Fazit - Mit großer Leistung kommt große Größe
Der beliebte Trend bei Gaming-Laptops geht dahin, immer dünner zu werden, aber Enthusiasten wissen sehr wohl, dass die Einsparung von Millimetern immer auch eine Leistungseinbuße bedeutet. Das Alienware 18 Area-51 mag größer und schwerer sein als viele Konkurrenten, aber es schafft es, gleichzeitig kühler, schneller und manchmal auch leiser zu arbeiten. Enthusiasten, die so viel Leistung wie möglich herausholen wollen, müssen nicht weiter suchen als nach dem Alienware 18.
Die große Größe ermöglicht viel mehr als nur Leistungssteigerungen. Das Modell bietet Qualitätsmerkmale, die bei den meisten dünneren oder kleineren Konkurrenten nicht zu finden sind, z. B. zwei PCIe5-SSD-Steckplätze, komfortable mechanische CherryMX-Tasten, eine höhere Qualität der Lautsprecher und eine stärkeres, unflexibleres Gehäuse. Käufer, die einfach nur die Spezifikationen konkurrierender Laptops vergleichen, könnten einige der besten Eigenschaften des Alienware übersehen.
Die größten Nachteile des Systems, abgesehen von seiner enormen Größe und seinem Gewicht, sind die kurze Akkulaufzeit und das Fehlen von Display-Optionen. Das 1.600p-300-Hz-IPS-Display ist wohl hervorragend für Spiele geeignet, aber das Fehlen von HDR-Unterstützung und 4K ist etwas verwirrend, wenn man bedenkt, wie viel das Alienware 18 im Einzelhandel kostet. Der Stromverbrauch ist unabhängig von den Einstellungen sehr hoch, was effizienzbewusste Benutzer abschrecken könnte. Diese Aspekte könnten noch verbessert werden, um Dell einen größeren Vorsprung gegenüber dem etwas effizienteren, AMD basierten MSI Raider A18 HX mit 4K-Mini-LED zu verschaffen. Wer bereit ist, zehn bis 15 Prozent Leistung für ein dünneres (und lauteres) Design zu opfern, hat ebenfalls eine große Auswahl – etwa mit dem Razer Blade 18 oder Asus ROG Strix G18.
Pro
Contra
Preis und Verfügbarkeit
Amazon liefert derzeit das Alienware 18 Area-51 mit RTX-5080-Grafik für 4.299 Euro. Die RTX-5090-Version ist direkt bei Dell aktuell zum Sonderpreis von 4.599 Euro erhältlich.
- 2.099,49 €Alienware 18 Area-51 Gaming Laptop Computer - Intel Ultra 9 275HX (24 Core, bis zu 5,4 GHz), RTX 5080 GDDR7, 18 Zoll 2,5K QHD+ 300Hz, mit DVD-Laufwerk, Win 11 Pro, Bürolebensdauer (32GB DDR5, 1 TB
- 1.154,11 €Alienware 18 Area 51 Gaming Laptop - Intel 24-Core Ultra 9 275HX CPU, NVIDIA RTX 5080 16GB GDDR7, 18 Zoll WQXGA 300Hz Display, 64GB DDR5, 8TB SSD, Win 11 Pro, Tastatur mit
- 4.299,00 €Alienware 18 Area-51 Gaming Laptop 18" WQXGA 300Hz G-Sync, Intel Core Ultra 9 275HX Series 2, NVIDIA GeForce RTX 5080, 32GB DDR5 RAM, 2TB SSD, 3 Monate Game Pass, Windows 11 Home, AlienFX RGB QWERTZ
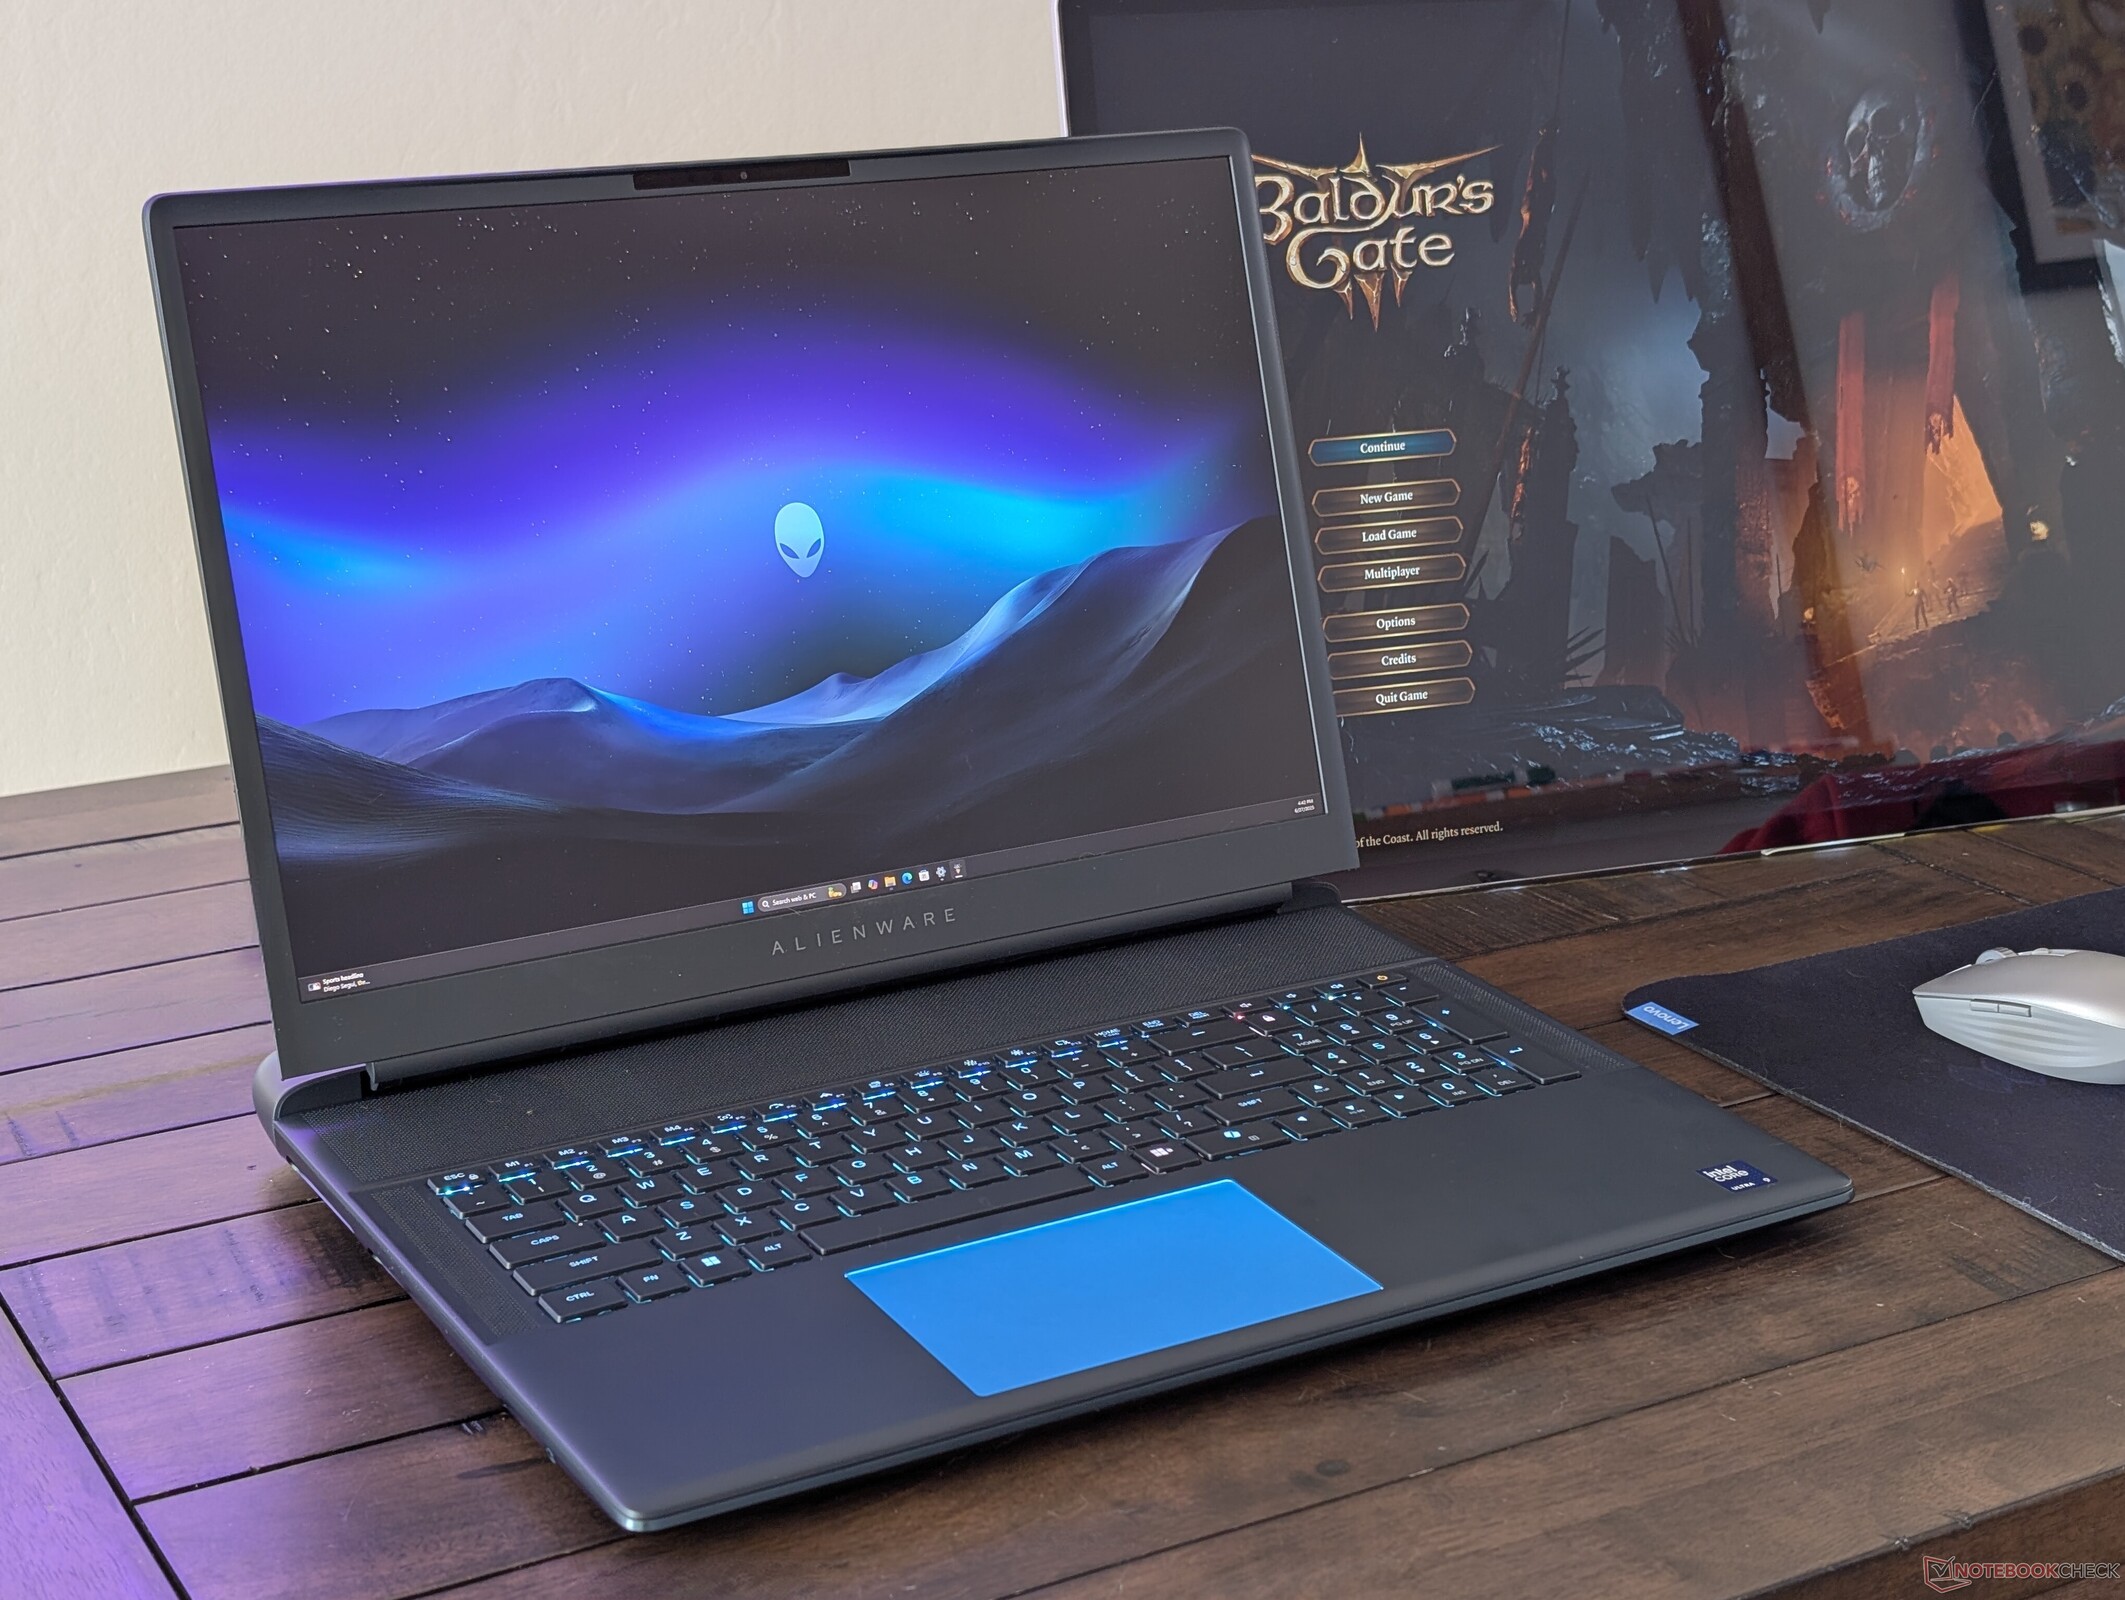
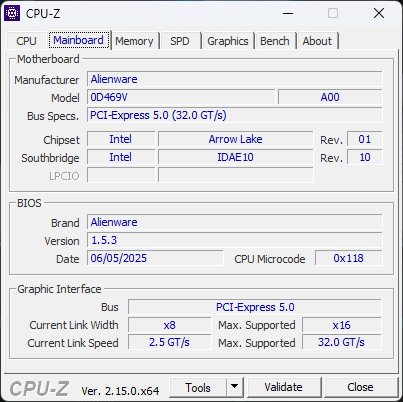
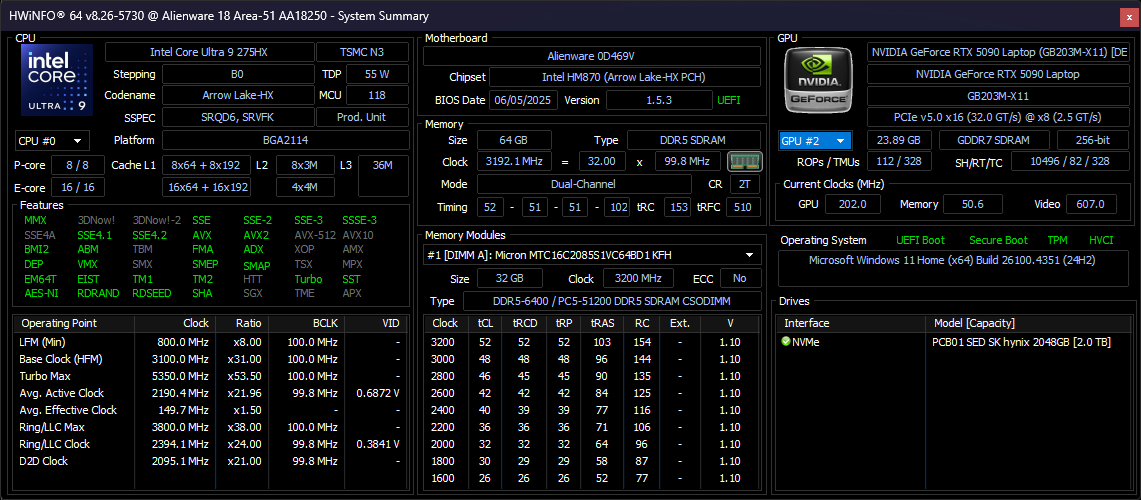
Das Alienware 18 Area-51 ist Dells neuestes Top-Gaming-Notebook mit noch mehr Leistung und Overhead gegenüber dem kleineren 16 Zoll Alienware 16. Es ist der direkte Nachfolger des letztjährigen Alienware m18 R2 mit einer kompletten Überarbeitung des Designs, sowohl innen als auch außen. Die Raptor-Lake-HX-CPUs und Ada-LoveLace-GPUs sind zugunsten der neueren Arrow-Lake-HX- bzw. Blackwell-Optionen verschwunden.
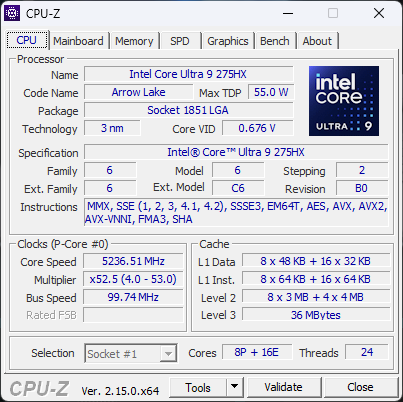
Unser Testgerät ist die höchste verfügbare Konfiguration mit Core Ultra 9 275HX CPU, 175-W-GeForce-RTX-5090-GPU und 1.600p300-IPS-Display für ca. 4.400 US-Dollar. Kleinere SKUs beginnen mit der RTX 5070 Ti für 3.300 US-Dollar, aber ansonsten gibt es derzeit keine weiteren Prozessoren oder Displays zur Auswahl.
Zu den Konkurrenten in diesem Bereich gehören andere große 18-Zoll-Gaming-Laptops wie das MSI Titan 18 HX, Aorus Master 18 oder Asus ROG Strix Scar 18. Viele unserer Kommentare über das Alienware 16 gelten hier für das Alienware 18, da sie die gleiche AW30-Designsprache haben.
Mehr Dell Testberichte:
Spezifikationen
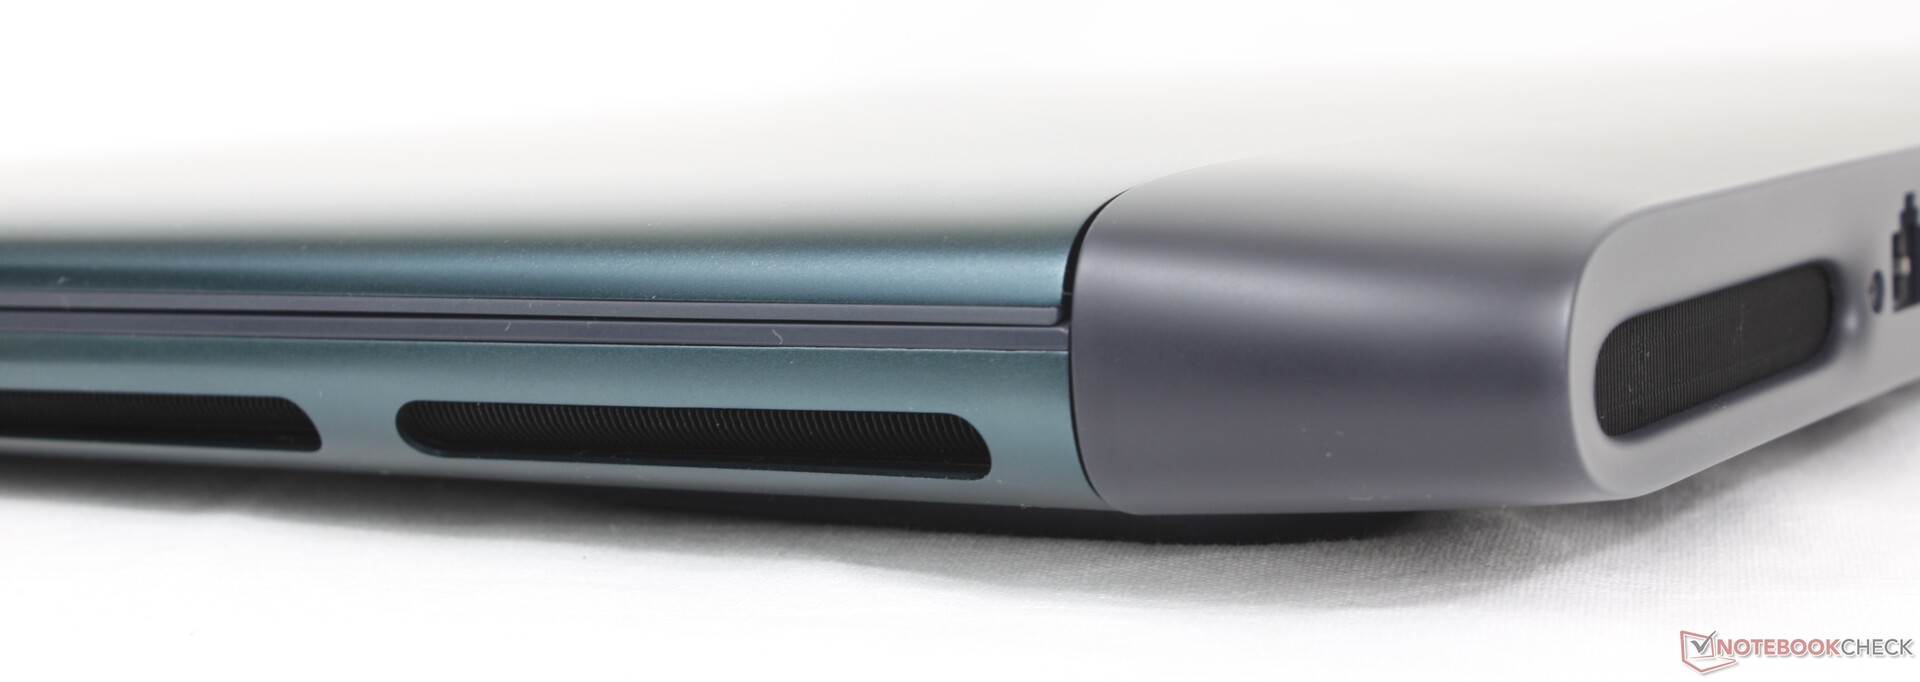
Gehäuse - Weg mit den Hexagonen
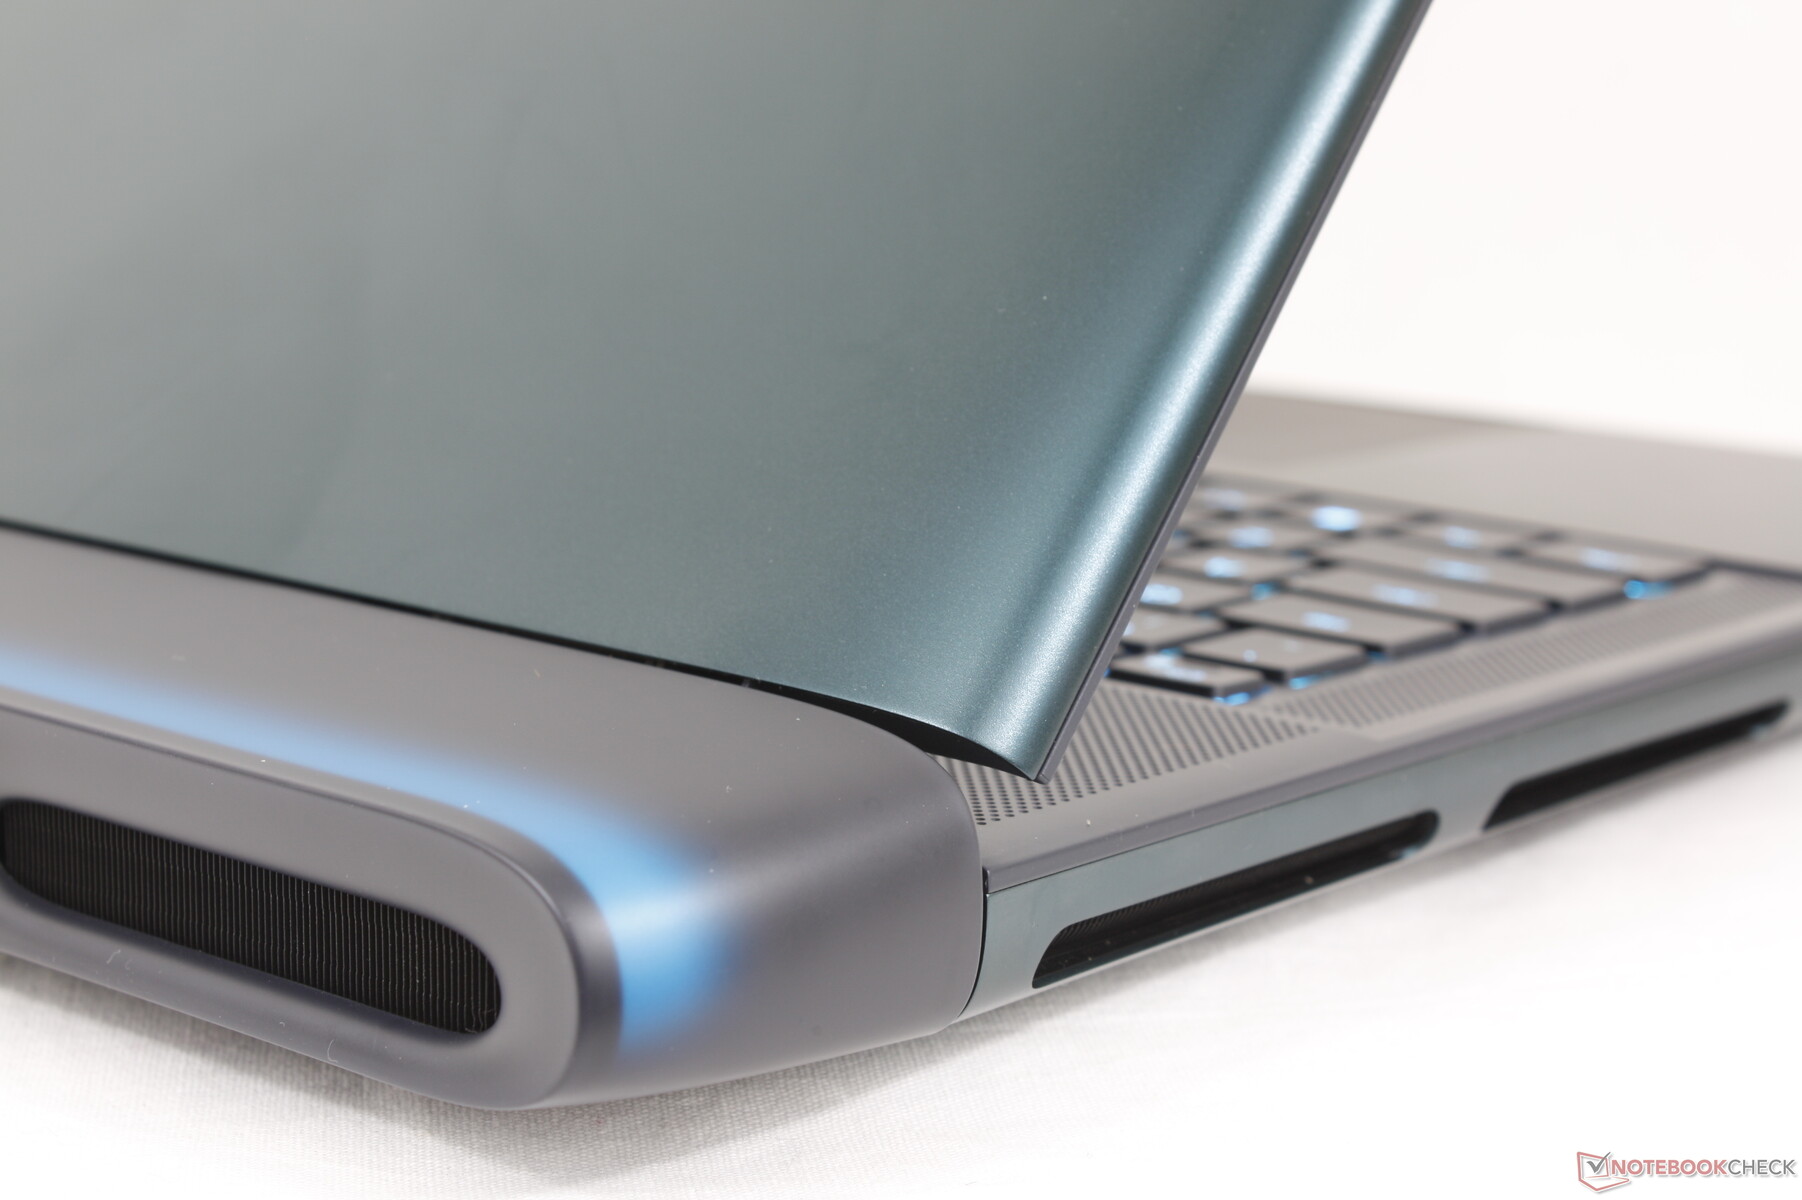
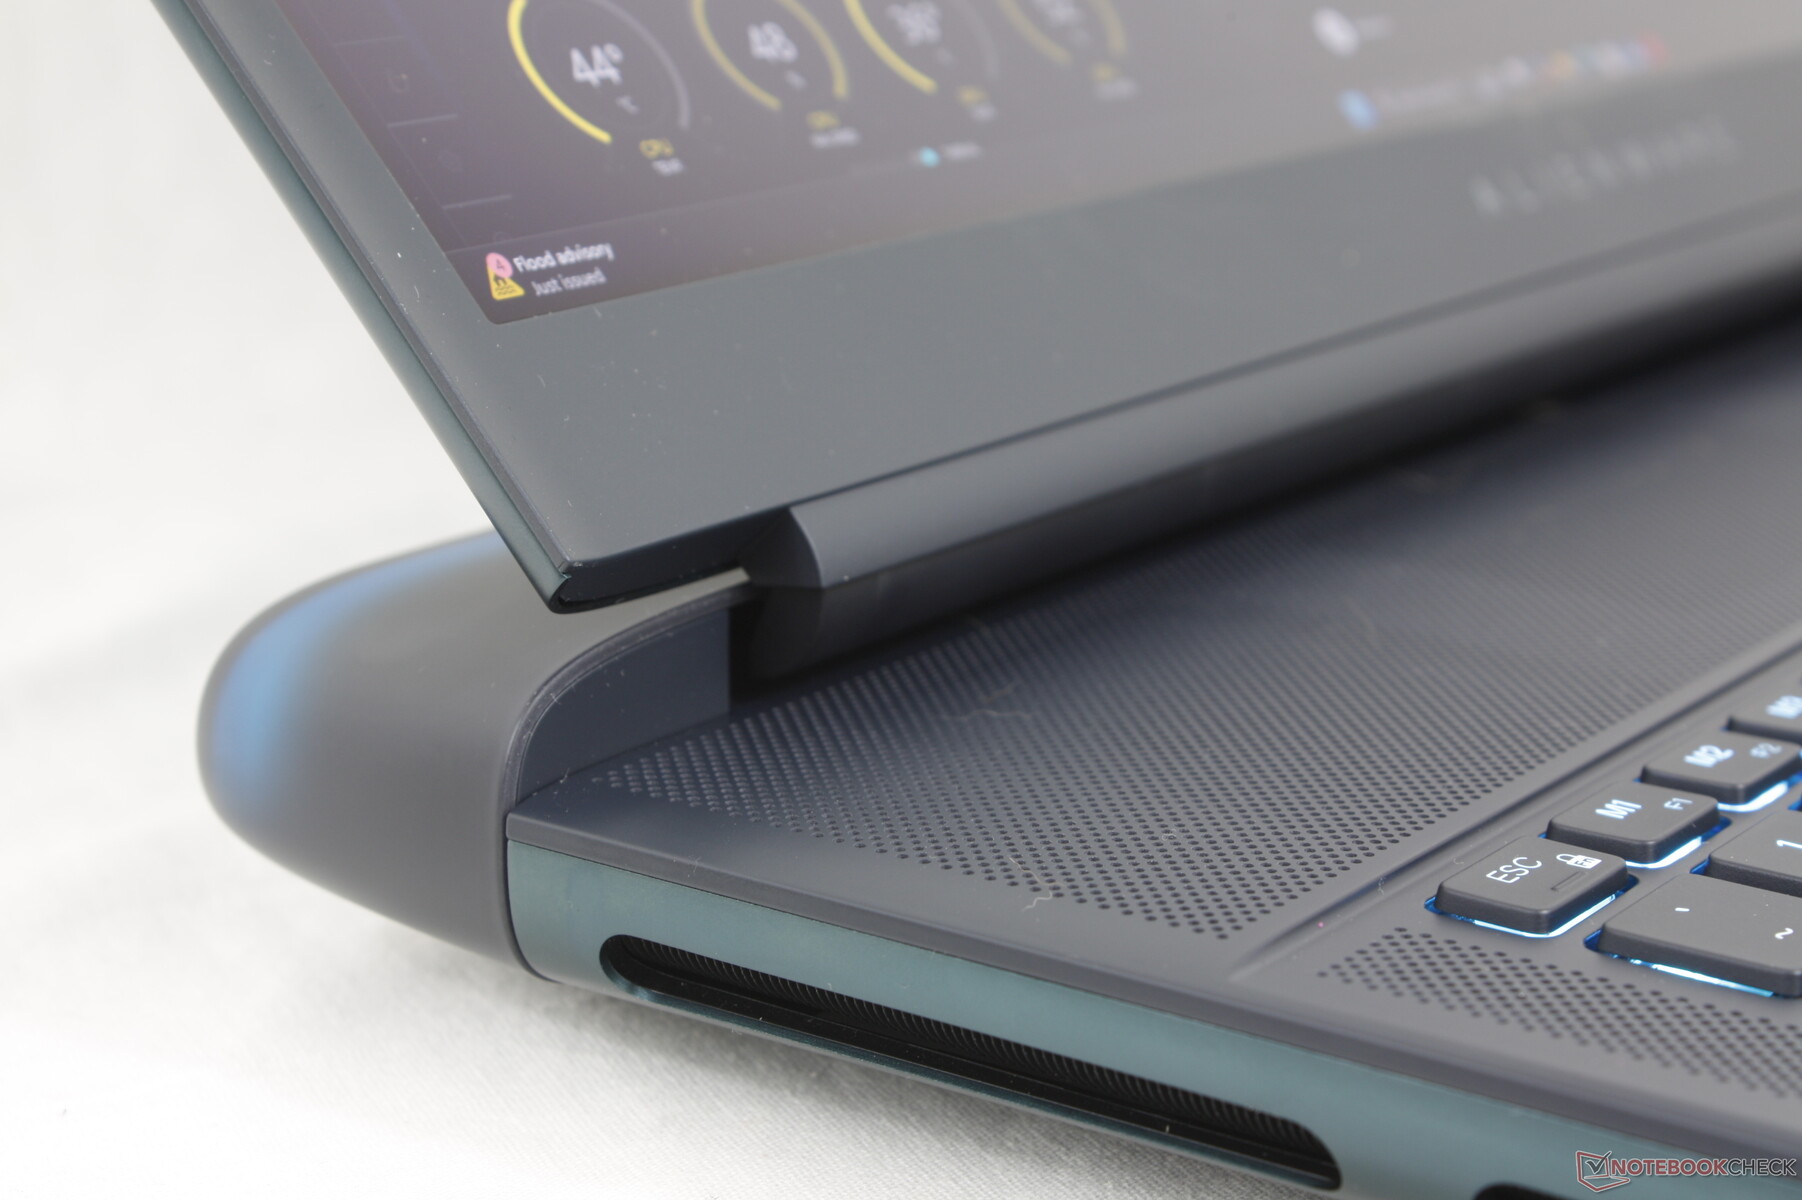
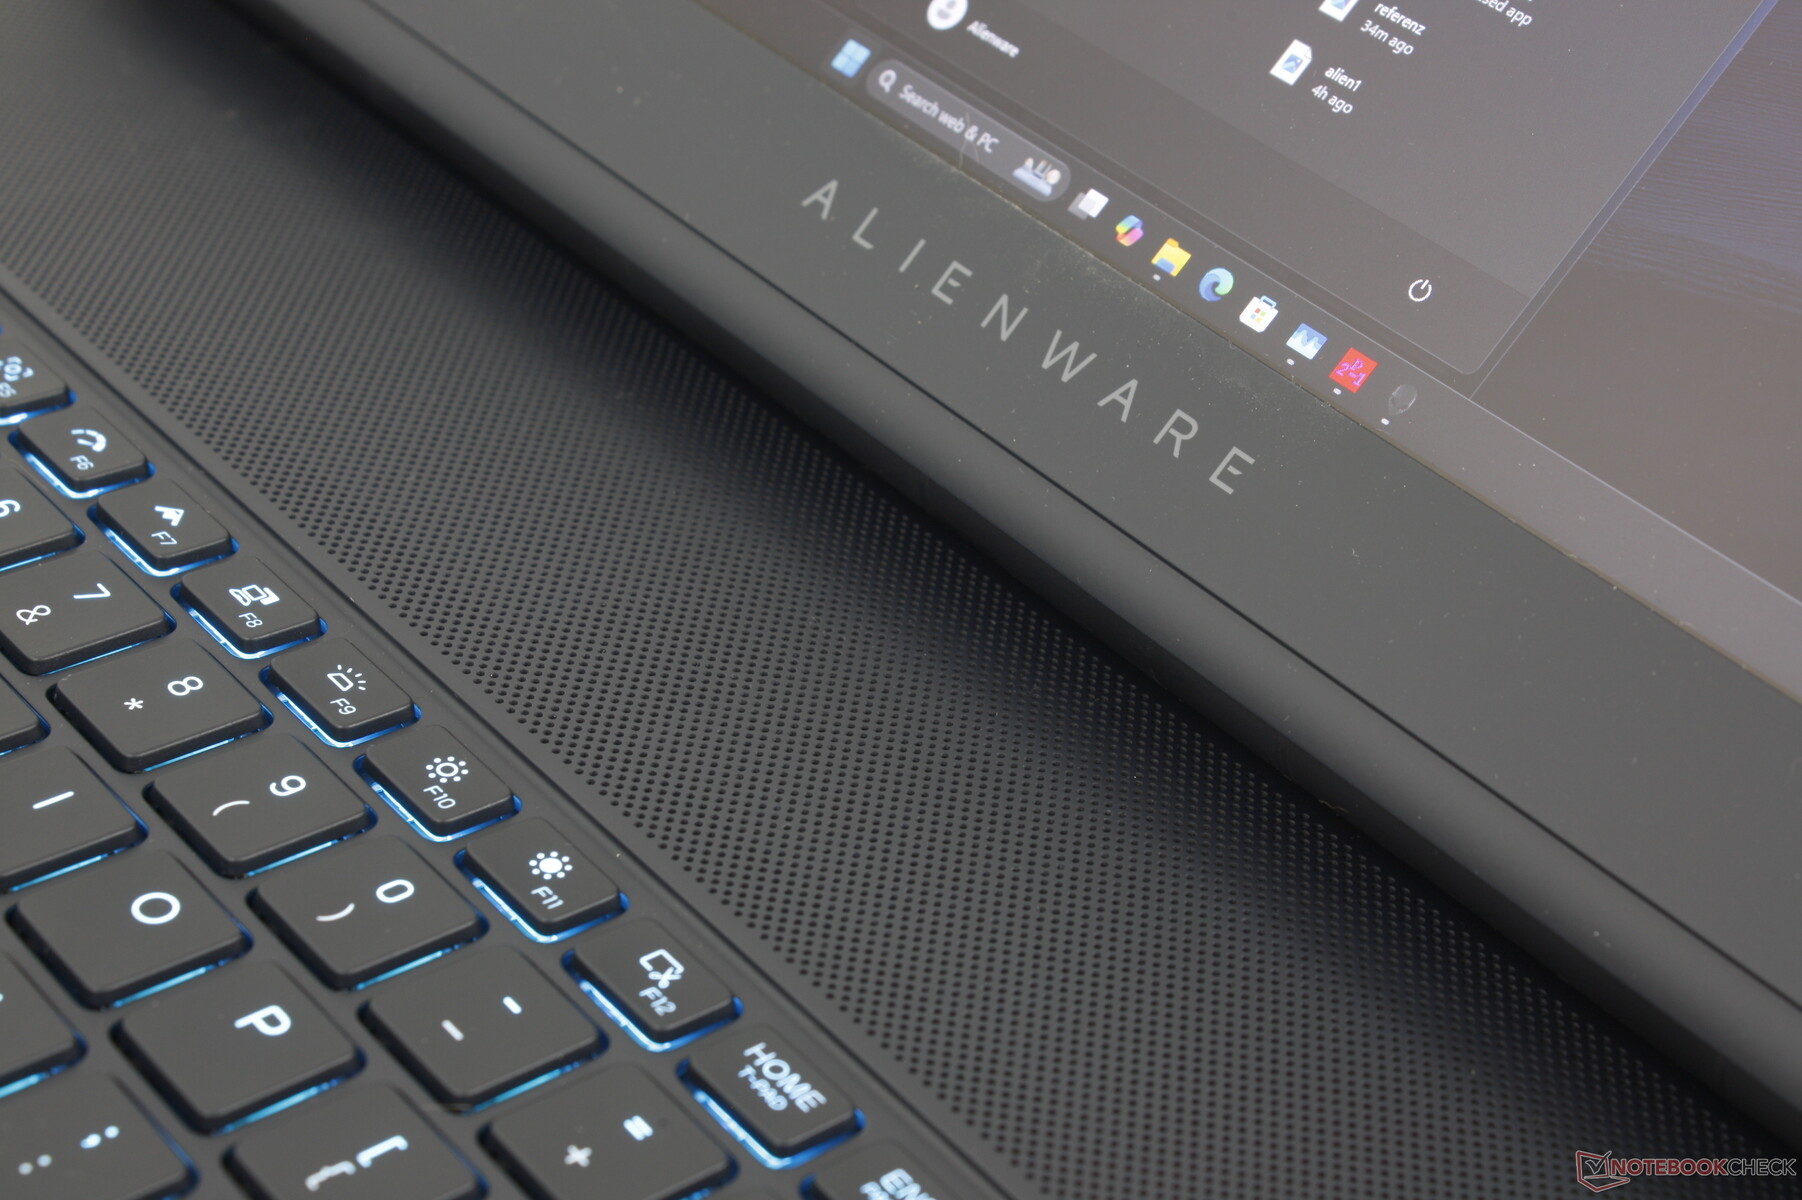
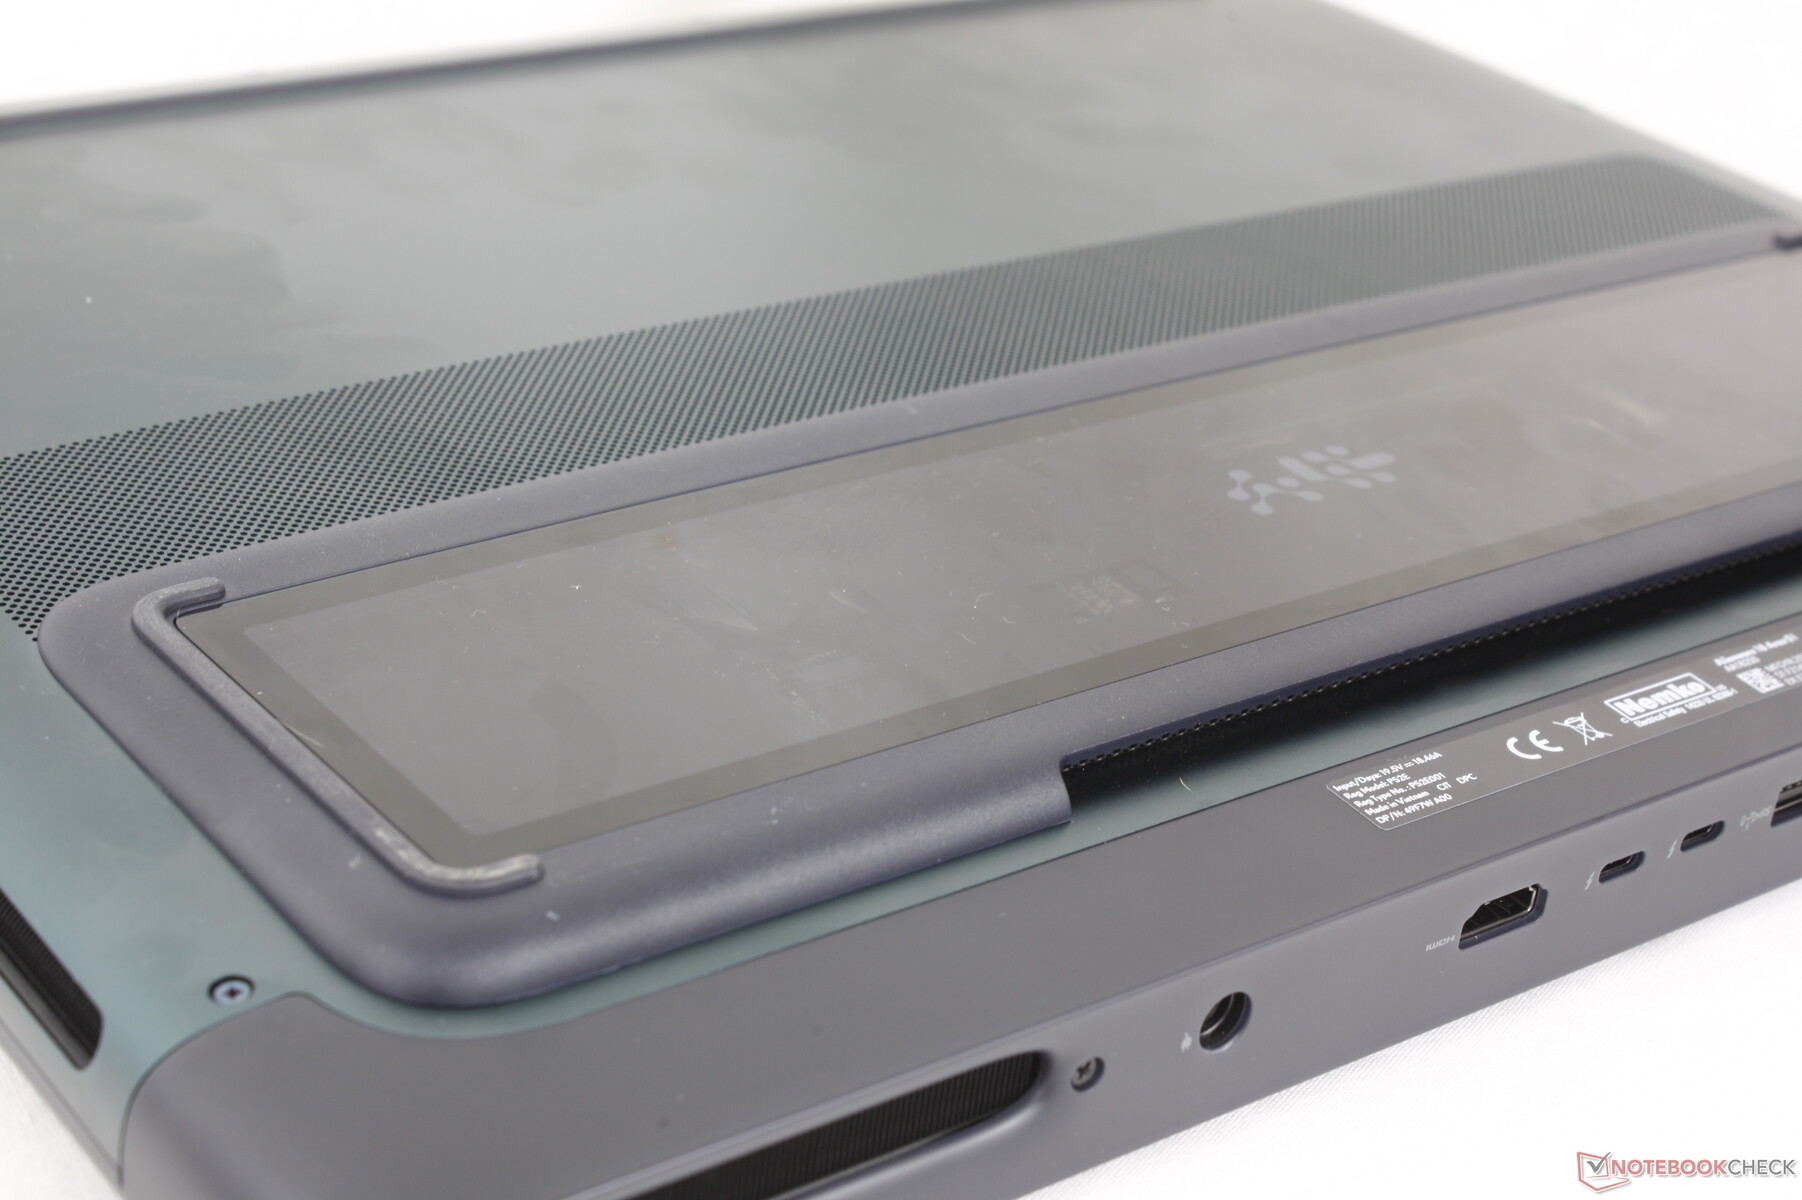
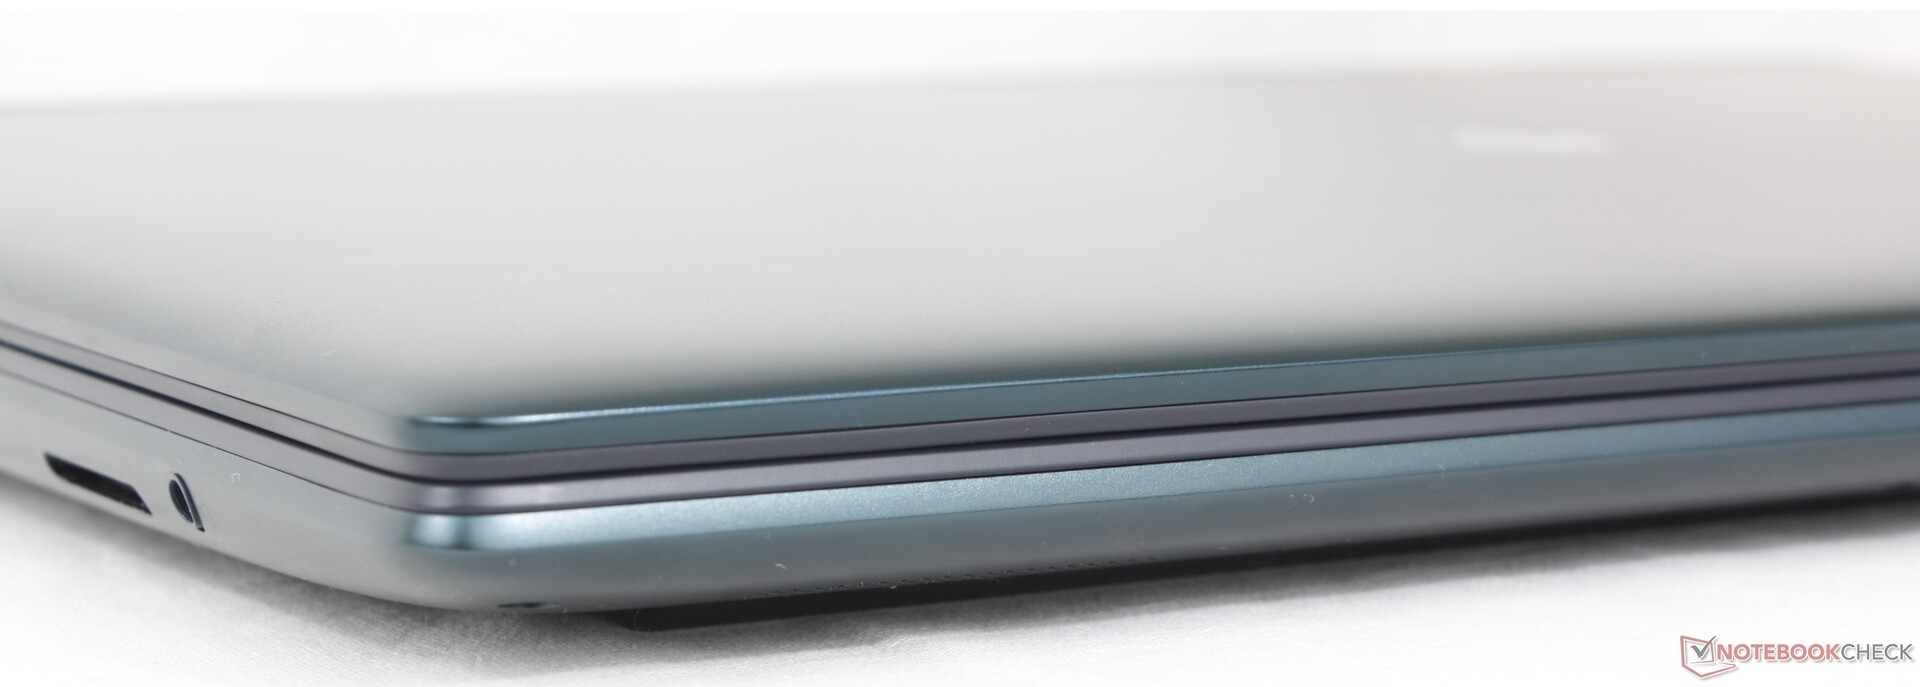
Das AW30-Design des Alienware 16 ist für den größeren 18-Zoll-Formfaktor wohl noch besser geeignet. Die bemerkenswerten visuellen Merkmale wie die abgerundeten Kanten, die glatte Oberfläche des Deckels, die weichen RGB-LEDs an der Rückseite und das Gorilla-Glas-Fenster an der Unterseite sind größer und daher visuell auffälliger als beim kleineren 16-Zoll-Modell. Das System sieht trotz seiner obszön großen Stellfläche ziemlich professionell aus.
Unsere größte Beschwerde über das Design bezieht sich nicht auf die Steifigkeit oder Qualität, sondern auf das schwarze Soft-Touch-Tastaturdeck, auf dem sich sehr schnell unschöne Fingerabdrücke ansammeln. Der Verpackung sollte ein Tuch beiliegen, denn man wird häufig Fettspuren von den Tasten und Handballenauflagen entfernen müssen

Das Alienware 18 ist mit relativ großem Abstand eines der größten und schwersten 18-Zoll-Gaming-Laptops auf dem Markt. Es ist 600 g schwerer als das MSI Titan 18, und obwohl es nicht so dick ist, macht die größere Stellfläche dies wieder wett.
Anschlussausstattung
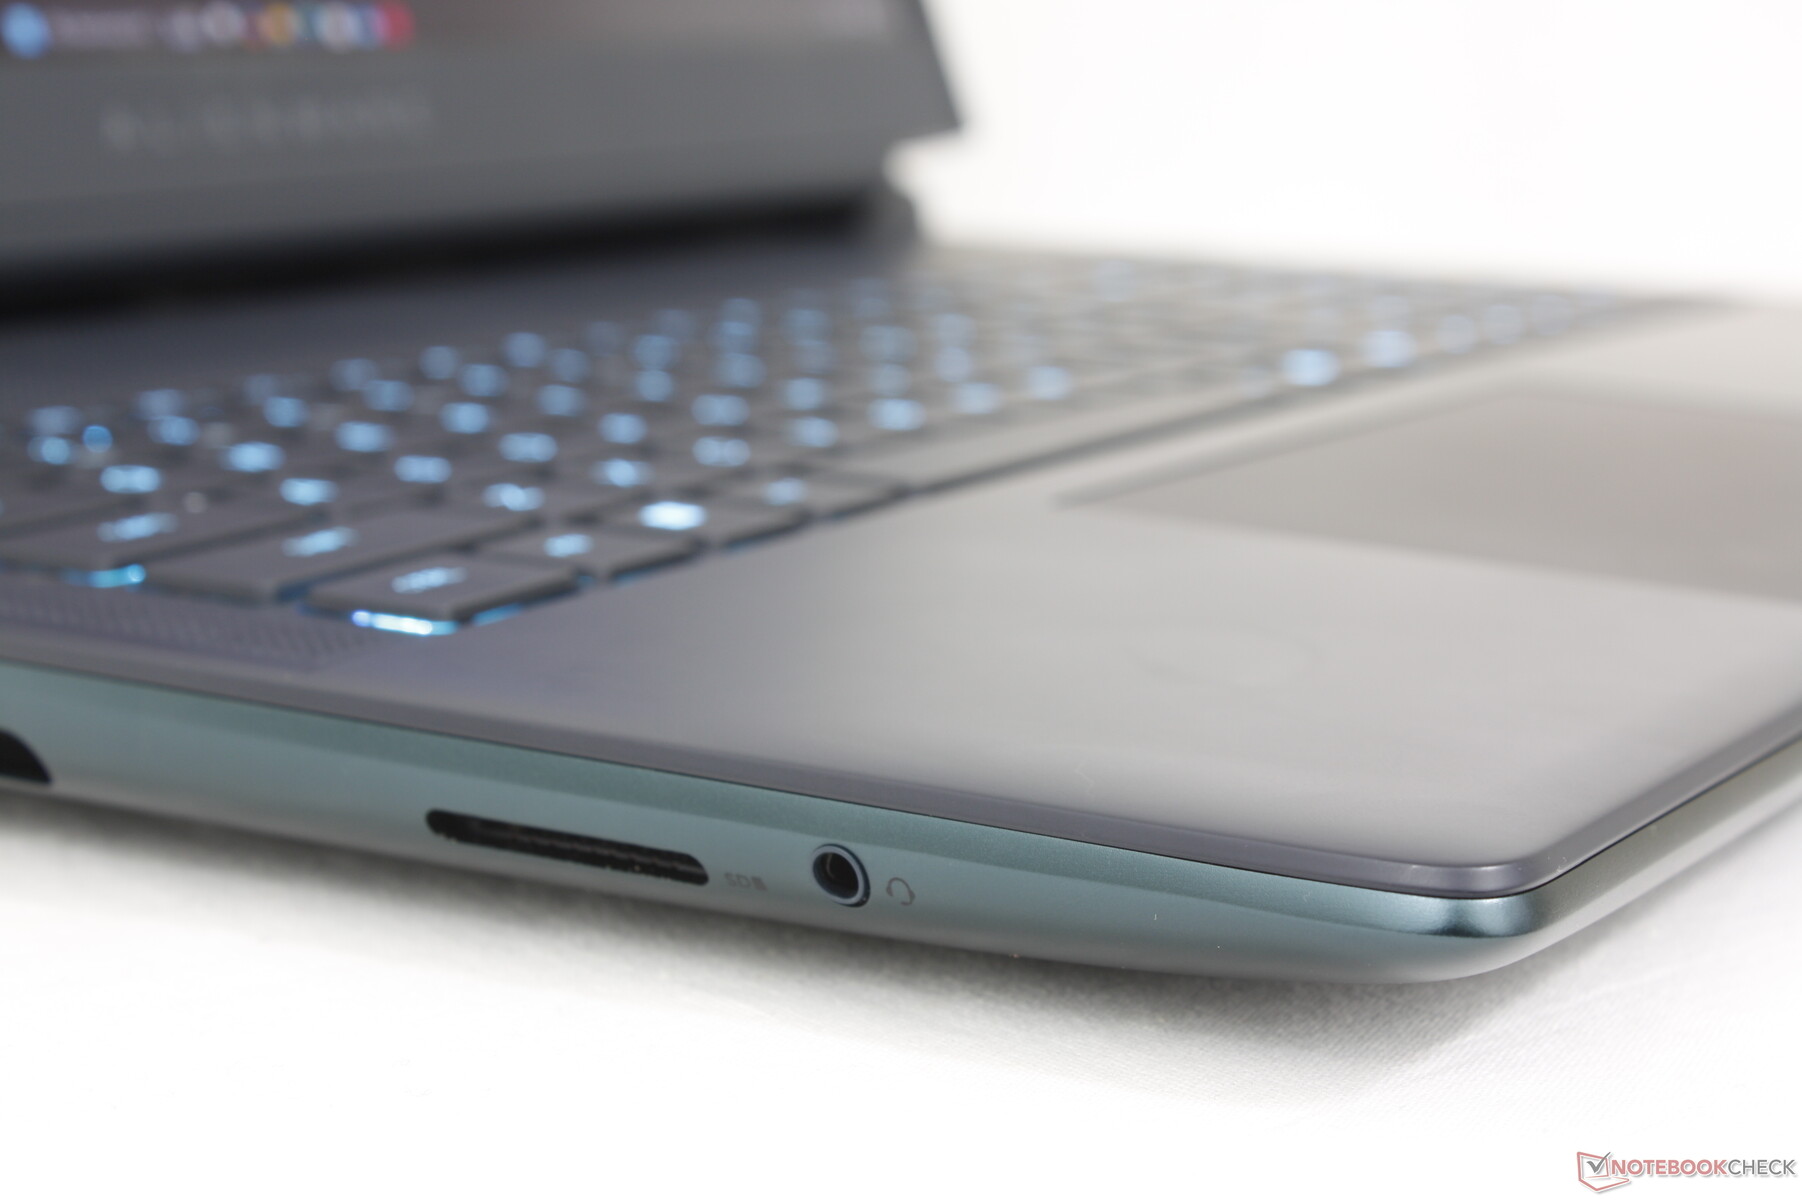
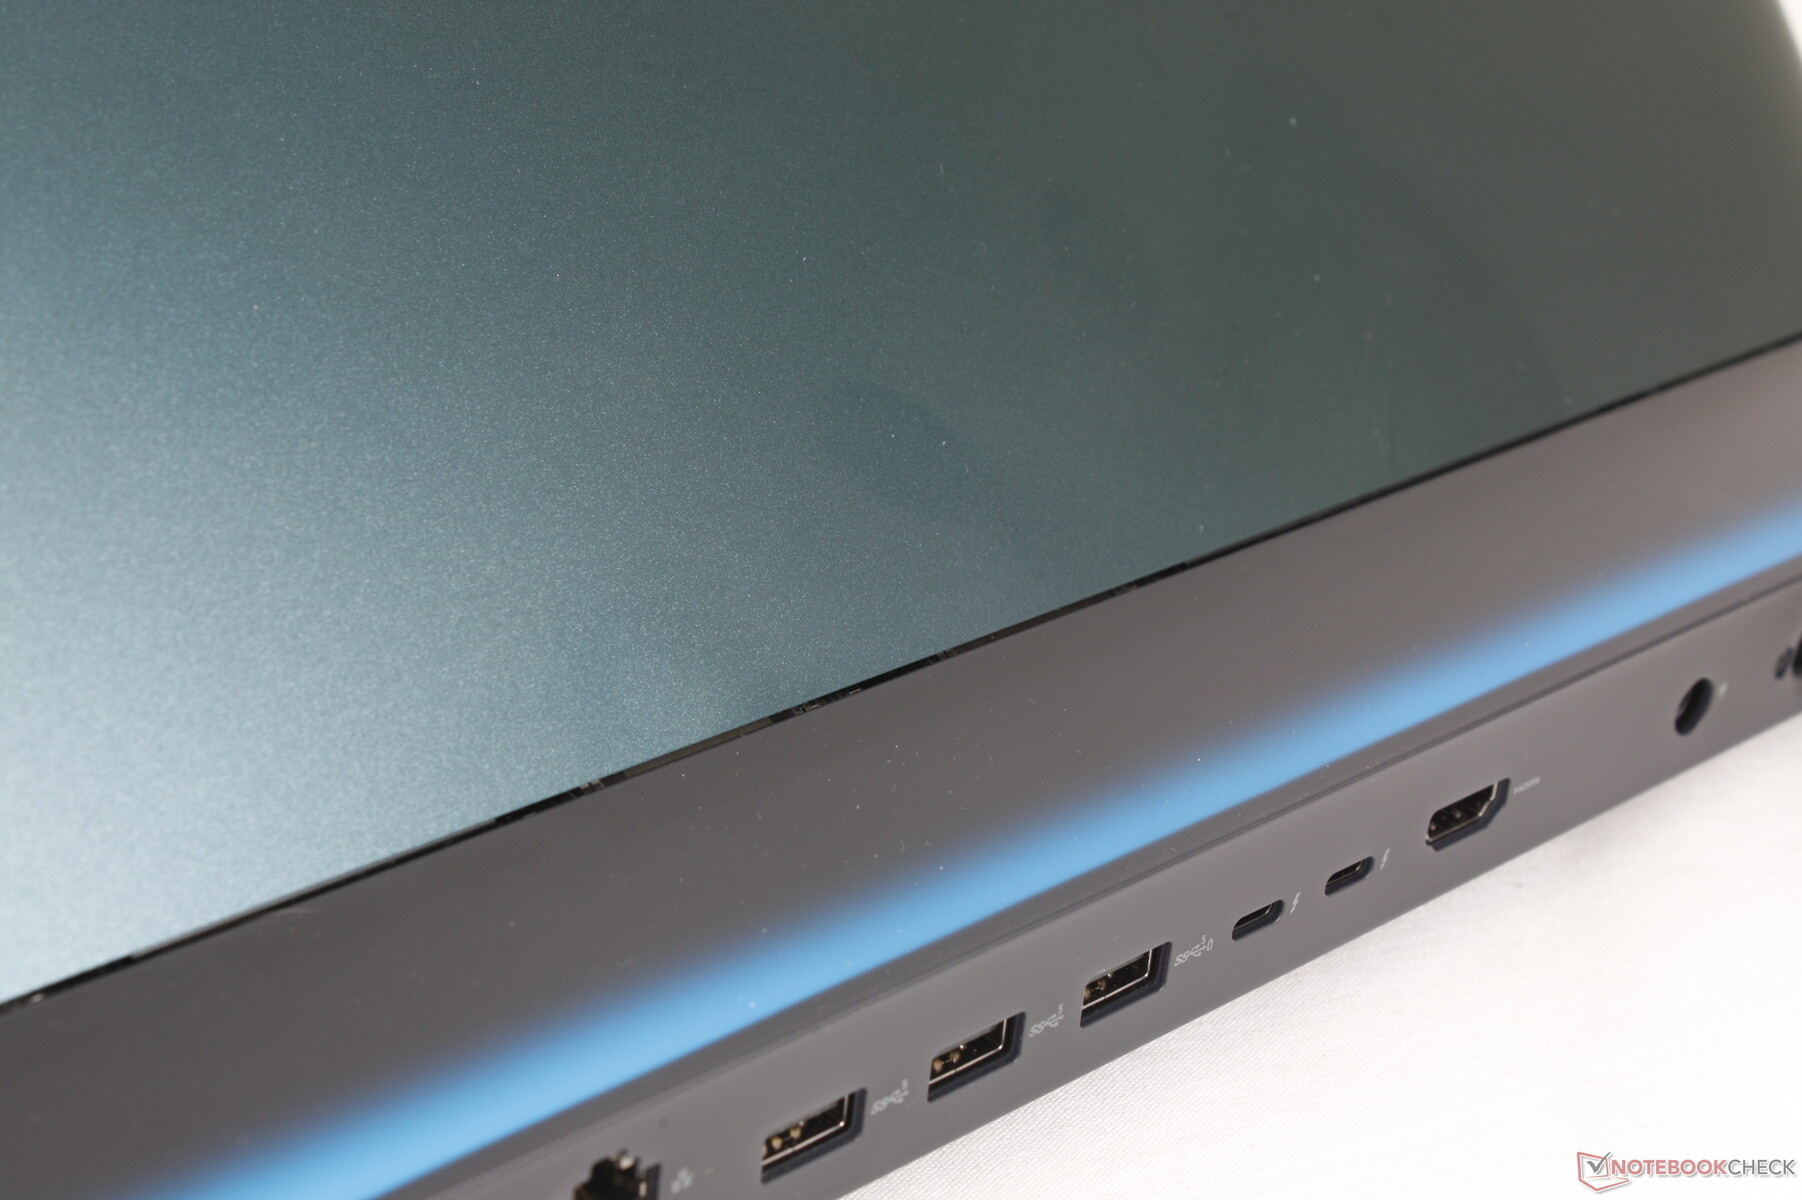
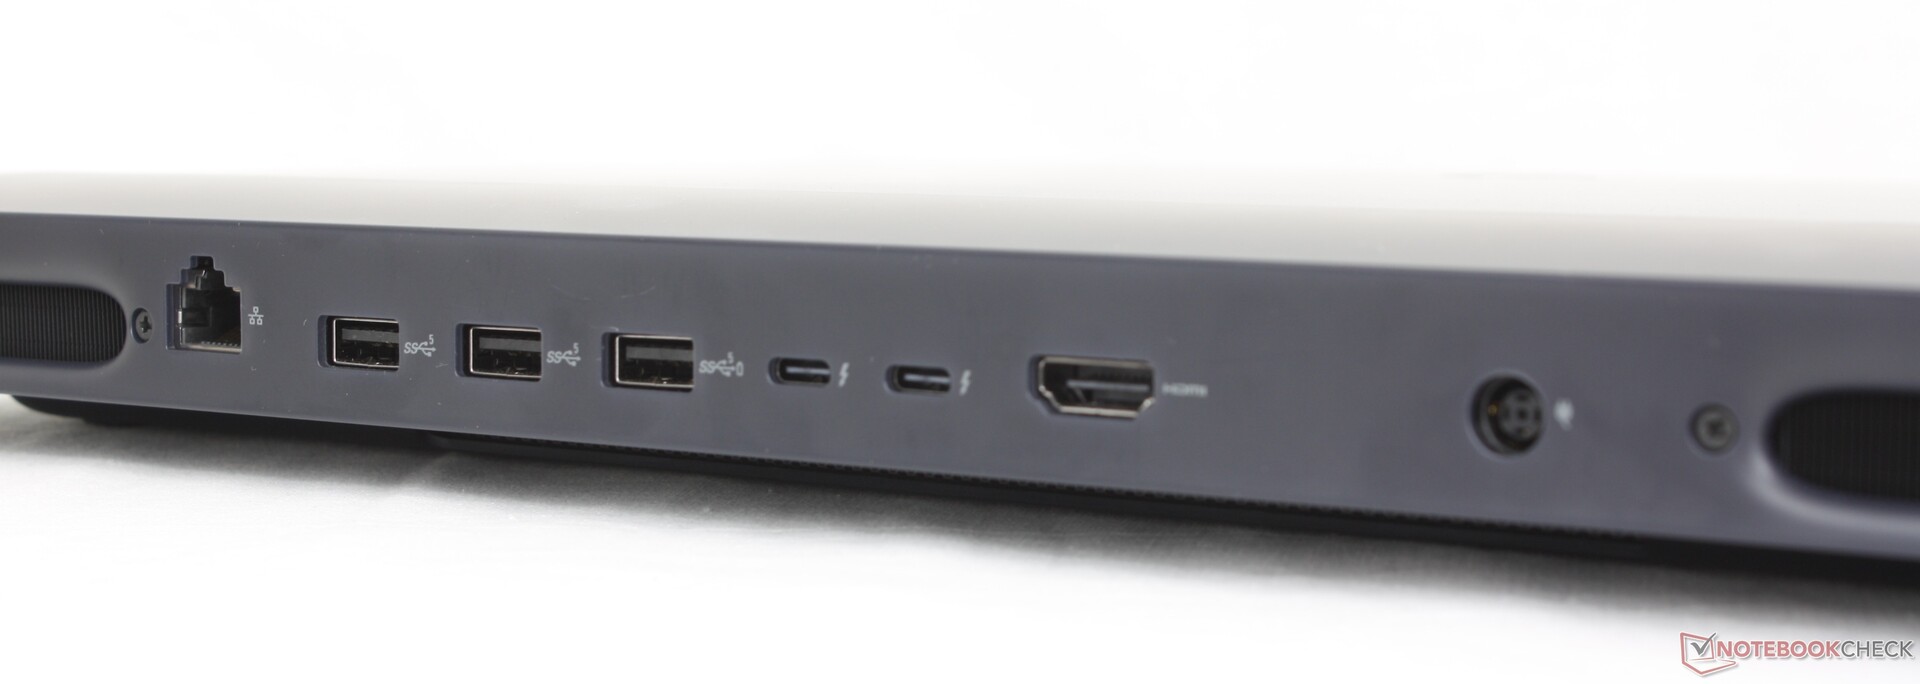
Alle Anschlüsse, die beim Alienware 16 zu finden sind, sind auch beim Alienware 18 vorhanden. Hinzu kommt ein bemerkenswertes Extra: der 5-Gbps-RJ-45-Port. Der Mini-DisplayPort des letztjährigen m18 R2 ist jetzt nicht mehr vorhanden, während der SD-Kartenleser glücklicherweise an eine besser zugängliche Position verschoben wurde.
Zu beachten ist, dass man bei der Konfiguration mit RTX-5070-Grafik nur Thunderbolt 4 und kein Thunderbolt 5 erhält.
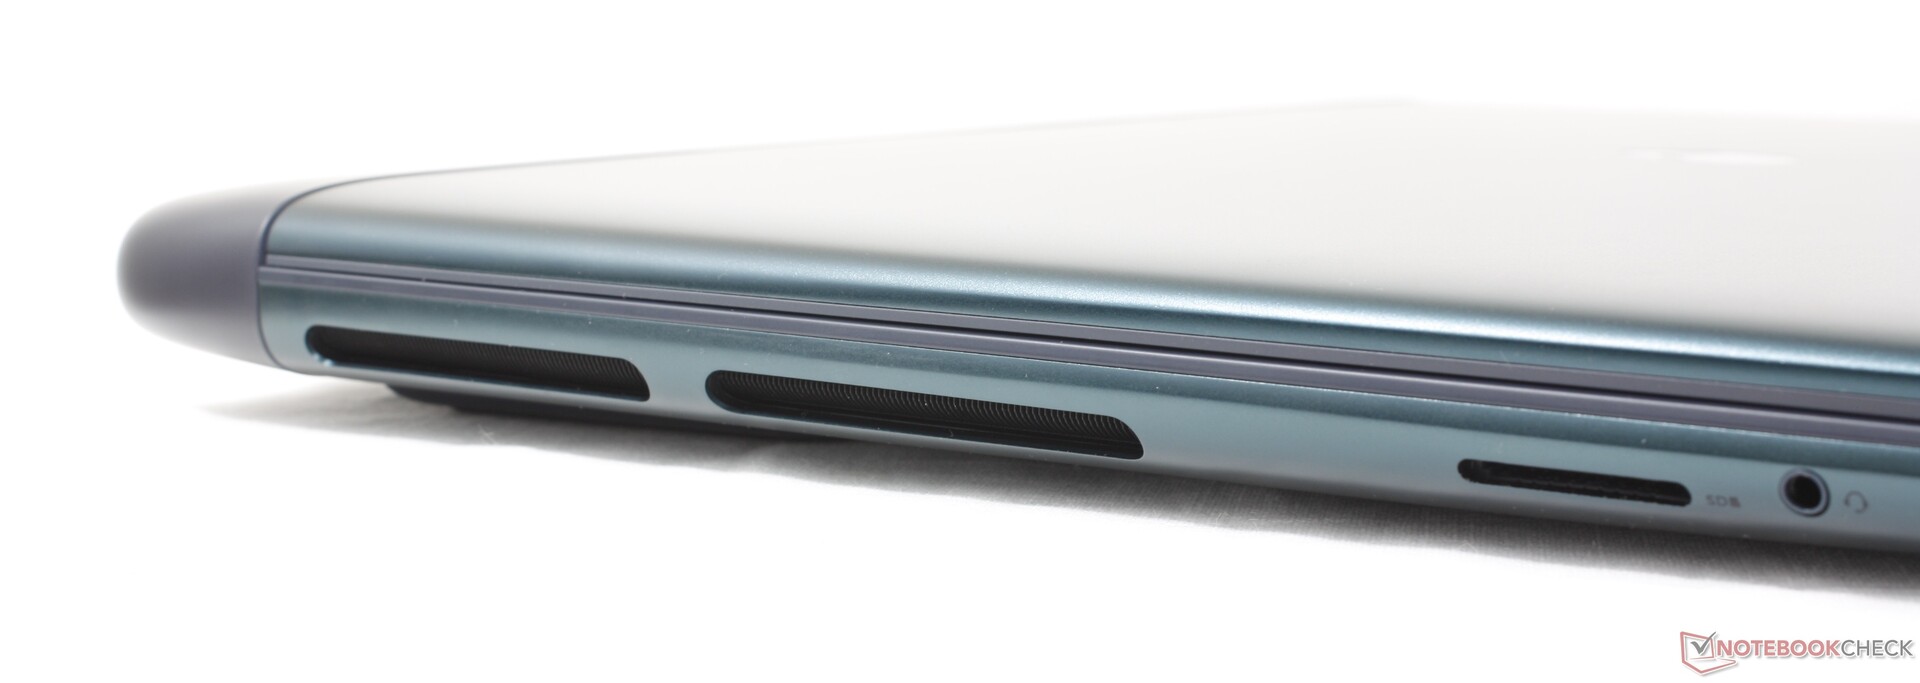
SD-Kartenleser
Obwohl die Leistung schnell ist, ist der Kartenleser nicht gefedert, so dass eine eingelegte SD-Karte immer noch um fast die Hälfte ihrer Länge herausragt, was den Transport unsicher macht.

| SD Card Reader | |
| average JPG Copy Test (av. of 3 runs) | |
| Alienware 18 Area-51 (Toshiba Exceria Pro SDXC 64 GB UHS-II) | |
| Alienware m18 R2 (Toshiba Exceria Pro SDXC 64 GB UHS-II) | |
| Razer Blade 18 2024 RZ09-0509 (Toshiba Exceria Pro SDXC 64 GB UHS-II) | |
| Alienware 16 Area-51 (Toshiba Exceria Pro SDXC 64 GB UHS-II) | |
| Acer Predator Helios 18 PH18-72-98MW (AV PRO microSD 128 GB V60) | |
| MSI Titan 18 HX AI A2XWJG (AV PRO microSD 128 GB V60) | |
| MSI Raider A18 HX A9WIG-080 | |
| maximum AS SSD Seq Read Test (1GB) | |
| Alienware 18 Area-51 (Toshiba Exceria Pro SDXC 64 GB UHS-II) | |
| Alienware 16 Area-51 (Toshiba Exceria Pro SDXC 64 GB UHS-II) | |
| Razer Blade 18 2024 RZ09-0509 (Toshiba Exceria Pro SDXC 64 GB UHS-II) | |
| Alienware m18 R2 (Toshiba Exceria Pro SDXC 64 GB UHS-II) | |
| MSI Raider A18 HX A9WIG-080 | |
| MSI Titan 18 HX AI A2XWJG (AV PRO microSD 128 GB V60) | |
| Acer Predator Helios 18 PH18-72-98MW (AV PRO microSD 128 GB V60) | |
Kommunikation
Der Intel Killer BE1750W kommt standardmäßig für Wi-Fi-7- und Bluetooth-5.4-Anschlüsse. Die Kernspezifikationen sind laut Intel identisch mit denen des BE1750x im Alienware 16 .

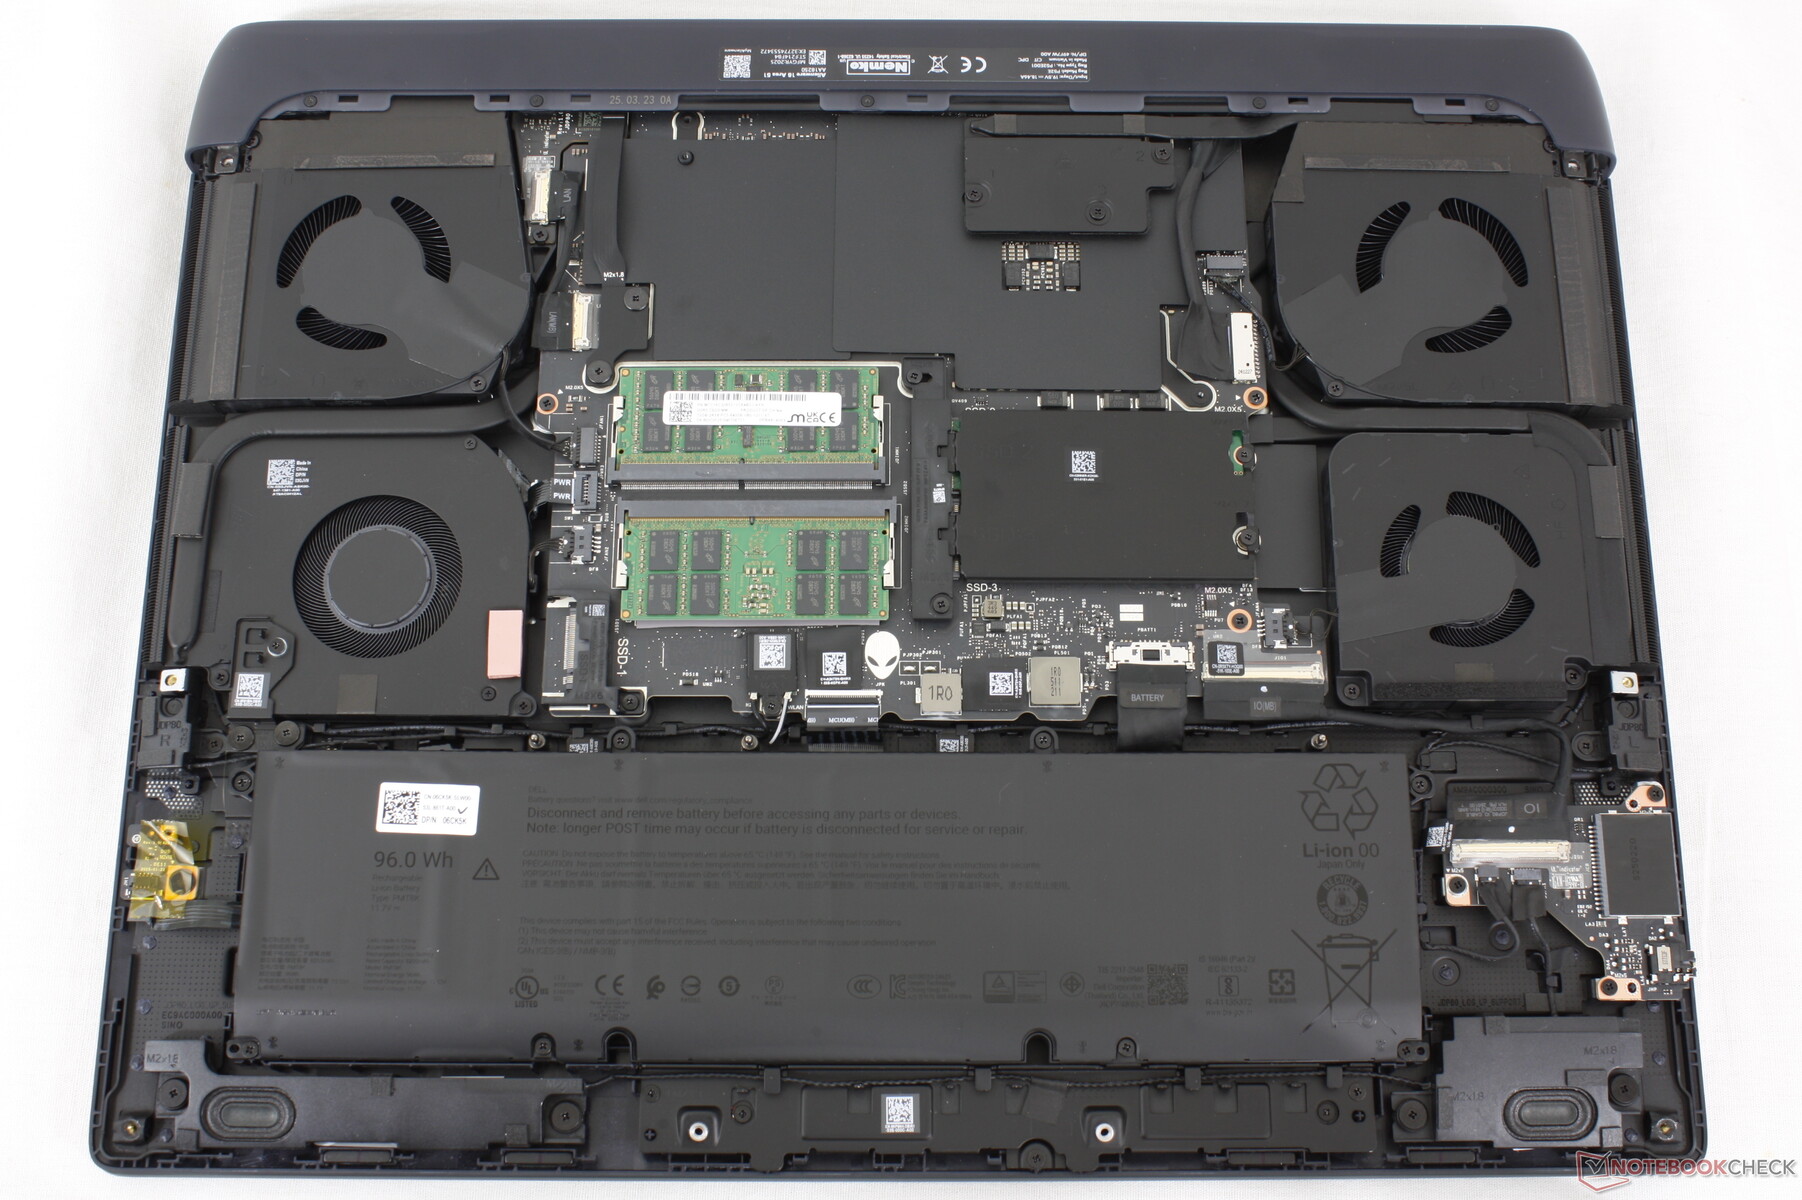
Webcam
Sie können zwischen einer 2-MP- oder 8-MP-Webcam mit IR-Unterstützung wählen. Es gibt keine Option für einen physischen Auslöser, was bei einem so teuren System ein Versäumnis ist.


Wartung
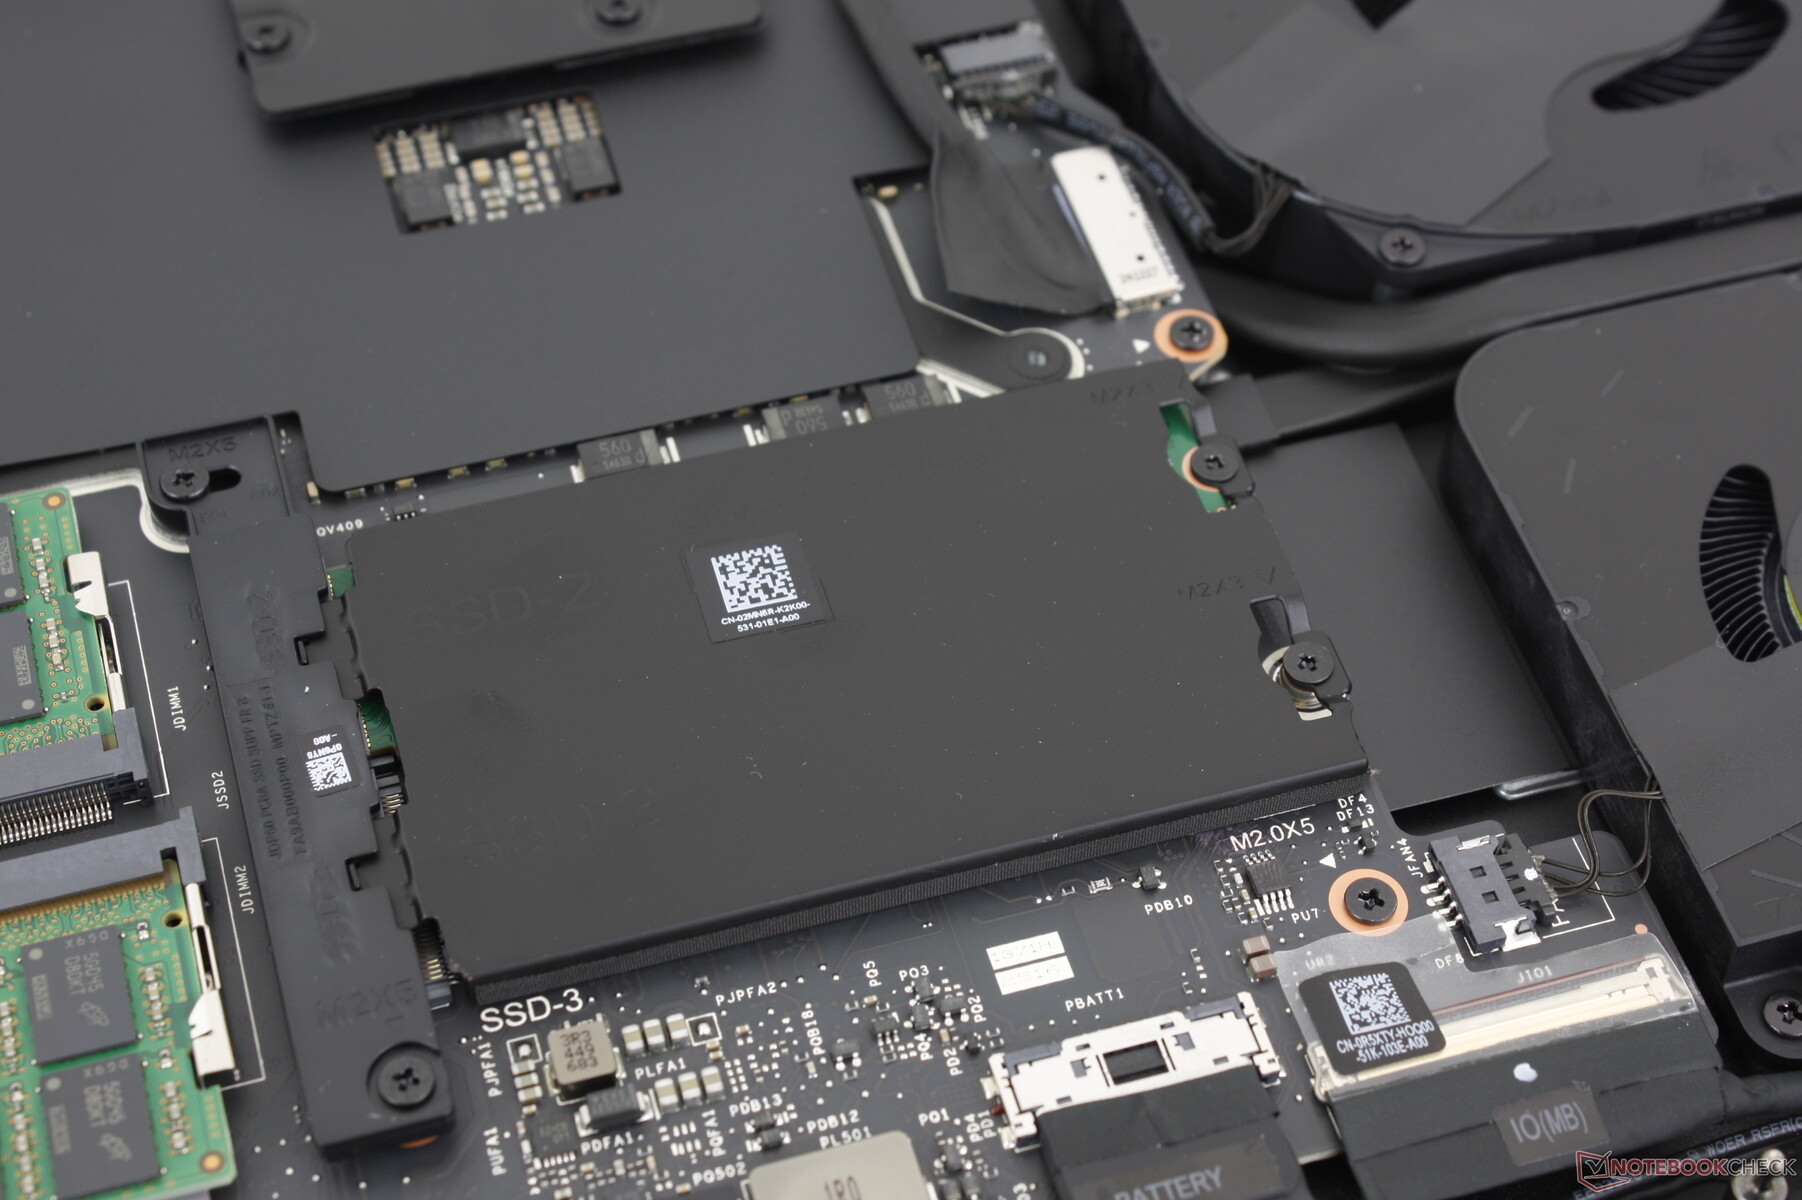
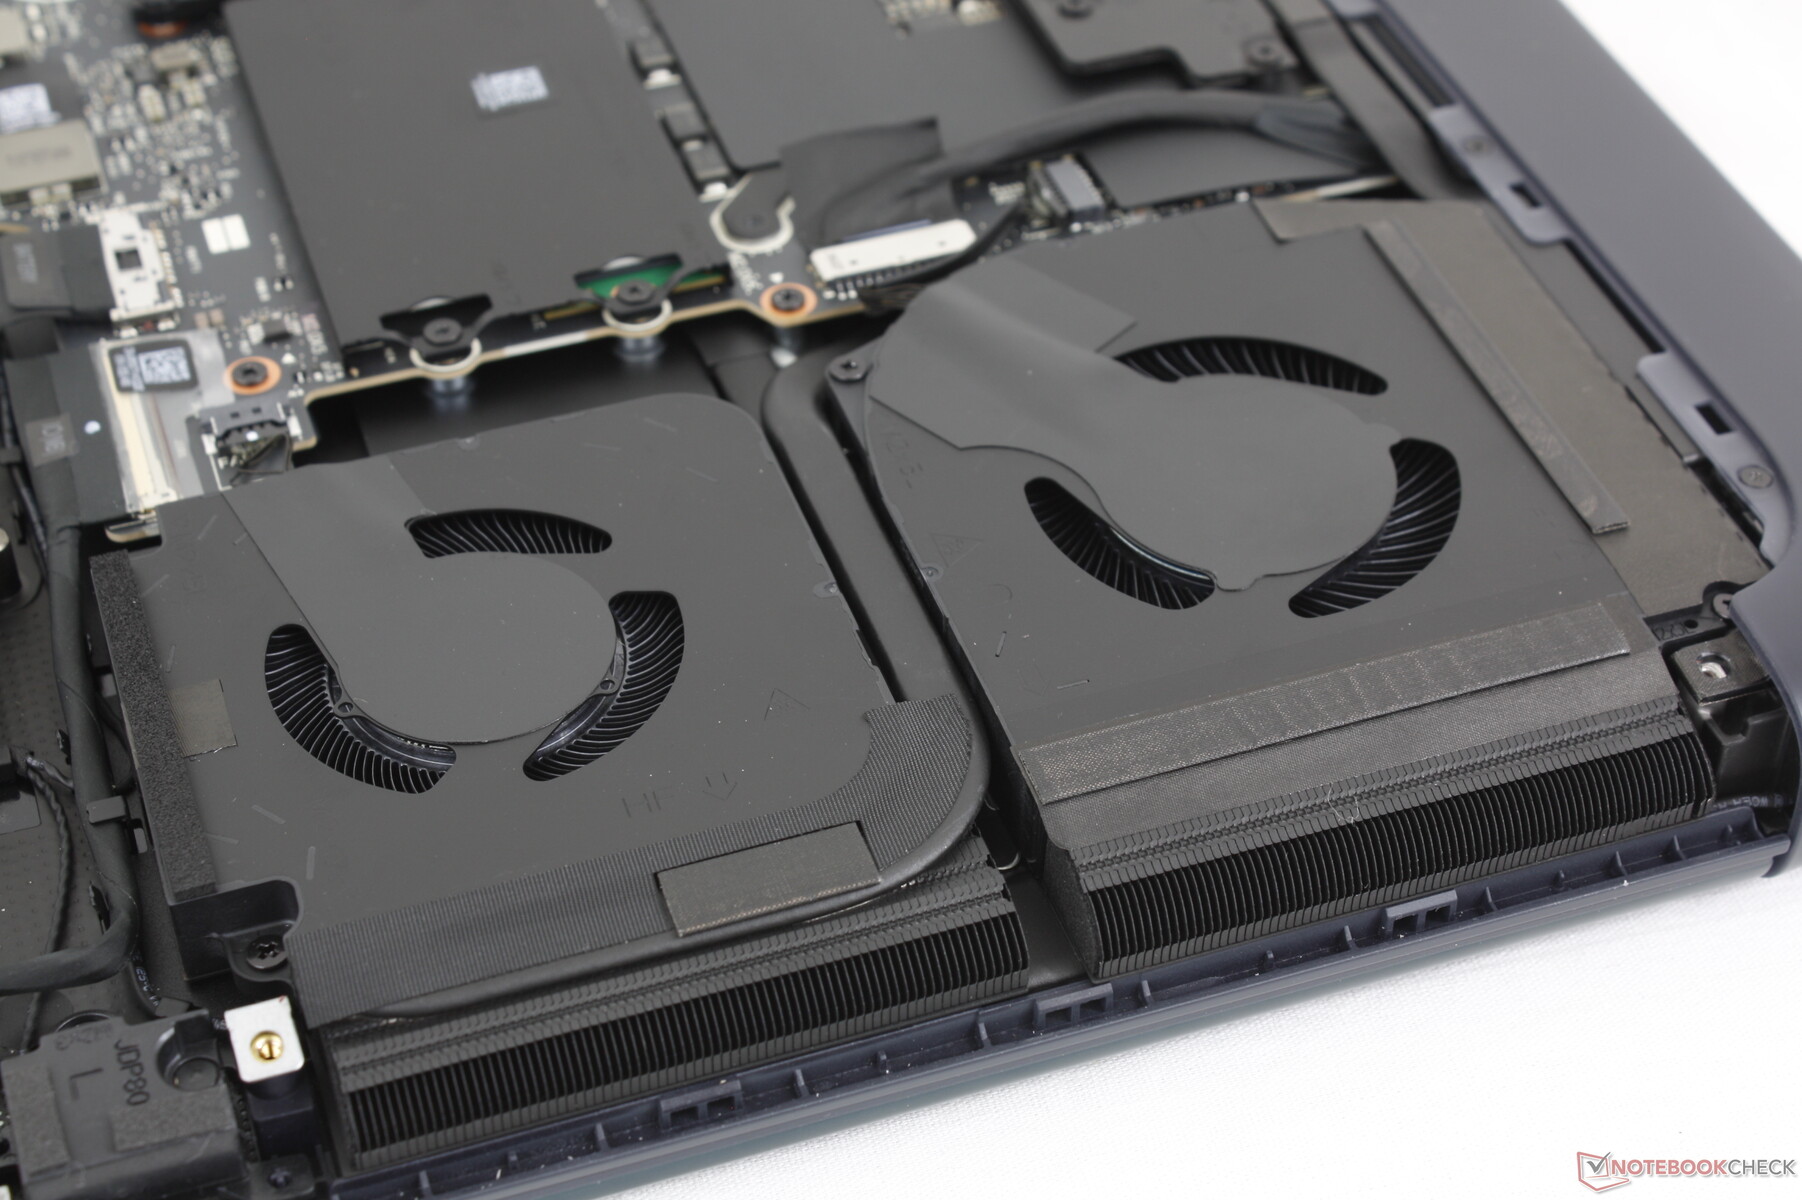
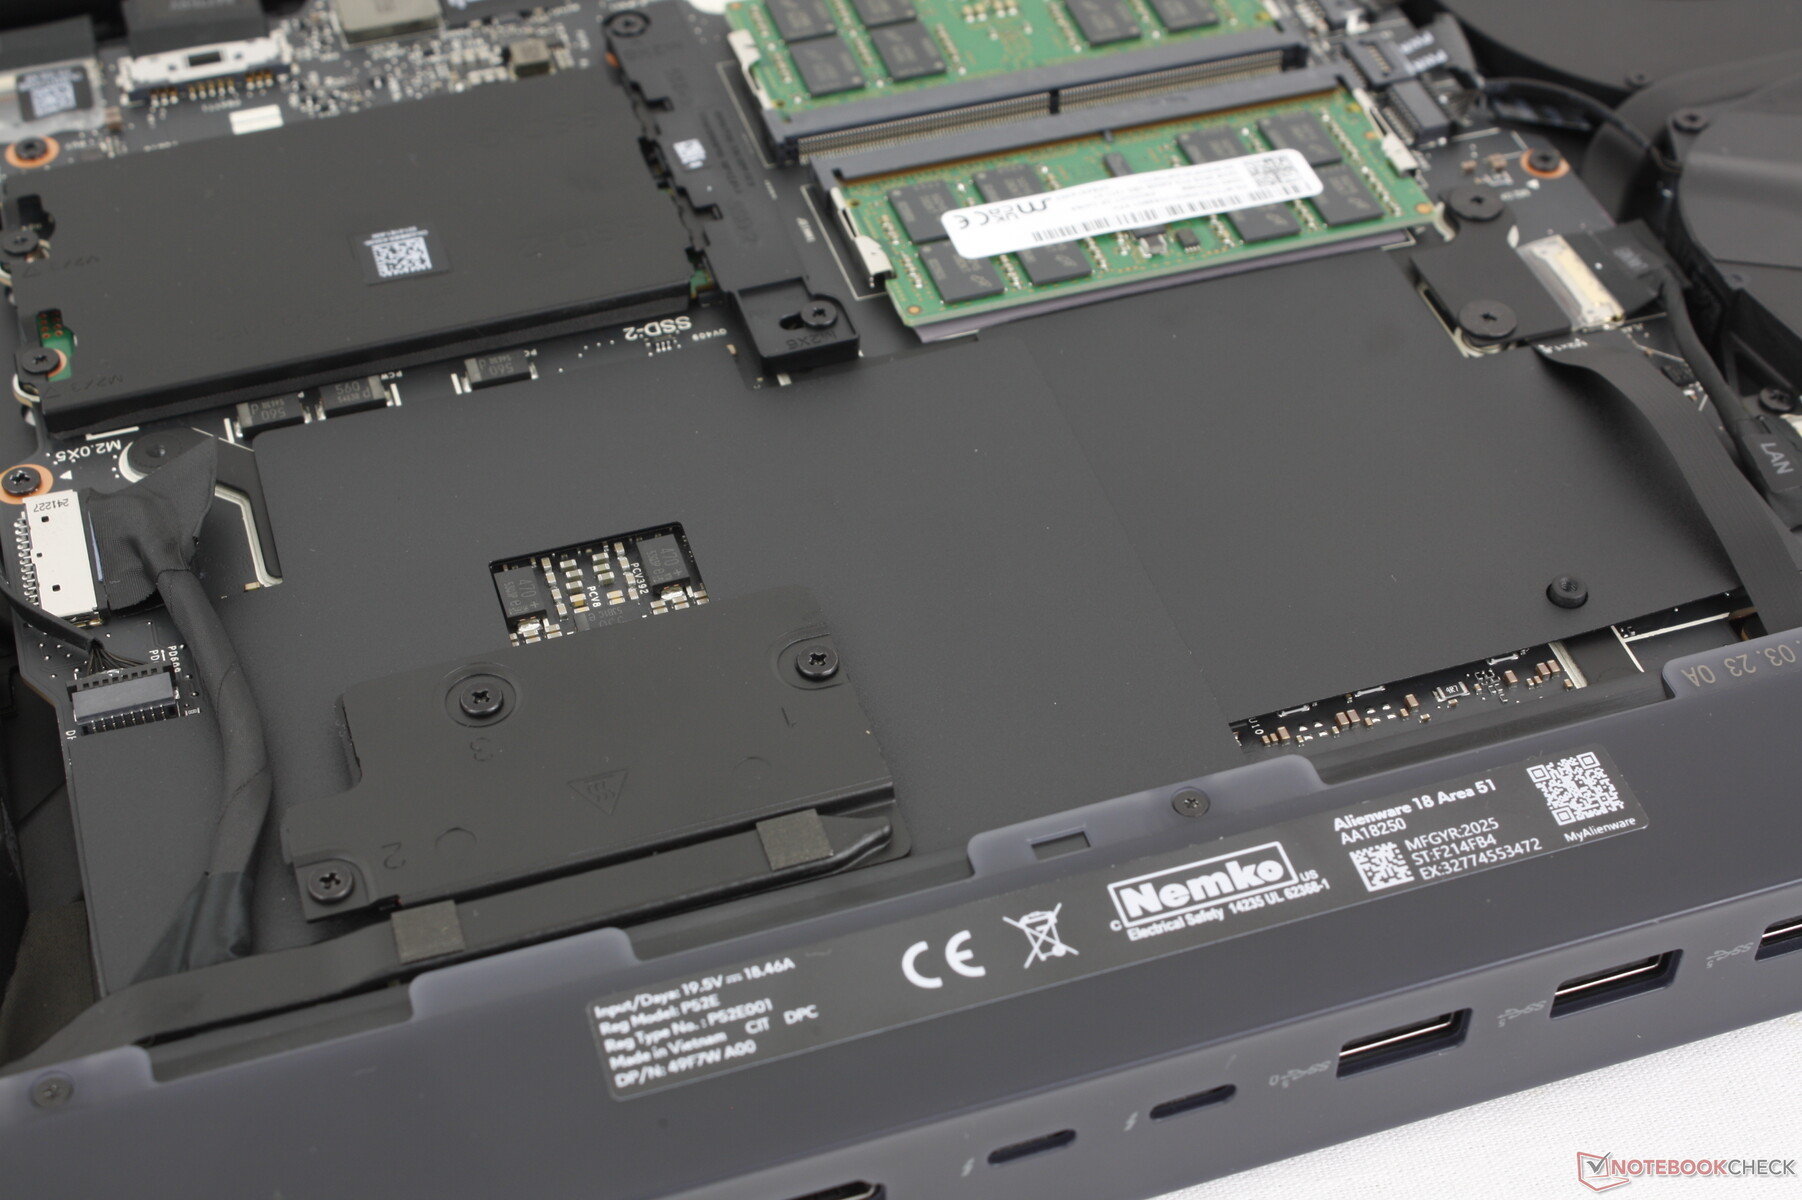
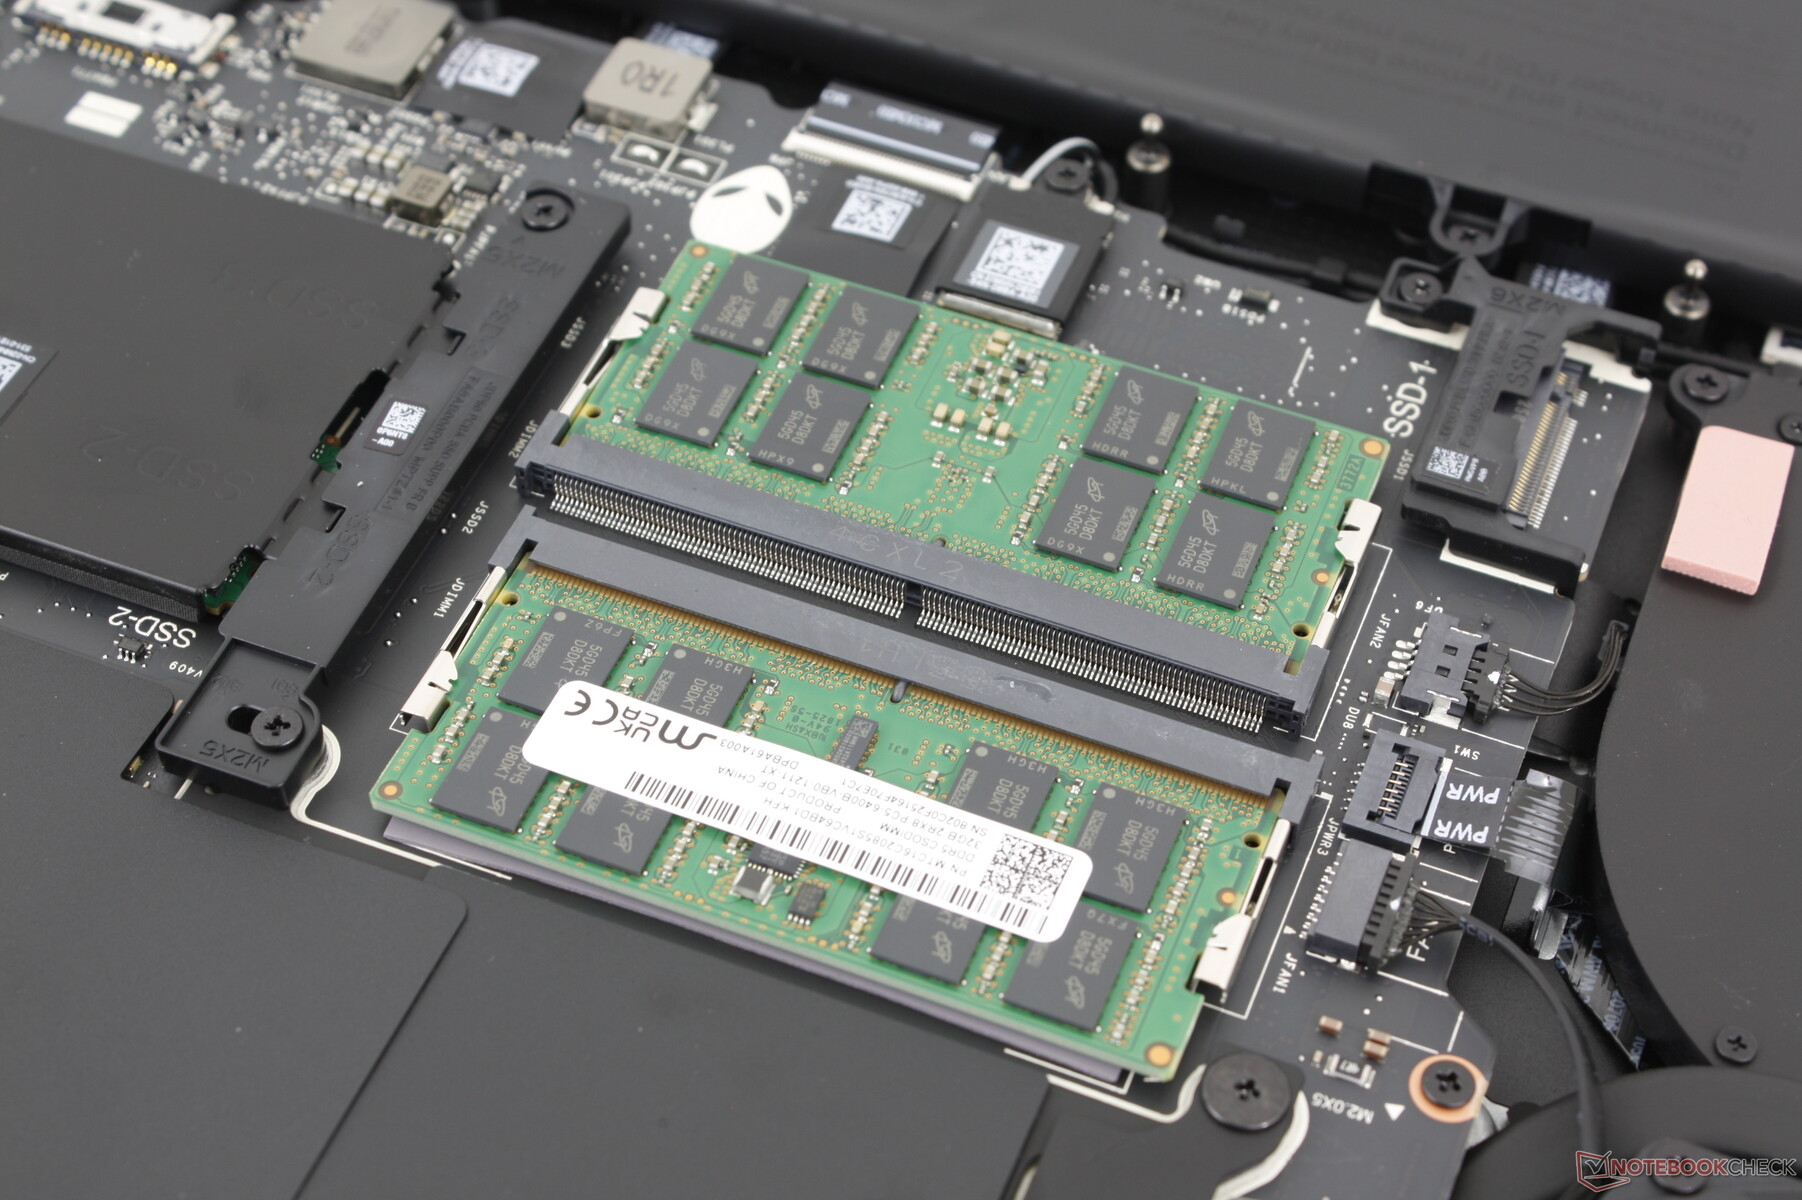
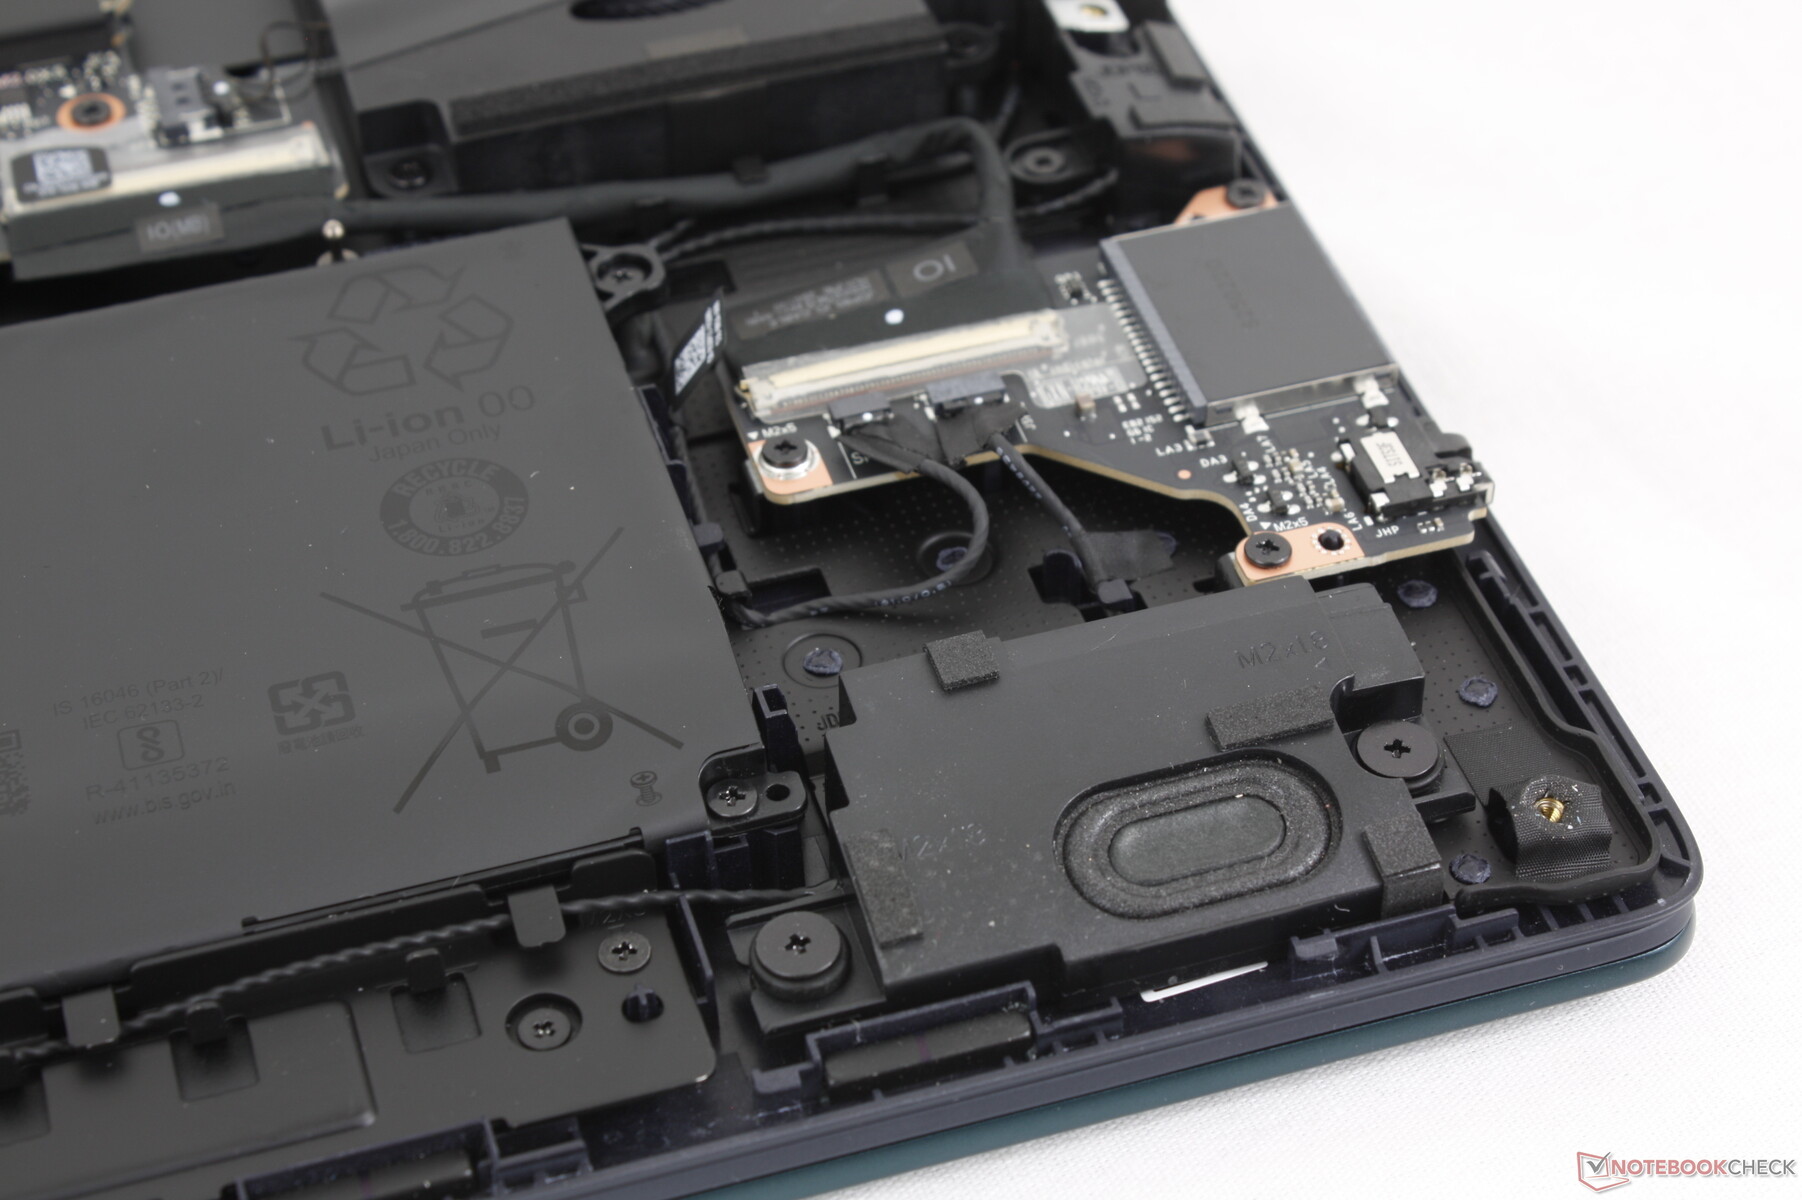
Die Unterseite ist mit acht Phillips Schrauben gesichert, was die Wartung relativ einfach macht. Das Innenleben ist ähnlich wie beim Alienware 16, aber mit größeren Lüftern für eine bessere Kühlung und einem neu positionierten SSD-Steckplatz.
Nachhaltigkeit
Wir können keine Informationen darüber finden, ob bei der Herstellung des Alienware 18 recycelte Kunststoffe oder Metalle verwendet wurden. Die Verpackung besteht größtenteils aus Papier und Karton und ist frei von Kunststoffen.
Zubehör und Garantie
In der Verkaufsverpackung befinden sich außer dem Netzteil und den Papieren keine weiteren Extras. Wenn man das Gerät in den USA kauft, gilt die übliche einjährige Herstellergarantie.
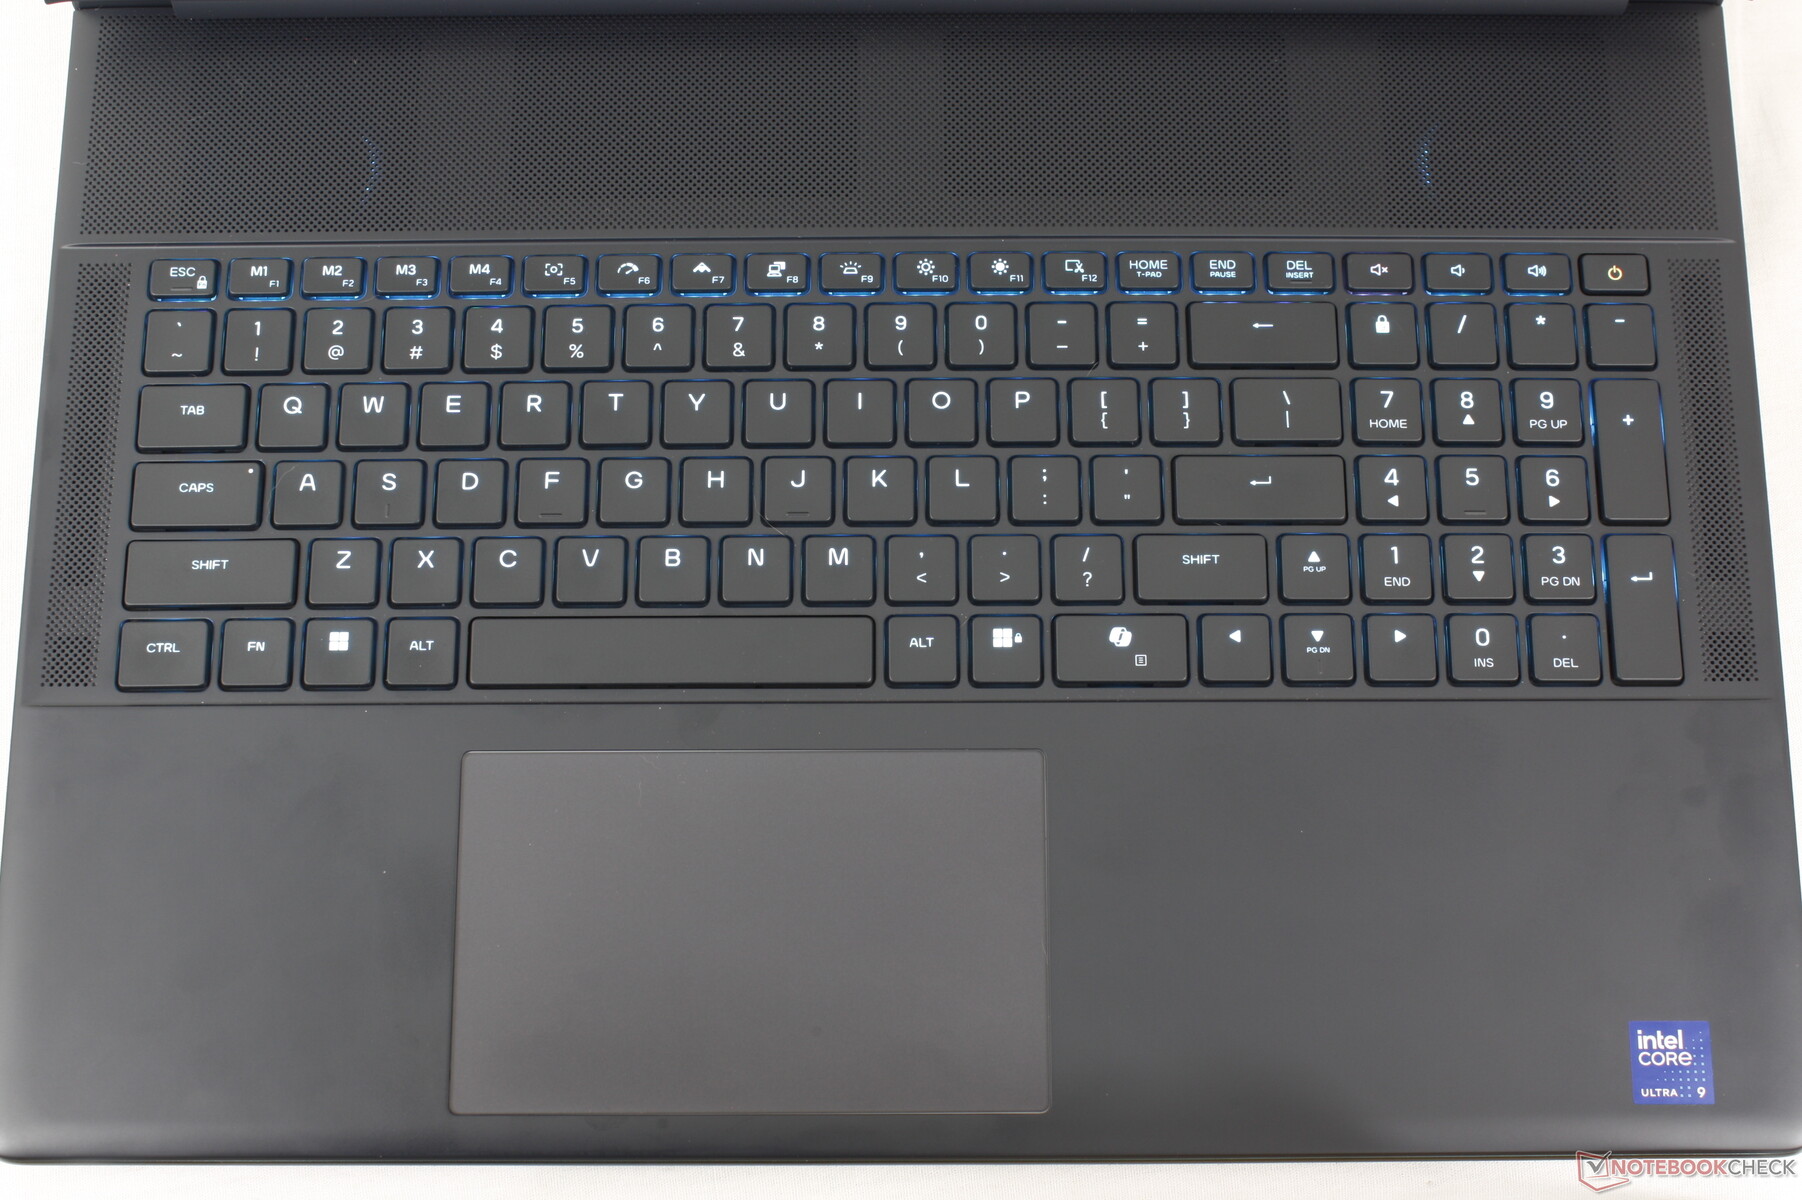
Eingabegeräte – Klickfreudig und komfortabel“
Tastatur
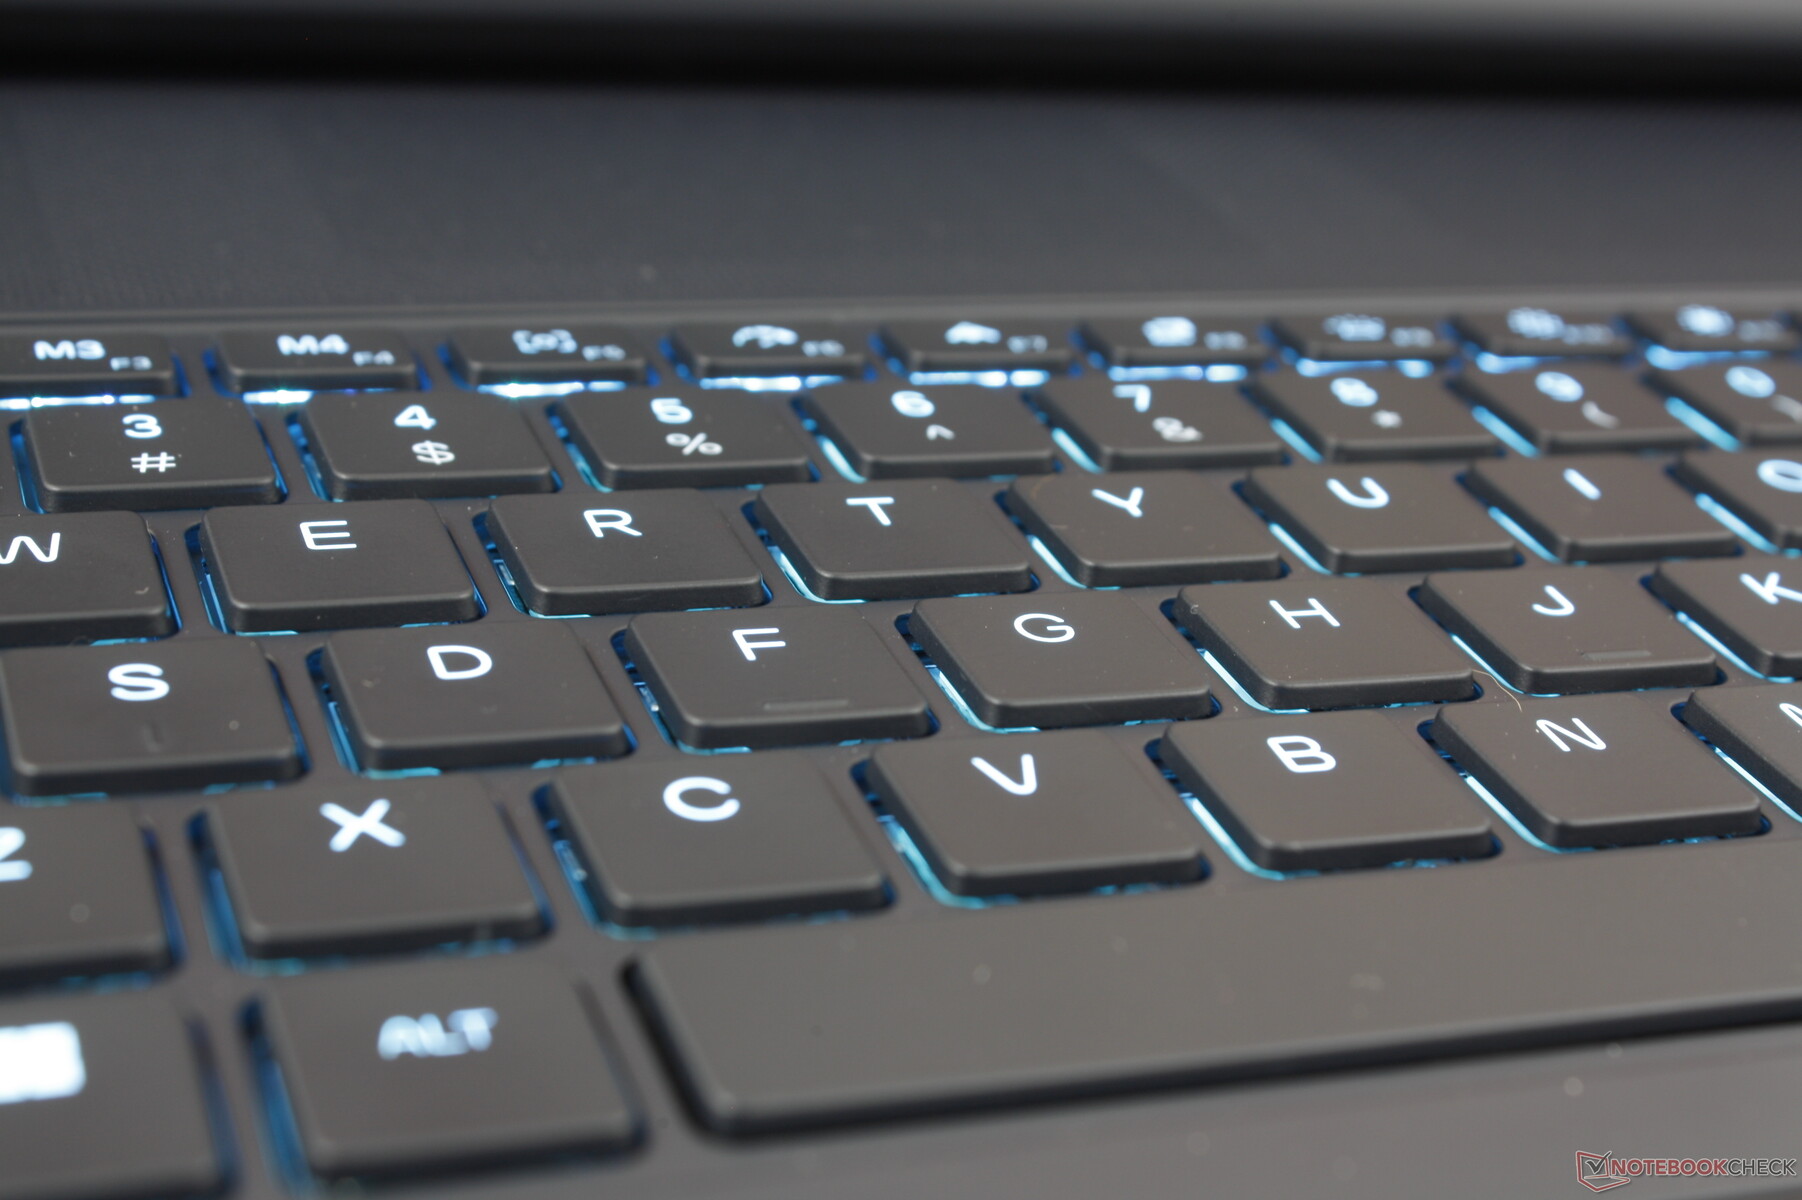
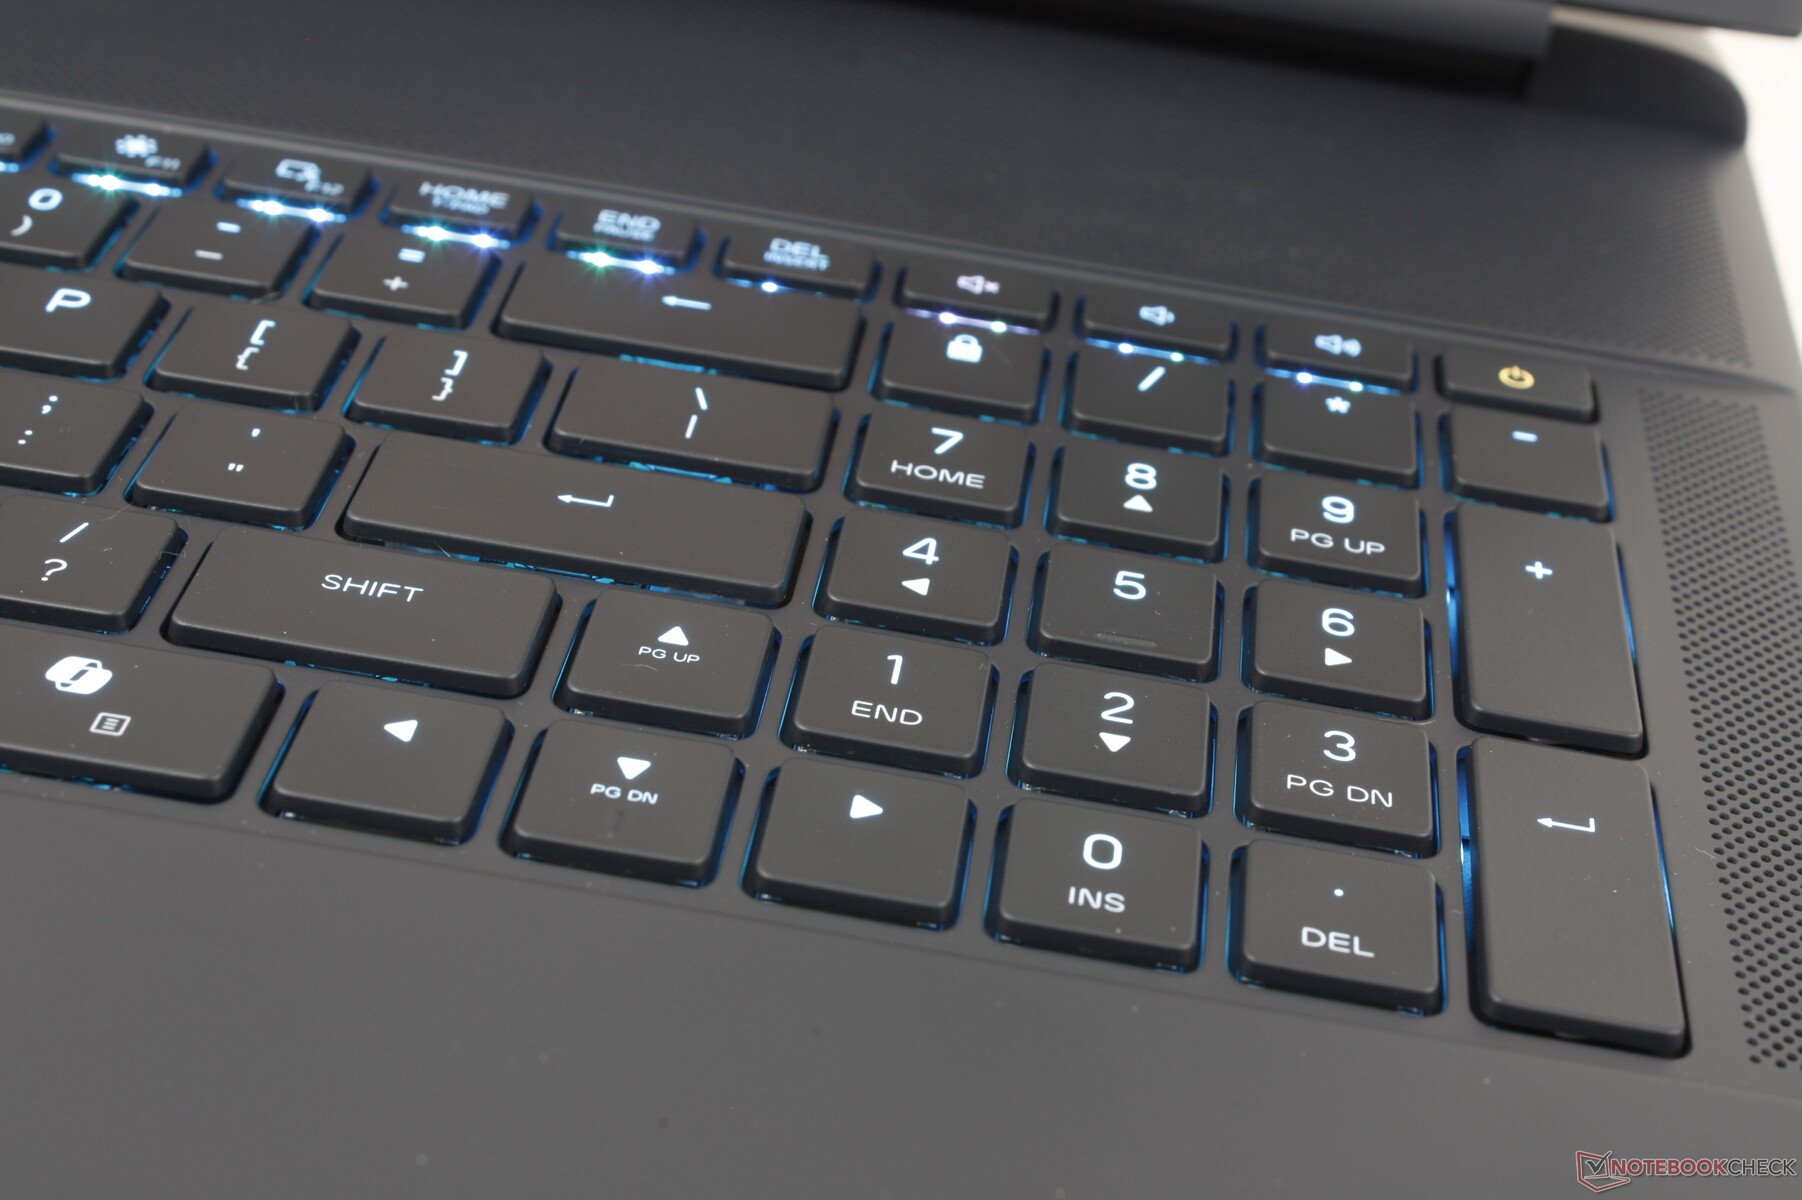
Die flache mechanische Cherry-Tastatur ist vom Alienware 16 und der letztjährigen Alienware-m18-Serie. Tatsächlich sind das Layout und die Tastenfunktionen fast identisch mit denen der Alienware-m18-Serie, so dass man im Wesentlichen das gleiche Tipperlebnis erhält. Die flachen CherryMX-Tasten gehören zu den geräumigsten und komfortabelsten, die wir je bei einem Gaming-Laptop erlebt haben, denn sie sind sehr leichtgängig, haben einen großen Hubweg und ein lautes Feedback. Allerdings könnten sich Nutzer dennoch für eine Konfiguration mit herkömmlichen Membrantasten entscheiden, da die lauten, hochfrequenten mechanischen Tasten in geräuschsensiblen Umgebungen möglicherweise unangebracht sind.
Touchpad
Das Clickpad des Alienware 18 ist etwas größer als das des Alienware 16 (13,2 x 8 cm vs. 11,2 x 6,5 cm). Der sanfte Zug und das laute "klickende" Feedback fühlen sich ansonsten bei beiden Modellen identisch an.

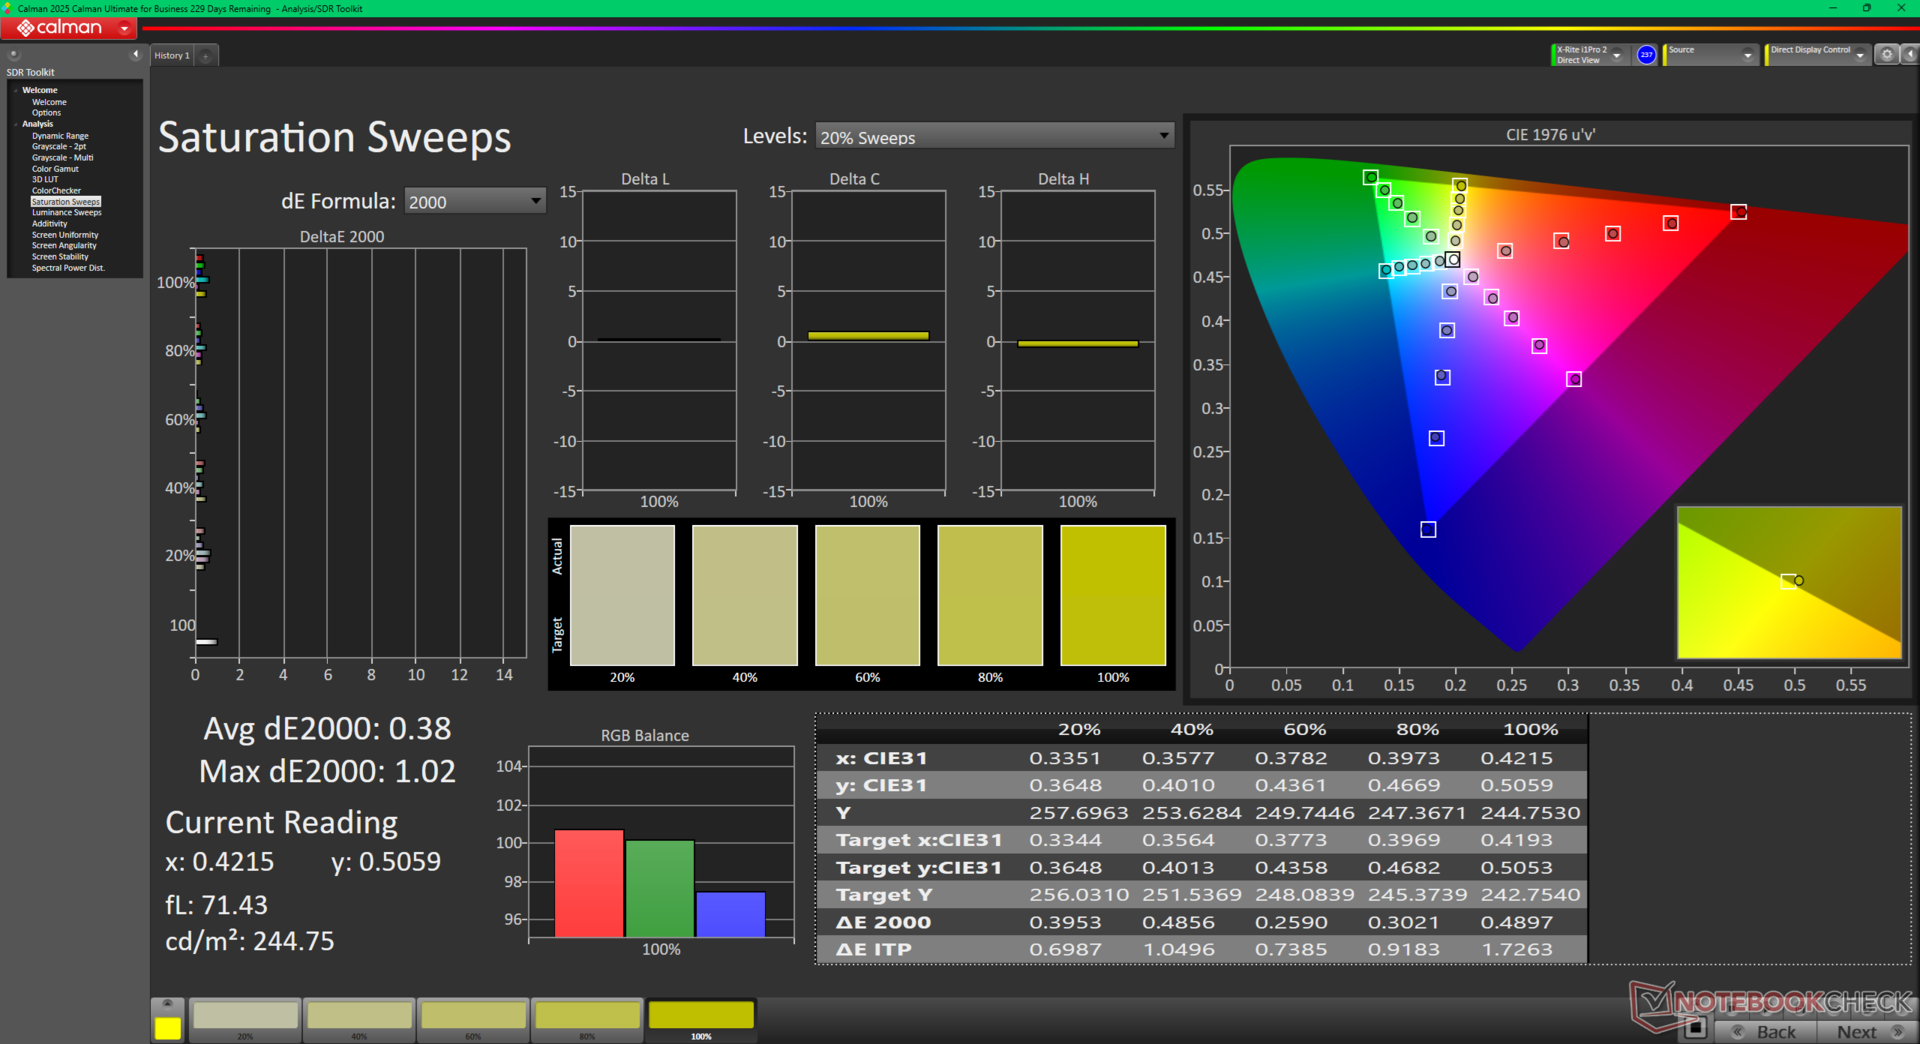
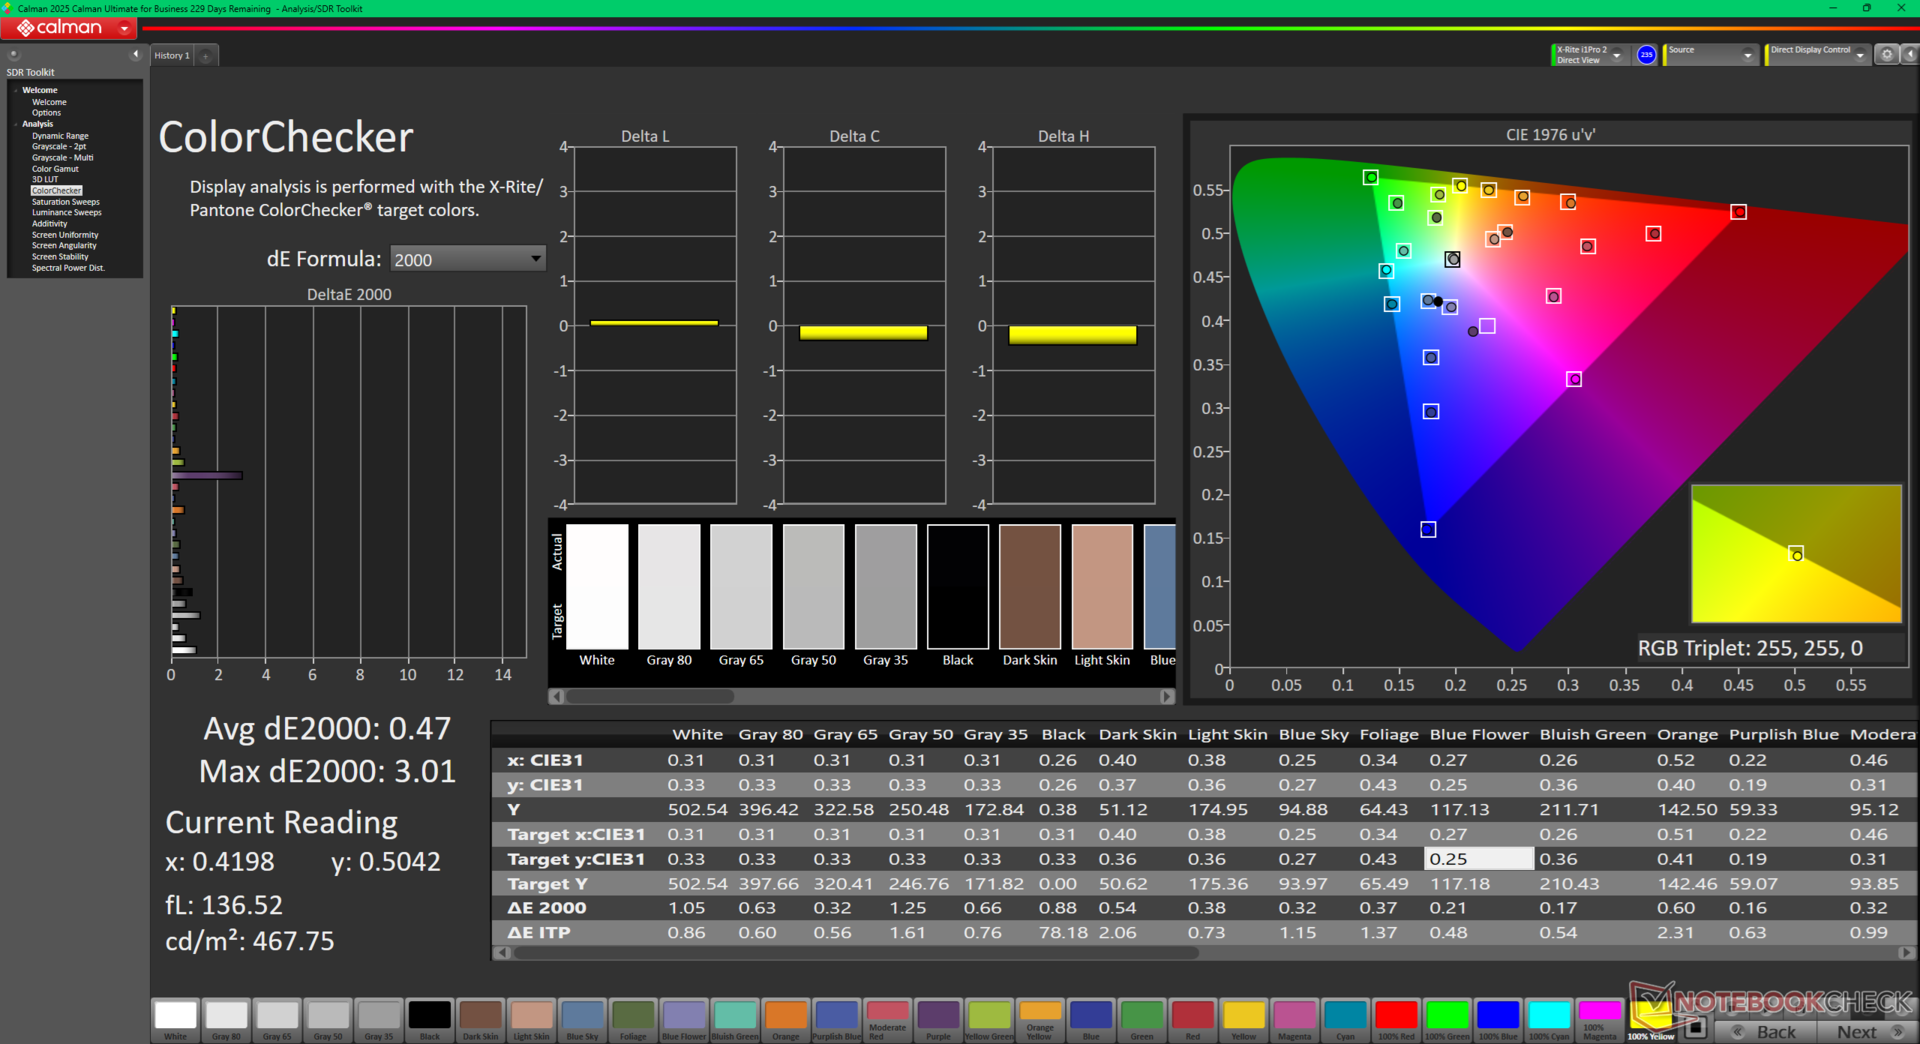
Display - Kein 4K verfügbar
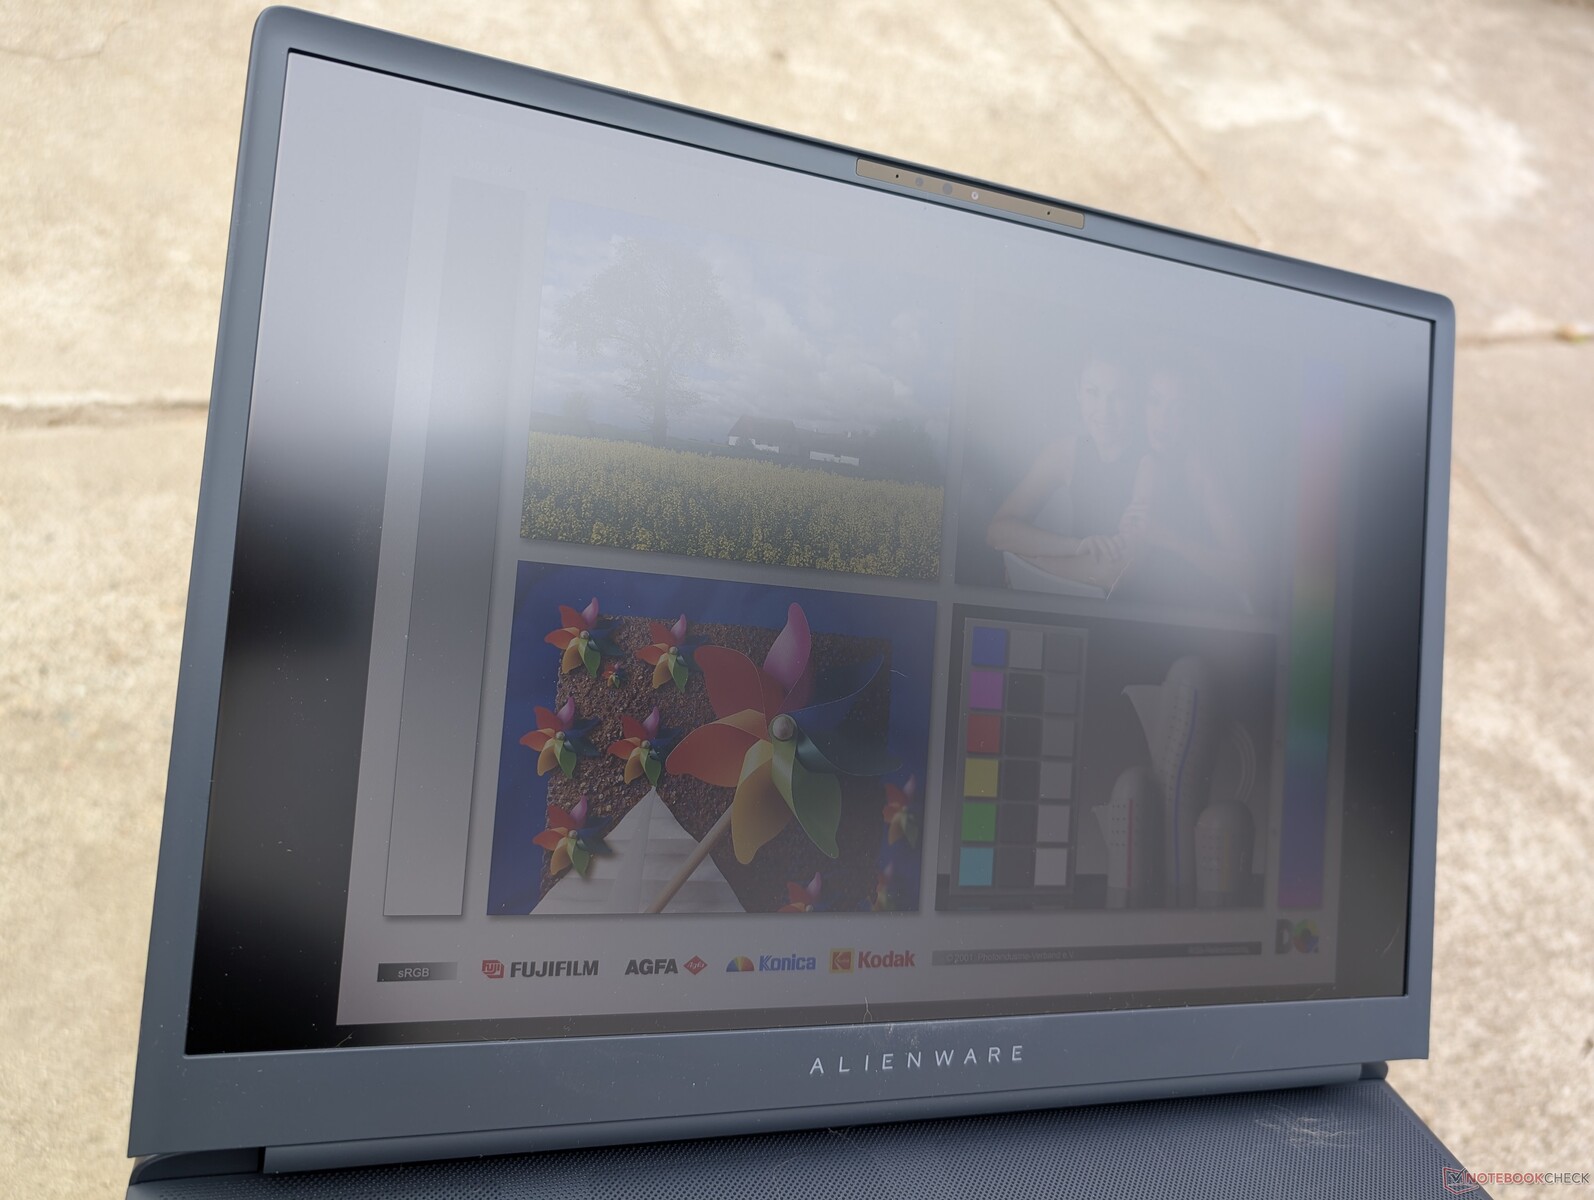
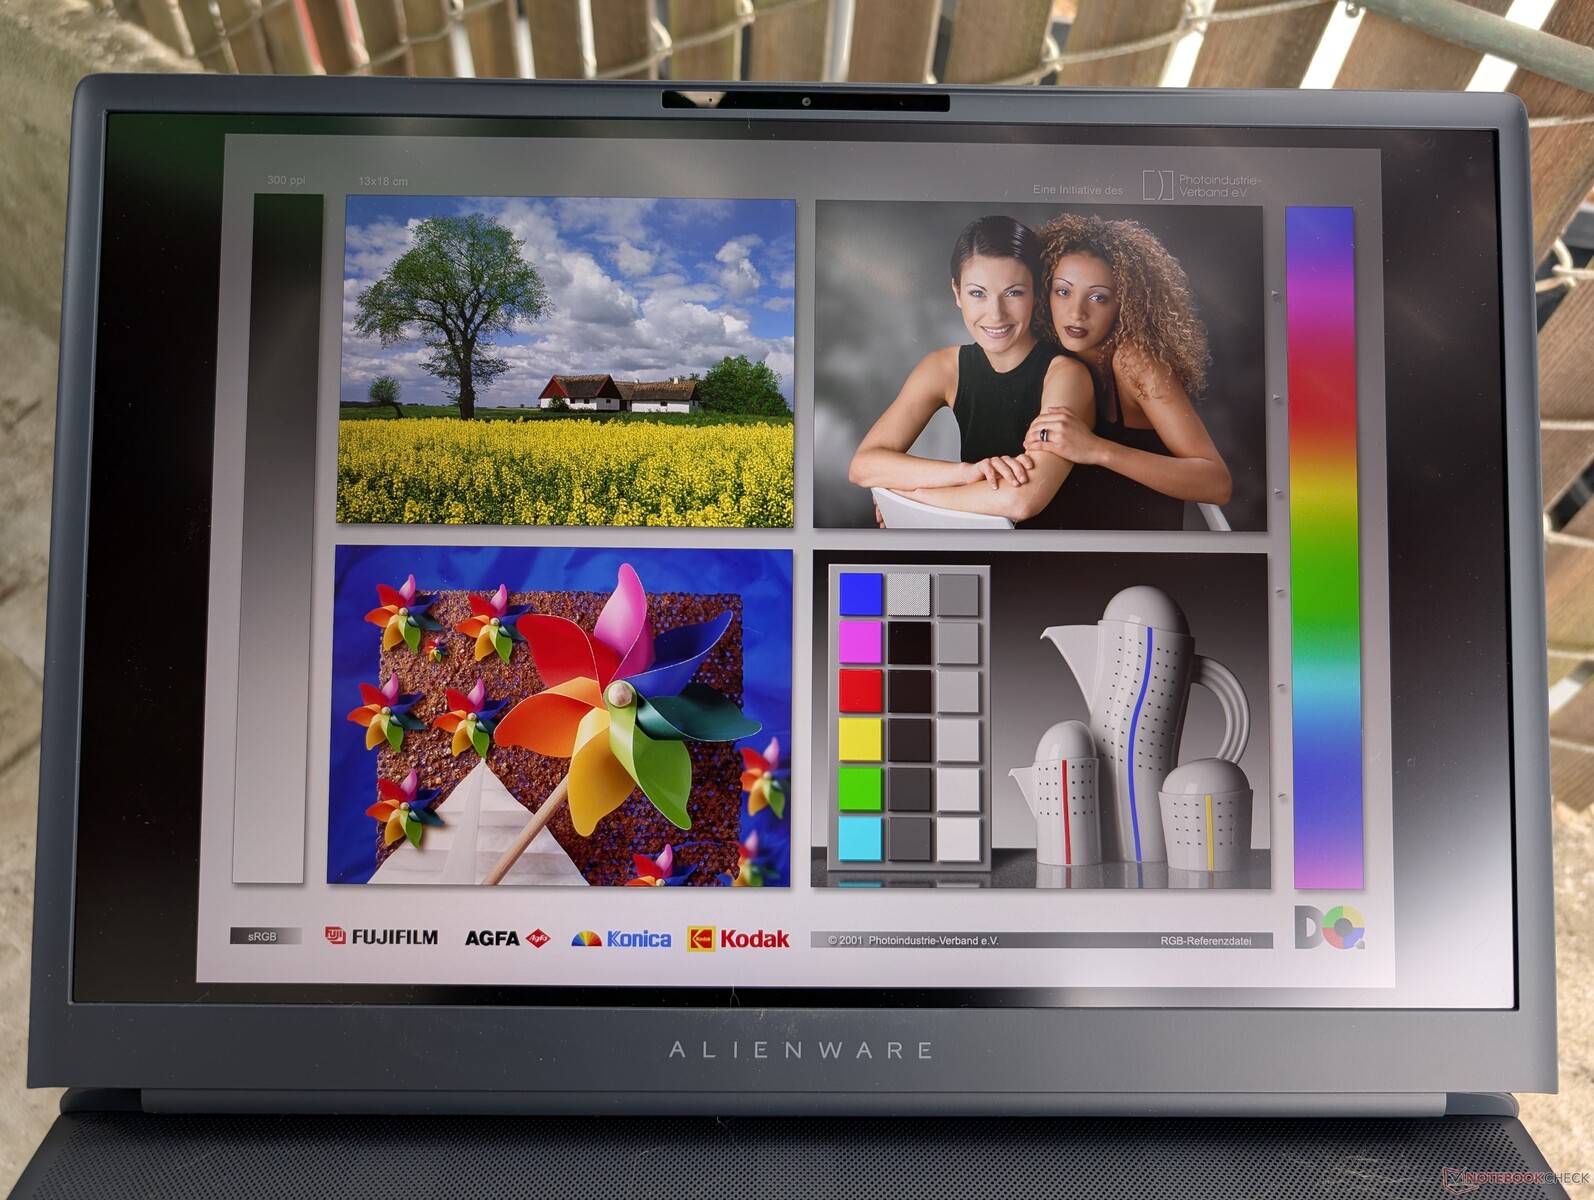
Es gibt derzeit nur eine einzige Display-Option, die wohl oder übel zur Verfügung steht. Zu den positiven Aspekten gehören die sehr hohe Bildwiederholfrequenz von 300 Hz und die vollen DCI-P3-Farben mit Unterstützung für Advanced Optimus. Auf der anderen Seite fehlt dem IPS-Display die HDR-Unterstützung und alle Vorteile von Mini-LED oder OLED wie tiefe Schwarzwerte und hohe maximale Helligkeitswerte. Es ist auch bedauerlich, dass es keine 4K-Option gibt, wenn man bedenkt, wie groß der 18-Zoll-Bildschirm ist. Das MSI Raider A18 HX hat in diesen spezifischen Szenarien die leichte Oberhand.


| |||||||||||||||||||||||||
Ausleuchtung: 94 %
Helligkeit Akku: 512.5 cd/m²
Kontrast: 1250:1 (Schwarzwert: 0.41 cd/m²)
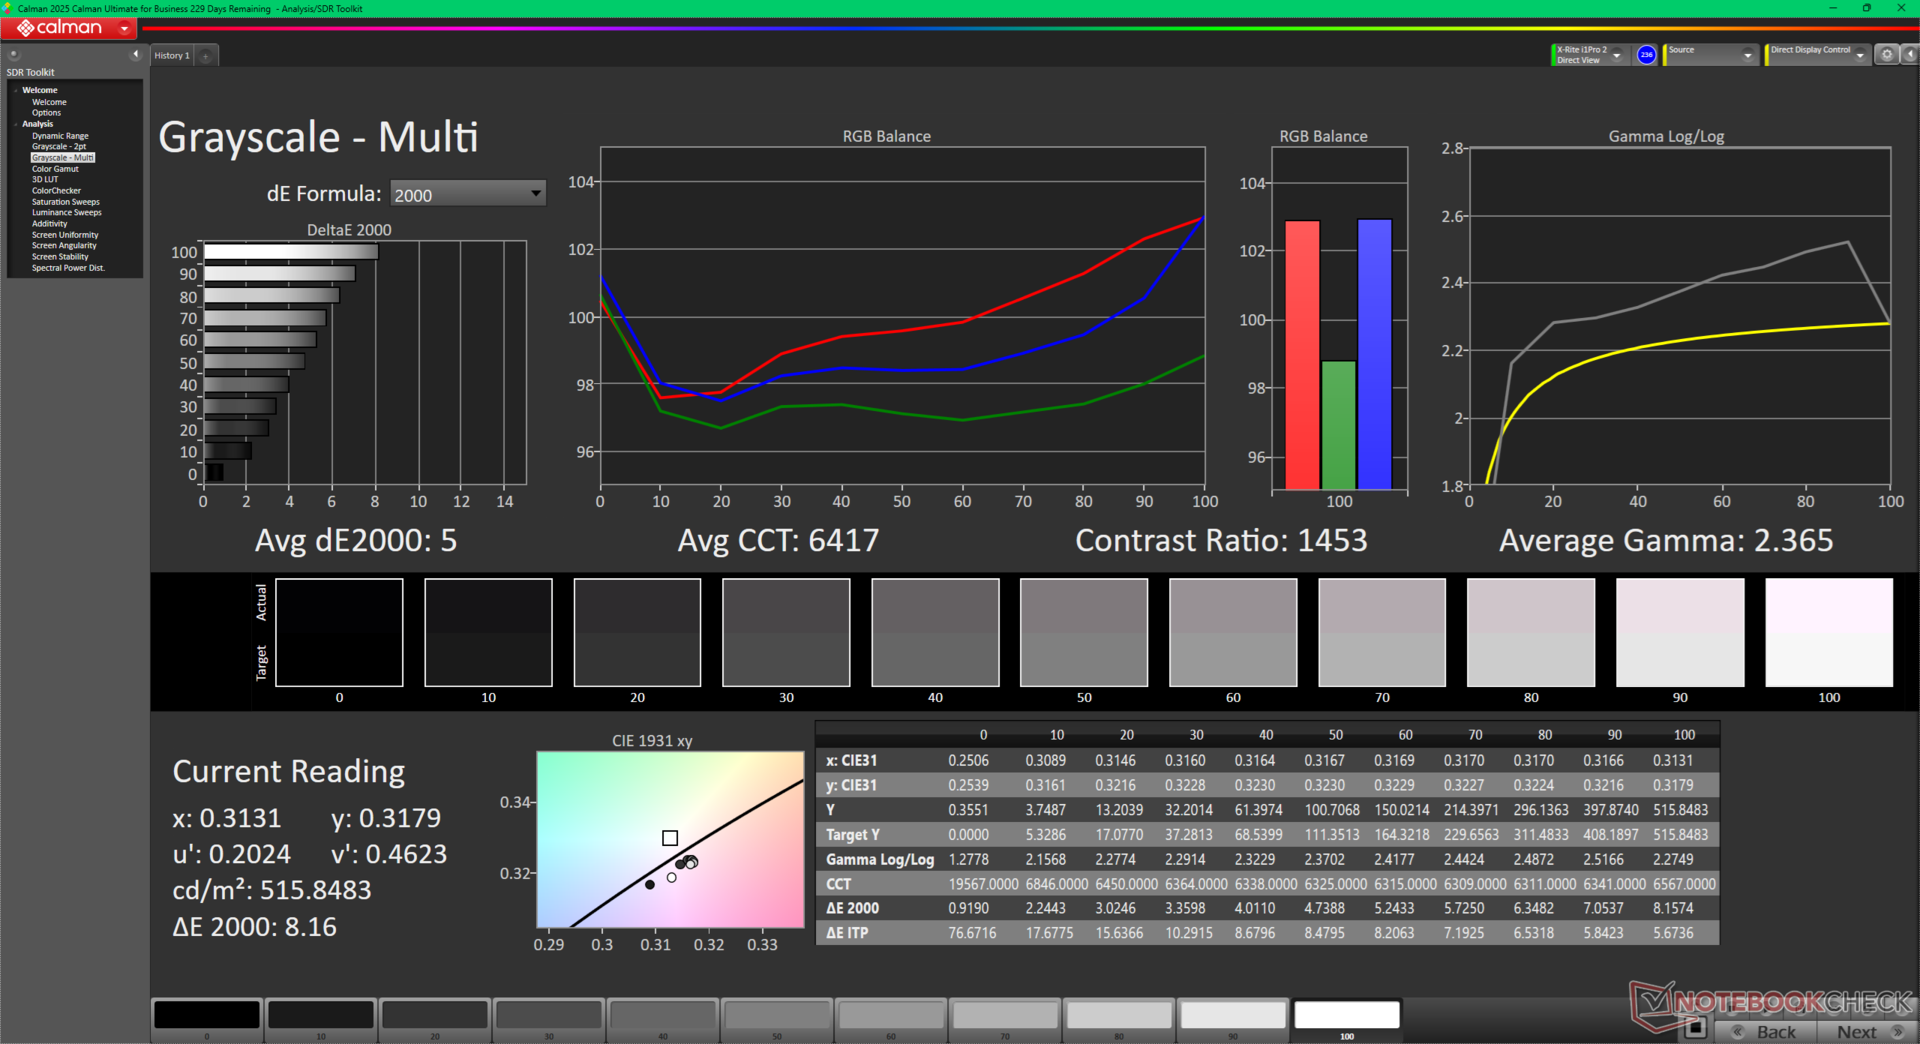
ΔE ColorChecker Calman: 3.24 | ∀{0.5-29.43 Ø4.72}
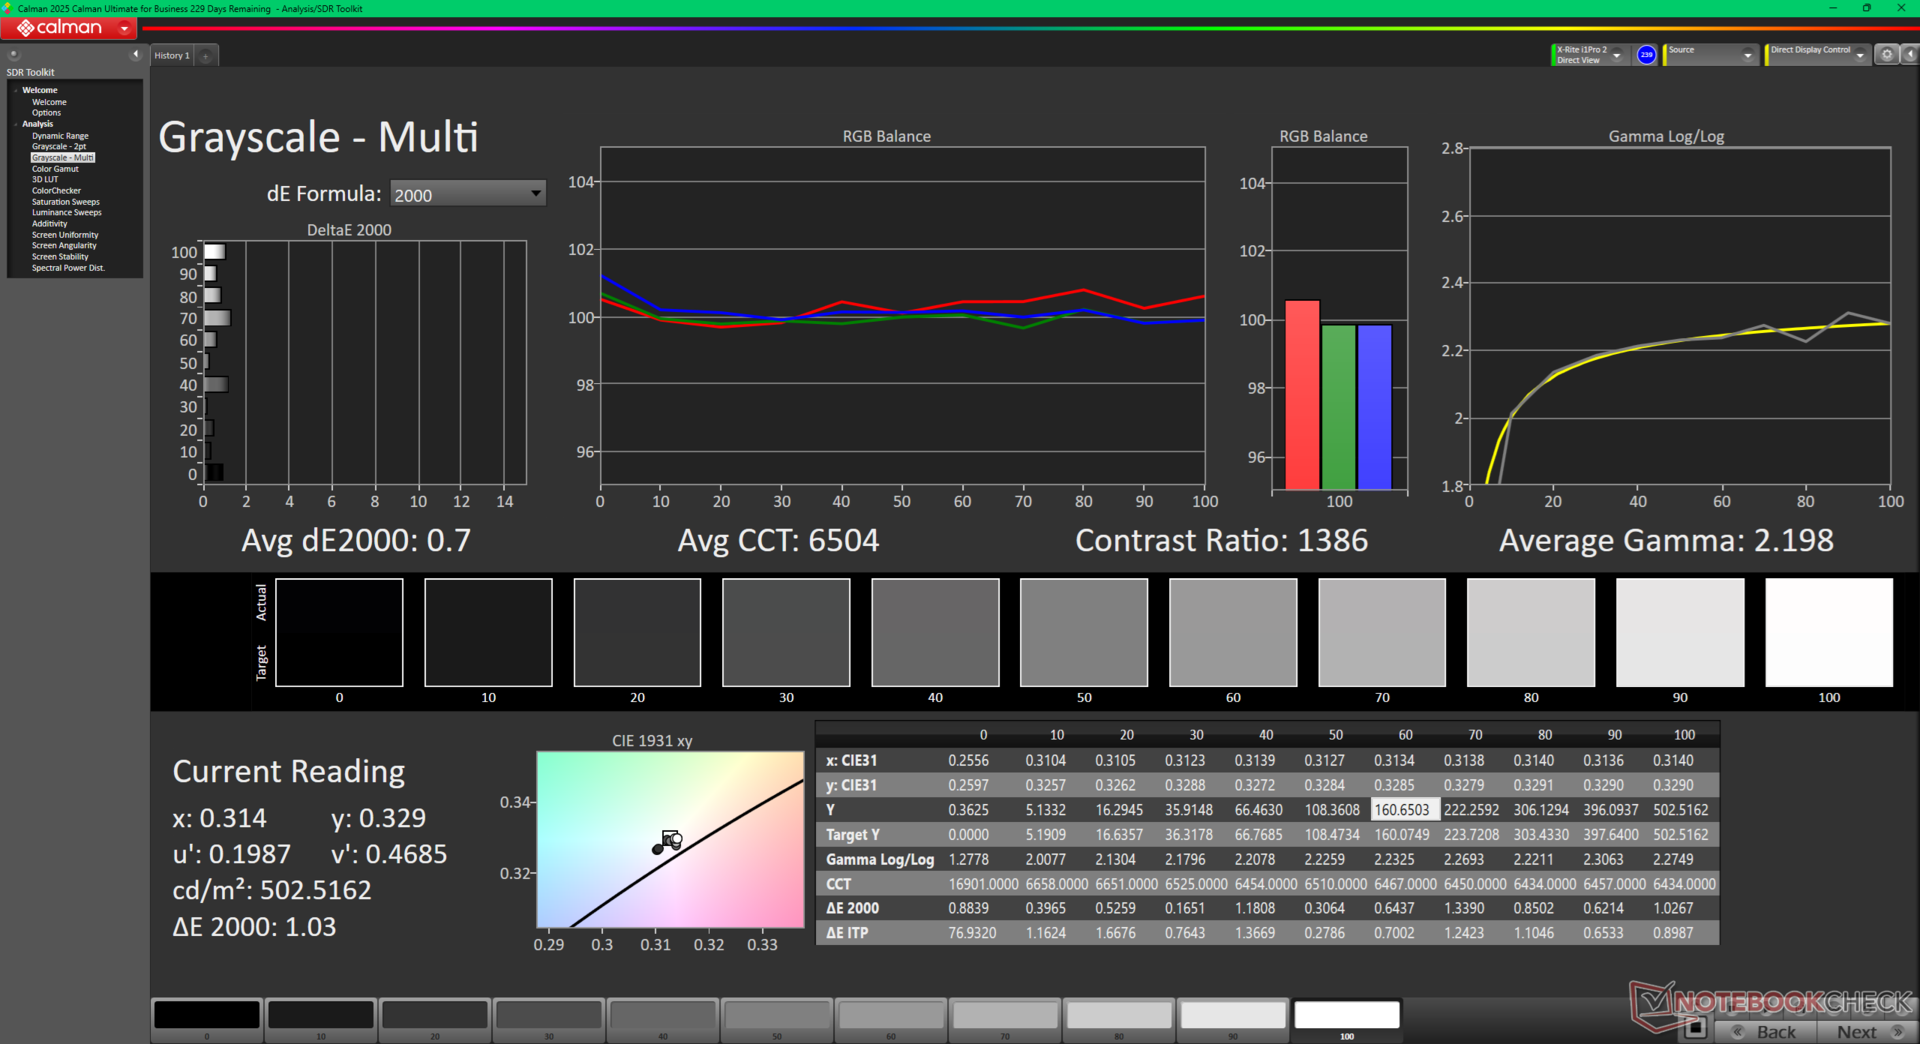
calibrated: 0.47
ΔE Greyscale Calman: 5 | ∀{0.09-98 Ø4.97}
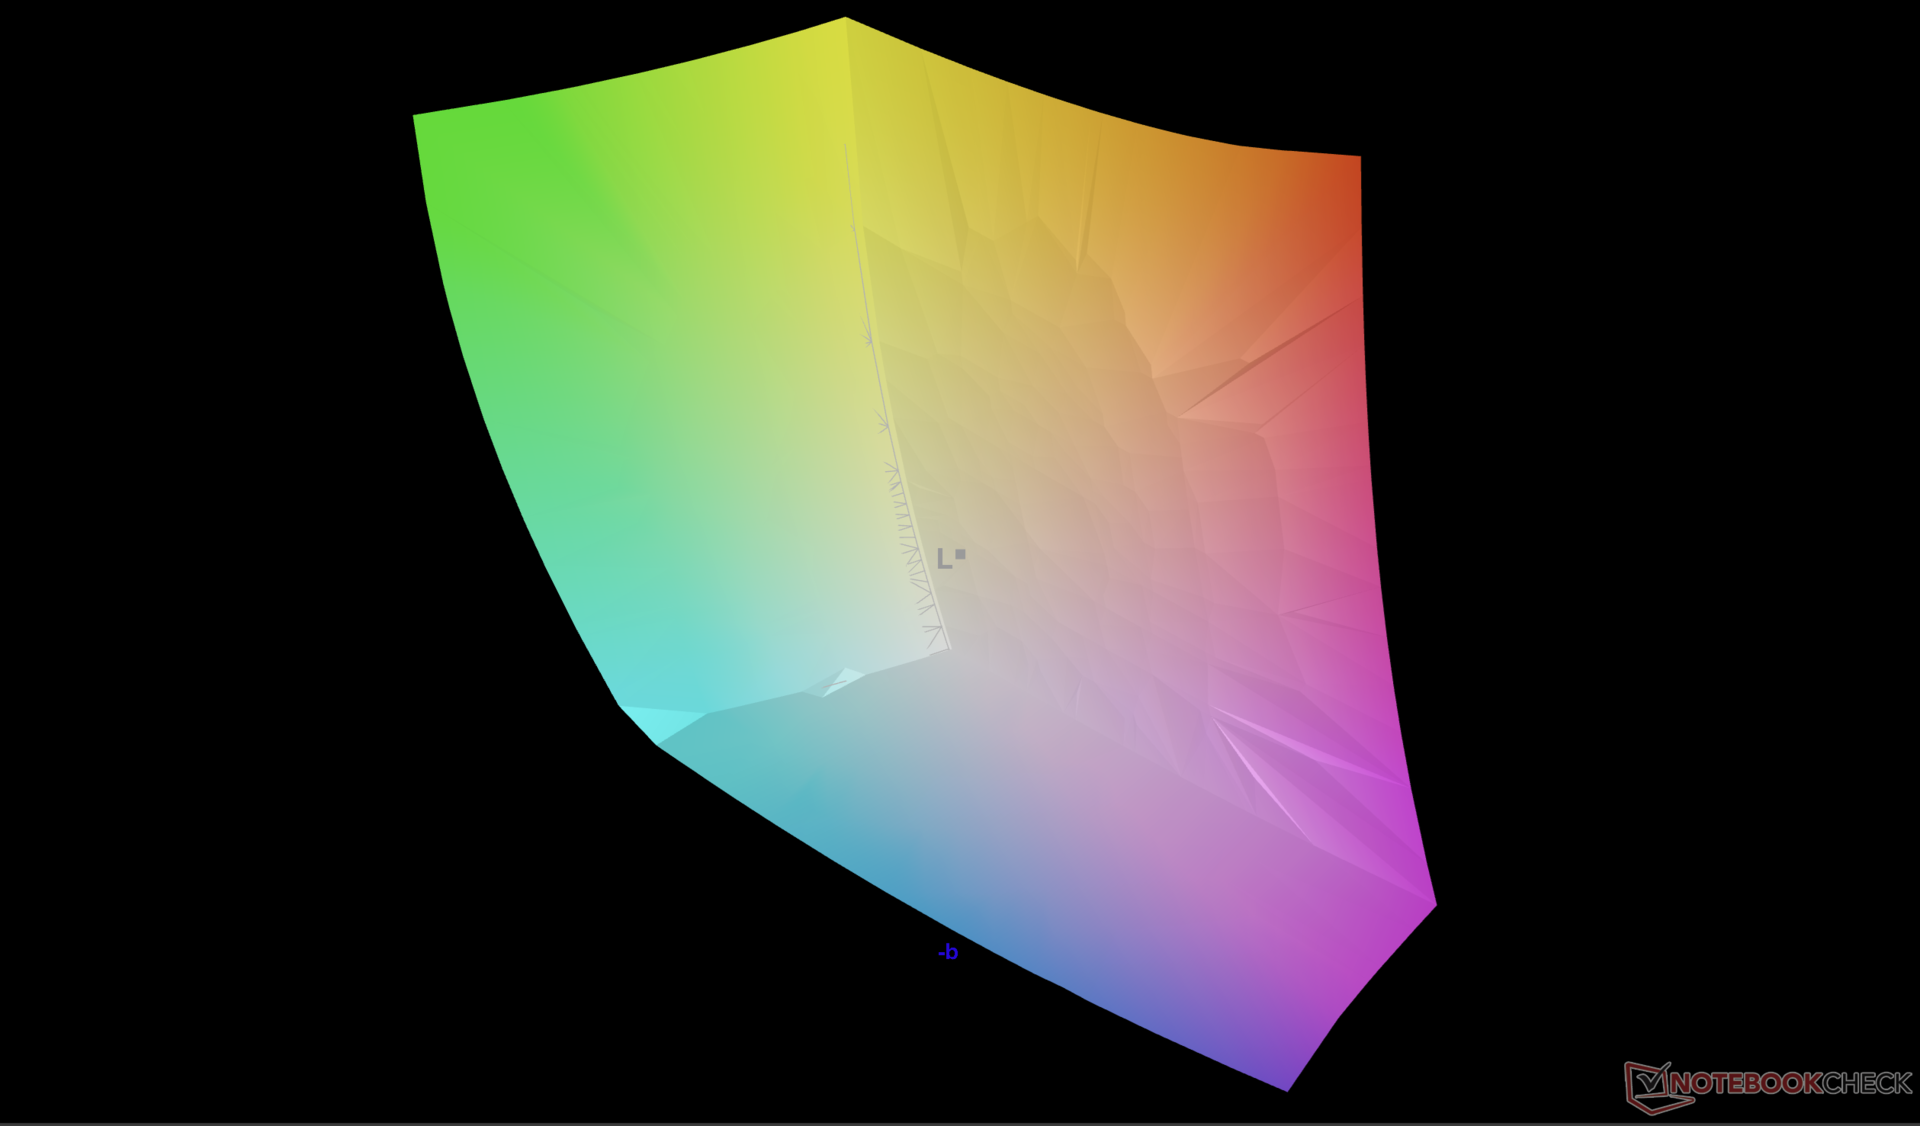
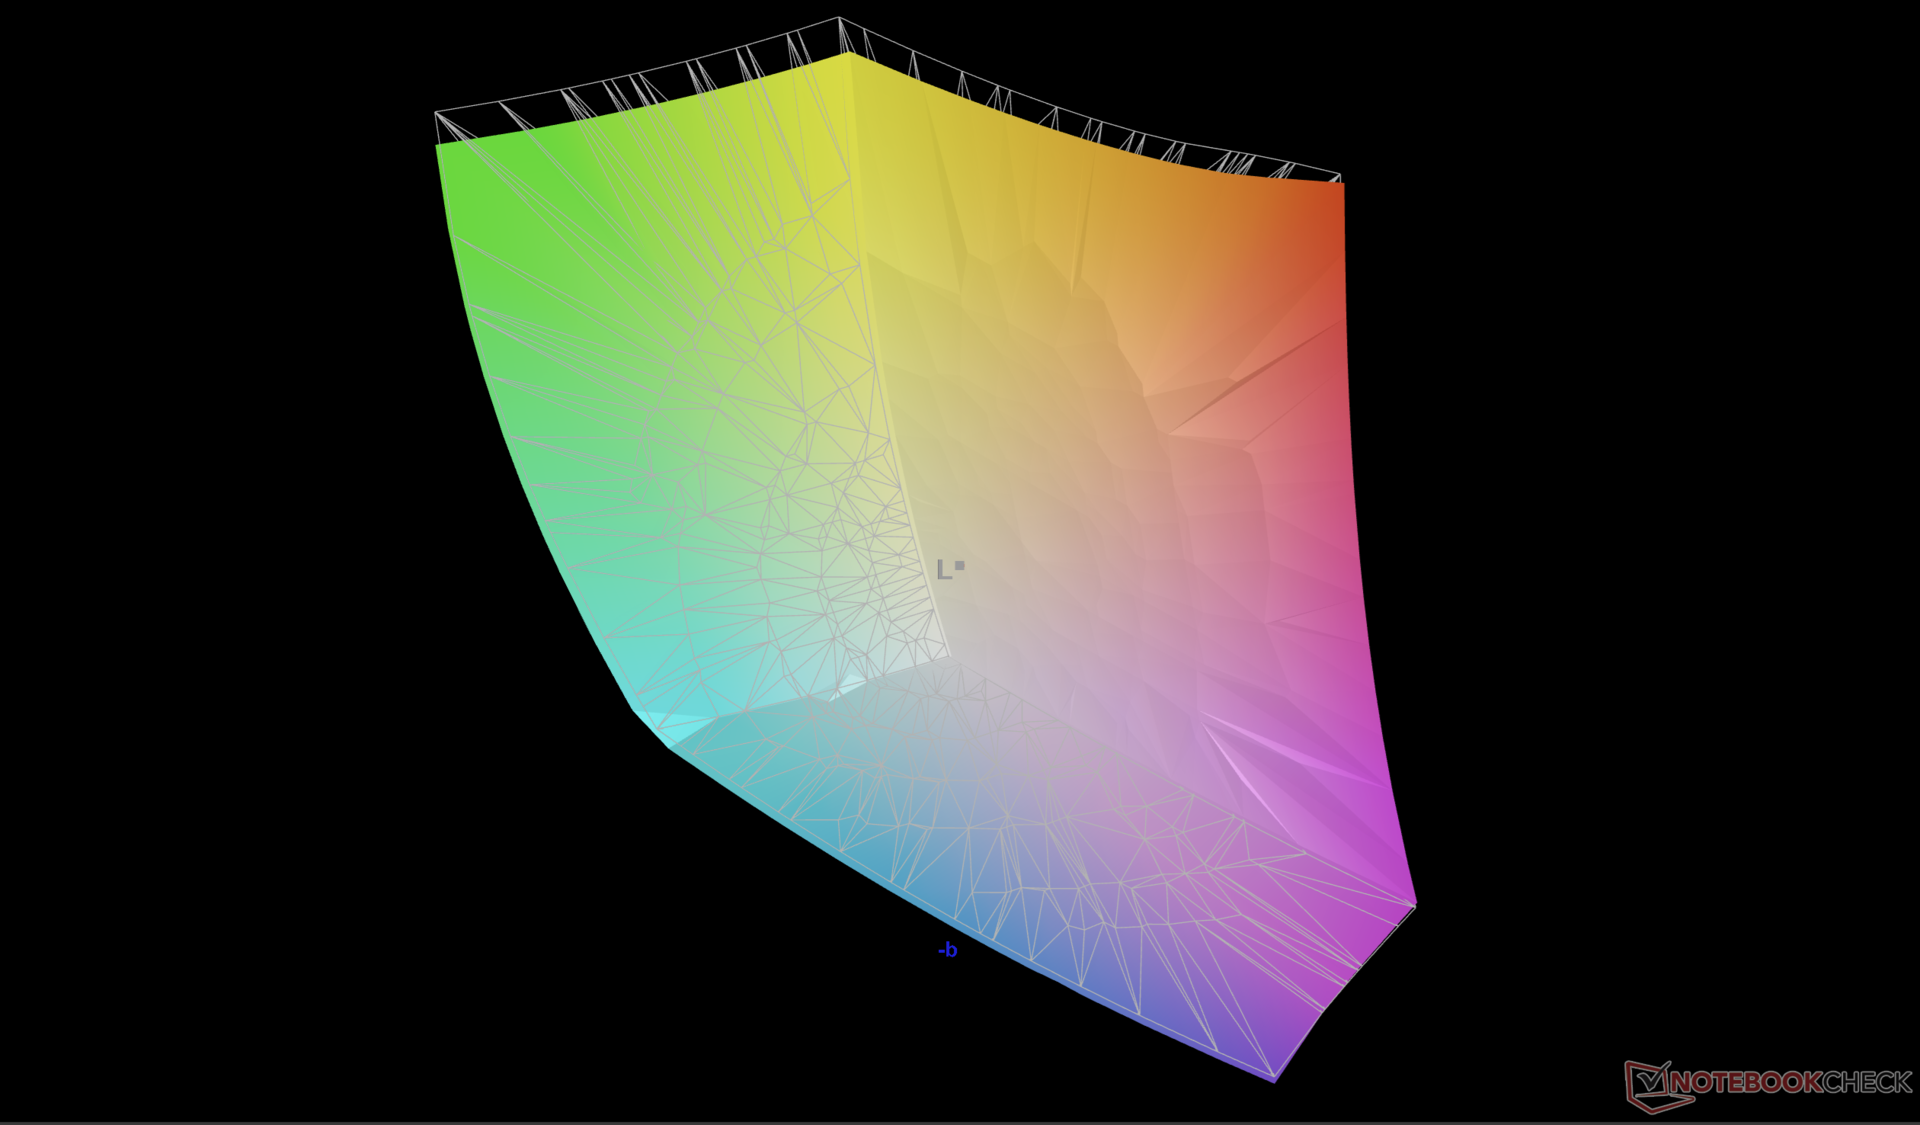
89.7% AdobeRGB 1998 (Argyll 3D)
100% sRGB (Argyll 3D)
96.1% Display P3 (Argyll 3D)
Gamma: 2.37
CCT: 6417 K
| Alienware 18 Area-51 AU Optronics B180QAN, IPS, 2560x1600, 18", 300 Hz | Alienware 16 Area-51 AU Optronics B160QAN, IPS, 2560x1600, 16", 240 Hz | Alienware m18 R2 BOE NE18NZ1, IPS, 2560x1600, 18", 165 Hz | MSI Raider A18 HX A9WIG-080 B180ZAN01.0, MiniLED IPS, 3840x2400, 18", 120 Hz | Razer Blade 18 2024 RZ09-0509 BOE NE180QDM-NM1, Mini-LED, 2560x1600, 18", 300 Hz | Asus ROG Strix G18 G814JI NE180QDM-NZ2 (BOE0B35), IPS, 2560x1600, 18", 240 Hz | Acer Predator Helios 18 PH18-72-98MW B180QAN01.2 (AUO45A8), Mini-LED, 2560x1600, 18", 250 Hz | |
|---|---|---|---|---|---|---|---|
| Display | -0% | 0% | 3% | 0% | -1% | 2% | |
| Display P3 Coverage (%) | 96.1 | 96 0% | 97.8 2% | 99.9 4% | 99 3% | 98.1 2% | 99.7 4% |
| sRGB Coverage (%) | 100 | 100 0% | 99.5 0% | 100 0% | 100 0% | 99.9 0% | 100 0% |
| AdobeRGB 1998 Coverage (%) | 89.7 | 89.2 -1% | 88.9 -1% | 93.9 5% | 86.9 -3% | 85.6 -5% | 91.6 2% |
| Response Times | 40% | 20% | -76% | -10% | 27% | -32% | |
| Response Time Grey 50% / Grey 80% * (ms) | 13 ? | 4.8 ? 63% | 5.3 ? 59% | 23 ? -77% | 7.6 ? 42% | 5.6 ? 57% | 8 ? 38% |
| Response Time Black / White * (ms) | 8.7 ? | 7.2 ? 17% | 10.4 ? -20% | 15.1 ? -74% | 14 ? -61% | 9 ? -3% | 17.6 ? -102% |
| PWM Frequency (Hz) | 15203 | 26444 ? | 4832 ? | ||||
| PWM Amplitude * (%) | 100 | ||||||
| Bildschirm | -6% | -3% | 331% | 15% | -1% | 148% | |
| Helligkeit Bildmitte (cd/m²) | 512.5 | 554 8% | 271.8 -47% | 510 0% | 605.4 18% | 471 -8% | 722 41% |
| Brightness (cd/m²) | 496 | 532 7% | 275 -45% | 470 -5% | 600 21% | 422 -15% | 724 46% |
| Brightness Distribution (%) | 94 | 88 -6% | 78 -17% | 85 -10% | 97 3% | 83 -12% | 93 -1% |
| Schwarzwert * (cd/m²) | 0.41 | 0.52 -27% | 0.27 34% | 0.01 98% | 0.62 -51% | 0.47 -15% | 0.04 90% |
| Kontrast (:1) | 1250 | 1065 -15% | 1007 -19% | 51000 3980% | 976 -22% | 1002 -20% | 18050 1344% |
| Delta E Colorchecker * | 3.24 | 2.81 13% | 2.48 23% | 4.5 -39% | 1.53 53% | 2.05 37% | 3.4 -5% |
| Colorchecker dE 2000 max. * | 8.4 | 8.32 1% | 5.59 33% | 7.3 13% | 4.15 51% | 4.15 51% | 5.32 37% |
| Colorchecker dE 2000 calibrated * | 0.47 | 0.65 -38% | 0.56 -19% | 5.7 -1113% | 0.8 -70% | 1.6 -240% | |
| Delta E Graustufen * | 5 | 4.7 6% | 3.7 26% | 2.3 54% | 2.6 48% | 2.8 44% | 3.8 24% |
| Gamma | 2.37 93% | 2.3 96% | 2.2 100% | 2.08 106% | 2.22 99% | 2.204 100% | 2.383 92% |
| CCT | 6417 101% | 6476 100% | 6355 102% | 6648 98% | 6843 95% | 7122 91% | 7051 92% |
| Durchschnitt gesamt (Programm / Settings) | 11% /
2% | 6% /
1% | 86% /
203% | 2% /
8% | 8% /
3% | 39% /
91% |
* ... kleinere Werte sind besser
Das Display ist standardmäßig anständig kalibriert ab Werk gegen den sRGB-Standard. Wenn man ihn selbst mit einem X-Rite-Kolorimeter kalibriert, verbessern sich die durchschnittlichen Graustufen- und Farb-DeltaE-Werte auf nur 0,7 bzw. 0,47.


Reaktionszeiten (Response Times) des Displays
| ↔ Reaktionszeiten Schwarz zu Weiß | ||
|---|---|---|
| 8.7 ms ... steigend ↗ und fallend ↘ kombiniert | ↗ 4.4 ms steigend | 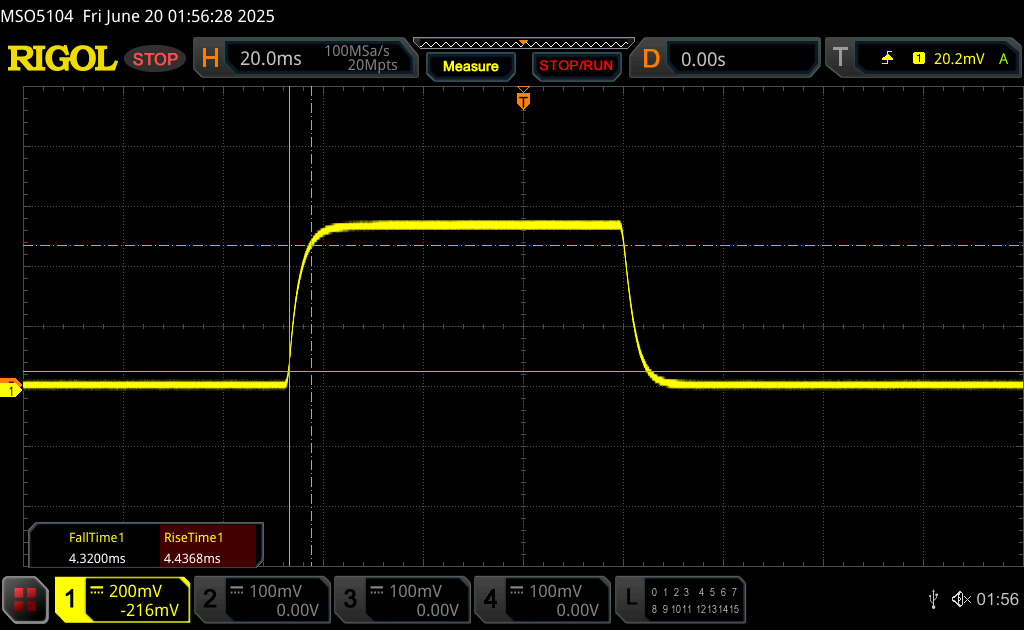 |
| ↘ 4.3 ms fallend | ||
| Die gemessenen Reaktionszeiten sind kurz wodurch sich der Bildschirm auch für Spiele gut eignen sollte. Im Vergleich rangierten die bei uns getesteten Geräte von 0.1 (Minimum) zu 240 (Maximum) ms. » 24 % aller Screens waren schneller als der getestete. Daher sind die gemessenen Reaktionszeiten besser als der Durchschnitt aller vermessenen Geräte (19.8 ms). | ||
| ↔ Reaktionszeiten 50% Grau zu 80% Grau | ||
| 13 ms ... steigend ↗ und fallend ↘ kombiniert | ↗ 5.8 ms steigend | 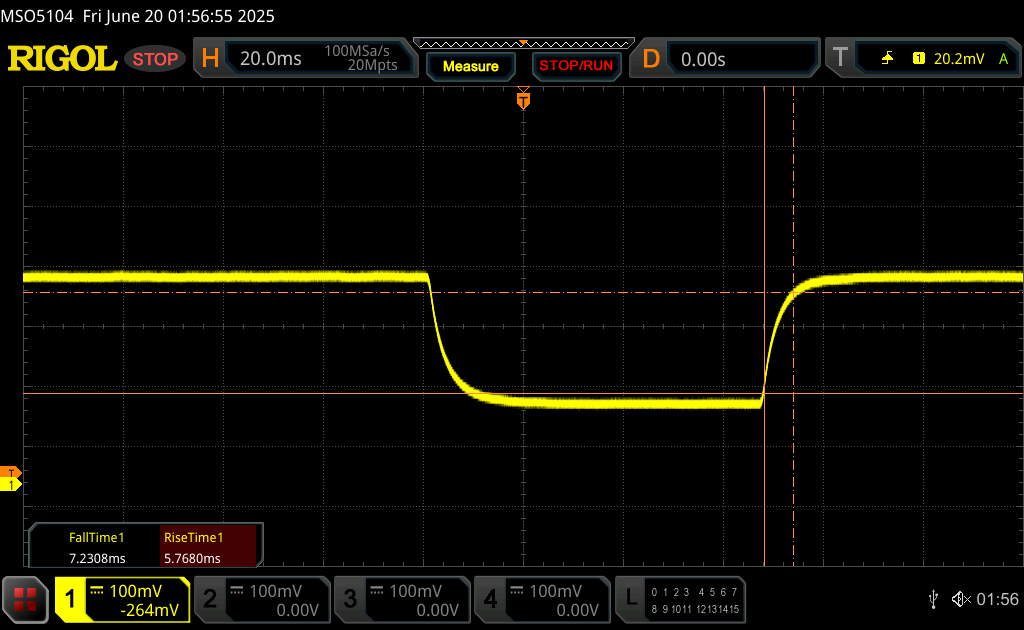 |
| ↘ 7.2 ms fallend | ||
| Die gemessenen Reaktionszeiten sind gut, für anspruchsvolle Spieler könnten der Bildschirm jedoch zu langsam sein. Im Vergleich rangierten die bei uns getesteten Geräte von 0.165 (Minimum) zu 636 (Maximum) ms. » 27 % aller Screens waren schneller als der getestete. Daher sind die gemessenen Reaktionszeiten besser als der Durchschnitt aller vermessenen Geräte (31 ms). | ||
Bildschirm-Flackern / PWM (Pulse-Width Modulation)
| Flackern / PWM nicht festgestellt |  | ||
Im Vergleich: 52 % aller getesteten Geräte nutzten kein PWM um die Helligkeit zu reduzieren. Wenn PWM eingesetzt wurde, dann bei einer Frequenz von durchschnittlich 7747 (Minimum 5, Maximum 343500) Hz. | |||
Das 500-Nit-Panel ist etwa 2x heller als das relativ schwache Alienware-m18-R2-Panel und sorgt für eine bessere Sichtbarkeit im Freien. Trotzdem sollte man, wann immer möglich, im Schatten bleiben, um verwaschene Farben zu vermeiden. Das begrenzte Akkulaufzeit und das hohe Gewicht machen das System ohnehin nur für den Einsatz in Innenräumen geeignet.

Performance

Testbedingungen
Wir haben das Alienware Command Center auf den Modus Performance eingestellt, bevor wir die folgenden Benchmarks durchgeführt haben. Alle Unterschiede zwischen dem Performance-Modus und dem Overdrive-Modus (d. h. dem Turbo-Modus) werden vermerkt. Das Alienware Command Center ist für die Steuerung der meisten Aspekte des Systems, einschließlich der LEDs und Energieprofile, unerlässlich, aber manchmal bleibt es beim Start ohne besonderen Grund hängen.
Prozessor
Die Multi-Thread-Leistung ist etwa 20 Prozent schneller als auf dem Alienware 16 mit der gleichen Core Ultra 9 275HX CPU, obwohl beide Systeme mit dem Energieprofil Performance betrieben werden. Das höhere Energieprofil "Overdrive" scheint die CPU-Leistung beim Alienware 18 überhaupt nicht zu steigern, während das Alienware 16 einen ordentlichen Leistungsschub von zehn Prozent verzeichnet. Das bedeutet, dass Alienware-18-Nutzer ihr System nicht unbedingt im Overdrive-Modus betreiben müssen, um maximale Leistung zu erzielen.
Die Gesamtleistung liegt innerhalb von fünf Prozentpunkten des konkurrierenden Ryzen 9 9955HX3D, wie er auf dem MSI Raider A18 HX zu finden ist.
Nutzer, die von der kaum zwei Jahre alten Meteor-Lake-H-Serie wie dem Core Ultra 7 155H aufrüsten, können mit deutlichen Leistungszuwächsen im Multi-Threading rechnen – etwa dem Doppelten.
Cinebench R15 Multi Loop
Cinebench R23: Multi Core | Single Core
Cinebench R20: CPU (Multi Core) | CPU (Single Core)
Cinebench R15: CPU Multi 64Bit | CPU Single 64Bit
Blender: v2.79 BMW27 CPU
7-Zip 18.03: 7z b 4 | 7z b 4 -mmt1
Geekbench 6.7: Multi-Core | Single-Core
Geekbench 5.5: Multi-Core | Single-Core
HWBOT x265 Benchmark v2.2: 4k Preset
LibreOffice : 20 Documents To PDF
R Benchmark 2.5: Overall mean
| CPU Performance Rating | |
| MSI Titan 18 HX AI A2XWJG | |
| MSI Raider A18 HX A9WIG-080 | |
| Alienware 18 Area-51 | |
| Durchschnittliche Intel Core Ultra 9 275HX | |
| Alienware m18 R2 | |
| Alienware 16 Area-51 | |
| MSI Vector 16 HX AI A2XWHG | |
| Razer Blade 18 2024 RZ09-0509 | |
| Acer Predator Helios 18 PH18-72-98MW | |
| Asus ROG Strix G18 G814JI -2! | |
| Alienware m16 R2 -1! | |
| Lenovo Legion Slim 7 16APH8 | |
| Lenovo Legion S7 16ARHA7 -2! | |
| Asus TUF Gaming A16 FA617 -2! | |
| Geekbench 6.7 / Multi-Core | |
| MSI Titan 18 HX AI A2XWJG | |
| MSI Raider A18 HX A9WIG-080 | |
| Alienware 18 Area-51 | |
| Durchschnittliche Intel Core Ultra 9 275HX (16033 - 21668, n=33) | |
| Alienware 16 Area-51 | |
| Alienware m18 R2 | |
| Acer Predator Helios 18 PH18-72-98MW | |
| Razer Blade 18 2024 RZ09-0509 | |
| MSI Vector 16 HX AI A2XWHG | |
| Lenovo Legion Slim 7 16APH8 | |
| Alienware m16 R2 | |
| Geekbench 6.7 / Single-Core | |
| MSI Raider A18 HX A9WIG-080 | |
| MSI Titan 18 HX AI A2XWJG | |
| Alienware m18 R2 | |
| Alienware 18 Area-51 | |
| Durchschnittliche Intel Core Ultra 9 275HX (2843 - 3160, n=33) | |
| Acer Predator Helios 18 PH18-72-98MW | |
| Alienware 16 Area-51 | |
| MSI Vector 16 HX AI A2XWHG | |
| Razer Blade 18 2024 RZ09-0509 | |
| Lenovo Legion Slim 7 16APH8 | |
| Alienware m16 R2 | |
Cinebench R23: Multi Core | Single Core
Cinebench R20: CPU (Multi Core) | CPU (Single Core)
Cinebench R15: CPU Multi 64Bit | CPU Single 64Bit
Blender: v2.79 BMW27 CPU
7-Zip 18.03: 7z b 4 | 7z b 4 -mmt1
Geekbench 6.7: Multi-Core | Single-Core
Geekbench 5.5: Multi-Core | Single-Core
HWBOT x265 Benchmark v2.2: 4k Preset
LibreOffice : 20 Documents To PDF
R Benchmark 2.5: Overall mean
* ... kleinere Werte sind besser
AIDA64: FP32 Ray-Trace | FPU Julia | CPU SHA3 | CPU Queen | FPU SinJulia | FPU Mandel | CPU AES | CPU ZLib | FP64 Ray-Trace | CPU PhotoWorxx
| Performance Rating | |
| MSI Raider A18 HX A9WIG-080 | |
| Alienware 18 Area-51 | |
| Durchschnittliche Intel Core Ultra 9 275HX | |
| Alienware 16 Area-51 | |
| Alienware m18 R2 | |
| Razer Blade 18 2024 RZ09-0509 | |
| Acer Predator Helios 18 PH18-72-98MW | |
| Asus ROG Strix G18 G814JI | |
| AIDA64 / FP32 Ray-Trace | |
| MSI Raider A18 HX A9WIG-080 | |
| Alienware 18 Area-51 | |
| Durchschnittliche Intel Core Ultra 9 275HX (28039 - 39895, n=30) | |
| Alienware 16 Area-51 | |
| Alienware m18 R2 | |
| Razer Blade 18 2024 RZ09-0509 | |
| Acer Predator Helios 18 PH18-72-98MW | |
| Asus ROG Strix G18 G814JI | |
| AIDA64 / FPU Julia | |
| MSI Raider A18 HX A9WIG-080 | |
| Alienware 18 Area-51 | |
| Durchschnittliche Intel Core Ultra 9 275HX (140254 - 200744, n=30) | |
| Alienware 16 Area-51 | |
| Alienware m18 R2 | |
| Razer Blade 18 2024 RZ09-0509 | |
| Acer Predator Helios 18 PH18-72-98MW | |
| Asus ROG Strix G18 G814JI | |
| AIDA64 / CPU SHA3 | |
| MSI Raider A18 HX A9WIG-080 | |
| Alienware 18 Area-51 | |
| Durchschnittliche Intel Core Ultra 9 275HX (6710 - 9817, n=30) | |
| Alienware 16 Area-51 | |
| Alienware m18 R2 | |
| Razer Blade 18 2024 RZ09-0509 | |
| Acer Predator Helios 18 PH18-72-98MW | |
| Asus ROG Strix G18 G814JI | |
| AIDA64 / CPU Queen | |
| MSI Raider A18 HX A9WIG-080 | |
| Alienware 18 Area-51 | |
| Alienware m18 R2 | |
| Acer Predator Helios 18 PH18-72-98MW | |
| Razer Blade 18 2024 RZ09-0509 | |
| Durchschnittliche Intel Core Ultra 9 275HX (113887 - 140937, n=30) | |
| Alienware 16 Area-51 | |
| Asus ROG Strix G18 G814JI | |
| AIDA64 / FPU SinJulia | |
| MSI Raider A18 HX A9WIG-080 | |
| Alienware m18 R2 | |
| Razer Blade 18 2024 RZ09-0509 | |
| Acer Predator Helios 18 PH18-72-98MW | |
| Alienware 18 Area-51 | |
| Alienware 16 Area-51 | |
| Durchschnittliche Intel Core Ultra 9 275HX (11172 - 14425, n=30) | |
| Asus ROG Strix G18 G814JI | |
| AIDA64 / FPU Mandel | |
| MSI Raider A18 HX A9WIG-080 | |
| Alienware 18 Area-51 | |
| Durchschnittliche Intel Core Ultra 9 275HX (72596 - 104508, n=30) | |
| Alienware 16 Area-51 | |
| Alienware m18 R2 | |
| Razer Blade 18 2024 RZ09-0509 | |
| Acer Predator Helios 18 PH18-72-98MW | |
| Asus ROG Strix G18 G814JI | |
| AIDA64 / CPU AES | |
| MSI Raider A18 HX A9WIG-080 | |
| Alienware 18 Area-51 | |
| Alienware m18 R2 | |
| Durchschnittliche Intel Core Ultra 9 275HX (105608 - 247074, n=30) | |
| Alienware 16 Area-51 | |
| Razer Blade 18 2024 RZ09-0509 | |
| Acer Predator Helios 18 PH18-72-98MW | |
| Asus ROG Strix G18 G814JI | |
| AIDA64 / CPU ZLib | |
| MSI Raider A18 HX A9WIG-080 | |
| Alienware 18 Area-51 | |
| Alienware m18 R2 | |
| Durchschnittliche Intel Core Ultra 9 275HX (1582 - 2263, n=30) | |
| Alienware 16 Area-51 | |
| Razer Blade 18 2024 RZ09-0509 | |
| Acer Predator Helios 18 PH18-72-98MW | |
| Asus ROG Strix G18 G814JI | |
| AIDA64 / FP64 Ray-Trace | |
| MSI Raider A18 HX A9WIG-080 | |
| Alienware 18 Area-51 | |
| Durchschnittliche Intel Core Ultra 9 275HX (14847 - 21854, n=30) | |
| Alienware 16 Area-51 | |
| Alienware m18 R2 | |
| Razer Blade 18 2024 RZ09-0509 | |
| Acer Predator Helios 18 PH18-72-98MW | |
| Asus ROG Strix G18 G814JI | |
| AIDA64 / CPU PhotoWorxx | |
| Alienware 18 Area-51 | |
| Alienware 16 Area-51 | |
| Durchschnittliche Intel Core Ultra 9 275HX (37482 - 62916, n=30) | |
| Alienware m18 R2 | |
| Razer Blade 18 2024 RZ09-0509 | |
| Acer Predator Helios 18 PH18-72-98MW | |
| Asus ROG Strix G18 G814JI | |
| MSI Raider A18 HX A9WIG-080 | |
System Performance
Die durchschnittlichen PCMark Ergebnisse gehören zu den höchsten aller 18-Zoll-Gaming-Notebooks, einschließlich des MSI Raider A18 HX, angetrieben durch den Ryzen 9 9955HX3D. Dies kann teilweise auf die PCIe5-SSD in unserem Alienware Testgerät zurückgeführt werden.
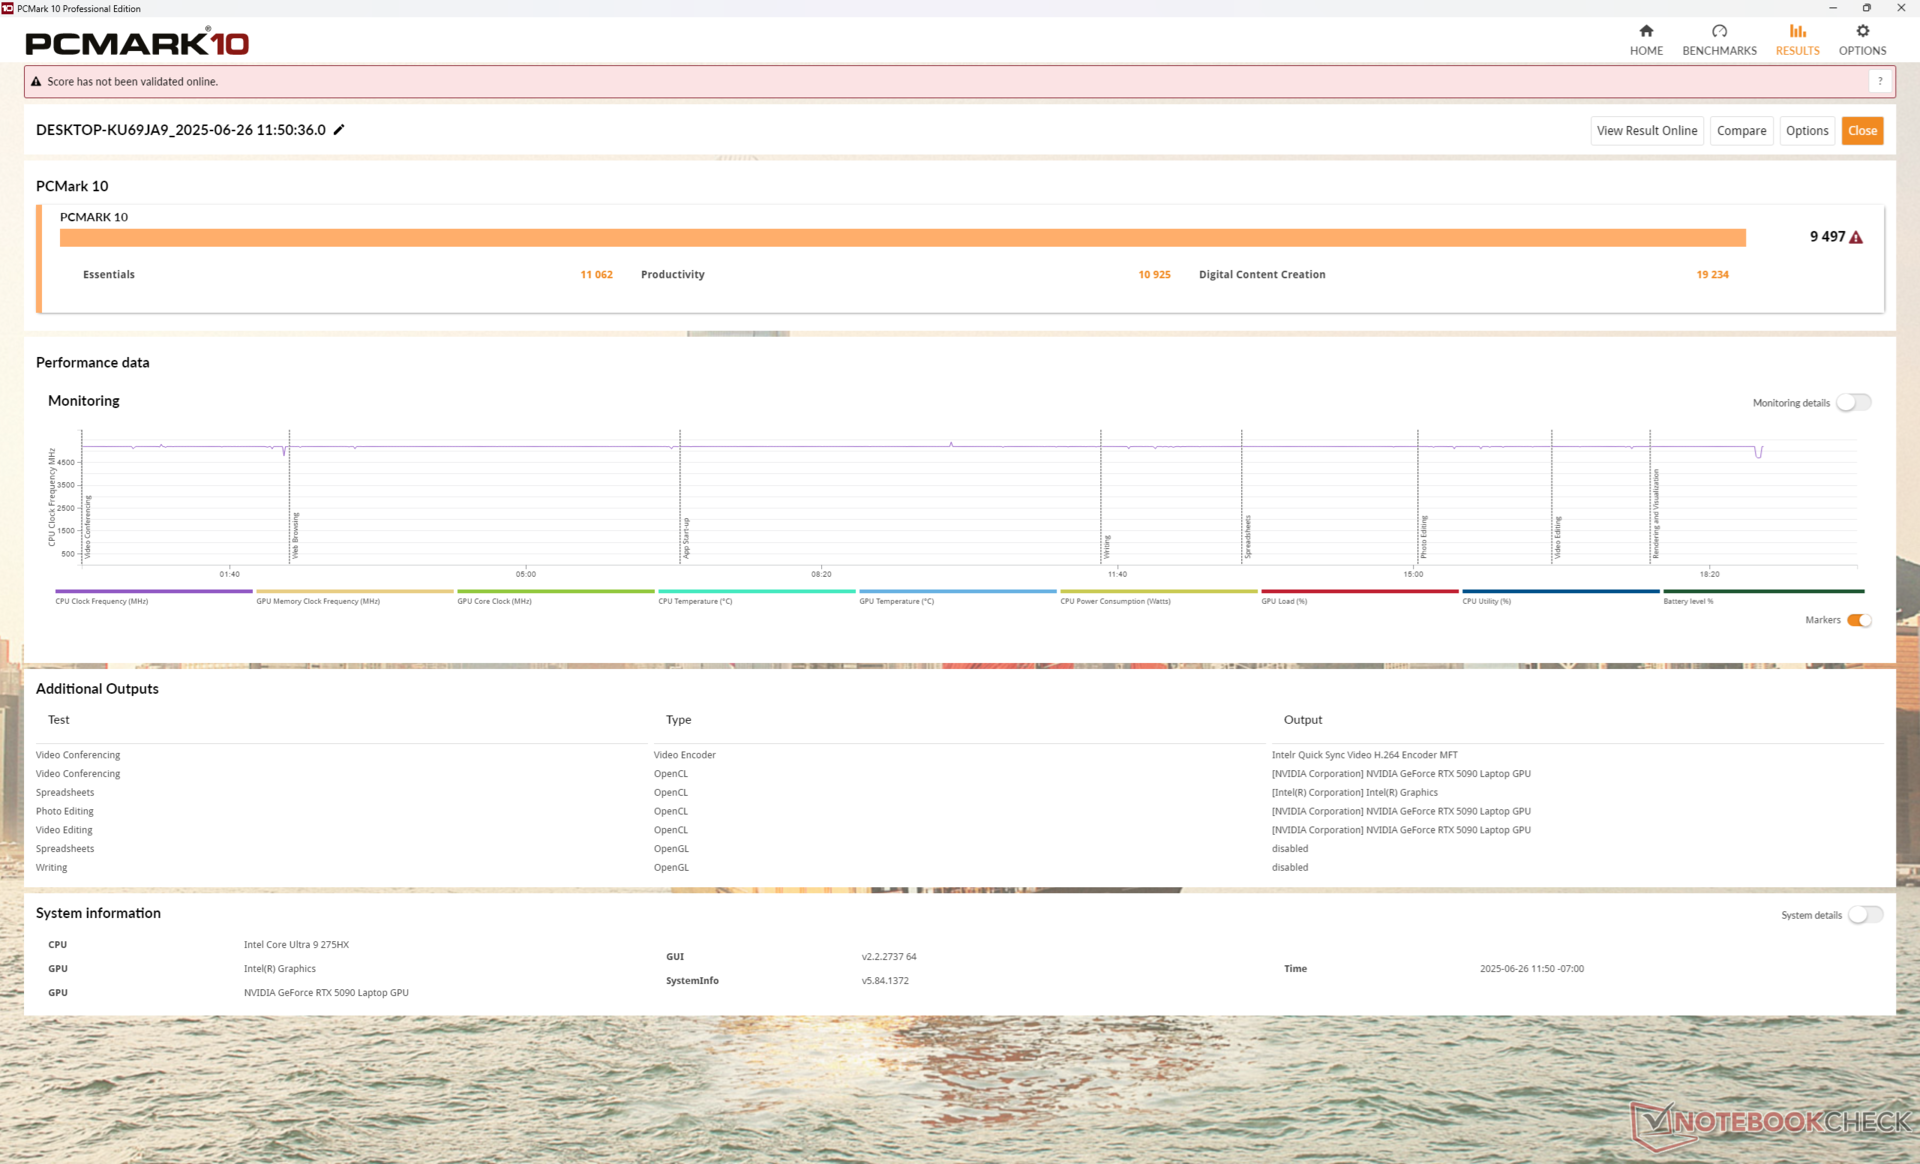
PCMark 10: Score | Essentials | Productivity | Digital Content Creation
CrossMark: Overall | Productivity | Creativity | Responsiveness
WebXPRT 3: Overall
WebXPRT 4: Overall
Mozilla Kraken 1.1: Total
| Performance Rating | |
| Alienware 18 Area-51 | |
| MSI Raider A18 HX A9WIG-080 | |
| Alienware 16 Area-51 | |
| Durchschnittliche Intel Core Ultra 9 275HX, NVIDIA GeForce RTX 5090 Laptop | |
| Alienware m18 R2 | |
| Razer Blade 18 2024 RZ09-0509 -1! | |
| Acer Predator Helios 18 PH18-72-98MW -6! | |
| Asus ROG Strix G18 G814JI -4! | |
| PCMark 10 / Score | |
| Alienware 18 Area-51 | |
| Alienware m18 R2 | |
| MSI Raider A18 HX A9WIG-080 | |
| Razer Blade 18 2024 RZ09-0509 | |
| Alienware 16 Area-51 | |
| Durchschnittliche Intel Core Ultra 9 275HX, NVIDIA GeForce RTX 5090 Laptop (7474 - 9497, n=11) | |
| Acer Predator Helios 18 PH18-72-98MW | |
| Asus ROG Strix G18 G814JI | |
| PCMark 10 / Essentials | |
| MSI Raider A18 HX A9WIG-080 | |
| Alienware m18 R2 | |
| Razer Blade 18 2024 RZ09-0509 | |
| Alienware 16 Area-51 | |
| Alienware 18 Area-51 | |
| Acer Predator Helios 18 PH18-72-98MW | |
| Durchschnittliche Intel Core Ultra 9 275HX, NVIDIA GeForce RTX 5090 Laptop (9994 - 11369, n=12) | |
| Asus ROG Strix G18 G814JI | |
| PCMark 10 / Productivity | |
| Alienware m18 R2 | |
| Alienware 18 Area-51 | |
| MSI Raider A18 HX A9WIG-080 | |
| Razer Blade 18 2024 RZ09-0509 | |
| Acer Predator Helios 18 PH18-72-98MW | |
| Durchschnittliche Intel Core Ultra 9 275HX, NVIDIA GeForce RTX 5090 Laptop (9122 - 10925, n=11) | |
| Alienware 16 Area-51 | |
| Asus ROG Strix G18 G814JI | |
| PCMark 10 / Digital Content Creation | |
| Alienware 18 Area-51 | |
| Alienware 16 Area-51 | |
| Durchschnittliche Intel Core Ultra 9 275HX, NVIDIA GeForce RTX 5090 Laptop (9952 - 19234, n=11) | |
| Alienware m18 R2 | |
| Razer Blade 18 2024 RZ09-0509 | |
| MSI Raider A18 HX A9WIG-080 | |
| Acer Predator Helios 18 PH18-72-98MW | |
| Asus ROG Strix G18 G814JI | |
| CrossMark / Overall | |
| Alienware 18 Area-51 | |
| MSI Raider A18 HX A9WIG-080 | |
| Durchschnittliche Intel Core Ultra 9 275HX, NVIDIA GeForce RTX 5090 Laptop (1995 - 2339, n=12) | |
| Alienware 16 Area-51 | |
| Alienware m18 R2 | |
| Razer Blade 18 2024 RZ09-0509 | |
| CrossMark / Productivity | |
| Alienware 18 Area-51 | |
| Durchschnittliche Intel Core Ultra 9 275HX, NVIDIA GeForce RTX 5090 Laptop (1847 - 2211, n=12) | |
| Alienware 16 Area-51 | |
| MSI Raider A18 HX A9WIG-080 | |
| Razer Blade 18 2024 RZ09-0509 | |
| Alienware m18 R2 | |
| CrossMark / Creativity | |
| MSI Raider A18 HX A9WIG-080 | |
| Alienware 18 Area-51 | |
| Durchschnittliche Intel Core Ultra 9 275HX, NVIDIA GeForce RTX 5090 Laptop (2170 - 2642, n=12) | |
| Alienware 16 Area-51 | |
| Alienware m18 R2 | |
| Razer Blade 18 2024 RZ09-0509 | |
| CrossMark / Responsiveness | |
| Alienware 18 Area-51 | |
| Alienware 16 Area-51 | |
| Durchschnittliche Intel Core Ultra 9 275HX, NVIDIA GeForce RTX 5090 Laptop (1673 - 2217, n=12) | |
| MSI Raider A18 HX A9WIG-080 | |
| Alienware m18 R2 | |
| Razer Blade 18 2024 RZ09-0509 | |
| WebXPRT 3 / Overall | |
| MSI Raider A18 HX A9WIG-080 | |
| Alienware 18 Area-51 | |
| Alienware 16 Area-51 | |
| Durchschnittliche Intel Core Ultra 9 275HX, NVIDIA GeForce RTX 5090 Laptop (315 - 372, n=12) | |
| Razer Blade 18 2024 RZ09-0509 | |
| Alienware m18 R2 | |
| Asus ROG Strix G18 G814JI | |
| Asus ROG Strix G18 G814JI | |
| WebXPRT 4 / Overall | |
| Alienware 18 Area-51 | |
| MSI Raider A18 HX A9WIG-080 | |
| Alienware 16 Area-51 | |
| Durchschnittliche Intel Core Ultra 9 275HX, NVIDIA GeForce RTX 5090 Laptop (301 - 341, n=11) | |
| Alienware m18 R2 | |
| Asus ROG Strix G18 G814JI | |
| Asus ROG Strix G18 G814JI | |
| Mozilla Kraken 1.1 / Total | |
| Asus ROG Strix G18 G814JI | |
| Asus ROG Strix G18 G814JI | |
| Razer Blade 18 2024 RZ09-0509 | |
| Acer Predator Helios 18 PH18-72-98MW | |
| Alienware m18 R2 | |
| Durchschnittliche Intel Core Ultra 9 275HX, NVIDIA GeForce RTX 5090 Laptop (402 - 424, n=12) | |
| Alienware 16 Area-51 | |
| Alienware 18 Area-51 | |
| MSI Raider A18 HX A9WIG-080 | |
* ... kleinere Werte sind besser
| PCMark 10 Score | 9497 Punkte | |
Hilfe | ||
| AIDA64 / Memory Copy | |
| Alienware 18 Area-51 | |
| Alienware 16 Area-51 | |
| Durchschnittliche Intel Core Ultra 9 275HX (56003 - 94460, n=30) | |
| Alienware m18 R2 | |
| Acer Predator Helios 18 PH18-72-98MW | |
| Razer Blade 18 2024 RZ09-0509 | |
| Asus ROG Strix G18 G814JI | |
| MSI Raider A18 HX A9WIG-080 | |
| AIDA64 / Memory Read | |
| Alienware 18 Area-51 | |
| Alienware 16 Area-51 | |
| Alienware m18 R2 | |
| Acer Predator Helios 18 PH18-72-98MW | |
| Durchschnittliche Intel Core Ultra 9 275HX (55795 - 97151, n=30) | |
| Razer Blade 18 2024 RZ09-0509 | |
| Asus ROG Strix G18 G814JI | |
| MSI Raider A18 HX A9WIG-080 | |
| AIDA64 / Memory Write | |
| Alienware 18 Area-51 | |
| Alienware 16 Area-51 | |
| Durchschnittliche Intel Core Ultra 9 275HX (55663 - 116129, n=30) | |
| Alienware m18 R2 | |
| Acer Predator Helios 18 PH18-72-98MW | |
| Razer Blade 18 2024 RZ09-0509 | |
| Asus ROG Strix G18 G814JI | |
| MSI Raider A18 HX A9WIG-080 | |
| AIDA64 / Memory Latency | |
| Alienware 16 Area-51 | |
| Durchschnittliche Intel Core Ultra 9 275HX (105.8 - 161.6, n=30) | |
| Alienware 18 Area-51 | |
| MSI Raider A18 HX A9WIG-080 | |
| Razer Blade 18 2024 RZ09-0509 | |
| Alienware m18 R2 | |
| Asus ROG Strix G18 G814JI | |
| Acer Predator Helios 18 PH18-72-98MW | |
* ... kleinere Werte sind besser
DPC-Latenzzeit
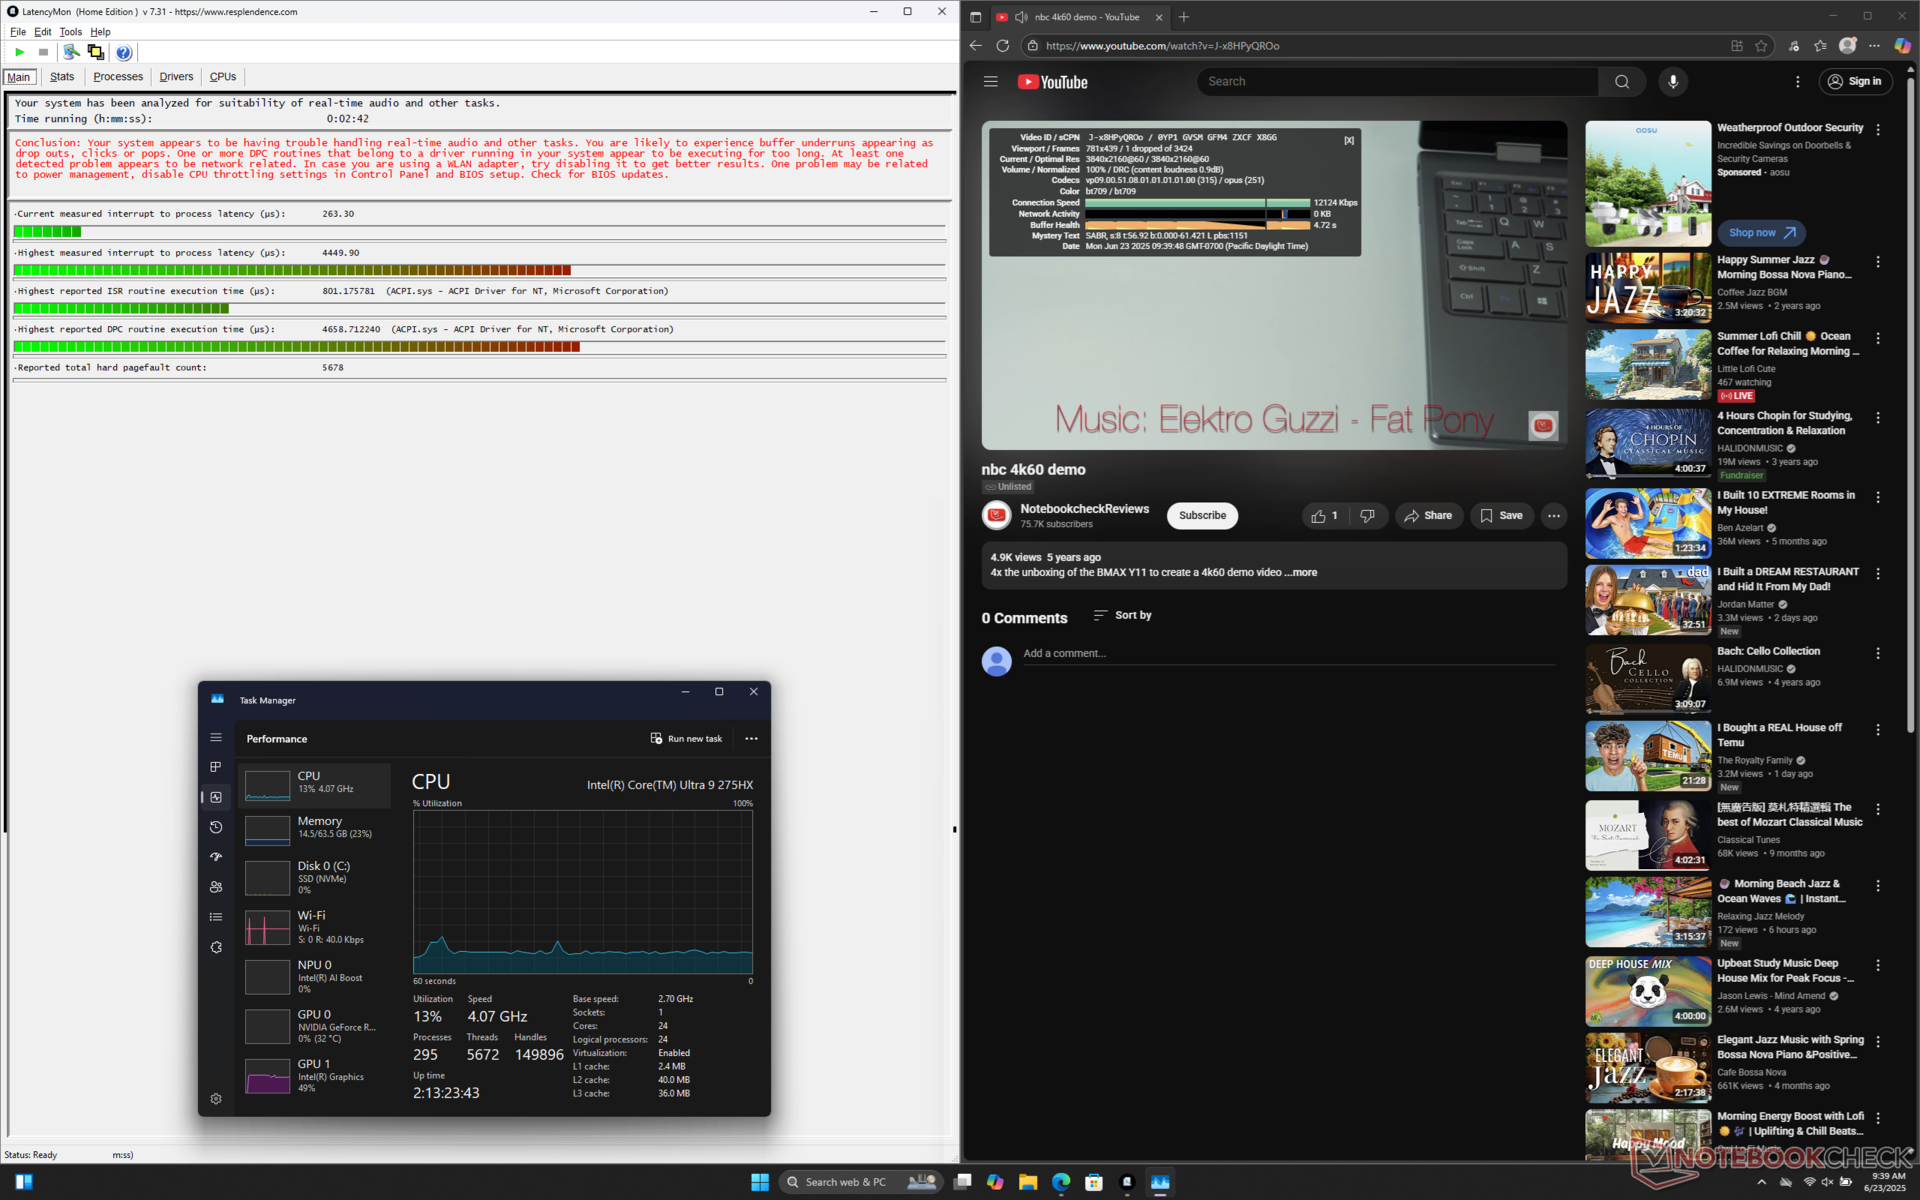
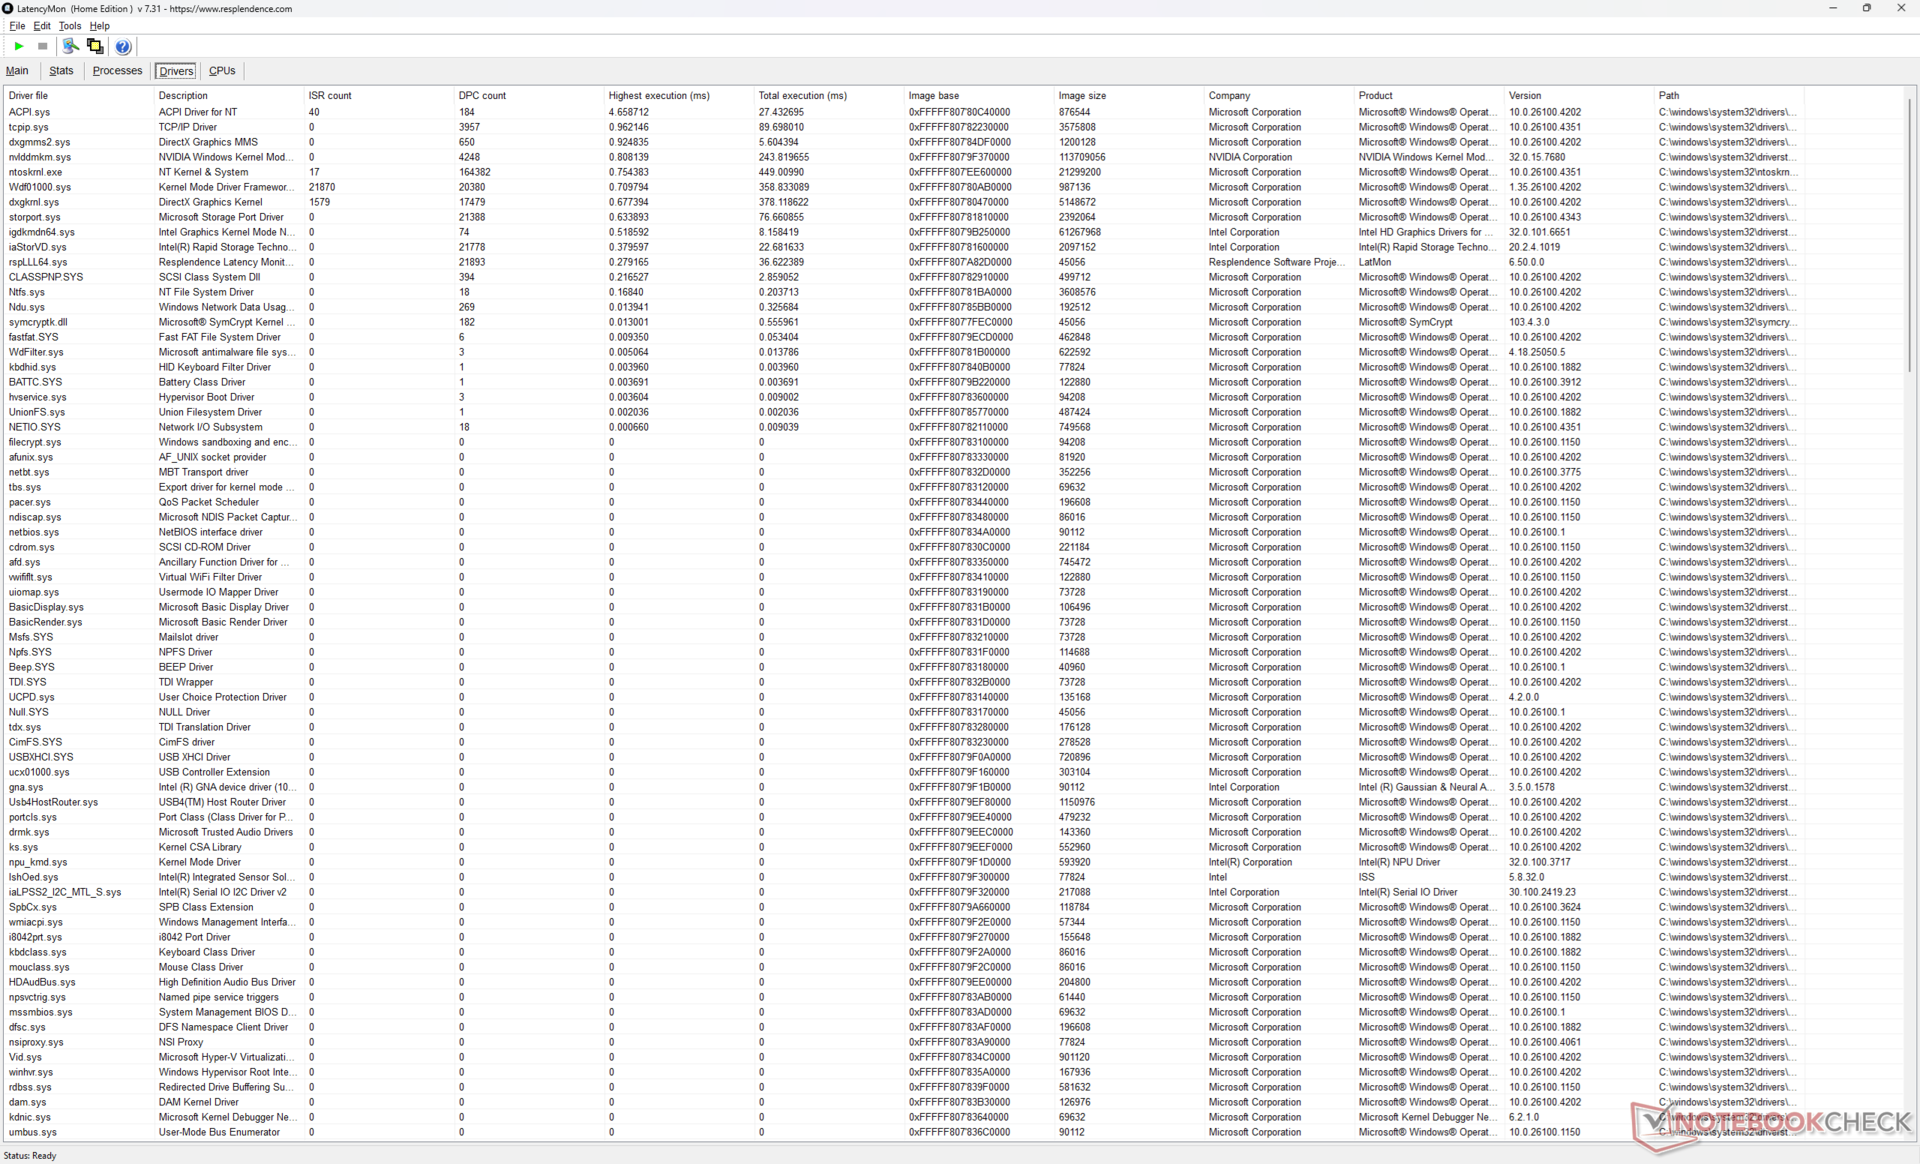
LatencyMon zeigt DPC-Probleme, aber ansonsten keine signifikanten Bildausfälle bei der Wiedergabe von 4K60-Videoinhalten.
| DPC Latencies / LatencyMon - interrupt to process latency (max), Web, Youtube, Prime95 | |
| Alienware 18 Area-51 | |
| Alienware 16 Area-51 | |
| Acer Predator Helios 18 PH18-72-98MW | |
| Alienware m18 R2 | |
| Razer Blade 18 2024 RZ09-0509 | |
| Asus ROG Strix G18 G814JI | |
| MSI Raider A18 HX A9WIG-080 | |
* ... kleinere Werte sind besser
Speichergeräte
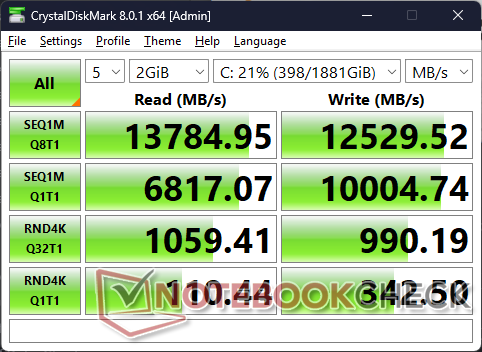
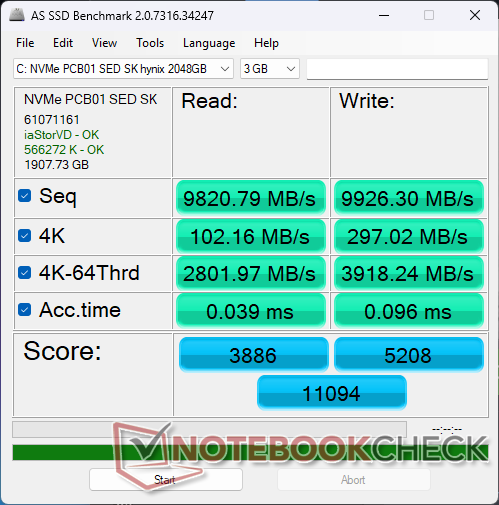
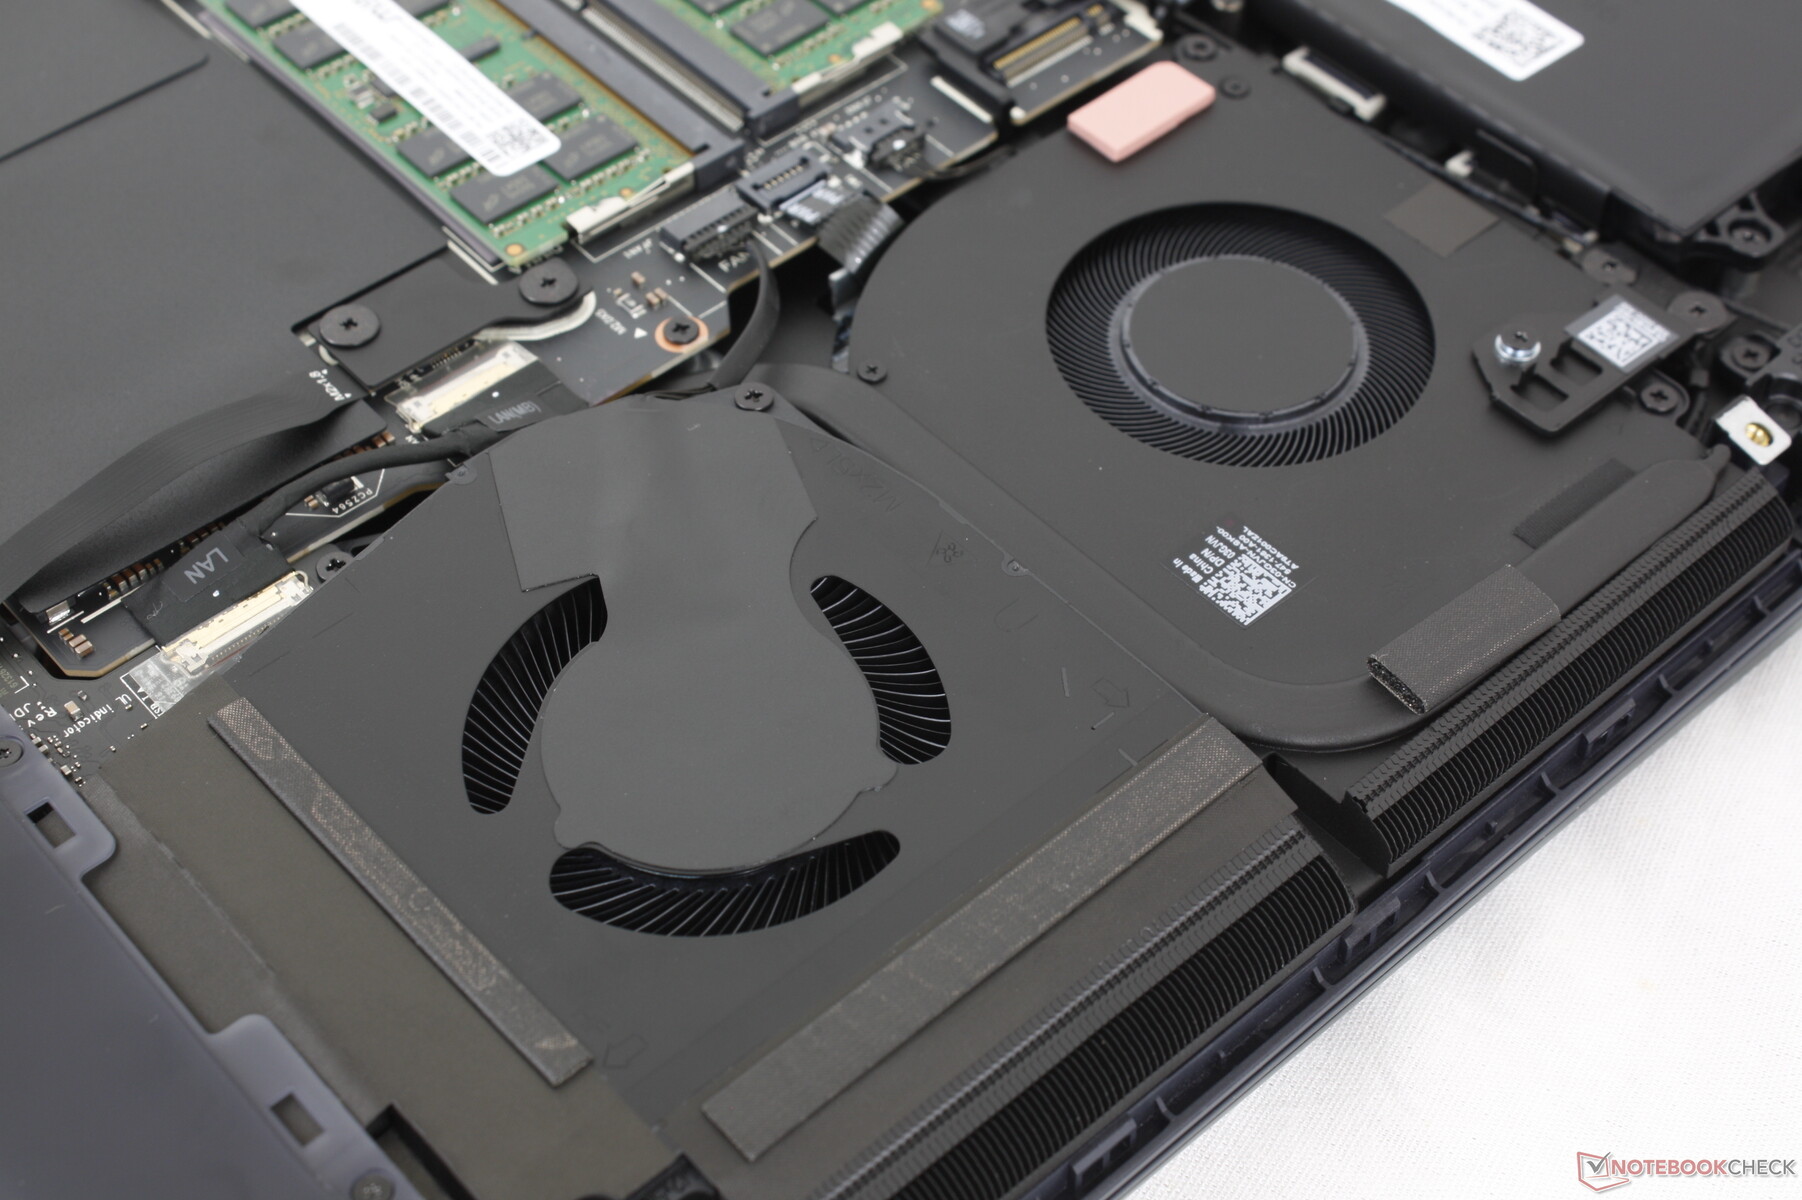
Unser Testgerät wird mit der SK Hynix PCB01 SED PCIe5 NVMe SSD ausgeliefert, die stabile Übertragungsraten von ~14.000 MB/s bietet, selbst wenn sie unter Stress laufen, wie unsere DiskSpd-Schleifentest-Ergebnisse unten zeigen. Die Performance kann bis zu 2x schneller sein als die PCie4 SK Hynix PC811 SSD im Alienware m18 R2 vom letzten Jahr. Es ist erwähnenswert, dass die beiden PCIe5-M.2-2280-Steckplätze mit einem Heatspreader ausgestattet sind, während der dritte PCIe4-2280-Steckplatz direkt über einem der vier Lüfter sitzt, wie die Bilder unten zeigen.
Nur einer der drei SSD-Steckplätze unterstützt PCIe5, wenn man das Notebook mit einer RTX 5070 Ti oder niedrigeren Grafikkarte konfiguriert.


* ... kleinere Werte sind besser
Disk Throttling: DiskSpd Read Loop, Queue Depth 8
GPU Performance
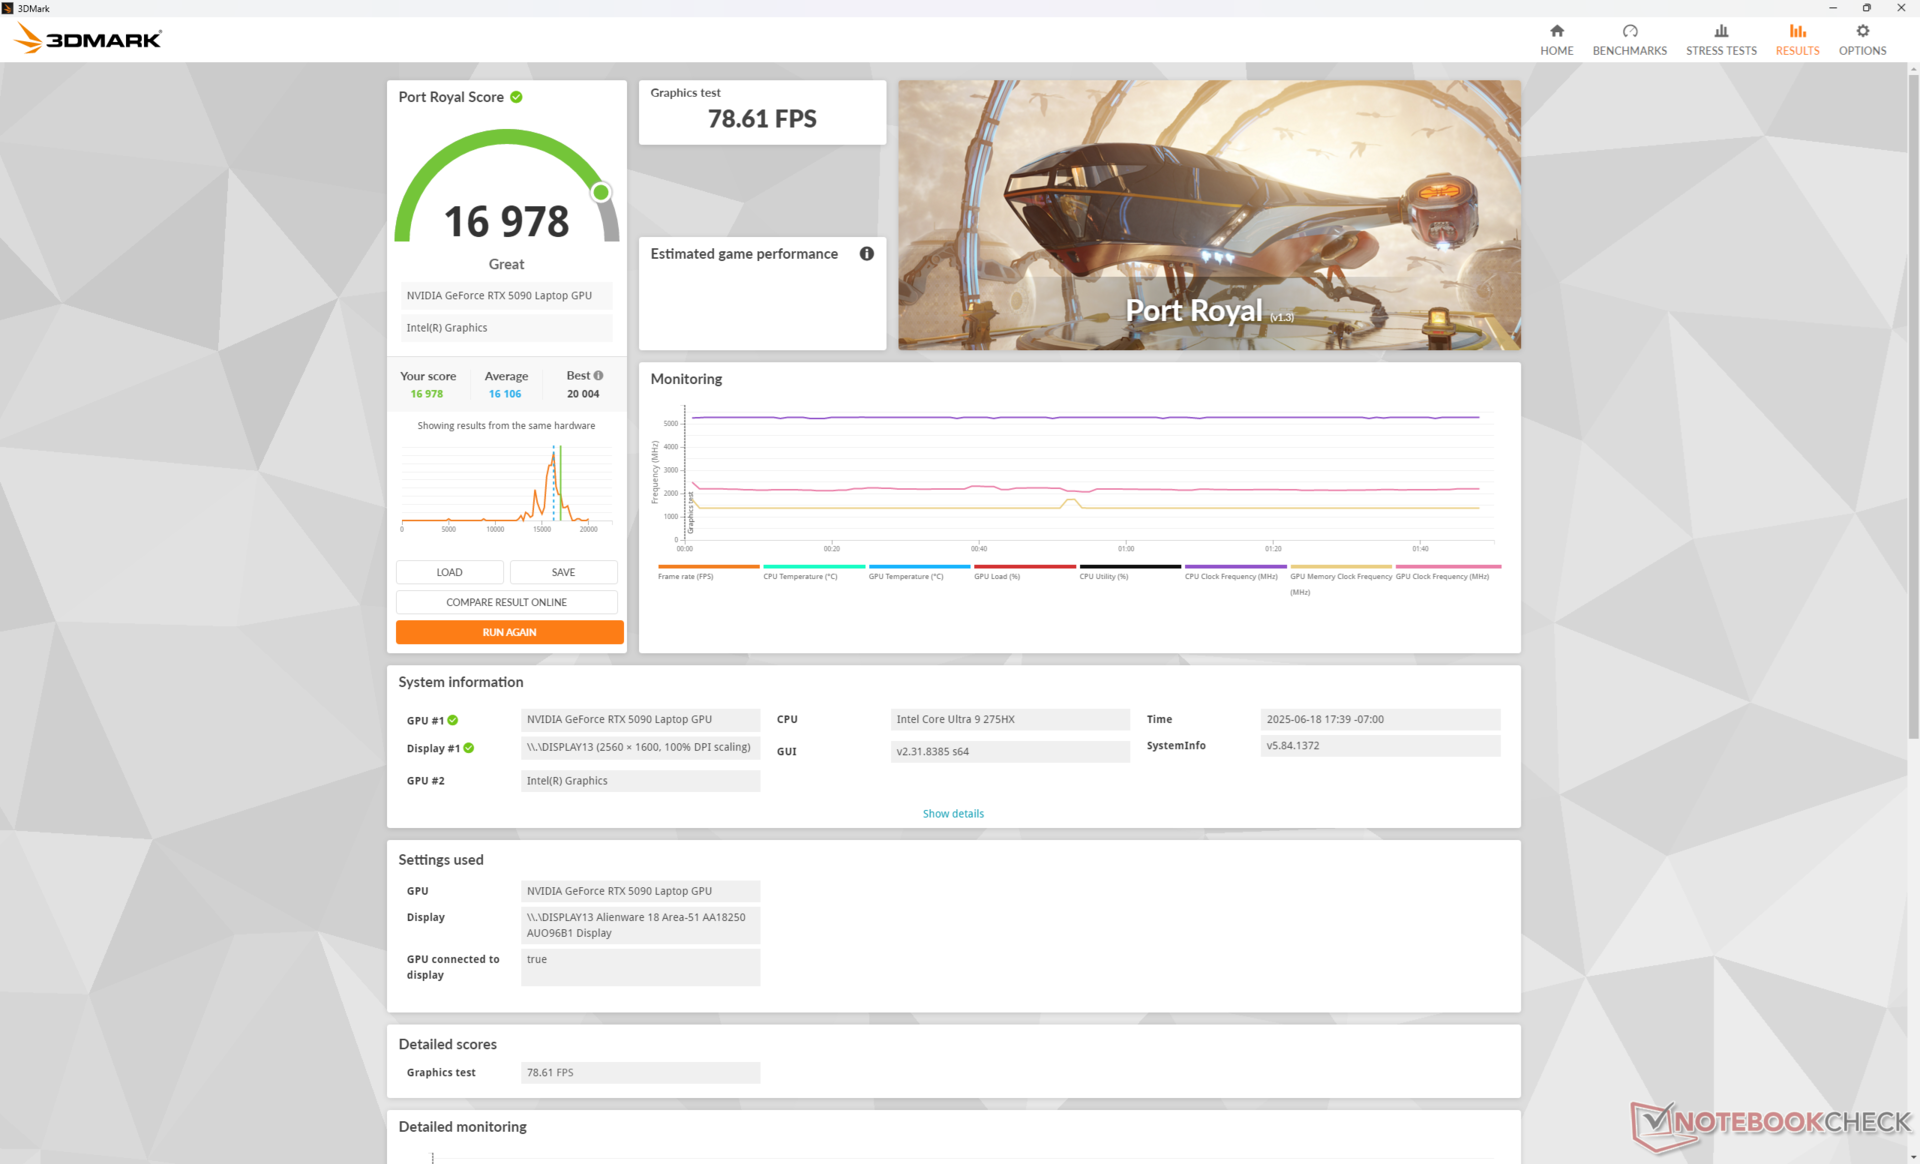
Die GeForce RTX 5090 GPU in unserem Alienware 18 läuft etwas schneller als die meisten anderen Laptops in unserer Datenbank mit der gleichen RTX-5090-Grafik, da die GPU im Alienware höhere Leistungsgrenzen aushalten kann, die näher am TGP-Ziel von 175 W liegen. Das kleinere Asus ROG Strix Scar 16 läuft zum Beispiel etwa acht Prozent langsamer als das Alienware 18.
Ein Abstieg auf die RTX-5080- oder RTX-5070-Ti-Konfigurationen wird die Grafikleistung voraussichtlich um etwa zehn bis 15 Prozent bzw. 30 bis 45 Prozent im Vergleich zu unserem RTX-5090-System sinken.
Der Modus Overdrive bietet bestenfalls minimale Leistungsvorteile gegenüber dem Modus Performance, wie unsere Fire-Strike-Ergebnistabelle unten zeigt. Die Leistung nimmt im Balanced-Modus viel weniger ab als erwartet.
| Leistungsprofil | Grafik Ergebnis | Physics-Wertung | Kombinierte Punktzahl |
| Overdrive-Modus | 49.289 | 48.120 | 13.445 |
| Performance-Modus | 50.772 (+3 %) | 47.552 (-1 %) | 13.217 (-2 %) |
| Ausgeglichener Modus | 46.380 (-6 %) | 48.198 (-0 %) | 11.235 (-16 %) |
| Akku-Modus | 33.485 (-32 %) | 29.896 (-38 %) | 8.165 (-39 %) |
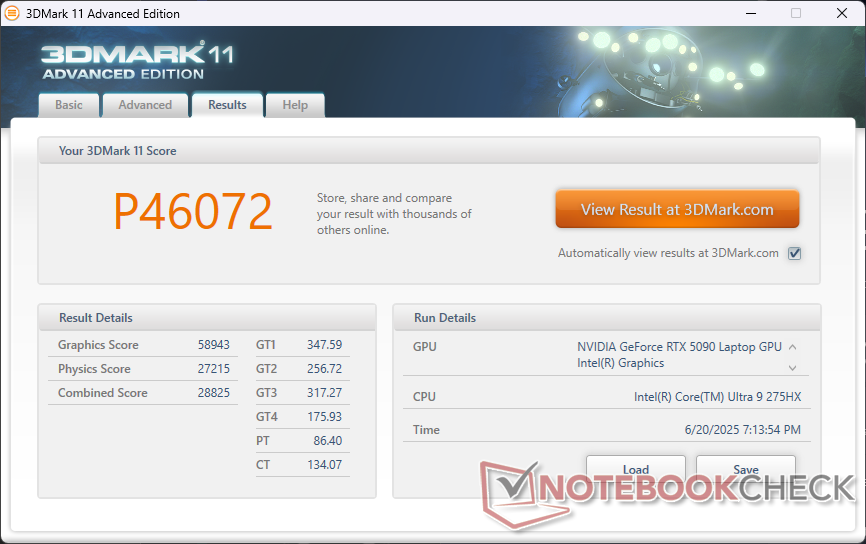

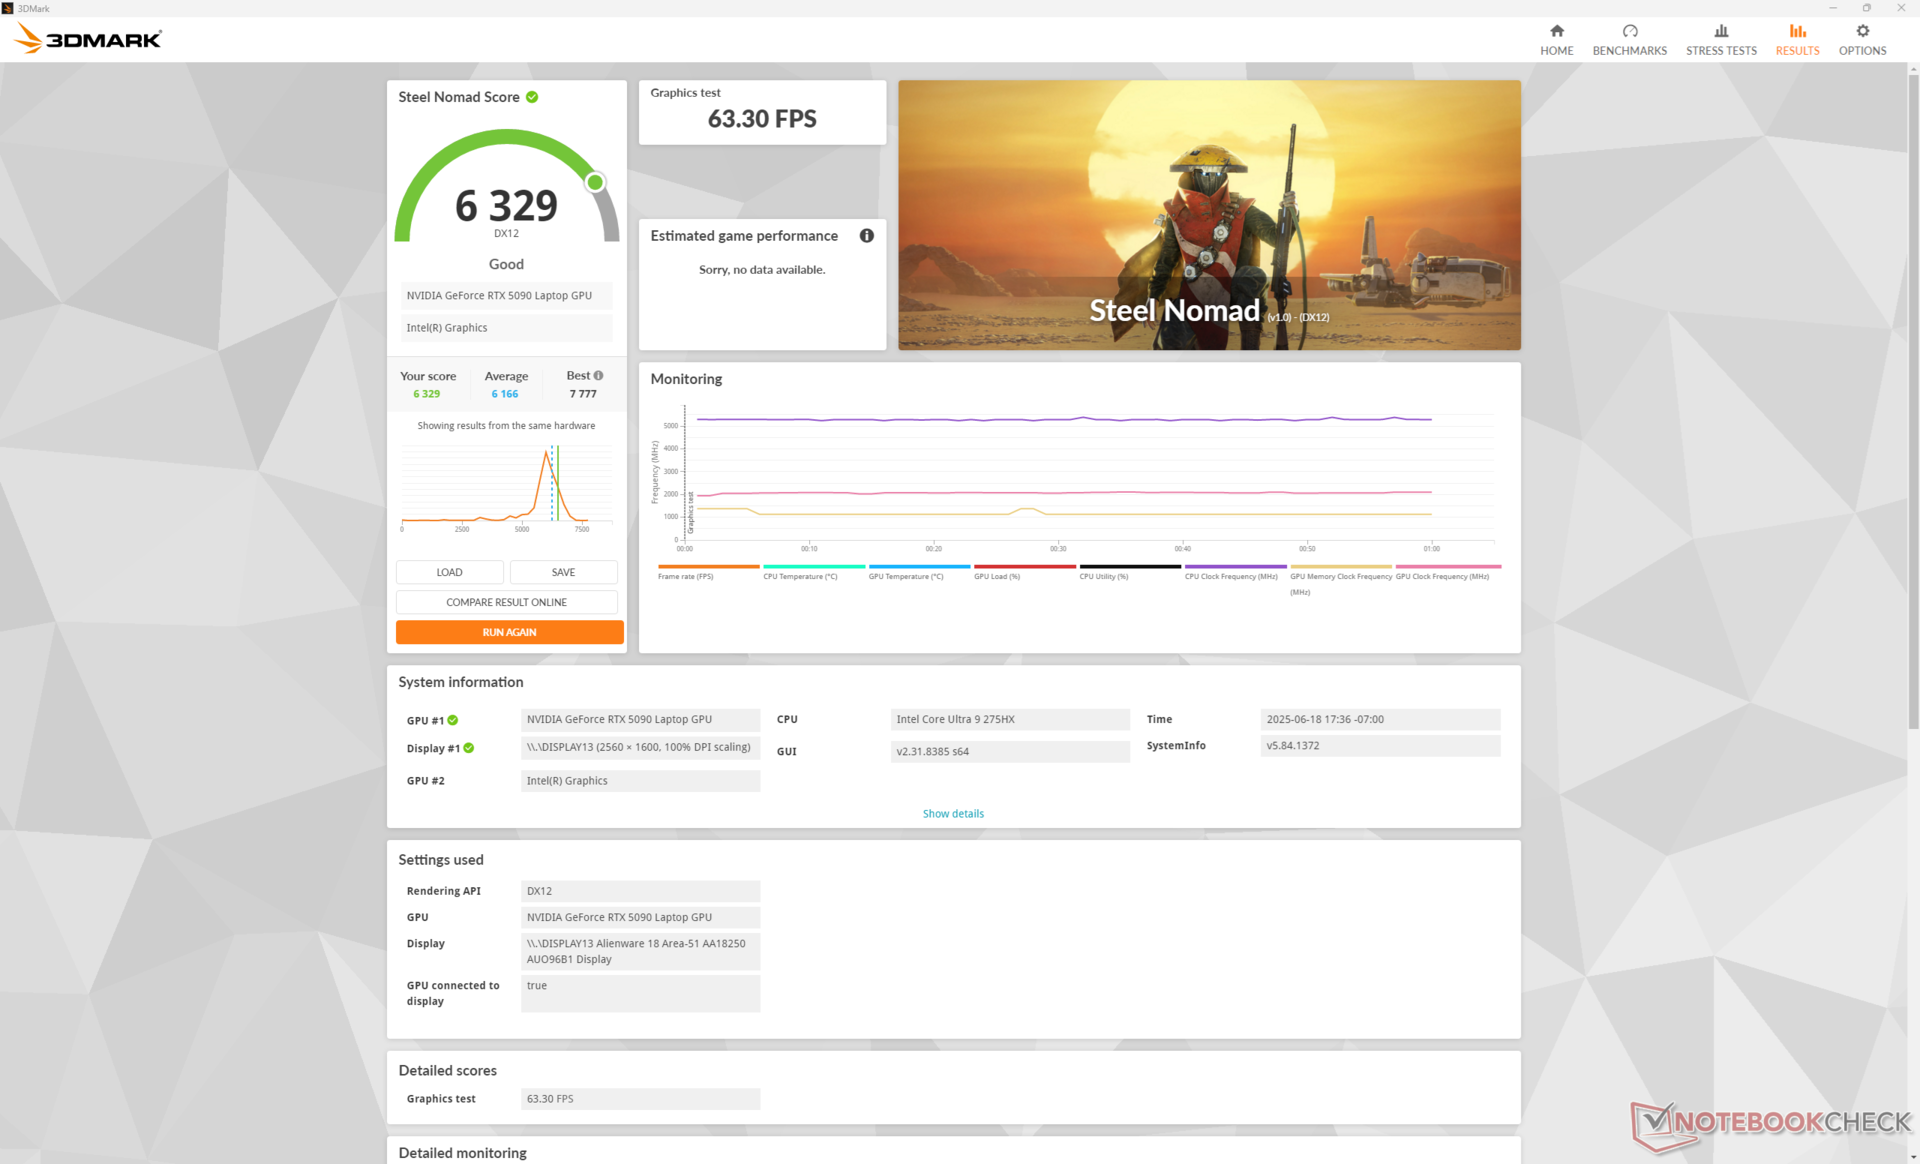

| 3DMark 11 Performance | 46072 Punkte | |
| 3DMark Fire Strike Score | 39227 Punkte | |
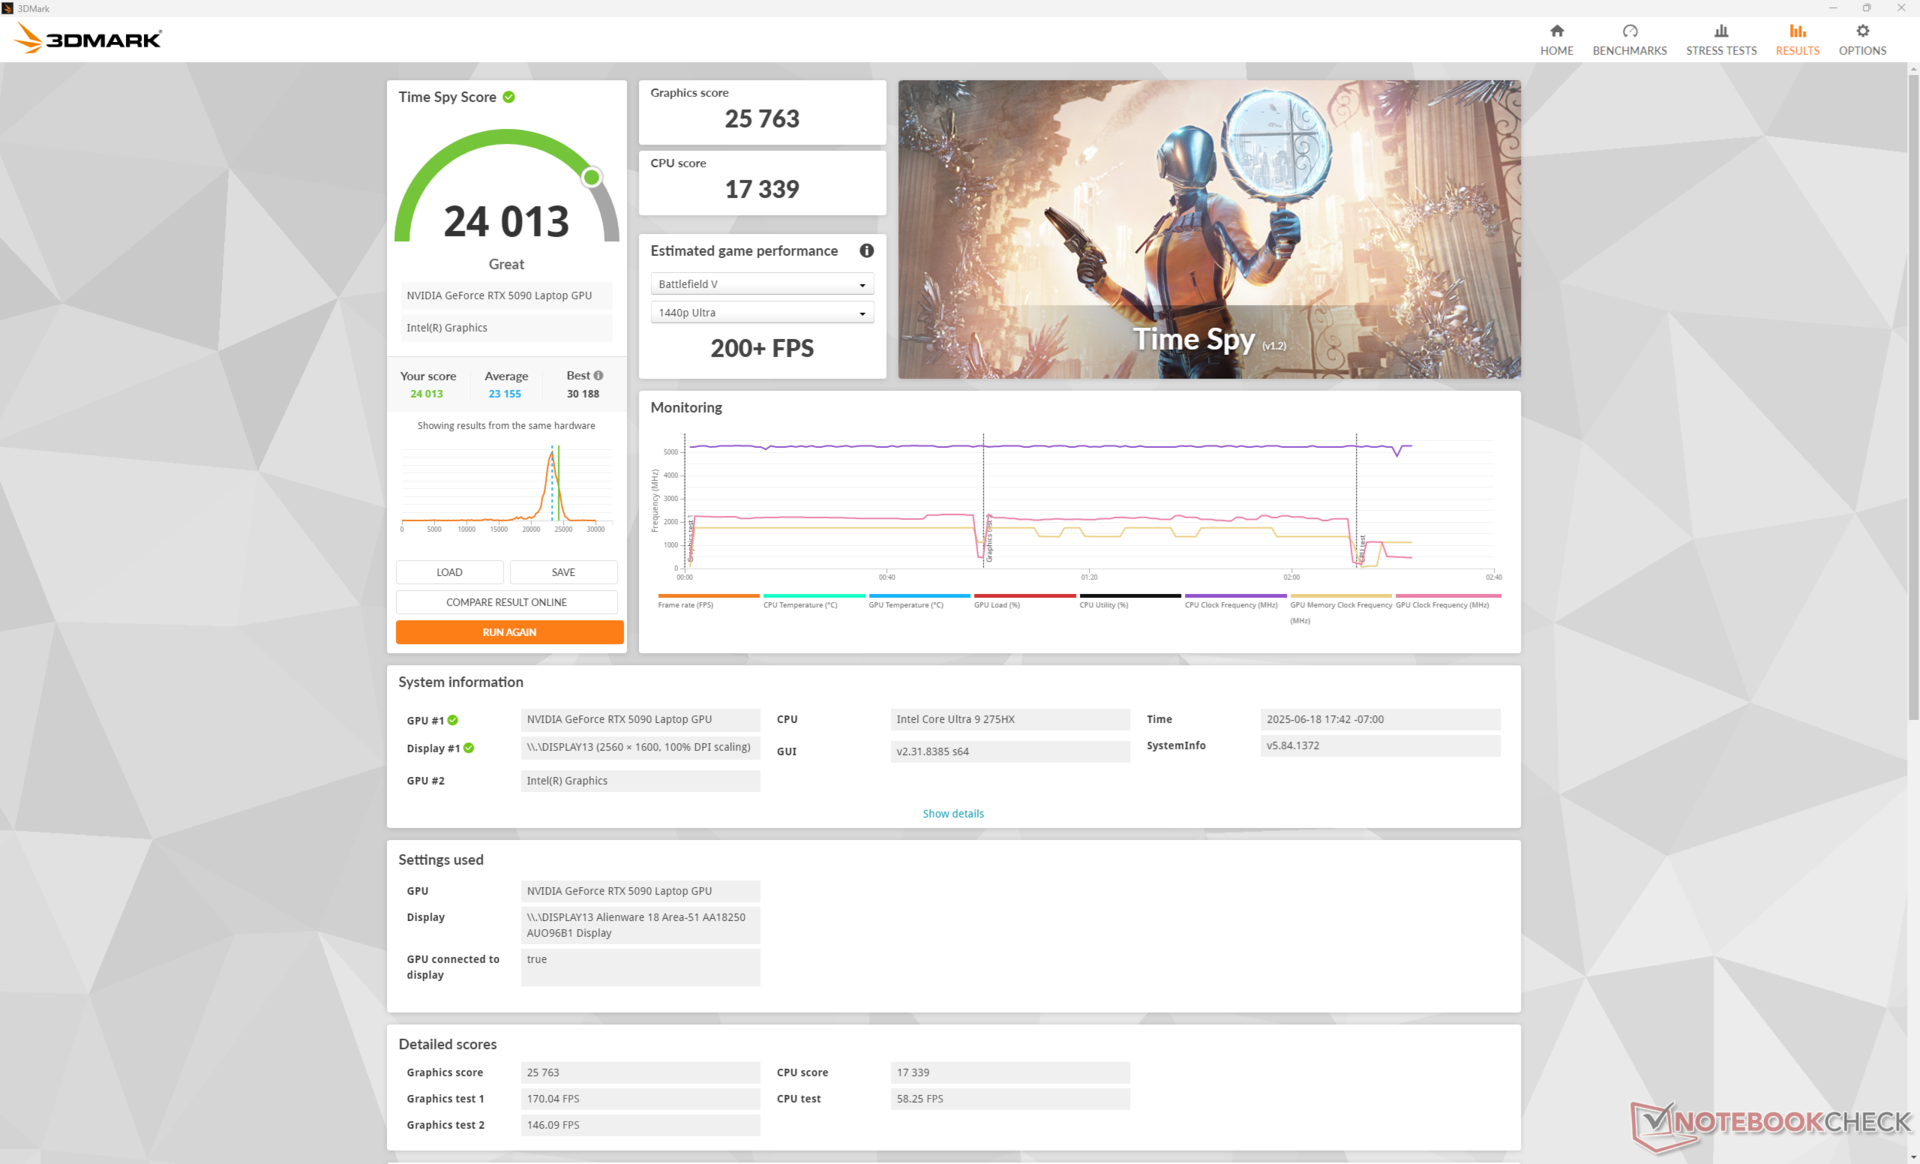
| 3DMark Time Spy Score | 24013 Punkte | |
| 3DMark Steel Nomad Score | 6329 Punkte | |
Hilfe | ||
* ... kleinere Werte sind besser
Spiele-Performance
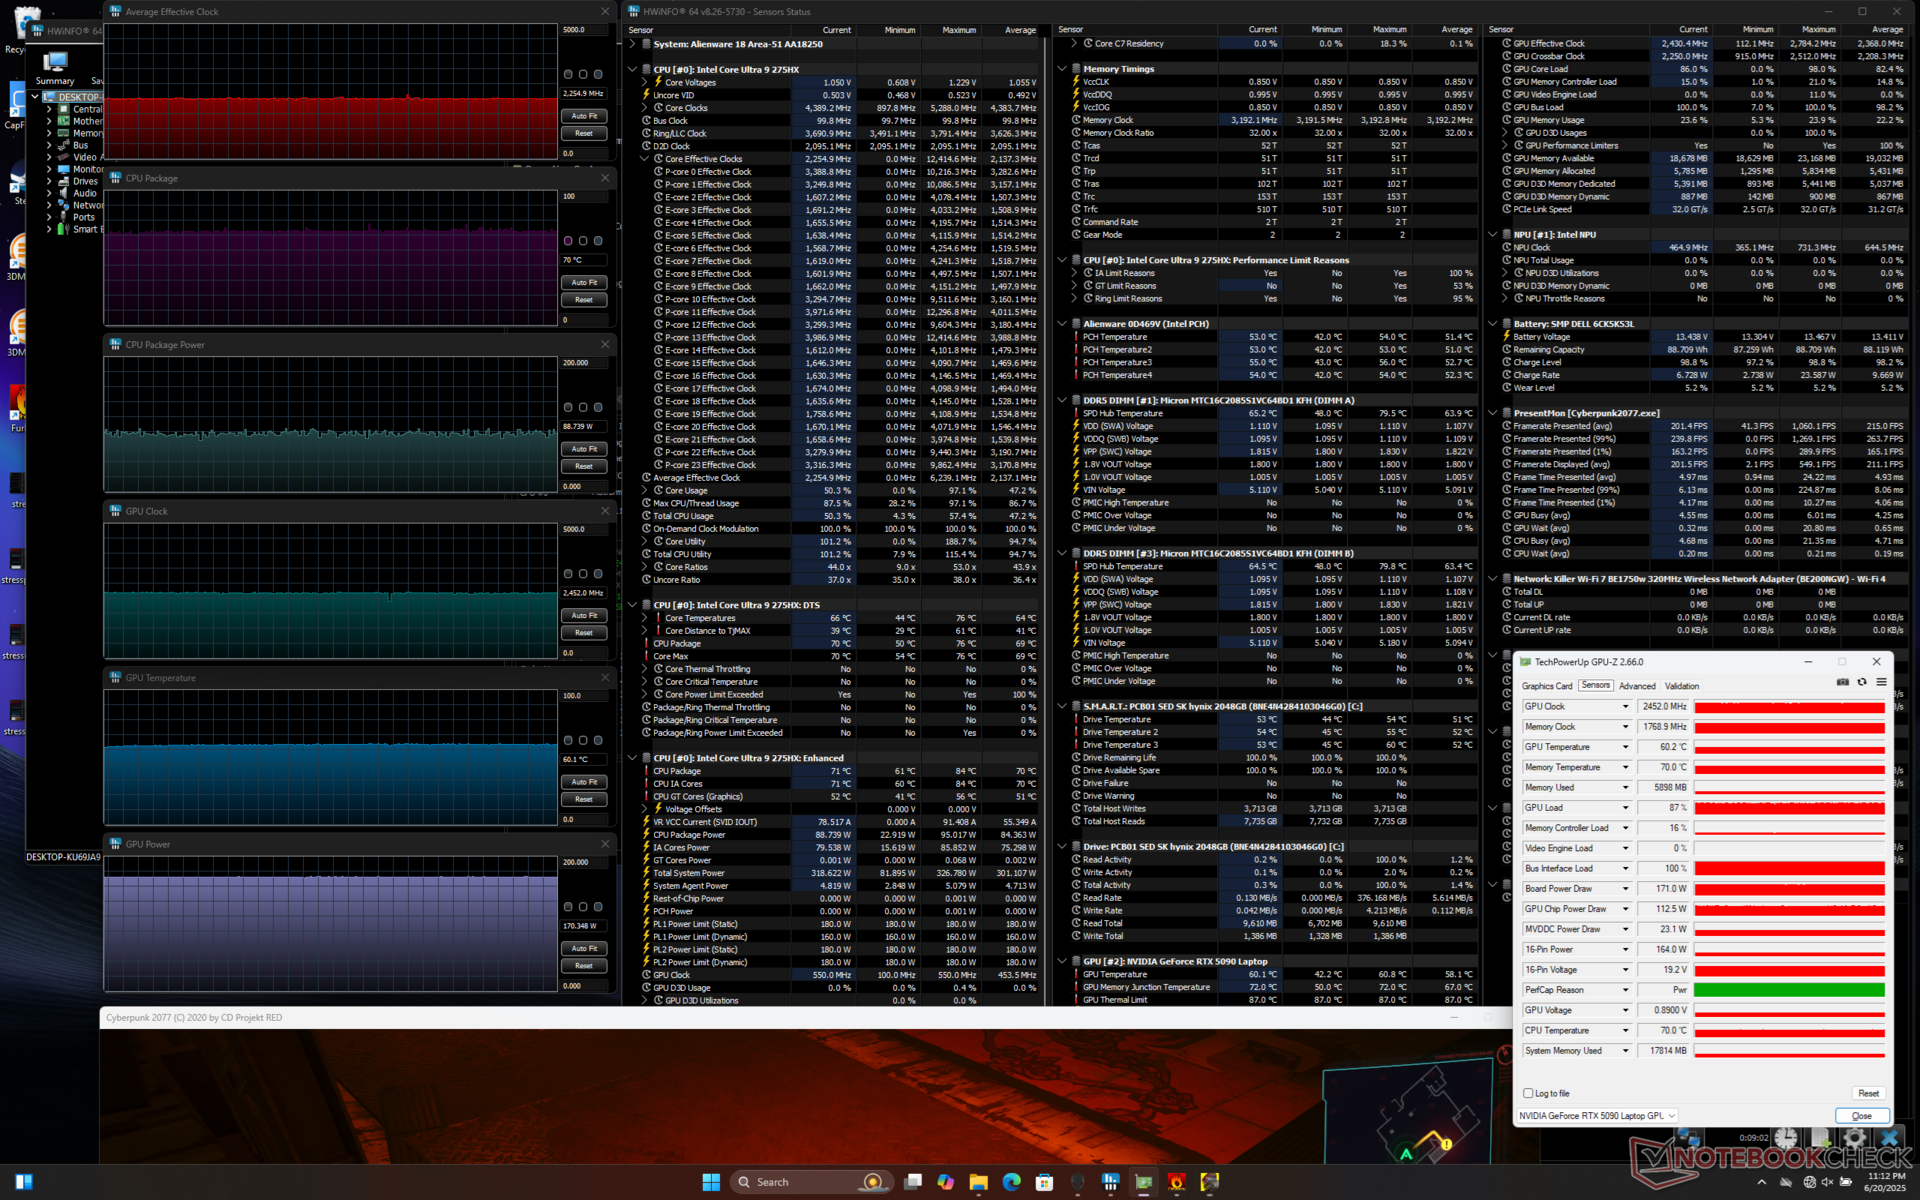
Unser Alienware 18 spielt Spiele durchweg schneller als der durchschnittliche Laptop in unserer Datenbank mit der gleichen RTX-5090-GPU, und zwar zwischen fünf und 15 Prozent. Die Leistungssteigerungen sind im Bereich der Laptop-GPUs weitgehend inkrementell, da Nvidia stattdessen die Multi-Frame-Generation zu einem der wichtigsten Verkaufsargumente der RTX-50-Blackwell-Serie gemacht hat. Unser System ist beispielsweise in der Lage, Alan Wake 2 auf maximalen 4K-RT-Einstellungen mit 125 fps mit MFG x4 auszuführen, während ein RTX-4090-Laptop der letzten Generation auf die x2-Frame-Generierung mit weit weniger als der Hälfte der durchschnittlichen Frame-Raten beschränkt ist. Wenn Ihre Lieblingstitel MFG nicht unterstützen, wie z. B. F1 24, dann wird der Leistungsgewinn gegenüber RTX-40-Laptops nicht so signifikant sein. MFG ist der Schlüssel für Spieler, die die schnelle 300-Hz-Bildwiederholrate des nativen Panels nutzen möchten.
Cyberpunk 2077 ultra fps-Chart
| min. | mittel | hoch | max. | QHD DLSS | QHD | 4K DLSS | 4K | |
|---|---|---|---|---|---|---|---|---|
| Dota 2 Reborn (2015) | 217 | 193.8 | 188.3 | 171.5 | 165.3 | |||
| Final Fantasy XV Benchmark (2018) | 212 | 183.6 | 109.4 | |||||
| X-Plane 11.11 (2018) | 153.7 | 143.6 | 122.9 | 100.2 | ||||
| Strange Brigade (2018) | 456 | 350 | 185.5 | |||||
| Baldur's Gate 3 (2023) | 236.5 | 237.3 | 174.8 | 149.3 | 94 | |||
| Cyberpunk 2077 (2023) | 179.1 | 166.5 | 136.6 | 120.5 | 55 | |||
| Alan Wake 2 (2023) | 133.2 | 88.1 | 75.4 | 49.3 | ||||
| F1 24 (2024) | 155.4 | 156.3 | 106.4 | 90.6 | 52.2 | |||
| Black Myth: Wukong (2024) | 109 | 65 | 73 | 50 | 52 | 30 | ||
| Indiana Jones and the Great Circle (2024) | 140.3 | 133.7 | 112.6 | 73 | ||||
| Monster Hunter Wilds (2025) | 95.34 | 92.77 | 80.51 | 69.17 | 50.77 | |||
| Assassin's Creed Shadows (2025) | 75 | 76 | 64 | 61 | 46 | |||
| Battlefield 6 (2025) | 159.4 | 143.4 | 109.3 | 83.6 | 59.4 |
Emissionen
Systemrauschen
Das Lüftergeräusch bewegt sich um die 31 dB(A), wenn man anspruchslose Lasten wie Browser oder Videostreaming ausführt. Es wird erst dann lauter, wenn anspruchsvollere Lasten ausgeführt werden, um das Pulsieren auf ein Minimum zu beschränken. Das Geräusch ist immer hörbar, aber im Allgemeinen nicht störend, wenn man nicht gerade spielt.
Das Lüftergeräusch beim Spielen würde sich bei 45,9 dB(A), 48,9 dB(A) und 55,9 dB(A) einpendeln, wenn der Modus Balanced, Performance bzw. Overdrive eingestellt wäre. Der Geräuschunterschied zwischen den Modi Performance und Overdrive ist beträchtlich, insbesondere im Vergleich zu den geringen Leistungsgewinnen, die der Overdrive-Modus bietet. Im Modus Performance ist das Lüftergeräusch um einige Dezibel leiser als beim letztjährigen Alienware m18 R2.
Lautstärkediagramm
| Idle |
| 30.2 / 30.6 / 30.6 dB(A) |
| Last |
| 38 / 55.9 dB(A) |
 | ||
30 dB leise 40 dB(A) deutlich hörbar 50 dB(A) störend |
||
min: | ||
| Alienware 18 Area-51 GeForce RTX 5090 Laptop, Ultra 9 275HX | Alienware 16 Area-51 GeForce RTX 5080 Laptop, Ultra 9 275HX, Samsung PM9C1a MZ9L81T0HDLB | Alienware m18 R2 GeForce RTX 4090 Laptop GPU, i9-14900HX, SK Hynix PC811 HFS002TEM9X152N | MSI Raider A18 HX A9WIG-080 GeForce RTX 5080 Laptop, R9 9955HX3D, Samsung PM9E1 MZVLC2T0HBLD | Razer Blade 18 2024 RZ09-0509 GeForce RTX 4090 Laptop GPU, i9-14900HX | Asus ROG Strix G18 G814JI GeForce RTX 4070 Laptop GPU, i7-13650HX, Micron 2400 MTFDKBA1T0QFM | Acer Predator Helios 18 PH18-72-98MW GeForce RTX 4090 Laptop GPU, i9-14900HX, 2x SK Hynix HFS001TEJ9X115N (RAID 0) | |
|---|---|---|---|---|---|---|---|
| Geräuschentwicklung | 7% | 8% | -1% | 5% | 5% | -14% | |
| aus / Umgebung * (dB) | 23.4 | 23.6 -1% | 23.6 -1% | 25.1 -7% | 23.4 -0% | 25 -7% | 25 -7% |
| Idle min * (dB) | 30.2 | 25.4 16% | 23.8 21% | 28.6 5% | 23.9 21% | 26 14% | 30 1% |
| Idle avg * (dB) | 30.6 | 27.8 9% | 26.1 15% | 28.9 6% | 28.2 8% | 28 8% | 36 -18% |
| Idle max * (dB) | 30.6 | 28.1 8% | 31.5 -3% | 29.2 5% | 29 5% | 29 5% | 44 -44% |
| Last avg * (dB) | 38 | 28.8 24% | 31.5 17% | 45.6 -20% | 36.8 3% | 41 -8% | 48 -26% |
| Cyberpunk 2077 ultra * (dB) | 48.9 | 50.4 -3% | 55.6 -14% | ||||
| Last max * (dB) | 55.9 | 56.4 -1% | 56.6 -1% | 45.8 18% | 61.1 -9% | 46 18% | 51 9% |
| Witcher 3 ultra * (dB) | 52.1 | 54.1 | 44 | 49 |
* ... kleinere Werte sind besser
Temperatur
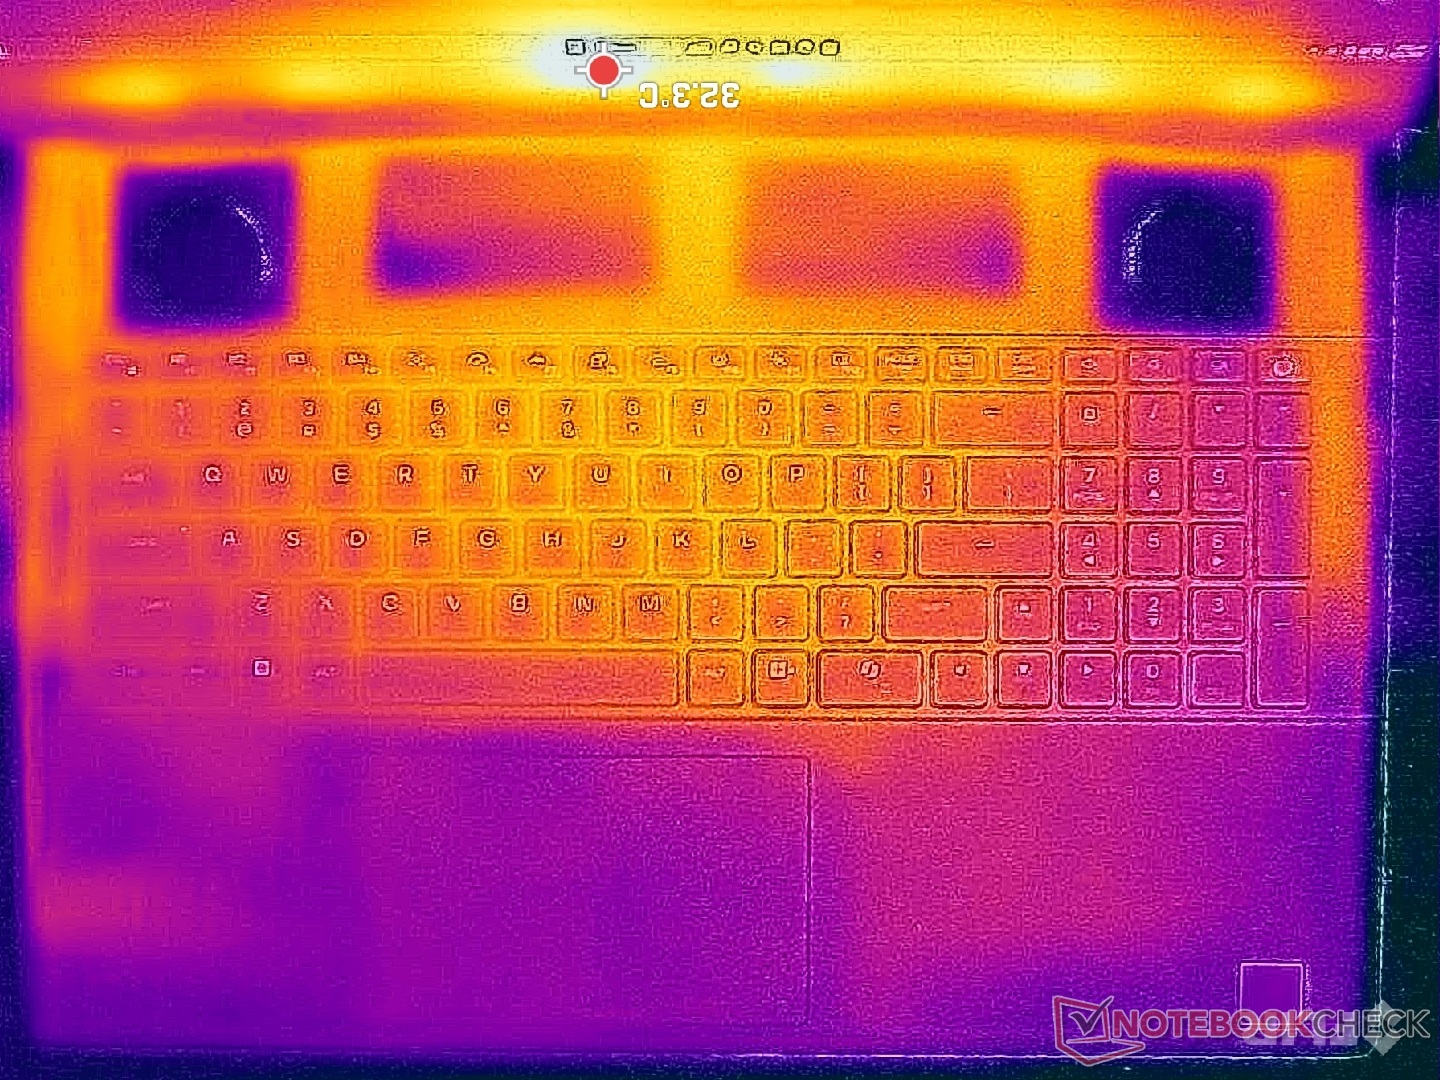
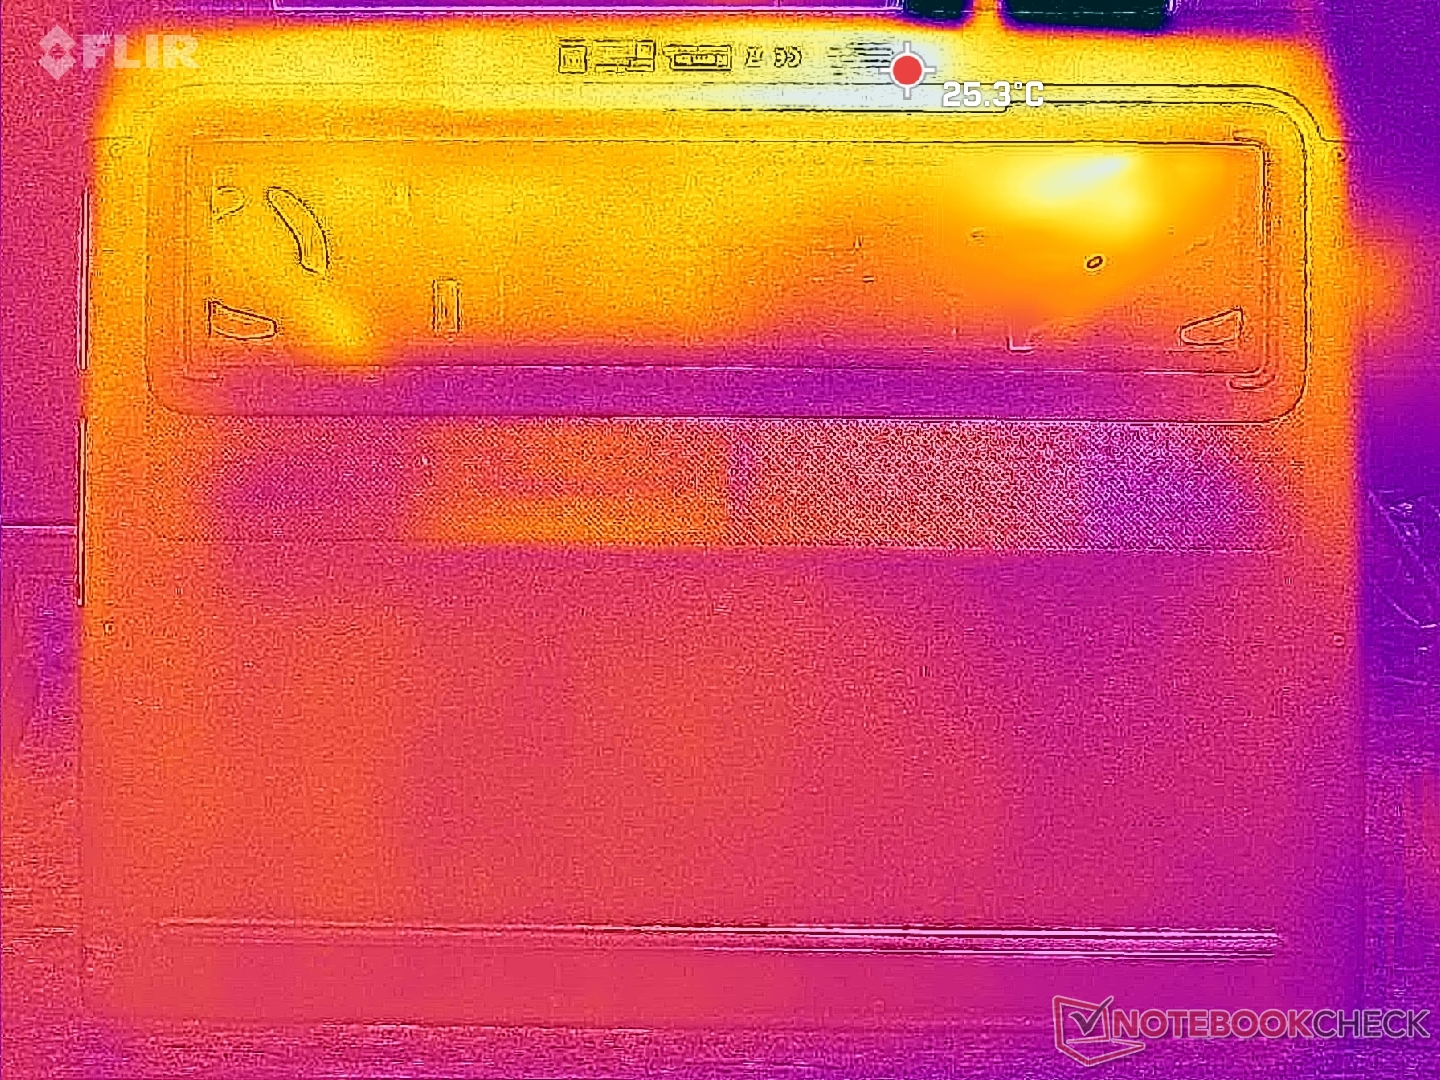
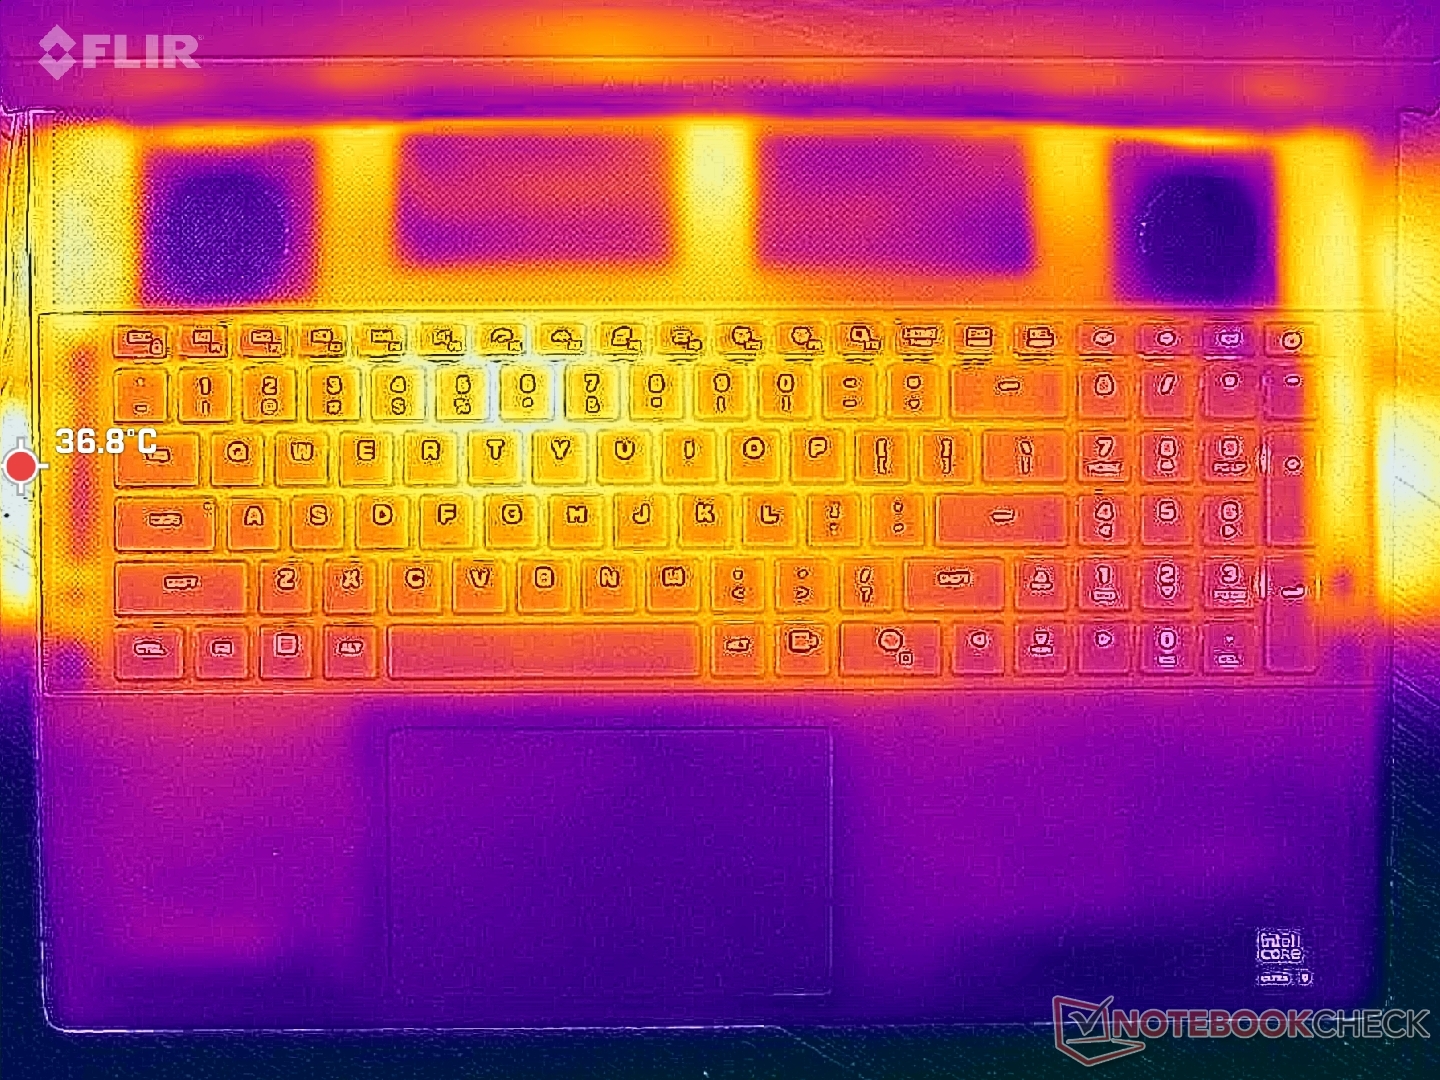
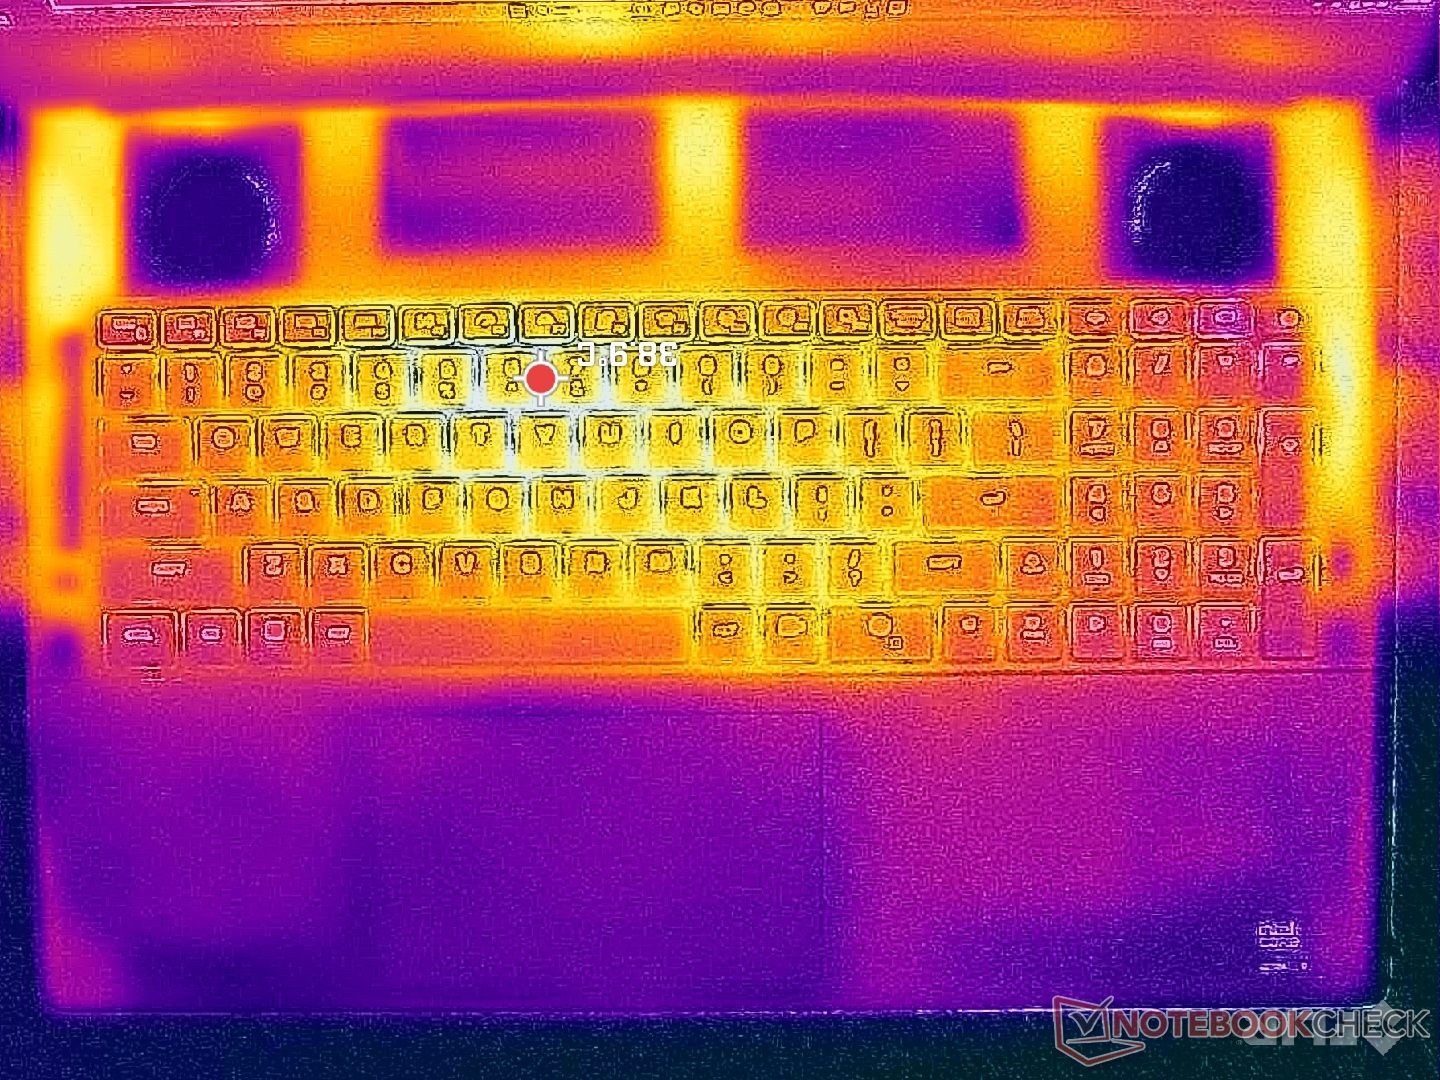
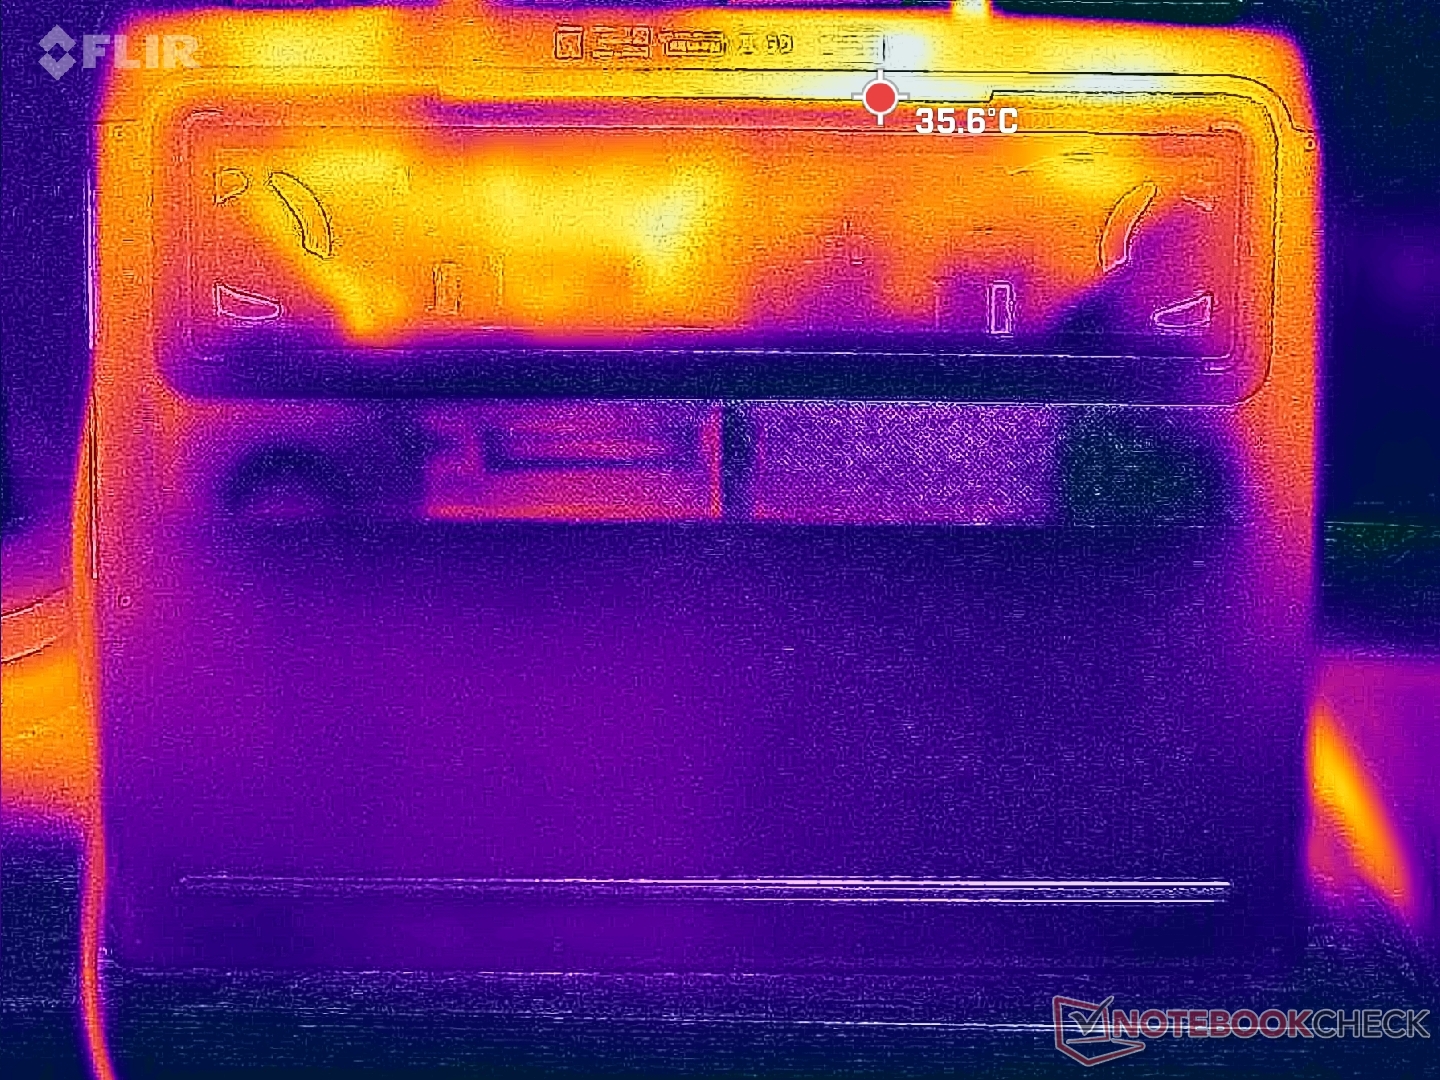
Die durchschnittlichen Oberflächentemperaturen sind in etwa die gleichen wie beim Alienware m18 R2, aber mit kühleren Hotspots, obwohl es insgesamt weniger Lüftungsgitter gibt. Das MSI Raider A18 erreicht beim Spielen an einigen Stellen 50 °C, verglichen mit nur 36 °C bei unserem Alienware. Wir haben nichts anderes erwartet, wenn man bedenkt, wie sperrig das Alienware Gerät ist.
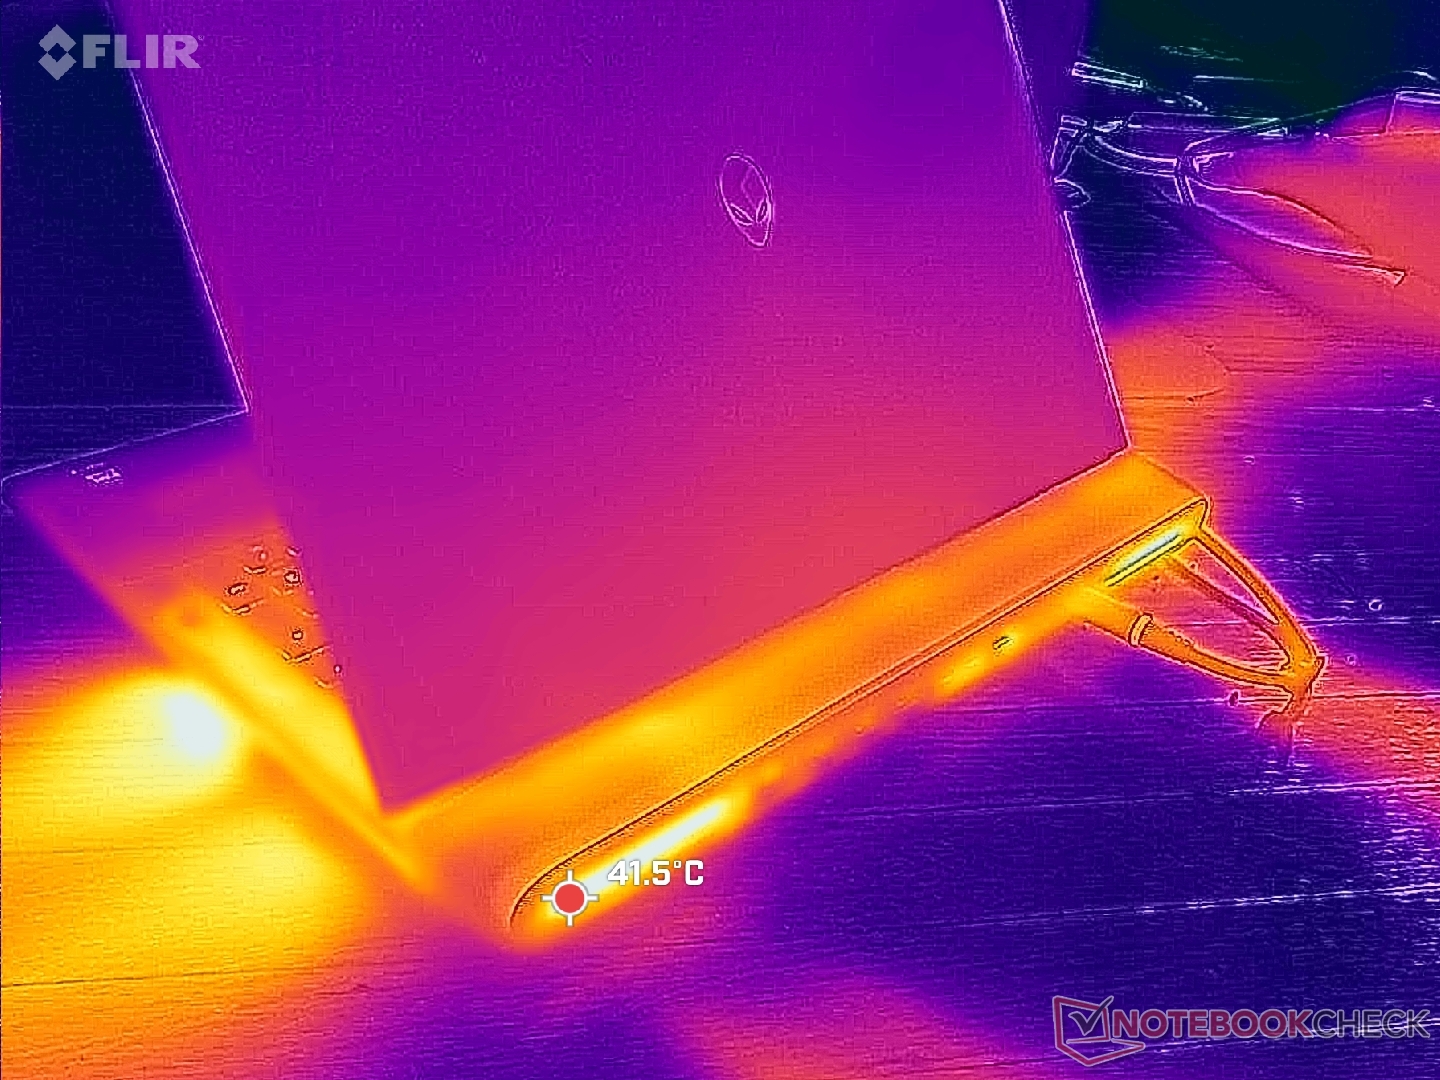

(+) Die maximale Temperatur auf der Oberseite ist 36.8 °C. Im Vergleich liegt der Klassendurchschnitt bei 40.4 °C (von 21.2 bis 68.8 °C für die Klasse Gaming).
(+) Auf der Unterseite messen wir eine maximalen Wert von 35.8 °C (im Vergleich zum Durchschnitt von 43.2 °C).
(+) Ohne Last messen wir eine durchschnittliche Temperatur von 28.5 °C auf der Oberseite. Der Klassendurchschnitt erreicht 33.9 °C.
(+) 3: The average temperature for the upper side is 31.2 °C / 88 F, compared to the average of 33.9 °C / 93 F for the class Gaming.
(+) Die Handballen und der Touchpad-Bereich sind mit gemessenen 26.8 °C kühler als die typische Hauttemperatur und fühlen sich dadurch kühl an.
(±) Die durchschnittliche Handballen-Temperatur anderer getesteter Geräte war 28.8 °C (+2 °C).

| Alienware 18 Area-51 Intel Core Ultra 9 275HX, NVIDIA GeForce RTX 5090 Laptop | Alienware 16 Area-51 Intel Core Ultra 9 275HX, NVIDIA GeForce RTX 5080 Laptop | Alienware m18 R2 Intel Core i9-14900HX, NVIDIA GeForce RTX 4090 Laptop GPU | MSI Raider A18 HX A9WIG-080 AMD Ryzen 9 9955HX3D, NVIDIA GeForce RTX 5080 Laptop | Razer Blade 18 2024 RZ09-0509 Intel Core i9-14900HX, NVIDIA GeForce RTX 4090 Laptop GPU | Asus ROG Strix G18 G814JI Intel Core i7-13650HX, NVIDIA GeForce RTX 4070 Laptop GPU | Acer Predator Helios 18 PH18-72-98MW Intel Core i9-14900HX, NVIDIA GeForce RTX 4090 Laptop GPU | |
|---|---|---|---|---|---|---|---|
| Hitze | -16% | -23% | -25% | -18% | -12% | -24% | |
| Last oben max * (°C) | 36.8 | 43.8 -19% | 41.2 -12% | 49.3 -34% | 43.2 -17% | 45 -22% | 43 -17% |
| Last unten max * (°C) | 35.8 | 40 -12% | 34.6 3% | 50.9 -42% | 42.6 -19% | 47 -31% | 59 -65% |
| Idle oben max * (°C) | 30.6 | 35.8 -17% | 42.8 -40% | 35.2 -15% | 36 -18% | 28 8% | 32 -5% |
| Idle unten max * (°C) | 30.8 | 35.2 -14% | 43.6 -42% | 33.5 -9% | 36.4 -18% | 31 -1% | 34 -10% |
* ... kleinere Werte sind besser
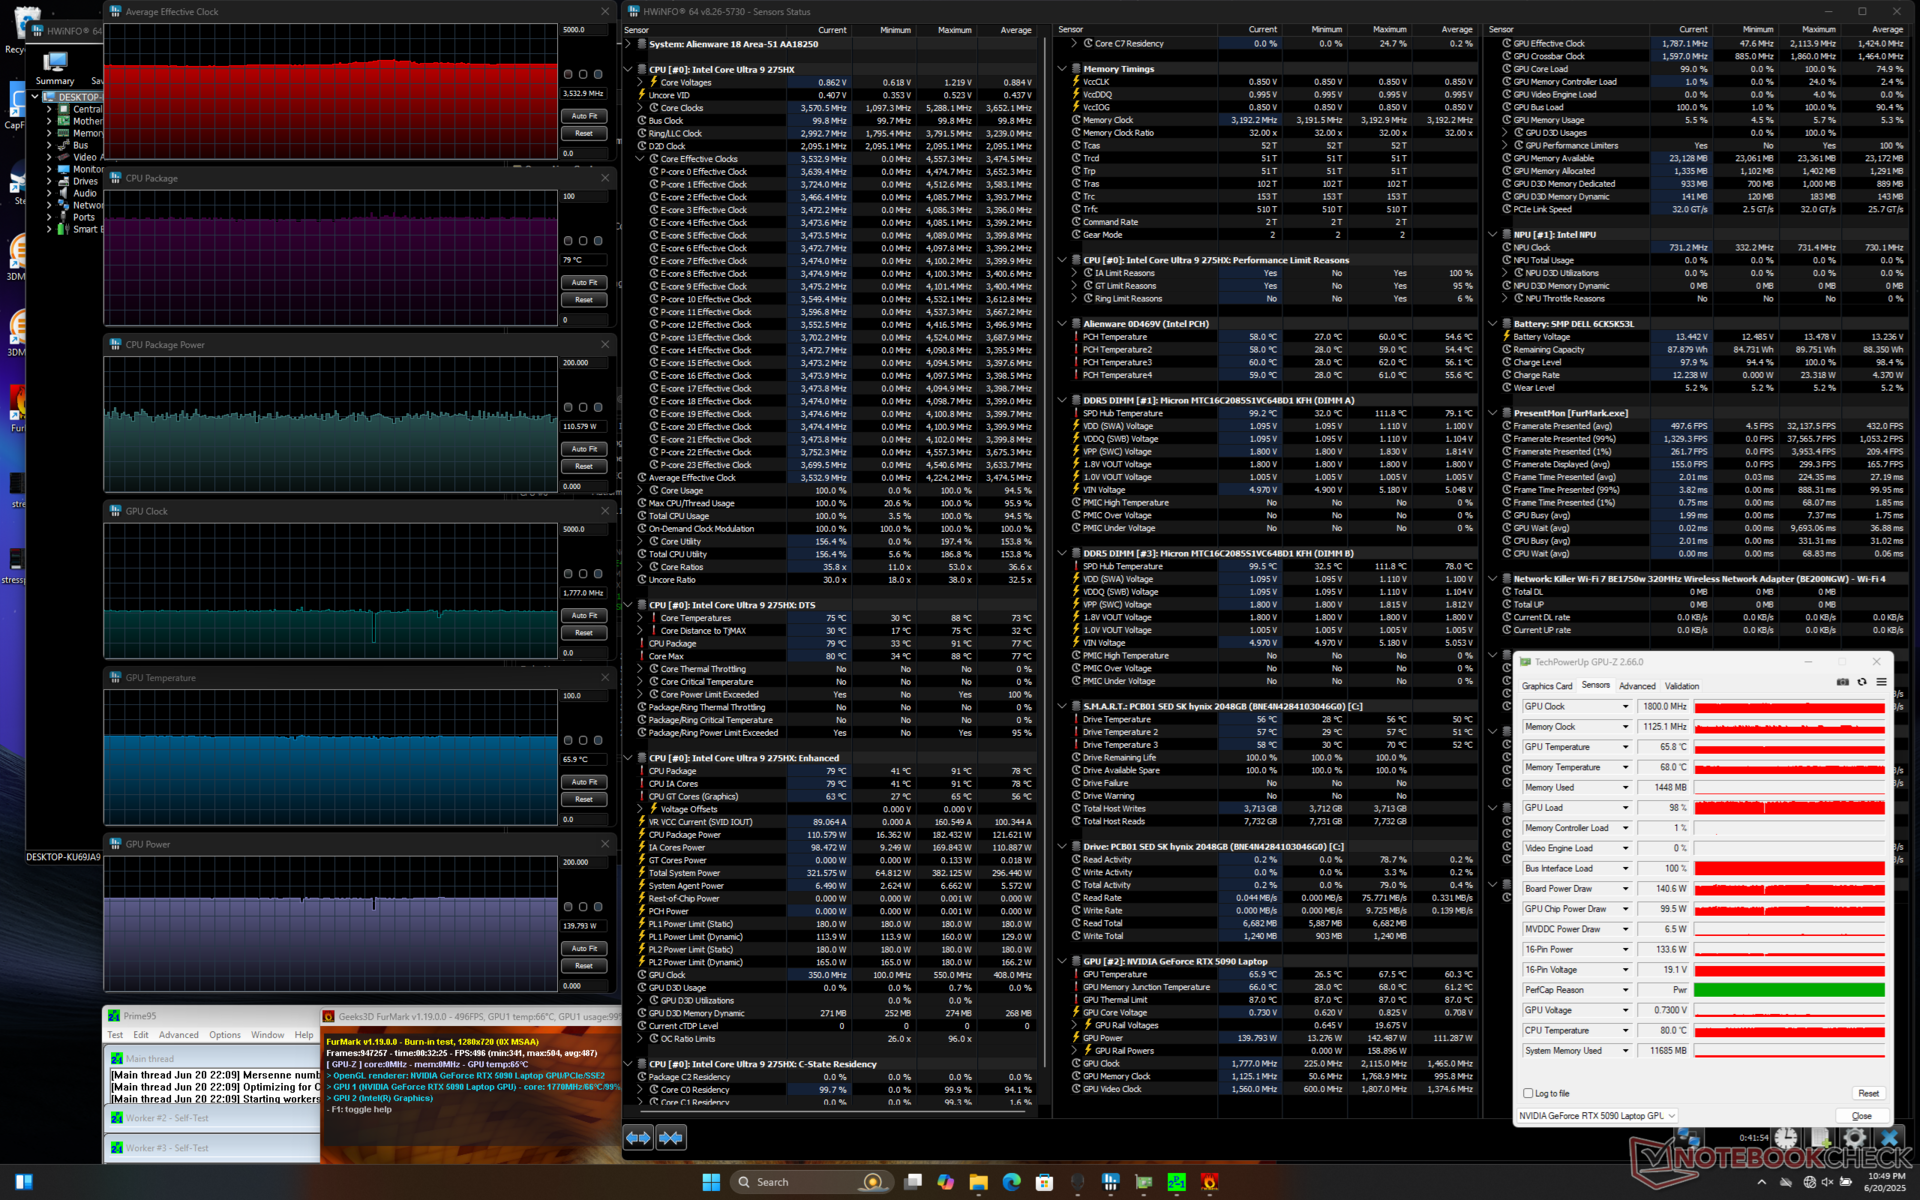
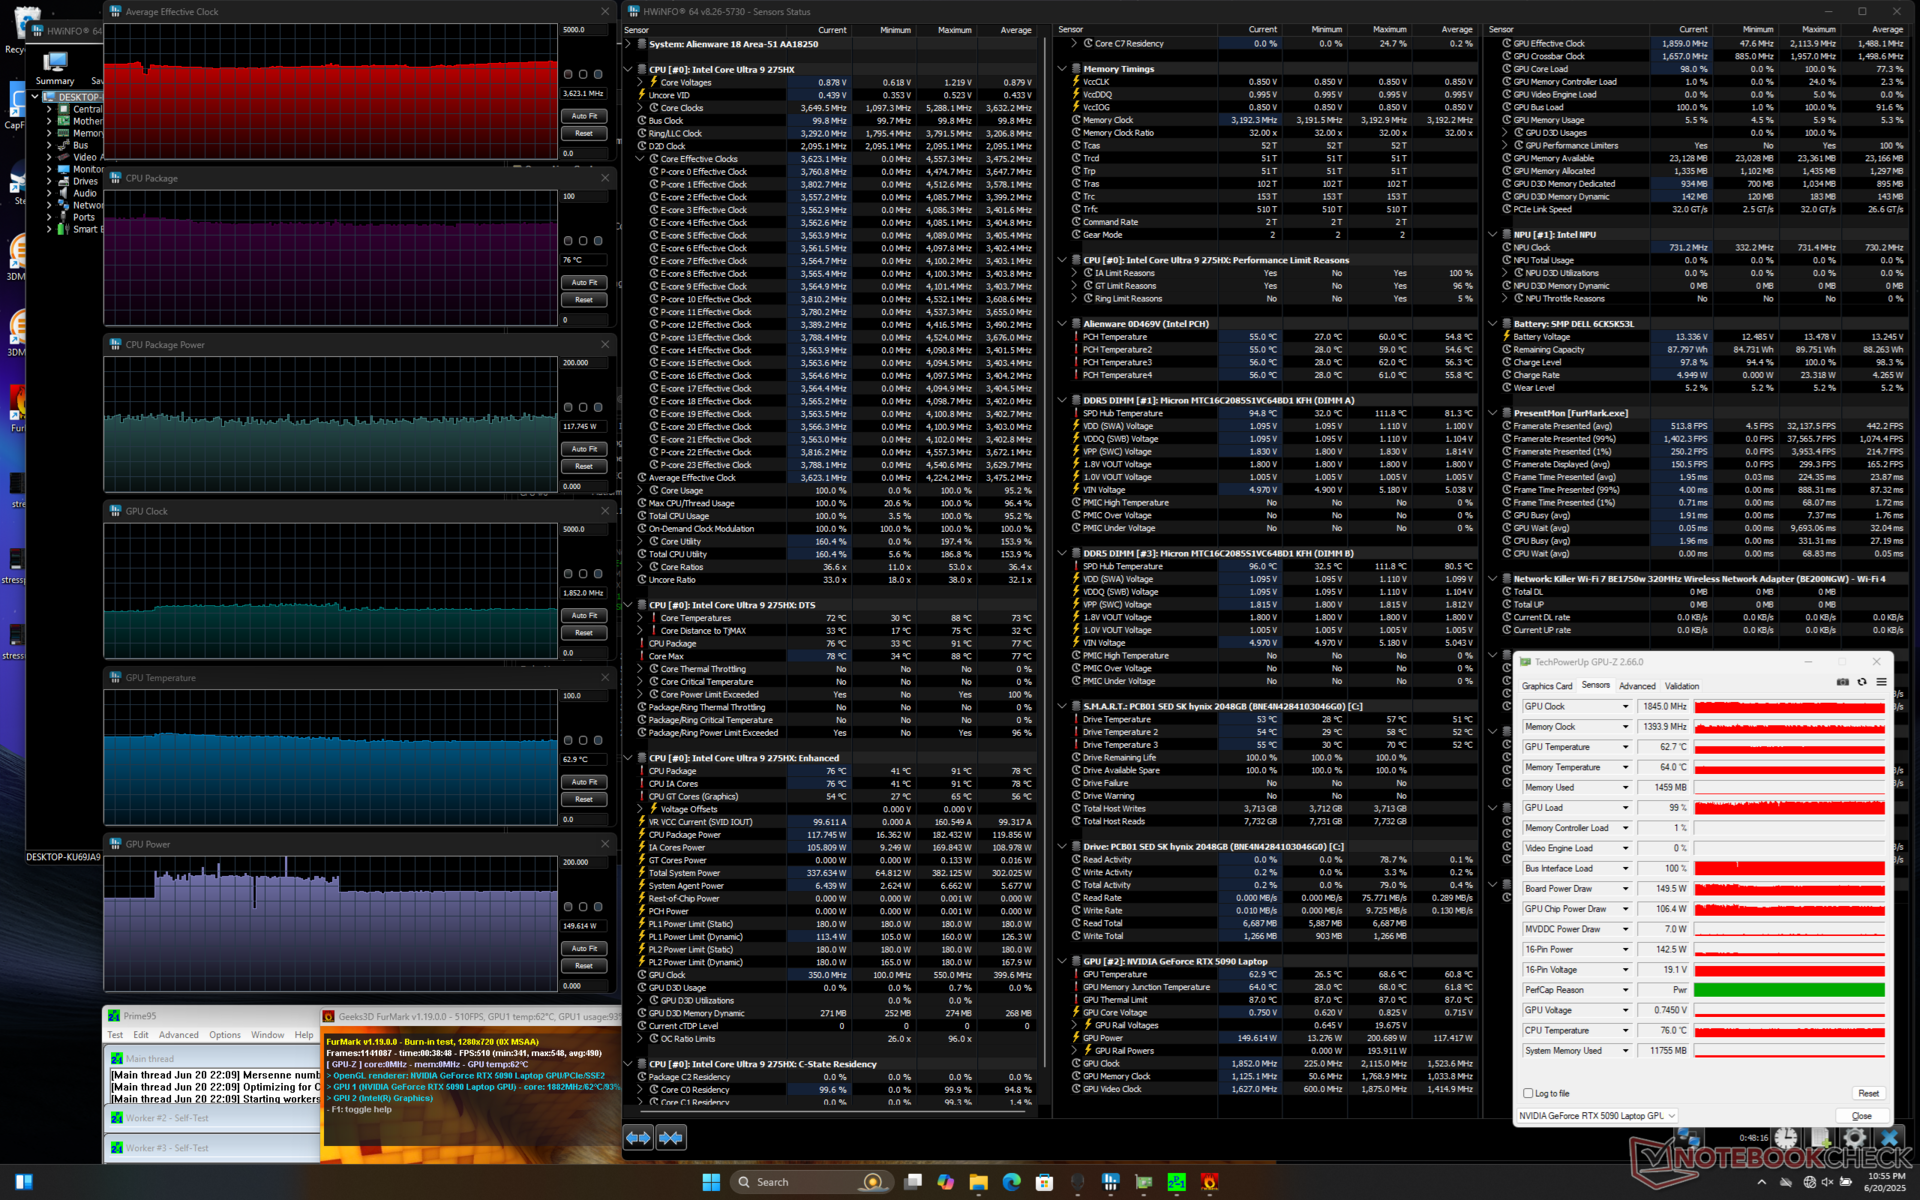
Stresstest
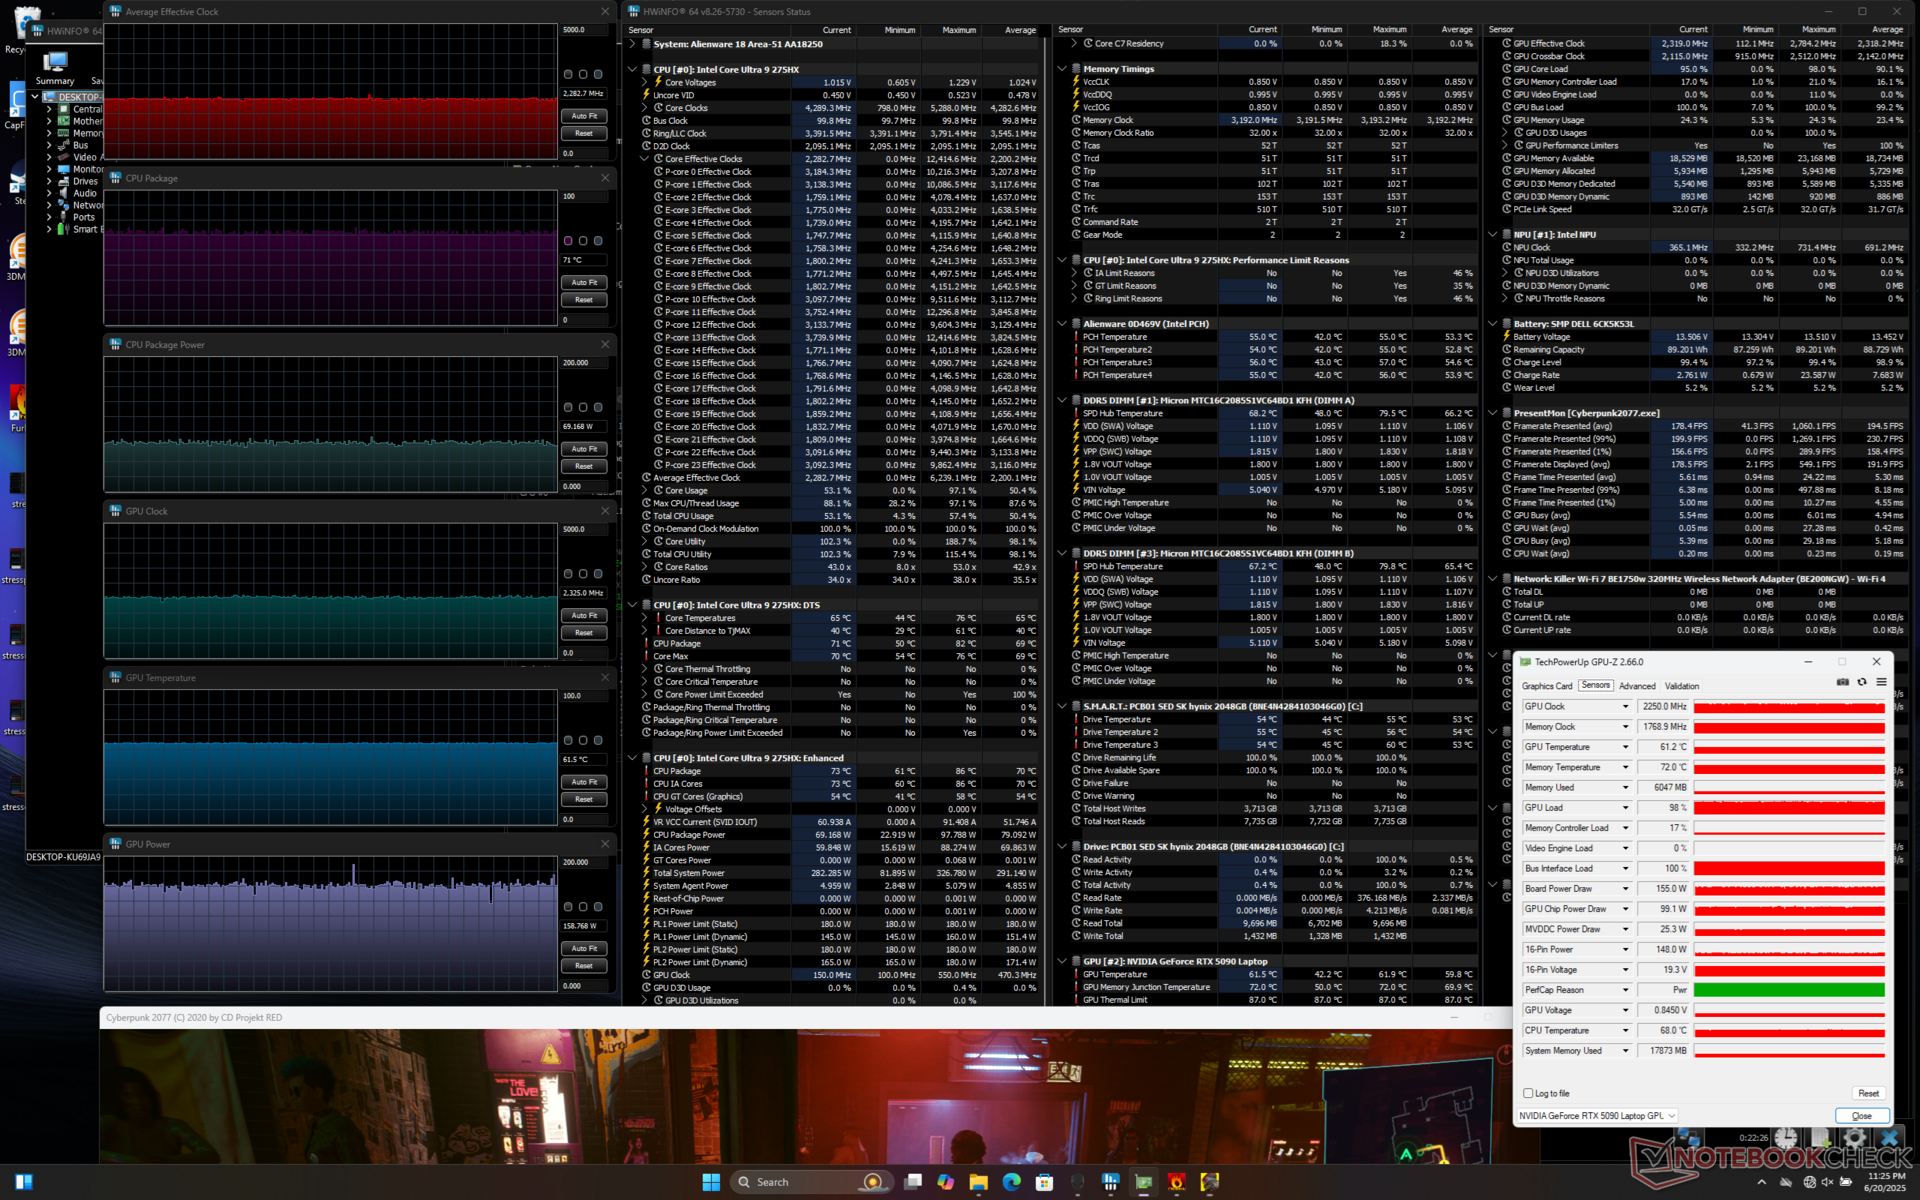
Die durchschnittlichen Kerntemperaturen unter Last sind für einen Gaming-Laptop relativ niedrig. Wird beispielsweise Prime95 und FurMark ausgeführt, stabilisieren sich die CPU- und GPU-Temperaturen bei 79 °C bzw. 66 °C, verglichen mit 83 °C und 77 °C beim dem MSI Vector A18 HX. Unser Alienware 18 blieb auch bei Cyberpunk 2077 kühler als die meisten anderen Gaming-Laptops.
Im Modus Performance stieg die CPU für etwa eine Minute auf 4,0 GHz und ~165 W, bevor sie auf 3,8 GHz, 145 W und 72 °C sank. Wird das Energieprofil in den Modus Overdrive geändert, steigt die CPU wieder auf 4,0 GHz und ~165 W.
Die Leistungsaufnahme der GPU-Platine bei Cyberpunk 2077 im Modus Performance liegt knapp unter 160 W, verglichen mit 171 W, wenn dasselbe Spiel im Modus Overdrive läuft. Die lauteren Lüfter im Overdrive-Modus ermöglichen etwas schnellere GPU-Taktraten, während die Kerntemperaturen ungefähr gleich bleiben.
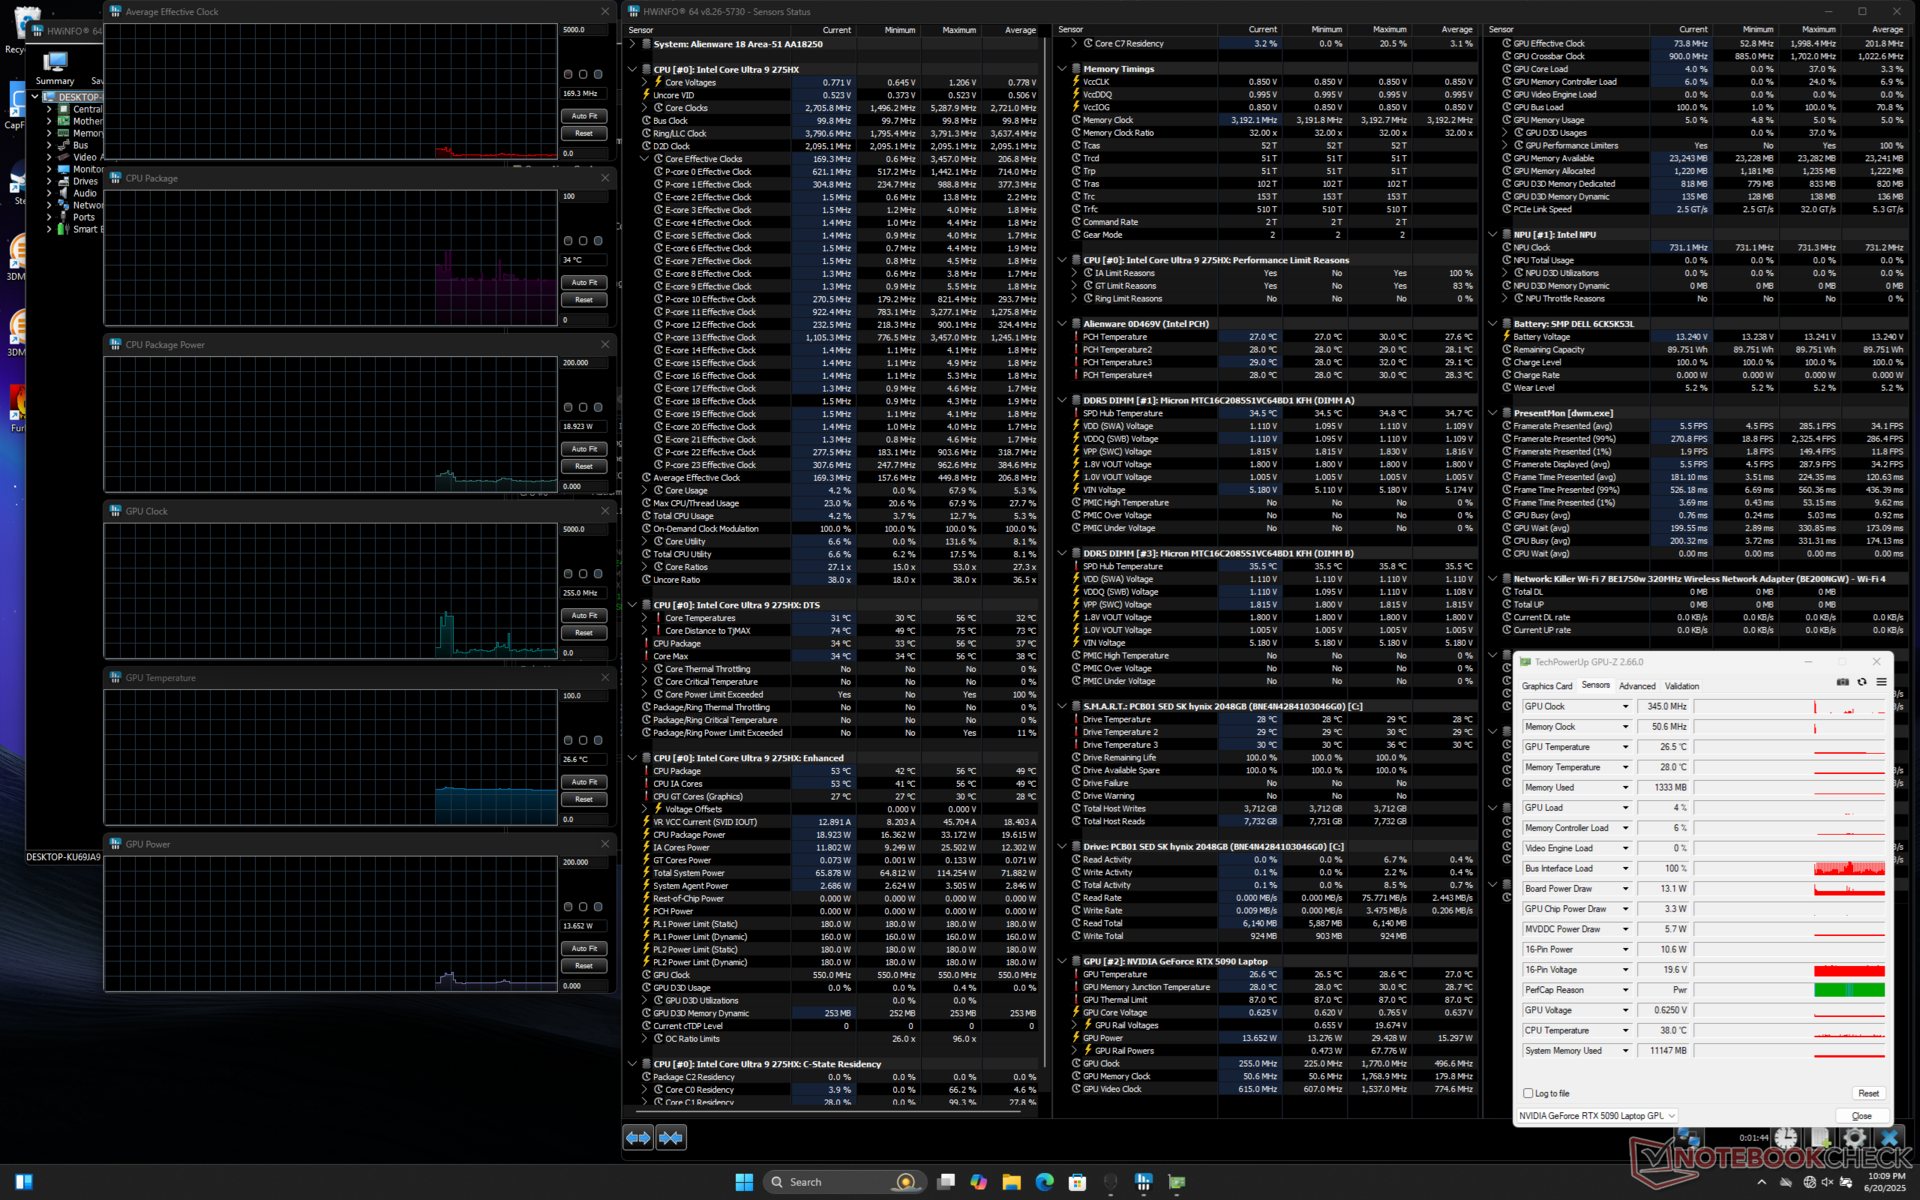
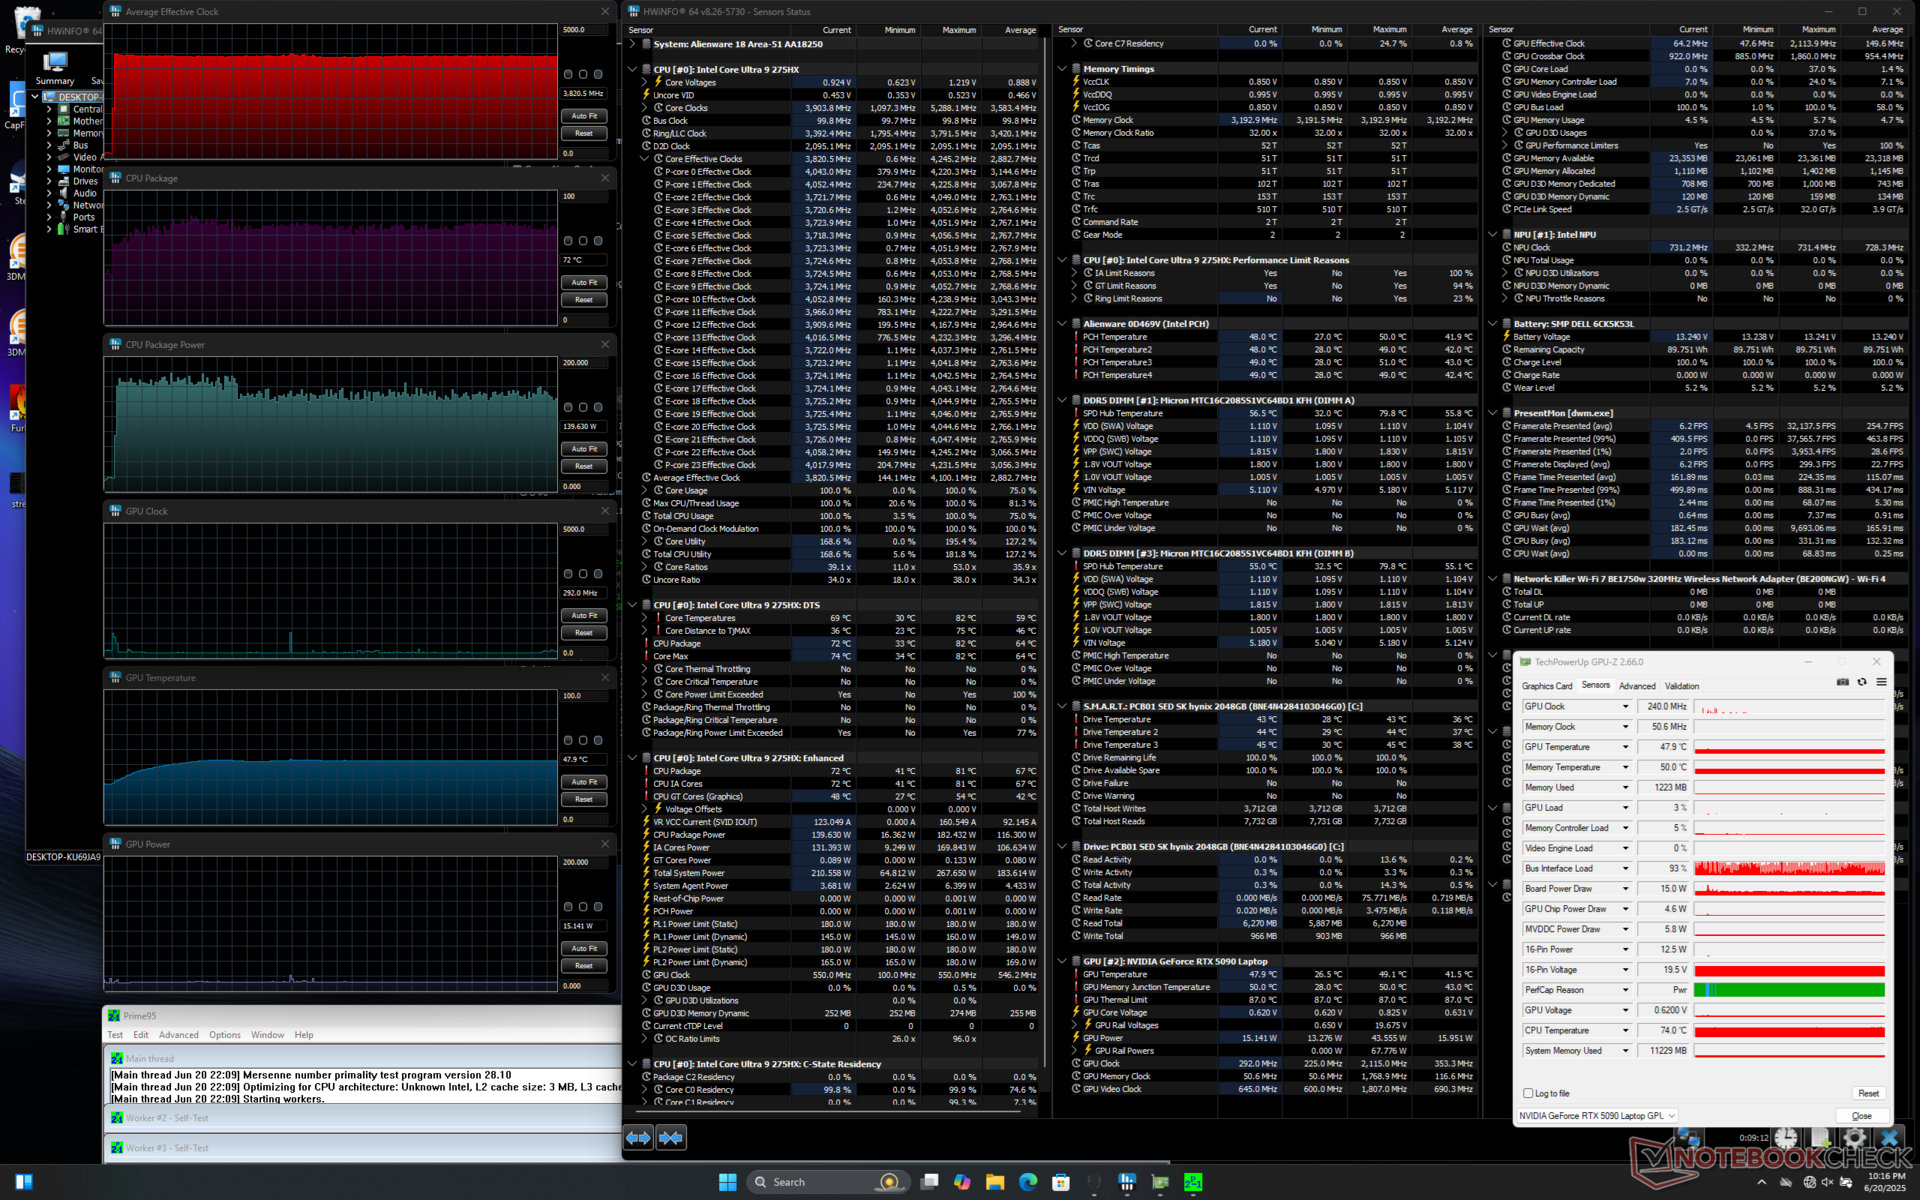
| durchschnittlicher CPU-Takt (GHz) | GPU-Takt (MHz) | durchschnittliche CPU-Temperatur (°C) | durchschnittliche GPU-Temperatur (°C) | |
| System Leerlauf | -- | -- | 34 | 27 |
| Prime95 Stress | 3,8 | -- | 72 | 48 |
| Prime95 + FurMark Stress (Overdrive-Modus) | 3,6 | 1.852 | 76 | 63 |
| Prime95 + FurMark Stress (Performance-Modus) | 3,5 | 1.777 | 79 | 66 |
| Cyberpunk 2077 Stress (Overdrive Modus) | 2,3 | 2.452 | 70 | 60 |
| Cyberpunk 2077 Stress (Performance-Modus) | 2,3 | 2.325 | 71 | 62 |
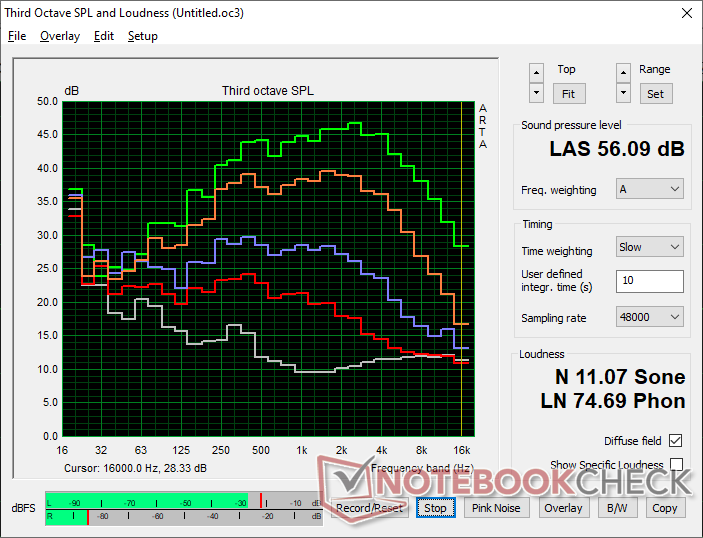
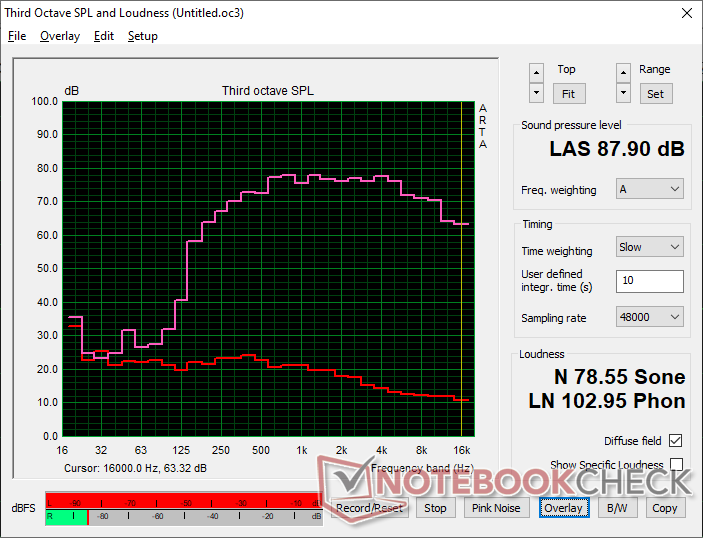
Lautsprecher
Alienware 18 Area-51 Audio Analyse
(+) | Die Lautsprecher können relativ laut spielen (87.9 dB)
Bass 100 - 315 Hz
(-) | kaum Bass - 17.5% niedriger als der Median
(±) | durchschnittlich lineare Bass-Wiedergabe (13.4% Delta zum Vorgänger)
Mitteltöne 400 - 2000 Hz
(+) | ausgeglichene Mitten, vom Median nur 3.1% abweichend
(+) | lineare Mitten (3.6% Delta zum Vorgänger)
Hochtöne 2 - 16 kHz
(+) | ausgeglichene Hochtöne, vom Median nur 2.9% abweichend
(+) | sehr lineare Hochtöne (2.9% Delta zum Vorgänger)
Gesamt im hörbaren Bereich 100 - 16.000 Hz
(+) | hörbarer Bereich ist sehr linear (14.2% Abstand zum Median
Im Vergleich zu allen Geräten derselben Klasse
» 25% aller getesteten Geräte dieser Klasse waren besser, 7% vergleichbar, 68% schlechter
» Das beste Gerät hat einen Delta-Wert von 6%, durchschnittlich ist 18%, das schlechteste Gerät hat 132%
Im Vergleich zu allen Geräten im Test
» 17% aller getesteten Geräte waren besser, 4% vergleichbar, 79% schlechter
» Das beste Gerät hat einen Delta-Wert von 4%, durchschnittlich ist 23%, das schlechteste Gerät hat 134%
Apple MacBook Pro 16 2021 M1 Pro Audio Analyse
(+) | Die Lautsprecher können relativ laut spielen (84.7 dB)
Bass 100 - 315 Hz
(+) | guter Bass - nur 3.8% Abweichung vom Median
(+) | lineare Bass-Wiedergabe (5.2% Delta zum Vorgänger)
Mitteltöne 400 - 2000 Hz
(+) | ausgeglichene Mitten, vom Median nur 1.3% abweichend
(+) | lineare Mitten (2.1% Delta zum Vorgänger)
Hochtöne 2 - 16 kHz
(+) | ausgeglichene Hochtöne, vom Median nur 1.9% abweichend
(+) | sehr lineare Hochtöne (2.7% Delta zum Vorgänger)
Gesamt im hörbaren Bereich 100 - 16.000 Hz
(+) | hörbarer Bereich ist sehr linear (4.6% Abstand zum Median
Im Vergleich zu allen Geräten derselben Klasse
» 0% aller getesteten Geräte dieser Klasse waren besser, 0% vergleichbar, 100% schlechter
» Das beste Gerät hat einen Delta-Wert von 5%, durchschnittlich ist 17%, das schlechteste Gerät hat 45%
Im Vergleich zu allen Geräten im Test
» 0% aller getesteten Geräte waren besser, 0% vergleichbar, 100% schlechter
» Das beste Gerät hat einen Delta-Wert von 4%, durchschnittlich ist 23%, das schlechteste Gerät hat 134%
Energieverwaltung
Stromverbrauch
Das System ist sehr anspruchsvoll, selbst wenn es im Leerlauf auf dem Desktop bei minimaler Helligkeit und Energieeinstellungen läuft. Die Akkulaufzeit ist daher unabhängig von der Bildschirmauslastung sehr kurz, wie unser nächster Abschnitt zeigen wird.
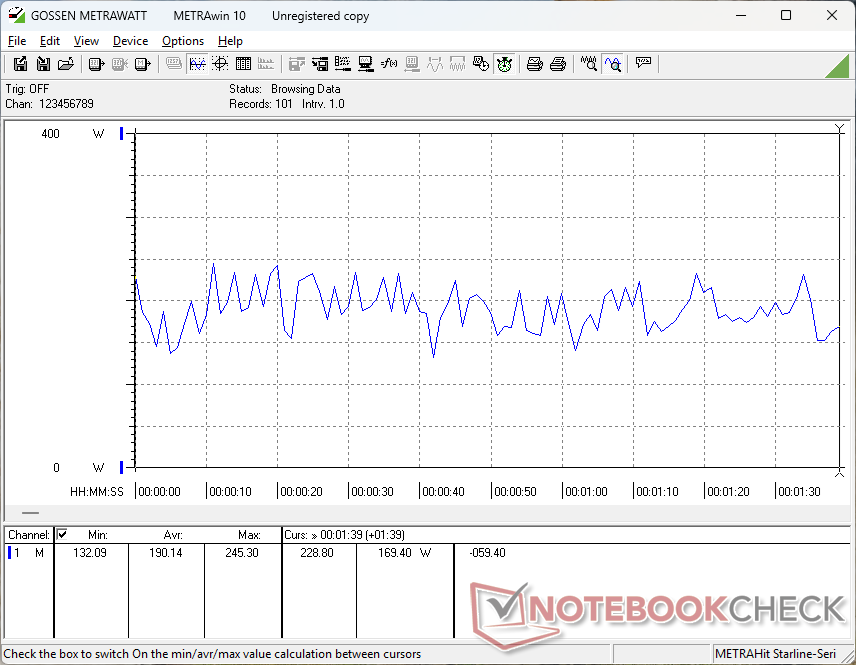
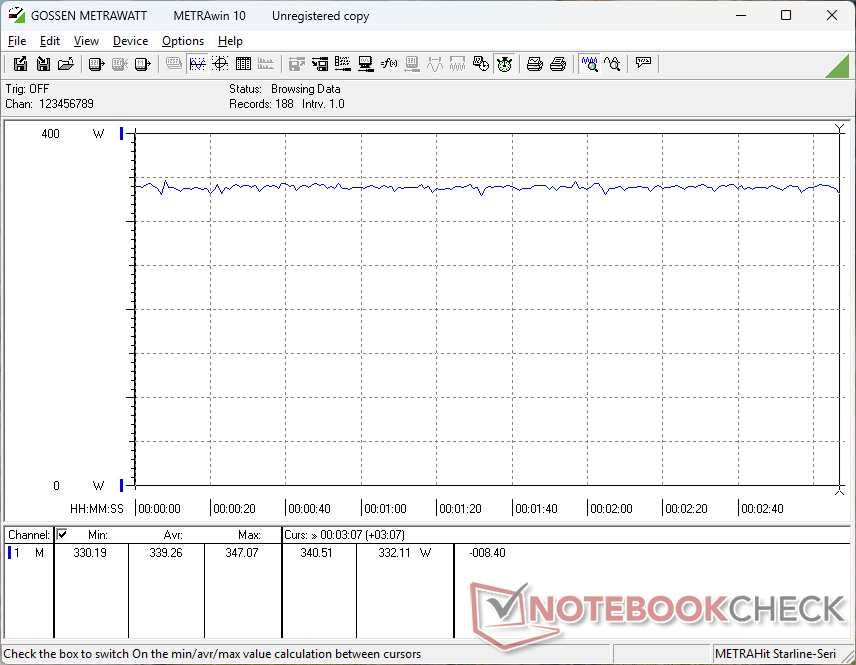
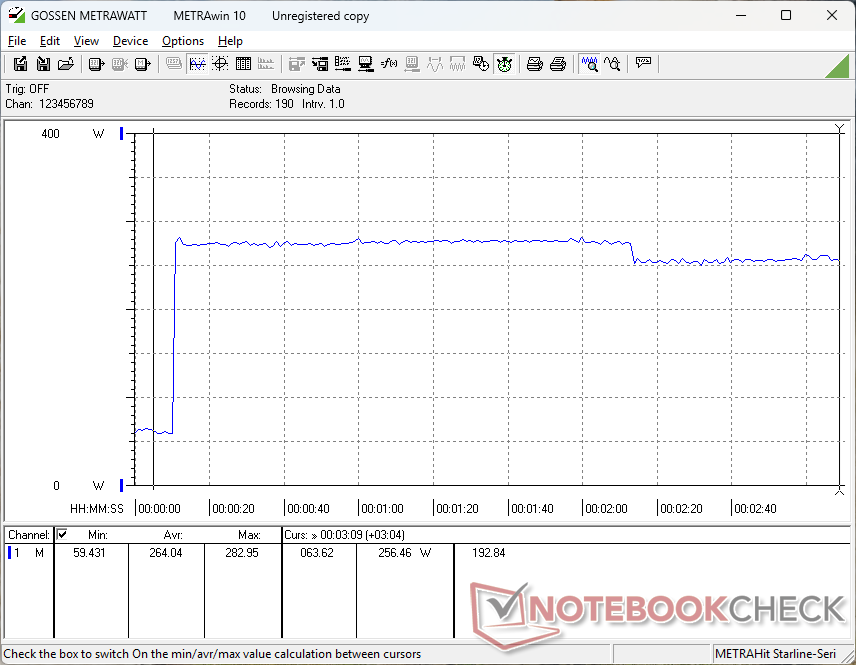
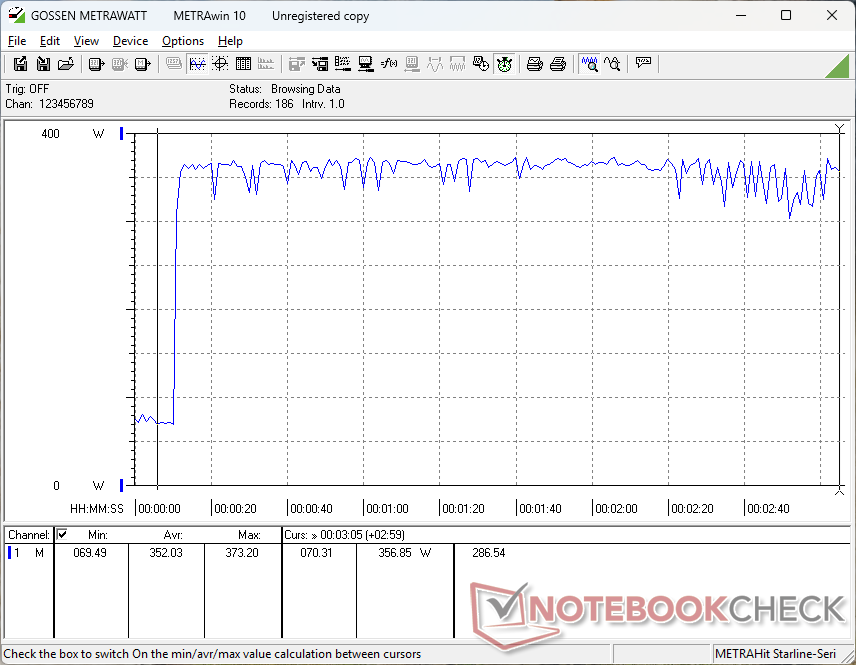
Wenn Sie Cyberpunk 2077 laufen lassen, um eine typische Spiellast darzustellen, verbraucht das System im Overdrive-Modus etwa 340 W und im Performance-Modus etwa 300 W, da die CPU- und GPU-Leistungsaufnahme wie im Test im Stressabschnitt erwähnt. Die Ergebnisse sind immer noch deutlich höher als die des Alienware 16, aber geringer als die des letztjährigen Alienware m18 R2. Die Leistung pro Watt hat sich im Vergleich zum Vorjahr verbessert, auch wenn das Alienware 18 nicht das effizienteste Gaming-Notebook auf dem Markt ist.
Wir konnten bei Prime95 und FurMark eine maximale Leistungsaufnahme von 373 W aus dem großen (~18,9 x 8,7 x 2,5 cm) 360-W-Netzteil ermitteln. Da Spiele bereits zwischen 300 und 340 W erfordern, sollte man damit rechnen, dass sich die Ladegeschwindigkeit bei gleichzeitigem Spielen verlangsamt. Das konkurrierende Lenovo Legion Pro 7i 16 G10 wird mit einem stärkeren 400-W-Netzteil geliefert.
| Aus / Standby | |
| Idle | |
| Last |
|
Legende:
min: | |
| Alienware 18 Area-51 Ultra 9 275HX, GeForce RTX 5090 Laptop, , IPS, 2560x1600, 18" | Alienware 16 Area-51 Ultra 9 275HX, GeForce RTX 5080 Laptop, Samsung PM9C1a MZ9L81T0HDLB, IPS, 2560x1600, 16" | Alienware m18 R2 i9-14900HX, GeForce RTX 4090 Laptop GPU, SK Hynix PC811 HFS002TEM9X152N, IPS, 2560x1600, 18" | MSI Raider A18 HX A9WIG-080 R9 9955HX3D, GeForce RTX 5080 Laptop, Samsung PM9E1 MZVLC2T0HBLD, MiniLED IPS, 3840x2400, 18" | Razer Blade 18 2024 RZ09-0509 i9-14900HX, GeForce RTX 4090 Laptop GPU, , Mini-LED, 2560x1600, 18" | Asus ROG Strix G18 G814JI i7-13650HX, GeForce RTX 4070 Laptop GPU, Micron 2400 MTFDKBA1T0QFM, IPS, 2560x1600, 18" | Acer Predator Helios 18 PH18-72-98MW i9-14900HX, GeForce RTX 4090 Laptop GPU, 2x SK Hynix HFS001TEJ9X115N (RAID 0), Mini-LED, 2560x1600, 18" | MSI Titan 18 HX AI A2XWJG Ultra 9 285HX, GeForce RTX 5090 Laptop, 1x Samsung PM9E1 MZVLC2T0HBLD-00BT7 + 2x Samsung PM9A1 MZVL22T0HDLB-00BT7 (RAID 0), Mini-LED, 3840x2160, 18" | |
|---|---|---|---|---|---|---|---|---|
| Stromverbrauch | 24% | 30% | 4% | 20% | 55% | 21% | 25% | |
| Idle min * (Watt) | 38.4 | 27 30% | 10.6 72% | 41.5 -8% | 25.4 34% | 8 79% | 31 19% | 19.01 50% |
| Idle avg * (Watt) | 45.6 | 33.5 27% | 20.9 54% | 53.5 -17% | 37.7 17% | 15 67% | 35 23% | 30.92 32% |
| Idle max * (Watt) | 57.5 | 41.4 28% | 40 30% | 53.8 6% | 57.9 -1% | 26 55% | 43 25% | 33.84 41% |
| Last avg * (Watt) | 190.1 | 124.7 34% | 201.1 -6% | 168.5 11% | 128.4 32% | 102 46% | 144 24% | 105.4 45% |
| Cyberpunk 2077 ultra external monitor * (Watt) | 333 | 249 25% | 295 11% | 330 1% | ||||
| Cyberpunk 2077 ultra * (Watt) | 340 | 256 25% | 298 12% | 343 -1% | ||||
| Last max * (Watt) | 373.2 | 367.2 2% | 378.9 -2% | 323.7 13% | 297.9 20% | 267 28% | 318 15% | 354 5% |
| Witcher 3 ultra * (Watt) | 358 | 273.1 | 178.6 | 228 |
* ... kleinere Werte sind besser
Energieverbrauch Cyberpunk/Stresstest
Energieverbrauch externer Monitor
Akkulaufzeit
Die Laufzeiten sind kürzer als die, die wir beim Alienware 16 mit knapp zwei Stunden Surfen in der realen Welt gemessen haben, selbst wenn der iGPU-Modus, eine Bildwiederholfrequenz von 60 Hz und das Energieprofil Akku eingestellt sind. Die meisten anderen Gaming-Laptops können trotz ihrer riesigen 18-Zoll-Bildschirme viel längere Laufzeiten bieten.
Das Aufladen von der leeren bis zur vollen Kapazität dauert mit dem mitgelieferten Netzteil nur knapp zwei Stunden. Das Aufladen über USB-C wird unterstützt, allerdings mit einer viel langsameren Rate.
| Alienware 18 Area-51 Ultra 9 275HX, GeForce RTX 5090 Laptop, 96 Wh | Alienware 16 Area-51 Ultra 9 275HX, GeForce RTX 5080 Laptop, 96 Wh | Alienware m18 R2 i9-14900HX, GeForce RTX 4090 Laptop GPU, 97 Wh | MSI Raider A18 HX A9WIG-080 R9 9955HX3D, GeForce RTX 5080 Laptop, 99 Wh | Razer Blade 18 2024 RZ09-0509 i9-14900HX, GeForce RTX 4090 Laptop GPU, 91.7 Wh | Asus ROG Strix G18 G814JI i7-13650HX, GeForce RTX 4070 Laptop GPU, 90 Wh | Acer Predator Helios 18 PH18-72-98MW i9-14900HX, GeForce RTX 4090 Laptop GPU, 90 Wh | MSI Titan 18 HX AI A2XWJG Ultra 9 285HX, GeForce RTX 5090 Laptop, 99 Wh | |
|---|---|---|---|---|---|---|---|---|
| Akkulaufzeit | 40% | 140% | 5% | 120% | 305% | 60% | 115% | |
| WLAN (h) | 2 | 2.8 40% | 4.8 140% | 2.1 5% | 4.4 120% | 8.1 305% | 3.2 60% | 4.3 115% |
| Idle (h) | 3.1 | 6.6 | 11.7 | |||||
| Last (h) | 1.1 | 1 | 1.2 | 1.1 | 1.5 | |||
| H.264 (h) | 3 | |||||||
| Cyberpunk 2077 ultra 150cd (h) | 1.2 |
Notebookcheck Bewertung
Alienware 18 Area-51
- 01.07.2025 v8
Allen Ngo
 Total Sustainability Score:
 Potential Competitors in Comparison
Bild | Modell / Test | Preis ab | Gewicht | Dicke | Display |
|---|---|---|---|---|---|
1. 86.2%  | Alienware 18 Area-51 Intel Core Ultra 9 275HX ⎘ NVIDIA GeForce RTX 5090 Laptop ⎘ 64 GB RAM | Amazon: 1. 2.099,49 € Alienware 18 Area-51 Gaming ... 2. 1.154,11 € Alienware 18 Area 51 Gaming ... 3. 4.299,00 € Alienware 18 Area-51 Gaming ... Geizhals Suche | 4.2 kg | 24.32 mm | 18.00" 2560x1600 168 PPI IPS |
2. 85.7%  | Alienware 16 Area-51 Intel Core Ultra 9 275HX ⎘ NVIDIA GeForce RTX 5080 Laptop ⎘ 32 GB RAM, 1024 GB SSD | Amazon: 1. 1.215,07 € Alienware 16 Zoll Area-51 Ga... 2. 1.251,08 € Dell Pro 16 PC16255 - AMD Ry... 3. 1.154,11 € Alienware 18 Area 51 Gaming ... Geizhals Suche | 3.3 kg | 28.5 mm | 16.00" 2560x1600 189 PPI IPS |
3. 89.5% v7 (old)  | Alienware m18 R2 Intel Core i9-14900HX ⎘ NVIDIA GeForce RTX 4090 Laptop GPU ⎘ 32 GB RAM, 2048 GB SSD | Amazon: 1. 1.906,11 € Alienware m18 R2 Gaming Lapt... 2. 1.899,00 € Alienware m16 R2 Gaming Lapt... 3. 985,66 € Alienware m16 Gaming Laptop ... Listenpreis: 3300 USD | 4 kg | 26.7 mm | 18.00" 2560x1600 168 PPI IPS |
4. 85.1%  | MSI Raider A18 HX A9WIG-080 AMD Ryzen 9 9955HX3D ⎘ NVIDIA GeForce RTX 5080 Laptop ⎘ 64 GB RAM, 2048 GB SSD | Amazon: Geizhals Suche | 3.6 kg | 34 mm | 18.00" 3840x2400 252 PPI MiniLED IPS |
5. 90.5% v7 (old)  | Razer Blade 18 2024 RZ09-0509 Intel Core i9-14900HX ⎘ NVIDIA GeForce RTX 4090 Laptop GPU ⎘ 32 GB RAM | Amazon: Geizhals Suche | 3.1 kg | 21.9 mm | 18.00" 2560x1600 168 PPI Mini-LED |
6. 87.4% v7 (old)  | Asus ROG Strix G18 G814JI Intel Core i7-13650HX ⎘ NVIDIA GeForce RTX 4070 Laptop GPU ⎘ 32 GB RAM, 1024 GB SSD | Amazon: 1. 2.061,49 € ASUS ROG Strix G18 G814JI-N6... 2. 1.927,18 € ASUS ROG Strix G18 G814JI-N6... 3. 3.939,53 € ASUS ROG Strix G18 G815LW La... Listenpreis: 2699 EUR | 3 kg | 31 mm | 18.00" 2560x1600 168 PPI IPS |
7. 87.1% v7 (old)  | Acer Predator Helios 18 PH18-72-98MW Intel Core i9-14900HX ⎘ NVIDIA GeForce RTX 4090 Laptop GPU ⎘ 32 GB RAM, 2048 GB SSD | Amazon: 1. 2.749,00 € Acer Predator Helios Neo 18 ... 2. 2.565,11 € Acer Predator Helios 18 (PH1... 3. 2.949,00 € Acer Predator Helios Neo 18 ... | 3.3 kg | 29.5 mm | 18.00" 2560x1600 168 PPI Mini-LED |
Transparenz
Die Auswahl der zu testenden Geräte erfolgt innerhalb der Redaktion. Das vorliegende Testmuster wurde dem Autor vom Hersteller oder einem Shop zu Testzwecken leihweise zur Verfügung gestellt. Eine Einflussnahme des Leihstellers auf den Testbericht gab es nicht, der Hersteller erhielt keine Version des Reviews vor der Veröffentlichung. Es bestand keine Verpflichtung zur Publikation. Als eigenständiges, unabhängiges Unternehmen unterliegt Notebookcheck keiner Diktion von Herstellern, Shops und Verlagen.
So testet Notebookcheck
Pro Jahr werden von Notebookcheck hunderte Laptops und Smartphones unabhängig in von uns standardisierten technischen Verfahren getestet, um eine Vergleichbarkeit aller Testergebnisse zu gewährleisten. Seit rund 20 Jahren entwickeln wir diese Testmethoden kontinuierlich weiter und setzen damit Branchenstandards. In unseren Testlaboren kommt ausschließlich hochwertiges Messequipment in die Hände erfahrener Techniker und Redakteure. Die Tests unterliegen einer mehrstufigen Kontrolle. Unsere komplexe Gesamtbewertung basiert auf hunderten fundierten Messergebnissen und Benchmarks, womit Ihnen Objektivität garantiert ist. Weitere Informationen zu unseren Testmethoden gibt es hier.

