Fazit - Apex 16 Max mit voller Gaming-Leistung und wenig Kompromissen
Das Apex 16 Max konzentriert sich mit den schnellen Komponenten voll auf die Gaming-Performance und liefert hier auch überzeugende Ergebnisse. Zusammen mit dem Mini-LED-Panel macht vor allem HDR-Gaming sehr viel Spaß. Allerdings benötigt das helle Display auch sehr viel Strom und beeinflusst die Akkulaufzeiten. Wer mehr Ausdauer benötigt, sollte daher das IPS-Panel nehmen.
Um den Einstiegspreis gering zu halten gibt es zwar einige Kompromisse (kein USB-C 4.0, kein Wi-Fi 7, kein Advanced Optimus, Baseunit aus Kunststoff), doch im Gaming-Alltag ist das ehrlich gesagt kein Problem und wir würden diesen Kompromiss zugunsten der RTX 5070 Ti mit 12 GB VRAM auf jeden Fall eingehen. Alles in allem gibt es hier einen sehr guten Gamer zum fairen Preis.
Pro
Contra
Inhaltsverzeichnis
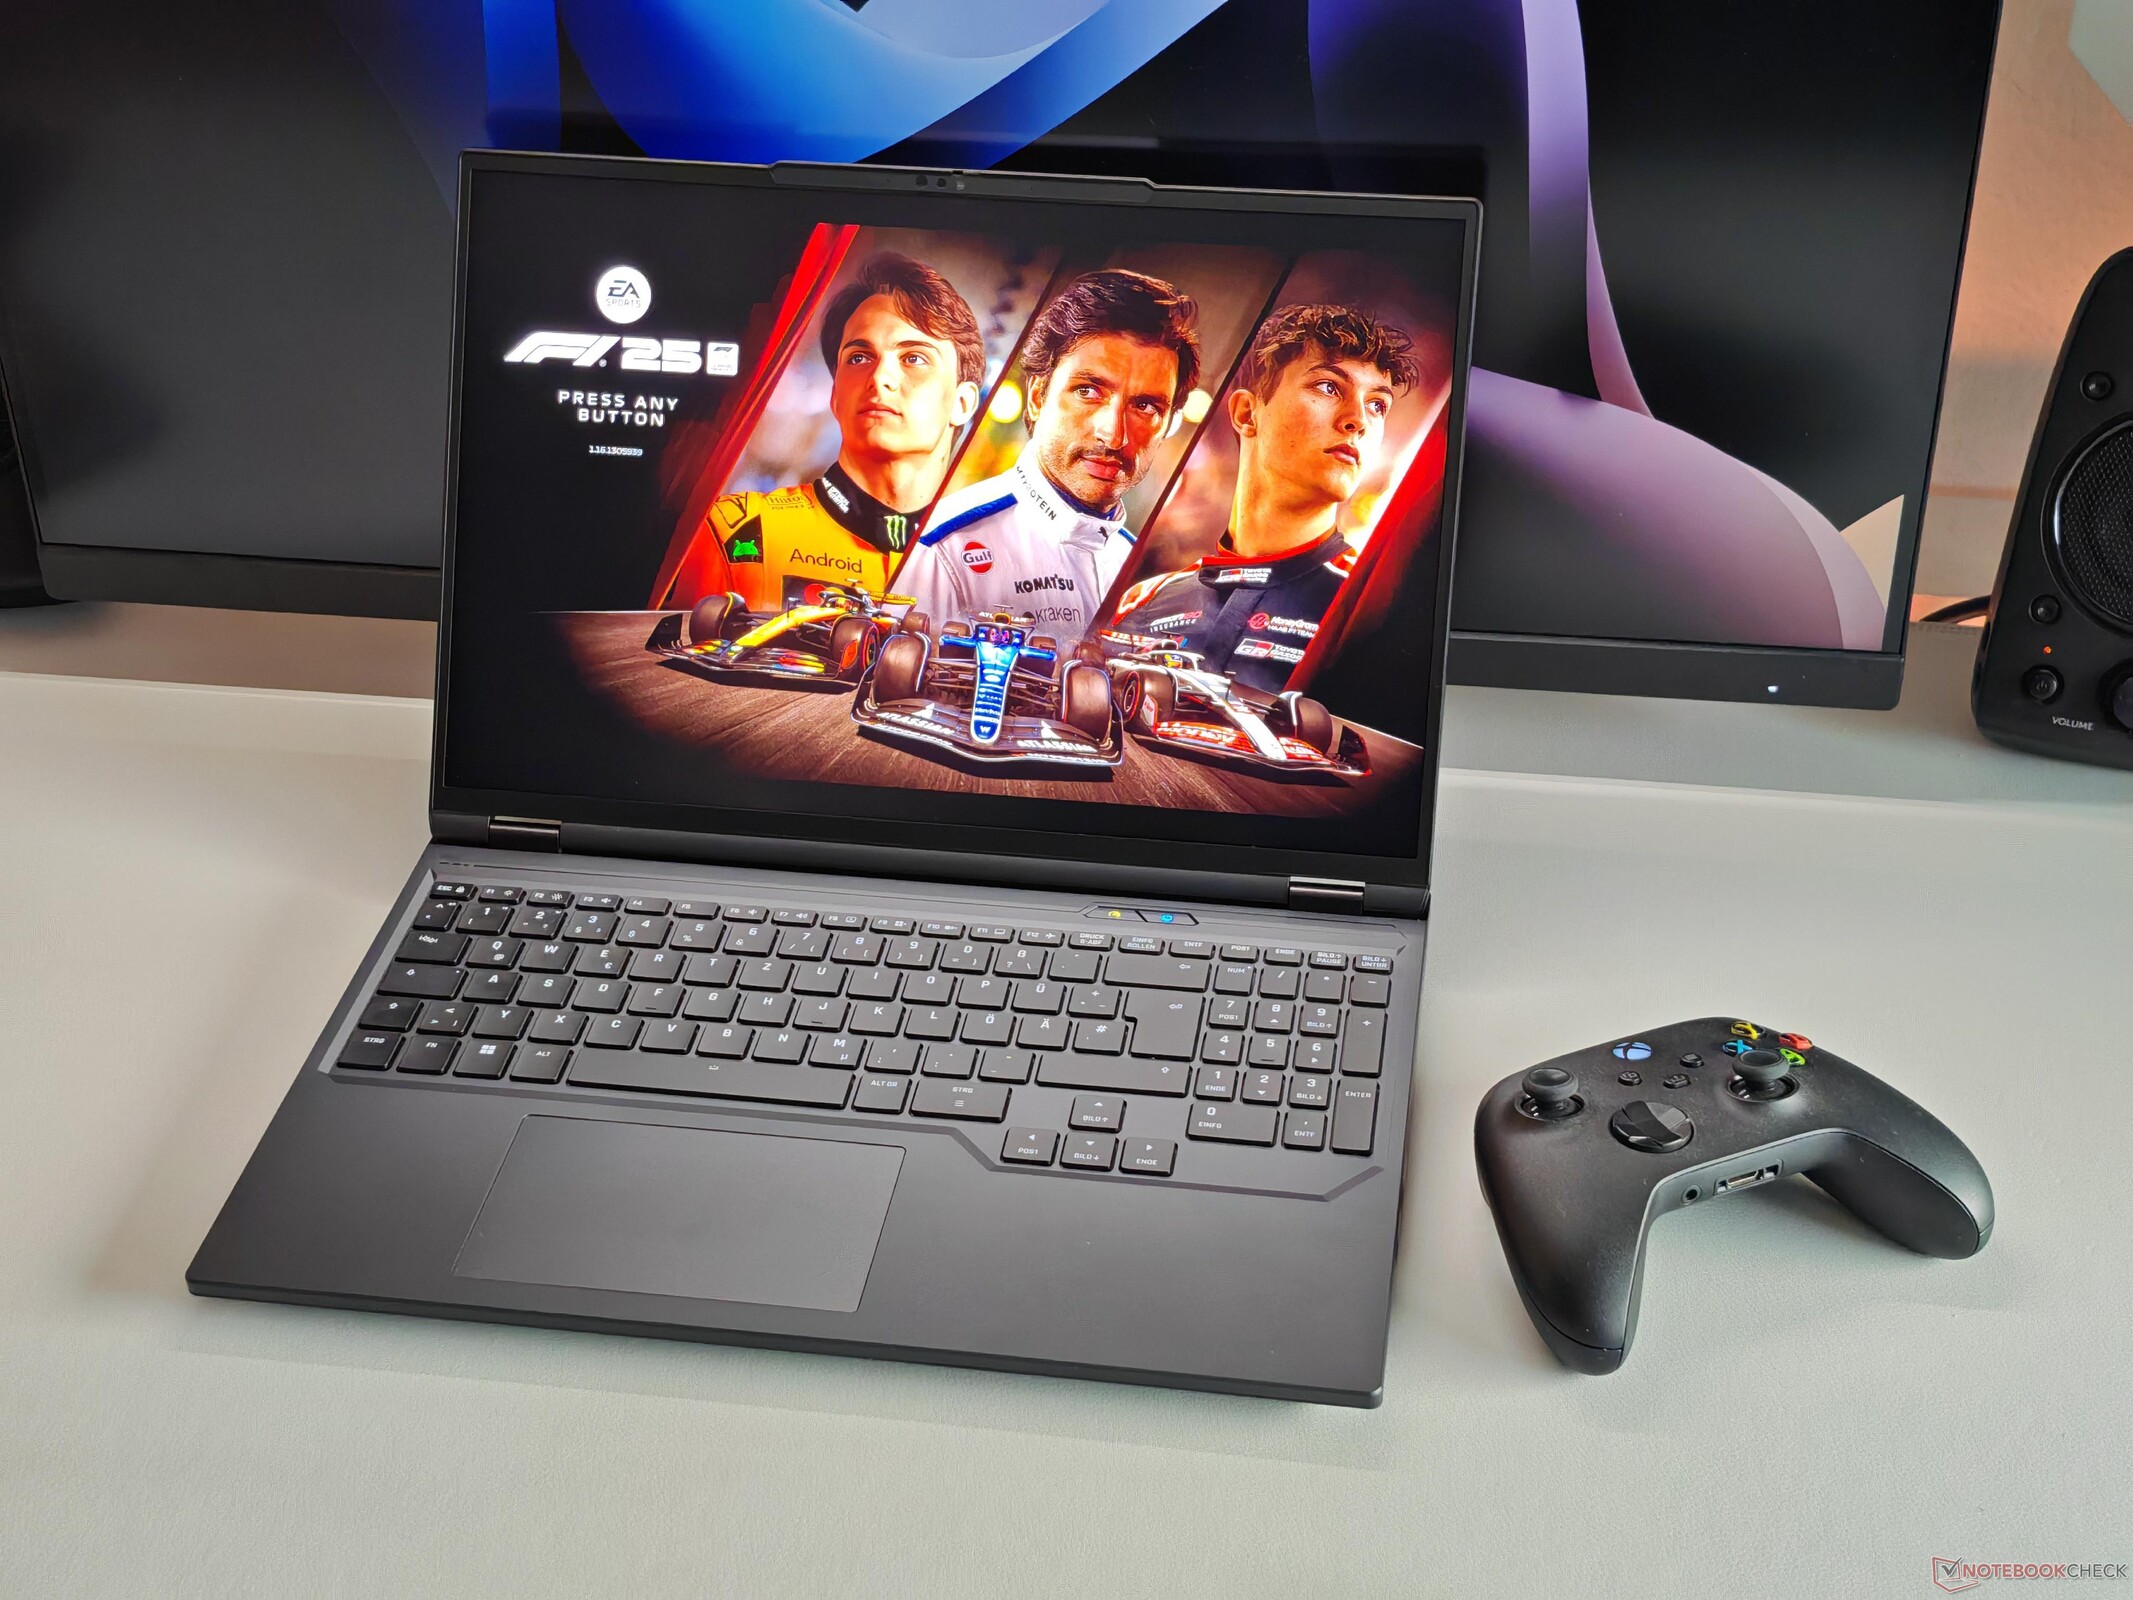
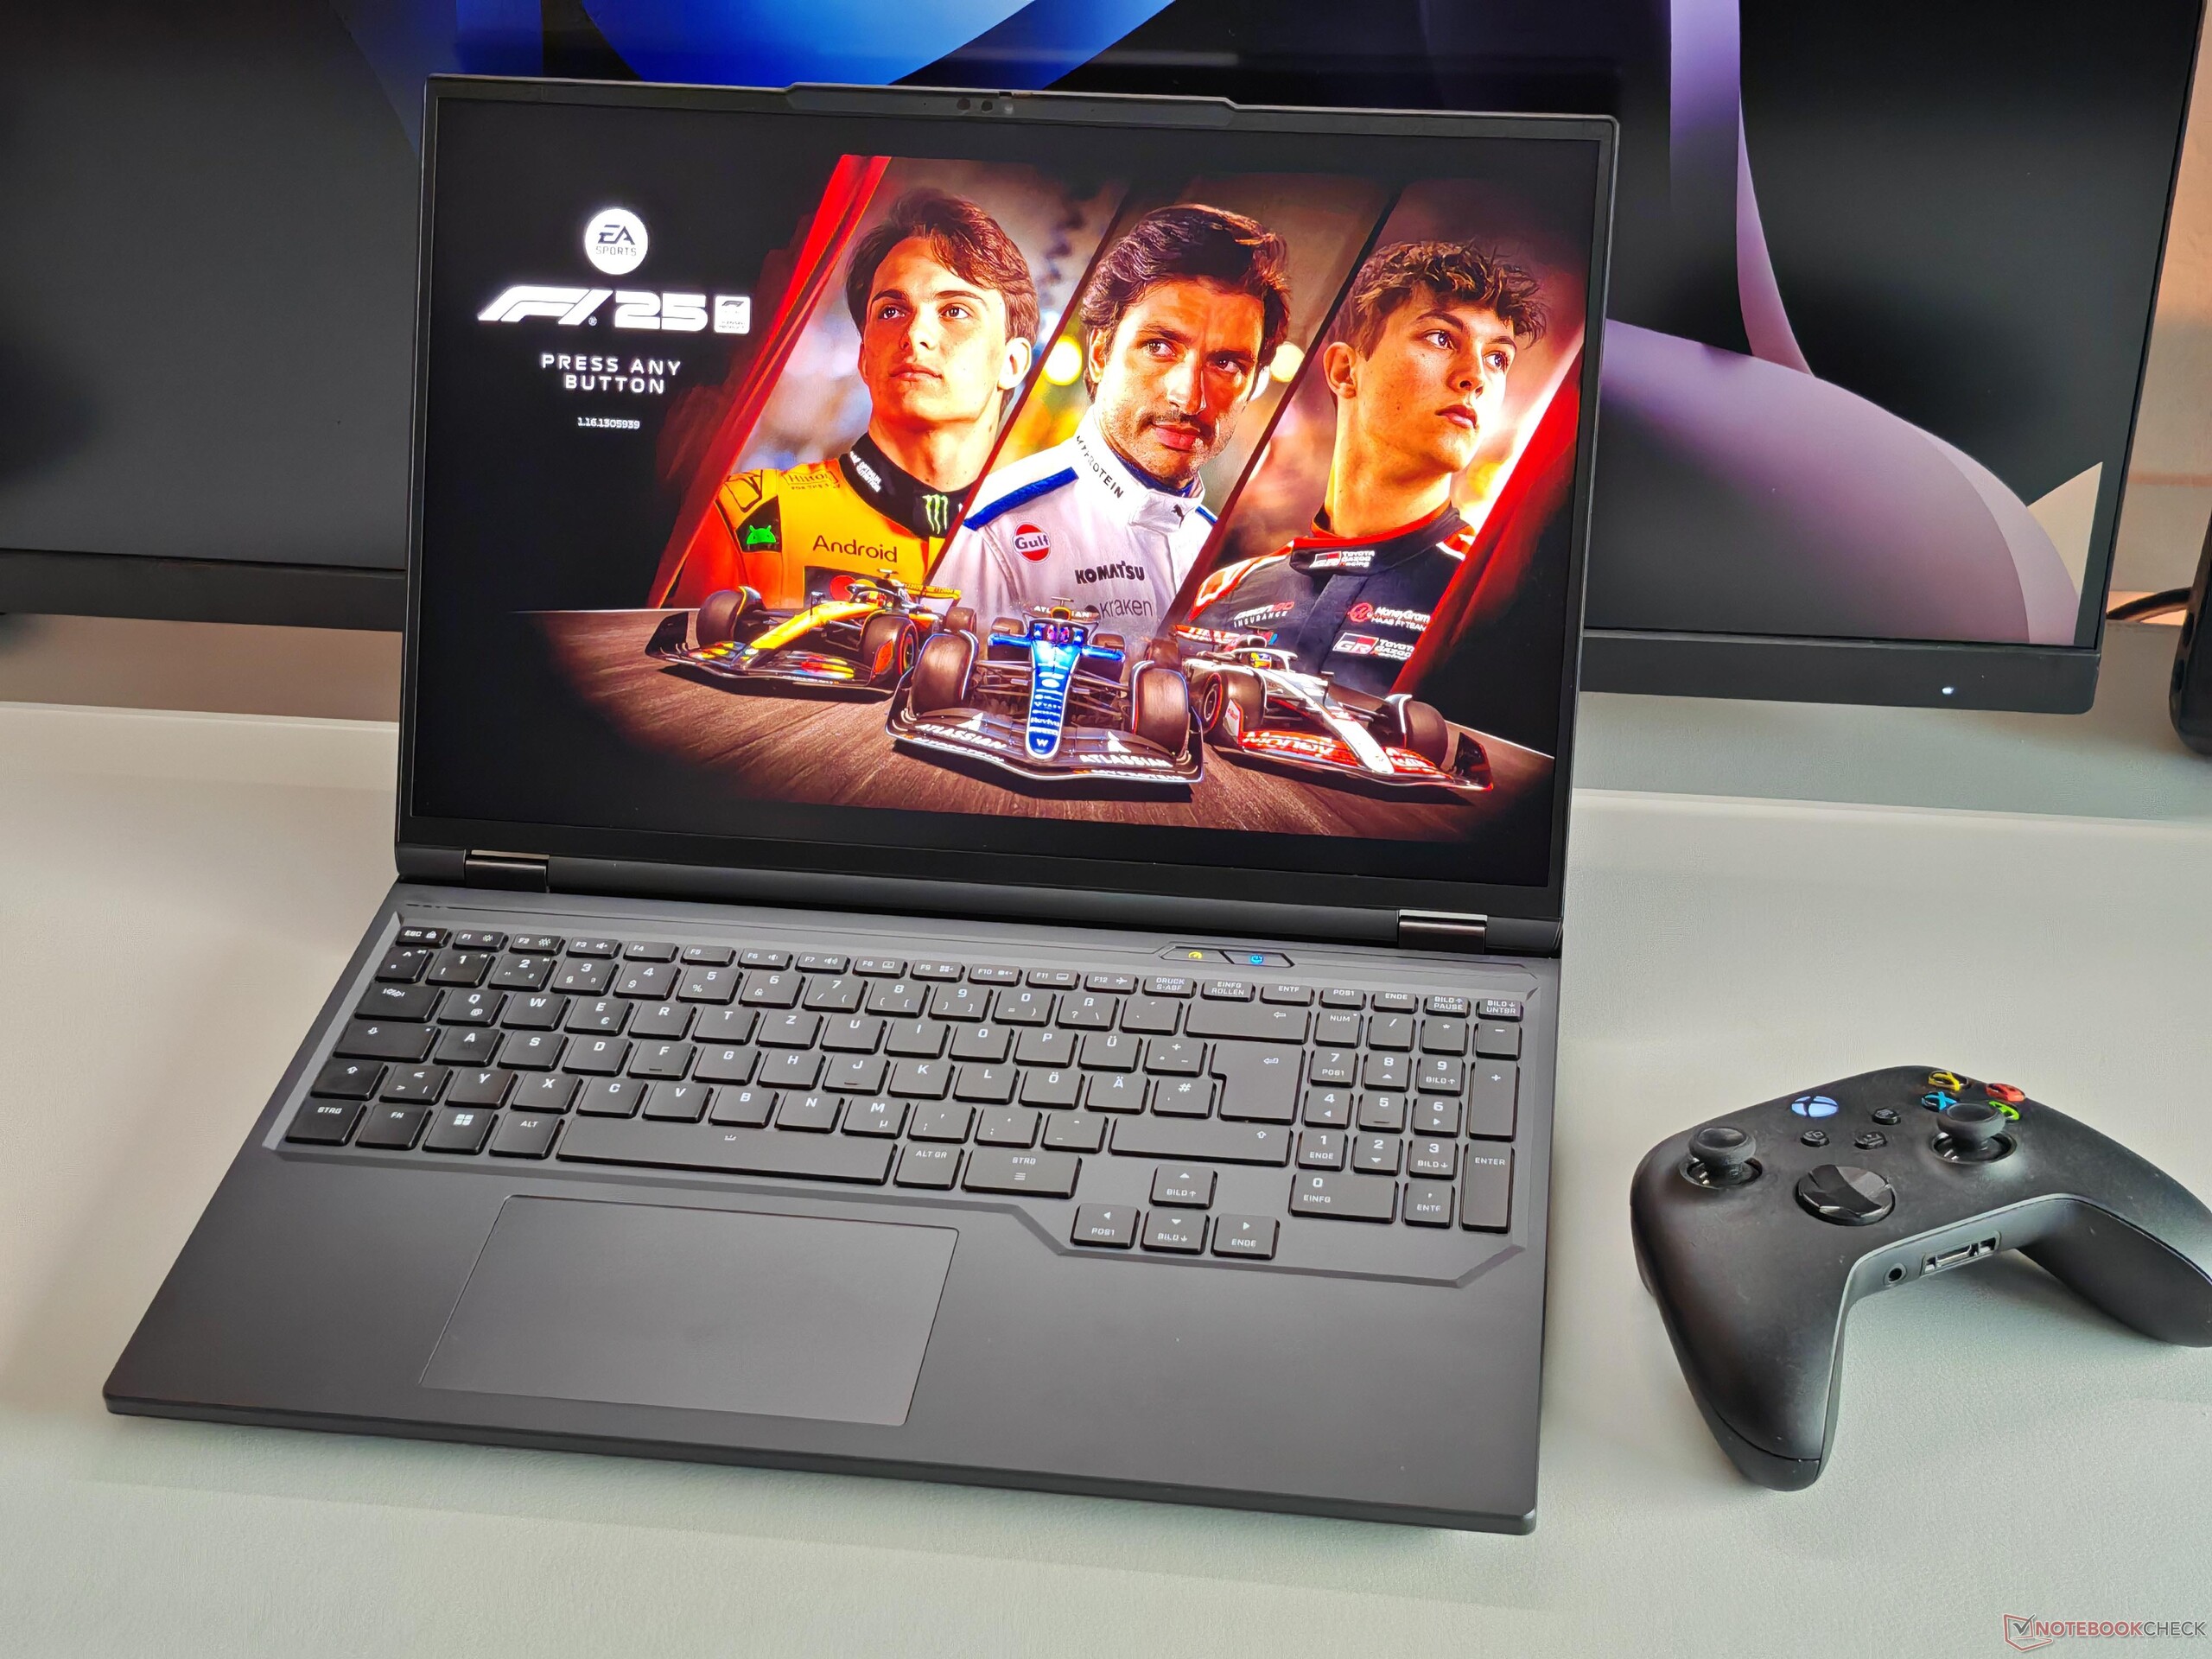
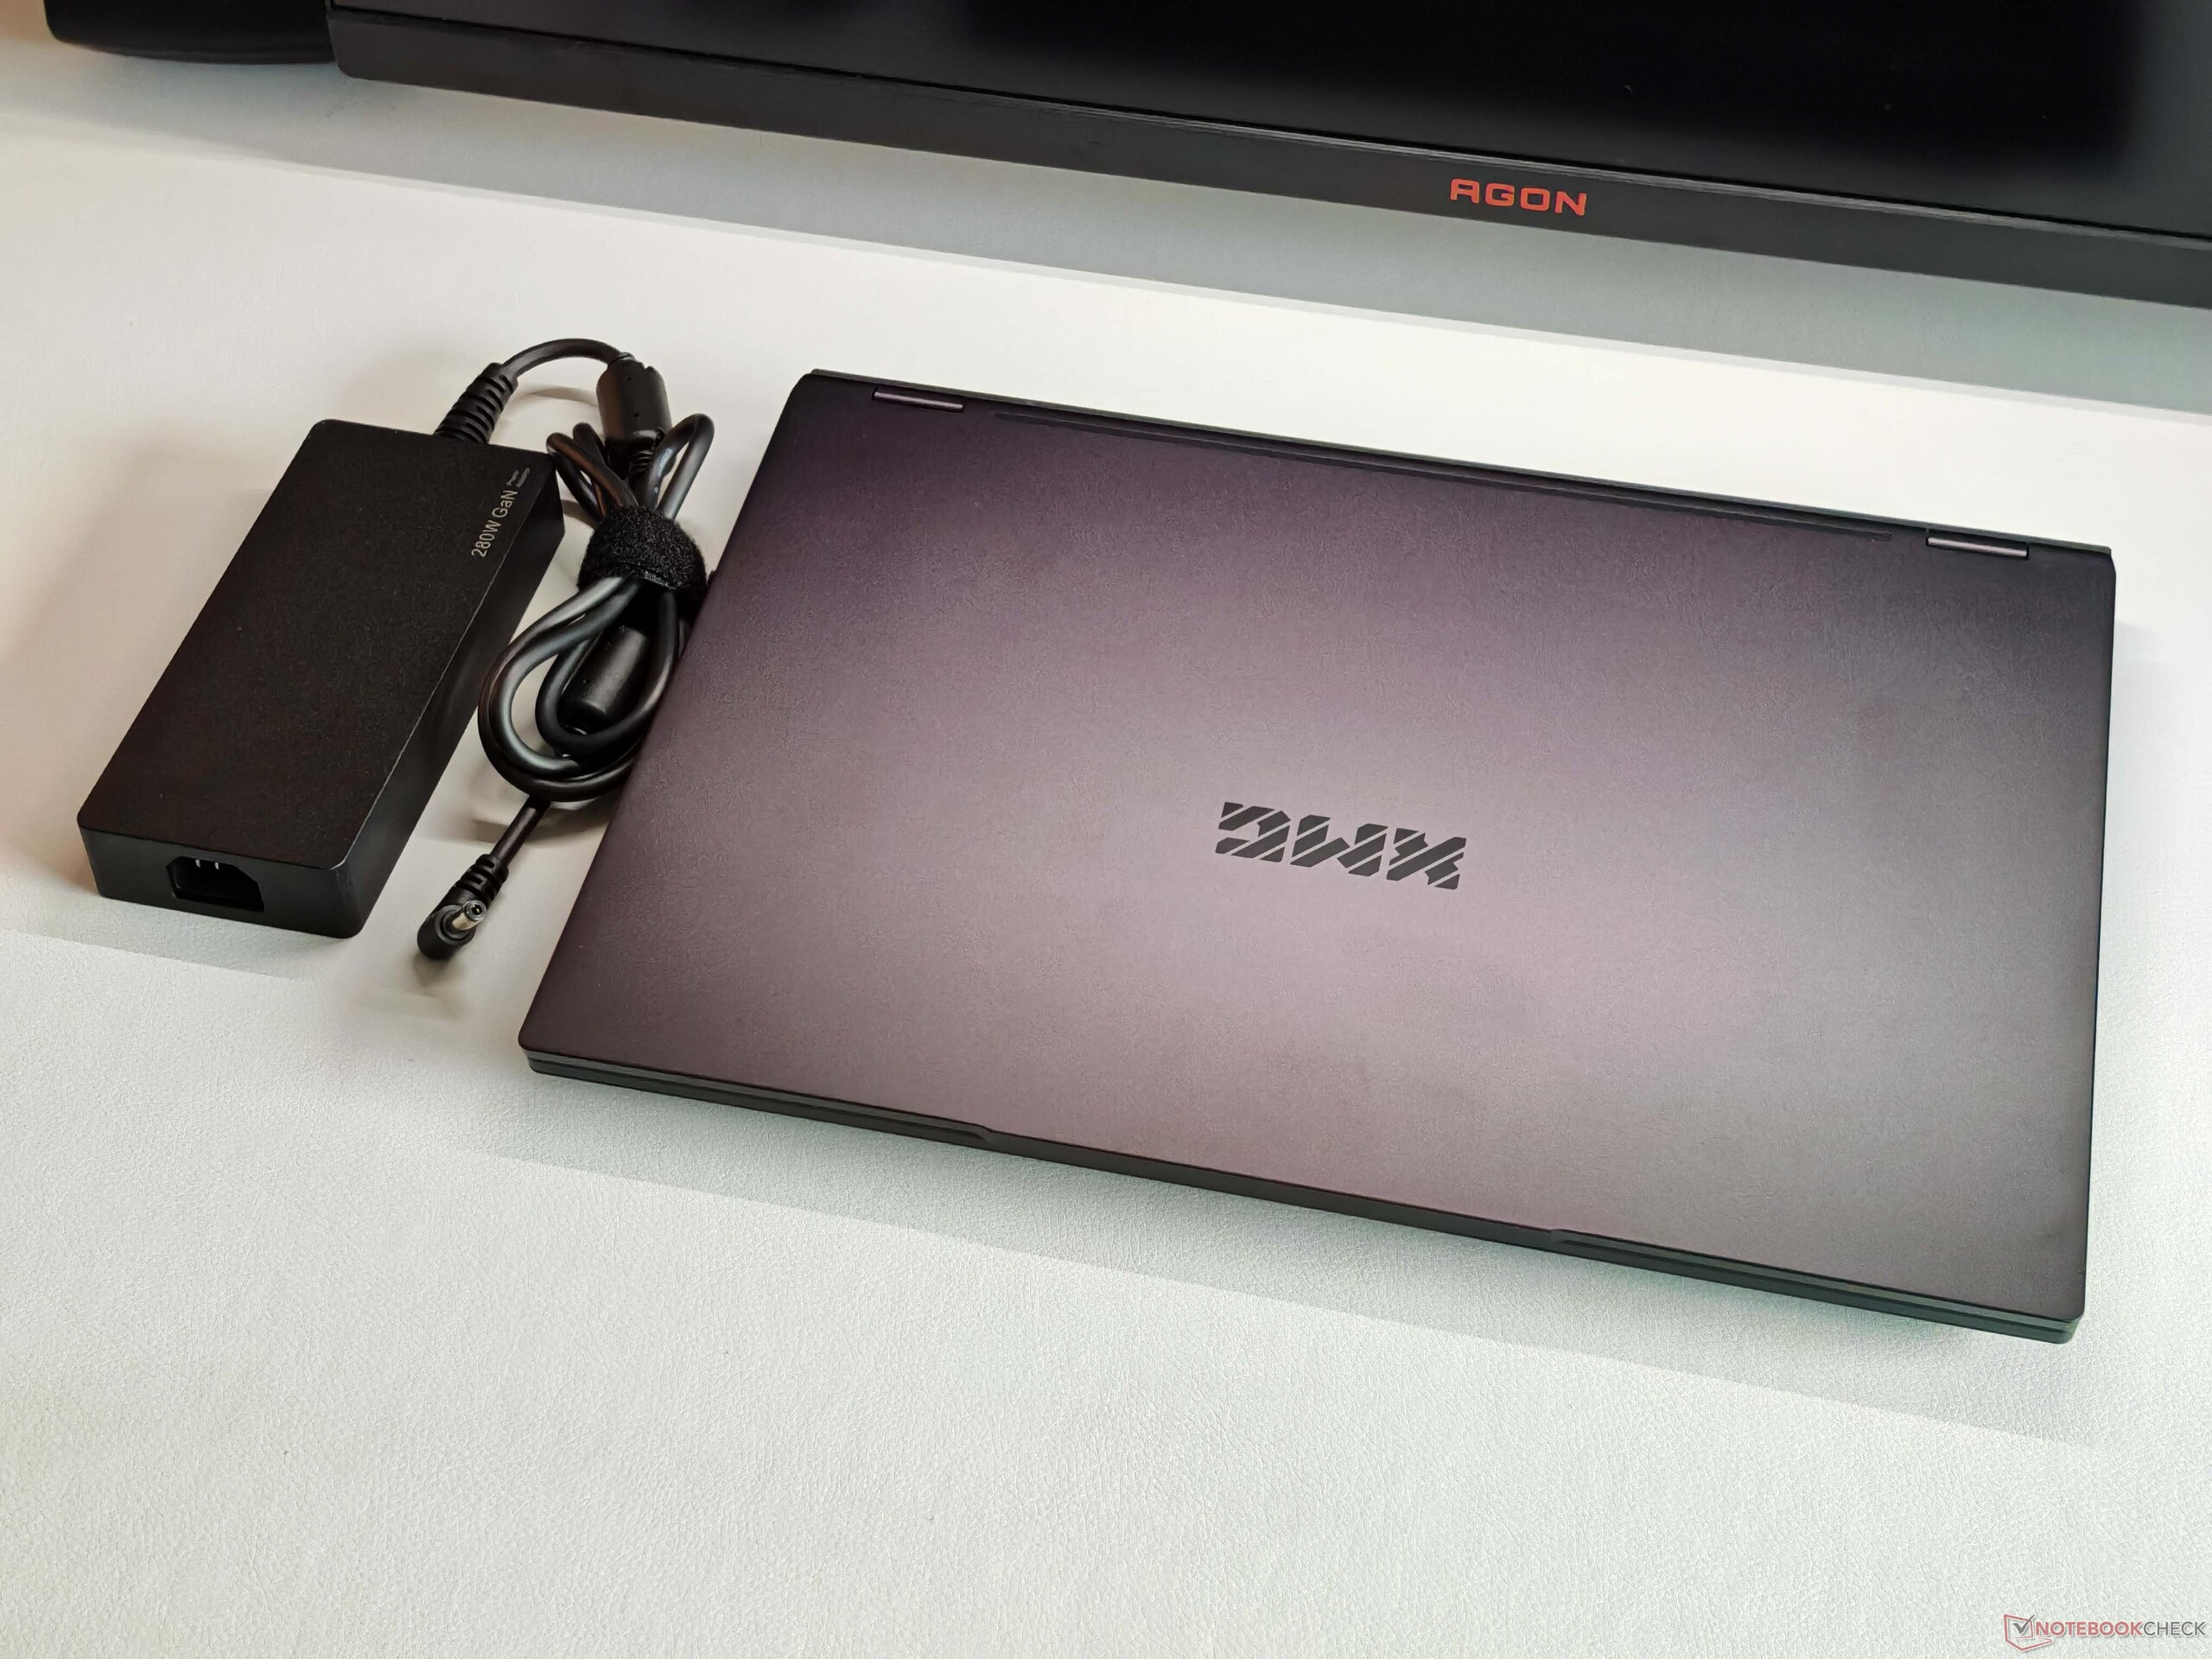
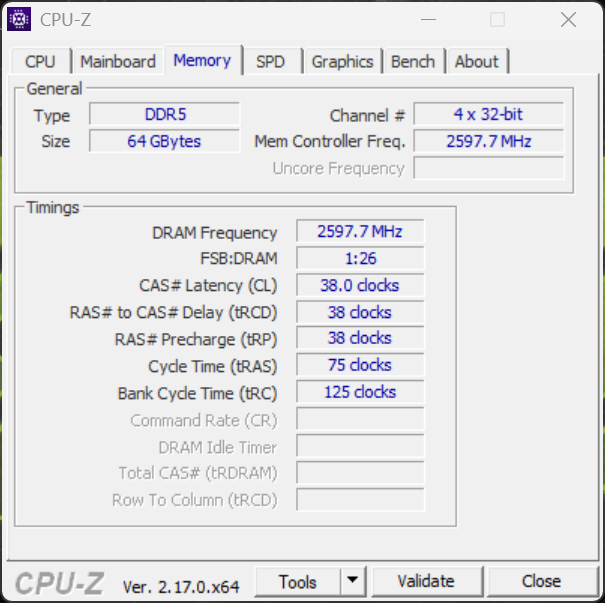
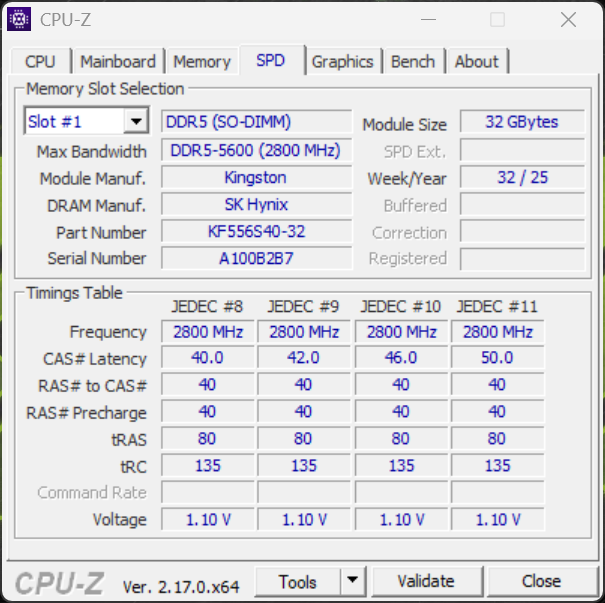
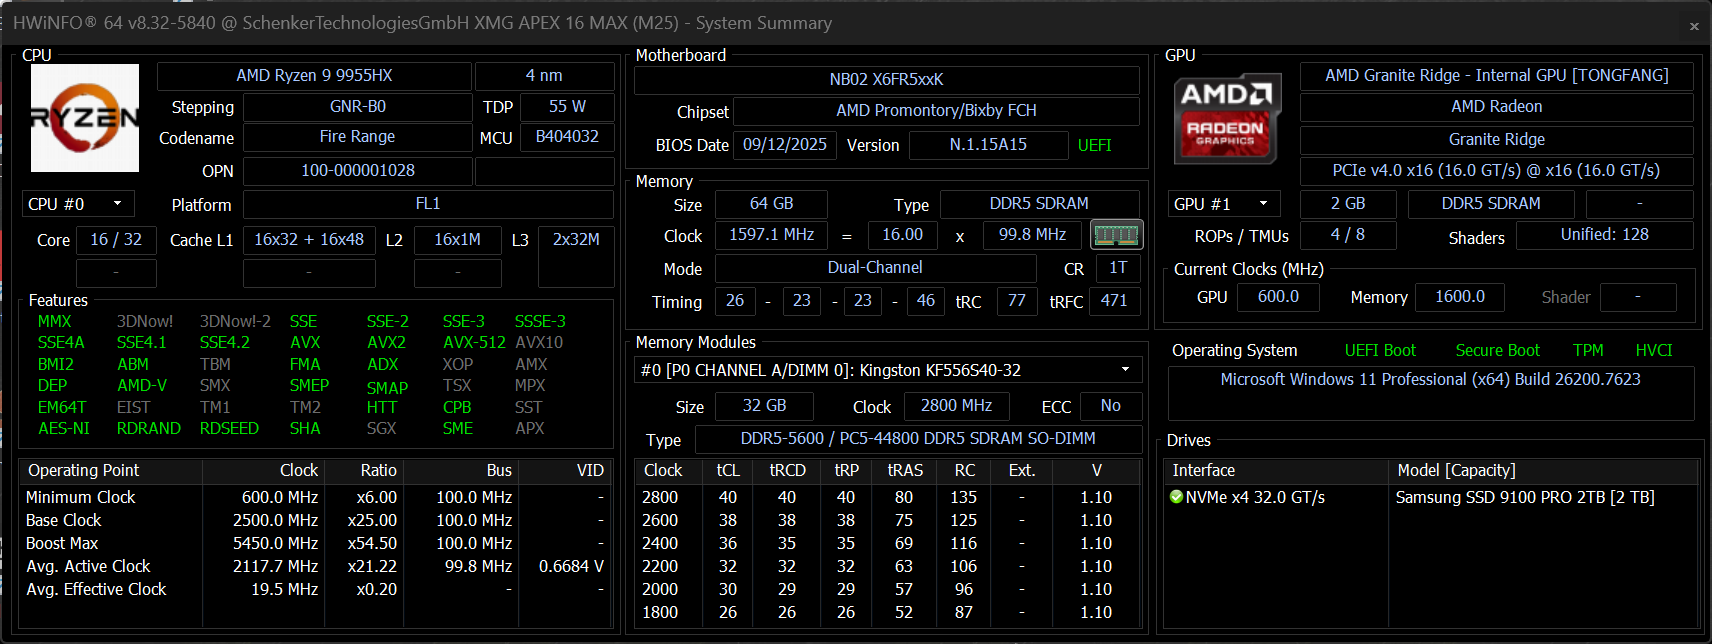
Mit dem Apex 16 Max hat XMG einen leistungsstarken Gaming-Laptop im Angebot, der möglichst preisbewusste Käufer ansprechen soll. Der Startpreis mit IPS-Display und RTX 5070 Ti liegt aktuell bei 2.090 Euro, unser Testgerät kostet vor allem aufgrund der üppigen Speicherausstattung (64 GB RAM, 2 TB SSD) sowie dem Mini-LED-Panel rund 2.800 Euro.
Spezifikationen
Preisvergleich
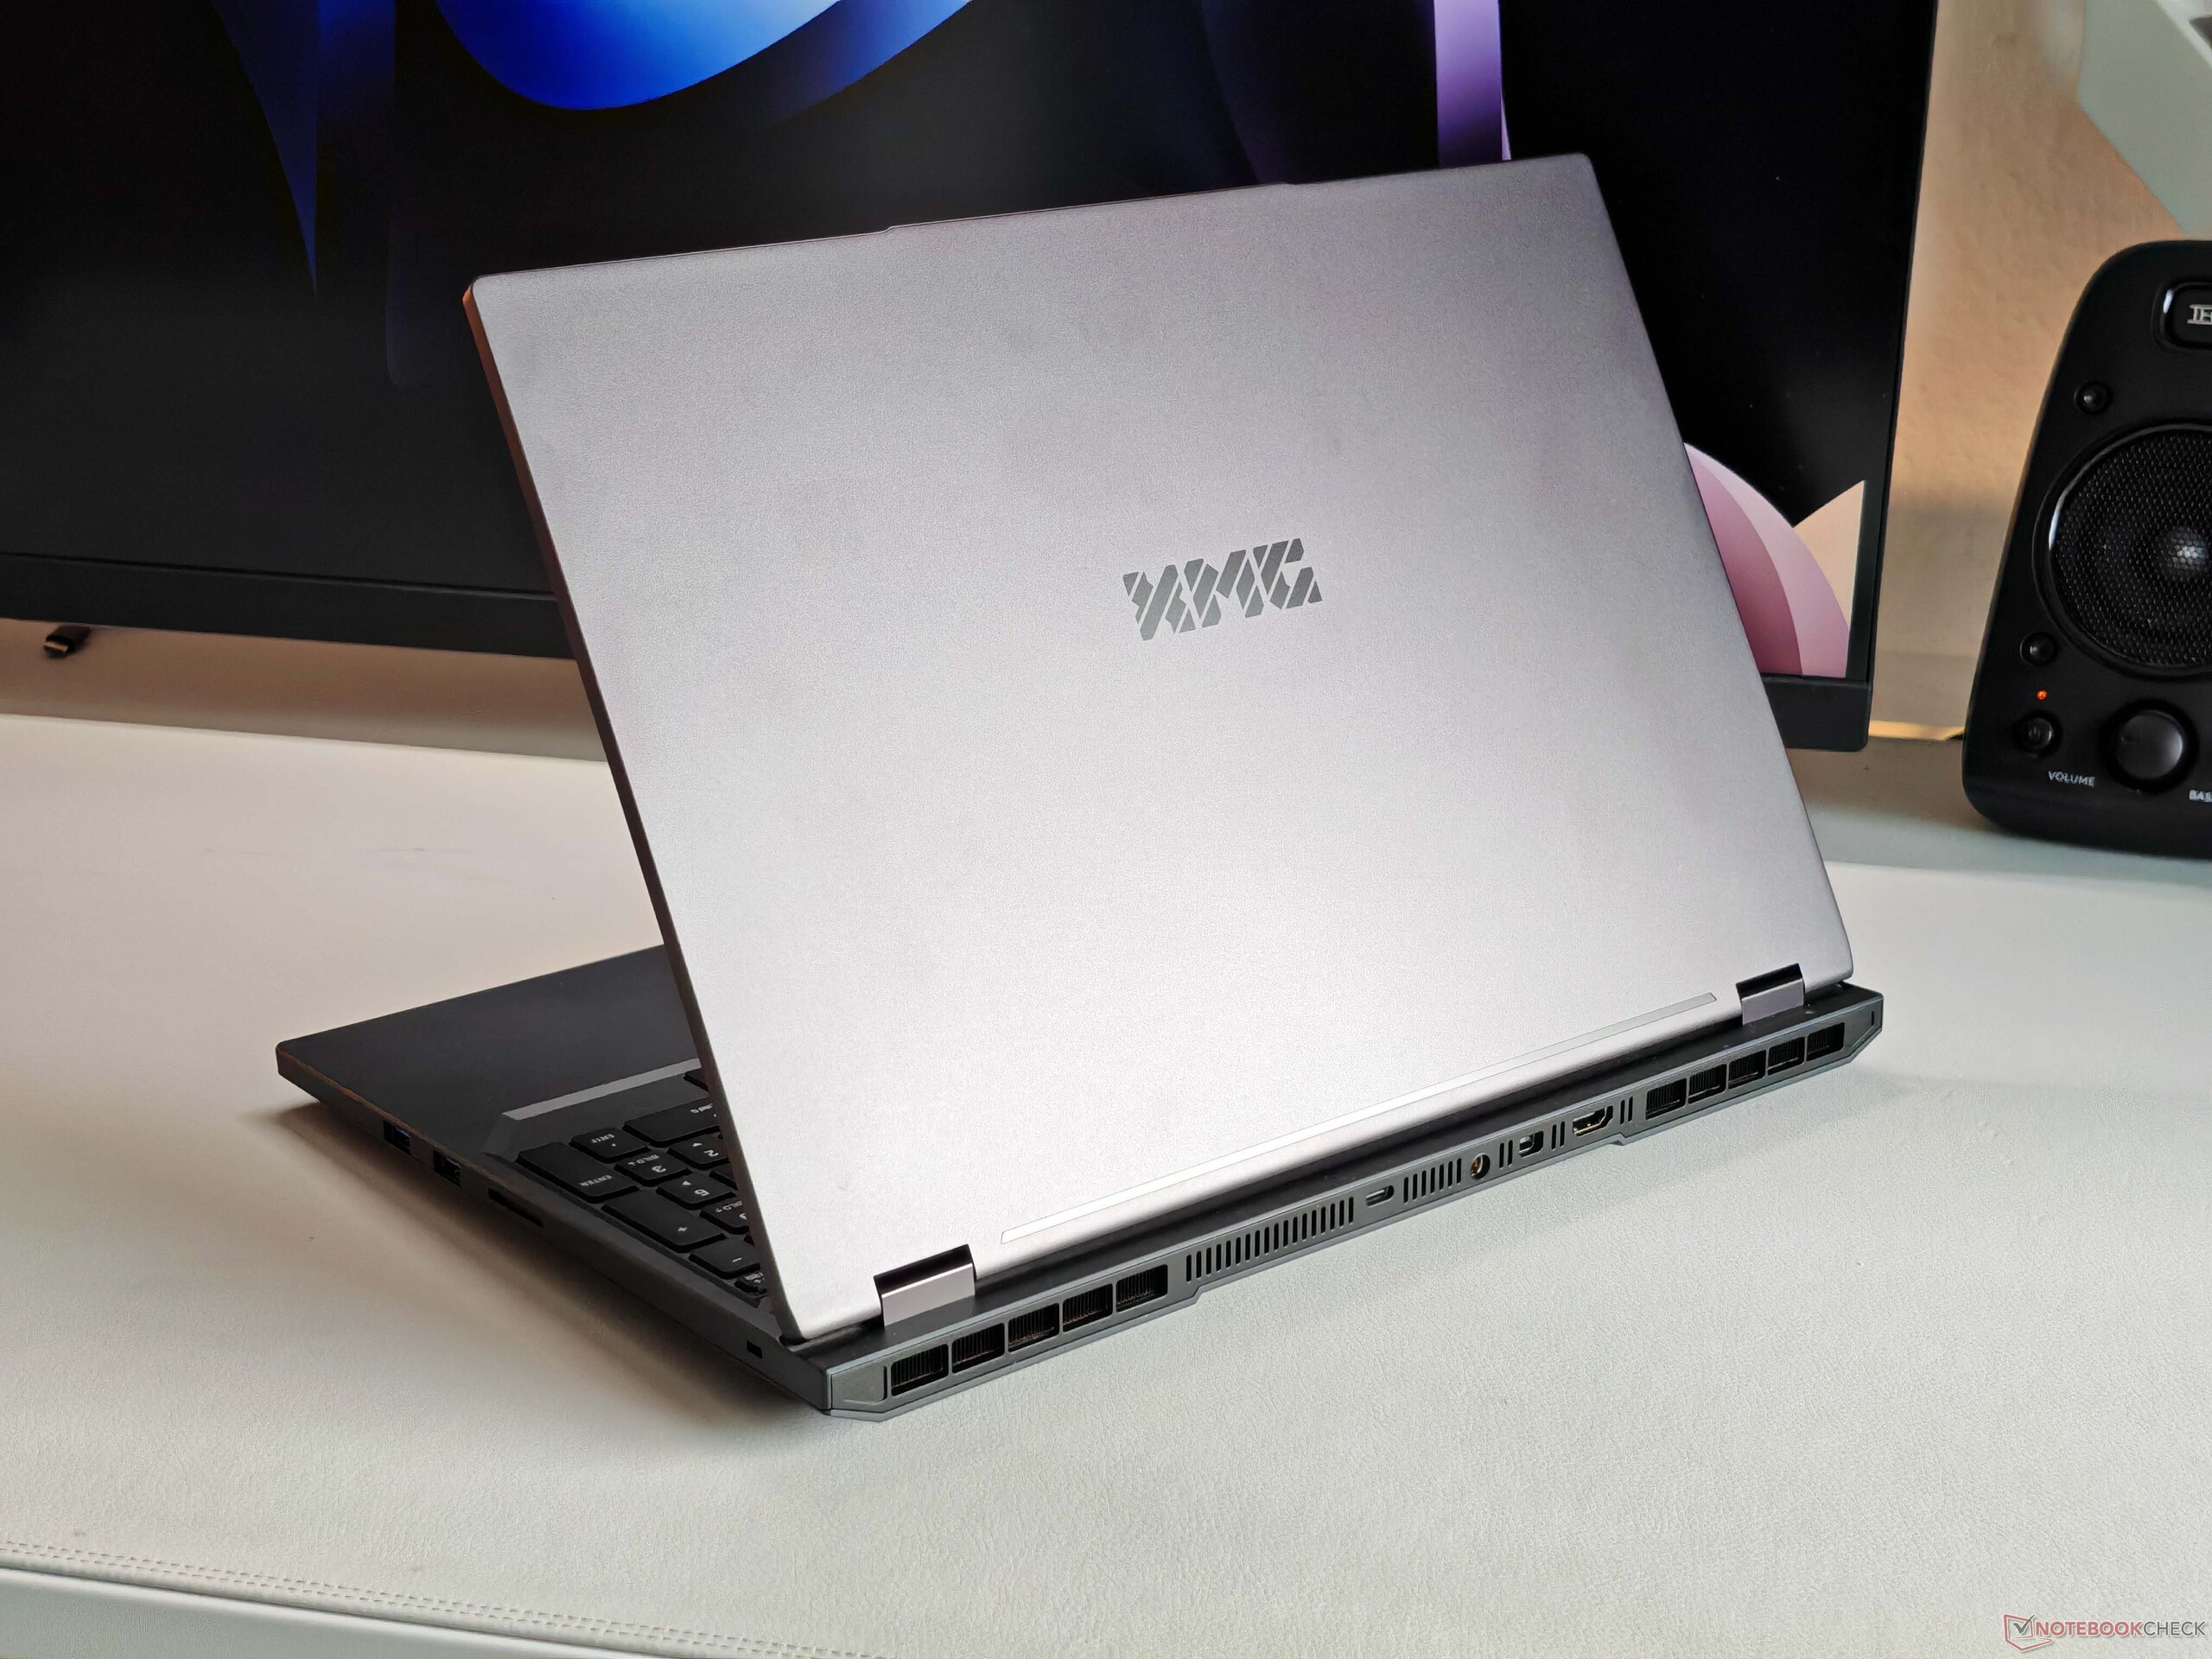
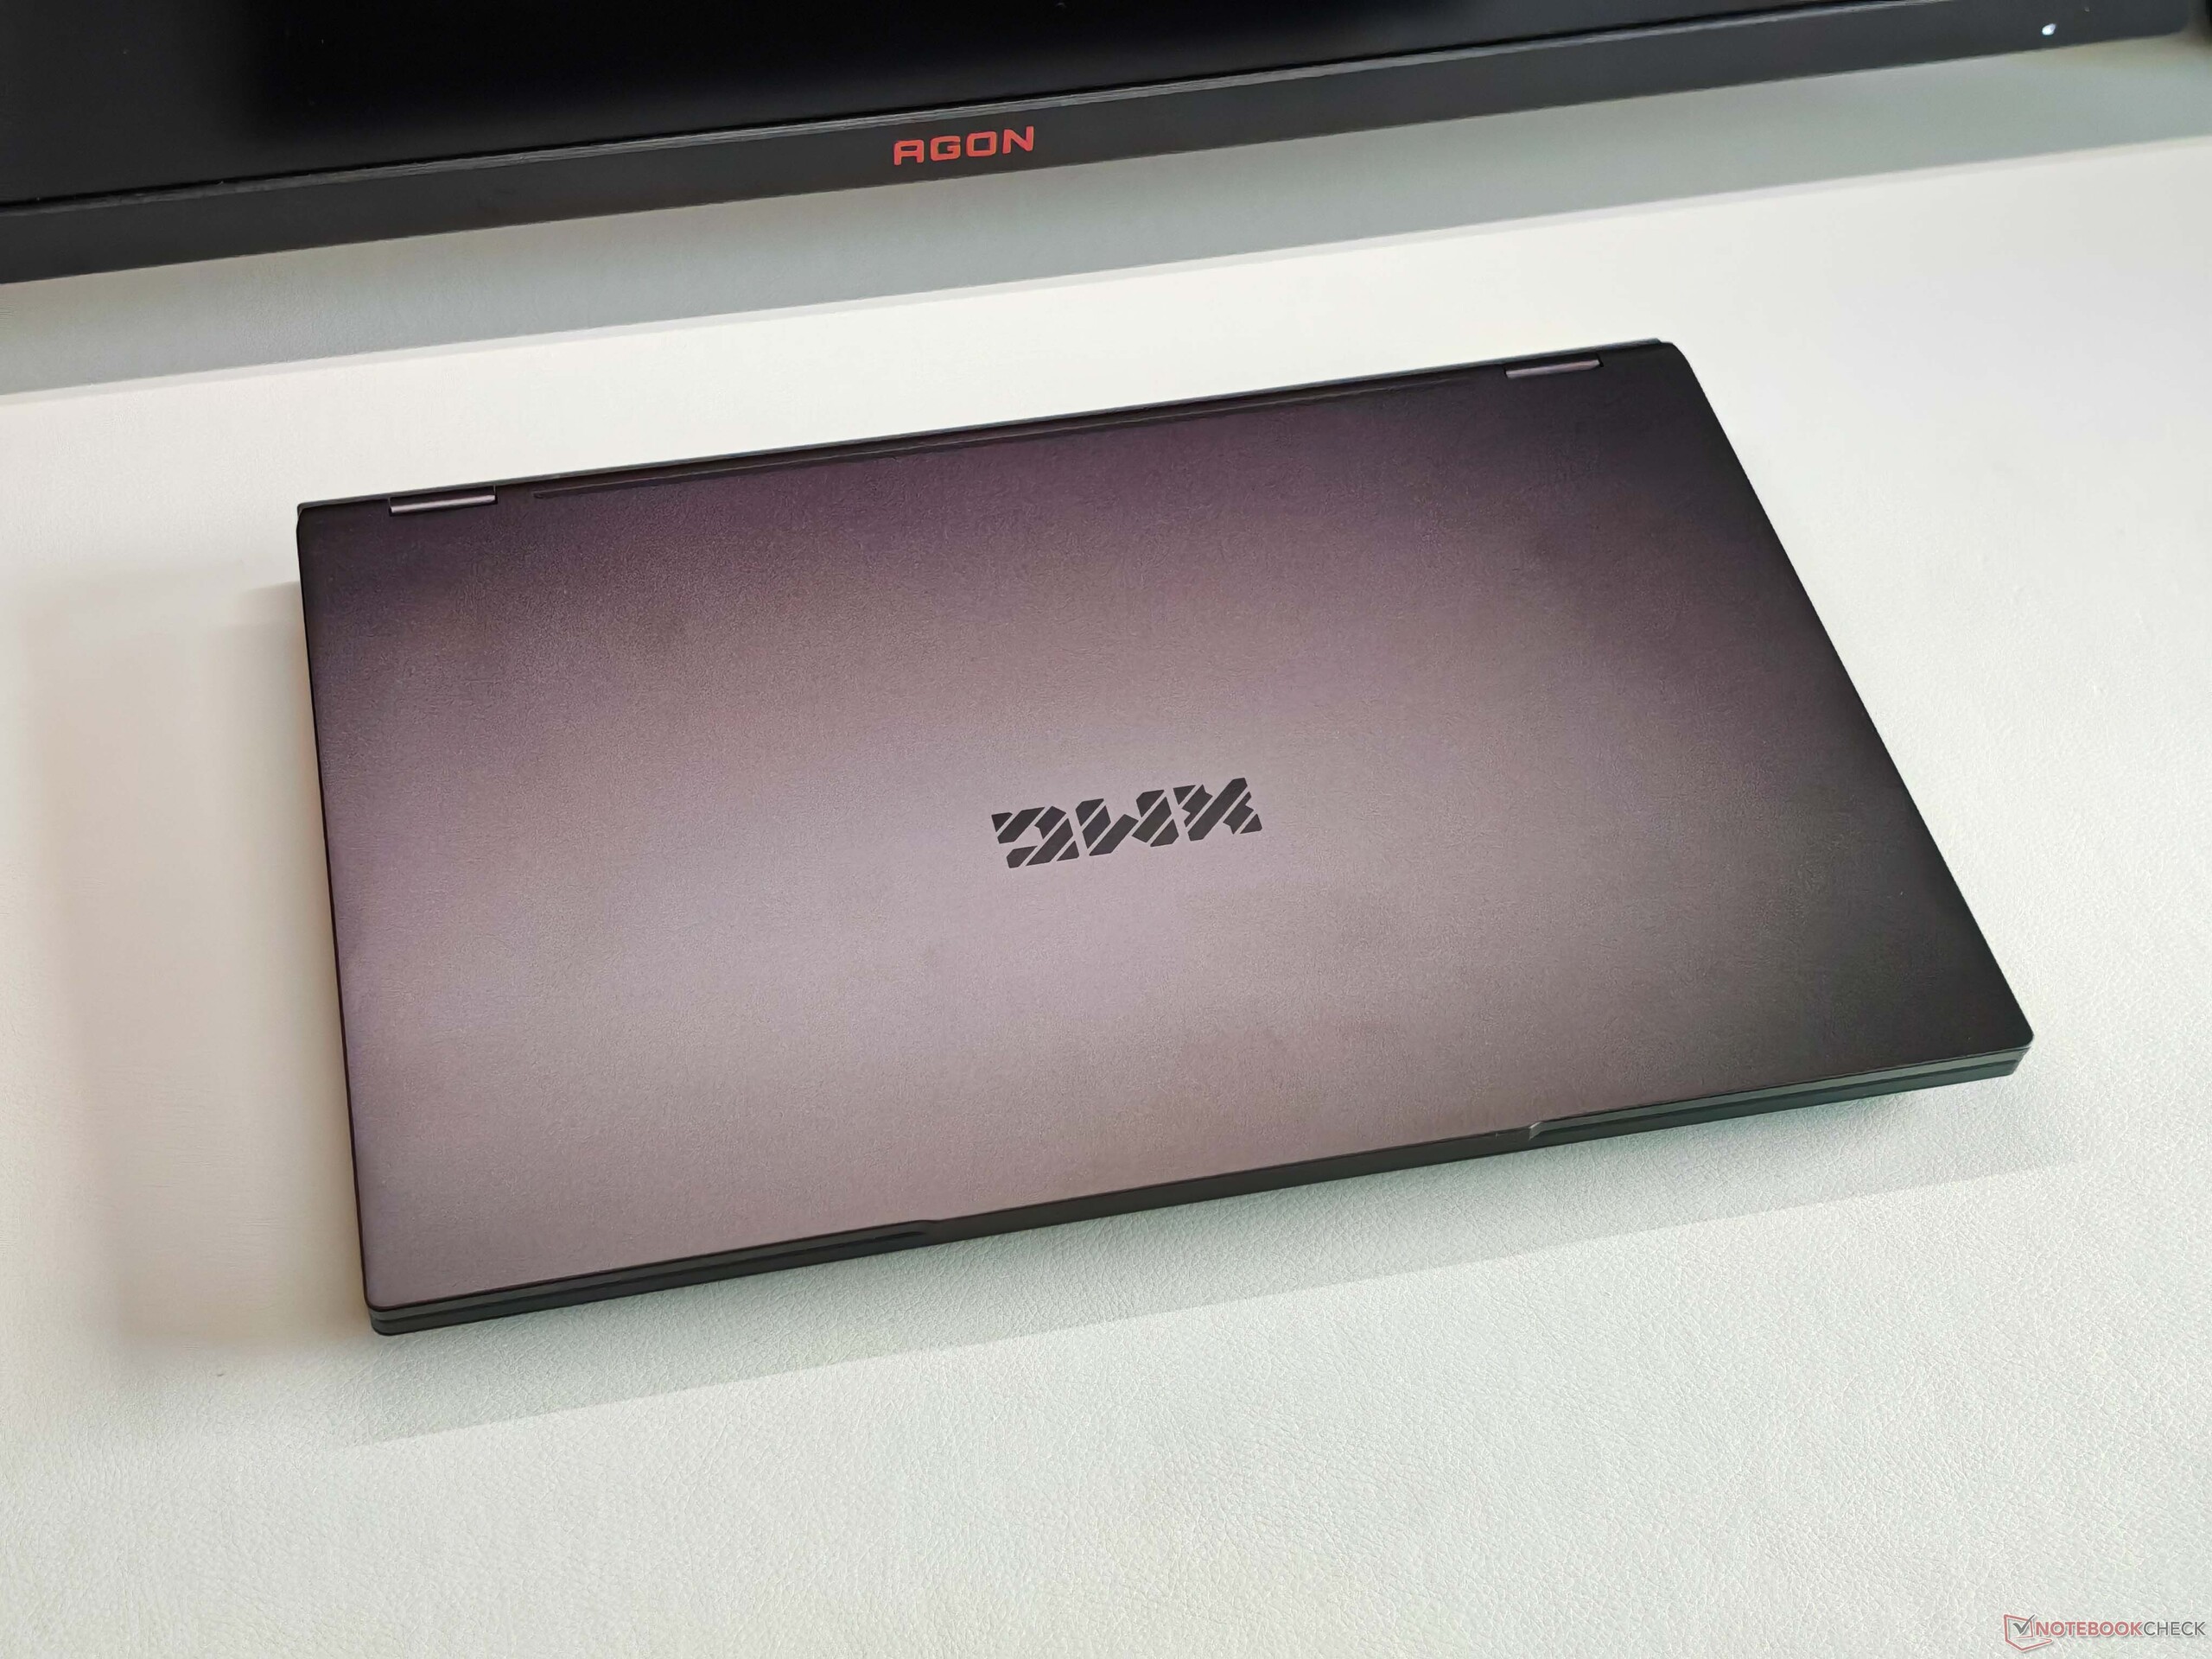
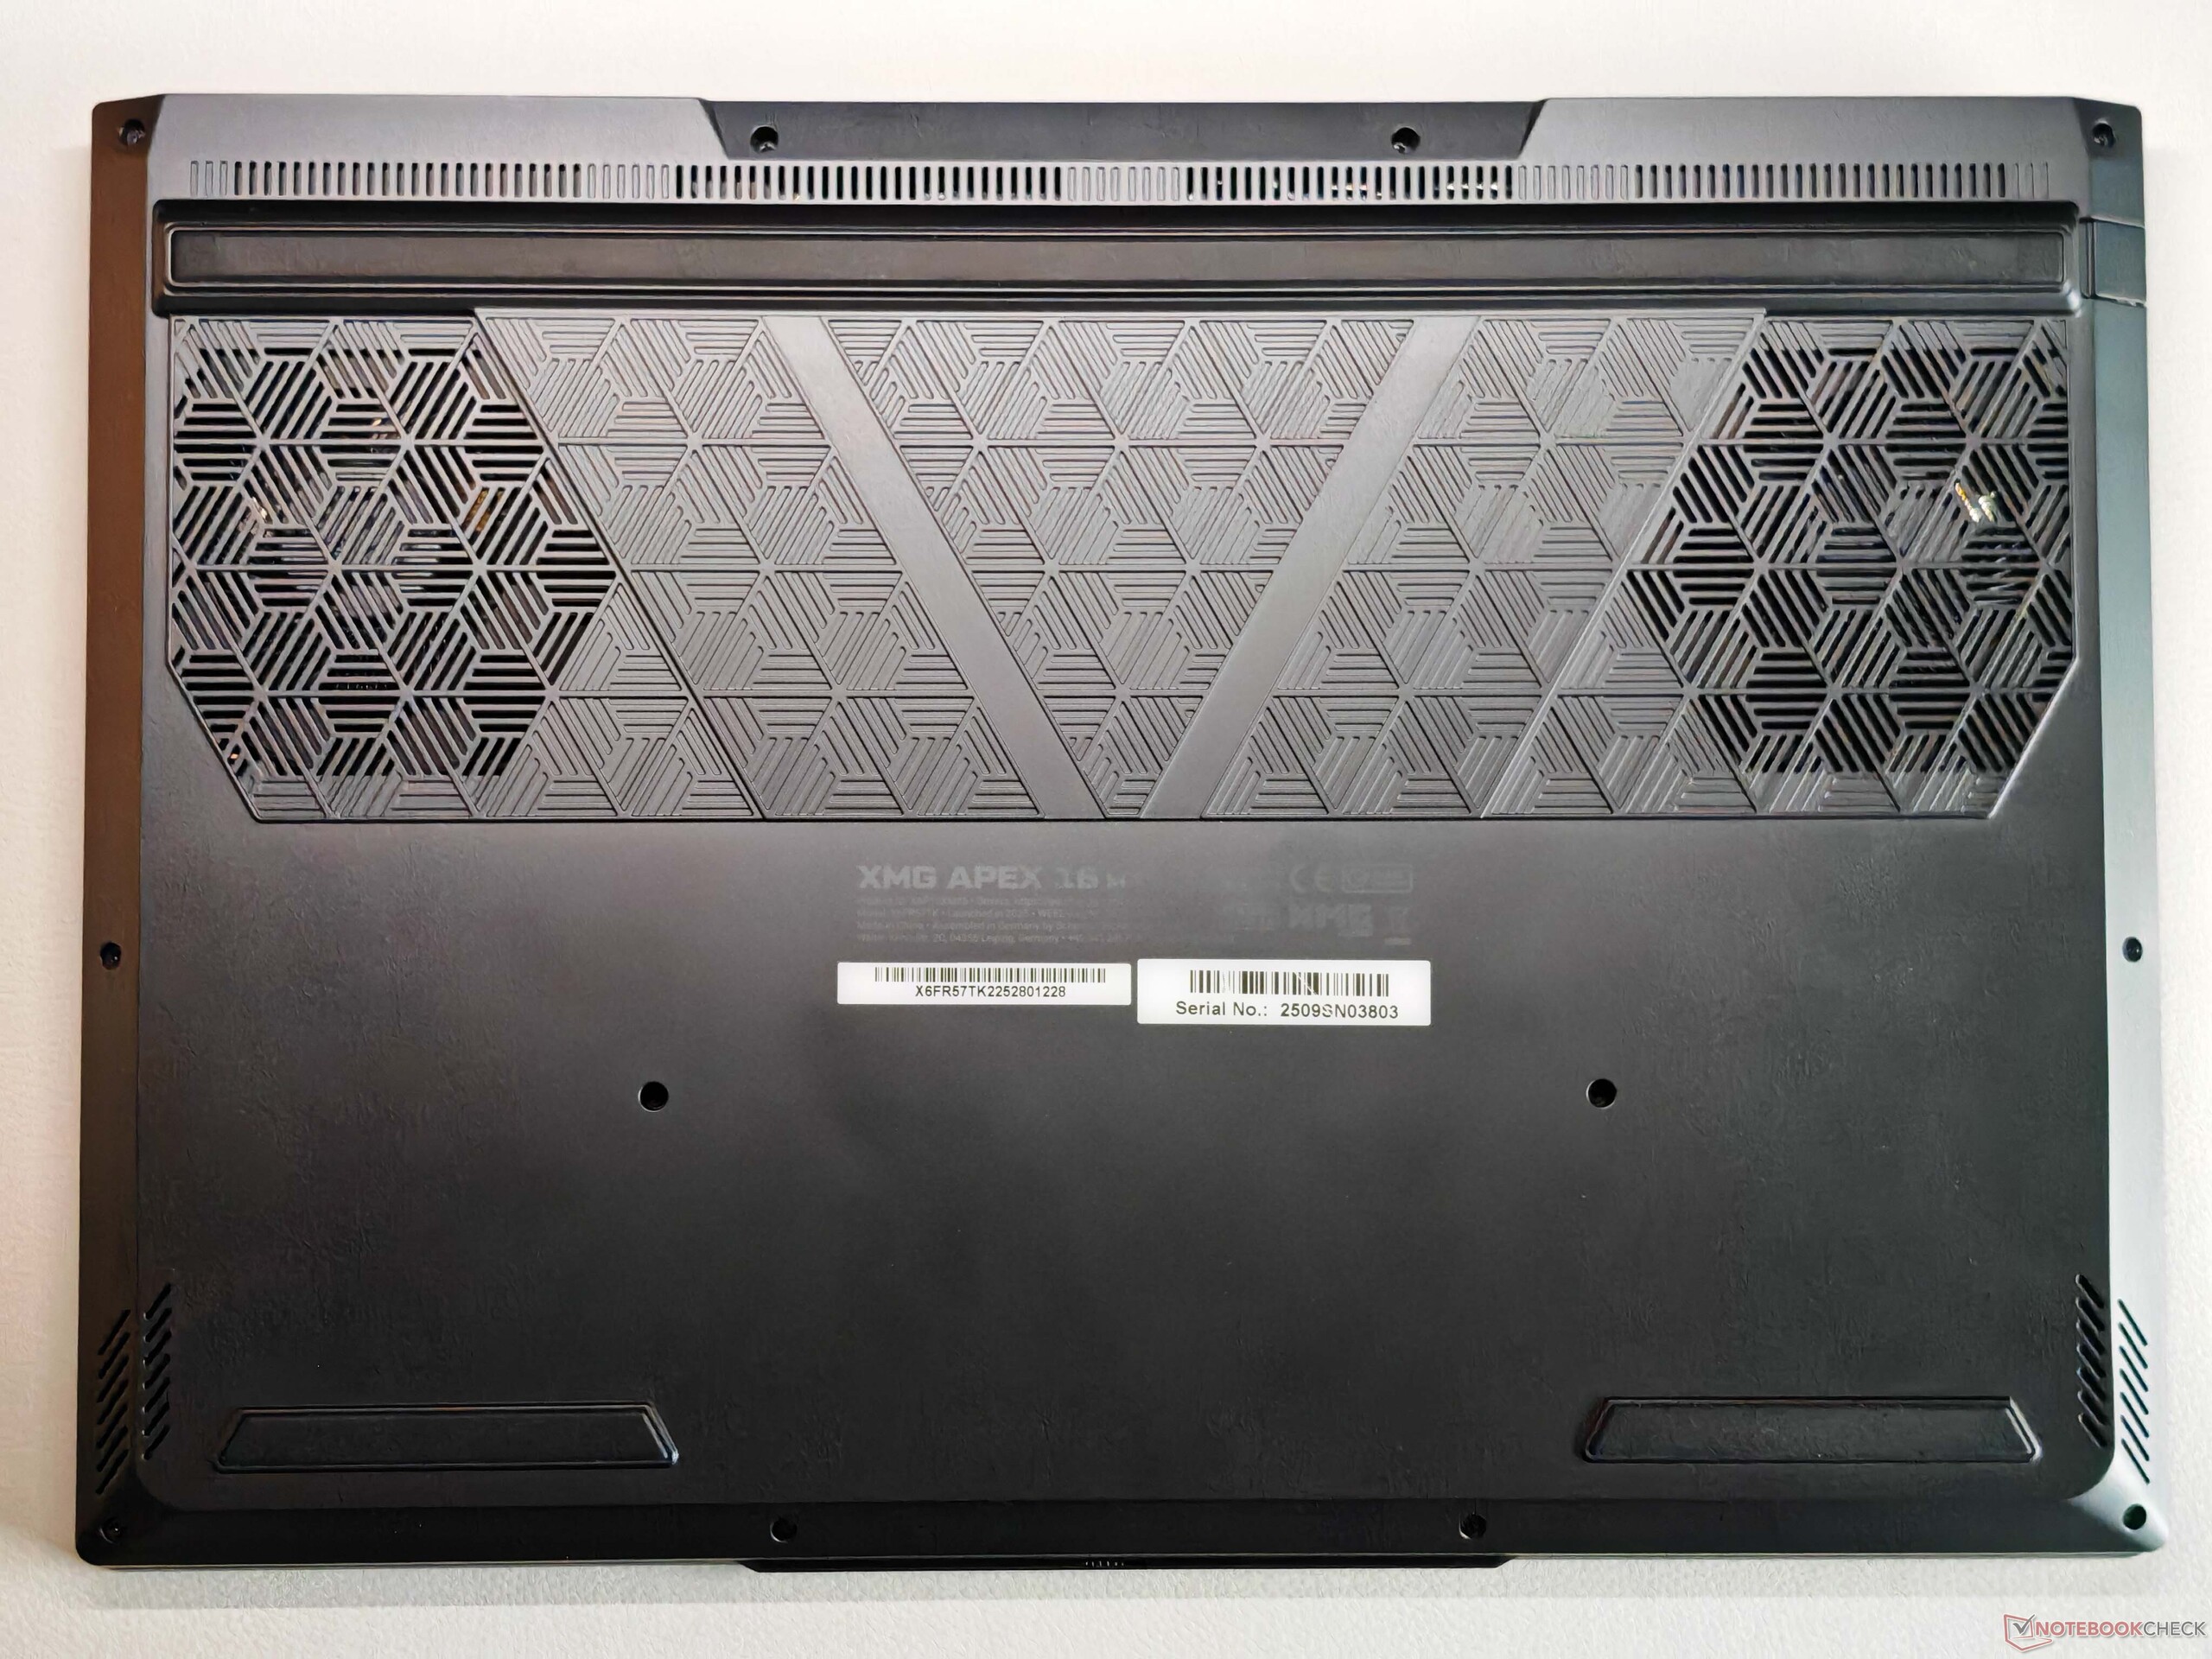
Gehäuse & Ausstattung
Das Gehäuse kennen wir in sehr ähnlicher Form bereits vom aktuellen XMG Pro 16. Das Design ist insgesamt sehr schlicht und es gibt auch keine Beleuchtungselemente am Gehäuse. Um den Preis so niedrig wie möglich zu halten besteht lediglich der Bildschirmdeckel aus Alu, die Baseunit jedoch aus Kunststoff. Die Stabilität ist insgesamt aber trotzdem sehr gut und auch die Scharniere (max. 180 Grad) lassen nur ein leichtes Nachwippen zu. Die Wartungsmöglichkeiten sind umfangreich (2x RAM, 2x SSD) und es stehen ausreichend Anschlüsse zur Verfügung, allerdings kein USB 4.0. Neben Wi-Fi 6E gibt es noch eine Gigabit-Ethernet-Anschluss sowie einen vollwertigen Kartenleser. Die 1080p-Webcam (mit Abdeckung + IR) erfüllt ihren Zweck.


| SD Card Reader | |
| average JPG Copy Test (av. of 3 runs) | |
| Medion Erazer Major 16 X1 MD62736 (AV PRO microSD 128 GB V60) | |
| Schenker XMG Pro 16 (E25) (Angelbird AV Pro V60) | |
| Durchschnitt der Klasse Gaming (20.9 - 210, n=54, der letzten 2 Jahre) | |
| MSI Vector 16 HX AI A2XWHG (AV PRO microSD 128 GB V60) | |
| Acer Predator Helios Neo 16S AI PHN16S-71-94L9 (AV PRO microSD 128 GB V60) | |
| Schenker XMG APEX 16 MAX (Angelbird AV Pro V60) | |
| maximum AS SSD Seq Read Test (1GB) | |
| Schenker XMG Pro 16 (E25) (Angelbird AV Pro V60) | |
| Medion Erazer Major 16 X1 MD62736 (AV PRO microSD 128 GB V60) | |
| Durchschnitt der Klasse Gaming (25.5 - 261, n=51, der letzten 2 Jahre) | |
| MSI Vector 16 HX AI A2XWHG (AV PRO microSD 128 GB V60) | |
| Schenker XMG APEX 16 MAX (Angelbird AV Pro V60) | |
| Acer Predator Helios Neo 16S AI PHN16S-71-94L9 (AV PRO microSD 128 GB V60) | |
| Networking | |
| Schenker XMG APEX 16 MAX | |
| iperf3 transmit AXE11000 | |
| iperf3 receive AXE11000 | |
| Acer Predator Helios Neo 16S AI PHN16S-71-94L9 | |
| iperf3 transmit AXE11000 | |
| iperf3 receive AXE11000 | |
| Chuwi Gamebook, R9 9955HX | |
| iperf3 transmit AXE11000 | |
| iperf3 receive AXE11000 | |
| iperf3 transmit AXE11000 6GHz | |
| iperf3 receive AXE11000 6GHz | |
| Medion Erazer Major 16 X1 MD62736 | |
| iperf3 transmit AXE11000 | |
| iperf3 receive AXE11000 | |
| Lenovo Legion 5 Pro 16IAX10H | |
| iperf3 transmit AXE11000 | |
| iperf3 receive AXE11000 | |
| MSI Vector 16 HX AI A2XWHG | |
| iperf3 transmit AXE11000 | |
| iperf3 receive AXE11000 | |
| Schenker XMG Pro 16 (E25) | |
| iperf3 transmit AXE11000 | |
| iperf3 receive AXE11000 | |


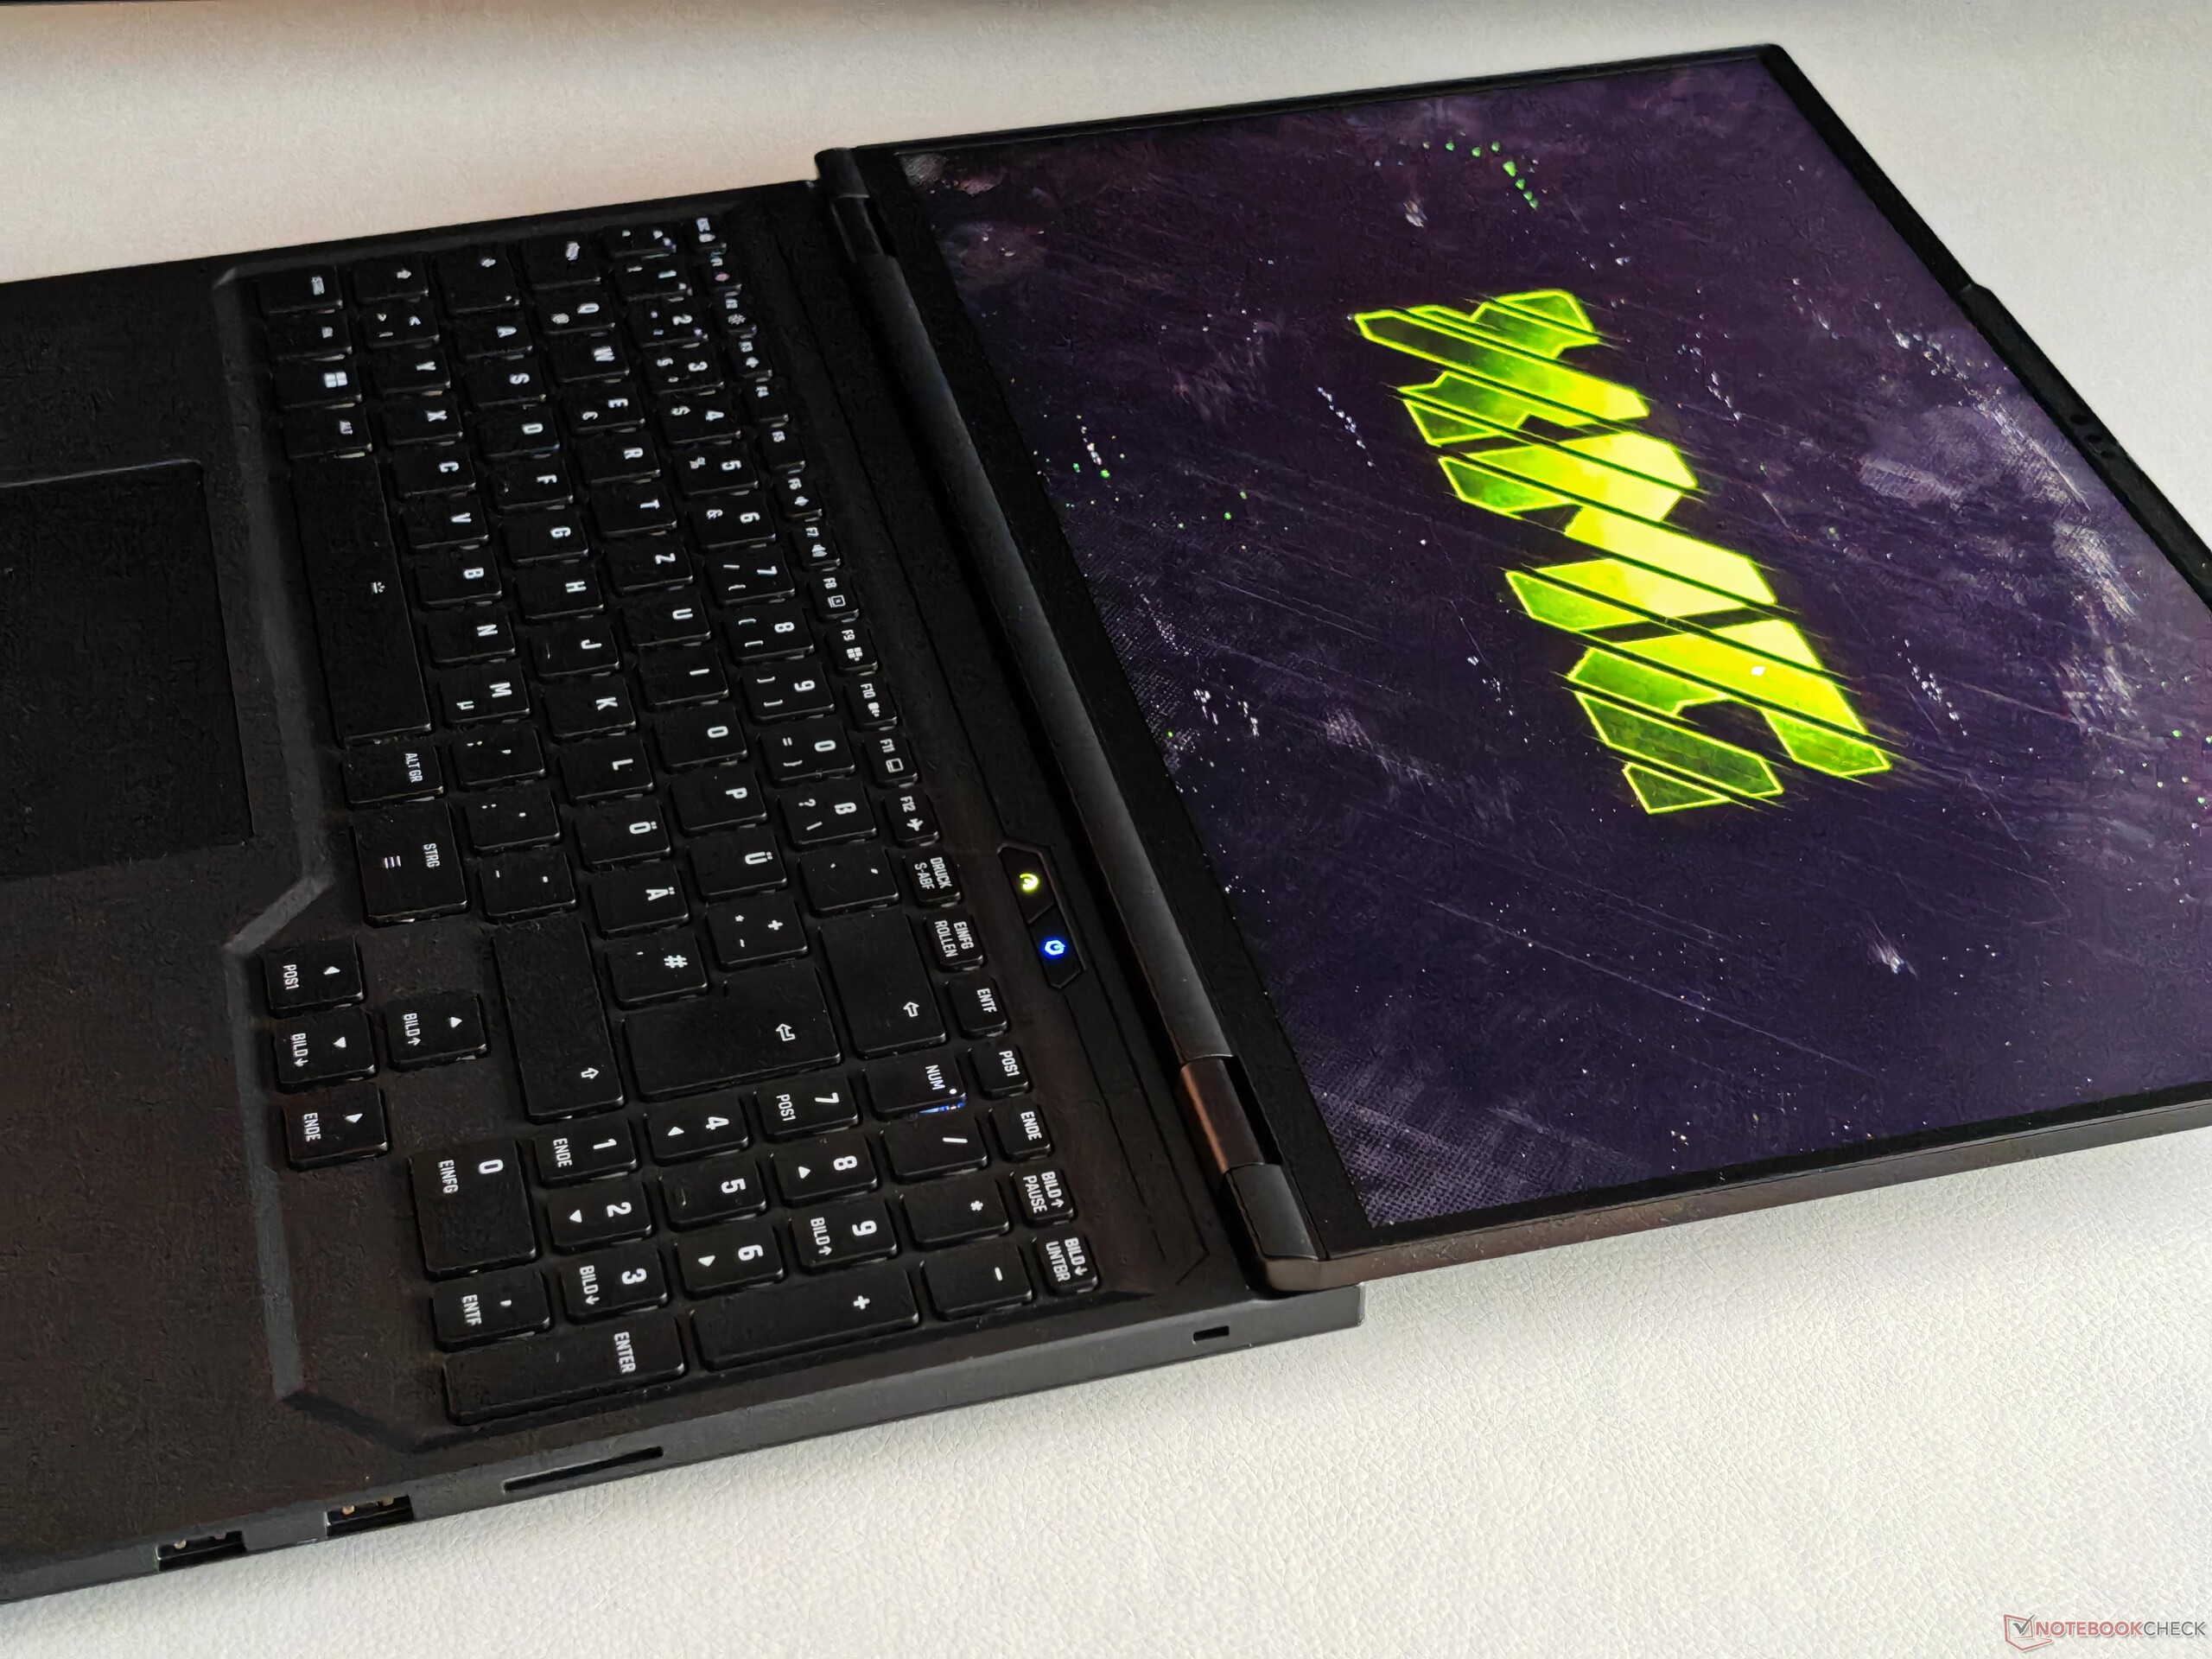
Eingabegeräte - Tastatur mit Einzeltastenbeleuchtung
Die Tastatur mit der Einzeltastenbeleuchtung kennen wir bereits von anderen XMG-Modellen und auch beim Apex 16 Max enttäuscht sie nicht. Der Hubweg ist ausreichend lang, das Feedback ist präzise und es gibt einen dedizierten Nummernblock. Das Clickpad macht seine Sache ebenfalls gut, nur die mechanischen Klicks im unteren Bereich sind etwas laut.


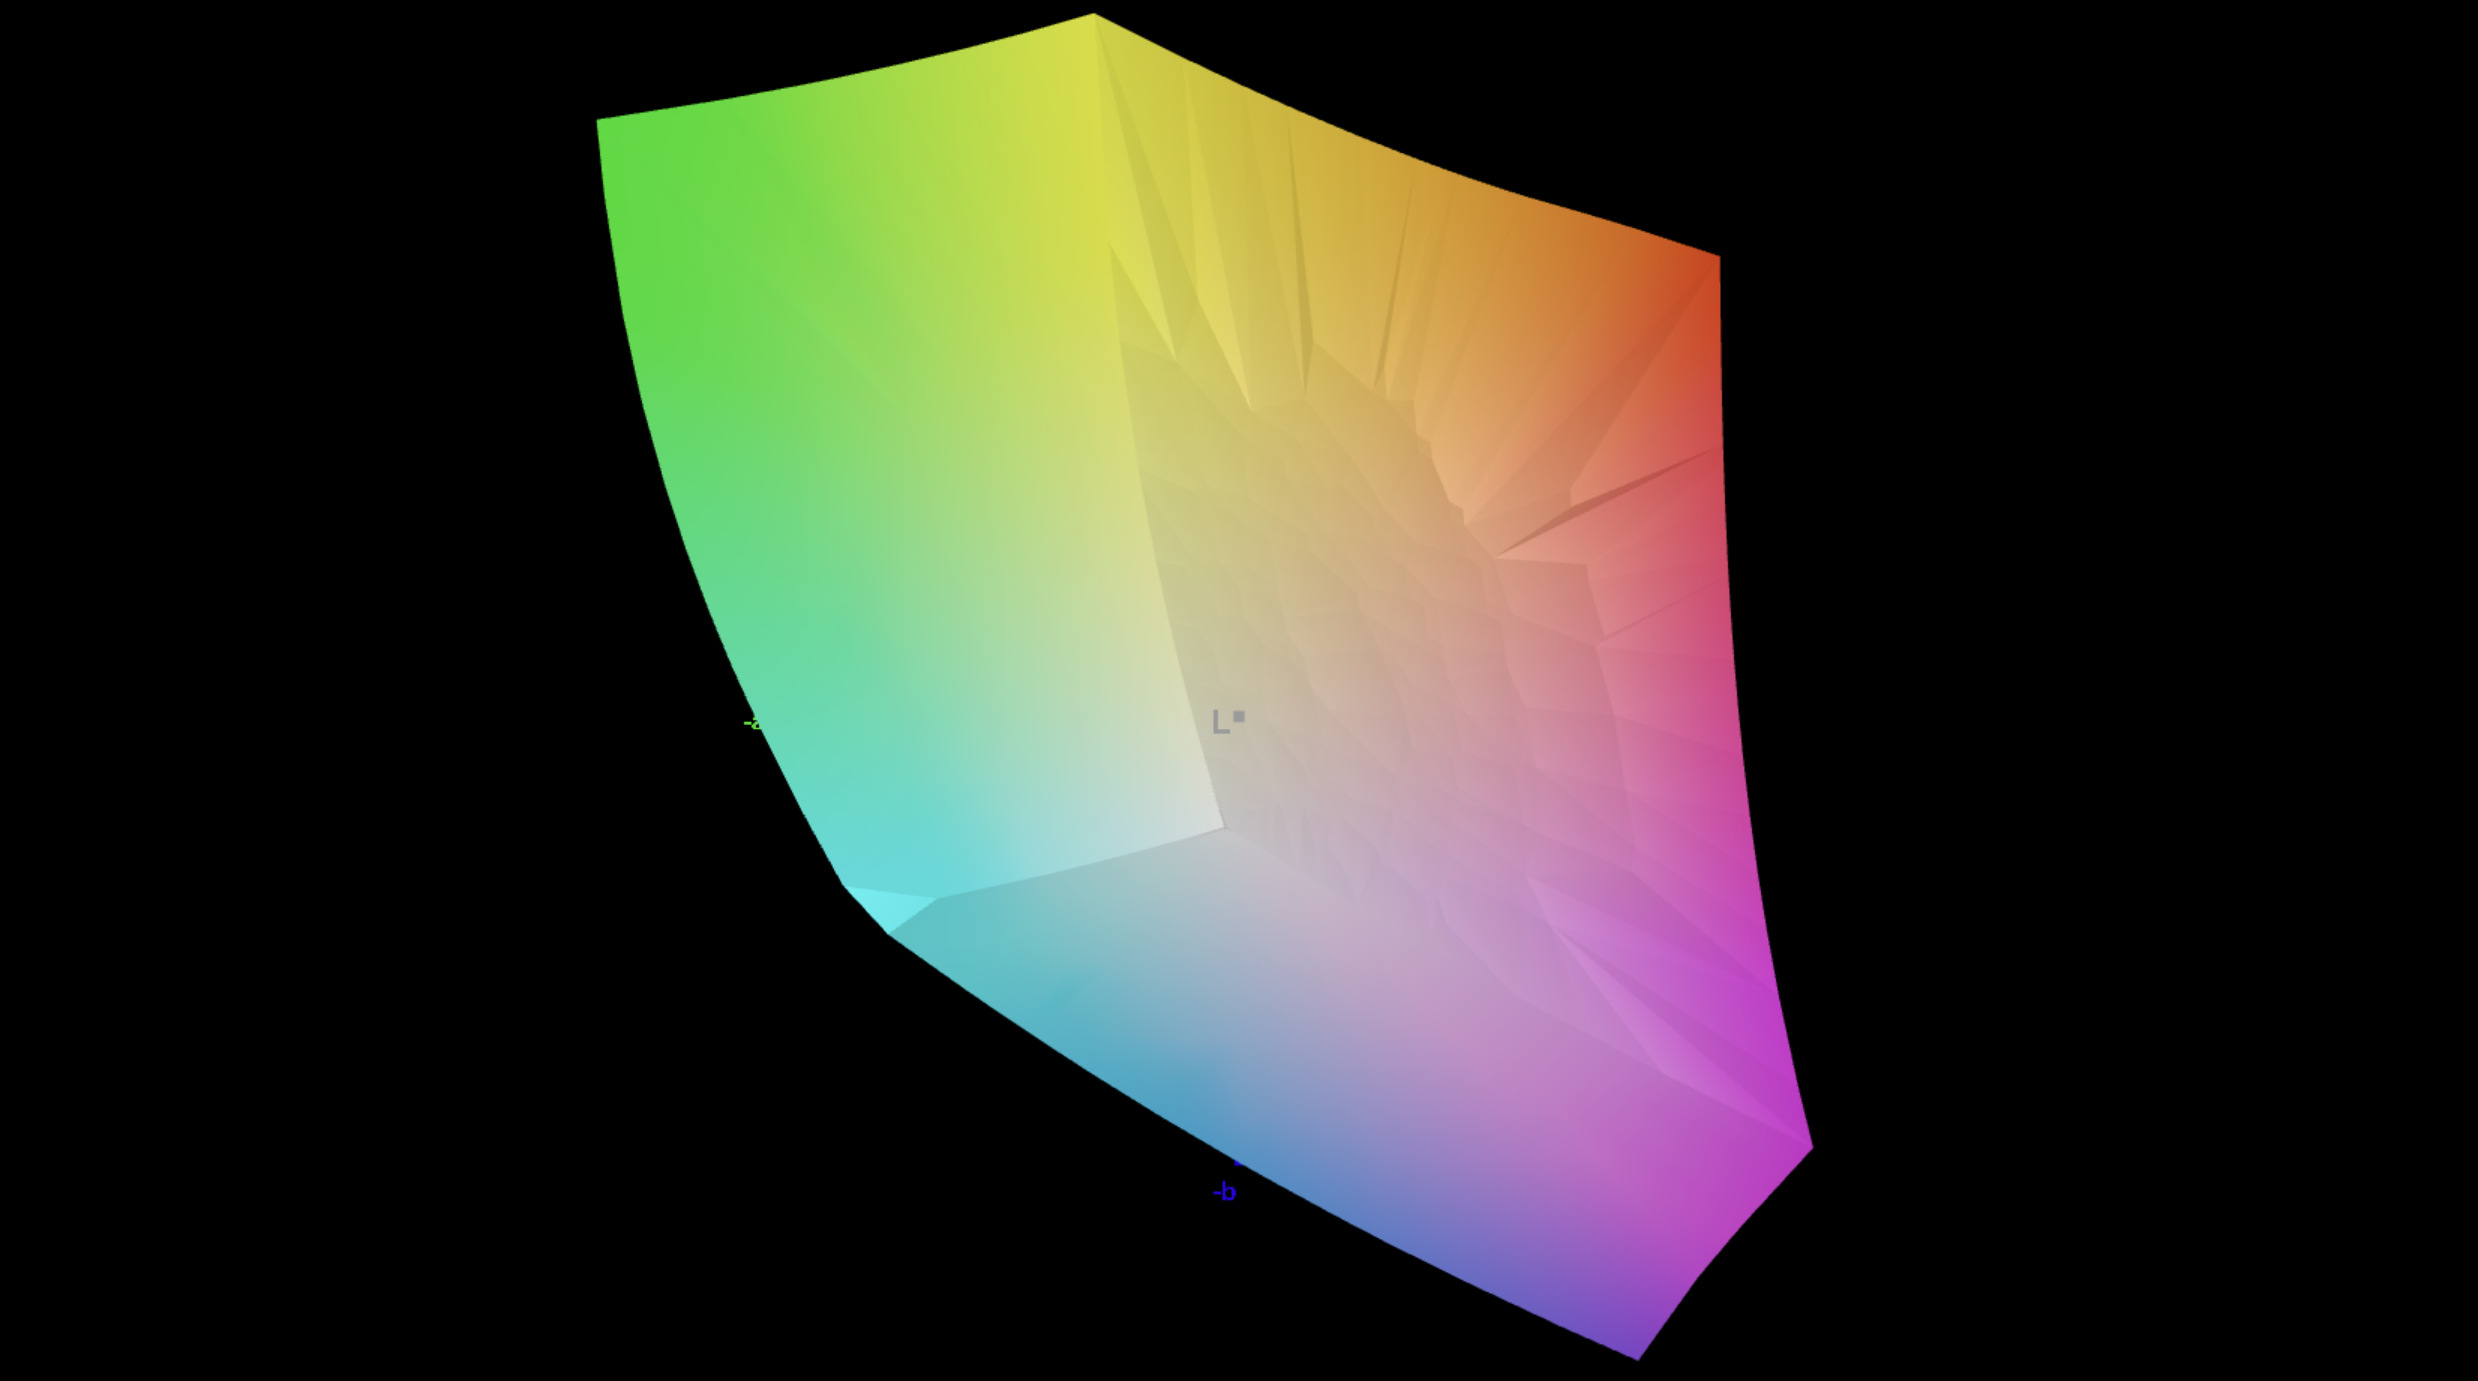
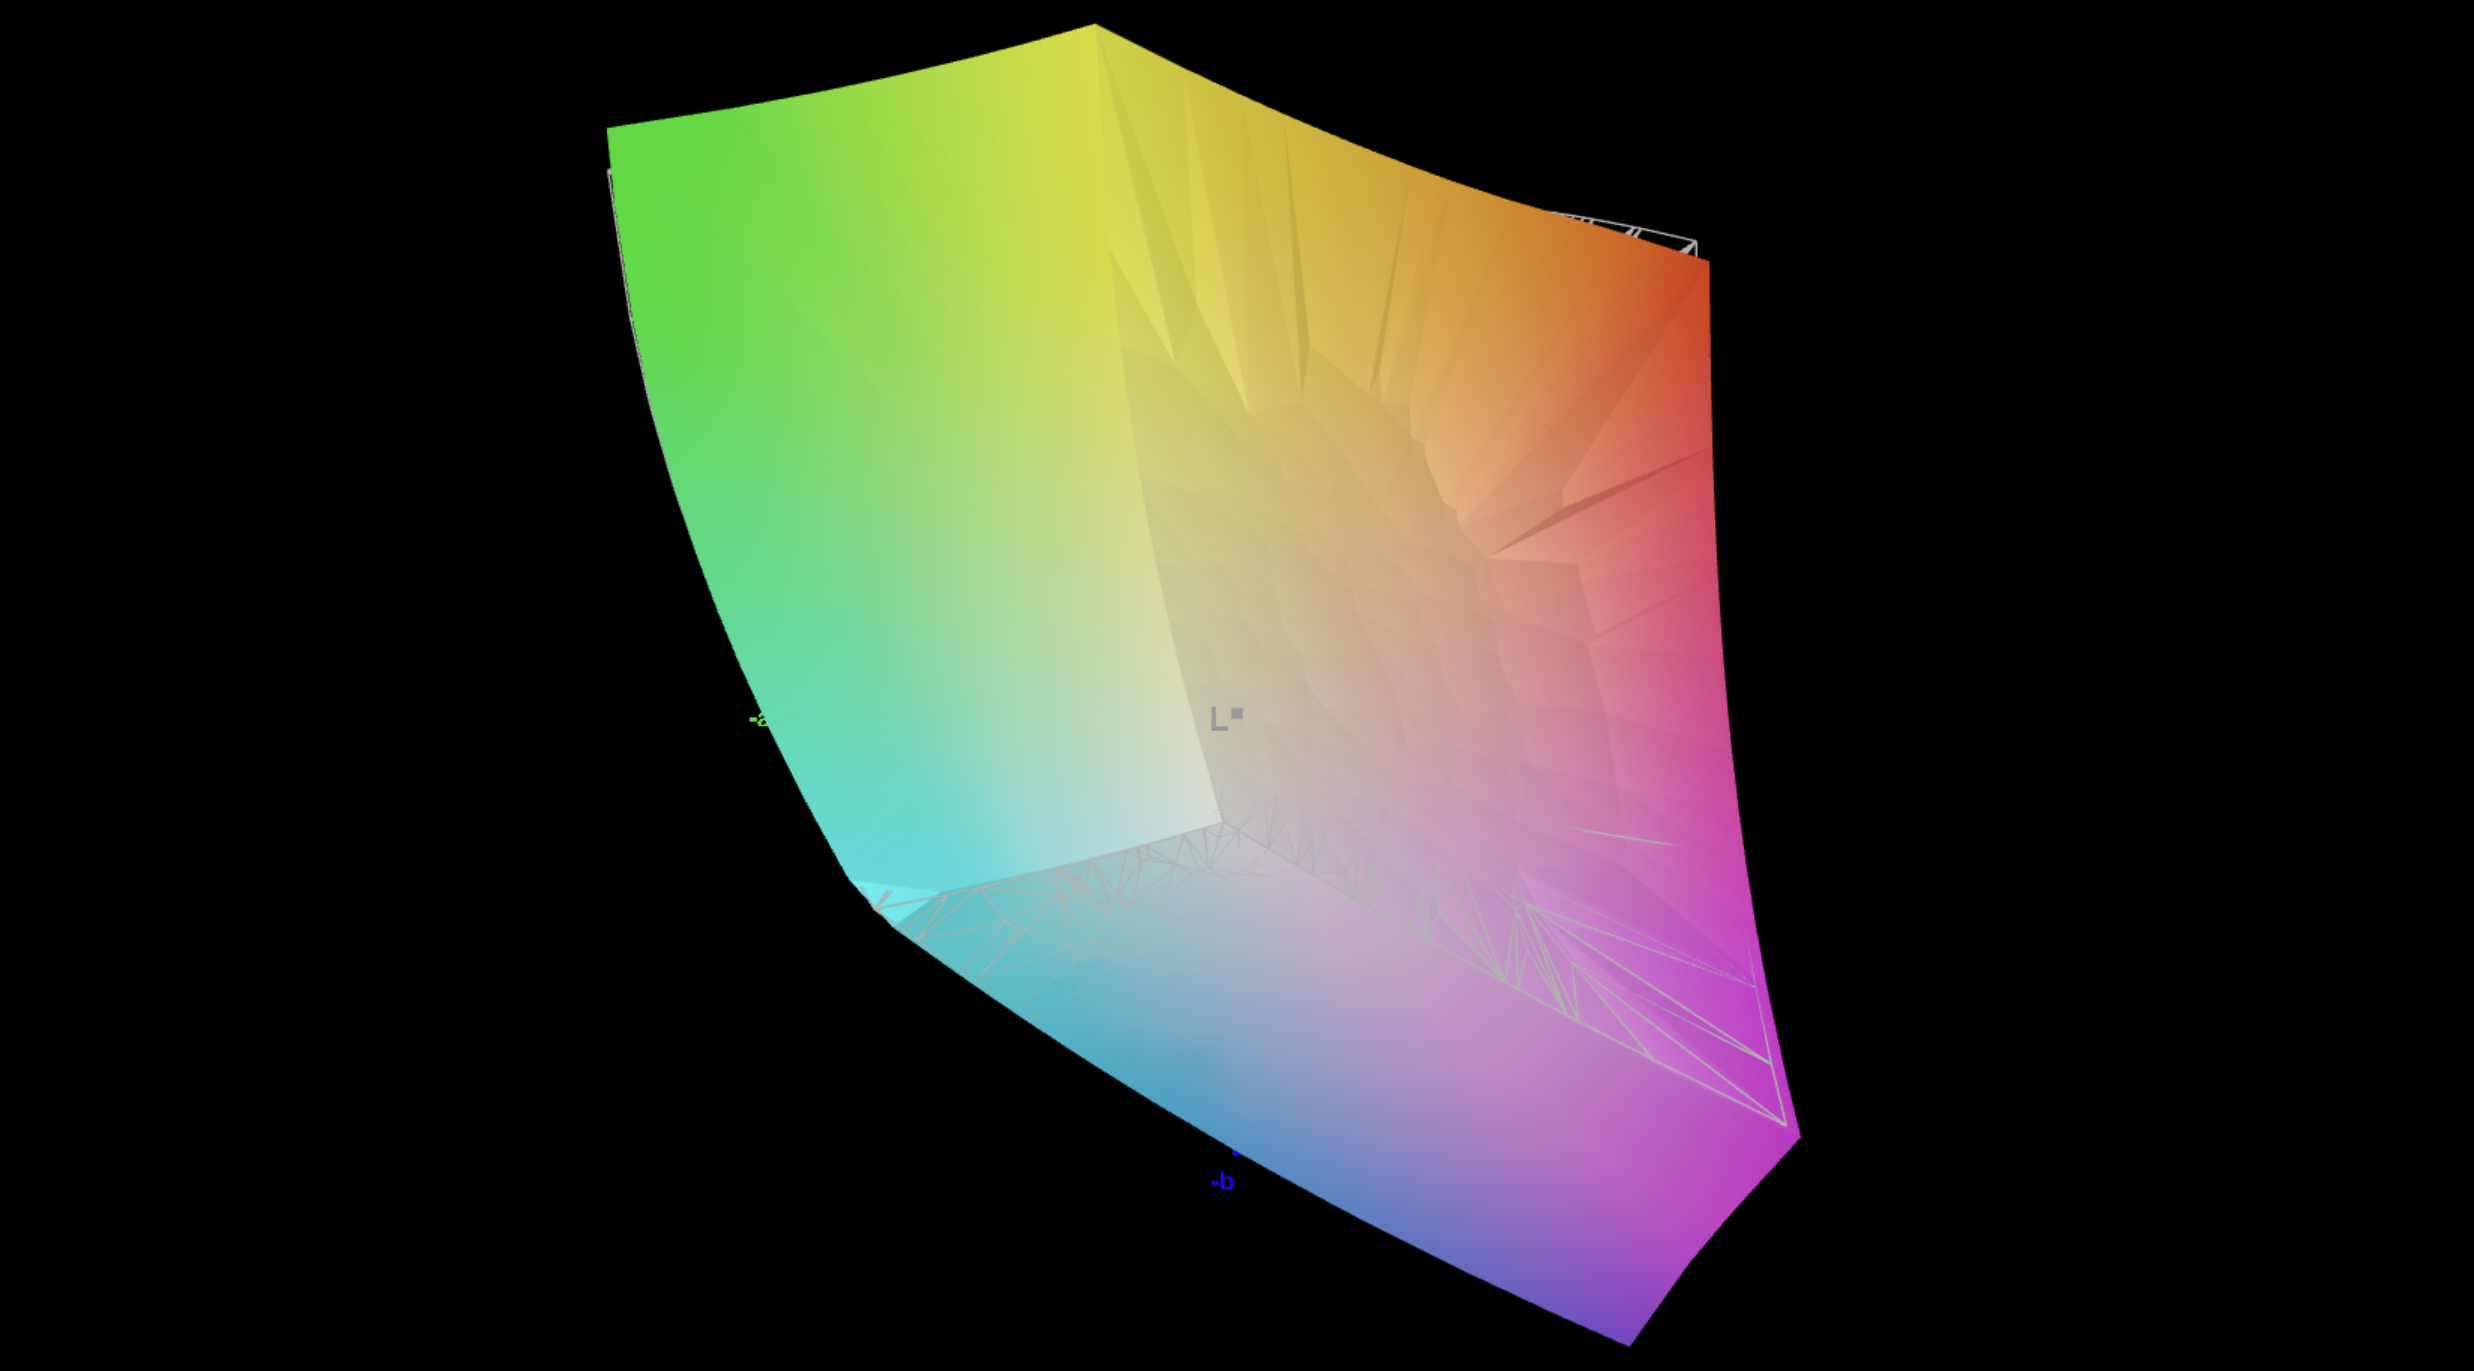
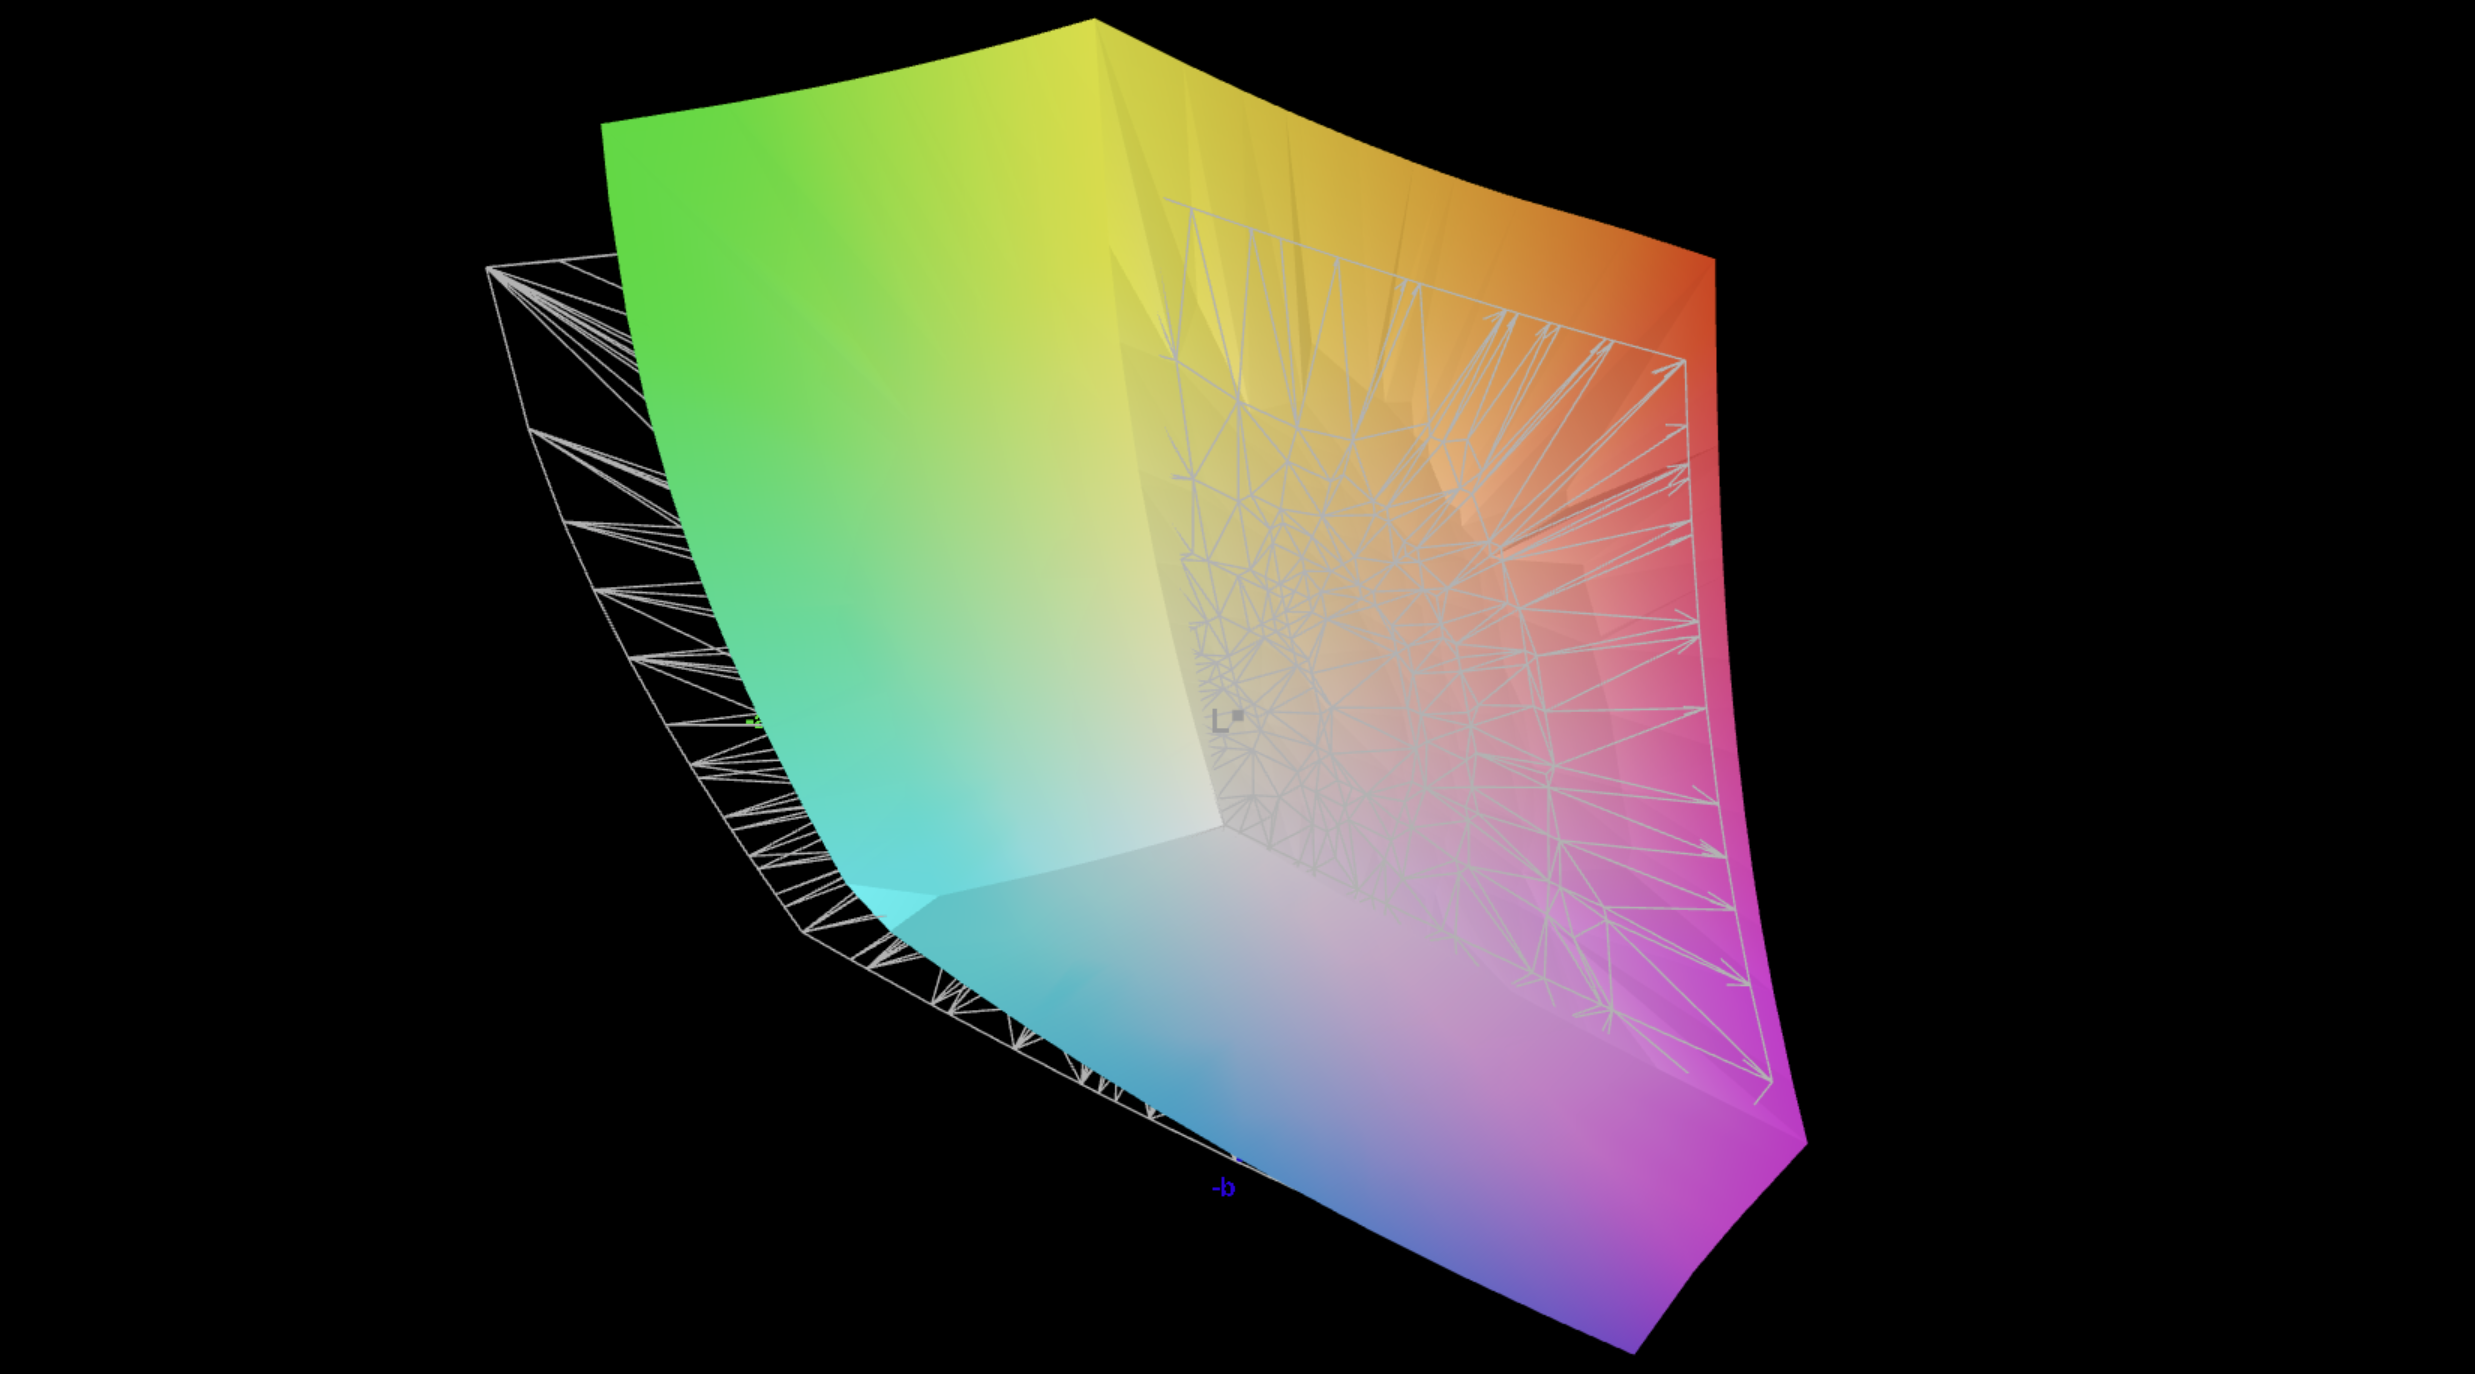
Display - Mini-LED mit 1.000 cd/m²
Unser Testgerät ist mit dem matten Mini-LED-Panel (2.560 x 1.600 Pixel, 16:10, 300 Hz) ausgestattet, dass wir bereits vom XMG Neo 16 kennen. Die Bildqualität ist hervorragend und vor allem bei der Helligkeit (maximal 752 cd/m² SDR bzw. 974 cd/m² HDR) liegt es deutlich vor dem normalen IPS-Panel. Das Local-Dimming kann abgeschaltet werden, was beispielsweise bei der Bildbearbeitung hilft. Die mitgelieferten Farbprofile (für P3 und sRGB) sind allerdings nicht optimal, wobei die Farbgenauigkeiten mit geringerer Helligkeit etwas besser werden. Unsere eigene Kalibrierung zeigt aber, dass hier noch Potenzial vorhanden ist. Die Reaktionszeiten lassen sich aufgrund des konstanten PWM-Flackerns (allerdings mit sehr hohen 20 kHz) nur schwer bestimmen, grundsätzlich handelt es sich aber um ein schnelles IPS-Panel und wir hatten beim Spielen keine Probleme.


| |||||||||||||||||||||||||
Ausleuchtung: 93 %
Helligkeit Akku: 742 cd/m²
Kontrast: 74200:1 (Schwarzwert: 0.01 cd/m²)
ΔE ColorChecker Calman: 3 | ∀{0.5-29.43 Ø4.72}
calibrated: 1.2
ΔE Greyscale Calman: 3.6 | ∀{0.09-98 Ø4.97}
87.9% AdobeRGB 1998 (Argyll 3D)
100% sRGB (Argyll 3D)
99.7% Display P3 (Argyll 3D)
Gamma: 2.43
CCT: 6559 K
| Schenker XMG APEX 16 MAX NE160QDM-NM9, Mini-LED, 2560x1600, 16", 300 Hz | Acer Predator Helios Neo 16S AI PHN16S-71-94L9 Samsung ATNA60DL03-0, OLED, 2560x1600, 16", 240 Hz | Chuwi Gamebook, R9 9955HX BOE0D55, IPS, 2560x1600, 16", 300 Hz | Medion Erazer Major 16 X1 MD62736 NE160QDM-NZL (BOE0D55), IPS, 2560x1600, 16", 300 Hz | Lenovo Legion 5 Pro 16IAX10H ATNA60HS01-0 (Samsung SDC420A), OLED, 2560x1600, 16", 165 Hz | MSI Vector 16 HX AI A2XWHG B160QAN02.3 (AUO7DB2), IPS, 2560x1600, 16", 240 Hz | Schenker XMG Pro 16 (E25) NE160QDM-NZL, IPS, 2560x1600, 16", 300 Hz | |
|---|---|---|---|---|---|---|---|
| Display | 3% | -16% | -14% | 2% | -2% | -13% | |
| Display P3 Coverage (%) | 99.7 | 99.9 0% | 72.5 -27% | 73.2 -27% | 99.9 0% | 96.6 -3% | 74.7 -25% |
| sRGB Coverage (%) | 100 | 100 0% | 97.9 -2% | 99.8 0% | 100 0% | 99.8 0% | 99.8 0% |
| AdobeRGB 1998 Coverage (%) | 87.9 | 96.5 10% | 72.5 -18% | 73.9 -16% | 94.1 7% | 84.4 -4% | 75.4 -14% |
| Response Times | 77% | 39% | 52% | 85% | 65% | 49% | |
| Response Time Grey 50% / Grey 80% * (ms) | 17.4 ? | 0.2 ? 99% | 12.4 ? 29% | 10 ? 43% | 2 ? 89% | 4.3 ? 75% | 10.5 ? 40% |
| Response Time Black / White * (ms) | 13 ? | 0.25 ? 98% | 6.8 ? 48% | 5.2 ? 60% | 1.4 ? 89% | 6 ? 54% | 5.4 ? 58% |
| PWM Frequency (Hz) | 20253 ? | 960 | 1300 | ||||
| PWM Amplitude * (%) | 75 | 50 33% | 16.7 78% | ||||
| Bildschirm | -42% | -557% | -553% | -18% | -485% | -587% | |
| Helligkeit Bildmitte (cd/m²) | 742 | 390 -47% | 576 -22% | 577 -22% | 518 -30% | 473 -36% | 538 -27% |
| Brightness (cd/m²) | 733 | 394 -46% | 545 -26% | 539 -26% | 522 -29% | 426 -42% | 508 -31% |
| Brightness Distribution (%) | 93 | 98 5% | 88 -5% | 85 -9% | 97 4% | 85 -9% | 88 -5% |
| Schwarzwert * (cd/m²) | 0.01 | 0.04 -300% | 0.5 -4900% | 0.5 -4900% | 0.42 -4100% | 0.47 -4600% | |
| Kontrast (:1) | 74200 | 9750 -87% | 1152 -98% | 1154 -98% | 1126 -98% | 1145 -98% | |
| Delta E Colorchecker * | 3 | 1.61 46% | 2.04 32% | 2.12 29% | 2.49 17% | 3.47 -16% | 1.9 37% |
| Colorchecker dE 2000 max. * | 4.3 | 3.49 19% | 3.56 17% | 3.32 23% | 5.25 -22% | 7.24 -68% | 4 7% |
| Colorchecker dE 2000 calibrated * | 1.2 | 1.59 -33% | 1.85 -54% | 1.33 -11% | 2.15 -79% | 1.36 -13% | |
| Delta E Graustufen * | 3.6 | 1.2 67% | 2.09 42% | 2.2 39% | 3.02 16% | 3.1 14% | 2.7 25% |
| Gamma | 2.43 91% | 2.235 98% | 2.3 96% | 2.123 104% | 2.37 93% | 2.486 88% | 2.24 98% |
| CCT | 6559 99% | 6580 99% | 6492 100% | 6457 101% | 6426 101% | 6832 95% | 7027 93% |
| Durchschnitt gesamt (Programm / Settings) | 13% /
-9% | -178% /
-356% | -172% /
-351% | 23% /
11% | -141% /
-303% | -184% /
-356% |
* ... kleinere Werte sind besser


Reaktionszeiten (Response Times) des Displays
| ↔ Reaktionszeiten Schwarz zu Weiß | ||
|---|---|---|
| 13 ms ... steigend ↗ und fallend ↘ kombiniert | ↗ 4.6 ms steigend | 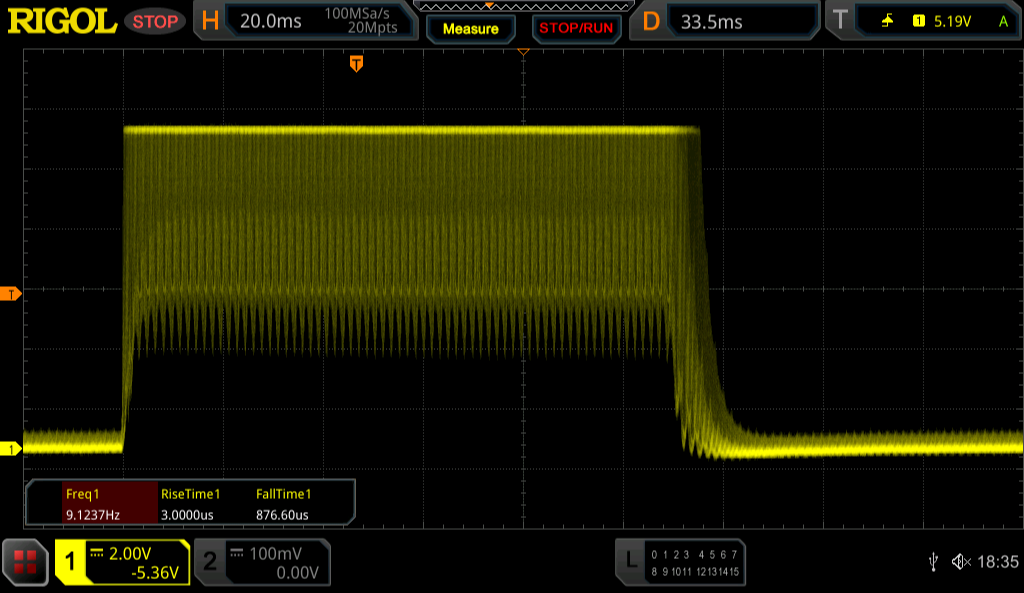 |
| ↘ 8.4 ms fallend | ||
| Die gemessenen Reaktionszeiten sind gut, für anspruchsvolle Spieler könnten der Bildschirm jedoch zu langsam sein. Im Vergleich rangierten die bei uns getesteten Geräte von 0.1 (Minimum) zu 240 (Maximum) ms. » 33 % aller Screens waren schneller als der getestete. Daher sind die gemessenen Reaktionszeiten besser als der Durchschnitt aller vermessenen Geräte (19.8 ms). | ||
| ↔ Reaktionszeiten 50% Grau zu 80% Grau | ||
| 17.4 ms ... steigend ↗ und fallend ↘ kombiniert | ↗ 8.4 ms steigend | 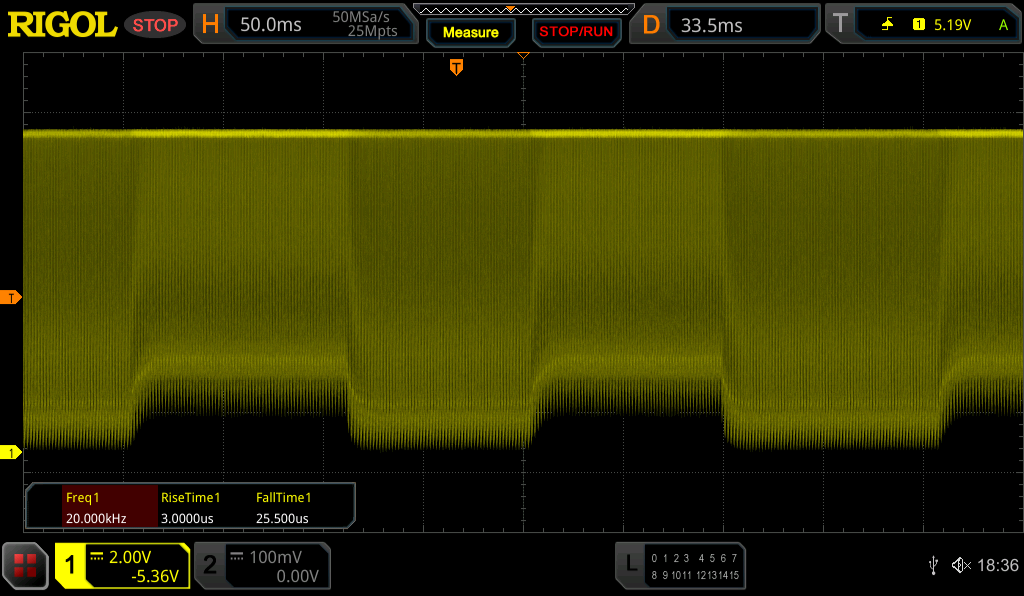 |
| ↘ 9 ms fallend | ||
| Die gemessenen Reaktionszeiten sind gut, für anspruchsvolle Spieler könnten der Bildschirm jedoch zu langsam sein. Im Vergleich rangierten die bei uns getesteten Geräte von 0.165 (Minimum) zu 636 (Maximum) ms. » 31 % aller Screens waren schneller als der getestete. Daher sind die gemessenen Reaktionszeiten besser als der Durchschnitt aller vermessenen Geräte (31 ms). | ||
Bildschirm-Flackern / PWM (Pulse-Width Modulation)
| Flackern / PWM festgestellt | 20253 Hz Amplitude: 75 % | ≤ 100 % Helligkeit | 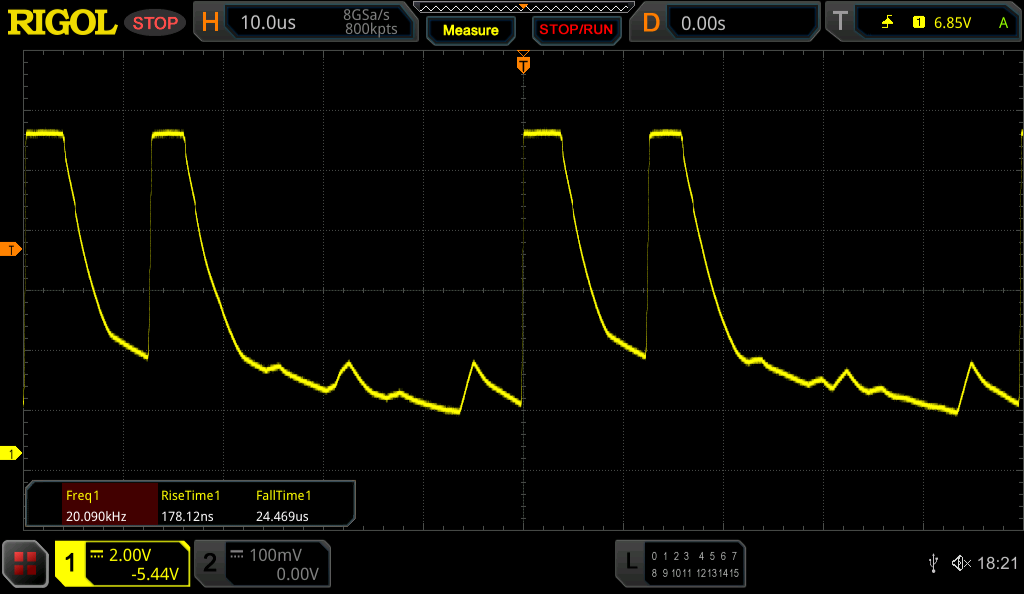 |
Das Display flackert mit 20253 Hz (im schlimmsten Fall, eventuell durch Pulsweitenmodulation PWM) bei einer eingestellten Helligkeit von 100 % und darunter. Darüber sollte es zu keinem Flackern kommen. Die Frequenz von 20253 Hz ist sehr hoch und sollte daher auch bei empfindlichen Personen zu keinen Problemen führen. Im Vergleich: 52 % aller getesteten Geräte nutzten kein PWM um die Helligkeit zu reduzieren. Wenn PWM eingesetzt wurde, dann bei einer Frequenz von durchschnittlich 7781 (Minimum 5, Maximum 343500) Hz. | |||


Leistung
Testbedingungen
Wir haben die nachfolgenden Benchmarks im Overboost-Normal-Modus durchgeführt. Im Akkubetrieb steht maximal der Enthusiast-Modus zur Verfügung.
Prozessor
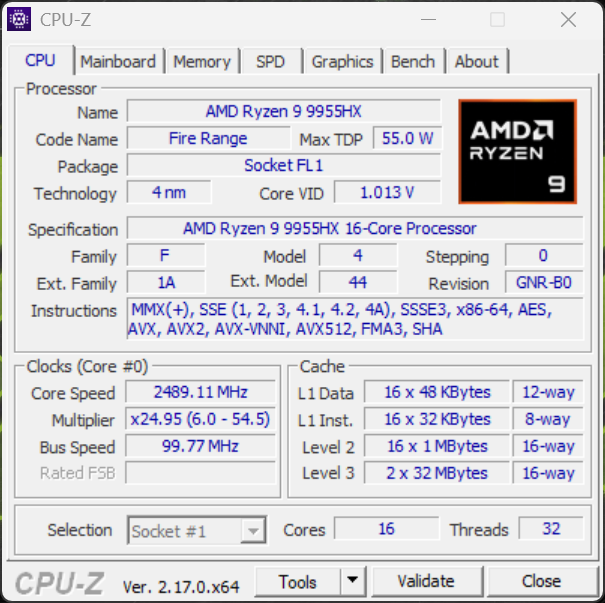
Der AMD Ryzen 9 9955HX (Zen 5) ist eins ehr schneller Mobilprozessor und darf 135/130 Watt verbrauchen, weshalb er eine sehr konstante Leistung bietet. In unseren Benchmarks kann er sich beispielsweise auch vor dem Intel Core Ultra 9 275HX platzieren, der mehr Strom verbraucht. Im Akkubetrieb (35 Watt) wird die Multi-Core-Leistung allerdings deutlich reduziert (-55 %).
Cinebench R15 Multi Dauertest
Cinebench R23: Multi Core | Single Core
Cinebench R20: CPU (Multi Core) | CPU (Single Core)
Cinebench R15: CPU Multi 64Bit | CPU Single 64Bit
Blender: v2.79 BMW27 CPU
7-Zip 18.03: 7z b 4 | 7z b 4 -mmt1
Geekbench 6.7: Multi-Core | Single-Core
Geekbench 5.5: Multi-Core | Single-Core
HWBOT x265 Benchmark v2.2: 4k Preset
LibreOffice : 20 Documents To PDF
R Benchmark 2.5: Overall mean
| CPU Performance Rating | |
| Durchschnittliche AMD Ryzen 9 9955HX | |
| Schenker XMG APEX 16 MAX | |
| Chuwi Gamebook, R9 9955HX | |
| Lenovo Legion 5 Pro 16IAX10H | |
| Schenker XMG Pro 16 (E25) | |
| Acer Predator Helios Neo 16S AI PHN16S-71-94L9 | |
| Medion Erazer Major 16 X1 MD62736 | |
| MSI Vector 16 HX AI A2XWHG | |
| Durchschnitt der Klasse Gaming | |
| Cinebench R23 / Multi Core | |
| Durchschnittliche AMD Ryzen 9 9955HX (35960 - 39690, n=9) | |
| Lenovo Legion 5 Pro 16IAX10H | |
| Schenker XMG Pro 16 (E25) | |
| Chuwi Gamebook, R9 9955HX | |
| Schenker XMG APEX 16 MAX | |
| Medion Erazer Major 16 X1 MD62736 | |
| Acer Predator Helios Neo 16S AI PHN16S-71-94L9 | |
| MSI Vector 16 HX AI A2XWHG | |
| Durchschnitt der Klasse Gaming (10488 - 40970, n=110, der letzten 2 Jahre) | |
| Cinebench R23 / Single Core | |
| Acer Predator Helios Neo 16S AI PHN16S-71-94L9 | |
| Lenovo Legion 5 Pro 16IAX10H | |
| Schenker XMG Pro 16 (E25) | |
| Chuwi Gamebook, R9 9955HX | |
| Schenker XMG APEX 16 MAX | |
| MSI Vector 16 HX AI A2XWHG | |
| Durchschnittliche AMD Ryzen 9 9955HX (1828 - 2183, n=9) | |
| Medion Erazer Major 16 X1 MD62736 | |
| Durchschnitt der Klasse Gaming (1166 - 2356, n=110, der letzten 2 Jahre) | |
| Cinebench R20 / CPU (Multi Core) | |
| Lenovo Legion 5 Pro 16IAX10H | |
| Durchschnittliche AMD Ryzen 9 9955HX (13963 - 15524, n=9) | |
| Schenker XMG Pro 16 (E25) | |
| Chuwi Gamebook, R9 9955HX | |
| Schenker XMG APEX 16 MAX | |
| Acer Predator Helios Neo 16S AI PHN16S-71-94L9 | |
| Medion Erazer Major 16 X1 MD62736 | |
| MSI Vector 16 HX AI A2XWHG | |
| Durchschnitt der Klasse Gaming (4029 - 16108, n=109, der letzten 2 Jahre) | |
| Cinebench R20 / CPU (Single Core) | |
| Acer Predator Helios Neo 16S AI PHN16S-71-94L9 | |
| Lenovo Legion 5 Pro 16IAX10H | |
| Schenker XMG Pro 16 (E25) | |
| Schenker XMG APEX 16 MAX | |
| Chuwi Gamebook, R9 9955HX | |
| Durchschnittliche AMD Ryzen 9 9955HX (819 - 856, n=9) | |
| MSI Vector 16 HX AI A2XWHG | |
| Medion Erazer Major 16 X1 MD62736 | |
| Durchschnitt der Klasse Gaming (442 - 895, n=109, der letzten 2 Jahre) | |
| Cinebench R15 / CPU Multi 64Bit | |
| Lenovo Legion 5 Pro 16IAX10H | |
| Durchschnittliche AMD Ryzen 9 9955HX (5624 - 6103, n=9) | |
| Chuwi Gamebook, R9 9955HX | |
| Schenker XMG APEX 16 MAX | |
| Schenker XMG Pro 16 (E25) | |
| Medion Erazer Major 16 X1 MD62736 | |
| Acer Predator Helios Neo 16S AI PHN16S-71-94L9 | |
| MSI Vector 16 HX AI A2XWHG | |
| Durchschnitt der Klasse Gaming (1578 - 6271, n=109, der letzten 2 Jahre) | |
| Cinebench R15 / CPU Single 64Bit | |
| Chuwi Gamebook, R9 9955HX | |
| Schenker XMG APEX 16 MAX | |
| Schenker XMG Pro 16 (E25) | |
| Acer Predator Helios Neo 16S AI PHN16S-71-94L9 | |
| Durchschnittliche AMD Ryzen 9 9955HX (320 - 338, n=9) | |
| Lenovo Legion 5 Pro 16IAX10H | |
| MSI Vector 16 HX AI A2XWHG | |
| Medion Erazer Major 16 X1 MD62736 | |
| Durchschnitt der Klasse Gaming (188.8 - 343, n=109, der letzten 2 Jahre) | |
| Blender / v2.79 BMW27 CPU | |
| Durchschnitt der Klasse Gaming (80 - 330, n=107, der letzten 2 Jahre) | |
| MSI Vector 16 HX AI A2XWHG | |
| Acer Predator Helios Neo 16S AI PHN16S-71-94L9 | |
| Medion Erazer Major 16 X1 MD62736 | |
| Lenovo Legion 5 Pro 16IAX10H | |
| Schenker XMG Pro 16 (E25) | |
| Chuwi Gamebook, R9 9955HX | |
| Schenker XMG APEX 16 MAX | |
| Durchschnittliche AMD Ryzen 9 9955HX (80 - 91, n=9) | |
| 7-Zip 18.03 / 7z b 4 | |
| Schenker XMG APEX 16 MAX | |
| Durchschnittliche AMD Ryzen 9 9955HX (132435 - 144064, n=9) | |
| Chuwi Gamebook, R9 9955HX | |
| Schenker XMG Pro 16 (E25) | |
| Lenovo Legion 5 Pro 16IAX10H | |
| Acer Predator Helios Neo 16S AI PHN16S-71-94L9 | |
| Medion Erazer Major 16 X1 MD62736 | |
| Durchschnitt der Klasse Gaming (33491 - 148086, n=108, der letzten 2 Jahre) | |
| MSI Vector 16 HX AI A2XWHG | |
| 7-Zip 18.03 / 7z b 4 -mmt1 | |
| Schenker XMG APEX 16 MAX | |
| Durchschnittliche AMD Ryzen 9 9955HX (7061 - 7462, n=9) | |
| Chuwi Gamebook, R9 9955HX | |
| Schenker XMG Pro 16 (E25) | |
| Acer Predator Helios Neo 16S AI PHN16S-71-94L9 | |
| Lenovo Legion 5 Pro 16IAX10H | |
| Medion Erazer Major 16 X1 MD62736 | |
| MSI Vector 16 HX AI A2XWHG | |
| Durchschnitt der Klasse Gaming (4199 - 7436, n=108, der letzten 2 Jahre) | |
| Geekbench 6.7 / Multi-Core | |
| Schenker XMG Pro 16 (E25) | |
| Lenovo Legion 5 Pro 16IAX10H | |
| Schenker XMG APEX 16 MAX | |
| Acer Predator Helios Neo 16S AI PHN16S-71-94L9 | |
| Chuwi Gamebook, R9 9955HX | |
| Durchschnittliche AMD Ryzen 9 9955HX (16313 - 19725, n=9) | |
| Medion Erazer Major 16 X1 MD62736 | |
| MSI Vector 16 HX AI A2XWHG | |
| Durchschnitt der Klasse Gaming (6625 - 22104, n=109, der letzten 2 Jahre) | |
| Geekbench 6.7 / Single-Core | |
| Schenker XMG APEX 16 MAX | |
| Durchschnittliche AMD Ryzen 9 9955HX (3156 - 3259, n=9) | |
| Chuwi Gamebook, R9 9955HX | |
| Acer Predator Helios Neo 16S AI PHN16S-71-94L9 | |
| Schenker XMG Pro 16 (E25) | |
| Lenovo Legion 5 Pro 16IAX10H | |
| Medion Erazer Major 16 X1 MD62736 | |
| MSI Vector 16 HX AI A2XWHG | |
| Durchschnitt der Klasse Gaming (1490 - 3259, n=109, der letzten 2 Jahre) | |
| Geekbench 5.5 / Multi-Core | |
| Schenker XMG Pro 16 (E25) | |
| Schenker XMG APEX 16 MAX | |
| Lenovo Legion 5 Pro 16IAX10H | |
| Acer Predator Helios Neo 16S AI PHN16S-71-94L9 | |
| Durchschnittliche AMD Ryzen 9 9955HX (20576 - 22716, n=9) | |
| Chuwi Gamebook, R9 9955HX | |
| Medion Erazer Major 16 X1 MD62736 | |
| MSI Vector 16 HX AI A2XWHG | |
| Durchschnitt der Klasse Gaming (6460 - 27010, n=108, der letzten 2 Jahre) | |
| Geekbench 5.5 / Single-Core | |
| Schenker XMG APEX 16 MAX | |
| Durchschnittliche AMD Ryzen 9 9955HX (2307 - 2474, n=9) | |
| Chuwi Gamebook, R9 9955HX | |
| Schenker XMG Pro 16 (E25) | |
| Lenovo Legion 5 Pro 16IAX10H | |
| Acer Predator Helios Neo 16S AI PHN16S-71-94L9 | |
| MSI Vector 16 HX AI A2XWHG | |
| Medion Erazer Major 16 X1 MD62736 | |
| Durchschnitt der Klasse Gaming (986 - 2474, n=108, der letzten 2 Jahre) | |
| HWBOT x265 Benchmark v2.2 / 4k Preset | |
| Durchschnittliche AMD Ryzen 9 9955HX (38.9 - 43, n=9) | |
| Chuwi Gamebook, R9 9955HX | |
| Schenker XMG APEX 16 MAX | |
| Schenker XMG Pro 16 (E25) | |
| Lenovo Legion 5 Pro 16IAX10H | |
| Medion Erazer Major 16 X1 MD62736 | |
| Acer Predator Helios Neo 16S AI PHN16S-71-94L9 | |
| MSI Vector 16 HX AI A2XWHG | |
| Durchschnitt der Klasse Gaming (11.5 - 44.3, n=108, der letzten 2 Jahre) | |
| LibreOffice / 20 Documents To PDF | |
| Durchschnitt der Klasse Gaming (19 - 88.8, n=108, der letzten 2 Jahre) | |
| Schenker XMG Pro 16 (E25) | |
| Schenker XMG APEX 16 MAX | |
| Durchschnittliche AMD Ryzen 9 9955HX (42.2 - 52.4, n=9) | |
| Chuwi Gamebook, R9 9955HX | |
| Acer Predator Helios Neo 16S AI PHN16S-71-94L9 | |
| Medion Erazer Major 16 X1 MD62736 | |
| MSI Vector 16 HX AI A2XWHG | |
| Lenovo Legion 5 Pro 16IAX10H | |
| R Benchmark 2.5 / Overall mean | |
| Durchschnitt der Klasse Gaming (0.3439 - 0.759, n=109, der letzten 2 Jahre) | |
| MSI Vector 16 HX AI A2XWHG | |
| Medion Erazer Major 16 X1 MD62736 | |
| Lenovo Legion 5 Pro 16IAX10H | |
| Schenker XMG Pro 16 (E25) | |
| Acer Predator Helios Neo 16S AI PHN16S-71-94L9 | |
| Chuwi Gamebook, R9 9955HX | |
| Durchschnittliche AMD Ryzen 9 9955HX (0.3439 - 0.3737, n=9) | |
| Schenker XMG APEX 16 MAX | |
* ... kleinere Werte sind besser
AIDA64: FP32 Ray-Trace | FPU Julia | CPU SHA3 | CPU Queen | FPU SinJulia | FPU Mandel | CPU AES | CPU ZLib | FP64 Ray-Trace | CPU PhotoWorxx
| Performance Rating | |
| Schenker XMG APEX 16 MAX | |
| Durchschnittliche AMD Ryzen 9 9955HX | |
| Chuwi Gamebook, R9 9955HX | |
| Lenovo Legion 5 Pro 16IAX10H | |
| Schenker XMG Pro 16 (E25) | |
| Medion Erazer Major 16 X1 MD62736 | |
| Acer Predator Helios Neo 16S AI PHN16S-71-94L9 | |
| Durchschnitt der Klasse Gaming | |
| MSI Vector 16 HX AI A2XWHG | |
| AIDA64 / FP32 Ray-Trace | |
| Schenker XMG APEX 16 MAX | |
| Chuwi Gamebook, R9 9955HX | |
| Durchschnittliche AMD Ryzen 9 9955HX (66596 - 85542, n=9) | |
| Lenovo Legion 5 Pro 16IAX10H | |
| Schenker XMG Pro 16 (E25) | |
| Medion Erazer Major 16 X1 MD62736 | |
| Durchschnitt der Klasse Gaming (10227 - 85542, n=107, der letzten 2 Jahre) | |
| Acer Predator Helios Neo 16S AI PHN16S-71-94L9 | |
| MSI Vector 16 HX AI A2XWHG | |
| AIDA64 / FPU Julia | |
| Schenker XMG APEX 16 MAX | |
| Durchschnittliche AMD Ryzen 9 9955HX (191535 - 232031, n=9) | |
| Chuwi Gamebook, R9 9955HX | |
| Lenovo Legion 5 Pro 16IAX10H | |
| Schenker XMG Pro 16 (E25) | |
| Medion Erazer Major 16 X1 MD62736 | |
| Acer Predator Helios Neo 16S AI PHN16S-71-94L9 | |
| MSI Vector 16 HX AI A2XWHG | |
| Durchschnitt der Klasse Gaming (51376 - 238426, n=107, der letzten 2 Jahre) | |
| AIDA64 / CPU SHA3 | |
| Schenker XMG APEX 16 MAX | |
| Durchschnittliche AMD Ryzen 9 9955HX (8489 - 9780, n=9) | |
| Chuwi Gamebook, R9 9955HX | |
| Schenker XMG Pro 16 (E25) | |
| Lenovo Legion 5 Pro 16IAX10H | |
| Medion Erazer Major 16 X1 MD62736 | |
| Acer Predator Helios Neo 16S AI PHN16S-71-94L9 | |
| MSI Vector 16 HX AI A2XWHG | |
| Durchschnitt der Klasse Gaming (2180 - 9817, n=107, der letzten 2 Jahre) | |
| AIDA64 / CPU Queen | |
| Durchschnittliche AMD Ryzen 9 9955HX (153027 - 164154, n=9) | |
| Schenker XMG APEX 16 MAX | |
| Chuwi Gamebook, R9 9955HX | |
| Lenovo Legion 5 Pro 16IAX10H | |
| Schenker XMG Pro 16 (E25) | |
| Medion Erazer Major 16 X1 MD62736 | |
| Acer Predator Helios Neo 16S AI PHN16S-71-94L9 | |
| Durchschnitt der Klasse Gaming (49785 - 173351, n=98, der letzten 2 Jahre) | |
| MSI Vector 16 HX AI A2XWHG | |
| AIDA64 / FPU SinJulia | |
| Schenker XMG APEX 16 MAX | |
| Durchschnittliche AMD Ryzen 9 9955HX (29876 - 32647, n=9) | |
| Chuwi Gamebook, R9 9955HX | |
| Durchschnitt der Klasse Gaming (4424 - 33636, n=107, der letzten 2 Jahre) | |
| Schenker XMG Pro 16 (E25) | |
| Lenovo Legion 5 Pro 16IAX10H | |
| Medion Erazer Major 16 X1 MD62736 | |
| Acer Predator Helios Neo 16S AI PHN16S-71-94L9 | |
| MSI Vector 16 HX AI A2XWHG | |
| AIDA64 / FPU Mandel | |
| Schenker XMG APEX 16 MAX | |
| Durchschnittliche AMD Ryzen 9 9955HX (101131 - 128721, n=9) | |
| Chuwi Gamebook, R9 9955HX | |
| Schenker XMG Pro 16 (E25) | |
| Lenovo Legion 5 Pro 16IAX10H | |
| Medion Erazer Major 16 X1 MD62736 | |
| Acer Predator Helios Neo 16S AI PHN16S-71-94L9 | |
| MSI Vector 16 HX AI A2XWHG | |
| Durchschnitt der Klasse Gaming (25115 - 128721, n=107, der letzten 2 Jahre) | |
| AIDA64 / CPU AES | |
| Schenker XMG APEX 16 MAX | |
| Durchschnittliche AMD Ryzen 9 9955HX (146979 - 218385, n=9) | |
| Chuwi Gamebook, R9 9955HX | |
| Lenovo Legion 5 Pro 16IAX10H | |
| Schenker XMG Pro 16 (E25) | |
| Medion Erazer Major 16 X1 MD62736 | |
| Acer Predator Helios Neo 16S AI PHN16S-71-94L9 | |
| Durchschnitt der Klasse Gaming (39258 - 247074, n=107, der letzten 2 Jahre) | |
| MSI Vector 16 HX AI A2XWHG | |
| AIDA64 / CPU ZLib | |
| Durchschnittliche AMD Ryzen 9 9955HX (2186 - 2531, n=9) | |
| Schenker XMG APEX 16 MAX | |
| Chuwi Gamebook, R9 9955HX | |
| Lenovo Legion 5 Pro 16IAX10H | |
| Schenker XMG Pro 16 (E25) | |
| Medion Erazer Major 16 X1 MD62736 | |
| Acer Predator Helios Neo 16S AI PHN16S-71-94L9 | |
| Durchschnitt der Klasse Gaming (574 - 2531, n=107, der letzten 2 Jahre) | |
| MSI Vector 16 HX AI A2XWHG | |
| AIDA64 / FP64 Ray-Trace | |
| Schenker XMG APEX 16 MAX | |
| Chuwi Gamebook, R9 9955HX | |
| Durchschnittliche AMD Ryzen 9 9955HX (35252 - 45446, n=9) | |
| Lenovo Legion 5 Pro 16IAX10H | |
| Schenker XMG Pro 16 (E25) | |
| Medion Erazer Major 16 X1 MD62736 | |
| Durchschnitt der Klasse Gaming (5509 - 45446, n=107, der letzten 2 Jahre) | |
| Acer Predator Helios Neo 16S AI PHN16S-71-94L9 | |
| MSI Vector 16 HX AI A2XWHG | |
| AIDA64 / CPU PhotoWorxx | |
| Acer Predator Helios Neo 16S AI PHN16S-71-94L9 | |
| Schenker XMG Pro 16 (E25) | |
| Medion Erazer Major 16 X1 MD62736 | |
| Lenovo Legion 5 Pro 16IAX10H | |
| Durchschnitt der Klasse Gaming (12271 - 89891, n=107, der letzten 2 Jahre) | |
| Schenker XMG APEX 16 MAX | |
| Chuwi Gamebook, R9 9955HX | |
| Durchschnittliche AMD Ryzen 9 9955HX (35974 - 42495, n=9) | |
| MSI Vector 16 HX AI A2XWHG | |
System Performance
Wenig überraschend ist die Systemleistung hervorragend und auch die Benchmark-Ergebnisse fallen sehr gut aus.
PCMark 10: Score | Essentials | Productivity | Digital Content Creation
CrossMark: Overall | Productivity | Creativity | Responsiveness
WebXPRT 3: Overall
WebXPRT 4: Overall
Mozilla Kraken 1.1: Total
| Performance Rating | |
| Lenovo Legion 5 Pro 16IAX10H | |
| Chuwi Gamebook, R9 9955HX | |
| Durchschnittliche AMD Ryzen 9 9955HX, NVIDIA GeForce RTX 5070 Ti Laptop | |
| Schenker XMG APEX 16 MAX | |
| Schenker XMG Pro 16 (E25) | |
| Acer Predator Helios Neo 16S AI PHN16S-71-94L9 | |
| Medion Erazer Major 16 X1 MD62736 | |
| Durchschnitt der Klasse Gaming | |
| MSI Vector 16 HX AI A2XWHG | |
| PCMark 10 / Score | |
| Schenker XMG APEX 16 MAX | |
| Durchschnittliche AMD Ryzen 9 9955HX, NVIDIA GeForce RTX 5070 Ti Laptop (9208 - 10060, n=3) | |
| Chuwi Gamebook, R9 9955HX | |
| Schenker XMG Pro 16 (E25) | |
| Acer Predator Helios Neo 16S AI PHN16S-71-94L9 | |
| Durchschnitt der Klasse Gaming (5828 - 11574, n=95, der letzten 2 Jahre) | |
| Lenovo Legion 5 Pro 16IAX10H | |
| Medion Erazer Major 16 X1 MD62736 | |
| MSI Vector 16 HX AI A2XWHG | |
| PCMark 10 / Essentials | |
| Schenker XMG APEX 16 MAX | |
| Durchschnittliche AMD Ryzen 9 9955HX, NVIDIA GeForce RTX 5070 Ti Laptop (11178 - 11719, n=3) | |
| Schenker XMG Pro 16 (E25) | |
| Chuwi Gamebook, R9 9955HX | |
| Acer Predator Helios Neo 16S AI PHN16S-71-94L9 | |
| Medion Erazer Major 16 X1 MD62736 | |
| Lenovo Legion 5 Pro 16IAX10H | |
| MSI Vector 16 HX AI A2XWHG | |
| Durchschnitt der Klasse Gaming (8810 - 12600, n=99, der letzten 2 Jahre) | |
| PCMark 10 / Productivity | |
| Schenker XMG APEX 16 MAX | |
| Durchschnittliche AMD Ryzen 9 9955HX, NVIDIA GeForce RTX 5070 Ti Laptop (10734 - 16314, n=3) | |
| Durchschnitt der Klasse Gaming (6845 - 18766, n=97, der letzten 2 Jahre) | |
| Chuwi Gamebook, R9 9955HX | |
| Acer Predator Helios Neo 16S AI PHN16S-71-94L9 | |
| Lenovo Legion 5 Pro 16IAX10H | |
| Schenker XMG Pro 16 (E25) | |
| MSI Vector 16 HX AI A2XWHG | |
| Medion Erazer Major 16 X1 MD62736 | |
| PCMark 10 / Digital Content Creation | |
| Chuwi Gamebook, R9 9955HX | |
| Durchschnittliche AMD Ryzen 9 9955HX, NVIDIA GeForce RTX 5070 Ti Laptop (14454 - 18192, n=3) | |
| Schenker XMG Pro 16 (E25) | |
| Lenovo Legion 5 Pro 16IAX10H | |
| Acer Predator Helios Neo 16S AI PHN16S-71-94L9 | |
| Schenker XMG APEX 16 MAX | |
| Durchschnitt der Klasse Gaming (7602 - 19657, n=97, der letzten 2 Jahre) | |
| Medion Erazer Major 16 X1 MD62736 | |
| MSI Vector 16 HX AI A2XWHG | |
| CrossMark / Overall | |
| Chuwi Gamebook, R9 9955HX | |
| Schenker XMG Pro 16 (E25) | |
| Lenovo Legion 5 Pro 16IAX10H | |
| Durchschnittliche AMD Ryzen 9 9955HX, NVIDIA GeForce RTX 5070 Ti Laptop (2111 - 2215, n=3) | |
| Acer Predator Helios Neo 16S AI PHN16S-71-94L9 | |
| Schenker XMG APEX 16 MAX | |
| Medion Erazer Major 16 X1 MD62736 | |
| Durchschnitt der Klasse Gaming (1366 - 2409, n=96, der letzten 2 Jahre) | |
| MSI Vector 16 HX AI A2XWHG | |
| CrossMark / Productivity | |
| Lenovo Legion 5 Pro 16IAX10H | |
| Schenker XMG Pro 16 (E25) | |
| Chuwi Gamebook, R9 9955HX | |
| Acer Predator Helios Neo 16S AI PHN16S-71-94L9 | |
| Medion Erazer Major 16 X1 MD62736 | |
| Durchschnittliche AMD Ryzen 9 9955HX, NVIDIA GeForce RTX 5070 Ti Laptop (1882 - 1999, n=3) | |
| Schenker XMG APEX 16 MAX | |
| Durchschnitt der Klasse Gaming (1386 - 2254, n=96, der letzten 2 Jahre) | |
| MSI Vector 16 HX AI A2XWHG | |
| CrossMark / Creativity | |
| Durchschnittliche AMD Ryzen 9 9955HX, NVIDIA GeForce RTX 5070 Ti Laptop (2592 - 2660, n=3) | |
| Chuwi Gamebook, R9 9955HX | |
| Schenker XMG APEX 16 MAX | |
| Schenker XMG Pro 16 (E25) | |
| Lenovo Legion 5 Pro 16IAX10H | |
| Acer Predator Helios Neo 16S AI PHN16S-71-94L9 | |
| Medion Erazer Major 16 X1 MD62736 | |
| MSI Vector 16 HX AI A2XWHG | |
| Durchschnitt der Klasse Gaming (1343 - 2729, n=96, der letzten 2 Jahre) | |
| CrossMark / Responsiveness | |
| Chuwi Gamebook, R9 9955HX | |
| Lenovo Legion 5 Pro 16IAX10H | |
| Schenker XMG Pro 16 (E25) | |
| Acer Predator Helios Neo 16S AI PHN16S-71-94L9 | |
| Medion Erazer Major 16 X1 MD62736 | |
| Durchschnittliche AMD Ryzen 9 9955HX, NVIDIA GeForce RTX 5070 Ti Laptop (1608 - 1854, n=3) | |
| Durchschnitt der Klasse Gaming (1226 - 2334, n=96, der letzten 2 Jahre) | |
| Schenker XMG APEX 16 MAX | |
| MSI Vector 16 HX AI A2XWHG | |
| WebXPRT 3 / Overall | |
| Lenovo Legion 5 Pro 16IAX10H | |
| Schenker XMG Pro 16 (E25) | |
| Durchschnittliche AMD Ryzen 9 9955HX, NVIDIA GeForce RTX 5070 Ti Laptop (328 - 361, n=3) | |
| Chuwi Gamebook, R9 9955HX | |
| Acer Predator Helios Neo 16S AI PHN16S-71-94L9 | |
| Schenker XMG APEX 16 MAX | |
| Medion Erazer Major 16 X1 MD62736 | |
| MSI Vector 16 HX AI A2XWHG | |
| Durchschnitt der Klasse Gaming (242 - 532, n=99, der letzten 2 Jahre) | |
| WebXPRT 4 / Overall | |
| Schenker XMG Pro 16 (E25) | |
| Lenovo Legion 5 Pro 16IAX10H | |
| Medion Erazer Major 16 X1 MD62736 | |
| Acer Predator Helios Neo 16S AI PHN16S-71-94L9 | |
| MSI Vector 16 HX AI A2XWHG | |
| Durchschnittliche AMD Ryzen 9 9955HX, NVIDIA GeForce RTX 5070 Ti Laptop (282 - 322, n=3) | |
| Chuwi Gamebook, R9 9955HX | |
| Durchschnitt der Klasse Gaming (176.4 - 354, n=99, der letzten 2 Jahre) | |
| Schenker XMG APEX 16 MAX | |
| Mozilla Kraken 1.1 / Total | |
| Durchschnitt der Klasse Gaming (391 - 590, n=104, der letzten 2 Jahre) | |
| Schenker XMG APEX 16 MAX | |
| MSI Vector 16 HX AI A2XWHG | |
| Medion Erazer Major 16 X1 MD62736 | |
| Durchschnittliche AMD Ryzen 9 9955HX, NVIDIA GeForce RTX 5070 Ti Laptop (403 - 440, n=3) | |
| Lenovo Legion 5 Pro 16IAX10H | |
| Acer Predator Helios Neo 16S AI PHN16S-71-94L9 | |
| Schenker XMG Pro 16 (E25) | |
| Chuwi Gamebook, R9 9955HX | |
* ... kleinere Werte sind besser
| PCMark 10 Score | 10060 Punkte | |
Hilfe | ||
| AIDA64 / Memory Copy | |
| Acer Predator Helios Neo 16S AI PHN16S-71-94L9 | |
| Schenker XMG Pro 16 (E25) | |
| Lenovo Legion 5 Pro 16IAX10H | |
| Medion Erazer Major 16 X1 MD62736 | |
| Durchschnitt der Klasse Gaming (21750 - 129946, n=107, der letzten 2 Jahre) | |
| MSI Vector 16 HX AI A2XWHG | |
| Schenker XMG APEX 16 MAX | |
| Chuwi Gamebook, R9 9955HX | |
| Durchschnittliche AMD Ryzen 9 9955HX (53598 - 62777, n=9) | |
| AIDA64 / Memory Read | |
| Schenker XMG Pro 16 (E25) | |
| Acer Predator Helios Neo 16S AI PHN16S-71-94L9 | |
| Lenovo Legion 5 Pro 16IAX10H | |
| Medion Erazer Major 16 X1 MD62736 | |
| MSI Vector 16 HX AI A2XWHG | |
| Durchschnitt der Klasse Gaming (22956 - 118858, n=107, der letzten 2 Jahre) | |
| Schenker XMG APEX 16 MAX | |
| Durchschnittliche AMD Ryzen 9 9955HX (63953 - 67256, n=9) | |
| Chuwi Gamebook, R9 9955HX | |
| AIDA64 / Memory Write | |
| Medion Erazer Major 16 X1 MD62736 | |
| Acer Predator Helios Neo 16S AI PHN16S-71-94L9 | |
| Schenker XMG Pro 16 (E25) | |
| Lenovo Legion 5 Pro 16IAX10H | |
| Durchschnitt der Klasse Gaming (22297 - 135096, n=107, der letzten 2 Jahre) | |
| Schenker XMG APEX 16 MAX | |
| Durchschnittliche AMD Ryzen 9 9955HX (65421 - 72060, n=9) | |
| Chuwi Gamebook, R9 9955HX | |
| MSI Vector 16 HX AI A2XWHG | |
| AIDA64 / Memory Latency | |
| Lenovo Legion 5 Pro 16IAX10H | |
| Acer Predator Helios Neo 16S AI PHN16S-71-94L9 | |
| Medion Erazer Major 16 X1 MD62736 | |
| Durchschnitt der Klasse Gaming (75.3 - 259, n=107, der letzten 2 Jahre) | |
| MSI Vector 16 HX AI A2XWHG | |
| Schenker XMG Pro 16 (E25) | |
| Chuwi Gamebook, R9 9955HX | |
| Durchschnittliche AMD Ryzen 9 9955HX (92.1 - 103.5, n=9) | |
| Schenker XMG APEX 16 MAX | |
* ... kleinere Werte sind besser
DPC-Latenzen
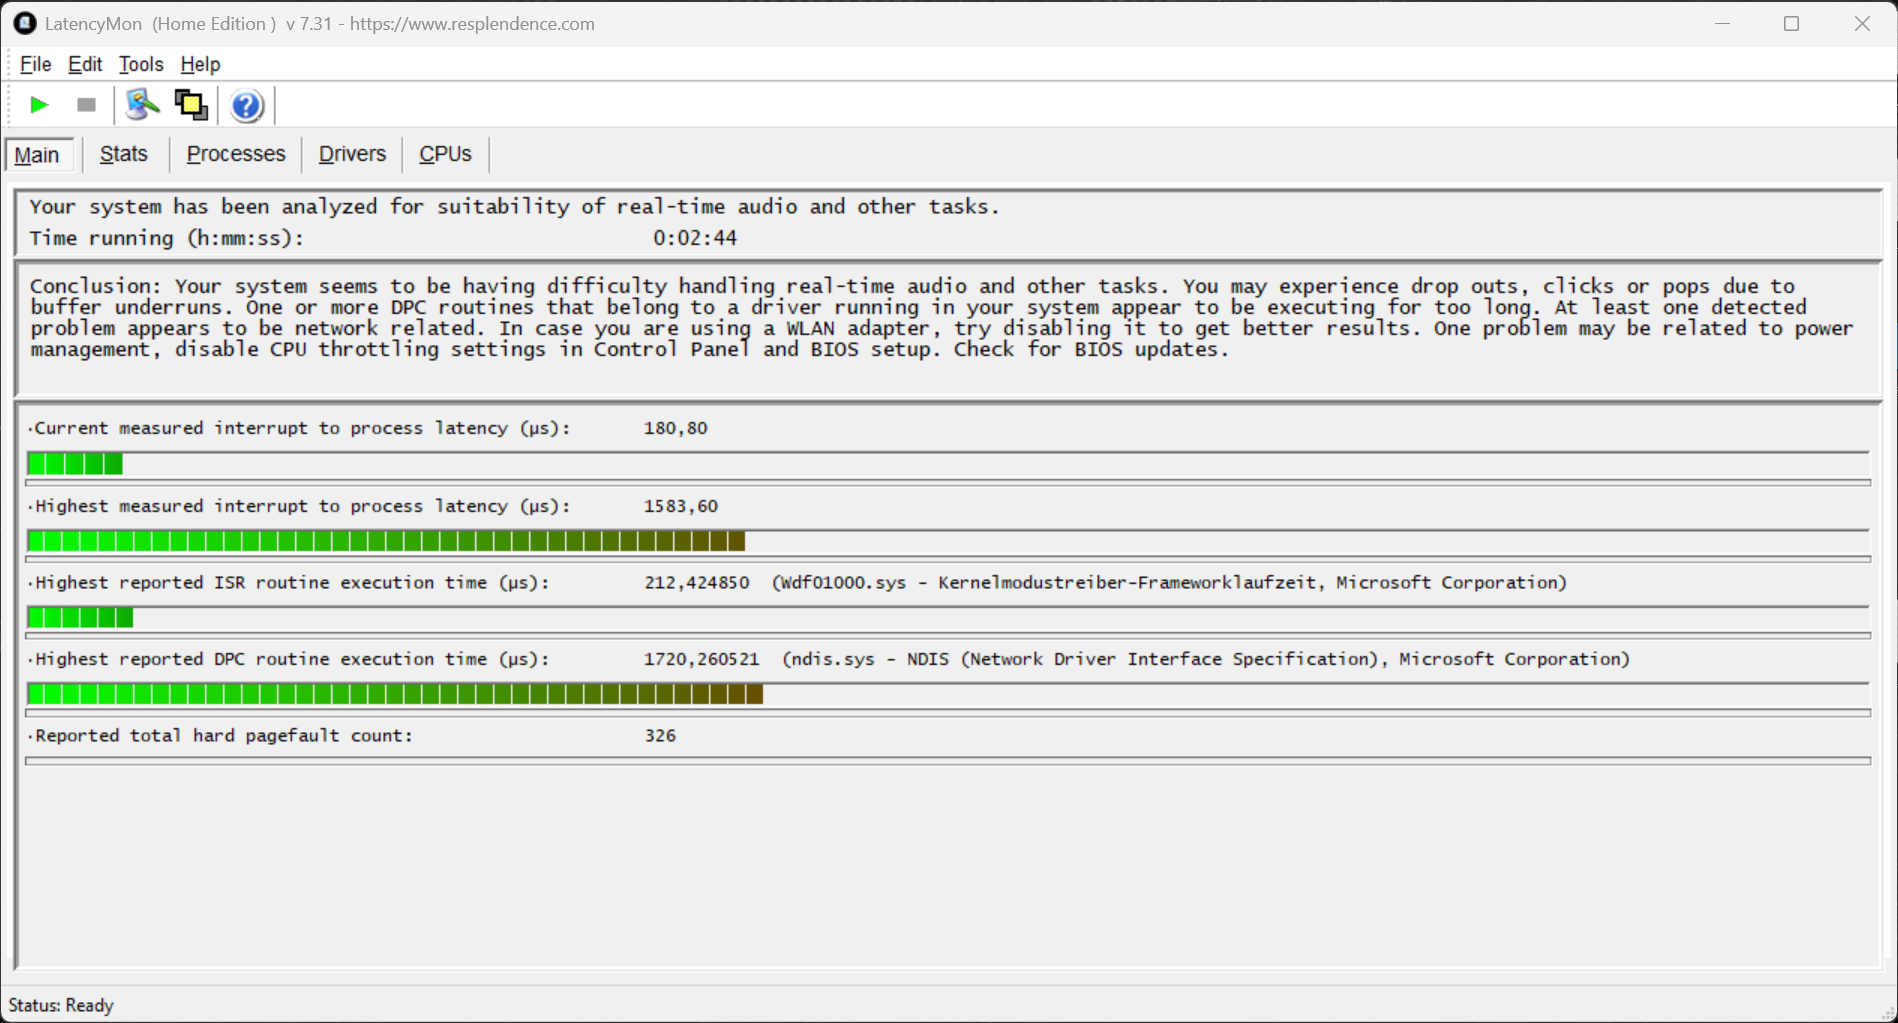
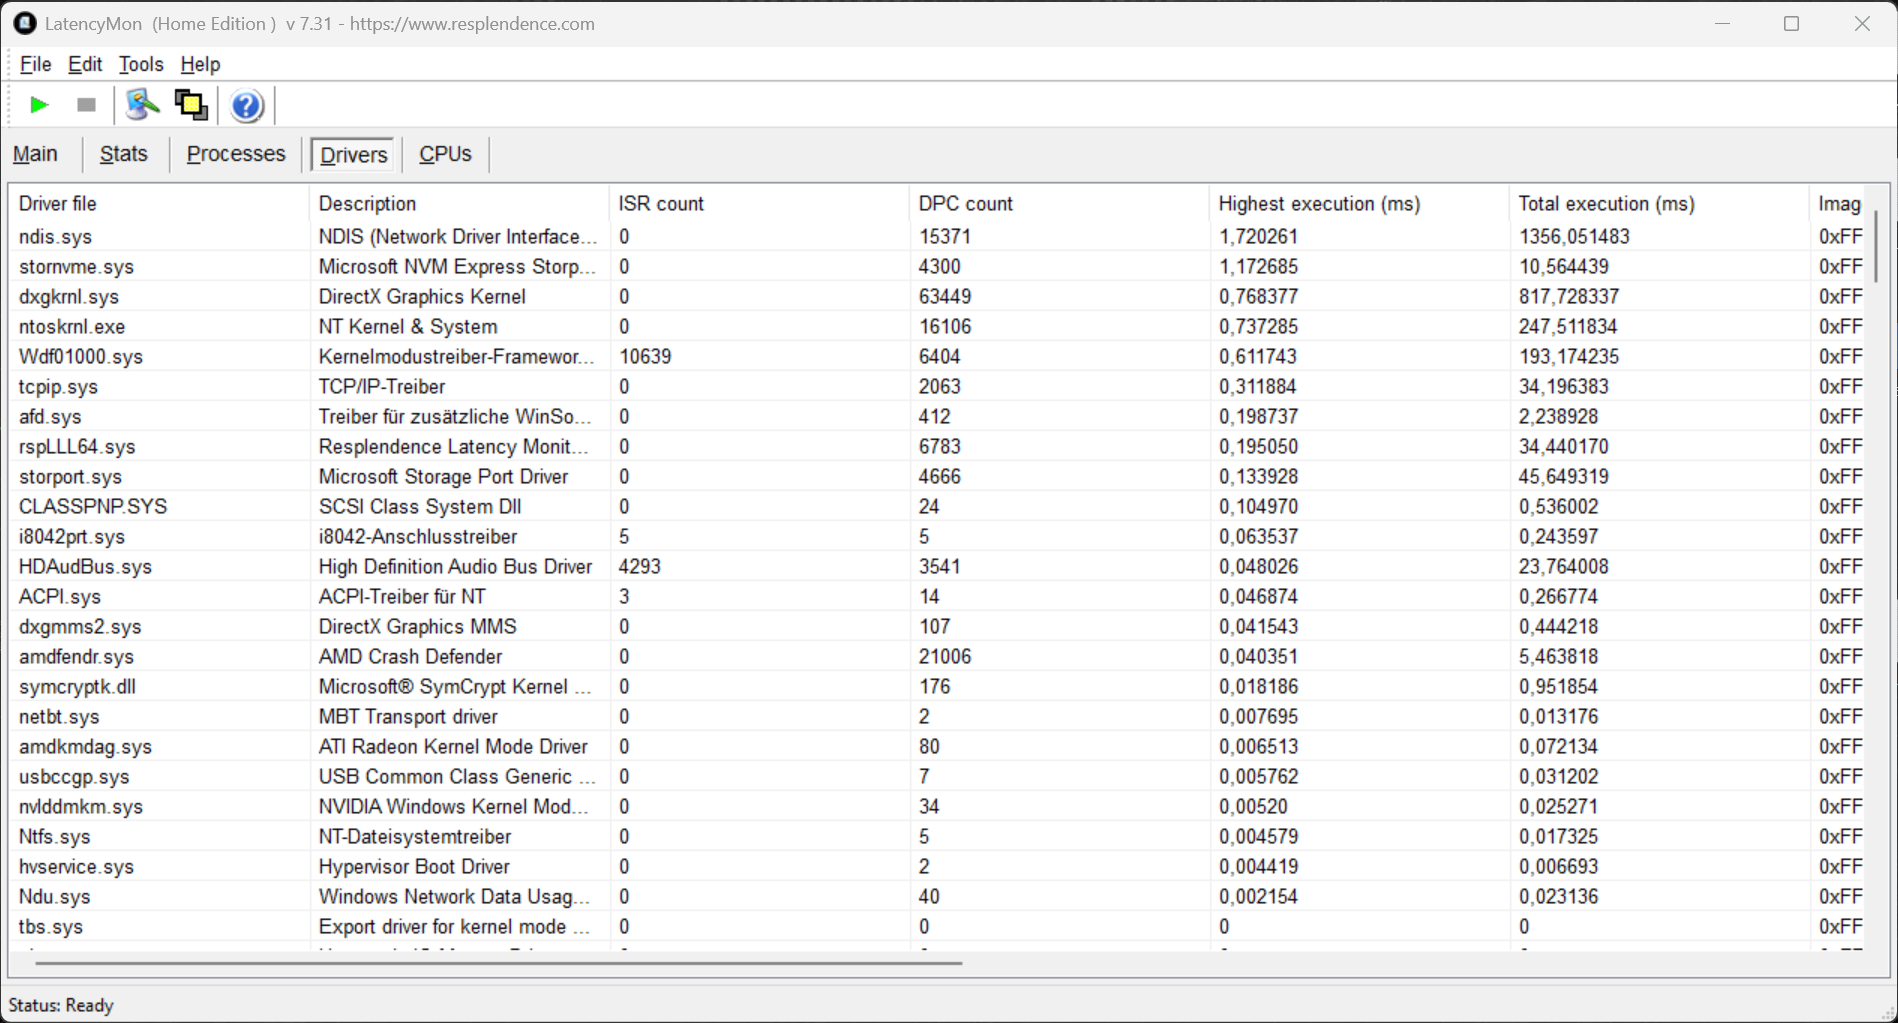
| DPC Latencies / LatencyMon - interrupt to process latency (max), Web, Youtube, Prime95 | |
| Chuwi Gamebook, R9 9955HX | |
| MSI Vector 16 HX AI A2XWHG | |
| Medion Erazer Major 16 X1 MD62736 | |
| Acer Predator Helios Neo 16S AI PHN16S-71-94L9 | |
| Schenker XMG Pro 16 (E25) | |
| Schenker XMG APEX 16 MAX | |
| Lenovo Legion 5 Pro 16IAX10H | |
* ... kleinere Werte sind besser
Massenspeicher
Das Apex 16 Max unterstützt bereits PCIe 5.0 und im Testsystem ist eine entsprechende Samsung 9100 Pro (2 TB, 1,73 TB nutzbar) verbaut. Die Leistung ist sehr gut und bleibt zudem stabil. Der zweite M.2-2280-Slot ist via PCIe 4.0 angebunden.

* ... kleinere Werte sind besser
Dauerleistung Lesen: DiskSpd Read Loop, Queue Depth 8
GPU Leistung
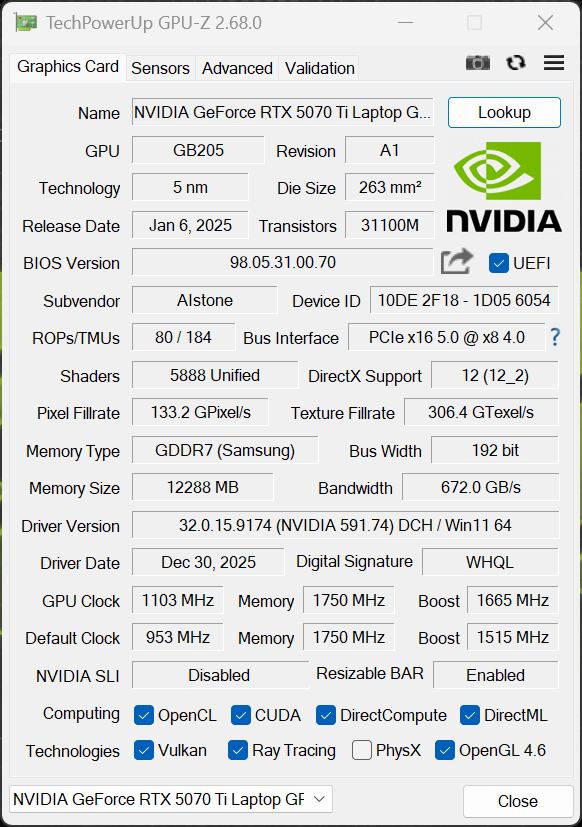
XMG verbaut die schnellste 140-Watt-Version der mobilen GeForce RTX 5070 Ti mit 12 GB VRAM. Die Grafikumschaltung erfolgt via Optimus, ein MUX-Schalter ist aber verbaut. Die Grafikleistung ist insgesamt sehr gut und bleibt auch bei längerer Belastung vollkommen stabil. Im Akkubetrieb (40 Watt) ist die Leistung rund 60 % geringer.
| 3DMark 11 Performance | 45731 Punkte | |
| 3DMark Fire Strike Score | 39568 Punkte | |
| 3DMark Time Spy Score | 17095 Punkte | |
| 3DMark Steel Nomad Score | 3953 Punkte | |
| 3DMark Steel Nomad Light Score | 18188 Punkte | |
Hilfe | ||
| Blender / v3.3 Classroom OPTIX/RTX | |
| Durchschnitt der Klasse Gaming (9 - 32, n=109, der letzten 2 Jahre) | |
| Acer Predator Helios Neo 16S AI PHN16S-71-94L9 | |
| MSI Vector 16 HX AI A2XWHG | |
| Medion Erazer Major 16 X1 MD62736 | |
| Schenker XMG APEX 16 MAX | |
| Durchschnittliche NVIDIA GeForce RTX 5070 Ti Laptop (13 - 19, n=14) | |
| Lenovo Legion 5 Pro 16IAX10H | |
| Schenker XMG Pro 16 (E25) | |
| Chuwi Gamebook, R9 9955HX | |
| Blender / v3.3 Classroom CUDA | |
| Durchschnitt der Klasse Gaming (15 - 228, n=109, der letzten 2 Jahre) | |
| Acer Predator Helios Neo 16S AI PHN16S-71-94L9 | |
| Schenker XMG APEX 16 MAX | |
| Durchschnittliche NVIDIA GeForce RTX 5070 Ti Laptop (24 - 33, n=14) | |
| Schenker XMG Pro 16 (E25) | |
| Medion Erazer Major 16 X1 MD62736 | |
| MSI Vector 16 HX AI A2XWHG | |
| Lenovo Legion 5 Pro 16IAX10H | |
| Chuwi Gamebook, R9 9955HX | |
| Blender / v3.3 Classroom CPU | |
| Durchschnitt der Klasse Gaming (122 - 565, n=105, der letzten 2 Jahre) | |
| MSI Vector 16 HX AI A2XWHG | |
| Durchschnittliche NVIDIA GeForce RTX 5070 Ti Laptop (122 - 361, n=14) | |
| Acer Predator Helios Neo 16S AI PHN16S-71-94L9 | |
| Medion Erazer Major 16 X1 MD62736 | |
| Lenovo Legion 5 Pro 16IAX10H | |
| Schenker XMG Pro 16 (E25) | |
| Chuwi Gamebook, R9 9955HX | |
| Schenker XMG APEX 16 MAX | |
* ... kleinere Werte sind besser
Gaming Performance
Die Gaming-Performance ist sehr gut und alle modernen Spiele laufen problemlos in der höchsten Detailstufe und der nativen Auflösung. Lediglich für Raytracing ist teilweise DLSS bzw. Frame Generation erforderlich. Die Gaming-Leistung bleibt zudem vollkommen stabil.
| Strange Brigade - 1920x1080 ultra AA:ultra AF:16 | |
| Lenovo Legion 5 Pro 16IAX10H | |
| Schenker XMG APEX 16 MAX | |
| Chuwi Gamebook, R9 9955HX | |
| Durchschnitt der Klasse Gaming (76.3 - 456, n=91, der letzten 2 Jahre) | |
| Schenker XMG Pro 16 (E25) | |
| F1 24 | |
| 2560x1440 Ultra High Preset AA:T AF:16x | |
| Schenker XMG APEX 16 MAX | |
| Durchschnitt der Klasse Gaming (29.8 - 106.9, n=59, der letzten 2 Jahre) | |
| Schenker XMG Pro 16 (E25) | |
| Chuwi Gamebook, R9 9955HX | |
| Durchschnittliche NVIDIA GeForce RTX 5070 Ti Laptop (53.2 - 72.1, n=10) | |
| 2560x1440 Ultra High Preset + Quality DLSS AF:16x | |
| Schenker XMG APEX 16 MAX | |
| Chuwi Gamebook, R9 9955HX | |
| Durchschnitt der Klasse Gaming (14.3 - 159.3, n=49, der letzten 2 Jahre) | |
| Durchschnittliche NVIDIA GeForce RTX 5070 Ti Laptop (78.1 - 115.8, n=9) | |
| F1 25 | |
| 2560x1440 Ultra Max Preset AA:T AF:16x | |
| Schenker XMG APEX 16 MAX | |
| Chuwi Gamebook, R9 9955HX | |
| Durchschnittliche NVIDIA GeForce RTX 5070 Ti Laptop (18 - 26, n=7) | |
| Durchschnitt der Klasse Gaming (5 - 37.5, n=24, der letzten 2 Jahre) | |
| Lenovo Legion 5 Pro 16IAX10H | |
| 2560x1440 Ultra Max Preset + DLSS Quality AA:DLSS AF:16x | |
| Schenker XMG APEX 16 MAX | |
| Chuwi Gamebook, R9 9955HX | |
| Durchschnittliche NVIDIA GeForce RTX 5070 Ti Laptop (32 - 48.1, n=7) | |
| Durchschnitt der Klasse Gaming (9 - 67.5, n=22, der letzten 2 Jahre) | |
| Lenovo Legion 5 Pro 16IAX10H | |

Cyberpunk 2077 ultra FPS-Diagramm
| min. | mittel | hoch | max. | QHD DLSS | QHD | |
|---|---|---|---|---|---|---|
| GTA V (2015) | 166.3 | 157.3 | ||||
| Dota 2 Reborn (2015) | 259 | 240 | 209 | 188.4 | ||
| Final Fantasy XV Benchmark (2018) | 232 | 211 | 158.2 | 121.8 | ||
| X-Plane 11.11 (2018) | 155.8 | 123.9 | 105.6 | |||
| Strange Brigade (2018) | 579 | 468 | 387 | 340 | 236 | |
| Baldur's Gate 3 (2023) | 221 | 178.7 | 157.5 | 155.6 | 110.5 | |
| Cyberpunk 2077 (2023) | 183.7 | 164.6 | 140.6 | 128 | 96.1 | 82.9 |
| F1 24 (2024) | 315 | 270 | 110.6 | 112.4 | 72 | |
| F1 25 (2025) | 249 | 231 | 218 | 42.9 | 48.1 | 26 |
| Call of Duty Black Ops 7 (2025) | 239 | 188 | 151 | 60 | 39 |
Emissionen & Energie
Geräuschemissionen

Die Lüfterlautstärke hängt maßgeblich vom Leistungsmodus ab. Vor allem im Alltag macht der Balanced-Modus am meisten Sinn, da die Lüfter hier entweder deaktiviert sind oder nur leise vor sich hin rauschen. Im Overboost-Normal-Modus wird es dann beim Spielen mit 51 dB(A) sehr laut (Overboost Extreme: 55 dB(A), Enthusiast: 47,9 dB(A), Balanced: 43,3 dB(A), Akku: 35,8 dB(A)). Spulenfiepen gab es beim Testgerät nicht.
Lautstärkediagramm
| Idle |
| 25.9 / 26.5 / 26.5 dB(A) |
| Last |
| 42.1 / 51 dB(A) |
 | ||
30 dB leise 40 dB(A) deutlich hörbar 50 dB(A) störend |
||
min: | ||
| Schenker XMG APEX 16 MAX R9 9955HX, GeForce RTX 5070 Ti Laptop | Acer Predator Helios Neo 16S AI PHN16S-71-94L9 Ultra 9 275HX, GeForce RTX 5070 Ti Laptop | Chuwi Gamebook, R9 9955HX R9 9955HX, GeForce RTX 5070 Ti Laptop | Medion Erazer Major 16 X1 MD62736 Ultra 7 255HX, GeForce RTX 5070 Ti Laptop | Lenovo Legion 5 Pro 16IAX10H Ultra 9 275HX, GeForce RTX 5070 Ti Laptop | MSI Vector 16 HX AI A2XWHG Ultra 7 255HX, GeForce RTX 5070 Ti Laptop | Schenker XMG Pro 16 (E25) Ultra 9 275HX, GeForce RTX 5070 Ti Laptop | |
|---|---|---|---|---|---|---|---|
| Geräuschentwicklung | -9% | -3% | -7% | -7% | -13% | 1% | |
| aus / Umgebung * (dB) | 25.9 | 24 7% | 25 3% | 25 3% | 24 7% | 25 3% | 23.3 10% |
| Idle min * (dB) | 25.9 | 24 7% | 26.3 -2% | 26 -0% | 24 7% | 33 -27% | 25 3% |
| Idle avg * (dB) | 26.5 | 30 -13% | 26.5 -0% | 27 -2% | 24 9% | 34 -28% | 25 6% |
| Idle max * (dB) | 26.5 | 35 -32% | 27.3 -3% | 30 -13% | 30.9 -17% | 38 -43% | 25 6% |
| Last avg * (dB) | 42.1 | 53 -26% | 50.4 -20% | 53 -26% | 55.9 -33% | 46 -9% | 45.5 -8% |
| Cyberpunk 2077 ultra * (dB) | 51 | 52 -2% | 50.3 1% | 54 -6% | 56.72 -11% | 47 8% | 53.3 -5% |
| Last max * (dB) | 51 | 54 -6% | 50.4 1% | 54 -6% | 56.72 -11% | 49 4% | 53.3 -5% |
| Witcher 3 ultra * (dB) | 50.4 |
* ... kleinere Werte sind besser
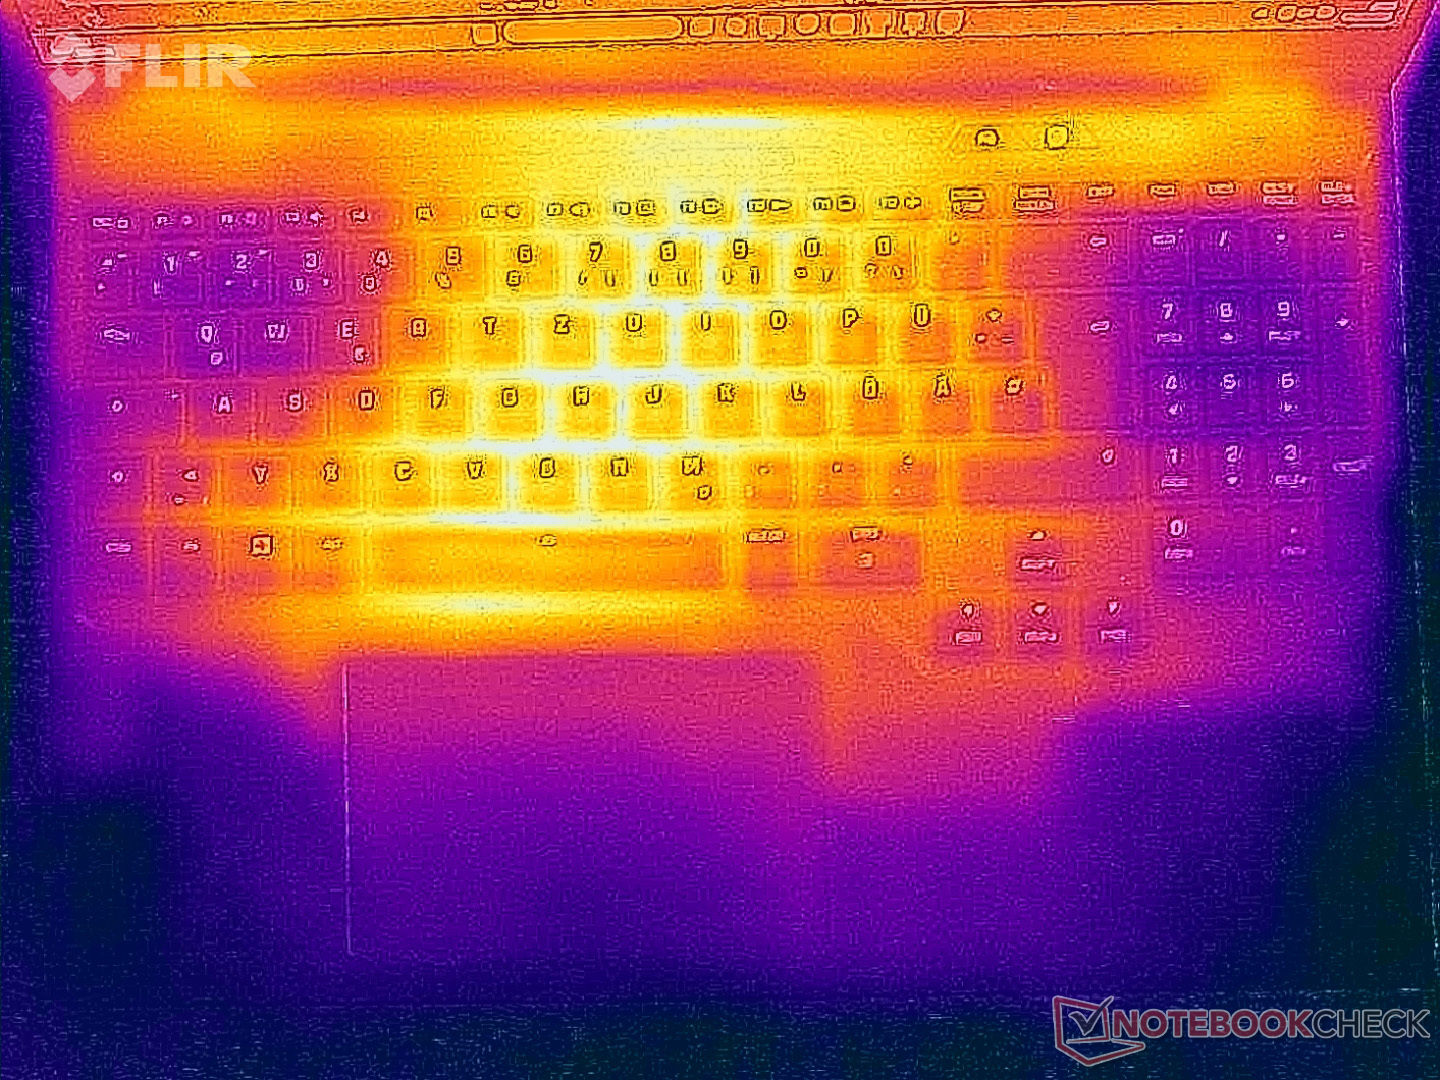
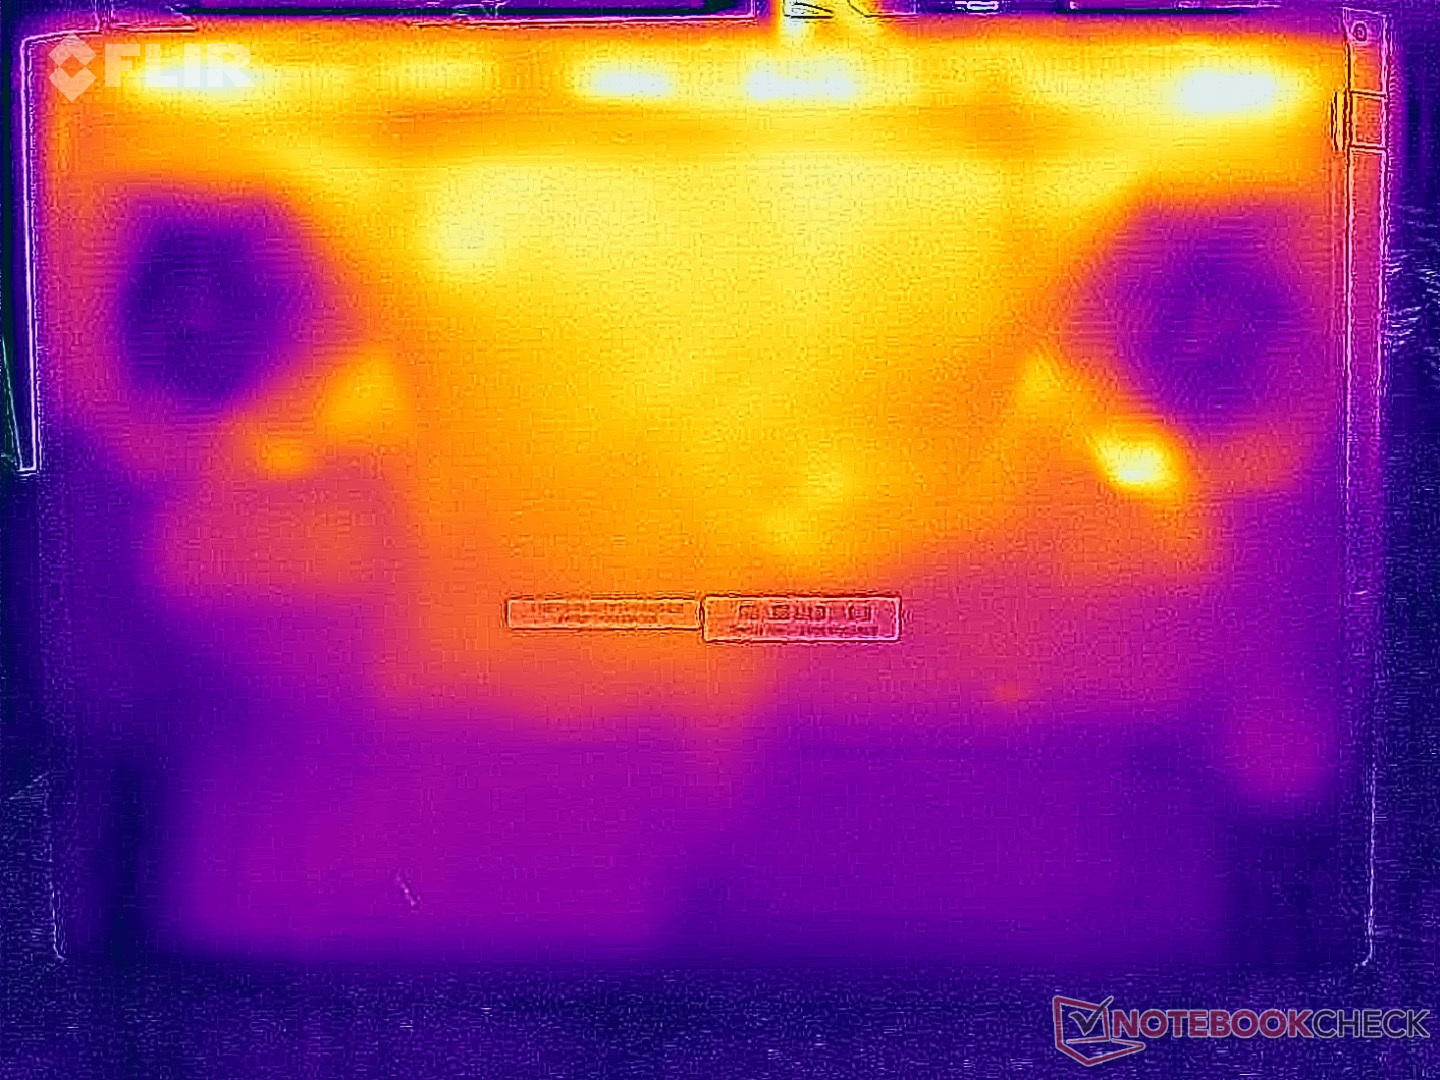
Temperatur
Die Oberflächentemperaturen sind insgesamt unbedenklich. Unter hoher Last messen wir zwar sowohl auf der Ober- als auch der Unterseite bis zu 46 °C, doch Einschränkungen gibt es dadurch noch nicht. Im Stresstest wird die GPU bevorzugt (volle 140 Watt bei 80 °C), während sich die CPU bei 45 Watt (70 °C) einpendelt.

(-) Die maximale Temperatur auf der Oberseite ist 46.5 °C. Im Vergleich liegt der Klassendurchschnitt bei 40.4 °C (von 21.2 bis 68.8 °C für die Klasse Gaming).
(-) Auf der Unterseite messen wir eine maximalen Wert von 46.4 °C (im Vergleich zum Durchschnitt von 43.2 °C).
(+) Ohne Last messen wir eine durchschnittliche Temperatur von 30.1 °C auf der Oberseite. Der Klassendurchschnitt erreicht 33.9 °C.
(-) 3: The average temperature for the upper side is 40 °C / 104 F, compared to the average of 33.9 °C / 93 F for the class Gaming.
(+) Die Handballen und der Touchpad-Bereich erreichen maximal 35.4 °C und damit die typische Hauttemperatur und fühlen sich daher nicht heiß an.
(-) Die durchschnittliche Handballen-Temperatur anderer getesteter Geräte war 28.8 °C (-6.6 °C).
| Schenker XMG APEX 16 MAX R9 9955HX, GeForce RTX 5070 Ti Laptop | Acer Predator Helios Neo 16S AI PHN16S-71-94L9 Ultra 9 275HX, GeForce RTX 5070 Ti Laptop | Chuwi Gamebook, R9 9955HX R9 9955HX, GeForce RTX 5070 Ti Laptop | Medion Erazer Major 16 X1 MD62736 Ultra 7 255HX, GeForce RTX 5070 Ti Laptop | Lenovo Legion 5 Pro 16IAX10H Ultra 9 275HX, GeForce RTX 5070 Ti Laptop | MSI Vector 16 HX AI A2XWHG Ultra 7 255HX, GeForce RTX 5070 Ti Laptop | Schenker XMG Pro 16 (E25) Ultra 9 275HX, GeForce RTX 5070 Ti Laptop | |
|---|---|---|---|---|---|---|---|
| Hitze | 2% | -5% | -9% | -14% | -4% | -167% | |
| Last oben max * (°C) | 46.5 | 47 -1% | 51.8 -11% | 49 -5% | 48 -3% | 53 -14% | 43.2 7% |
| Last unten max * (°C) | 46.4 | 55 -19% | 46.6 -0% | 50 -8% | 50 -8% | 52 -12% | 46 1% |
| Idle oben max * (°C) | 32.1 | 28 13% | 34.9 -9% | 36 -12% | 38 -18% | 33 -3% | 27.7 14% |
| Idle unten max * (°C) | 33.5 | 29 13% | 33.4 -0% | 37 -10% | 42 -25% | 29 13% | 264 -688% |
* ... kleinere Werte sind besser
Lautsprecher
Schenker XMG APEX 16 MAX Audio Analyse
(±) | Mittelmäßig laut spielende Lautsprecher (78.3 dB)
Bass 100 - 315 Hz
(-) | kaum Bass - 16.7% niedriger als der Median
(±) | durchschnittlich lineare Bass-Wiedergabe (10.3% Delta zum Vorgänger)
Mitteltöne 400 - 2000 Hz
(±) | zu hohe Mitten, vom Median 5.6% abweichend
(+) | lineare Mitten (4.2% Delta zum Vorgänger)
Hochtöne 2 - 16 kHz
(+) | ausgeglichene Hochtöne, vom Median nur 2.2% abweichend
(+) | sehr lineare Hochtöne (6.2% Delta zum Vorgänger)
Gesamt im hörbaren Bereich 100 - 16.000 Hz
(±) | hörbarer Bereich ist durchschnittlich linear (16.8% Abstand zum Median)
Im Vergleich zu allen Geräten derselben Klasse
» 44% aller getesteten Geräte dieser Klasse waren besser, 11% vergleichbar, 46% schlechter
» Das beste Gerät hat einen Delta-Wert von 6%, durchschnittlich ist 18%, das schlechteste Gerät hat 132%
Im Vergleich zu allen Geräten im Test
» 29% aller getesteten Geräte waren besser, 8% vergleichbar, 63% schlechter
» Das beste Gerät hat einen Delta-Wert von 4%, durchschnittlich ist 24%, das schlechteste Gerät hat 134%
Acer Predator Helios Neo 16S AI PHN16S-71-94L9 Audio Analyse
(+) | Die Lautsprecher können relativ laut spielen (86 dB)
Bass 100 - 315 Hz
(-) | kaum Bass - 24.8% niedriger als der Median
(±) | durchschnittlich lineare Bass-Wiedergabe (12.6% Delta zum Vorgänger)
Mitteltöne 400 - 2000 Hz
(±) | zu hohe Mitten, vom Median 5.9% abweichend
(+) | lineare Mitten (6.4% Delta zum Vorgänger)
Hochtöne 2 - 16 kHz
(+) | ausgeglichene Hochtöne, vom Median nur 2.8% abweichend
(+) | sehr lineare Hochtöne (5.9% Delta zum Vorgänger)
Gesamt im hörbaren Bereich 100 - 16.000 Hz
(±) | hörbarer Bereich ist durchschnittlich linear (17.3% Abstand zum Median)
Im Vergleich zu allen Geräten derselben Klasse
» 47% aller getesteten Geräte dieser Klasse waren besser, 12% vergleichbar, 41% schlechter
» Das beste Gerät hat einen Delta-Wert von 6%, durchschnittlich ist 18%, das schlechteste Gerät hat 132%
Im Vergleich zu allen Geräten im Test
» 32% aller getesteten Geräte waren besser, 8% vergleichbar, 59% schlechter
» Das beste Gerät hat einen Delta-Wert von 4%, durchschnittlich ist 24%, das schlechteste Gerät hat 134%
Chuwi Gamebook, R9 9955HX Audio Analyse
(±) | Mittelmäßig laut spielende Lautsprecher (75.7 dB)
Bass 100 - 315 Hz
(-) | kaum Bass - 18.7% niedriger als der Median
(±) | durchschnittlich lineare Bass-Wiedergabe (10.3% Delta zum Vorgänger)
Mitteltöne 400 - 2000 Hz
(±) | zu hohe Mitten, vom Median 7.2% abweichend
(±) | Linearität der Mitten ist durchschnittlich (9.9% Delta zum Vorgänger)
Hochtöne 2 - 16 kHz
(+) | ausgeglichene Hochtöne, vom Median nur 3.2% abweichend
(±) | durchschnittlich lineare Hochtöne (8.1% Delta zum Vorgänger)
Gesamt im hörbaren Bereich 100 - 16.000 Hz
(±) | hörbarer Bereich ist durchschnittlich linear (21.2% Abstand zum Median)
Im Vergleich zu allen Geräten derselben Klasse
» 76% aller getesteten Geräte dieser Klasse waren besser, 4% vergleichbar, 19% schlechter
» Das beste Gerät hat einen Delta-Wert von 6%, durchschnittlich ist 18%, das schlechteste Gerät hat 132%
Im Vergleich zu allen Geräten im Test
» 59% aller getesteten Geräte waren besser, 7% vergleichbar, 34% schlechter
» Das beste Gerät hat einen Delta-Wert von 4%, durchschnittlich ist 24%, das schlechteste Gerät hat 134%
Medion Erazer Major 16 X1 MD62736 Audio Analyse
(+) | Die Lautsprecher können relativ laut spielen (82 dB)
Bass 100 - 315 Hz
(-) | kaum Bass - 19.4% niedriger als der Median
(±) | durchschnittlich lineare Bass-Wiedergabe (13.5% Delta zum Vorgänger)
Mitteltöne 400 - 2000 Hz
(±) | zu hohe Mitten, vom Median 8.4% abweichend
(±) | Linearität der Mitten ist durchschnittlich (9.1% Delta zum Vorgänger)
Hochtöne 2 - 16 kHz
(+) | ausgeglichene Hochtöne, vom Median nur 4.2% abweichend
(+) | sehr lineare Hochtöne (6.4% Delta zum Vorgänger)
Gesamt im hörbaren Bereich 100 - 16.000 Hz
(±) | hörbarer Bereich ist durchschnittlich linear (20.8% Abstand zum Median)
Im Vergleich zu allen Geräten derselben Klasse
» 75% aller getesteten Geräte dieser Klasse waren besser, 4% vergleichbar, 21% schlechter
» Das beste Gerät hat einen Delta-Wert von 6%, durchschnittlich ist 18%, das schlechteste Gerät hat 132%
Im Vergleich zu allen Geräten im Test
» 56% aller getesteten Geräte waren besser, 8% vergleichbar, 36% schlechter
» Das beste Gerät hat einen Delta-Wert von 4%, durchschnittlich ist 24%, das schlechteste Gerät hat 134%
Lenovo Legion 5 Pro 16IAX10H Audio Analyse
(±) | Mittelmäßig laut spielende Lautsprecher (78.2 dB)
Bass 100 - 315 Hz
(-) | kaum Bass - 21.1% niedriger als der Median
(±) | durchschnittlich lineare Bass-Wiedergabe (8% Delta zum Vorgänger)
Mitteltöne 400 - 2000 Hz
(±) | zu hohe Mitten, vom Median 6.3% abweichend
(+) | lineare Mitten (6.5% Delta zum Vorgänger)
Hochtöne 2 - 16 kHz
(+) | ausgeglichene Hochtöne, vom Median nur 1.6% abweichend
(+) | sehr lineare Hochtöne (4.9% Delta zum Vorgänger)
Gesamt im hörbaren Bereich 100 - 16.000 Hz
(±) | hörbarer Bereich ist durchschnittlich linear (18.3% Abstand zum Median)
Im Vergleich zu allen Geräten derselben Klasse
» 58% aller getesteten Geräte dieser Klasse waren besser, 9% vergleichbar, 33% schlechter
» Das beste Gerät hat einen Delta-Wert von 6%, durchschnittlich ist 18%, das schlechteste Gerät hat 132%
Im Vergleich zu allen Geräten im Test
» 40% aller getesteten Geräte waren besser, 8% vergleichbar, 52% schlechter
» Das beste Gerät hat einen Delta-Wert von 4%, durchschnittlich ist 24%, das schlechteste Gerät hat 134%
MSI Vector 16 HX AI A2XWHG Audio Analyse
(+) | Die Lautsprecher können relativ laut spielen (86 dB)
Bass 100 - 315 Hz
(±) | abgesenkter Bass - 12.3% geringer als der Median
(±) | durchschnittlich lineare Bass-Wiedergabe (8.5% Delta zum Vorgänger)
Mitteltöne 400 - 2000 Hz
(±) | zu hohe Mitten, vom Median 9.9% abweichend
(+) | lineare Mitten (6.8% Delta zum Vorgänger)
Hochtöne 2 - 16 kHz
(+) | ausgeglichene Hochtöne, vom Median nur 1.8% abweichend
(+) | sehr lineare Hochtöne (2.9% Delta zum Vorgänger)
Gesamt im hörbaren Bereich 100 - 16.000 Hz
(±) | hörbarer Bereich ist durchschnittlich linear (15.8% Abstand zum Median)
Im Vergleich zu allen Geräten derselben Klasse
» 37% aller getesteten Geräte dieser Klasse waren besser, 7% vergleichbar, 56% schlechter
» Das beste Gerät hat einen Delta-Wert von 6%, durchschnittlich ist 18%, das schlechteste Gerät hat 132%
Im Vergleich zu allen Geräten im Test
» 24% aller getesteten Geräte waren besser, 5% vergleichbar, 71% schlechter
» Das beste Gerät hat einen Delta-Wert von 4%, durchschnittlich ist 24%, das schlechteste Gerät hat 134%
Schenker XMG Pro 16 (E25) Audio Analyse
(±) | Mittelmäßig laut spielende Lautsprecher (79.2 dB)
Bass 100 - 315 Hz
(±) | abgesenkter Bass - 14.2% geringer als der Median
(±) | durchschnittlich lineare Bass-Wiedergabe (10.6% Delta zum Vorgänger)
Mitteltöne 400 - 2000 Hz
(±) | zu hohe Mitten, vom Median 8.2% abweichend
(±) | Linearität der Mitten ist durchschnittlich (9.9% Delta zum Vorgänger)
Hochtöne 2 - 16 kHz
(+) | ausgeglichene Hochtöne, vom Median nur 3.8% abweichend
(+) | sehr lineare Hochtöne (5.9% Delta zum Vorgänger)
Gesamt im hörbaren Bereich 100 - 16.000 Hz
(±) | hörbarer Bereich ist durchschnittlich linear (18.5% Abstand zum Median)
Im Vergleich zu allen Geräten derselben Klasse
» 60% aller getesteten Geräte dieser Klasse waren besser, 8% vergleichbar, 32% schlechter
» Das beste Gerät hat einen Delta-Wert von 6%, durchschnittlich ist 18%, das schlechteste Gerät hat 132%
Im Vergleich zu allen Geräten im Test
» 41% aller getesteten Geräte waren besser, 8% vergleichbar, 51% schlechter
» Das beste Gerät hat einen Delta-Wert von 4%, durchschnittlich ist 24%, das schlechteste Gerät hat 134%
Energieaufnahme
Beim Stromverbrauch macht sich vor allem das helle Mini-LED-Panel im Leerlauf bemerkbar. Zu Beginn des Stresstests messen wir kurz bis zu 320 Watt, was sich dann aber bei 242 Watt einpendelt. Das 280-Watt-Netzteil ist daher ausreichend dimensioniert. Der Standby-Verbrauch ist mit mehr als 3 Watt zu hoch.
| Aus / Standby | |
| Idle | |
| Last |
|
Legende:
min: | |
| Schenker XMG APEX 16 MAX R9 9955HX, GeForce RTX 5070 Ti Laptop, Samsung 9100 Pro 2 TB, Mini-LED, 2560x1600, 16" | Acer Predator Helios Neo 16S AI PHN16S-71-94L9 Ultra 9 275HX, GeForce RTX 5070 Ti Laptop, Micron 3500 1TB MTFDKBA1T0TGD, OLED, 2560x1600, 16" | Chuwi Gamebook, R9 9955HX R9 9955HX, GeForce RTX 5070 Ti Laptop, YMTC PC41Q-1TB-B, IPS, 2560x1600, 16" | Medion Erazer Major 16 X1 MD62736 Ultra 7 255HX, GeForce RTX 5070 Ti Laptop, Phison E31 2 TB, IPS, 2560x1600, 16" | Lenovo Legion 5 Pro 16IAX10H Ultra 9 275HX, GeForce RTX 5070 Ti Laptop, Western Digital PC SN8000S SDEPNRK-1T00, OLED, 2560x1600, 16" | MSI Vector 16 HX AI A2XWHG Ultra 7 255HX, GeForce RTX 5070 Ti Laptop, Micron 2400 MTFDKBA512QFM, IPS, 2560x1600, 16" | Schenker XMG Pro 16 (E25) Ultra 9 275HX, GeForce RTX 5070 Ti Laptop, Samsung 9100 Pro 1 TB, IPS, 2560x1600, 16" | Durchschnittliche NVIDIA GeForce RTX 5070 Ti Laptop | Durchschnitt der Klasse Gaming | |
|---|---|---|---|---|---|---|---|---|---|
| Stromverbrauch | 41% | 6% | 8% | 7% | 16% | 16% | 19% | 22% | |
| Idle min * (Watt) | 15.4 | 3.9 75% | 16.4 -6% | 17.8 -16% | 14 9% | 7.1 54% | 11.7 24% | 12.4 ? 19% | 13.2 ? 14% |
| Idle avg * (Watt) | 29.9 | 11 63% | 21.2 29% | 20.7 31% | 14.3 52% | 15.9 47% | 16.6 44% | 19.7 ? 34% | 18.9 ? 37% |
| Idle max * (Watt) | 30.1 | 16.9 44% | 28.3 6% | 23.4 22% | 20.1 33% | 29.5 2% | 17.1 43% | 24.9 ? 17% | 24.3 ? 19% |
| Last avg * (Watt) | 136.4 | 123 10% | 145.6 -7% | 110 19% | 177 -30% | 124 9% | 122.4 10% | 123.6 ? 9% | 108.3 ? 21% |
| Cyberpunk 2077 ultra * (Watt) | 231 | 152.7 34% | 221 4% | 233 -1% | 255 -10% | 222 4% | 245 -6% | ||
| Cyberpunk 2077 ultra external monitor * (Watt) | 226 | 144.9 36% | 218 4% | 232 -3% | 255 -13% | 217 4% | 241 -7% | ||
| Last max * (Watt) | 315 | 229 27% | 284 10% | 297 6% | 294 7% | 336 -7% | 291.5 7% | 272 ? 14% | 254 ? 19% |
* ... kleinere Werte sind besser
Energieaufnahme Cyberpunk / Stresstest
Energieaufnahme mit externem Monitor
Akkulaufzeit
Trotz des großen 99-Wh-Akkus resultiert der hohe Stromverbrauch in kurzen Akkulaufzeiten. Im WLAN-Test mit 150 cd/m² ermitteln wir knapp 5 Stunden und bei voller Helligkeit nur noch knapp 3 Stunden.
| Schenker XMG APEX 16 MAX R9 9955HX, GeForce RTX 5070 Ti Laptop, 99.8 Wh | Acer Predator Helios Neo 16S AI PHN16S-71-94L9 Ultra 9 275HX, GeForce RTX 5070 Ti Laptop, 76 Wh | Chuwi Gamebook, R9 9955HX R9 9955HX, GeForce RTX 5070 Ti Laptop, 77 Wh | Medion Erazer Major 16 X1 MD62736 Ultra 7 255HX, GeForce RTX 5070 Ti Laptop, 80 Wh | Lenovo Legion 5 Pro 16IAX10H Ultra 9 275HX, GeForce RTX 5070 Ti Laptop, 80 Wh | MSI Vector 16 HX AI A2XWHG Ultra 7 255HX, GeForce RTX 5070 Ti Laptop, 90 Wh | Schenker XMG Pro 16 (E25) Ultra 9 275HX, GeForce RTX 5070 Ti Laptop, 99.8 Wh | Durchschnitt der Klasse Gaming | |
|---|---|---|---|---|---|---|---|---|
| Battery Runtime | 2% | 0% | 29% | -4% | 43% | 100% | 66% | |
| WiFi Websurfing (h) | 4.9 | 5 2% | 4.9 0% | 6.3 29% | 4.9 0% | 7 43% | 9.1 86% | 7.04 ? 44% |
| WiFi Websurfing max. Brightness (h) | 2.9 | 2.7 -7% | 6.2 114% | 5.45 ? 88% |
Notebookcheck Gesamtbewertung
Schenker XMG APEX 16 MAX
- 16.01.2026 v8
Andreas Osthoff
 Total Sustainability Score:
 Mögliche Alternativen im Vergleich
Bild | Modell / Test | Preis ab | Gewicht | Dicke | Display |
|---|---|---|---|---|---|
1. 87.8%  | Schenker XMG APEX 16 MAX AMD Ryzen 9 9955HX ⎘ NVIDIA GeForce RTX 5070 Ti Laptop ⎘ 64 GB RAM, 2048 GB SSD | Amazon: 1. 144,40 € dekoelektropunktde 512GB M.2... 2. 144,40 € dekoelektropunktde 512GB M.2... 3. 151,50 € dekoelektropunktde 512GB M.2... Bestpreis 2519€ Cyberport Stores Deutschland 2. 2519€ Cyberport.de 3. 2519€ computeruniverse.net | 2.7 kg | 26 mm | 16.00" 2560x1600 189 PPI Mini-LED |
2. 82%  | Acer Predator Helios Neo 16S AI PHN16S-71-94L9 Intel Core Ultra 9 275HX ⎘ NVIDIA GeForce RTX 5070 Ti Laptop ⎘ 32 GB RAM, 1024 GB SSD | Amazon: Bestpreis 2638€ ao-projekt 2. 2687€ AO-Projekt 3. 2753€ AO-Projekt | 2.2 kg | 19.9 mm | 16.00" 2560x1600 189 PPI OLED |
3. 84.9%  | Chuwi Gamebook, R9 9955HX AMD Ryzen 9 9955HX ⎘ NVIDIA GeForce RTX 5070 Ti Laptop ⎘ 32 GB RAM, 1024 GB SSD | Amazon: Listenpreis: 2300 EUR | 2.5 kg | 21.4 mm | 16.00" 2560x1600 189 PPI IPS |
4. 85.2%  | Medion Erazer Major 16 X1 MD62736 Intel Core Ultra 7 255HX ⎘ NVIDIA GeForce RTX 5070 Ti Laptop ⎘ 32 GB RAM, SSD | Amazon: Geizhals Suche | 2.5 kg | 22.7 mm | 16.00" 2560x1600 189 PPI IPS |
5. 84.5% 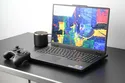 | Lenovo Legion 5 Pro 16IAX10H Intel Core Ultra 9 275HX ⎘ NVIDIA GeForce RTX 5070 Ti Laptop ⎘ 32 GB RAM, 1024 GB SSD | Amazon: 1. 2.799,00 € Lenovo Legion Pro 5 Gaming A... 2. 1.999,00 € Lenovo Legion Pro 5 16ADR10 ... 3. 2.163,20 € Lenovo Legion Pro 5 Gaming L... Listenpreis: 2500 Euro | 2.4 kg | 25.95 mm | 16.00" 2560x1600 189 PPI OLED |
6. 84%  | MSI Vector 16 HX AI A2XWHG Intel Core Ultra 7 255HX ⎘ NVIDIA GeForce RTX 5070 Ti Laptop ⎘ 16 GB RAM, 512 GB SSD | Amazon: 2.029,00 € Bestpreis 1898.99€ playox.de 2. 1899€ office-partner.de 3. 1914.95€ playox (AT) | 2.6 kg | 28.6 mm | 16.00" 2560x1600 189 PPI IPS |
7. 87.4%  | Schenker XMG Pro 16 (E25) Intel Core Ultra 9 275HX ⎘ NVIDIA GeForce RTX 5070 Ti Laptop ⎘ 32 GB RAM, 1024 GB SSD | Amazon: 1. 27,69 € atFoliX Displayfolie kompati... 2. 27,69 € atFoliX Schutzfolie kompatib... Listenpreis: 2480€ | 2.5 kg | 26.5 mm | 16.00" 2560x1600 189 PPI IPS |
Transparenz
Die Auswahl der zu testenden Geräte erfolgt innerhalb der Redaktion. Das vorliegende Testmuster wurde dem Autor vom Hersteller oder einem Shop zu Testzwecken leihweise zur Verfügung gestellt. Eine Einflussnahme des Leihstellers auf den Testbericht gab es nicht, der Hersteller erhielt keine Version des Reviews vor der Veröffentlichung. Es bestand keine Verpflichtung zur Publikation. Als eigenständiges, unabhängiges Unternehmen unterliegt Notebookcheck keiner Diktion von Herstellern, Shops und Verlagen.
So testet Notebookcheck
Pro Jahr werden von Notebookcheck hunderte Laptops und Smartphones unabhängig in von uns standardisierten technischen Verfahren getestet, um eine Vergleichbarkeit aller Testergebnisse zu gewährleisten. Seit rund 20 Jahren entwickeln wir diese Testmethoden kontinuierlich weiter und setzen damit Branchenstandards. In unseren Testlaboren kommt ausschließlich hochwertiges Messequipment in die Hände erfahrener Techniker und Redakteure. Die Tests unterliegen einer mehrstufigen Kontrolle. Unsere komplexe Gesamtbewertung basiert auf hunderten fundierten Messergebnissen und Benchmarks, womit Ihnen Objektivität garantiert ist. Weitere Informationen zu unseren Testmethoden gibt es hier.
