Fazit - Bei Performance und Gewicht ausgewogen
Das "Revier" des ZBook X G1i 16 liegt zwischen der langsameren ZBook 8 Serie und der schnelleren, dafür schwereren ZBook Fury Serie. Äußerlich hat sich fast nichts gegenüber dem letztjährigen ZBook Power 16 G11 getan, einschließlich der Ports und der komfortablen Tasten. Sowohl Akkulaufzeit als auch Leistung haben sich verbessert, weswegen der Stromverbrauch bei anspruchsvoller Last etwas höher ausfällt.
Einige Funktionen fehlen bei diesem Gerät weiterhin. Während hochwertigere CPU- und GPU-Optionen erwartungsgemäß nicht verfügbar sind, verfügt das Modell nicht über OLED-, HDR- und ECC-RAM-Unterstützung. Die Anschlüsse wirken entlang der linken Seite überfüllt, insbesondere da es entlang der rechten Seite keine USB-C-Anschlüsse gibt. Nutzer, die CPU und GPU gerne stark beanspruchen, werden außerdem feststellen, dass das System nicht leiser läuft als sein Vorgängermodell.
Für künftige Modelle würden wir uns wünschen, dass die ZBook X Serie von der proprietären AC-Ladestation wegkommt und gleichzeitig eine bessere CPU Turbo Boost Leistung bietet. Der Prozessor erreicht bei Belastung recht schnell über 100 °C, was darauf hindeutet, dass eine stärkere Kühllösung von Vorteil sein könnte.
Pro
Contra
Preis und Verfügbarkeit
Die getestete Konfiguration ist im HP-Webshop neben vielen anderen Optionen für 2.500 Euro erhältlich. Die Konfiguration mit Core Ultra 9 und 2400p gibt es auch bei Amazon für knapp unter 3.300 Euro.
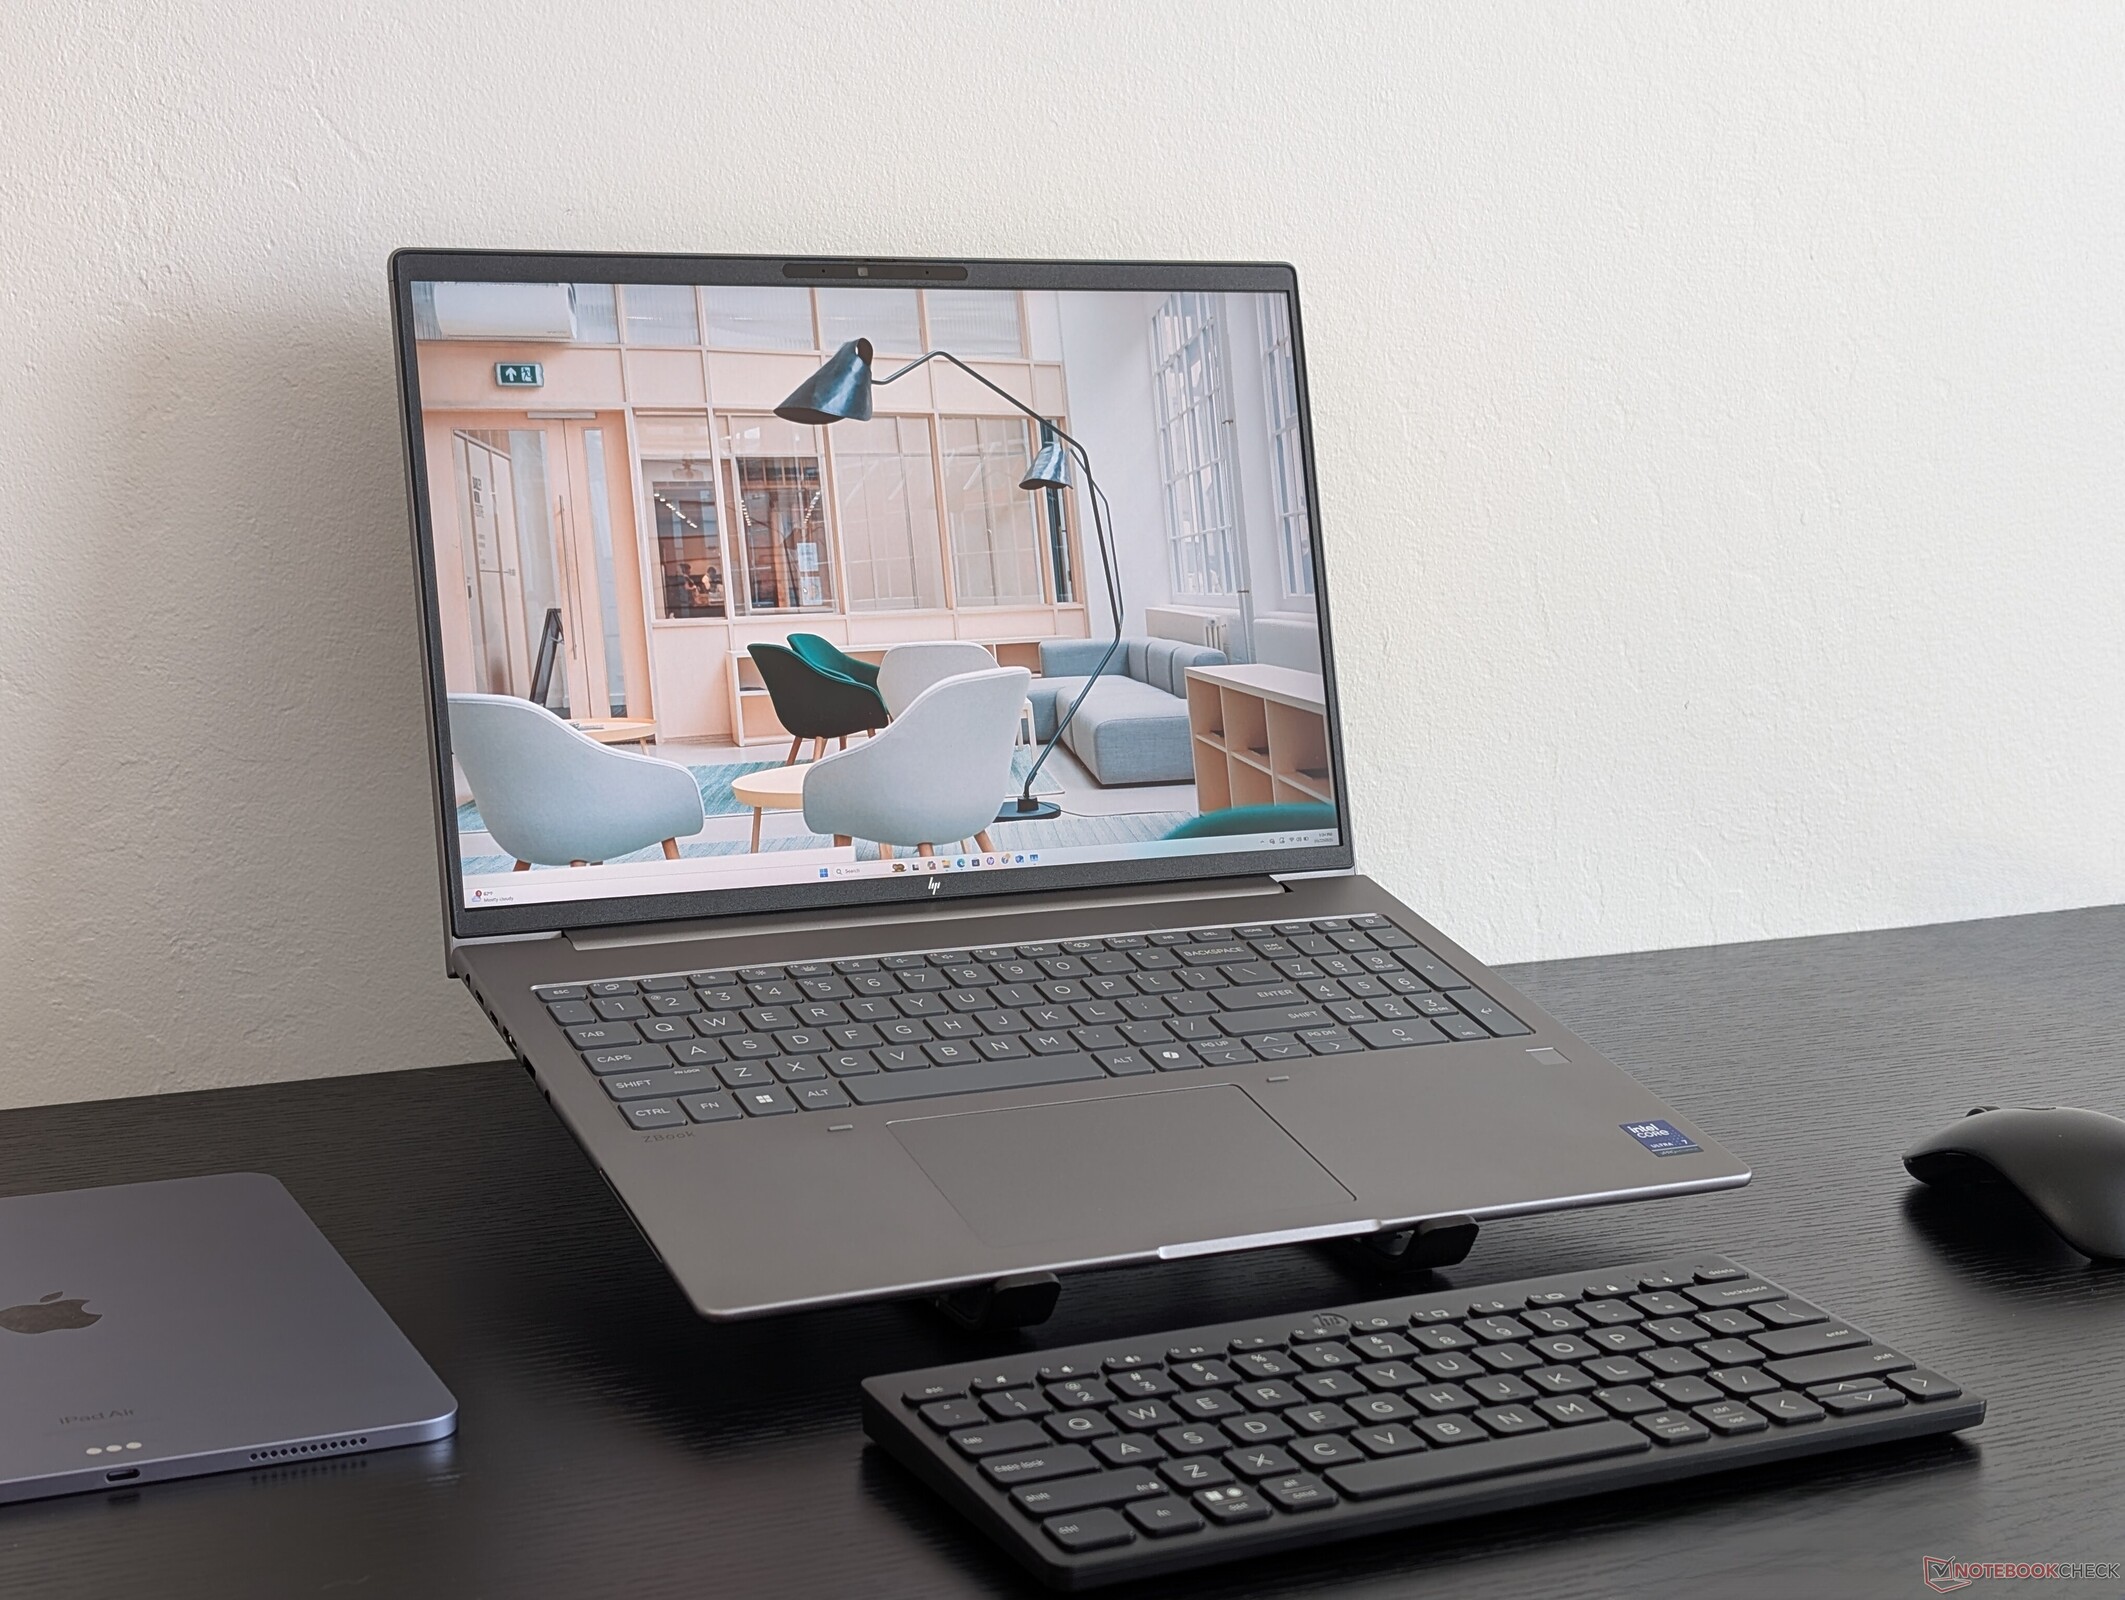
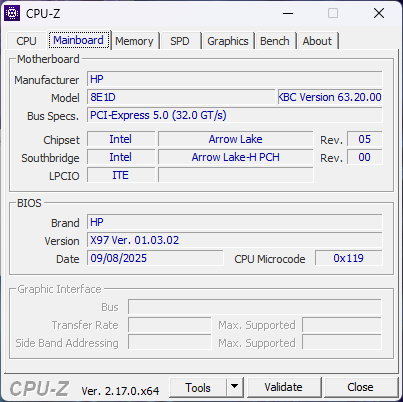
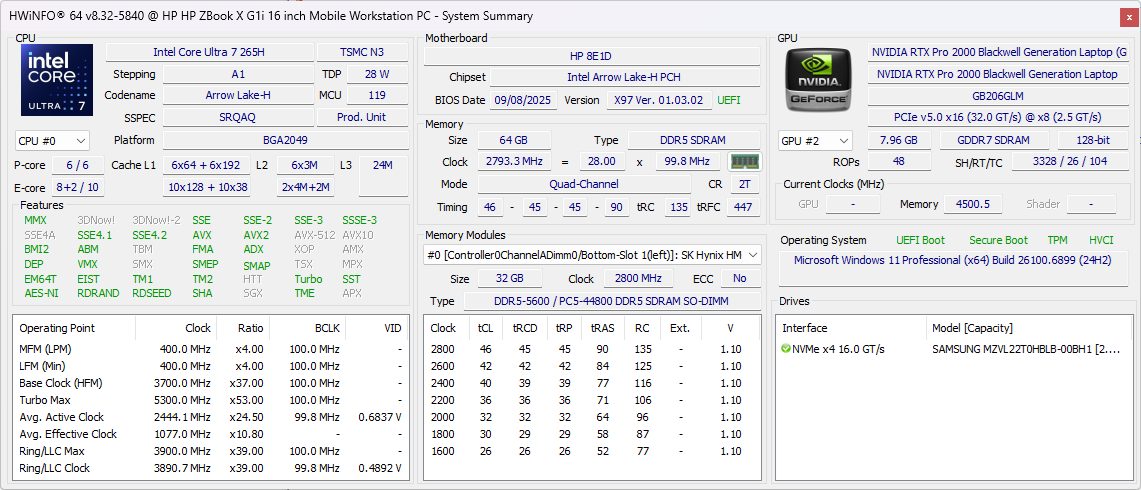
Das HP ZBook X G1i 16 ist eine ultradünne mobile Workstation mit Arrow Lake-H Prozessoren der Mittelklasse und Nvidia RTX Pro Blackwell GPU-Grafik. Die Obergrenze liegt bei einer Core Ultra 9 285H CPU und einer RTX Pro 2000 GPU, während das dickere ZBook Fury G1i 16 mit schnelleren Arrow Lake-HX und RTX Pro 5000 Grafiken ausgestattet werden kann.
Unser amerikanisches Testgerät ist die mittlere Konfiguration mit Core Ultra 7 265H, 2K 1600p120-Display und RTX Pro 2000-GPU für ca. 2.700 USD. Das HP ZBook X G1i 16 ist in vielen verschieden Varianten erhältlich.
Zu den Alternativen zum ZBook X G1i 16 gehören andere ultradünne 16-Zoll-Workstations wie das Dell Precision 5690, das Lenovo ThinkPad P16s G2 oder die MSI CreatorPro-Serie.
Weitere HP-Tests:
Spezifikationen
Preisvergleich
Gehäuse
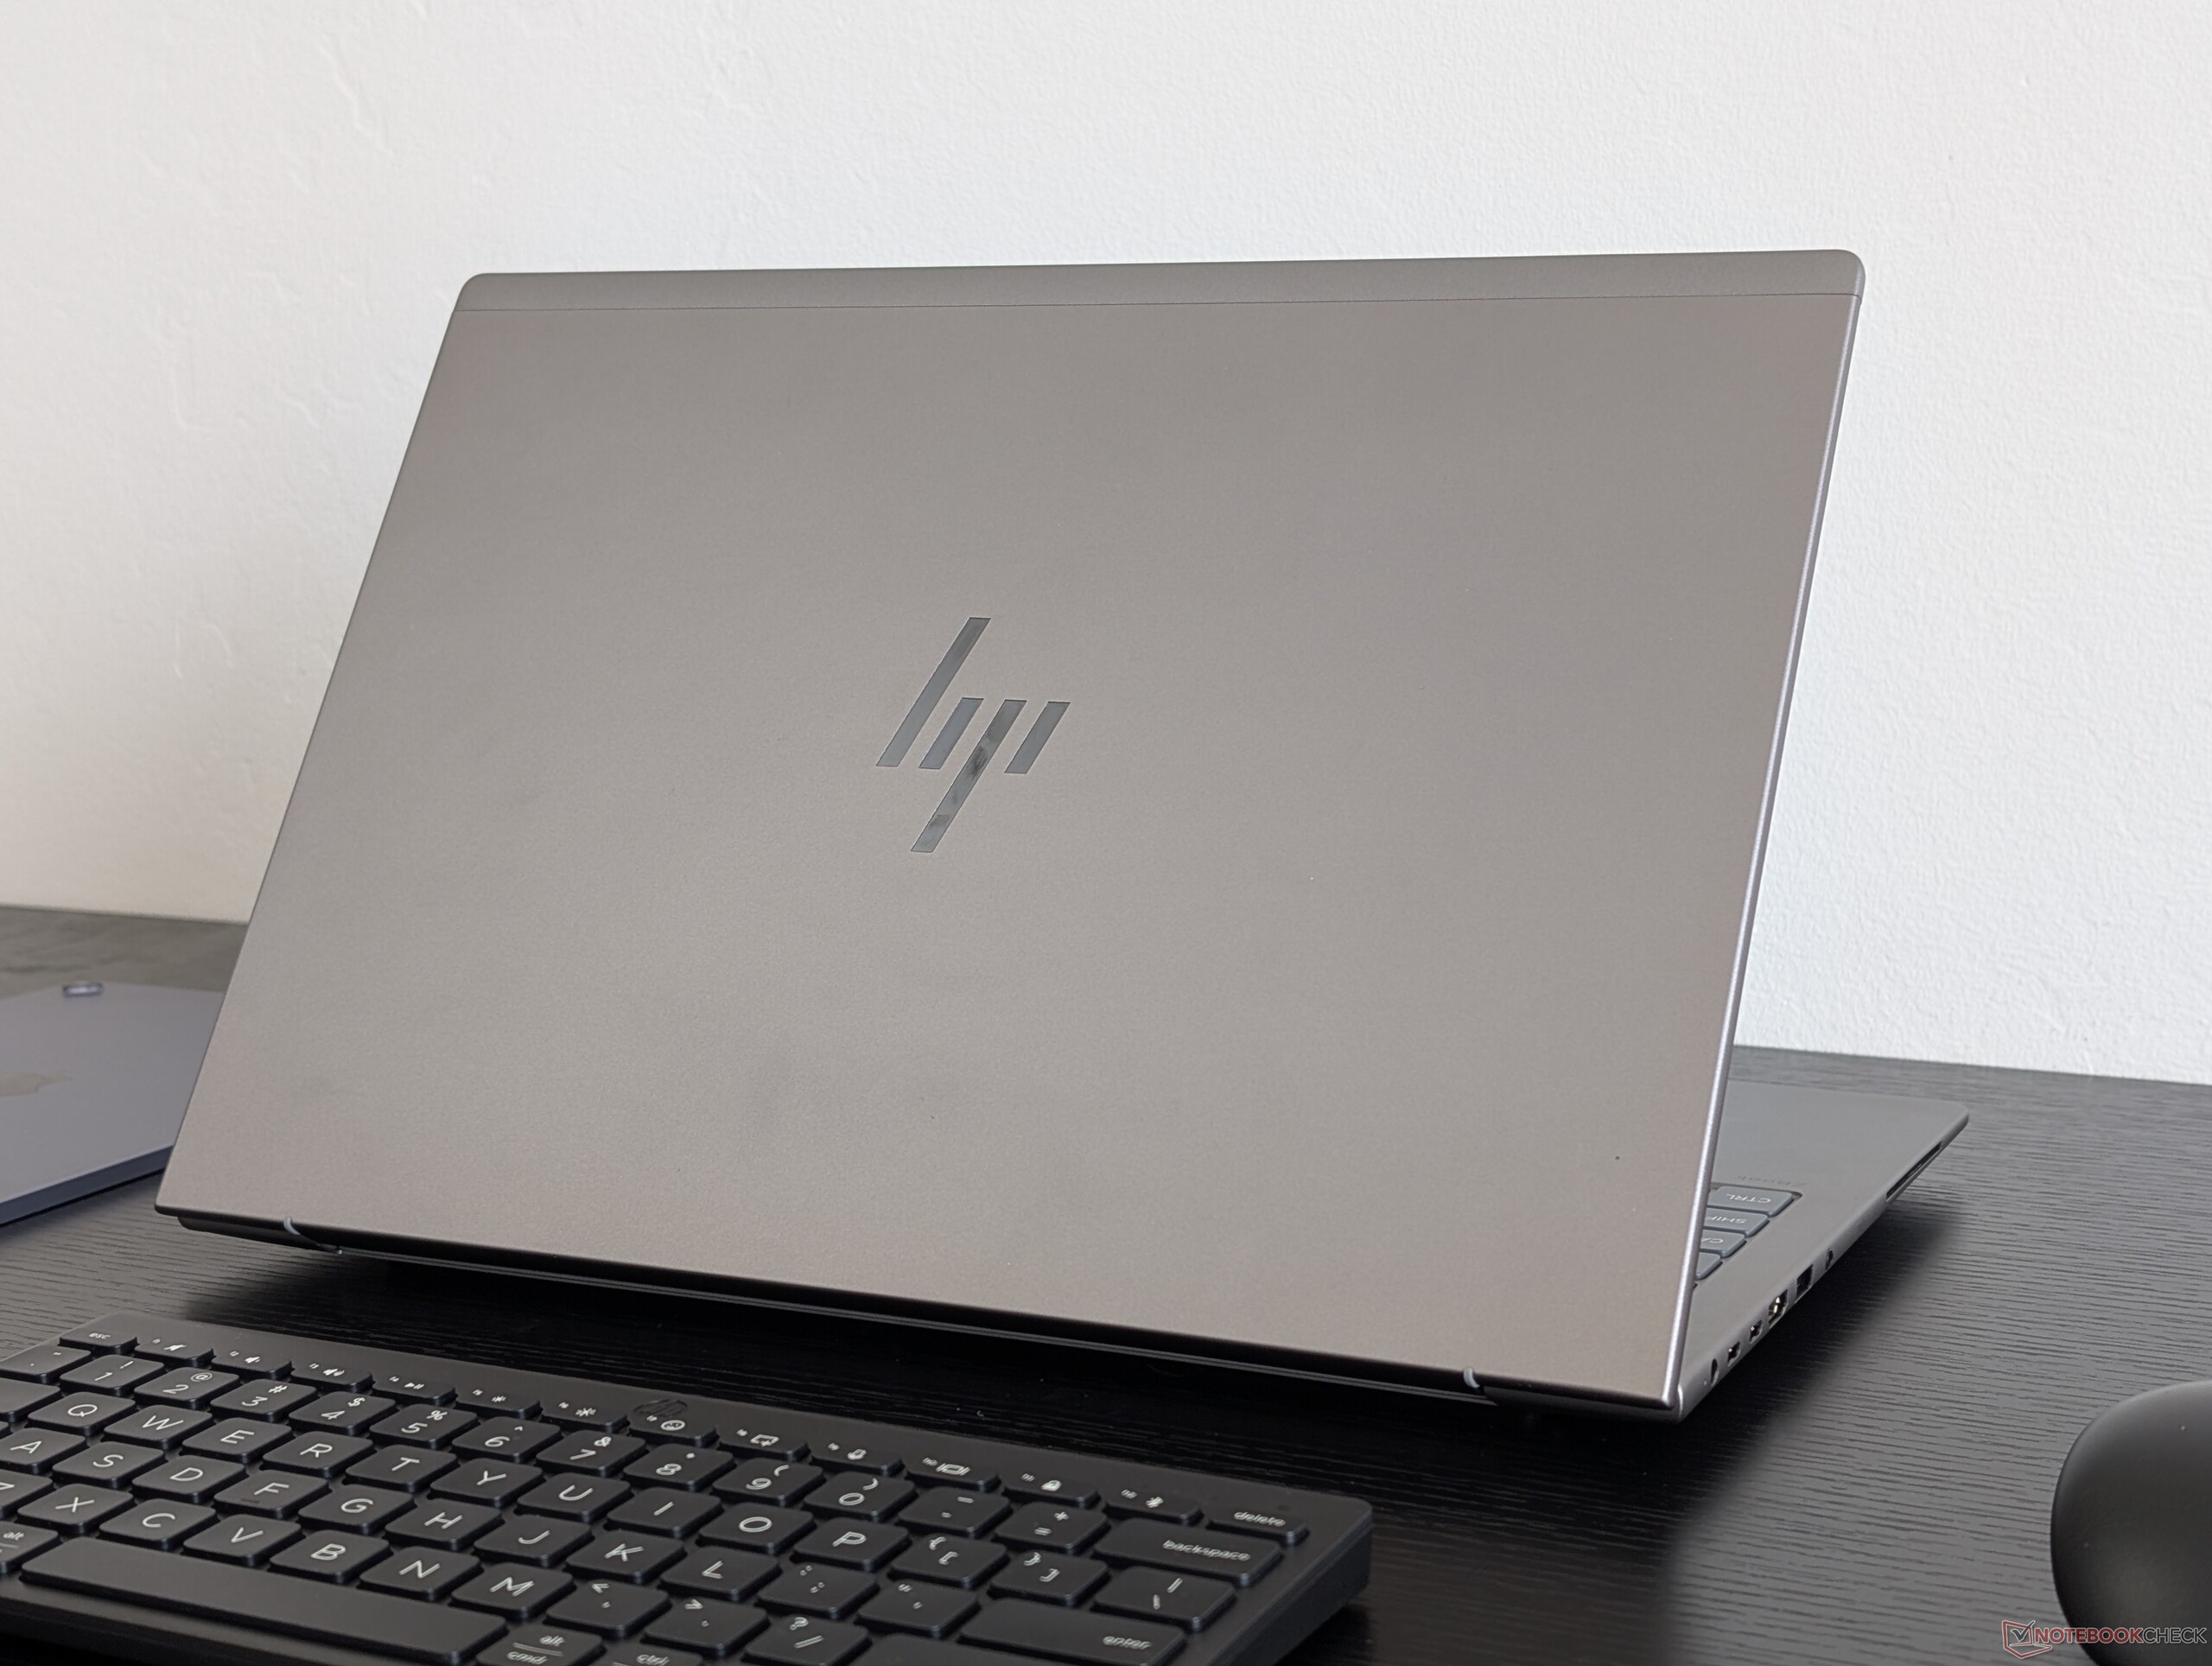
Das ZBook X G1i 16 ersetzt das letztjährige ZBook Power 16 G11. Trotz der Namensänderung sind die beiden Modelle ansonsten optisch fast identisch. Auch die physischen Eigenschaften bleiben nahezu gleich, einschließlich des Gewichts, der Abmessungen und der Anschlussausstattung und so sind unsere Erfahrungen mit dem ZBook Power 16 G11 auch für das ZBook X G1i 16 gültig.
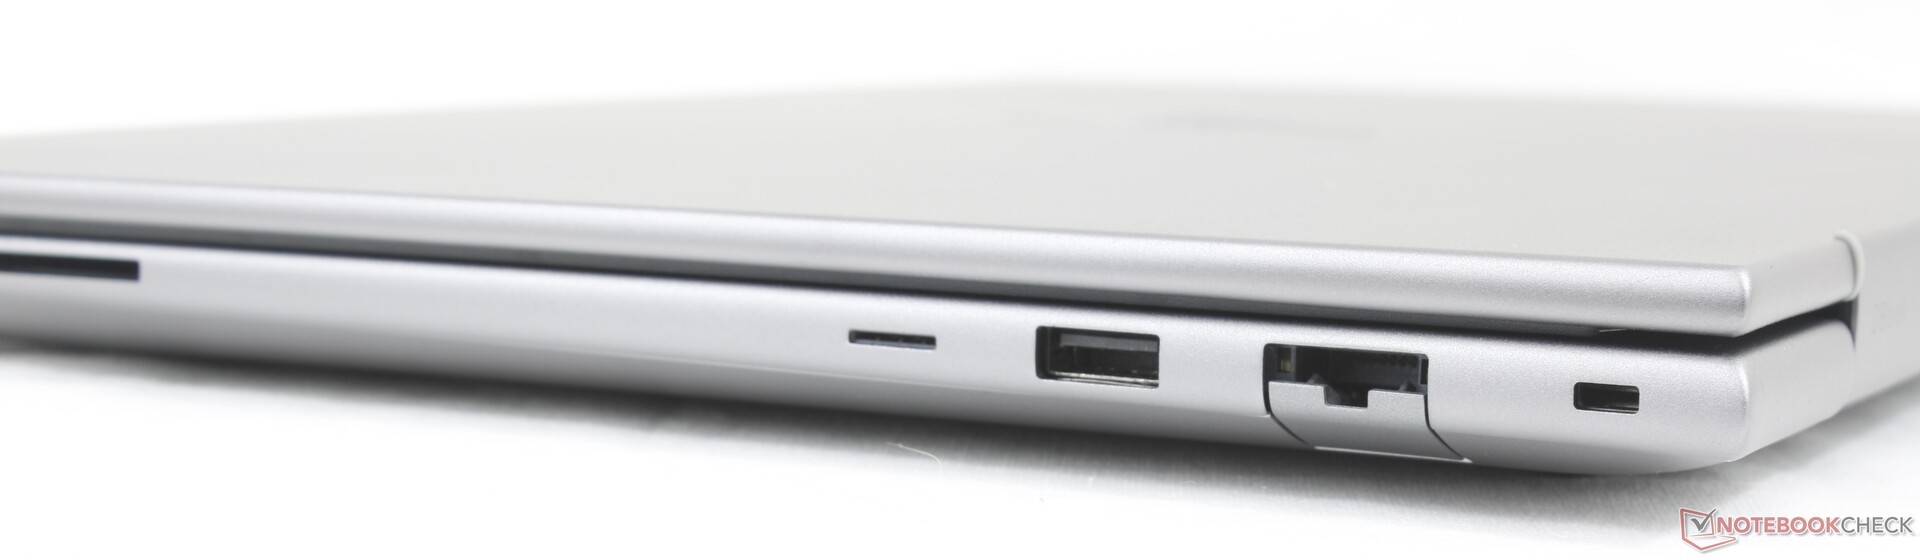
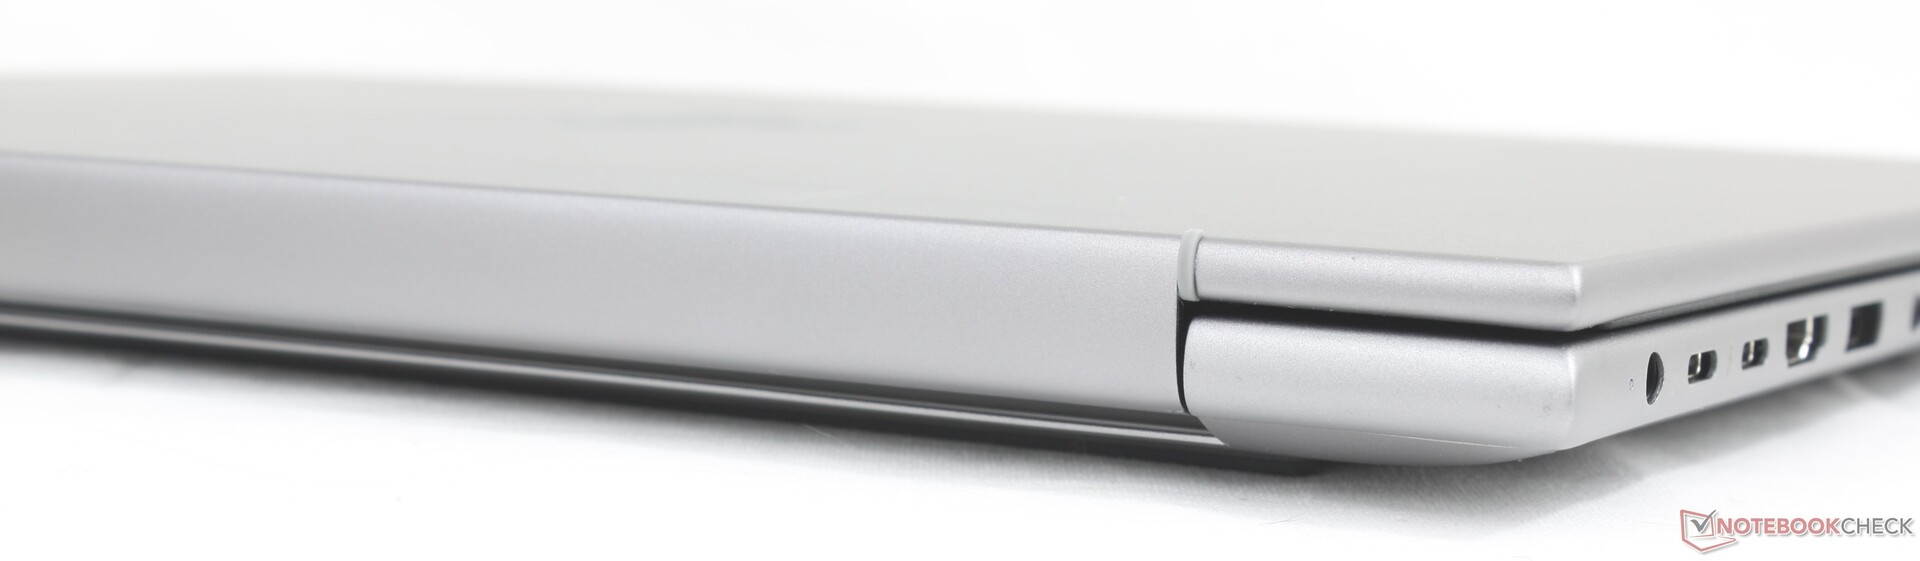
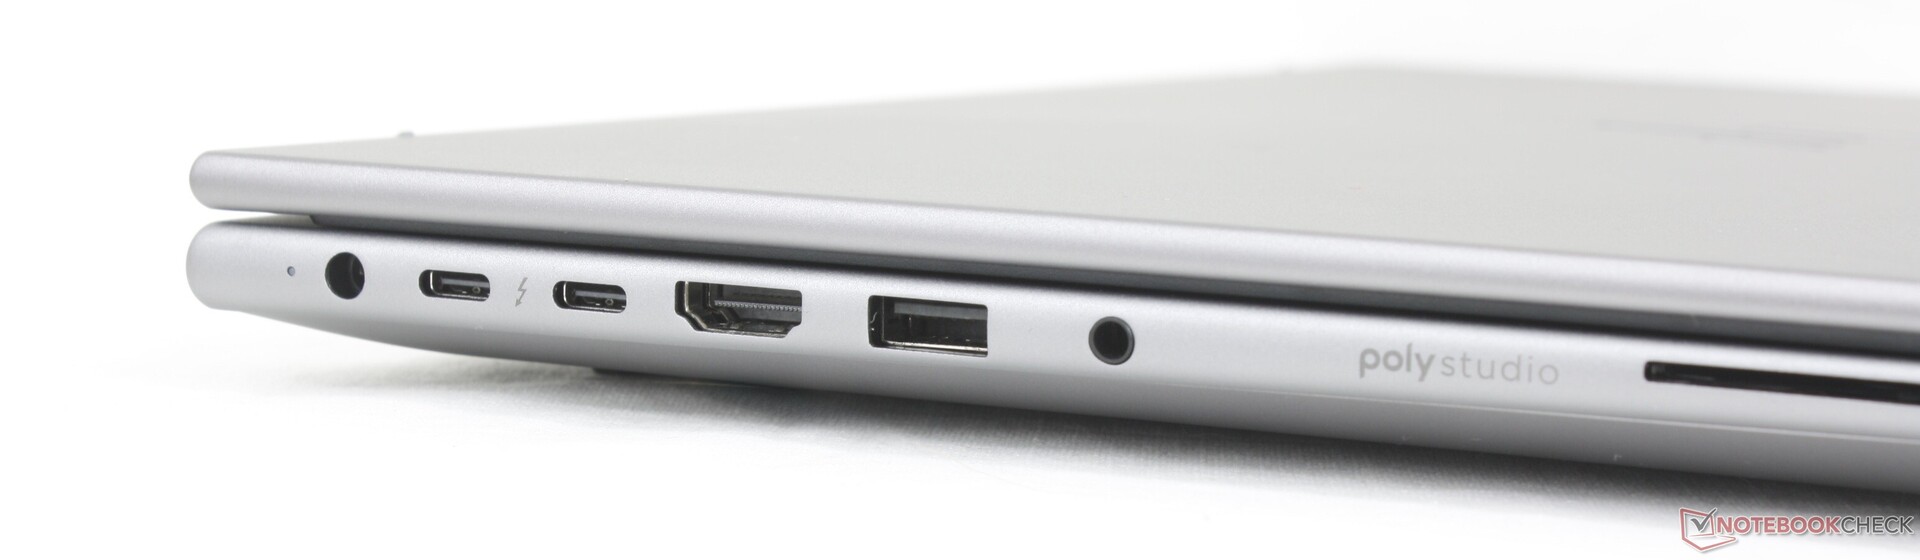
Anschlussausstattung
Die Anschlussmöglichkeiten haben sich gegenüber dem letztjährigen ZBook Studio 16 G11 verbessert, mit einer Ausnahme. Das ZBook X G1i 16 verfügt zwar über zusätzliche Anschlüsse wie RJ-45, HDMI und weitere USB-A-Anschlüsse, jedoch wurde einer der USB-C-Anschlüsse entfernt. Darüber hinaus würden wir uns eine vollständige Umstellung auf USB-C-Laden wünschen, ähnlich wie beim kürzlich vorgestellten Dell Pro Max 16 Plus.

SD-Kartenleser
| SD Card Reader | |
| average JPG Copy Test (av. of 3 runs) | |
| HP ZBook X G1i 16 (Toshiba Exceria Pro SDXC 64 GB UHS-II) | |
| HP ZBook Power 16 G11 A (Toshiba Exceria Pro SDXC 64 GB UHS-II) | |
| Lenovo ThinkPad P16 Gen 2 (Toshiba Exceria Pro SDXC 64 GB UHS-II) | |
| Dell Pro Max 16 Plus (Toshiba Exceria Pro SDXC 64 GB UHS-II) | |
| maximum AS SSD Seq Read Test (1GB) | |
| HP ZBook Power 16 G11 A (Toshiba Exceria Pro SDXC 64 GB UHS-II) | |
| HP ZBook X G1i 16 (Toshiba Exceria Pro SDXC 64 GB UHS-II) | |
| Dell Pro Max 16 Plus (Toshiba Exceria Pro SDXC 64 GB UHS-II) | |
| Lenovo ThinkPad P16 Gen 2 (Toshiba Exceria Pro SDXC 64 GB UHS-II) | |
Kommunikation
Webcam
Die Webcam-Optionen umfassen 2 MP oder 5 MP mit IR und einem physischen Verschluss.


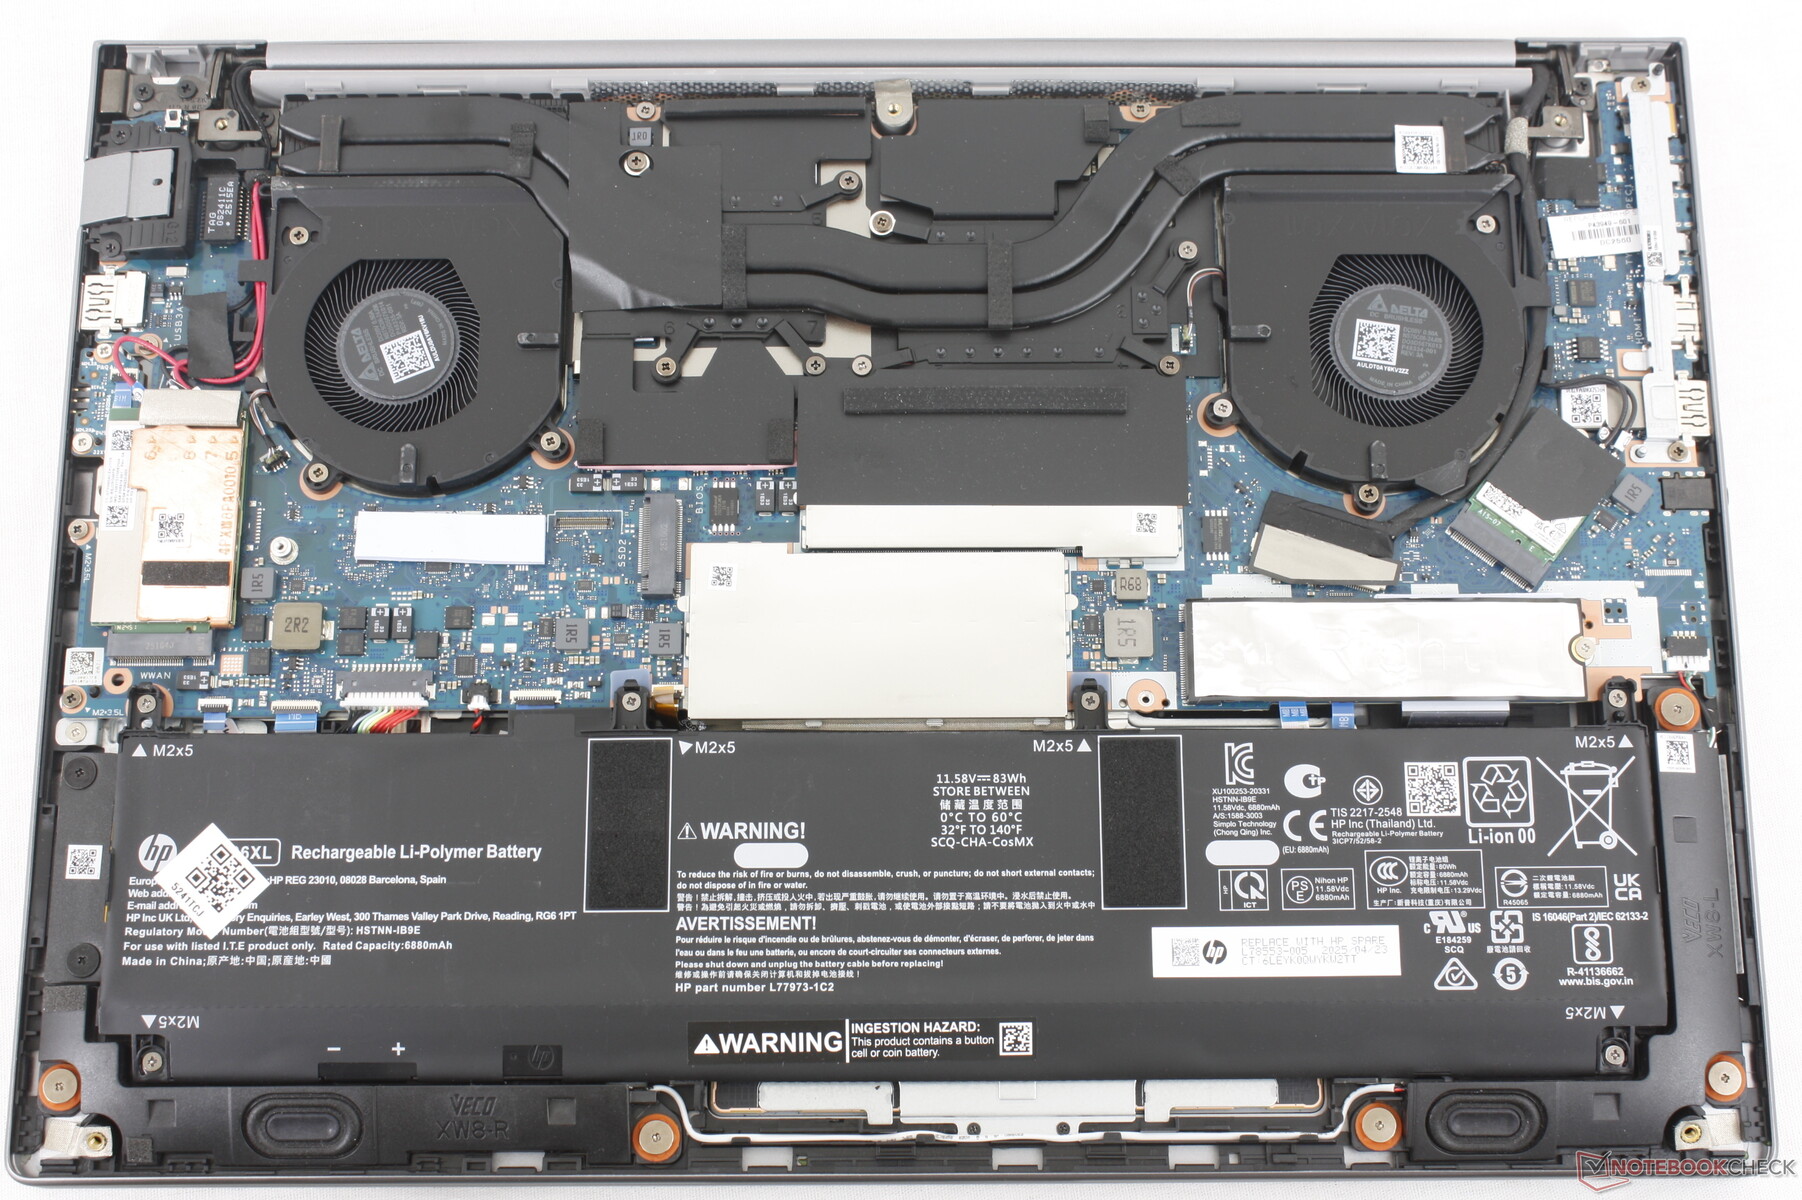
Wartung
HP bietet Videos zur Demontage und Anleitungen für die Wartung des ZBook X G1i 16.
Nachhaltigkeit
Alle Z-Workstations sind mit EPEAT Gold oder Silber zertifiziert und enthalten Kunststoffe oder Metalle, die aus dem Meer stammen und recycelt wurden.
Zubehör und Garantie
In der Verpackung befinden sich außer dem Netzteil und den Papieren keine weiteren Extras. In Deutschland gilt die allgemein übliche Garantie.
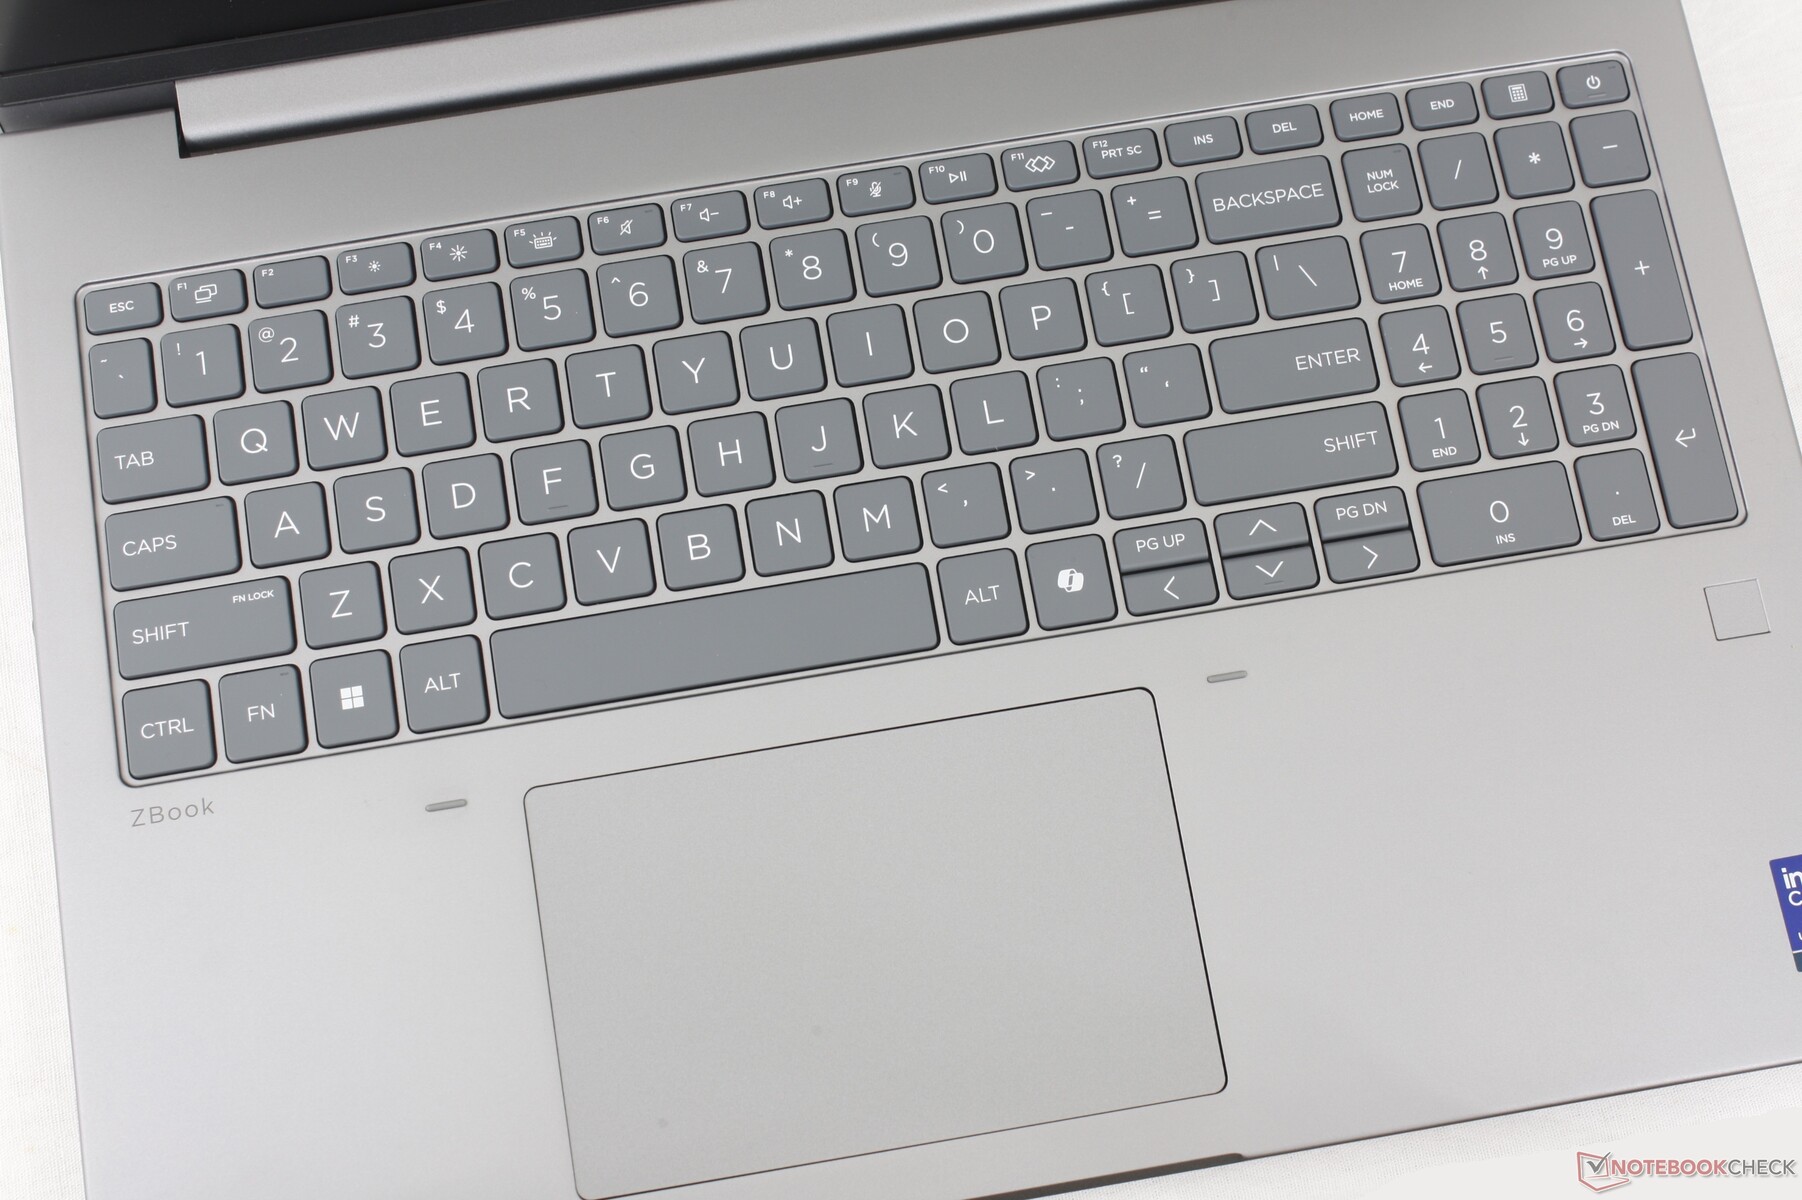
Eingabegeräte
Das Tipperlebnis ist ähnlich wie beim älteren ZBook Fury 16 G9, da sich das Tastaturlayout über die ZBook Generationen hinweg kaum verändert hat. Beim ZBook X G1i 16 hat HP jedoch die dedizierten Maustasten entfernt, ohne die Fläche zu vergrößern (12 x 8 cm gegenüber 12,4 x 8,3 cm beim ZBook Fury 16 G9).
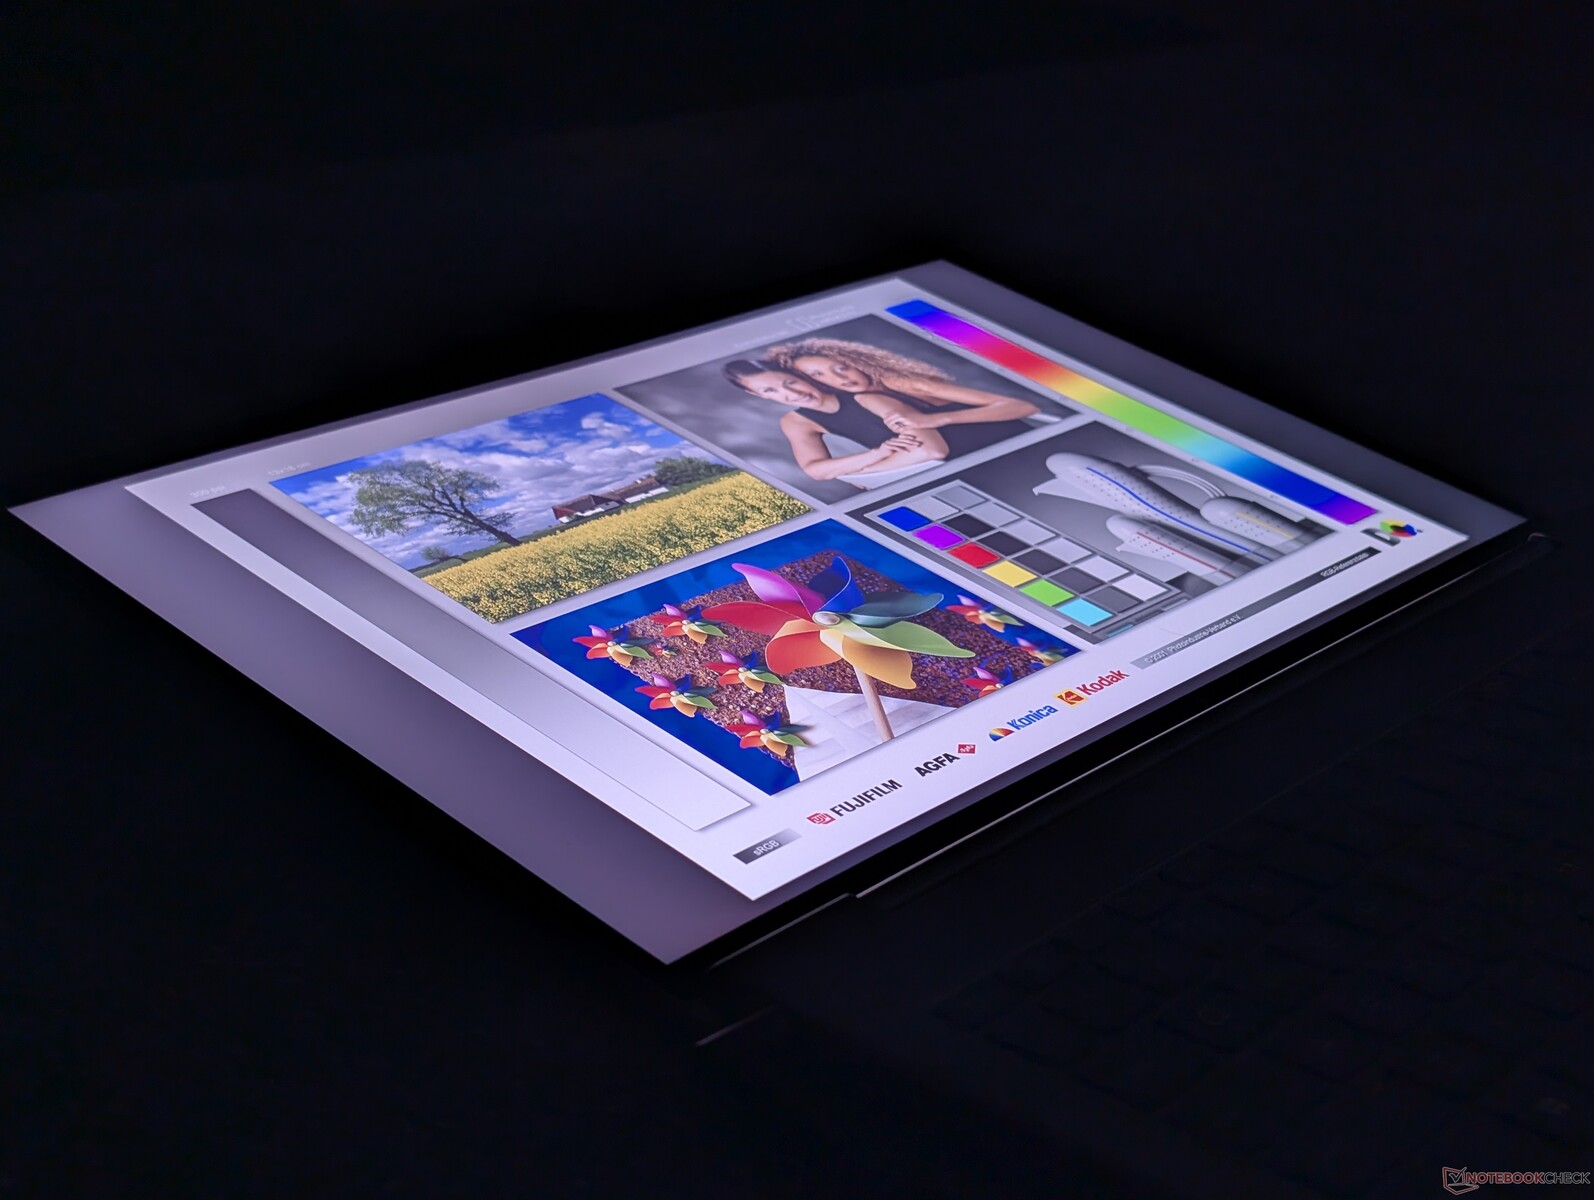
Display
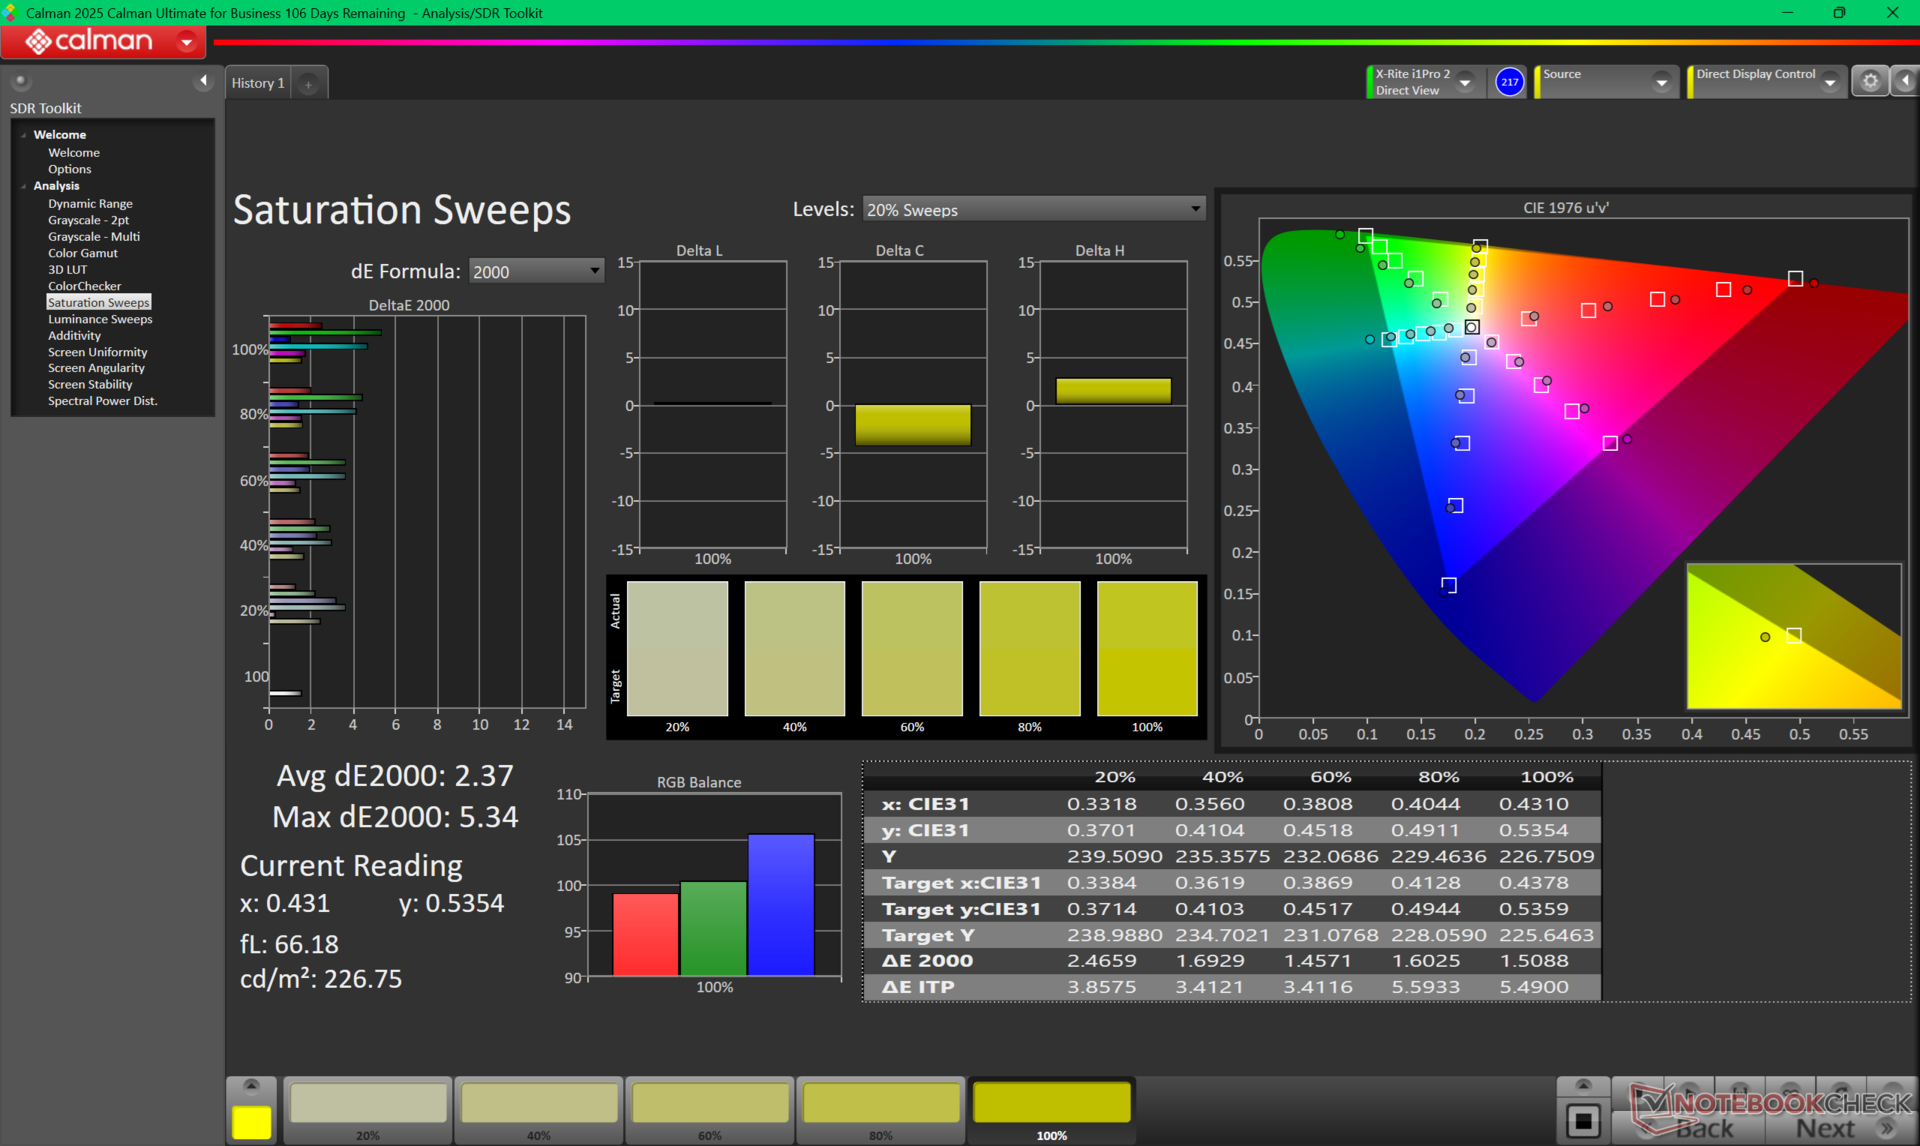
Es sind sechs IPS-Display-Optionen verfügbar, die von 1200p60 und 300 nits bis zu 2400p120 und 500 nits mit vollen DCI-P3-Farben reichen. Unser Testgerät wird mit der mittleren 1600p 120 Hz matten Option ausgeliefert, die immer noch P3-Farben bietet, aber keine Touchscreen- oder Sure View-Funktionen. Letzteres ist nur bei dem 1200p-Panel ohne Touchscreen verfügbar.
Beachten Sie, dass es für dieses Modell keine OLED-Optionen oder HDR-Unterstützung gibt. Wenn Sie Wert auf Farbgenauigkeit legen, empfehlen wir Ihnen, die günstigeren 1200p-Optionen zu meiden, da sie nur ~60% der sRGB-Farben bieten.

| |||||||||||||||||||||||||
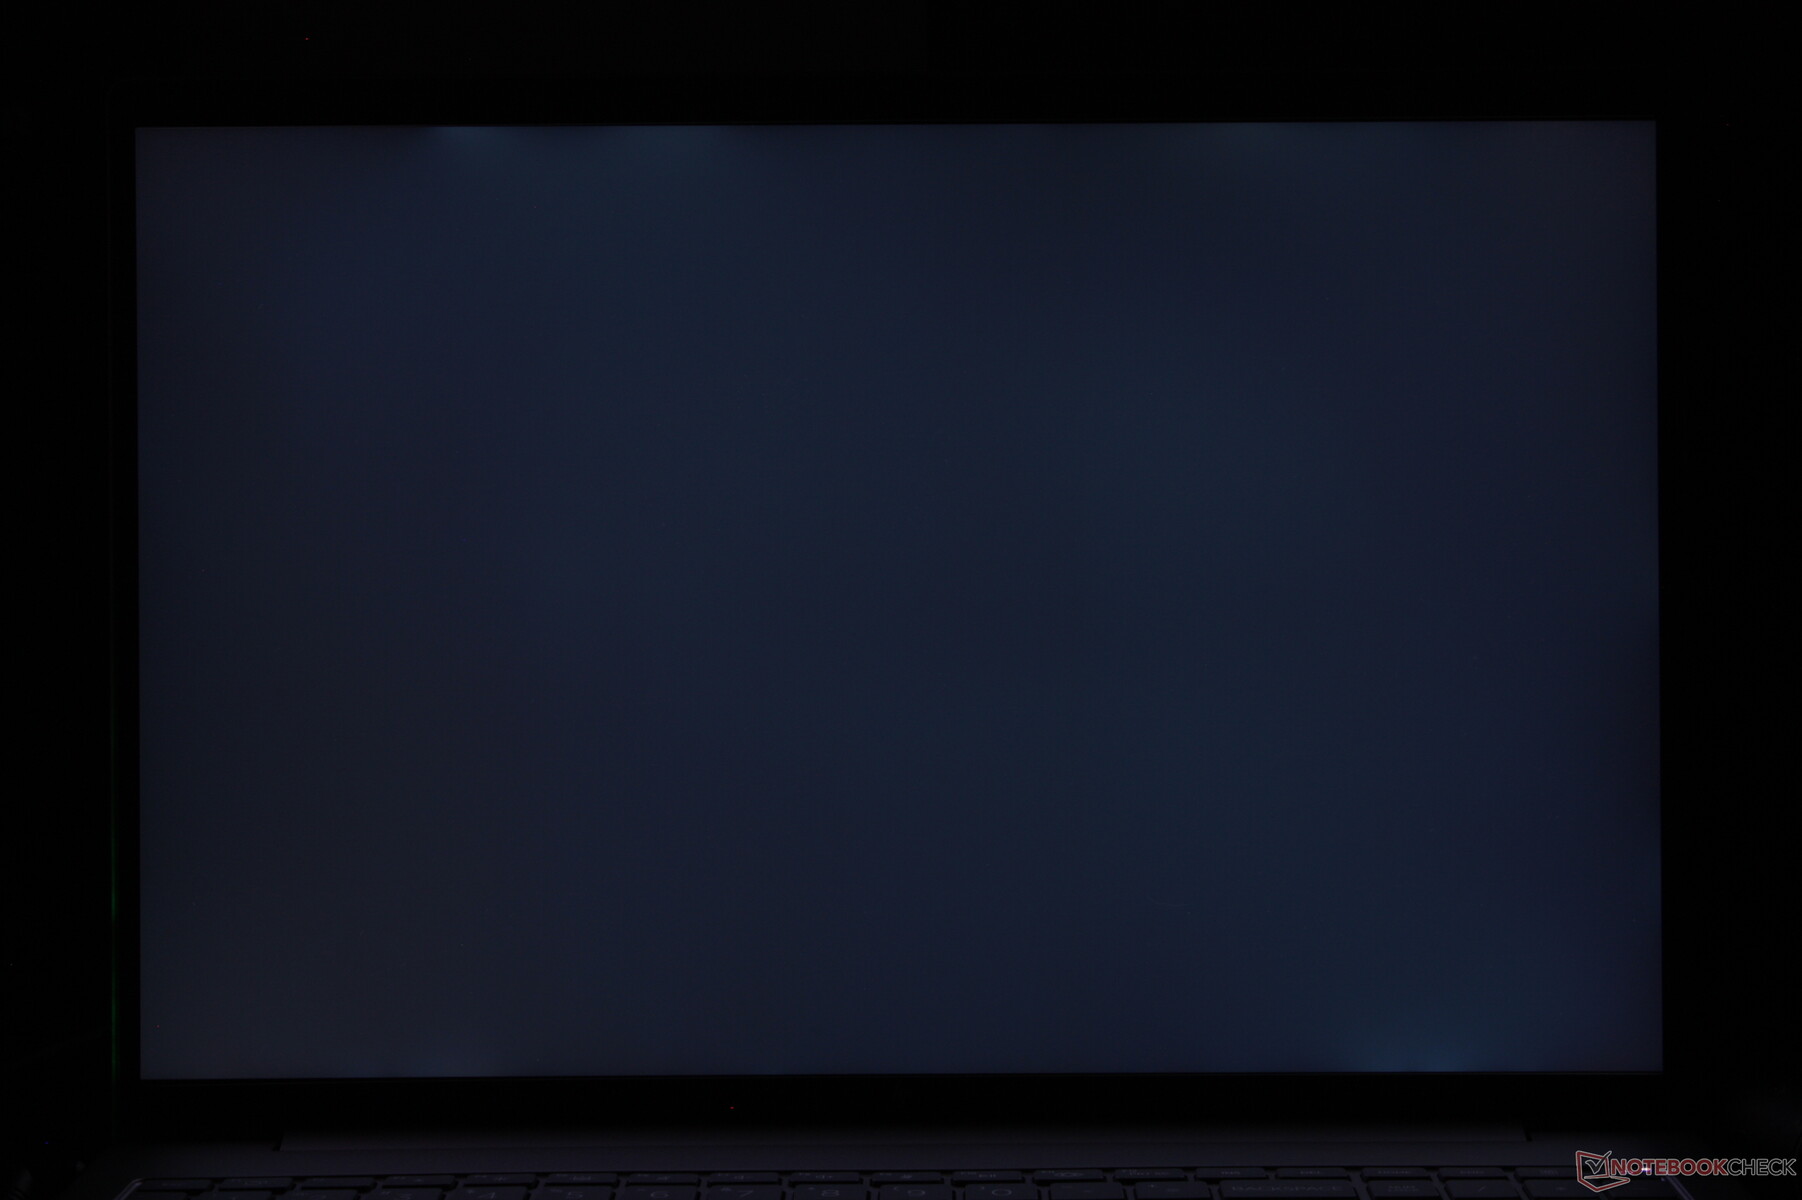
Ausleuchtung: 88 %
Helligkeit Akku: 461.8 cd/m²
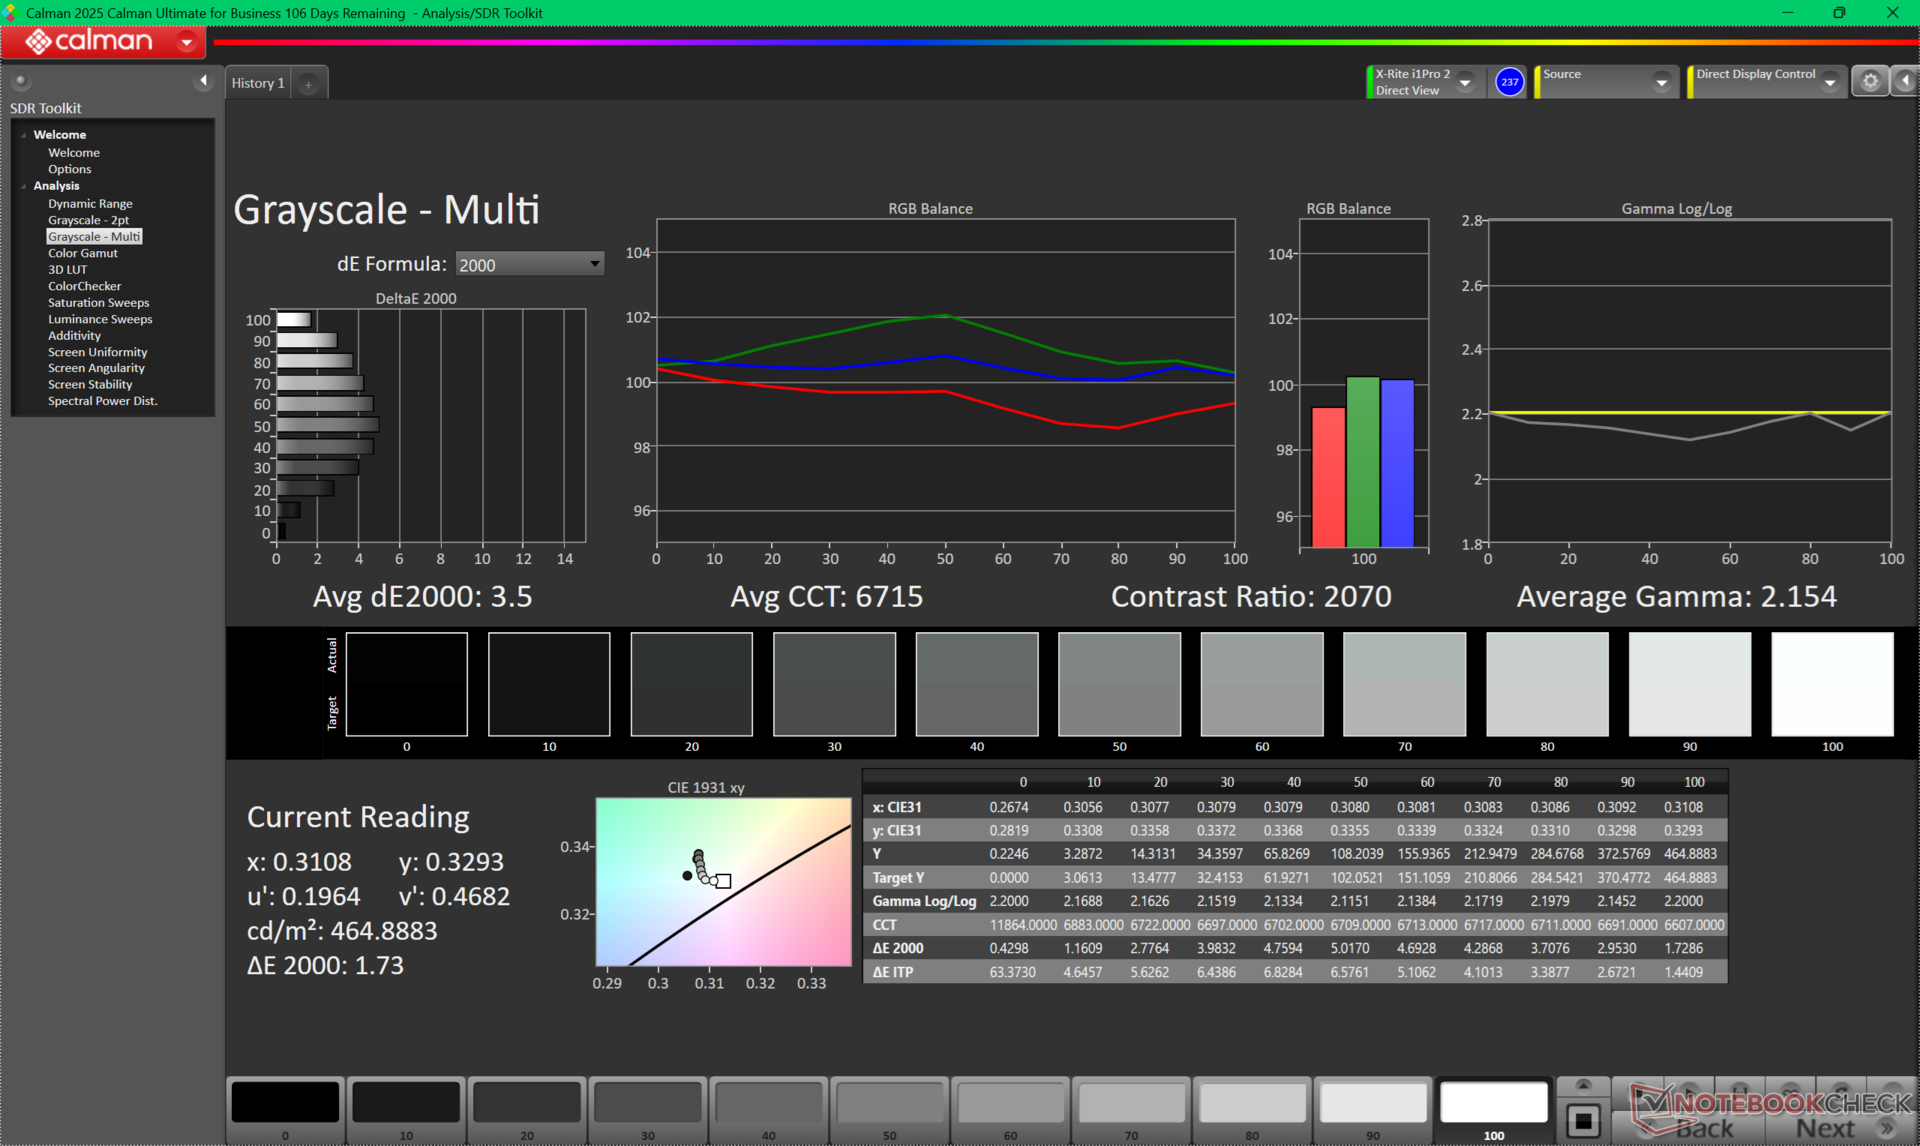
Kontrast: 1004:1 (Schwarzwert: 0.46 cd/m²)
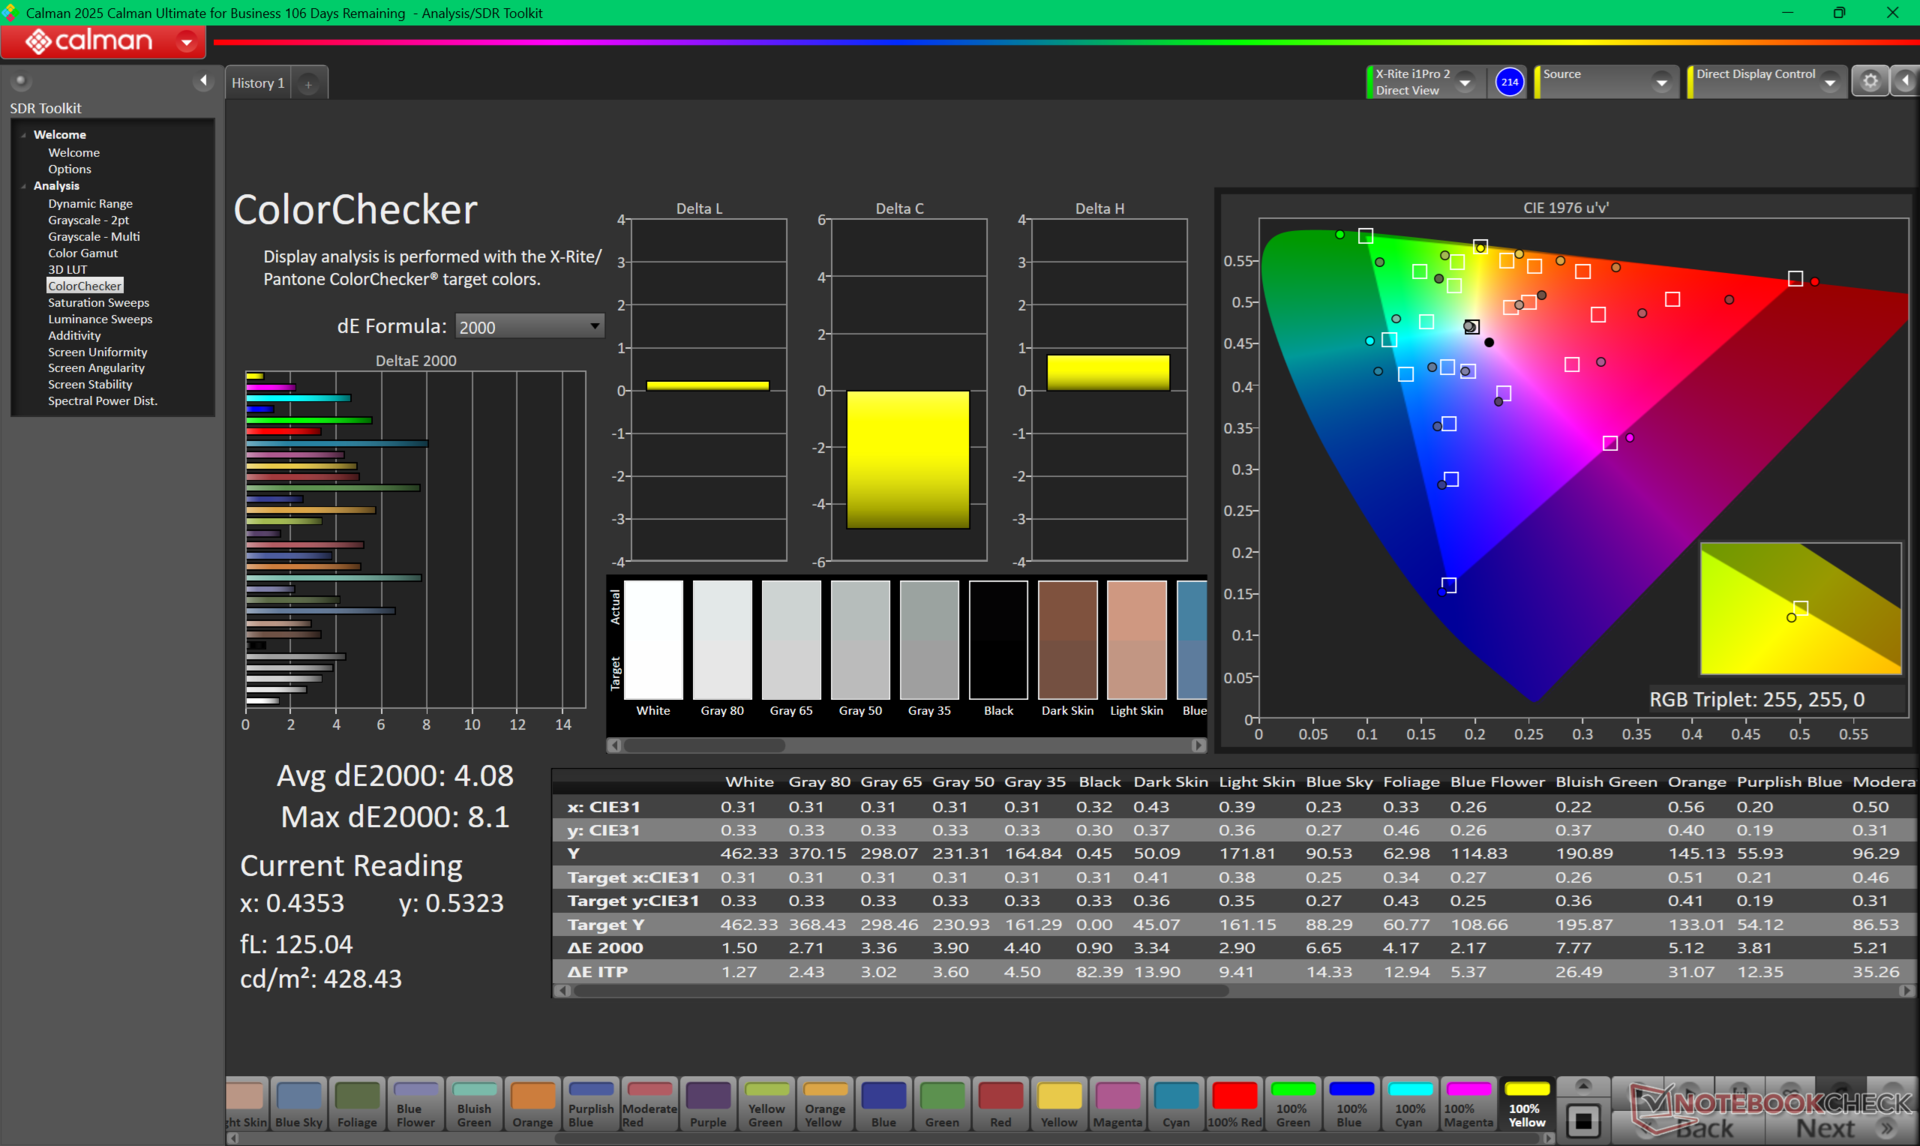
ΔE ColorChecker Calman: 4.08 | ∀{0.5-29.43 Ø4.73}
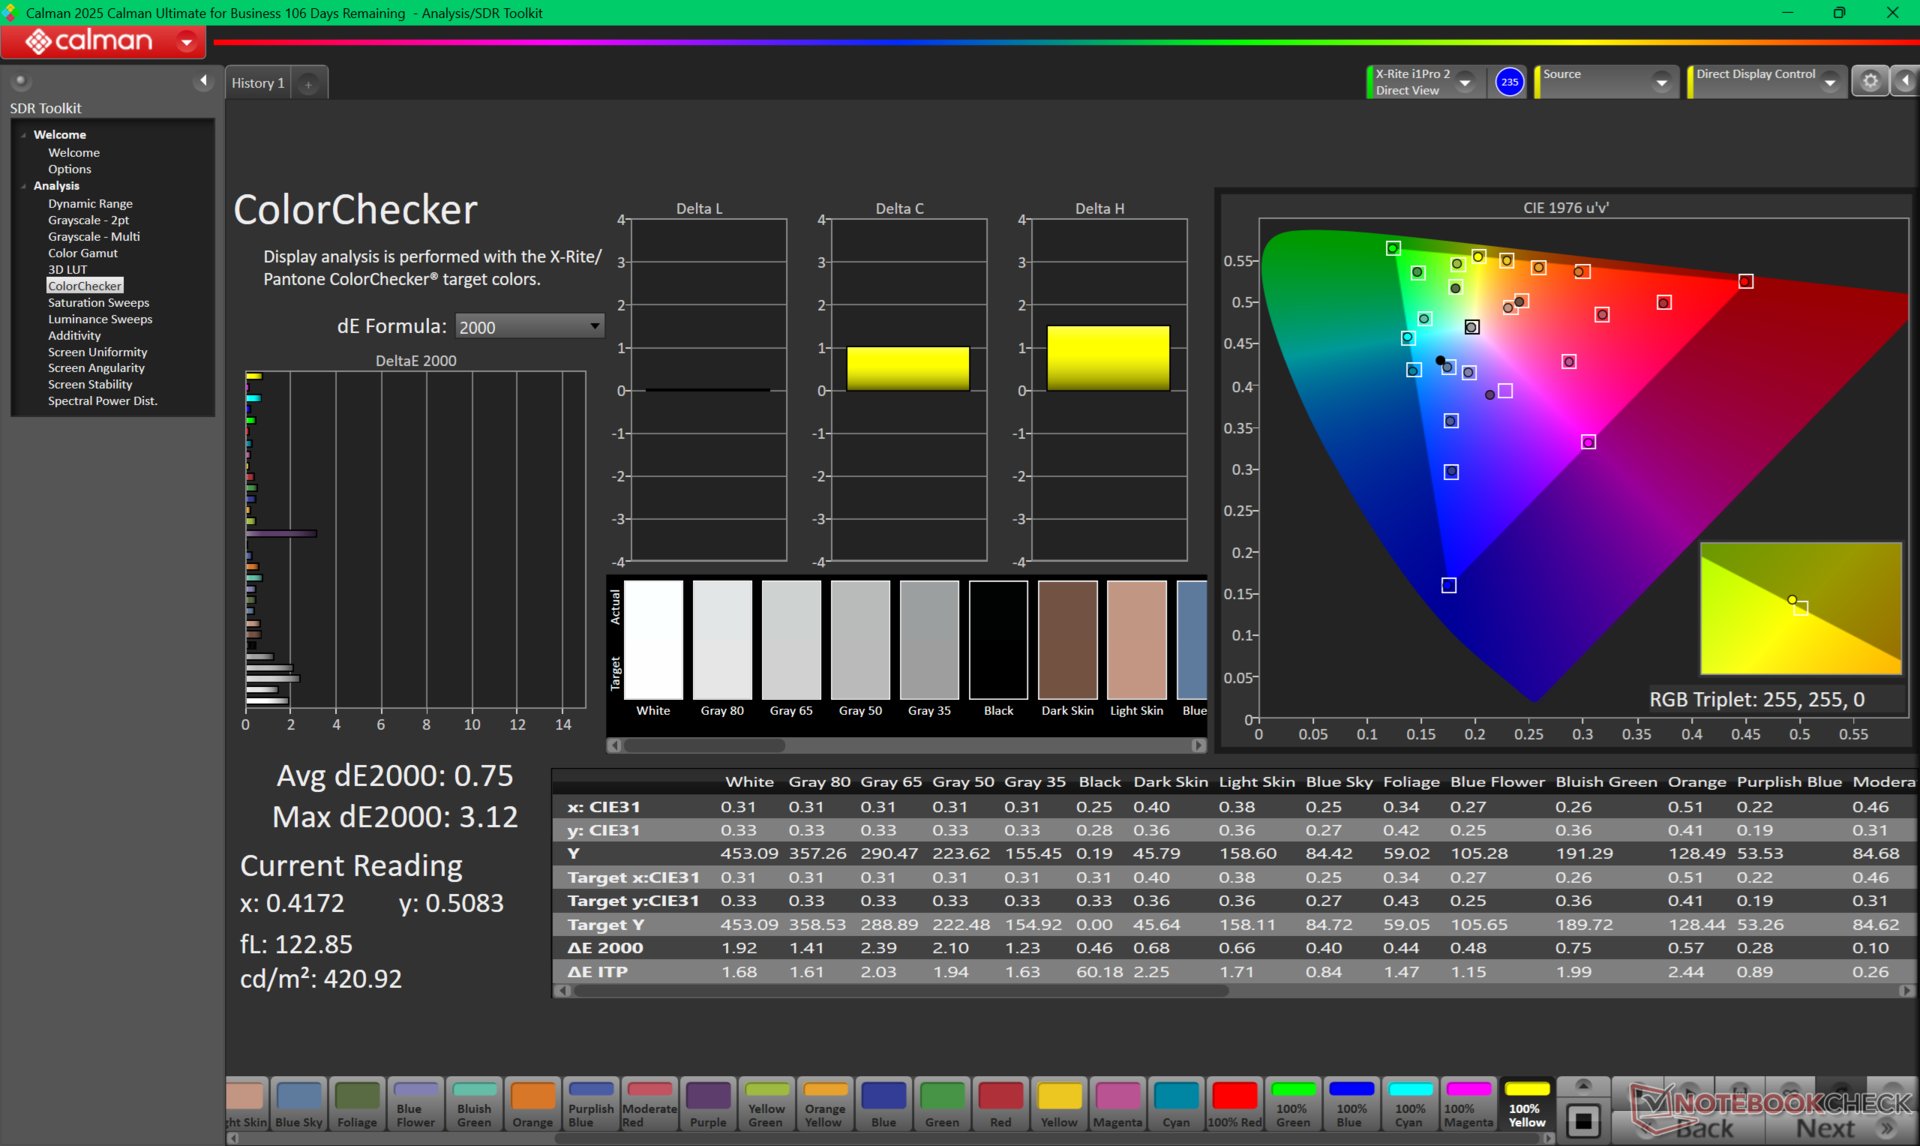
calibrated: 0.75
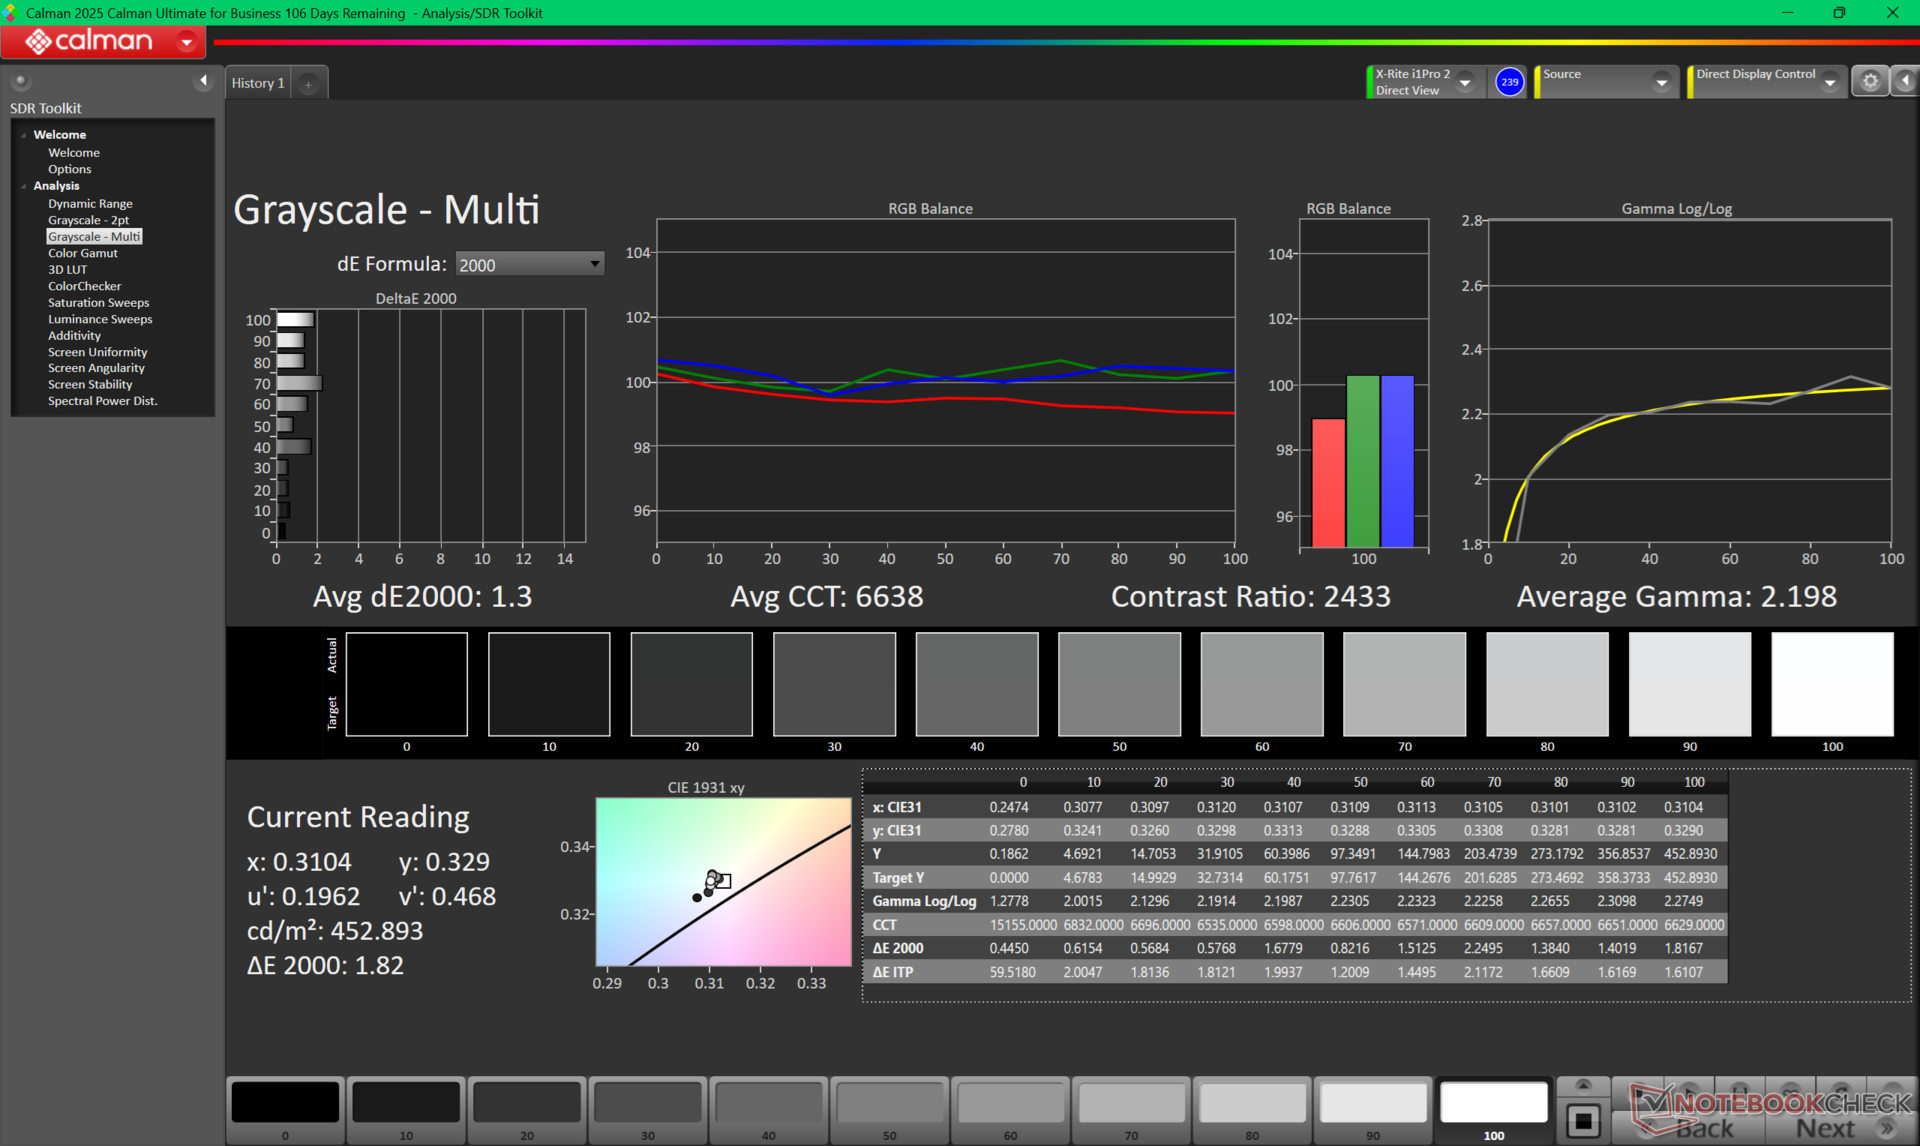
ΔE Greyscale Calman: 3.5 | ∀{0.09-98 Ø4.97}
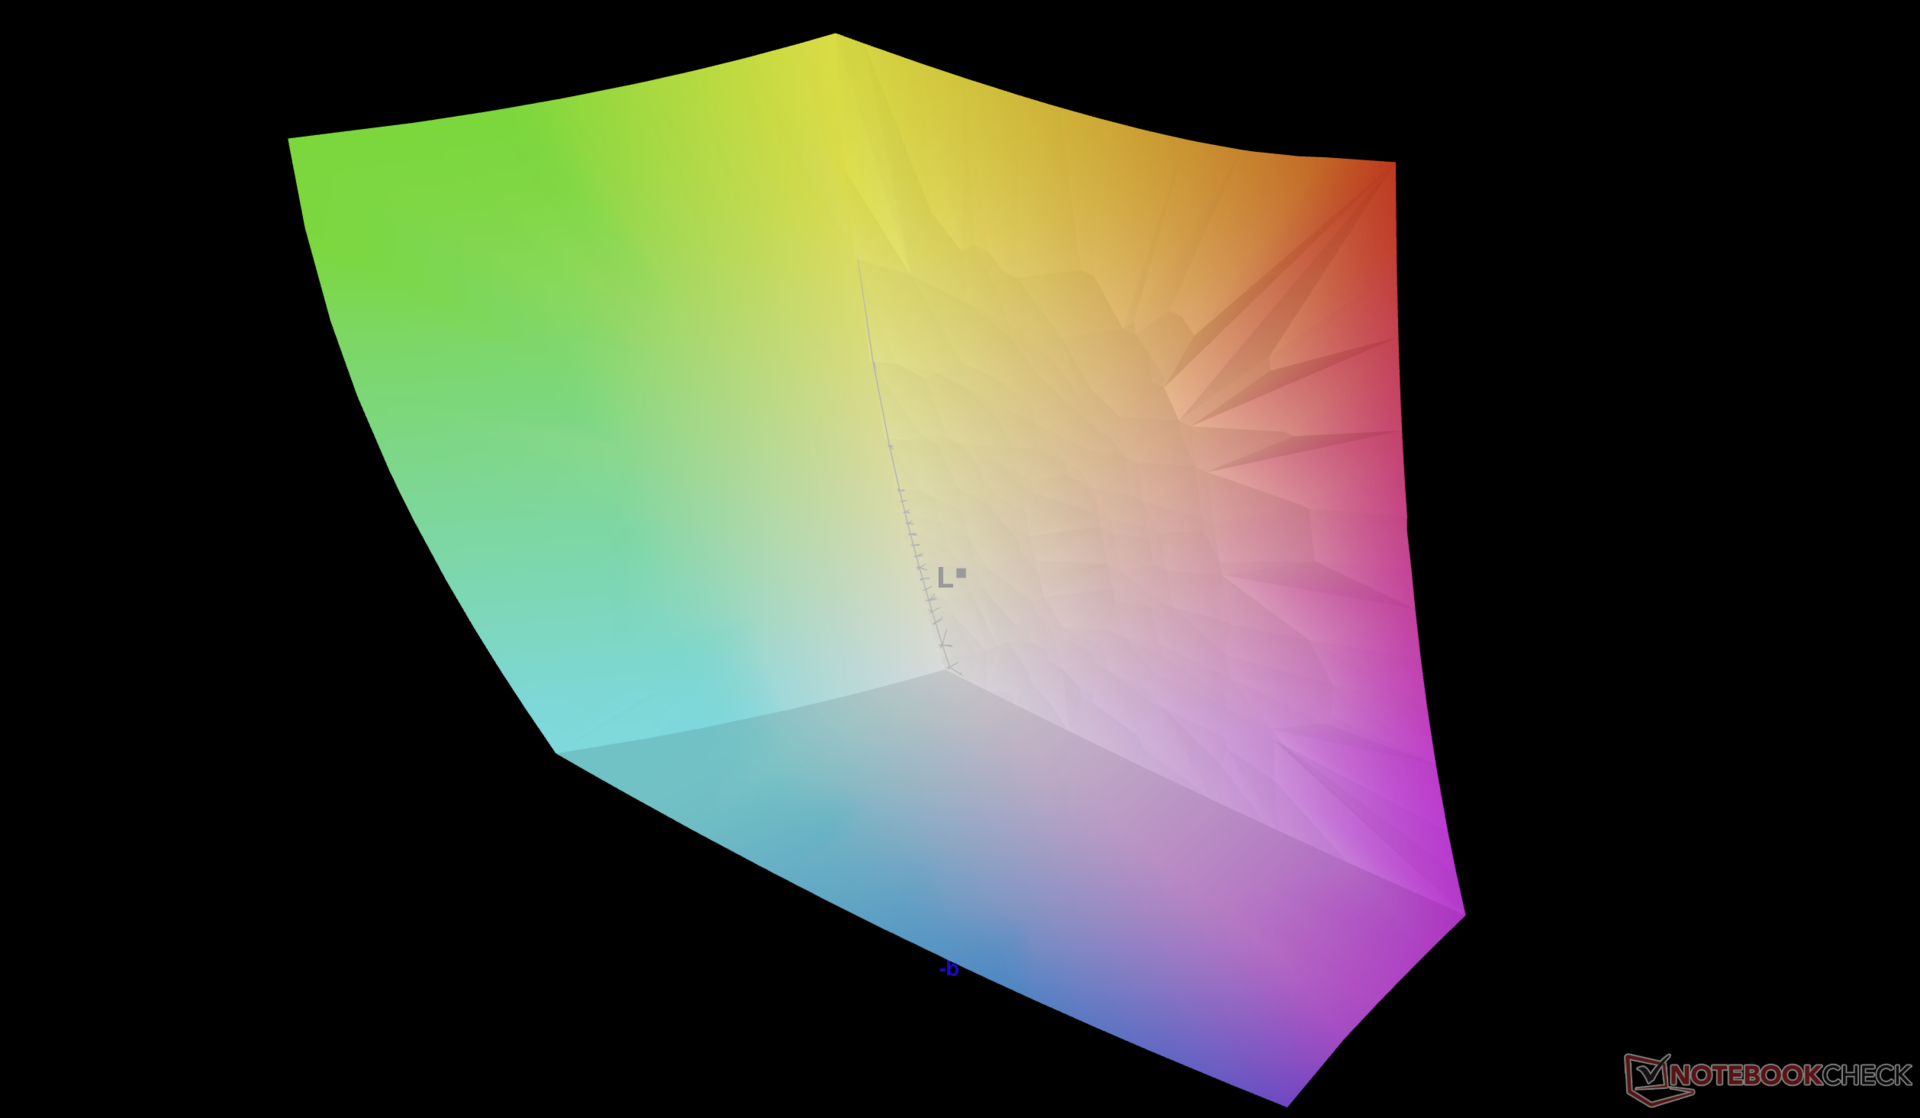
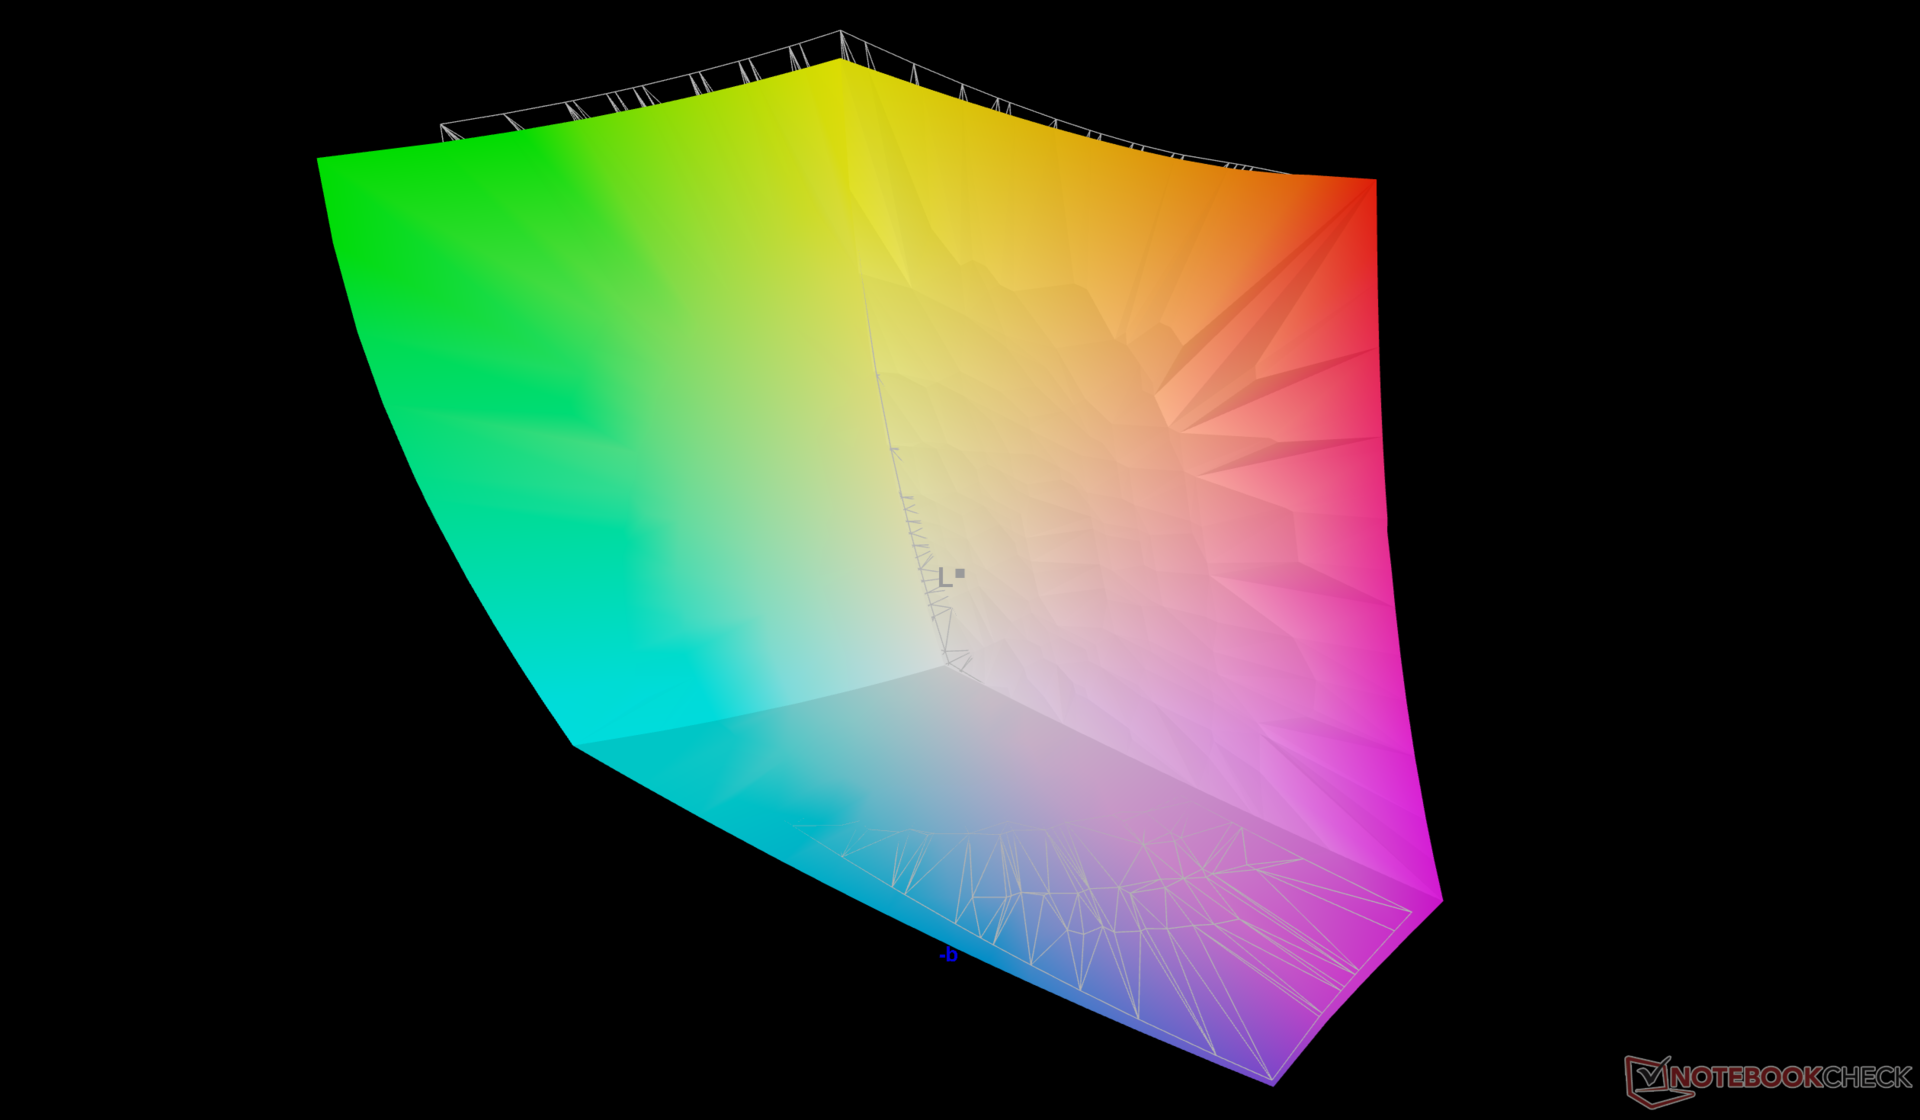
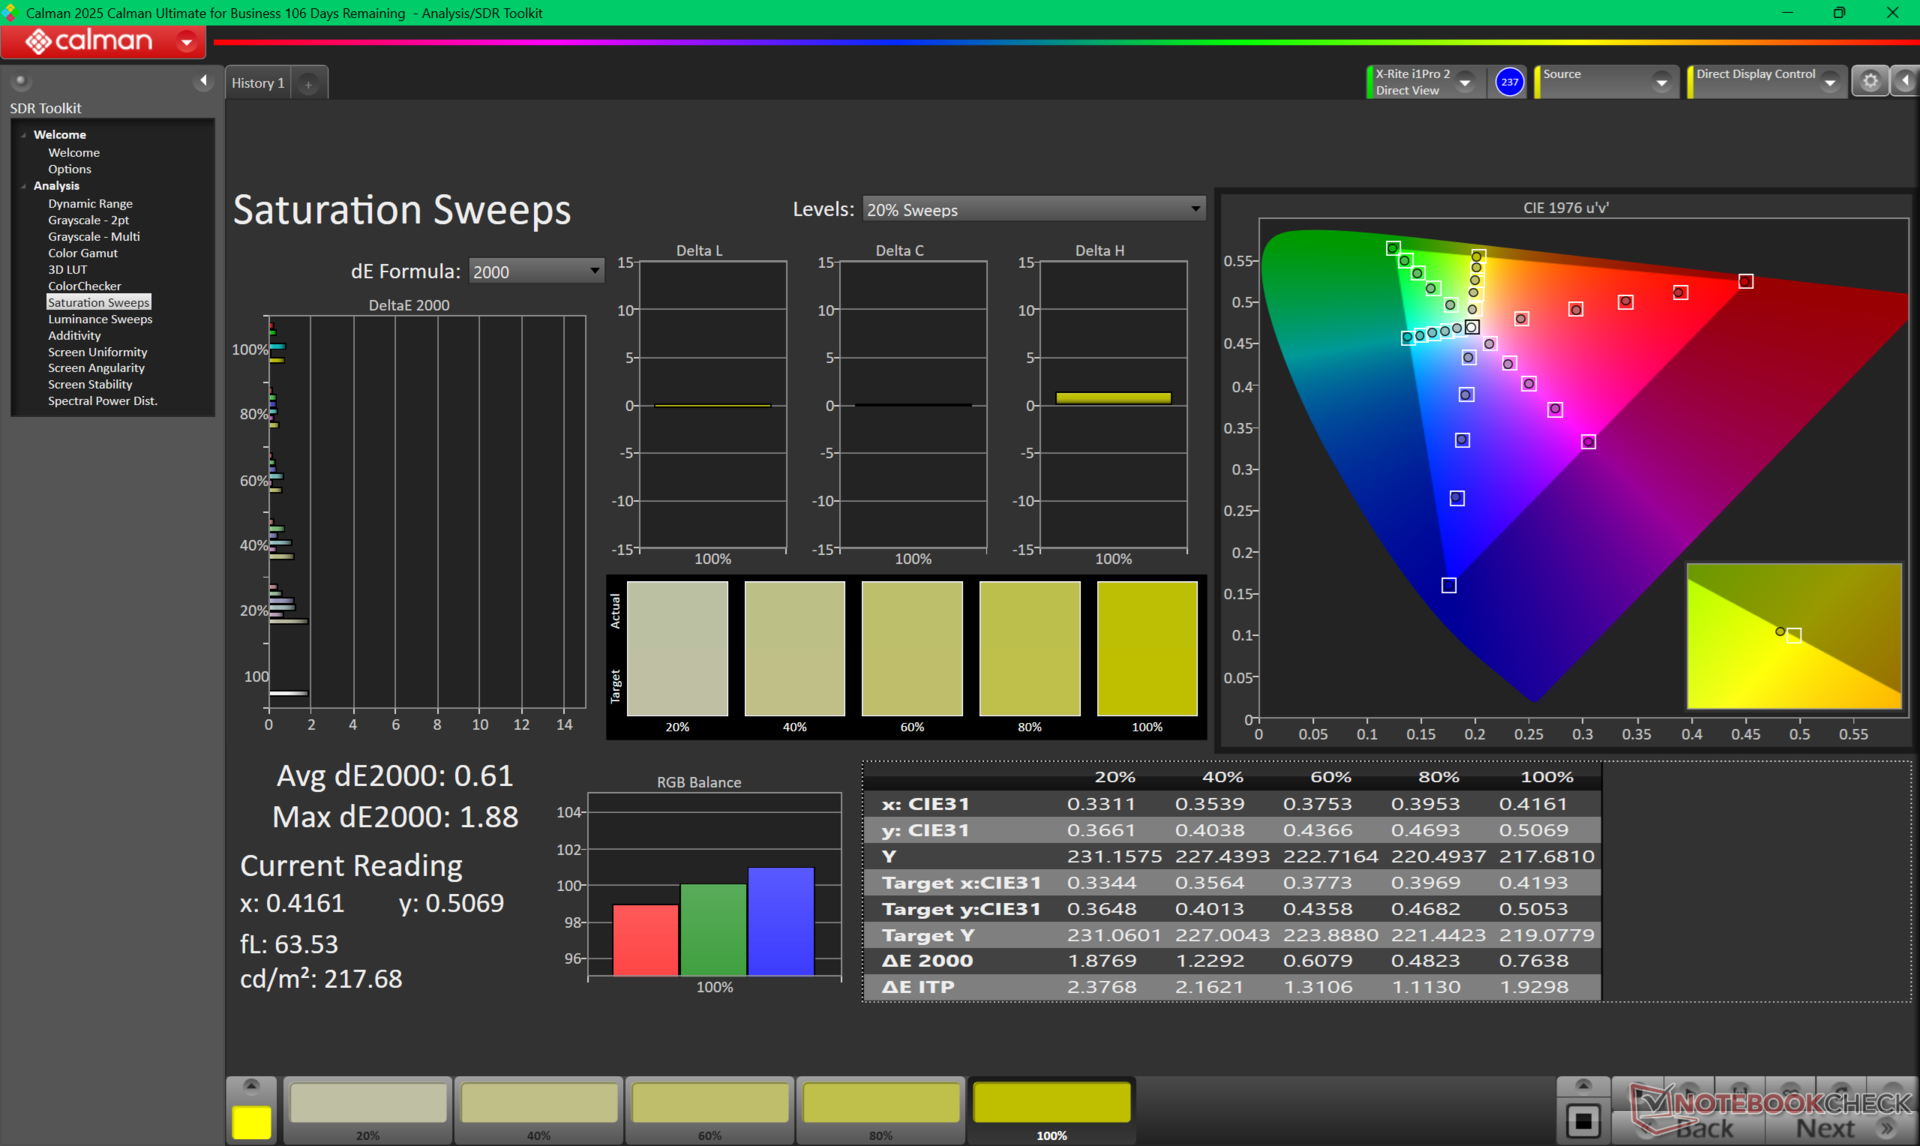
99.9% AdobeRGB 1998 (Argyll 3D)
100% sRGB (Argyll 3D)
97.2% Display P3 (Argyll 3D)
Gamma: 2.15
CCT: 6715 K
| HP ZBook X G1i 16 LG Philips LGD07B3, IPS, 2560x1600, 16", 120 Hz | HP ZBook Power 16 G11 A AUOA0A9, IPS, 2560x1600, 16", 120 Hz | HP ZBook Studio 16 G11 AUO87A8, IPS, 3840x2400, 16", 120 Hz | Lenovo ThinkPad P16 Gen 2 NE160QDM-NY1, IPS, 2560x1600, 16", 165 Hz | Dell Pro Max 16 Plus Samsung 160HC01, OLED, 3840x2400, 16", 120 Hz | Dell Precision 5690 Samsung 160YV03, OLED, 3840x2400, 16", 60 Hz | |
|---|---|---|---|---|---|---|
| Display | -20% | -4% | -21% | -4% | 0% | |
| Display P3 Coverage (%) | 97.2 | 69.1 -29% | 97.7 1% | 68.4 -30% | 97.3 0% | 99.8 3% |
| sRGB Coverage (%) | 100 | 97.7 -2% | 99.9 0% | 96.9 -3% | 100 0% | 100 0% |
| AdobeRGB 1998 Coverage (%) | 99.9 | 71 -29% | 85.7 -14% | 70.6 -29% | 88.8 -11% | 96.6 -3% |
| Response Times | 69% | 64% | 66% | 79% | 95% | |
| Response Time Grey 50% / Grey 80% * (ms) | 45.5 ? | 13.6 ? 70% | 14.2 ? 69% | 14.1 ? 69% | 0.63 ? 99% | 1.7 ? 96% |
| Response Time Black / White * (ms) | 26.1 ? | 8.4 ? 68% | 10.6 ? 59% | 9.9 ? 62% | 0.89 ? 97% | 1.7 ? 93% |
| PWM Frequency (Hz) | 26536 ? | 479.9 ? | 60 ? | |||
| PWM Amplitude * (%) | 47 | 28 40% | ||||
| Bildschirm | -4% | 11% | 31% | 29% | 1% | |
| Helligkeit Bildmitte (cd/m²) | 461.8 | 470.7 2% | 404.3 -12% | 531.5 15% | 530.9 15% | 348.1 -25% |
| Brightness (cd/m²) | 427 | 431 1% | 405 -5% | 499 17% | 540 26% | 351 -18% |
| Brightness Distribution (%) | 88 | 88 0% | 92 5% | 89 1% | 95 8% | 97 10% |
| Schwarzwert * (cd/m²) | 0.46 | 0.57 -24% | 0.28 39% | 0.38 17% | ||
| Kontrast (:1) | 1004 | 826 -18% | 1444 44% | 1399 39% | ||
| Delta E Colorchecker * | 4.08 | 2.16 47% | 2.63 36% | 1.82 55% | 2.42 41% | 4.18 -2% |
| Colorchecker dE 2000 max. * | 8.1 | 4.39 46% | 4.48 45% | 4.1 49% | 5.76 29% | 6.68 18% |
| Colorchecker dE 2000 calibrated * | 0.75 | 1.37 -83% | 1.46 -95% | 0.63 16% | 0.7 7% | 0.97 -29% |
| Delta E Graustufen * | 3.5 | 3.7 -6% | 2.1 40% | 1.2 66% | 0.8 77% | 1.7 51% |
| Gamma | 2.15 102% | 2.38 92% | 2.3 96% | 2.15 102% | 2.23 99% | 2.2 100% |
| CCT | 6715 97% | 6765 96% | 6810 95% | 6484 100% | 6488 100% | 6198 105% |
| Durchschnitt gesamt (Programm / Settings) | 15% /
3% | 24% /
15% | 25% /
25% | 35% /
33% | 32% /
16% |
* ... kleinere Werte sind besser
Reaktionszeiten (Response Times) des Displays
| ↔ Reaktionszeiten Schwarz zu Weiß | ||
|---|---|---|
| 26.1 ms ... steigend ↗ und fallend ↘ kombiniert | ↗ 11.8 ms steigend | 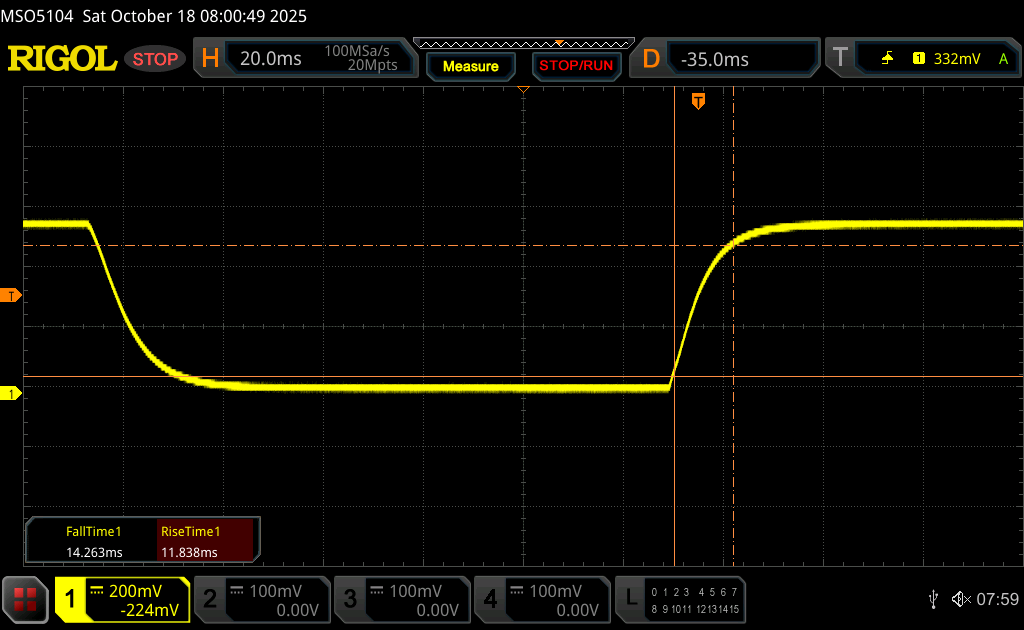 |
| ↘ 14.3 ms fallend | ||
| Die gemessenen Reaktionszeiten sind mittelmäßig und dadurch für Spieler eventuell zu langsam. Im Vergleich rangierten die bei uns getesteten Geräte von 0.1 (Minimum) zu 240 (Maximum) ms. » 65 % aller Screens waren schneller als der getestete. Daher sind die gemessenen Reaktionszeiten schlechter als der Durchschnitt aller vermessenen Geräte (19.9 ms). | ||
| ↔ Reaktionszeiten 50% Grau zu 80% Grau | ||
| 45.5 ms ... steigend ↗ und fallend ↘ kombiniert | ↗ 21.1 ms steigend | 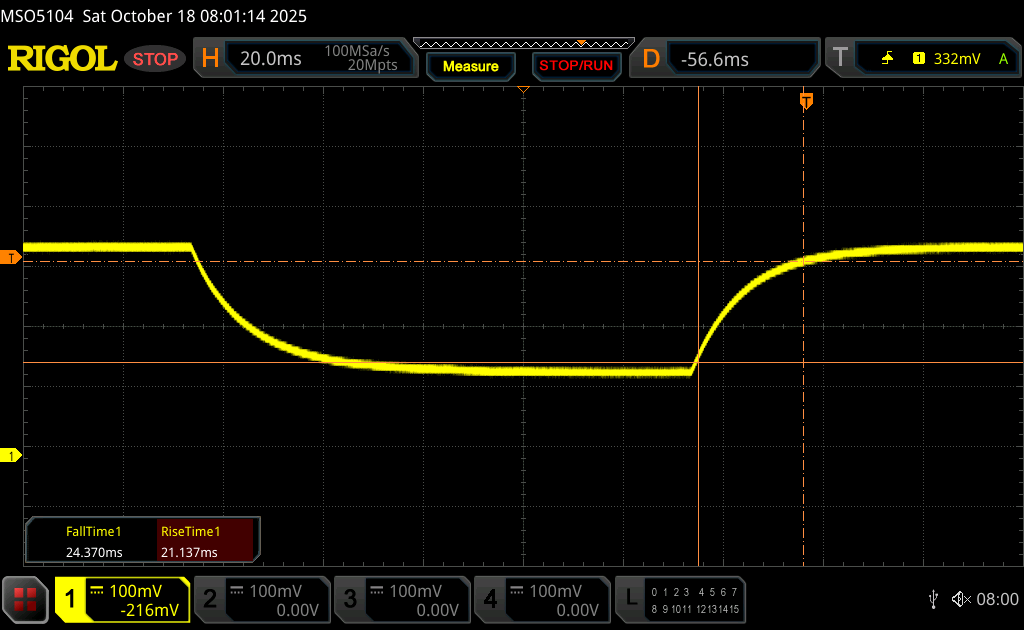 |
| ↘ 24.4 ms fallend | ||
| Die gemessenen Reaktionszeiten sind langsam und dadurch für viele Spieler wahrscheinlich zu langsam. Im Vergleich rangierten die bei uns getesteten Geräte von 0.165 (Minimum) zu 636 (Maximum) ms. » 78 % aller Screens waren schneller als der getestete. Daher sind die gemessenen Reaktionszeiten schlechter als der Durchschnitt aller vermessenen Geräte (31.1 ms). | ||
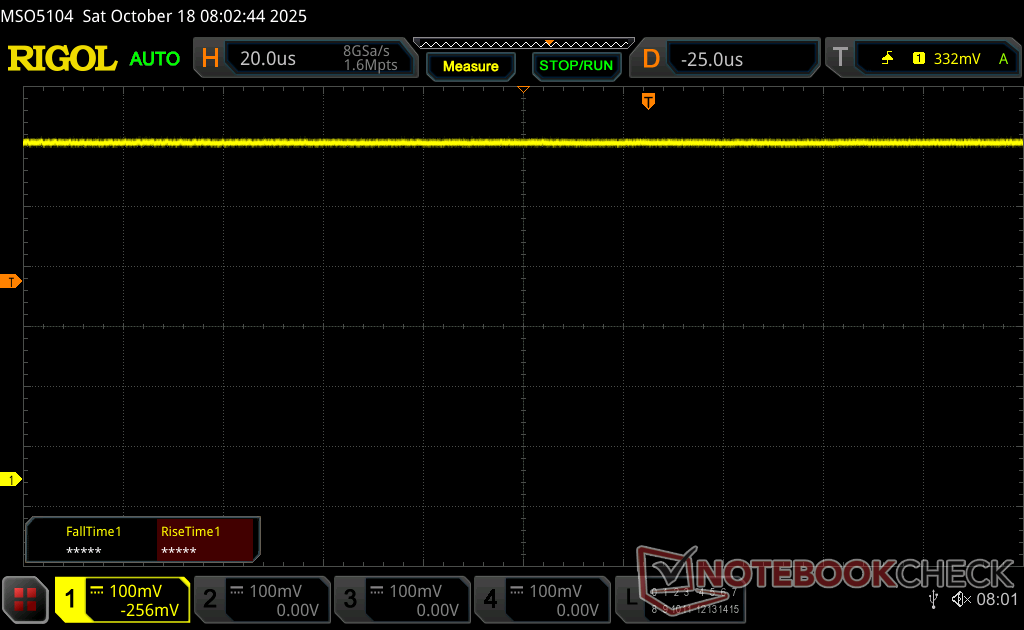
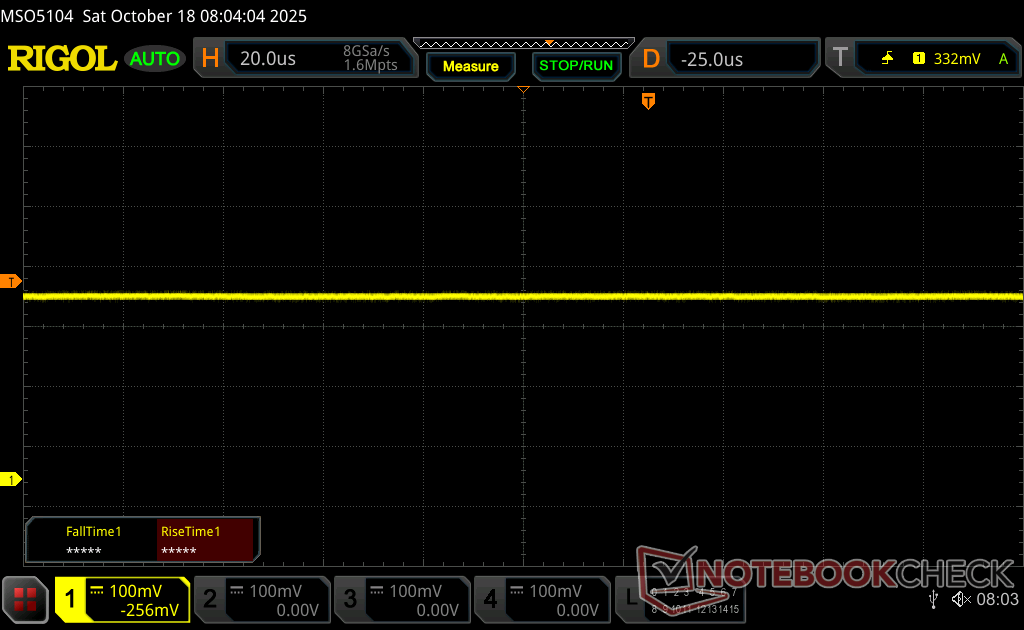
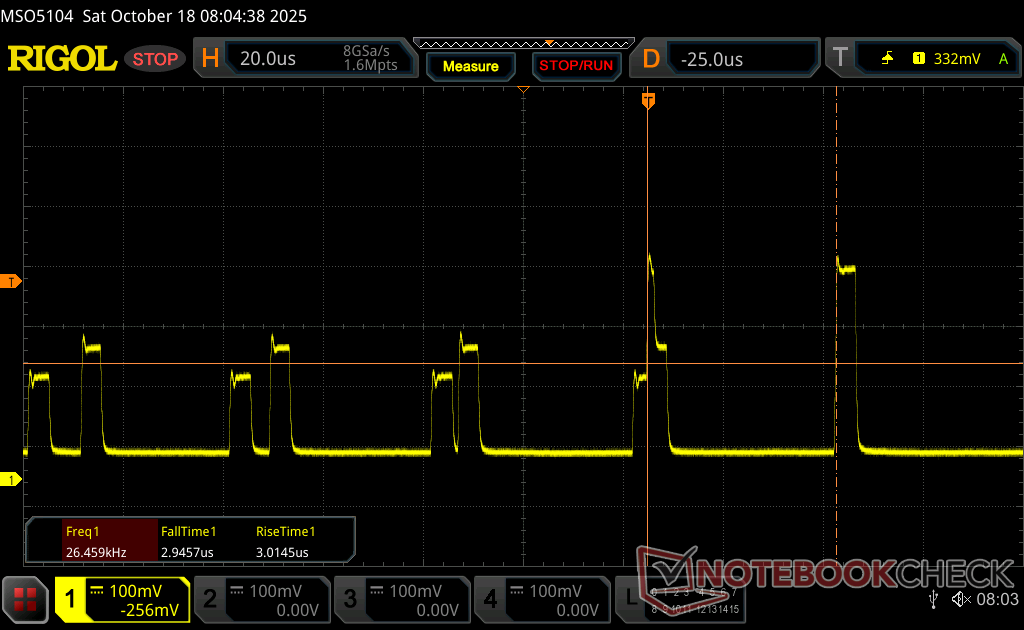
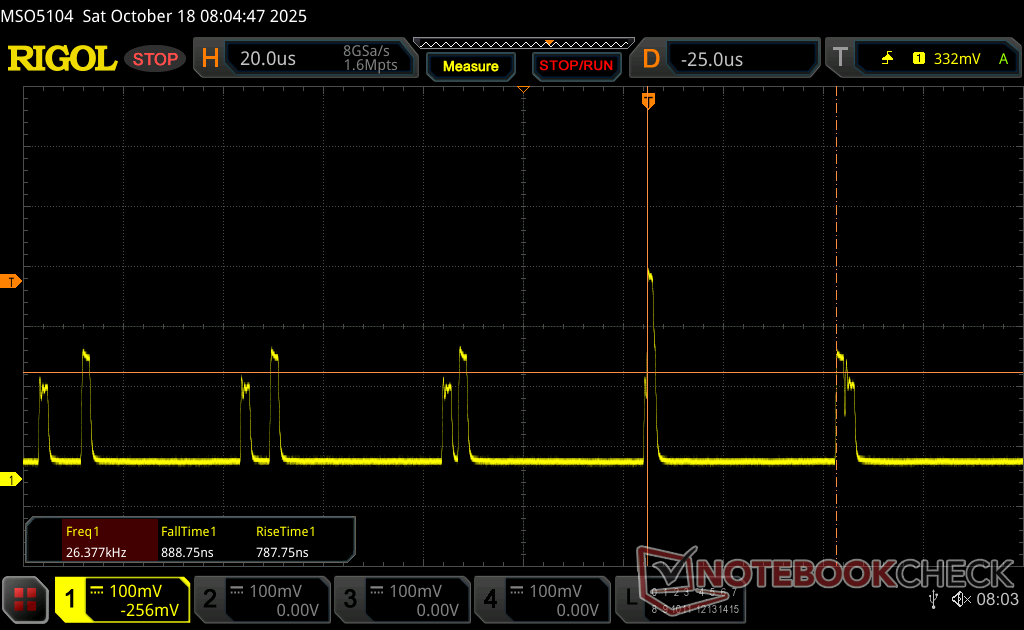
Bildschirm-Flackern / PWM (Pulse-Width Modulation)
| Flackern / PWM festgestellt | 26536 Hz Amplitude: 47 % | ≤ 74 % Helligkeit | 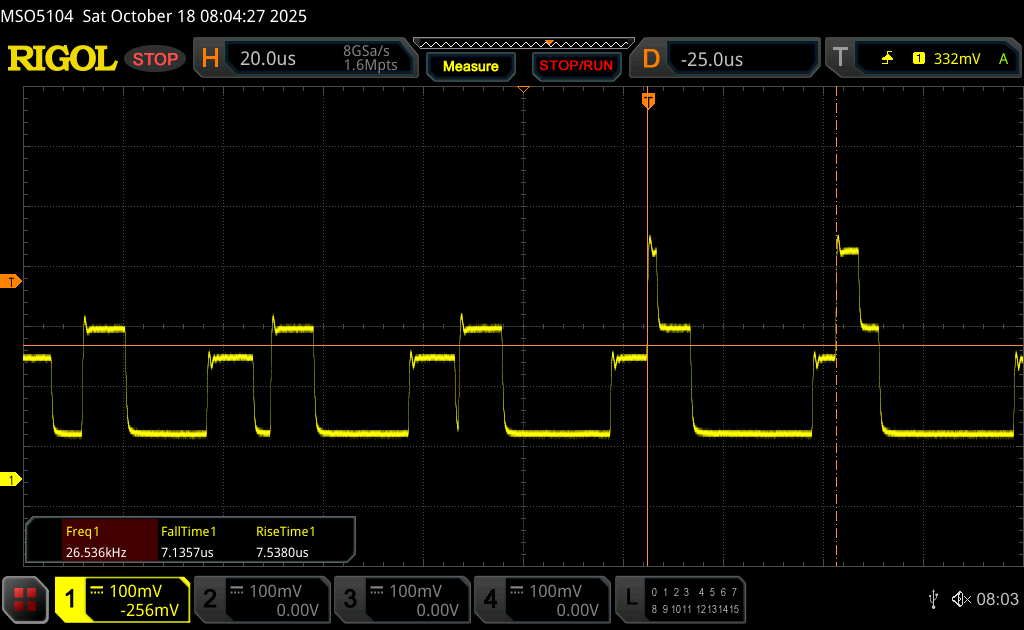 |
Das Display flackert mit 26536 Hz (im schlimmsten Fall, eventuell durch Pulsweitenmodulation PWM) bei einer eingestellten Helligkeit von 74 % und darunter. Darüber sollte es zu keinem Flackern kommen. Die Frequenz von 26536 Hz ist sehr hoch und sollte daher auch bei empfindlichen Personen zu keinen Problemen führen. Im Vergleich: 52 % aller getesteten Geräte nutzten kein PWM um die Helligkeit zu reduzieren. Wenn PWM eingesetzt wurde, dann bei einer Frequenz von durchschnittlich 7794 (Minimum 5, Maximum 343500) Hz. | |||


Performance
Testbedingungen
Wir haben Windows in den Modus Performance versetzt, bevor wir die folgenden Benchmarks durchgeführt haben.
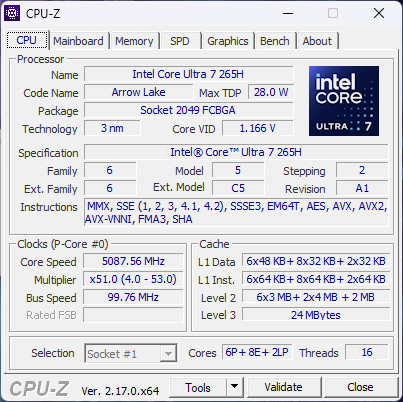
Prozessor
Der Core Ultra 7 265H bietet nur einen relativ geringen Leistungssprung (etwa 15 Prozent) gegenüber dem letztjährigen Core Ultra 7 155H. Benutzer, die von einem viel älteren Modell wie dem HP ZBook Studio 16 G9 aufrüsten, werden eine deutlichere Steigerung von etwa 30 Prozent feststellen.
Die Leistung sinkt um etwa 10 Prozent, wenn unser CineBench R15 xT-Stresstest in einer Schleife ausgeführt wird. Dies ist auf die Einschränkungen von Turbo Boost zurückzuführen, die im Abschnitt „Stresstest“ weiter unten näher erläutert werden.
Cinebench R15 Mehrfachschleife
Cinebench R23: Multi Core | Single Core
Cinebench R20: CPU (Multi Core) | CPU (Single Core)
Cinebench R15: CPU Multi 64Bit | CPU Single 64Bit
Blender: v2.79 BMW27 CPU
7-Zip 18.03: 7z b 4 | 7z b 4 -mmt1
Geekbench 6.7: Multi-Core | Single-Core
Geekbench 5.5: Multi-Core | Single-Core
HWBOT x265 Benchmark v2.2: 4k Preset
LibreOffice : 20 Documents To PDF
R Benchmark 2.5: Overall mean
* ... kleinere Werte sind besser
System Performance
Einige Benchmarks stürzte auf unserem Testgerät ab oder konnte nicht abgeschlossen werden, darunter PCMark 10, SpecViewPerf 13 Maya und AIDA64 Engineer.
CrossMark: Overall | Productivity | Creativity | Responsiveness
WebXPRT 3: Overall
WebXPRT 4: Overall
Mozilla Kraken 1.1: Total
| Performance Rating | |
| Dell Pro Max 16 Plus | |
| Lenovo ThinkPad P16 Gen 2 | |
| HP ZBook X G1i 16 | |
| Durchschnittliche Intel Core Ultra 7 265H, NVIDIA RTX PRO 2000 Blackwell Generation Laptop | |
| Dell Precision 5690 | |
| HP ZBook Studio 16 G11 | |
| HP ZBook Power 16 G11 A | |
| CrossMark / Overall | |
| Dell Pro Max 16 Plus | |
| Lenovo ThinkPad P16 Gen 2 | |
| HP ZBook X G1i 16 | |
| Durchschnittliche Intel Core Ultra 7 265H, NVIDIA RTX PRO 2000 Blackwell Generation Laptop (n=1) | |
| Dell Precision 5690 | |
| HP ZBook Power 16 G11 A | |
| HP ZBook Studio 16 G11 | |
| CrossMark / Productivity | |
| Dell Pro Max 16 Plus | |
| HP ZBook X G1i 16 | |
| Durchschnittliche Intel Core Ultra 7 265H, NVIDIA RTX PRO 2000 Blackwell Generation Laptop (n=1) | |
| Lenovo ThinkPad P16 Gen 2 | |
| Dell Precision 5690 | |
| HP ZBook Power 16 G11 A | |
| HP ZBook Studio 16 G11 | |
| CrossMark / Creativity | |
| Dell Pro Max 16 Plus | |
| Lenovo ThinkPad P16 Gen 2 | |
| HP ZBook X G1i 16 | |
| Durchschnittliche Intel Core Ultra 7 265H, NVIDIA RTX PRO 2000 Blackwell Generation Laptop (n=1) | |
| HP ZBook Power 16 G11 A | |
| Dell Precision 5690 | |
| HP ZBook Studio 16 G11 | |
| CrossMark / Responsiveness | |
| Dell Pro Max 16 Plus | |
| Lenovo ThinkPad P16 Gen 2 | |
| Dell Precision 5690 | |
| HP ZBook X G1i 16 | |
| Durchschnittliche Intel Core Ultra 7 265H, NVIDIA RTX PRO 2000 Blackwell Generation Laptop (n=1) | |
| HP ZBook Studio 16 G11 | |
| HP ZBook Power 16 G11 A | |
| WebXPRT 3 / Overall | |
| Lenovo ThinkPad P16 Gen 2 | |
| Dell Pro Max 16 Plus | |
| HP ZBook X G1i 16 | |
| Durchschnittliche Intel Core Ultra 7 265H, NVIDIA RTX PRO 2000 Blackwell Generation Laptop (n=1) | |
| HP ZBook Power 16 G11 A | |
| HP ZBook Studio 16 G11 | |
| Dell Precision 5690 | |
| WebXPRT 4 / Overall | |
| Dell Pro Max 16 Plus | |
| Lenovo ThinkPad P16 Gen 2 | |
| HP ZBook X G1i 16 | |
| Durchschnittliche Intel Core Ultra 7 265H, NVIDIA RTX PRO 2000 Blackwell Generation Laptop (n=1) | |
| Dell Precision 5690 | |
| HP ZBook Studio 16 G11 | |
| HP ZBook Power 16 G11 A | |
| Mozilla Kraken 1.1 / Total | |
| HP ZBook Power 16 G11 A | |
| HP ZBook Studio 16 G11 | |
| Dell Precision 5690 | |
| HP ZBook X G1i 16 | |
| Durchschnittliche Intel Core Ultra 7 265H, NVIDIA RTX PRO 2000 Blackwell Generation Laptop (n=1) | |
| Lenovo ThinkPad P16 Gen 2 | |
| Dell Pro Max 16 Plus | |
* ... kleinere Werte sind besser
» No benchmarks for this notebook found!
DPC-Latenzzeit
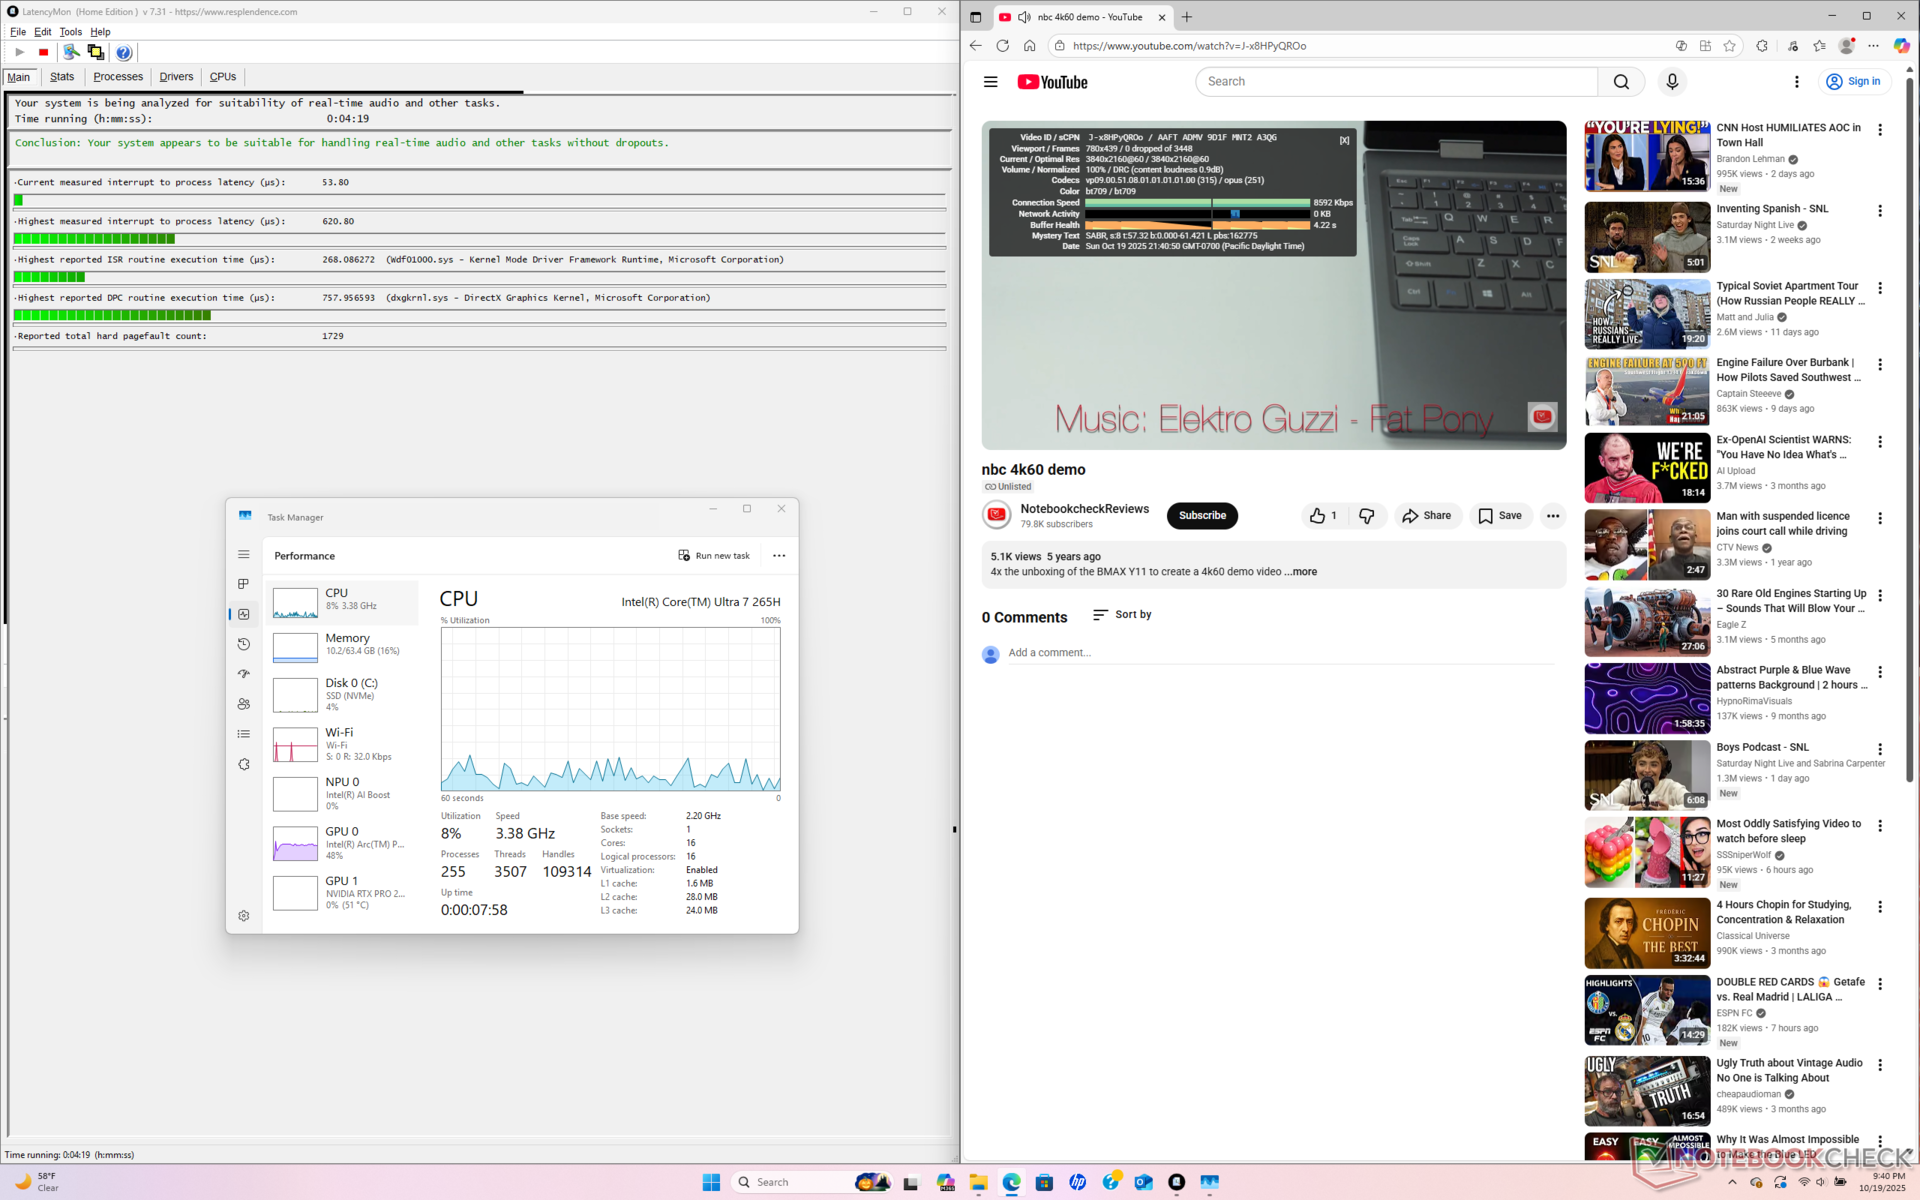
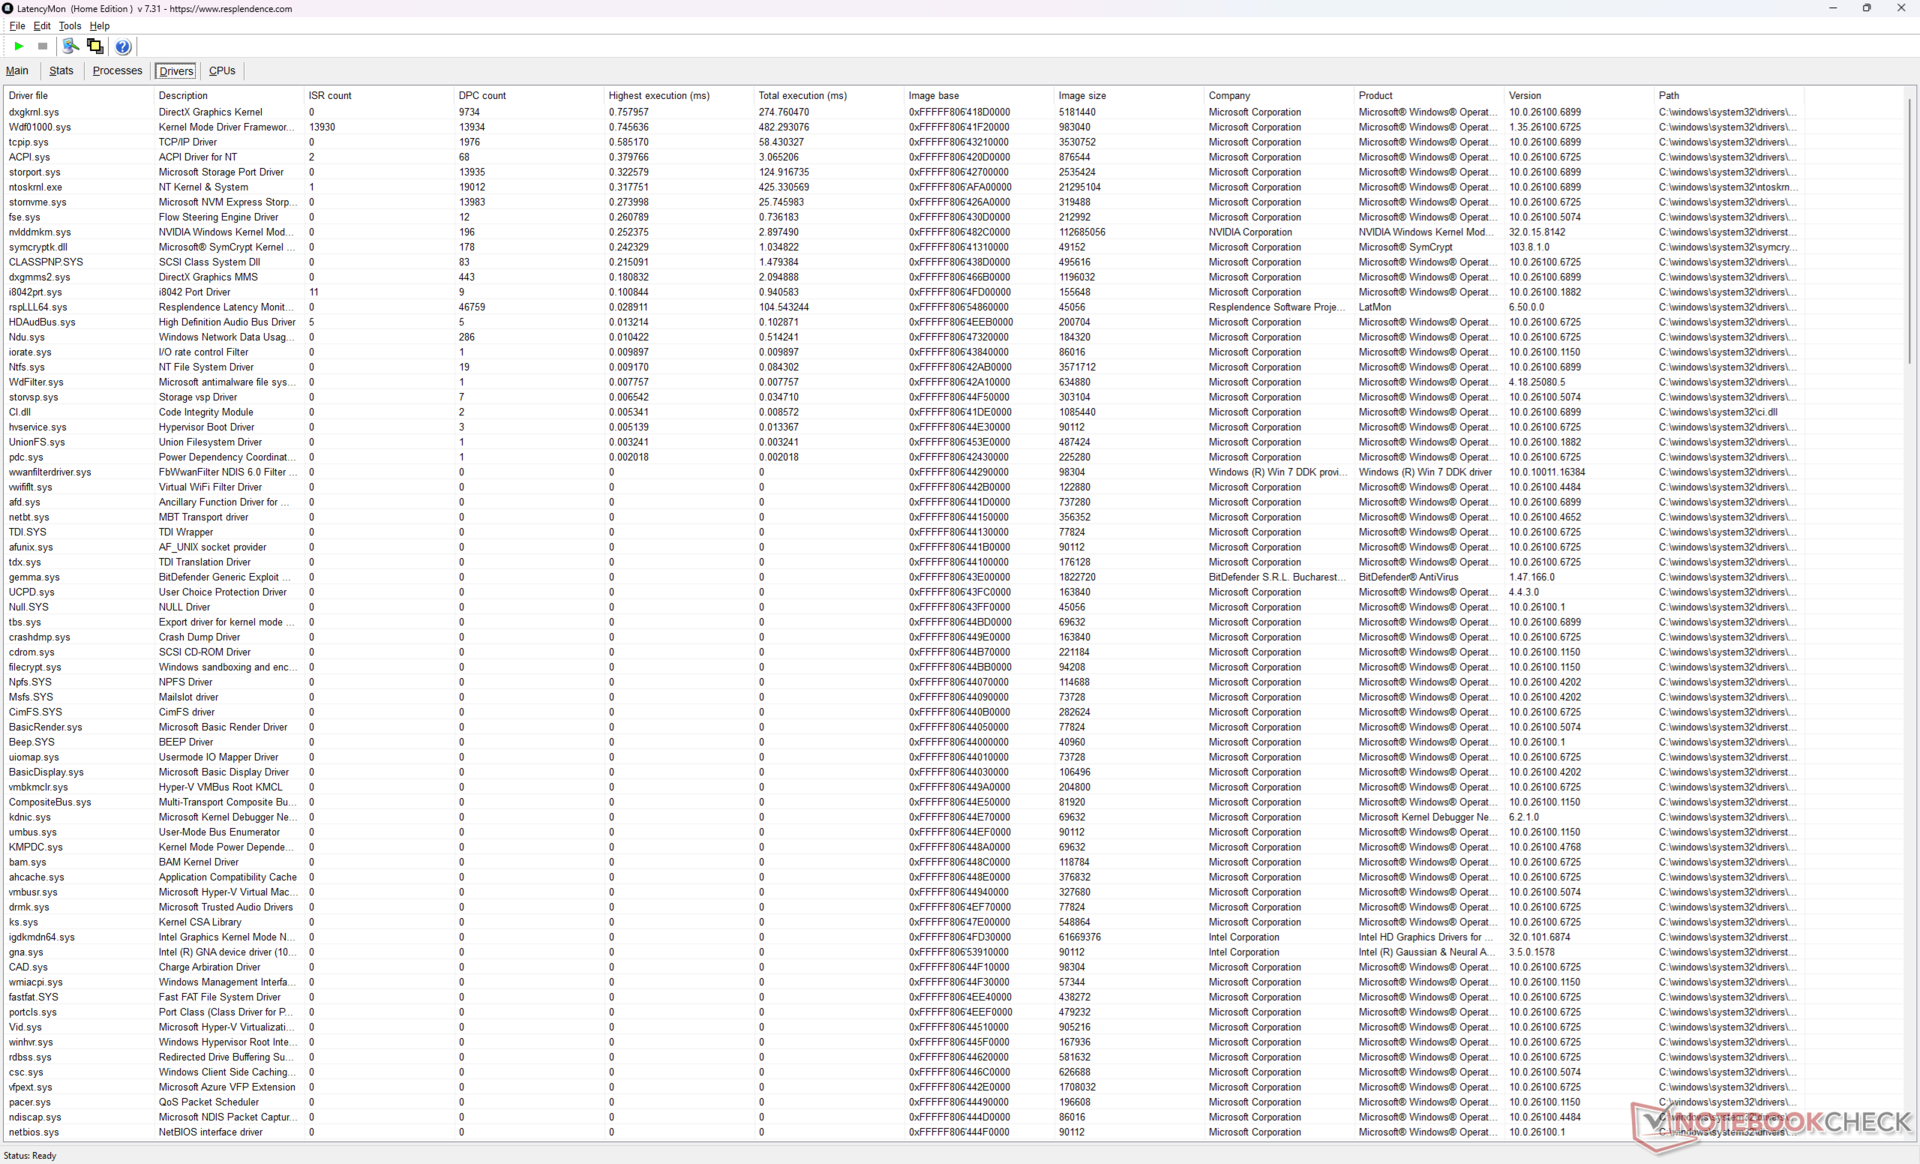
| DPC Latencies / LatencyMon - interrupt to process latency (max), Web, Youtube, Prime95 | |
| HP ZBook Power 16 G11 A | |
| Dell Pro Max 16 Plus | |
| HP ZBook Studio 16 G11 | |
| Lenovo ThinkPad P16 Gen 2 | |
| HP ZBook X G1i 16 | |
| Dell Precision 5690 | |
* ... kleinere Werte sind besser
Speichergeräte
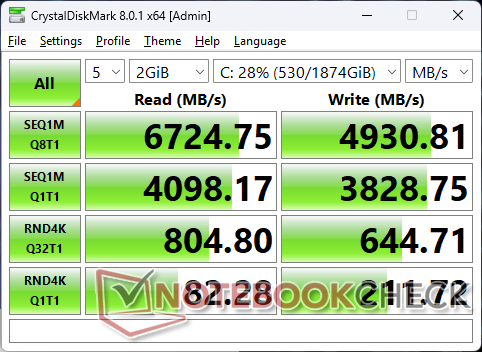
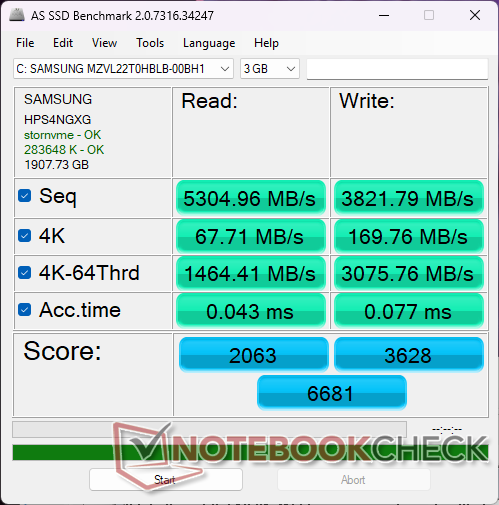

| Drive Performance Rating - Percent | |
| HP ZBook X G1i 16 | |
| Dell Pro Max 16 Plus | |
| Dell Precision 5690 | |
| Lenovo ThinkPad P16 Gen 2 | |
| HP ZBook Power 16 G11 A | |
| HP ZBook Studio 16 G11 | |
* ... kleinere Werte sind besser
Drosselung der Festplatte: DiskSpd-Leseschleife, Warteschlangentiefe 8
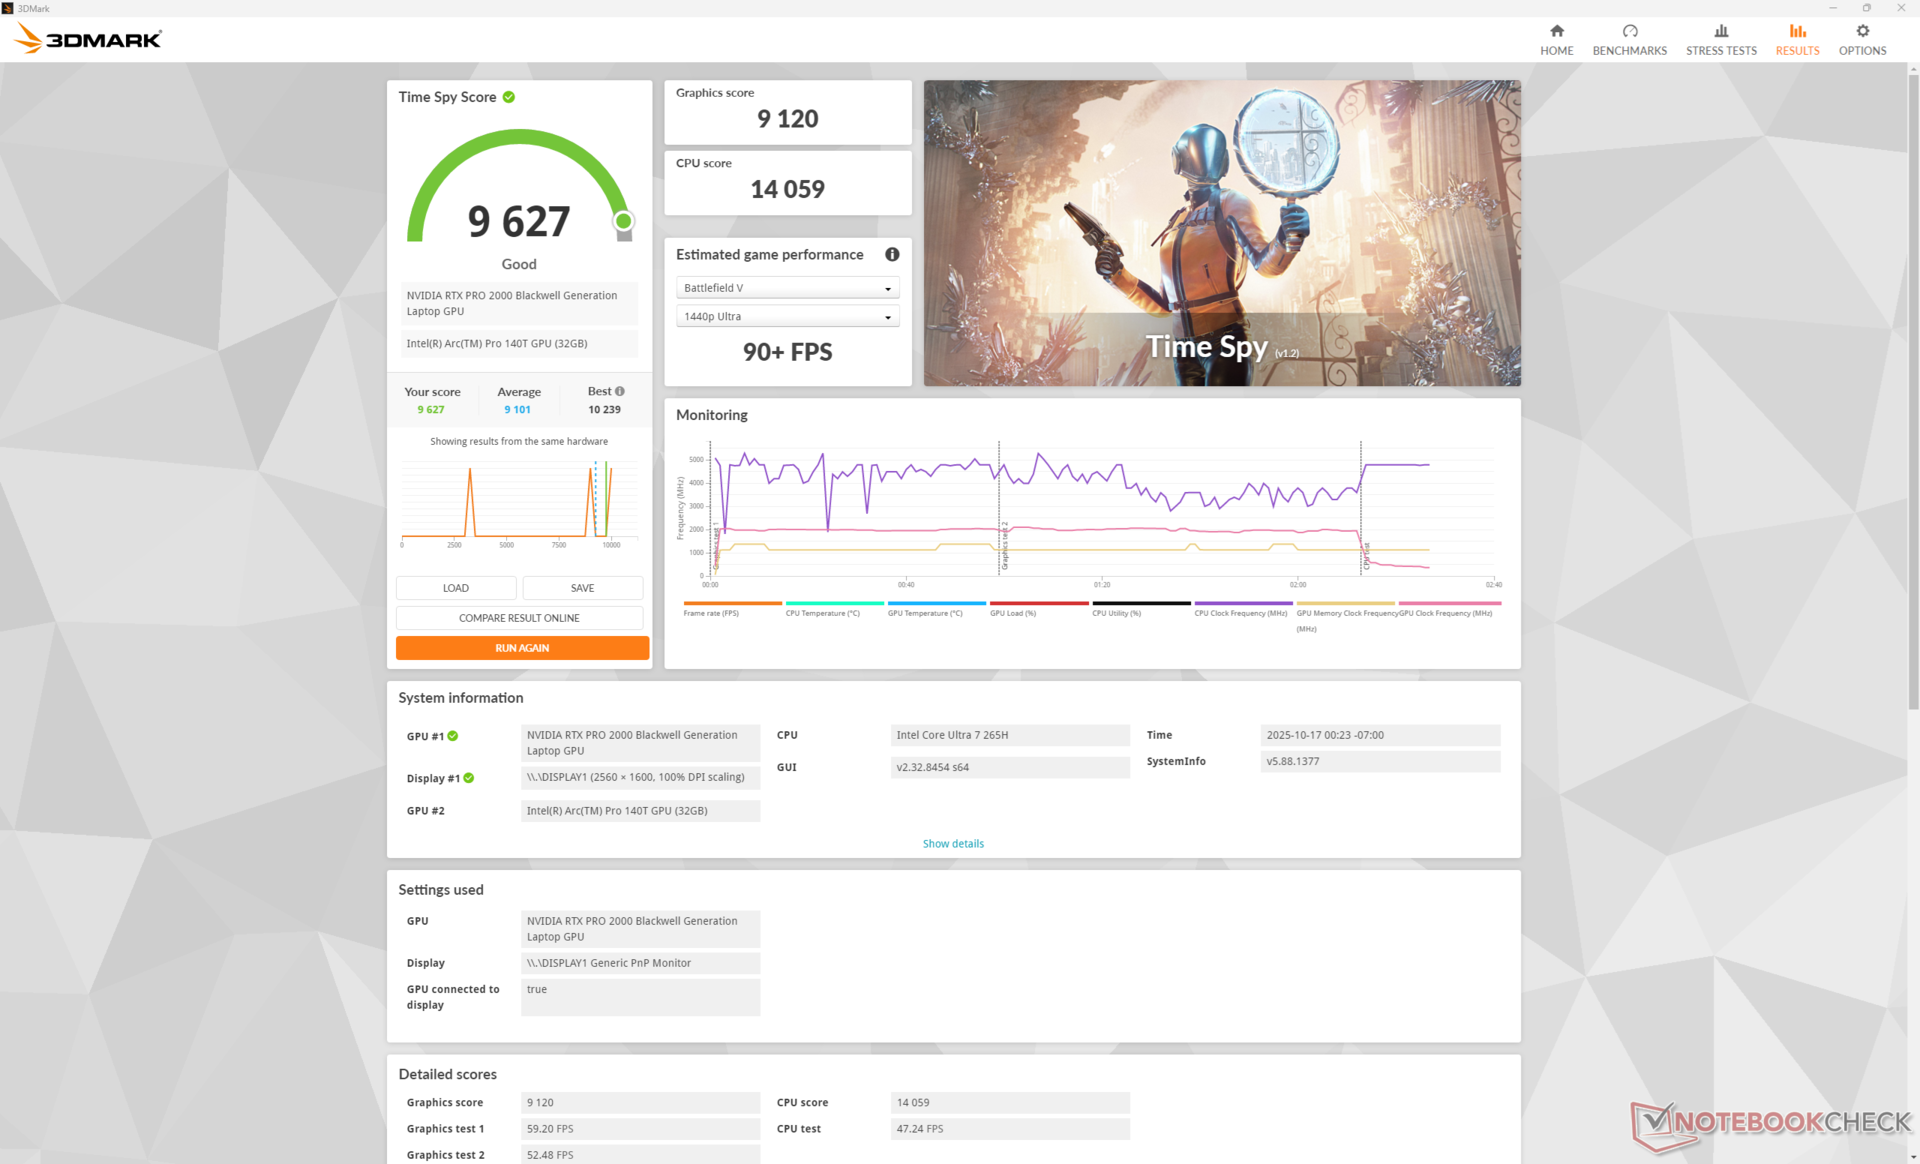
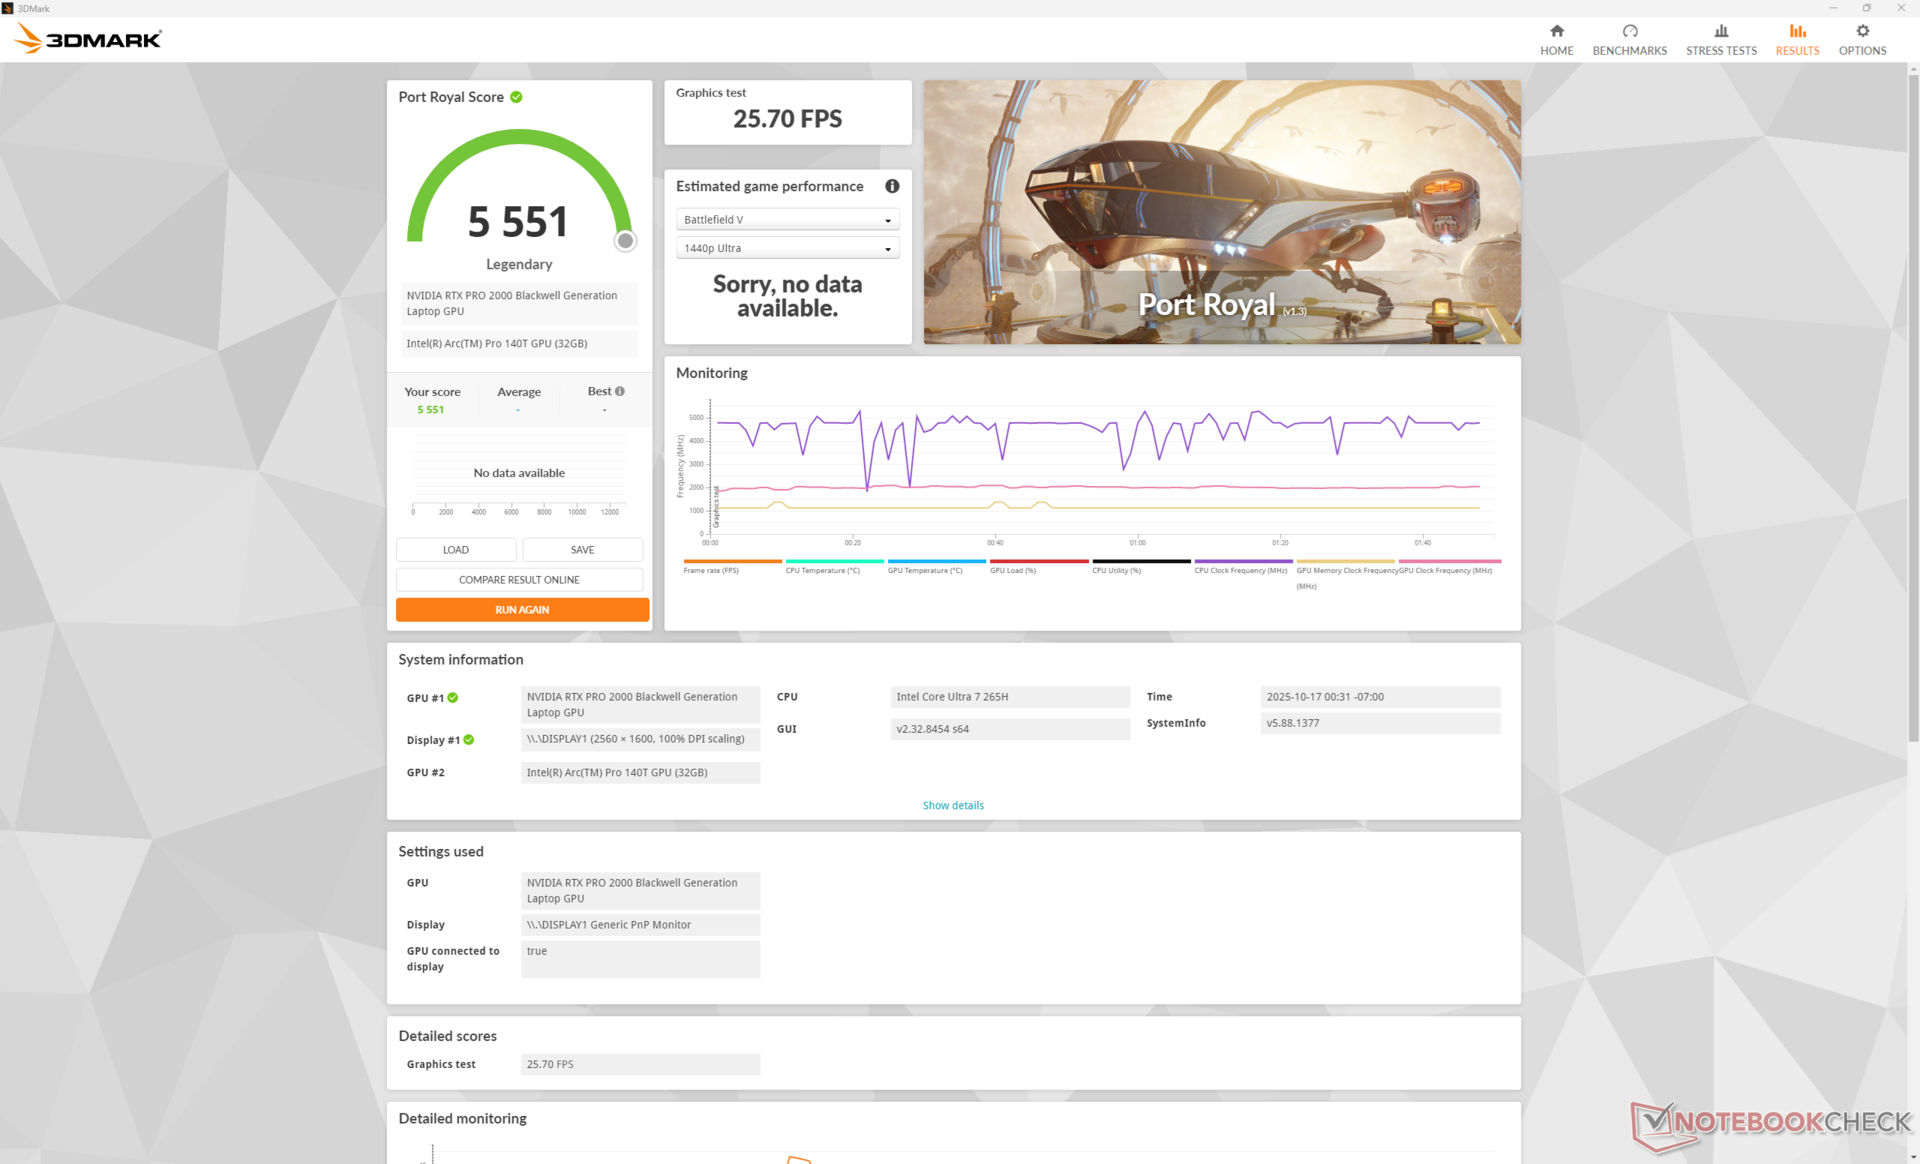
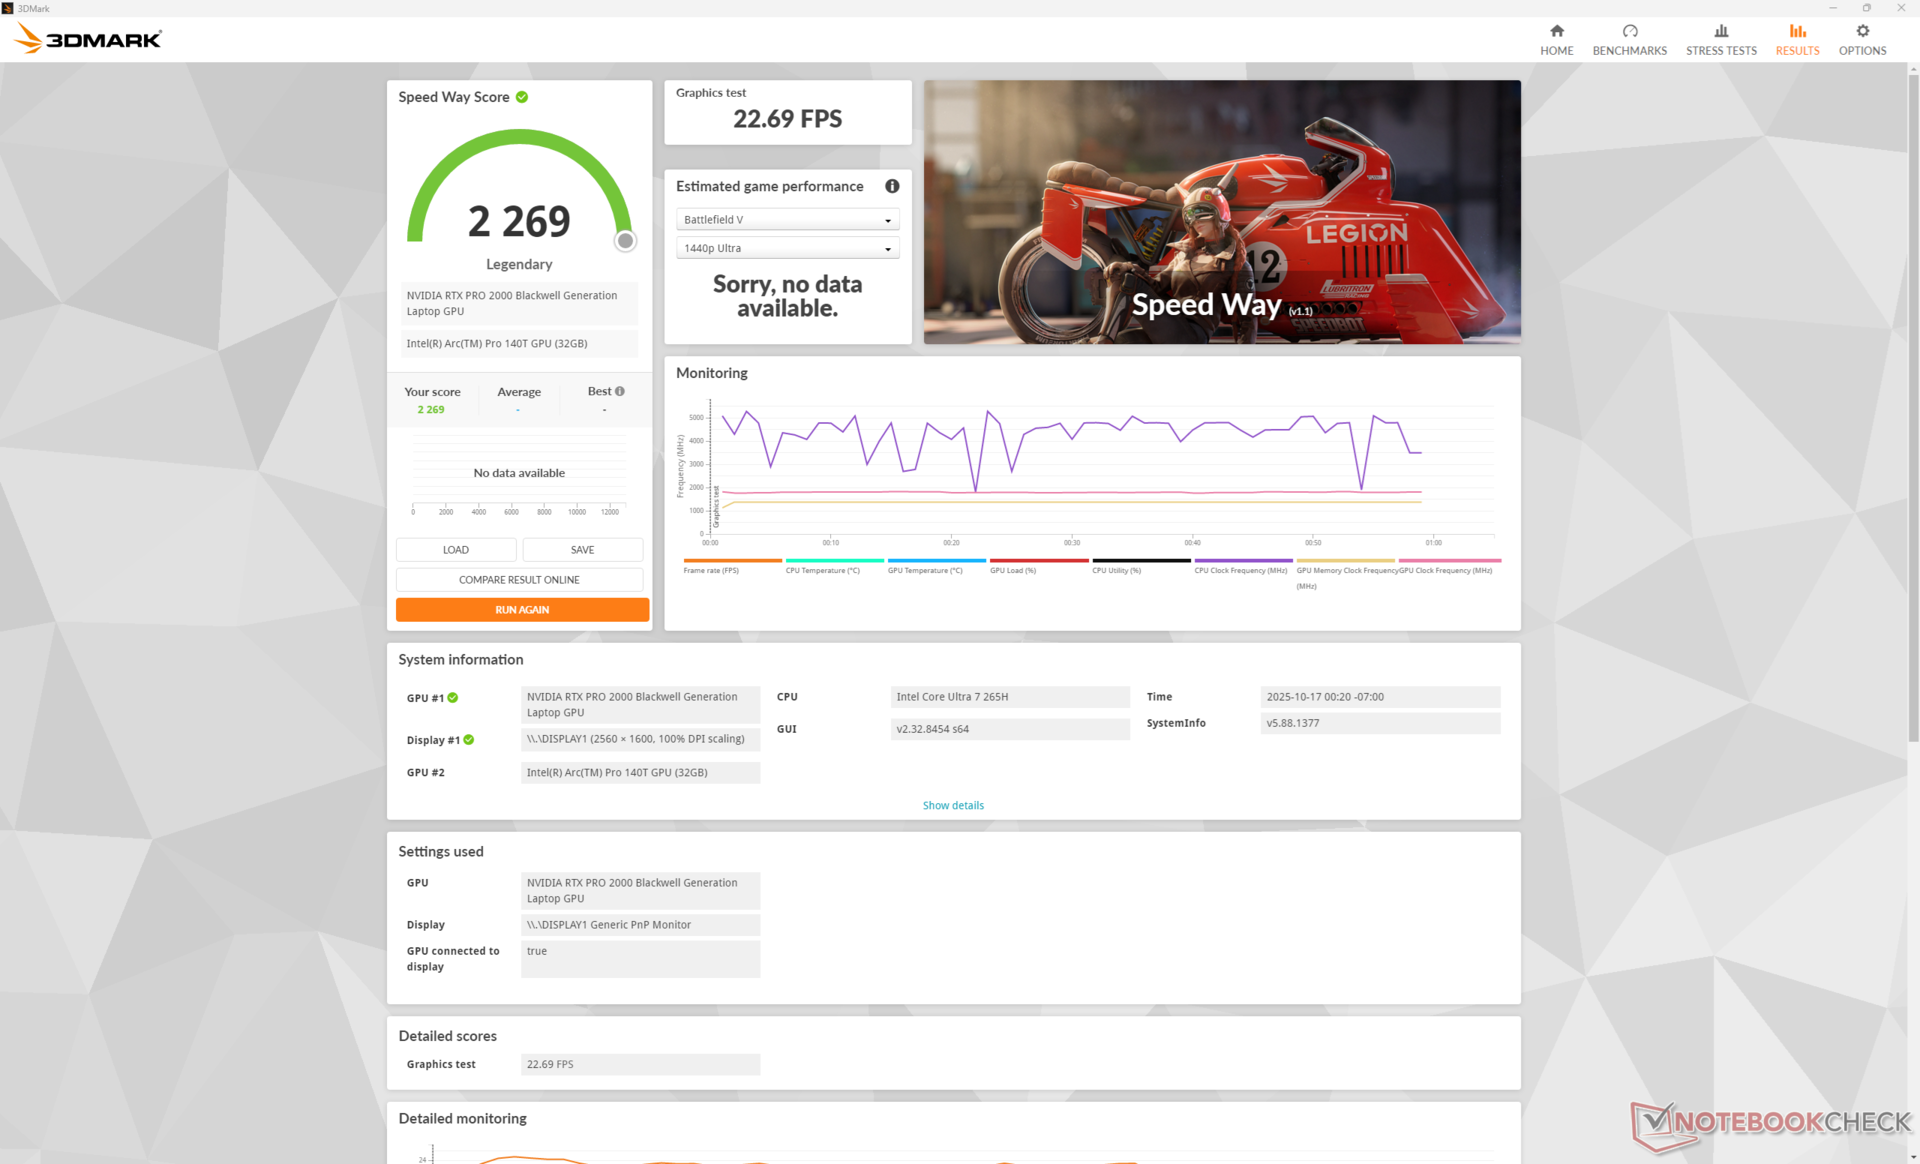
GPU Performance
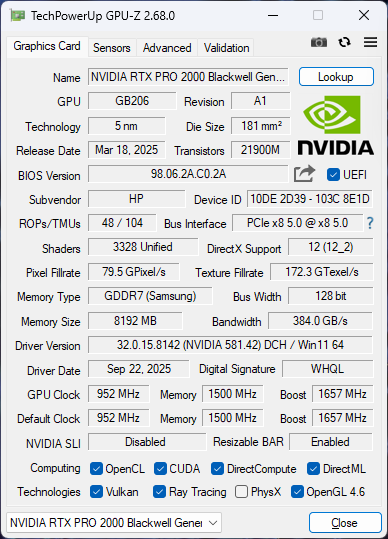
Der RTX Pro 2000 Blackwell im HP zielt mit 60 W auf eine Rohleistung ab, die nur geringfügig höher ist als die der letzten Generation RTX 2000 Ada Lovelace. In der Zwischenzeit werden Benutzer, die von der viel älteren RTX A2000 auf Modellen wie dem 2022 ZBook Studio 16 G9 aufrüsten, signifikante Leistungssteigerungen von 1,5x bis 1,9x sehen.
Wenn Sie den Modus "Balanced" anstelle des Modus "Performance" verwenden, wird die Grafikleistung um etwa 5 Prozent beeinträchtigt, wie unsere Fire Strike Ergebnistabelle unten zeigt. Bei Spielen schneidet die RTX Pro 2000 am ähnlichsten ab wie die mobile GeForce RTX 4060 oder 5060.
| Leistungsprofil | Graphics Score | Physics Score | Kombinierte Punktzahl |
| Performance Modus | 25085 | 33858 | 11010 |
| Balanced Modus | 23771 (-5%) | 35309 (+4%) | 9366 (-15%) |
| Akku-Leistung | 18195 (-27%) | 25739 (-24%) | 5646 (-49%) |
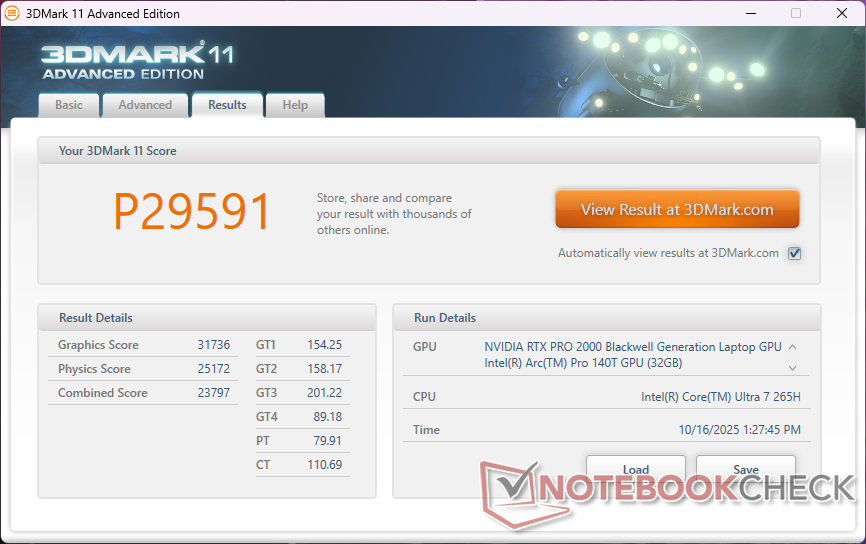

| 3DMark 11 Performance | 29591 Punkte | |
| 3DMark Cloud Gate Standard Score | 60675 Punkte | |
| 3DMark Fire Strike Score | 23035 Punkte | |
| 3DMark Time Spy Score | 9627 Punkte | |
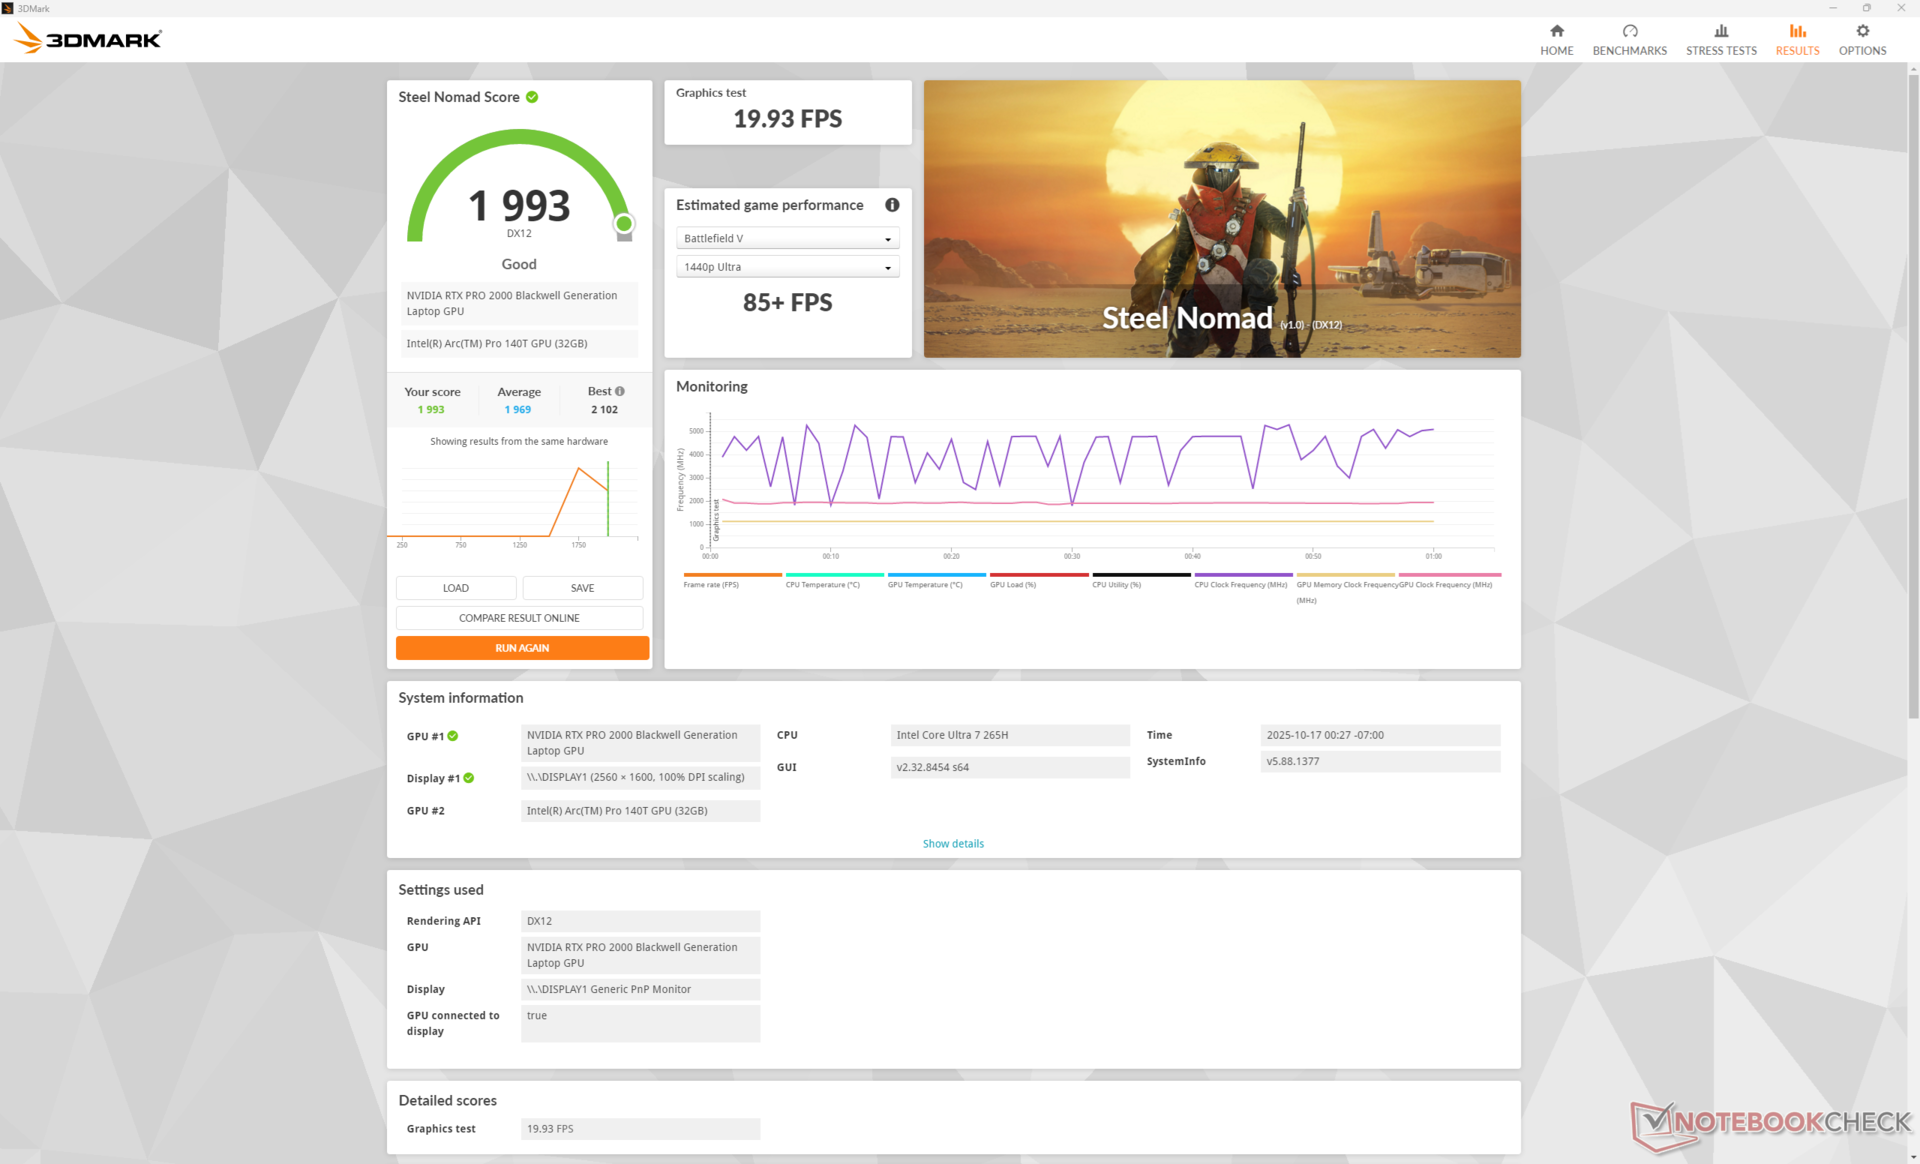
| 3DMark Steel Nomad Score | 1993 Punkte | |
Hilfe | ||
* ... kleinere Werte sind besser
| Performance Rating - Percent | |
| Dell Pro Max 16 Plus | |
| Lenovo ThinkPad P16 Gen 2 | |
| Dell Precision 5690 -1! | |
| HP ZBook X G1i 16 | |
| HP ZBook Studio 16 G11 | |
| HP ZBook Power 16 G11 A | |
| Cyberpunk 2077 - 1920x1080 Ultra Preset (FSR off) | |
| Dell Pro Max 16 Plus | |
| Dell Precision 5690 | |
| Lenovo ThinkPad P16 Gen 2 | |
| HP ZBook X G1i 16 | |
| HP ZBook Studio 16 G11 | |
| HP ZBook Power 16 G11 A | |
| Baldur's Gate 3 - 1920x1080 Ultra Preset AA:T | |
| Dell Pro Max 16 Plus | |
| Lenovo ThinkPad P16 Gen 2 | |
| Dell Precision 5690 | |
| HP ZBook Studio 16 G11 | |
| HP ZBook X G1i 16 | |
| HP ZBook Power 16 G11 A | |
| GTA V - 1920x1080 Highest AA:4xMSAA + FX AF:16x | |
| Dell Pro Max 16 Plus | |
| Lenovo ThinkPad P16 Gen 2 | |
| HP ZBook X G1i 16 | |
| HP ZBook Studio 16 G11 | |
| HP ZBook Power 16 G11 A | |
| Final Fantasy XV Benchmark - 1920x1080 High Quality | |
| Dell Pro Max 16 Plus | |
| Lenovo ThinkPad P16 Gen 2 | |
| Dell Precision 5690 | |
| HP ZBook X G1i 16 | |
| HP ZBook Studio 16 G11 | |
| HP ZBook Power 16 G11 A | |
| Strange Brigade - 1920x1080 ultra AA:ultra AF:16 | |
| Lenovo ThinkPad P16 Gen 2 | |
| Dell Pro Max 16 Plus | |
| Dell Precision 5690 | |
| HP ZBook Studio 16 G11 | |
| HP ZBook X G1i 16 | |
| HP ZBook Power 16 G11 A | |
| Dota 2 Reborn - 1920x1080 ultra (3/3) best looking | |
| Dell Pro Max 16 Plus | |
| Lenovo ThinkPad P16 Gen 2 | |
| HP ZBook Studio 16 G11 | |
| HP ZBook X G1i 16 | |
| Dell Precision 5690 | |
| HP ZBook Power 16 G11 A | |
| X-Plane 11.11 - 1920x1080 high (fps_test=3) | |
| Lenovo ThinkPad P16 Gen 2 | |
| Dell Pro Max 16 Plus | |
| Dell Precision 5690 | |
| HP ZBook Studio 16 G11 | |
| HP ZBook X G1i 16 | |
| HP ZBook Power 16 G11 A | |
Cyberpunk 2077 ultra FPS Grafik
| min. | mittel | hoch | max. | QHD DLSS | QHD | |
|---|---|---|---|---|---|---|
| GTA V (2015) | 186.2 | 183.1 | 177.8 | 112.7 | 88.4 | |
| Dota 2 Reborn (2015) | 170.1 | 158.1 | 151.1 | 141.8 | ||
| Final Fantasy XV Benchmark (2018) | 206 | 129.5 | 100.2 | 71 | ||
| X-Plane 11.11 (2018) | 102 | 92.2 | 80.6 | |||
| Strange Brigade (2018) | 480 | 252 | 198.7 | 171.3 | 119.2 | |
| Baldur's Gate 3 (2023) | 116.1 | 99.7 | 89.6 | 89.5 | 90 | 60.4 |
| Cyberpunk 2077 (2023) | 112.5 | 93.5 | 80 | 72.1 | 52.4 | 43.6 |
| F1 24 (2024) | 214 | 205 | 161.4 | 48.2 | 48.8 | 32.2 |
Emissionen
Geräuschentwicklung
Die Lüfter sind lethargisch, wenn sie anspruchslose Lasten laufen lassen, aber sie können mit knapp über 50 dB(A) ziemlich laut werden, wenn anspruchsvollere Lasten wie Cyberpunk 2077 für längere Zeit laufen.
Lautstärkediagramm
| Idle |
| 23.7 / 23.7 / 23.7 dB(A) |
| Last |
| 32.7 / 48 dB(A) |
 | ||
30 dB leise 40 dB(A) deutlich hörbar 50 dB(A) störend |
||
min: | ||
| HP ZBook X G1i 16 RTX PRO 2000 Blackwell Generation Laptop, Ultra 7 265H, Samsung PM9A1 MZVL22T0HBLB | HP ZBook Power 16 G11 A RTX 2000 Ada Generation Laptop, R7 8845HS, Samsung PM9A1 MZVL22T0HBLB | HP ZBook Studio 16 G11 RTX 3000 Ada Generation Laptop, Ultra 9 185H, Kioxia XG8 KXG80ZNV1T02 | Lenovo ThinkPad P16 Gen 2 RTX 4000 Ada Generation Laptop, i7-14700HX, SK hynix PC801 HFS001TEJ9X162N | Dell Pro Max 16 Plus RTX PRO 5000 Blackwell Generation Laptop, Ultra 9 285HX, SK hynix PCB01 HFS001TFM9X186N | Dell Precision 5690 RTX 5000 Ada Generation Laptop, Ultra 9 185H, 2x Samsung PM9A1 1TB (RAID 0) | |
|---|---|---|---|---|---|---|
| Geräuschentwicklung | 6% | -4% | -16% | -18% | -11% | |
| aus / Umgebung * (dB) | 23.7 | 23.5 1% | 23.8 -0% | 23.9 -1% | 23.2 2% | 23.4 1% |
| Idle min * (dB) | 23.7 | 23.8 -0% | 23.8 -0% | 29.1 -23% | 26.7 -13% | 23.6 -0% |
| Idle avg * (dB) | 23.7 | 24.2 -2% | 26.4 -11% | 29.1 -23% | 30.5 -29% | 24.9 -5% |
| Idle max * (dB) | 23.7 | 24.2 -2% | 26.4 -11% | 29.1 -23% | 34 -43% | 30.9 -30% |
| Last avg * (dB) | 32.7 | 25.4 22% | 33.7 -3% | 41 -25% | 39.8 -22% | 40.4 -24% |
| Cyberpunk 2077 ultra * (dB) | 50.9 | 43 16% | 46.1 9% | 52.8 -4% | 54.3 -7% | |
| Last max * (dB) | 48 | 45 6% | 53.2 -11% | 52.9 -10% | 54.3 -13% | 51.9 -8% |
| Witcher 3 ultra * (dB) | 48.3 |
* ... kleinere Werte sind besser
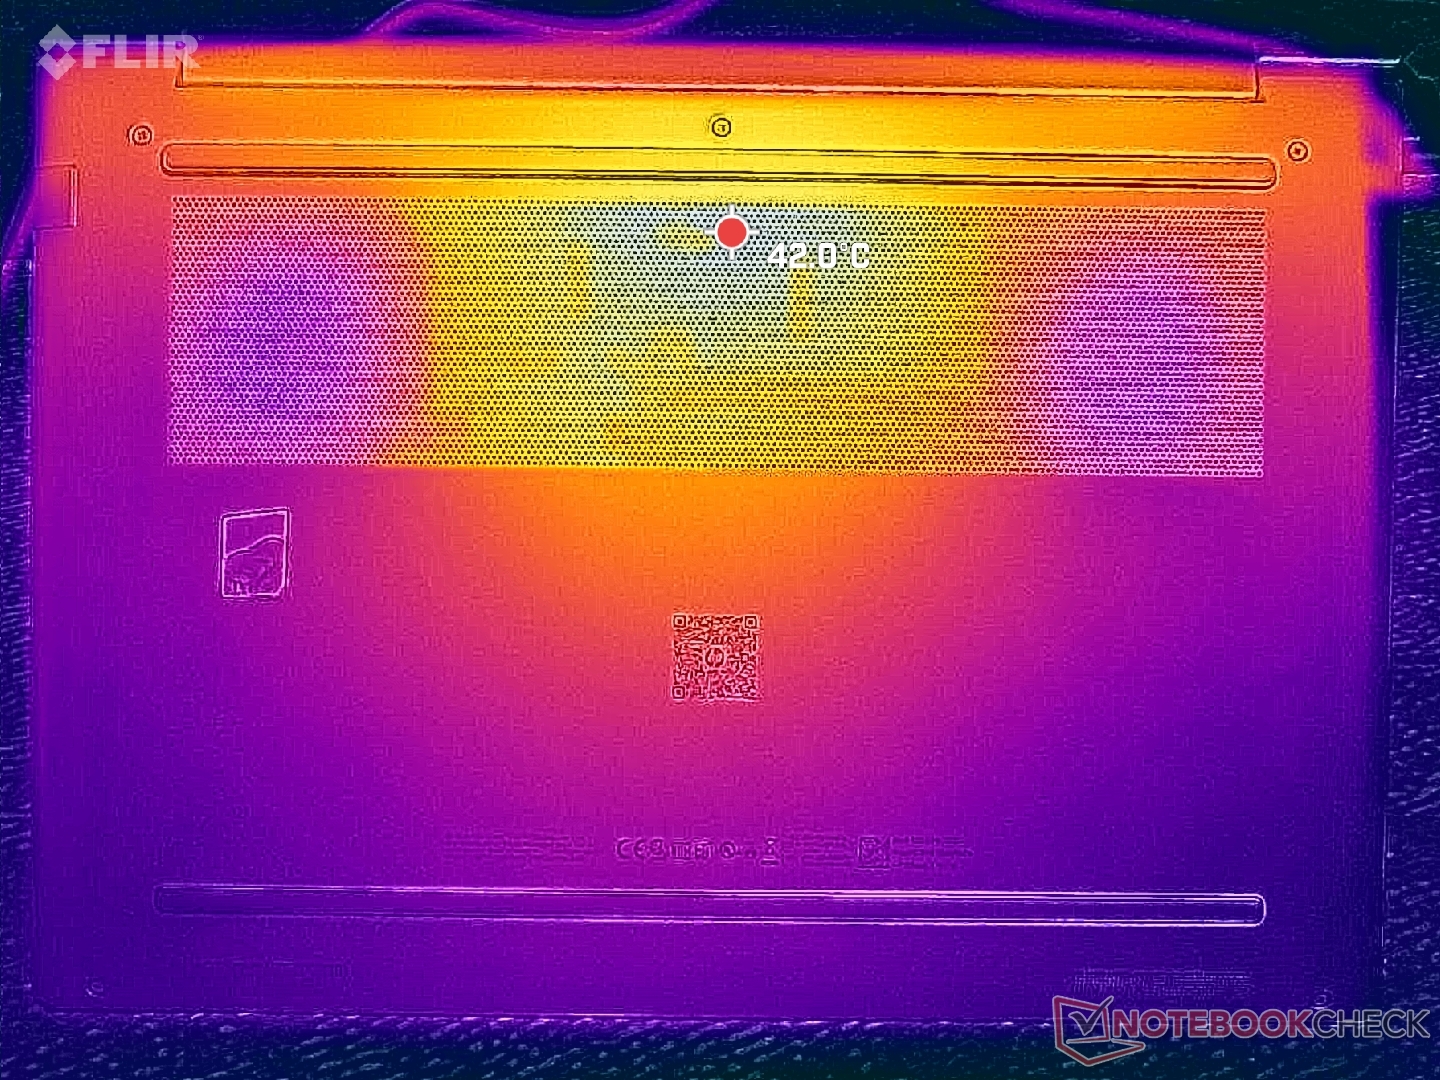
Temperatur
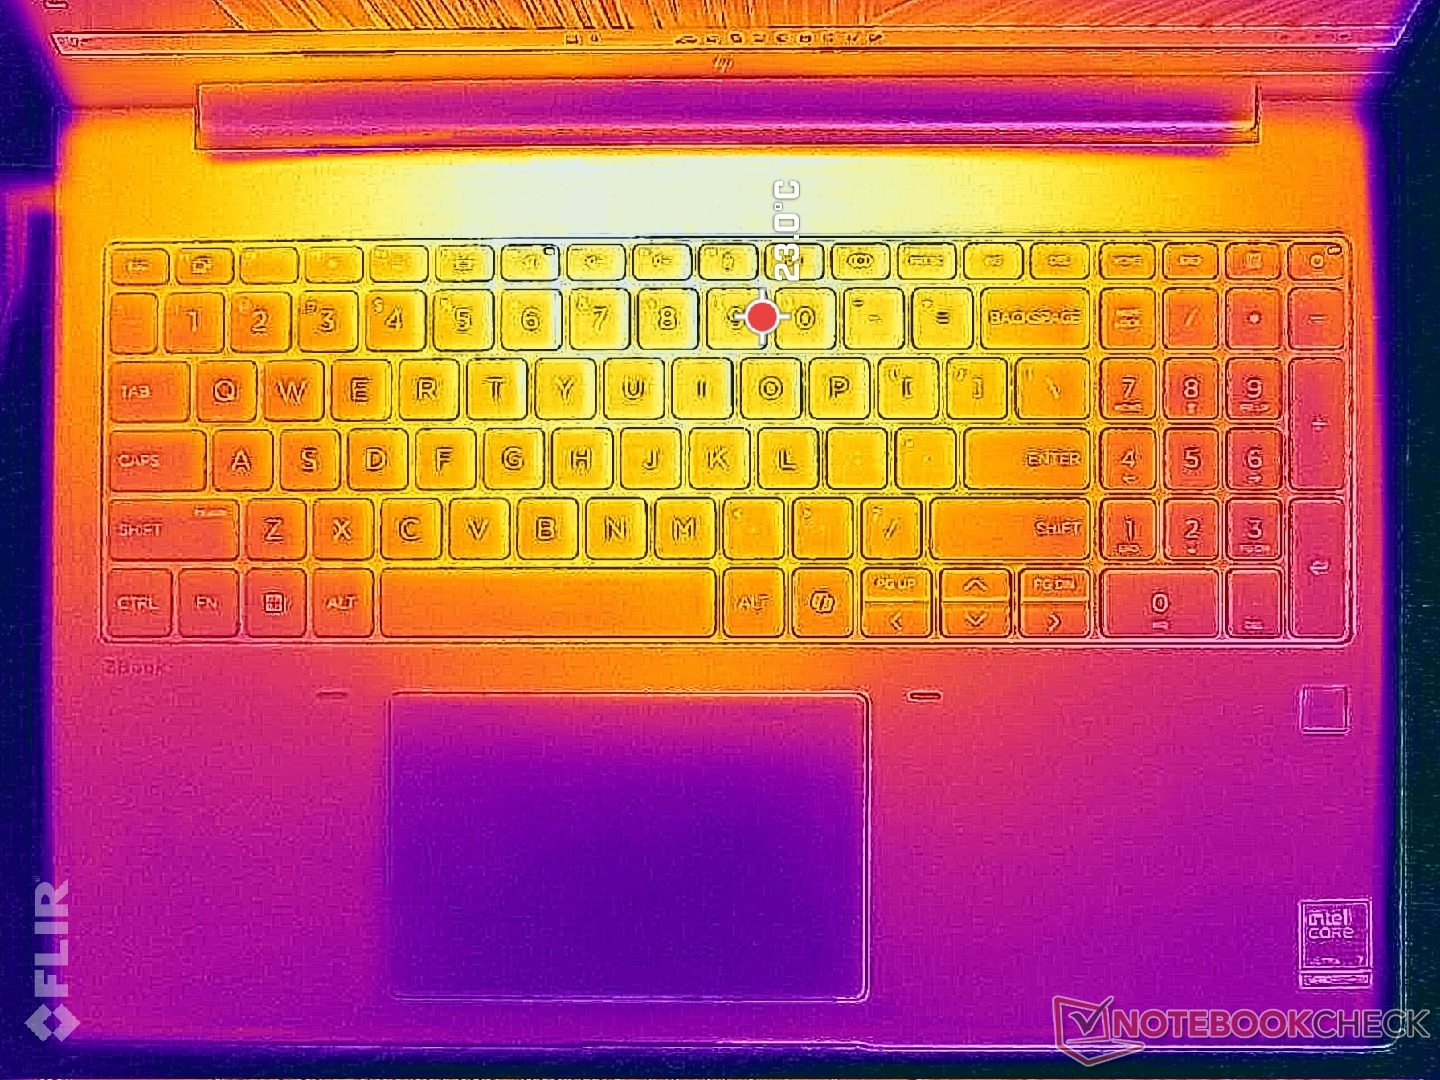
Die Oberflächentemperatur ist in der Mitte am wärmsten, wo sie bei anspruchsvoller Last über 36 °C erreichen kann, was deutlich kühler ist als das, was wir beim ThinkPad P16 Gen 2 oder Dell Precision 5690 gemessen haben.
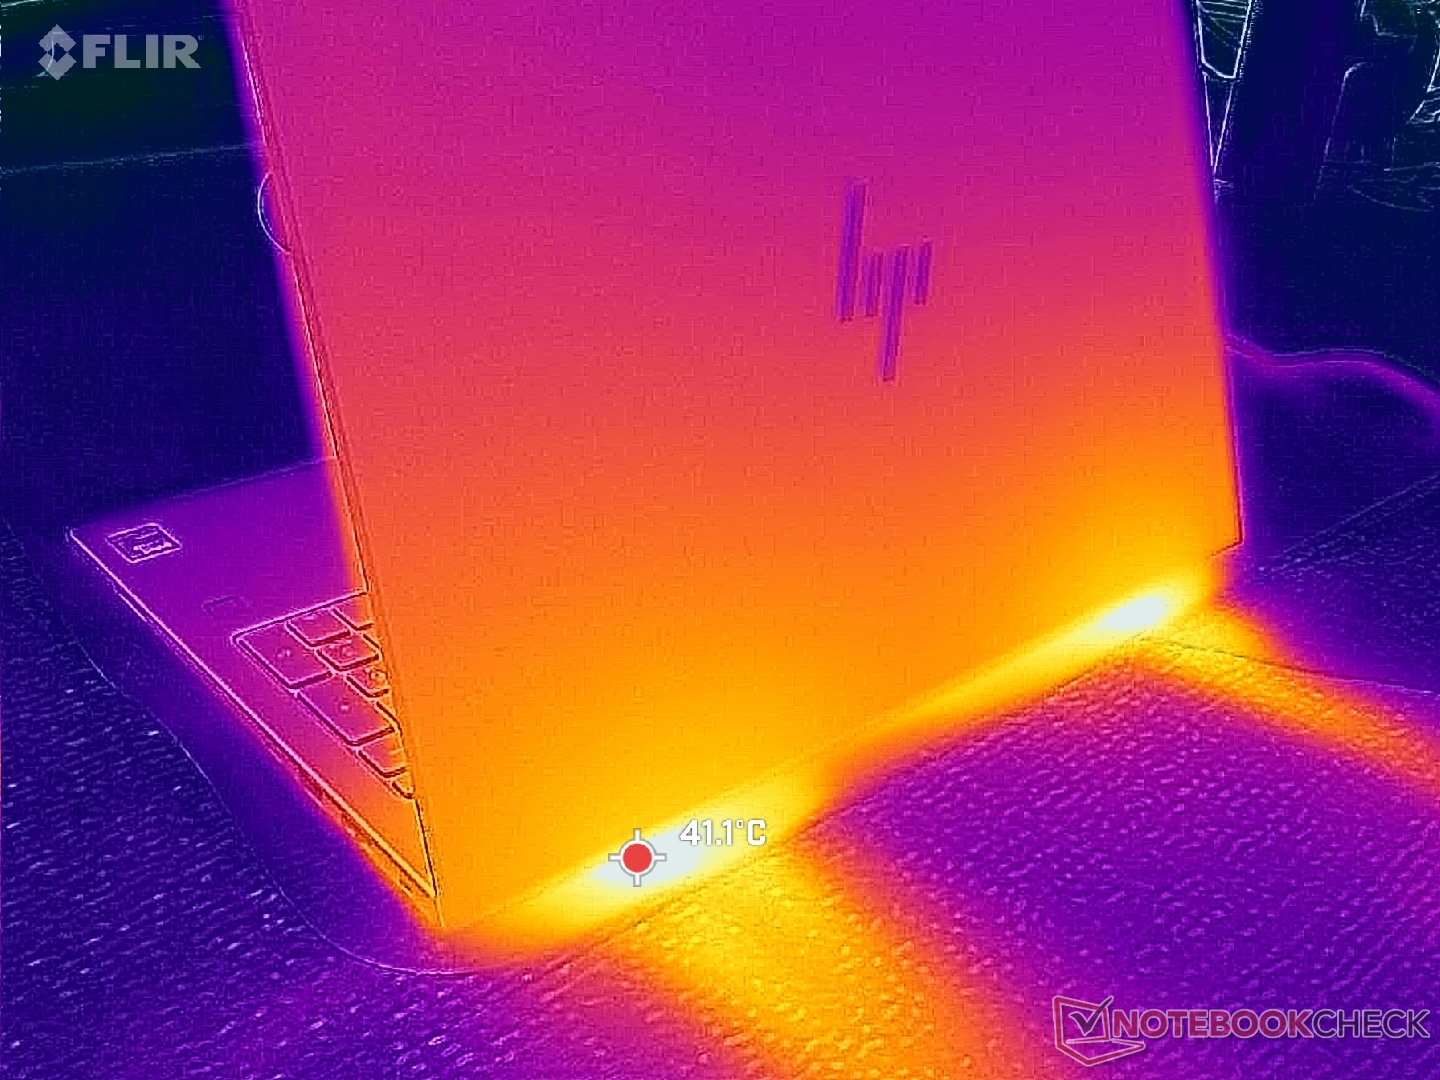
(+) Die maximale Temperatur auf der Oberseite ist 36 °C. Im Vergleich liegt der Klassendurchschnitt bei 38.2 °C (von 22.2 bis 69.8 °C für die Klasse Workstation).
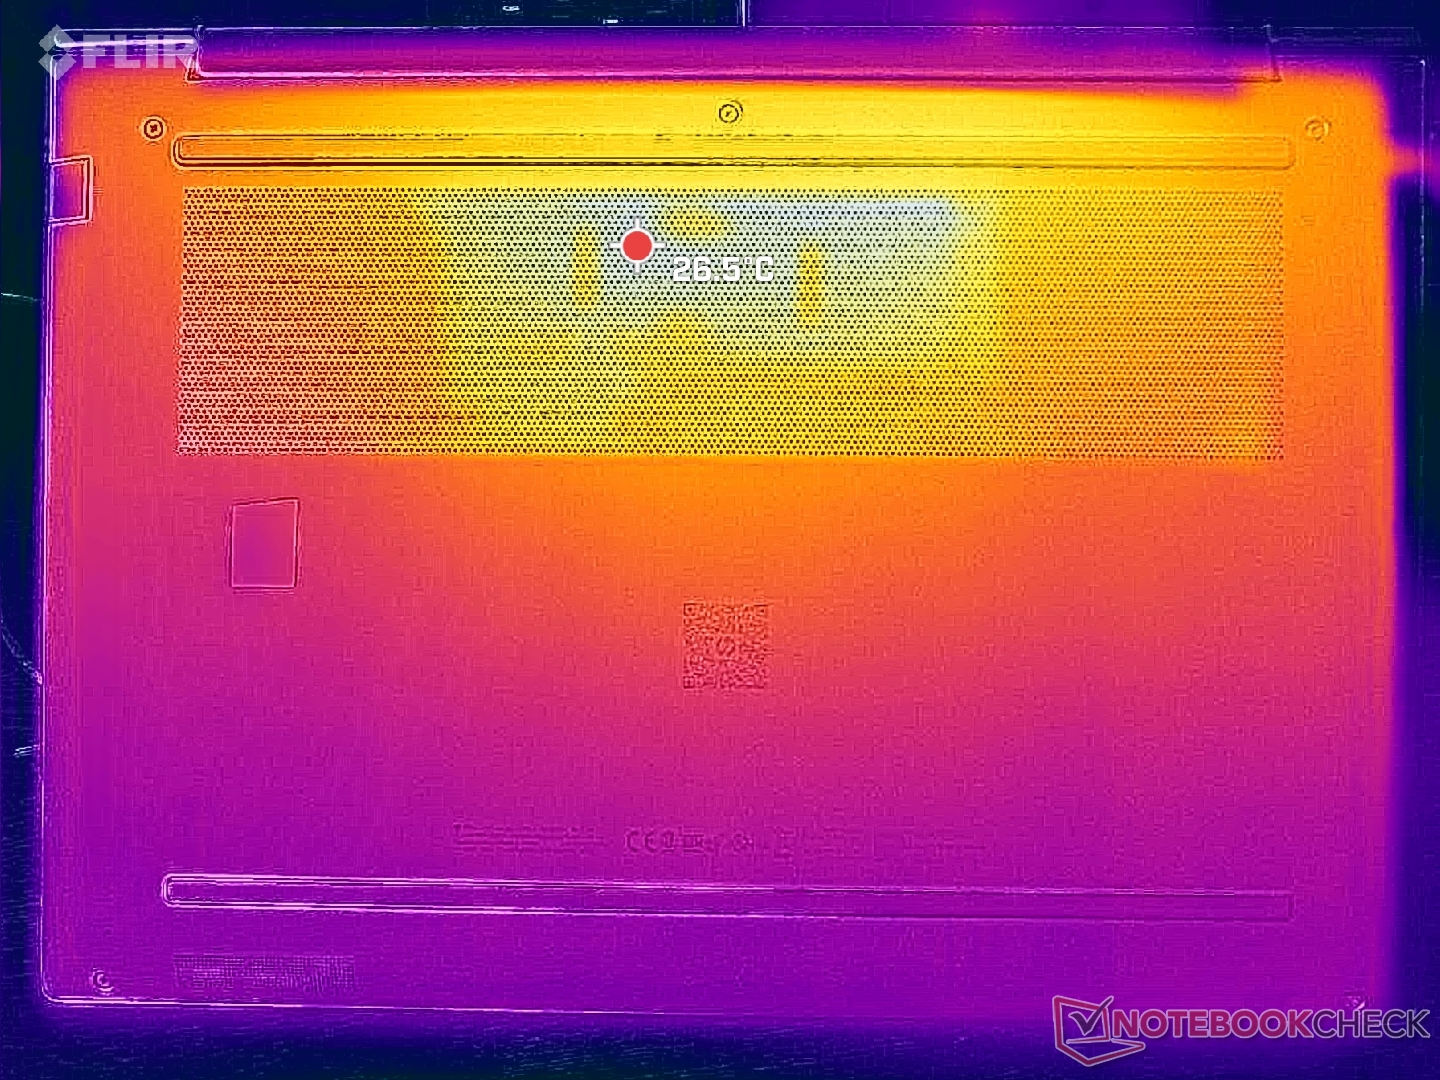
(+) Auf der Unterseite messen wir eine maximalen Wert von 39.4 °C (im Vergleich zum Durchschnitt von 41.1 °C).
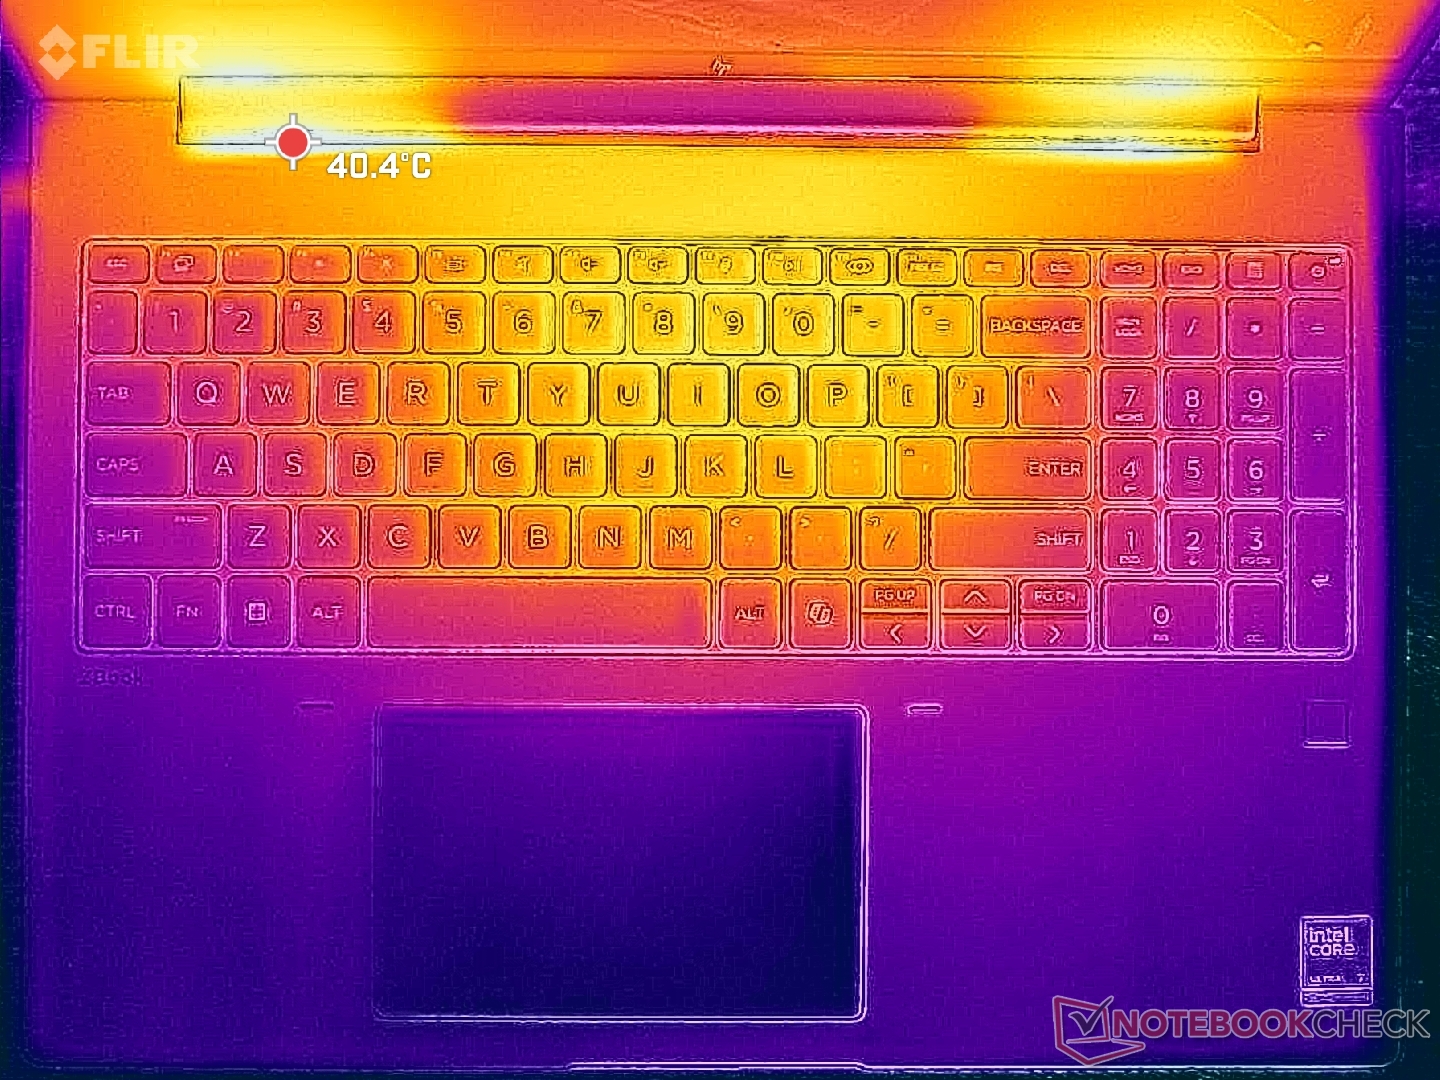
(+) Ohne Last messen wir eine durchschnittliche Temperatur von 26.9 °C auf der Oberseite. Der Klassendurchschnitt erreicht 32 °C.
(+) Die Handballen und der Touchpad-Bereich sind mit gemessenen 24.2 °C kühler als die typische Hauttemperatur und fühlen sich dadurch kühl an.
(+) Die durchschnittliche Handballen-Temperatur anderer getesteter Geräte war 27.8 °C (+3.6 °C).
| HP ZBook X G1i 16 Intel Core Ultra 7 265H, NVIDIA RTX PRO 2000 Blackwell Generation Laptop | HP ZBook Power 16 G11 A AMD Ryzen 7 8845HS, NVIDIA RTX 2000 Ada Generation Laptop | HP ZBook Studio 16 G11 Intel Core Ultra 9 185H, NVIDIA RTX 3000 Ada Generation Laptop | Lenovo ThinkPad P16 Gen 2 Intel Core i7-14700HX, NVIDIA RTX 4000 Ada Generation Laptop | Dell Pro Max 16 Plus Intel Core Ultra 9 285HX, NVIDIA RTX PRO 5000 Blackwell Generation Laptop | Dell Precision 5690 Intel Core Ultra 9 185H, NVIDIA RTX 5000 Ada Generation Laptop | |
|---|---|---|---|---|---|---|
| Hitze | 4% | -10% | -5% | -10% | -3% | |
| Last oben max * (°C) | 36 | 40.6 -13% | 36.6 -2% | 46.6 -29% | 40.4 -12% | 46.6 -29% |
| Last unten max * (°C) | 39.4 | 40.6 -3% | 47.8 -21% | 51 -29% | 45.6 -16% | 33 16% |
| Idle oben max * (°C) | 30.4 | 26 14% | 31.4 -3% | 24.8 18% | 32.8 -8% | 32.4 -7% |
| Idle unten max * (°C) | 31.8 | 26.6 16% | 35.6 -12% | 25.6 19% | 33 -4% | 29.4 8% |
* ... kleinere Werte sind besser
Stresstest
Die CPU stieg bei Start des Prime95-Stresstests auf 3,6 GHz, 108 W und knackige 104 °C, bevor sie kurz darauf auf 3,0 GHz, 62 W und 88 °C zurückfiel und sich dort stabilisierte, was die begrenzte maximale Nachhaltigkeit des Turbo Boost verdeutlicht. Interessanterweise schwankten die CPU-Taktraten, während die GPU-Taktraten konstant blieben, wenn Prime95 und FurMark gleichzeitig ausgeführt wurden.
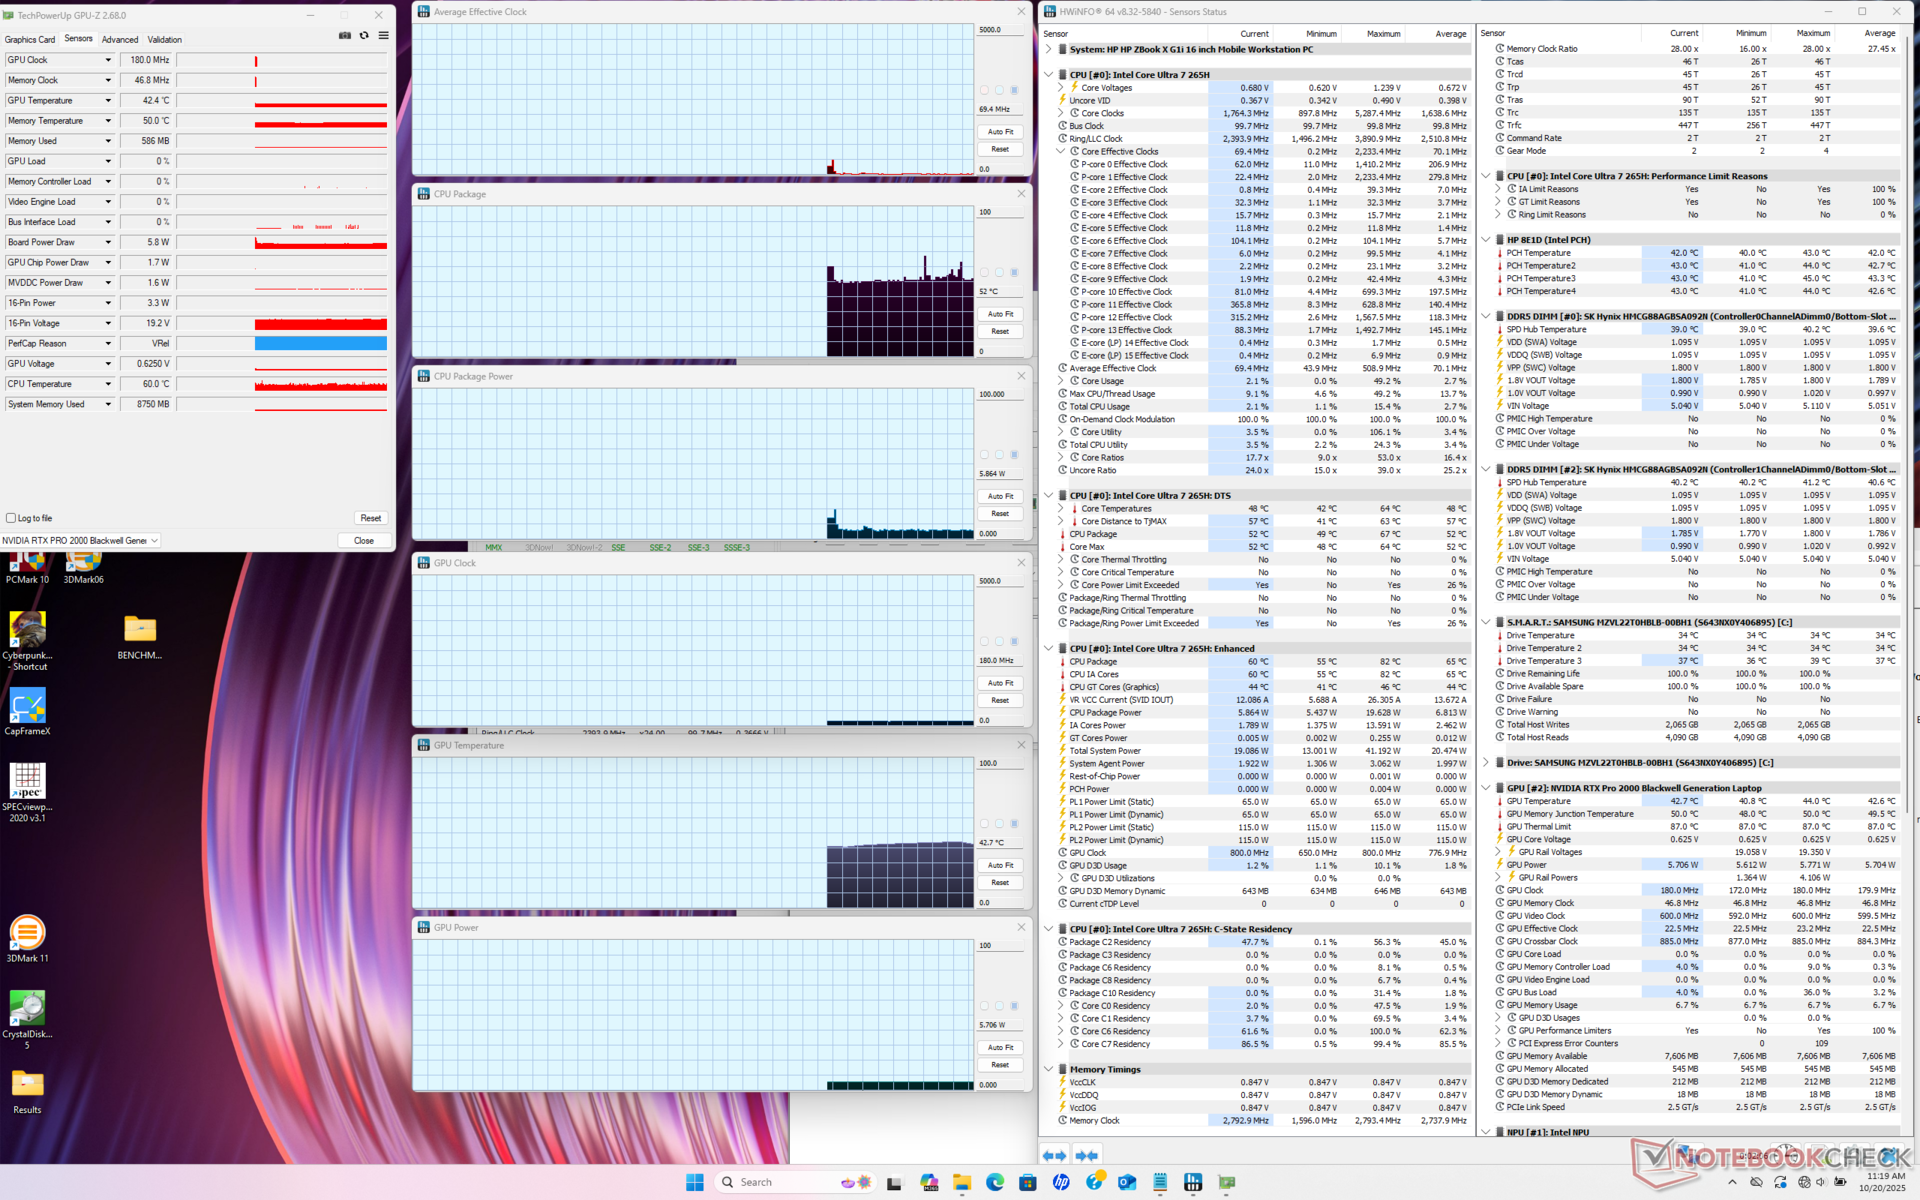
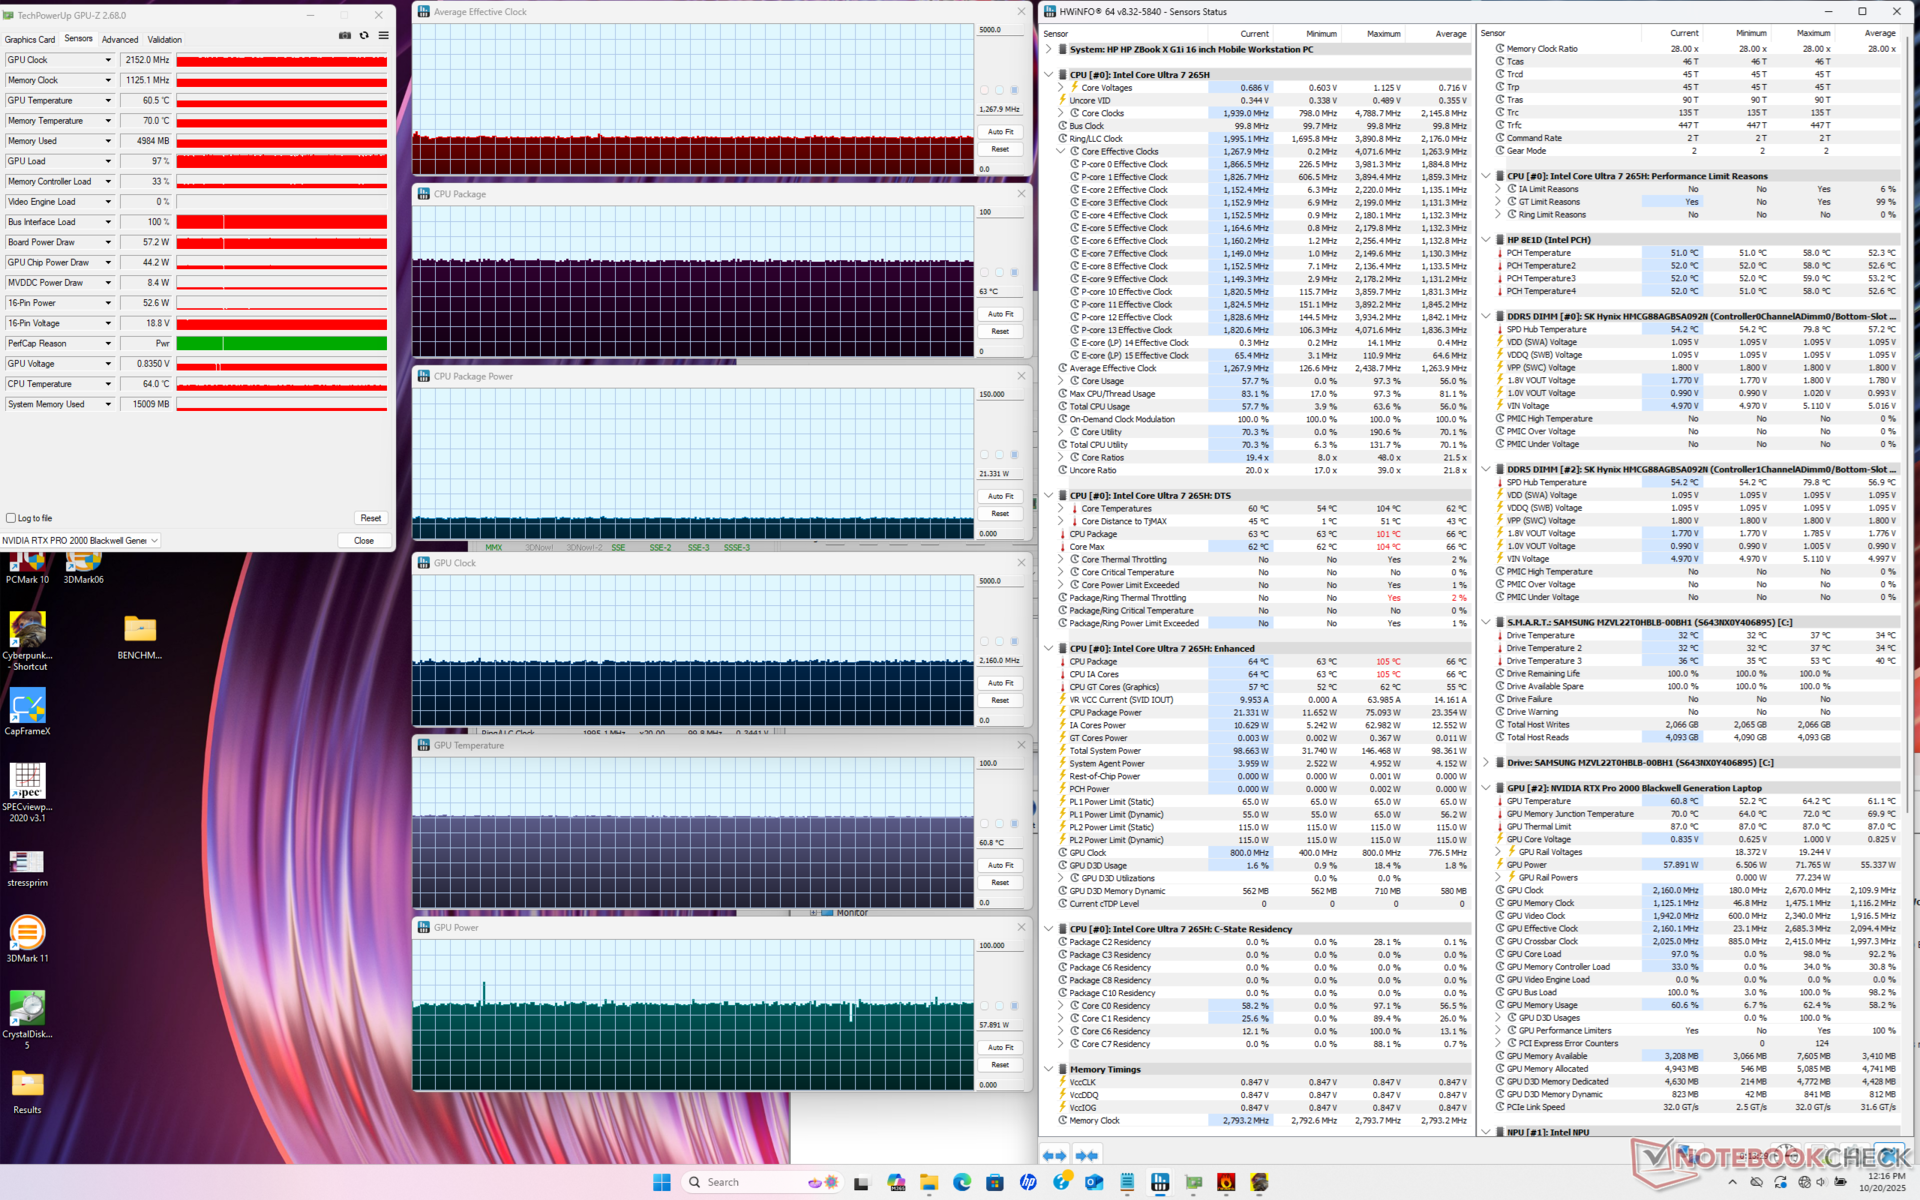
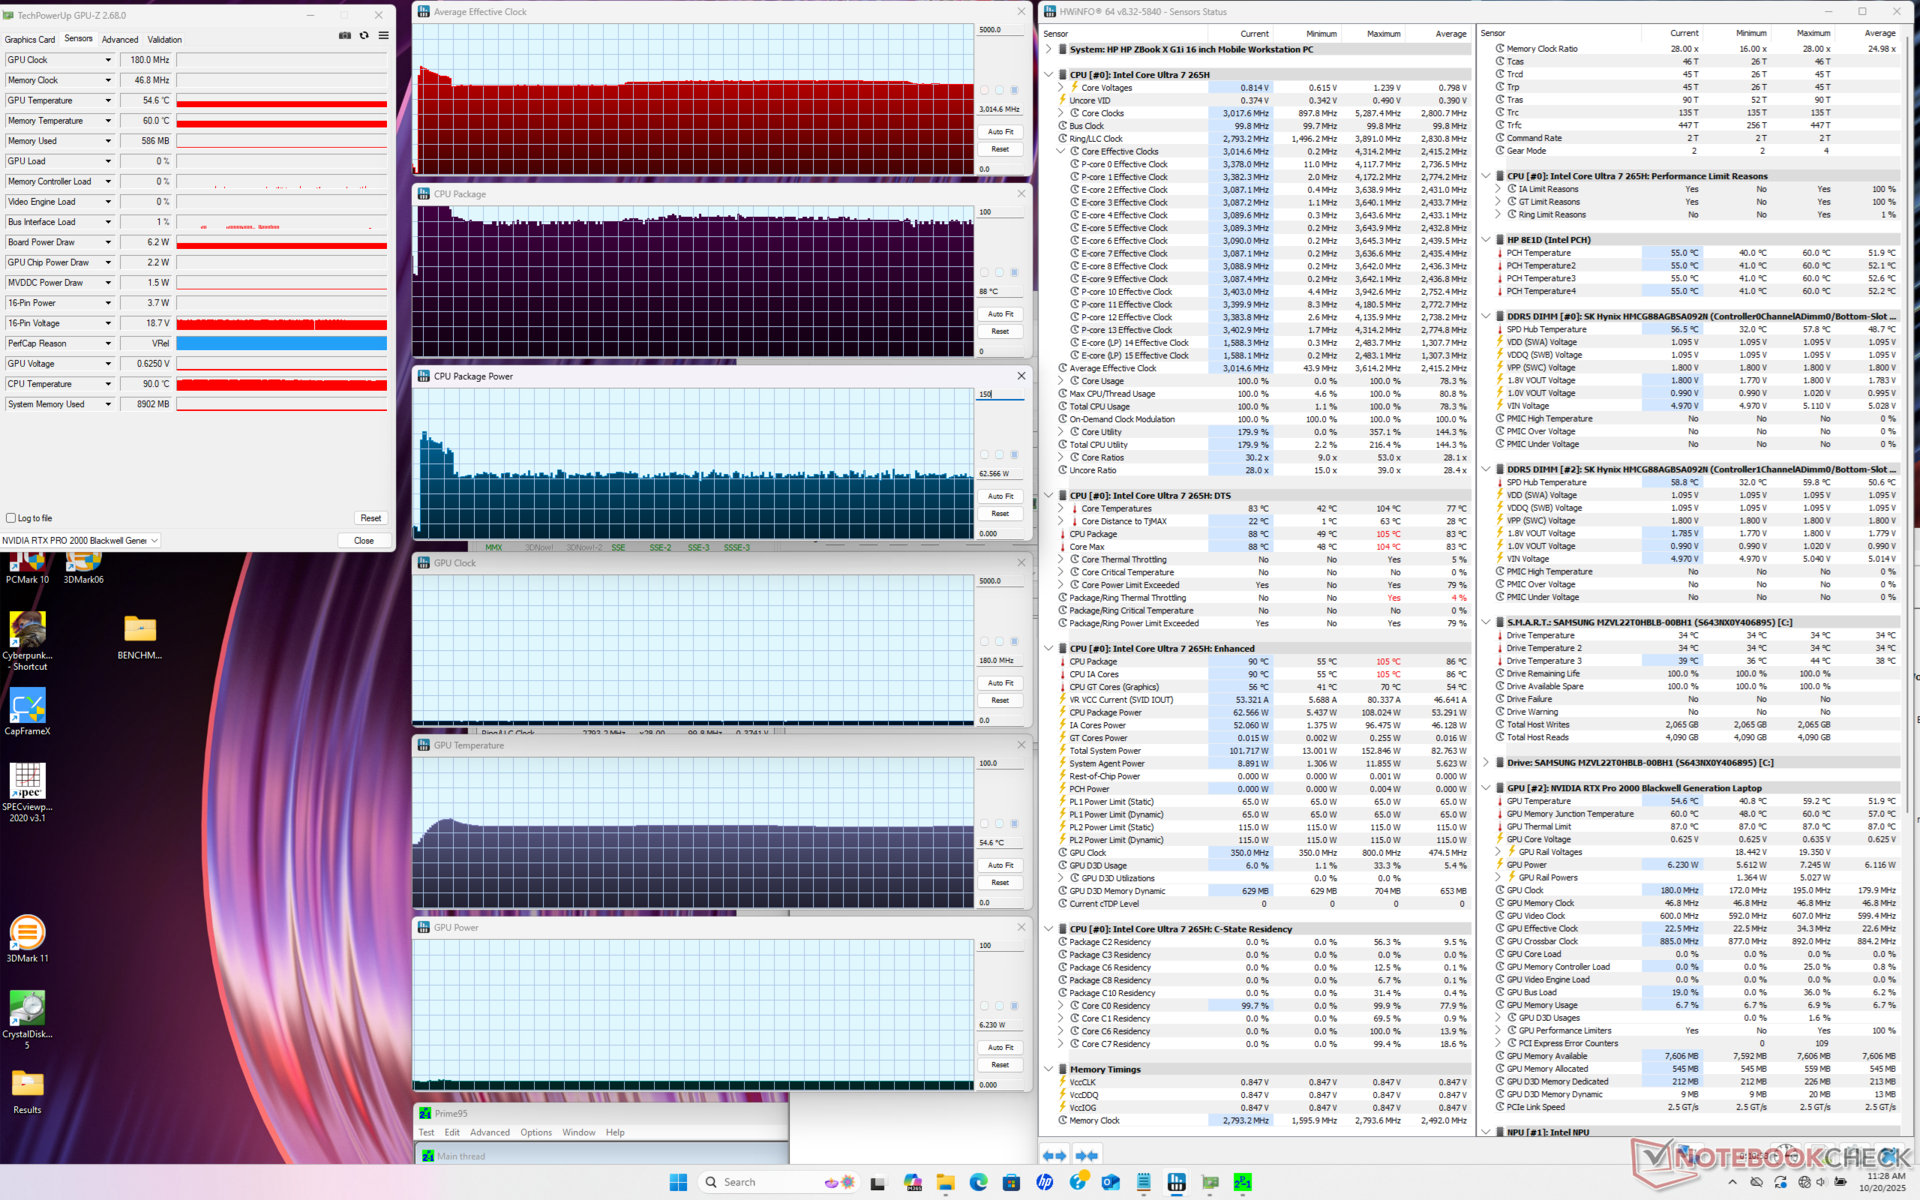

| Durchschnittlicher CPU-Takt (GHz) | GPU-Takt (MHz) | Durchschnittliche CPU-Temperatur (°C) | Durchschnittliche GPU-Temperatur (°C) | |
| System Leerlauf | -- | -- | 52 | 43 |
| Prime95 Stress | 3.0 | -- | 88 | 55 |
| Prime95 + FurMark Stress | 2.5 - 2.9 | 1215 | 83 - 91 | 65 |
| Cyberpunk 2077 Stress | 1.3 | 2160 | 63 | 61 |
Lautsprecher
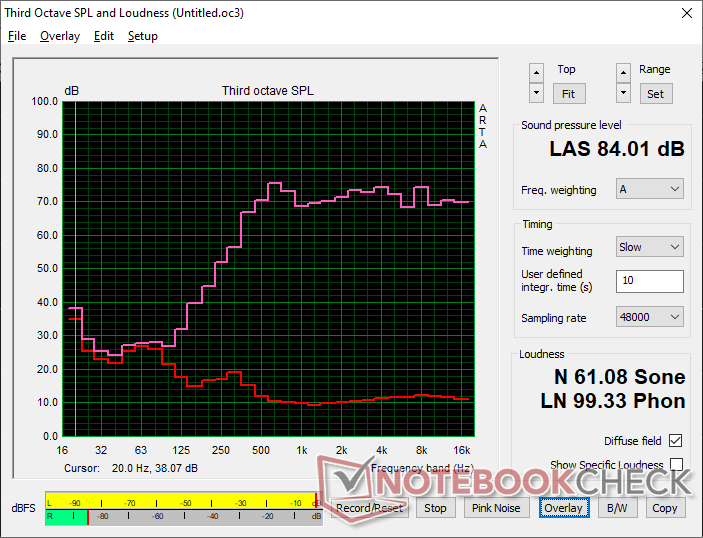
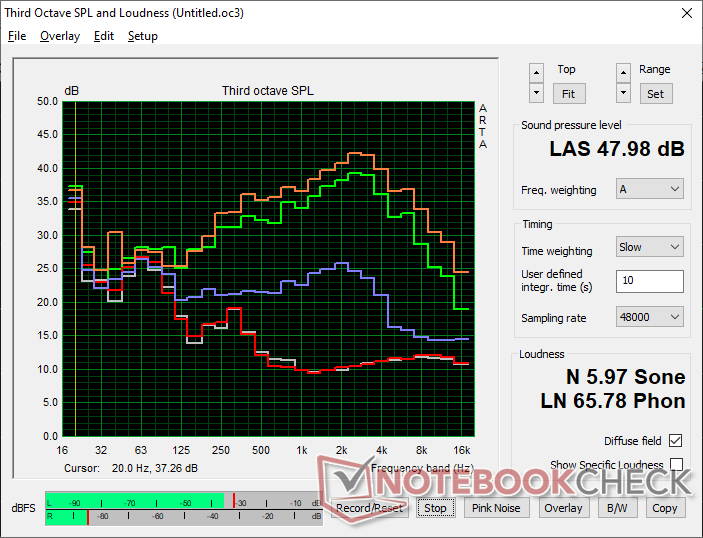
HP ZBook X G1i 16 Audio Analyse
(+) | Die Lautsprecher können relativ laut spielen (84 dB)
Bass 100 - 315 Hz
(-) | kaum Bass - 28% niedriger als der Median
(±) | durchschnittlich lineare Bass-Wiedergabe (8.8% Delta zum Vorgänger)
Mitteltöne 400 - 2000 Hz
(+) | ausgeglichene Mitten, vom Median nur 1.9% abweichend
(+) | lineare Mitten (6.1% Delta zum Vorgänger)
Hochtöne 2 - 16 kHz
(+) | ausgeglichene Hochtöne, vom Median nur 2.9% abweichend
(+) | sehr lineare Hochtöne (5.1% Delta zum Vorgänger)
Gesamt im hörbaren Bereich 100 - 16.000 Hz
(±) | hörbarer Bereich ist durchschnittlich linear (15.6% Abstand zum Median)
Im Vergleich zu allen Geräten derselben Klasse
» 35% aller getesteten Geräte dieser Klasse waren besser, 11% vergleichbar, 54% schlechter
» Das beste Gerät hat einen Delta-Wert von 7%, durchschnittlich ist 17%, das schlechteste Gerät hat 35%
Im Vergleich zu allen Geräten im Test
» 23% aller getesteten Geräte waren besser, 5% vergleichbar, 72% schlechter
» Das beste Gerät hat einen Delta-Wert von 4%, durchschnittlich ist 24%, das schlechteste Gerät hat 134%
Apple MacBook Pro 16 2021 M1 Pro Audio Analyse
(+) | Die Lautsprecher können relativ laut spielen (84.7 dB)
Bass 100 - 315 Hz
(+) | guter Bass - nur 3.8% Abweichung vom Median
(+) | lineare Bass-Wiedergabe (5.2% Delta zum Vorgänger)
Mitteltöne 400 - 2000 Hz
(+) | ausgeglichene Mitten, vom Median nur 1.3% abweichend
(+) | lineare Mitten (2.1% Delta zum Vorgänger)
Hochtöne 2 - 16 kHz
(+) | ausgeglichene Hochtöne, vom Median nur 1.9% abweichend
(+) | sehr lineare Hochtöne (2.7% Delta zum Vorgänger)
Gesamt im hörbaren Bereich 100 - 16.000 Hz
(+) | hörbarer Bereich ist sehr linear (4.6% Abstand zum Median
Im Vergleich zu allen Geräten derselben Klasse
» 0% aller getesteten Geräte dieser Klasse waren besser, 0% vergleichbar, 100% schlechter
» Das beste Gerät hat einen Delta-Wert von 5%, durchschnittlich ist 17%, das schlechteste Gerät hat 45%
Im Vergleich zu allen Geräten im Test
» 0% aller getesteten Geräte waren besser, 0% vergleichbar, 100% schlechter
» Das beste Gerät hat einen Delta-Wert von 4%, durchschnittlich ist 24%, das schlechteste Gerät hat 134%
Energieverwaltung
Stromverbrauch
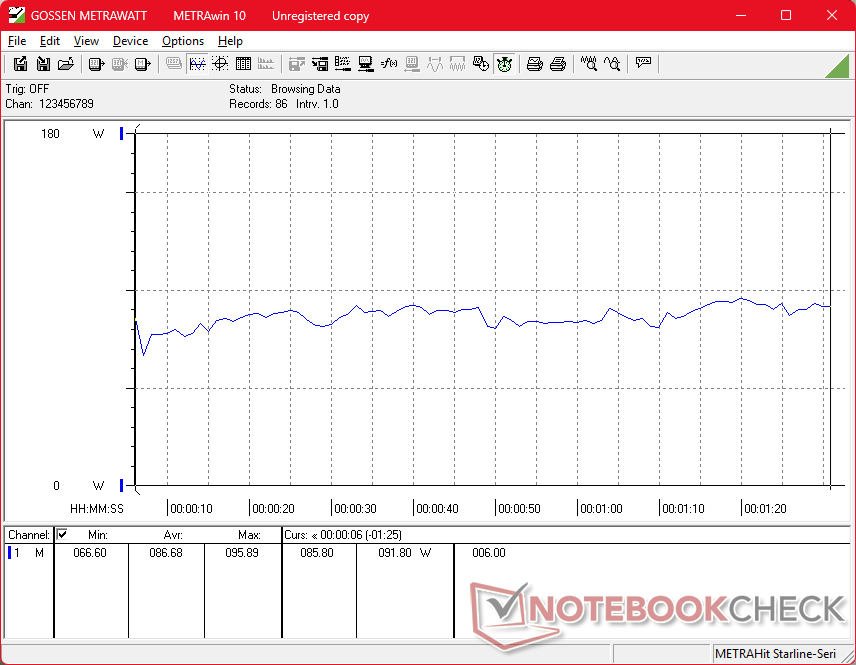
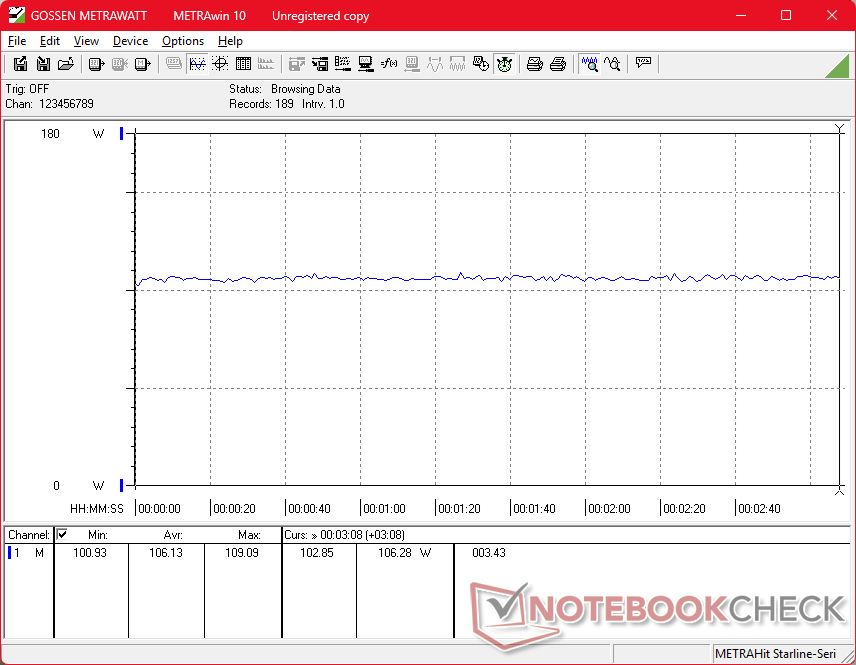
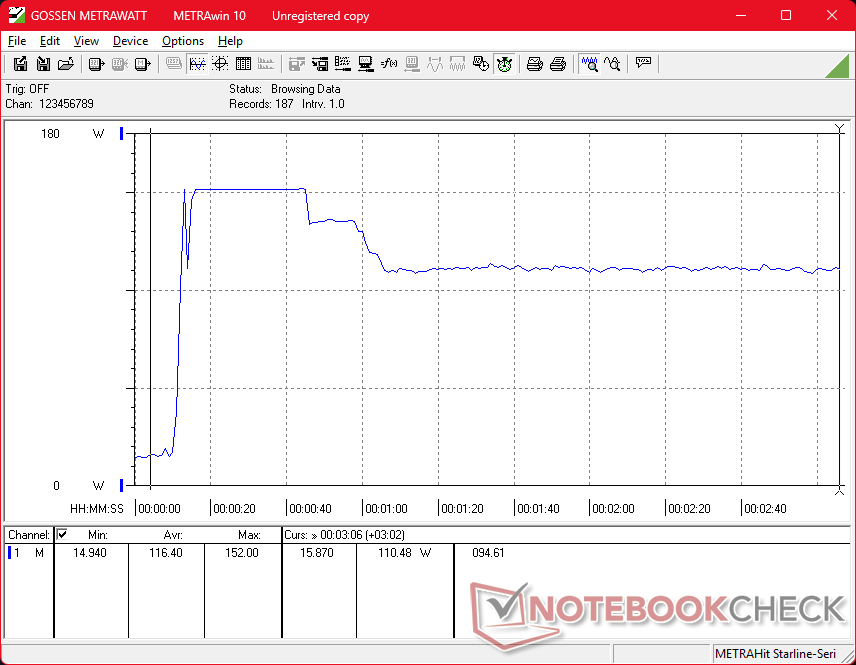
Der Verbrauch unter Last ist im Durchschnitt etwas höher als beim älteren AMD-betriebenen ZBook Power 16 G11 A. Allerdings ist unser ZBook X G1i 16 auch das schnellere und schlankere Gerät und so bleibt die hohe Leistung pro Watt erhalten.
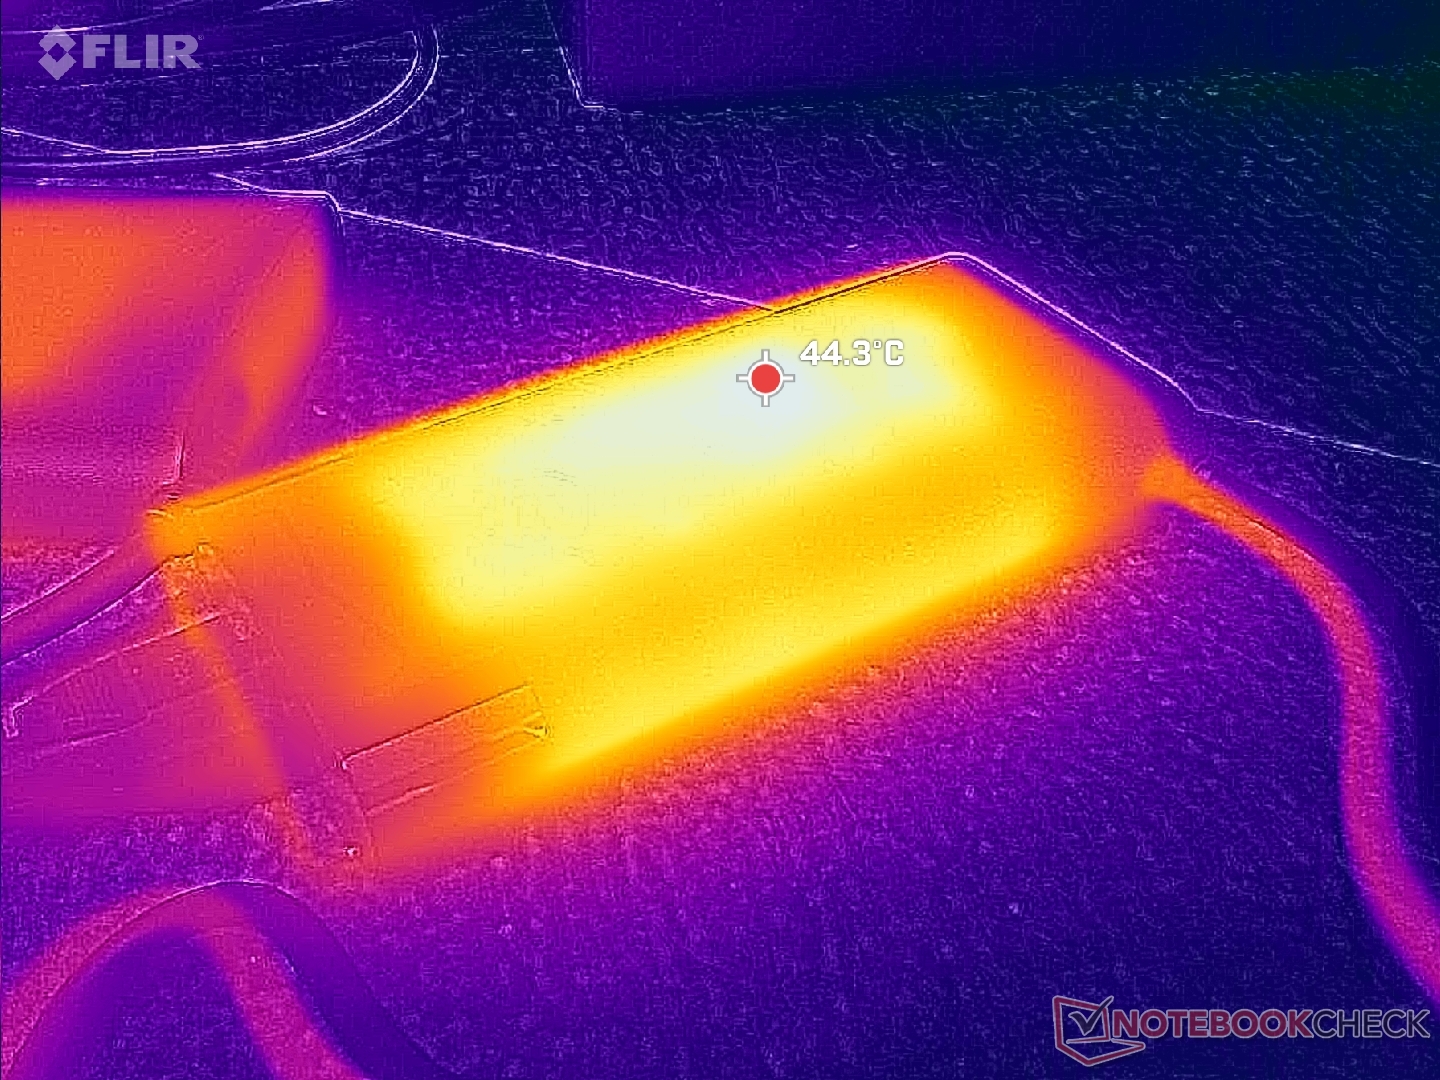
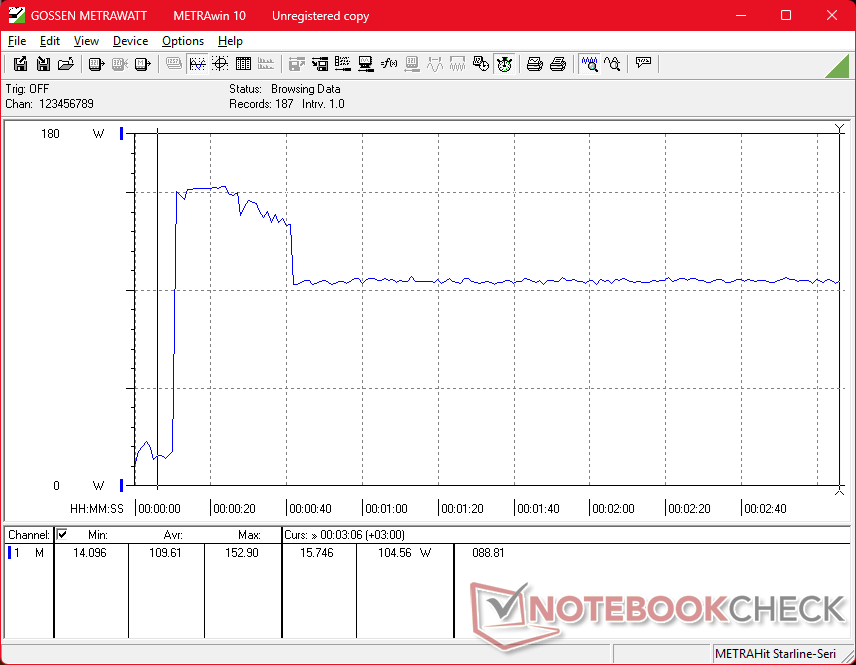
Mit dem kleinen (~13,8 x 6,5 x 2,2 cm) 150-Watt-Netzteil konnten wir eine vorübergehende maximale Leistungsaufnahme von 153 W messen, wenn CPU und GPU voll ausgelastet sind.
| Aus / Standby | |
| Idle | |
| Last |
|
Legende:
min: | |
| HP ZBook X G1i 16 Ultra 7 265H, RTX PRO 2000 Blackwell Generation Laptop, Samsung PM9A1 MZVL22T0HBLB, IPS, 2560x1600, 16" | HP ZBook Power 16 G11 A R7 8845HS, RTX 2000 Ada Generation Laptop, Samsung PM9A1 MZVL22T0HBLB, IPS, 2560x1600, 16" | HP ZBook Studio 16 G11 Ultra 9 185H, RTX 3000 Ada Generation Laptop, Kioxia XG8 KXG80ZNV1T02, IPS, 3840x2400, 16" | Lenovo ThinkPad P16 Gen 2 i7-14700HX, RTX 4000 Ada Generation Laptop, SK hynix PC801 HFS001TEJ9X162N, IPS, 2560x1600, 16" | Dell Pro Max 16 Plus Ultra 9 285HX, RTX PRO 5000 Blackwell Generation Laptop, SK hynix PCB01 HFS001TFM9X186N, OLED, 3840x2400, 16" | Dell Precision 5690 Ultra 9 185H, RTX 5000 Ada Generation Laptop, 2x Samsung PM9A1 1TB (RAID 0), OLED, 3840x2400, 16" | |
|---|---|---|---|---|---|---|
| Stromverbrauch | 2% | -85% | -90% | -279% | -72% | |
| Idle min * (Watt) | 4.1 | 4.6 -12% | 14 -241% | 7.9 -93% | 35.1 -756% | 7.9 -93% |
| Idle avg * (Watt) | 9 | 10 -11% | 22.4 -149% | 13.1 -46% | 39.2 -336% | 12 -33% |
| Idle max * (Watt) | 9.4 | 10.6 -13% | 25.7 -173% | 24.2 -157% | 56 -496% | 28.6 -204% |
| Last avg * (Watt) | 86.7 | 60.9 30% | 90.2 -4% | 127.4 -47% | 130.2 -50% | 98.8 -14% |
| Cyberpunk 2077 ultra external monitor * (Watt) | 102 | 92.8 9% | 120.3 -18% | 219 -115% | 213 -109% | |
| Cyberpunk 2077 ultra * (Watt) | 106.1 | 96.8 9% | 125.4 -18% | 225 -112% | 229 -116% | |
| Last max * (Watt) | 152.9 | 154.8 -1% | 142 7% | 248.5 -63% | 285.2 -87% | 174.8 -14% |
| Witcher 3 ultra * (Watt) | 144.5 |
* ... kleinere Werte sind besser
Stromverbrauch Cyberpunk / Stress Test
Stromverbrauch externer Monitor
Akkulaufzeit
Die WLAN-Laufzeit ist mit 12,5 Stunden hervorragend und übertrifft damit das Precision 5690 der letzten Generation oder das ZBook Power 16 G11 A jeweils um einige Stunden.
| HP ZBook X G1i 16 Ultra 7 265H, RTX PRO 2000 Blackwell Generation Laptop, 83 Wh | HP ZBook Power 16 G11 A R7 8845HS, RTX 2000 Ada Generation Laptop, 83 Wh | HP ZBook Studio 16 G11 Ultra 9 185H, RTX 3000 Ada Generation Laptop, 86 Wh | Lenovo ThinkPad P16 Gen 2 i7-14700HX, RTX 4000 Ada Generation Laptop, 94 Wh | Dell Pro Max 16 Plus Ultra 9 285HX, RTX PRO 5000 Blackwell Generation Laptop, 96 Wh | Dell Precision 5690 Ultra 9 185H, RTX 5000 Ada Generation Laptop, 98 Wh | |
|---|---|---|---|---|---|---|
| Akkulaufzeit | -22% | -62% | -80% | -71% | -26% | |
| WLAN (h) | 12.5 | 9.7 -22% | 4.8 -62% | 2.5 -80% | 3.6 -71% | 9.2 -26% |
| Idle (h) | 26.1 | |||||
| Last (h) | 1.7 |
Notebookcheck Bewertung
Hochwertige und schlanke mobile Workstation mit mittlerer Leistung.
HP ZBook X G1i 16
- 22.10.2025 v8
Allen Ngo
 Total Sustainability Score:
 Potenzielle Wettbewerber im Vergleich
Bild | Modell / Test | Preis ab | Gewicht | Dicke | Display |
|---|---|---|---|---|---|
1. 87.4%  | HP ZBook X G1i 16 Intel Core Ultra 7 265H ⎘ NVIDIA RTX PRO 2000 Blackwell Generation Laptop ⎘ 64 GB RAM, 2048 GB SSD | Amazon: 4.836,05 € Bestpreis 3862.56€ ITboost.de 2. 3868€ CNW IT-Systeme 3. 4073.57€ electronis.de | 2.2 kg | 23 mm | 16.00" 2560x1600 189 PPI IPS |
2. 85.4%  | HP ZBook Power 16 G11 A AMD Ryzen 7 8845HS ⎘ NVIDIA RTX 2000 Ada Generation Laptop ⎘ 64 GB RAM, 2048 GB SSD | Amazon: 2.264,63 € Bestpreis 3214.41€ Klarsicht IT 2. 3214.53€ electronis.de 3. 3214.66€ Easynotebooks.de | 2.2 kg | 22.9 mm | 16.00" 2560x1600 189 PPI IPS |
3. 84.2%  | HP ZBook Studio 16 G11 Intel Core Ultra 9 185H ⎘ NVIDIA RTX 3000 Ada Generation Laptop ⎘ 64 GB RAM, 1024 GB SSD | Amazon: 3.081,37 € Geizhals Suche | 1.8 kg | 19 mm | 16.00" 3840x2400 283 PPI IPS |
4. 85.9%  | Lenovo ThinkPad P16 Gen 2 Intel Core i7-14700HX ⎘ NVIDIA RTX 4000 Ada Generation Laptop ⎘ 32 GB RAM, 1024 GB SSD | Amazon: 2.456,03 € Geizhals Suche | 3.1 kg | 30.23 mm | 16.00" 2560x1600 189 PPI IPS |
5. 88.4%  | Dell Pro Max 16 Plus Intel Core Ultra 9 285HX ⎘ NVIDIA RTX PRO 5000 Blackwell Generation Laptop ⎘ 128 GB RAM, SSD | Amazon: 3.743,78 € Bestpreis 3083.71€ Cyberport.de 2. 3083.71€ computeruniverse.net 3. 3109.62€ computeruniverse.at | 2.8 kg | 30.9 mm | 16.00" 3840x2400 283 PPI OLED |
6. 88.3% v7 (old)  | Dell Precision 5690 Intel Core Ultra 9 185H ⎘ NVIDIA RTX 5000 Ada Generation Laptop ⎘ 32 GB RAM, 2048 GB SSD | Amazon: 2.967,99 € Bestpreis 2727.46€ electronis.de 2. 2727.47€ Jacob Elektronik direkt 3. 2727.47€ Easynotebooks.de | 2.3 kg | 22.17 mm | 16.00" 3840x2400 283 PPI OLED |
Transparenz
Die Auswahl der zu testenden Geräte erfolgt innerhalb der Redaktion. Das vorliegende Testmuster wurde dem Autor vom Hersteller oder einem Shop zu Testzwecken leihweise zur Verfügung gestellt. Eine Einflussnahme des Leihstellers auf den Testbericht gab es nicht, der Hersteller erhielt keine Version des Reviews vor der Veröffentlichung. Es bestand keine Verpflichtung zur Publikation. Als eigenständiges, unabhängiges Unternehmen unterliegt Notebookcheck keiner Diktion von Herstellern, Shops und Verlagen.
So testet Notebookcheck
Pro Jahr werden von Notebookcheck hunderte Laptops und Smartphones unabhängig in von uns standardisierten technischen Verfahren getestet, um eine Vergleichbarkeit aller Testergebnisse zu gewährleisten. Seit rund 20 Jahren entwickeln wir diese Testmethoden kontinuierlich weiter und setzen damit Branchenstandards. In unseren Testlaboren kommt ausschließlich hochwertiges Messequipment in die Hände erfahrener Techniker und Redakteure. Die Tests unterliegen einer mehrstufigen Kontrolle. Unsere komplexe Gesamtbewertung basiert auf hunderten fundierten Messergebnissen und Benchmarks, womit Ihnen Objektivität garantiert ist. Weitere Informationen zu unseren Testmethoden gibt es hier.

