Getac S410 Gen 5 Rugged Laptop Test: Raptor Lake-P für zusätzliche Leistung

Das S410 ist in diesem Jahr als Modell der 5. Generation zurück und verfügt über die gleichen physischen Eigenschaften wie die vier vorherigen Versionen. Sein Innenleben wurde aktualisiert und enthält nun Raptor-Lake-P-vPro-Prozessoren, welche die älteren Tiger-Lake-U-Optionen ablösen. Wir empfehlen Ihnen einen Blick auf unsere Testberichte über das S410 G4 und das ursprüngliche 2018 S410, um mehr über das Gehäuse und die Funktionen des S410 G5 zu erfahren, da sich nur sehr wenig geändert hat, um die Kompatibilität mit Teilen und Zubehör zu erhalten. Der vorliegende Test wird sich stattdessen auf die Leistungsunterschiede zwischen dem S410 G5 und seinen Alternativen und Vorgängern konzentrieren.
Weitere Informationen über das S410 G5 und seine lange Liste anpassbarer Funktionen finden Sie auf der offiziellen pdf-Produktseite hier.
Weitere Getac Testberichte:
Mögliche Konkurrenten im Vergleich
Bew. | Datum | Modell | Gewicht | Dicke | Größe | Auflösung | Preis ab |
|---|---|---|---|---|---|---|---|
| 82.9 % v7 (old) | 06 / 2024 | Getac S410 G5 i5-1350P, Iris Xe G7 80EUs | 2.9 kg | 34.9 mm | 14.00" | 1920x1080 | |
| 81.7 % v7 (old) | 06 / 2022 | Getac S410 Gen 4 i7-1185G7, Iris Xe G7 96EUs | 3.2 kg | 34.9 mm | 14.00" | 1920x1080 | |
v (old) | 09 / 2021 | Durabook S14I i7-1165G7, Iris Xe G7 96EUs | 3 kg | 38.1 mm | 14.00" | 1920x1080 | |
| 84.8 % v7 (old) | 01 / 2022 | Dell Latitude 14 5420-D2G5W i5-1135G7, Iris Xe G7 80EUs | 1.5 kg | 20.9 mm | 14.00" | 1920x1080 | |
v (old) | 05 / 2022 | Dell Latitude 7330 Rugged Extreme i7-1185G7, Iris Xe G7 96EUs | 2.7 kg | 36.5 mm | 13.30" | 1920x1080 | |
v (old) | 07 / 2022 | Panasonic Toughbook 40 i7-1185G7, Iris Xe G7 96EUs | 3.9 kg | 53.4 mm | 14.00" | 1920x1080 |
Gehäuse - robustes Gehäuse mit MIL-STD-810H und IP53-Zertifizierung

Anschlussausstattung


SD-Kartenleser
| SD Card Reader | |
| average JPG Copy Test (av. of 3 runs) | |
| Dell Latitude 14 5420-D2G5W (AV Pro SD microSD 128 GB V60) | |
| Dell Latitude 7330 Rugged Extreme (AV Pro V60) | |
| Getac S410 G5 (AV Pro V60) | |
| Panasonic Toughbook 40 (AV Pro V60) | |
| Durabook S14I (Angelbird 128GB AV Pro UHS-II) | |
| maximum AS SSD Seq Read Test (1GB) | |
| Dell Latitude 7330 Rugged Extreme (AV Pro V60) | |
| Dell Latitude 14 5420-D2G5W (AV Pro SD microSD 128 GB V60) | |
| Getac S410 G5 (AV Pro V60) | |
| Panasonic Toughbook 40 (AV Pro V60) | |
| Durabook S14I (Angelbird 128GB AV Pro UHS-II) | |
Kommunikation
Das WLAN wurde vom Intel AX201 auf den AX211 aufgerüstet, um Wi-Fi-6E-Geschwindigkeiten zu unterstützen.
| Networking | |
| iperf3 transmit AX12 | |
| Durabook S14I | |
| Dell Latitude 7330 Rugged Extreme | |
| Getac S410 Gen 4 | |
| Dell Latitude 14 5420-D2G5W | |
| iperf3 receive AX12 | |
| Durabook S14I | |
| Getac S410 Gen 4 | |
| Dell Latitude 7330 Rugged Extreme | |
| Dell Latitude 14 5420-D2G5W | |
| iperf3 transmit AXE11000 | |
| Panasonic Toughbook 40 | |
| Getac S410 G5 | |
| iperf3 receive AXE11000 | |
| Panasonic Toughbook 40 | |
| Getac S410 G5 | |
| iperf3 transmit AXE11000 6GHz | |
| Getac S410 G5 | |
| iperf3 receive AXE11000 6GHz | |
| Getac S410 G5 | |
Webcam
Unser Testgerät wurde mit einer 5-MP-Webcam ausgestattet, die eine enorme Verbesserung gegenüber der 1-MP-Webcam des S410 G4 darstellt. Die Windows-Hello-Gesichtserkennung wird unterstützt.


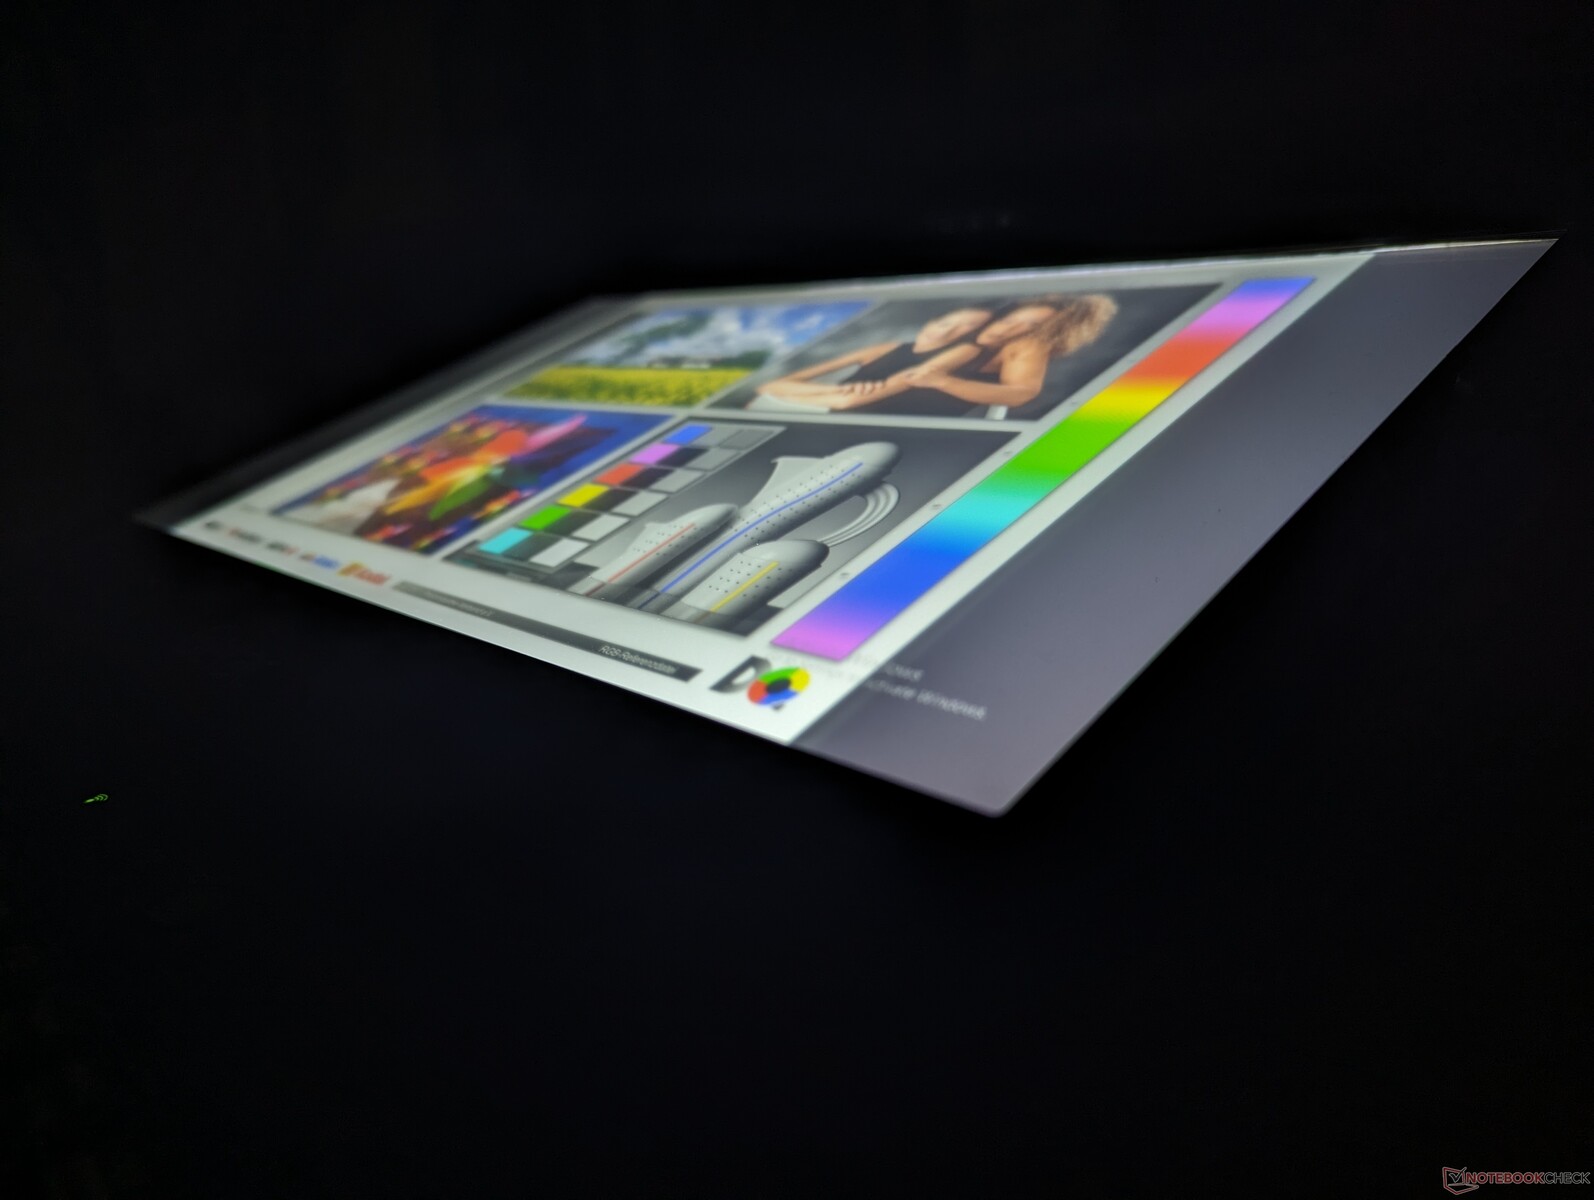
Display - schnellere Schwarz-Weiß-Reaktionszeiten
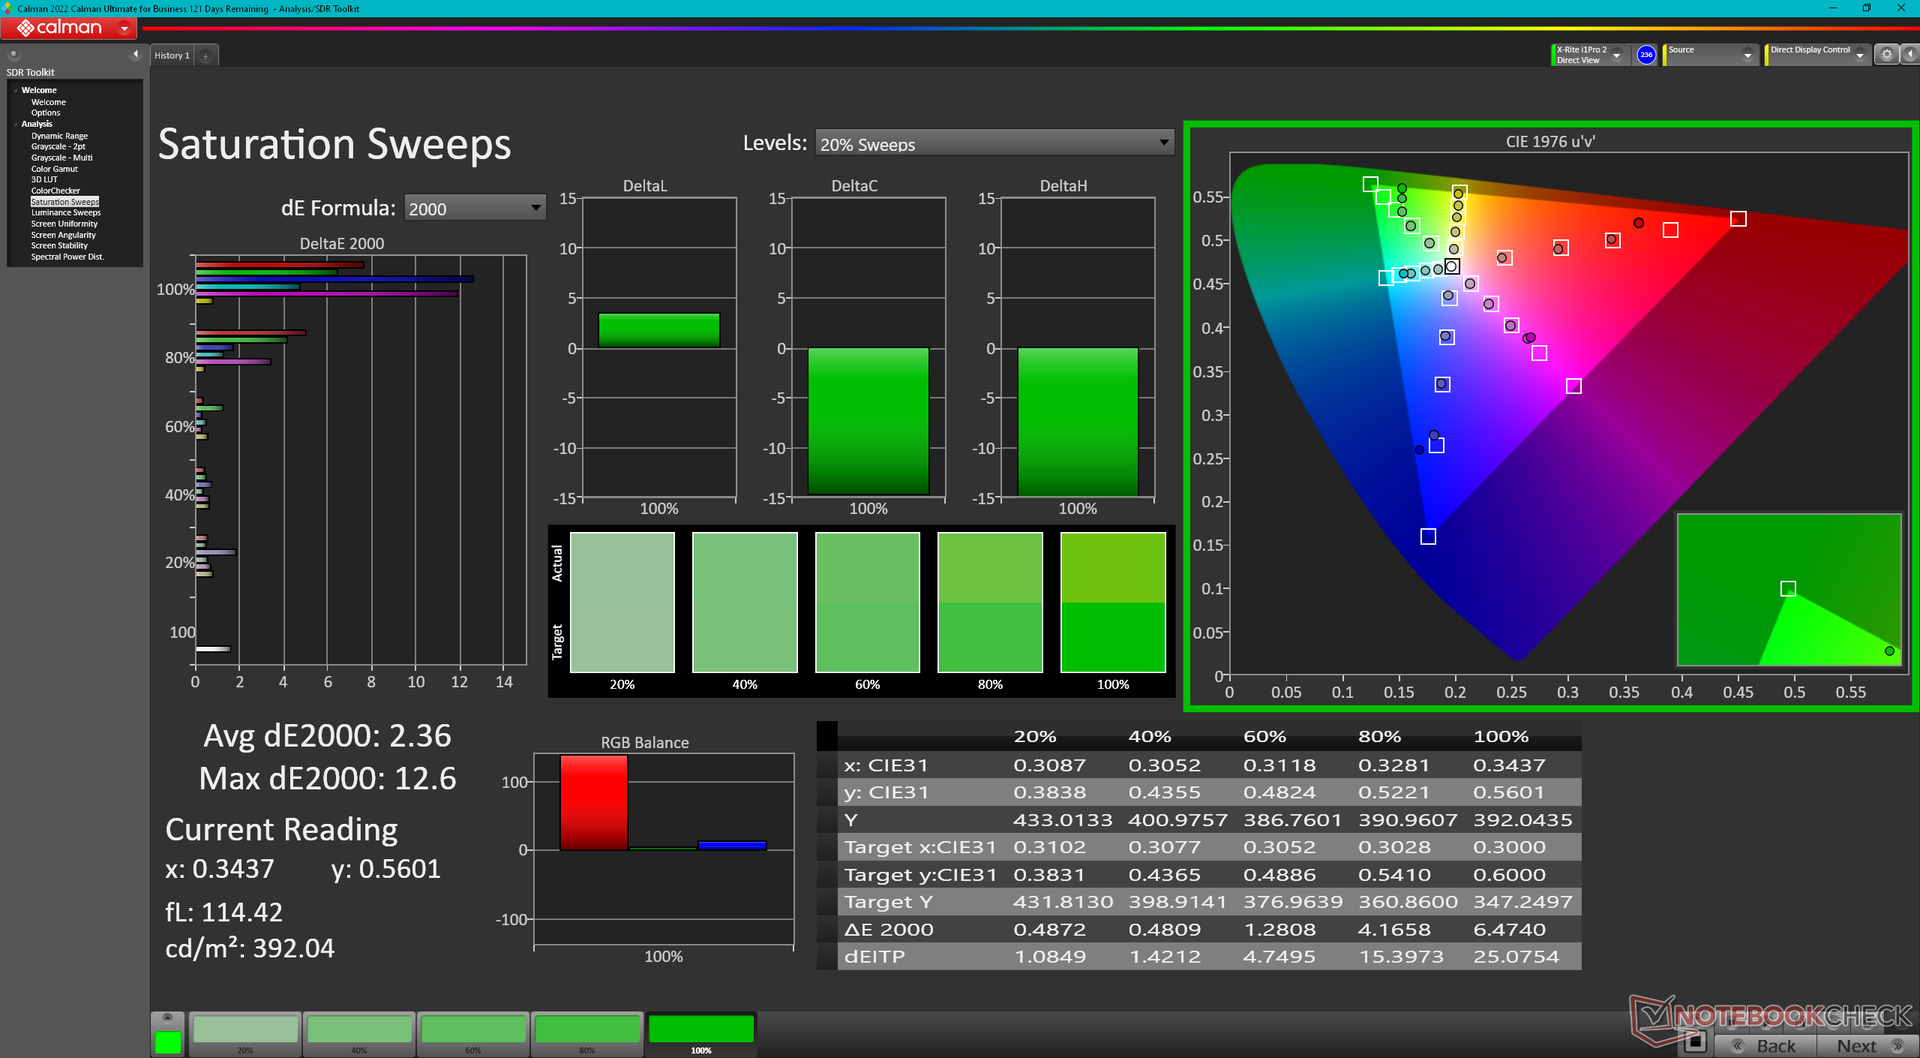
Unser S410 G5 wird mit einem Panel von TCL CSOT (SNE001BS1-1) ausgeliefert, während das S410 G4 mit einem Panel von AU Optronics ausgestattet wurde. Das TCL-Panel bietet schnellere Schwarz-Weiß- und Graustufen-Reaktionszeiten, um Ghosting zu reduzieren, was beim S410 G4 ein spürbares Problem darstellte. Ansonsten bleiben alle anderen Eigenschaften fast gleich, einschließlich der 1000-Nit-Helligkeit, dem ordentlichen Kontrastverhältnis von 1.000:1 und der begrenzten sRGB-Farben von <60 %.


| |||||||||||||||||||||||||
Ausleuchtung: 86 %
Helligkeit Akku: 958.4 cd/m²
Kontrast: 998:1 (Schwarzwert: 0.96 cd/m²)
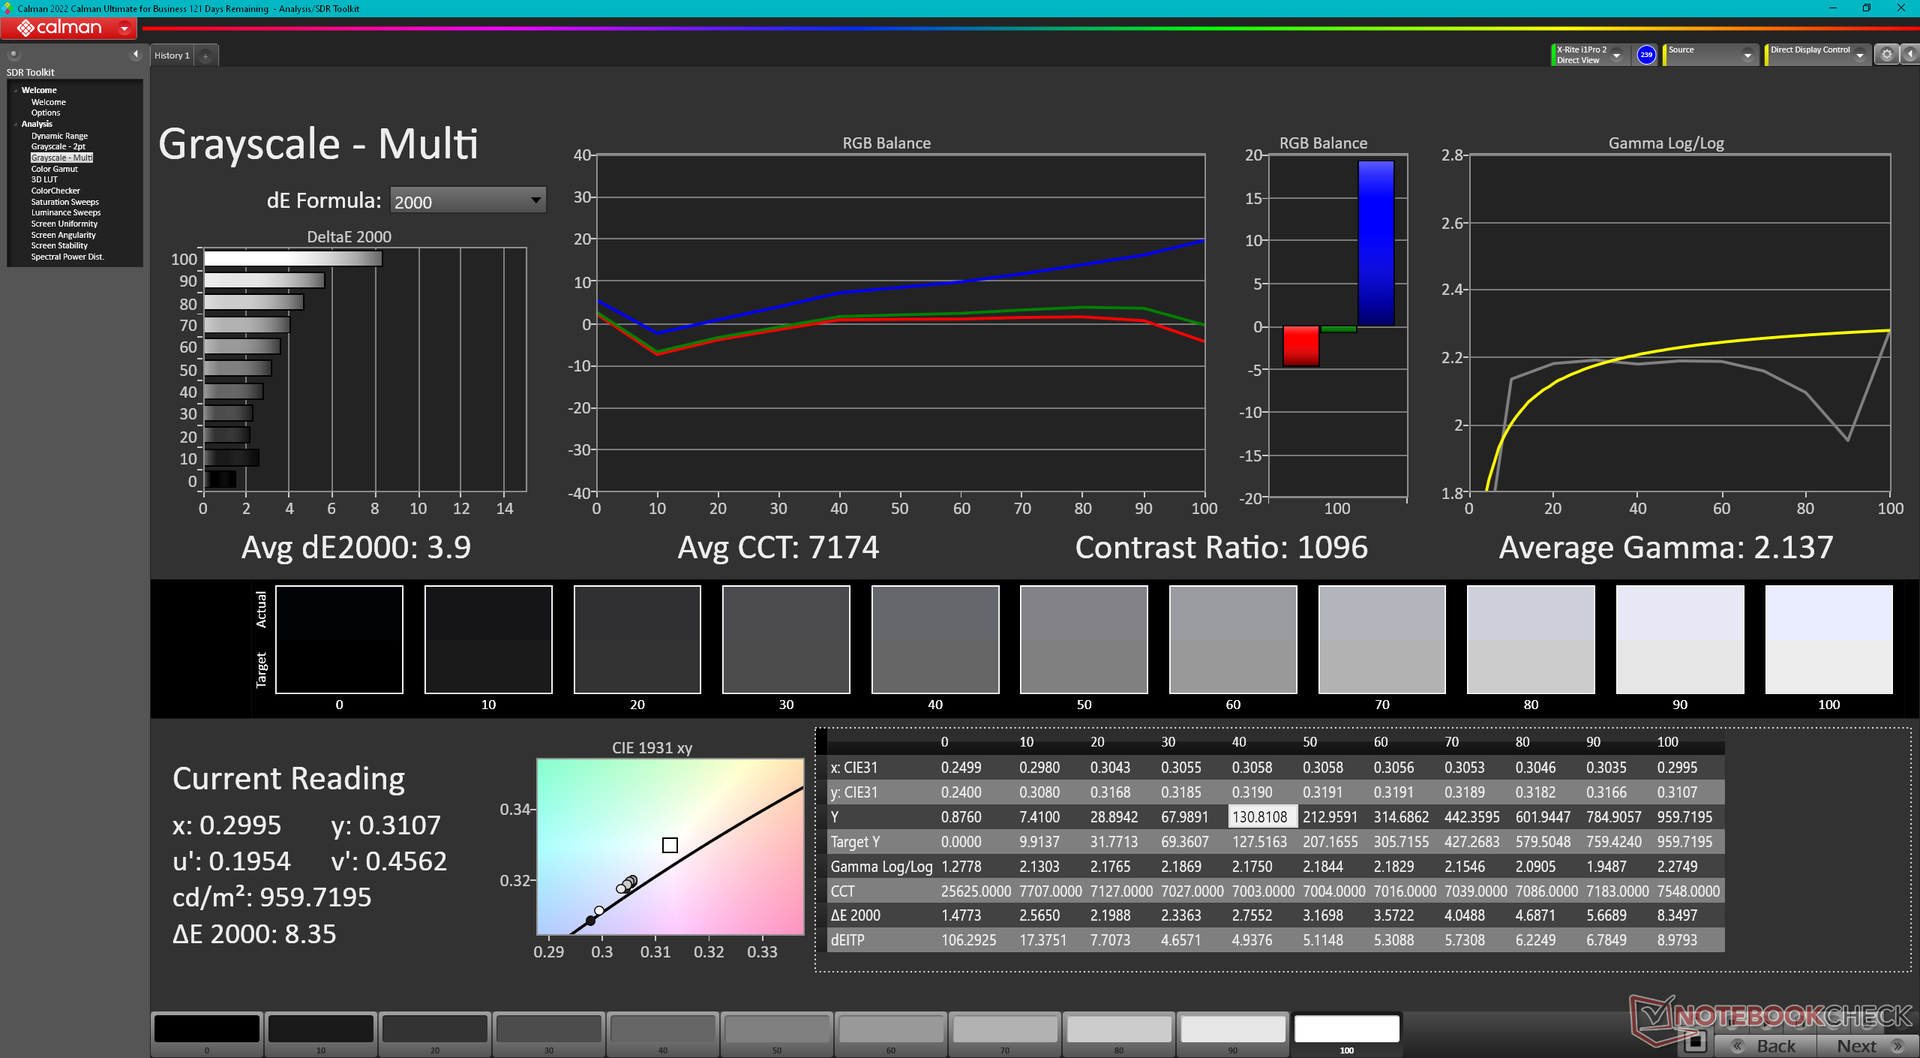
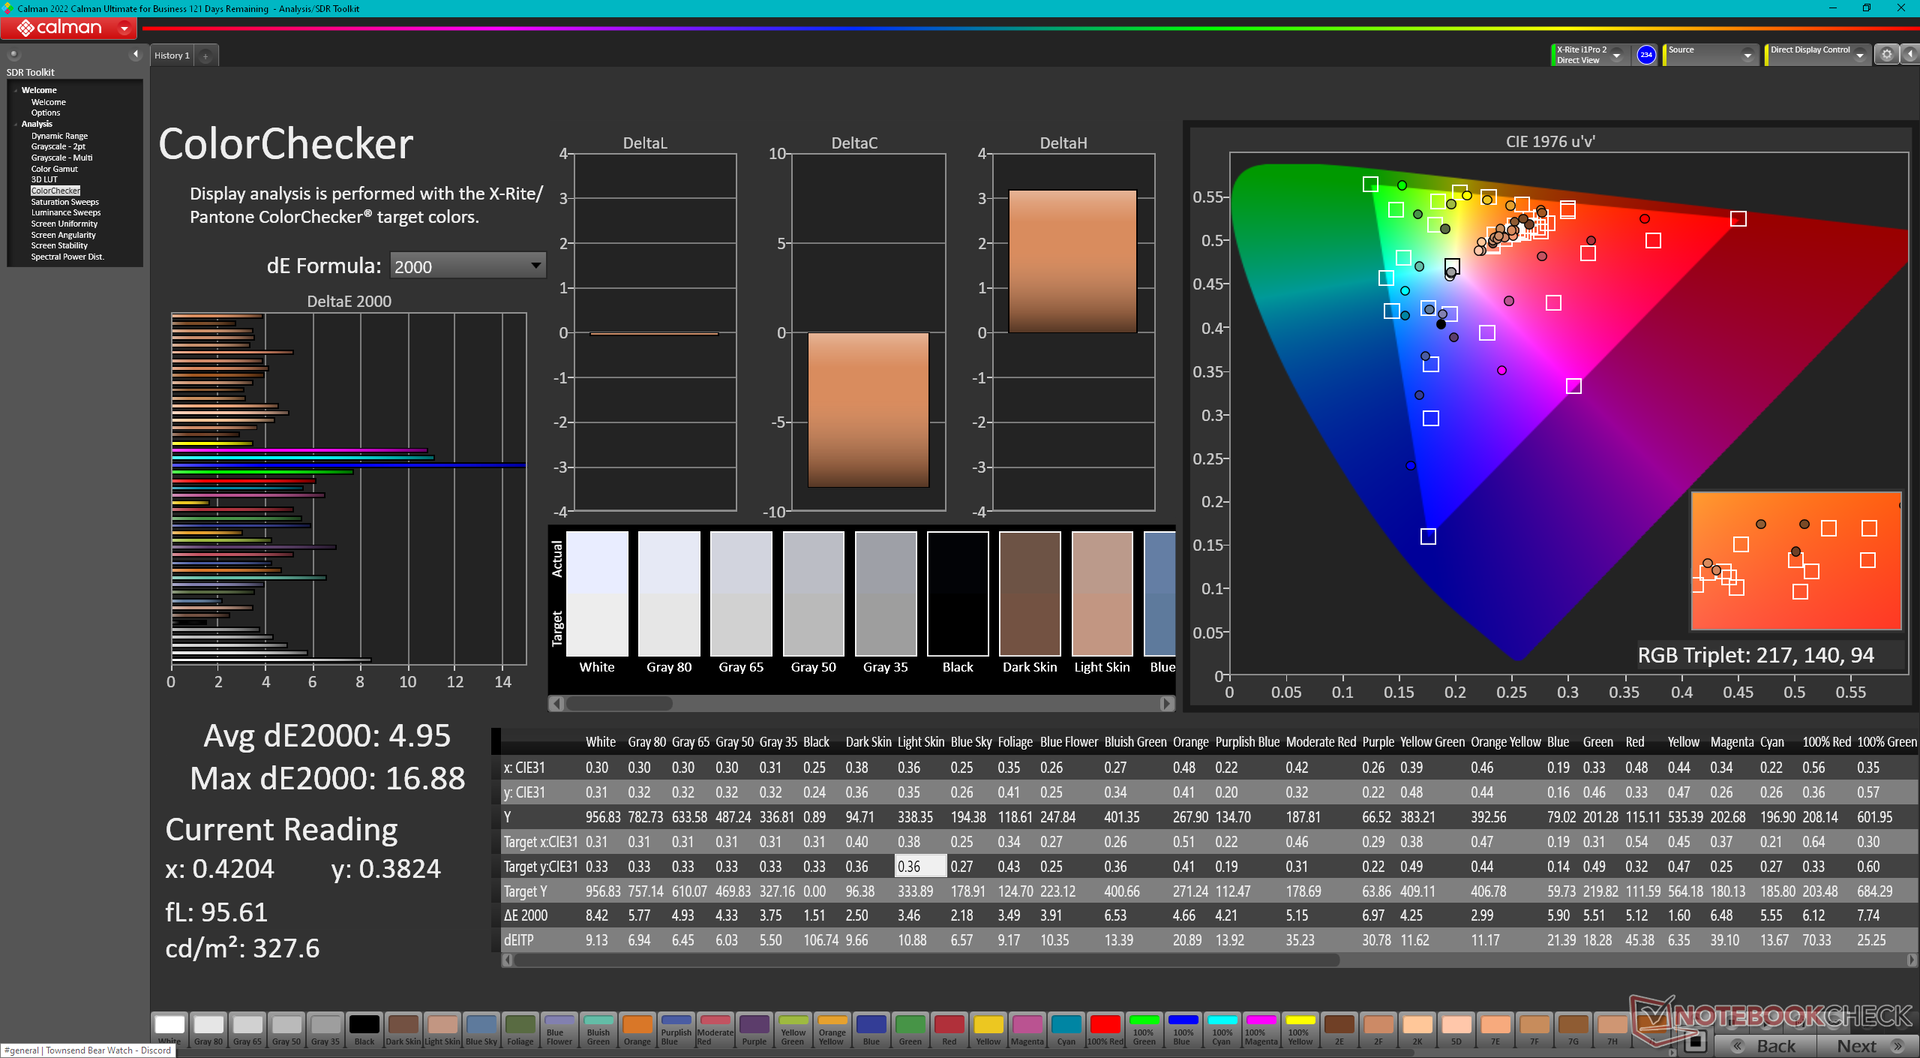
ΔE ColorChecker Calman: 4.95 | ∀{0.5-29.43 Ø4.71}
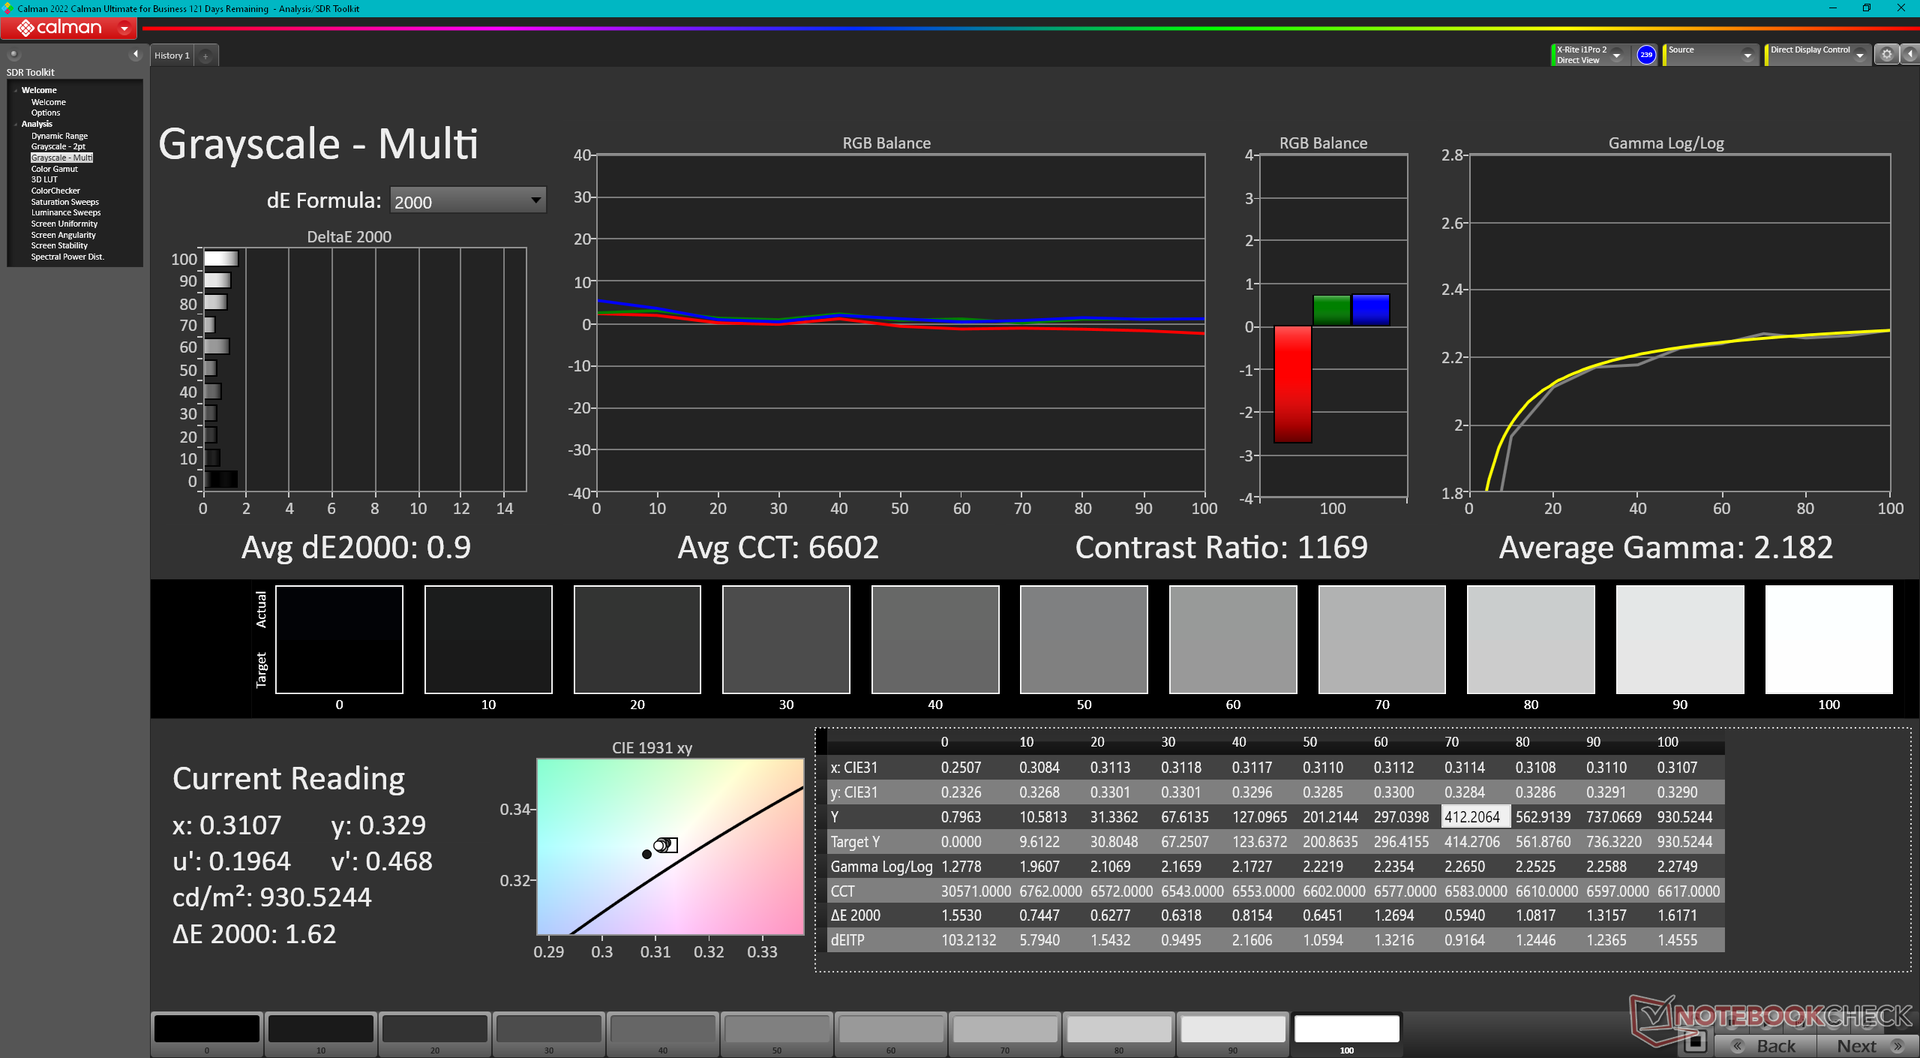
calibrated: 1.96
ΔE Greyscale Calman: 3.9 | ∀{0.09-98 Ø4.96}
39.8% AdobeRGB 1998 (Argyll 3D)
57.9% sRGB (Argyll 3D)
38.5% Display P3 (Argyll 3D)
Gamma: 2.14
CCT: 7174 K
| Getac S410 G5 CSOT T9 SNE001BS1-1, IPS, 1920x1080, 14" | Getac S410 Gen 4 AU Optronics AUO413D, IPS, 1920x1080, 14" | Durabook S14I KD140N0730A01, TN, 1920x1080, 14" | Dell Latitude 14 5420-D2G5W AUO5491 / B140HAN, IPS, 1920x1080, 14" | Dell Latitude 7330 Rugged Extreme Sharp LQ133M1, IPS, 1920x1080, 13.3" | Panasonic Toughbook 40 InfoVision M140NWF5 R3, IPS, 1920x1080, 14" | |
|---|---|---|---|---|---|---|
| Display | -1% | 13% | -7% | 72% | -7% | |
| Display P3 Coverage (%) | 38.5 | 38.3 -1% | 43.55 13% | 36 -6% | 67.1 74% | 35.8 -7% |
| sRGB Coverage (%) | 57.9 | 57.2 -1% | 65.4 13% | 54 -7% | 98.2 70% | 53.8 -7% |
| AdobeRGB 1998 Coverage (%) | 39.8 | 39.5 -1% | 45 13% | 37 -7% | 69 73% | 37 -7% |
| Response Times | -45% | 16% | -41% | -143% | -61% | |
| Response Time Grey 50% / Grey 80% * (ms) | 29 ? | 35.2 ? -21% | 30.4 ? -5% | 41 ? -41% | 74.4 ? -157% | 50.4 ? -74% |
| Response Time Black / White * (ms) | 18.6 ? | 31.2 ? -68% | 11.8 ? 37% | 26 ? -40% | 42.4 ? -128% | 27.6 ? -48% |
| PWM Frequency (Hz) | 876 ? | 870 ? | 304.9 ? | 694.4 ? | ||
| Bildschirm | -22% | -73% | -10% | 43% | 13% | |
| Helligkeit Bildmitte (cd/m²) | 958.4 | 956.9 0% | 1180.7 23% | 290 -70% | 1414.1 48% | 1284.3 34% |
| Brightness (cd/m²) | 978 | 984 1% | 1102 13% | 282 -71% | 1282 31% | 1289 32% |
| Brightness Distribution (%) | 86 | 84 -2% | 89 3% | 81 -6% | 84 -2% | 82 -5% |
| Schwarzwert * (cd/m²) | 0.96 | 0.81 16% | 1.91 -99% | 0.26 73% | 0.83 14% | 0.89 7% |
| Kontrast (:1) | 998 | 1181 18% | 618 -38% | 1115 12% | 1704 71% | 1443 45% |
| Delta E Colorchecker * | 4.95 | 6.6 -33% | 13.45 -172% | 4.65 6% | 1.99 60% | 4.67 6% |
| Colorchecker dE 2000 max. * | 16.88 | 22.94 -36% | 22.52 -33% | 7.5 56% | 3.75 78% | 19.85 -18% |
| Colorchecker dE 2000 calibrated * | 1.96 | 4.05 -107% | 3.19 -63% | 3.98 -103% | 0.72 63% | 2.21 -13% |
| Delta E Graustufen * | 3.9 | 6 -54% | 15.4 -295% | 3.22 17% | 2.8 28% | 2.7 31% |
| Gamma | 2.14 103% | 2.19 100% | 1.97 112% | 2.54 87% | 2.06 107% | 1.97 112% |
| CCT | 7174 91% | 7276 89% | 21134 31% | 6169 105% | 6775 96% | 6222 104% |
| Farbraum (Prozent von AdobeRGB 1998) (%) | 41.6 | |||||
| Color Space (Percent of sRGB) (%) | 65.5 | |||||
| Durchschnitt gesamt (Programm / Settings) | -23% /
-21% | -15% /
-42% | -19% /
-13% | -9% /
23% | -18% /
-2% |
* ... kleinere Werte sind besser
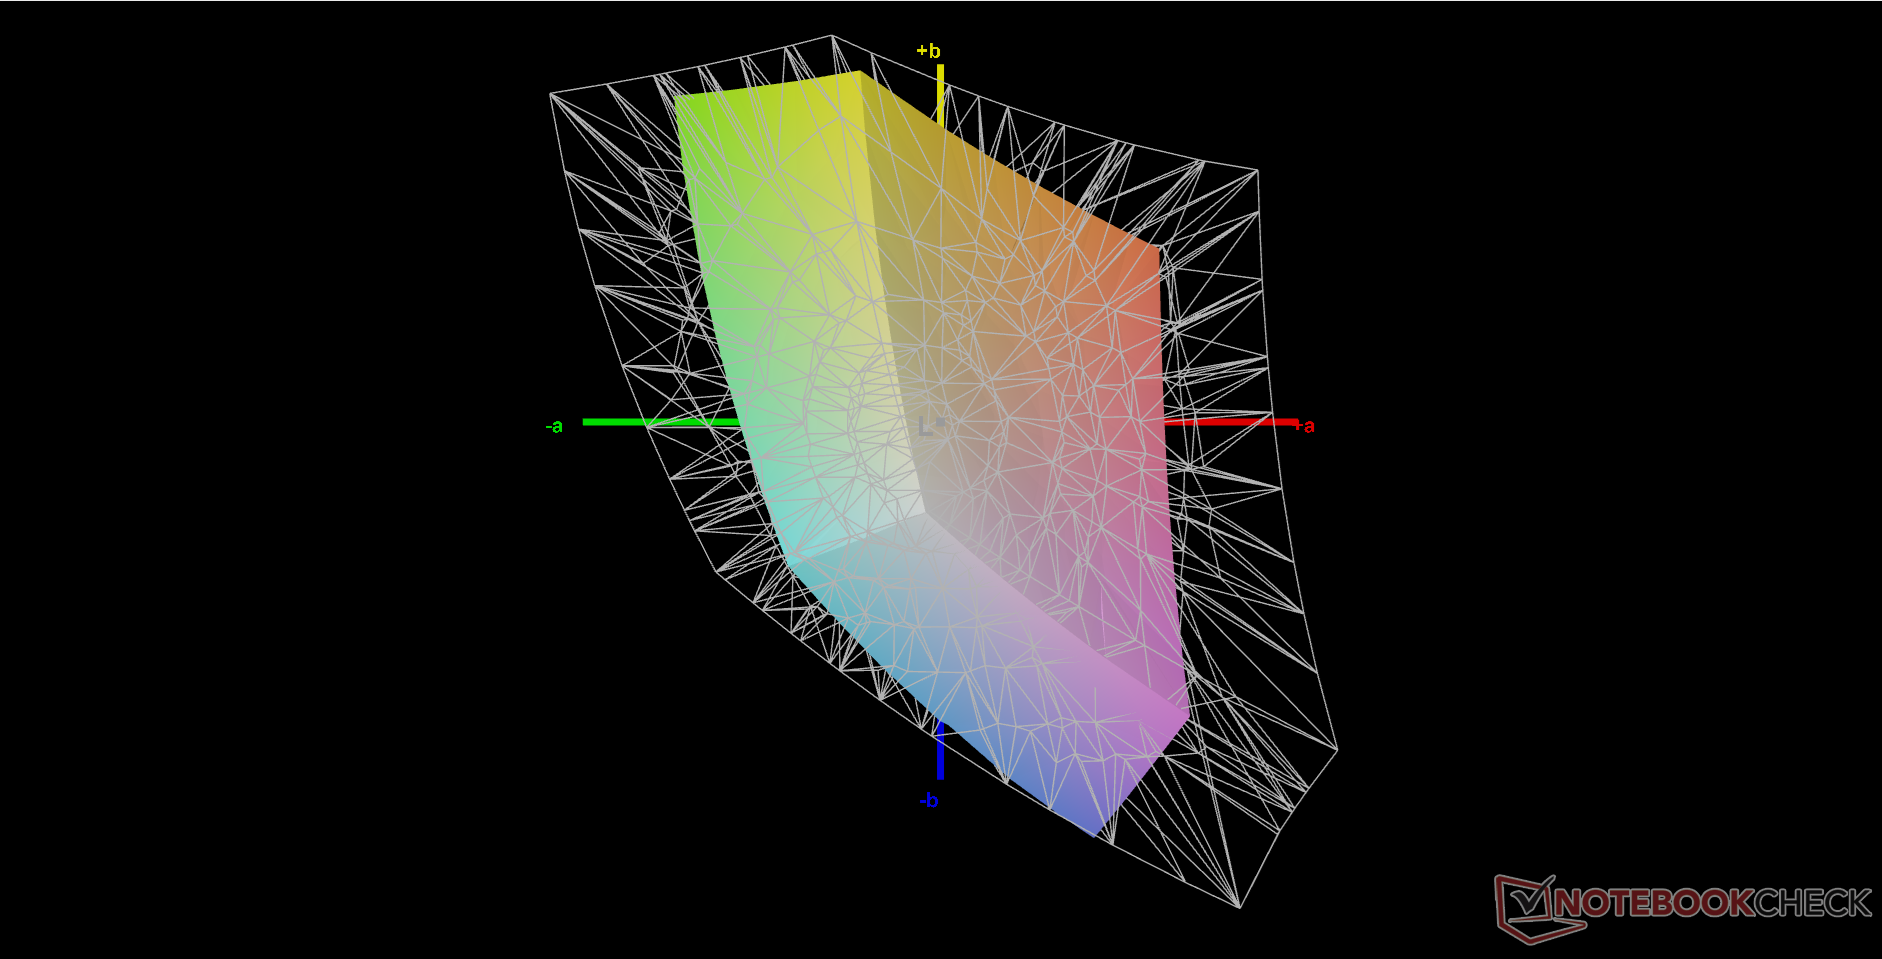

Das Display ist schlecht kalibriert mit durchschnittlichen DeltaE-Werten von mehr als 4 und einer zu kühlen Farbtemperatur. Eine ordnungsgemäße Kalibrierung mit unserem X-Rite-Kolorimeter behebt diese Probleme, aber aufgrund des oben erwähnten begrenzten Farbraums werden die Farben bei höheren Sättigungsstufen trotzdem ungenauer. Wir empfehlen die Anwendung unseres kalibrierten ICM-Profils, um das Beste aus dem Display herauszuholen.


Reaktionszeiten (Response Times) des Displays
| ↔ Reaktionszeiten Schwarz zu Weiß | ||
|---|---|---|
| 18.6 ms ... steigend ↗ und fallend ↘ kombiniert | ↗ 9.4 ms steigend |  |
| ↘ 9.2 ms fallend | ||
| Die gemessenen Reaktionszeiten sind gut, für anspruchsvolle Spieler könnten der Bildschirm jedoch zu langsam sein. Im Vergleich rangierten die bei uns getesteten Geräte von 0.1 (Minimum) zu 240 (Maximum) ms. » 42 % aller Screens waren schneller als der getestete. Daher sind die gemessenen Reaktionszeiten durchschnittlich (19.8 ms). | ||
| ↔ Reaktionszeiten 50% Grau zu 80% Grau | ||
| 29 ms ... steigend ↗ und fallend ↘ kombiniert | ↗ 14.6 ms steigend |  |
| ↘ 14.4 ms fallend | ||
| Die gemessenen Reaktionszeiten sind mittelmäßig und dadurch für Spieler eventuell zu langsam. Im Vergleich rangierten die bei uns getesteten Geräte von 0.165 (Minimum) zu 636 (Maximum) ms. » 39 % aller Screens waren schneller als der getestete. Daher sind die gemessenen Reaktionszeiten durchschnittlich (30.9 ms). | ||
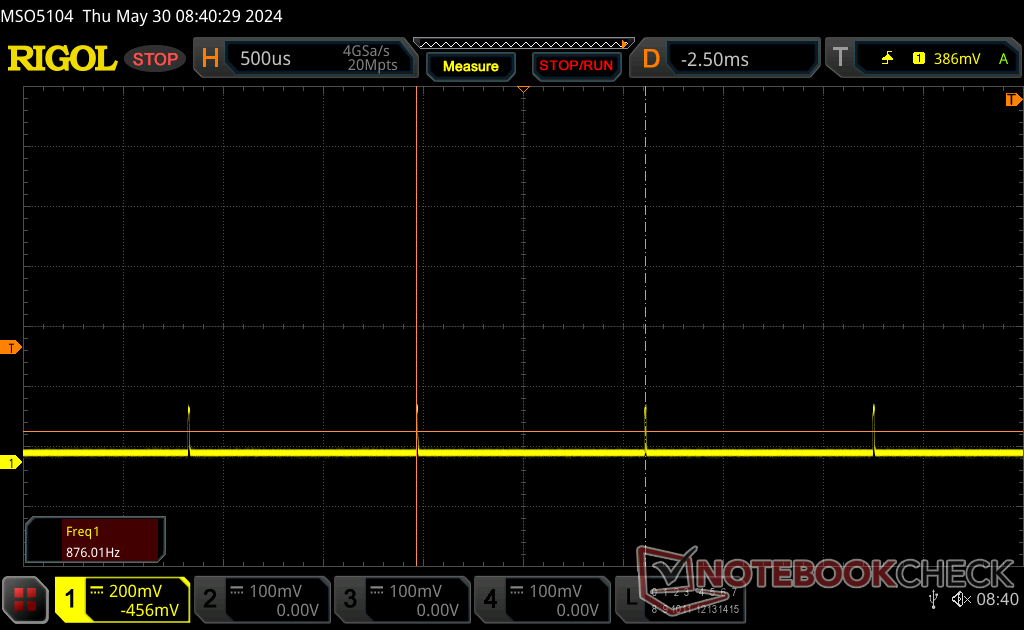
Bildschirm-Flackern / PWM (Pulse-Width Modulation)
| Flackern / PWM festgestellt | 876 Hz | ≤ 100 % Helligkeit |  |
Das Display flackert mit 876 Hz (im schlimmsten Fall, eventuell durch Pulsweitenmodulation PWM) bei einer eingestellten Helligkeit von 100 % und darunter. Darüber sollte es zu keinem Flackern kommen. Die Frequenz von 876 Hz ist sehr hoch und sollte daher auch bei empfindlichen Personen zu keinen Problemen führen. Im Vergleich: 52 % aller getesteten Geräte nutzten kein PWM um die Helligkeit zu reduzieren. Wenn PWM eingesetzt wurde, dann bei einer Frequenz von durchschnittlich 7744 (Minimum 5, Maximum 343500) Hz. | |||
Die Pulsbreitenmodulation oder das Flackern tritt bei allen Helligkeitsstufen mit einer Frequenz von 876 Hz auf. Benutzer, die empfindlich auf Flackern reagieren, sollten den Bildschirm nicht über einen längeren Zeitraum verwenden oder zumindest die Helligkeit reduzieren.


Performance - Raptor-Lake-P-Upgrade


Testbedingungen
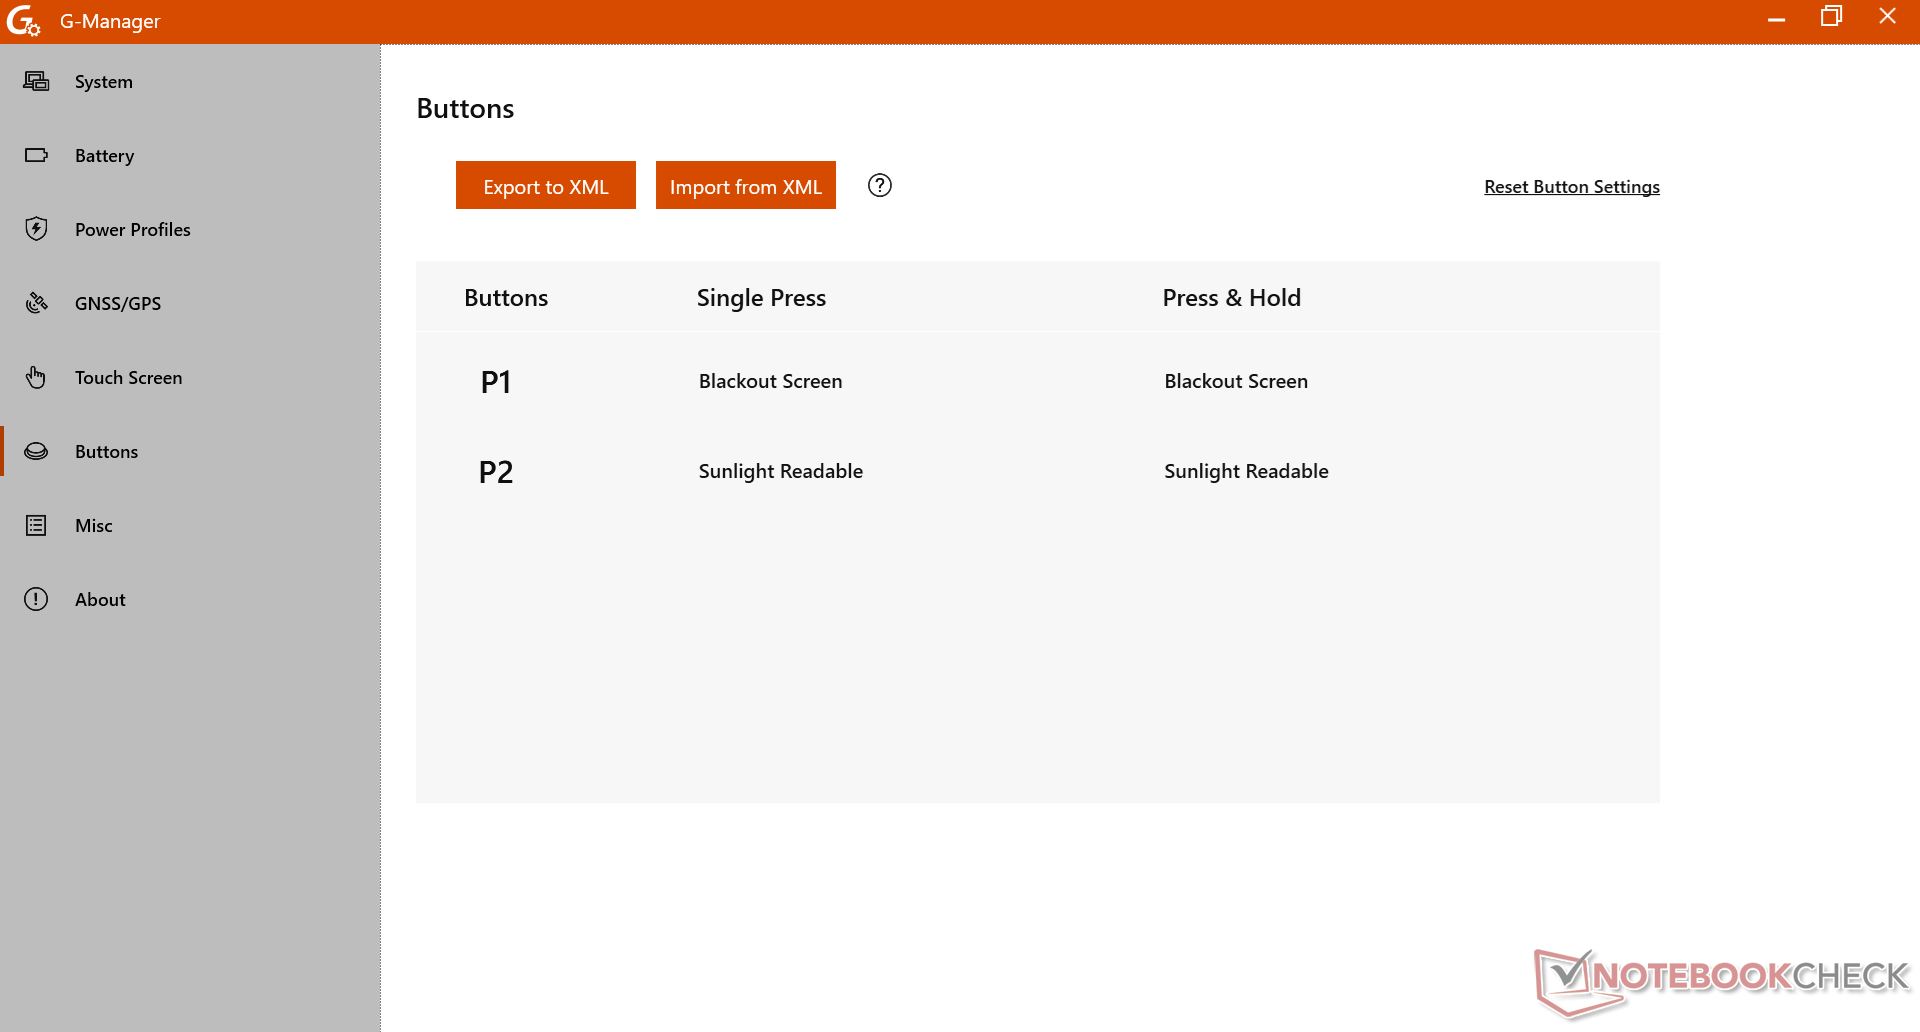
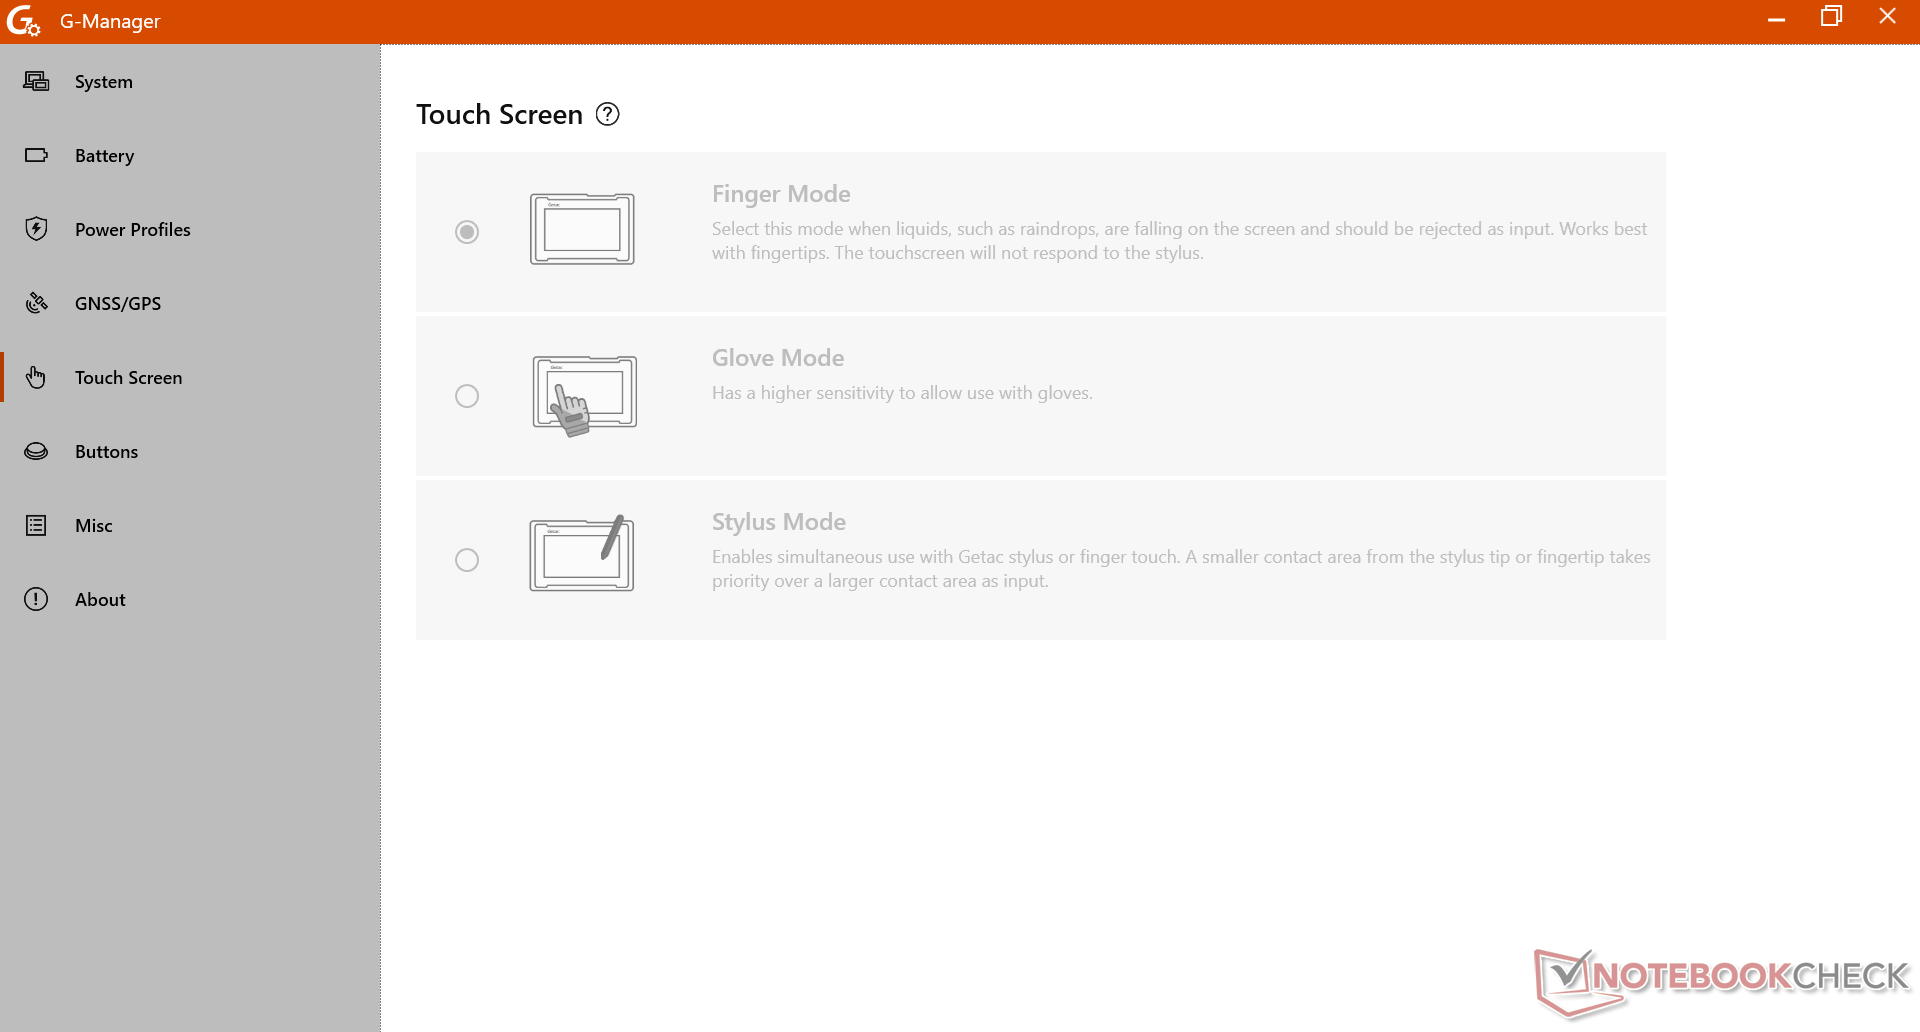
Wir haben Windows auf den Modus Performance und den G-Manager auf den Modus Extreme Leistung eingestellt, bevor wir die folgenden Benchmarks durchgeführt haben. Wir empfehlen Ihnen, sich mit dem G-Manager vertraut zu machen, da er der Dreh- und Angelpunkt für die Einstellung mehrerer einzigartiger Funktionen des S410 ist, darunter das integrierte GPS/GNSS, die anpassbaren Tasten und die Empfindlichkeit des Touchscreens.


Prozessor
Der Leistungssprung vom Core i7-1185G7 in der älteren S410 G4 zu unserem neueren Core i5-1350P ist signifikant, da die Raptor-Lake-P-CPU bei Multi-Thread-Arbeitslasten mehr als 2x schneller sein kann als Tiger Lake-U. Der Turbo Boost ist jedoch begrenzt, wie unser CineBench-R15-xT-Schleifentestdiagramm unten zeigt. Trotzdem ist das System immer noch viel schneller als zuvor, selbst wenn man die starke Drosselung berücksichtigt.
Cinebench R15 Multi Loop
Cinebench R23: Multi Core | Single Core
Cinebench R20: CPU (Multi Core) | CPU (Single Core)
Cinebench R15: CPU Multi 64Bit | CPU Single 64Bit
Blender: v2.79 BMW27 CPU
7-Zip 18.03: 7z b 4 | 7z b 4 -mmt1
Geekbench 6.7: Multi-Core | Single-Core
Geekbench 5.5: Multi-Core | Single-Core
HWBOT x265 Benchmark v2.2: 4k Preset
LibreOffice : 20 Documents To PDF
R Benchmark 2.5: Overall mean
| CPU Performance Rating | |
| Getac S410 G5 | |
| Durchschnittliche Intel Core i5-1350P | |
| Dell Latitude 7330 Rugged Extreme -2! | |
| Panasonic Toughbook FZ-55 MK2 -4! | |
| Getac S410 Gen 4 -2! | |
| Dell Latitude 14 5420-D2G5W -2! | |
| Panasonic Toughbook 40 -2! | |
| Durabook S14I -2! | |
| Panasonic Toughbook FZ-55 -14! | |
| Getac B360 -3! | |
| Getac S410 -14! | |
| Cinebench R23 / Multi Core | |
| Getac S410 G5 | |
| Durchschnittliche Intel Core i5-1350P (n=1) | |
| Dell Latitude 7330 Rugged Extreme | |
| Dell Latitude 14 5420-D2G5W | |
| Panasonic Toughbook FZ-55 MK2 | |
| Getac S410 Gen 4 | |
| Panasonic Toughbook 40 | |
| Getac B360 | |
| Durabook S14I | |
| Cinebench R23 / Single Core | |
| Getac S410 G5 | |
| Durchschnittliche Intel Core i5-1350P (n=1) | |
| Dell Latitude 7330 Rugged Extreme | |
| Panasonic Toughbook FZ-55 MK2 | |
| Getac S410 Gen 4 | |
| Panasonic Toughbook 40 | |
| Durabook S14I | |
| Dell Latitude 14 5420-D2G5W | |
| Getac B360 | |
| Cinebench R20 / CPU (Multi Core) | |
| Getac S410 G5 | |
| Durchschnittliche Intel Core i5-1350P (n=1) | |
| Dell Latitude 14 5420-D2G5W | |
| Dell Latitude 7330 Rugged Extreme | |
| Panasonic Toughbook FZ-55 MK2 | |
| Getac S410 Gen 4 | |
| Panasonic Toughbook 40 | |
| Getac B360 | |
| Durabook S14I | |
| Cinebench R20 / CPU (Single Core) | |
| Getac S410 G5 | |
| Durchschnittliche Intel Core i5-1350P (n=1) | |
| Dell Latitude 7330 Rugged Extreme | |
| Panasonic Toughbook FZ-55 MK2 | |
| Getac S410 Gen 4 | |
| Durabook S14I | |
| Panasonic Toughbook 40 | |
| Dell Latitude 14 5420-D2G5W | |
| Getac B360 | |
| Cinebench R15 / CPU Multi 64Bit | |
| Getac S410 G5 | |
| Durchschnittliche Intel Core i5-1350P (n=1) | |
| Dell Latitude 14 5420-D2G5W | |
| Dell Latitude 7330 Rugged Extreme | |
| Panasonic Toughbook FZ-55 MK2 | |
| Getac S410 Gen 4 | |
| Panasonic Toughbook 40 | |
| Getac B360 | |
| Durabook S14I | |
| Panasonic Toughbook FZ-55 | |
| Getac S410 | |
| Cinebench R15 / CPU Single 64Bit | |
| Getac S410 G5 | |
| Durchschnittliche Intel Core i5-1350P (n=1) | |
| Dell Latitude 7330 Rugged Extreme | |
| Panasonic Toughbook FZ-55 MK2 | |
| Getac S410 Gen 4 | |
| Durabook S14I | |
| Panasonic Toughbook 40 | |
| Dell Latitude 14 5420-D2G5W | |
| Getac B360 | |
| Panasonic Toughbook FZ-55 | |
| Getac S410 | |
| Blender / v2.79 BMW27 CPU | |
| Durabook S14I | |
| Getac B360 | |
| Panasonic Toughbook 40 | |
| Getac S410 Gen 4 | |
| Panasonic Toughbook FZ-55 MK2 | |
| Dell Latitude 7330 Rugged Extreme | |
| Dell Latitude 14 5420-D2G5W | |
| Getac S410 G5 | |
| Durchschnittliche Intel Core i5-1350P (n=1) | |
| 7-Zip 18.03 / 7z b 4 | |
| Getac S410 G5 | |
| Durchschnittliche Intel Core i5-1350P (n=1) | |
| Dell Latitude 7330 Rugged Extreme | |
| Panasonic Toughbook FZ-55 MK2 | |
| Dell Latitude 14 5420-D2G5W | |
| Getac S410 Gen 4 | |
| Getac B360 | |
| Panasonic Toughbook 40 | |
| Durabook S14I | |
| 7-Zip 18.03 / 7z b 4 -mmt1 | |
| Dell Latitude 7330 Rugged Extreme | |
| Panasonic Toughbook FZ-55 MK2 | |
| Durabook S14I | |
| Getac S410 G5 | |
| Durchschnittliche Intel Core i5-1350P (n=1) | |
| Panasonic Toughbook 40 | |
| Getac S410 Gen 4 | |
| Dell Latitude 14 5420-D2G5W | |
| Getac B360 | |
| Geekbench 6.7 / Multi-Core | |
| Getac S410 G5 | |
| Durchschnittliche Intel Core i5-1350P (n=1) | |
| Geekbench 6.7 / Single-Core | |
| Getac S410 G5 | |
| Durchschnittliche Intel Core i5-1350P (n=1) | |
| Geekbench 5.5 / Multi-Core | |
| Getac S410 G5 | |
| Durchschnittliche Intel Core i5-1350P (n=1) | |
| Dell Latitude 7330 Rugged Extreme | |
| Getac S410 Gen 4 | |
| Panasonic Toughbook 40 | |
| Getac B360 | |
| Durabook S14I | |
| Dell Latitude 14 5420-D2G5W | |
| Geekbench 5.5 / Single-Core | |
| Getac S410 G5 | |
| Durchschnittliche Intel Core i5-1350P (n=1) | |
| Dell Latitude 7330 Rugged Extreme | |
| Durabook S14I | |
| Getac S410 Gen 4 | |
| Panasonic Toughbook 40 | |
| Getac B360 | |
| Dell Latitude 14 5420-D2G5W | |
| HWBOT x265 Benchmark v2.2 / 4k Preset | |
| Getac S410 G5 | |
| Durchschnittliche Intel Core i5-1350P (n=1) | |
| Dell Latitude 7330 Rugged Extreme | |
| Panasonic Toughbook FZ-55 MK2 | |
| Getac S410 Gen 4 | |
| Dell Latitude 14 5420-D2G5W | |
| Panasonic Toughbook 40 | |
| Getac B360 | |
| Durabook S14I | |
| LibreOffice / 20 Documents To PDF | |
| Dell Latitude 14 5420-D2G5W | |
| Panasonic Toughbook 40 | |
| Getac S410 Gen 4 | |
| Dell Latitude 7330 Rugged Extreme | |
| Panasonic Toughbook FZ-55 MK2 | |
| Durabook S14I | |
| Getac S410 G5 | |
| Durchschnittliche Intel Core i5-1350P (n=1) | |
| R Benchmark 2.5 / Overall mean | |
| Getac B360 | |
| Dell Latitude 14 5420-D2G5W | |
| Panasonic Toughbook 40 | |
| Getac S410 Gen 4 | |
| Durabook S14I | |
| Panasonic Toughbook FZ-55 MK2 | |
| Dell Latitude 7330 Rugged Extreme | |
| Getac S410 G5 | |
| Durchschnittliche Intel Core i5-1350P (n=1) | |
* ... kleinere Werte sind besser
AIDA64: FP32 Ray-Trace | FPU Julia | CPU SHA3 | CPU Queen | FPU SinJulia | FPU Mandel | CPU AES | CPU ZLib | FP64 Ray-Trace | CPU PhotoWorxx
| Performance Rating | |
| Getac S410 G5 | |
| Durchschnittliche Intel Core i5-1350P | |
| Dell Latitude 7330 Rugged Extreme | |
| Dell Latitude 14 5420-D2G5W | |
| Getac S410 Gen 4 | |
| Panasonic Toughbook 40 | |
| Durabook S14I | |
| AIDA64 / FP32 Ray-Trace | |
| Getac S410 G5 | |
| Durchschnittliche Intel Core i5-1350P (n=1) | |
| Dell Latitude 14 5420-D2G5W | |
| Dell Latitude 7330 Rugged Extreme | |
| Getac S410 Gen 4 | |
| Panasonic Toughbook 40 | |
| Durabook S14I | |
| AIDA64 / FPU Julia | |
| Getac S410 G5 | |
| Durchschnittliche Intel Core i5-1350P (n=1) | |
| Dell Latitude 7330 Rugged Extreme | |
| Dell Latitude 14 5420-D2G5W | |
| Getac S410 Gen 4 | |
| Panasonic Toughbook 40 | |
| Durabook S14I | |
| AIDA64 / CPU SHA3 | |
| Dell Latitude 7330 Rugged Extreme | |
| Dell Latitude 14 5420-D2G5W | |
| Getac S410 G5 | |
| Durchschnittliche Intel Core i5-1350P (n=1) | |
| Getac S410 Gen 4 | |
| Panasonic Toughbook 40 | |
| Durabook S14I | |
| AIDA64 / CPU Queen | |
| Getac S410 G5 | |
| Durchschnittliche Intel Core i5-1350P (n=1) | |
| Dell Latitude 7330 Rugged Extreme | |
| Durabook S14I | |
| Getac S410 Gen 4 | |
| Dell Latitude 14 5420-D2G5W | |
| Panasonic Toughbook 40 | |
| AIDA64 / FPU SinJulia | |
| Getac S410 G5 | |
| Durchschnittliche Intel Core i5-1350P (n=1) | |
| Dell Latitude 7330 Rugged Extreme | |
| Dell Latitude 14 5420-D2G5W | |
| Getac S410 Gen 4 | |
| Panasonic Toughbook 40 | |
| Durabook S14I | |
| AIDA64 / FPU Mandel | |
| Getac S410 G5 | |
| Durchschnittliche Intel Core i5-1350P (n=1) | |
| Dell Latitude 7330 Rugged Extreme | |
| Dell Latitude 14 5420-D2G5W | |
| Getac S410 Gen 4 | |
| Panasonic Toughbook 40 | |
| Durabook S14I | |
| AIDA64 / CPU AES | |
| Dell Latitude 7330 Rugged Extreme | |
| Dell Latitude 14 5420-D2G5W | |
| Durabook S14I | |
| Getac S410 G5 | |
| Durchschnittliche Intel Core i5-1350P (n=1) | |
| Getac S410 Gen 4 | |
| Panasonic Toughbook 40 | |
| AIDA64 / CPU ZLib | |
| Getac S410 G5 | |
| Durchschnittliche Intel Core i5-1350P (n=1) | |
| Dell Latitude 7330 Rugged Extreme | |
| Dell Latitude 14 5420-D2G5W | |
| Panasonic Toughbook 40 | |
| Getac S410 Gen 4 | |
| Durabook S14I | |
| AIDA64 / FP64 Ray-Trace | |
| Getac S410 G5 | |
| Durchschnittliche Intel Core i5-1350P (n=1) | |
| Dell Latitude 7330 Rugged Extreme | |
| Dell Latitude 14 5420-D2G5W | |
| Getac S410 Gen 4 | |
| Panasonic Toughbook 40 | |
| Durabook S14I | |
| AIDA64 / CPU PhotoWorxx | |
| Dell Latitude 7330 Rugged Extreme | |
| Getac S410 G5 | |
| Durchschnittliche Intel Core i5-1350P (n=1) | |
| Getac S410 Gen 4 | |
| Panasonic Toughbook 40 | |
| Durabook S14I | |
| Dell Latitude 14 5420-D2G5W | |
System Performance
Die PCMark Ergebnisse sind durchweg höher als beim Vorjahresmodell, um die schnellere Gesamtleistung mit dem neueren Prozessor widerzuspiegeln.

CrossMark: Overall | Productivity | Creativity | Responsiveness
WebXPRT 3: Overall
WebXPRT 4: Overall
Mozilla Kraken 1.1: Total
| PCMark 10 / Score | |
| Getac S410 G5 | |
| Durchschnittliche Intel Core i5-1350P, Intel Iris Xe Graphics G7 80EUs (n=1) | |
| Dell Latitude 7330 Rugged Extreme | |
| Panasonic Toughbook 40 | |
| Durabook S14I | |
| Getac S410 Gen 4 | |
| Dell Latitude 14 5420-D2G5W | |
| PCMark 10 / Essentials | |
| Dell Latitude 7330 Rugged Extreme | |
| Durabook S14I | |
| Getac S410 G5 | |
| Durchschnittliche Intel Core i5-1350P, Intel Iris Xe Graphics G7 80EUs (n=1) | |
| Getac S410 Gen 4 | |
| Panasonic Toughbook 40 | |
| Dell Latitude 14 5420-D2G5W | |
| PCMark 10 / Productivity | |
| Getac S410 G5 | |
| Durchschnittliche Intel Core i5-1350P, Intel Iris Xe Graphics G7 80EUs (n=1) | |
| Durabook S14I | |
| Dell Latitude 7330 Rugged Extreme | |
| Panasonic Toughbook 40 | |
| Dell Latitude 14 5420-D2G5W | |
| Getac S410 Gen 4 | |
| PCMark 10 / Digital Content Creation | |
| Getac S410 G5 | |
| Durchschnittliche Intel Core i5-1350P, Intel Iris Xe Graphics G7 80EUs (n=1) | |
| Dell Latitude 7330 Rugged Extreme | |
| Panasonic Toughbook 40 | |
| Getac S410 Gen 4 | |
| Dell Latitude 14 5420-D2G5W | |
| Durabook S14I | |
| CrossMark / Overall | |
| Getac S410 G5 | |
| Durchschnittliche Intel Core i5-1350P, Intel Iris Xe Graphics G7 80EUs (n=1) | |
| Panasonic Toughbook 40 | |
| Getac S410 Gen 4 | |
| Dell Latitude 14 5420-D2G5W | |
| CrossMark / Productivity | |
| Getac S410 G5 | |
| Durchschnittliche Intel Core i5-1350P, Intel Iris Xe Graphics G7 80EUs (n=1) | |
| Panasonic Toughbook 40 | |
| Getac S410 Gen 4 | |
| Dell Latitude 14 5420-D2G5W | |
| CrossMark / Creativity | |
| Getac S410 G5 | |
| Durchschnittliche Intel Core i5-1350P, Intel Iris Xe Graphics G7 80EUs (n=1) | |
| Panasonic Toughbook 40 | |
| Getac S410 Gen 4 | |
| Dell Latitude 14 5420-D2G5W | |
| CrossMark / Responsiveness | |
| Getac S410 G5 | |
| Durchschnittliche Intel Core i5-1350P, Intel Iris Xe Graphics G7 80EUs (n=1) | |
| Panasonic Toughbook 40 | |
| Dell Latitude 14 5420-D2G5W | |
| Getac S410 Gen 4 | |
| WebXPRT 3 / Overall | |
| Getac S410 G5 | |
| Durchschnittliche Intel Core i5-1350P, Intel Iris Xe Graphics G7 80EUs (n=1) | |
| Dell Latitude 7330 Rugged Extreme | |
| Durabook S14I | |
| Getac S410 Gen 4 | |
| Panasonic Toughbook 40 | |
| Dell Latitude 14 5420-D2G5W | |
| WebXPRT 4 / Overall | |
| Getac S410 G5 | |
| Durchschnittliche Intel Core i5-1350P, Intel Iris Xe Graphics G7 80EUs (n=1) | |
| Mozilla Kraken 1.1 / Total | |
| Dell Latitude 14 5420-D2G5W | |
| Dell Latitude 7330 Rugged Extreme | |
| Panasonic Toughbook 40 | |
| Durabook S14I | |
| Getac S410 G5 | |
| Durchschnittliche Intel Core i5-1350P, Intel Iris Xe Graphics G7 80EUs (n=1) | |
* ... kleinere Werte sind besser
| PCMark 10 Score | 5589 Punkte | |
Hilfe | ||
| AIDA64 / Memory Copy | |
| Dell Latitude 7330 Rugged Extreme | |
| Getac S410 G5 | |
| Durchschnittliche Intel Core i5-1350P (n=1) | |
| Getac S410 Gen 4 | |
| Panasonic Toughbook 40 | |
| Durabook S14I | |
| Dell Latitude 14 5420-D2G5W | |
| AIDA64 / Memory Read | |
| Dell Latitude 7330 Rugged Extreme | |
| Getac S410 G5 | |
| Durchschnittliche Intel Core i5-1350P (n=1) | |
| Getac S410 Gen 4 | |
| Panasonic Toughbook 40 | |
| Durabook S14I | |
| Dell Latitude 14 5420-D2G5W | |
| AIDA64 / Memory Write | |
| Dell Latitude 7330 Rugged Extreme | |
| Getac S410 G5 | |
| Durchschnittliche Intel Core i5-1350P (n=1) | |
| Getac S410 Gen 4 | |
| Panasonic Toughbook 40 | |
| Durabook S14I | |
| Dell Latitude 14 5420-D2G5W | |
| AIDA64 / Memory Latency | |
| Getac S410 G5 | |
| Durchschnittliche Intel Core i5-1350P (n=1) | |
| Panasonic Toughbook 40 | |
| Dell Latitude 7330 Rugged Extreme | |
| Getac S410 Gen 4 | |
| Durabook S14I | |
| Dell Latitude 14 5420-D2G5W | |
* ... kleinere Werte sind besser
DPC-Latenzzeit
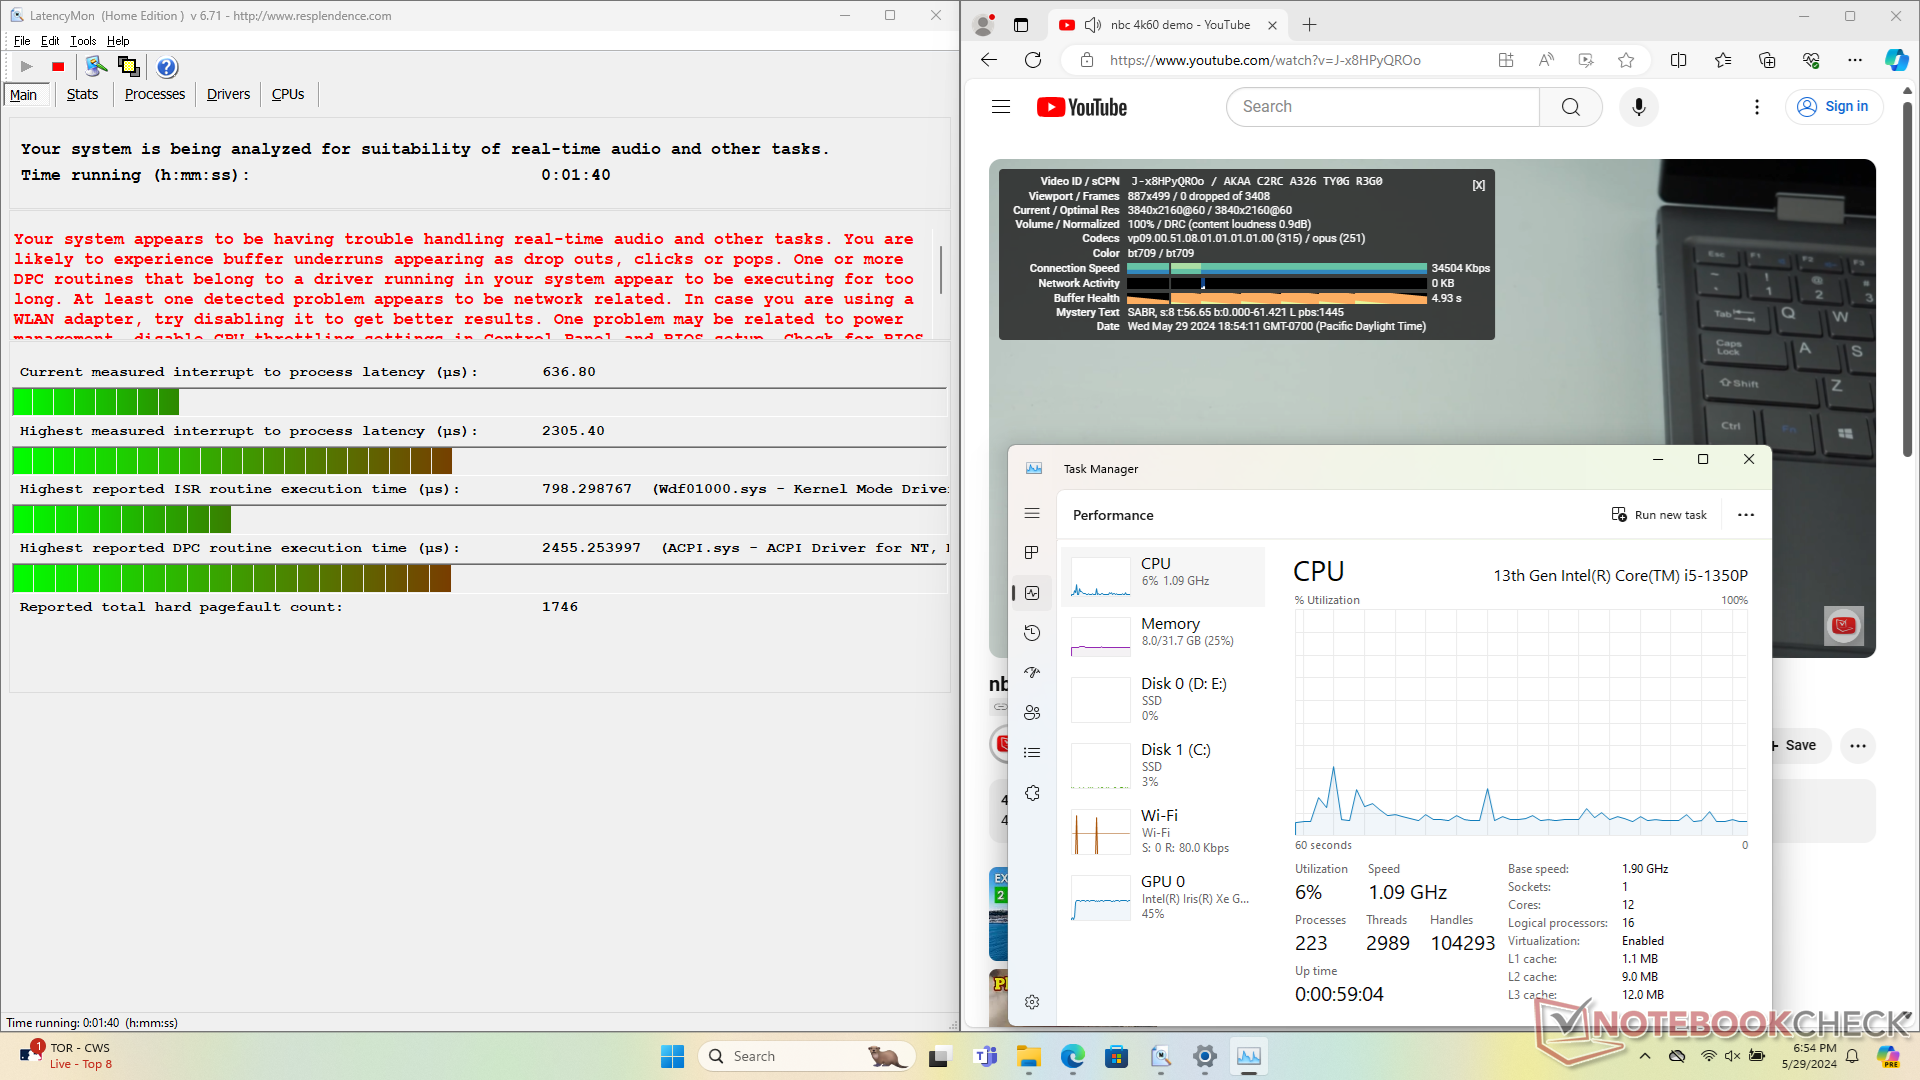
Es gibt leichte DPC-Probleme beim Öffnen mehrerer Browser Tabs unserer Homepage. Die 4K-Videowiedergabe bei 60 fps ist ansonsten perfekt, und es werden keine übersprungenen Bilder aufgezeichnet.

| DPC Latencies / LatencyMon - interrupt to process latency (max), Web, Youtube, Prime95 | |
| Dell Latitude 14 5420-D2G5W | |
| Getac S410 G5 | |
| Durabook S14I | |
| Getac S410 Gen 4 | |
| Panasonic Toughbook 40 | |
| Dell Latitude 7330 Rugged Extreme | |
* ... kleinere Werte sind besser
Speichergeräte
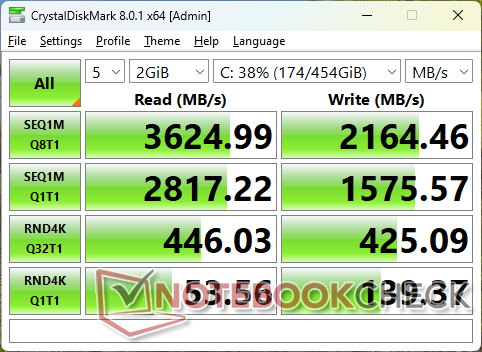
Unser Testgerät wird mit dem SSSTC CL4-8D512 ausgeliefert, während die ältere S410 G4 mit der SSSTC CA5-8D256 bestückt wurde. Das neuere Laufwerk ist in jeder Hinsicht etwas schneller, aber es leidet immer noch unter etwas längeren Zugriffszeiten als die meisten anderen Laufwerke.


| Drive Performance Rating - Percent | |
| Dell Latitude 7330 Rugged Extreme | |
| Getac S410 G5 | |
| Durabook S14I | |
| Panasonic Toughbook 40 | |
| Dell Latitude 14 5420-D2G5W | |
| Getac S410 Gen 4 | |
* ... kleinere Werte sind besser
Disk Throttling: DiskSpd Read Loop, Queue Depth 8
GPU Performance - wieder einmal Iris Xe
Tiger Lake-U und Raptor Lake-P verwenden dieselbe Iris-Xe-Architektur, so dass die Leistungssteigerungen zwischen dem S410 G4 und dem S410 G5 minimal sind. Die Iris Xe Grafik G7 80 EUs in unserem Gerät ist nur etwa 10 Prozent schneller als die Iris Xe Graphics G7 96 EUs im letztjährigen Modell. Dieser geringfügige Vorteil wird sich bei den allermeisten Anwendungen nicht bemerkbar machen.
| Leistungsprofil | Grafik-Punktzahl | Physik-Wertung | Kombinierte Bewertung |
| Extrem-Profil | 5.183 | 18.051 | 1.634 |
| Standard-Profil | 5.169 (-0 %) | 17.729 (-2 %) | 1.648 (-0 %) |
| Akku-Leistung | 5.186 (-0 %) | 11.113 (-38 %) | 1.725 (-0 %) |
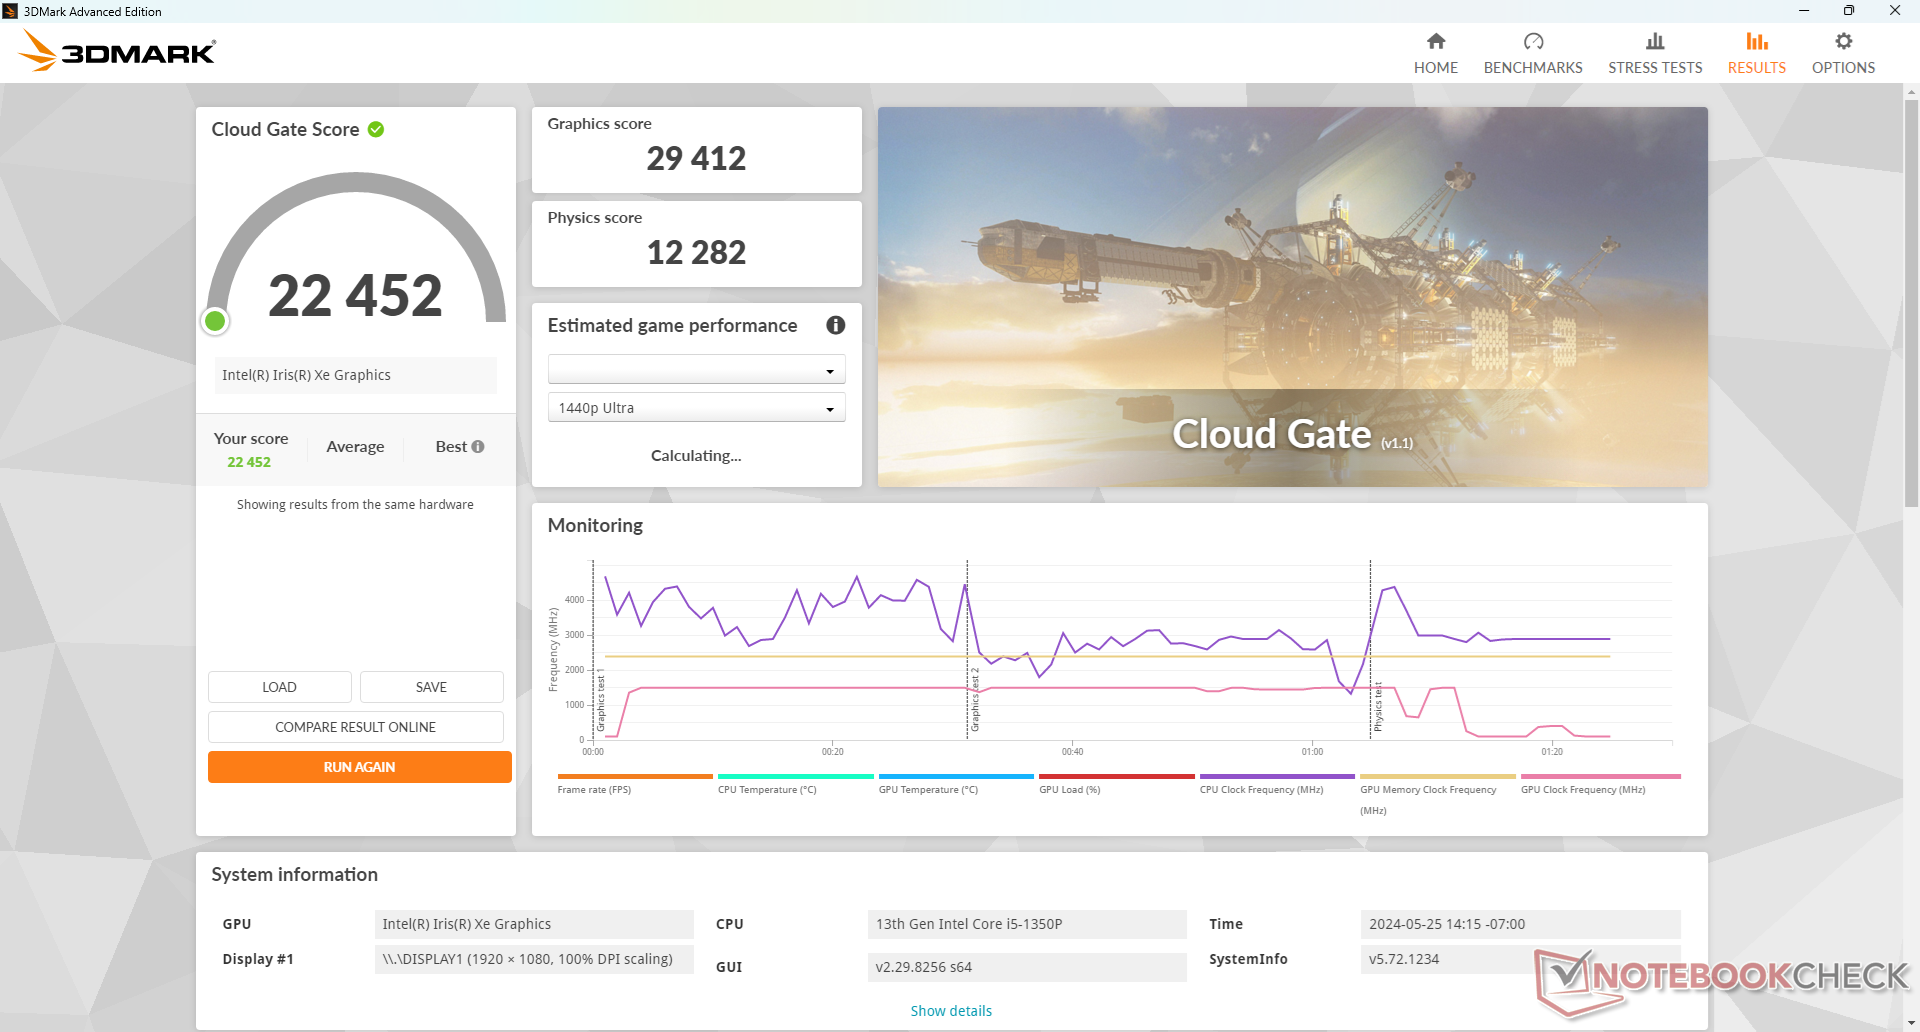
Die Verwendung des extremen Leistungsmodus führt nicht zu einer schnelleren Leistung als der normale Standardleistungsmodus, wie unsere Fire-Strike-Ergebnistabelle oben zeigt. Allerdings wird die CPU-Leistung im Akkubetrieb stark reduziert, was bei einem Einsatz im Freien enttäuschend sein kann.


| 3DMark 11 Performance | 6948 Punkte | |
| 3DMark Cloud Gate Standard Score | 22452 Punkte | |
| 3DMark Fire Strike Score | 4668 Punkte | |
| 3DMark Time Spy Score | 1661 Punkte | |
Hilfe | ||
| Blender - v3.3 Classroom CPU | |
| Getac S410 G5 | |
* ... kleinere Werte sind besser
| Performance Rating - Percent | |
| Getac S410 G5 | |
| Dell Latitude 7330 Rugged Extreme -2! | |
| Getac S410 Gen 4 | |
| Panasonic Toughbook 40 -2! | |
| Durabook S14I -3! | |
| Dell Latitude 14 5420-D2G5W -3! | |
| The Witcher 3 - 1920x1080 Ultra Graphics & Postprocessing (HBAO+) | |
| Getac S410 G5 | |
| Dell Latitude 7330 Rugged Extreme | |
| Panasonic Toughbook 40 | |
| Getac S410 Gen 4 | |
| Dell Latitude 14 5420-D2G5W | |
| GTA V - 1920x1080 Highest AA:4xMSAA + FX AF:16x | |
| Getac S410 G5 | |
| Getac S410 Gen 4 | |
| Final Fantasy XV Benchmark - 1920x1080 High Quality | |
| Dell Latitude 7330 Rugged Extreme | |
| Getac S410 G5 | |
| Panasonic Toughbook 40 | |
| Getac S410 Gen 4 | |
| Durabook S14I | |
| Dell Latitude 14 5420-D2G5W | |
| Strange Brigade - 1920x1080 ultra AA:ultra AF:16 | |
| Getac S410 G5 | |
| Getac S410 Gen 4 | |
| Dota 2 Reborn - 1920x1080 ultra (3/3) best looking | |
| Dell Latitude 7330 Rugged Extreme | |
| Panasonic Toughbook 40 | |
| Getac S410 G5 | |
| Getac S410 Gen 4 | |
| Durabook S14I | |
| X-Plane 11.11 - 1920x1080 high (fps_test=3) | |
| Getac S410 G5 | |
| Getac S410 Gen 4 | |
| Durabook S14I | |
| Panasonic Toughbook 40 | |
| Dell Latitude 14 5420-D2G5W | |
| Dell Latitude 7330 Rugged Extreme | |
| GTA V | |
| 1024x768 Lowest Settings possible | |
| Getac S410 G5 | |
| Durchschnittliche Intel Iris Xe Graphics G7 80EUs (36.5 - 144.6, n=84) | |
| Getac S410 Gen 4 | |
| Dell Latitude 14 5420-D2G5W | |
| 1920x1080 Lowest Settings possible | |
| Getac S410 G5 | |
| Durchschnittliche Intel Iris Xe Graphics G7 80EUs (21.5 - 98.1, n=68) | |
| Getac S410 Gen 4 | |
| 1366x768 Normal/Off AF:4x | |
| Getac S410 G5 | |
| Durchschnittliche Intel Iris Xe Graphics G7 80EUs (28.9 - 133.8, n=87) | |
| Getac S410 Gen 4 | |
| Dell Latitude 14 5420-D2G5W | |
| 1920x1080 Normal/Off AF:4x | |
| Getac S410 G5 | |
| Durchschnittliche Intel Iris Xe Graphics G7 80EUs (18.8 - 97.2, n=68) | |
| Getac S410 Gen 4 | |
| 1920x1080 High/On (Advanced Graphics Off) AA:2xMSAA + FX AF:8x | |
| Getac S410 G5 | |
| Getac S410 Gen 4 | |
| Durchschnittliche Intel Iris Xe Graphics G7 80EUs (7.81 - 32, n=86) | |
| Dell Latitude 14 5420-D2G5W | |
| 1920x1080 Highest AA:4xMSAA + FX AF:16x | |
| Getac S410 G5 | |
| Getac S410 Gen 4 | |
| Durchschnittliche Intel Iris Xe Graphics G7 80EUs (3.07 - 11.6, n=74) | |
| Strange Brigade | |
| 1280x720 lowest AF:1 | |
| Getac S410 G5 | |
| Getac S410 Gen 4 | |
| Durchschnittliche Intel Iris Xe Graphics G7 80EUs (22.7 - 98.7, n=84) | |
| Dell Latitude 14 5420-D2G5W | |
| 1920x1080 medium AA:medium AF:4 | |
| Getac S410 G5 | |
| Getac S410 Gen 4 | |
| Durchschnittliche Intel Iris Xe Graphics G7 80EUs (6 - 48.8, n=86) | |
| Dell Latitude 14 5420-D2G5W | |
| 1920x1080 high AA:high AF:8 | |
| Getac S410 G5 | |
| Getac S410 Gen 4 | |
| Durchschnittliche Intel Iris Xe Graphics G7 80EUs (11.4 - 34, n=83) | |
| Dell Latitude 14 5420-D2G5W | |
| 1920x1080 ultra AA:ultra AF:16 | |
| Getac S410 G5 | |
| Getac S410 Gen 4 | |
| Durchschnittliche Intel Iris Xe Graphics G7 80EUs (13.6 - 27, n=60) | |
Die Bildwiederholraten im Leerlauf auf Witcher 3 sind stabil, bis auf einen Abfall nach 40 Minuten im Test, wo sie auf nur 10 fps abrutschten, was auf eine Unterbrechung der Hintergrundaktivität hindeutet. Dies ist enttäuschend für ein industrielles oder robustes System, bei dem Stabilität von größter Bedeutung ist und Hintergrundanwendungen keine Priorität haben sollten.
Witcher 3 FPS Chart
| min. | mittel | hoch | max. | |
|---|---|---|---|---|
| GTA V (2015) | 101.8 | 94.6 | 22.5 | 9.58 |
| The Witcher 3 (2015) | 79.9 | 56.3 | 31.5 | 28 |
| Dota 2 Reborn (2015) | 94.8 | 71.3 | 55.8 | 49.5 |
| Final Fantasy XV Benchmark (2018) | 40.4 | 22 | 15.8 | |
| X-Plane 11.11 (2018) | 47.6 | 36.1 | 32.7 | |
| Strange Brigade (2018) | 86.2 | 38.9 | 31 | 25.1 |
Emissionen
Systemgeräusch - hochfrequentes Gebläse
Das Geräuschverhalten des Lüfters ist weitgehend dasselbe wie zuvor bei einem ähnlichen Boden und einer ähnlichen Decke. Am enttäuschendsten ist, dass das relativ hohe Lüftergeräusch bestehen bleibt, was den Lüfter während der Nutzung auffälliger macht, als es sein müsste.

Lautstärkediagramm
| Idle |
| 23.4 / 25.9 / 26 dB(A) |
| Last |
| 38.7 / 42.1 dB(A) |
 | ||
30 dB leise 40 dB(A) deutlich hörbar 50 dB(A) störend |
||
min: | ||
| Getac S410 G5 Iris Xe G7 80EUs, i5-1350P, SSSTC CL4-8D512 | Getac S410 Gen 4 Iris Xe G7 96EUs, i7-1185G7, SSSTC CA5-8D256 | Durabook S14I Iris Xe G7 96EUs, i7-1165G7, UDinfo M2P M2P80DE512GBAEP | Dell Latitude 14 5420-D2G5W Iris Xe G7 80EUs, i5-1135G7, WDC PC SN530 SDBPTPZ-256G | Dell Latitude 7330 Rugged Extreme Iris Xe G7 96EUs, i7-1185G7 | Panasonic Toughbook 40 Iris Xe G7 96EUs, i7-1185G7, Samsung PM991 MZVLQ1T0HALB | |
|---|---|---|---|---|---|---|
| Geräuschentwicklung | -2% | -4% | -4% | 13% | 1% | |
| aus / Umgebung * (dB) | 23.4 | 23.3 -0% | 25.2 -8% | 25 -7% | 22.9 2% | 22.8 3% |
| Idle min * (dB) | 23.4 | 23.5 -0% | 25.2 -8% | 25 -7% | 23.1 1% | 26 -11% |
| Idle avg * (dB) | 25.9 | 23.5 9% | 25.2 3% | 25 3% | 23.1 11% | 26 -0% |
| Idle max * (dB) | 26 | 28 -8% | 34.5 -33% | 25 4% | 23.1 11% | 26 -0% |
| Last avg * (dB) | 38.7 | 42.8 -11% | 34.5 11% | 36.5 6% | 28 28% | 37.6 3% |
| Witcher 3 ultra * (dB) | 42.1 | 42.3 -0% | 31.2 26% | 37.8 10% | ||
| Last max * (dB) | 42.1 | 42.6 -1% | 36.2 14% | 52.4 -24% | 36.2 14% | 40.3 4% |
* ... kleinere Werte sind besser
Temperatur
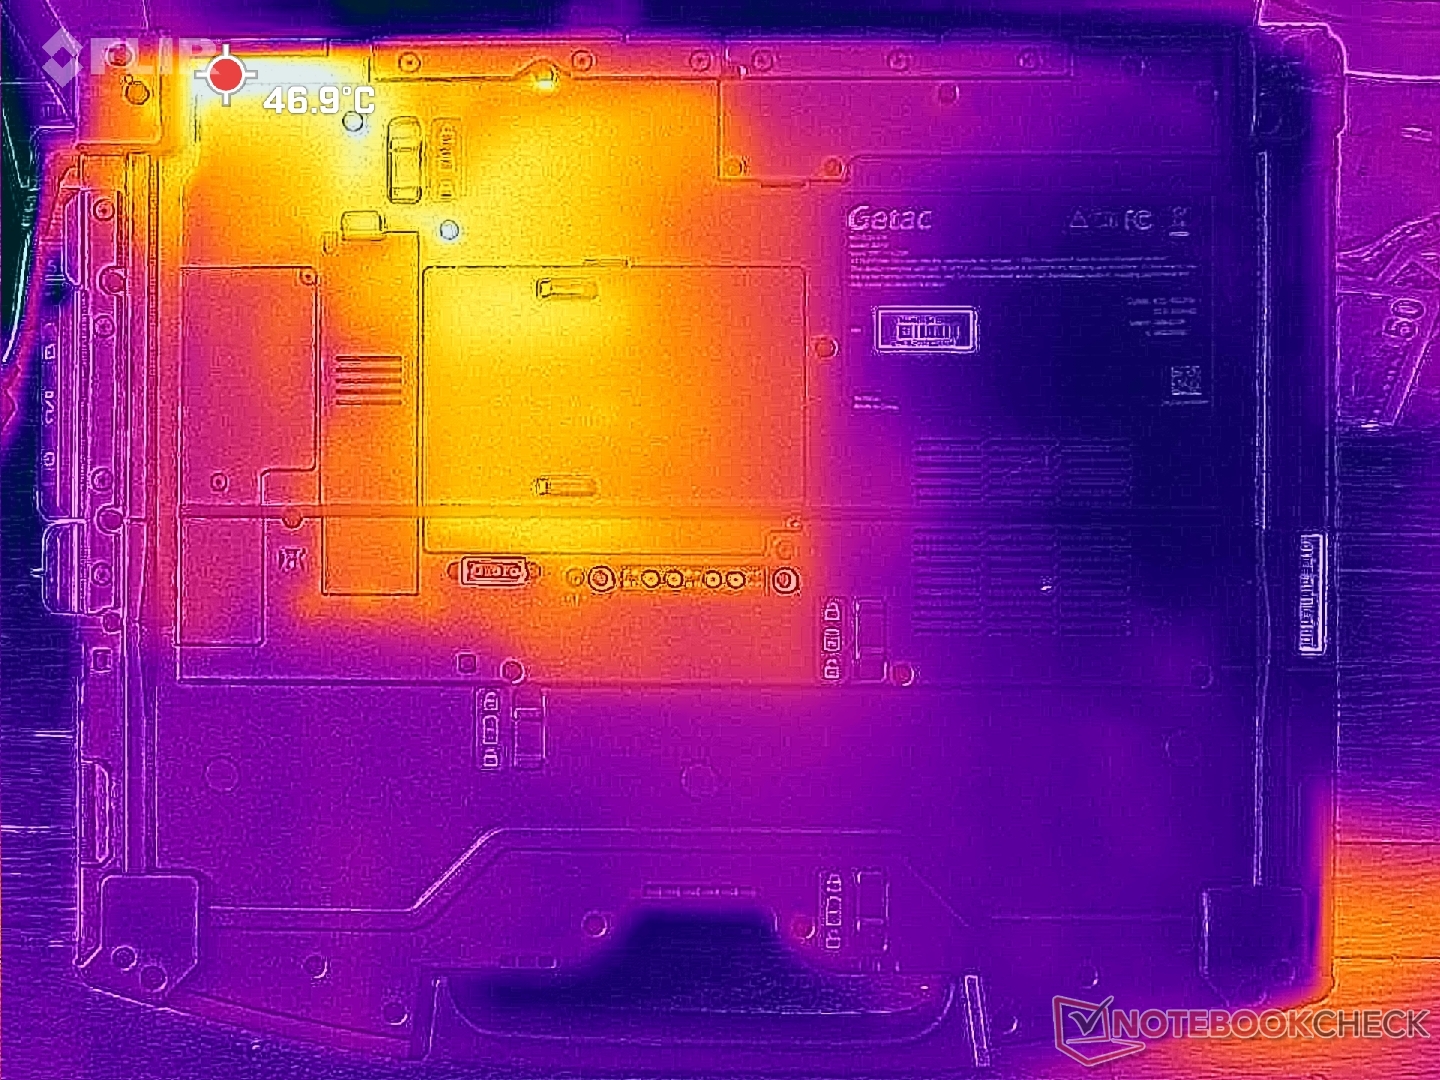
Die Oberflächentemperaturen sind auf der rechten Hälfte des Gehäuses wärmer als auf der linken. Heiße Stellen können 36 ˚C und 47 ˚C auf der C- bzw. D-Abdeckung des Laptops erreichen, aber diese Bereiche konzentrieren sich auf die Rückseite, wo es unwahrscheinlich ist, dass Finger oder Haut sie berühren.

(+) Die maximale Temperatur auf der Oberseite ist 37 °C. Im Vergleich liegt der Klassendurchschnitt bei 34.3 °C (von 21.2 bis 62.5 °C für die Klasse Office).
(±) Auf der Unterseite messen wir eine maximalen Wert von 42.2 °C (im Vergleich zum Durchschnitt von 36.8 °C).
(+) Ohne Last messen wir eine durchschnittliche Temperatur von 25.6 °C auf der Oberseite. Der Klassendurchschnitt erreicht 29.5 °C.
(+) Die Handballen und der Touchpad-Bereich sind mit gemessenen 26.8 °C kühler als die typische Hauttemperatur und fühlen sich dadurch kühl an.
(±) Die durchschnittliche Handballen-Temperatur anderer getesteter Geräte war 27.6 °C (+0.8 °C).


| Getac S410 G5 Intel Core i5-1350P, Intel Iris Xe Graphics G7 80EUs | Getac S410 Gen 4 Intel Core i7-1185G7, Intel Iris Xe Graphics G7 96EUs | Durabook S14I Intel Core i7-1165G7, Intel Iris Xe Graphics G7 96EUs | Dell Latitude 14 5420-D2G5W Intel Core i5-1135G7, Intel Iris Xe Graphics G7 80EUs | Dell Latitude 7330 Rugged Extreme Intel Core i7-1185G7, Intel Iris Xe Graphics G7 96EUs | Panasonic Toughbook 40 Intel Core i7-1185G7, Intel Iris Xe Graphics G7 96EUs | |
|---|---|---|---|---|---|---|
| Hitze | -7% | -1% | 2% | 14% | 5% | |
| Last oben max * (°C) | 37 | 36 3% | 36.4 2% | 41.7 -13% | 34.6 6% | 35.6 4% |
| Last unten max * (°C) | 42.2 | 46.8 -11% | 38.6 9% | 35.6 16% | 36.6 13% | 40 5% |
| Idle oben max * (°C) | 28.8 | 30 -4% | 32.6 -13% | 29.9 -4% | 24.8 14% | 28.6 1% |
| Idle unten max * (°C) | 33 | 38.2 -16% | 33.8 -2% | 29.7 10% | 25.2 24% | 29.4 11% |
* ... kleinere Werte sind besser
Stresstest
Die Kerntemperatur unter Last ist ein paar Grad kühler als beim S410 G4 des letzten Jahres. Bei der Ausführung von Prime95 Stress, erhöht sich die CPU auf 3,1 GHz, 53 W und 97 ˚C, bis sie nach einer Minute des Tests aufgrund der begrenzten Nachhaltigkeit des Turbo Boosts auf 1,9 GHz, 88 ˚C und 29 W sinkt. Die Kerntemperatur ist auch bei der Ausführung von Witcher 3 ähnlich, während sich die CPU des S410 G4 deutlich über 90 °C stabilisiert.

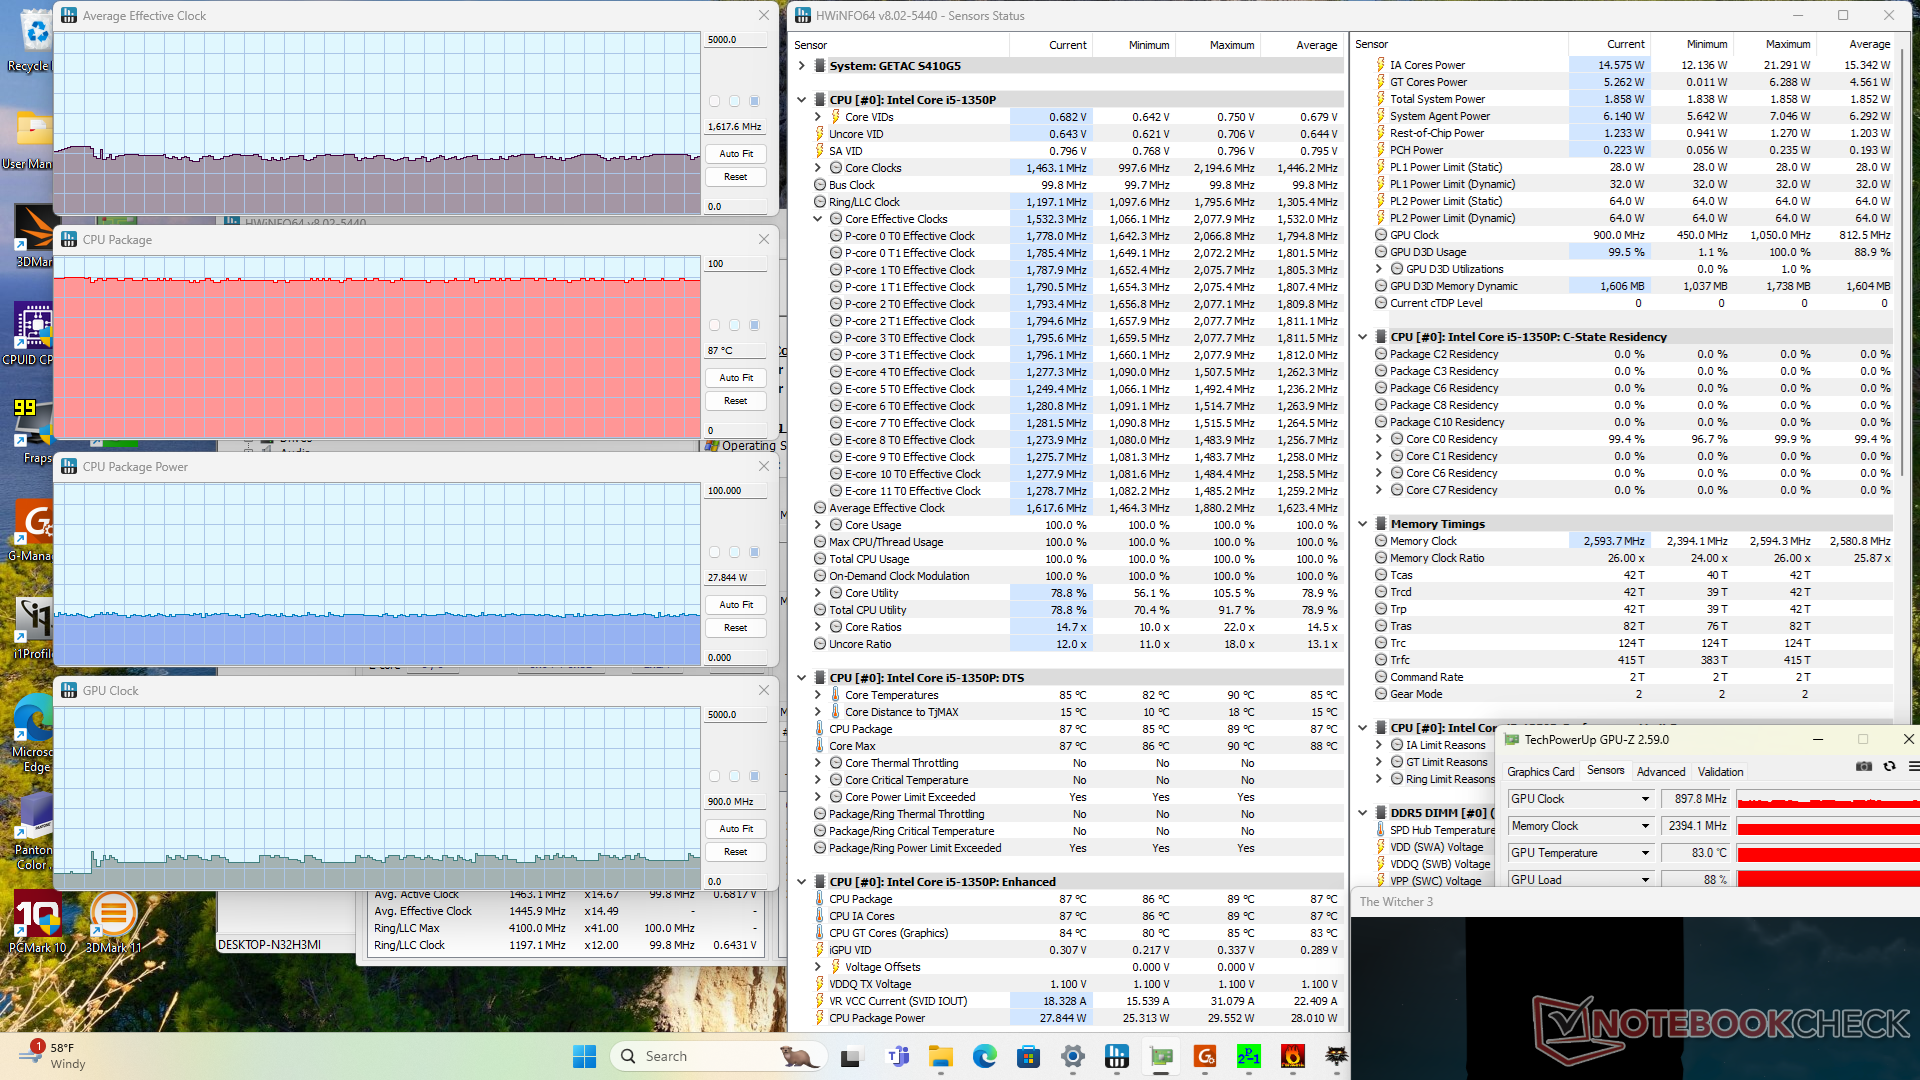

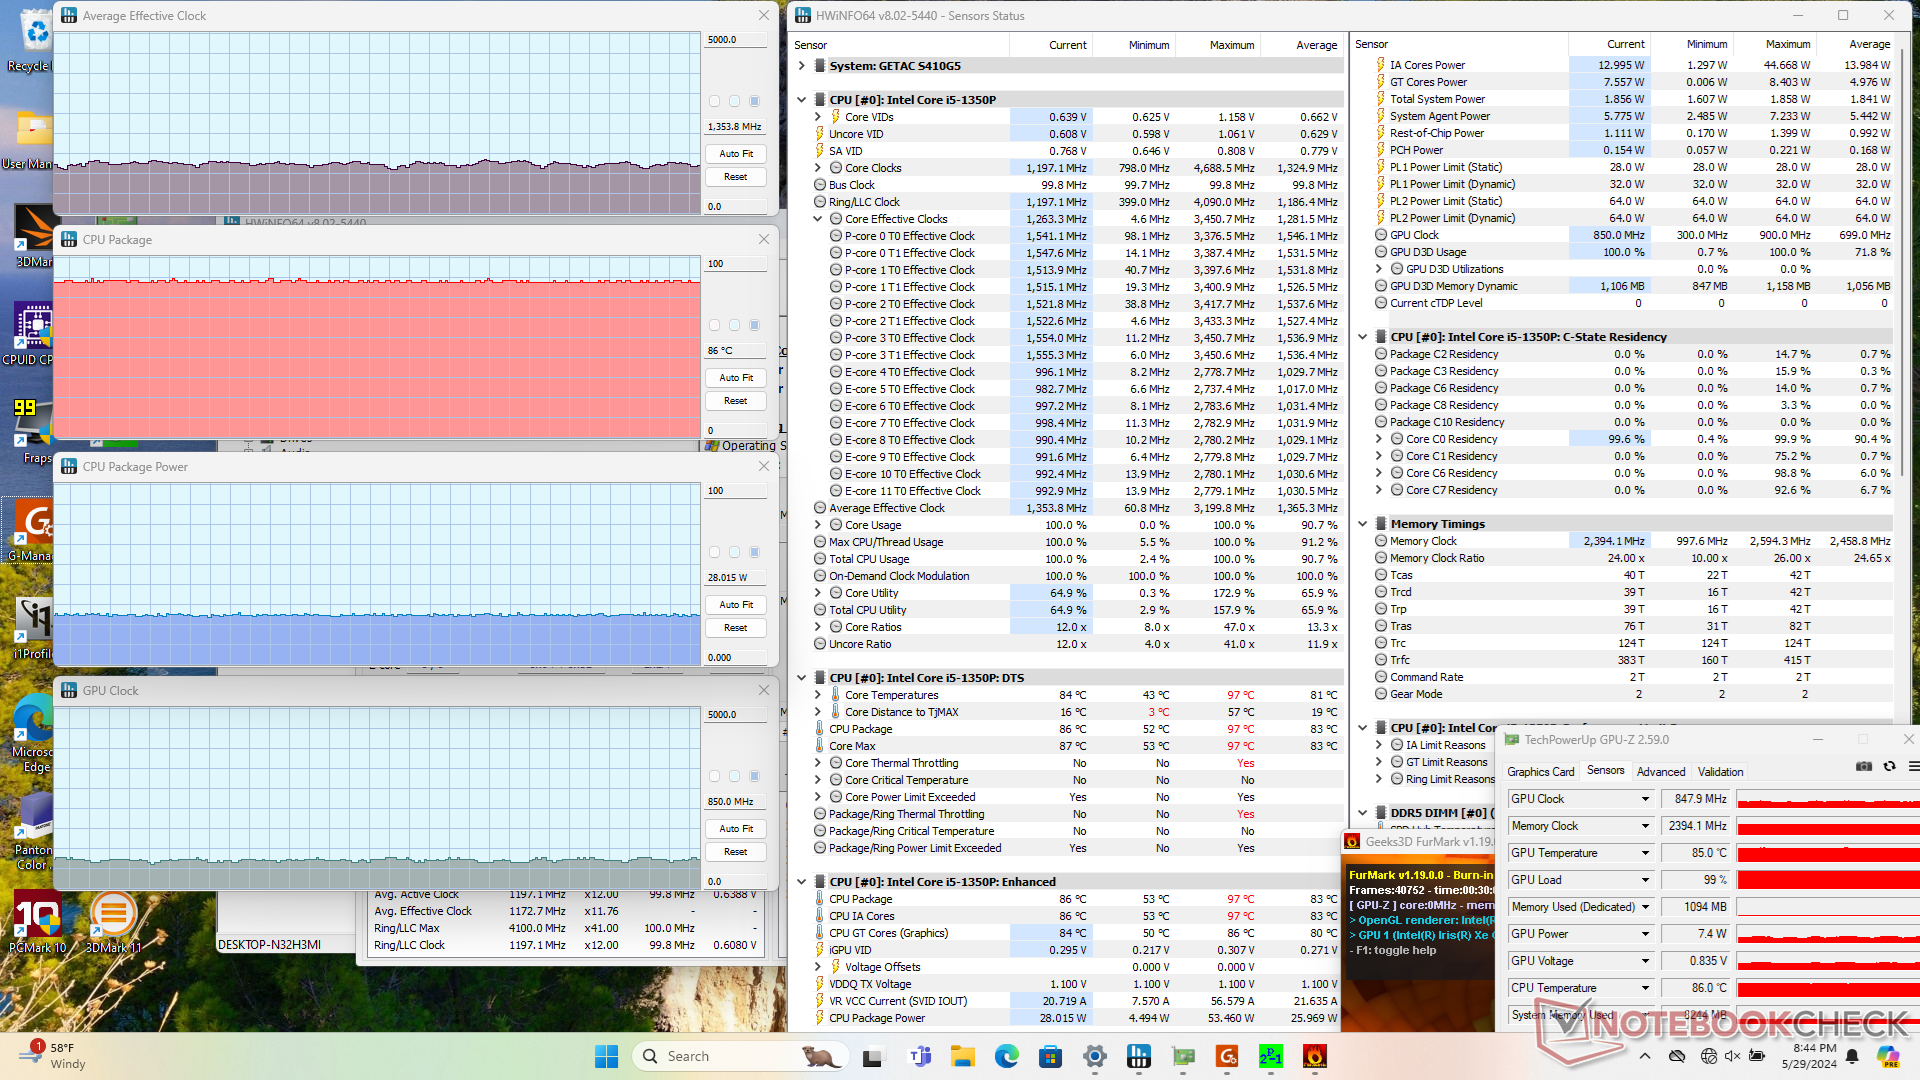
| durchschnittlicher CPU-Takt (GHz) | GPU-Takt (MHz) | durchschnittliche CPU-Temperatur (°C) | |
| System Leerlauf | -- | -- | 56 |
| Prime95, Stress | 1,9 | -- | 88 |
| Prime95 + FurMark, Stress | 1,2 - 1,5 | 850 | 86 |
| Witcher 3, Stress | 1,6 | 900 | 87 |
Lautsprecher
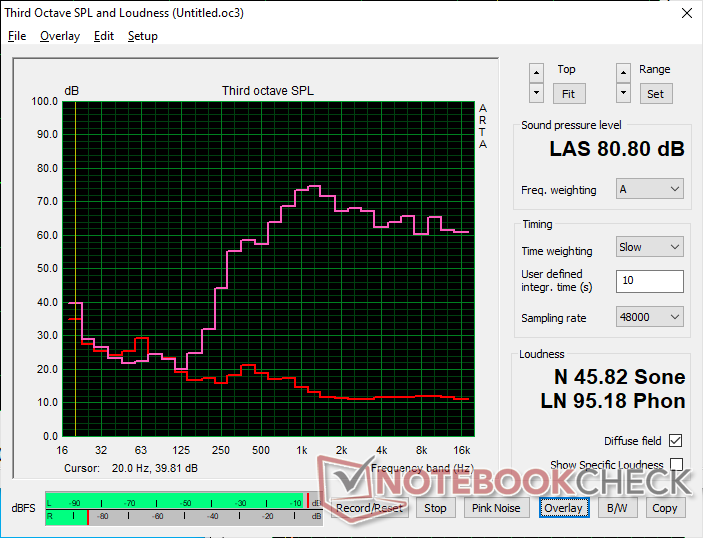
Getac S410 G5 Audio Analyse
(±) | Mittelmäßig laut spielende Lautsprecher (80.8 dB)
Bass 100 - 315 Hz
(-) | kaum Bass - 29.2% niedriger als der Median
(±) | durchschnittlich lineare Bass-Wiedergabe (13.4% Delta zum Vorgänger)
Mitteltöne 400 - 2000 Hz
(±) | zu hohe Mitten, vom Median 6.7% abweichend
(±) | Linearität der Mitten ist durchschnittlich (7.5% Delta zum Vorgänger)
Hochtöne 2 - 16 kHz
(+) | ausgeglichene Hochtöne, vom Median nur 2.9% abweichend
(+) | sehr lineare Hochtöne (6% Delta zum Vorgänger)
Gesamt im hörbaren Bereich 100 - 16.000 Hz
(±) | hörbarer Bereich ist durchschnittlich linear (23.3% Abstand zum Median)
Im Vergleich zu allen Geräten derselben Klasse
» 66% aller getesteten Geräte dieser Klasse waren besser, 7% vergleichbar, 27% schlechter
» Das beste Gerät hat einen Delta-Wert von 7%, durchschnittlich ist 21%, das schlechteste Gerät hat 53%
Im Vergleich zu allen Geräten im Test
» 70% aller getesteten Geräte waren besser, 5% vergleichbar, 25% schlechter
» Das beste Gerät hat einen Delta-Wert von 4%, durchschnittlich ist 23%, das schlechteste Gerät hat 134%
Apple MacBook Pro 16 2021 M1 Pro Audio Analyse
(+) | Die Lautsprecher können relativ laut spielen (84.7 dB)
Bass 100 - 315 Hz
(+) | guter Bass - nur 3.8% Abweichung vom Median
(+) | lineare Bass-Wiedergabe (5.2% Delta zum Vorgänger)
Mitteltöne 400 - 2000 Hz
(+) | ausgeglichene Mitten, vom Median nur 1.3% abweichend
(+) | lineare Mitten (2.1% Delta zum Vorgänger)
Hochtöne 2 - 16 kHz
(+) | ausgeglichene Hochtöne, vom Median nur 1.9% abweichend
(+) | sehr lineare Hochtöne (2.7% Delta zum Vorgänger)
Gesamt im hörbaren Bereich 100 - 16.000 Hz
(+) | hörbarer Bereich ist sehr linear (4.6% Abstand zum Median
Im Vergleich zu allen Geräten derselben Klasse
» 0% aller getesteten Geräte dieser Klasse waren besser, 0% vergleichbar, 100% schlechter
» Das beste Gerät hat einen Delta-Wert von 5%, durchschnittlich ist 17%, das schlechteste Gerät hat 45%
Im Vergleich zu allen Geräten im Test
» 0% aller getesteten Geräte waren besser, 0% vergleichbar, 100% schlechter
» Das beste Gerät hat einen Delta-Wert von 4%, durchschnittlich ist 23%, das schlechteste Gerät hat 134%
Energieverwaltung
Stromverbrauch
Der Stromverbrauch ist mit dem des S410 G4 vergleichbar, allerdings mit einer bemerkenswerten Ausnahme, welche die CPU betrifft. Der neue Core i5-1350P ist, wie oben erwähnt, deutlich schneller als der Core i7-1185G7, aber dies wird durch einen höheren Stromverbrauch erkauft, insbesondere wenn der Turbo Boost aktiviert ist. Zum Beispiel kann der Verbrauch in den ersten Sekunden des Prime95 Stress, wenn der Turbo Boost am schnellsten ist, bis zu 102 W betragen, verglichen mit nur 73 W bei der S410 G4. Dennoch ist die Leistung pro Watt bei der neueren CPU vor und nach der Drosselung immer noch besser.
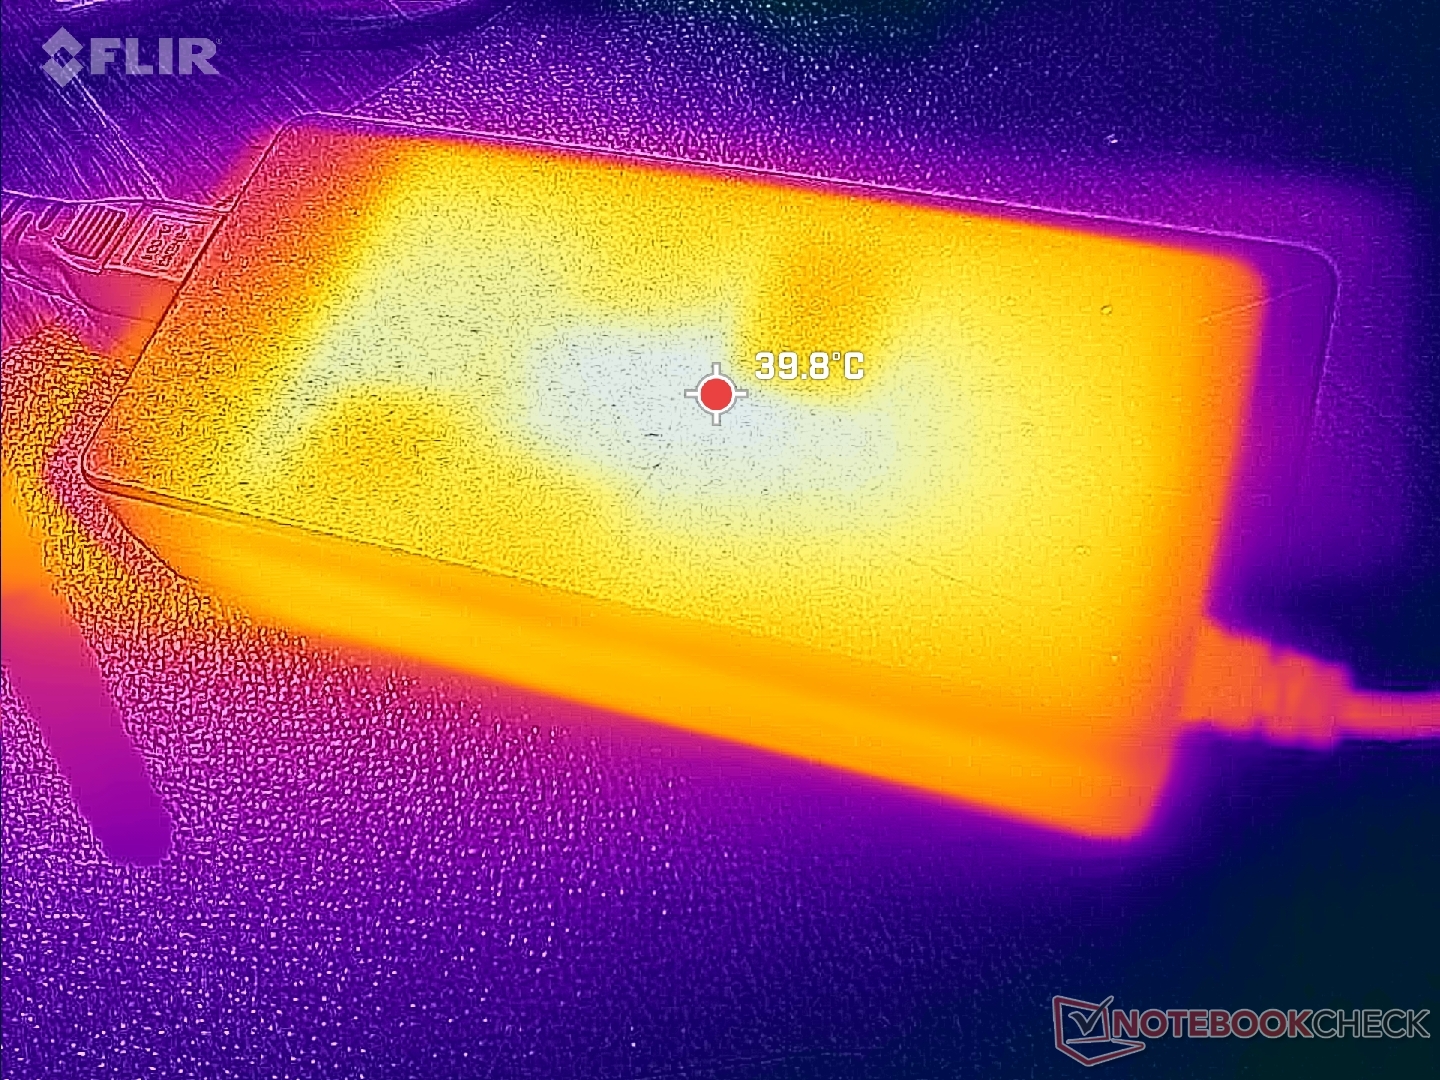
Das Modell wird mit demselben 90-Watt-Netzteil geliefert wie zuvor.


| Aus / Standby | |
| Idle | |
| Last |
|
Legende:
min: | |
| Getac S410 G5 i5-1350P, Iris Xe G7 80EUs, SSSTC CL4-8D512, IPS, 1920x1080, 14" | Getac S410 Gen 4 i7-1185G7, Iris Xe G7 96EUs, SSSTC CA5-8D256, IPS, 1920x1080, 14" | Durabook S14I i7-1165G7, Iris Xe G7 96EUs, UDinfo M2P M2P80DE512GBAEP, TN, 1920x1080, 14" | Dell Latitude 14 5420-D2G5W i5-1135G7, Iris Xe G7 80EUs, WDC PC SN530 SDBPTPZ-256G, IPS, 1920x1080, 14" | Dell Latitude 7330 Rugged Extreme i7-1185G7, Iris Xe G7 96EUs, , IPS, 1920x1080, 13.3" | Panasonic Toughbook 40 i7-1185G7, Iris Xe G7 96EUs, Samsung PM991 MZVLQ1T0HALB, IPS, 1920x1080, 14" | |
|---|---|---|---|---|---|---|
| Stromverbrauch | 10% | 11% | 44% | 23% | 18% | |
| Idle min * (Watt) | 7.9 | 8.3 -5% | 6.8 14% | 3.4 57% | 4.1 48% | 4.9 38% |
| Idle avg * (Watt) | 14.4 | 10.5 27% | 16.4 -14% | 7.1 51% | 11.7 19% | 12.3 15% |
| Idle max * (Watt) | 15.2 | 14.9 2% | 16.9 -11% | 8.4 45% | 11.8 22% | 14 8% |
| Last avg * (Watt) | 58.4 | 48.6 17% | 39.2 33% | 35.3 40% | 48.5 17% | 54 8% |
| Witcher 3 ultra * (Watt) | 53.7 | 50.9 5% | 35.4 34% | 44.3 18% | 46.3 14% | |
| Last max * (Watt) | 106.5 | 90.1 15% | 73.1 31% | 67 37% | 91 15% | 83.6 22% |
* ... kleinere Werte sind besser
Power Consumption Witcher 3 / Stresstest
Power Consumption external Monitor
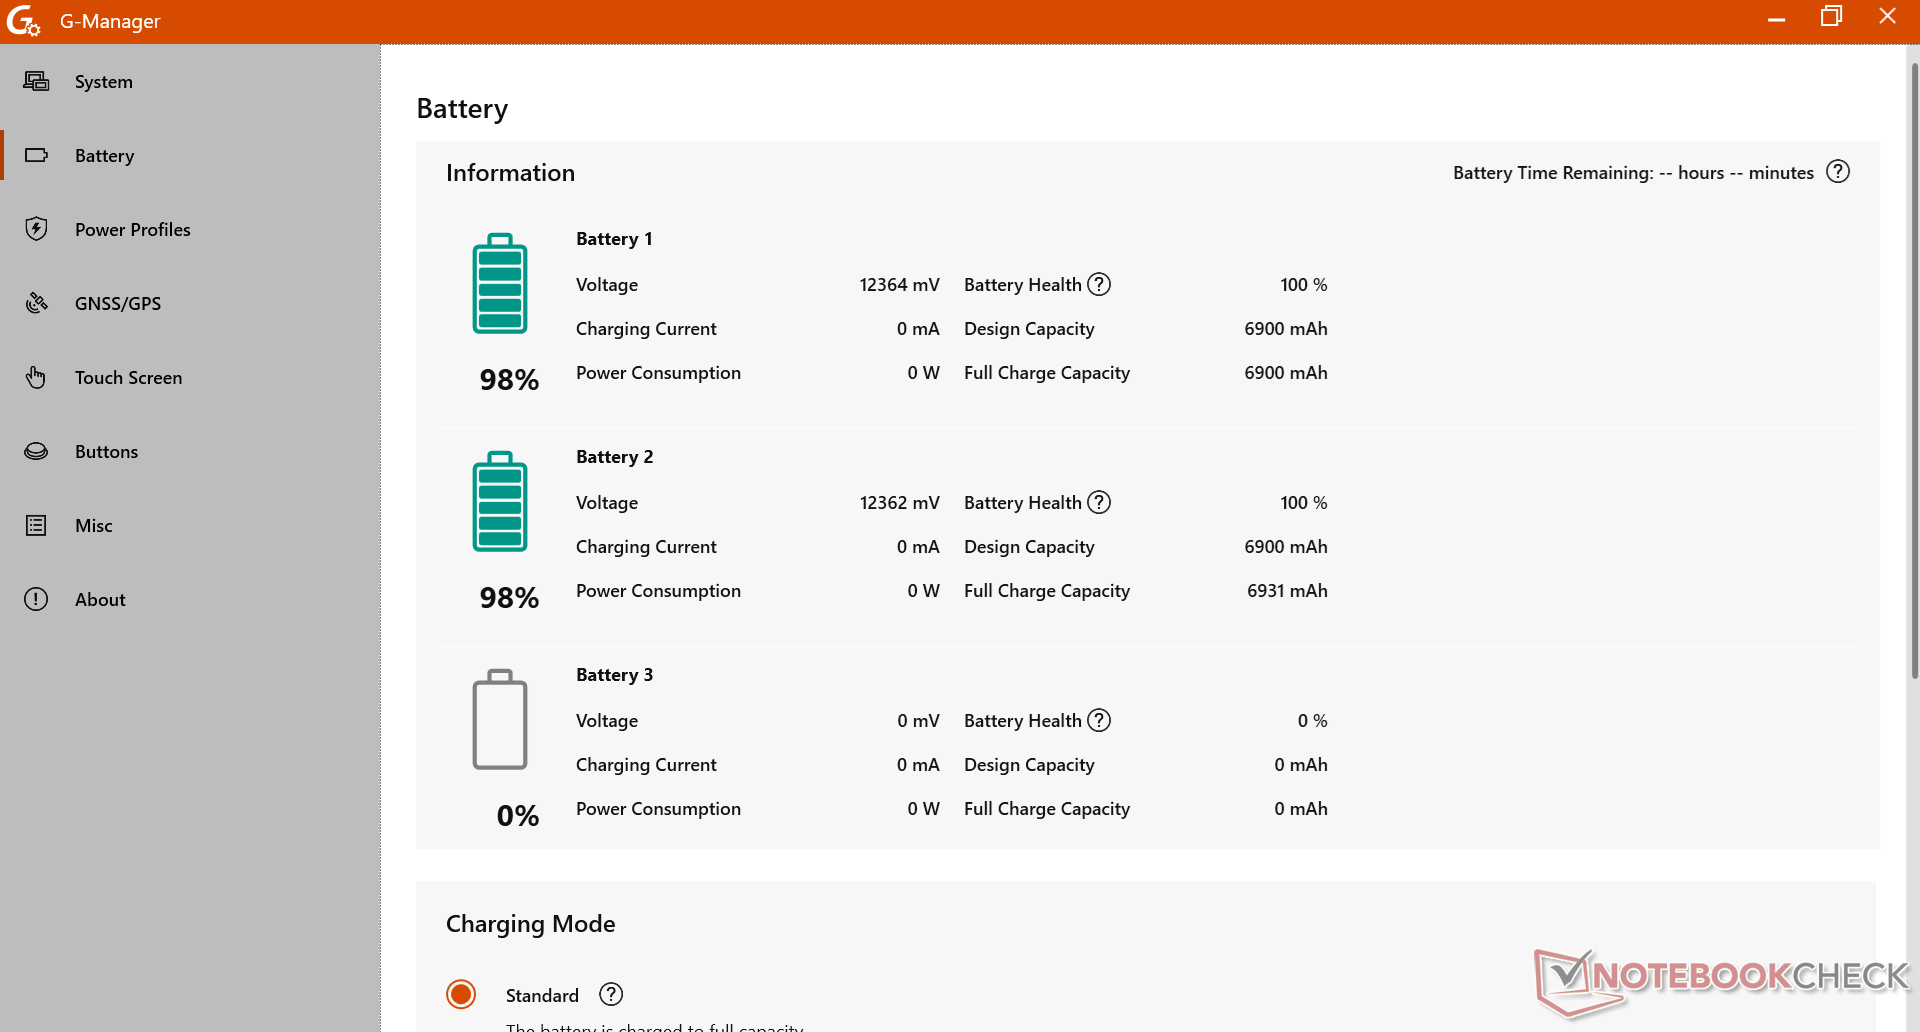
Akkulaufzeit
Unser S410-G5-Testgerät verfügt im Gegensatz zu unserem S410-G4-Gerät nicht über einen internen Akku, sondern über zwei herausnehmbare 75-Wh-Akkus mit einer Gesamtkapazität von 150 Wh. Die WLAN-Laufzeit ist dennoch deutlich kürzer als beim Vorjahresmodell (17,5 Stunden gegenüber 28,5 Stunden), selbst wenn man die kleinere Gesamtkapazität berücksichtigt. Die Diskrepanz bei der Akkulaufzeit kann größtenteils auf die anspruchsvollere Raptor-Lake-P-CPU zurückgeführt werden, wie bereits im Abschnitt über den Stromverbrauch erwähnt wurde.
| Getac S410 G5 i5-1350P, Iris Xe G7 80EUs, 150 Wh | Getac S410 Gen 4 i7-1185G7, Iris Xe G7 96EUs, 194 Wh | Durabook S14I i7-1165G7, Iris Xe G7 96EUs, 50 Wh | Dell Latitude 14 5420-D2G5W i5-1135G7, Iris Xe G7 80EUs, 63 Wh | Dell Latitude 7330 Rugged Extreme i7-1185G7, Iris Xe G7 96EUs, 107 Wh | Panasonic Toughbook 40 i7-1185G7, Iris Xe G7 96EUs, 136 Wh | |
|---|---|---|---|---|---|---|
| Akkulaufzeit | 63% | -69% | -27% | 3% | 9% | |
| WLAN (h) | 17.5 | 28.6 63% | 5.5 -69% | 12.8 -27% | 18 3% | 19 9% |
| Idle (h) | 22.9 | |||||
| Last (h) | 2.4 |
Pro
Contra
Fazit

Das S410 G5 behält die Kompatibilität mit den Modellen der vorherigen Generation bei, was für industrielle und staatliche Anwendungen wichtig ist. Das geringere Ghosting auf dem Display und die höhere CPU-Leistung sind definitiv die Highlights des neuesten Modells und die Hauptgründe für den Kauf des S410 G5 gegenüber dem älteren S410 G4. Die Akkulaufzeit wird zwar durch die schnellere CPU beeinträchtigt, ist aber immer noch sehr lang, zumal das System mehrere Akkus unterstützen kann. Die höher auflösende Webcam und die Unterstützung von Wi-Fi 6E sind nette Extras.
Das robuste Getac S410 G5 ist dank der neuen 13. CPU-Generation deutlich schneller als zuvor. Einige interne und externe Funktionen bedürfen jedoch einer Aktualisierung, um das Benutzererlebnis zu verbessern.
Wir würden es begrüßen, wenn einige störende Aspekte des Designs in zukünftigen Versionen behoben würden. Ein größerer Lüfter zum Beispiel würde helfen, das Lüftergeräusch zu reduzieren. Die Lautsprecher könnten lauter sein und es wäre gut, wenn die Port-Abdeckungen leichter zu öffnen wären. Die Tasten der Tastatur sind auch nicht sehr zuverlässig, da es möglich ist, eine Taste zu drücken, ohne dass eine Eingabe registriert wird. Diese Nachteile haben sich bei der S410-Serie hartnäckig gehalten, und es wird mit jedem Jahr schwieriger, sie zu ignorieren.
Preis und Verfügbarkeit
Kostenvoranschläge sind erhältlich auf Anfrage auf der offiziellen Getac Website.
Getac S410 G5
- 05.06.2024 v7 (old)
Allen Ngo
Transparenz
Die Auswahl der zu testenden Geräte erfolgt innerhalb der Redaktion. Das vorliegende Testmuster wurde dem Autor vom Hersteller oder einem Shop zu Testzwecken leihweise zur Verfügung gestellt. Eine Einflussnahme des Leihstellers auf den Testbericht gab es nicht, der Hersteller erhielt keine Version des Reviews vor der Veröffentlichung. Es bestand keine Verpflichtung zur Publikation. Als eigenständiges, unabhängiges Unternehmen unterliegt Notebookcheck keiner Diktion von Herstellern, Shops und Verlagen.
So testet Notebookcheck
Pro Jahr werden von Notebookcheck hunderte Laptops und Smartphones unabhängig in von uns standardisierten technischen Verfahren getestet, um eine Vergleichbarkeit aller Testergebnisse zu gewährleisten. Seit rund 20 Jahren entwickeln wir diese Testmethoden kontinuierlich weiter und setzen damit Branchenstandards. In unseren Testlaboren kommt ausschließlich hochwertiges Messequipment in die Hände erfahrener Techniker und Redakteure. Die Tests unterliegen einer mehrstufigen Kontrolle. Unsere komplexe Gesamtbewertung basiert auf hunderten fundierten Messergebnissen und Benchmarks, womit Ihnen Objektivität garantiert ist. Weitere Informationen zu unseren Testmethoden gibt es hier.
Preisvergleich

