Fazit - Leistungsgrenzen verschieben
Da es dieses Jahr keine neuen GeForce GPUs gibt, sind der Arrow Lake Core Ultra 9 290HX Plus und das 1.600p-OLED-Display die einzigen beiden Neuerungen für das Alienware 16 Area-51 von 2026. Die neue CPU ist in der Tat bis zu 25 Prozent schneller als das bisherige Spitzenmodell Core Ultra 9 275HX, aber der Stromverbrauch ist dadurch ebenfalls um bis zu 25 Prozent höher.
Was das Display anbelangt, so ist das Upgrade von IPS auf OLED wohl viel deutlicher als das Upgrade vom Core Ultra 9 auf den Core Ultra 9 Plus. Das OLED-Panel bietet einen deutlich höheren Kontrast, schnellere Reaktionszeiten und besseres HDR, während die Unterstützung für Advanced Optimus, die native QHD+-Auflösung und eine schnelle Bildwiederholfrequenz von 240 Hz erhalten bleiben. Von diesen Vorteilen werden vor allem Spiele und Multimedia profitieren. Leider sind die neuen OLED- und Core-Ultra-9-Plus-CPU-Optionen gebündelt und können nicht getrennt werden, was zu sehr hohen Preisen für diese Konfiguration führt.
Da sich das Gehäuse nicht verändert hat, gelten die meisten unserer Beschwerden über das 2025er Modell auch für das 2026er Modell. Die ohnehin schon warmen Kerntemperaturen sind dieses Mal sogar noch schlimmer, nämlich bis zu 100 °C, wenn es mit dem Core Ultra 9 Plus konfiguriert ist. Unterdessen ist die Akkulaufzeit selbst für ein Gaming-Notebook immer noch recht kurz. Die "Leistung um jeden Preis"-Mentalität ist so stark wie eh und je und steht im Einklang mit dem, wofür die Marke Alienware bekannt ist.
Pro
Contra
Preis und Verfügbarkeit
Dell Deutschland liefert jetzt das 2026 Alienware 16 Area-51 ab 2.799 Euro für die Basiskonfiguration mit Core Ultra 9 275HX und RTX 5070 bis zu 4.549 Euro oder mehr für unsere Konfiguration mit Core Ultra 9 290HX Plus und RTX 5080.
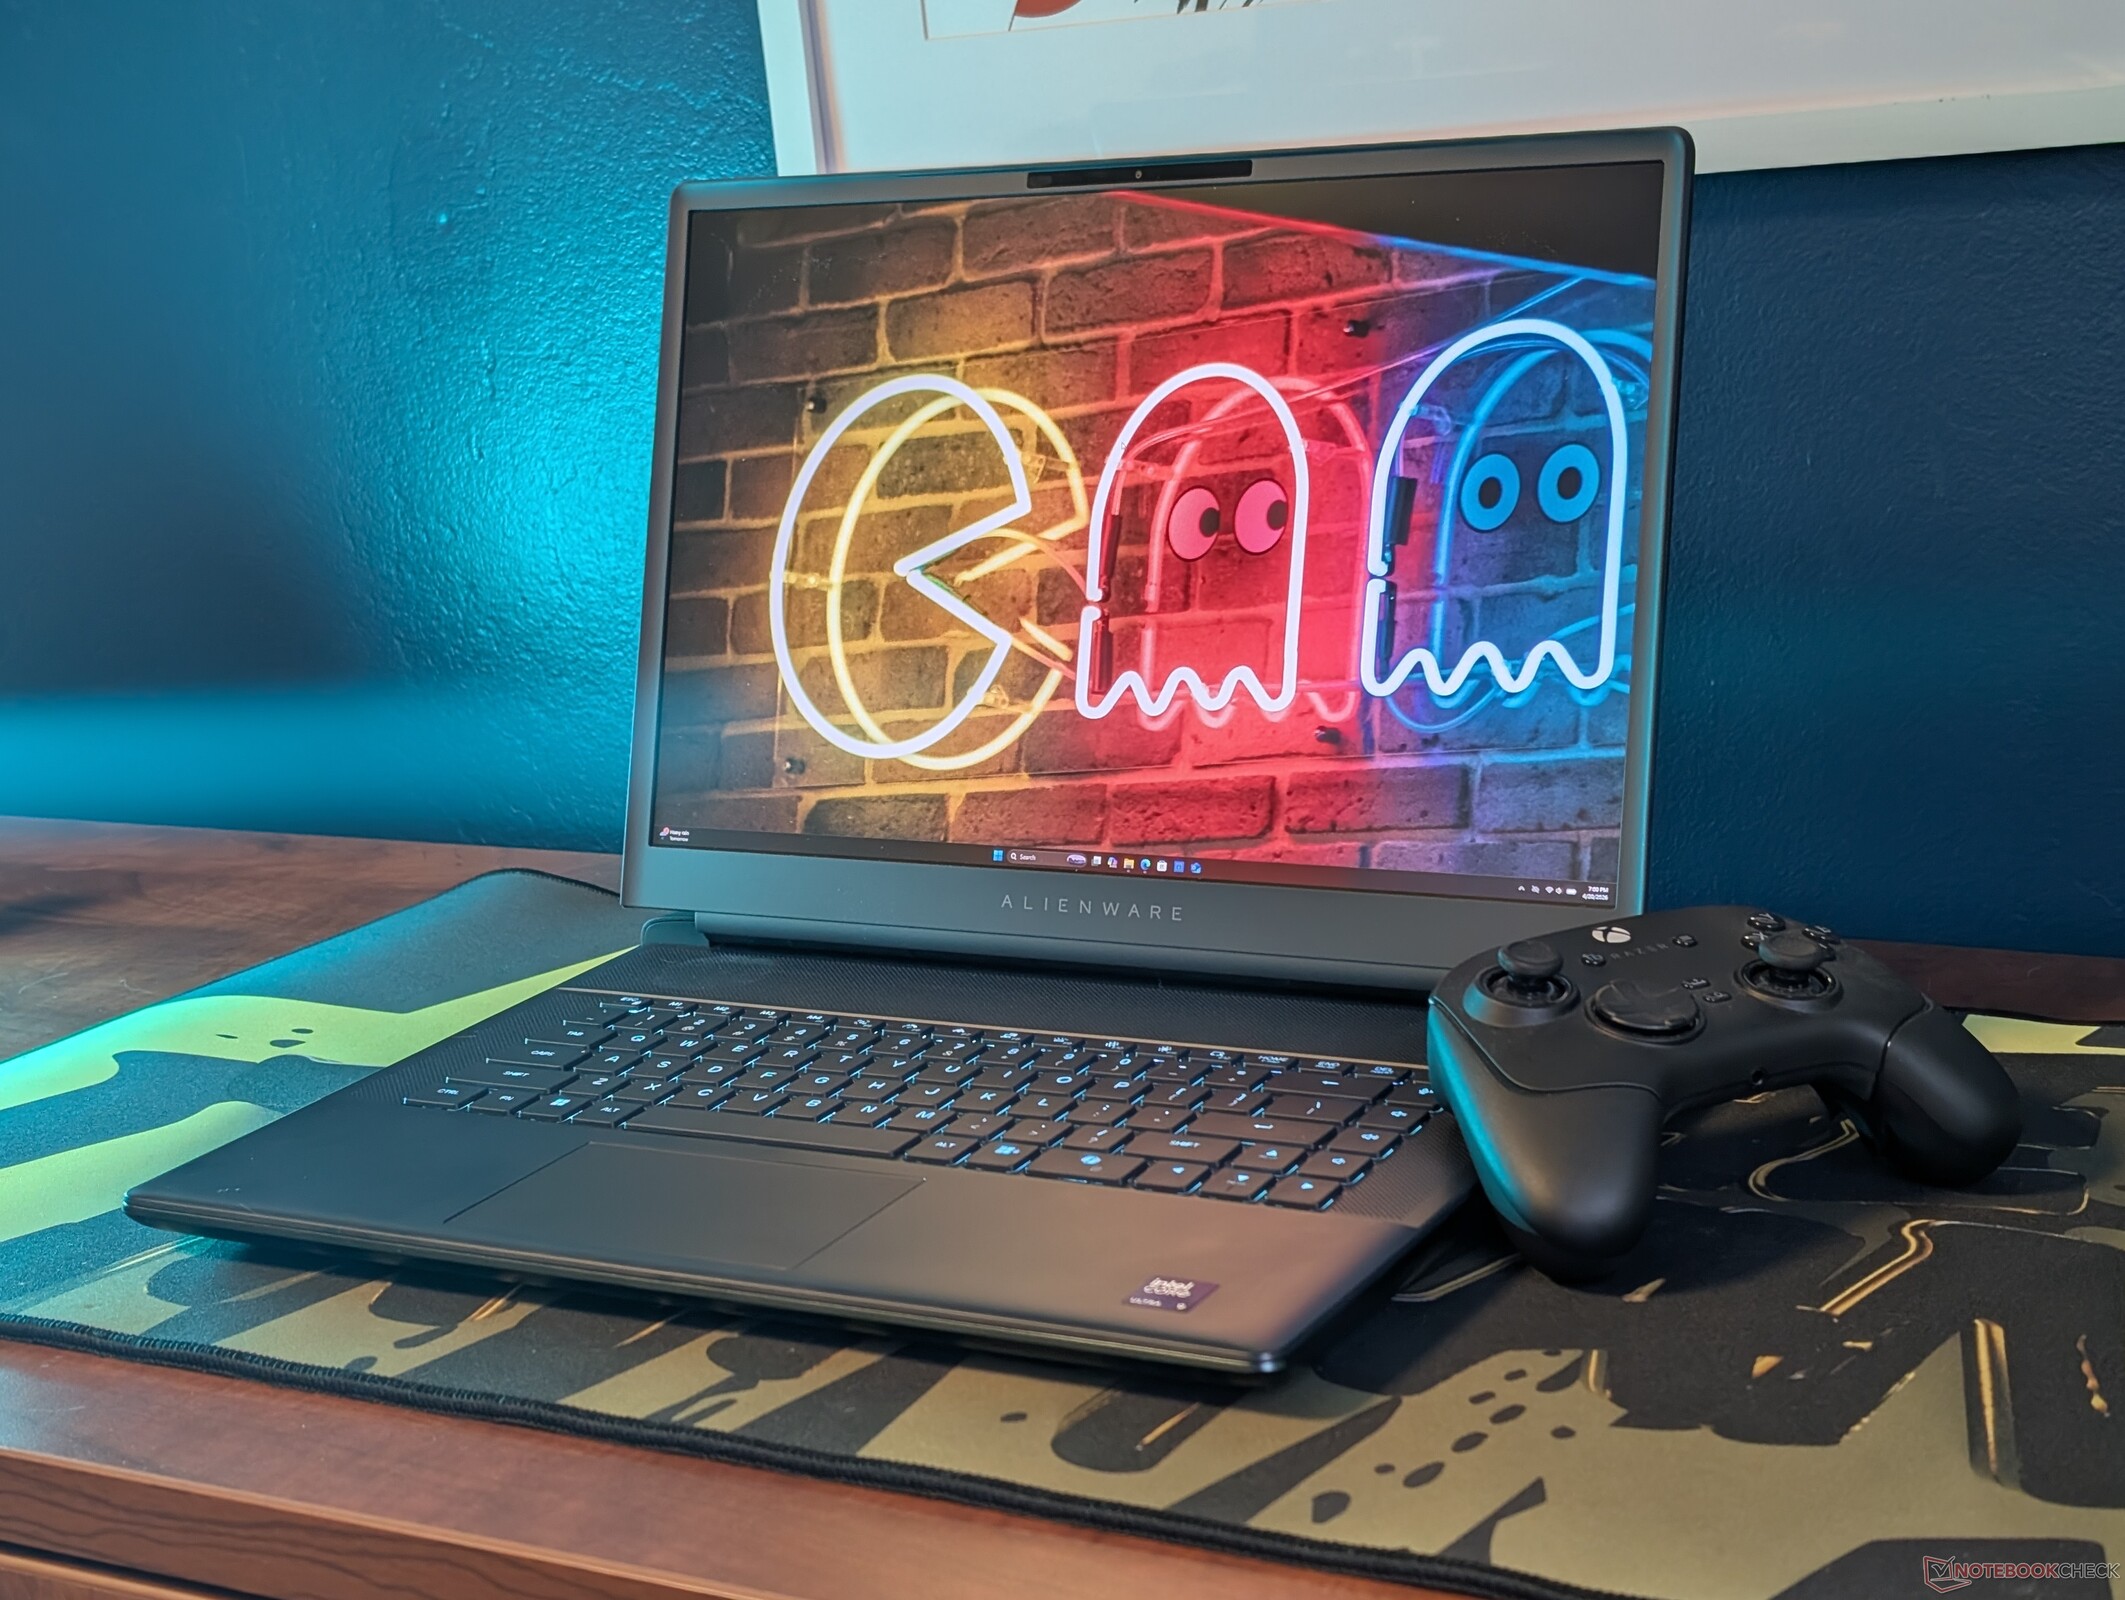
Das Alienware 16 Area-51 feierte letztes Jahr sein Debüt und wurde wohl zu einem der mit Abstand besten Laptops von Alienware. Für das Jahr 2026 erhält das Modell nur kleinere Auffrischungen in Bezug auf die CPU und das Display, da die GeForce-RTX-50-Serie noch keinen Nachfolger hat.
Unser Testgerät ist mit neuen Optionen ausgestattet, die bei der 2025er Version nicht verfügbar sind, darunter die Core-Ultra-9-290HX-Plus-CPU und ein mattes 240-Hz-1.600p-OLED-Panel mit G-Sync für knapp unter 4.000 US-Dollar. Verbessern diese Änderungen das Benutzererlebnis oder rechtfertigen sie den neuen Preis?
Wir empfehlen einen Blick auf unseren Test des 2025 Alienware 16 Area-51, um mehr über die physischen Eigenschaften des Notebooks zu erfahren. Zu den Alternativen zum Dell Modell gehören andere hochwertige 16-Zoll-Gaming-Laptops wie das Asus ROG Zephyrus G16 oder Lenovo Legion Pro 7i 16 Gen 10.
Mehr Alienware Testberichte:
Spezifikationen
Gehäuse

Anschlussausstattung


SD-Kartenleser
| SD Card Reader | |
| average JPG Copy Test (av. of 3 runs) | |
| Alienware 16 Area-51 Core Ultra 9 290HX Plus (Toshiba Exceria Pro SDXC 64 GB UHS-II) | |
| Alienware 16 Area-51 (Toshiba Exceria Pro SDXC 64 GB UHS-II) | |
| Asus ROG Zephyrus G16 GU605CW (AV Pro SD microSD 128 GB V60) | |
| MSI Vector 16 HX AI A2XWHG (AV PRO microSD 128 GB V60) | |
| maximum AS SSD Seq Read Test (1GB) | |
| Alienware 16 Area-51 Core Ultra 9 290HX Plus (Toshiba Exceria Pro SDXC 64 GB UHS-II) | |
| Alienware 16 Area-51 (Toshiba Exceria Pro SDXC 64 GB UHS-II) | |
| MSI Vector 16 HX AI A2XWHG (AV PRO microSD 128 GB V60) | |
| Asus ROG Zephyrus G16 GU605CW (AV Pro SD microSD 128 GB V60) | |
Kommunikation
Webcam


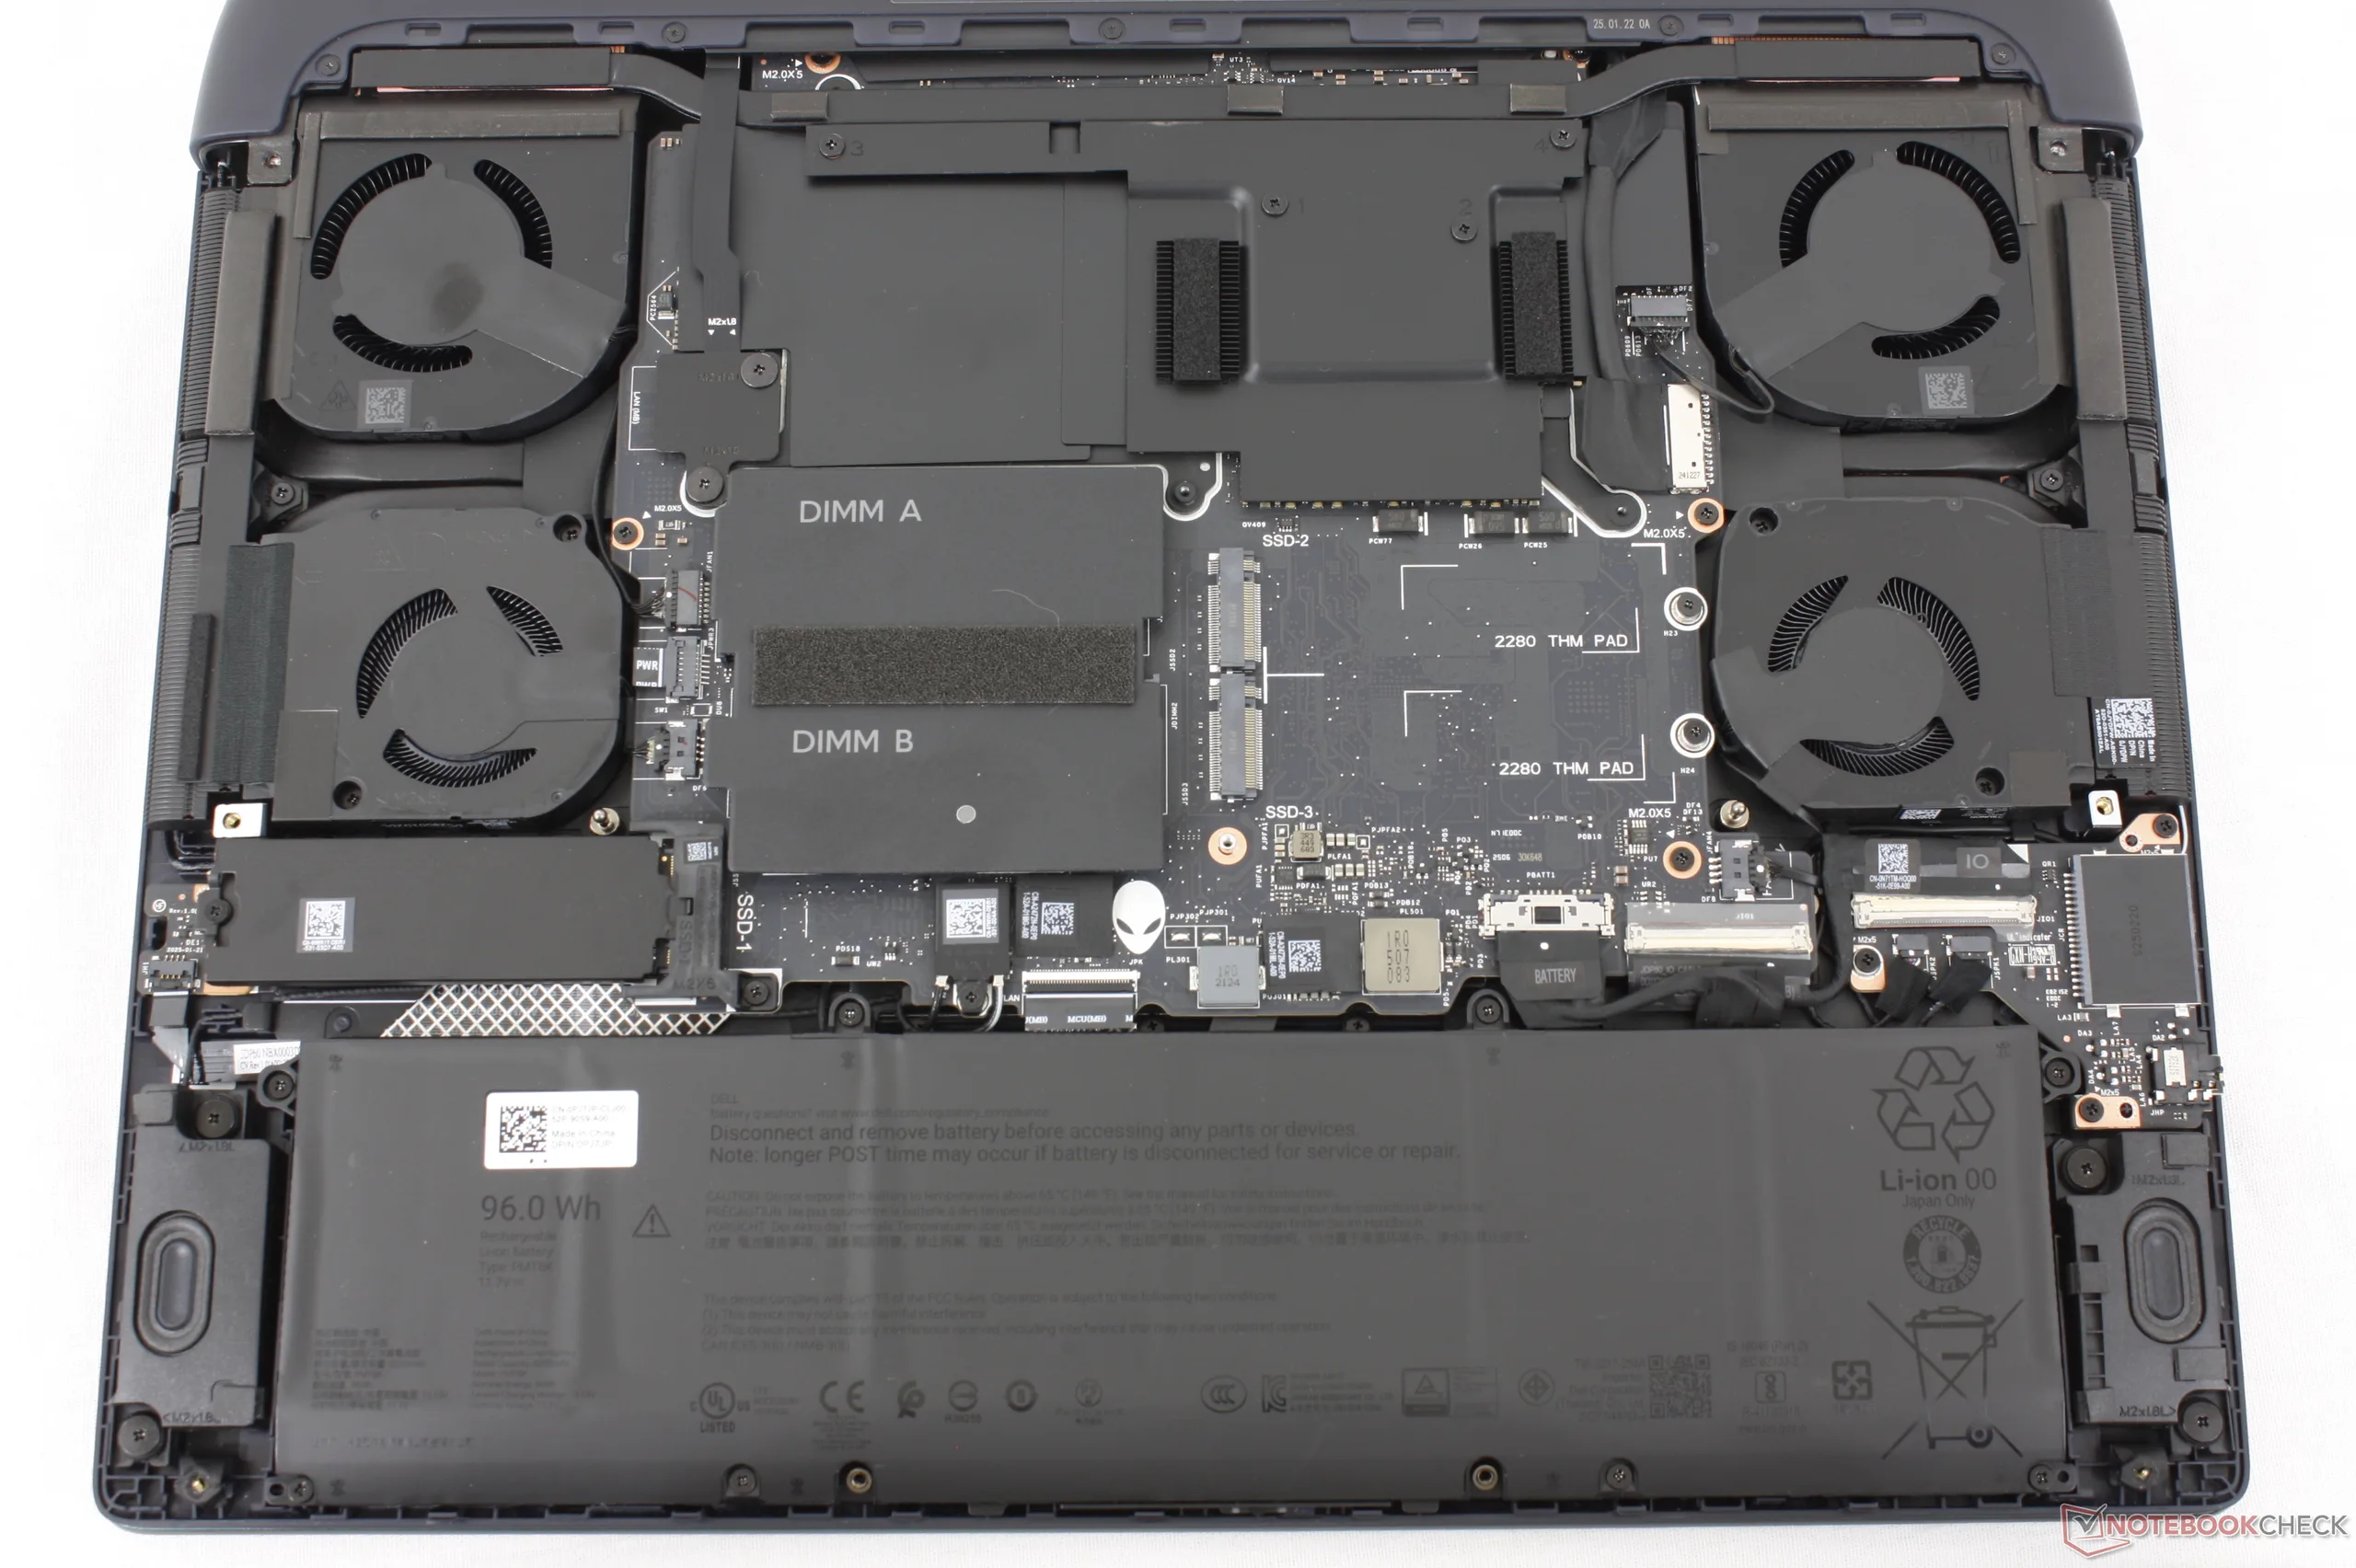
Wartung

Eingabegeräte

Display

Es sind jetzt zwei Display-Optionen verfügbar, die jeweils G-Sync und eine native Bildwiederholfrequenz von 240 Hz unterstützen:
- 2.560 x 1.600, 100 % DCI-P3, IPS, 500 nits, matt
- 2.560 x 1.600, 120 % DCI-P3, OLED, 620 nits (bei HDR), matt
Das Basis-IPS-Panel ist das gleiche wie beim Modell 2025, während das OLED-Panel eine neue Option ist. Im Gegensatz zu den meisten anderen OLED-Laptops ist das OLED-Panel des Alienware matt mit G-Sync-Unterstützung und nicht glänzend. Das matte Overlay hat jedoch zur Folge, dass Texte und Bilder etwas körniger sind.
| |||||||||||||||||||||||||
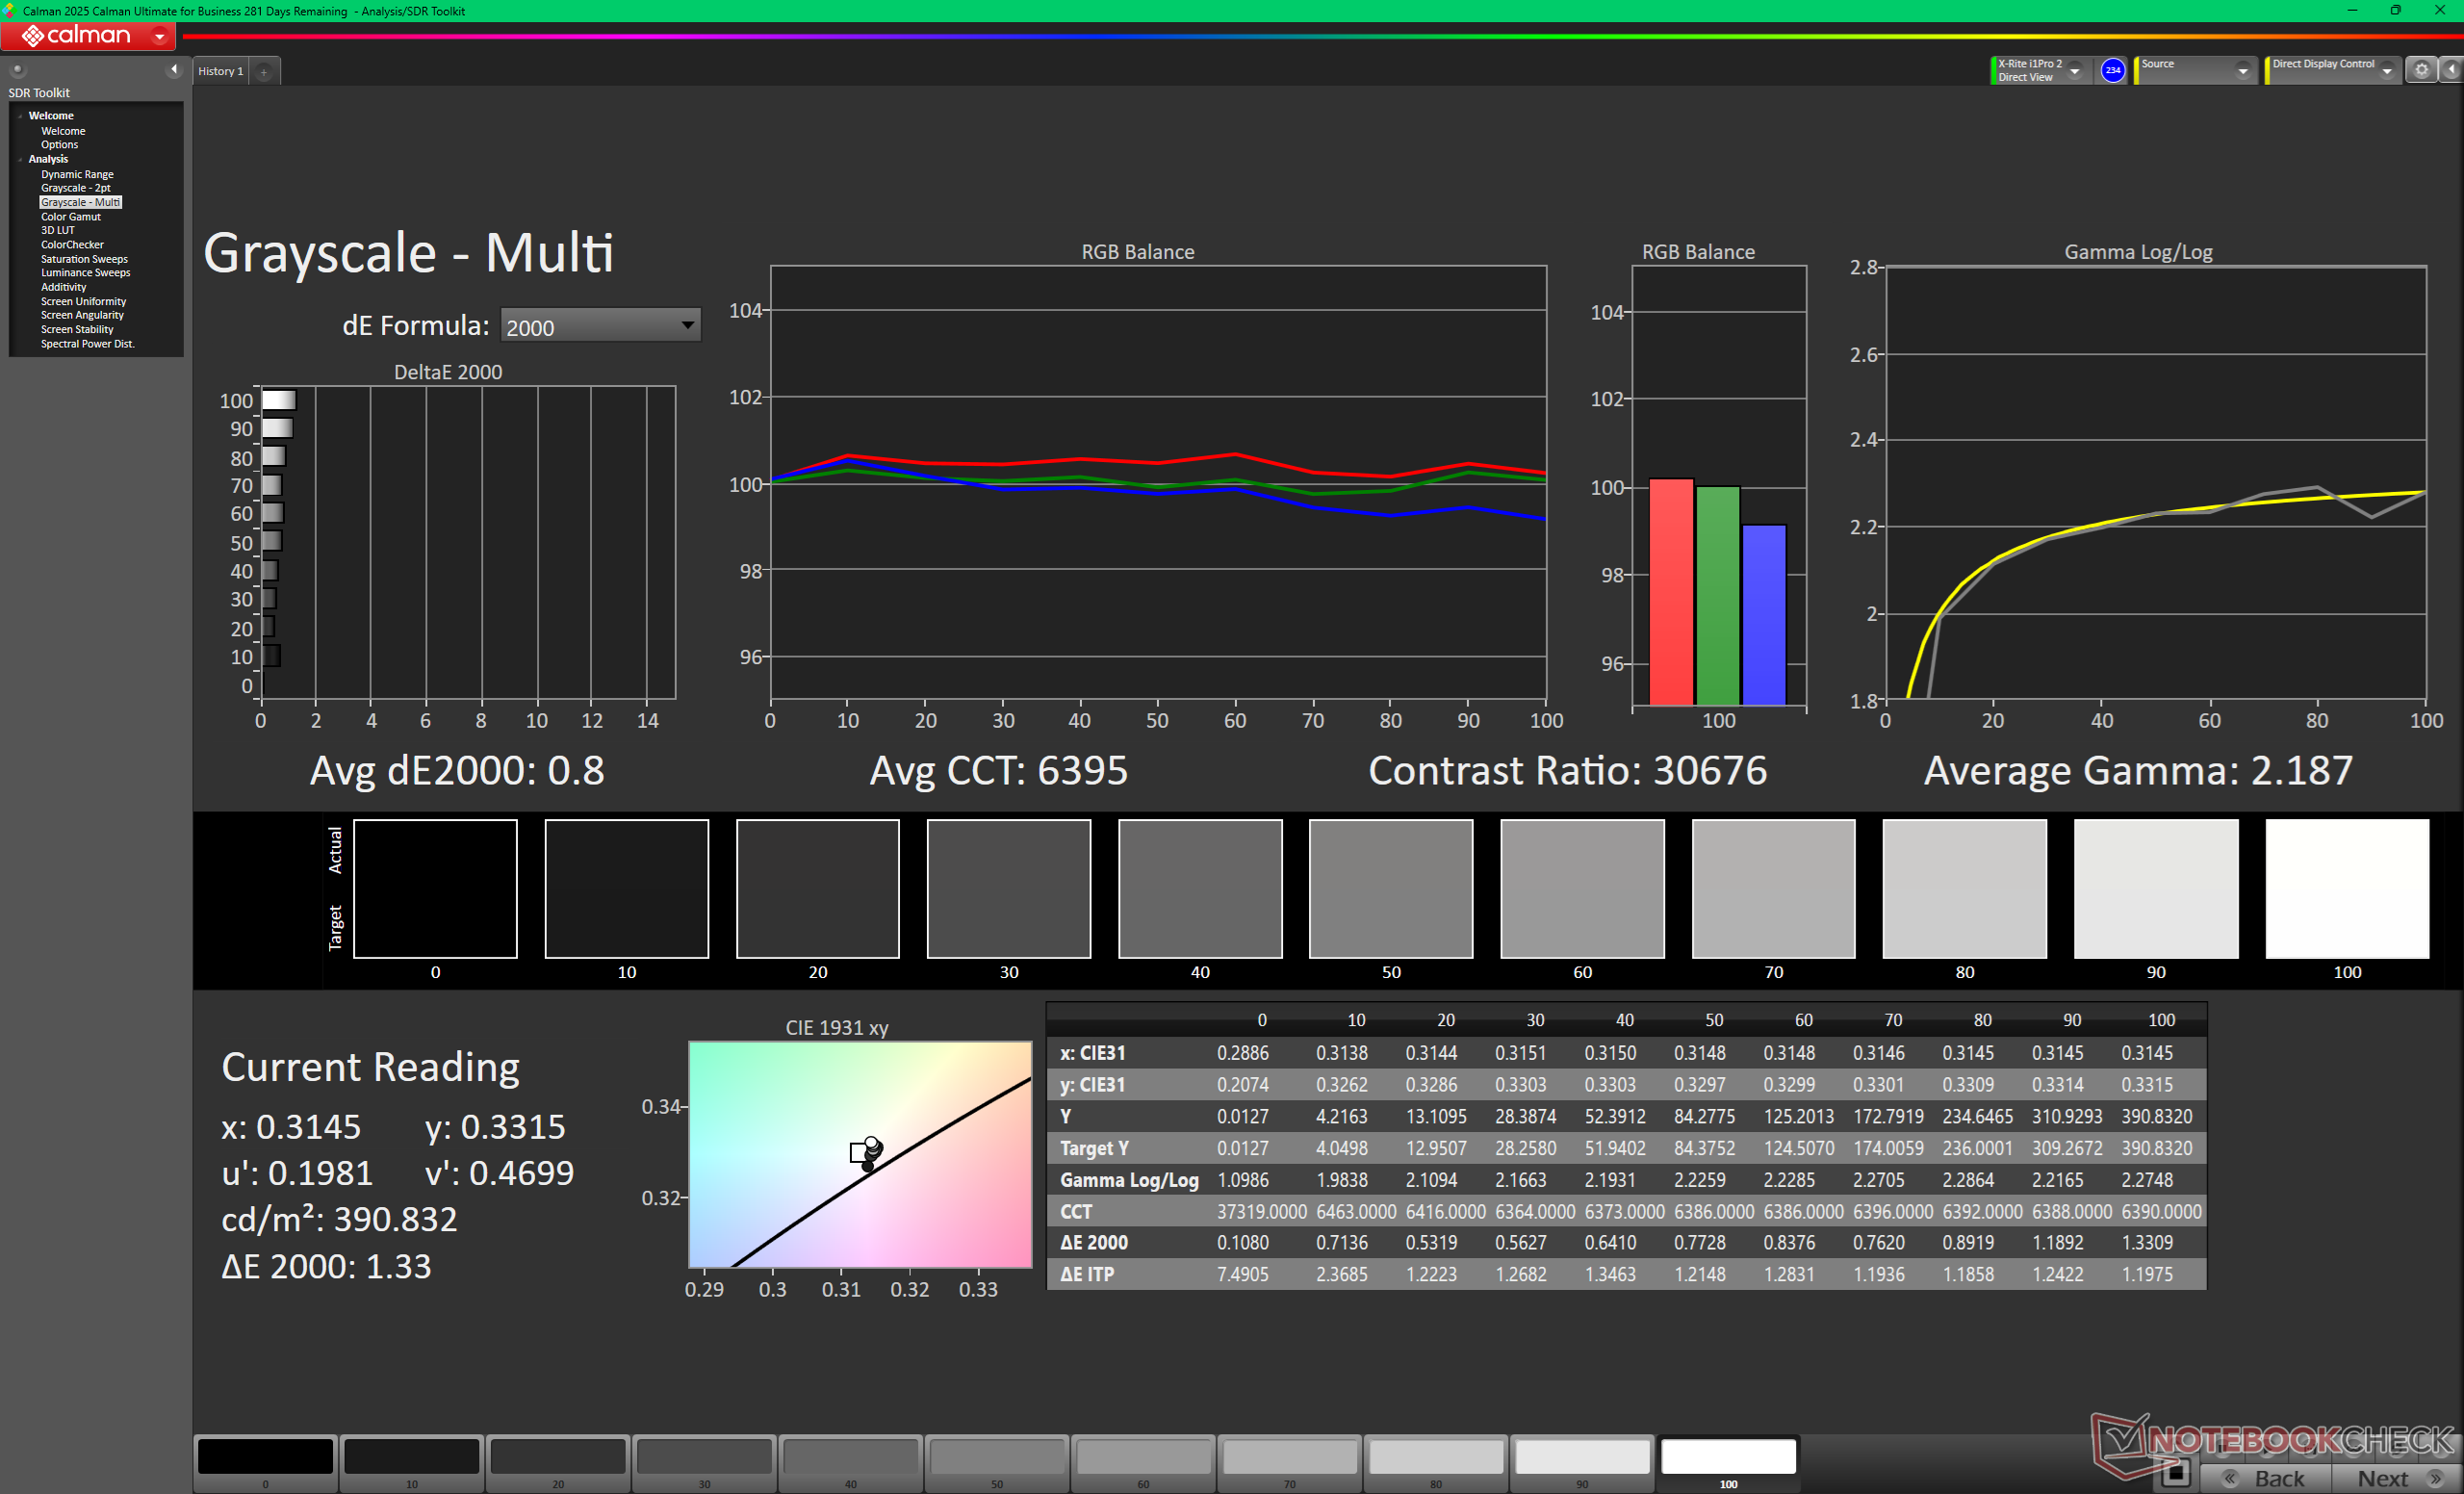
Ausleuchtung: 97 %
Helligkeit Akku: 383.3 cd/m²
Kontrast: ∞:1 (Schwarzwert: 0 cd/m²)
ΔE ColorChecker Calman: 0.87 | ∀{0.5-29.43 Ø4.72}
calibrated: 0.61
ΔE Greyscale Calman: 0.8 | ∀{0.09-98 Ø4.97}
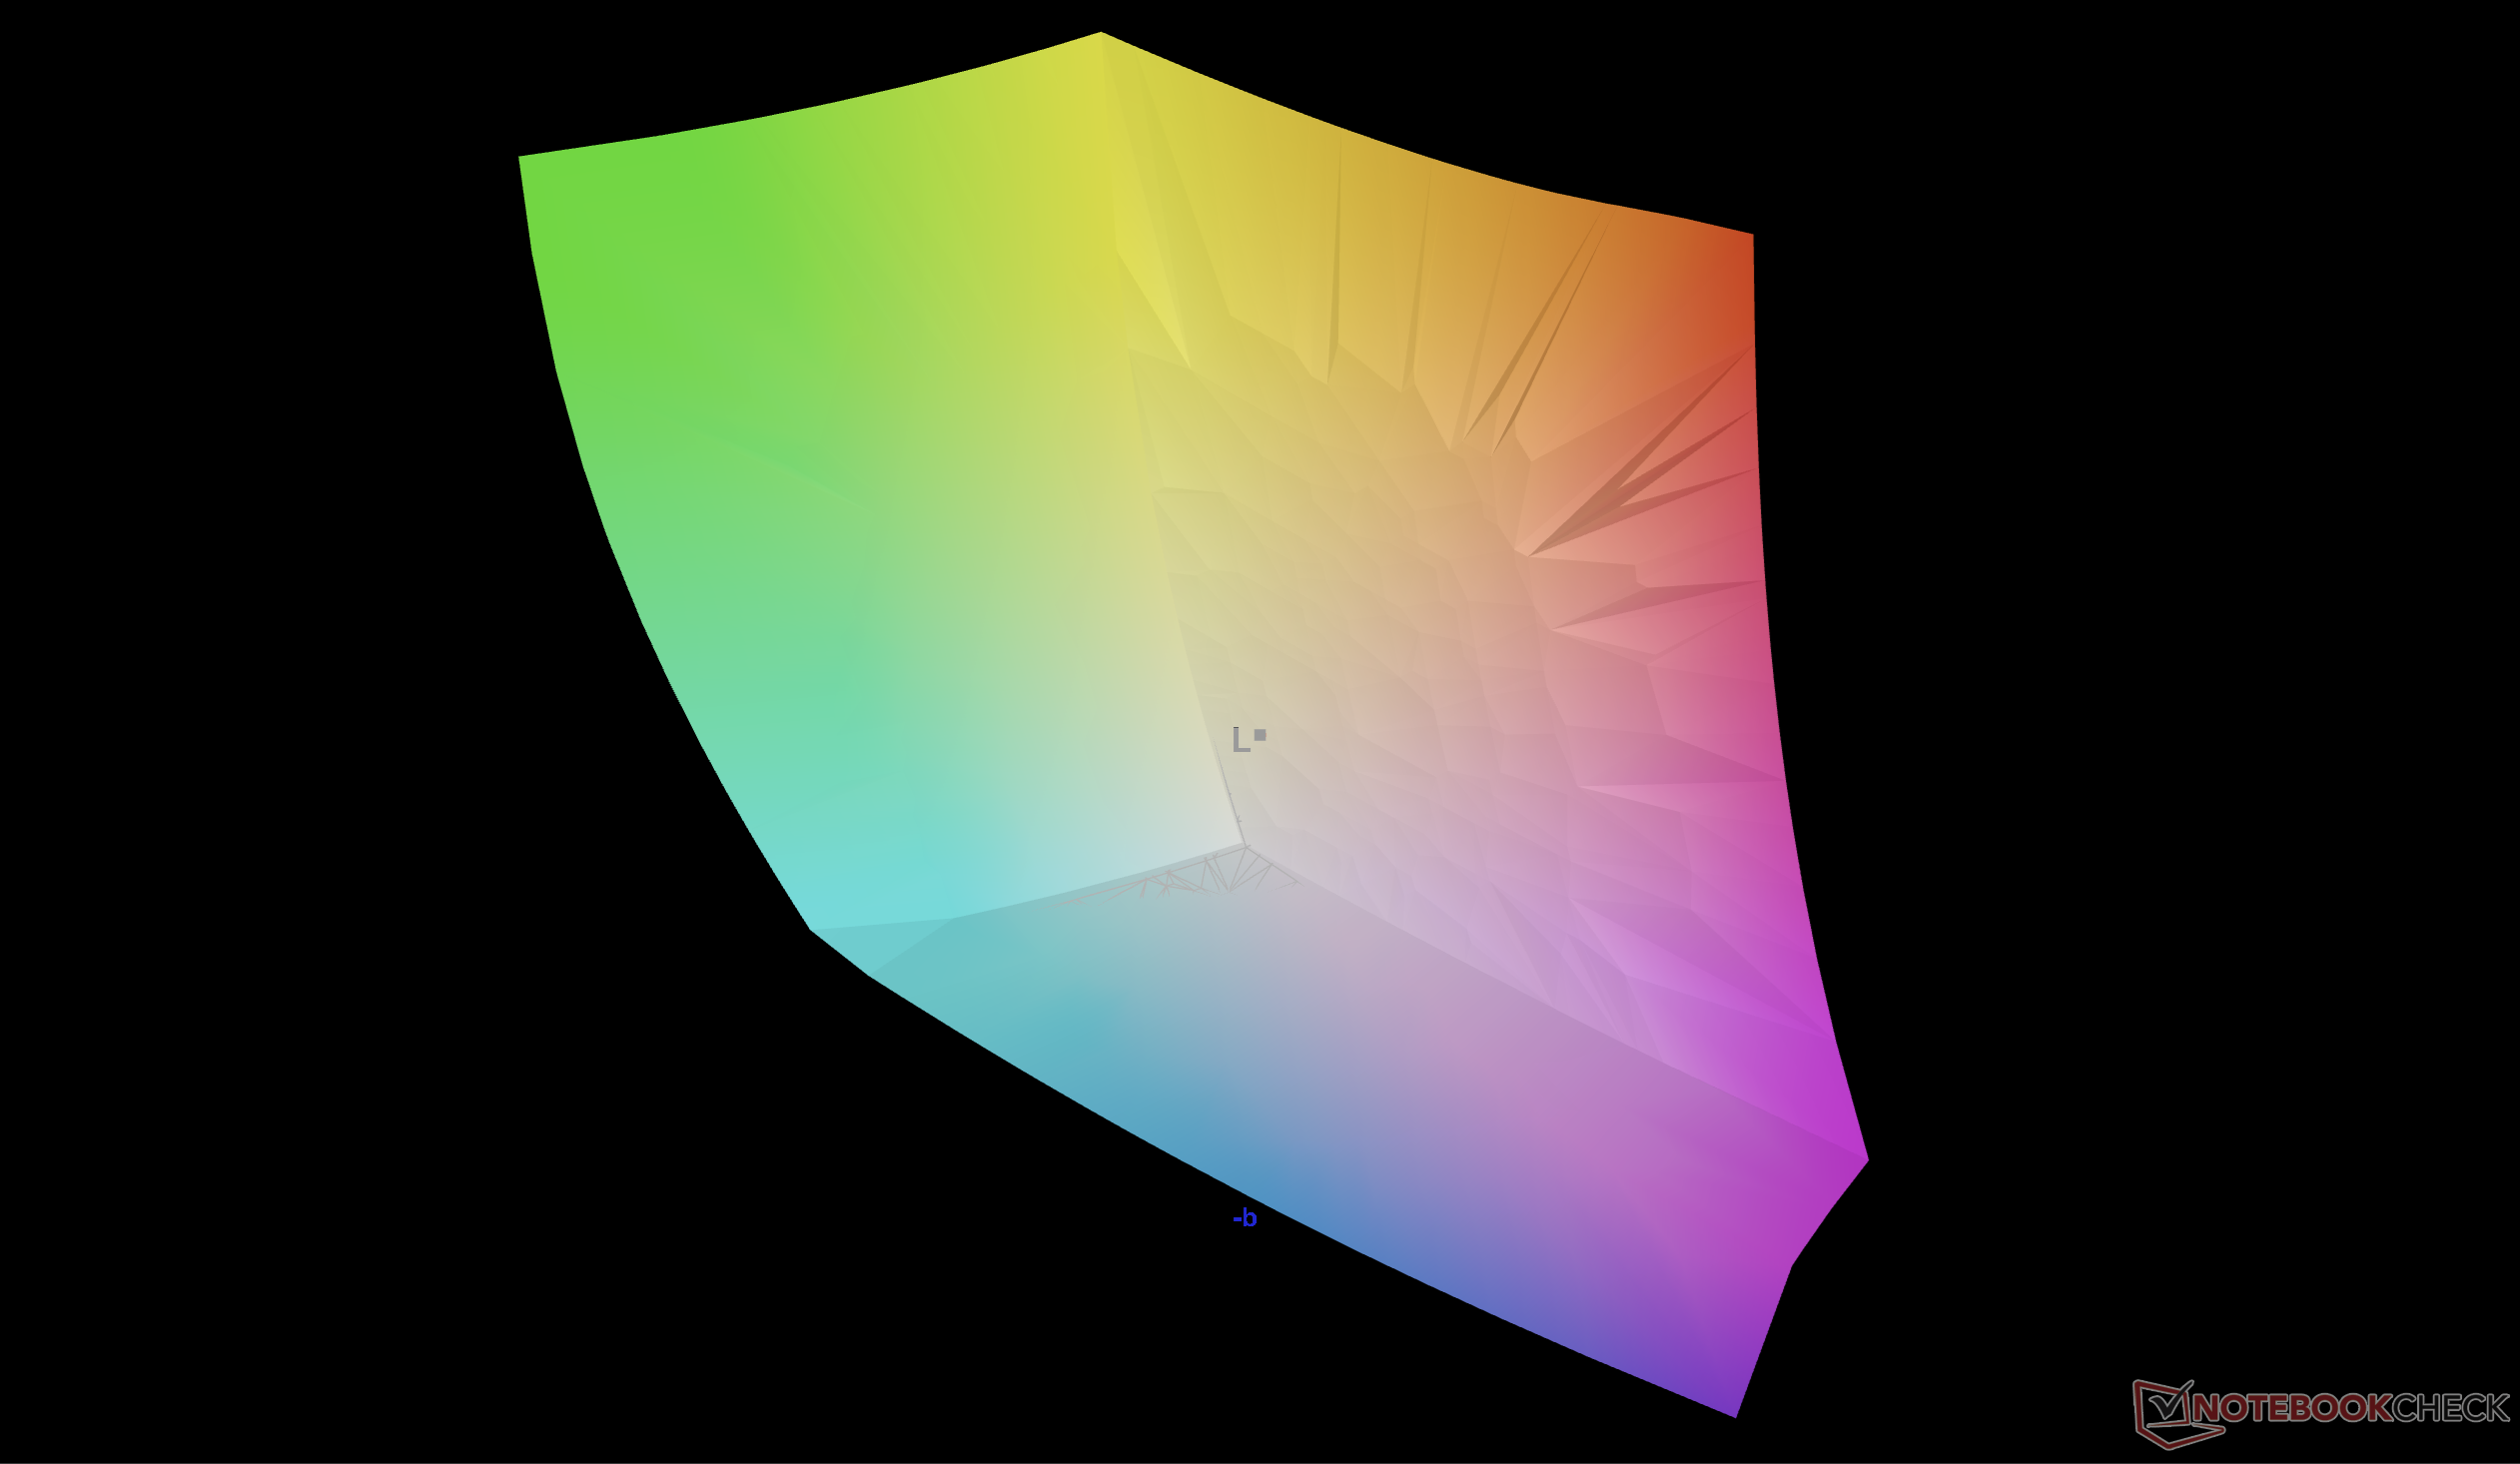
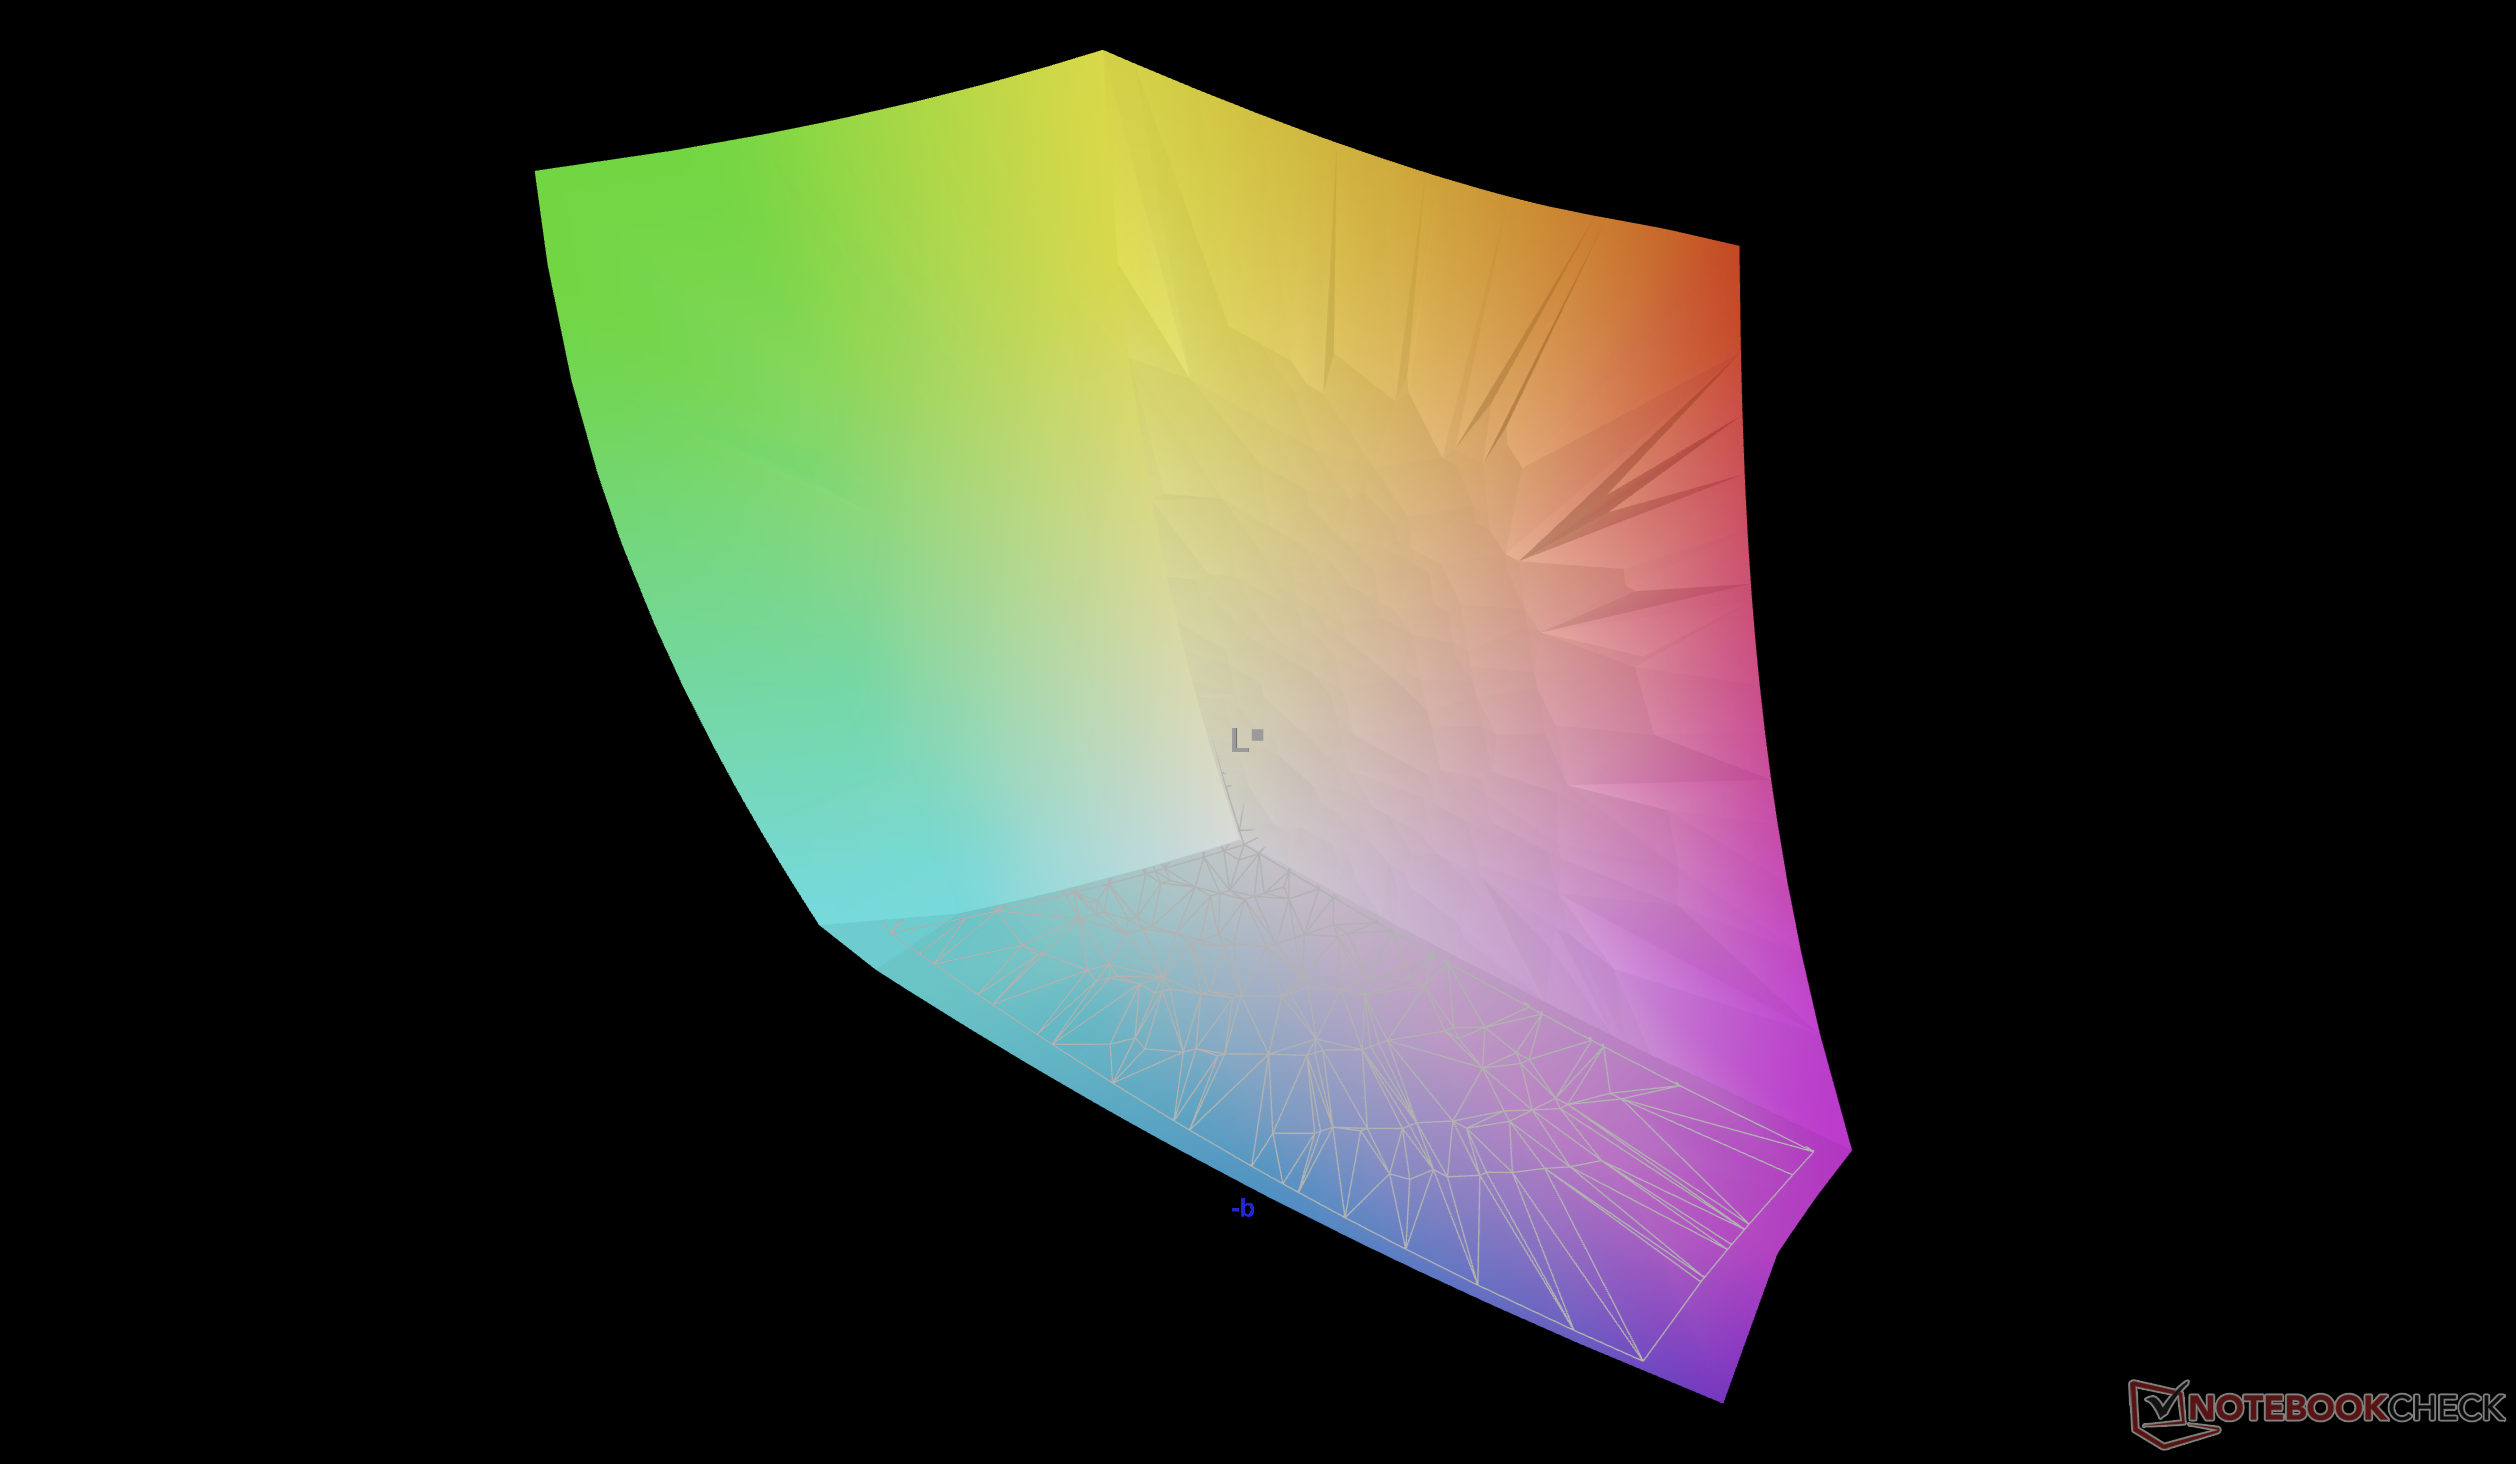
95.6% AdobeRGB 1998 (Argyll 3D)
100% sRGB (Argyll 3D)
99.6% Display P3 (Argyll 3D)
Gamma: 2.19
CCT: 6395 K
| Alienware 16 Area-51 Core Ultra 9 290HX Plus Samsung 160HU05, OLED, 2560x1600, 16", 240 Hz | Alienware 16 Area-51 AU Optronics B160QAN, IPS, 2560x1600, 16", 240 Hz | Lenovo Legion Pro 7i 16 Gen 10 Samsung ATNA60HU01-0, OLED, 2560x1600, 16", 240 Hz | HP Omen Max 16 ah000 Samsung ATNA60DL02-0, OLED, 2560x1600, 16", 240 Hz | MSI Vector 16 HX AI A2XWHG B160QAN02.3 (AUO7DB2), IPS, 2560x1600, 16", 240 Hz | Asus ROG Zephyrus G16 GU605CW Samsung ATNA60DL01-0, OLED, 2560x1600, 16", 240 Hz | |
|---|---|---|---|---|---|---|
| Display | -4% | -0% | 1% | -5% | -2% | |
| APL18 Peak Brightness (cd/m²) | 609 | |||||
| HDR Peak Brightness (cd/m²) | 609 | |||||
| Display P3 Coverage (%) | 99.6 | 96 -4% | 99.5 0% | 99.7 0% | 96.6 -3% | 96.5 -3% |
| sRGB Coverage (%) | 100 | 100 0% | 100 0% | 100 0% | 99.8 0% | 99.2 -1% |
| AdobeRGB 1998 Coverage (%) | 95.6 | 89.2 -7% | 94.4 -1% | 98.2 3% | 84.4 -12% | 94.5 -1% |
| Response Times | -1606% | 0% | -6% | -1373% | -447% | |
| Response Time Grey 50% / Grey 80% * (ms) | 0.29 ? | 4.8 ? -1555% | 0.28 ? 3% | 0.29 ? -0% | 4.3 ? -1383% | 0.32 ? -10% |
| Response Time Black / White * (ms) | 0.41 ? | 7.2 ? -1656% | 0.43 ? -5% | 0.47 ? -15% | 6 ? -1363% | 6 ? -1363% |
| PWM Frequency (Hz) | 1440 ? | 1438 ? | 960 ? | 960 | ||
| PWM Amplitude * (%) | 30 | 29 3% | 31 -3% | 20 33% | ||
| Bildschirm | -131% | -64% | -92% | -131% | -82% | |
| Helligkeit Bildmitte (cd/m²) | 383.3 | 554 45% | 490.4 28% | 376.5 -2% | 473 23% | 394 3% |
| Brightness (cd/m²) | 387 | 532 37% | 498 29% | 382 -1% | 426 10% | 398 3% |
| Brightness Distribution (%) | 97 | 88 -9% | 97 0% | 96 -1% | 85 -12% | 98 1% |
| Schwarzwert * (cd/m²) | 0.52 | 0.42 | 0.0084 | |||
| Delta E Colorchecker * | 0.87 | 2.81 -223% | 3.2 -268% | 3.67 -322% | 3.47 -299% | 2.41 -177% |
| Colorchecker dE 2000 max. * | 2.23 | 8.32 -273% | 6.04 -171% | 7.24 -225% | 7.24 -225% | 3.82 -71% |
| Colorchecker dE 2000 calibrated * | 0.61 | 0.65 -7% | 0.84 -38% | 0.94 -54% | 1.36 -123% | 1.41 -131% |
| Delta E Graustufen * | 0.8 | 4.7 -488% | 1 -25% | 1.1 -38% | 3.1 -288% | 2.4 -200% |
| Gamma | 2.19 100% | 2.3 96% | 2.24 98% | 2.25 98% | 2.486 88% | 2.16 102% |
| CCT | 6395 102% | 6476 100% | 6373 102% | 6319 103% | 6832 95% | 6544 99% |
| Kontrast (:1) | 1065 | 1126 | 46905 | |||
| Durchschnitt gesamt (Programm / Settings) | -580% /
-345% | -21% /
-34% | -32% /
-51% | -503% /
-306% | -177% /
-147% |
* ... kleinere Werte sind besser
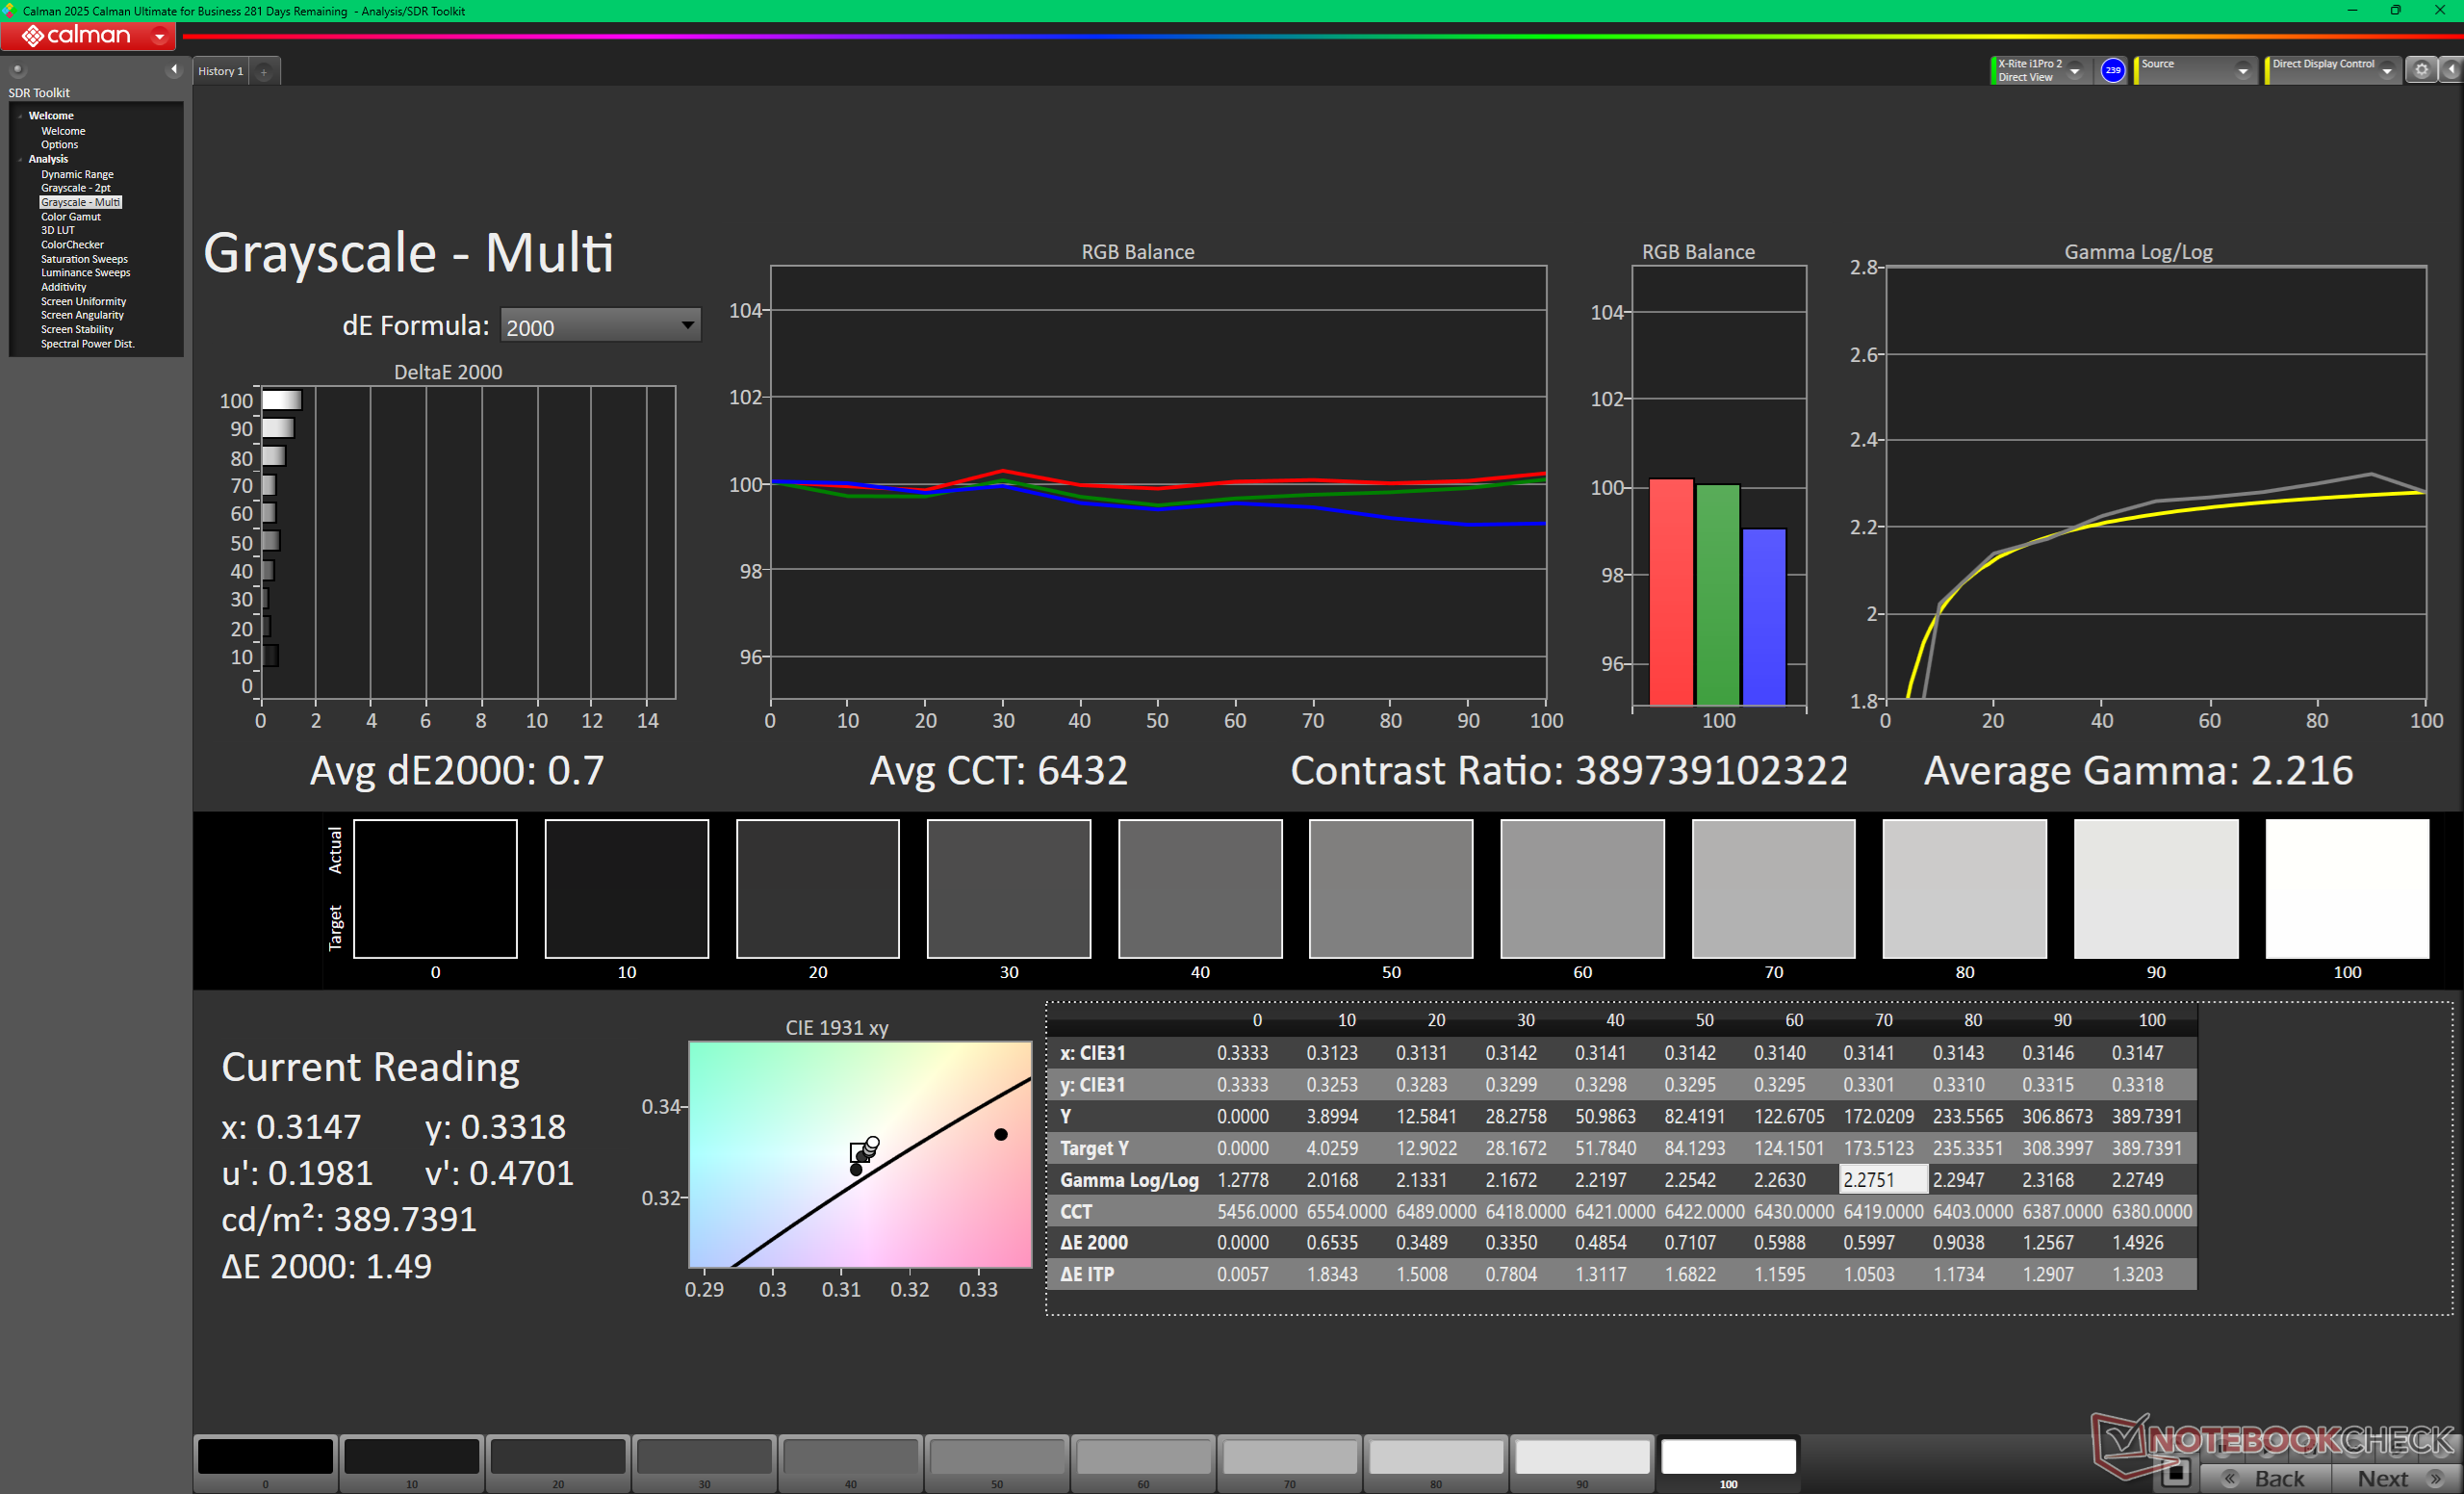
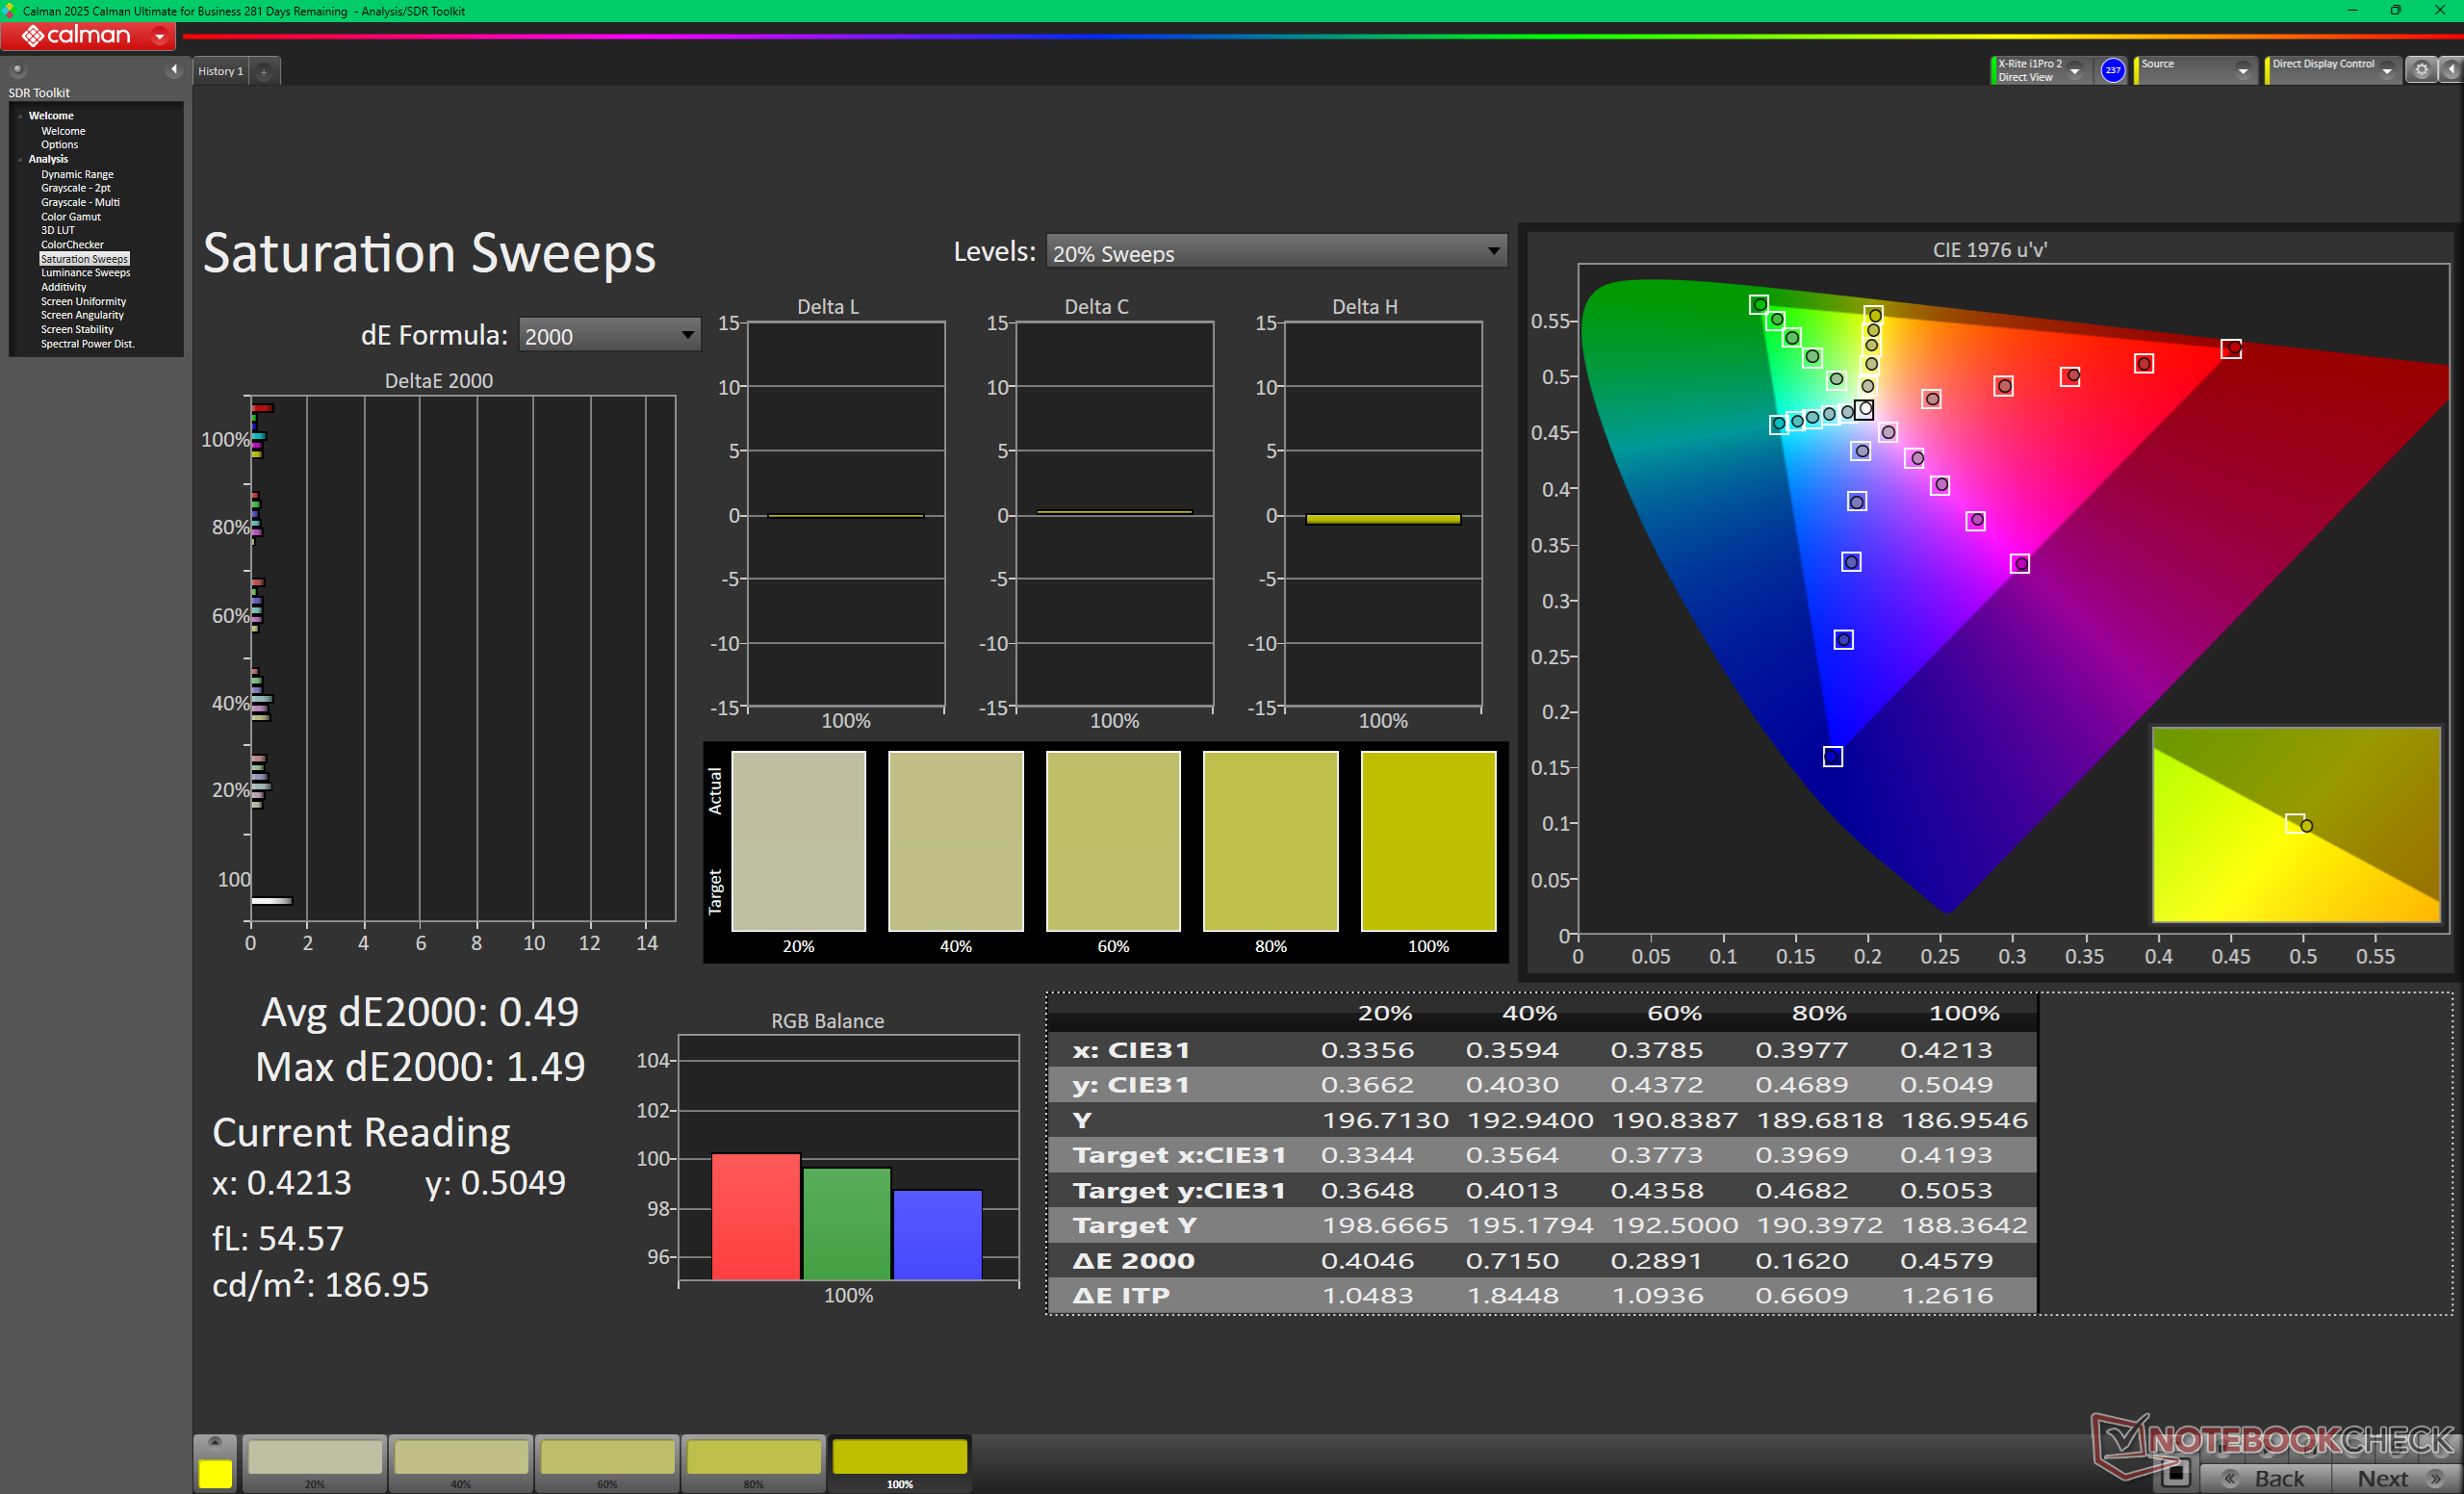
Das Display kommt gut kalibriert ab Werk mit durchschnittlichen DeltaE-Werten deutlich unter 2. Eine Kalibrierung durch den Endbenutzer sollte für die meisten nicht notwendig sein.


Reaktionszeiten (Response Times) des Displays
| ↔ Reaktionszeiten Schwarz zu Weiß | ||
|---|---|---|
| 0.41 ms ... steigend ↗ und fallend ↘ kombiniert | ↗ 0.2 ms steigend | 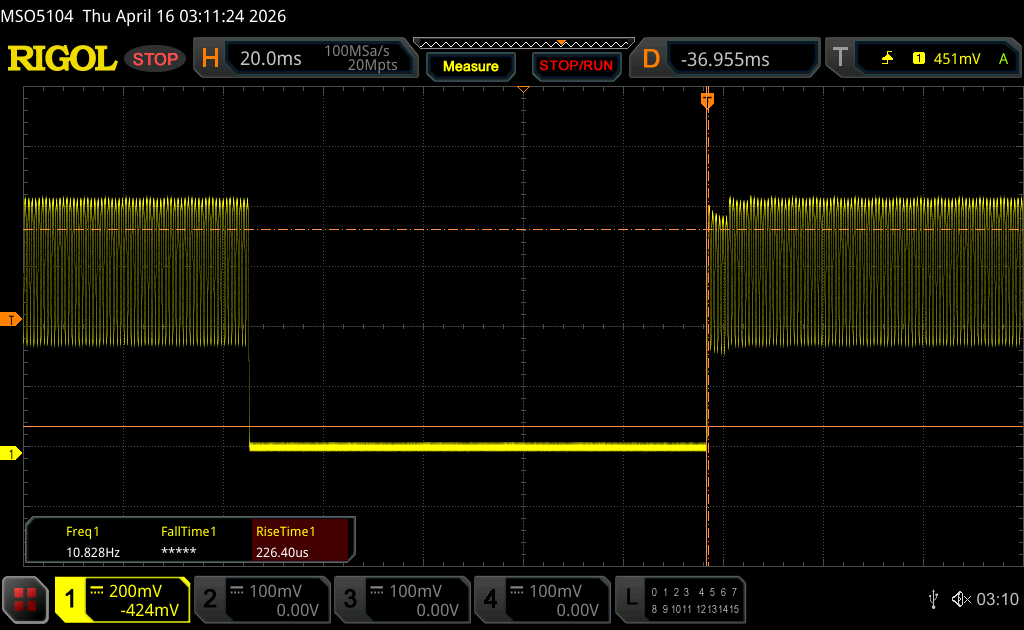 |
| ↘ 0.21 ms fallend | ||
| Die gemessenen Reaktionszeiten sind sehr kurz, wodurch sich der Bildschirm auch für schnelle 3D Spiele eignen sollte. Im Vergleich rangierten die bei uns getesteten Geräte von 0.1 (Minimum) zu 240 (Maximum) ms. » 0 % aller Screens waren schneller als der getestete. Daher sind die gemessenen Reaktionszeiten besser als der Durchschnitt aller vermessenen Geräte (19.8 ms). | ||
| ↔ Reaktionszeiten 50% Grau zu 80% Grau | ||
| 0.29 ms ... steigend ↗ und fallend ↘ kombiniert | ↗ 0.15 ms steigend | 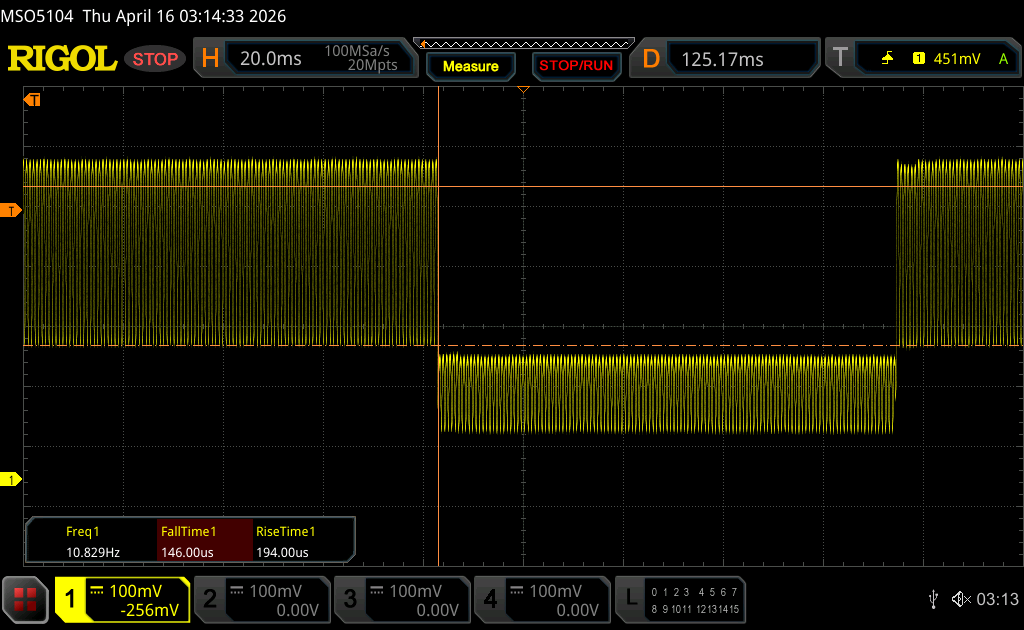 |
| ↘ 0.14 ms fallend | ||
| Die gemessenen Reaktionszeiten sind sehr kurz, wodurch sich der Bildschirm auch für schnelle 3D Spiele eignen sollte. Im Vergleich rangierten die bei uns getesteten Geräte von 0.165 (Minimum) zu 636 (Maximum) ms. » 0 % aller Screens waren schneller als der getestete. Daher sind die gemessenen Reaktionszeiten besser als der Durchschnitt aller vermessenen Geräte (31 ms). | ||
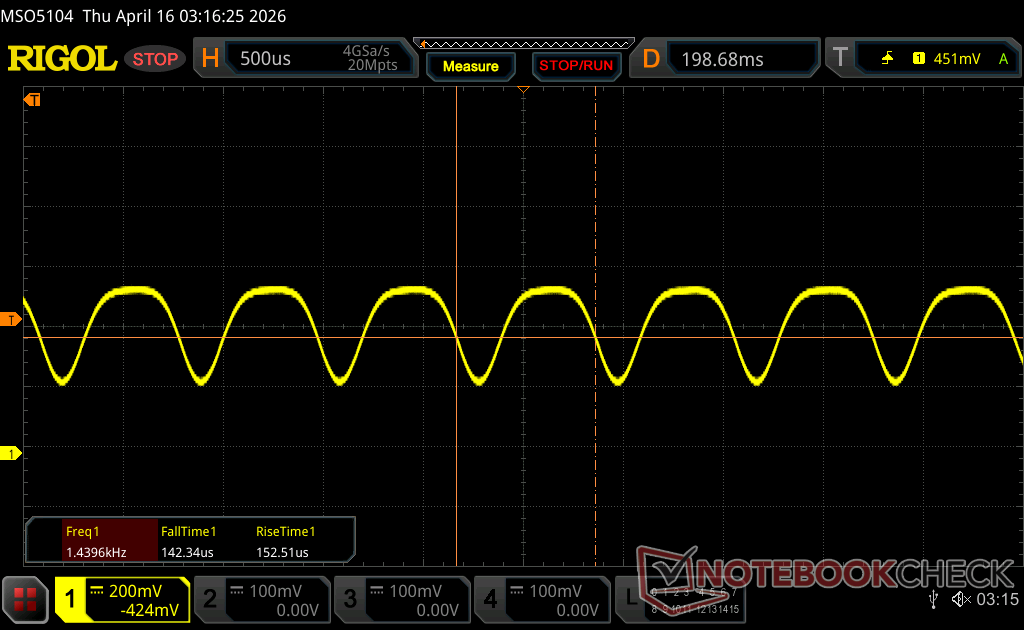
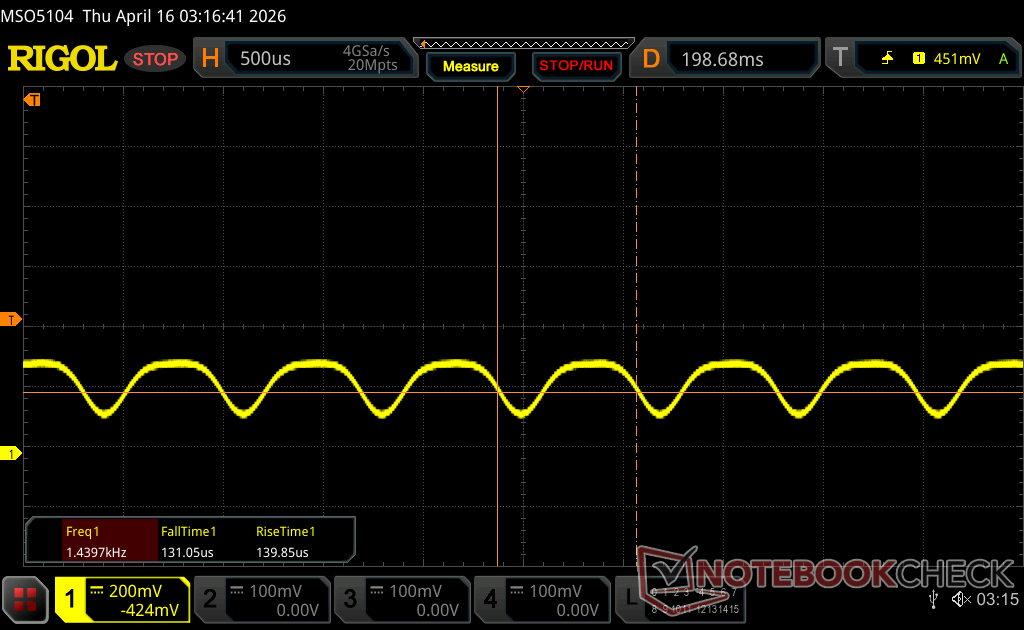
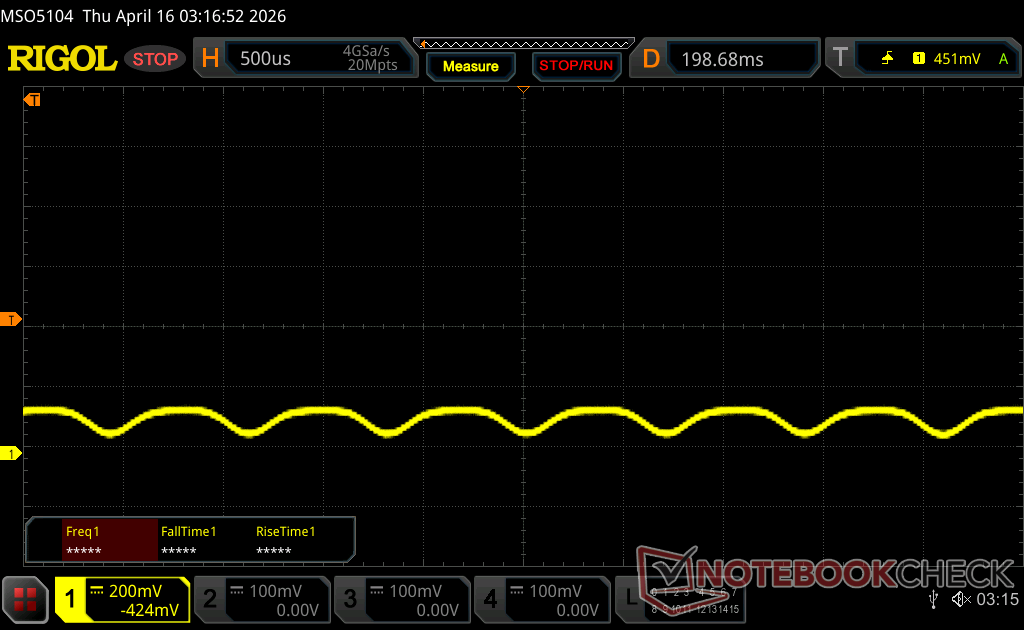
Bildschirm-Flackern / PWM (Pulse-Width Modulation)
| Flackern / PWM festgestellt | 1440 Hz Amplitude: 30 % | ≤ 100 % Helligkeit | 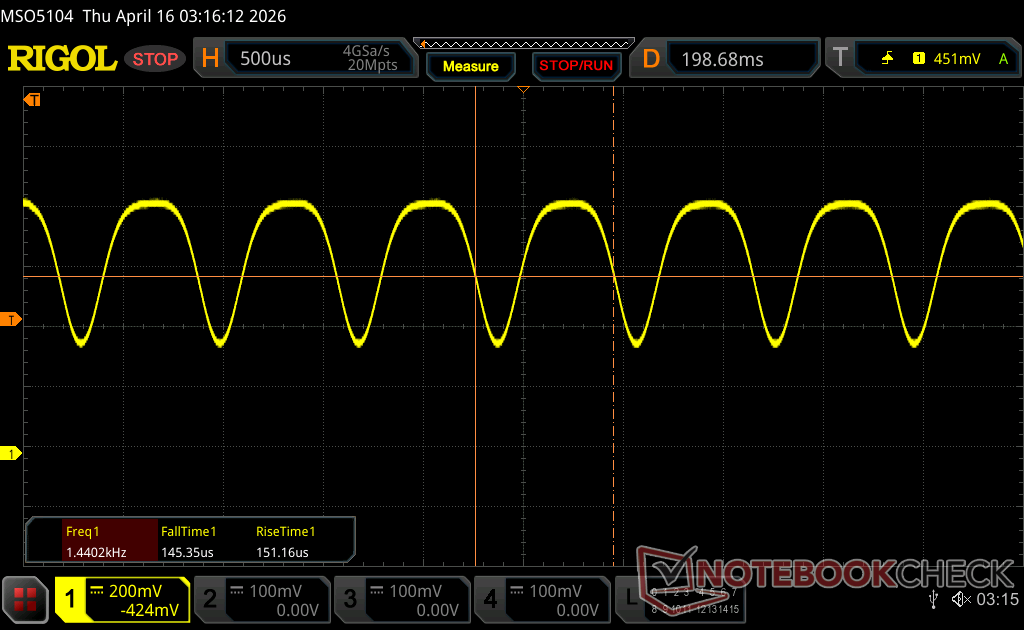 |
Das Display flackert mit 1440 Hz (im schlimmsten Fall, eventuell durch Pulsweitenmodulation PWM) bei einer eingestellten Helligkeit von 100 % und darunter. Darüber sollte es zu keinem Flackern kommen. Die Frequenz von 1440 Hz ist sehr hoch und sollte daher auch bei empfindlichen Personen zu keinen Problemen führen. Im Vergleich: 52 % aller getesteten Geräte nutzten kein PWM um die Helligkeit zu reduzieren. Wenn PWM eingesetzt wurde, dann bei einer Frequenz von durchschnittlich 7747 (Minimum 5, Maximum 343500) Hz. | |||


Leistung
Testbedingungen
Wir haben Windows auf den Performance-Modus und das Alienware Command Center auf den Overdrive-Modus eingestellt, bevor wir die folgenden Benchmarks durchgeführt haben. Der Overdrive-Modus ist für eine maximale Grafikleistung erforderlich.
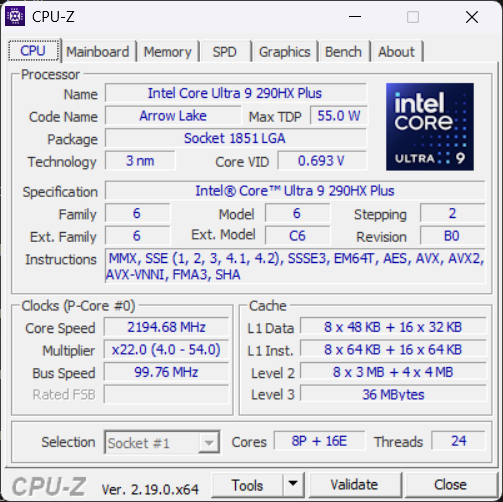
Prozessor
Der Core Ultra 9 290HX Plus bietet eine bis zu 15 Prozent bzw. 25 Prozent schnellere Single-Thread- und Multi-Thread-Leistung als der Core Ultra 9 275HX im Alienware 16 Area-51 aus dem letzten Jahr. Mit dieser Steigerung liegt die Arrow-Lake-CPU Kopf an Kopf mit dem konkurrierenden Ryzen 9 9955HX3D.
Cinebench R15 Mehrfachschleife
Cinebench R23: Multi Core | Single Core
Cinebench R20: CPU (Multi Core) | CPU (Single Core)
Cinebench R15: CPU Multi 64Bit | CPU Single 64Bit
Blender: v2.79 BMW27 CPU
7-Zip 18.03: 7z b 4 | 7z b 4 -mmt1
Geekbench 6.7: Multi-Core | Single-Core
Geekbench 5.5: Multi-Core | Single-Core
HWBOT x265 Benchmark v2.2: 4k Preset
LibreOffice : 20 Documents To PDF
R Benchmark 2.5: Overall mean
| Geekbench 6.7 / Single-Core | |
| Schenker XMG Neo 16 A25 5090 | |
| Durchschnittliche Intel Core Ultra 9 290HX Plus (3147 - 3226, n=5) | |
| Alienware 16 Area-51 Core Ultra 9 290HX Plus | |
| Chuwi Gamebook, R9 9955HX | |
| Lenovo Legion Pro 7i 16 Gen 10 | |
| Alienware 16 Area-51 | |
| MSI Vector 16 HX AI A2XWHG | |
| HP Omen Max 16 ah000 | |
| MSI Stealth 16 Mercedes-AMG Motorsport A13VG | |
| Asus ROG Zephyrus G16 GU605CW | |
| Schenker XMG Core 16 VE M25 | |
| HWBOT x265 Benchmark v2.2 / 4k Preset | |
| Schenker XMG Neo 16 A25 5090 | |
| Alienware 16 Area-51 Core Ultra 9 290HX Plus | |
| Durchschnittliche Intel Core Ultra 9 290HX Plus (38.2 - 42.3, n=4) | |
| Chuwi Gamebook, R9 9955HX | |
| Lenovo Legion Pro 7i 16 Gen 10 | |
| HP Omen Max 16 ah000 | |
| Alienware 16 Area-51 | |
| MSI Vector 16 HX AI A2XWHG | |
| Schenker XMG Core 16 VE M25 | |
| Asus ROG Zephyrus M16 GU604VY-NM042X | |
| Asus ROG Zephyrus G16 GU605CW | |
| MSI Stealth 16 Mercedes-AMG Motorsport A13VG | |
Cinebench R23: Multi Core | Single Core
Cinebench R20: CPU (Multi Core) | CPU (Single Core)
Cinebench R15: CPU Multi 64Bit | CPU Single 64Bit
Blender: v2.79 BMW27 CPU
7-Zip 18.03: 7z b 4 | 7z b 4 -mmt1
Geekbench 6.7: Multi-Core | Single-Core
Geekbench 5.5: Multi-Core | Single-Core
HWBOT x265 Benchmark v2.2: 4k Preset
LibreOffice : 20 Documents To PDF
R Benchmark 2.5: Overall mean
* ... kleinere Werte sind besser
AIDA64: FP32 Ray-Trace | FPU Julia | CPU SHA3 | CPU Queen | FPU SinJulia | FPU Mandel | CPU AES | CPU ZLib | FP64 Ray-Trace | CPU PhotoWorxx | CPU CheckMate
| Performance Rating | |
| Alienware 16 Area-51 Core Ultra 9 290HX Plus -1! | |
| Durchschnittliche Intel Core Ultra 9 290HX Plus -1! | |
| Lenovo Legion Pro 7i 16 Gen 10 -1! | |
| Alienware 16 Area-51 -1! | |
| HP Omen Max 16 ah000 -1! | |
| MSI Vector 16 HX AI A2XWHG -1! | |
| Asus ROG Zephyrus G16 GU605CW -1! | |
| AIDA64 / FP32 Ray-Trace | |
| Alienware 16 Area-51 Core Ultra 9 290HX Plus (v8.20.8100) | |
| Durchschnittliche Intel Core Ultra 9 290HX Plus (34761 - 40761, n=4) | |
| Lenovo Legion Pro 7i 16 Gen 10 (v6.92.6600) | |
| Alienware 16 Area-51 (v6.92.6600) | |
| HP Omen Max 16 ah000 (v6.92.6600) | |
| MSI Vector 16 HX AI A2XWHG (v6.92.6600) | |
| Asus ROG Zephyrus G16 GU605CW (v6.92.6600) | |
| AIDA64 / FPU Julia | |
| Alienware 16 Area-51 Core Ultra 9 290HX Plus (v8.20.8100) | |
| Durchschnittliche Intel Core Ultra 9 290HX Plus (174665 - 208083, n=4) | |
| Lenovo Legion Pro 7i 16 Gen 10 (v6.92.6600) | |
| HP Omen Max 16 ah000 (v6.92.6600) | |
| Alienware 16 Area-51 (v6.92.6600) | |
| MSI Vector 16 HX AI A2XWHG (v6.92.6600) | |
| Asus ROG Zephyrus G16 GU605CW (v6.92.6600) | |
| AIDA64 / CPU SHA3 | |
| Alienware 16 Area-51 Core Ultra 9 290HX Plus (v8.20.8100) | |
| Durchschnittliche Intel Core Ultra 9 290HX Plus (8352 - 9784, n=4) | |
| Lenovo Legion Pro 7i 16 Gen 10 (v6.92.6600) | |
| Alienware 16 Area-51 (v6.92.6600) | |
| HP Omen Max 16 ah000 (v6.92.6600) | |
| MSI Vector 16 HX AI A2XWHG (v6.92.6600) | |
| Asus ROG Zephyrus G16 GU605CW (v6.92.6600) | |
| AIDA64 / CPU Queen | |
| Lenovo Legion Pro 7i 16 Gen 10 (v6.92.6600) | |
| Alienware 16 Area-51 (v6.92.6600) | |
| HP Omen Max 16 ah000 (v6.92.6600) | |
| MSI Vector 16 HX AI A2XWHG (v6.92.6600) | |
| Asus ROG Zephyrus G16 GU605CW (v6.92.6600) | |
| AIDA64 / FPU SinJulia | |
| Lenovo Legion Pro 7i 16 Gen 10 (v6.92.6600) | |
| Durchschnittliche Intel Core Ultra 9 290HX Plus (13612 - 14461, n=4) | |
| Alienware 16 Area-51 Core Ultra 9 290HX Plus (v8.20.8100) | |
| Alienware 16 Area-51 (v6.92.6600) | |
| HP Omen Max 16 ah000 (v6.92.6600) | |
| MSI Vector 16 HX AI A2XWHG (v6.92.6600) | |
| Asus ROG Zephyrus G16 GU605CW (v6.92.6600) | |
| AIDA64 / FPU Mandel | |
| Alienware 16 Area-51 Core Ultra 9 290HX Plus (v8.20.8100) | |
| Durchschnittliche Intel Core Ultra 9 290HX Plus (91215 - 108275, n=4) | |
| Lenovo Legion Pro 7i 16 Gen 10 (v6.92.6600) | |
| HP Omen Max 16 ah000 (v6.92.6600) | |
| Alienware 16 Area-51 (v6.92.6600) | |
| MSI Vector 16 HX AI A2XWHG (v6.92.6600) | |
| Asus ROG Zephyrus G16 GU605CW (v6.92.6600) | |
| AIDA64 / CPU AES | |
| Lenovo Legion Pro 7i 16 Gen 10 (v6.92.6600) | |
| Durchschnittliche Intel Core Ultra 9 290HX Plus (127585 - 136781, n=4) | |
| Alienware 16 Area-51 Core Ultra 9 290HX Plus (v8.20.8100) | |
| Alienware 16 Area-51 (v6.92.6600) | |
| HP Omen Max 16 ah000 (v6.92.6600) | |
| MSI Vector 16 HX AI A2XWHG (v6.92.6600) | |
| Asus ROG Zephyrus G16 GU605CW (v6.92.6600) | |
| AIDA64 / CPU ZLib | |
| Alienware 16 Area-51 Core Ultra 9 290HX Plus (v8.20.8100) | |
| Durchschnittliche Intel Core Ultra 9 290HX Plus (1967 - 2206, n=4) | |
| Lenovo Legion Pro 7i 16 Gen 10 (v6.92.6600) | |
| Alienware 16 Area-51 (v6.92.6600) | |
| HP Omen Max 16 ah000 (v6.92.6600) | |
| MSI Vector 16 HX AI A2XWHG (v6.92.6600) | |
| Asus ROG Zephyrus G16 GU605CW (v6.92.6600) | |
| AIDA64 / FP64 Ray-Trace | |
| Alienware 16 Area-51 Core Ultra 9 290HX Plus (v8.20.8100) | |
| Durchschnittliche Intel Core Ultra 9 290HX Plus (18611 - 21949, n=4) | |
| Lenovo Legion Pro 7i 16 Gen 10 (v6.92.6600) | |
| Alienware 16 Area-51 (v6.92.6600) | |
| HP Omen Max 16 ah000 (v6.92.6600) | |
| MSI Vector 16 HX AI A2XWHG (v6.92.6600) | |
| Asus ROG Zephyrus G16 GU605CW (v6.92.6600) | |
| AIDA64 / CPU PhotoWorxx | |
| Asus ROG Zephyrus G16 GU605CW (v6.92.6600) | |
| Alienware 16 Area-51 Core Ultra 9 290HX Plus (v8.20.8100) | |
| Lenovo Legion Pro 7i 16 Gen 10 (v6.92.6600) | |
| Alienware 16 Area-51 (v6.92.6600) | |
| Durchschnittliche Intel Core Ultra 9 290HX Plus (51134 - 55731, n=4) | |
| HP Omen Max 16 ah000 (v6.92.6600) | |
| MSI Vector 16 HX AI A2XWHG (v6.92.6600) | |
| AIDA64 / CPU CheckMate | |
| Alienware 16 Area-51 Core Ultra 9 290HX Plus (v8.20.8100) | |
| Durchschnittliche Intel Core Ultra 9 290HX Plus (7624 - 8322, n=4) | |
Systemleistung
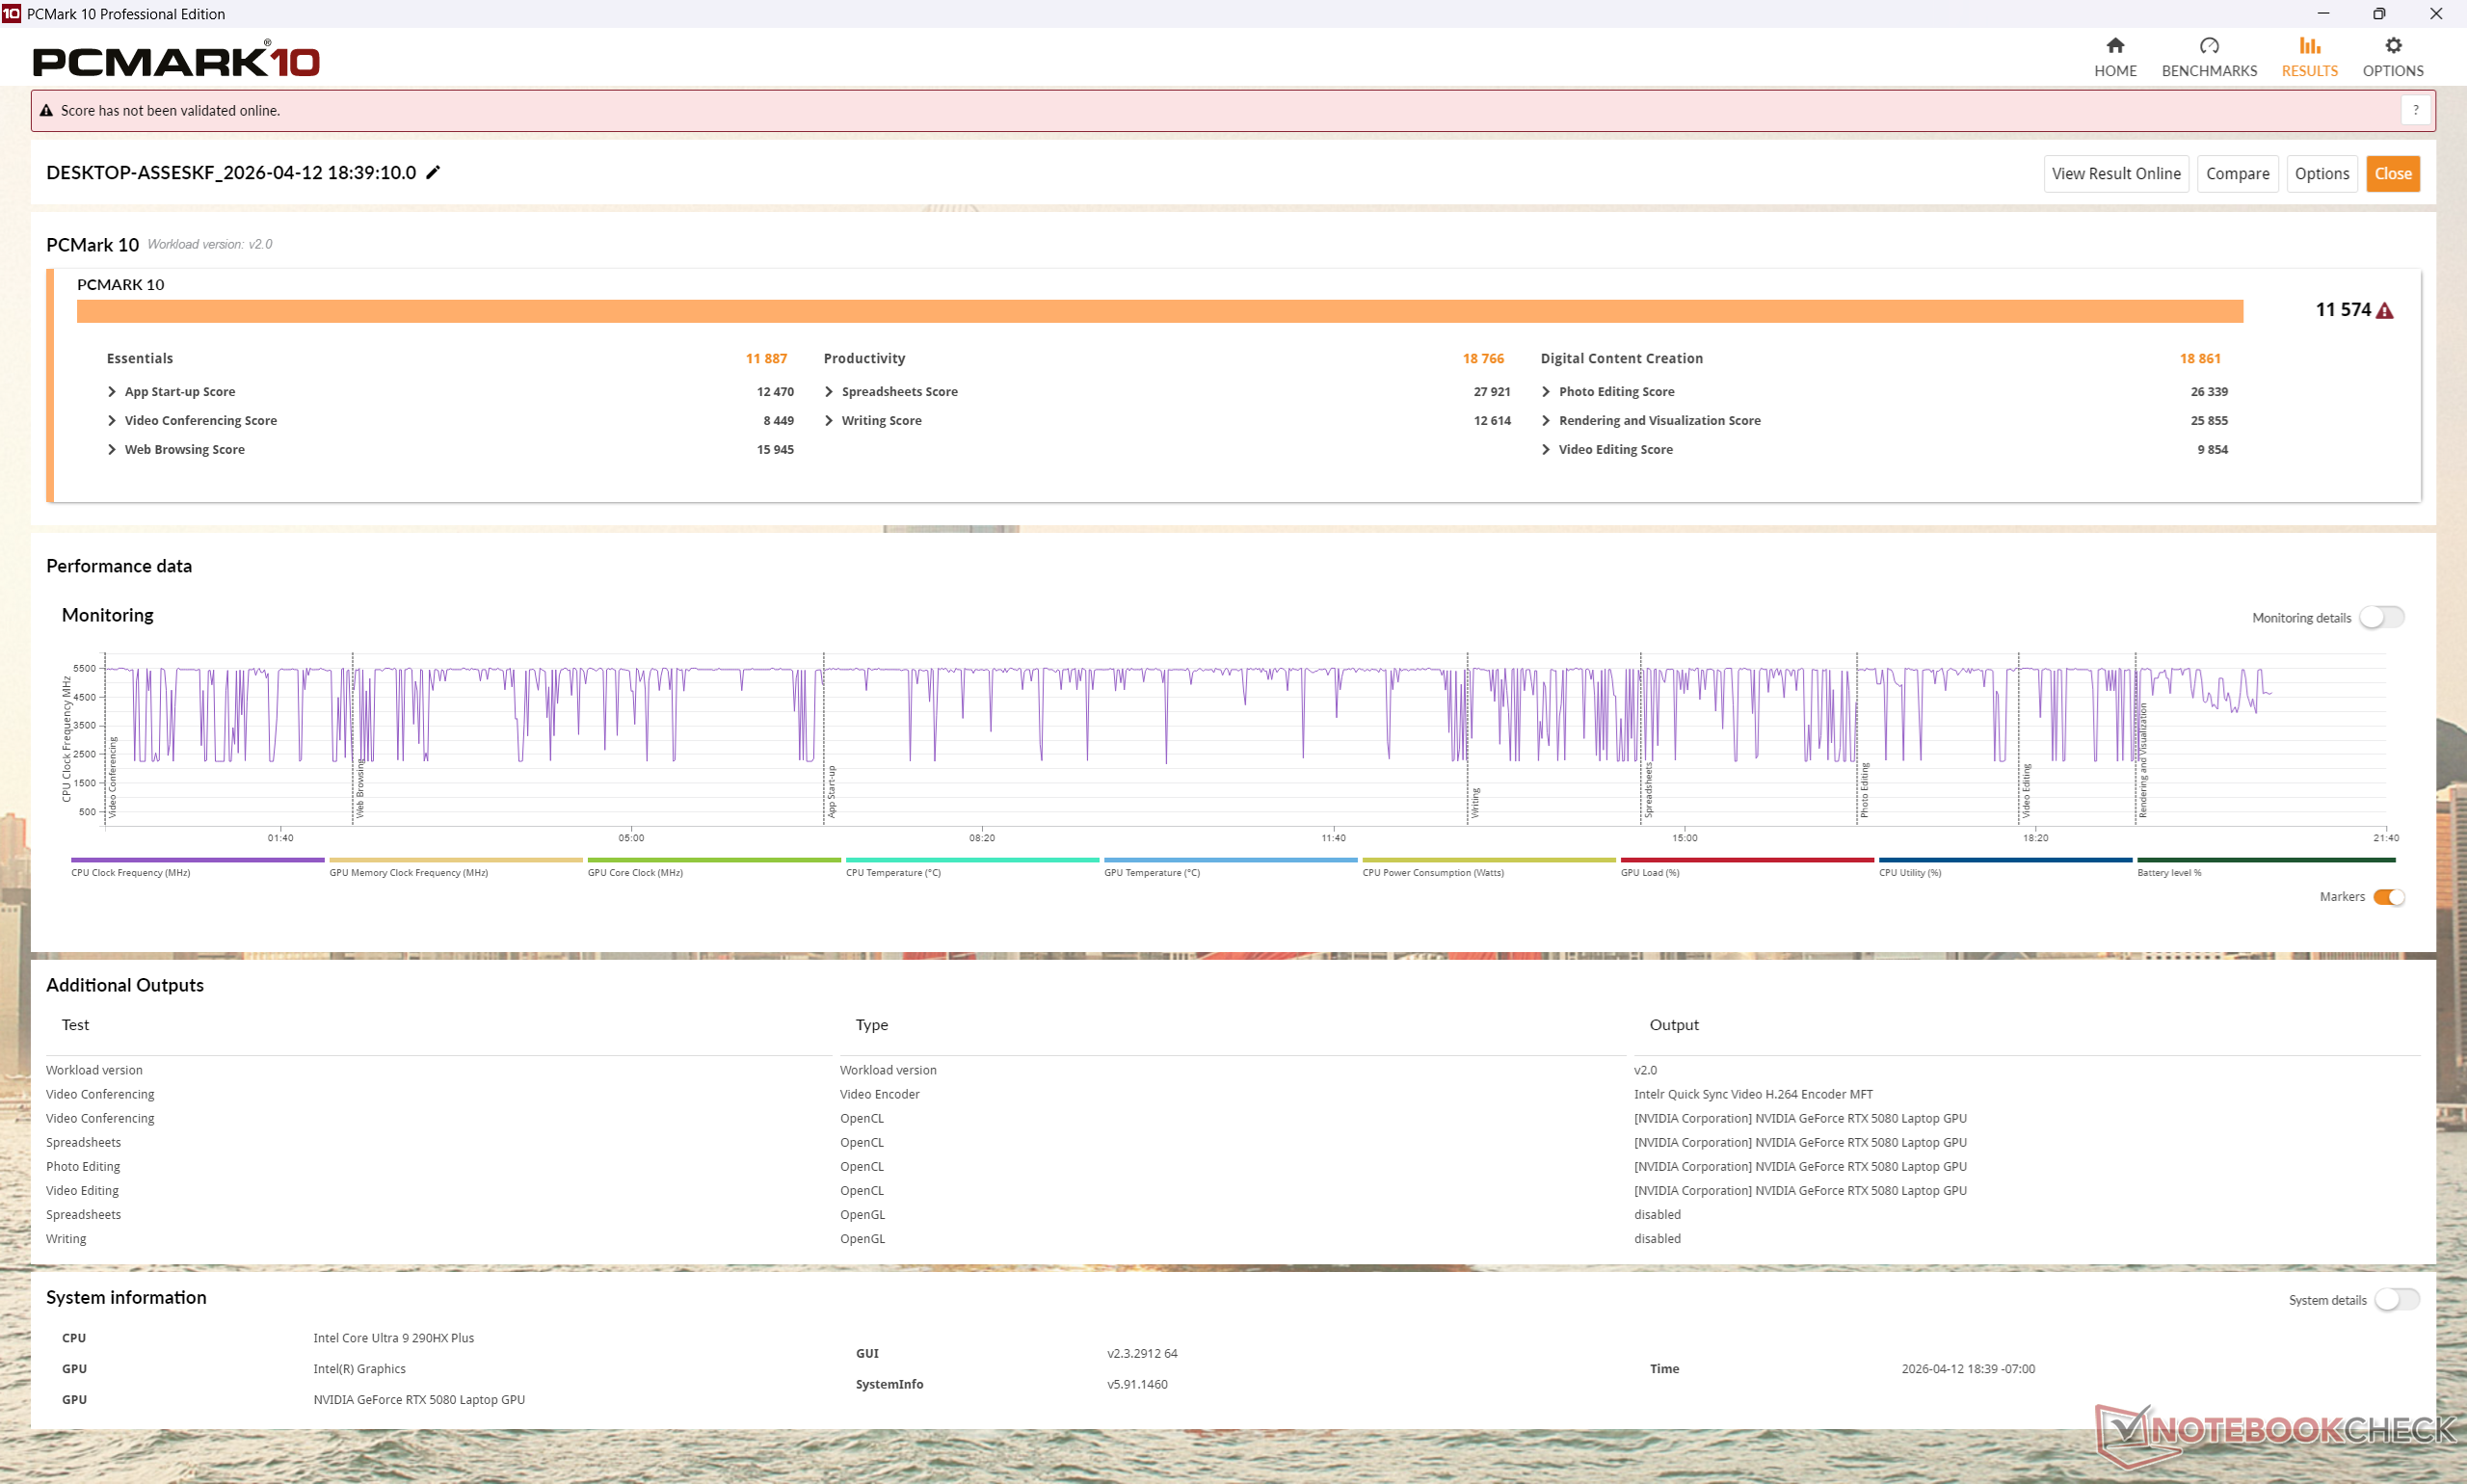
PCMark 10: Score | Essentials | Productivity | Digital Content Creation
CrossMark: Overall | Productivity | Creativity | Responsiveness
WebXPRT 3: Overall
WebXPRT 4: Overall
Mozilla Kraken 1.1: Total
| Performance Rating | |
| Alienware 16 Area-51 Core Ultra 9 290HX Plus | |
| Durchschnittliche Intel Core Ultra 9 290HX Plus, NVIDIA GeForce RTX 5080 Laptop | |
| Alienware 16 Area-51 | |
| Lenovo Legion Pro 7i 16 Gen 10 | |
| HP Omen Max 16 ah000 -1! | |
| MSI Vector 16 HX AI A2XWHG | |
| Asus ROG Zephyrus G16 GU605CW | |
| PCMark 10 / Score | |
| Alienware 16 Area-51 Core Ultra 9 290HX Plus | |
| Durchschnittliche Intel Core Ultra 9 290HX Plus, NVIDIA GeForce RTX 5080 Laptop (n=1) | |
| Lenovo Legion Pro 7i 16 Gen 10 | |
| HP Omen Max 16 ah000 | |
| Alienware 16 Area-51 | |
| MSI Vector 16 HX AI A2XWHG | |
| Asus ROG Zephyrus G16 GU605CW | |
| PCMark 10 / Essentials | |
| Alienware 16 Area-51 Core Ultra 9 290HX Plus | |
| Durchschnittliche Intel Core Ultra 9 290HX Plus, NVIDIA GeForce RTX 5080 Laptop (n=1) | |
| Lenovo Legion Pro 7i 16 Gen 10 | |
| Alienware 16 Area-51 | |
| HP Omen Max 16 ah000 | |
| MSI Vector 16 HX AI A2XWHG | |
| Asus ROG Zephyrus G16 GU605CW | |
| PCMark 10 / Productivity | |
| Alienware 16 Area-51 Core Ultra 9 290HX Plus | |
| Durchschnittliche Intel Core Ultra 9 290HX Plus, NVIDIA GeForce RTX 5080 Laptop (n=1) | |
| Lenovo Legion Pro 7i 16 Gen 10 | |
| MSI Vector 16 HX AI A2XWHG | |
| Alienware 16 Area-51 | |
| HP Omen Max 16 ah000 | |
| Asus ROG Zephyrus G16 GU605CW | |
| PCMark 10 / Digital Content Creation | |
| Lenovo Legion Pro 7i 16 Gen 10 | |
| Alienware 16 Area-51 Core Ultra 9 290HX Plus | |
| Durchschnittliche Intel Core Ultra 9 290HX Plus, NVIDIA GeForce RTX 5080 Laptop (n=1) | |
| HP Omen Max 16 ah000 | |
| Alienware 16 Area-51 | |
| Asus ROG Zephyrus G16 GU605CW | |
| MSI Vector 16 HX AI A2XWHG | |
| CrossMark / Overall | |
| Alienware 16 Area-51 Core Ultra 9 290HX Plus | |
| Durchschnittliche Intel Core Ultra 9 290HX Plus, NVIDIA GeForce RTX 5080 Laptop (n=1) | |
| Alienware 16 Area-51 | |
| Lenovo Legion Pro 7i 16 Gen 10 | |
| HP Omen Max 16 ah000 | |
| MSI Vector 16 HX AI A2XWHG | |
| Asus ROG Zephyrus G16 GU605CW | |
| CrossMark / Productivity | |
| Alienware 16 Area-51 Core Ultra 9 290HX Plus | |
| Durchschnittliche Intel Core Ultra 9 290HX Plus, NVIDIA GeForce RTX 5080 Laptop (n=1) | |
| Alienware 16 Area-51 | |
| Lenovo Legion Pro 7i 16 Gen 10 | |
| HP Omen Max 16 ah000 | |
| MSI Vector 16 HX AI A2XWHG | |
| Asus ROG Zephyrus G16 GU605CW | |
| CrossMark / Creativity | |
| Alienware 16 Area-51 Core Ultra 9 290HX Plus | |
| Durchschnittliche Intel Core Ultra 9 290HX Plus, NVIDIA GeForce RTX 5080 Laptop (n=1) | |
| Alienware 16 Area-51 | |
| Lenovo Legion Pro 7i 16 Gen 10 | |
| HP Omen Max 16 ah000 | |
| MSI Vector 16 HX AI A2XWHG | |
| Asus ROG Zephyrus G16 GU605CW | |
| CrossMark / Responsiveness | |
| Alienware 16 Area-51 Core Ultra 9 290HX Plus | |
| Durchschnittliche Intel Core Ultra 9 290HX Plus, NVIDIA GeForce RTX 5080 Laptop (n=1) | |
| Alienware 16 Area-51 | |
| HP Omen Max 16 ah000 | |
| Lenovo Legion Pro 7i 16 Gen 10 | |
| MSI Vector 16 HX AI A2XWHG | |
| Asus ROG Zephyrus G16 GU605CW | |
| WebXPRT 3 / Overall | |
| Alienware 16 Area-51 Core Ultra 9 290HX Plus | |
| Durchschnittliche Intel Core Ultra 9 290HX Plus, NVIDIA GeForce RTX 5080 Laptop (n=1) | |
| HP Omen Max 16 ah000 | |
| Lenovo Legion Pro 7i 16 Gen 10 | |
| Alienware 16 Area-51 | |
| MSI Vector 16 HX AI A2XWHG | |
| Asus ROG Zephyrus G16 GU605CW | |
| WebXPRT 4 / Overall | |
| Alienware 16 Area-51 Core Ultra 9 290HX Plus | |
| Durchschnittliche Intel Core Ultra 9 290HX Plus, NVIDIA GeForce RTX 5080 Laptop (n=1) | |
| Lenovo Legion Pro 7i 16 Gen 10 | |
| Alienware 16 Area-51 | |
| MSI Vector 16 HX AI A2XWHG | |
| Asus ROG Zephyrus G16 GU605CW | |
| Mozilla Kraken 1.1 / Total | |
| Asus ROG Zephyrus G16 GU605CW | |
| MSI Vector 16 HX AI A2XWHG | |
| HP Omen Max 16 ah000 | |
| Alienware 16 Area-51 | |
| Lenovo Legion Pro 7i 16 Gen 10 | |
| Alienware 16 Area-51 Core Ultra 9 290HX Plus | |
| Durchschnittliche Intel Core Ultra 9 290HX Plus, NVIDIA GeForce RTX 5080 Laptop (n=1) | |
* ... kleinere Werte sind besser
| PCMark 10 Score | 11574 Punkte | |
Hilfe | ||
| AIDA64 / Memory Copy | |
| Asus ROG Zephyrus G16 GU605CW | |
| Alienware 16 Area-51 Core Ultra 9 290HX Plus | |
| Alienware 16 Area-51 | |
| Lenovo Legion Pro 7i 16 Gen 10 | |
| Durchschnittliche Intel Core Ultra 9 290HX Plus (76912 - 86055, n=4) | |
| HP Omen Max 16 ah000 | |
| MSI Vector 16 HX AI A2XWHG | |
| AIDA64 / Memory Read | |
| Lenovo Legion Pro 7i 16 Gen 10 | |
| Alienware 16 Area-51 Core Ultra 9 290HX Plus | |
| Alienware 16 Area-51 | |
| Durchschnittliche Intel Core Ultra 9 290HX Plus (84638 - 96309, n=4) | |
| HP Omen Max 16 ah000 | |
| MSI Vector 16 HX AI A2XWHG | |
| Asus ROG Zephyrus G16 GU605CW | |
| AIDA64 / Memory Write | |
| Lenovo Legion Pro 7i 16 Gen 10 | |
| Alienware 16 Area-51 | |
| Alienware 16 Area-51 Core Ultra 9 290HX Plus | |
| Durchschnittliche Intel Core Ultra 9 290HX Plus (76094 - 85001, n=4) | |
| HP Omen Max 16 ah000 | |
| Asus ROG Zephyrus G16 GU605CW | |
| MSI Vector 16 HX AI A2XWHG | |
| AIDA64 / Memory Latency | |
| Asus ROG Zephyrus G16 GU605CW | |
| Alienware 16 Area-51 | |
| HP Omen Max 16 ah000 | |
| Lenovo Legion Pro 7i 16 Gen 10 | |
| MSI Vector 16 HX AI A2XWHG | |
| Alienware 16 Area-51 Core Ultra 9 290HX Plus | |
| Durchschnittliche Intel Core Ultra 9 290HX Plus (100.7 - 108.4, n=4) | |
* ... kleinere Werte sind besser
DPC-Latenzzeit
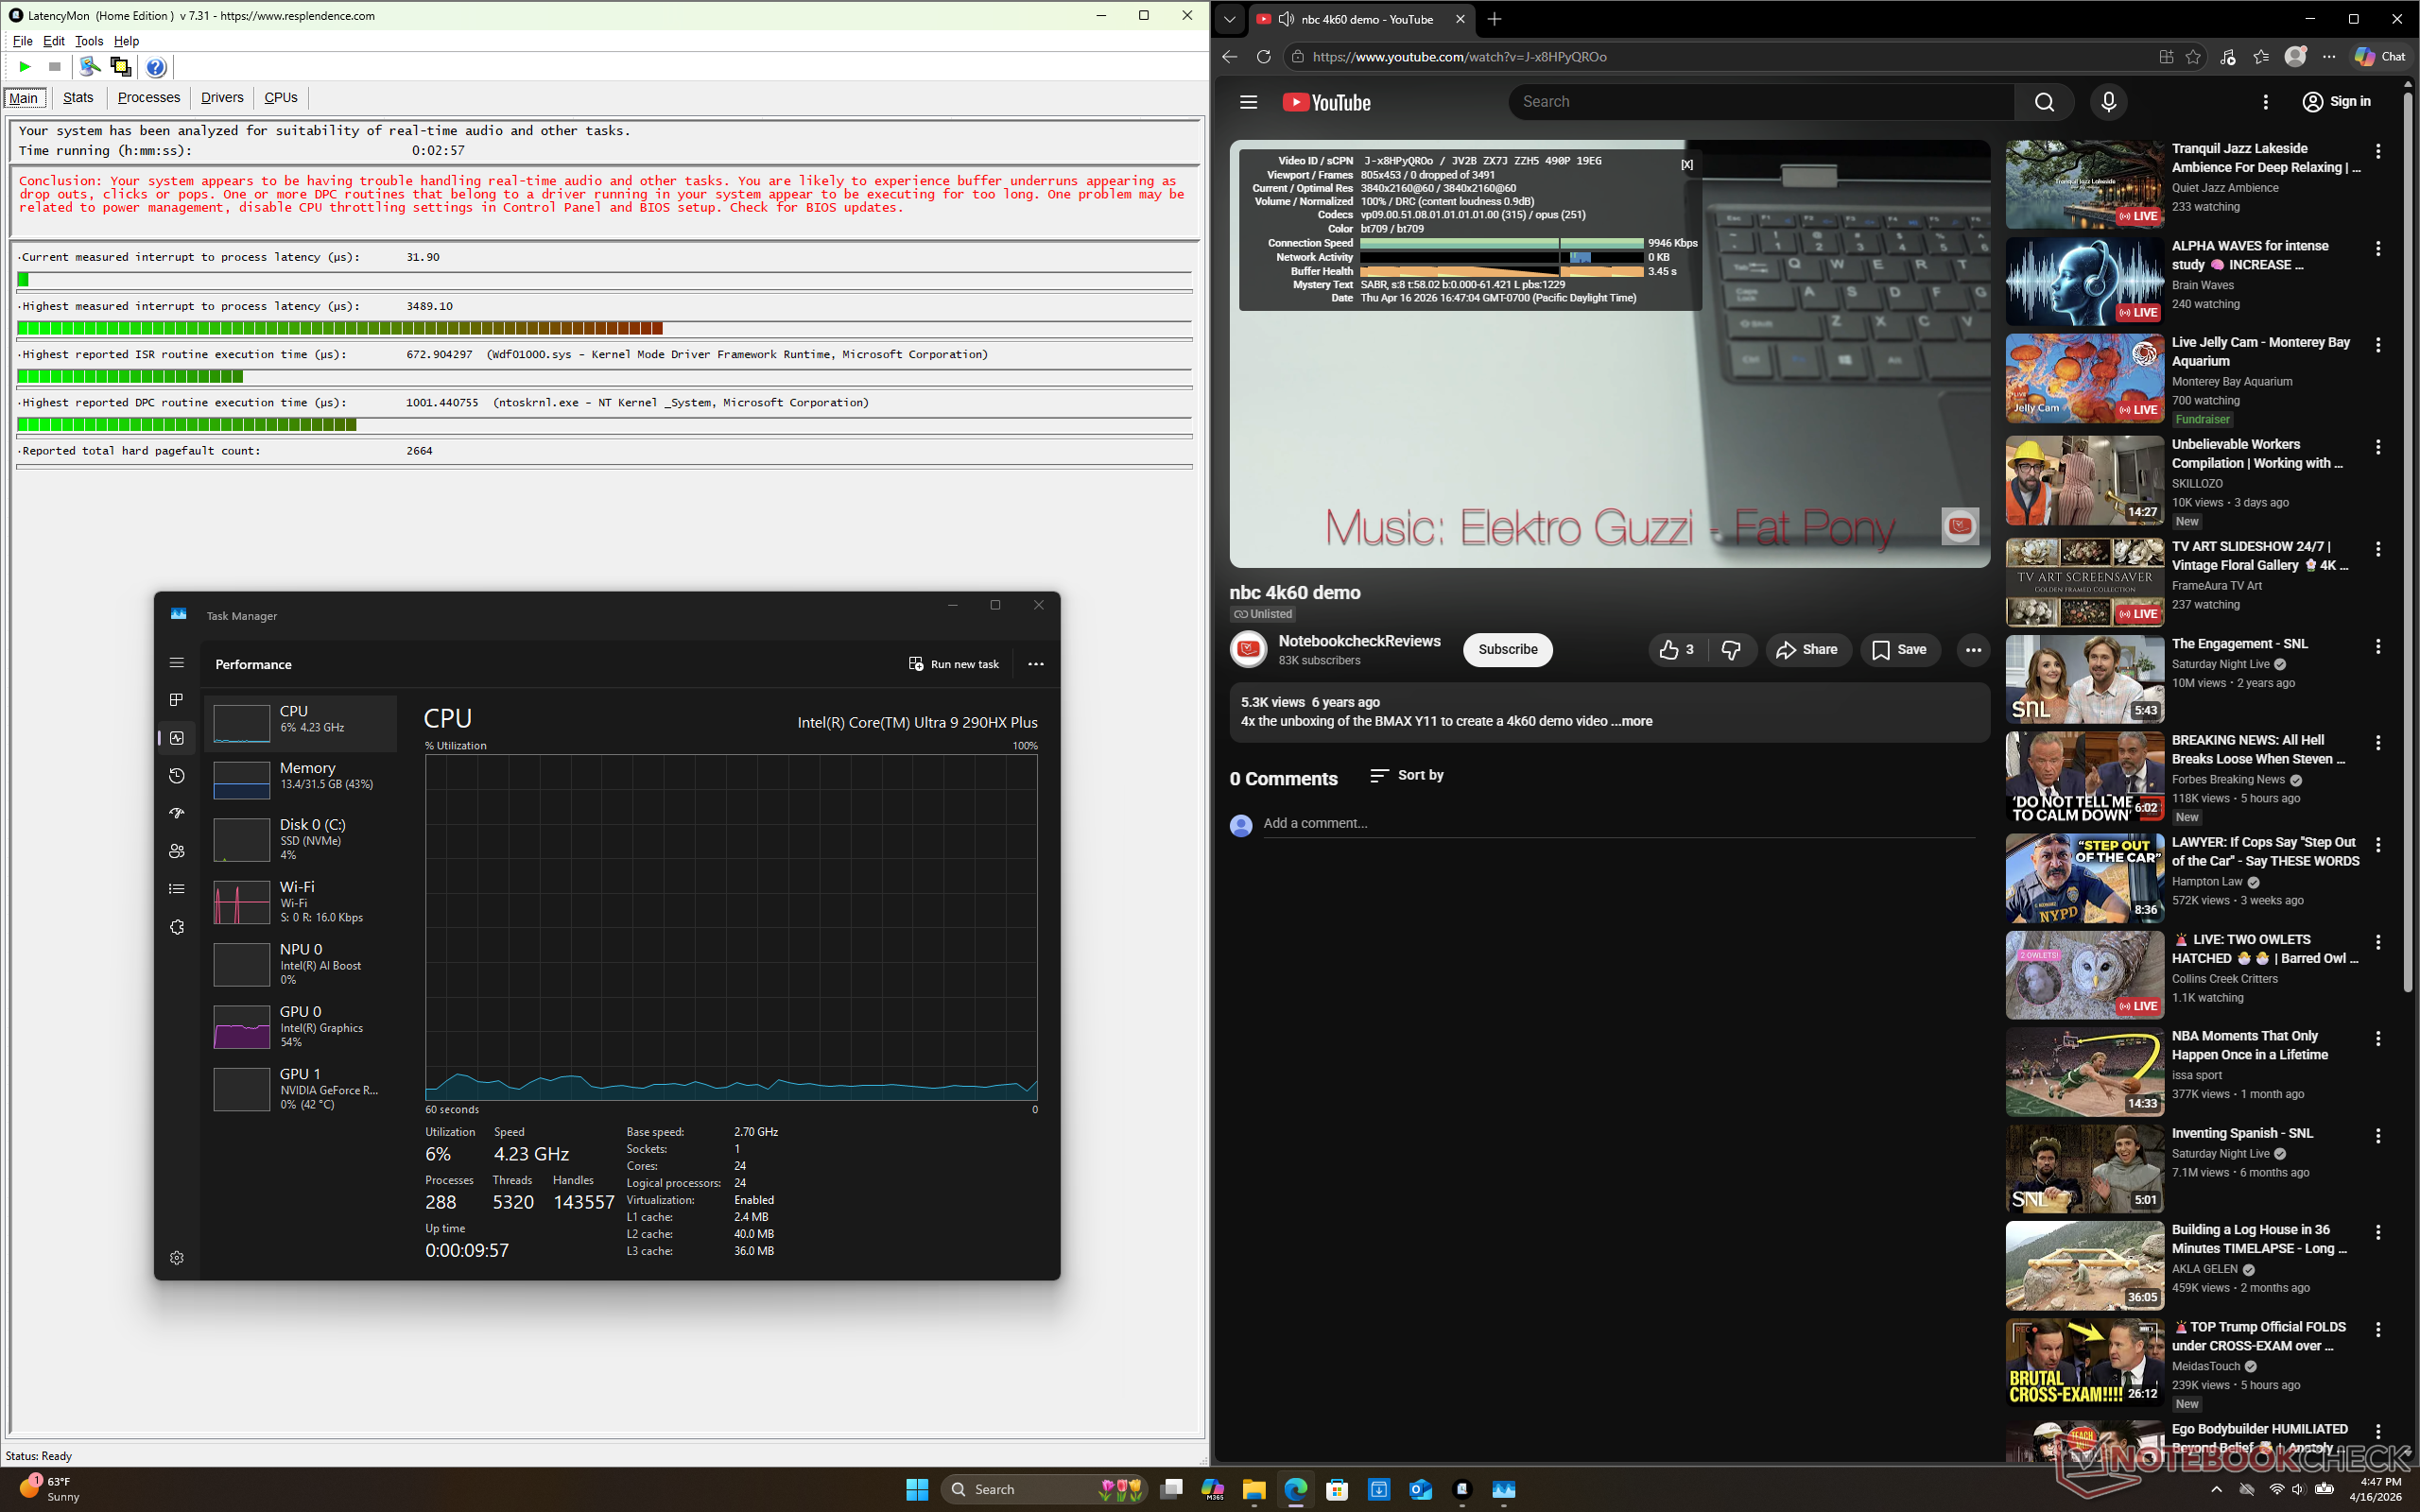
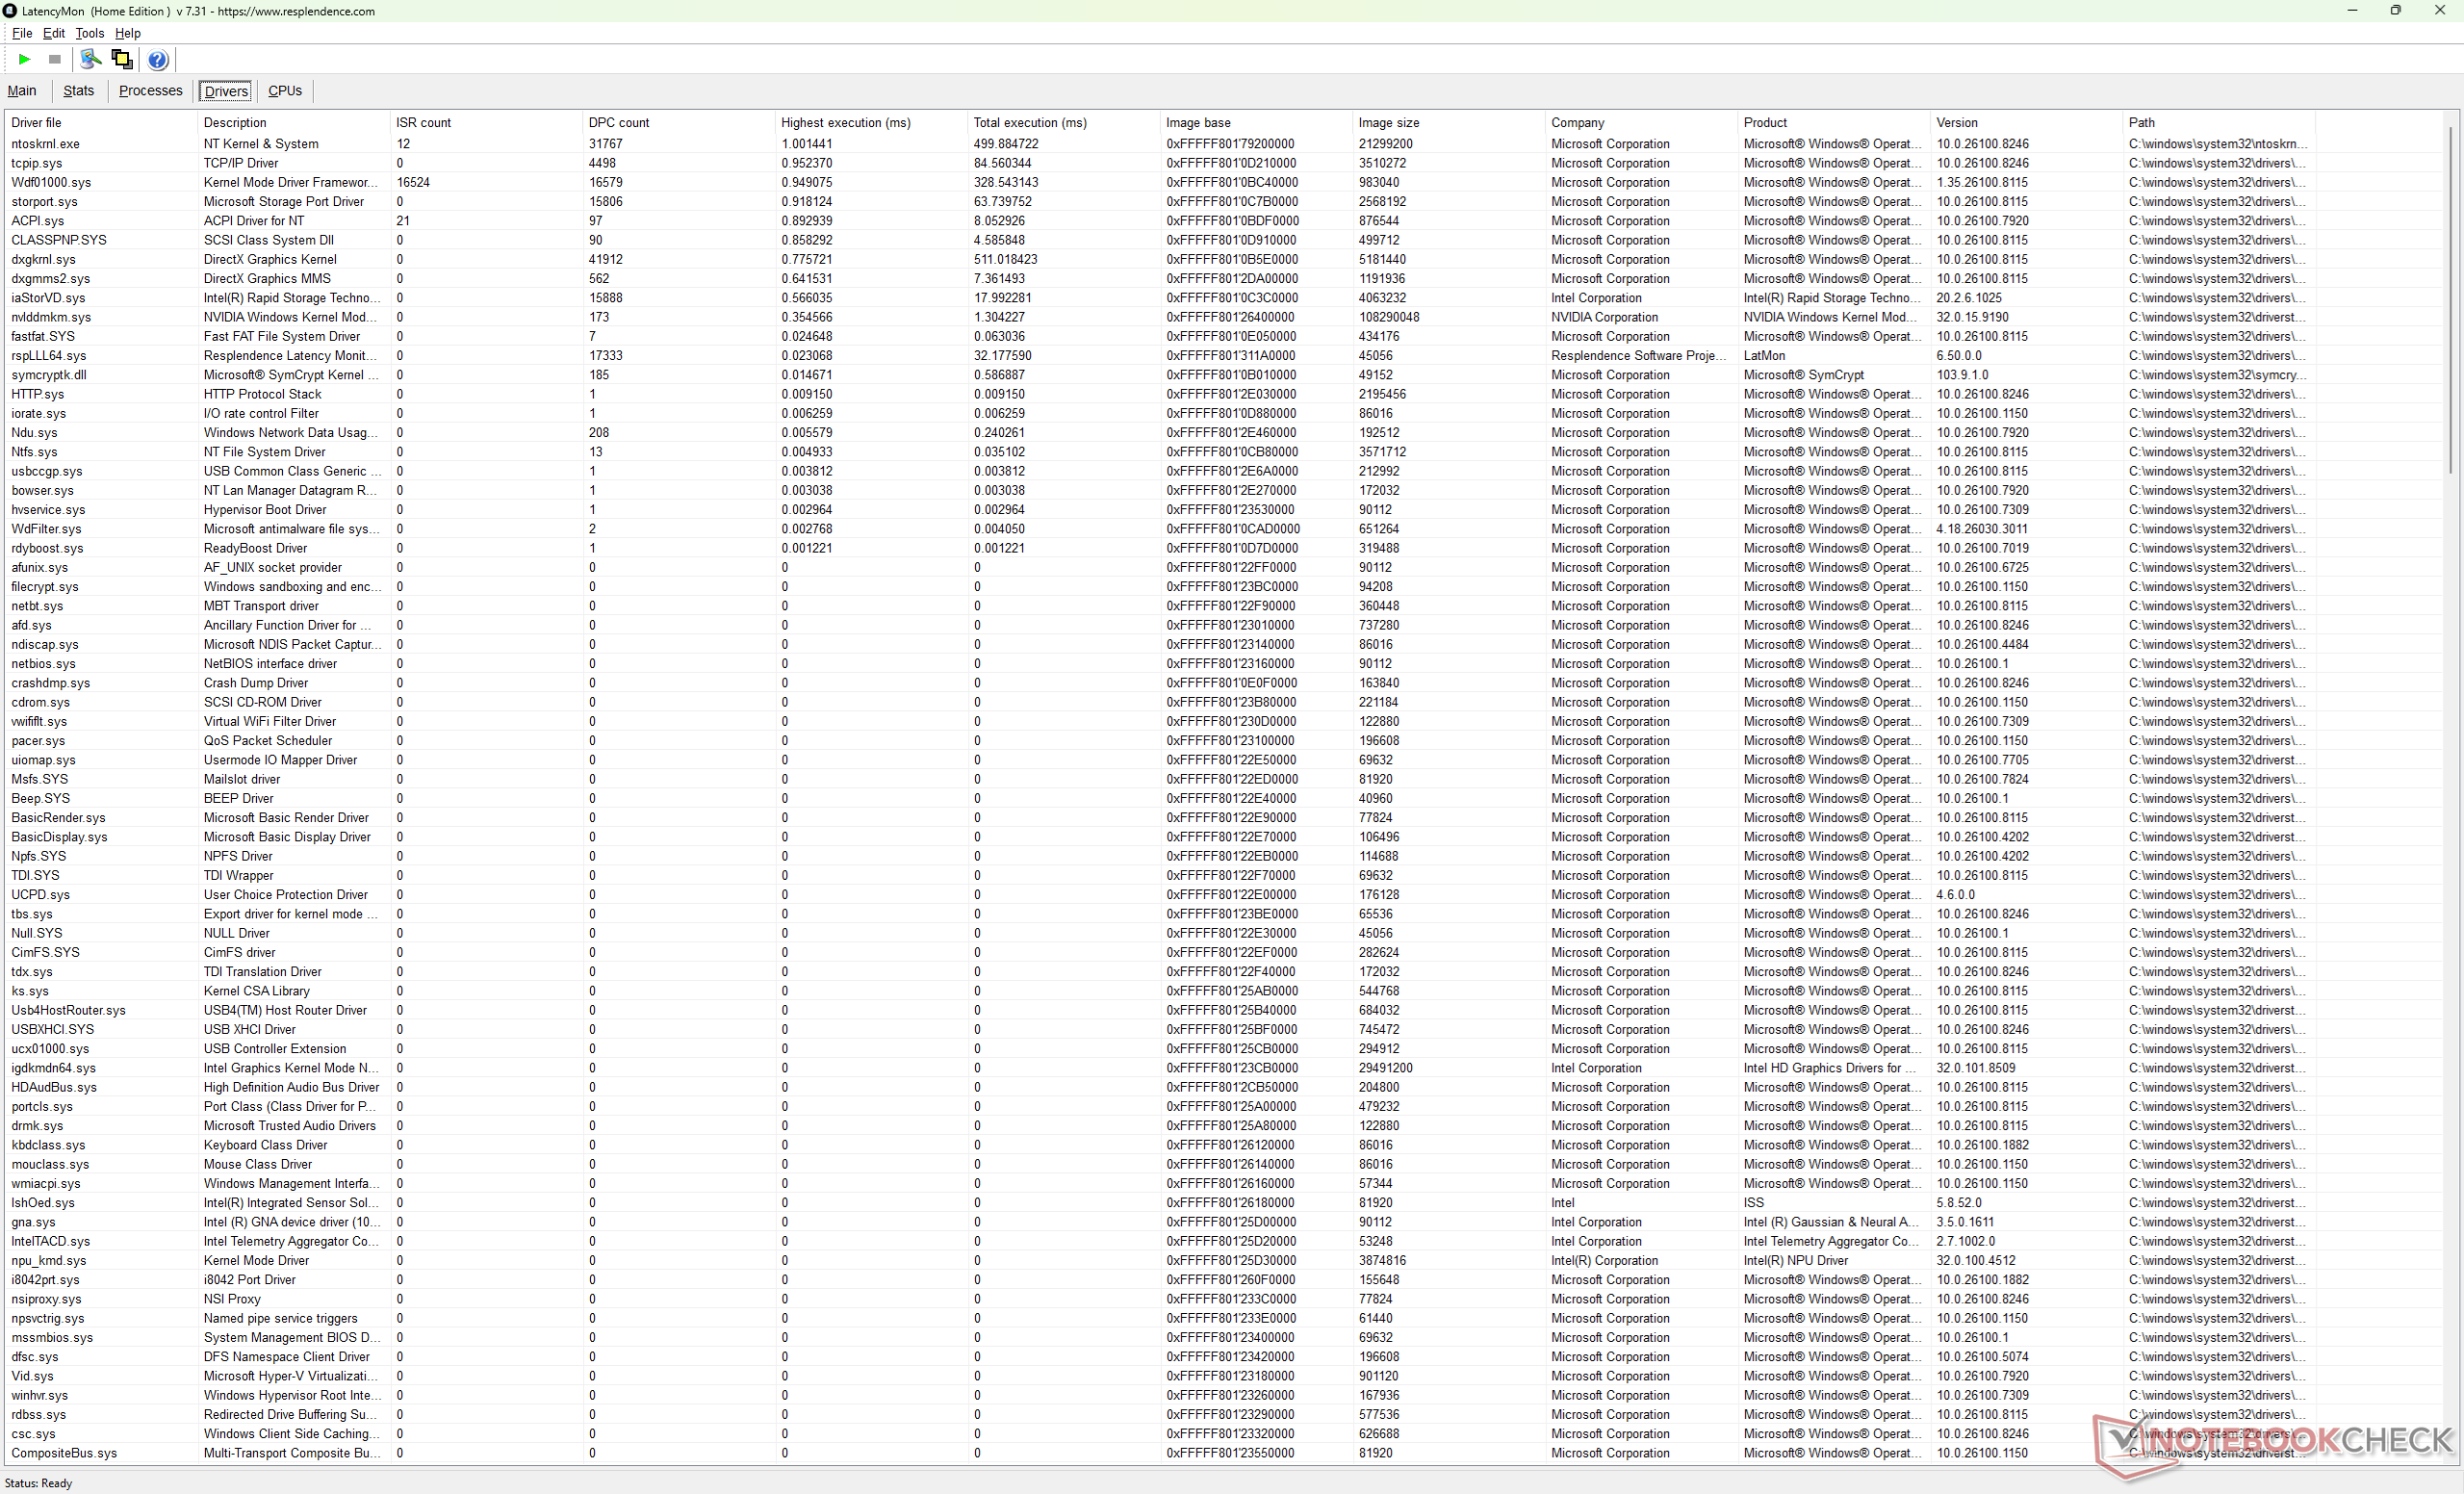
| DPC Latencies / LatencyMon - interrupt to process latency (max), Web, Youtube, Prime95 | |
| MSI Vector 16 HX AI A2XWHG | |
| Alienware 16 Area-51 Core Ultra 9 290HX Plus | |
| Alienware 16 Area-51 | |
| HP Omen Max 16 ah000 | |
| Asus ROG Zephyrus G16 GU605CW | |
| Lenovo Legion Pro 7i 16 Gen 10 | |
* ... kleinere Werte sind besser
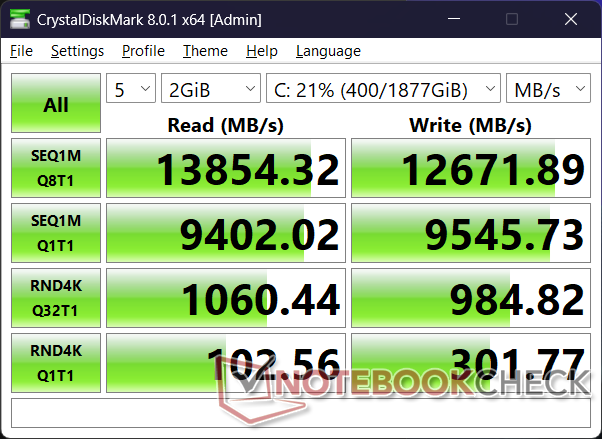
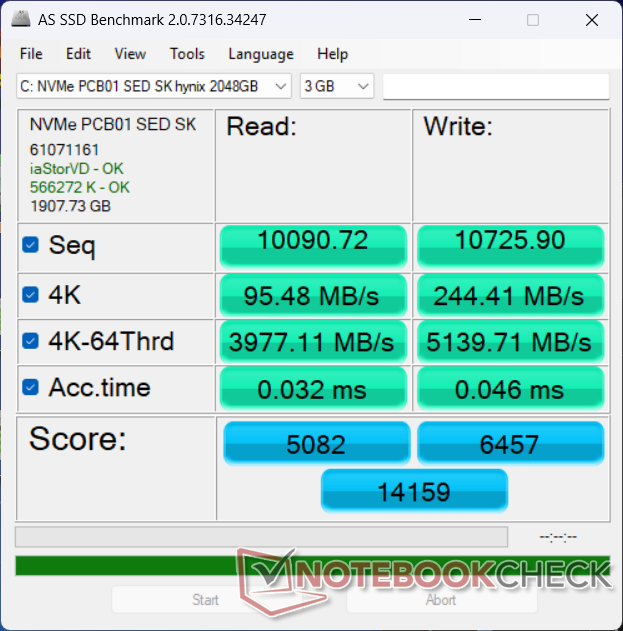
Speichergeräte
Beeindruckend: Die SK Hynix PCB01 PCIe5 x4 NVMe SSD ist in der Lage, Übertragungsraten von fast 14.000 MB/s ohne jegliche Drosselung zu erreichen.

* ... kleinere Werte sind besser
Disk Throttling: DiskSpd Read Loop, Queue Depth 8
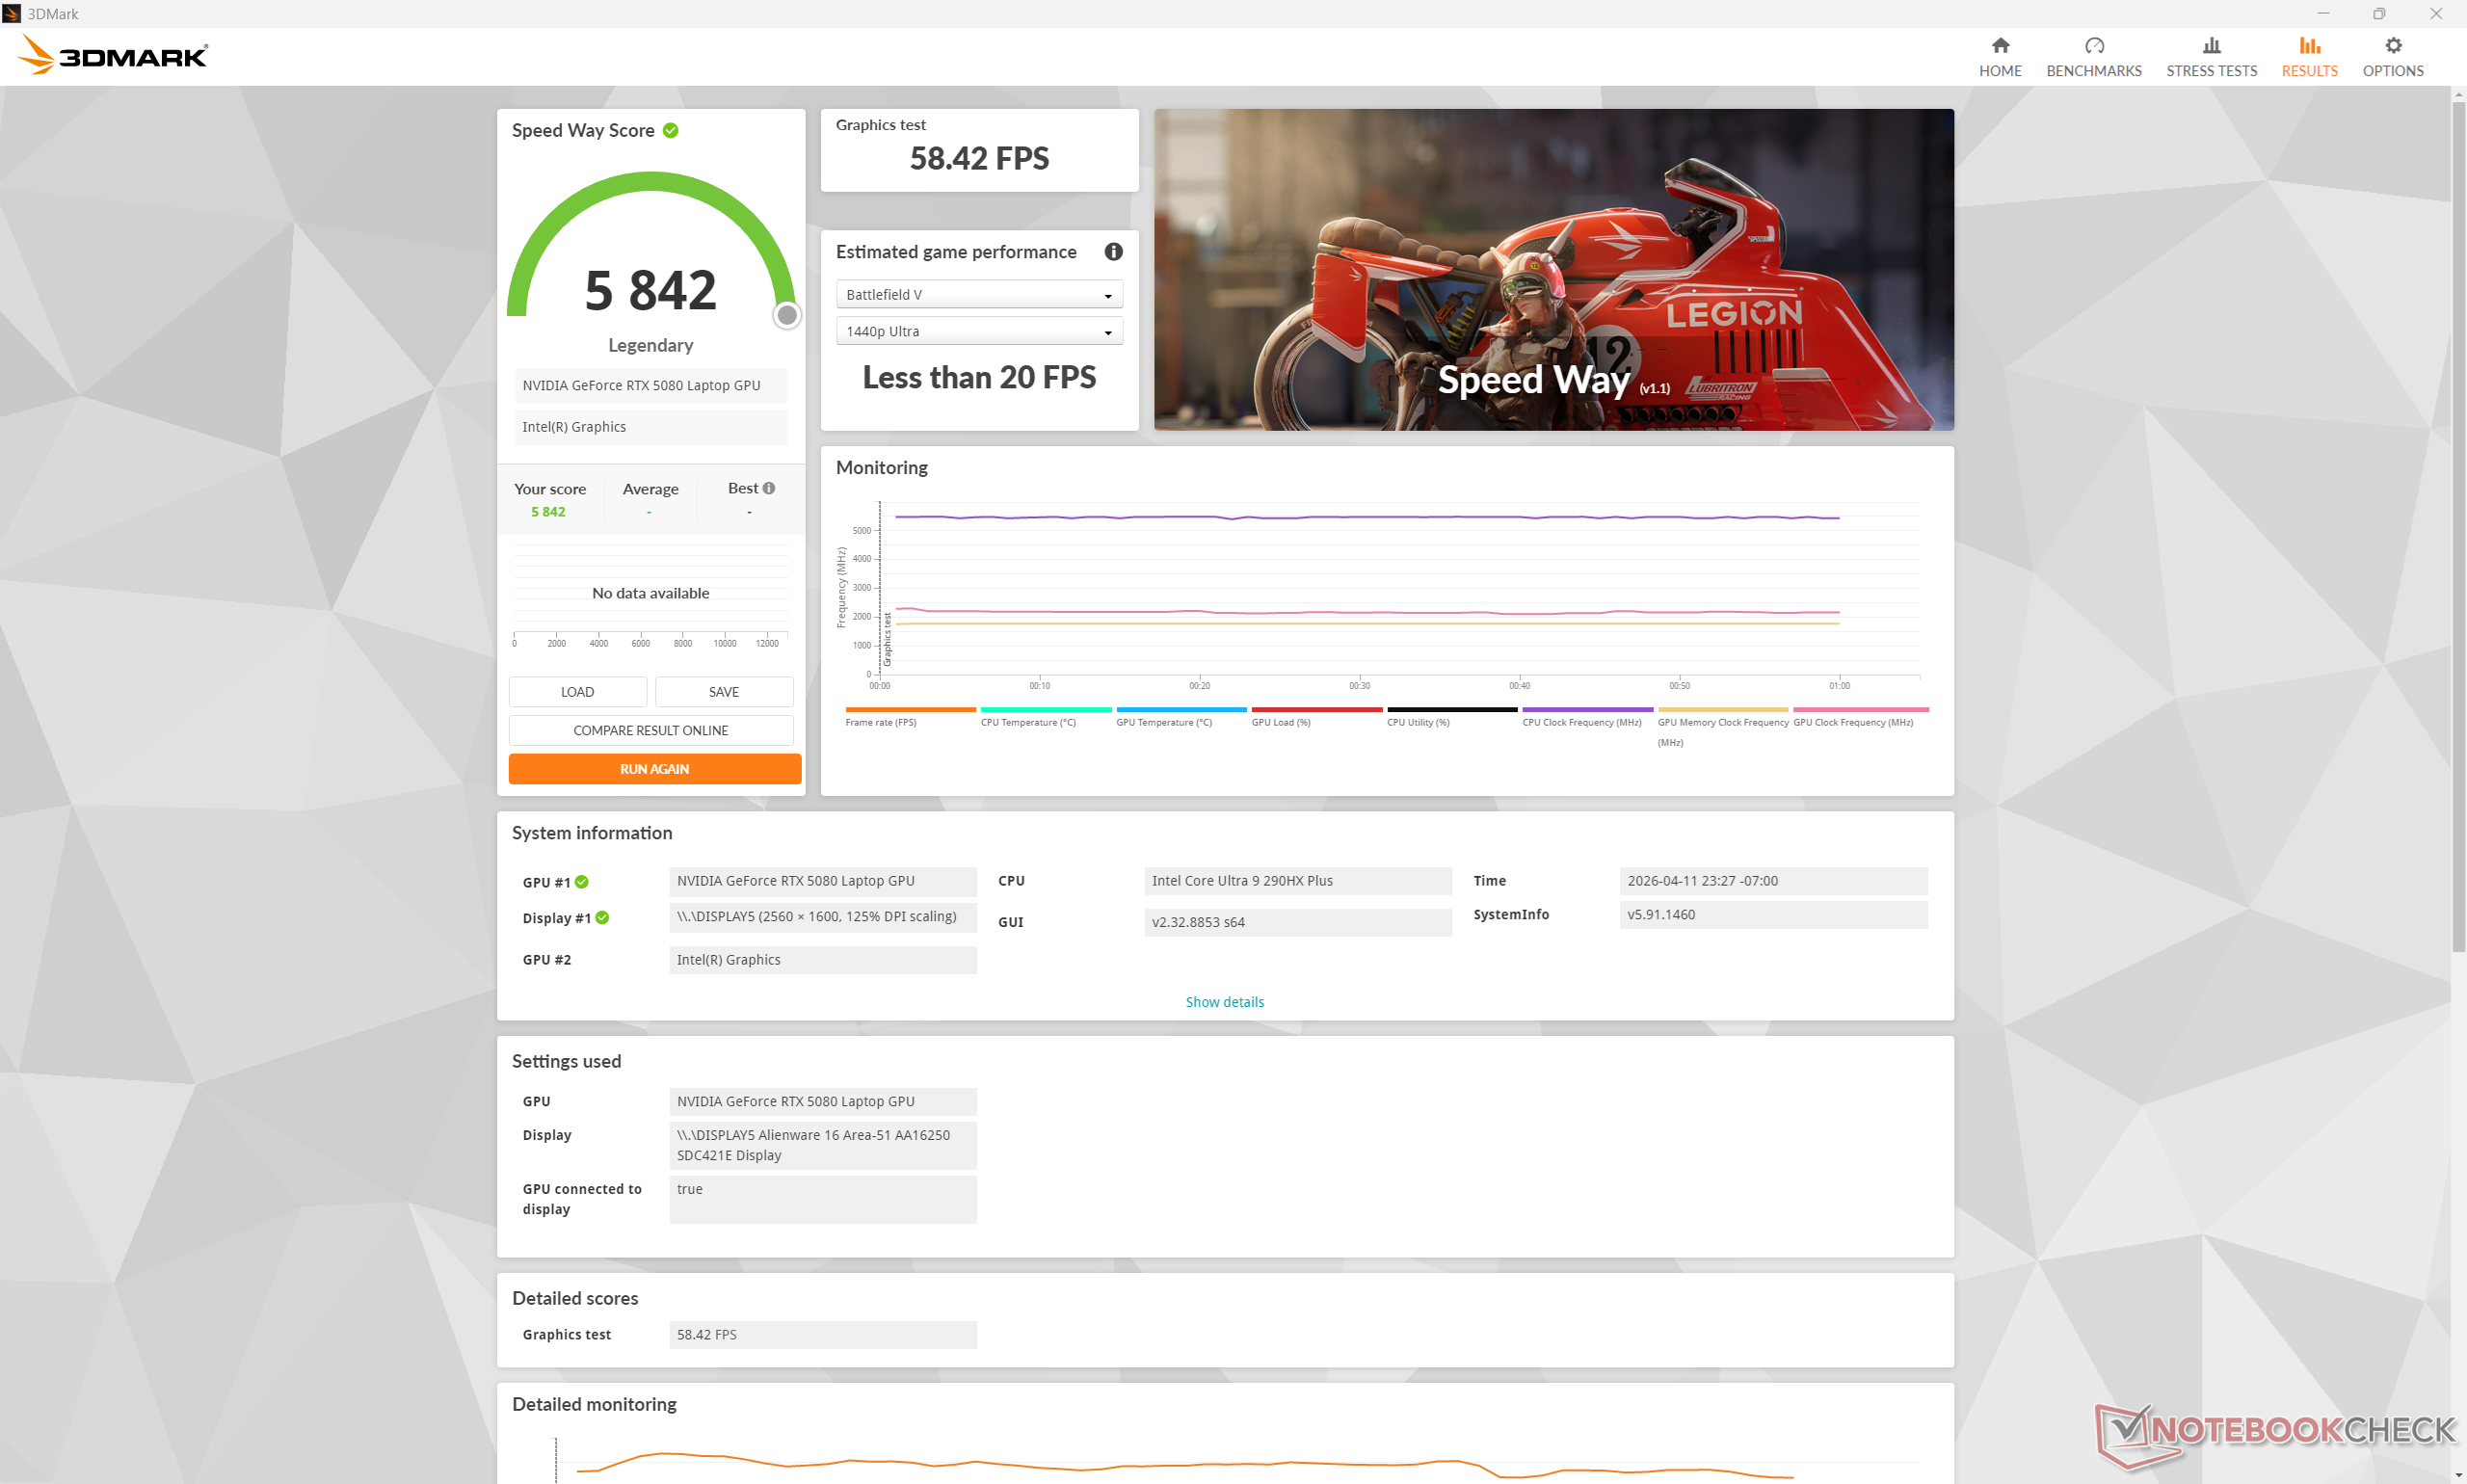
GPU-Leistung
Die GPU-Optionen GeForce RTX 5080 und 5090 bleiben die gleichen wie zuvor, ohne Änderungen am 175-W-TGP-Ziel. Dennoch sind die 3DMark Ergebnisse bei unserem neueren 2026-Modell um einige Prozentpunkte höher. Ein Upgrade von der RTX 5080 auf die RTX 5090 wird die Gaming Performance voraussichtlich nur um zehn bis 15 Prozent erhöhen.
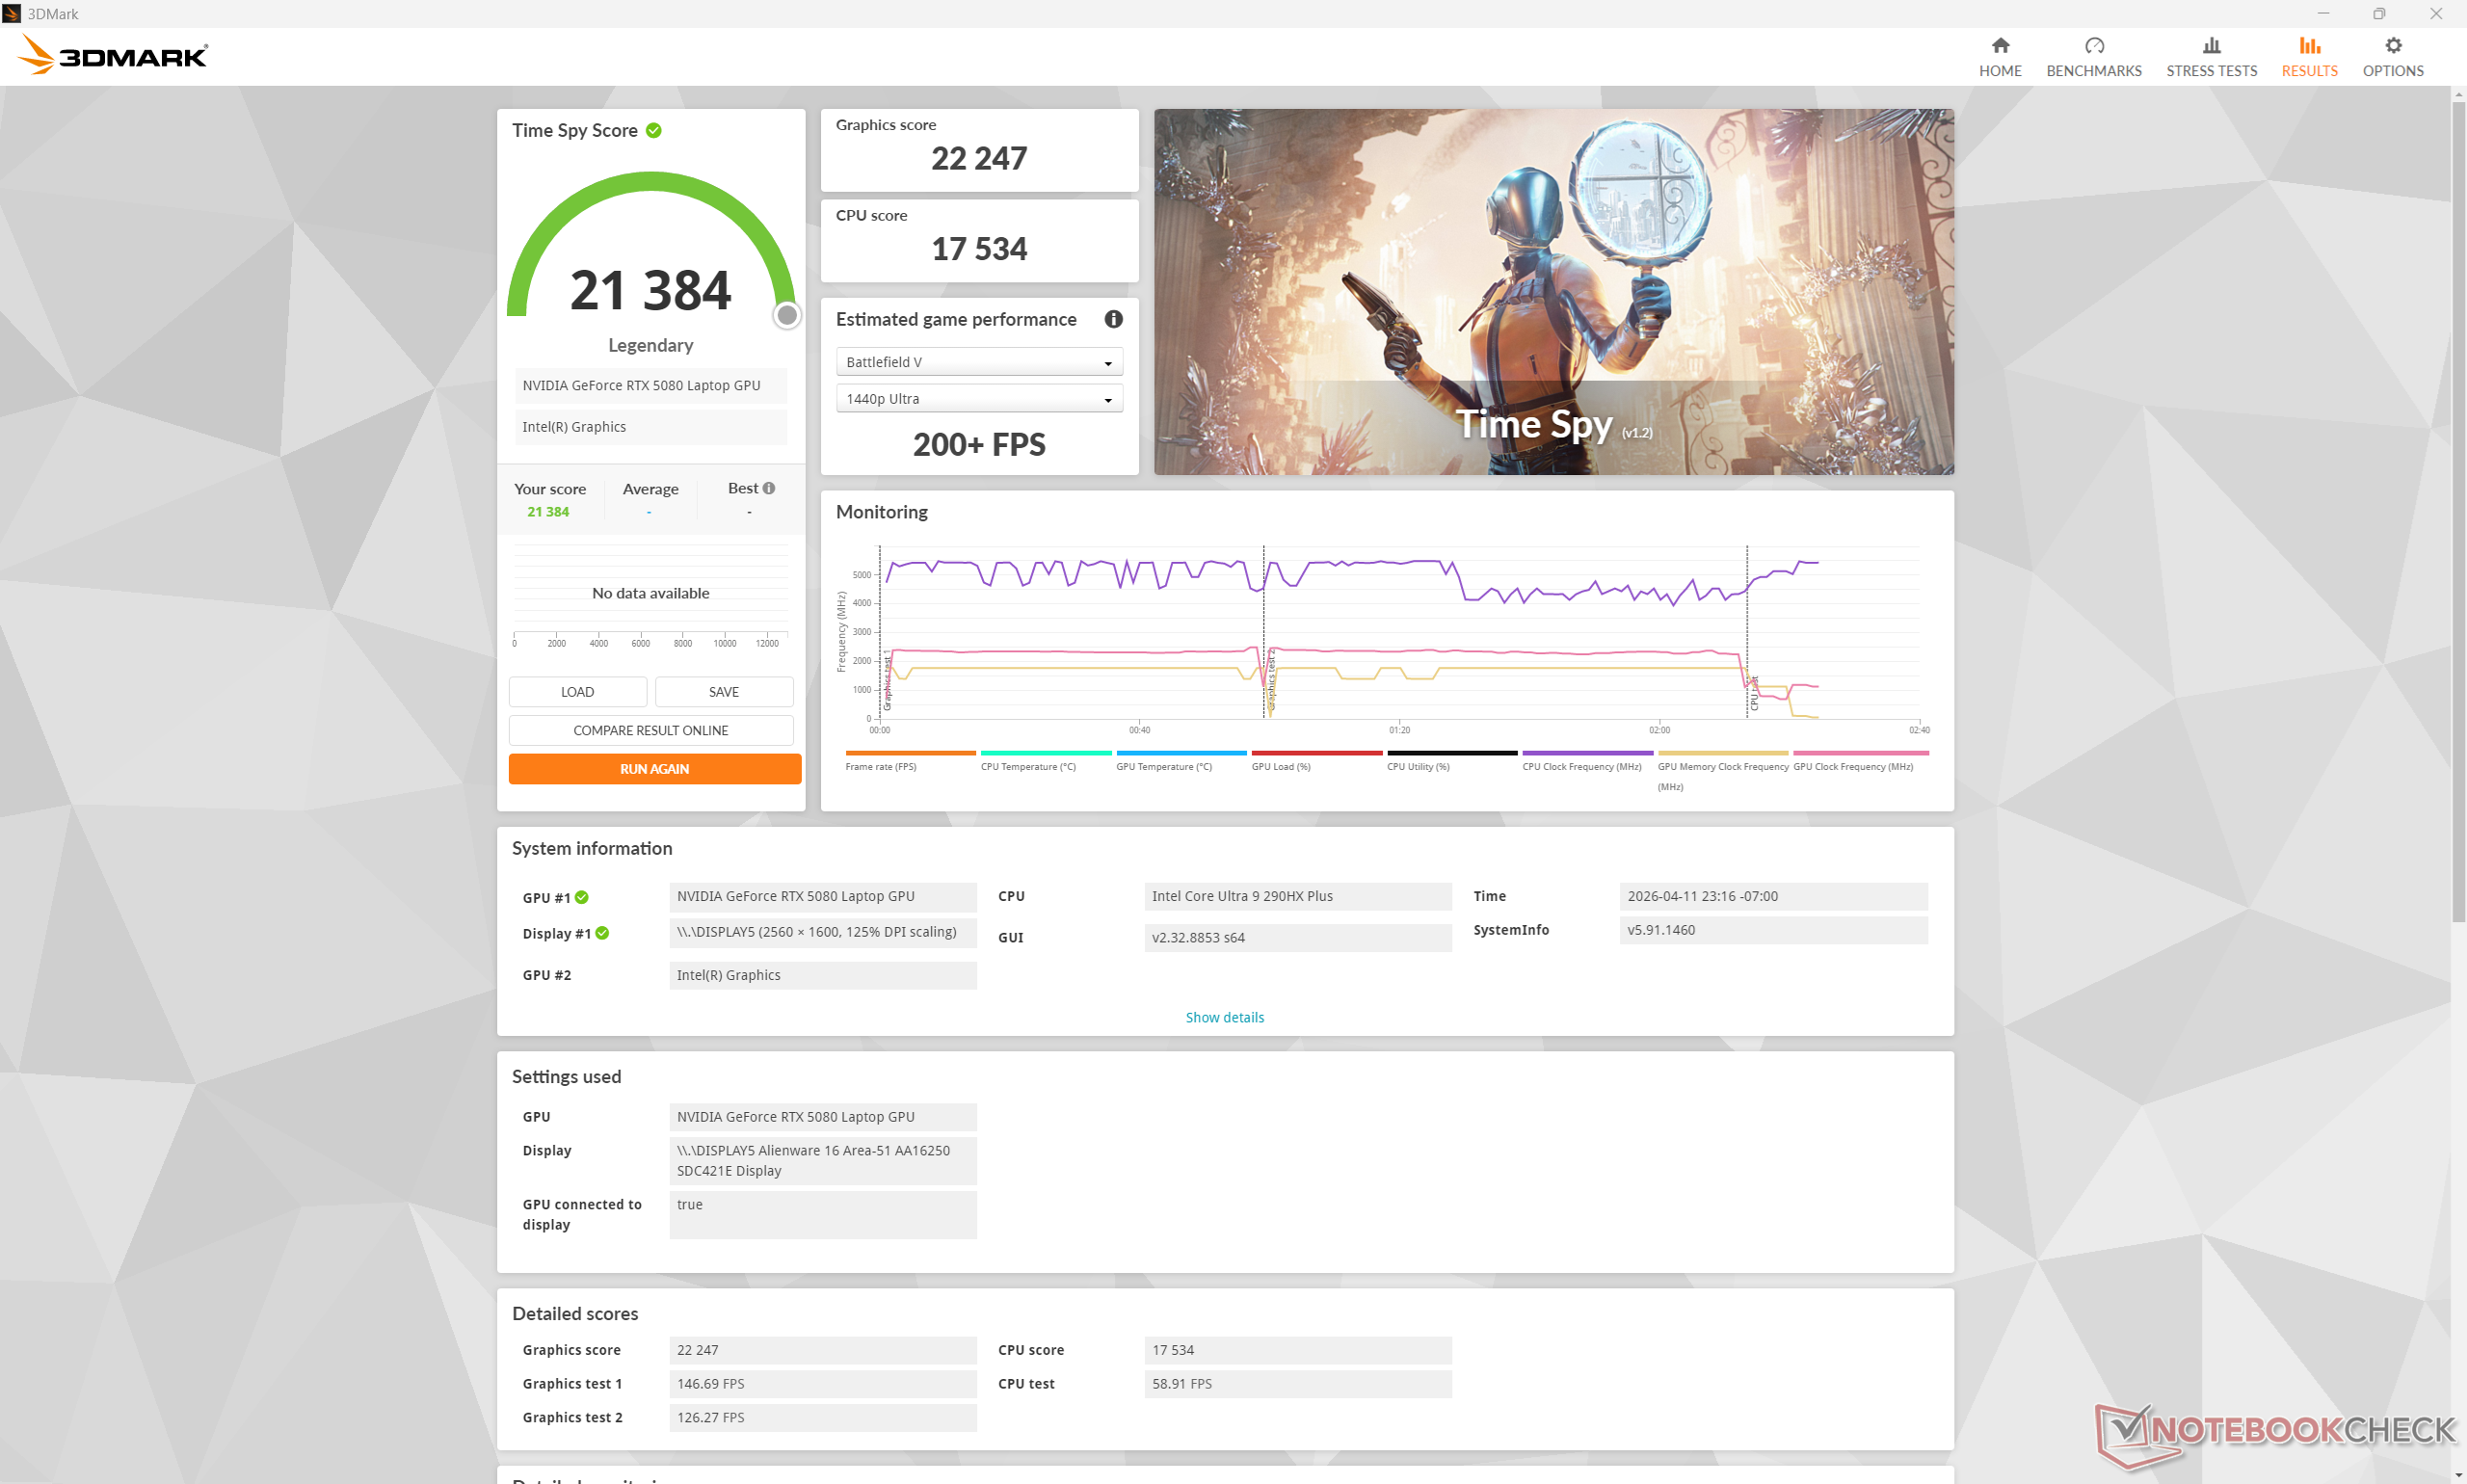
Besonders bemerkenswert ist, dass die Grafikleistung im Performance- oder im Modus-Balanced statt im Overdrive-Modus nur um 3 bzw. 6 Prozent abnimmt, wie aus unserer Time-Spy-Ergebnistabelle unten hervorgeht. Die Leistungsdefizite sind im Vergleich zu den meisten anderen Gaming-Laptops geringer als erwartet.
| Leistungsprofil | Graphics-Punktzahl | Physics-Punktzahl | Kombinierte Punktzahl |
| Overdrive-Modus | 22.247 | 17.534 | 21.384 |
| Performance-Modus | 21.478 (-3 %) | 17.530 (-0 %) | 20.776 (-3 %) |
| Ausgeglichener Modus | 20.815 (-6 %) | 17.251 (-2 %) | 20.189 (-6 %) |
| Akku-Leistung | 13.861 (-38 %) | 13.580 (-23 %) | 13.818 (-35 %) |
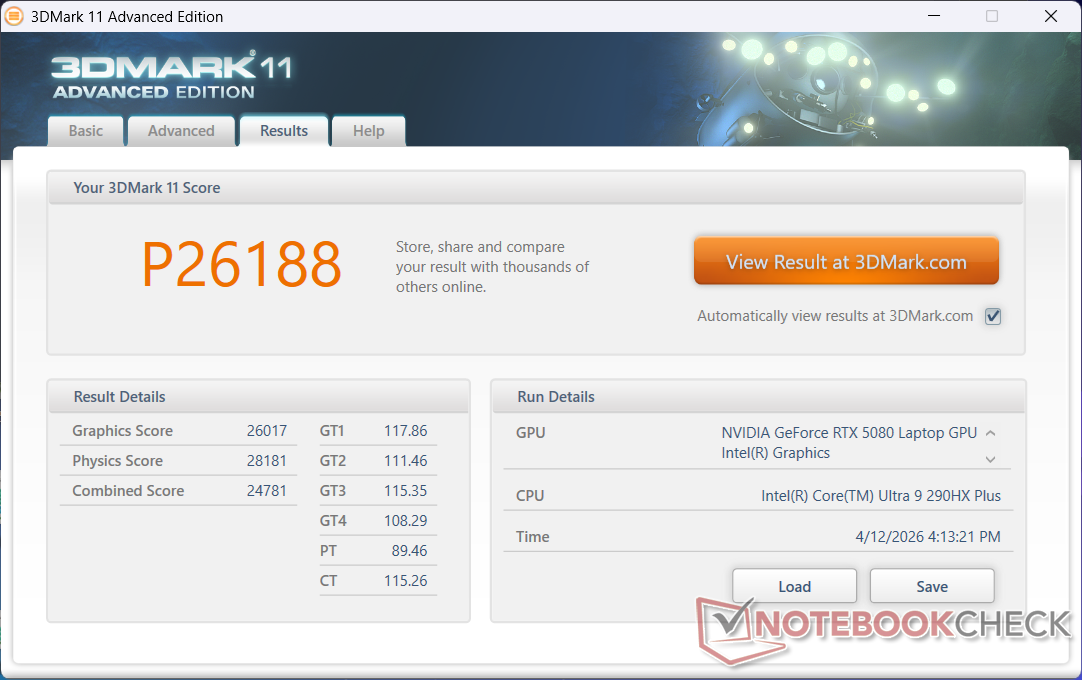

| 3DMark 11 Performance | 26188 Punkte | |
| 3DMark Cloud Gate Standard Score | 74132 Punkte | |
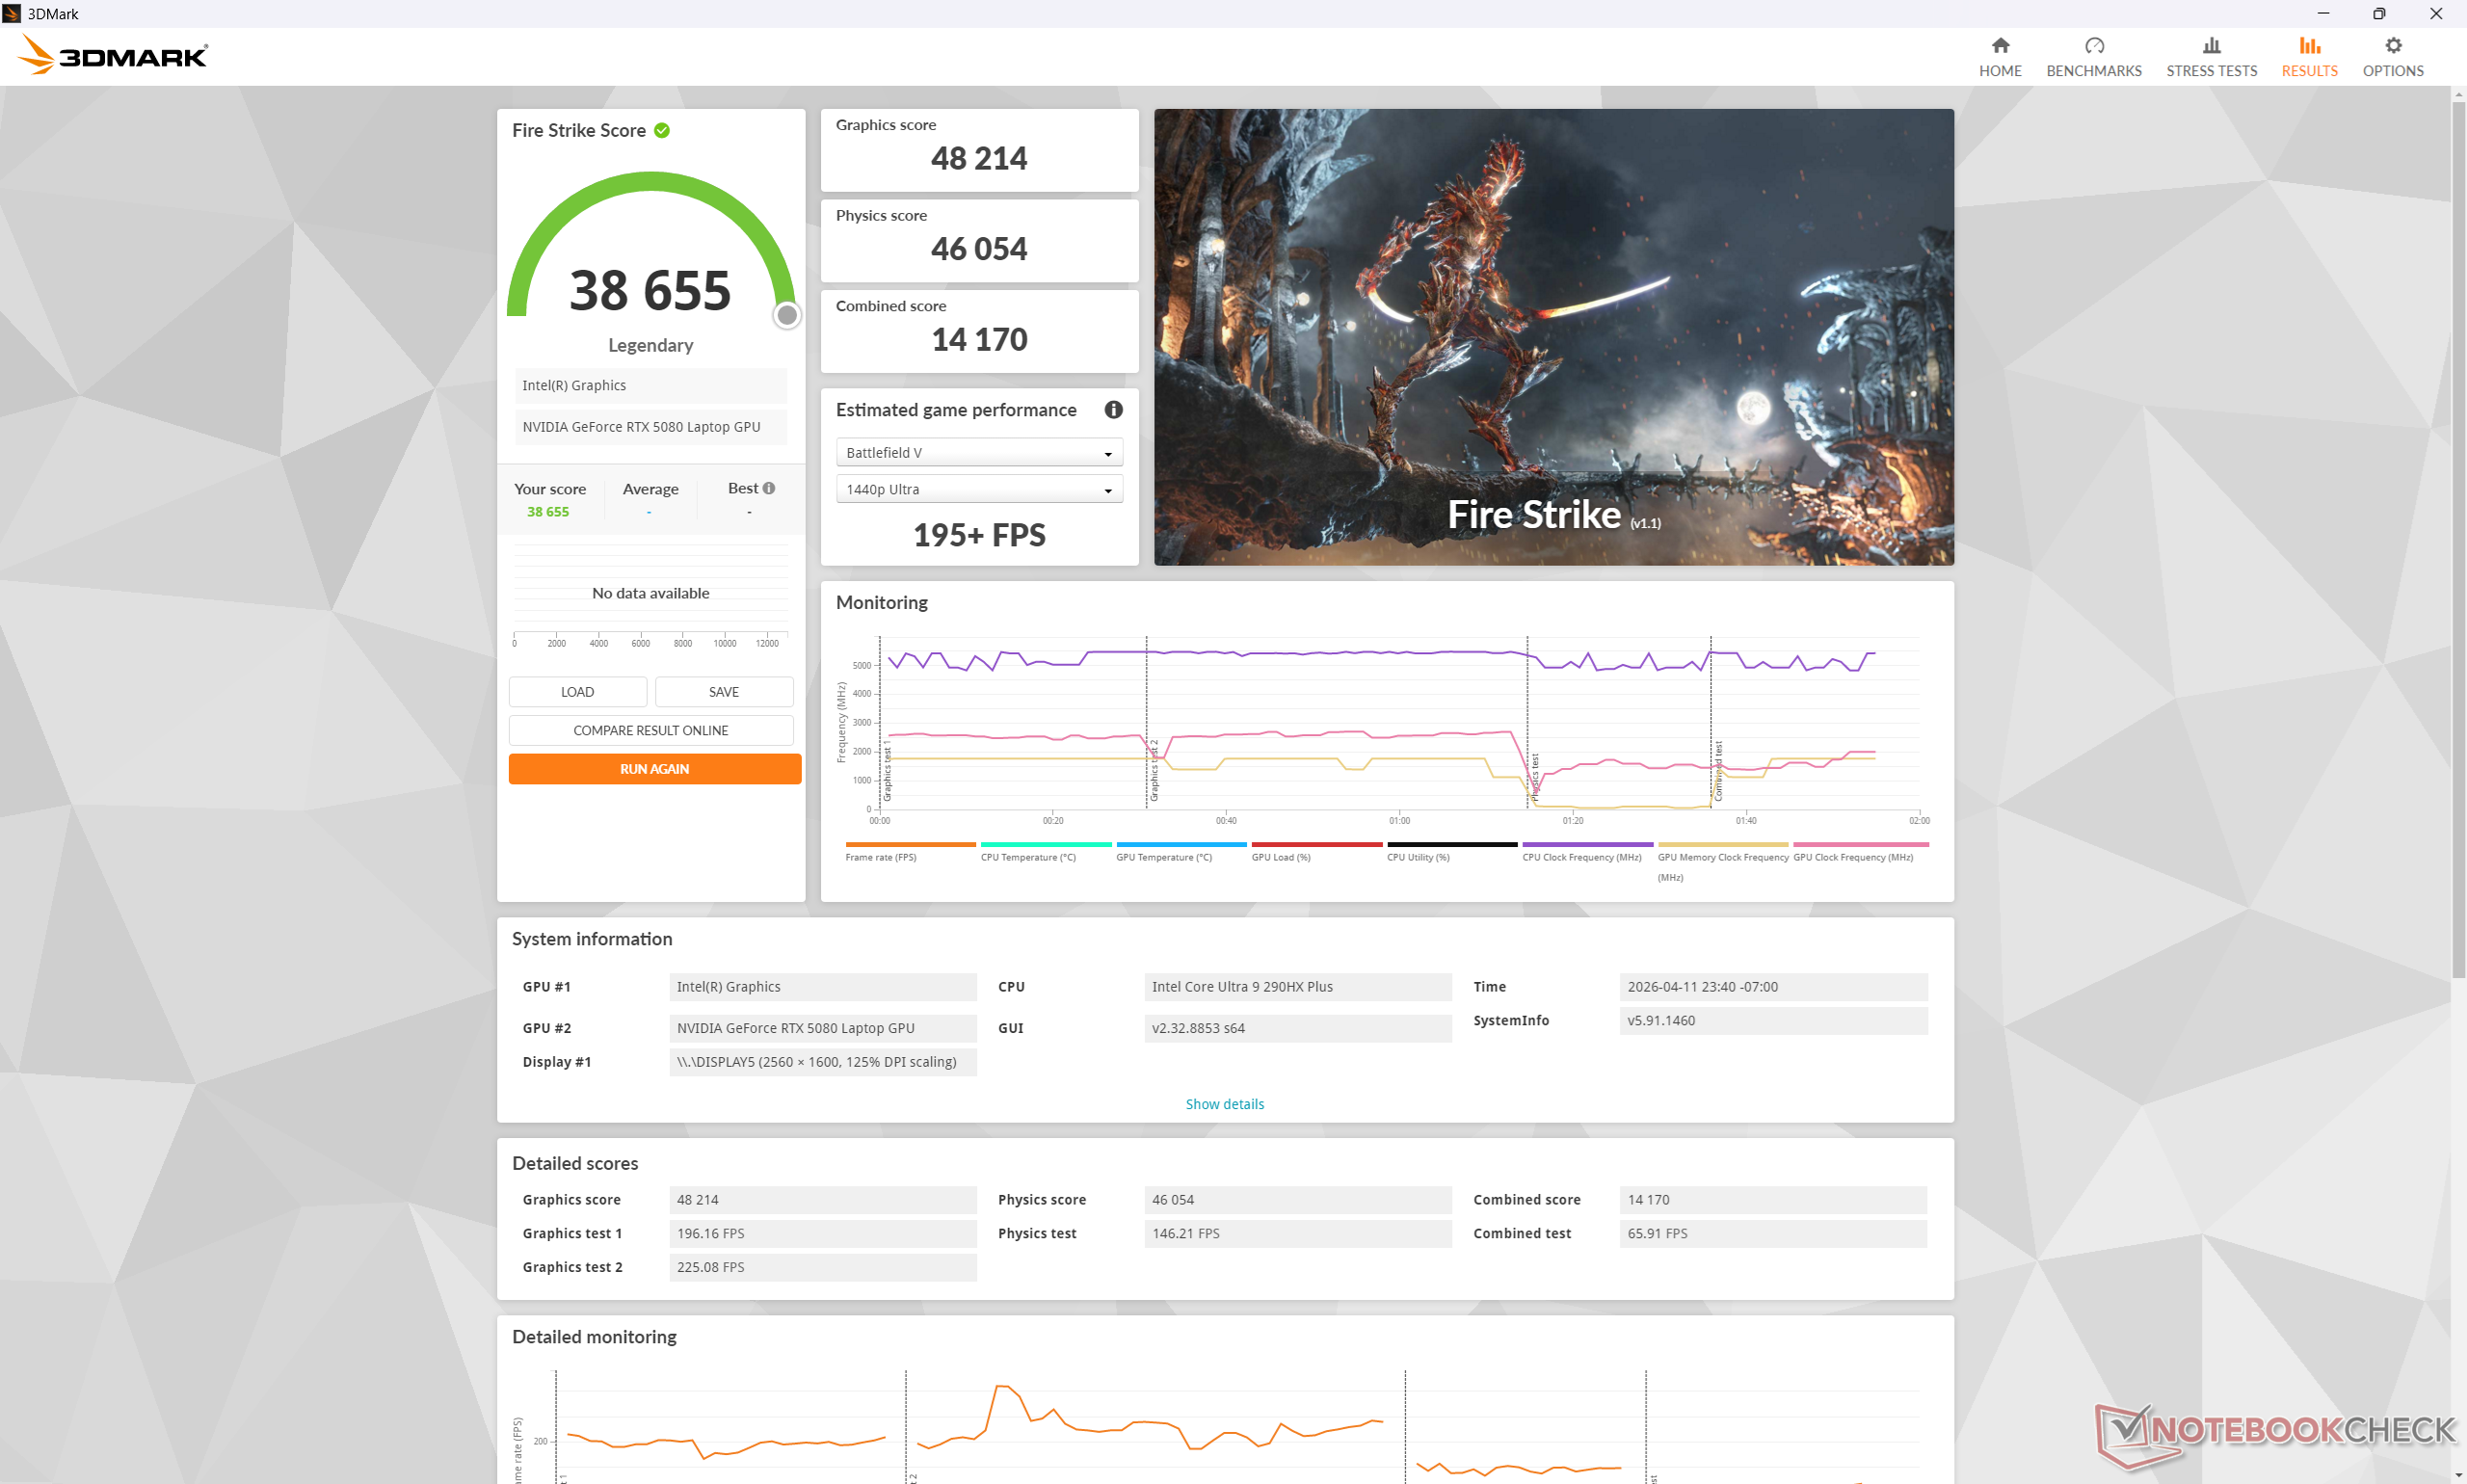
| 3DMark Fire Strike Score | 38655 Punkte | |
| 3DMark Time Spy Score | 21384 Punkte | |
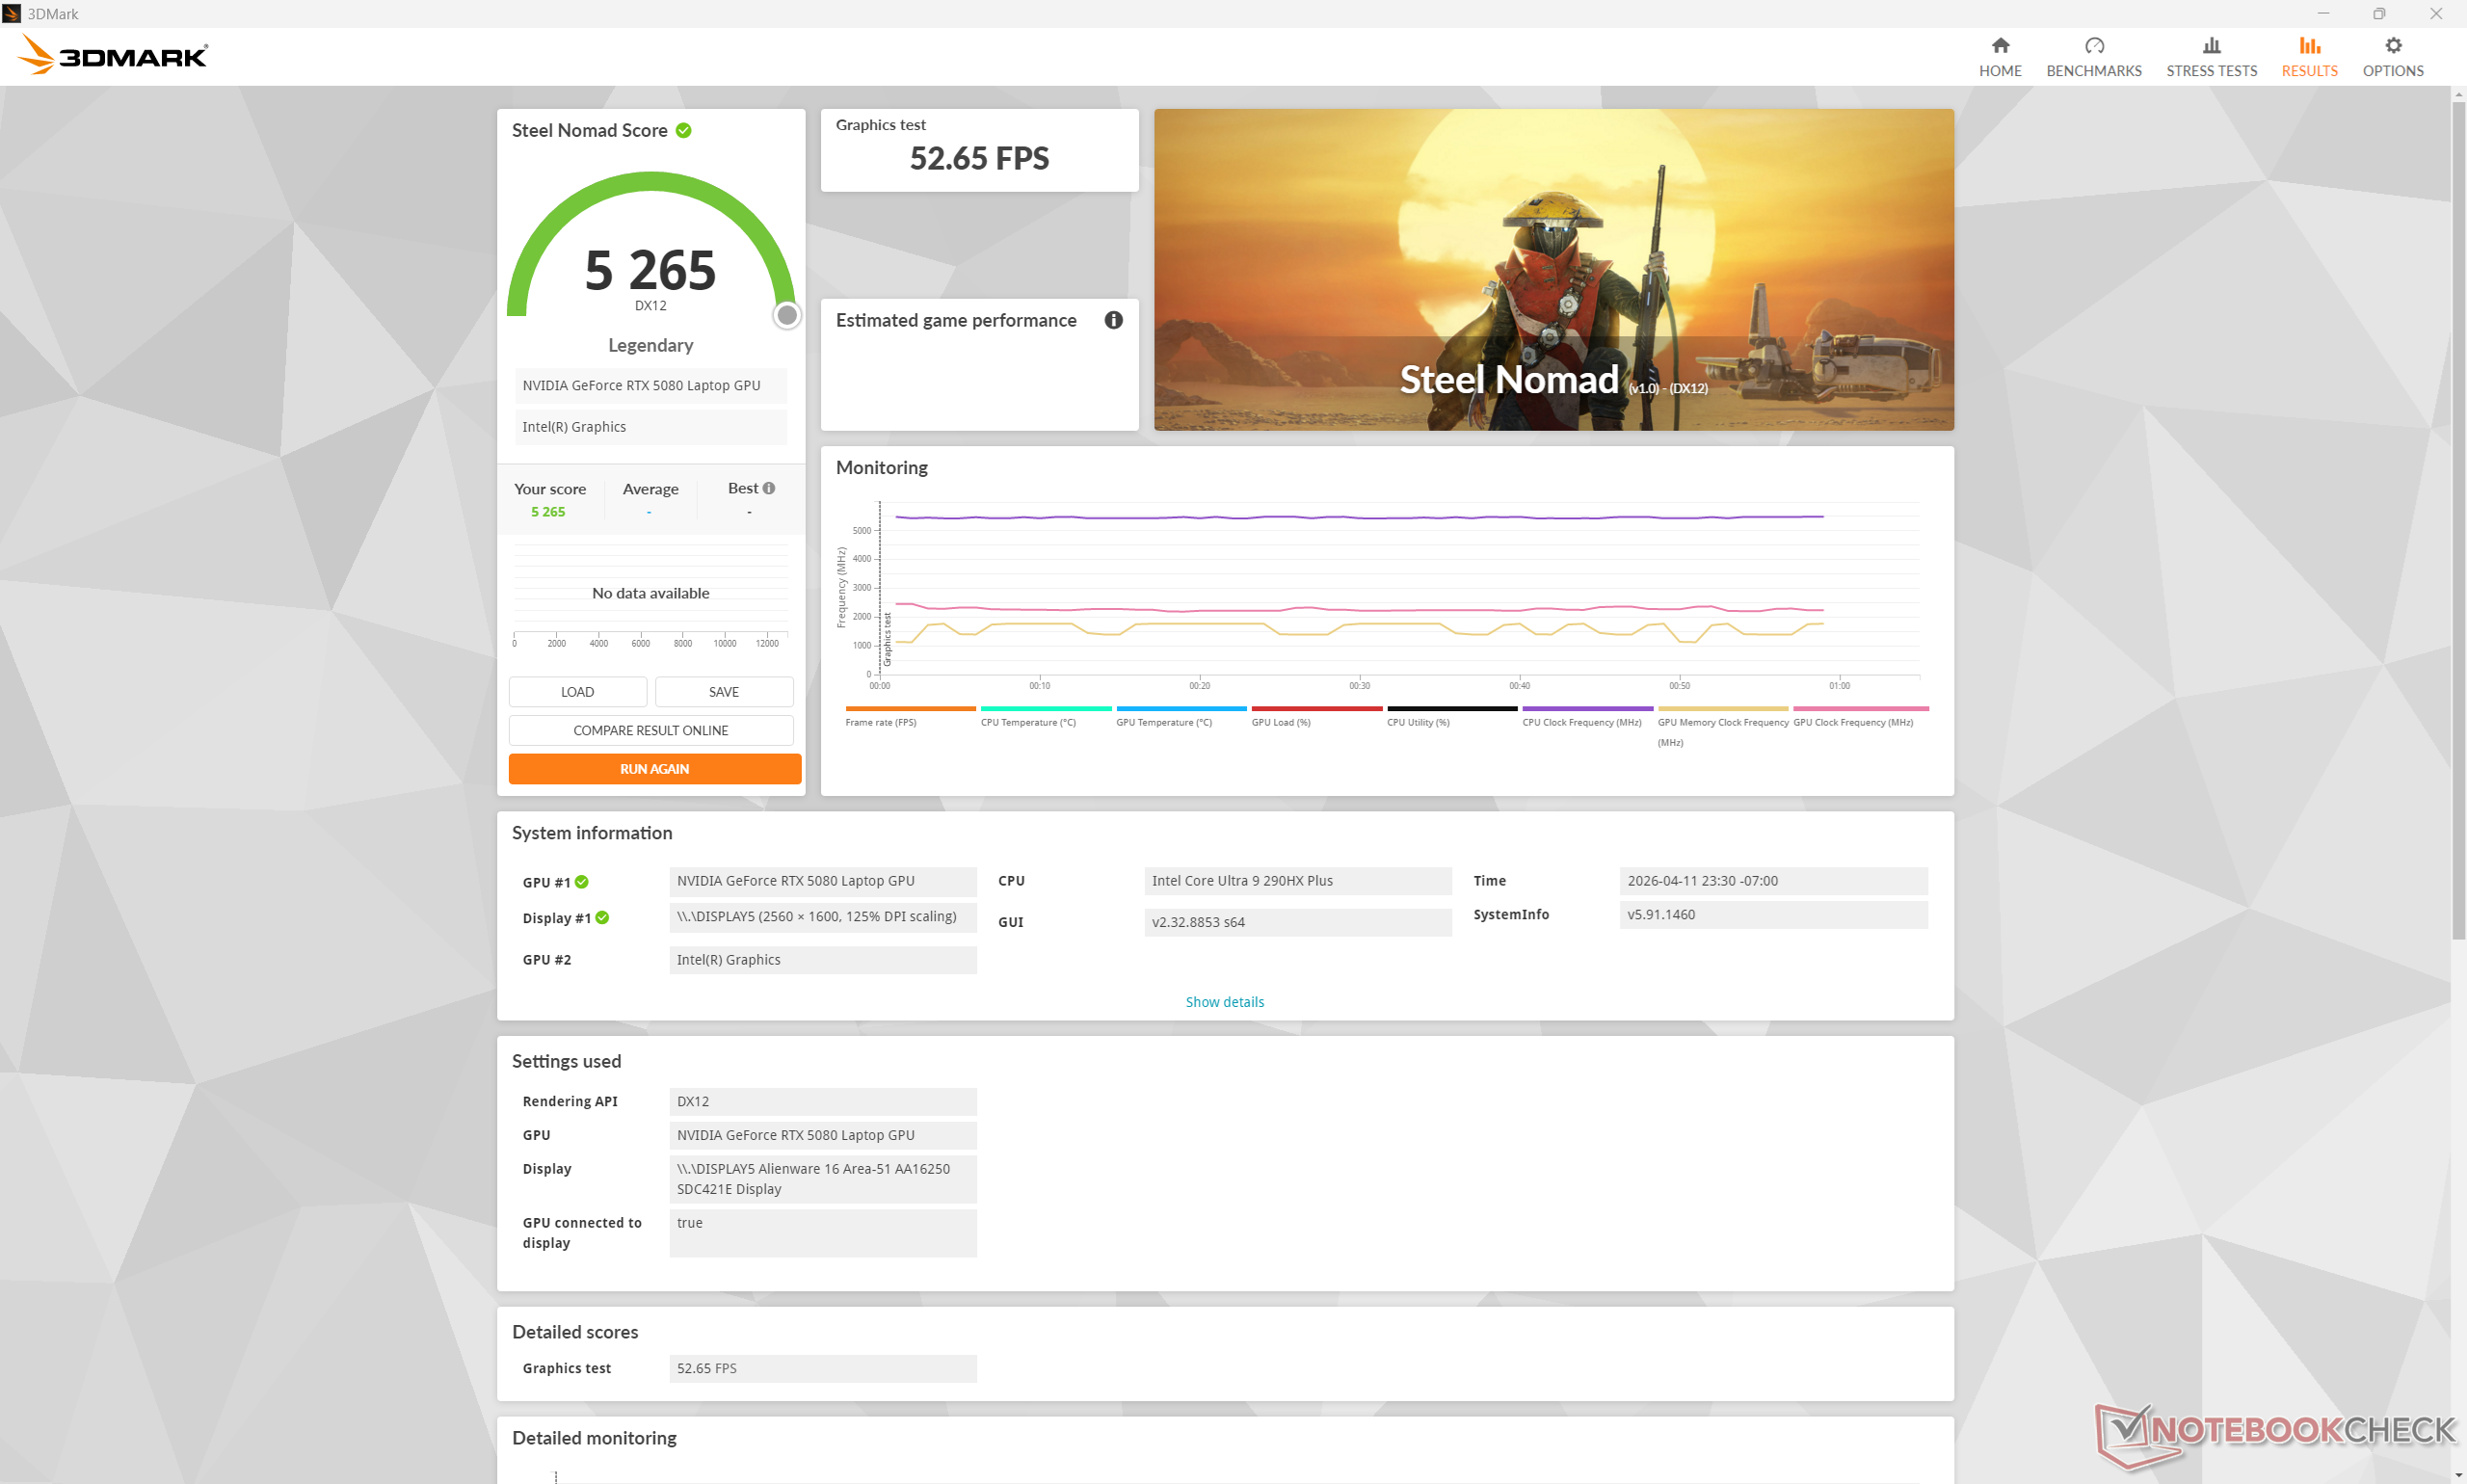
| 3DMark Steel Nomad Score | 5265 Punkte | |
Hilfe | ||
* ... kleinere Werte sind besser
| Performance Rating - Percent | |
| Lenovo Legion Pro 7i 16 Gen 10 -1! | |
| Alienware 16 Area-51 Core Ultra 9 290HX Plus -1! | |
| HP Omen Max 16 ah000 -2! | |
| Alienware 16 Area-51 -1! | |
| MSI Vector 16 HX AI A2XWHG -1! | |
| Asus ROG Zephyrus G16 GU605CW | |
| Cyberpunk 2077 - 1920x1080 Ultra Preset (FSR off) | |
| Lenovo Legion Pro 7i 16 Gen 10 | |
| Alienware 16 Area-51 Core Ultra 9 290HX Plus | |
| HP Omen Max 16 ah000 | |
| Alienware 16 Area-51 | |
| MSI Vector 16 HX AI A2XWHG | |
| Asus ROG Zephyrus G16 GU605CW | |
| Baldur's Gate 3 - 1920x1080 Ultra Preset AA:T | |
| Lenovo Legion Pro 7i 16 Gen 10 | |
| Alienware 16 Area-51 | |
| MSI Vector 16 HX AI A2XWHG | |
| Asus ROG Zephyrus G16 GU605CW | |
| GTA V - 1920x1080 Highest AA:4xMSAA + FX AF:16x | |
| Alienware 16 Area-51 Core Ultra 9 290HX Plus | |
| MSI Vector 16 HX AI A2XWHG | |
| Asus ROG Zephyrus G16 GU605CW | |
| Final Fantasy XV Benchmark - 1920x1080 High Quality | |
| Lenovo Legion Pro 7i 16 Gen 10 | |
| HP Omen Max 16 ah000 | |
| Alienware 16 Area-51 Core Ultra 9 290HX Plus | |
| Alienware 16 Area-51 | |
| MSI Vector 16 HX AI A2XWHG | |
| Asus ROG Zephyrus G16 GU605CW | |
| Strange Brigade - 1920x1080 ultra AA:ultra AF:16 | |
| Lenovo Legion Pro 7i 16 Gen 10 | |
| Alienware 16 Area-51 Core Ultra 9 290HX Plus | |
| Alienware 16 Area-51 | |
| HP Omen Max 16 ah000 | |
| Asus ROG Zephyrus G16 GU605CW | |
| Dota 2 Reborn - 1920x1080 ultra (3/3) best looking | |
| Lenovo Legion Pro 7i 16 Gen 10 | |
| Alienware 16 Area-51 Core Ultra 9 290HX Plus | |
| MSI Vector 16 HX AI A2XWHG | |
| HP Omen Max 16 ah000 | |
| Alienware 16 Area-51 | |
| Asus ROG Zephyrus G16 GU605CW | |
Cyberpunk 2077 ultra FPS Grafik
| min. | mittel | hoch | max. | QHD DLSS | QHD FSR | QHD | 4K DLSS | 4K | |
|---|---|---|---|---|---|---|---|---|---|
| GTA V (2015) | 187.9 | 187.6 | 186.2 | 168.1 | 167.2 | 183.9 | |||
| Dota 2 Reborn (2015) | 216 | 191 | 184.3 | 170.9 | 165.9 | ||||
| Final Fantasy XV Benchmark (2018) | 234 | 232 | 201 | 157.5 | 93.6 | ||||
| X-Plane 11.11 (2018) | 171.5 | 154.6 | 129.5 | 101.3 | |||||
| Strange Brigade (2018) | 624 | 489 | 448 | 413 | 300 | 161.1 | |||
| Cyberpunk 2077 (2023) | 195.9 | 191.5 | 171.9 | 153.3 | 119.1 | 101.7 | 57.8 | 46.4 | |
| F1 24 (2024) | 341 | 375 | 351 | 136.9 | 141.2 | 136.2 | 89.2 | 76.5 | 44.8 |
| Black Myth: Wukong (2024) | 55 | 61 | 42 | 42 | 24 | ||||
| Monster Hunter Wilds (2025) | 85.5 | 82.5 | 69 | 58.7 | 43 | ||||
| Assassin's Creed Shadows (2025) | 59 | 59 | 51 | 49 | 37 |
Emissionen
Systemgeräusche
Die Lüftergeräusche und das Verhalten des Lüfters sind fast identisch mit denen des Alienware 16 aus dem Jahr 2025, trotz dem Leistungsanstieg bei dieser neuesten Version. Zu beachten ist, dass sich das Lüftergeräusch bei 48 dB(A), 49 dB(A) und 57 dB(A) stabilisiert, wenn Cyberpunk 2077 im Modus Balanced, Performance bzw. Overdrive läuft. Die Geräuschentwicklung wird deutlich reduziert, wenn man von Overdrive auf Performance wechselt und dabei nur <5 % der Grafikleistung verliert.
Lautstärkediagramm
| Idle |
| 23.2 / 28.2 / 28.3 dB(A) |
| Last |
| 28.8 / 57.1 dB(A) |
 | ||
30 dB leise 40 dB(A) deutlich hörbar 50 dB(A) störend |
||
min: | ||
| Alienware 16 Area-51 Core Ultra 9 290HX Plus Ultra 9 290HX Plus, GeForce RTX 5080 Laptop | Alienware 16 Area-51 Ultra 9 275HX, GeForce RTX 5080 Laptop | Lenovo Legion Pro 7i 16 Gen 10 Ultra 9 275HX, GeForce RTX 5080 Laptop | HP Omen Max 16 ah000 Ultra 9 275HX, GeForce RTX 5090 Laptop | MSI Vector 16 HX AI A2XWHG Ultra 7 255HX, GeForce RTX 5070 Ti Laptop | Asus ROG Zephyrus G16 GU605CW Ultra 9 285H, GeForce RTX 5080 Laptop | |
|---|---|---|---|---|---|---|
| Geräuschentwicklung | -2% | 4% | -16% | -21% | -20% | |
| aus / Umgebung * (dB) | 23.1 | 23.6 -2% | 22.9 1% | 22.8 1% | 25 -8% | 25.56 -11% |
| Idle min * (dB) | 23.2 | 25.4 -9% | 22.9 1% | 29 -25% | 33 -42% | 30 -29% |
| Idle avg * (dB) | 28.2 | 27.8 1% | 22.9 19% | 29 -3% | 34 -21% | 30 -6% |
| Idle max * (dB) | 28.3 | 28.1 1% | 26.3 7% | 29 -2% | 38 -34% | 30 -6% |
| Last avg * (dB) | 28.8 | 28.8 -0% | 27.8 3% | 47.7 -66% | 46 -60% | 53.55 -86% |
| Cyberpunk 2077 ultra * (dB) | 49 | 50.4 -3% | 54.2 -11% | 54.8 -12% | 47 4% | 53.5 -9% |
| Last max * (dB) | 57.1 | 56.4 1% | 53.9 6% | 61.1 -7% | 49 14% | 54.02 5% |
* ... kleinere Werte sind besser
Temperatur
Beim Spielen erreichten die Hotspots den niedrigen 40-°C-Bereich, was dem entspricht, was wir beim 2025er Alienware 16 Area-51 beobachtet hatten. Die durchschnittliche Temperatur ist etwas wärmer als beim konkurrierenden Lenovo Legion Pro 7i 16 Gen 10, da die Handballenablagen des Alienware nicht so kühl bleiben.


(-) Die maximale Temperatur auf der Oberseite ist 45.2 °C. Im Vergleich liegt der Klassendurchschnitt bei 40.4 °C (von 21.2 bis 68.8 °C für die Klasse Gaming).
(+) Auf der Unterseite messen wir eine maximalen Wert von 37.4 °C (im Vergleich zum Durchschnitt von 43.2 °C).
(+) Ohne Last messen wir eine durchschnittliche Temperatur von 27.6 °C auf der Oberseite. Der Klassendurchschnitt erreicht 33.9 °C.
(±) 3: The average temperature for the upper side is 36.4 °C / 98 F, compared to the average of 33.9 °C / 93 F for the class Gaming.
(+) Die Handballen und der Touchpad-Bereich sind mit gemessenen 29.8 °C kühler als die typische Hauttemperatur und fühlen sich dadurch kühl an.
(±) Die durchschnittliche Handballen-Temperatur anderer getesteter Geräte war 28.8 °C (-1 °C).


| Alienware 16 Area-51 Core Ultra 9 290HX Plus Ultra 9 290HX Plus, GeForce RTX 5080 Laptop | Alienware 16 Area-51 Ultra 9 275HX, GeForce RTX 5080 Laptop | Lenovo Legion Pro 7i 16 Gen 10 Ultra 9 275HX, GeForce RTX 5080 Laptop | HP Omen Max 16 ah000 Ultra 9 275HX, GeForce RTX 5090 Laptop | MSI Vector 16 HX AI A2XWHG Ultra 7 255HX, GeForce RTX 5070 Ti Laptop | Asus ROG Zephyrus G16 GU605CW Ultra 9 285H, GeForce RTX 5080 Laptop | |
|---|---|---|---|---|---|---|
| Hitze | -9% | -4% | -1% | -14% | -21% | |
| Last oben max * (°C) | 45.2 | 43.8 3% | 42.6 6% | 42.8 5% | 53 -17% | 49.2 -9% |
| Last unten max * (°C) | 37.4 | 40 -7% | 41.2 -10% | 50.2 -34% | 52 -39% | 50.2 -34% |
| Idle oben max * (°C) | 31.6 | 35.8 -13% | 32.6 -3% | 27.6 13% | 33 -4% | 37.2 -18% |
| Idle unten max * (°C) | 30.2 | 35.2 -17% | 32.4 -7% | 26.2 13% | 29 4% | 37.4 -24% |
* ... kleinere Werte sind besser
Stresstest
Wenn man Prime95 Stress im Overdrive-Modus (d. h. maximaler Lüftermodus) laufen lässt, fährt die CPU auf 4,3 GHz, 182 W und 105 °C (!) hoch, bevor sie leicht in den Bereich von 3,9 bis 4,1 GHz absinkt, um eine etwas kühlere Kerntemperatur von 95 bis 100° C aufrechtzuerhalten. Im Vergleich dazu würde die Durchführung desselben Tests auf dem 2025 Alienware 16 zu einer niedrigeren durchschnittlichen CPU-Taktrate und Temperatur von 3,6 GHz bzw. 92 °C führen. Es ist klar, dass der Core Ultra 9 290HX Plus die bestehende Kühlungslösung des Alienware 16 an ihre absoluten Grenzen bringt.
Die GPU-Temperatur bleibt bei der Ausführung von Cyberpunk 2077 ungefähr gleich wie beim Modell 2025. Die CPU-Temperatur ist jedoch um einige Grad Celsius wärmer und liegt bei bis zu 82 °C.
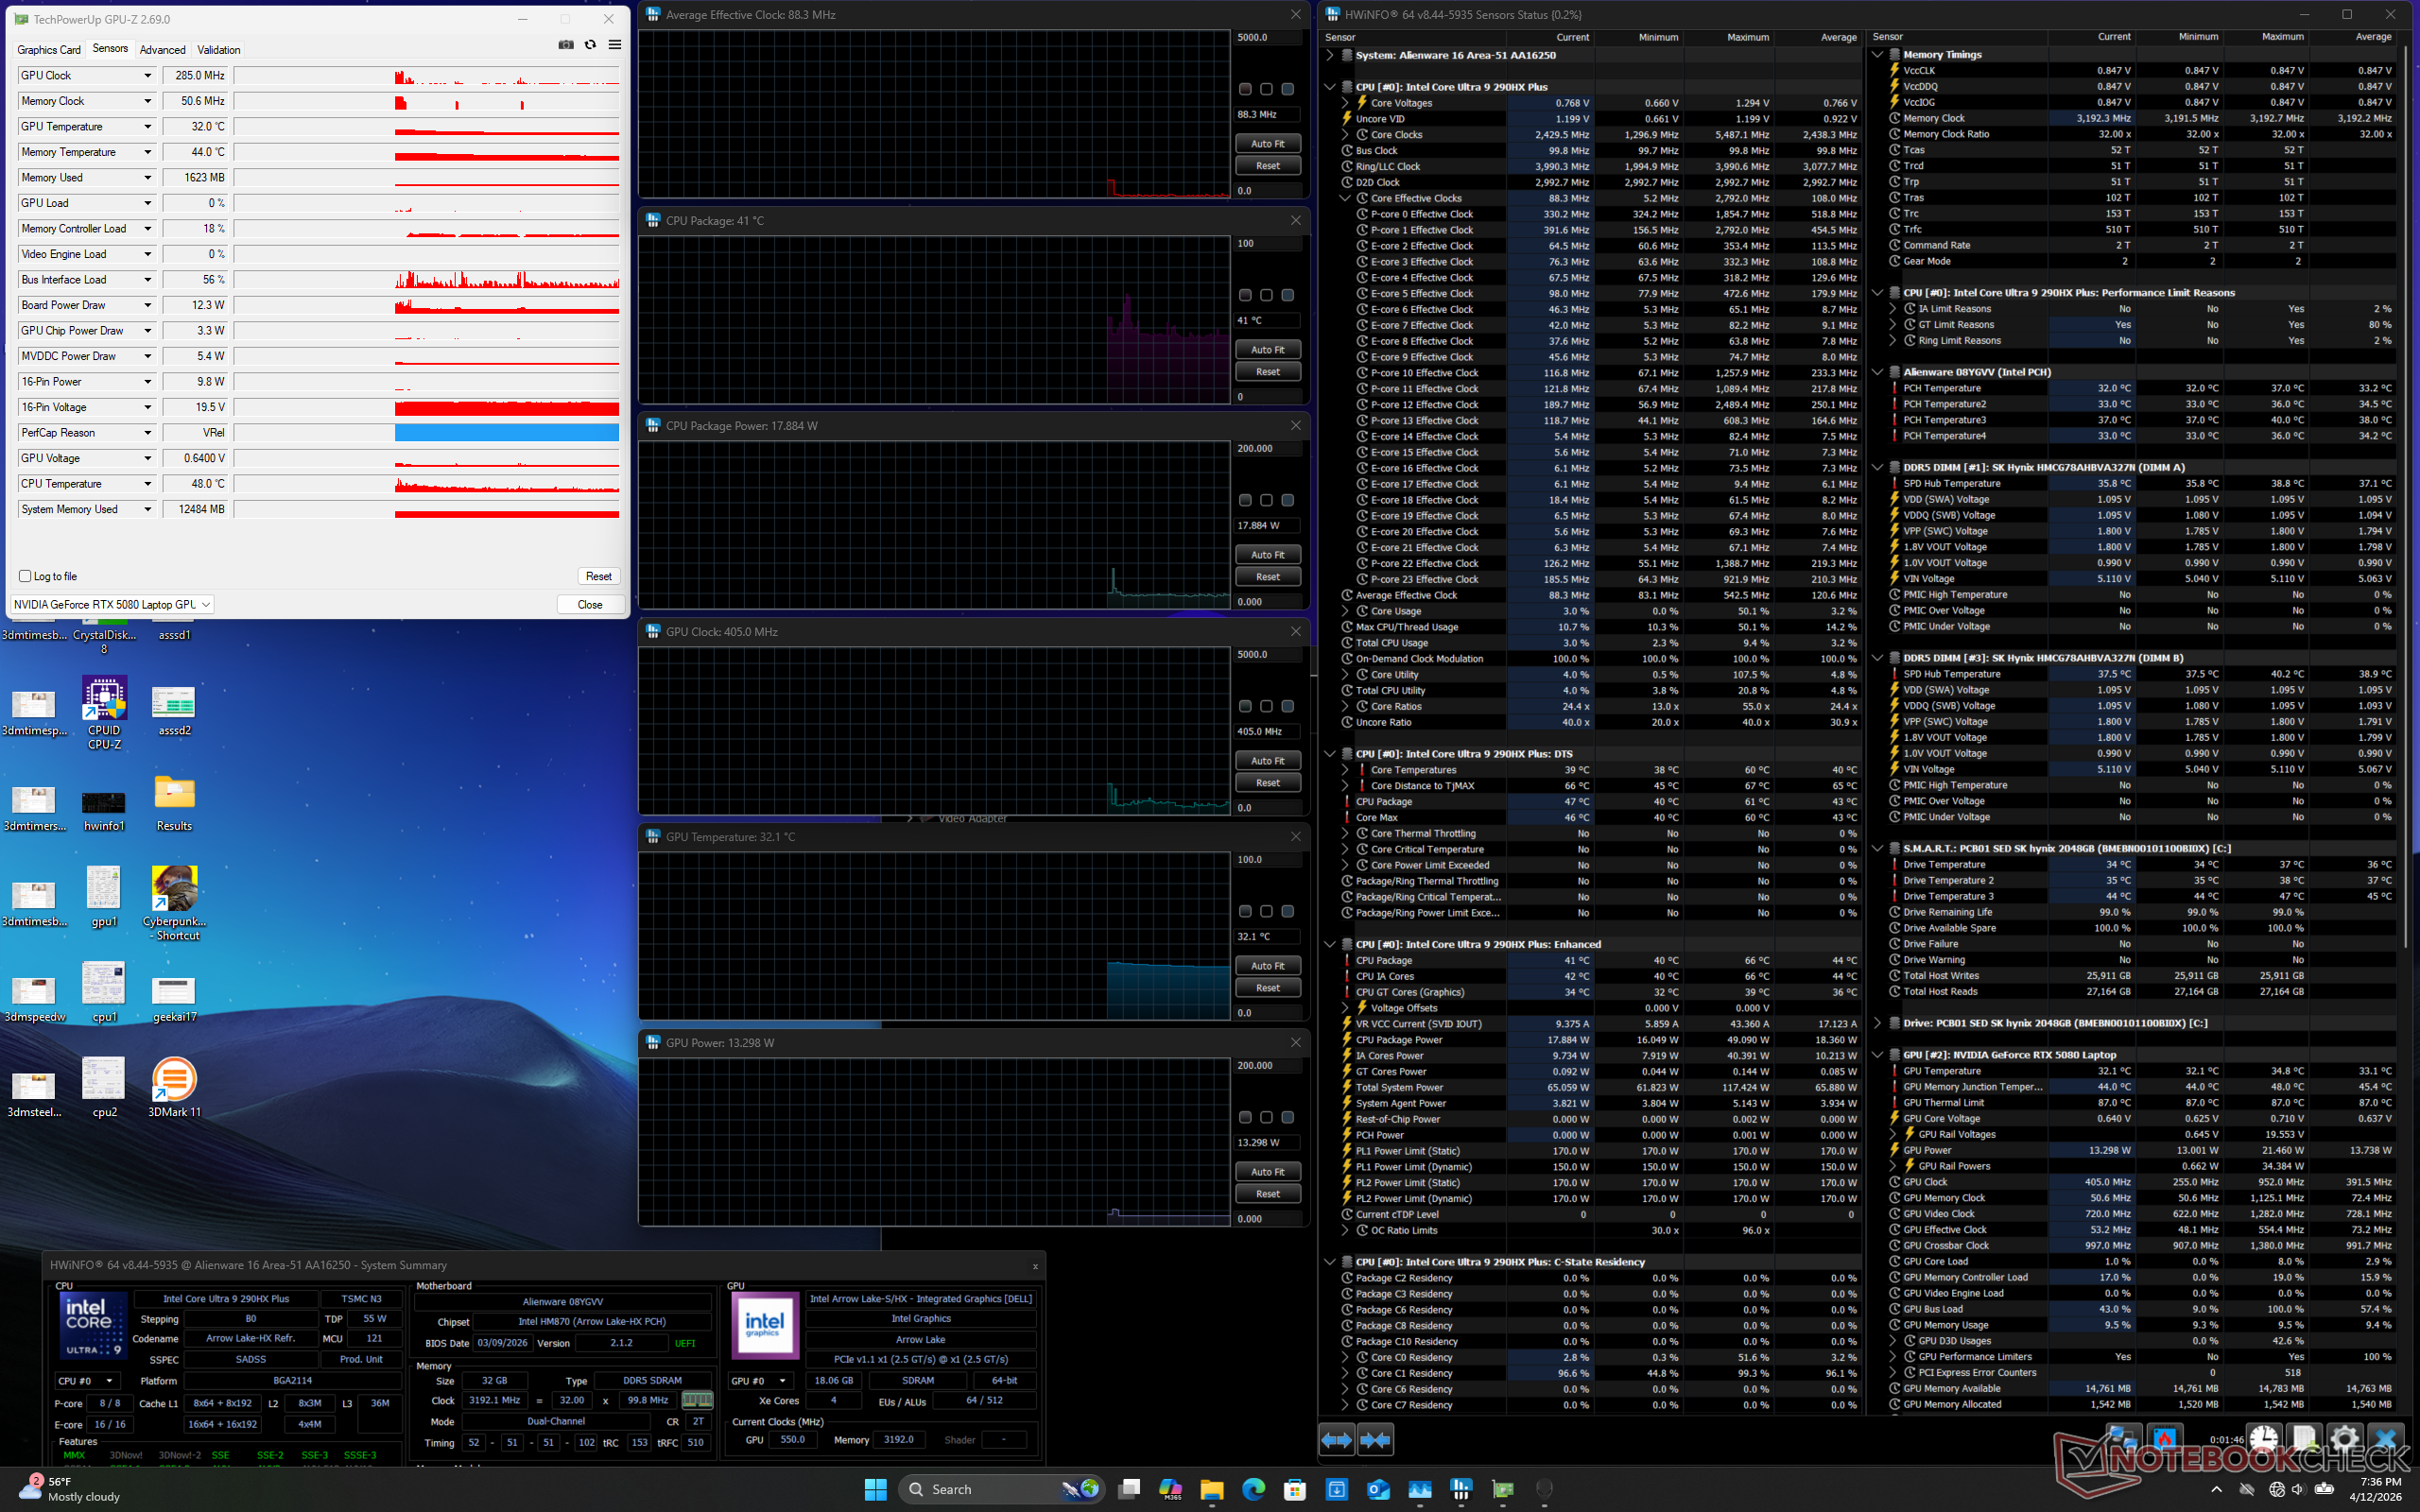
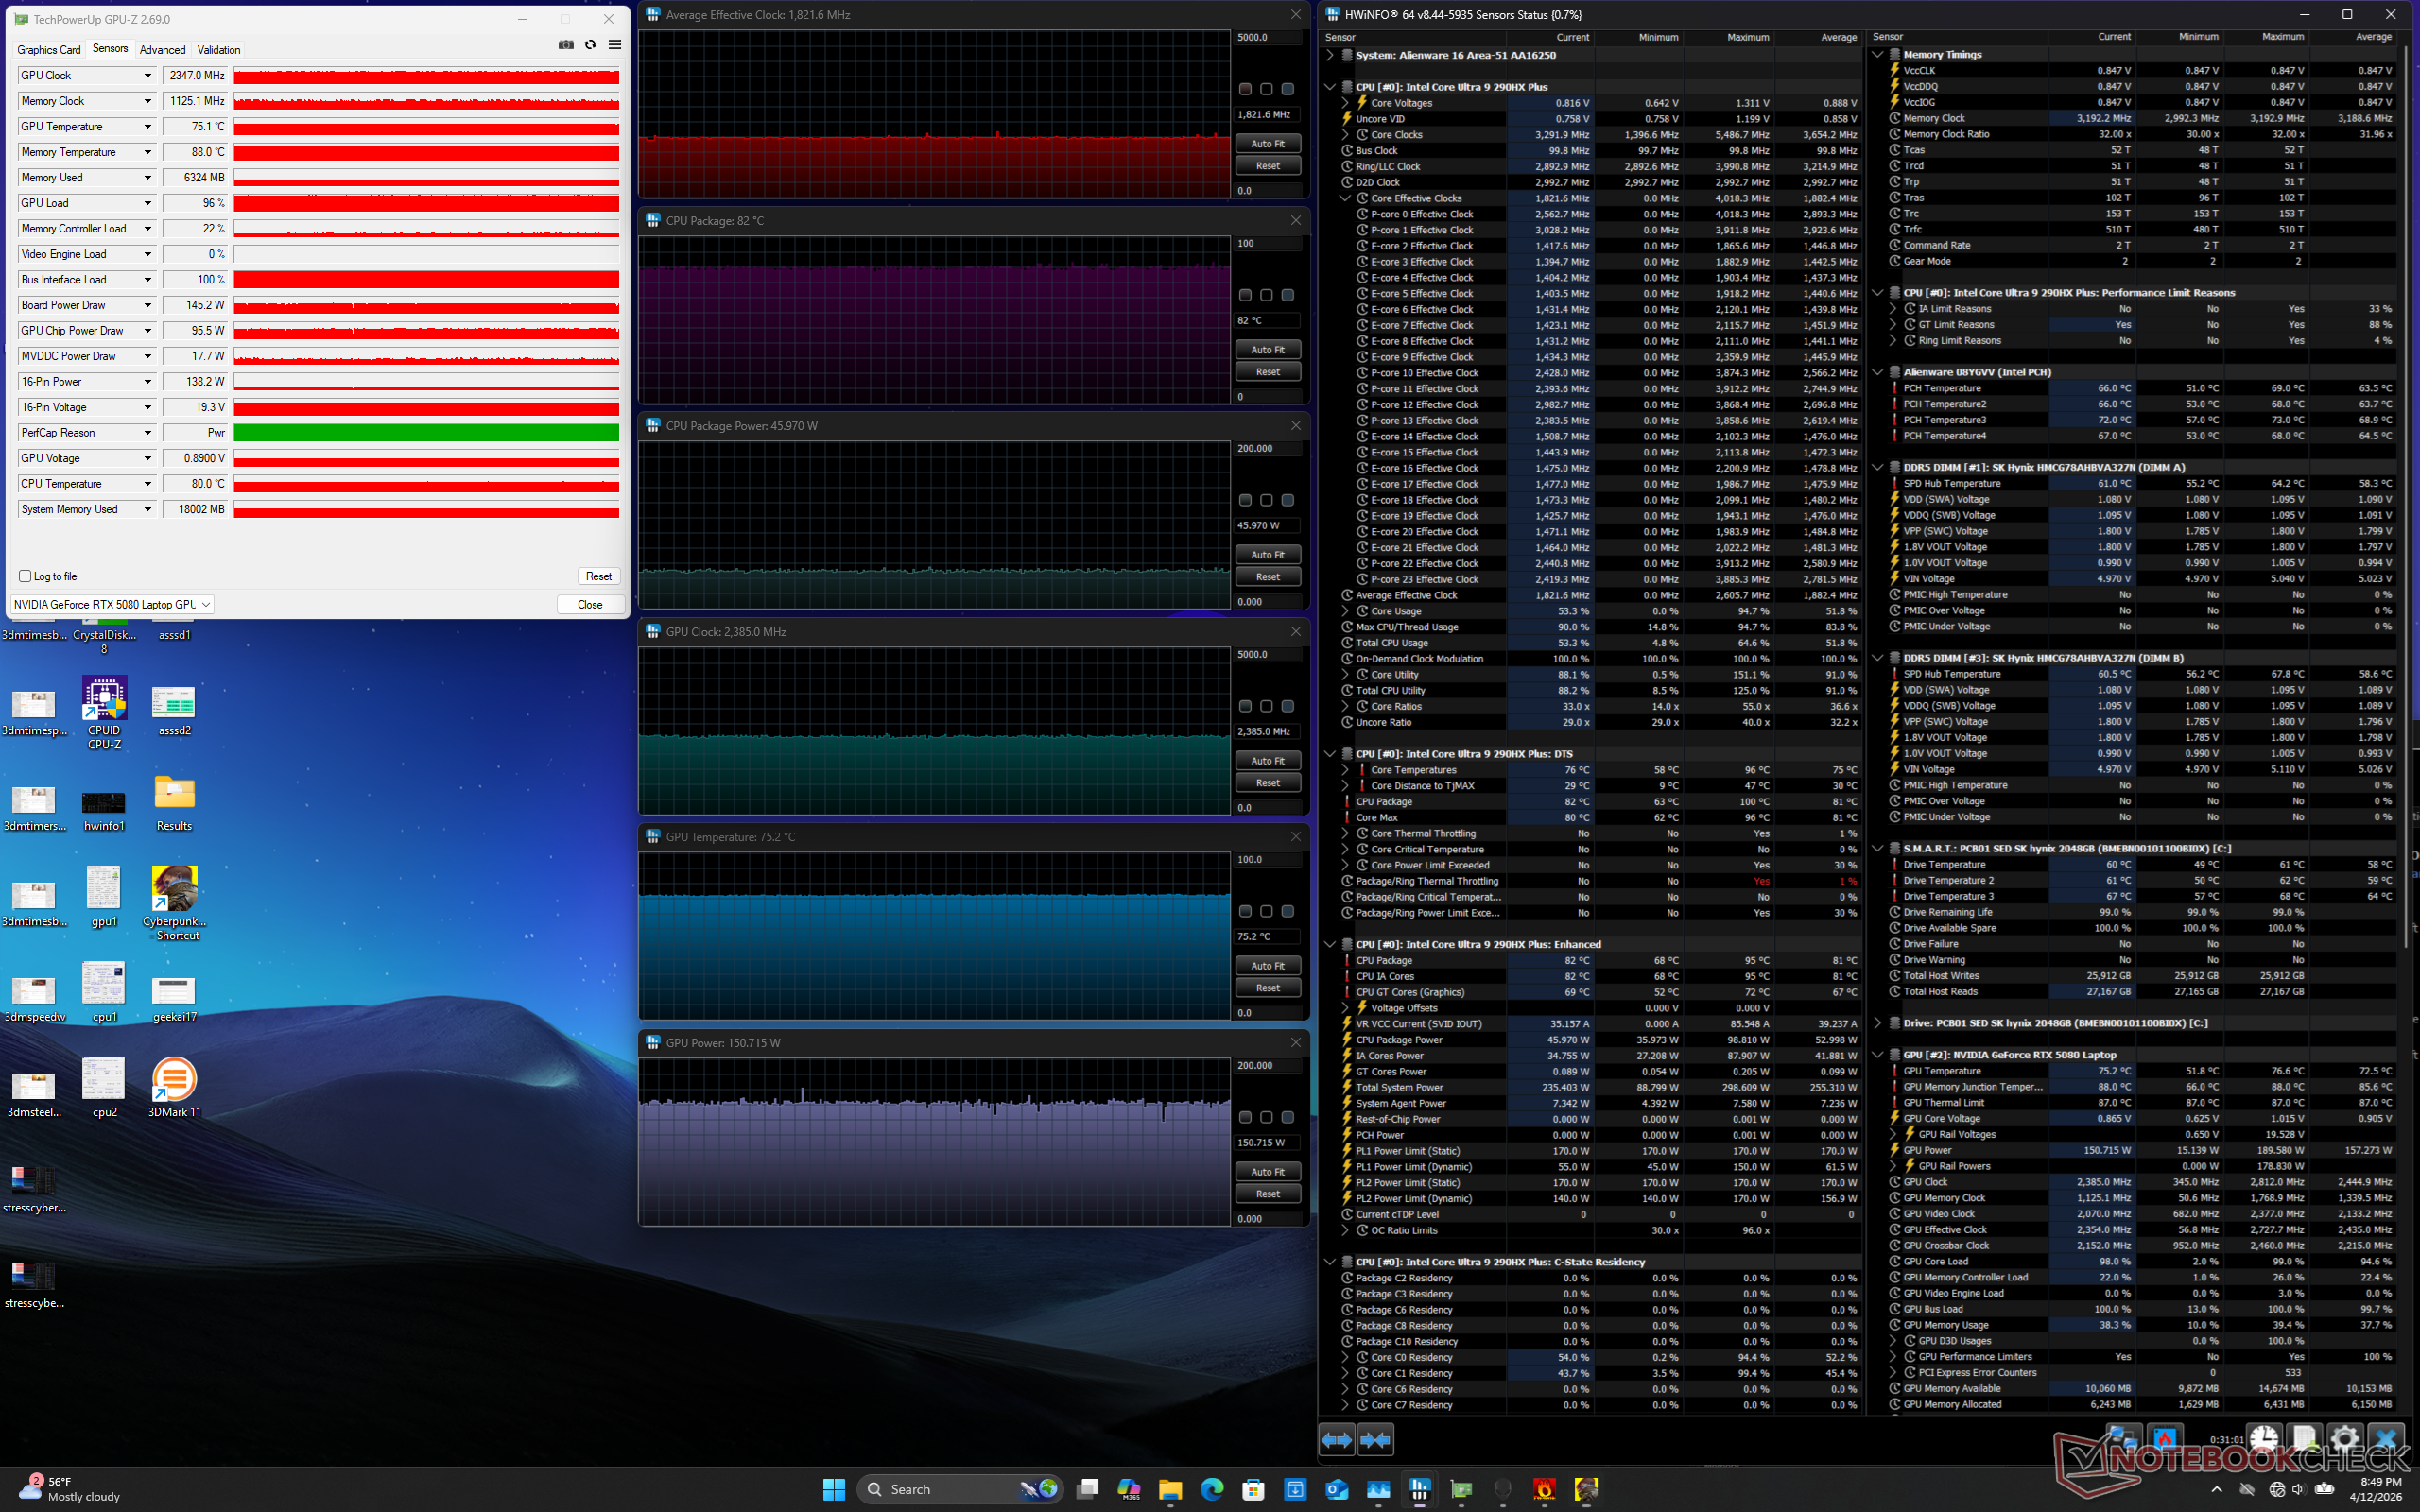
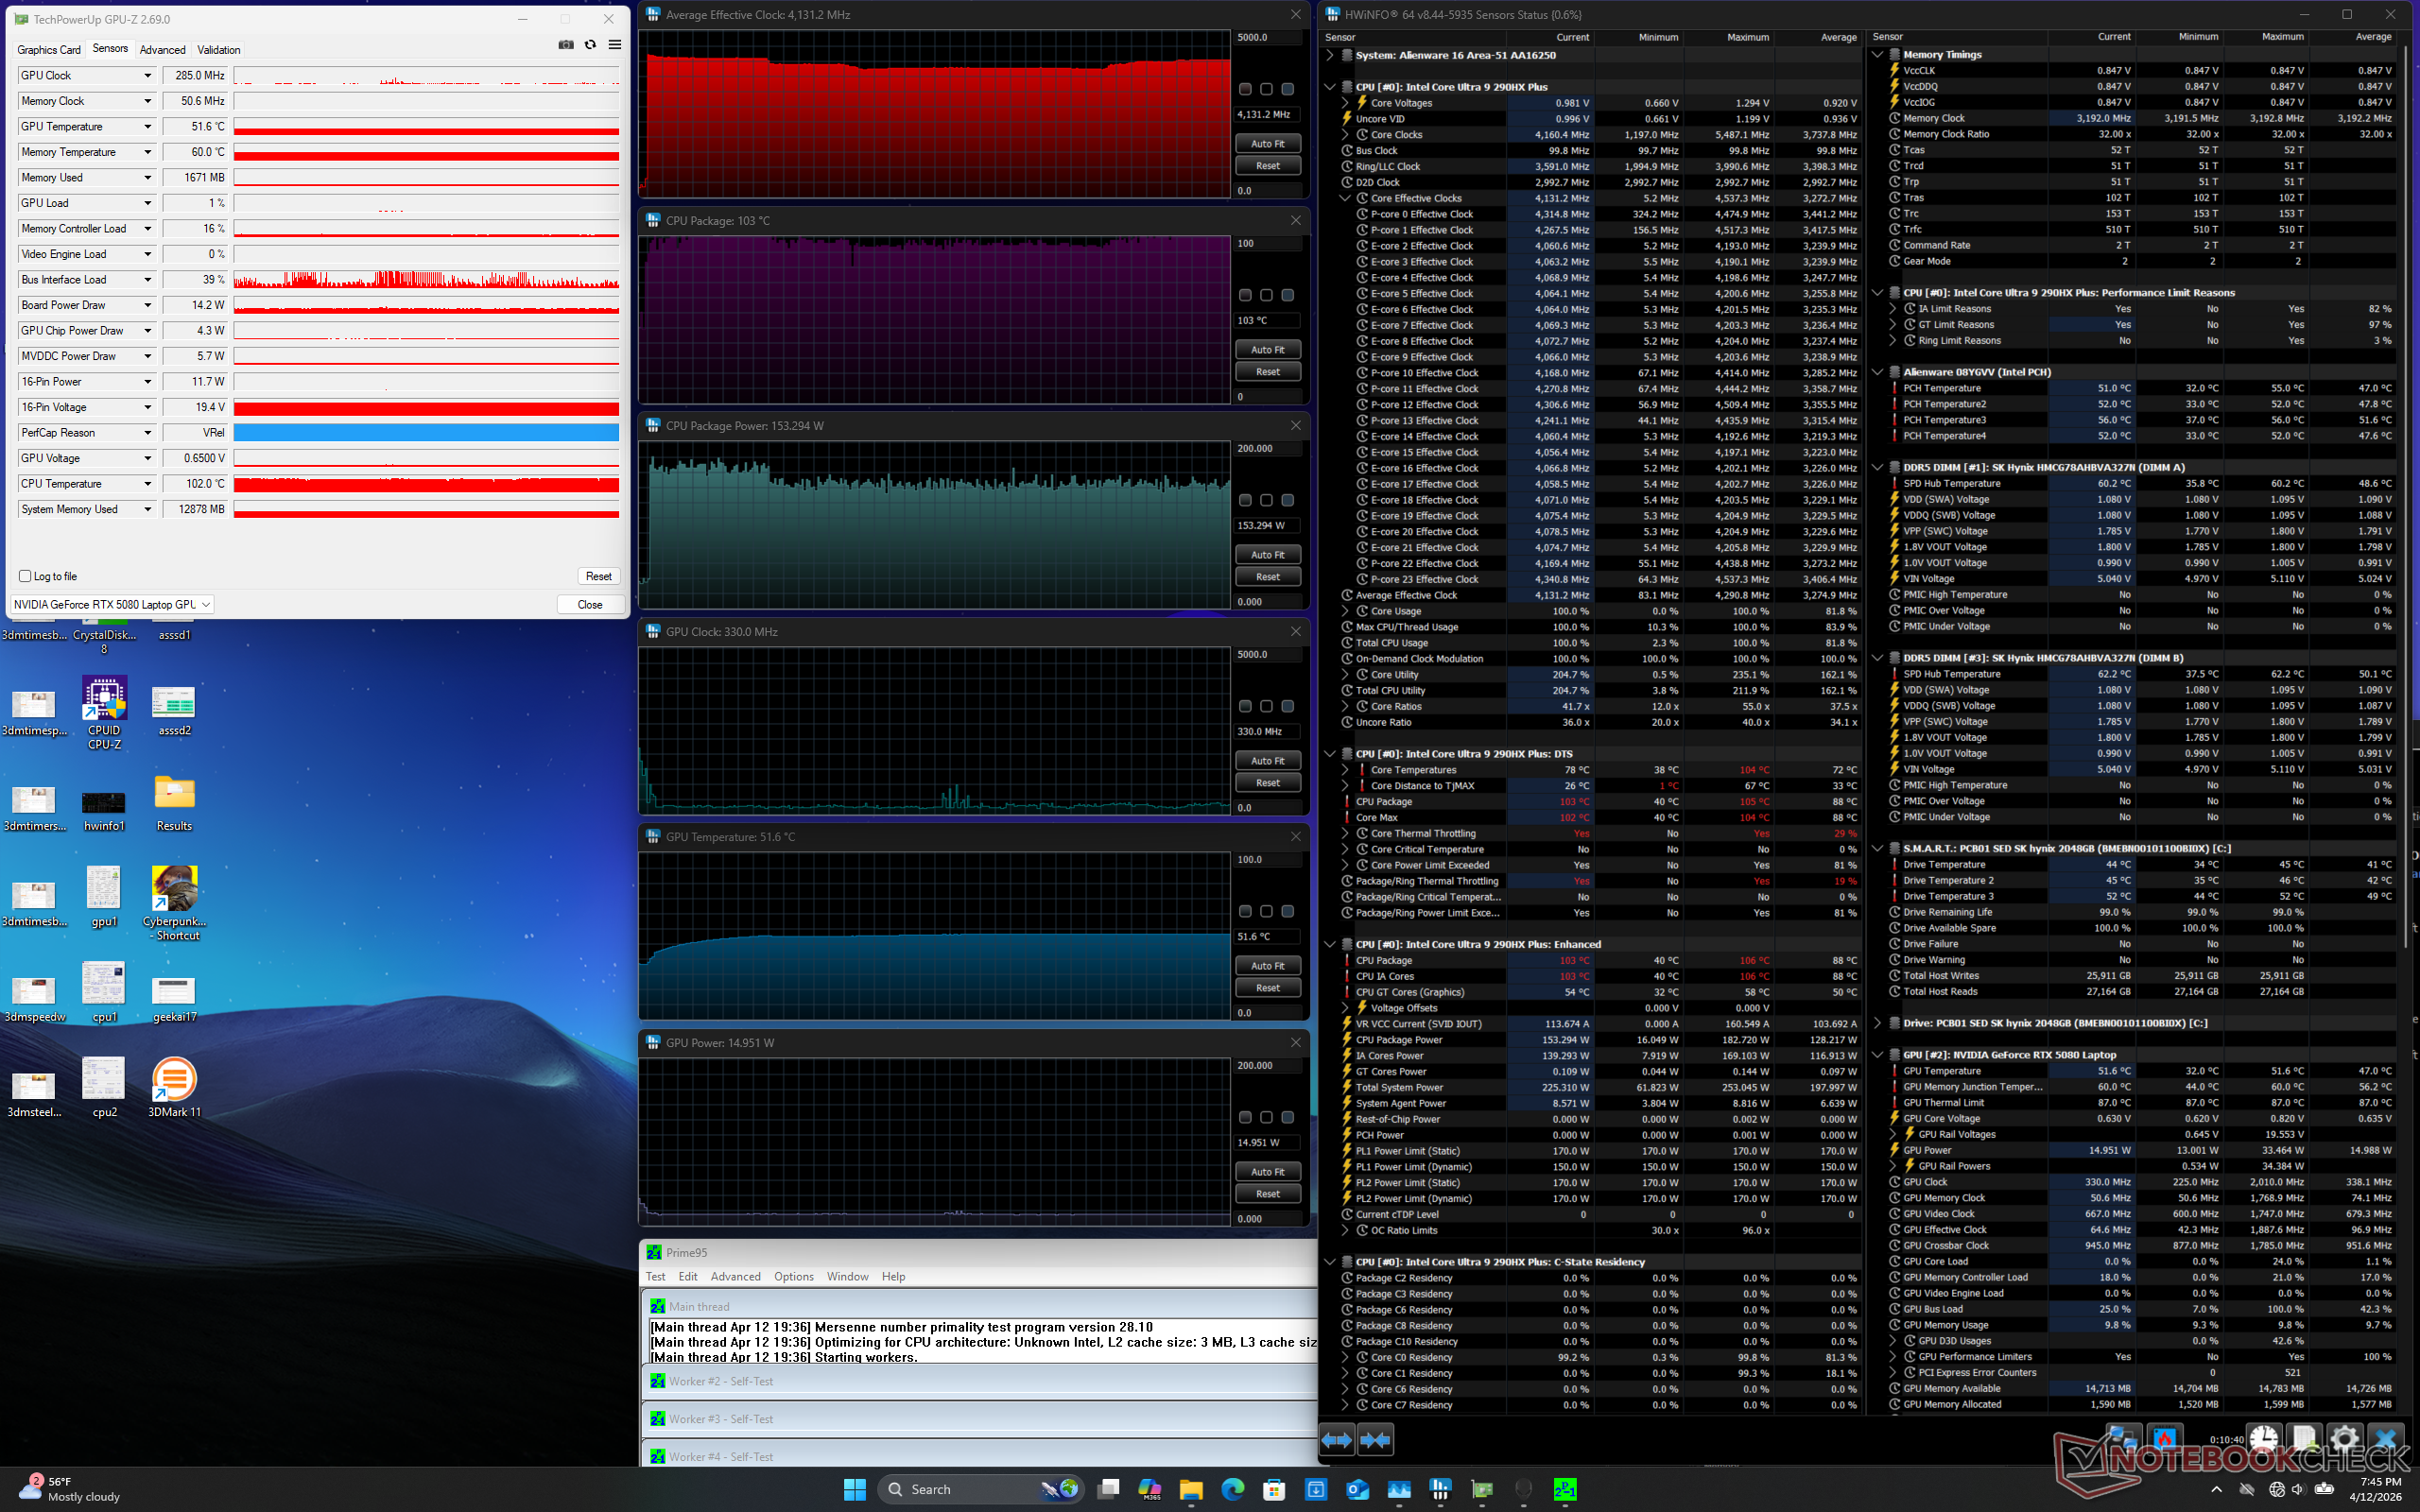
| durchschnittlicher CPU-Takt (GHz) | GPU-Takt (MHz) | durchschnittliche CPU-Temperatur (°C) | durchschnittliche GPU-Temperatur (°C) | |
| System Leerlauf | -- | -- | 41 | 32 |
| Prime95 Stress | 4,1 | -- | 103 | 52 |
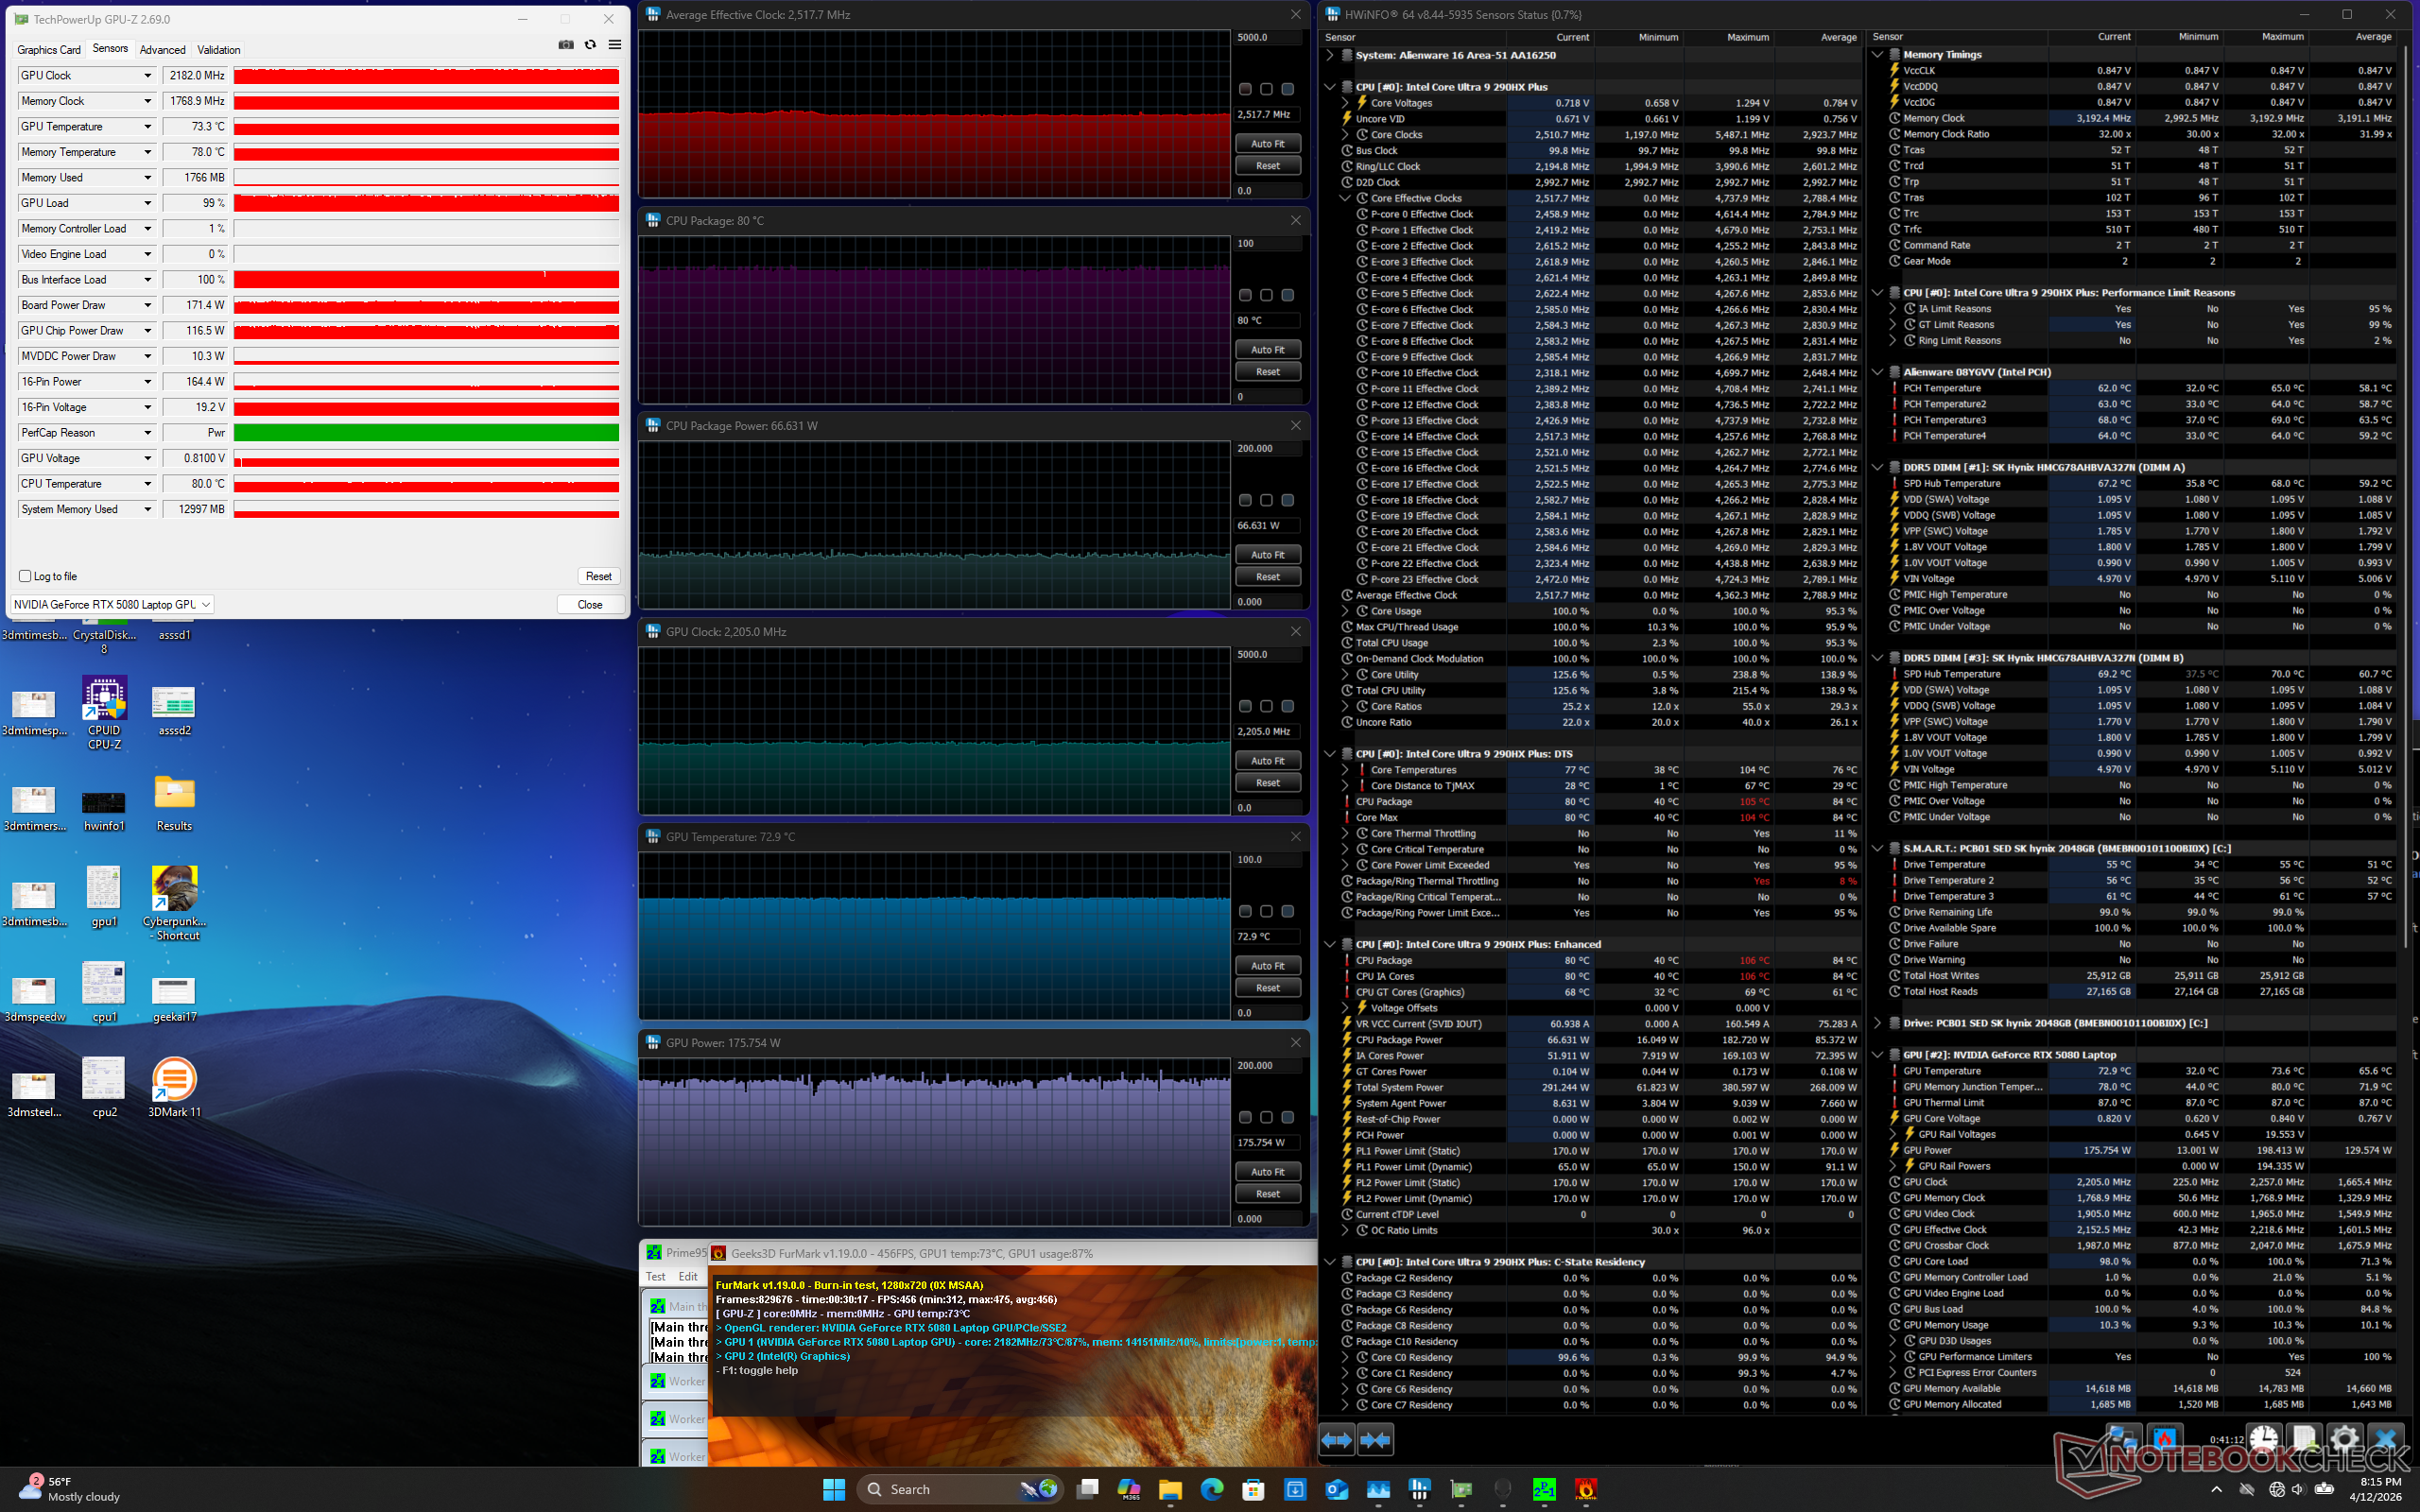
| Prime95 + FurMark Stress | 2,5 | 2.182 | 80 | 73 |
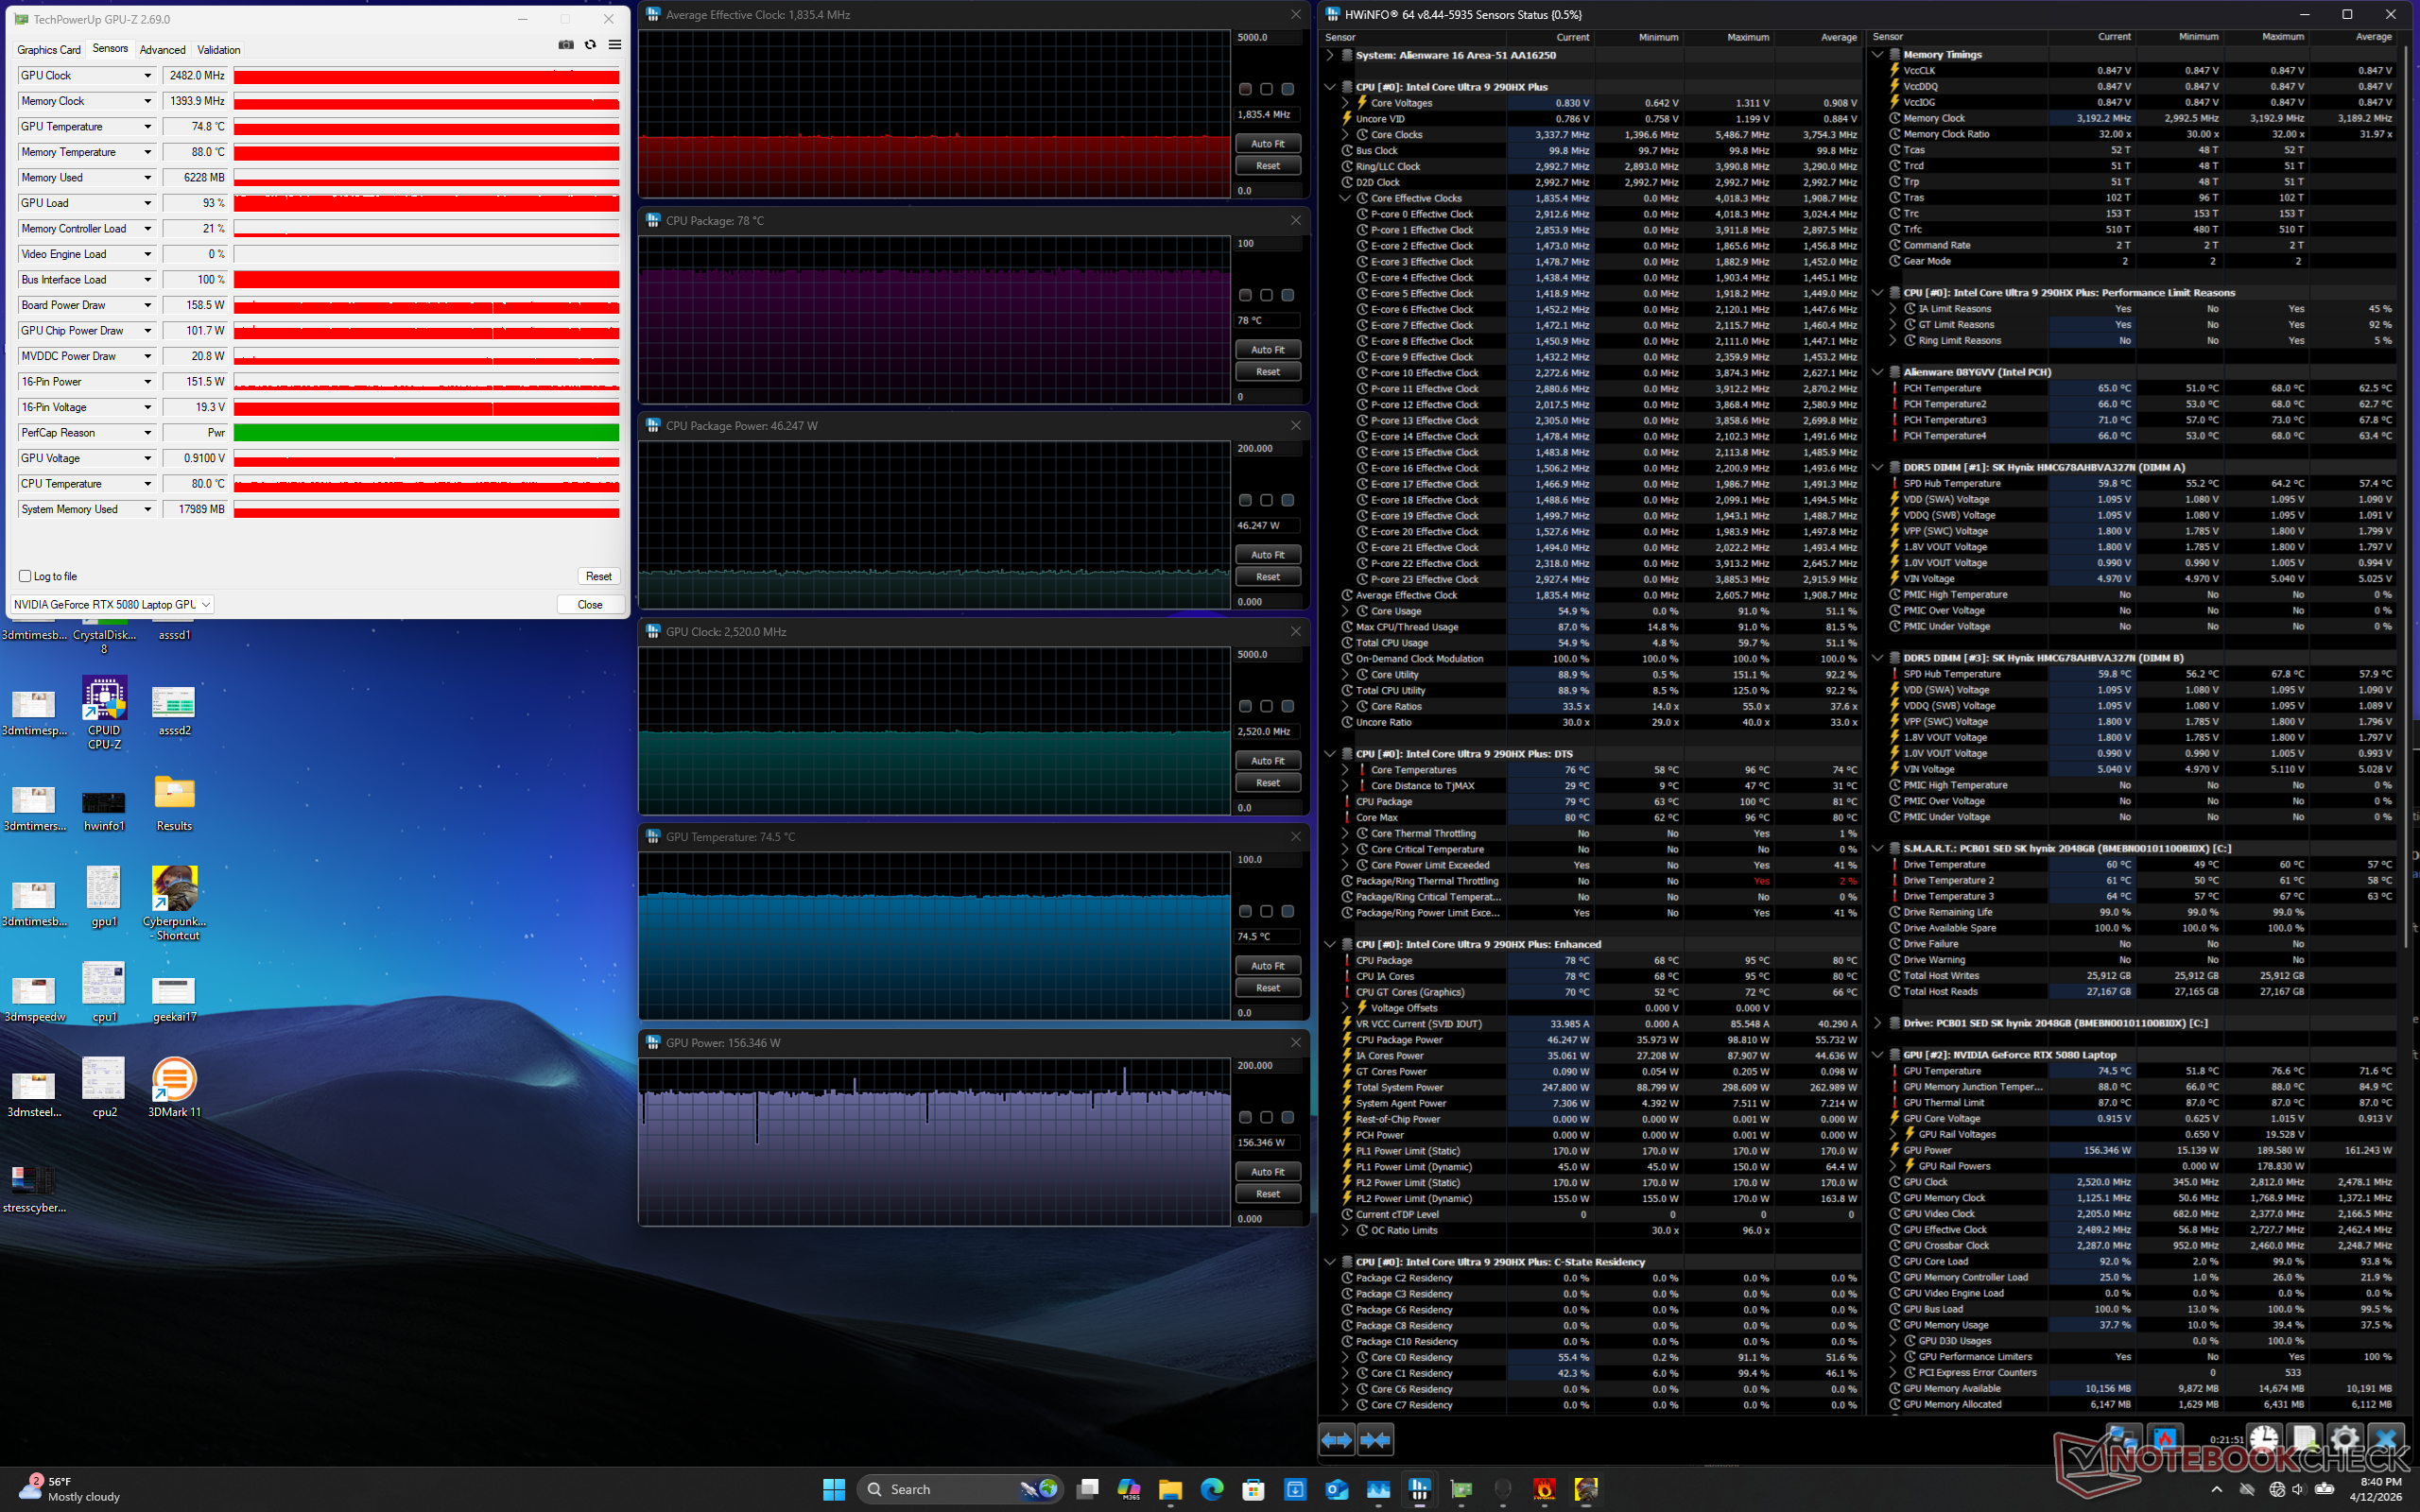
| Cyberpunk 2077 Stress (Balanced-Modus) | 1,8 | 2.347 | 82 | 75 |
| Cyberpunk 2077 Stress (Performance-Modus) | 1,8 | 2.482 | 78 | 75 |
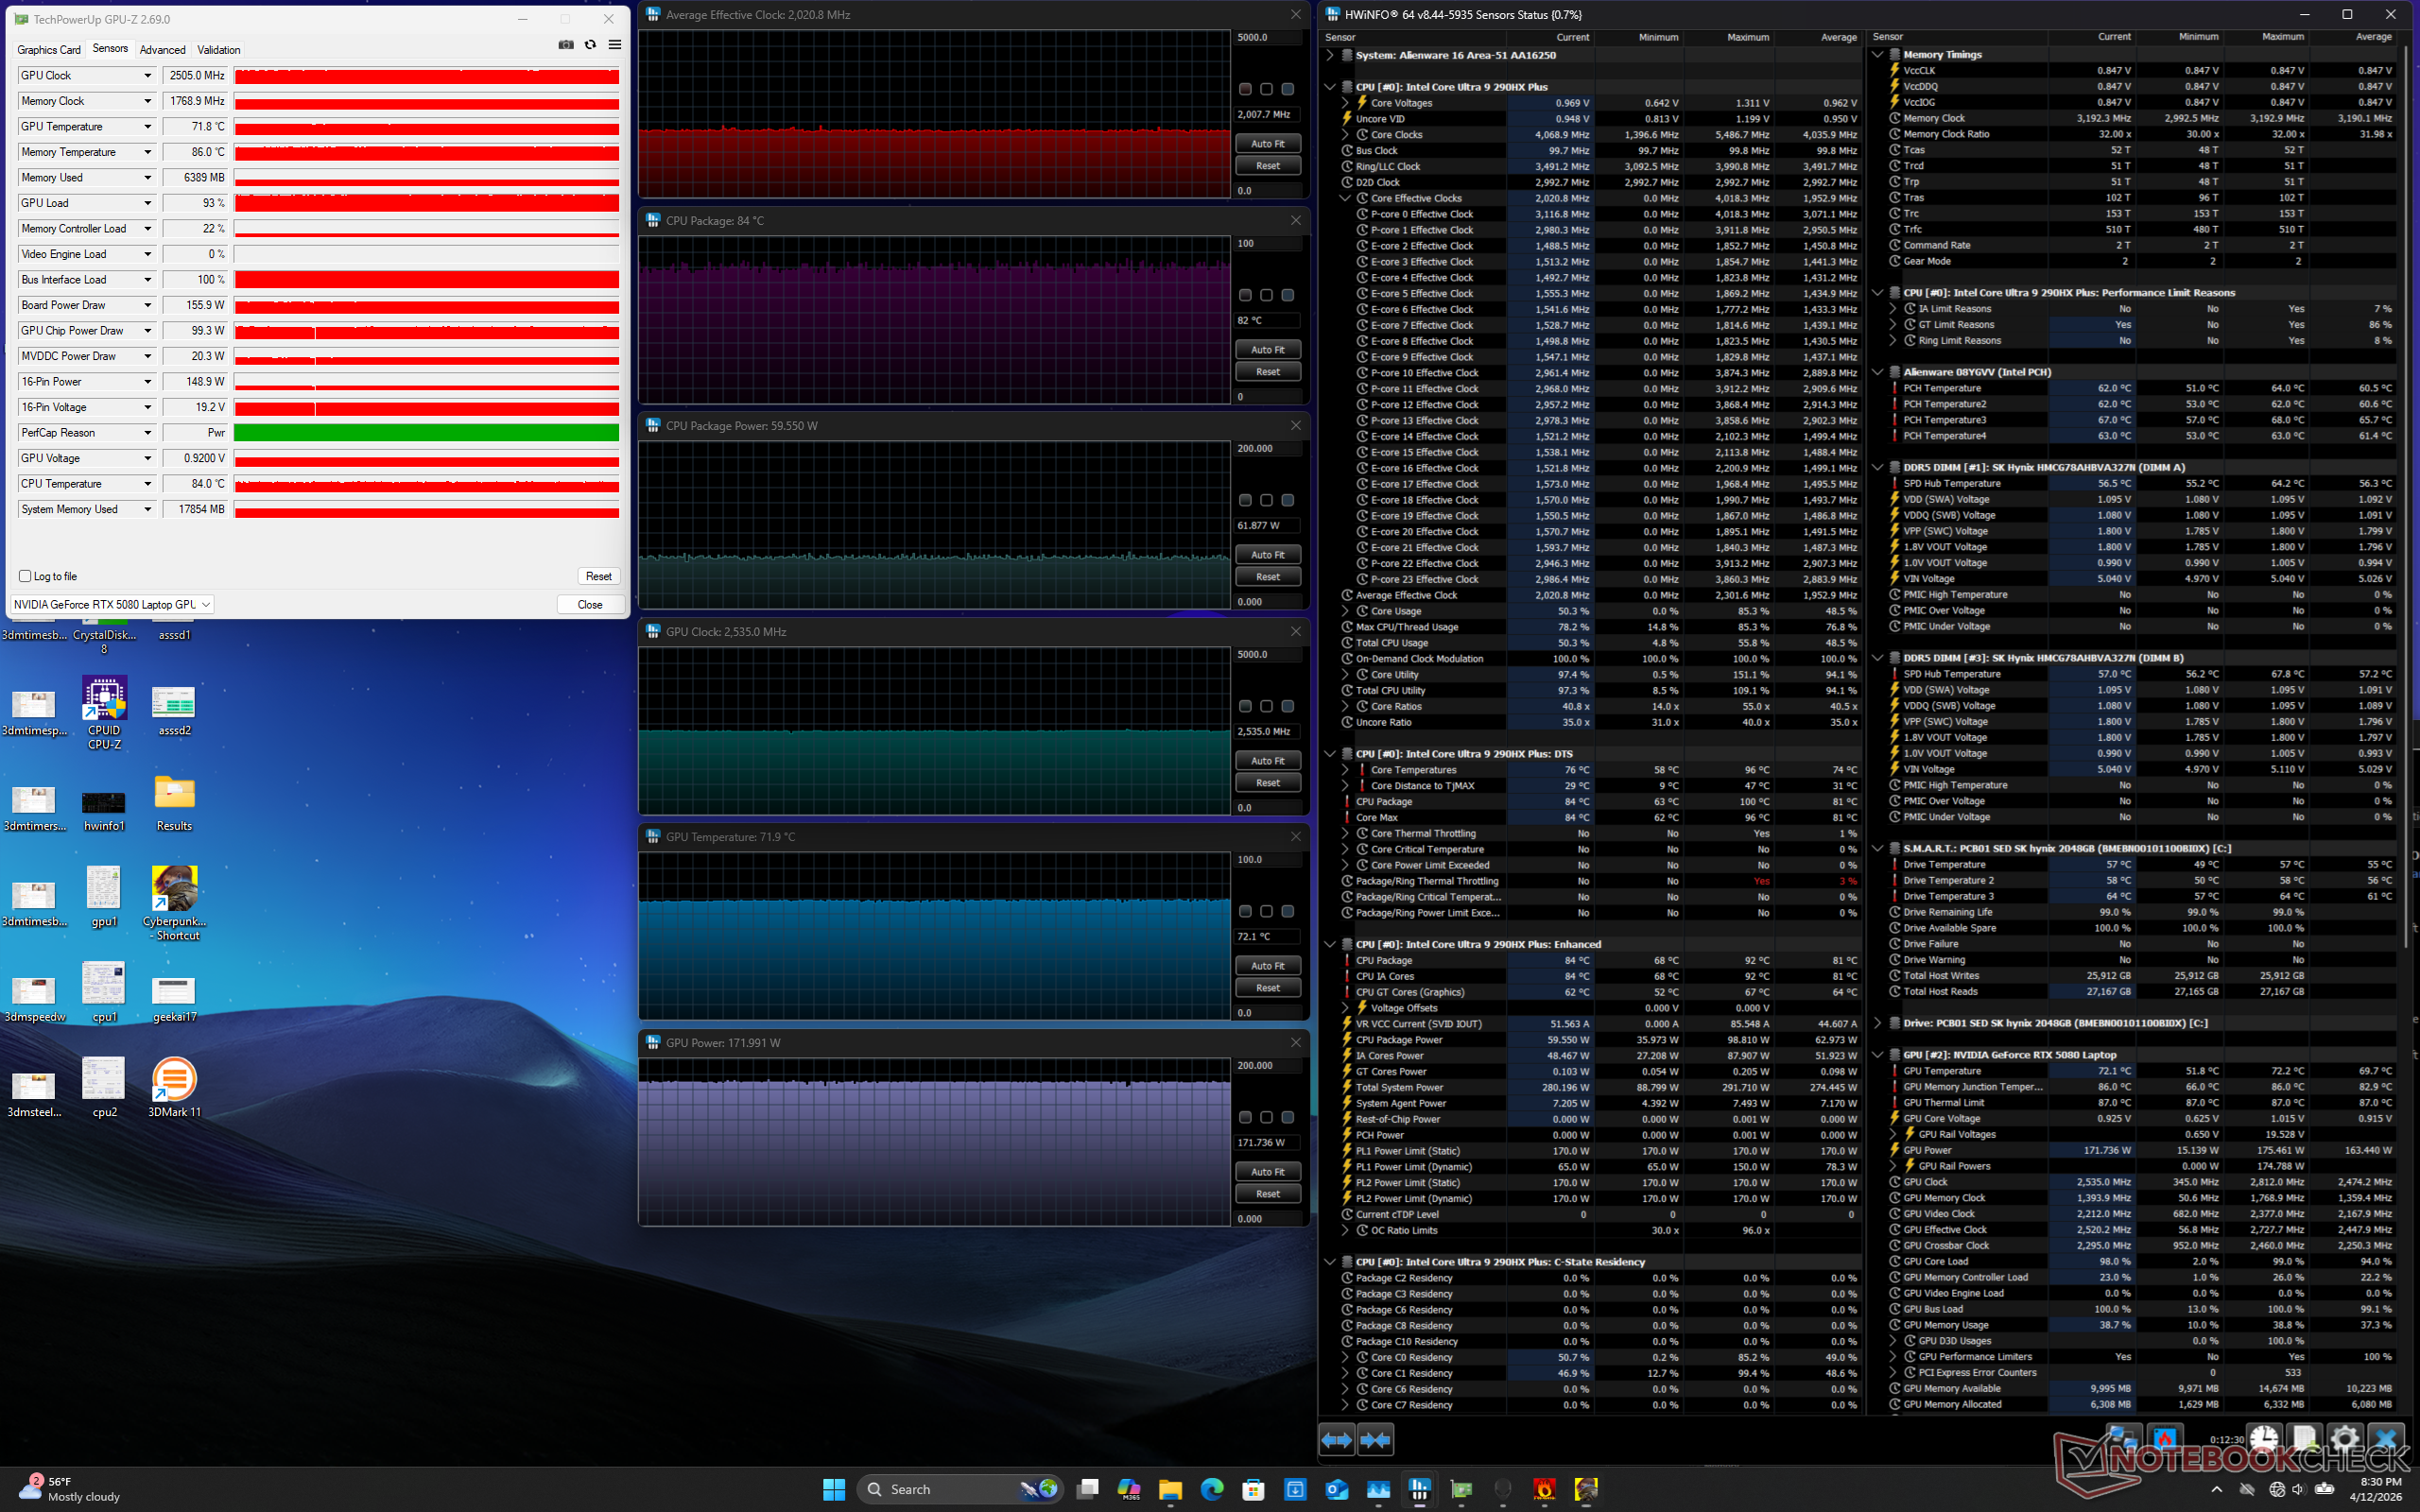
| Cyberpunk 2077 Stress (Overdrive-Modus) | 21 | 2.505 | 82 | 72 |
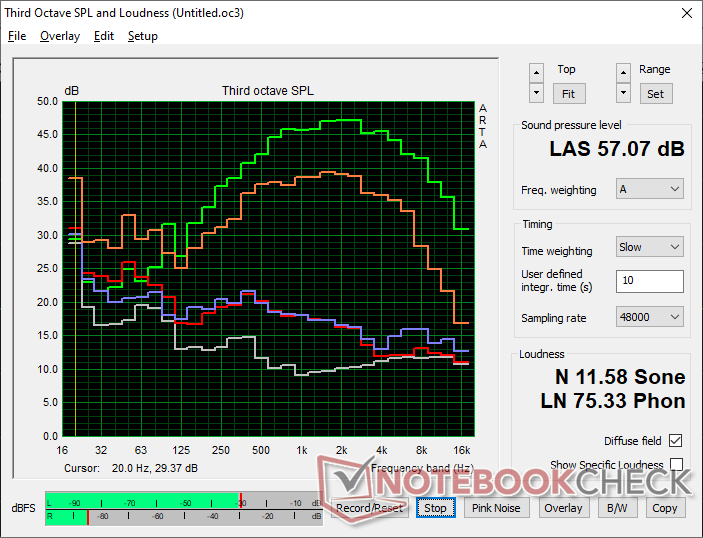
Lautsprecher
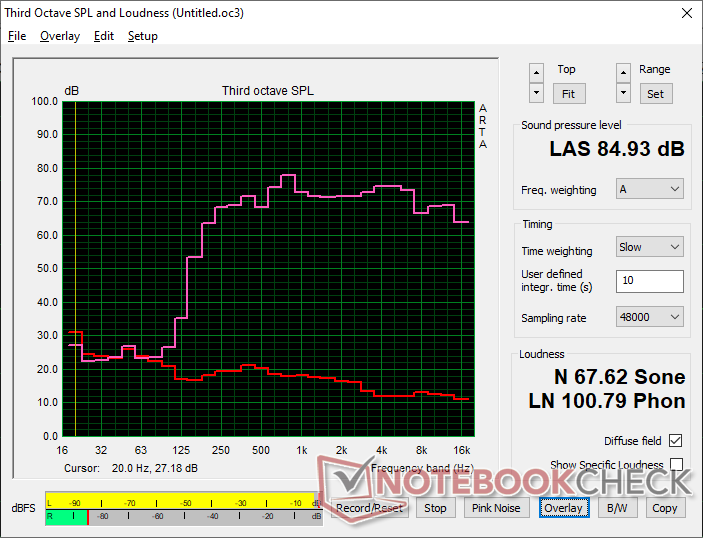
Alienware 16 Area-51 Core Ultra 9 290HX Plus Audio Analyse
(+) | Die Lautsprecher können relativ laut spielen (84.9 dB)
Bass 100 - 315 Hz
(-) | kaum Bass - 18.7% niedriger als der Median
(±) | durchschnittlich lineare Bass-Wiedergabe (13.9% Delta zum Vorgänger)
Mitteltöne 400 - 2000 Hz
(+) | ausgeglichene Mitten, vom Median nur 1.8% abweichend
(+) | lineare Mitten (5.1% Delta zum Vorgänger)
Hochtöne 2 - 16 kHz
(+) | ausgeglichene Hochtöne, vom Median nur 2.5% abweichend
(+) | sehr lineare Hochtöne (3.4% Delta zum Vorgänger)
Gesamt im hörbaren Bereich 100 - 16.000 Hz
(+) | hörbarer Bereich ist sehr linear (12.6% Abstand zum Median
Im Vergleich zu allen Geräten derselben Klasse
» 16% aller getesteten Geräte dieser Klasse waren besser, 4% vergleichbar, 81% schlechter
» Das beste Gerät hat einen Delta-Wert von 6%, durchschnittlich ist 18%, das schlechteste Gerät hat 132%
Im Vergleich zu allen Geräten im Test
» 11% aller getesteten Geräte waren besser, 3% vergleichbar, 86% schlechter
» Das beste Gerät hat einen Delta-Wert von 4%, durchschnittlich ist 23%, das schlechteste Gerät hat 134%
Apple MacBook Pro 16 2021 M1 Pro Audio Analyse
(+) | Die Lautsprecher können relativ laut spielen (84.7 dB)
Bass 100 - 315 Hz
(+) | guter Bass - nur 3.8% Abweichung vom Median
(+) | lineare Bass-Wiedergabe (5.2% Delta zum Vorgänger)
Mitteltöne 400 - 2000 Hz
(+) | ausgeglichene Mitten, vom Median nur 1.3% abweichend
(+) | lineare Mitten (2.1% Delta zum Vorgänger)
Hochtöne 2 - 16 kHz
(+) | ausgeglichene Hochtöne, vom Median nur 1.9% abweichend
(+) | sehr lineare Hochtöne (2.7% Delta zum Vorgänger)
Gesamt im hörbaren Bereich 100 - 16.000 Hz
(+) | hörbarer Bereich ist sehr linear (4.6% Abstand zum Median
Im Vergleich zu allen Geräten derselben Klasse
» 0% aller getesteten Geräte dieser Klasse waren besser, 0% vergleichbar, 100% schlechter
» Das beste Gerät hat einen Delta-Wert von 5%, durchschnittlich ist 17%, das schlechteste Gerät hat 45%
Im Vergleich zu allen Geräten im Test
» 0% aller getesteten Geräte waren besser, 0% vergleichbar, 100% schlechter
» Das beste Gerät hat einen Delta-Wert von 4%, durchschnittlich ist 23%, das schlechteste Gerät hat 134%
Energieverwaltung
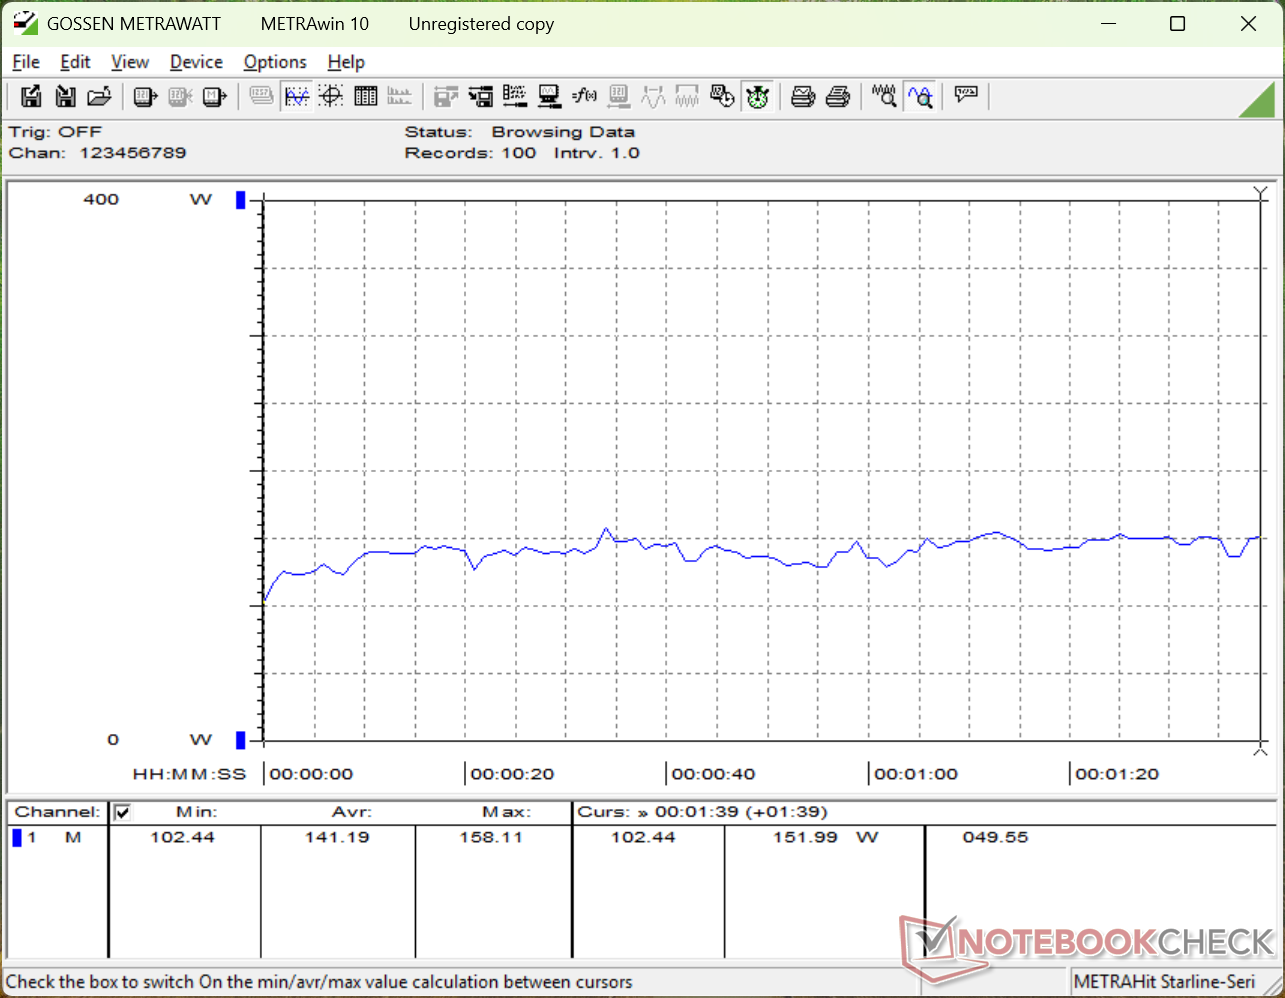
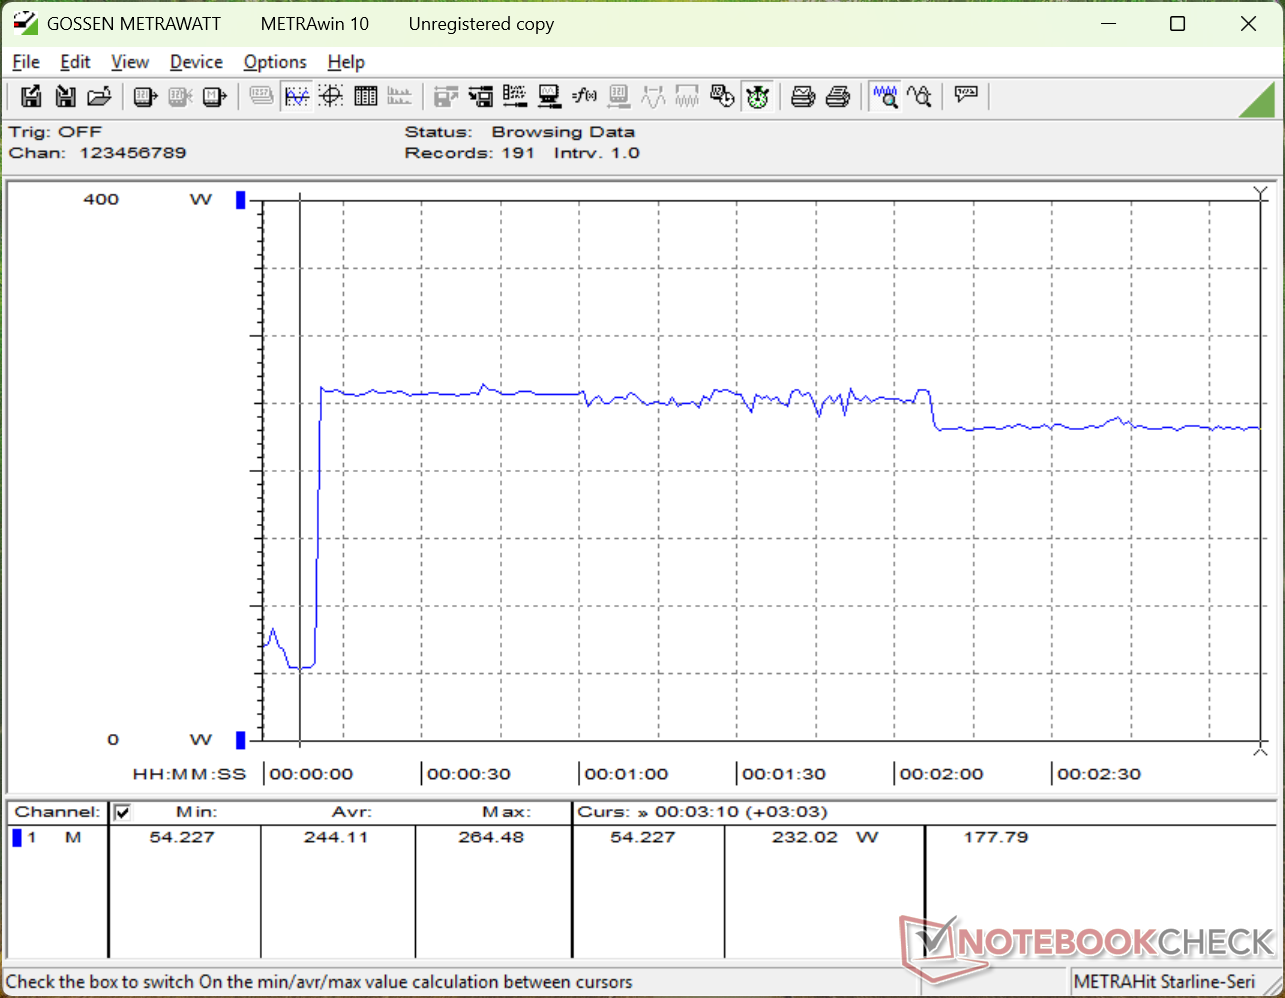
Stromverbrauch
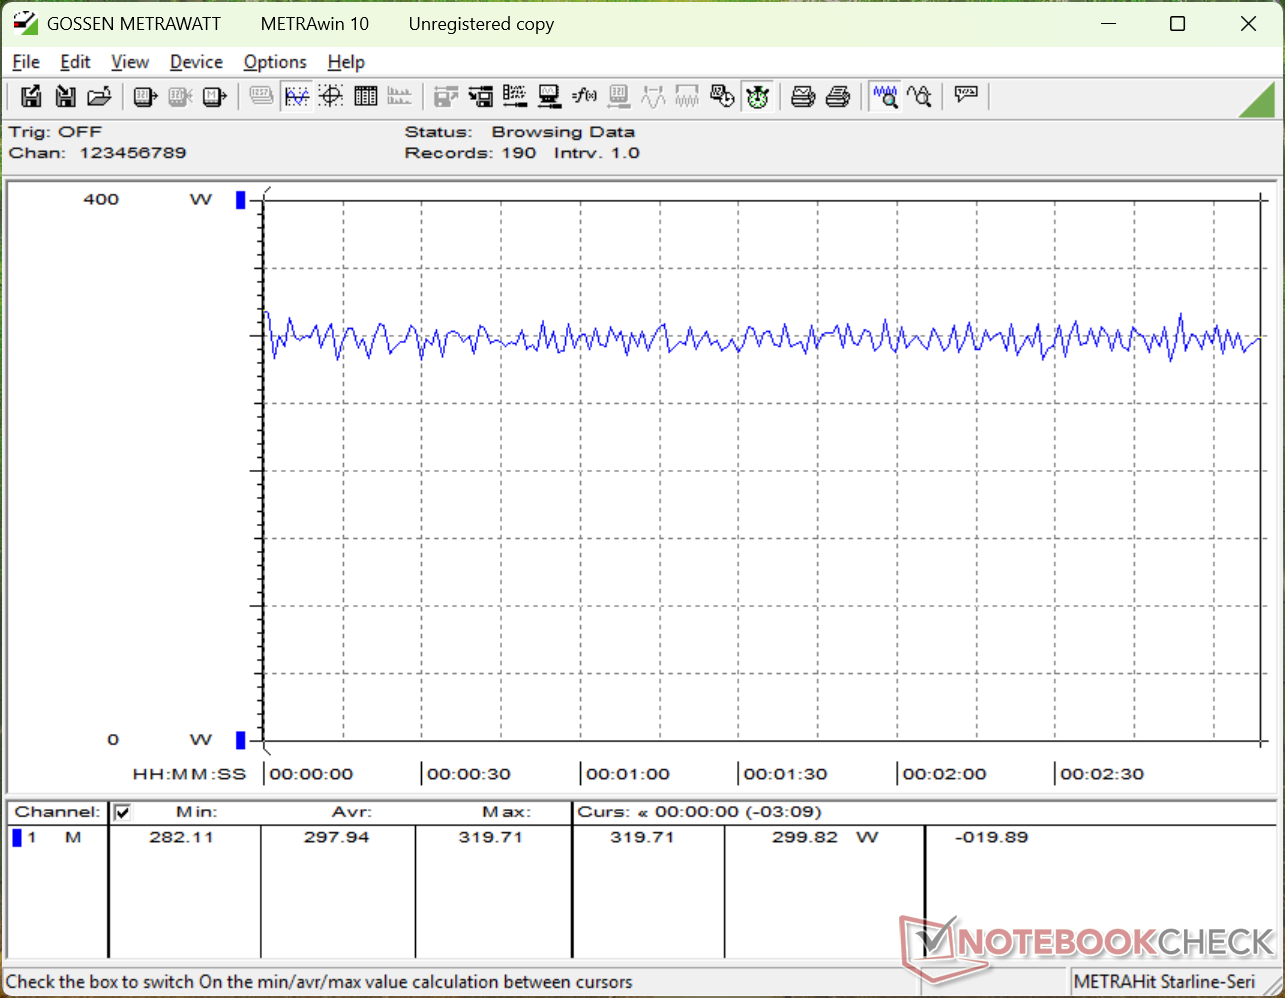
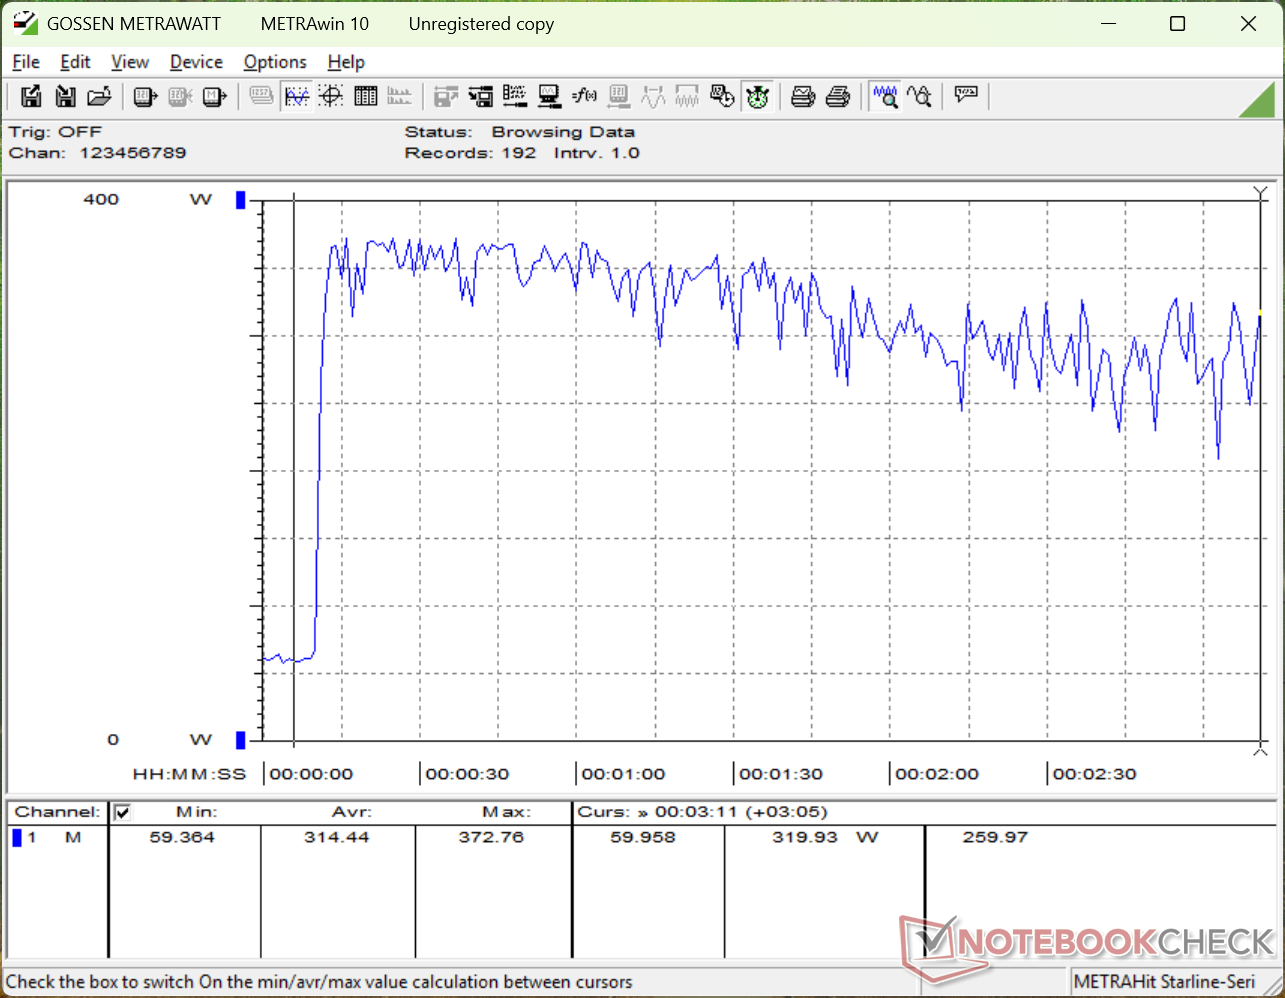
Der Core Ultra 9 290HX Plus ist 15 bis 25 Prozent schneller als der oben erwähnte Vorgänger Core Ultra 9 275HX. Kaum überraschend ist unser 2026 Alienware 16 15 bis 25 Prozent stromhungriger als das 2025 Alienware 16, wenn die CPU belastet wird. Die Ausführung von Prime95 auf dem neuesten Alienware Modell verbraucht etwa 255 W, wenn der Turbo Boost am effektivsten ist, oder 230 W, wenn der Turbo Boost auf ein Plateau gefallen ist, verglichen mit nur 200 W beim Vorjahresmodell. Selbst wenn man nicht spielt, ist das neuere Modell im Allgemeinen um mindestens ein paar Watt anspruchsvoller.
Das schlanke 360-W-GaN-Netzteil ist ansonsten gegenüber dem 2025er Modell unverändert.
| Aus / Standby | |
| Idle | |
| Last |
|
Legende:
min: | |
| Alienware 16 Area-51 Core Ultra 9 290HX Plus Ultra 9 290HX Plus, GeForce RTX 5080 Laptop, SK hynix PCB01 HFS001TFM9X186N, OLED, 2560x1600, 16" | Alienware 16 Area-51 Ultra 9 275HX, GeForce RTX 5080 Laptop, Samsung PM9C1a MZ9L81T0HDLB, IPS, 2560x1600, 16" | Lenovo Legion Pro 7i 16 Gen 10 Ultra 9 275HX, GeForce RTX 5080 Laptop, SK Hynix HFS001TEJ9X115N, OLED, 2560x1600, 16" | HP Omen Max 16 ah000 Ultra 9 275HX, GeForce RTX 5090 Laptop, WDC PC SN810 2TB, OLED, 2560x1600, 16" | MSI Vector 16 HX AI A2XWHG Ultra 7 255HX, GeForce RTX 5070 Ti Laptop, Micron 2400 MTFDKBA512QFM, IPS, 2560x1600, 16" | Asus ROG Zephyrus G16 GU605CW Ultra 9 285H, GeForce RTX 5080 Laptop, Micron 2500 2TB MTFDKBA2T0QGN-1BN1AABGA, OLED, 2560x1600, 16" | |
|---|---|---|---|---|---|---|
| Stromverbrauch | 2% | -11% | 18% | 32% | 46% | |
| Idle min * (Watt) | 23.9 | 27 -13% | 28.5 -19% | 9.9 59% | 7.1 70% | 12.6 47% |
| Idle avg * (Watt) | 25.2 | 33.5 -33% | 38.8 -54% | 28.6 -13% | 15.9 37% | 13.4 47% |
| Idle max * (Watt) | 49.6 | 41.4 17% | 45.6 8% | 47.1 5% | 29.5 41% | 15.1 70% |
| Last avg * (Watt) | 141.2 | 124.7 12% | 132.2 6% | 141.8 -0% | 124 12% | 116.3 18% |
| Cyberpunk 2077 ultra external monitor * (Watt) | 297 | 249 16% | 319 -7% | 230 23% | 217 27% | 157.9 47% |
| Cyberpunk 2077 ultra * (Watt) | 298 | 256 14% | 318 -7% | 253 15% | 222 26% | 156.4 48% |
| Last max * (Watt) | 372.8 | 367.2 2% | 384 -3% | 233 37% | 336 10% | 199 47% |
* ... kleinere Werte sind besser
Stromverbrauch Cyberpunk/Stresstest
Stromverbrauch externer Monitor
Akkulaufzeit
Die WLAN-Laufzeit ist etwa gleich lang wie zuvor, wenn nicht sogar etwas länger, nämlich nur eine halbe Stunde, selbst bei aktivierter VRR und Optimus und deaktivierten LEDs. Dennoch sind drei Stunden nicht sehr lang, egal wie man es betrachtet.
| Alienware 16 Area-51 Core Ultra 9 290HX Plus Ultra 9 290HX Plus, GeForce RTX 5080 Laptop, 96 Wh | Alienware 16 Area-51 Ultra 9 275HX, GeForce RTX 5080 Laptop, 96 Wh | Lenovo Legion Pro 7i 16 Gen 10 Ultra 9 275HX, GeForce RTX 5080 Laptop, 99 Wh | HP Omen Max 16 ah000 Ultra 9 275HX, GeForce RTX 5090 Laptop, 83 Wh | MSI Vector 16 HX AI A2XWHG Ultra 7 255HX, GeForce RTX 5070 Ti Laptop, 90 Wh | Asus ROG Zephyrus G16 GU605CW Ultra 9 285H, GeForce RTX 5080 Laptop, 90 Wh | |
|---|---|---|---|---|---|---|
| Akkulaufzeit | -13% | 69% | 81% | 119% | ||
| WLAN (h) | 3.2 | 2.8 -13% | 5.4 69% | 5.8 81% | 7 119% | |
| Idle (h) | 3.1 | 8.7 | ||||
| Last (h) | 0.8 | 1.2 |
Notebookcheck Bewertung
Das Alienware 16 Area-51 mit Core Ultra 9 290HX Plus ist die schnellste verfügbare Version des Modells. Für die große Mehrheit der Gamer wird die zusätzliche CPU-Leistung jedoch bestenfalls einen kleinen Unterschied machen.
Alienware 16 Area-51 Core Ultra 9 290HX Plus
- 22.04.2026 v8
Allen Ngo
 Total Sustainability Score:
 Potenzielle Wettbewerber im Vergleich
Bild | Modell / Test | Preis ab | Gewicht | Dicke | Display |
|---|---|---|---|---|---|
1. 88.1%  | Alienware 16 Area-51 Core Ultra 9 290HX Plus Intel Core Ultra 9 290HX Plus ⎘ NVIDIA GeForce RTX 5080 Laptop ⎘ 32 GB RAM, SSD | Amazon: Geizhals Suche | 3.3 kg | 28.5 mm | 16.00" 2560x1600 189 PPI OLED |
2. 85.7%  | Alienware 16 Area-51 Intel Core Ultra 9 275HX ⎘ NVIDIA GeForce RTX 5080 Laptop ⎘ 32 GB RAM, 1024 GB SSD | Amazon: 1. 1.215,07 € Alienware 16 Zoll Area-51 Ga... 2. 1.622,02 € Alienware 18 Area-51 Gaming ... 3. 4.299,00 € Alienware 18 Area-51 Gaming ... Geizhals Suche | 3.3 kg | 28.5 mm | 16.00" 2560x1600 189 PPI IPS |
3. 87.5%  | Lenovo Legion Pro 7i 16 Gen 10 Intel Core Ultra 9 275HX ⎘ NVIDIA GeForce RTX 5080 Laptop ⎘ 32 GB RAM, 1024 GB SSD | Amazon: Geizhals Suche | 2.6 kg | 26.65 mm | 16.00" 2560x1600 189 PPI OLED |
4. 81.9%  | HP Omen Max 16 ah000 Intel Core Ultra 9 275HX ⎘ NVIDIA GeForce RTX 5090 Laptop ⎘ 32 GB RAM, 2048 GB SSD | Amazon: 4.109,00 € Geizhals Suche | 2.8 kg | 24.9 mm | 16.00" 2560x1600 189 PPI OLED |
5. 84%  | MSI Vector 16 HX AI A2XWHG Intel Core Ultra 7 255HX ⎘ NVIDIA GeForce RTX 5070 Ti Laptop ⎘ 16 GB RAM, 512 GB SSD | Amazon: 1.923,47 € Bestpreis 1898.99€ playox.de 2. 1899€ office-partner.de 3. 1914.95€ playox (AT) | 2.6 kg | 28.6 mm | 16.00" 2560x1600 189 PPI IPS |
6.  | Asus ROG Zephyrus G16 GU605CW Intel Core Ultra 9 285H ⎘ NVIDIA GeForce RTX 5080 Laptop ⎘ 32 GB RAM, 2048 GB SSD | Amazon: Geizhals Suche | 2 kg | 14.9 mm | 16.00" 2560x1600 189 PPI OLED |
Transparenz
Die Auswahl der zu testenden Geräte erfolgt innerhalb der Redaktion. Das vorliegende Testmuster wurde dem Autor vom Hersteller oder einem Shop zu Testzwecken leihweise zur Verfügung gestellt. Eine Einflussnahme des Leihstellers auf den Testbericht gab es nicht, der Hersteller erhielt keine Version des Reviews vor der Veröffentlichung. Es bestand keine Verpflichtung zur Publikation. Als eigenständiges, unabhängiges Unternehmen unterliegt Notebookcheck keiner Diktion von Herstellern, Shops und Verlagen.
So testet Notebookcheck
Pro Jahr werden von Notebookcheck hunderte Laptops und Smartphones unabhängig in von uns standardisierten technischen Verfahren getestet, um eine Vergleichbarkeit aller Testergebnisse zu gewährleisten. Seit rund 20 Jahren entwickeln wir diese Testmethoden kontinuierlich weiter und setzen damit Branchenstandards. In unseren Testlaboren kommt ausschließlich hochwertiges Messequipment in die Hände erfahrener Techniker und Redakteure. Die Tests unterliegen einer mehrstufigen Kontrolle. Unsere komplexe Gesamtbewertung basiert auf hunderten fundierten Messergebnissen und Benchmarks, womit Ihnen Objektivität garantiert ist. Weitere Informationen zu unseren Testmethoden gibt es hier.

