Fazit - Edles und äußerst potentes Desktop-Replacement
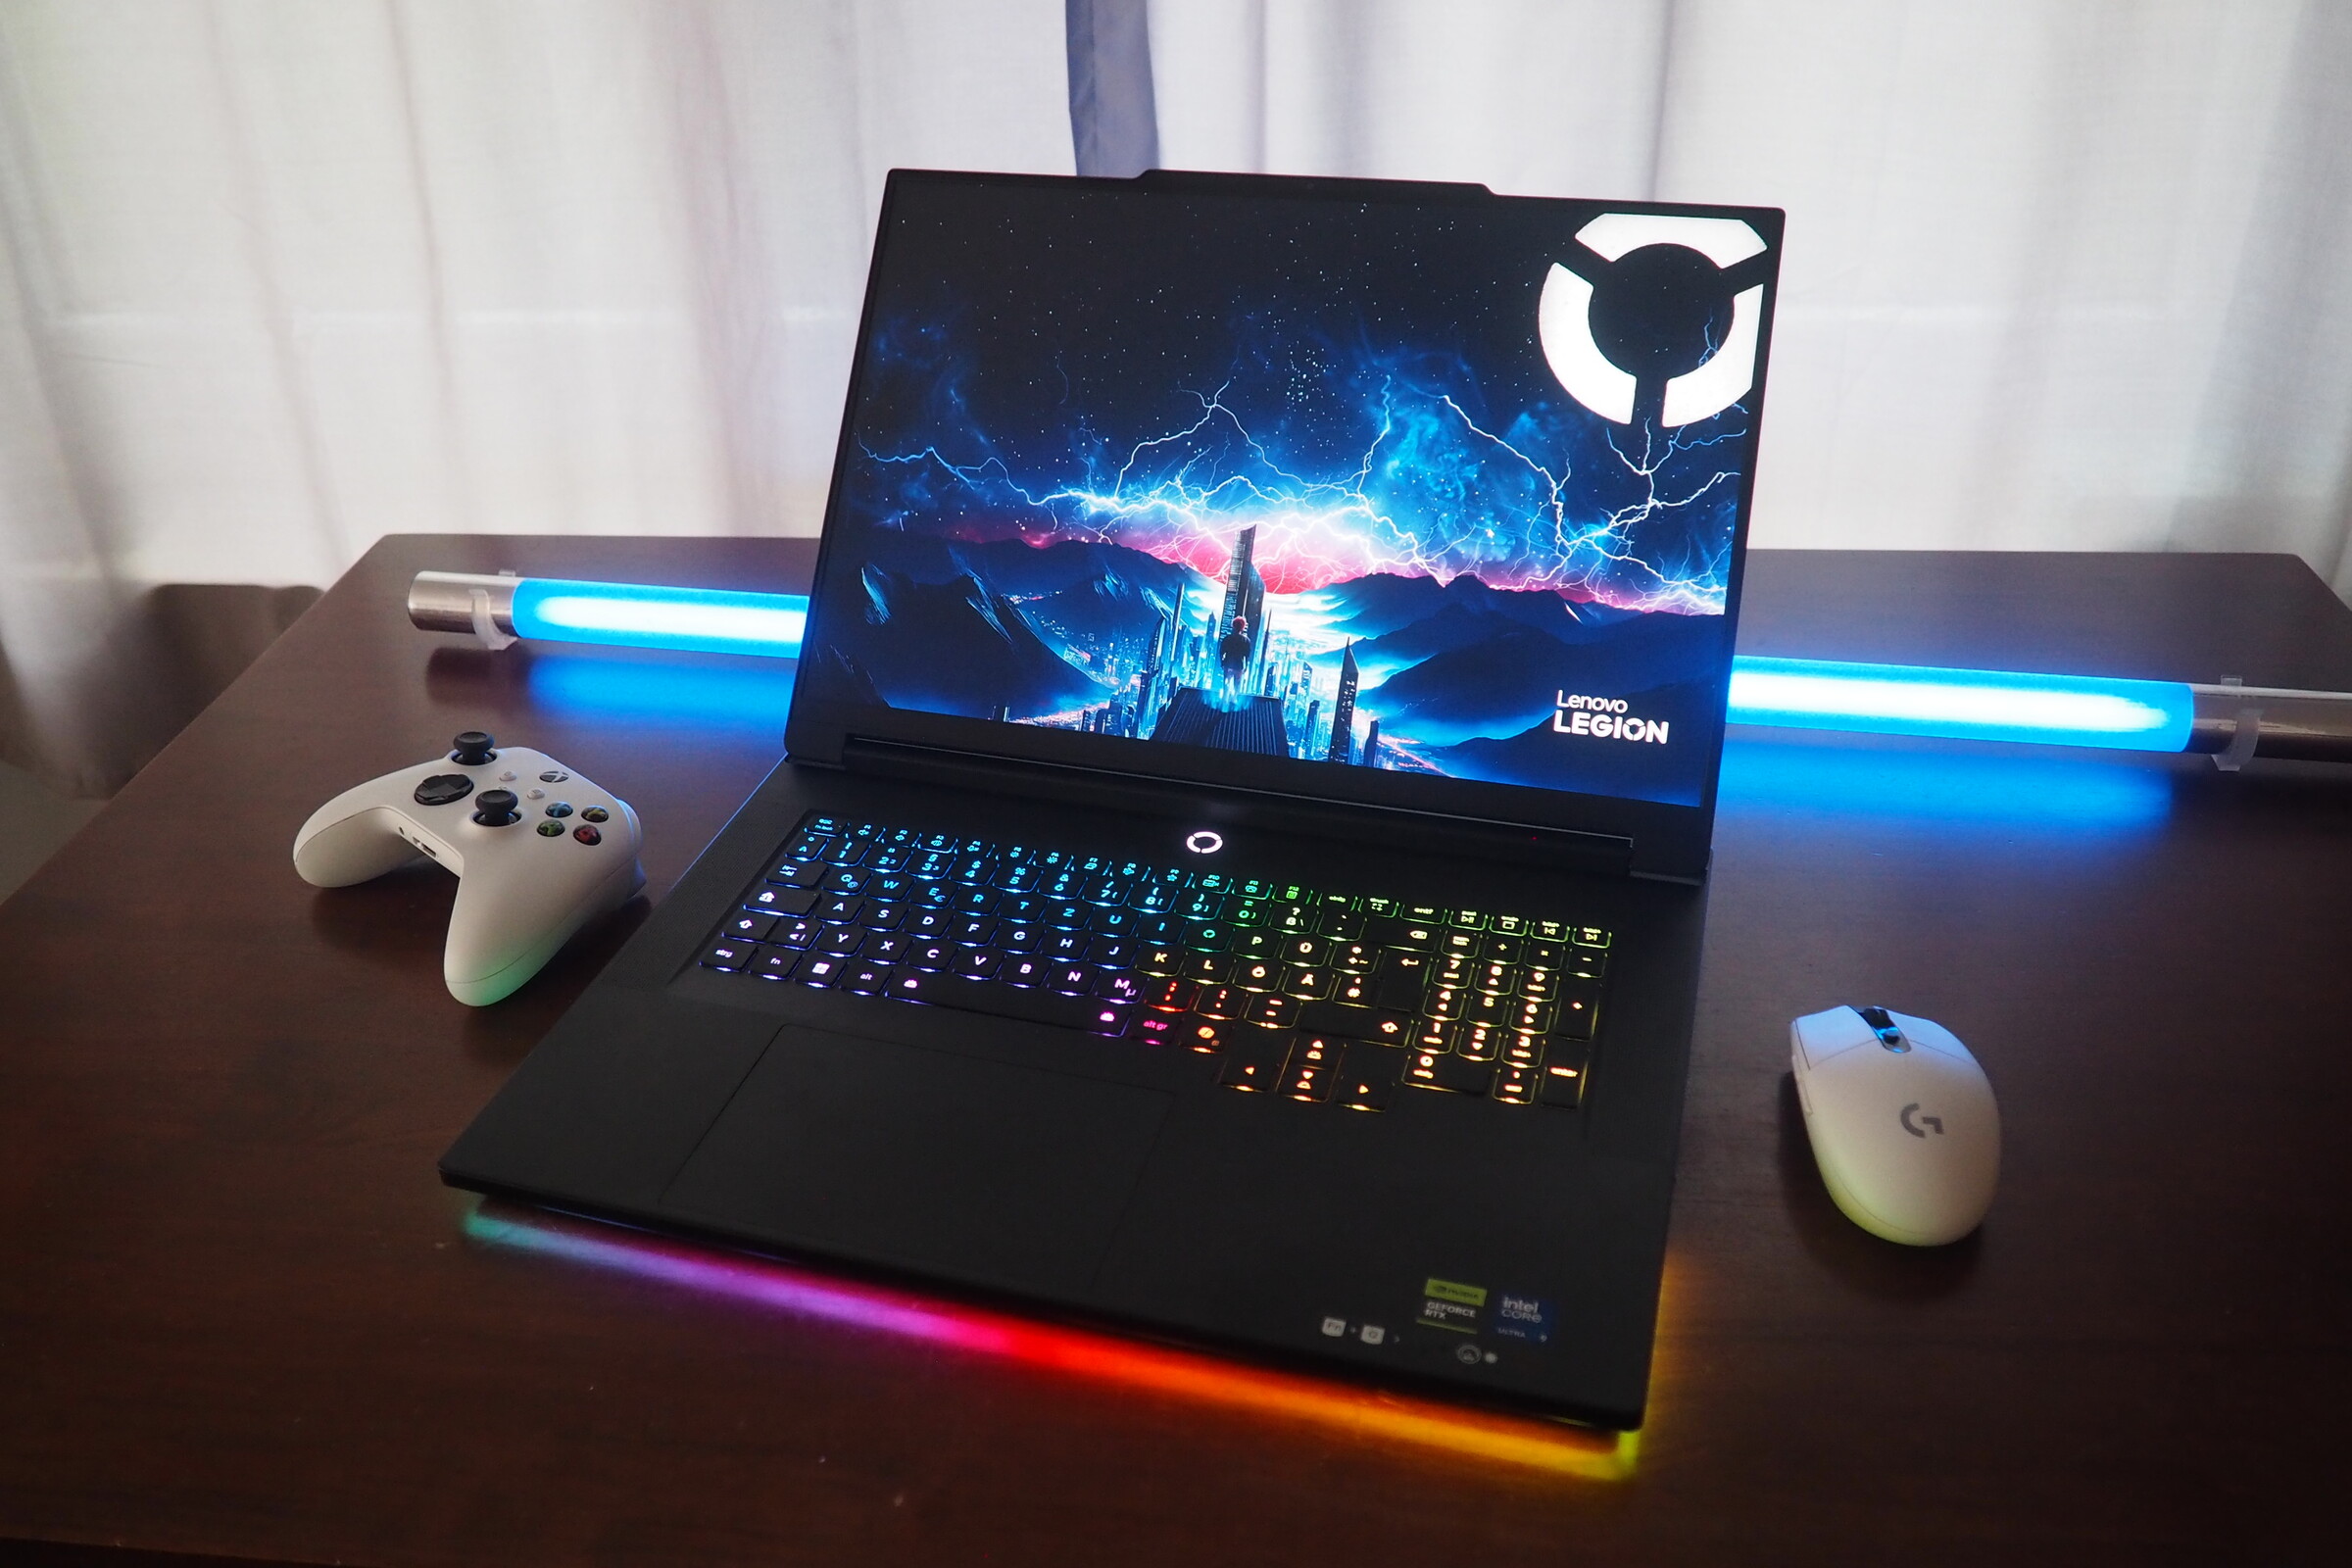
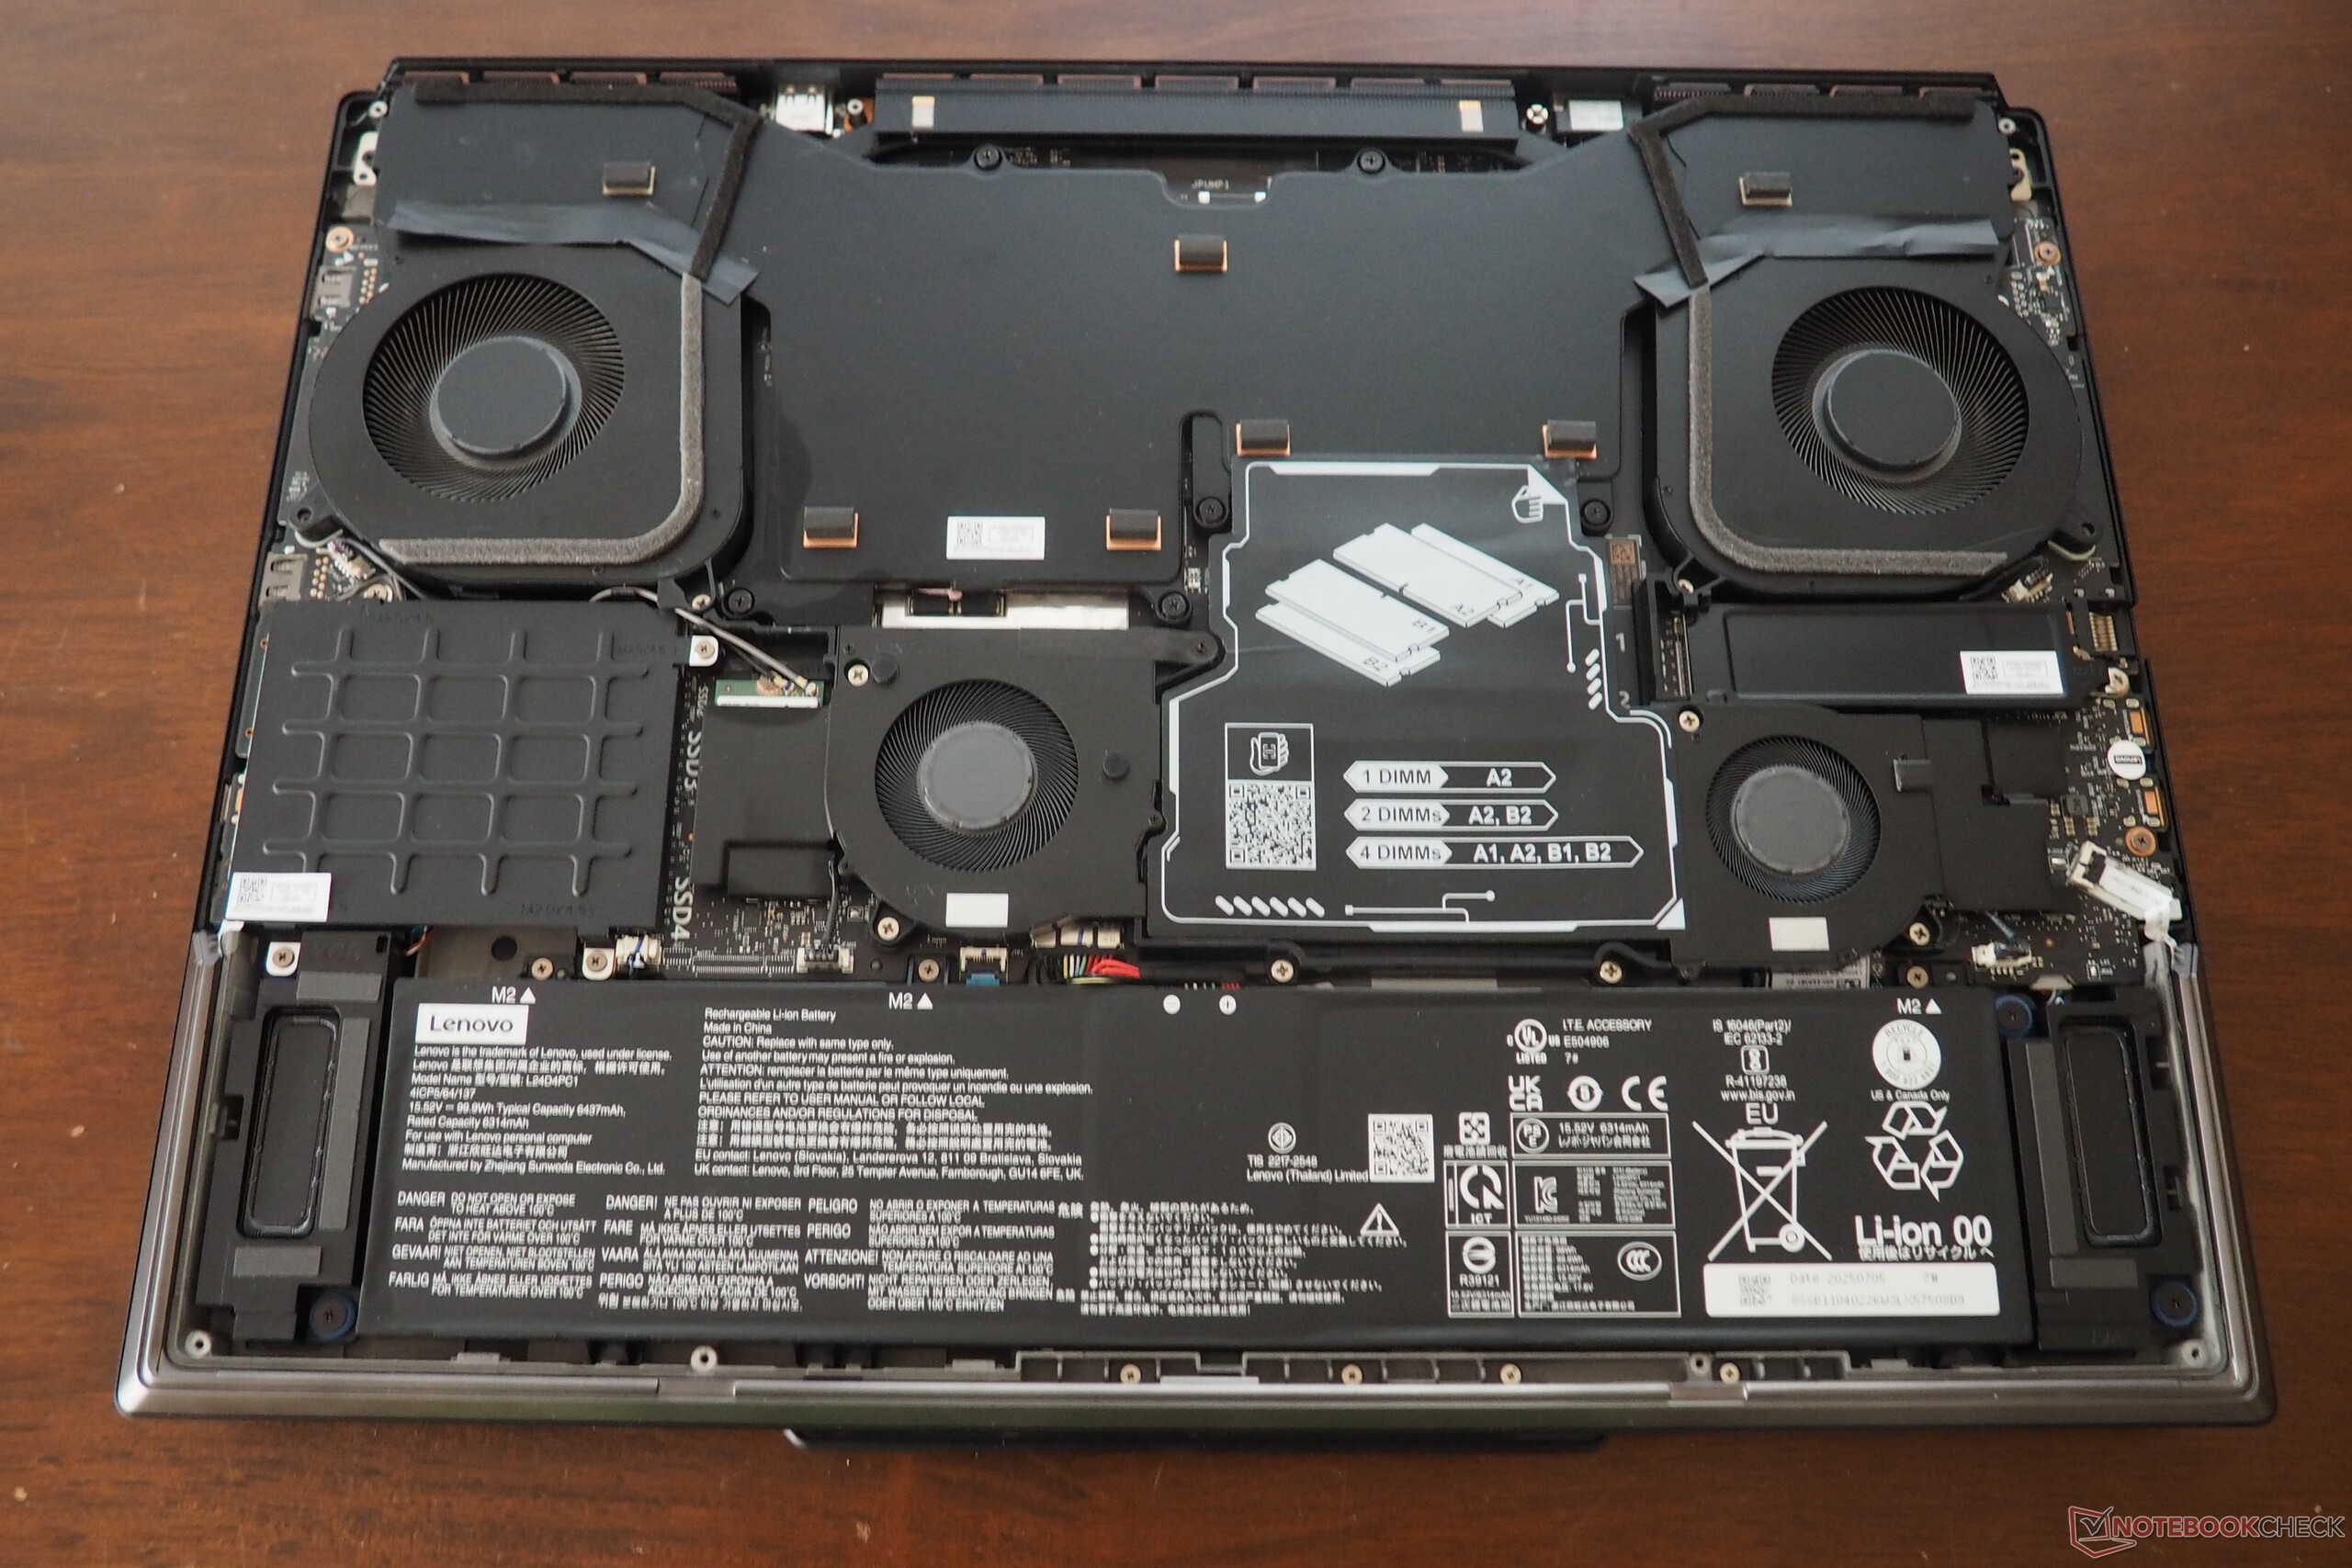
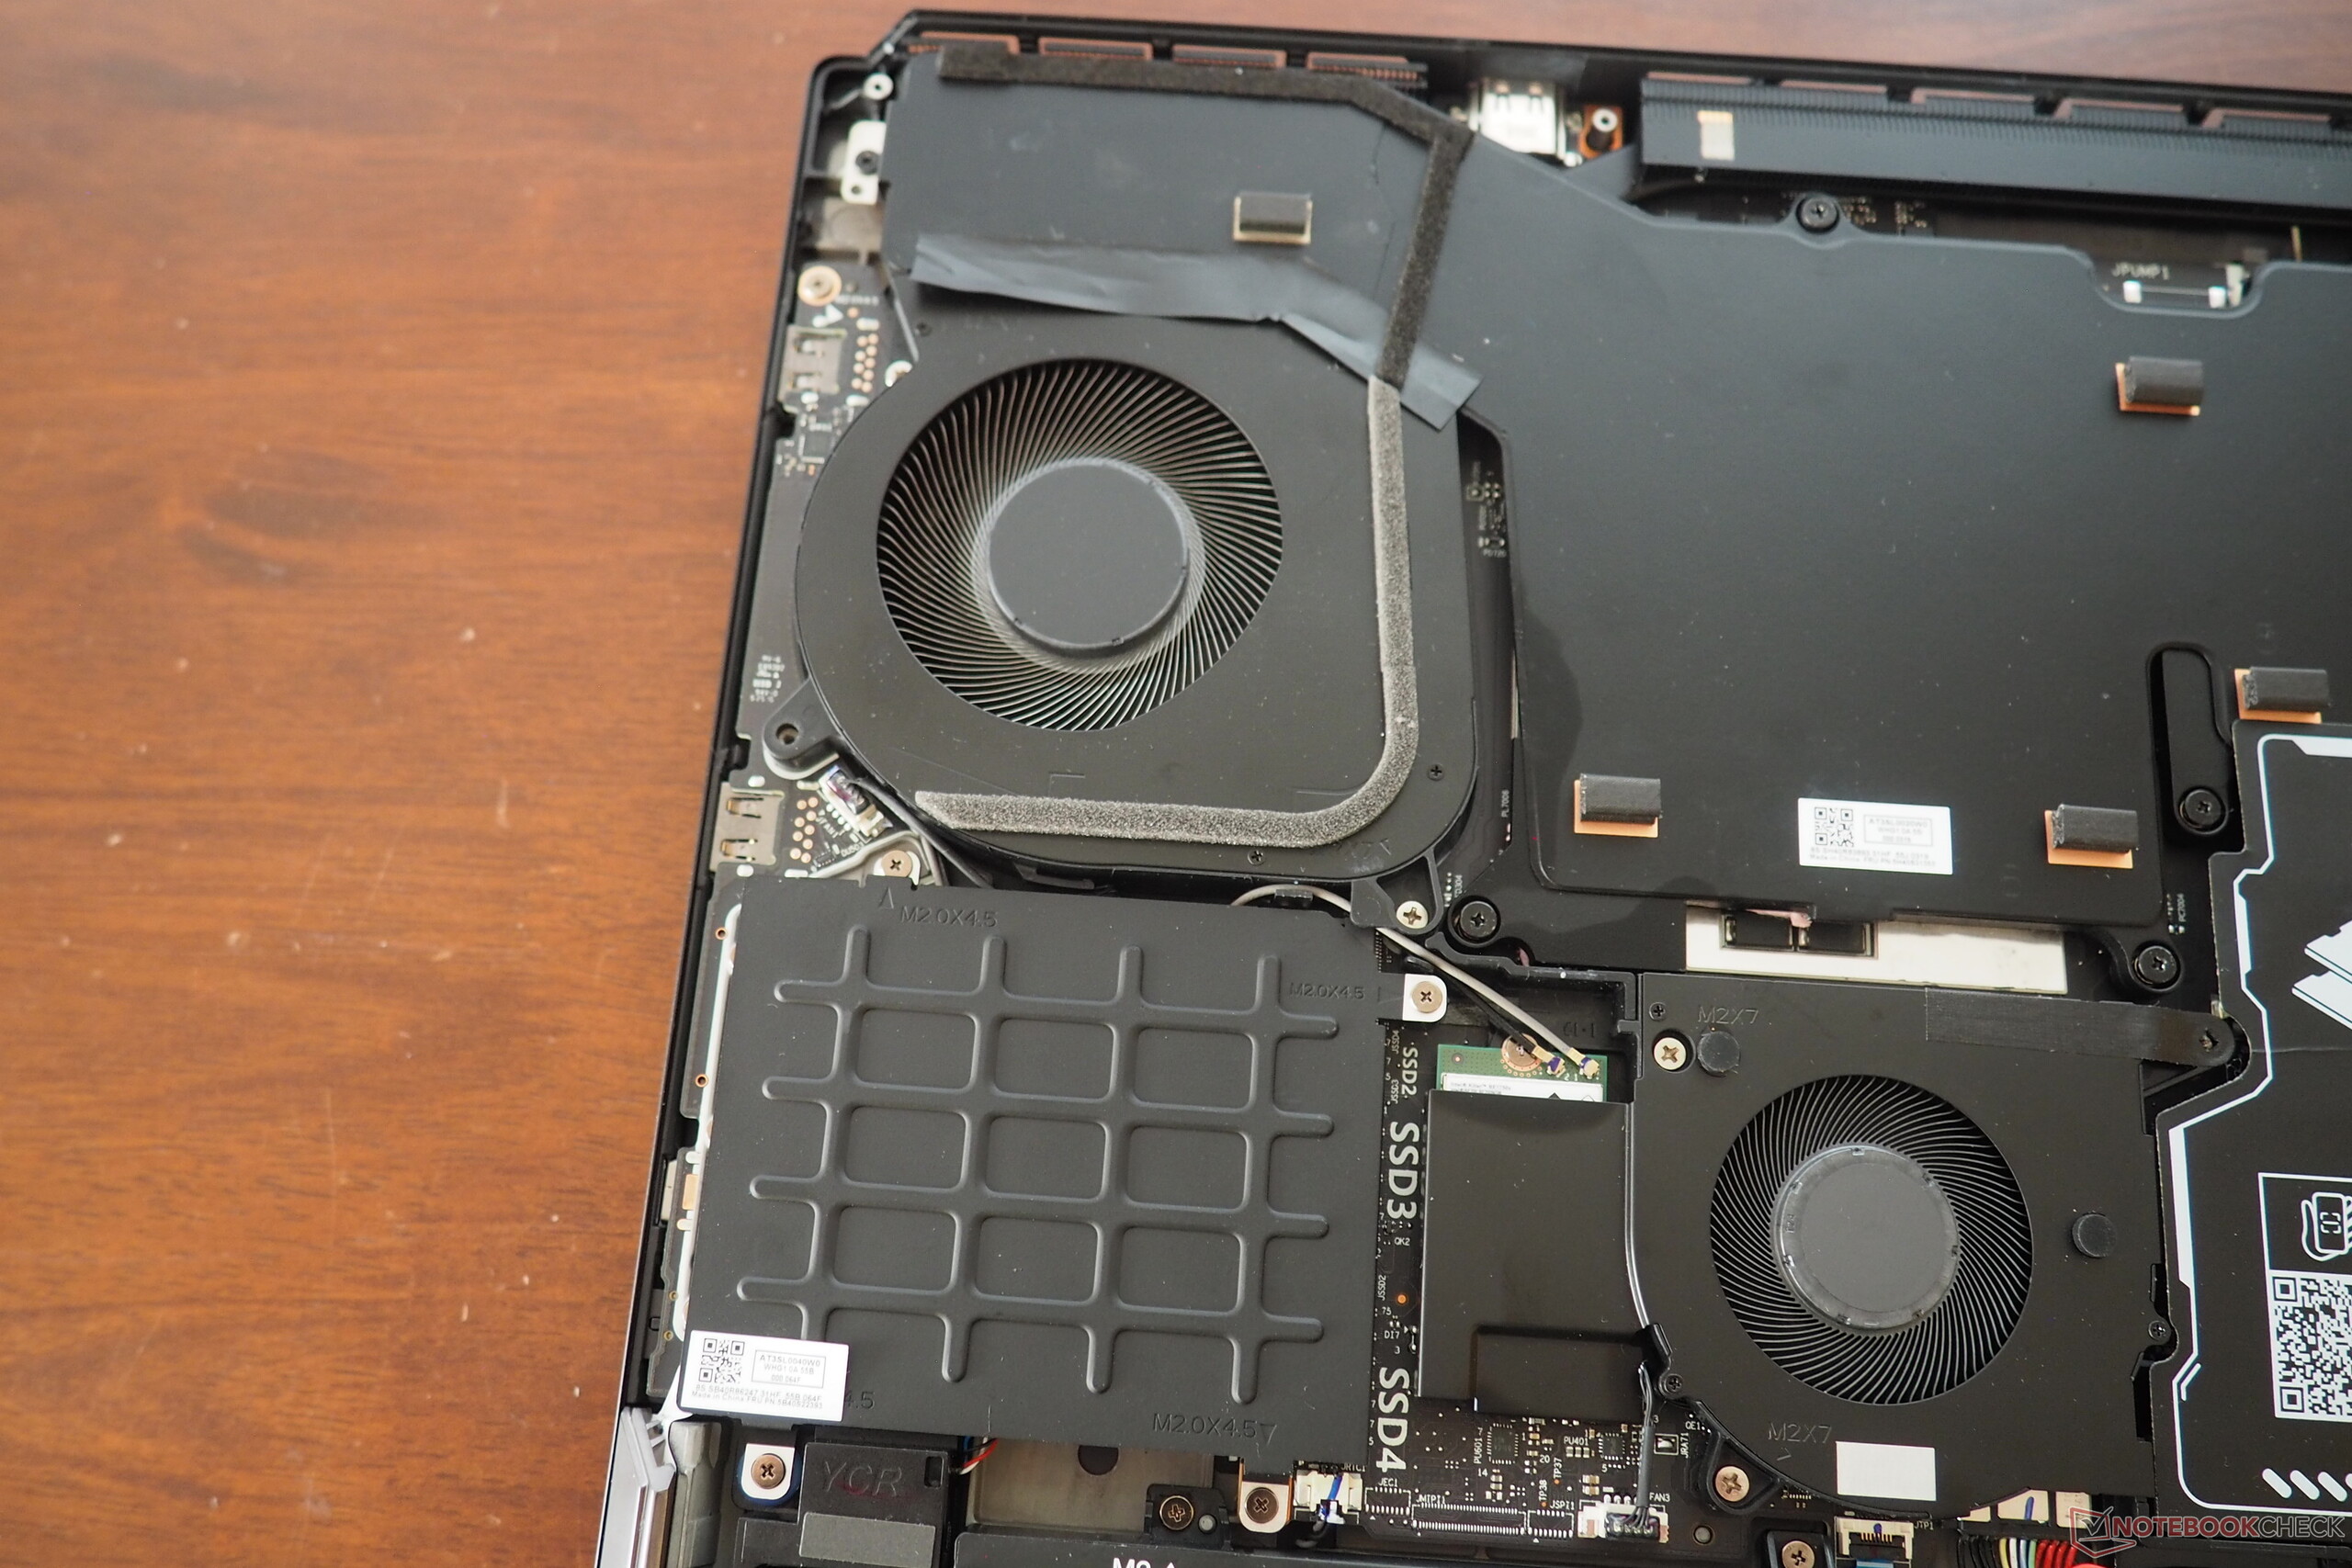
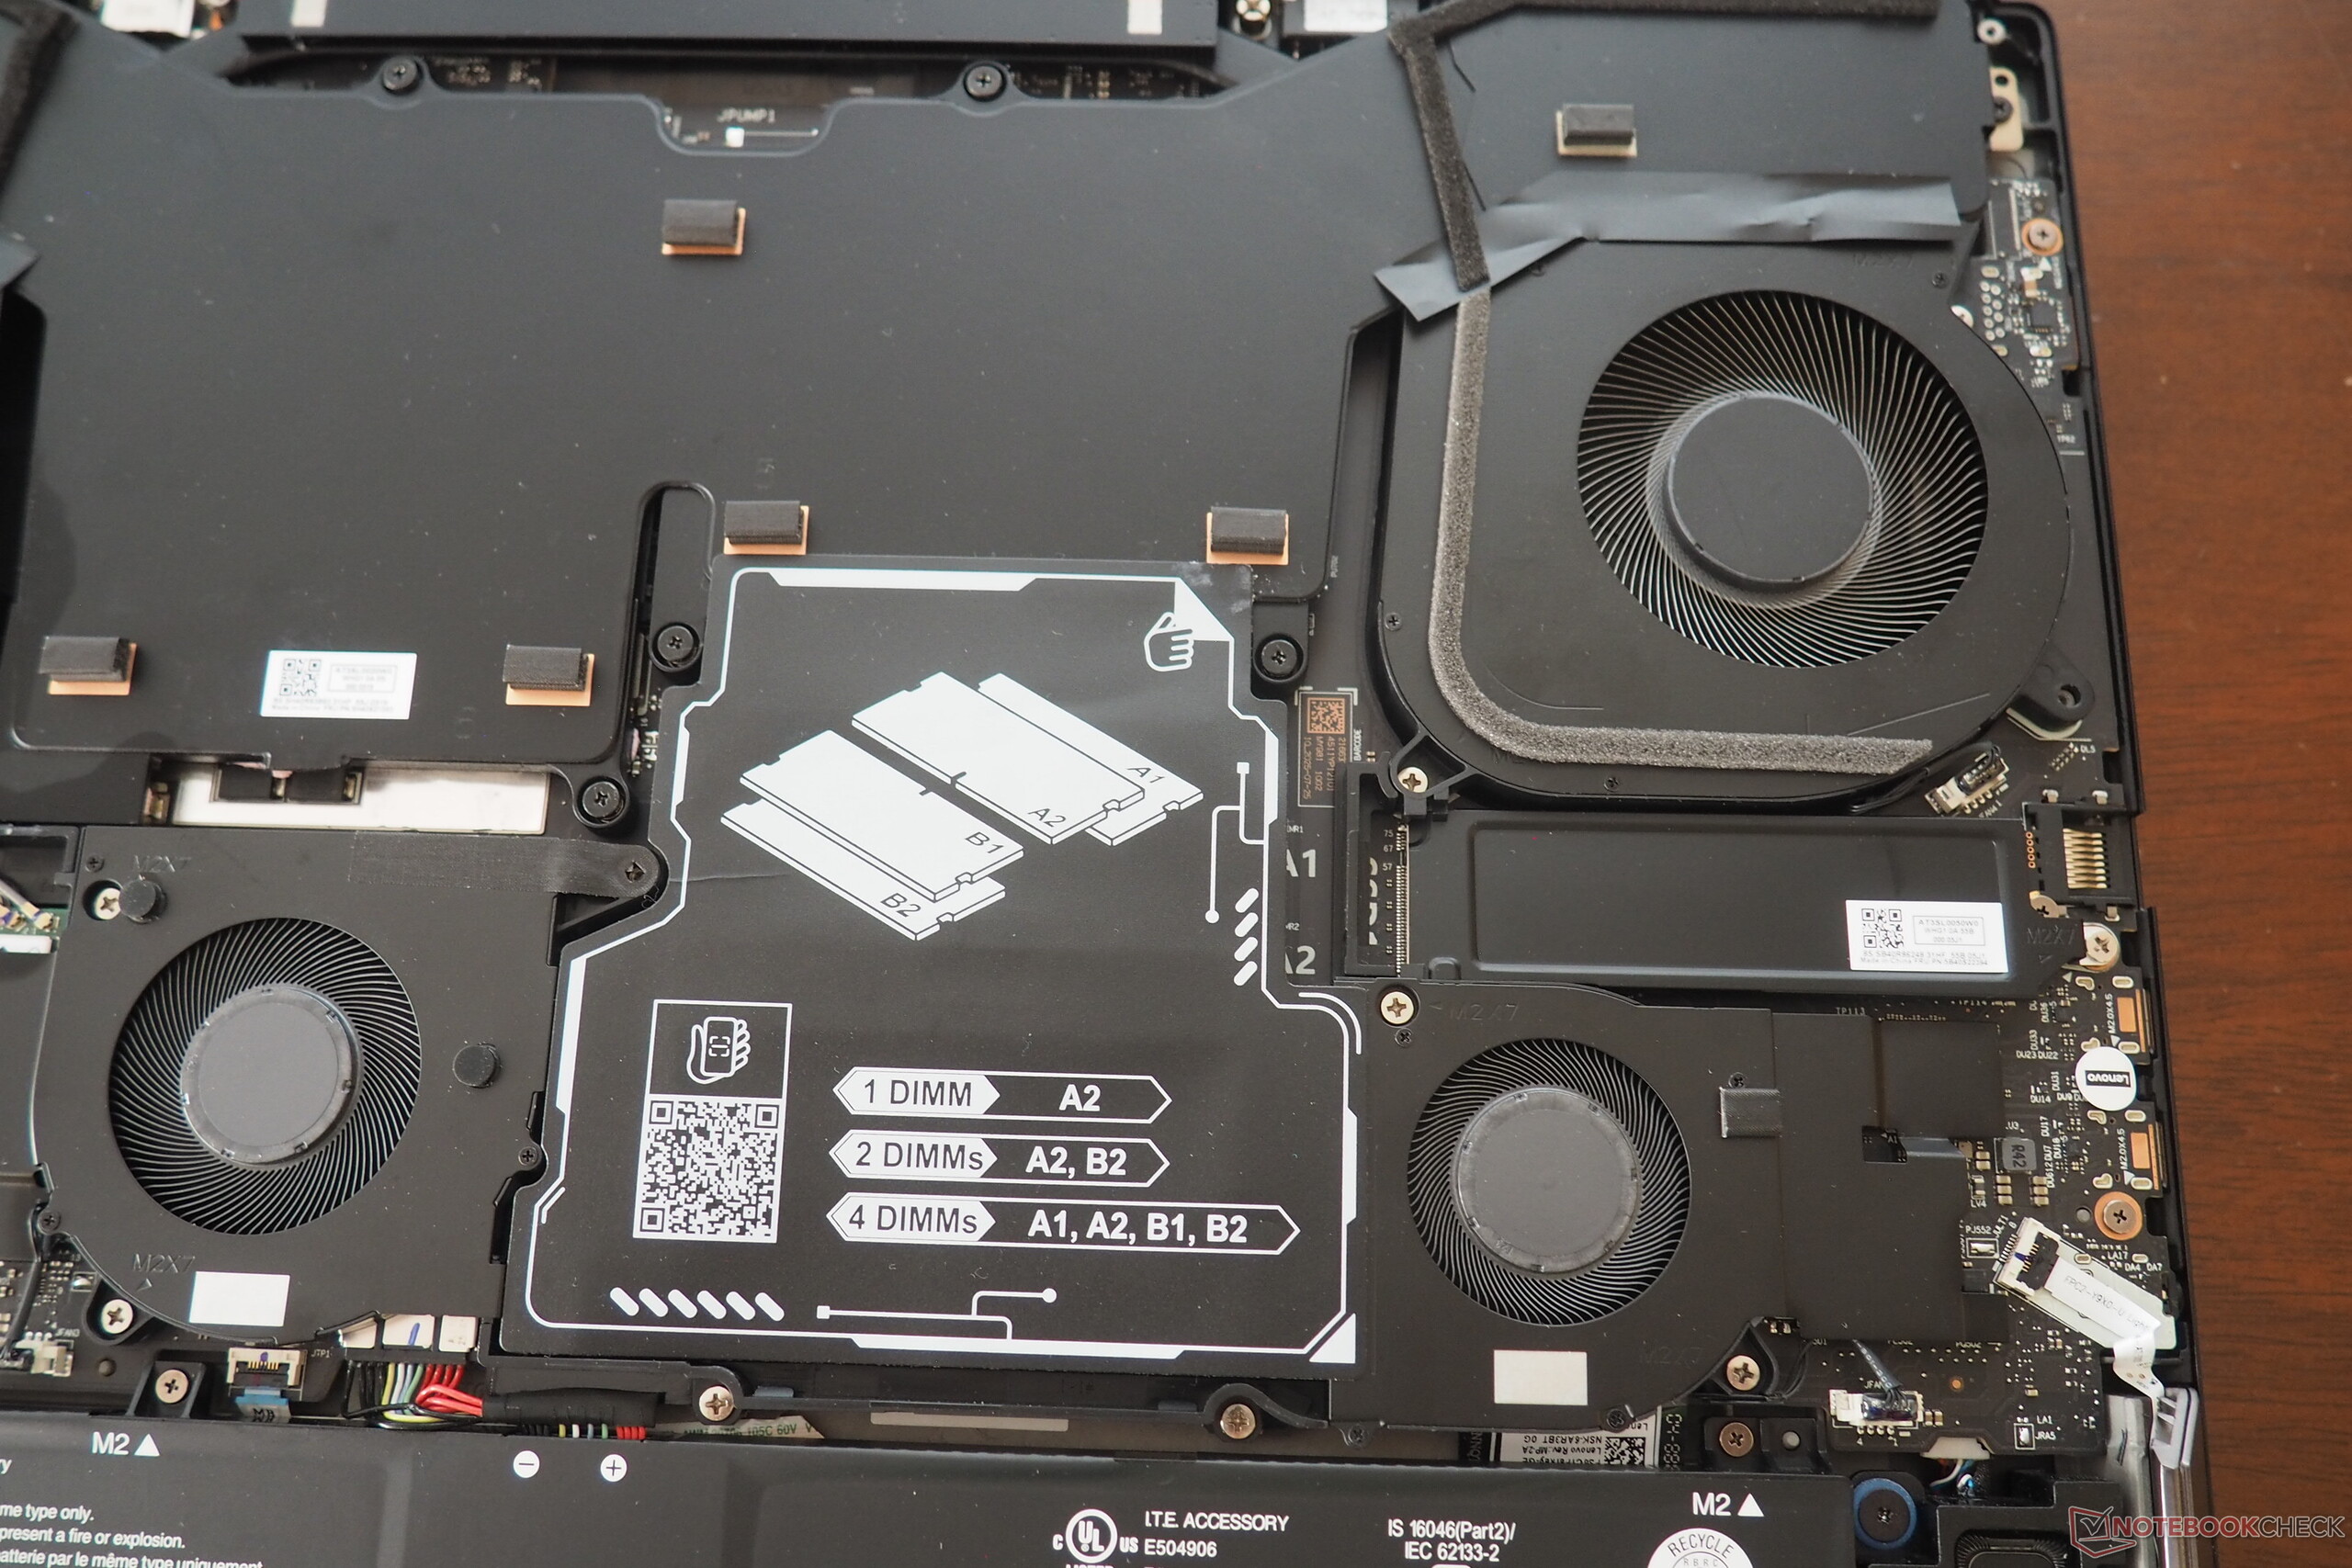
Wie bereits die 5080er-Variante hinterließ auch die – mit knapp 6.000 Euro fast schon absurd teure – RTX 5090-Edition des Legion 9 18 in den meisten Kategorien eine gute bis sehr gute Figur. Zu den Stärken des Gaming-Boliden gehört unter anderem das hochwertig anmutende Gehäuse, das mit einem schicken Design und vielen Beleuchtungselementen auf Kundenfang geht. Die Anschlussausstattung ist ebenfalls nicht von schlechten Eltern, als Beispiel seien hier die beiden Thunderbolt 5-Ports genannt. Unter der Haube geht es ebenfalls sehr üppig zu, wenn man die vier Lüfter, vier RAM-Bänke und vier SSD-Slots betrachtet. Auch die Soundqualität wird den enormen Kosten gerecht. Die Performance ist ebenfalls über jeden Zweifel erhaben. Nicht zuletzt dank GPU-Overclocking setzt sich die RTX 5090 an die Spitze aller bisher getesteten Laptops mit diesem Grafikchip.
Allerdings hat der Muskelprotz natürlich auch seine Nachteile. So fällt das mitgelieferte 400-Watt-Netzteil ungemein wuchtig und schwer aus. Dazu kommen ein happiger Energiebedarf, eine maue Akkulaufzeit und ein hoher Geräuschpegel im 3D-Betrieb. Insgesamt schneidet das RTX 5080-Pendant trotz geringerer Leistung entsprechend etwas besser ab.
Pro
Contra
Preis und Verfügbarkeit
Das Lenovo Legion 9 18IAX10 mit Core Ultra 9 275HX und GeForce RTX 5090 ist für knapp 6.000 Euro verfügbar (z. B. bei Amazon).
Zu den Konkurrenten des Legion 9 18 zählen andere 18-Zoll-Gamer mit der mobilen RTX 5090 wie das Alienware 18 Area-51, das Asus Strix Scar 18 G835 und das Razer Blade 18 2025, welche allesamt in den Tabellen als Vergleichsgeräte auftauchen.
Spezifikationen
Gehäuse
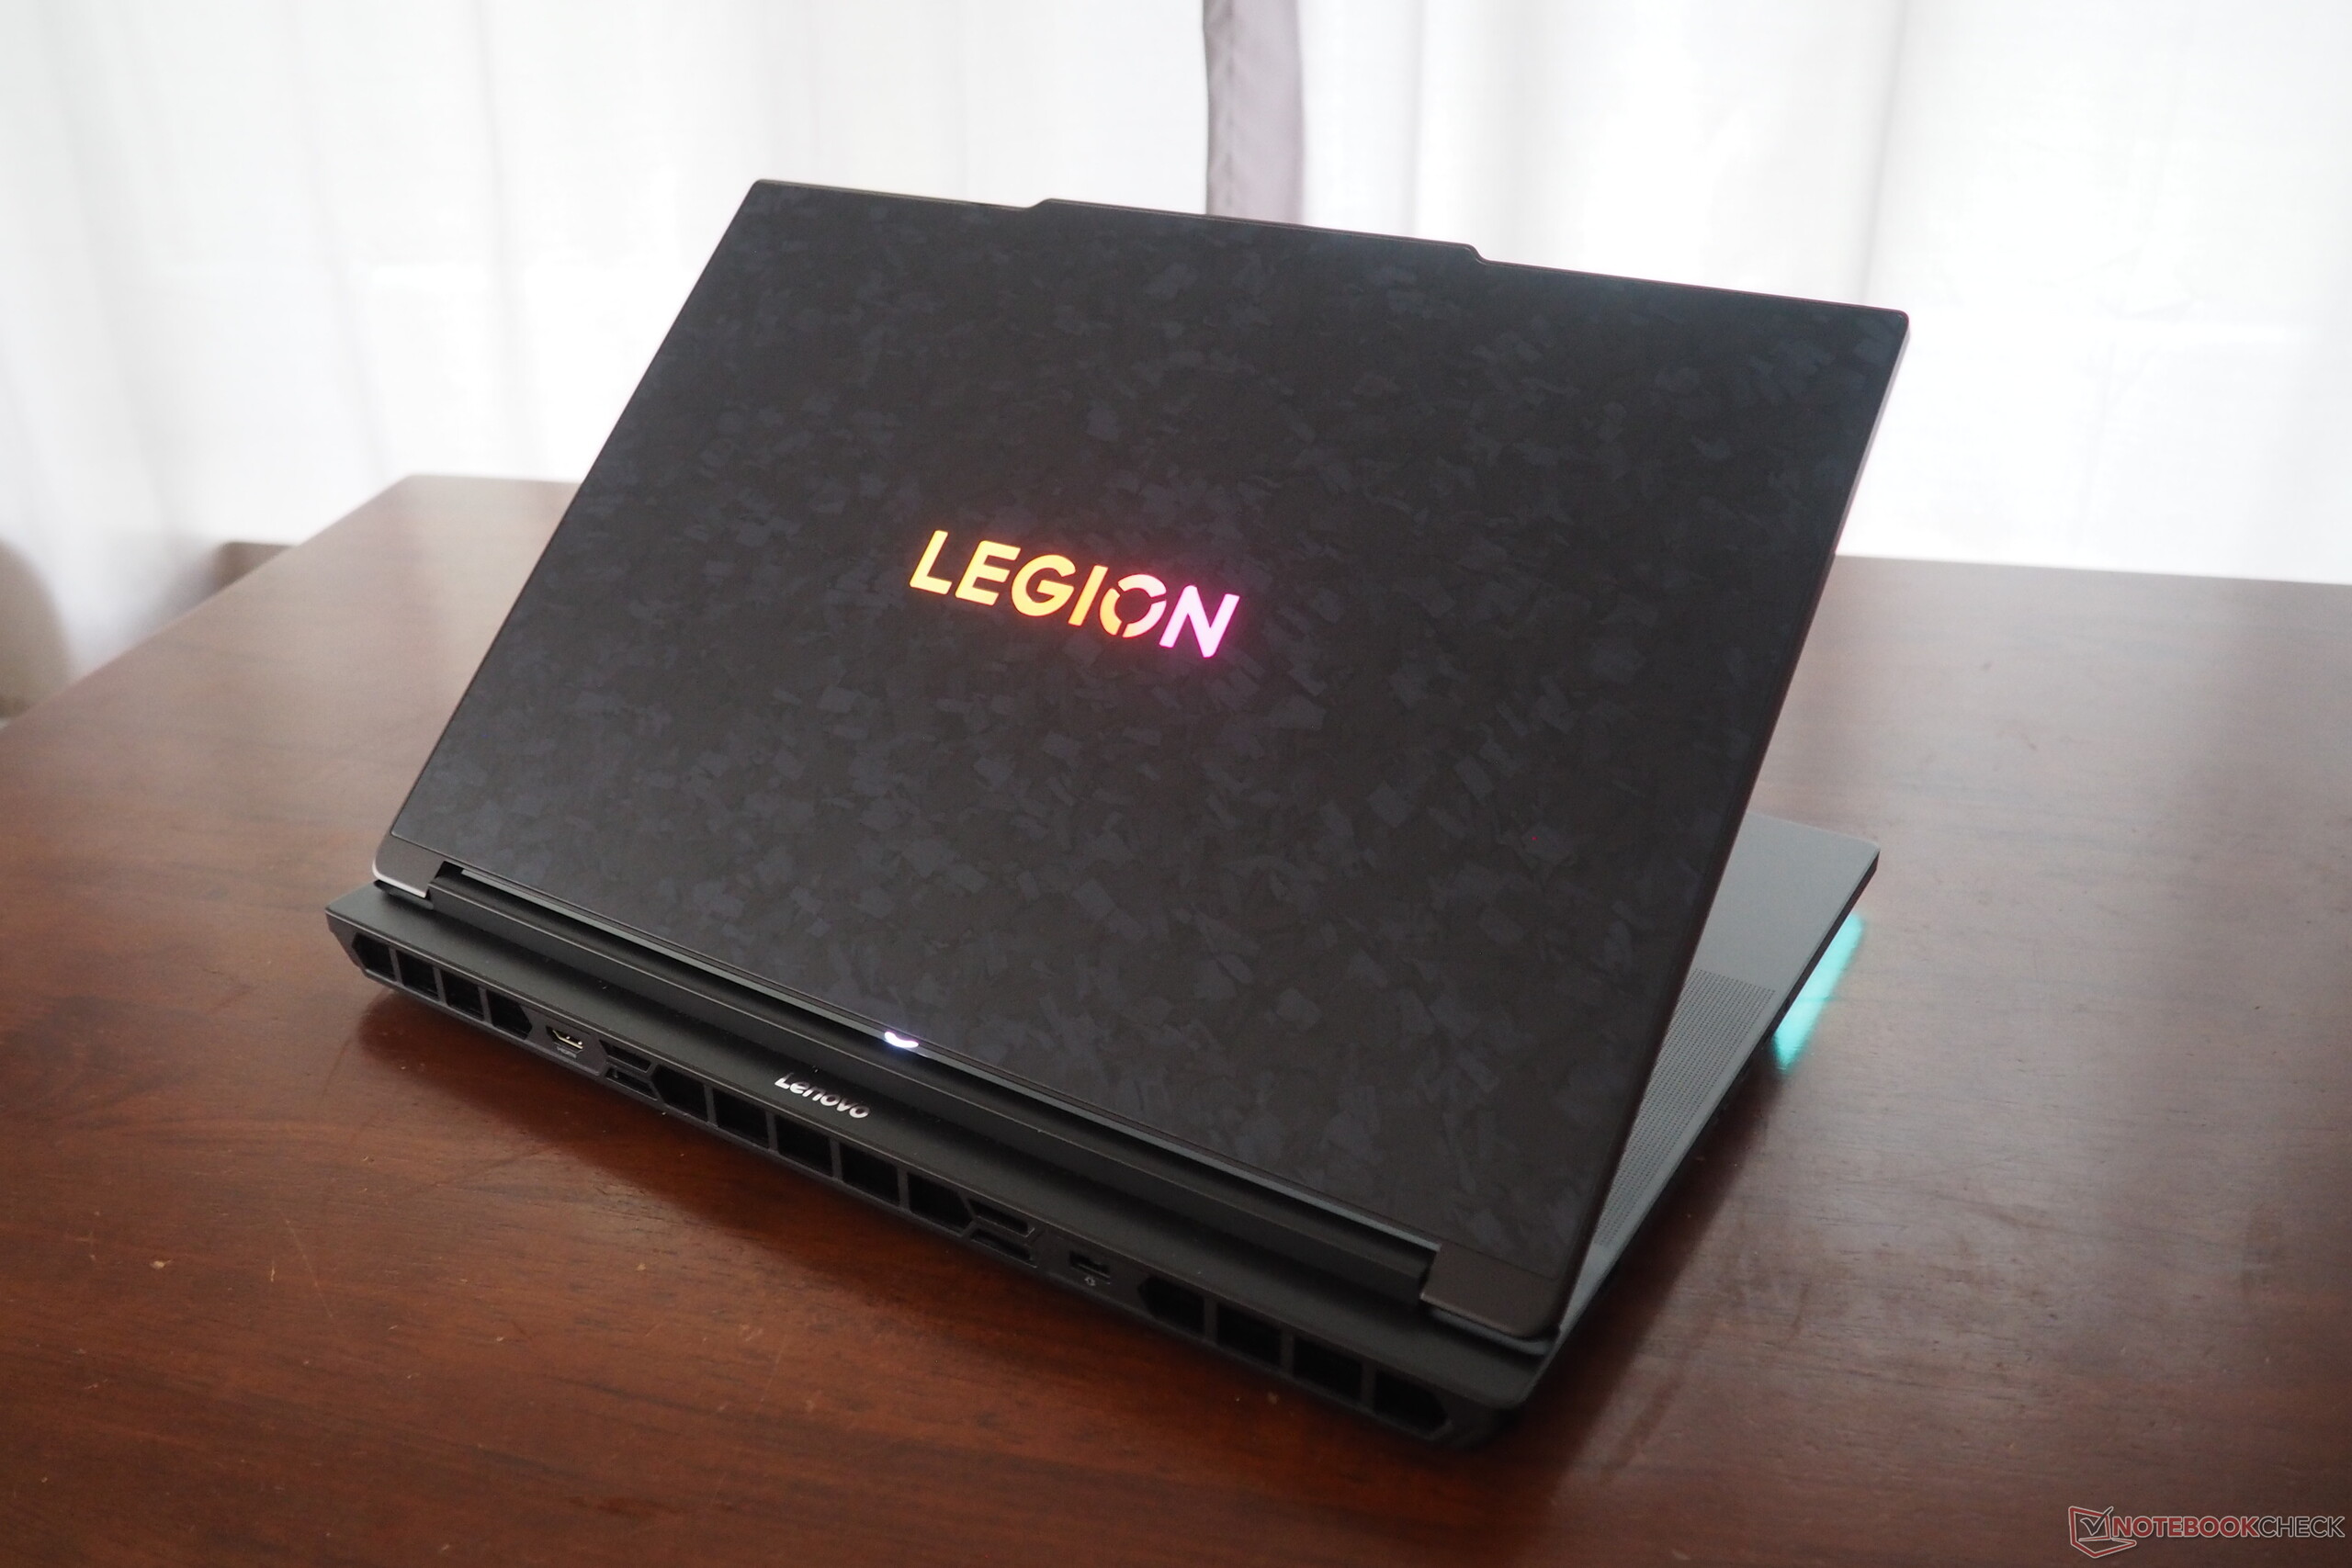
Das Gehäuse besticht nicht nur durch einen texturierten Deckel, sondern auch durch eine gute Stabilität und eine saubere Verarbeitung. 3,5 kg Gewicht sind für ein Notebook zwar ziemlich viel und mehr als beim Strix Scar 18 bzw. Blade 18 (3,2-3,3 kg), allerdings geht es noch schwerer, wie der Alienware-Spross zeigt (4,2 kg). Die Bauhöhe orientiert sich mit 2,8 cm (ohne Füße) derweil am Razer-Produkt. Besonders gut hat uns der üppige Aufklappwinkel von 180° gefallen.

Ausstattung
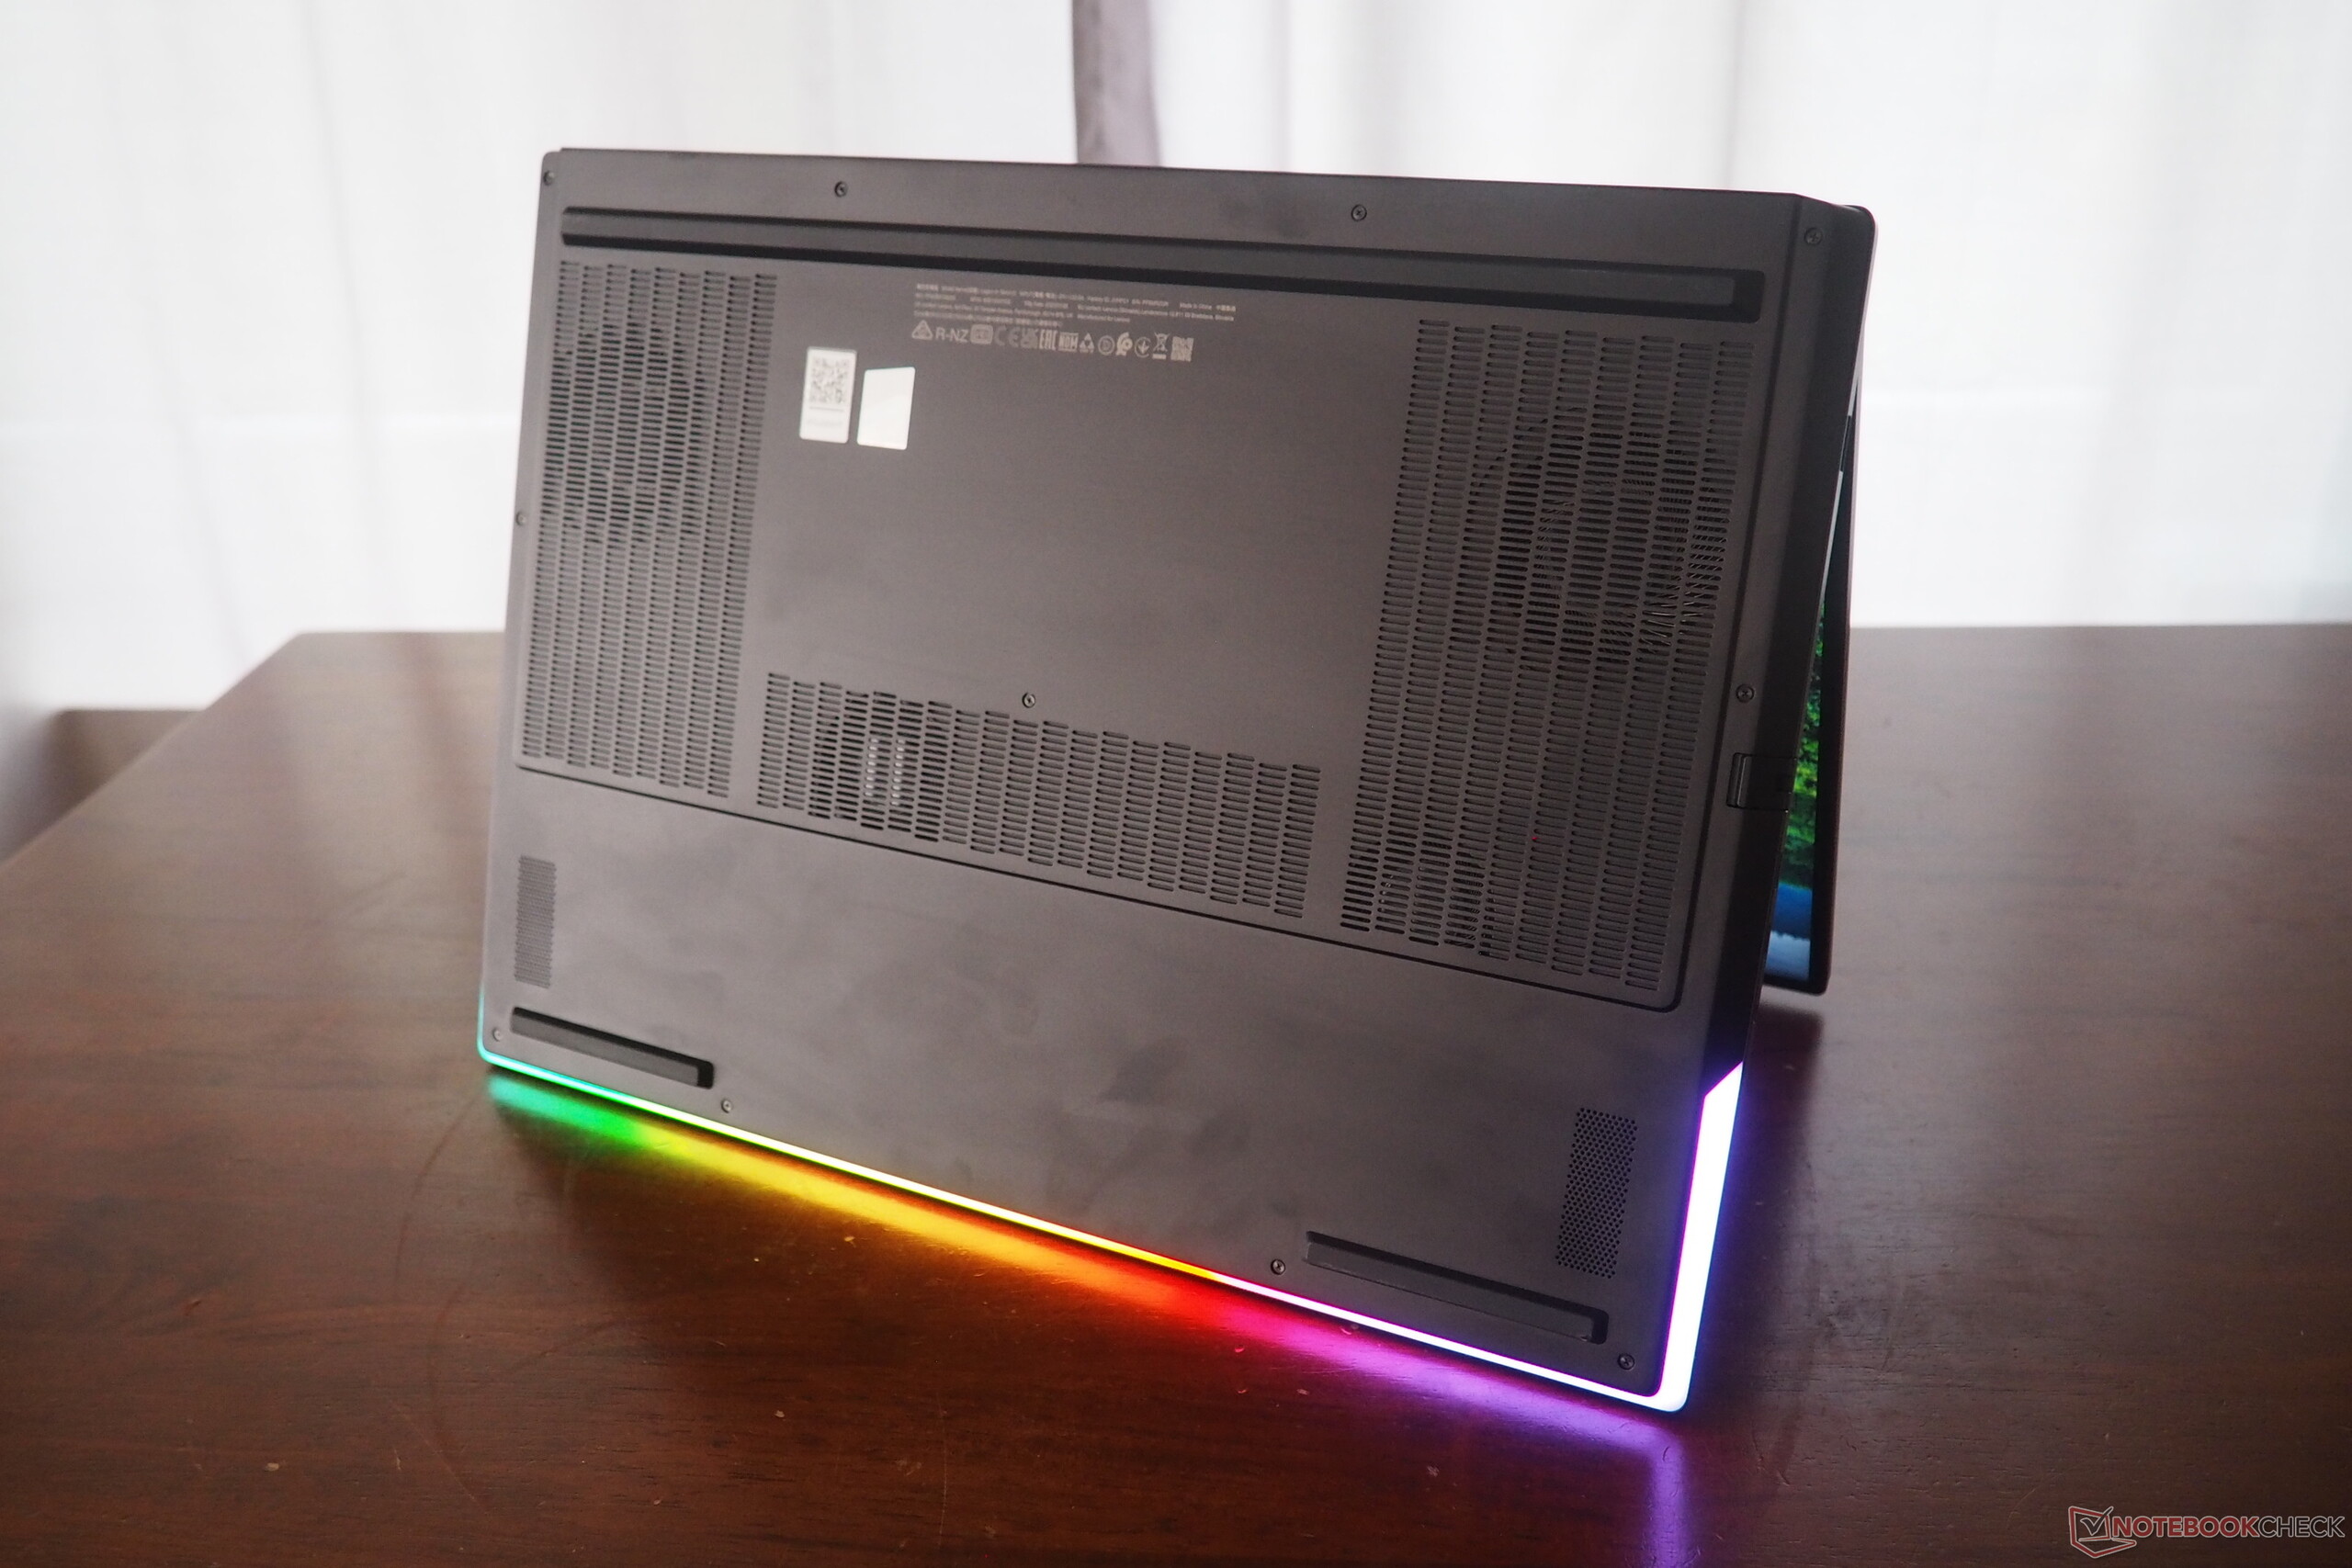
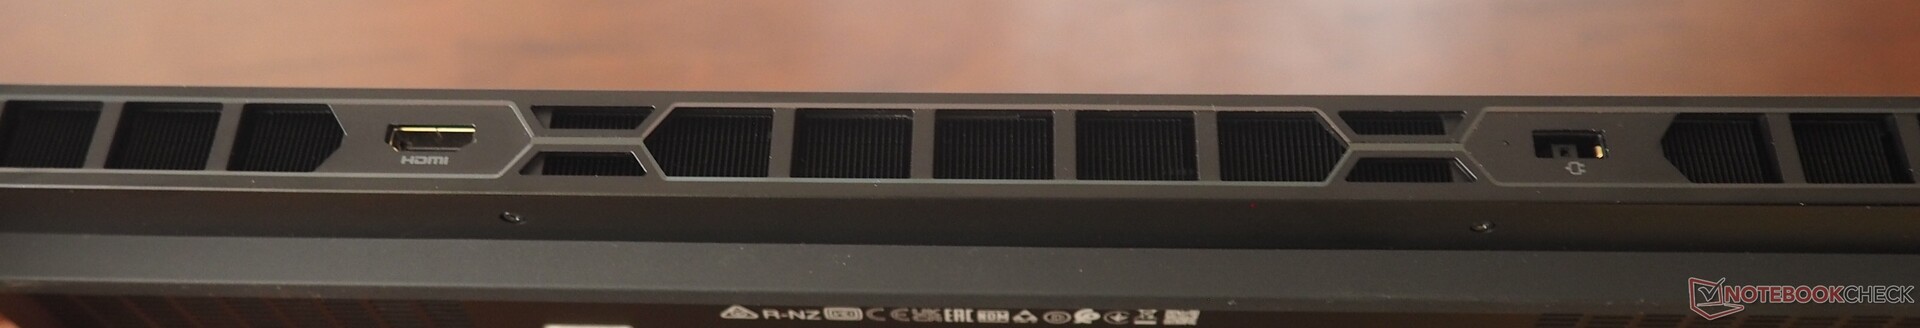
Die Anschlussmenge bzw. -vielfalt lässt keine Wünsche offen, zumal Lenovo sehr moderne Schnittstellen verbaut (siehe Fotos). Interessanterweise war der Cardreader langsamer als bei der RTX 5080-Version, das Funkmodul lieferte hingegen deutlich bessere Ergebnisse. Die 5-MP-Webcam, welche einen e-Shutter bietet, produziert ordentliche Bilder. Die Öffnung des Gehäuses könnte indes komfortabler sein: Zwar lassen sich die 11 Kreuzschrauben recht simpel entfernen, allerdings sitzt die Bodenplatte ungemein fest.


SD Card Reader
| SD Card Reader - average JPG Copy Test (av. of 3 runs) | |
| Lenovo Legion 9 18IAX10 (Toshiba Exceria Pro SDXC 64 GB UHS-II) | |
| Razer Blade 18 2025 RTX 5090 Laptop (Angelbird AV Pro V60) | |
| Alienware 18 Area-51 (Toshiba Exceria Pro SDXC 64 GB UHS-II) | |
| Durchschnitt der Klasse Gaming (20.9 - 210, n=54, der letzten 2 Jahre) | |
| Lenovo Legion 9 18IAX10 RTX 5090 (AV PRO microSD 128 GB V60) | |
Kommunikation
Webcam


Wartung

Eingabegeräte
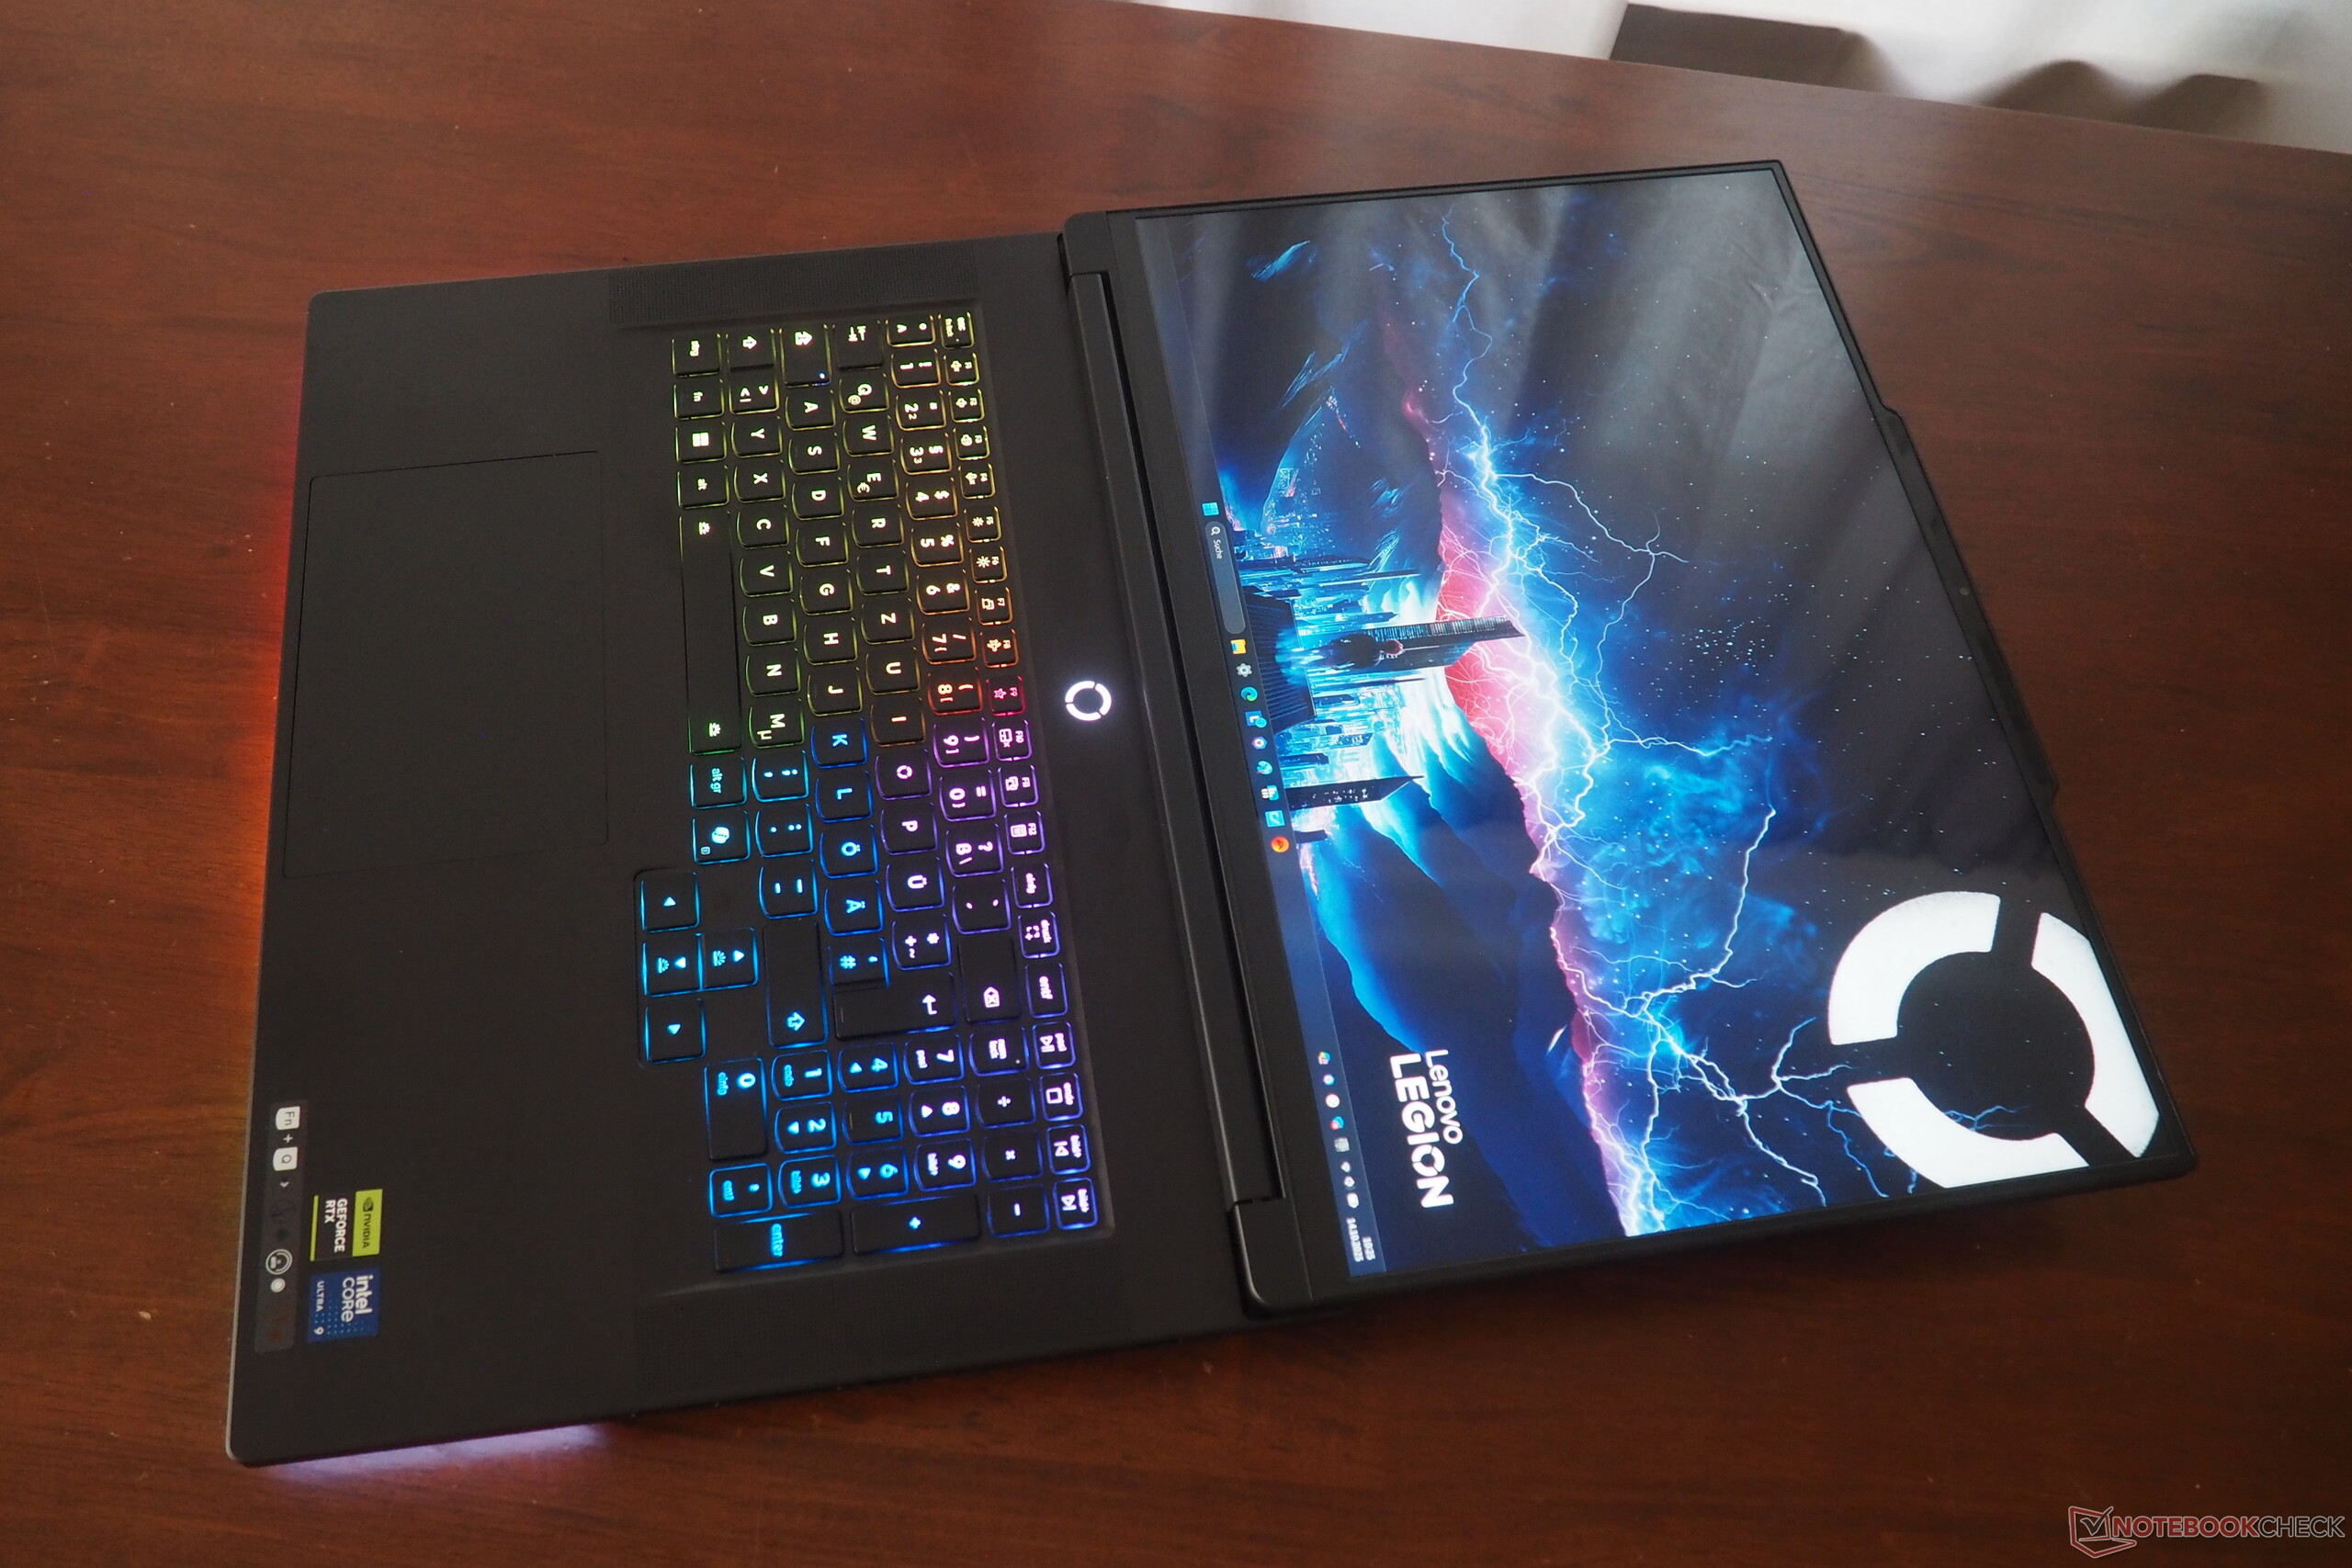
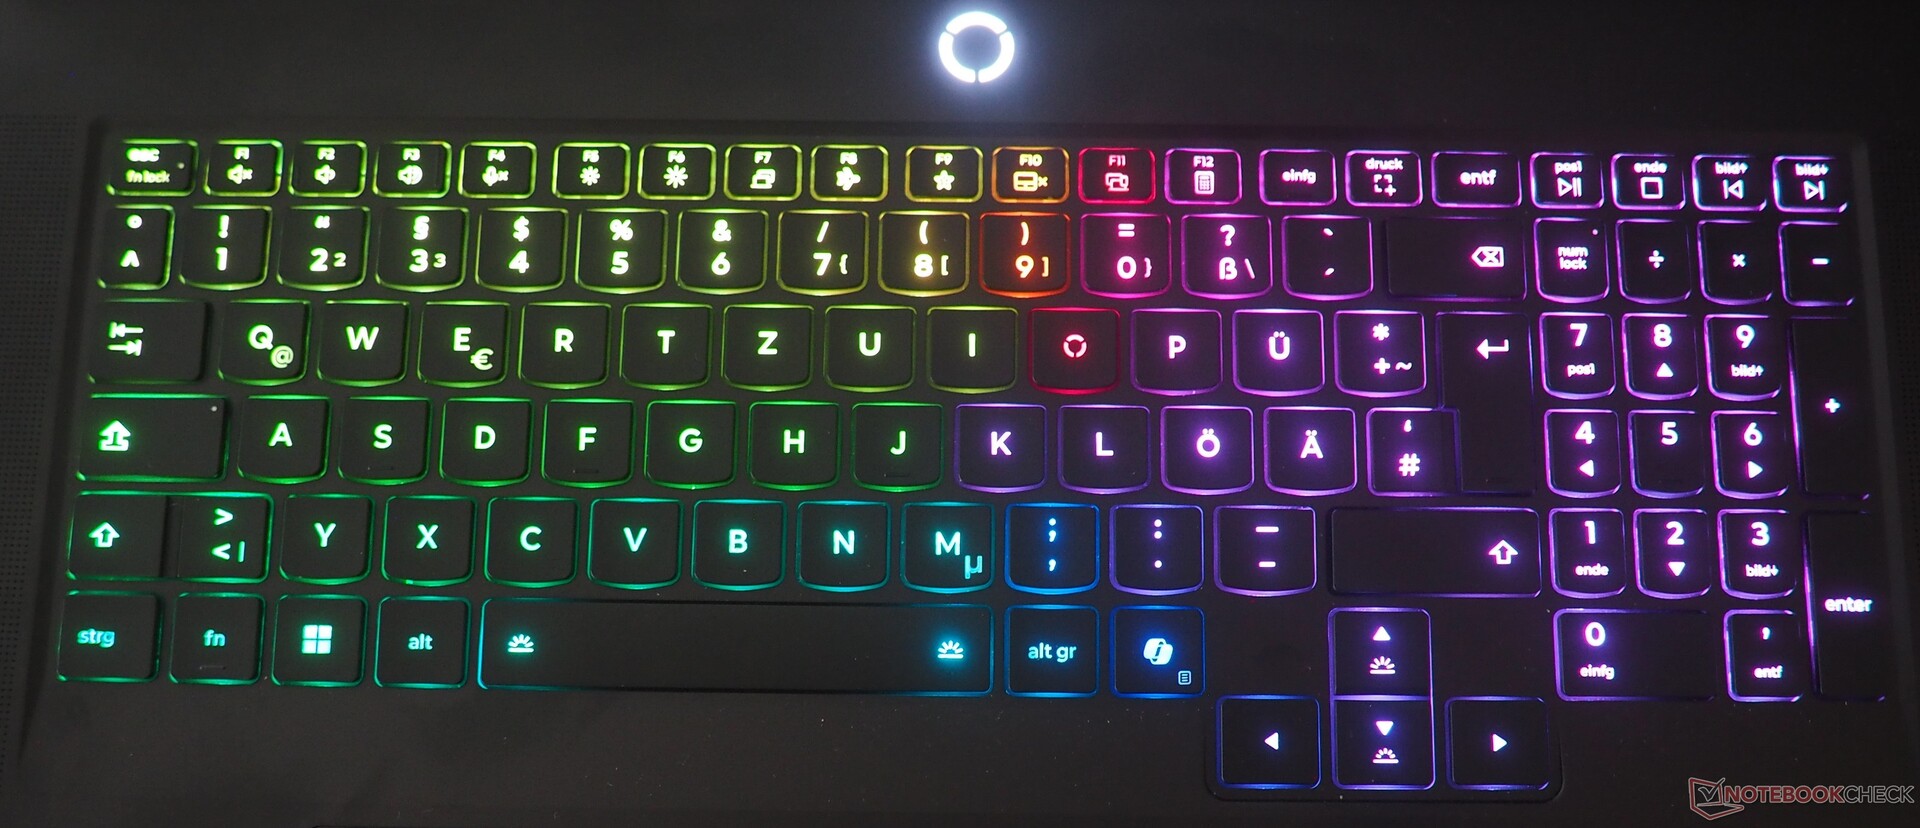
Obwohl Lenovo auf ein mechanisches Keyboard verzichtet, wissen die Eingabegeräte zu überzeugen. Die Tastatur erfreut unter anderem durch eine intensive RGB-Beleuchtung, ein gelungenes Layout und eine angenehme Tastengröße (Stichwort Richtungspfeile). Dazu gesellt sich ein präzises Touchpad, das auf eine respektable Größe von 15 x 9,5 cm kommt und recht gute Gleiteigenschaften bietet.
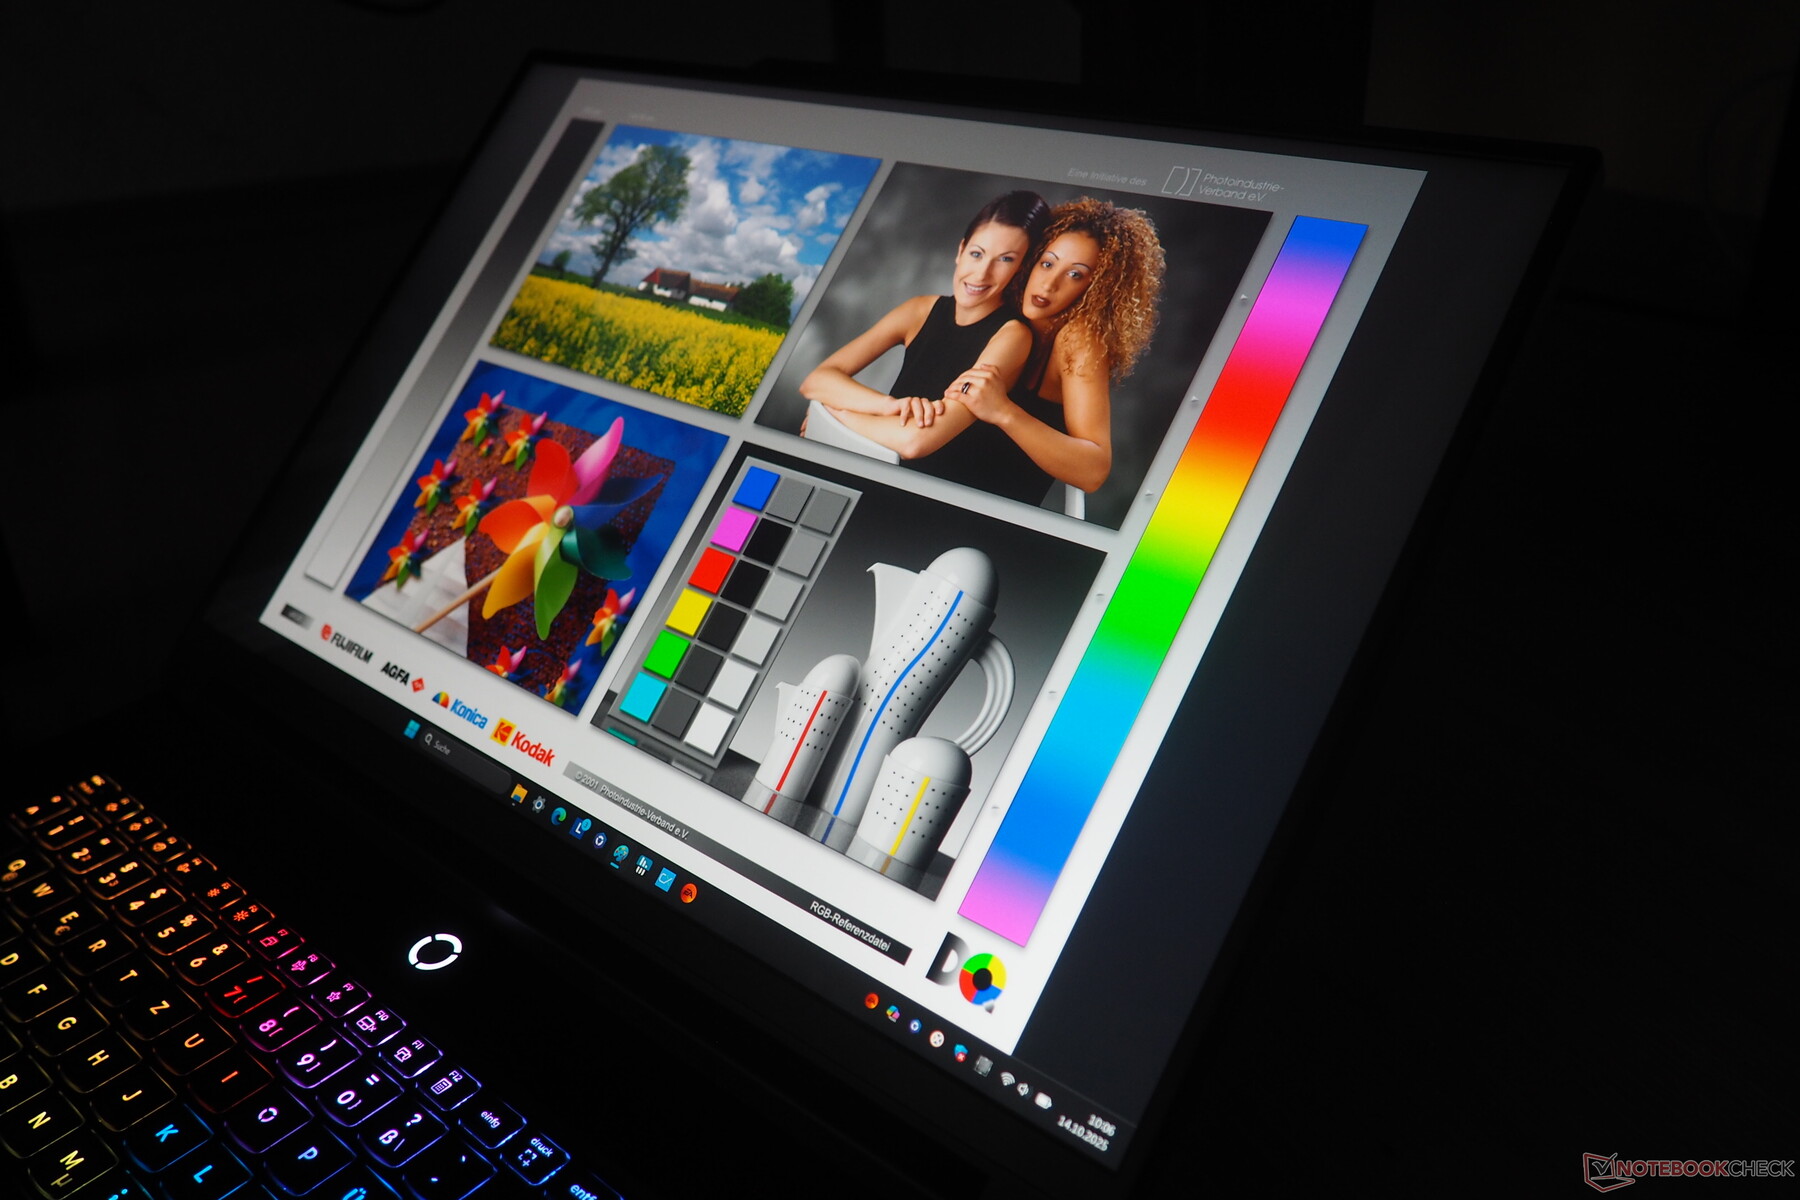
Display
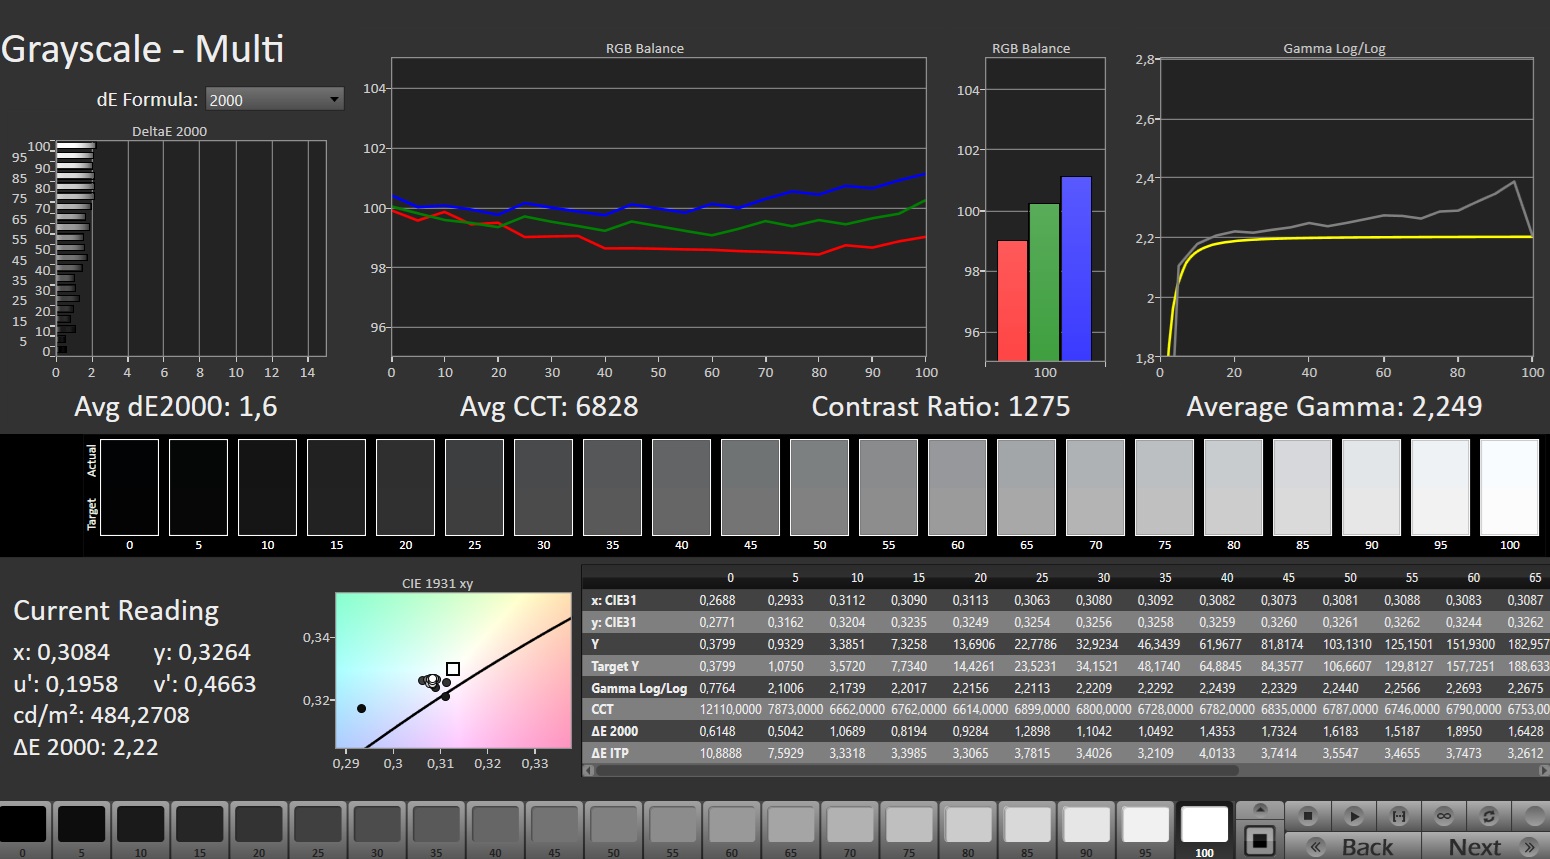
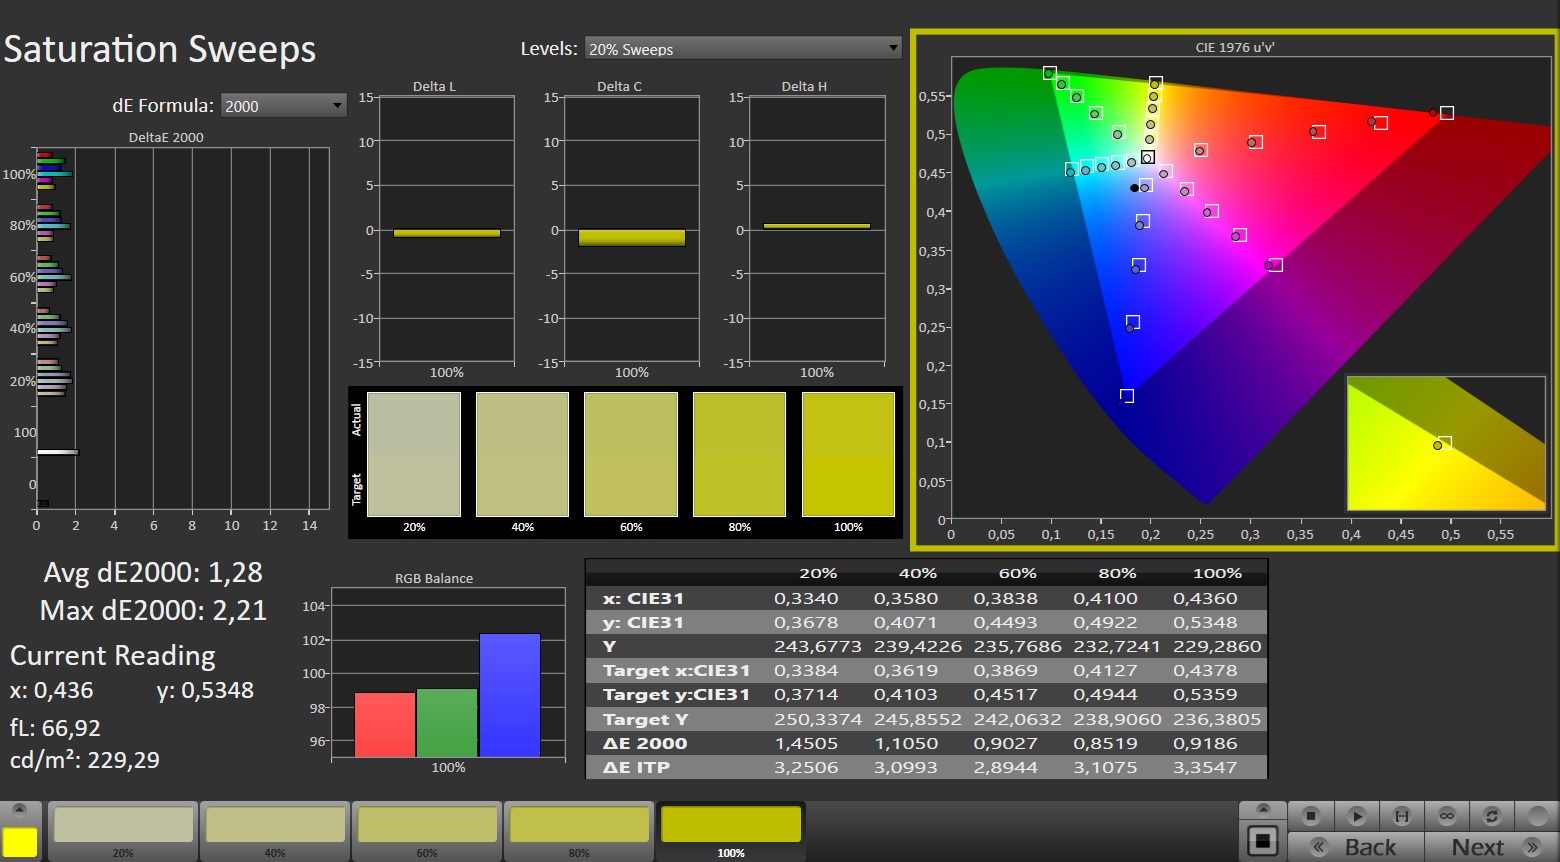
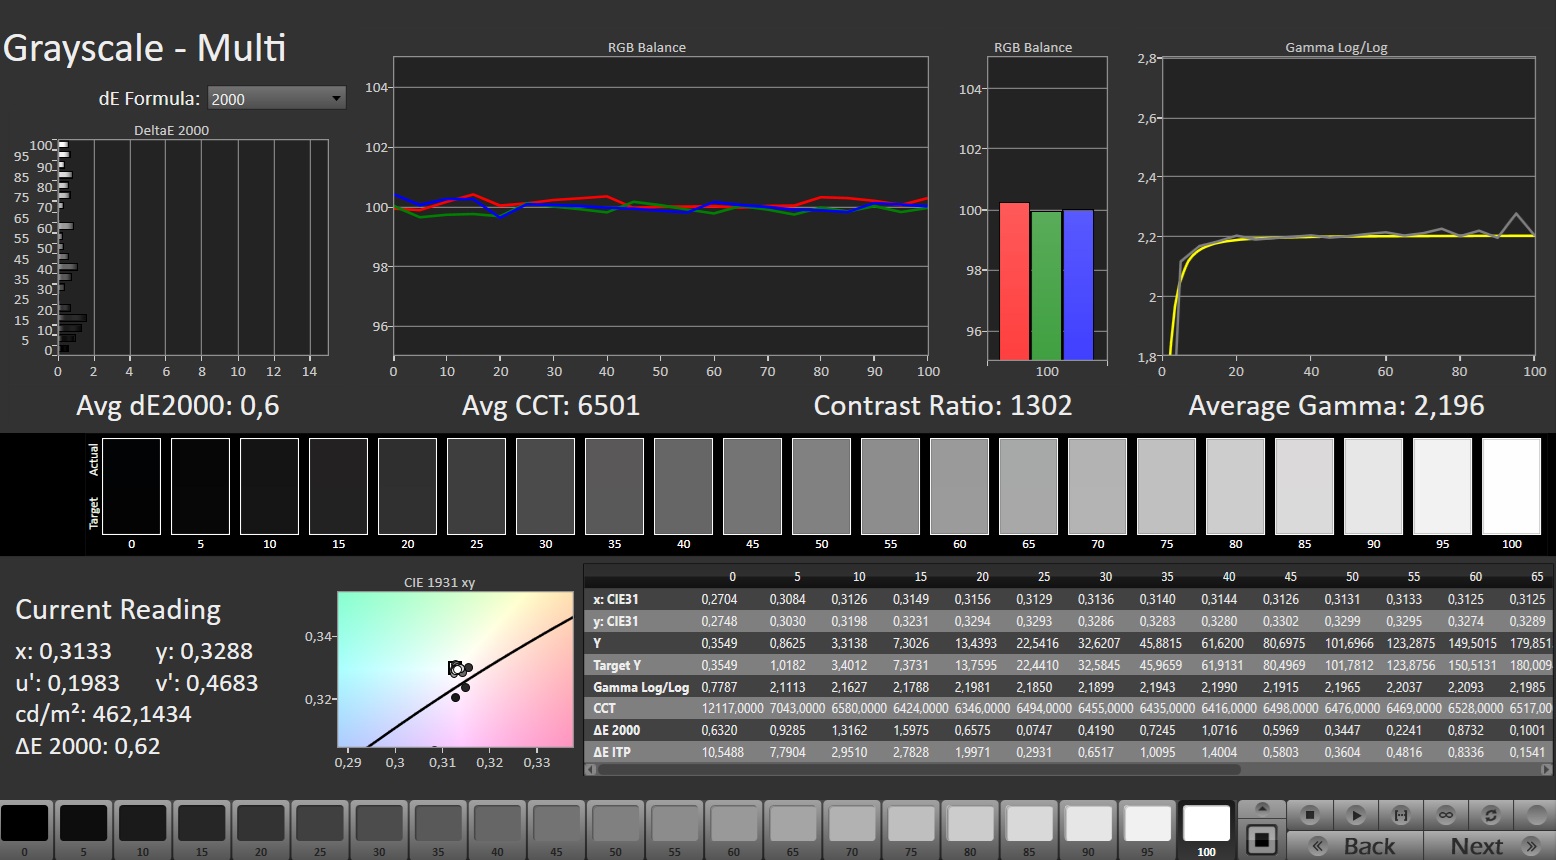
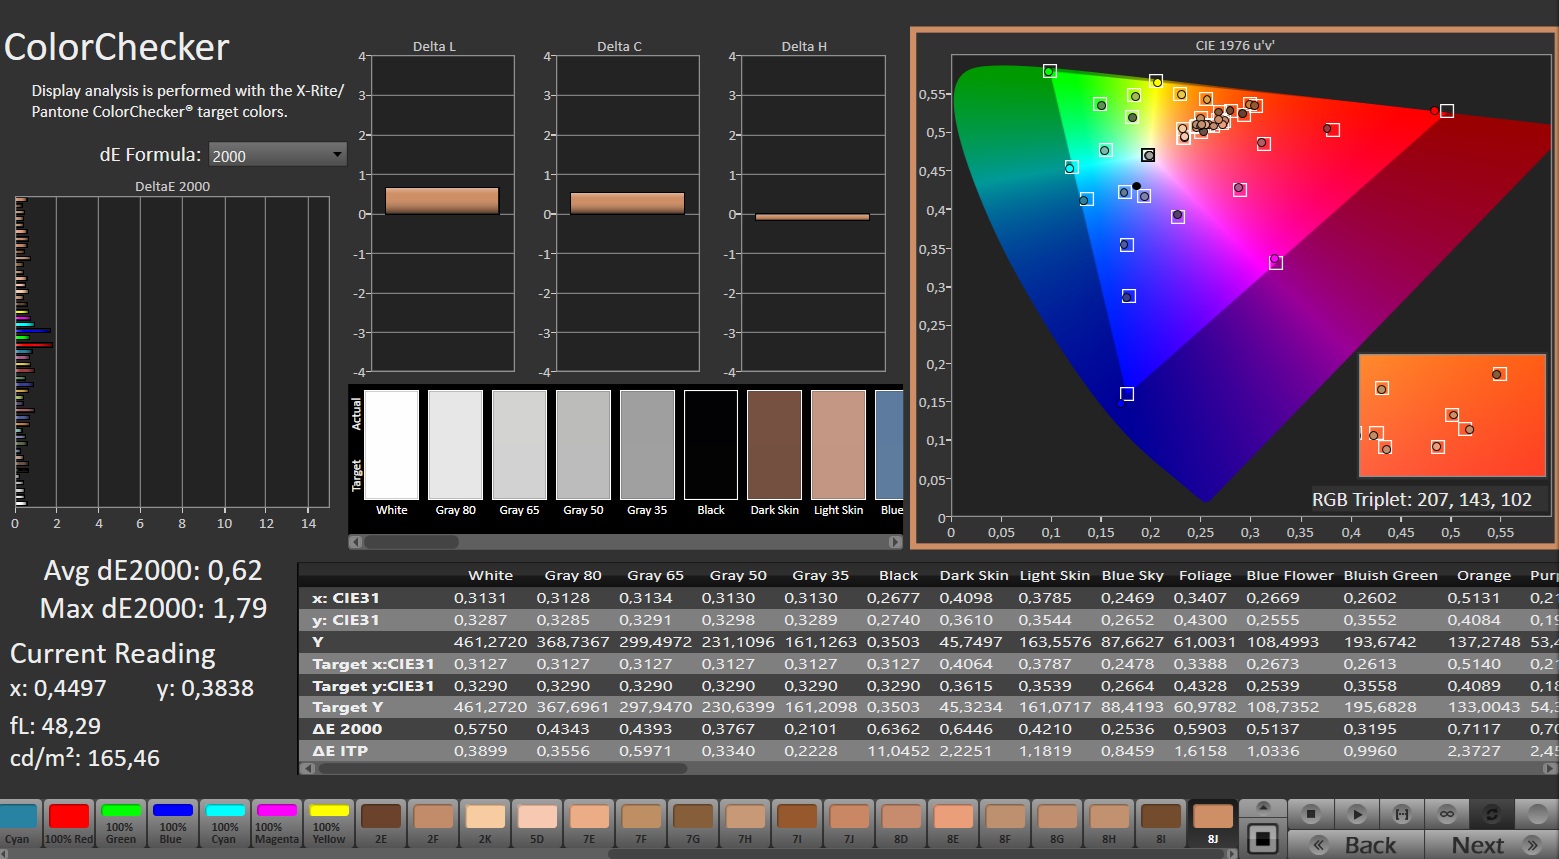
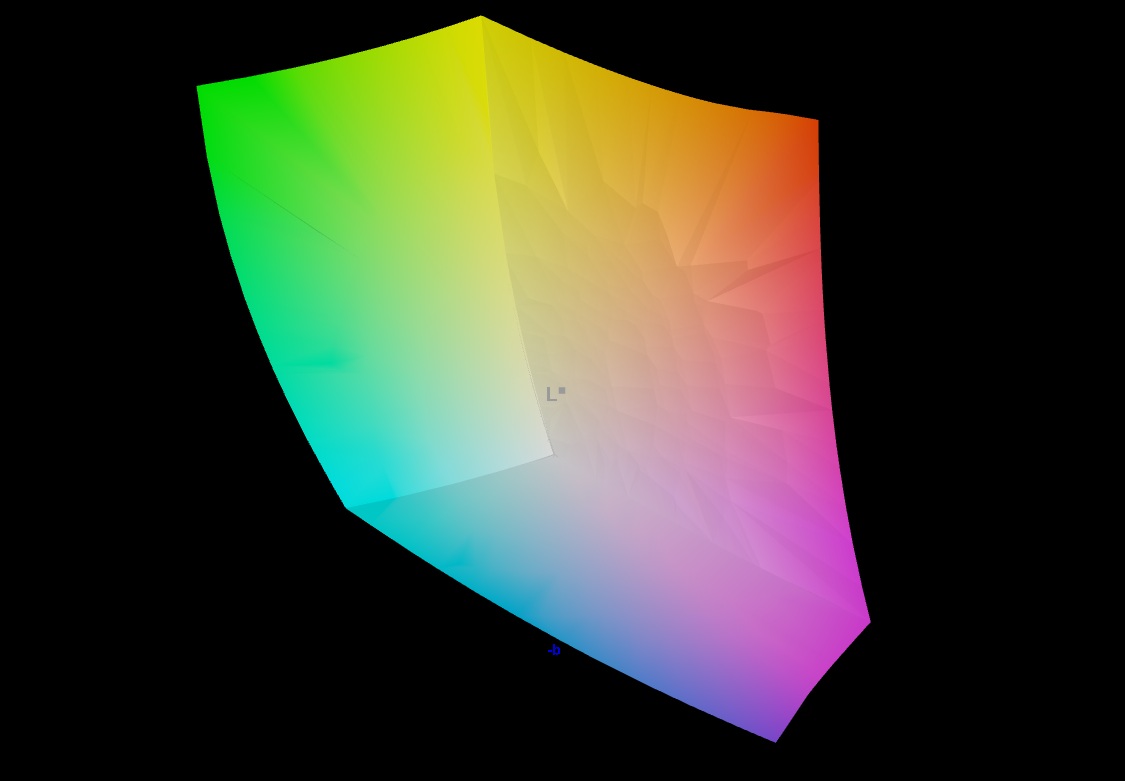
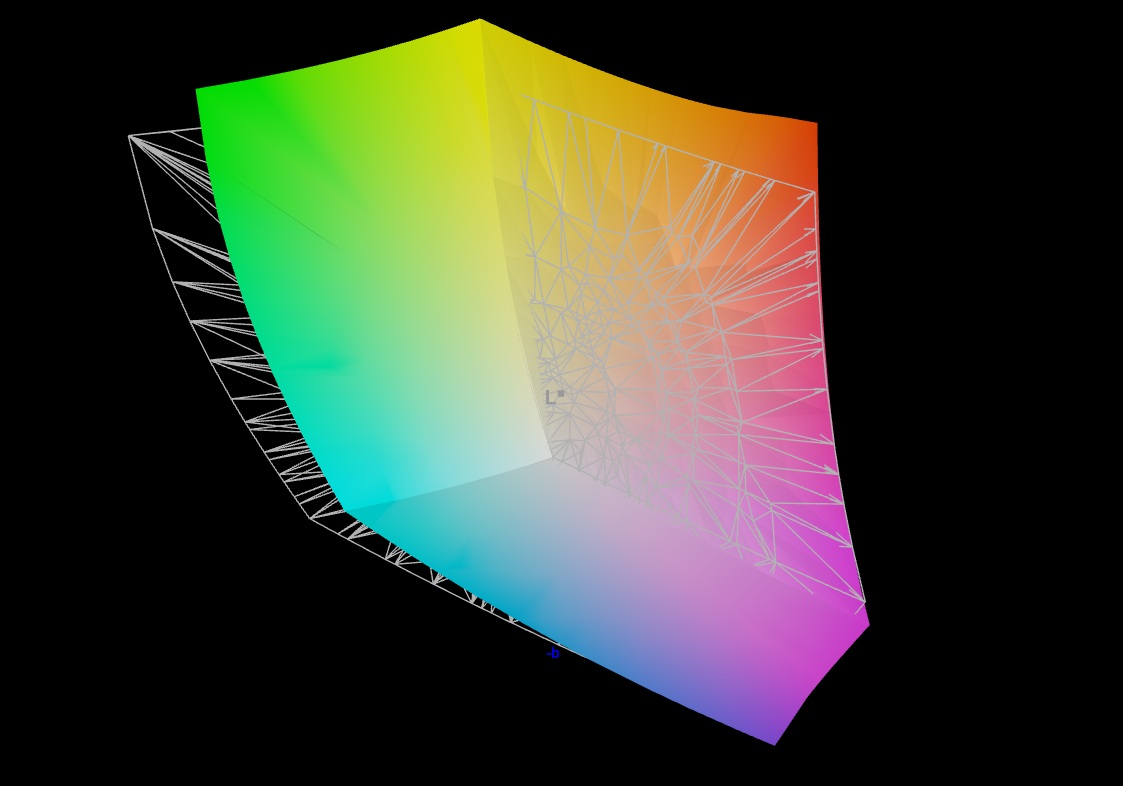
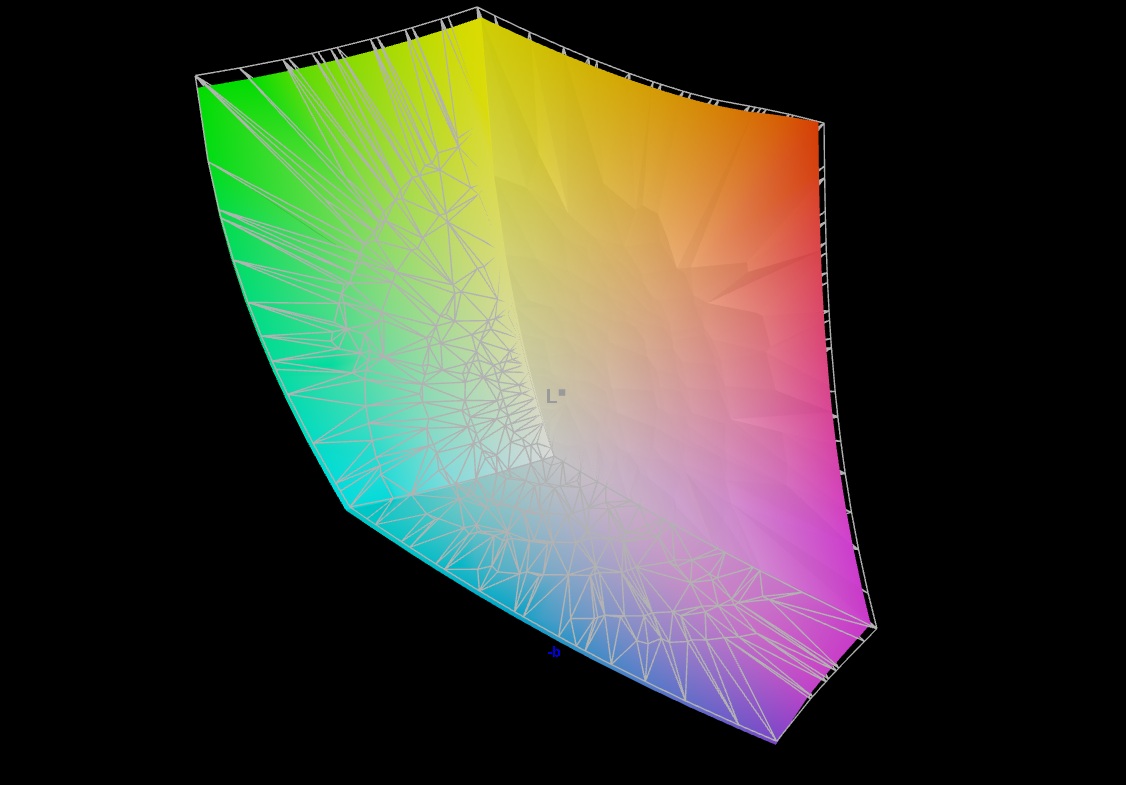
Etwas unverständlich ist Lenovos Display-Entscheidung. Analog zur 5080er-Edition werkelt hier ein glänzendes IPS-Panel, das je nach Umgebung teils stark spiegelt. Um entsprechende Reflexionen zu verhindern, werden IPS-Modelle sonst meist in einer matten Variante verbaut, bei OLED-Panels existieren hingegen (manche würden sagen leider) fast nur Glare-Modelle. Vorteil der glänzenden Ausführung sind die sehr knalligen Farben, wobei das 240-Hz-Panel generell einen großen Farbraum bietet. Neben DCI-P3 wird auch AdobeRGB fast vollständig abgedeckt. Darüber hinaus ist das Display schon bei der Auslieferung vorkalibriert, was zu einer hohen Farbgenauigkeit führt. Die restlichen Werte sind für IPS-Verhältnisse ebenfalls gut, ohne dabei an der Konkurrenz vorbeizuziehen. Eine Leuchtkraft von durchschnittlich 440 cd/m² und ein Schwarzwert von 0,27 cd/m² sorgen für einen soliden Kontrast von knapp 1.600:1. Auch bei der Blickwinkelstabilität und den Reaktionszeiten gibt es keine Überraschungen. Dank der hohen Auflösung von 3.840 x 2.400 (16:10-Format) ist das Bild sehr scharf.
| |||||||||||||||||||||||||
Ausleuchtung: 84 %
Helligkeit Akku: 439 cd/m²
Kontrast: 1626:1 (Schwarzwert: 0.27 cd/m²)
ΔE ColorChecker Calman: 0.99 | ∀{0.5-29.43 Ø4.72}
calibrated: 0.62
ΔE Greyscale Calman: 1.6 | ∀{0.09-98 Ø4.97}
88.9% AdobeRGB 1998 (Argyll 3D)
100% sRGB (Argyll 3D)
96.8% Display P3 (Argyll 3D)
Gamma: 2.249
CCT: 6828 K
| Lenovo Legion 9 18IAX10 RTX 5090 BOEhydis NE180QAM-NZ2 (BOE0D5B), IPS, 3840x2400, 18", 240 Hz | Alienware 18 Area-51 AU Optronics B180QAN, IPS, 2560x1600, 18", 300 Hz | Asus Strix Scar 18 G835LX N180QDM-NM2, Mini-LED, 2560x1600, 18", 240 Hz | Razer Blade 18 2025 RTX 5090 Laptop NE180QAM-NZ1, IPS, 3840x2400, 18", 240 Hz | Lenovo Legion 9 18IAX10 BOE NE180QAM-NZ2, IPS, 3840x2400, 18", 240 Hz | |
|---|---|---|---|---|---|
| Display | 0% | 0% | 0% | -0% | |
| Display P3 Coverage (%) | 96.8 | 96.1 -1% | 99 2% | 97 0% | 96 -1% |
| sRGB Coverage (%) | 100 | 100 0% | 100 0% | 100 0% | 100 0% |
| AdobeRGB 1998 Coverage (%) | 88.9 | 89.7 1% | 87.2 -2% | 89 0% | 88.8 0% |
| Response Times | -12% | -1% | 48% | 8% | |
| Response Time Grey 50% / Grey 80% * (ms) | 12.7 ? | 13 ? -2% | 7.4 ? 42% | 5.1 ? 60% | 9.7 ? 24% |
| Response Time Black / White * (ms) | 7.2 ? | 8.7 ? -21% | 10.4 ? -44% | 4.6 ? 36% | 7.8 ? -8% |
| PWM Frequency (Hz) | 20610 ? | ||||
| PWM Amplitude * (%) | 100 | ||||
| Bildschirm | -80% | 69% | -56% | -67% | |
| Helligkeit Bildmitte (cd/m²) | 439 | 512.5 17% | 764 74% | 545 24% | 479.7 9% |
| Brightness (cd/m²) | 440 | 496 13% | 747 70% | 510 16% | 465 6% |
| Brightness Distribution (%) | 84 | 94 12% | 93 11% | 86 2% | 86 2% |
| Schwarzwert * (cd/m²) | 0.27 | 0.41 -52% | 0.1 63% | 0.41 -52% | 0.27 -0% |
| Kontrast (:1) | 1626 | 1250 -23% | 7640 370% | 1329 -18% | 1777 9% |
| Delta E Colorchecker * | 0.99 | 3.24 -227% | 1.2 -21% | 2.2 -122% | 3.14 -217% |
| Colorchecker dE 2000 max. * | 2.25 | 8.4 -273% | 2.8 -24% | 5.8 -158% | 6.48 -188% |
| Colorchecker dE 2000 calibrated * | 0.62 | 0.47 24% | 1.1 -77% | 1.17 -89% | |
| Delta E Graustufen * | 1.6 | 5 -213% | 1.5 6% | 3.5 -119% | 3.8 -137% |
| Gamma | 2.249 98% | 2.37 93% | 2.17 101% | 2.18 101% | 2.18 101% |
| CCT | 6828 95% | 6417 101% | 6556 99% | 7027 93% | 7301 89% |
| Durchschnitt gesamt (Programm / Settings) | -31% /
-53% | 23% /
42% | -3% /
-29% | -20% /
-42% |
* ... kleinere Werte sind besser


Reaktionszeiten (Response Times) des Displays
| ↔ Reaktionszeiten Schwarz zu Weiß | ||
|---|---|---|
| 7.2 ms ... steigend ↗ und fallend ↘ kombiniert | ↗ 3.3 ms steigend | 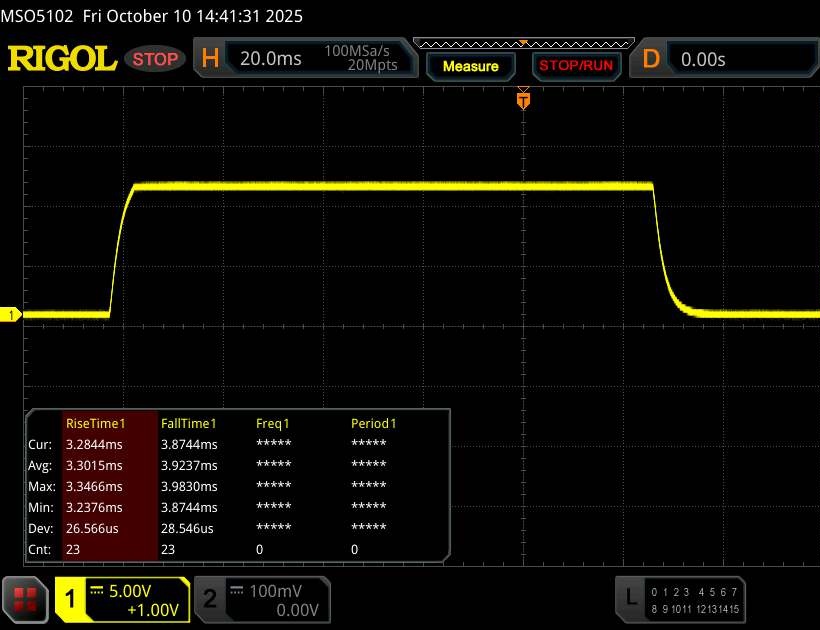 |
| ↘ 3.9 ms fallend | ||
| Die gemessenen Reaktionszeiten sind sehr kurz, wodurch sich der Bildschirm auch für schnelle 3D Spiele eignen sollte. Im Vergleich rangierten die bei uns getesteten Geräte von 0.1 (Minimum) zu 240 (Maximum) ms. » 21 % aller Screens waren schneller als der getestete. Daher sind die gemessenen Reaktionszeiten besser als der Durchschnitt aller vermessenen Geräte (19.8 ms). | ||
| ↔ Reaktionszeiten 50% Grau zu 80% Grau | ||
| 12.7 ms ... steigend ↗ und fallend ↘ kombiniert | ↗ 6.2 ms steigend | 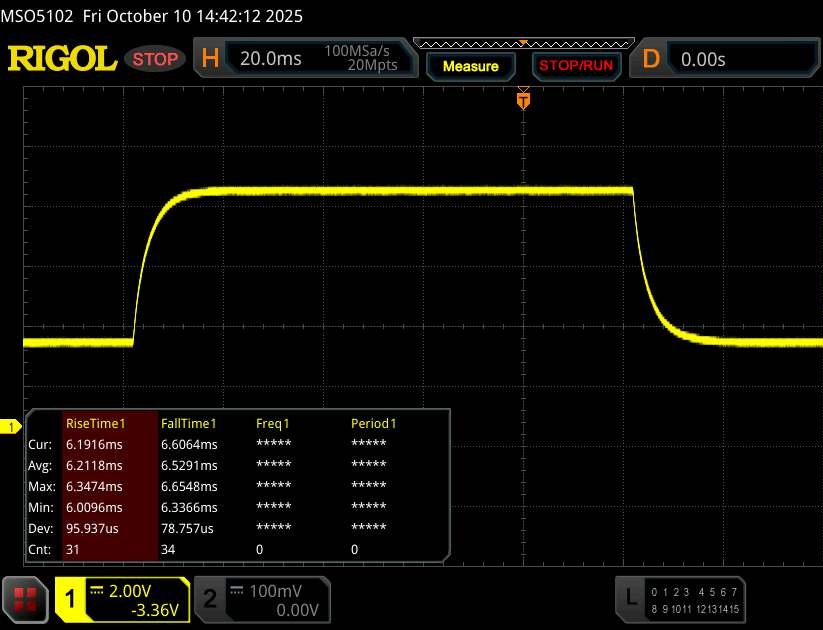 |
| ↘ 6.5 ms fallend | ||
| Die gemessenen Reaktionszeiten sind gut, für anspruchsvolle Spieler könnten der Bildschirm jedoch zu langsam sein. Im Vergleich rangierten die bei uns getesteten Geräte von 0.165 (Minimum) zu 636 (Maximum) ms. » 26 % aller Screens waren schneller als der getestete. Daher sind die gemessenen Reaktionszeiten besser als der Durchschnitt aller vermessenen Geräte (31 ms). | ||
Bildschirm-Flackern / PWM (Pulse-Width Modulation)
| Flackern / PWM nicht festgestellt | 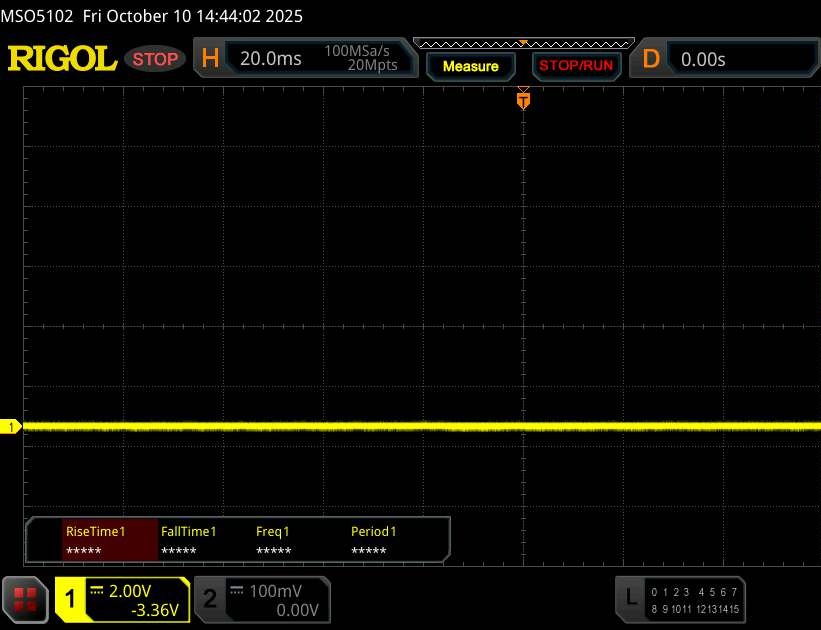 | ||
Im Vergleich: 52 % aller getesteten Geräte nutzten kein PWM um die Helligkeit zu reduzieren. Wenn PWM eingesetzt wurde, dann bei einer Frequenz von durchschnittlich 7763 (Minimum 5, Maximum 343500) Hz. | |||
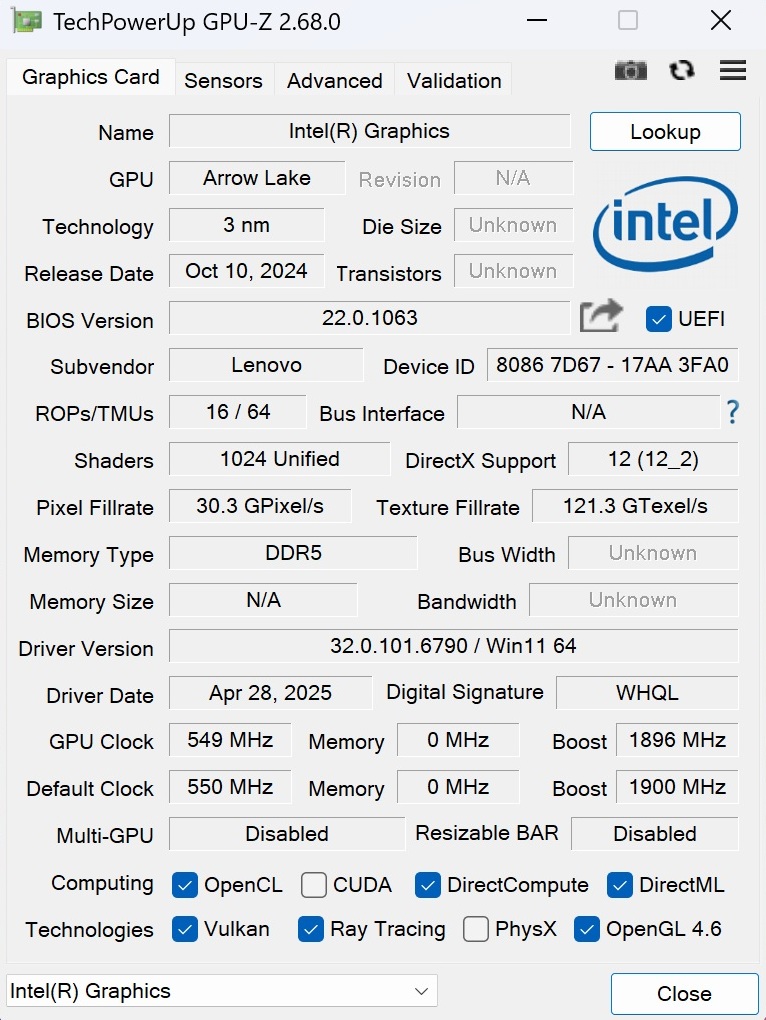
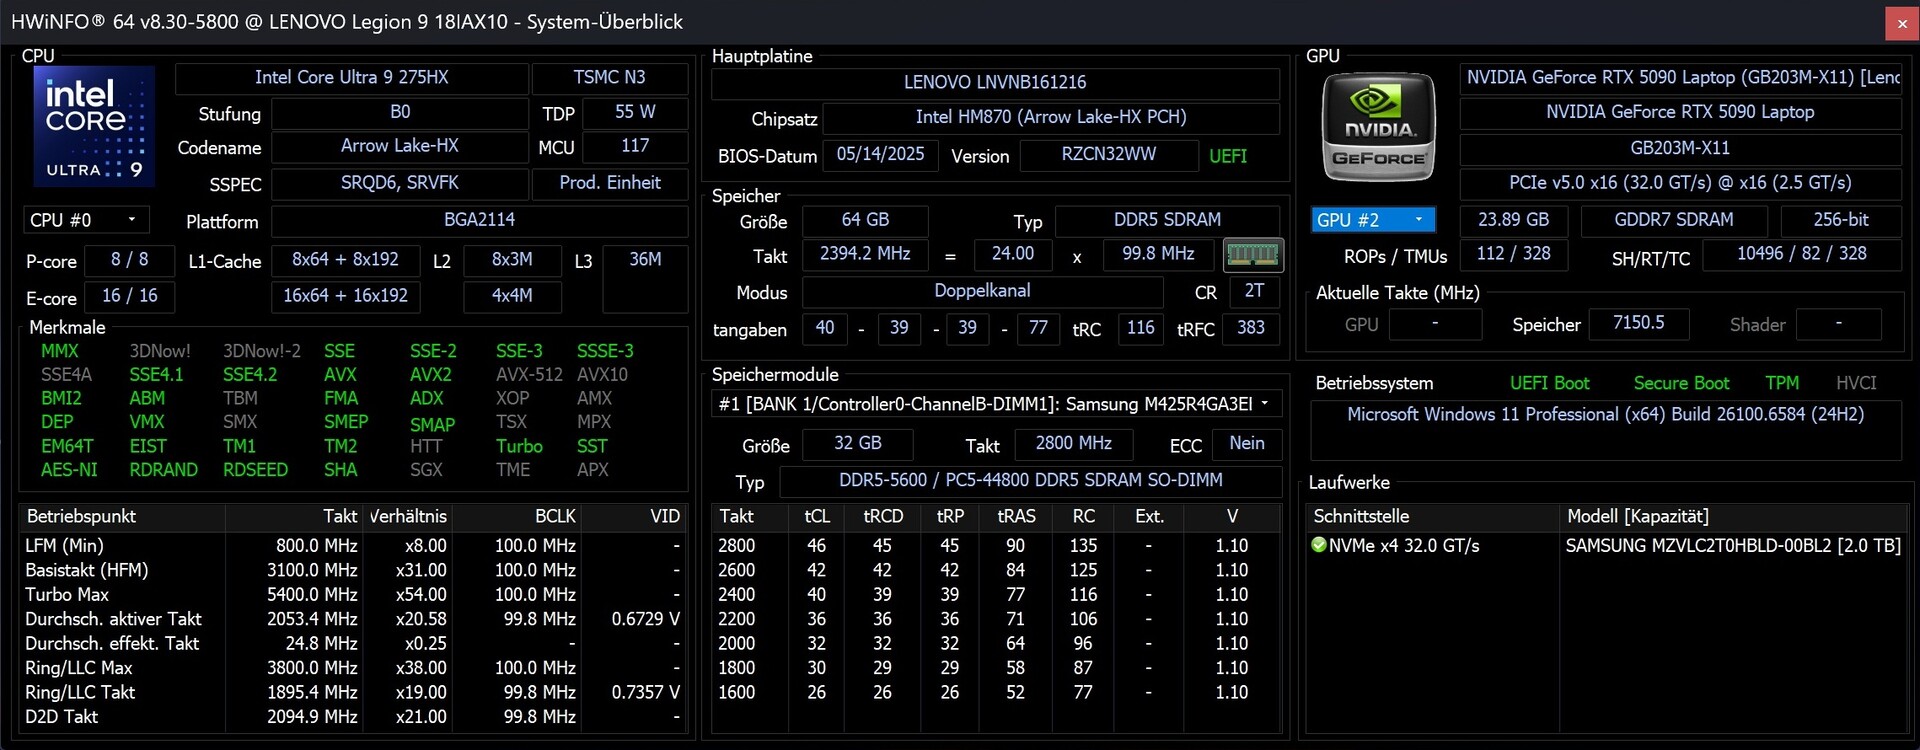
Leistung
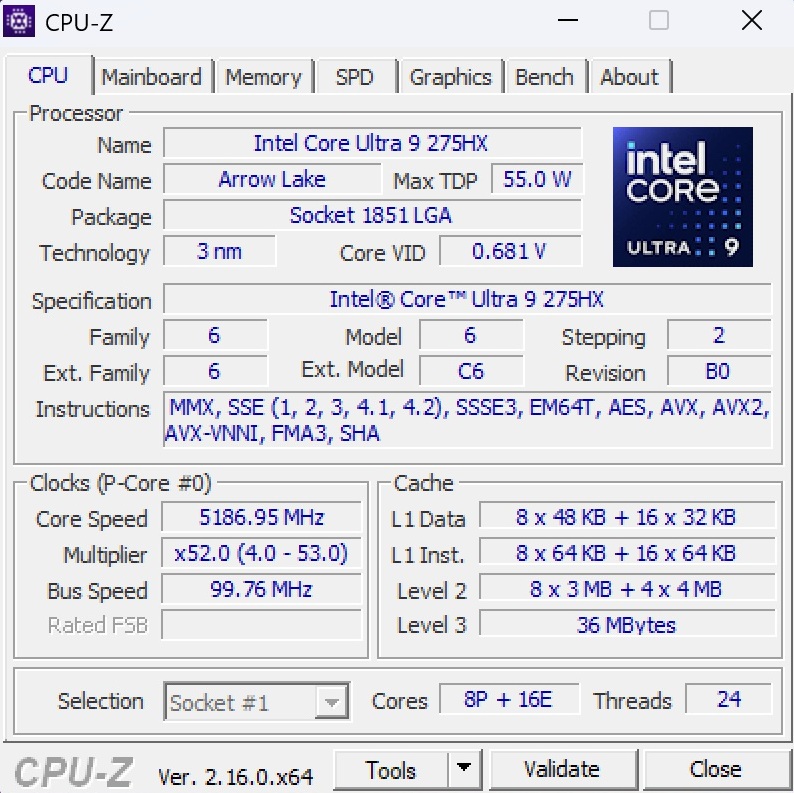
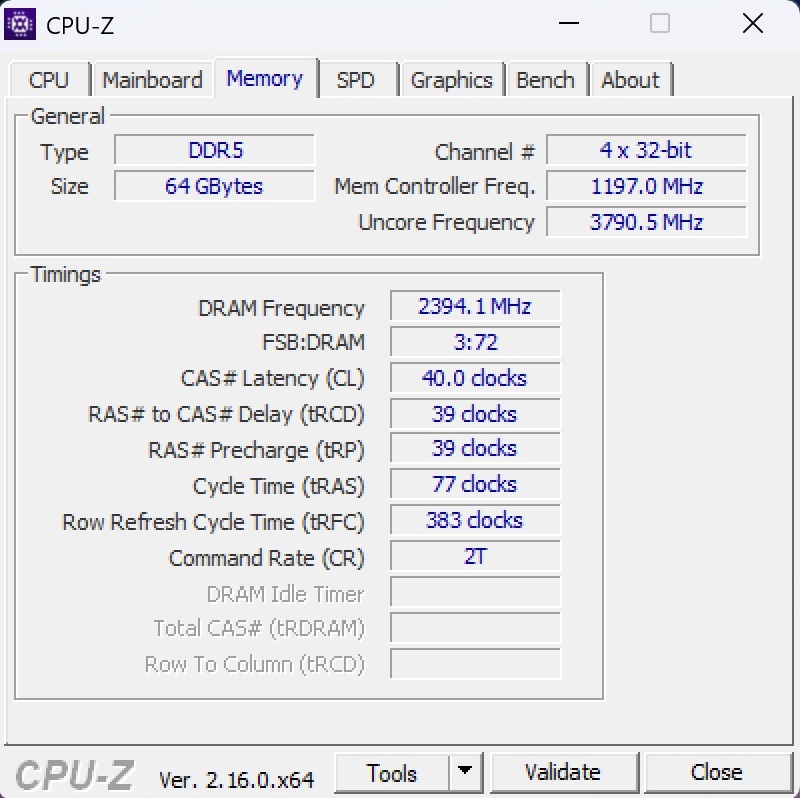
Im Bezug auf die Hardware, genauer gesagt die CPU und GPU, gehört das Legion 9 18IAX10 zum absoluten High-End-Segment. 64 GB RAM sollten bei den meisten Nutzern ebenfalls nicht so schnell an ihre Grenzen geraten, die verbaute SSD könnte angesichts von 2 TB aber größer dimensioniert sein, wenn man den Preis der Testkonfiguration betrachtet.
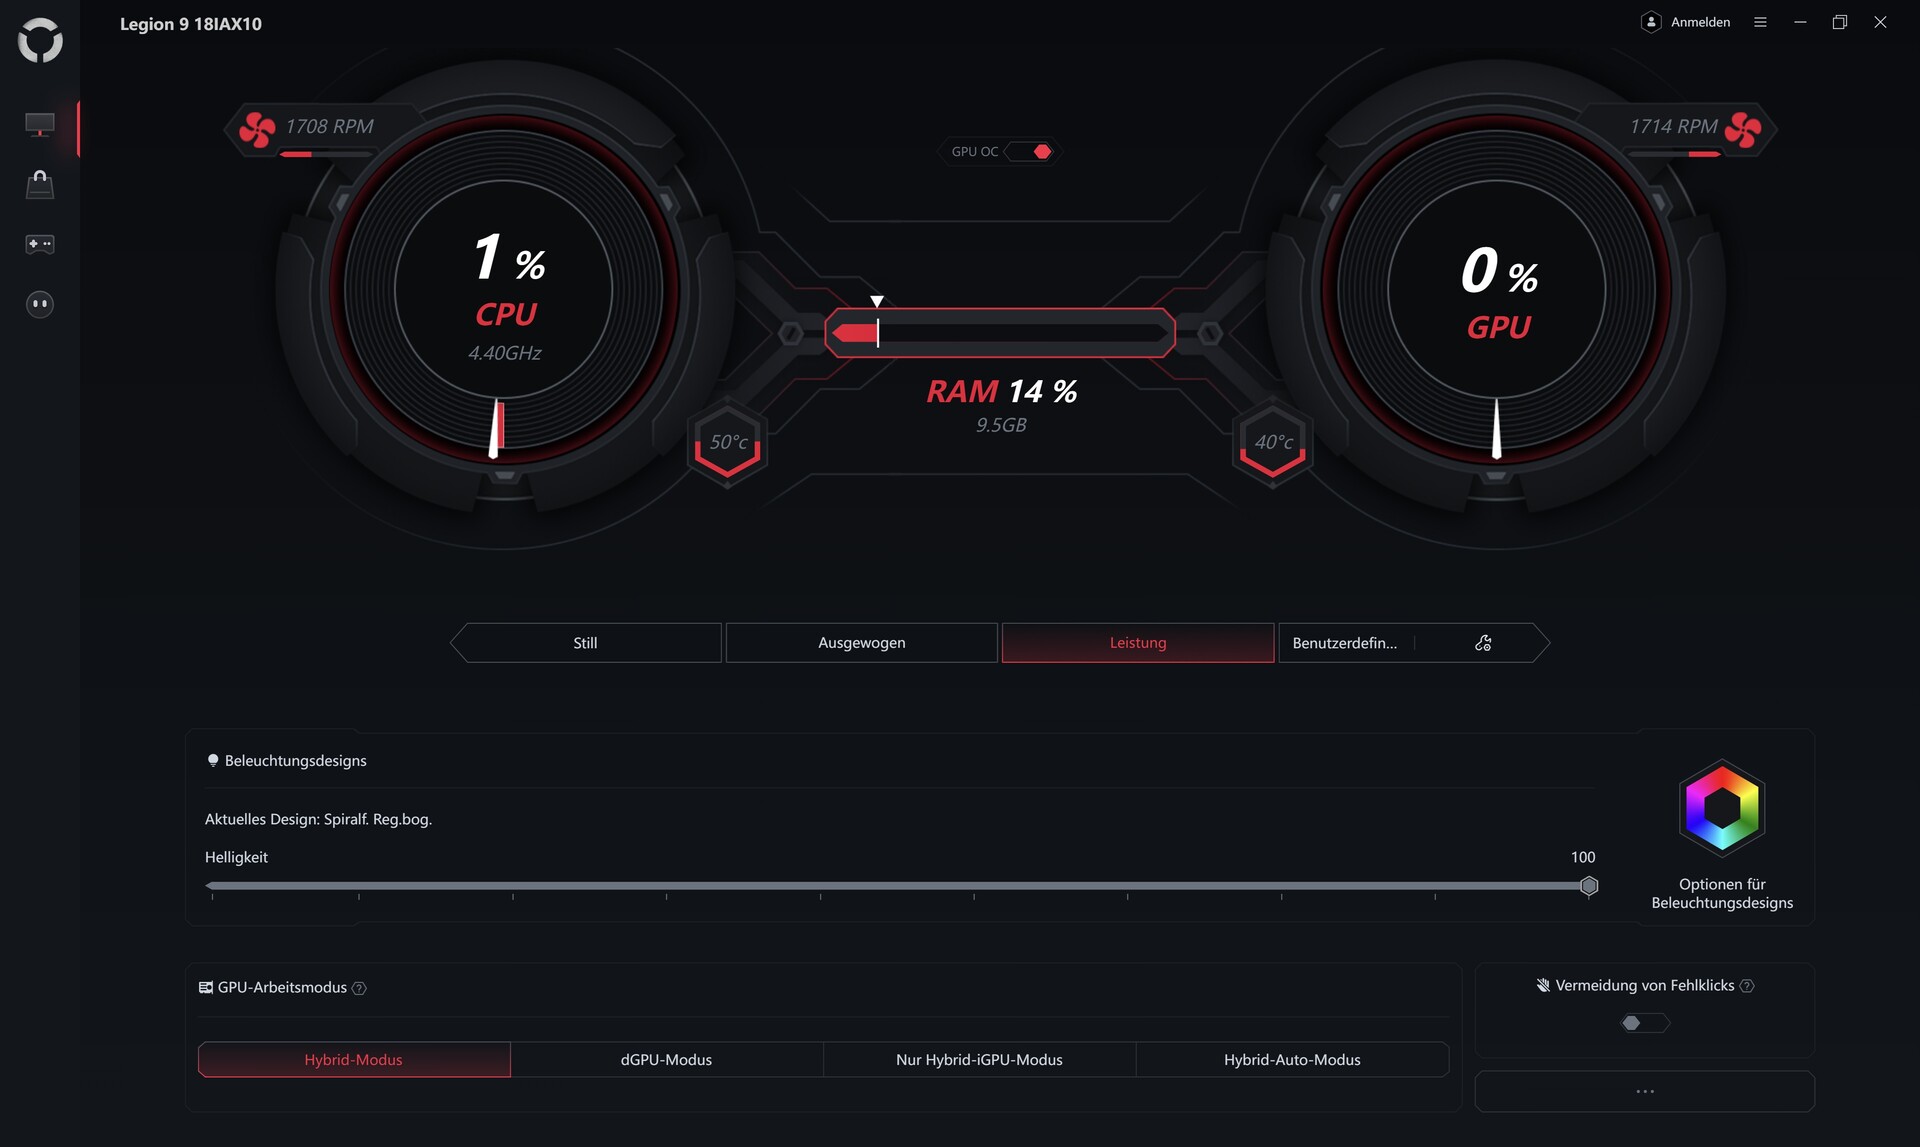
Testbedingungen
Der Betriebsmodus lässt sich entweder mittels der Legion Software oder komfortabel über die Tastenkombination Fn + Q durchschalten. Unsere Messungen sind – sofern nicht anders erwähnt – im Leistungsprofil mit aktiviertem GPU-Overclocking entstanden.
| Mode | Silent | Balanced + GPU OC | Performance + GPU OC |
| Cyberpunk 2077 Noise | 41 dB(A) | 49 dB(A) | 56 dB(A) |
| Cyberpunk 2077 Performance (FHD/Ultra) | 114 fps | 136 fps | 170 fps |
| Cyberpunk 2077 GPU Power Draw | ~75 W | ~95 W | ~165 W |
| Cinebench R15 Multi Score | 4124 Points | 5040 Points | 6013 Points |
| CPU PL1 | 56 W | 91 W | 171 W |
| CPU PL2 | 65 W | 125 W | 205 W |
Prozessor
Die hohen PL1- bzw. PL2-Level des Core Ultra 9 275HX sorgen für eine exzellente Leistung bei den CPU-Benchmarks, was allerdings auch für die Konkurrenten gilt, welche allesamt ebenfalls mit einem 275HX bestückt sind. Die Ergebnisse im Cinebench-Loop waren zudem sehr stabil, was für eine gute Kühlung spricht.
Cinebench R15 Multi Dauertest
* ... kleinere Werte sind besser
AIDA64: FP32 Ray-Trace | FPU Julia | CPU SHA3 | CPU Queen | FPU SinJulia | FPU Mandel | CPU AES | CPU ZLib | FP64 Ray-Trace | CPU PhotoWorxx
| Performance Rating | |
| Lenovo Legion 9 18IAX10 | |
| Alienware 18 Area-51 | |
| Asus Strix Scar 18 G835LX | |
| Lenovo Legion 9 18IAX10 RTX 5090 | |
| Razer Blade 18 2025 RTX 5090 Laptop | |
| Durchschnittliche Intel Core Ultra 9 275HX | |
| Durchschnitt der Klasse Gaming | |
| AIDA64 / FP32 Ray-Trace | |
| Lenovo Legion 9 18IAX10 | |
| Asus Strix Scar 18 G835LX | |
| Lenovo Legion 9 18IAX10 RTX 5090 | |
| Alienware 18 Area-51 | |
| Durchschnittliche Intel Core Ultra 9 275HX (28039 - 39895, n=30) | |
| Razer Blade 18 2025 RTX 5090 Laptop | |
| Durchschnitt der Klasse Gaming (10227 - 85542, n=107, der letzten 2 Jahre) | |
| AIDA64 / FPU Julia | |
| Alienware 18 Area-51 | |
| Lenovo Legion 9 18IAX10 | |
| Lenovo Legion 9 18IAX10 RTX 5090 | |
| Asus Strix Scar 18 G835LX | |
| Razer Blade 18 2025 RTX 5090 Laptop | |
| Durchschnittliche Intel Core Ultra 9 275HX (140254 - 200744, n=30) | |
| Durchschnitt der Klasse Gaming (51376 - 238426, n=107, der letzten 2 Jahre) | |
| AIDA64 / CPU SHA3 | |
| Lenovo Legion 9 18IAX10 | |
| Asus Strix Scar 18 G835LX | |
| Alienware 18 Area-51 | |
| Lenovo Legion 9 18IAX10 RTX 5090 | |
| Razer Blade 18 2025 RTX 5090 Laptop | |
| Durchschnittliche Intel Core Ultra 9 275HX (6710 - 9817, n=30) | |
| Durchschnitt der Klasse Gaming (2180 - 9817, n=107, der letzten 2 Jahre) | |
| AIDA64 / CPU Queen | |
| Alienware 18 Area-51 | |
| Lenovo Legion 9 18IAX10 | |
| Asus Strix Scar 18 G835LX | |
| Lenovo Legion 9 18IAX10 RTX 5090 | |
| Razer Blade 18 2025 RTX 5090 Laptop | |
| Durchschnittliche Intel Core Ultra 9 275HX (113887 - 140937, n=30) | |
| Durchschnitt der Klasse Gaming (49785 - 173351, n=94, der letzten 2 Jahre) | |
| AIDA64 / FPU SinJulia | |
| Durchschnitt der Klasse Gaming (4424 - 33636, n=107, der letzten 2 Jahre) | |
| Lenovo Legion 9 18IAX10 | |
| Lenovo Legion 9 18IAX10 RTX 5090 | |
| Asus Strix Scar 18 G835LX | |
| Alienware 18 Area-51 | |
| Razer Blade 18 2025 RTX 5090 Laptop | |
| Durchschnittliche Intel Core Ultra 9 275HX (11172 - 14425, n=30) | |
| AIDA64 / FPU Mandel | |
| Lenovo Legion 9 18IAX10 | |
| Alienware 18 Area-51 | |
| Asus Strix Scar 18 G835LX | |
| Lenovo Legion 9 18IAX10 RTX 5090 | |
| Razer Blade 18 2025 RTX 5090 Laptop | |
| Durchschnittliche Intel Core Ultra 9 275HX (72596 - 104508, n=30) | |
| Durchschnitt der Klasse Gaming (25115 - 128721, n=107, der letzten 2 Jahre) | |
| AIDA64 / CPU AES | |
| Lenovo Legion 9 18IAX10 | |
| Lenovo Legion 9 18IAX10 RTX 5090 | |
| Asus Strix Scar 18 G835LX | |
| Alienware 18 Area-51 | |
| Razer Blade 18 2025 RTX 5090 Laptop | |
| Durchschnittliche Intel Core Ultra 9 275HX (105608 - 247074, n=30) | |
| Durchschnitt der Klasse Gaming (39258 - 247074, n=107, der letzten 2 Jahre) | |
| AIDA64 / CPU ZLib | |
| Lenovo Legion 9 18IAX10 RTX 5090 | |
| Lenovo Legion 9 18IAX10 | |
| Asus Strix Scar 18 G835LX | |
| Alienware 18 Area-51 | |
| Razer Blade 18 2025 RTX 5090 Laptop | |
| Durchschnittliche Intel Core Ultra 9 275HX (1582 - 2263, n=30) | |
| Durchschnitt der Klasse Gaming (574 - 2531, n=107, der letzten 2 Jahre) | |
| AIDA64 / FP64 Ray-Trace | |
| Lenovo Legion 9 18IAX10 | |
| Alienware 18 Area-51 | |
| Lenovo Legion 9 18IAX10 RTX 5090 | |
| Asus Strix Scar 18 G835LX | |
| Durchschnittliche Intel Core Ultra 9 275HX (14847 - 21854, n=30) | |
| Razer Blade 18 2025 RTX 5090 Laptop | |
| Durchschnitt der Klasse Gaming (5509 - 45446, n=107, der letzten 2 Jahre) | |
| AIDA64 / CPU PhotoWorxx | |
| Alienware 18 Area-51 | |
| Razer Blade 18 2025 RTX 5090 Laptop | |
| Asus Strix Scar 18 G835LX | |
| Durchschnittliche Intel Core Ultra 9 275HX (37482 - 62916, n=30) | |
| Lenovo Legion 9 18IAX10 RTX 5090 | |
| Lenovo Legion 9 18IAX10 | |
| Durchschnitt der Klasse Gaming (12271 - 89891, n=107, der letzten 2 Jahre) | |
System Performance
Bei der Systemperformance liegen die Kontrahenten ebenfalls nah beieinander, so dass man in der Praxis kaum Unterschiede spüren dürfte.
PCMark 10: Essentials
CrossMark: Overall | Productivity | Creativity | Responsiveness
WebXPRT 3: Overall
WebXPRT 4: Overall
Mozilla Kraken 1.1: Total
| Performance Rating | |
| Alienware 18 Area-51 | |
| Lenovo Legion 9 18IAX10 | |
| Razer Blade 18 2025 RTX 5090 Laptop | |
| Asus Strix Scar 18 G835LX | |
| Lenovo Legion 9 18IAX10 RTX 5090 | |
| Durchschnittliche Intel Core Ultra 9 275HX, NVIDIA GeForce RTX 5090 Laptop | |
| Durchschnitt der Klasse Gaming | |
| PCMark 10 / Essentials | |
| Lenovo Legion 9 18IAX10 | |
| Alienware 18 Area-51 | |
| Asus Strix Scar 18 G835LX | |
| Durchschnittliche Intel Core Ultra 9 275HX, NVIDIA GeForce RTX 5090 Laptop (9994 - 11369, n=12) | |
| Razer Blade 18 2025 RTX 5090 Laptop | |
| Lenovo Legion 9 18IAX10 RTX 5090 | |
| Durchschnitt der Klasse Gaming (8810 - 12600, n=99, der letzten 2 Jahre) | |
| CrossMark / Overall | |
| Alienware 18 Area-51 | |
| Razer Blade 18 2025 RTX 5090 Laptop | |
| Asus Strix Scar 18 G835LX | |
| Lenovo Legion 9 18IAX10 | |
| Durchschnittliche Intel Core Ultra 9 275HX, NVIDIA GeForce RTX 5090 Laptop (1995 - 2339, n=12) | |
| Lenovo Legion 9 18IAX10 RTX 5090 | |
| Durchschnitt der Klasse Gaming (1366 - 2409, n=96, der letzten 2 Jahre) | |
| CrossMark / Productivity | |
| Alienware 18 Area-51 | |
| Razer Blade 18 2025 RTX 5090 Laptop | |
| Lenovo Legion 9 18IAX10 | |
| Durchschnittliche Intel Core Ultra 9 275HX, NVIDIA GeForce RTX 5090 Laptop (1847 - 2211, n=12) | |
| Asus Strix Scar 18 G835LX | |
| Lenovo Legion 9 18IAX10 RTX 5090 | |
| Durchschnitt der Klasse Gaming (1386 - 2254, n=96, der letzten 2 Jahre) | |
| CrossMark / Creativity | |
| Razer Blade 18 2025 RTX 5090 Laptop | |
| Asus Strix Scar 18 G835LX | |
| Lenovo Legion 9 18IAX10 RTX 5090 | |
| Alienware 18 Area-51 | |
| Lenovo Legion 9 18IAX10 | |
| Durchschnittliche Intel Core Ultra 9 275HX, NVIDIA GeForce RTX 5090 Laptop (2170 - 2642, n=12) | |
| Durchschnitt der Klasse Gaming (1343 - 2729, n=96, der letzten 2 Jahre) | |
| CrossMark / Responsiveness | |
| Alienware 18 Area-51 | |
| Lenovo Legion 9 18IAX10 | |
| Razer Blade 18 2025 RTX 5090 Laptop | |
| Durchschnittliche Intel Core Ultra 9 275HX, NVIDIA GeForce RTX 5090 Laptop (1673 - 2217, n=12) | |
| Asus Strix Scar 18 G835LX | |
| Lenovo Legion 9 18IAX10 RTX 5090 | |
| Durchschnitt der Klasse Gaming (1226 - 2334, n=96, der letzten 2 Jahre) | |
| WebXPRT 3 / Overall | |
| Lenovo Legion 9 18IAX10 | |
| Lenovo Legion 9 18IAX10 RTX 5090 | |
| Alienware 18 Area-51 | |
| Razer Blade 18 2025 RTX 5090 Laptop | |
| Durchschnittliche Intel Core Ultra 9 275HX, NVIDIA GeForce RTX 5090 Laptop (315 - 372, n=12) | |
| Asus Strix Scar 18 G835LX | |
| Durchschnitt der Klasse Gaming (220 - 532, n=100, der letzten 2 Jahre) | |
| WebXPRT 4 / Overall | |
| Alienware 18 Area-51 | |
| Asus Strix Scar 18 G835LX | |
| Lenovo Legion 9 18IAX10 | |
| Lenovo Legion 9 18IAX10 RTX 5090 | |
| Durchschnittliche Intel Core Ultra 9 275HX, NVIDIA GeForce RTX 5090 Laptop (301 - 341, n=11) | |
| Razer Blade 18 2025 RTX 5090 Laptop | |
| Durchschnitt der Klasse Gaming (165 - 354, n=101, der letzten 2 Jahre) | |
| Mozilla Kraken 1.1 / Total | |
| Durchschnitt der Klasse Gaming (391 - 590, n=104, der letzten 2 Jahre) | |
| Lenovo Legion 9 18IAX10 | |
| Lenovo Legion 9 18IAX10 RTX 5090 | |
| Durchschnittliche Intel Core Ultra 9 275HX, NVIDIA GeForce RTX 5090 Laptop (402 - 424, n=12) | |
| Razer Blade 18 2025 RTX 5090 Laptop | |
| Asus Strix Scar 18 G835LX | |
| Alienware 18 Area-51 | |
* ... kleinere Werte sind besser
| AIDA64 / Memory Copy | |
| Alienware 18 Area-51 | |
| Asus Strix Scar 18 G835LX | |
| Razer Blade 18 2025 RTX 5090 Laptop | |
| Lenovo Legion 9 18IAX10 | |
| Durchschnittliche Intel Core Ultra 9 275HX (56003 - 94460, n=30) | |
| Lenovo Legion 9 18IAX10 RTX 5090 | |
| Durchschnitt der Klasse Gaming (21750 - 129946, n=107, der letzten 2 Jahre) | |
| AIDA64 / Memory Read | |
| Alienware 18 Area-51 | |
| Asus Strix Scar 18 G835LX | |
| Razer Blade 18 2025 RTX 5090 Laptop | |
| Durchschnittliche Intel Core Ultra 9 275HX (55795 - 97151, n=30) | |
| Lenovo Legion 9 18IAX10 | |
| Lenovo Legion 9 18IAX10 RTX 5090 | |
| Durchschnitt der Klasse Gaming (22956 - 118858, n=107, der letzten 2 Jahre) | |
| AIDA64 / Memory Write | |
| Razer Blade 18 2025 RTX 5090 Laptop | |
| Lenovo Legion 9 18IAX10 | |
| Alienware 18 Area-51 | |
| Asus Strix Scar 18 G835LX | |
| Durchschnittliche Intel Core Ultra 9 275HX (55663 - 116129, n=30) | |
| Durchschnitt der Klasse Gaming (22297 - 135096, n=107, der letzten 2 Jahre) | |
| Lenovo Legion 9 18IAX10 RTX 5090 | |
| AIDA64 / Memory Latency | |
| Lenovo Legion 9 18IAX10 | |
| Durchschnittliche Intel Core Ultra 9 275HX (105.8 - 161.6, n=30) | |
| Razer Blade 18 2025 RTX 5090 Laptop | |
| Lenovo Legion 9 18IAX10 RTX 5090 | |
| Alienware 18 Area-51 | |
| Asus Strix Scar 18 G835LX | |
| Durchschnitt der Klasse Gaming (75.3 - 259, n=107, der letzten 2 Jahre) | |
* ... kleinere Werte sind besser
DPC-Latenzen
Deutlich stärkere Abweichungen offenbaren sich beim Thema Latenzen. Wie so häufig fallen die ermittelten Werte nicht ideal aus.
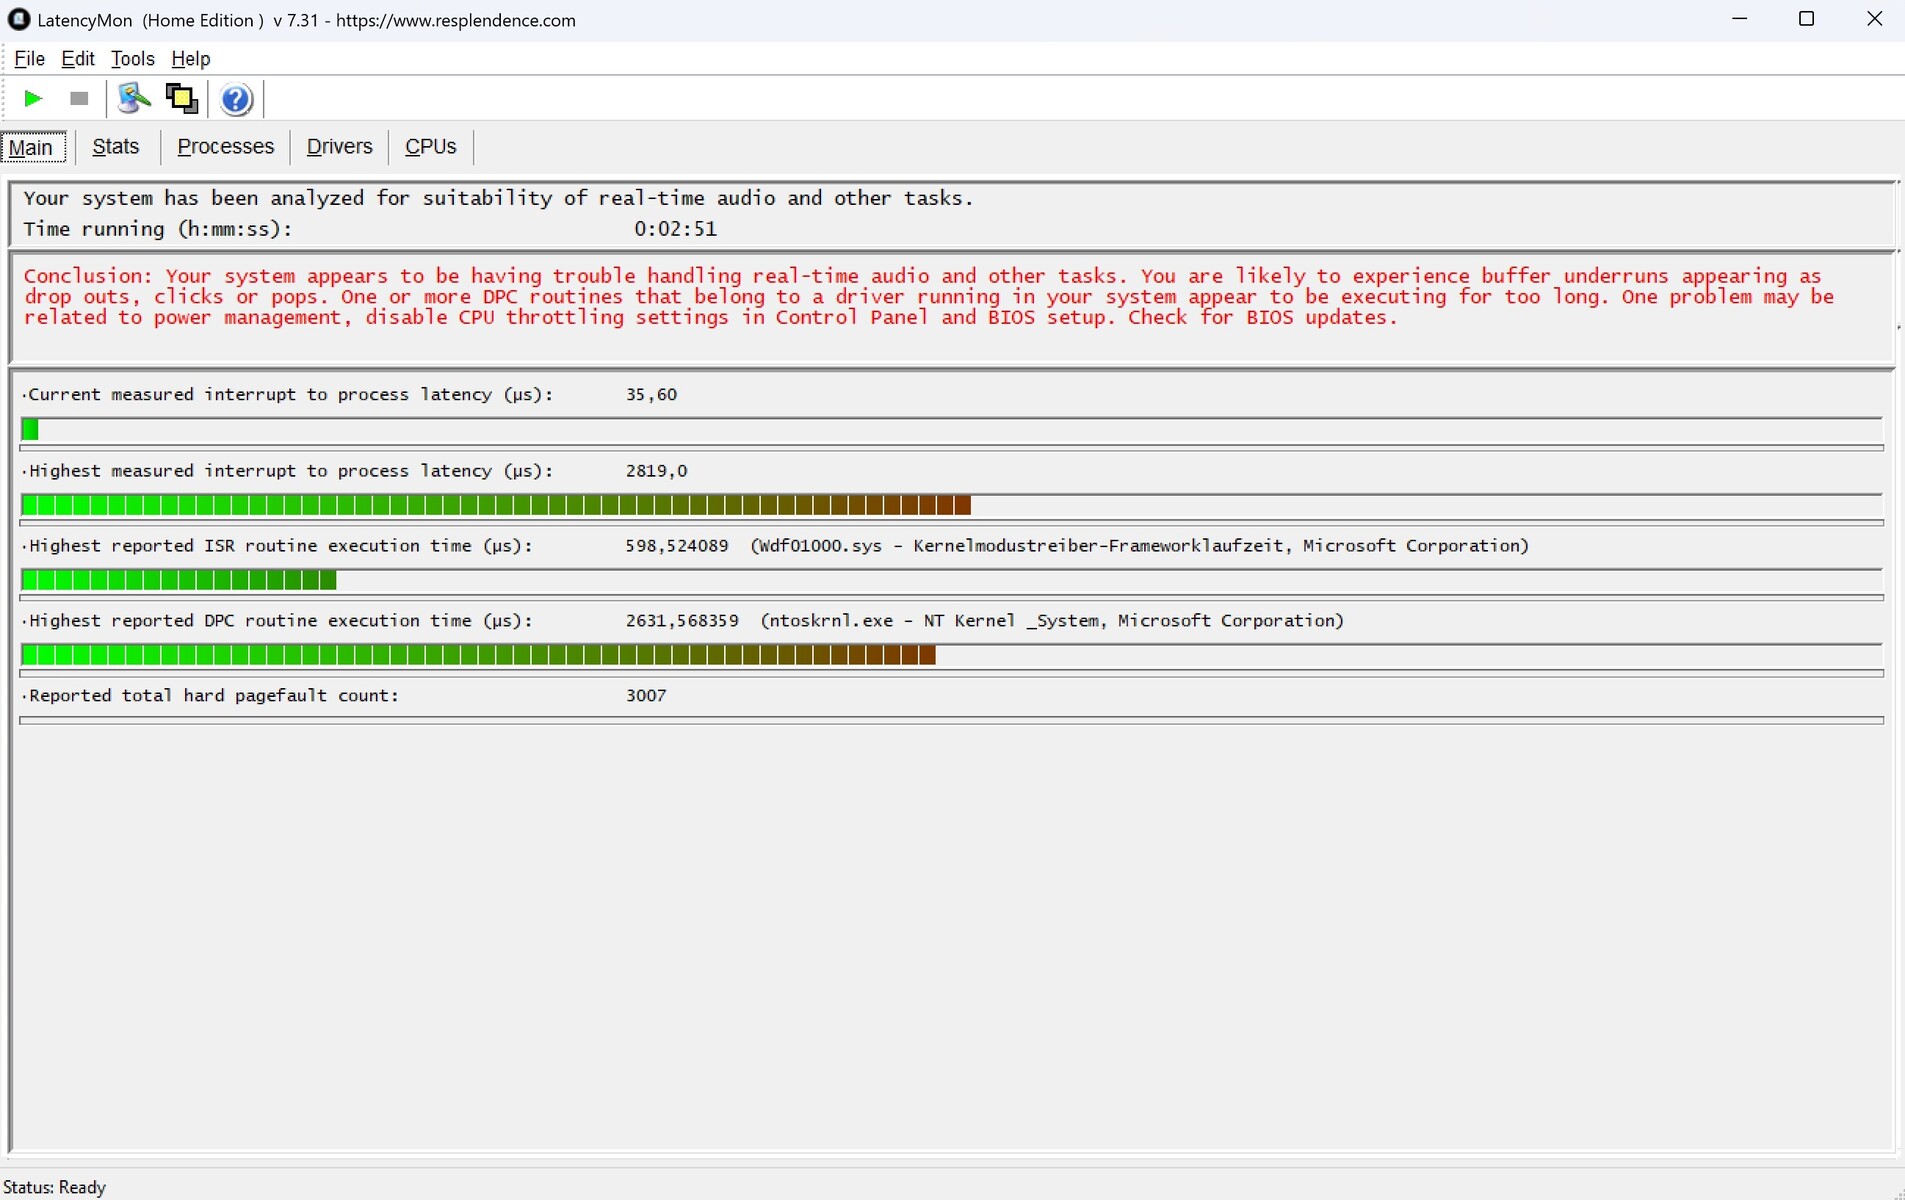
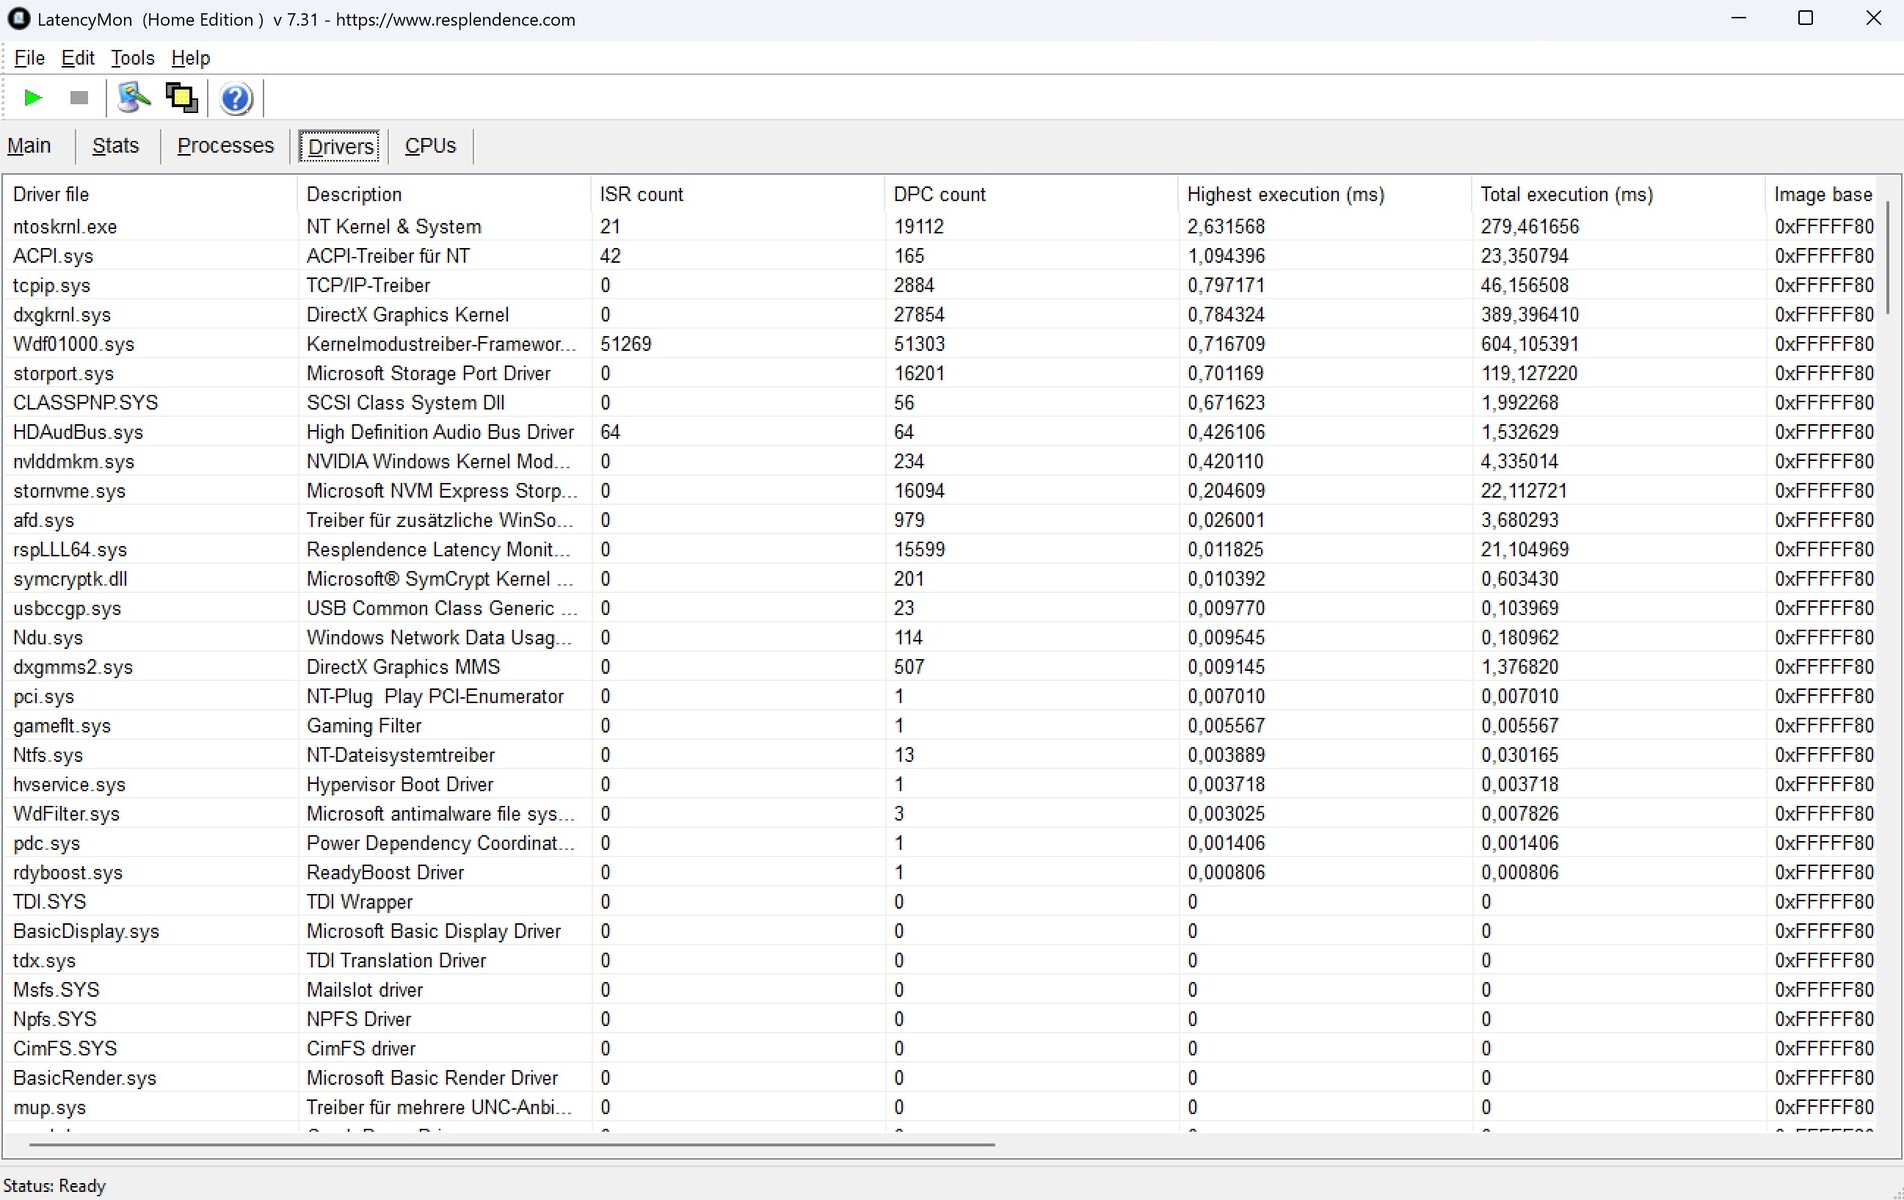
| DPC Latencies / LatencyMon - interrupt to process latency (max), Web, Youtube, Prime95 | |
| Alienware 18 Area-51 | |
| Lenovo Legion 9 18IAX10 RTX 5090 | |
| Lenovo Legion 9 18IAX10 | |
| Razer Blade 18 2025 RTX 5090 Laptop | |
| Asus Strix Scar 18 G835LX | |
* ... kleinere Werte sind besser
Massenspeicher
Der Massenspeicher hinterlässt gemischte Gefühle. Zwar ist die NVMe-SSD von Samsung grundsätzlich sehr performant und knackt im Idealfall die Marke von 10.000 MB/s, in unserem Loop-Test kam es nach einer Weile allerdings zum Throttling, was bei der Konkurrenz und der RTX 5080-Version nicht passiert ist.

* ... kleinere Werte sind besser
Dauerleistung Lesen: DiskSpd Read Loop, Queue Depth 8
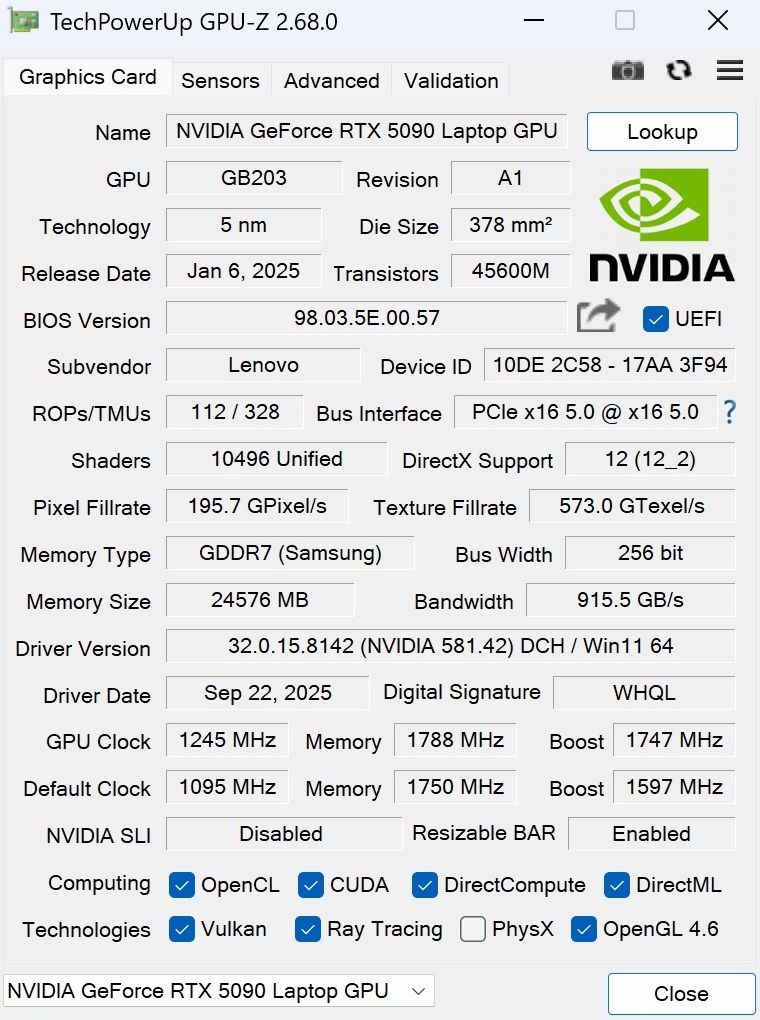
GPU Leistung
Als größtes Highlight erweist sich die GPU-Geschwindigkeit. Bei den 3DMarks lässt das Legion 9 alle anderen RTX 5090-Laptops hinter sich, wobei der RTX 5080-Bruder dennoch nur um ca. 10 % abgehängt wird. Angesichts von 24 zu 16 GB GDDR7-VRAM bietet die RTX 5090 aber eine höhere Zukunftssicherheit.
| 3DMark 11 Performance | 54833 Punkte | |
| 3DMark Cloud Gate Standard Score | 74154 Punkte | |
| 3DMark Fire Strike Score | 41019 Punkte | |
| 3DMark Time Spy Score | 23942 Punkte | |
Hilfe | ||
* ... kleinere Werte sind besser
Gaming Performance
Die RTX 5090 ist aktuell mehr oder weniger die einzige Notebook-GPU, welche sich von der Rohleistung gut für UHD-Displays eignet. Mit Ausnahme von sehr schlecht optimierten Games wie Borderlands 4 und Oblivion Remastered laufen fast alle aktuellen Titel in der nativen Auflösung bzw. 3.840 x 2.160 Pixeln flüssig mit maximalen Details. Wenn es doch eng wird, hilft wie üblich Upscaling. So klettert die Framerate in Borderlands 4 inklusive DLSS4 zum Beispiel von 20 auf 38 FPS (UHD/Badass-Preset). Wenn man auch noch vierfache Frame Generation dazuschaltet, sind es sogar 118 FPS, wobei das subjektive Spielgefühl wegen schwankender Frametimes in diesem Fall nicht perfekt ist, um es vorsichtig auszudrücken.
| min. | mittel | hoch | max. | QHD DLSS | QHD | 4K DLSS | 4K | |
|---|---|---|---|---|---|---|---|---|
| GTA V (2015) | 184.3 | 183.9 | 164.5 | 163.8 | ||||
| Dota 2 Reborn (2015) | 201 | 184.8 | 180.1 | |||||
| Final Fantasy XV Benchmark (2018) | 209 | 176.7 | 111.8 | |||||
| X-Plane 11.11 (2018) | 118.7 | 97.1 | ||||||
| Strange Brigade (2018) | 479 | 443 | 333 | 182.2 | ||||
| Baldur's Gate 3 (2023) | 209 | 209 | 158.3 | 88.5 | ||||
| Cyberpunk 2077 (2023) | 185 | 169.9 | 122.8 | 55.1 | ||||
| Horizon Forbidden West (2024) | 140.7 | 140.3 | 100.9 | 81 | 59.5 | |||
| Ghost of Tsushima (2024) | 115.1 | 108.1 | 100.3 | 94.4 | 62 | |||
| Senua's Saga Hellblade 2 (2024) | 86.1 | 63.1 | 61.8 | 37.5 | ||||
| Space Marine 2 (2024) | 108.5 | 108 | 107.4 | 94.7 | 69.6 | |||
| Until Dawn (2024) | 116.6 | 104 | 76.6 | 63.2 | 45.4 | |||
| Stalker 2 (2024) | 167.8 | 147.6 | 110.7 | 92.7 | 65.4 | |||
| The Elder Scrolls IV Oblivion Remastered (2025) | 111.8 | 61.9 | 45.9 | 41.6 | 27.3 | |||
| Doom: The Dark Ages (2025) | 133.2 | 128.9 | 92.2 | 75.6 | 52.2 | |||
| Borderlands 4 (2025) | 76.6 | 54 | 37.1 | 117.5 | 20.2 | |||
| Battlefield 6 (2025) | 181.4 | 169.4 | 159.9 | 145.8 | 136.7 | 108.5 | 82.5 | 59.7 |
| Borderlands 4 | |
| 3840x2160 Badass Preset AA:FX | |
| Lenovo Legion 9 18IAX10 RTX 5090 | |
| Durchschnitt der Klasse Gaming (n=1der letzten 2 Jahre) | |
| 3840x2160 Badass Preset + Quality DLSS + Max. FG | |
| Lenovo Legion 9 18IAX10 RTX 5090 | |
| Durchschnitt der Klasse Gaming (n=1der letzten 2 Jahre) | |
| Doom: The Dark Ages | |
| 3840x2160 Ultra Nightmare AA:T | |
| Lenovo Legion 9 18IAX10 RTX 5090 | |
| Durchschnitt der Klasse Gaming (11.7 - 52.2, n=6, der letzten 2 Jahre) | |
| 3840x2160 Ultra Nightmare - DLSS Quality | |
| Lenovo Legion 9 18IAX10 RTX 5090 | |
| Durchschnitt der Klasse Gaming (14.2 - 75.6, n=7, der letzten 2 Jahre) | |
| The Elder Scrolls IV Oblivion Remastered | |
| 3840x2160 Ultra Preset AA:T | |
| Lenovo Legion 9 18IAX10 RTX 5090 | |
| Durchschnitt der Klasse Gaming (17.9 - 27.3, n=2, der letzten 2 Jahre) | |
| 3840x2160 Ultra Preset + Quality DLSS | |
| Lenovo Legion 9 18IAX10 RTX 5090 | |
| Durchschnitt der Klasse Gaming (31.2 - 41.6, n=2, der letzten 2 Jahre) | |
| Stalker 2 | |
| 3840x2160 Epic Preset | |
| Lenovo Legion 9 18IAX10 RTX 5090 | |
| Durchschnitt der Klasse Gaming (28.2 - 65.4, n=2, der letzten 2 Jahre) | |
| 3840x2160 Epic Preset + Quality DLSS + FG | |
| Lenovo Legion 9 18IAX10 RTX 5090 | |
| Durchschnitt der Klasse Gaming (55.6 - 92.7, n=2, der letzten 2 Jahre) | |
| Until Dawn | |
| 3840x2160 Ultra Preset | |
| Lenovo Legion 9 18IAX10 RTX 5090 | |
| Durchschnitt der Klasse Gaming (n=1der letzten 2 Jahre) | |
| 3840x2160 Ultra Preset + Quality DLSS + Ray Tracing | |
| Lenovo Legion 9 18IAX10 RTX 5090 | |
| Durchschnitt der Klasse Gaming (n=1der letzten 2 Jahre) | |
| Space Marine 2 | |
| 3840x2160 Ultra Preset AA:T | |
| Lenovo Legion 9 18IAX10 RTX 5090 | |
| Durchschnitt der Klasse Gaming (n=1der letzten 2 Jahre) | |
| 3840x2160 Ultra Preset + Quality DLSS | |
| Lenovo Legion 9 18IAX10 RTX 5090 | |
| Durchschnitt der Klasse Gaming (n=1der letzten 2 Jahre) | |
| Senua's Saga Hellblade 2 | |
| 3840x2160 High Preset | |
| Lenovo Legion 9 18IAX10 RTX 5090 | |
| Durchschnitt der Klasse Gaming (n=1der letzten 2 Jahre) | |
| 3840x2160 High Preset + Quality DLSS | |
| Lenovo Legion 9 18IAX10 RTX 5090 | |
| Durchschnitt der Klasse Gaming (n=1der letzten 2 Jahre) | |
| Ghost of Tsushima | |
| 3840x2160 Very High Preset AA:T | |
| Lenovo Legion 9 18IAX10 RTX 5090 | |
| Durchschnitt der Klasse Gaming (n=1der letzten 2 Jahre) | |
| 3840x2160 Very High Preset + Quality DLSS | |
| Lenovo Legion 9 18IAX10 RTX 5090 | |
| Durchschnitt der Klasse Gaming (n=1der letzten 2 Jahre) | |
| Horizon Forbidden West | |
| 3840x2160 Very High Preset AA:T | |
| Lenovo Legion 9 18IAX10 RTX 5090 | |
| Durchschnitt der Klasse Gaming (n=1der letzten 2 Jahre) | |
| 3840x2160 Very High Preset + Quality DLSS | |
| Lenovo Legion 9 18IAX10 RTX 5090 | |
| Durchschnitt der Klasse Gaming (n=1der letzten 2 Jahre) | |
Wie sich die 3D-Performance über einen längeren Zeitraum verhält, haben wir anhand von Cyberpunk 2077 überprüft. Ergebnis: Die FPS-Werte waren bis auf kleinere Schwankungen relativ konstant.
Cyberpunk 2077 ultra FPS-Diagramm
Emissionen
Geräuschemissionen
Die überdurchschnittliche Leistung fordert ihren Tribut in Form eines überdurchschnittlichen Geräuschpegels. 56 dB(A) bei Cyberpunk 2077 markieren den höchsten Wert im Testfeld. Die Konkurrenz wird mit 48 bis 54 dB(A) allerdings ebenfalls ziemlich laut, so dass man zum Zocken am besten ein Headset verwenden sollte. Im Leerlauf bleiben die Lüfter des Legion 9 18 deutlich ruhiger und schalten sich manchmal komplett aus.
Lautstärkediagramm
| Idle |
| 24 / 30 / 32 dB(A) |
| Last |
| 46 / 56 dB(A) |
 | ||
30 dB leise 40 dB(A) deutlich hörbar 50 dB(A) störend |
||
min: | ||
| Lenovo Legion 9 18IAX10 RTX 5090 Ultra 9 275HX, GeForce RTX 5090 Laptop | Alienware 18 Area-51 Ultra 9 275HX, GeForce RTX 5090 Laptop | Asus Strix Scar 18 G835LX Ultra 9 275HX, GeForce RTX 5090 Laptop | Razer Blade 18 2025 RTX 5090 Laptop Ultra 9 275HX, GeForce RTX 5090 Laptop | Lenovo Legion 9 18IAX10 Ultra 9 275HX, GeForce RTX 5080 Laptop | |
|---|---|---|---|---|---|
| Geräuschentwicklung | 1% | 0% | 12% | 8% | |
| aus / Umgebung * (dB) | 24 | 23.4 2% | 23.3 3% | 23.4 2% | 23.3 3% |
| Idle min * (dB) | 24 | 30.2 -26% | 29.8 -24% | 23.4 2% | 23.3 3% |
| Idle avg * (dB) | 30 | 30.6 -2% | 29.8 1% | 23.4 22% | 23.3 22% |
| Idle max * (dB) | 32 | 30.6 4% | 29.8 7% | 23.4 27% | 29.1 9% |
| Last avg * (dB) | 46 | 38 17% | 42.9 7% | 40.4 12% | 46.8 -2% |
| Cyberpunk 2077 ultra * (dB) | 56 | 48.9 13% | 53.7 4% | 48.2 14% | 49.6 11% |
| Last max * (dB) | 56 | 55.9 -0% | 53.7 4% | 53.5 4% | 49.6 11% |
* ... kleinere Werte sind besser
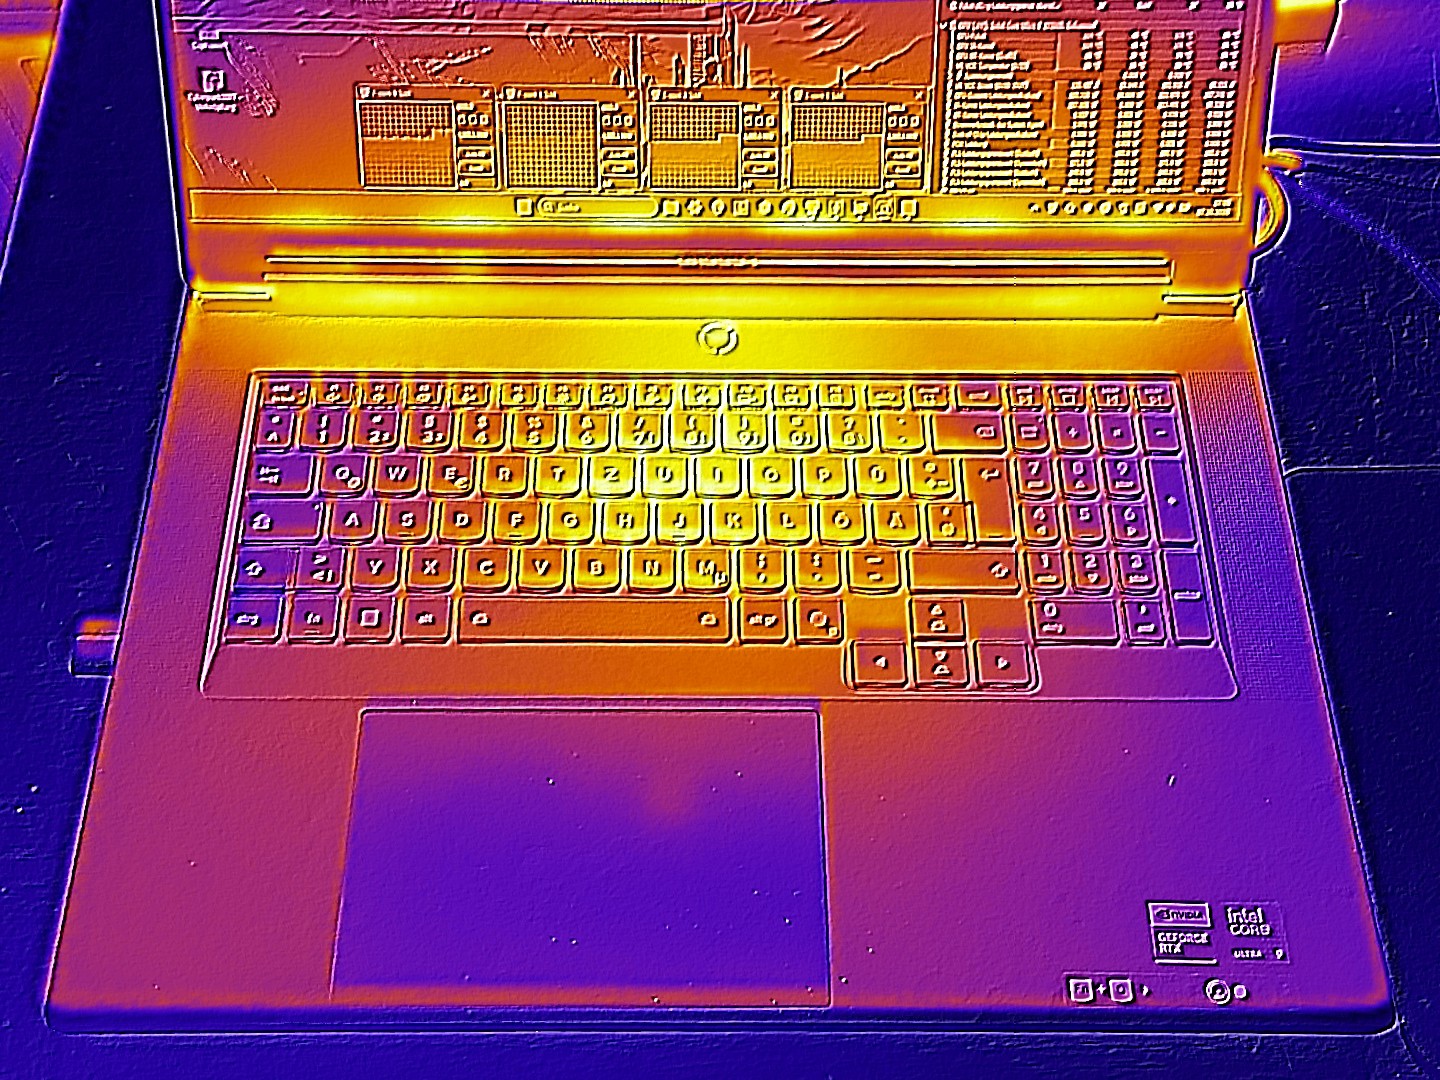
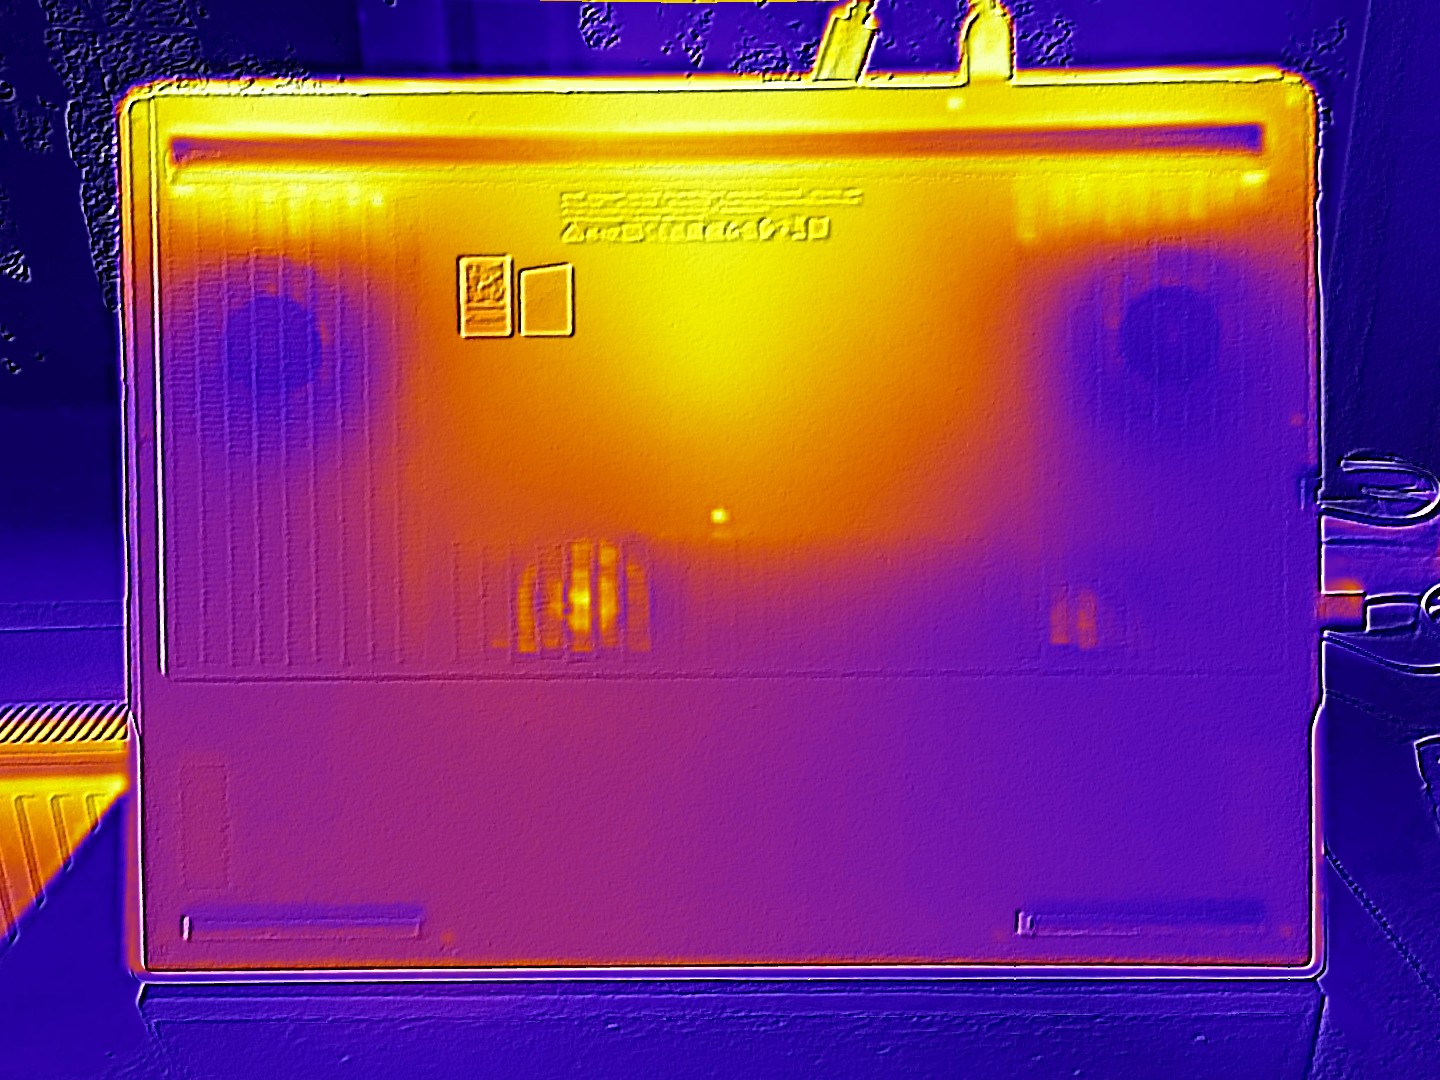
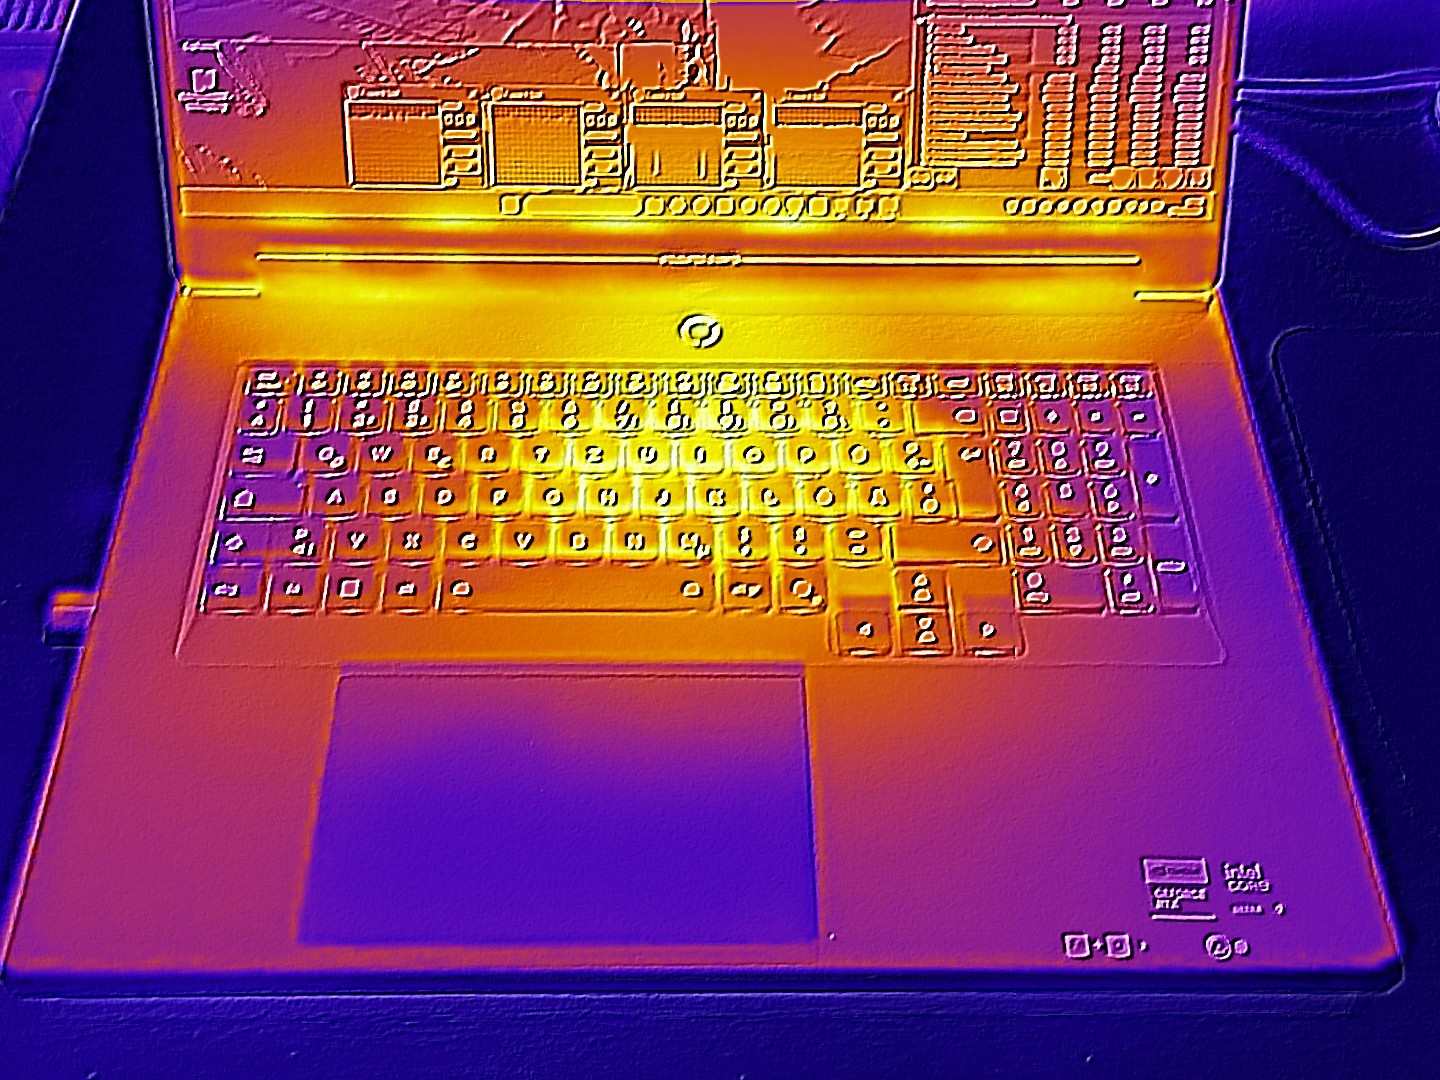
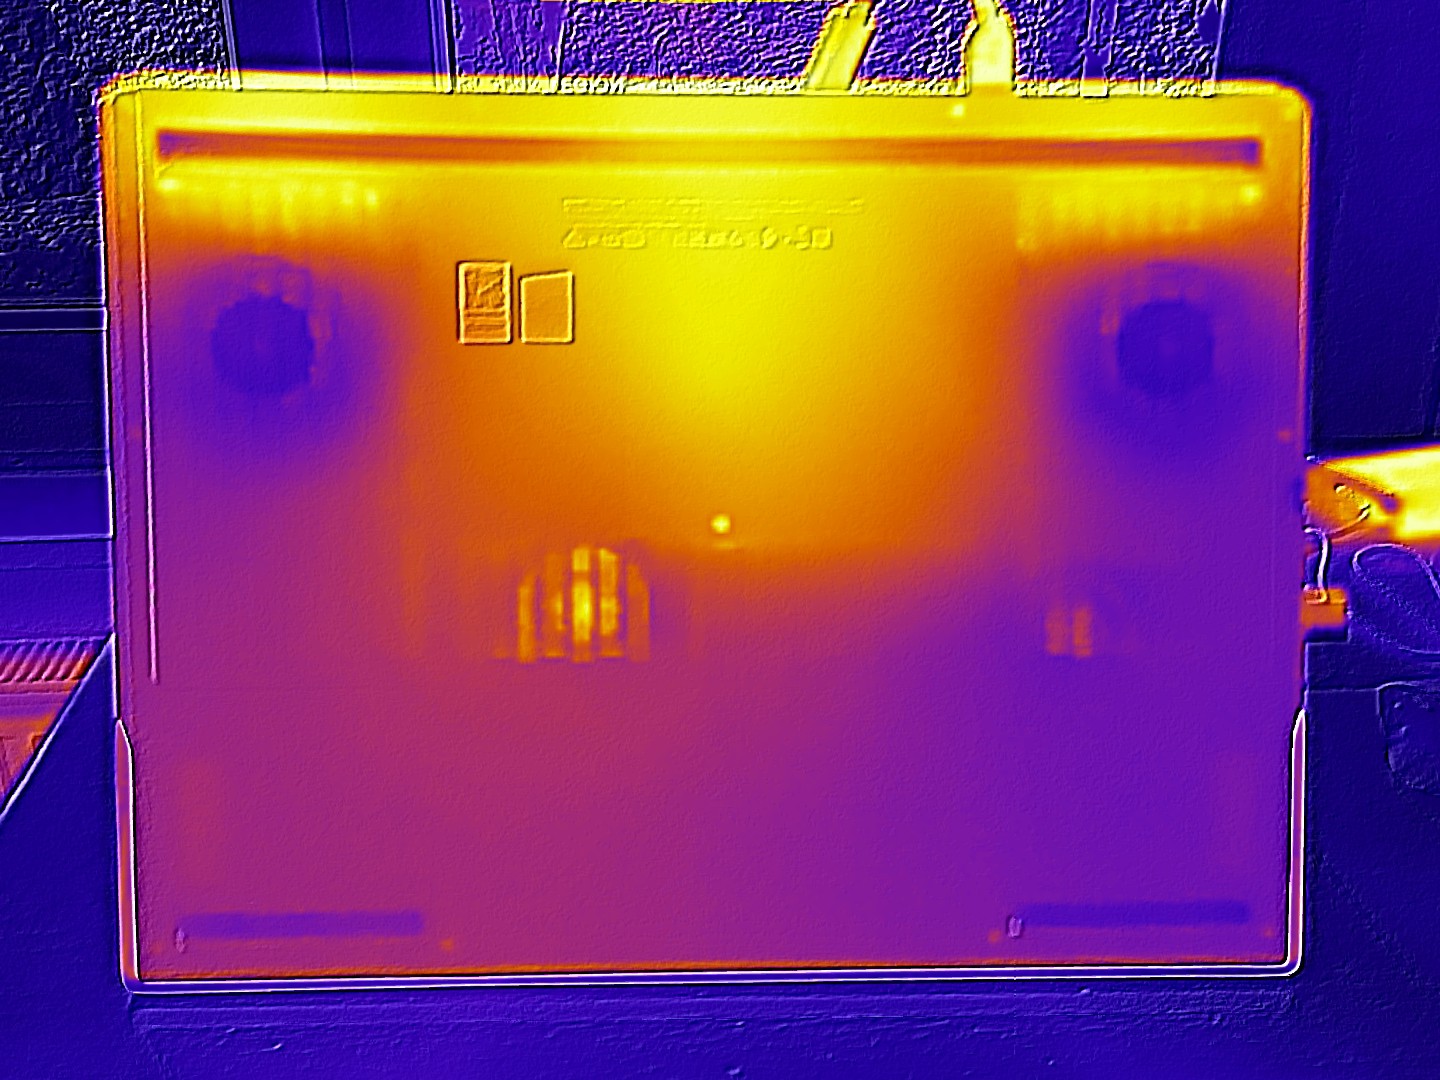
Temperatur
Die Temperaturentwicklung ist wie schon beim 5080er-Modell etwas kurios. Während der 18-Zöller bereits im Idle-Betrieb verhältnismäßig warm wird, erhitzen sich die Gehäuseoberflächen unter Last kaum noch und erreichen teils ähnliche Werte.
(±) Die maximale Temperatur auf der Oberseite ist 41 °C. Im Vergleich liegt der Klassendurchschnitt bei 40.4 °C (von 21.2 bis 68.8 °C für die Klasse Gaming).
(+) Auf der Unterseite messen wir eine maximalen Wert von 39 °C (im Vergleich zum Durchschnitt von 43.2 °C).
(±) Ohne Last messen wir eine durchschnittliche Temperatur von 34.7 °C auf der Oberseite. Der Klassendurchschnitt erreicht 33.9 °C.
(±) 3: The average temperature for the upper side is 33.1 °C / 92 F, compared to the average of 33.9 °C / 93 F for the class Gaming.
(+) Die Handballen und der Touchpad-Bereich erreichen maximal 33 °C und damit die typische Hauttemperatur und fühlen sich daher nicht heiß an.
(-) Die durchschnittliche Handballen-Temperatur anderer getesteter Geräte war 28.8 °C (-4.2 °C).
| Lenovo Legion 9 18IAX10 RTX 5090 Ultra 9 275HX, GeForce RTX 5090 Laptop | Alienware 18 Area-51 Ultra 9 275HX, GeForce RTX 5090 Laptop | Asus Strix Scar 18 G835LX Ultra 9 275HX, GeForce RTX 5090 Laptop | Razer Blade 18 2025 RTX 5090 Laptop Ultra 9 275HX, GeForce RTX 5090 Laptop | Lenovo Legion 9 18IAX10 Ultra 9 275HX, GeForce RTX 5080 Laptop | |
|---|---|---|---|---|---|
| Hitze | 13% | 4% | 9% | -1% | |
| Last oben max * (°C) | 41 | 36.8 10% | 45.6 -11% | 44.3 -8% | 43 -5% |
| Last unten max * (°C) | 39 | 35.8 8% | 46 -18% | 42 -8% | 41.8 -7% |
| Idle oben max * (°C) | 38 | 30.6 19% | 28.9 24% | 27.2 28% | 37 3% |
| Idle unten max * (°C) | 36 | 30.8 14% | 29.2 19% | 27.5 24% | 34.2 5% |
* ... kleinere Werte sind besser
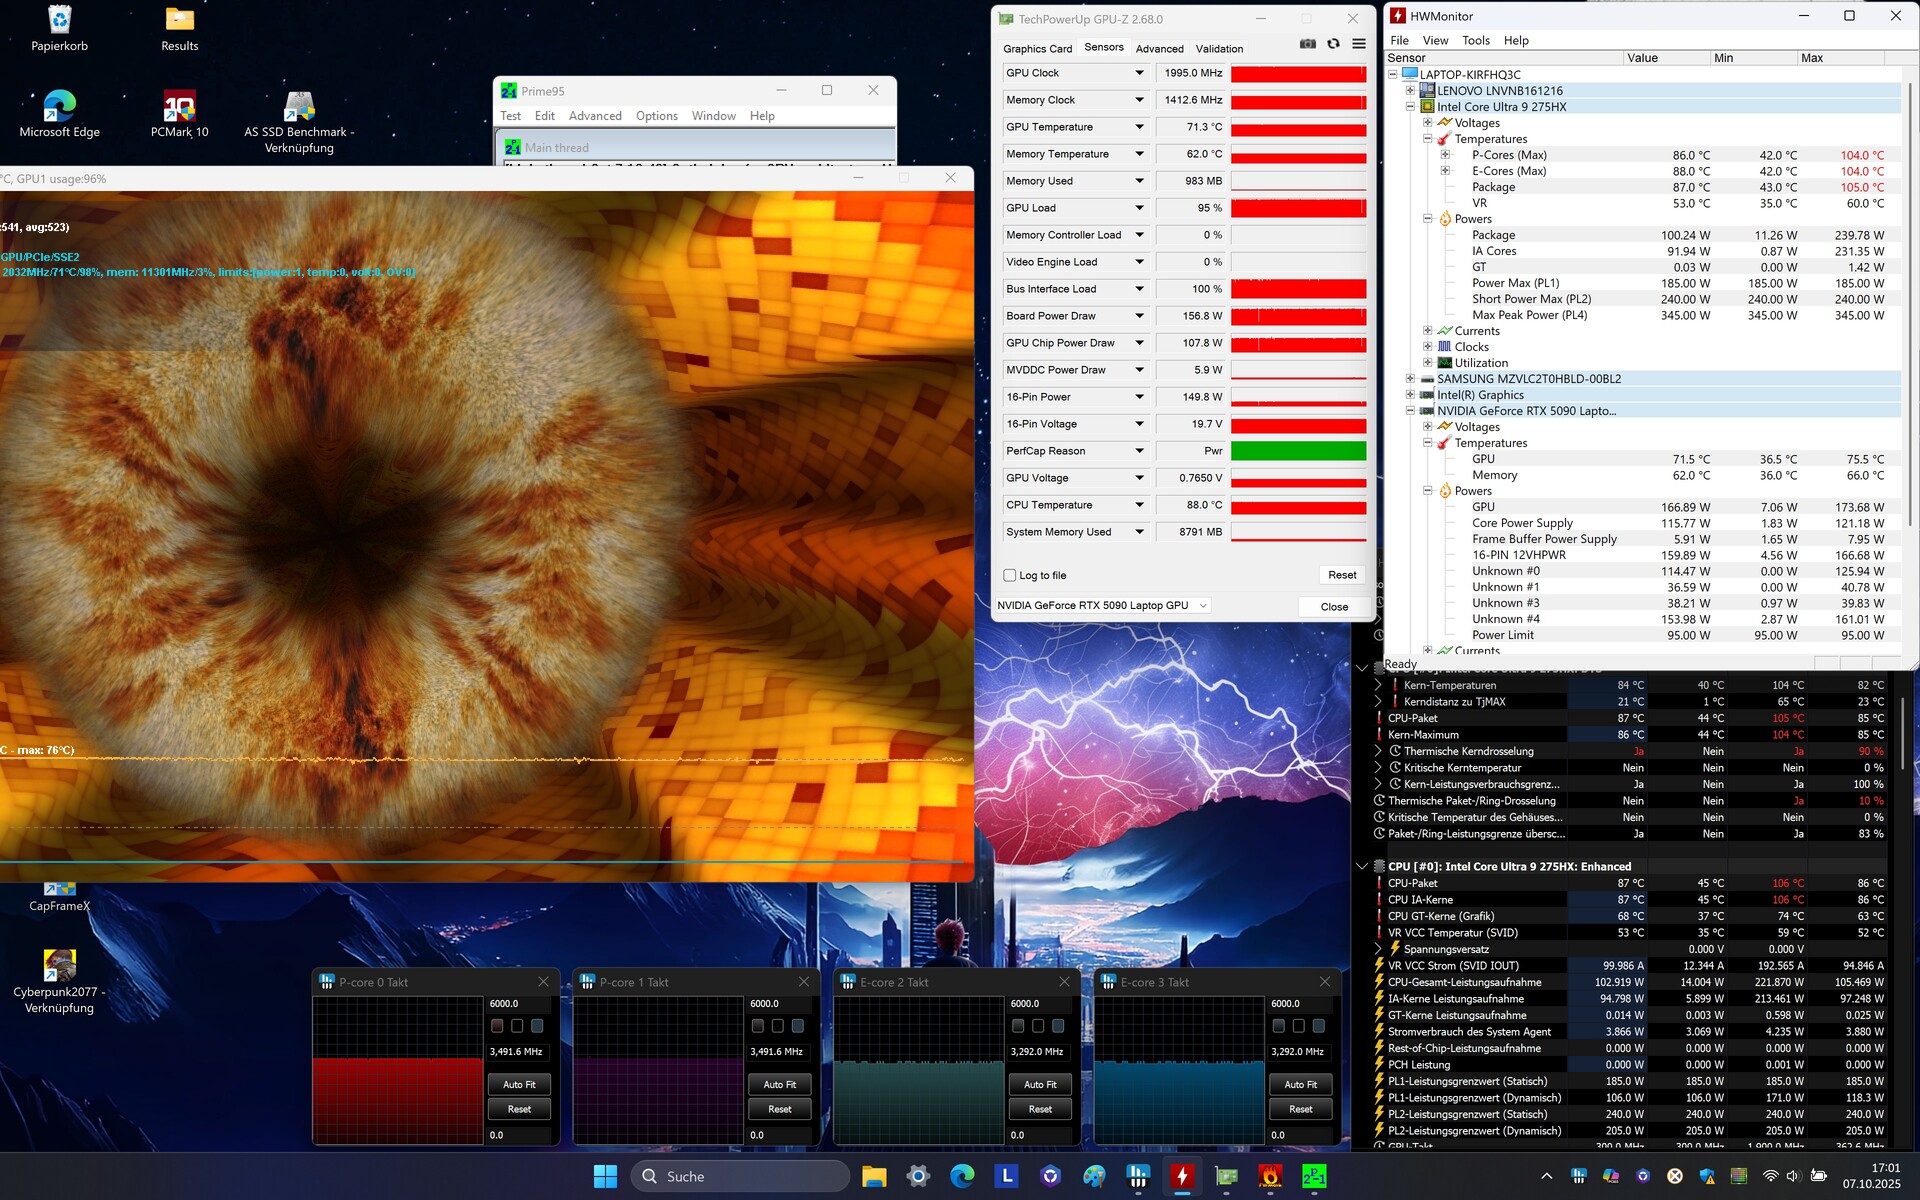
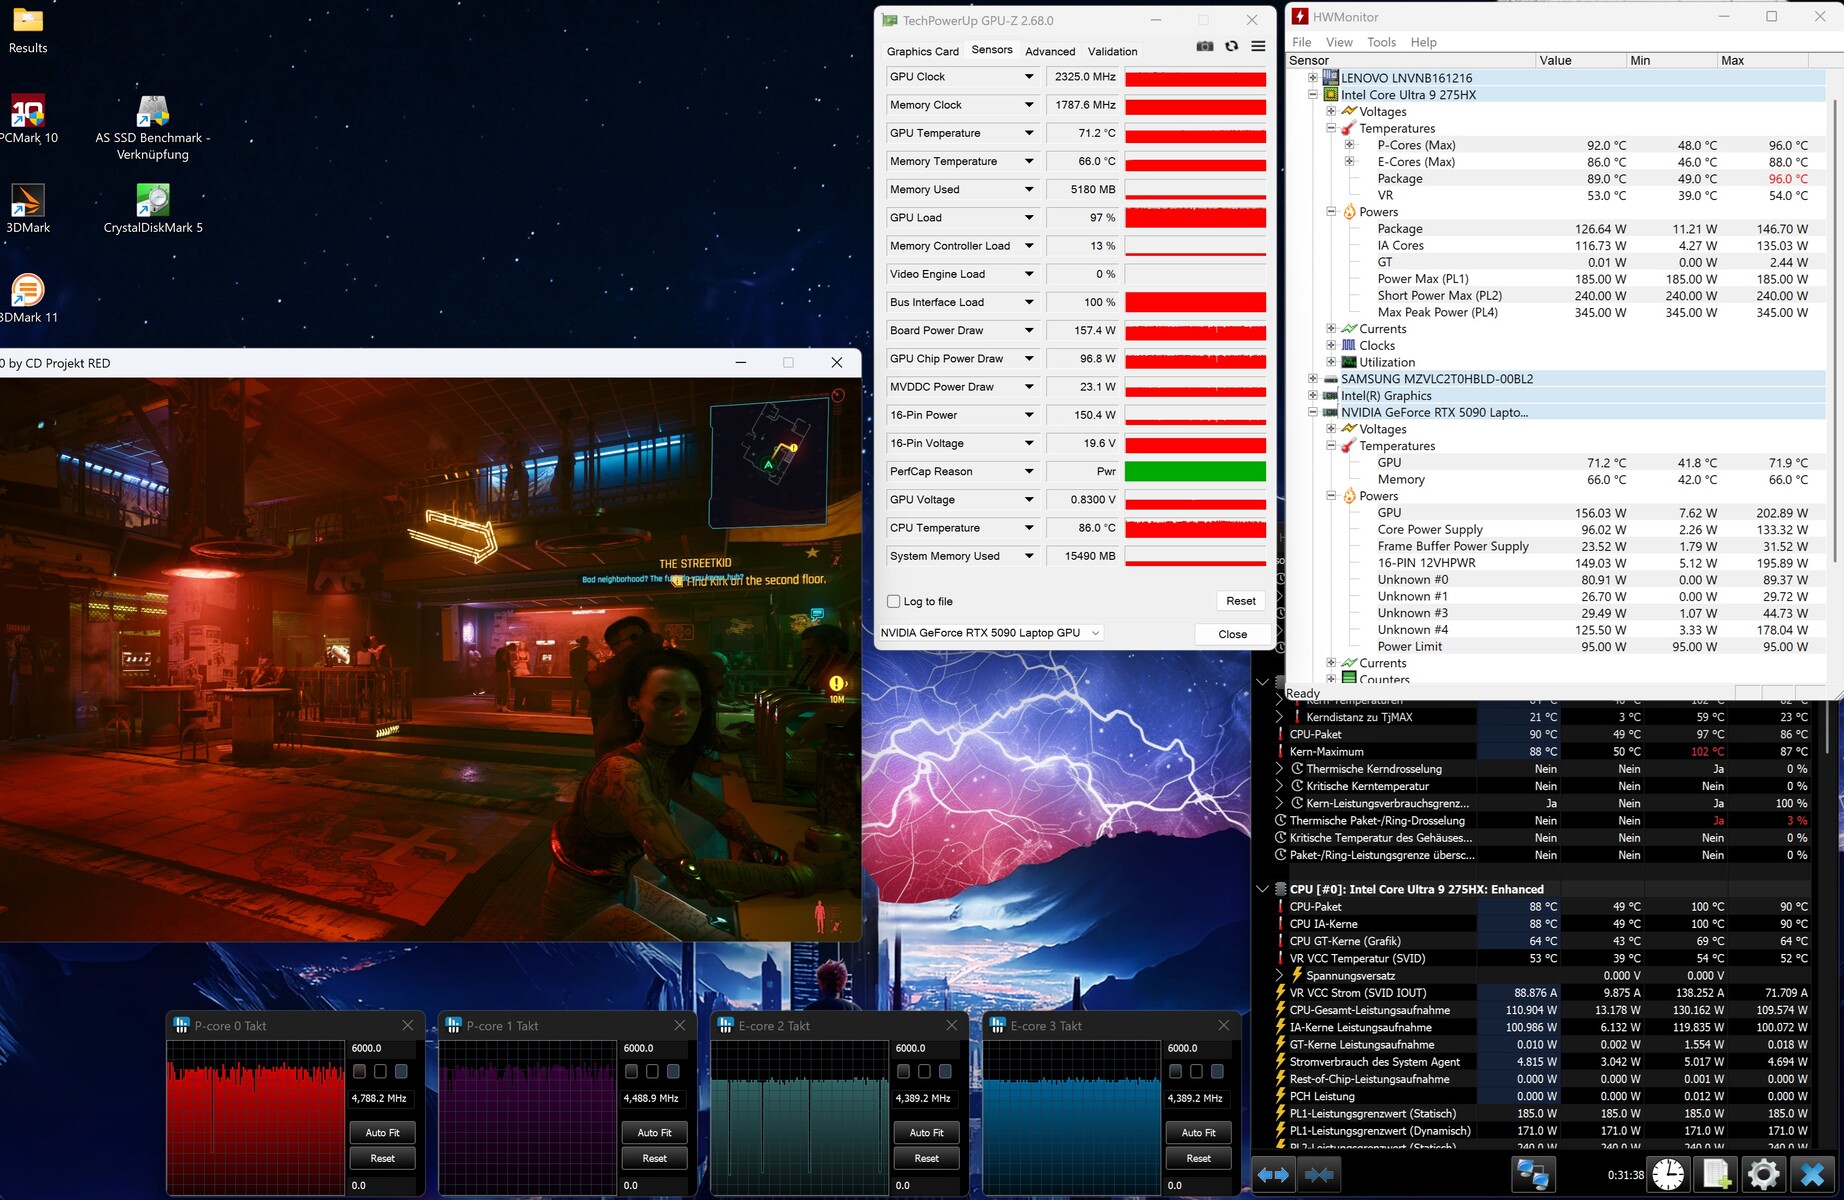
Stresstest
Im Stresstest mit den Tools Furmark und Prime95 pendelte sich der Core Ultra 9 275HX auf rund 87 °C ein, bei der RTX 5090 waren es moderate 71 °C.
Lautsprecher
Die Klangqualität muss sich nicht hinter der Konkurrenz verstecken – im Gegenteil. Das Soundsystem zählt zu den besten im Notebook-Bereich und macht auch beim Bass nicht schlapp.
Lenovo Legion 9 18IAX10 RTX 5090 Audio Analyse
(±) | Mittelmäßig laut spielende Lautsprecher (81 dB)
Bass 100 - 315 Hz
(+) | guter Bass - nur 3.6% Abweichung vom Median
(+) | lineare Bass-Wiedergabe (6.4% Delta zum Vorgänger)
Mitteltöne 400 - 2000 Hz
(+) | ausgeglichene Mitten, vom Median nur 3.1% abweichend
(+) | lineare Mitten (5% Delta zum Vorgänger)
Hochtöne 2 - 16 kHz
(±) | verringerte Hochtöne, 8.7% geringer als der Median
(+) | sehr lineare Hochtöne (3% Delta zum Vorgänger)
Gesamt im hörbaren Bereich 100 - 16.000 Hz
(+) | hörbarer Bereich ist sehr linear (11.2% Abstand zum Median
Im Vergleich zu allen Geräten derselben Klasse
» 8% aller getesteten Geräte dieser Klasse waren besser, 4% vergleichbar, 88% schlechter
» Das beste Gerät hat einen Delta-Wert von 6%, durchschnittlich ist 18%, das schlechteste Gerät hat 132%
Im Vergleich zu allen Geräten im Test
» 7% aller getesteten Geräte waren besser, 2% vergleichbar, 91% schlechter
» Das beste Gerät hat einen Delta-Wert von 4%, durchschnittlich ist 24%, das schlechteste Gerät hat 134%
Alienware 18 Area-51 Audio Analyse
(+) | Die Lautsprecher können relativ laut spielen (87.9 dB)
Bass 100 - 315 Hz
(-) | kaum Bass - 17.5% niedriger als der Median
(±) | durchschnittlich lineare Bass-Wiedergabe (13.4% Delta zum Vorgänger)
Mitteltöne 400 - 2000 Hz
(+) | ausgeglichene Mitten, vom Median nur 3.1% abweichend
(+) | lineare Mitten (3.6% Delta zum Vorgänger)
Hochtöne 2 - 16 kHz
(+) | ausgeglichene Hochtöne, vom Median nur 2.9% abweichend
(+) | sehr lineare Hochtöne (2.9% Delta zum Vorgänger)
Gesamt im hörbaren Bereich 100 - 16.000 Hz
(+) | hörbarer Bereich ist sehr linear (14.2% Abstand zum Median
Im Vergleich zu allen Geräten derselben Klasse
» 25% aller getesteten Geräte dieser Klasse waren besser, 7% vergleichbar, 68% schlechter
» Das beste Gerät hat einen Delta-Wert von 6%, durchschnittlich ist 18%, das schlechteste Gerät hat 132%
Im Vergleich zu allen Geräten im Test
» 17% aller getesteten Geräte waren besser, 4% vergleichbar, 79% schlechter
» Das beste Gerät hat einen Delta-Wert von 4%, durchschnittlich ist 24%, das schlechteste Gerät hat 134%
Energieverwaltung
Energieaufnahme
Im 3D-Betrieb richtet sich der Energiebedarf mit 343 Watt (avg. 3DMark 06) bis 393 Watt (Maximalwert Stresstest) ungefähr nach dem RTX 5080-Modell, das für ein Notebook ebenfalls sehr viel Strom verbraucht. Solange die Grafikumschaltung aktiv ist, sind es im Leerlauf „nur“ 31 bis 42 Watt.
| Aus / Standby | |
| Idle | |
| Last |
|
Legende:
min: | |
| Lenovo Legion 9 18IAX10 RTX 5090 Ultra 9 275HX, GeForce RTX 5090 Laptop | Alienware 18 Area-51 Ultra 9 275HX, GeForce RTX 5090 Laptop | Asus Strix Scar 18 G835LX Ultra 9 275HX, GeForce RTX 5090 Laptop | Razer Blade 18 2025 RTX 5090 Laptop Ultra 9 275HX, GeForce RTX 5090 Laptop | Lenovo Legion 9 18IAX10 Ultra 9 275HX, GeForce RTX 5080 Laptop | Durchschnitt der Klasse Gaming | |
|---|---|---|---|---|---|---|
| Stromverbrauch | -17% | 8% | 18% | -10% | 41% | |
| Idle min * (Watt) | 30.9 | 38.4 -24% | 11.4 63% | 18.1 41% | 34.5 -12% | 13.1 ? 58% |
| Idle avg * (Watt) | 32.6 | 45.6 -40% | 39.2 -20% | 27.9 14% | 44.1 -35% | 18.8 ? 42% |
| Idle max * (Watt) | 42.1 | 57.5 -37% | 40.2 5% | 28.7 32% | 53.3 -27% | 24.4 ? 42% |
| Last avg * (Watt) | 150 | 190.1 -27% | 161.2 -7% | 108.3 28% | 140.9 6% | 108.6 ? 28% |
| Cyberpunk 2077 ultra external monitor * (Watt) | 343 | 333 3% | 295 14% | 331 3% | 353 -3% | |
| Cyberpunk 2077 ultra * (Watt) | 348 | 340 2% | 303 13% | 338 3% | 360 -3% | |
| Last max * (Watt) | 393 | 373.2 5% | 430.9 -10% | 366.7 7% | 367.5 6% | 255 ? 35% |
* ... kleinere Werte sind besser
Energieaufnahme Cyberpunk / Stresstest
Energieaufnahme mit externem Monitor
Akkulaufzeit
Im Akkumodus ist der Energiehunger höher als beim günstigeren Legion 9. Knapp 3 Stunden beim Wi-Fi-Test (Balanced-Profil statt Performance) überholen zwar das Alienware 18 mit seinen mageren 2 Stunden, dennoch ist der ermittelte Wert eher enttäuschend – vor allem im Hinblick auf den kräftigen 99-Wh-Akku.
| Lenovo Legion 9 18IAX10 RTX 5090 Ultra 9 275HX, GeForce RTX 5090 Laptop, 99.9 Wh | Alienware 18 Area-51 Ultra 9 275HX, GeForce RTX 5090 Laptop, 96 Wh | Asus Strix Scar 18 G835LX Ultra 9 275HX, GeForce RTX 5090 Laptop, 90 Wh | Razer Blade 18 2025 RTX 5090 Laptop Ultra 9 275HX, GeForce RTX 5090 Laptop, 99.99 Wh | Lenovo Legion 9 18IAX10 Ultra 9 275HX, GeForce RTX 5080 Laptop, 99.9 Wh | Durchschnitt der Klasse Gaming | |
|---|---|---|---|---|---|---|
| Akkulaufzeit | -31% | 90% | 169% | 93% | 141% | |
| WLAN (h) | 2.9 | 2 -31% | 5.5 90% | 7.8 169% | 5.6 93% | 6.98 ? 141% |
| H.264 (h) | 5.8 | 8.9 ? | ||||
| Cyberpunk 2077 ultra 150cd (h) | 0.7 | |||||
| Last (h) | 1.2 | 1.51 ? |
Notebookcheck Gesamtbewertung
Mit dem Legion 9 18IAX10 verkauft Lenovo ein extrem teures, aber auch sehr hochwertiges und ungemein flottes Desktop-Replacment, dessen RTX 5090 sich oft die Performance-Krone schnappt.
Lenovo Legion 9 18IAX10 RTX 5090
- 10.10.2025 v8
Florian Glaser
 Total Sustainability Score:
 Mögliche Alternativen im Vergleich
Bild | Modell / Test | Preis ab | Gewicht | Dicke | Display |
|---|---|---|---|---|---|
1. 87.1%  | Lenovo Legion 9 18IAX10 RTX 5090 Intel Core Ultra 9 275HX ⎘ NVIDIA GeForce RTX 5090 Laptop ⎘ 64 GB RAM, 2048 GB SSD | Amazon: 5.604,05 € Geizhals Suche | 3.5 kg | 28 mm | 18.00" 3840x2400 252 PPI IPS |
2. 86.2%  | Alienware 18 Area-51 Intel Core Ultra 9 275HX ⎘ NVIDIA GeForce RTX 5090 Laptop ⎘ 64 GB RAM | Amazon: 1. 1.922,49 € Alienware 18 Area-51 Gaming ... 2. 1.992,87 € Alienware 18 Area-51 Gaming-... 3. 4.749,00 € Alienware 18 Area-51 Gaming ... Geizhals Suche | 4.2 kg | 24.32 mm | 18.00" 2560x1600 168 PPI IPS |
3. 88%  | Asus Strix Scar 18 G835LX Intel Core Ultra 9 275HX ⎘ NVIDIA GeForce RTX 5090 Laptop ⎘ 64 GB RAM, 2048 GB SSD | Amazon: 5.969,49 € Geizhals Suche | 3.3 kg | 32 mm | 18.00" 2560x1600 168 PPI Mini-LED |
4. 89.5%  | Razer Blade 18 2025 RTX 5090 Laptop Intel Core Ultra 9 275HX ⎘ NVIDIA GeForce RTX 5090 Laptop ⎘ 64 GB RAM, 2048 GB SSD | Amazon: Geizhals Suche | 3.2 kg | 27.9 mm | 18.00" 3840x2400 252 PPI IPS |
5. 89.1%  | Lenovo Legion 9 18IAX10 Intel Core Ultra 9 275HX ⎘ NVIDIA GeForce RTX 5080 Laptop ⎘ 64 GB RAM, 2048 GB SSD | Amazon: 5.604,05 € Geizhals Suche | 3.5 kg | 27.95 mm | 18.00" 3840x2400 252 PPI IPS |
Transparenz
Die Auswahl der zu testenden Geräte erfolgt innerhalb der Redaktion. Das vorliegende Testmuster wurde dem Autor vom Hersteller oder einem Shop zu Testzwecken leihweise zur Verfügung gestellt. Eine Einflussnahme des Leihstellers auf den Testbericht gab es nicht, der Hersteller erhielt keine Version des Reviews vor der Veröffentlichung. Es bestand keine Verpflichtung zur Publikation. Als eigenständiges, unabhängiges Unternehmen unterliegt Notebookcheck keiner Diktion von Herstellern, Shops und Verlagen.
So testet Notebookcheck
Pro Jahr werden von Notebookcheck hunderte Laptops und Smartphones unabhängig in von uns standardisierten technischen Verfahren getestet, um eine Vergleichbarkeit aller Testergebnisse zu gewährleisten. Seit rund 20 Jahren entwickeln wir diese Testmethoden kontinuierlich weiter und setzen damit Branchenstandards. In unseren Testlaboren kommt ausschließlich hochwertiges Messequipment in die Hände erfahrener Techniker und Redakteure. Die Tests unterliegen einer mehrstufigen Kontrolle. Unsere komplexe Gesamtbewertung basiert auf hunderten fundierten Messergebnissen und Benchmarks, womit Ihnen Objektivität garantiert ist. Weitere Informationen zu unseren Testmethoden gibt es hier.
