Lenovo ThinkPad T16 Gen 1 Core i7 Laptop im Test: Leise auf Kosten der Leistung
Das ThinkPad T16 G1 ist das zweite 16-Zoll-ThinkPad, das eine Weiterentwicklung der bestehenden ThinkBook 16 Prosumer-Serie darstellt. Es ist sowohl mit Core-U- als auch mit Core-P-CPUs der 12. Generation ausgestattet und verfügt bei einigen Modellen über eine GeForce MX550.
Wir haben vor kurzem die Konfiguration mit Core i5-1240P und Ryzen 5 Pro 6650U getestet, daher konzentriert sich dieser Test auf die Konfiguration mit dem Core i7-1270P. Wir empfehlen einen Blick auf die Core i5-Version, um mehr über Gehäuse und andere physische Merkmale des ThinkPad T16 G1 zu erfahren. Wie groß ist der Leistungsunterschied, den Nutzer erwarten können, wenn sie auf die teurere Core i7-Option aufrüsten?
Zu den Konkurrenten des ThinkPad T16 G1 gehören das 16-Zoller LG Gram 16, das MSI Summit E16 oder HPs EliteBook 860/865 G9. Dell hat zum Zeitpunkt der Erstellung dieses Artikels noch keinen direkten 16-Zoll-Konkurrenten (Latitude) auf den Markt gebracht. Unsere getestete Konfiguration kostet etwa 1.600 Euro.
Weitere Lenovo-Testberichte:
Mögliche Konkurrenten im Vergleich
Bew. | Datum | Modell | Gewicht | Dicke | Größe | Auflösung | Preis ab |
|---|---|---|---|---|---|---|---|
| 88.6 % v7 (old) | 02 / 2023 | Lenovo ThinkPad T16 Gen 1 Core i7-1270P i7-1270P, Iris Xe G7 96EUs | 2 kg | 20.5 mm | 16.00" | 1920x1200 | |
| 90.2 % v7 (old) | 02 / 2023 | Lenovo ThinkPad T16 G1 21CH004MGE R5 PRO 6650U, Radeon 660M | 1.8 kg | 20.5 mm | 16.00" | 2560x1600 | |
| 86.6 % v7 (old) | 01 / 2023 | LG Gram 16Z90Q i7-1260P, Iris Xe G7 96EUs | 1.2 kg | 16.8 mm | 16.00" | 2560x1600 | |
| 87.2 % v7 (old) | 12 / 2022 | HP EliteBook 865 G9 R7 PRO 6850U, Radeon 680M | 1.9 kg | 19 mm | 16.00" | 1920x1200 | |
| 86.4 % v7 (old) | 07 / 2022 | Huawei MateBook 16s i7 i7-12700H, Iris Xe G7 96EUs | 2 kg | 17.8 mm | 16.00" | 2520x1680 | |
| 93.2 % v7 (old) | 11 / 2021 | Apple MacBook Pro 16 2021 M1 Pro M1 Pro, M1 Pro 16-Core GPU | 2.2 kg | 16.8 mm | 16.20" | 3456x2234 |
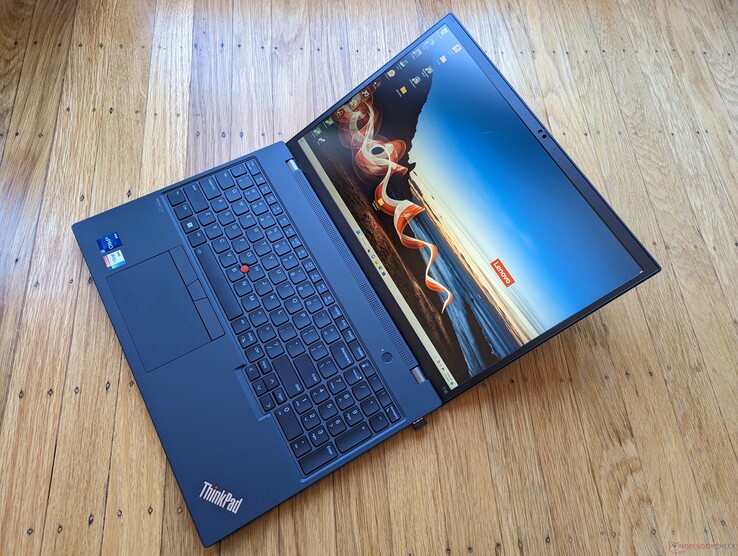
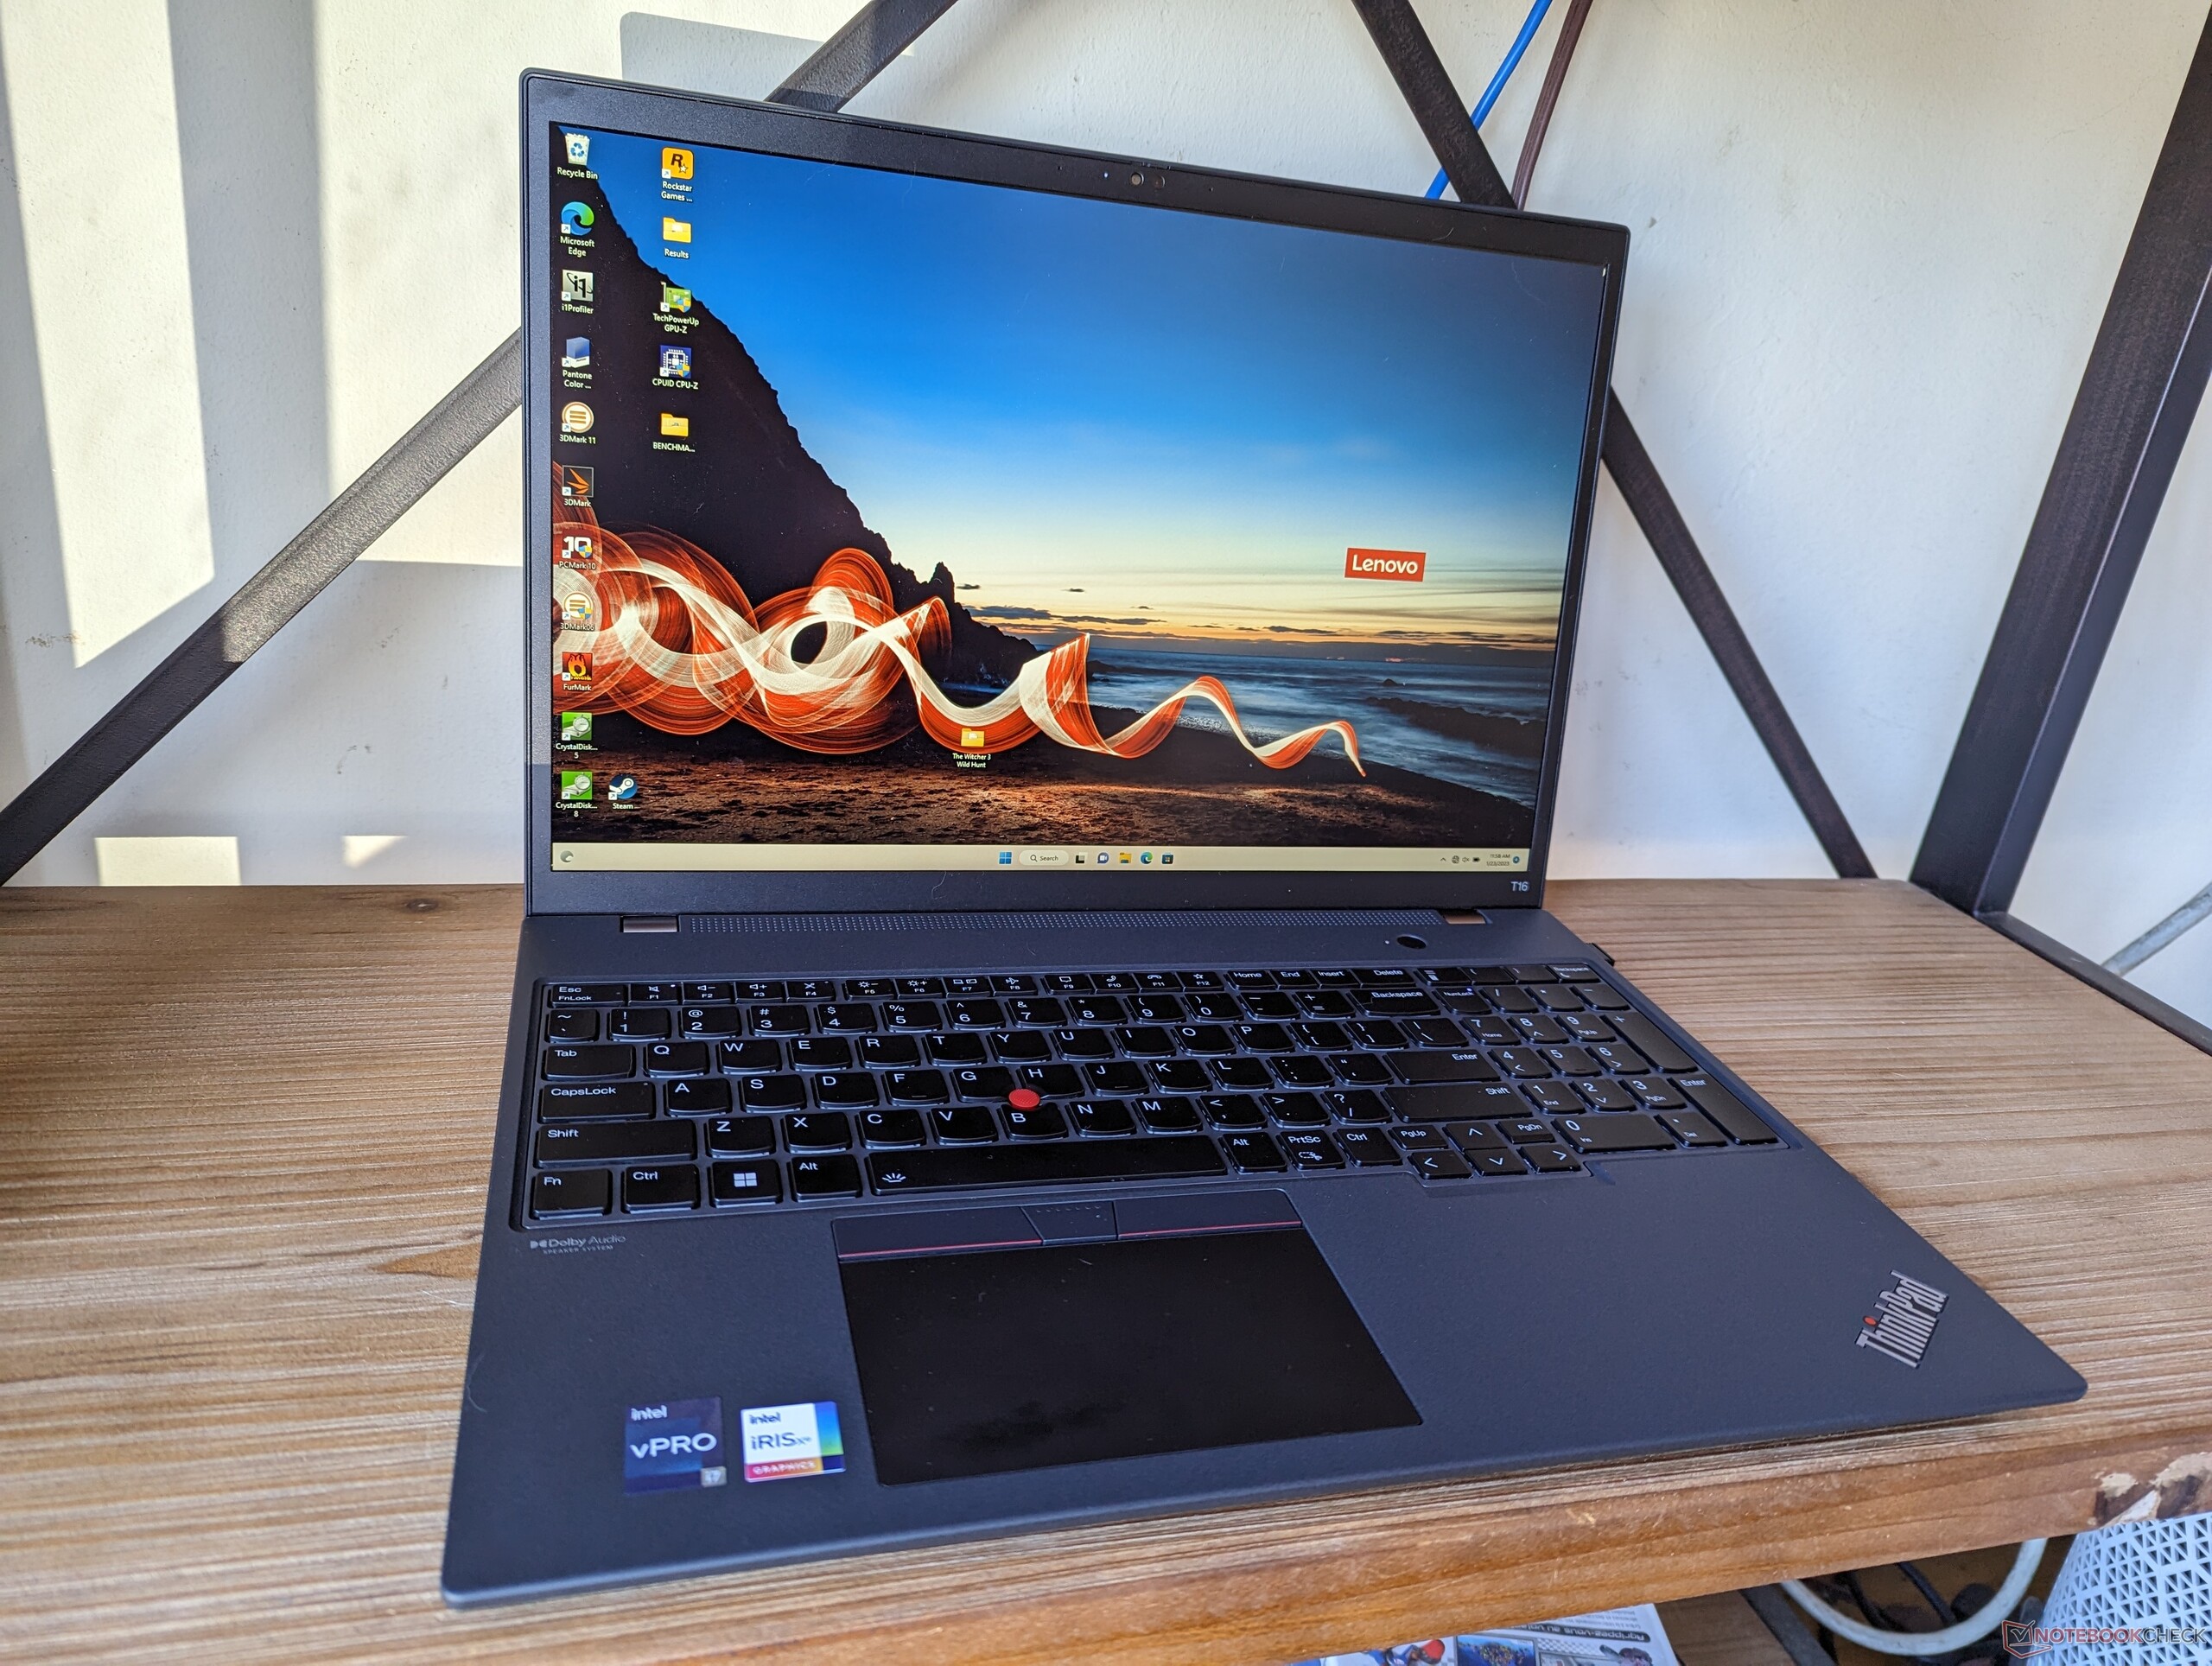
Gehäuse - Ein bisschen groß
Das Gehäuse ist in allen Dimensionen etwas größer und schwerer als bei konkurrierenden 16-Zoll-Notebooks wie dem HP EliteBook 865 G9 oder dem Apple MacBook Pro 16. Vor allem das LG Gram 16 ist mit 800 Gramm besonders leicht.
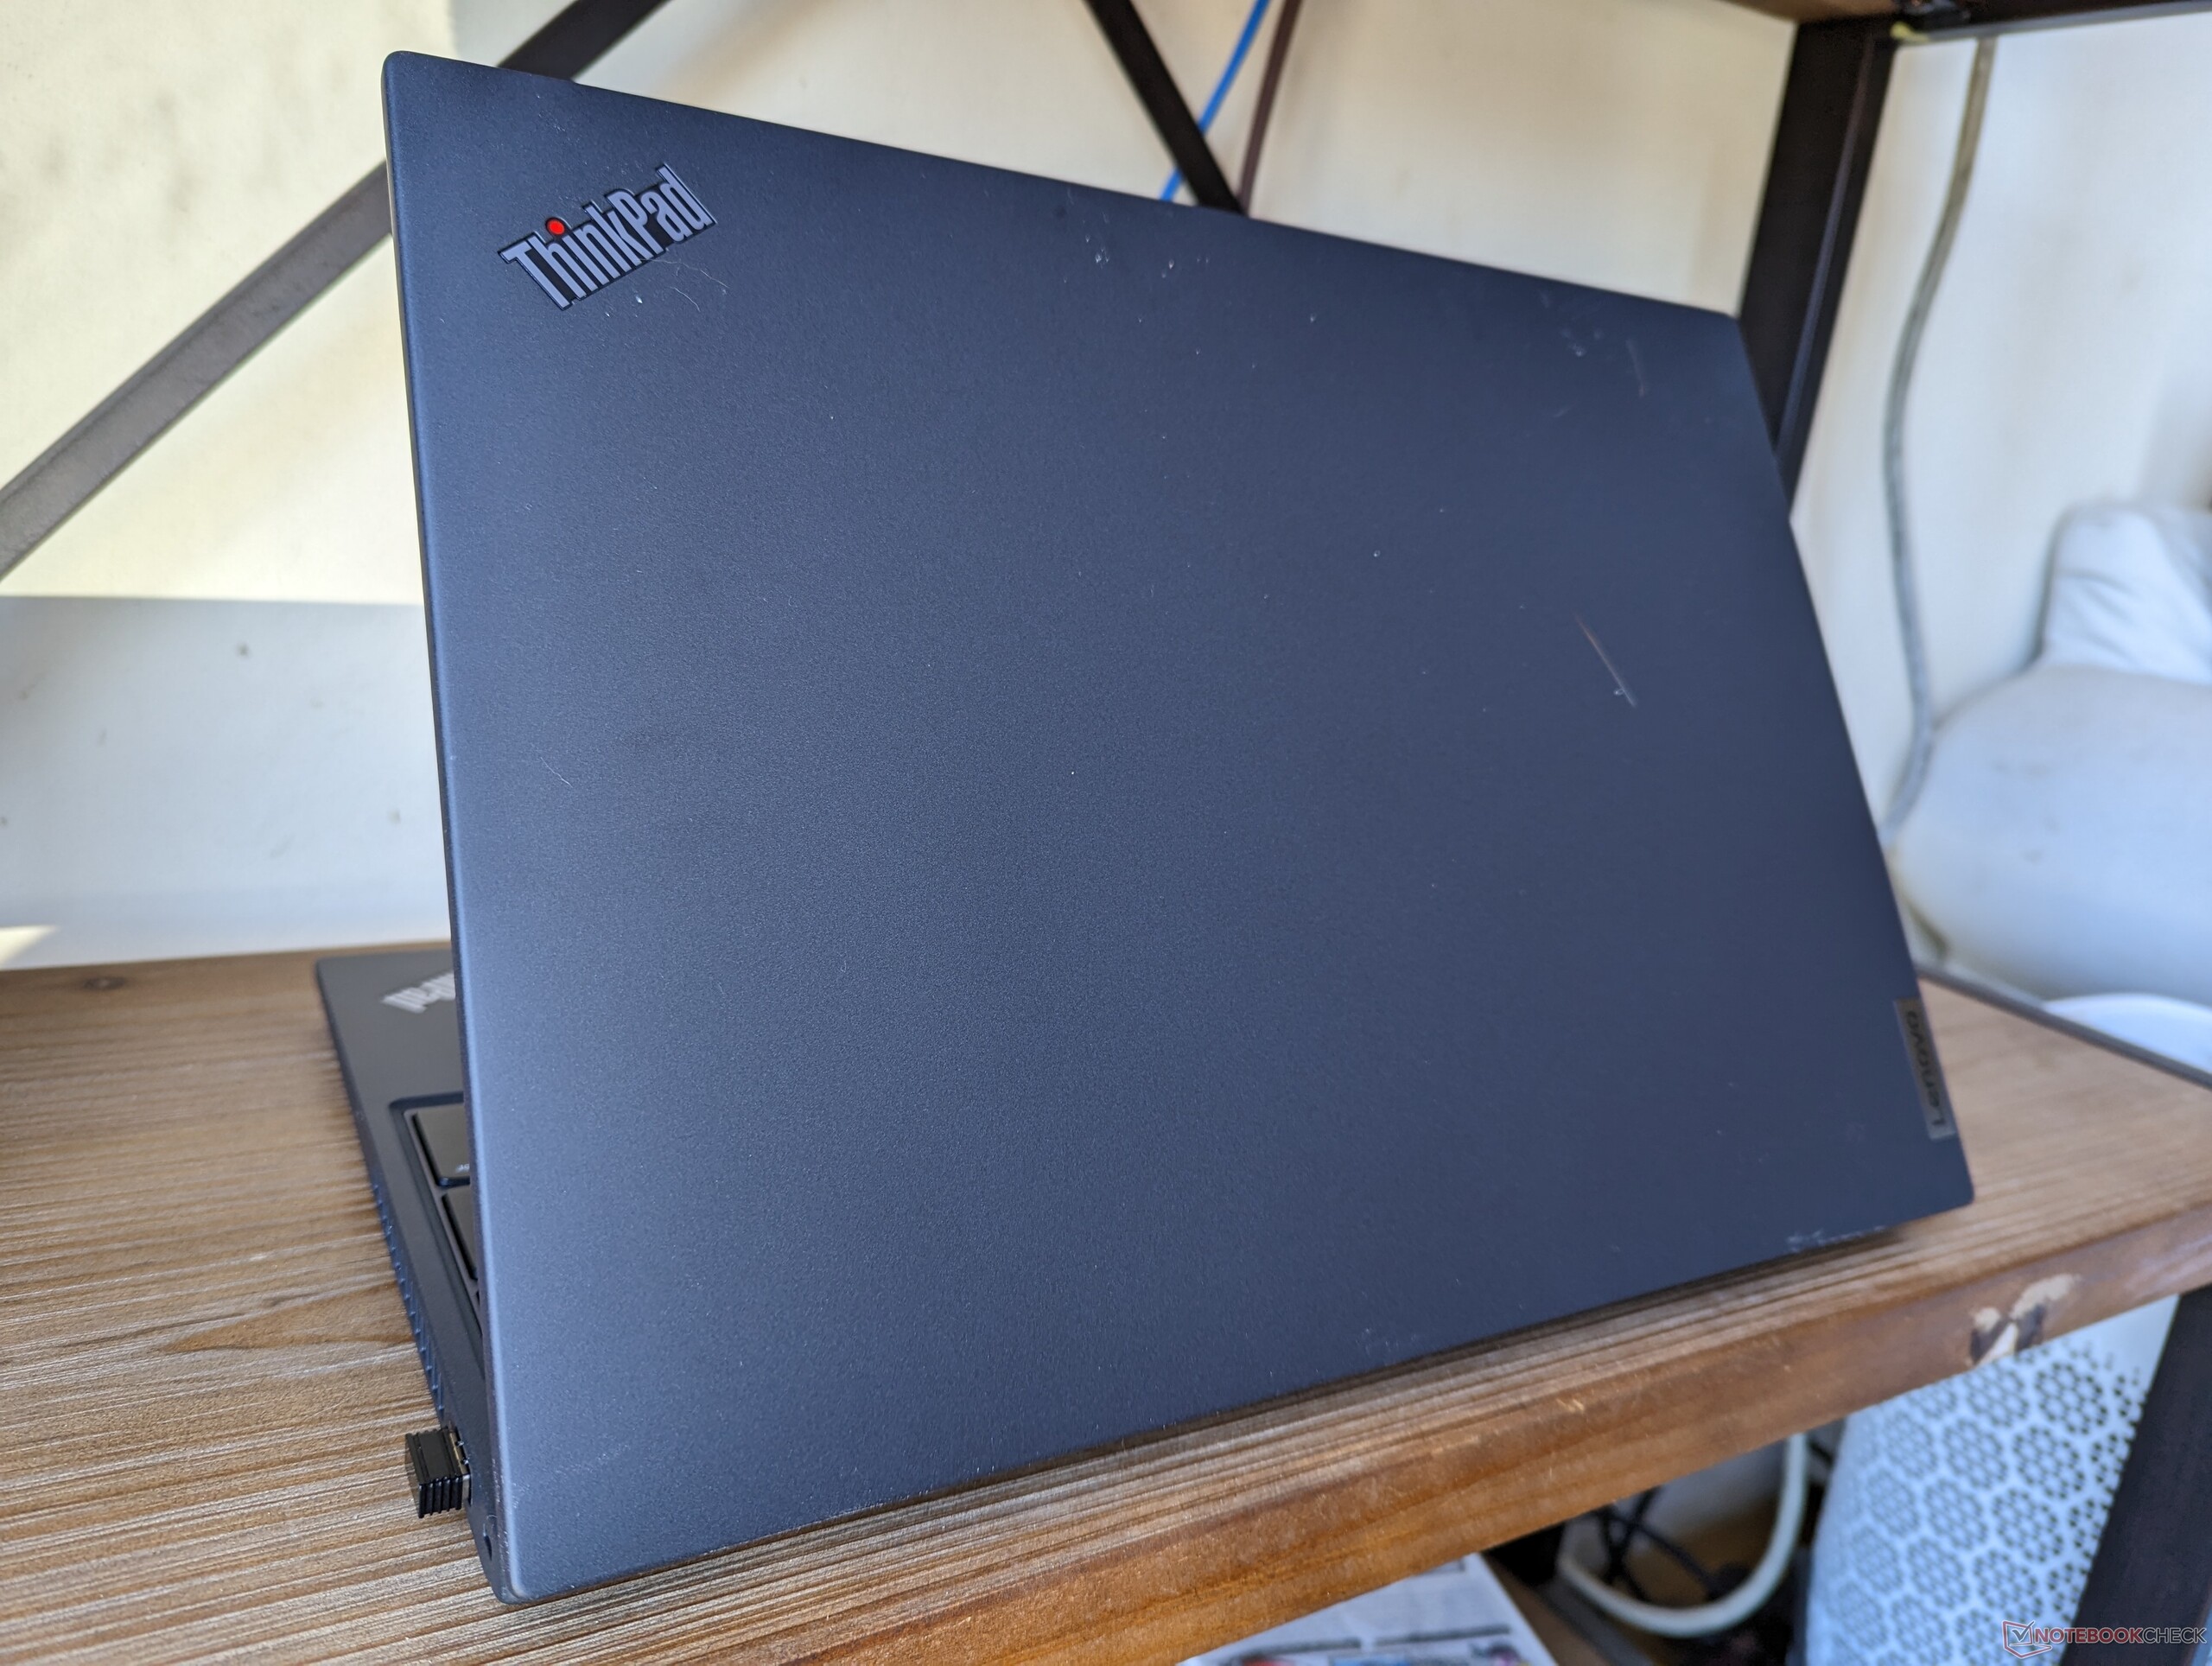
Auf den mattschwarzen Oberflächen können sich schnell Fett- und Fingerabdrücke ansammeln. Der dunkle Ansatz aus Kohlefaser, Glasfaser und Kunststoff steht im Gegensatz zu der hellgrauen Metalllegierung des konkurrierenden HP EliteBook.
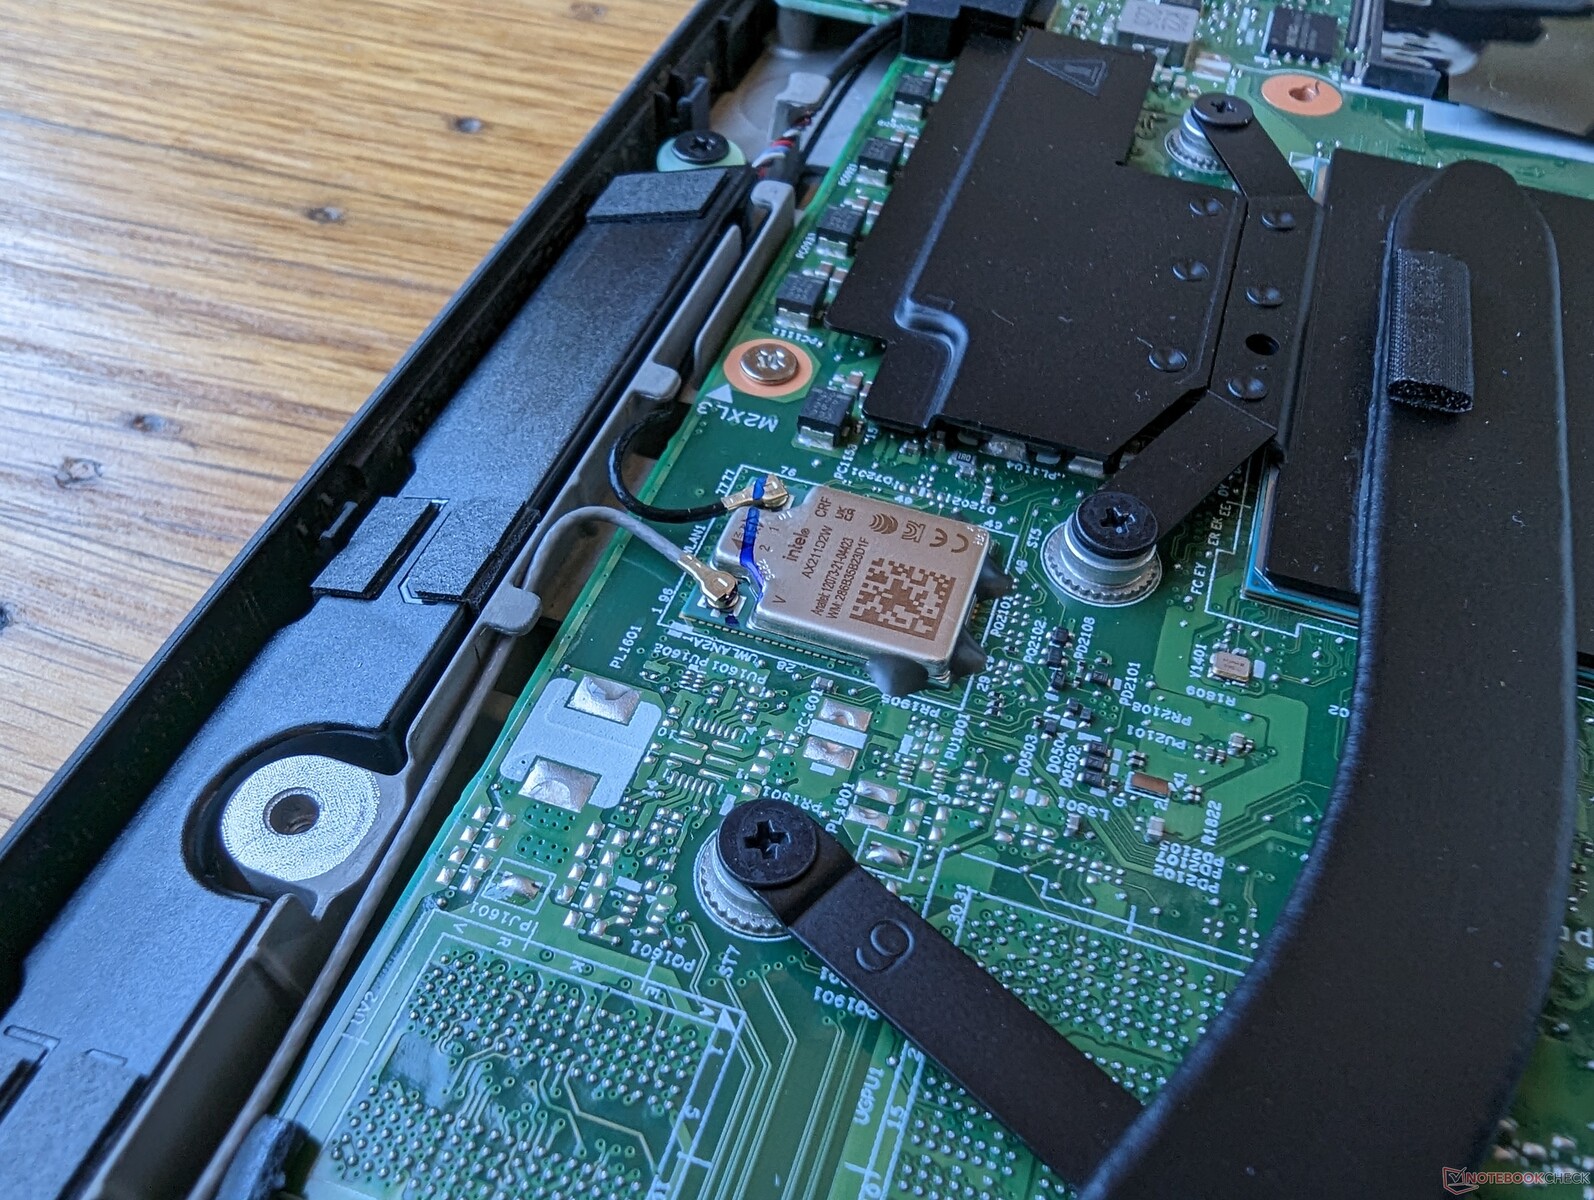
Kommunikation
Ein Intel AX211 kommt mit den standardmäßigen Anschlüssen für Bluetooth 5.2 und Wi-Fi 6E. Die Übertragungsraten sind in Koppelung mit unserem Testrouter Asus AXE11000 stabil.
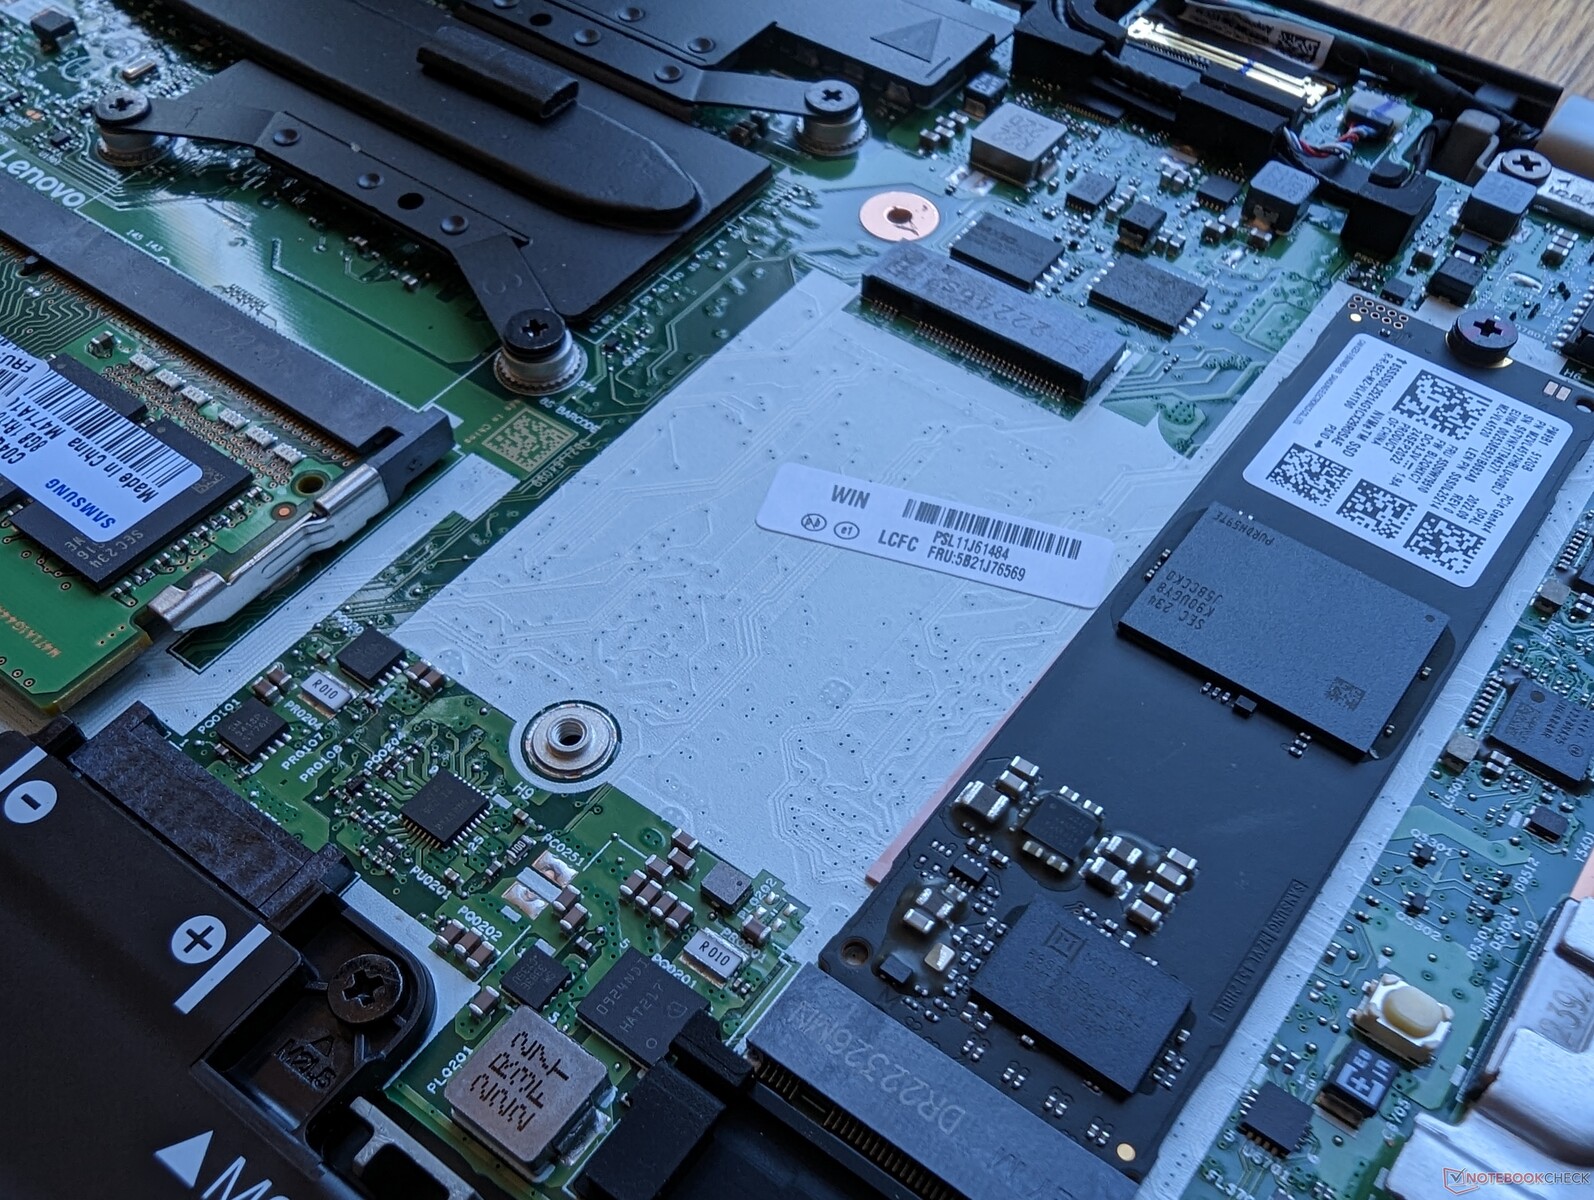
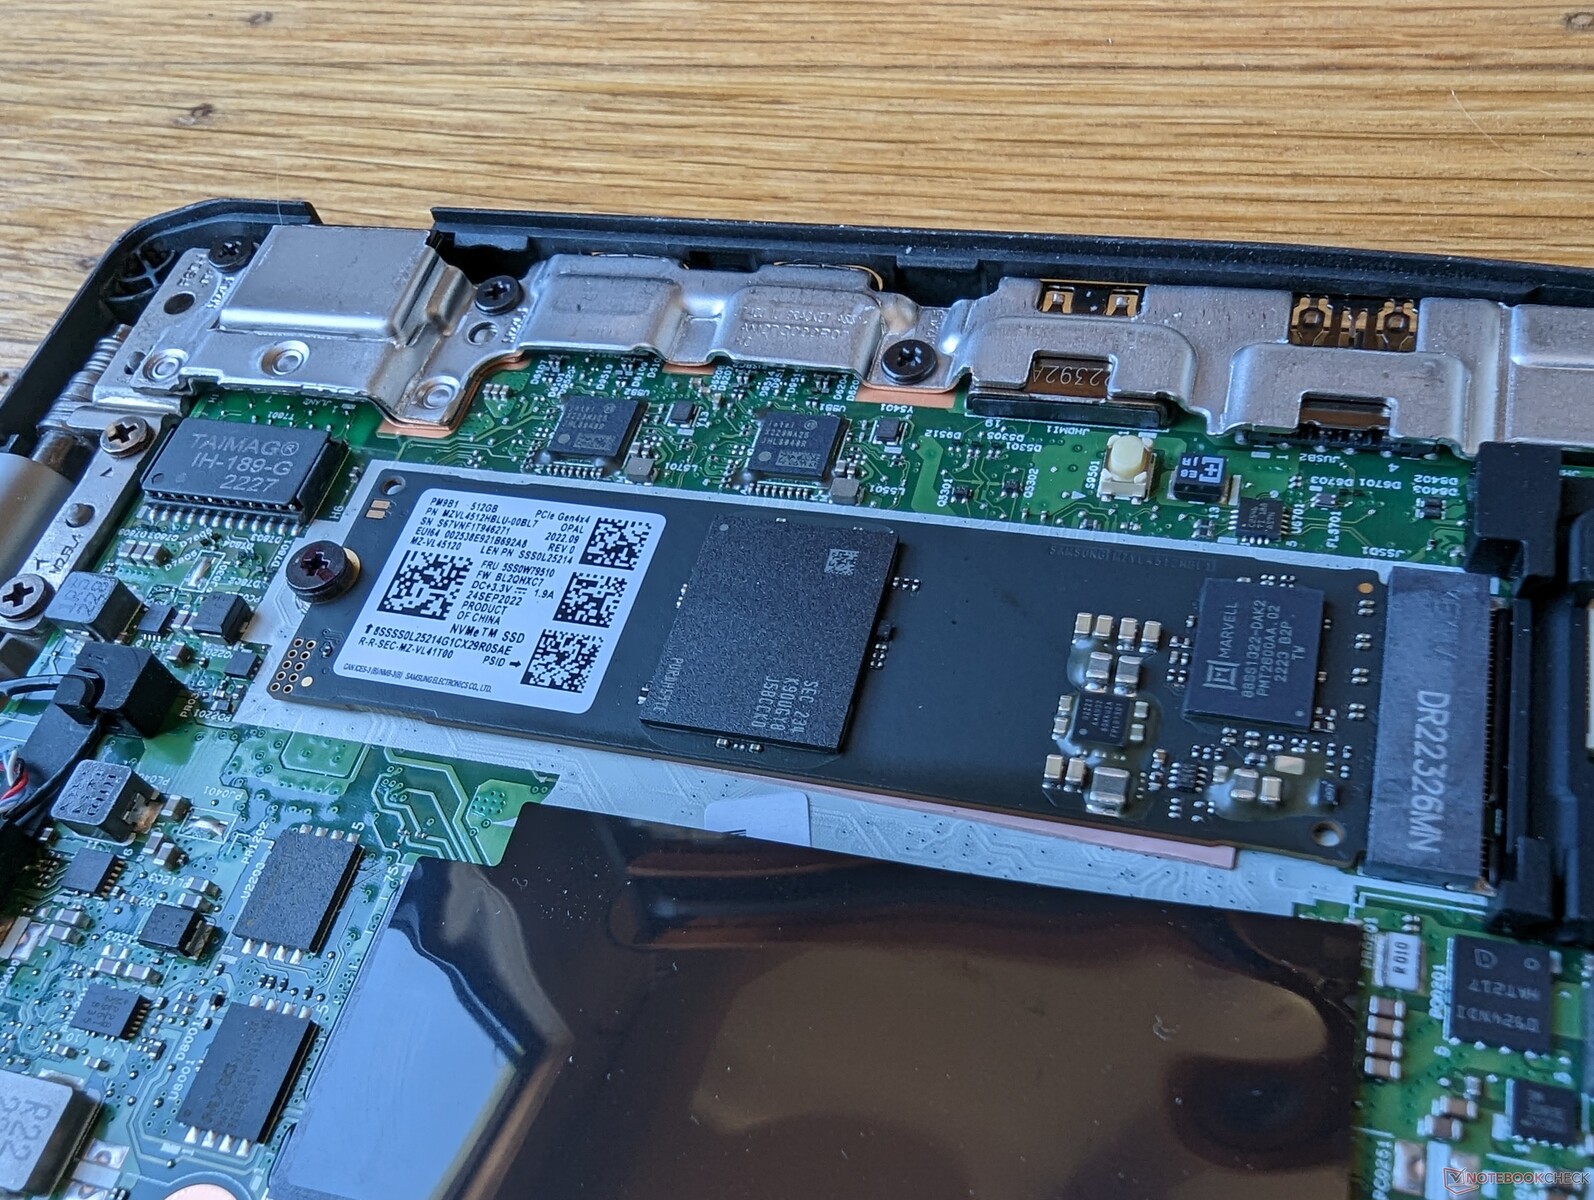
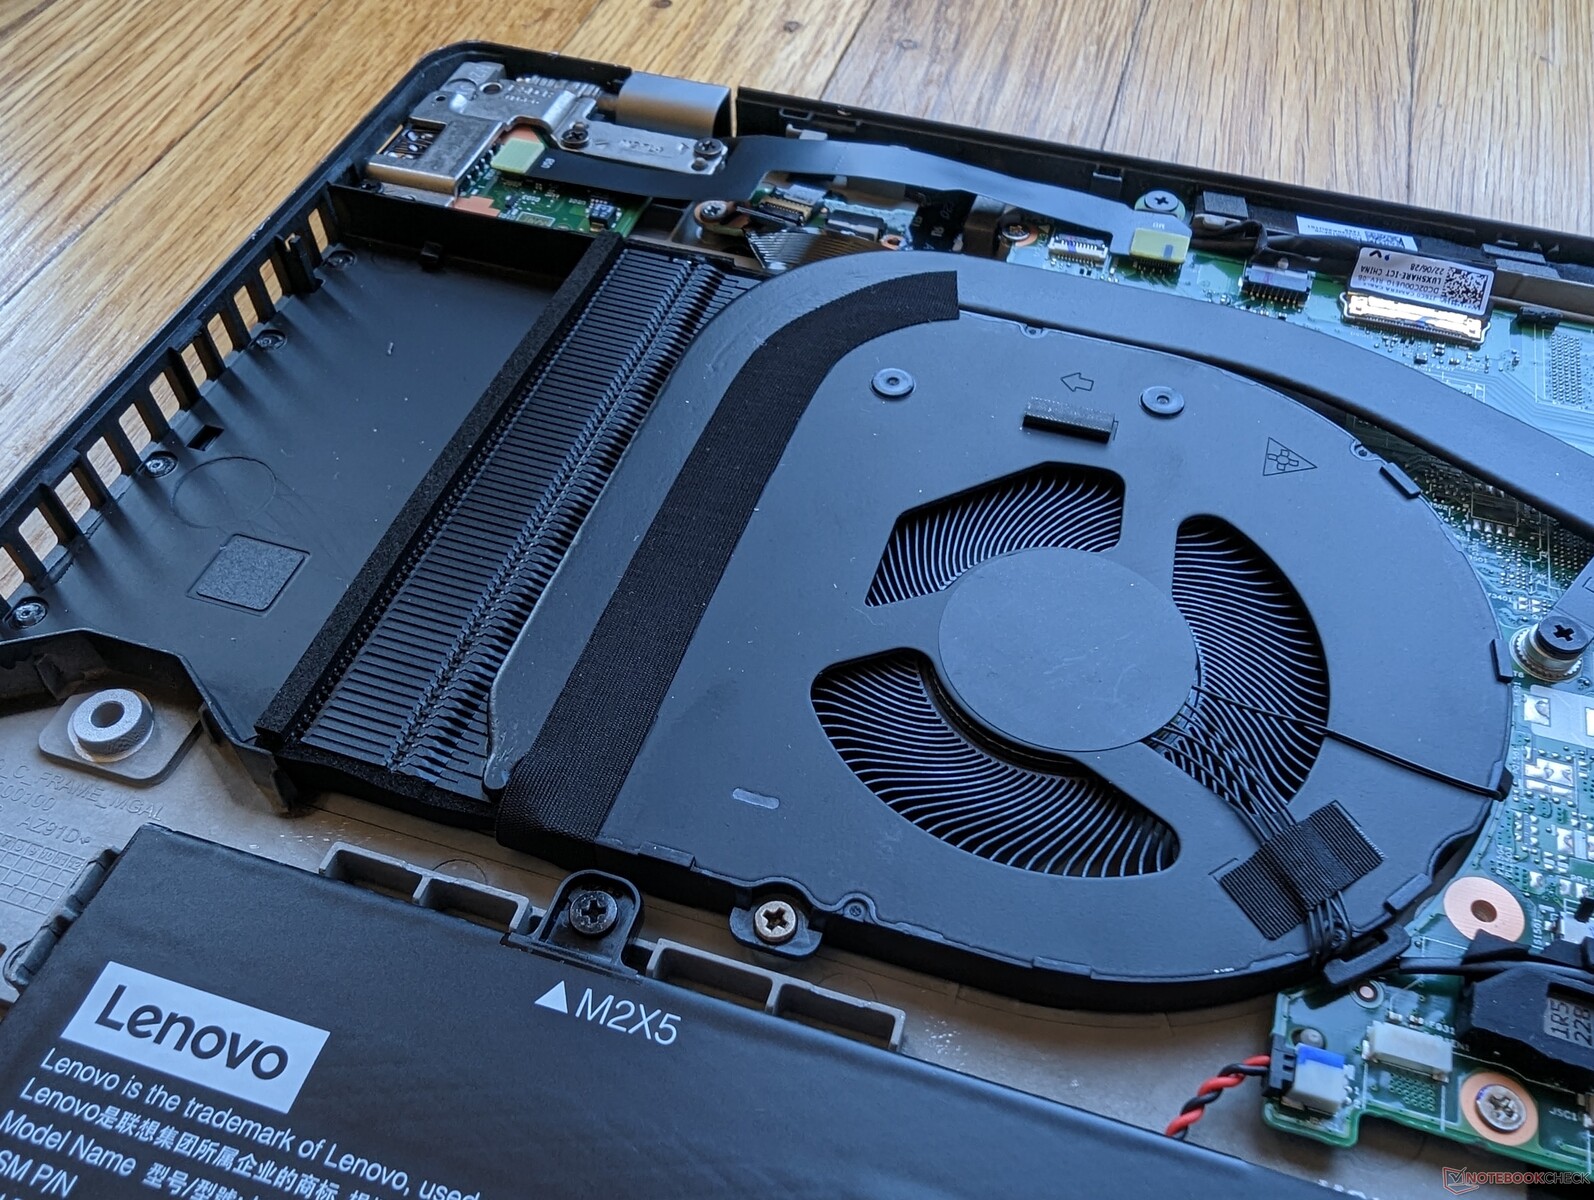
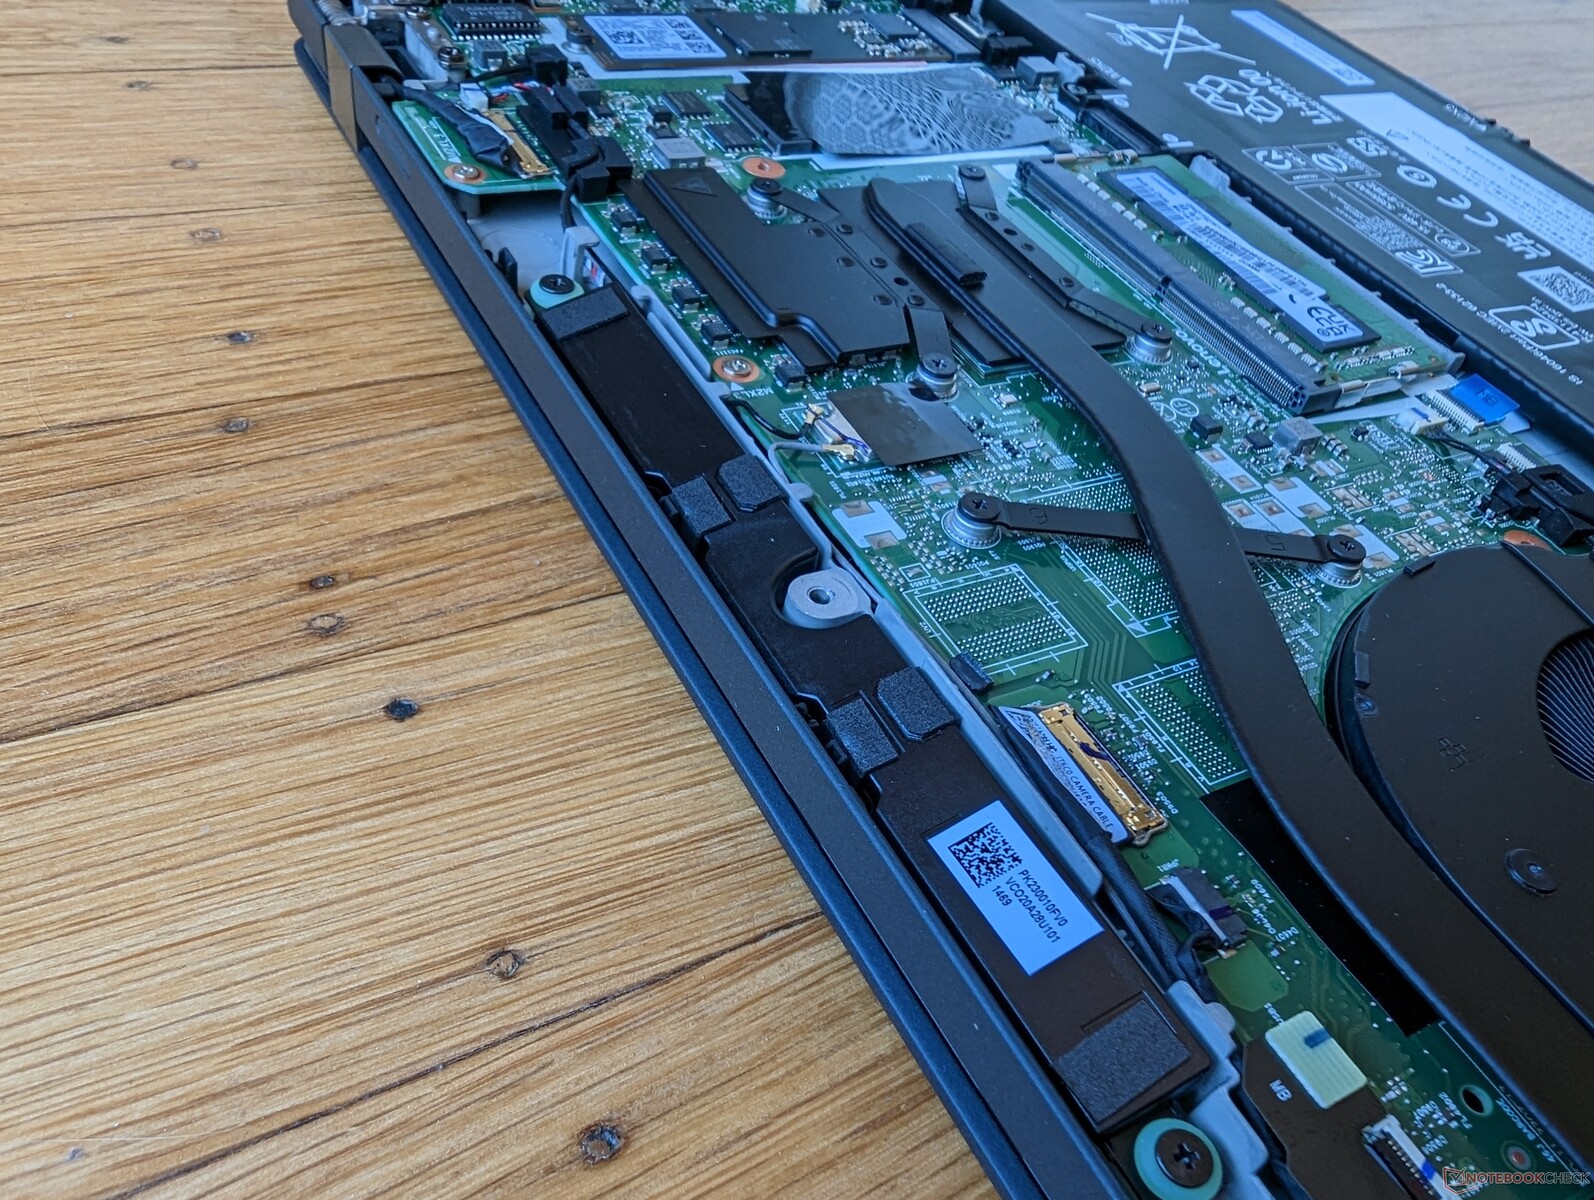
Der M.2-WWAN-Steckplatz ist in unserer speziellen Konfiguration leer, wie das Bild unten zeigt. Leider liefert Lenovo die Antenne nicht mit, wenn man das Gerät ohne WWAN konfiguriert.
| Networking | |
| iperf3 transmit AX12 | |
| Apple MacBook Pro 16 2021 M1 Pro | |
| iperf3 receive AX12 | |
| Apple MacBook Pro 16 2021 M1 Pro | |
| iperf3 receive AXE11000 6GHz | |
| Lenovo ThinkPad T16 G1 21CH004MGE | |
| Huawei MateBook 16s i7 | |
| Lenovo ThinkPad T16 Gen 1 Core i7-1270P | |
| iperf3 receive AXE11000 | |
| Lenovo ThinkPad T16 G1 21CH004MGE | |
| HP EliteBook 865 G9 | |
| LG Gram 16Z90Q | |
| Lenovo ThinkPad T16 Gen 1 Core i7-1270P | |
| Apple MacBook Pro 16 2021 M1 Pro | |
| iperf3 transmit AXE11000 | |
| Lenovo ThinkPad T16 G1 21CH004MGE | |
| HP EliteBook 865 G9 | |
| LG Gram 16Z90Q | |
| Lenovo ThinkPad T16 Gen 1 Core i7-1270P | |
| Apple MacBook Pro 16 2021 M1 Pro | |
| iperf3 transmit AXE11000 6GHz | |
| Lenovo ThinkPad T16 G1 21CH004MGE | |
| Huawei MateBook 16s i7 | |
| Lenovo ThinkPad T16 Gen 1 Core i7-1270P | |
Webcam
Die 2-MP-Webcam verblasst im Vergleich zu den 5-MP-Webcams, die jetzt bei vielen HP EliteBook Modelle integriert sind. Das ThinkPad T16 verfügt sowohl über IR-Sensor als auch über eine physische Kamerablende.


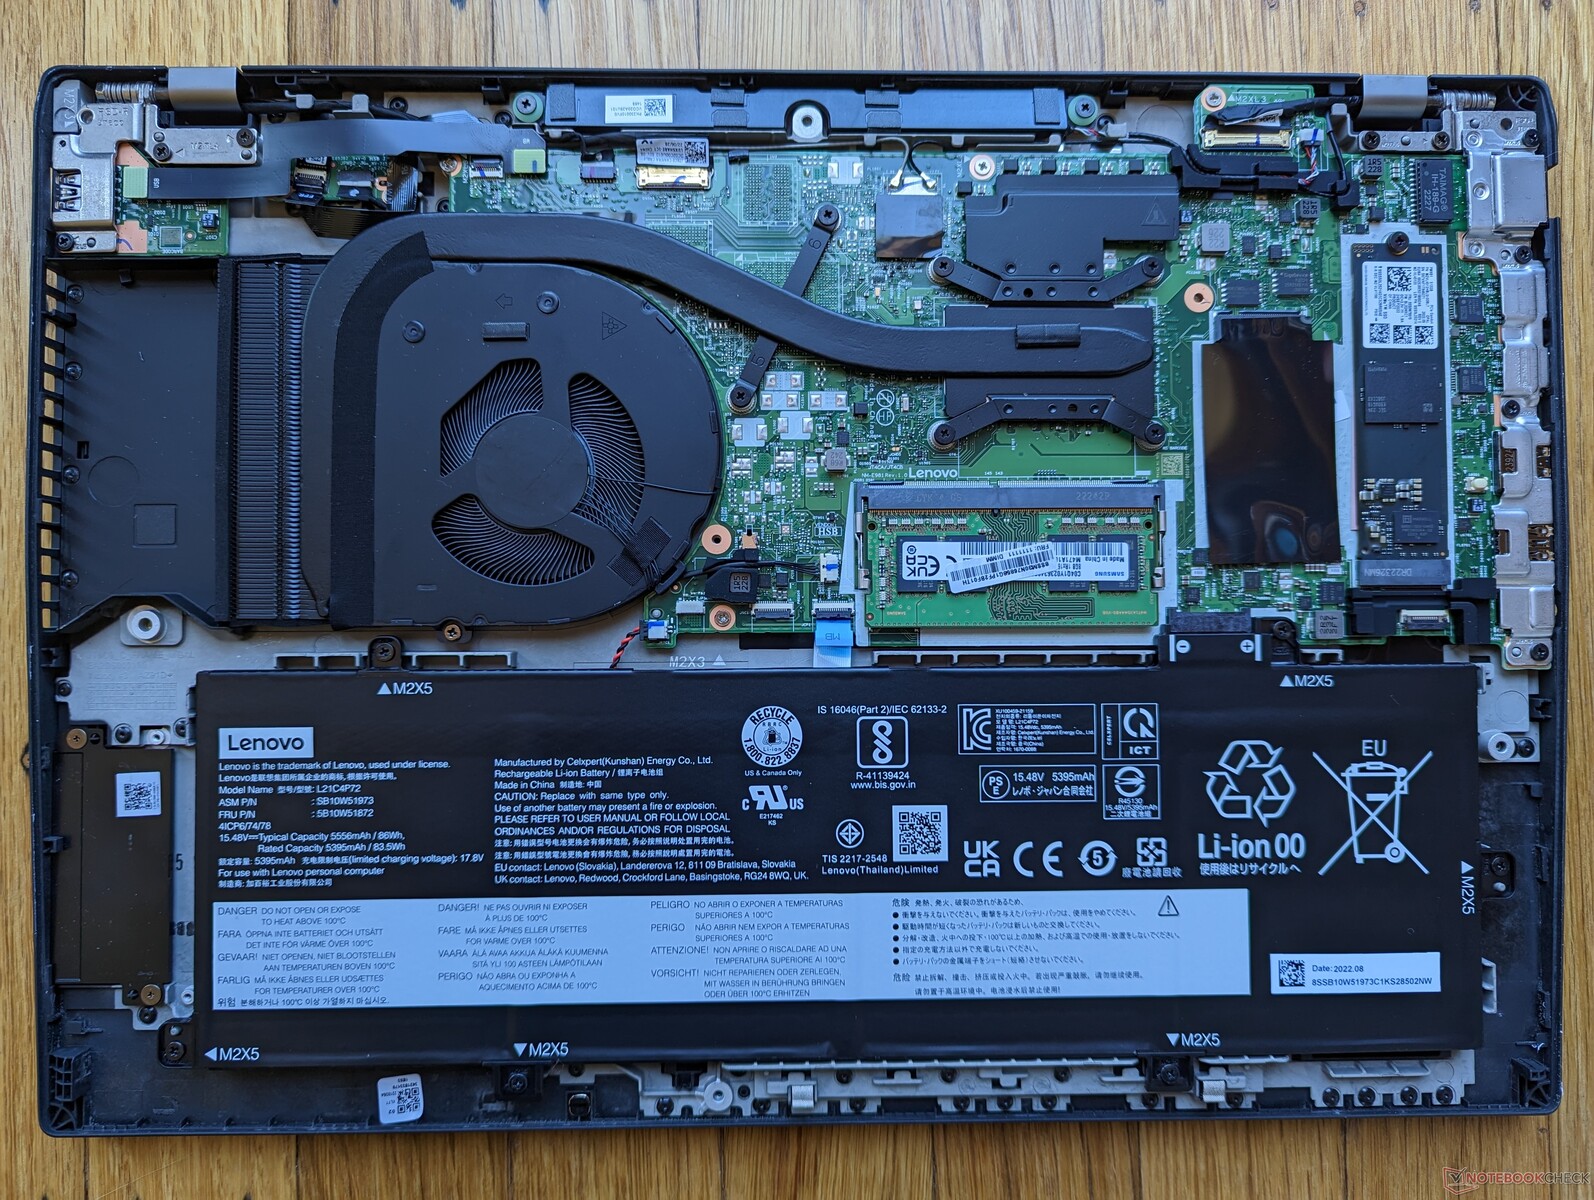
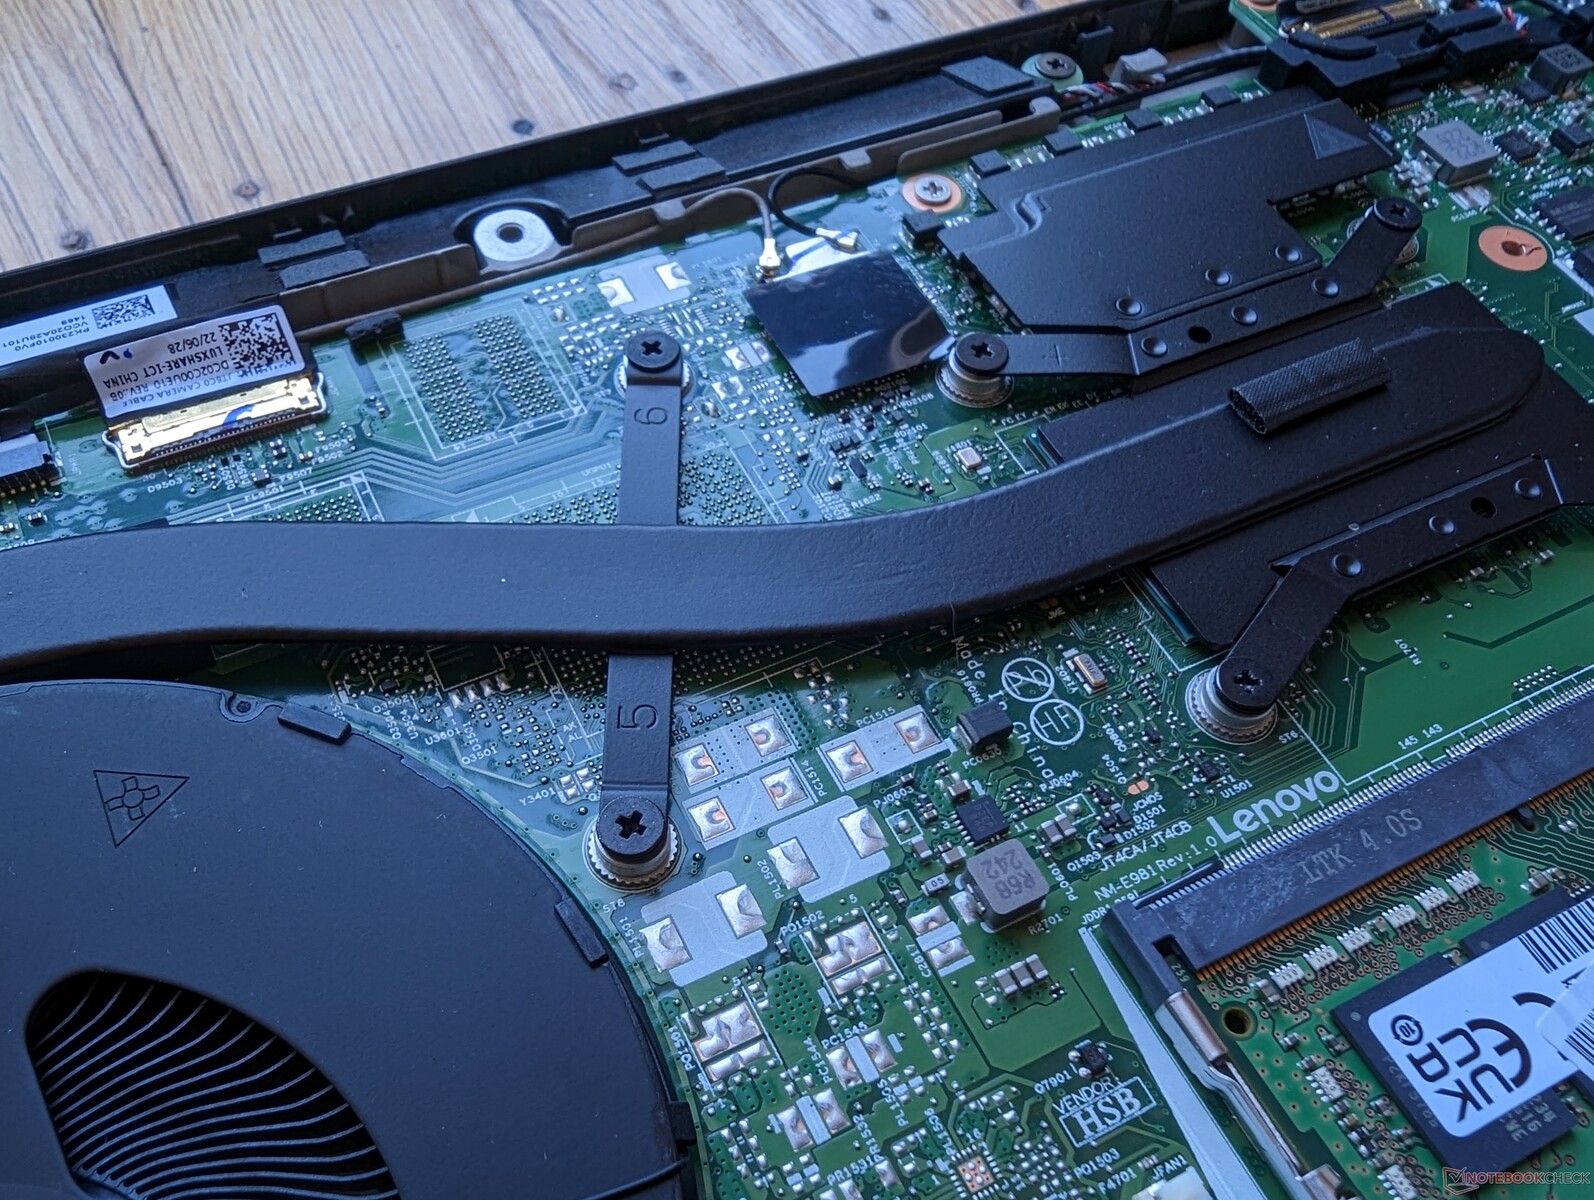
Wartung
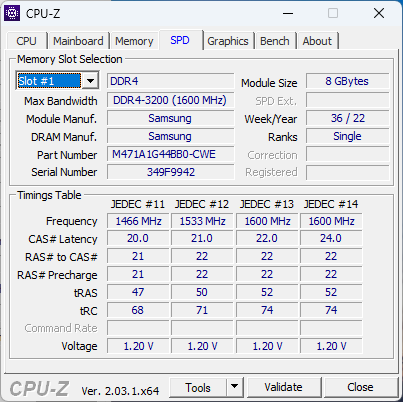
Die Unterseite ist mit acht Kreuzschlitzschrauben befestigt, was eine Wartung leicht macht. Beachten Sie, dass das Modell mit 8 GB gelötetem Arbeitsspeicher und einem SODIMM-Steckplatz zur Erweiterung ausgestattet ist, während die meisten anderen Laptops ausschließlich gelöteten Arbeitsspeicher oder 2 SODIMMs verwenden. Bestimmte SKUs können stattdessen mit 16 GB verlötetem RAM ausgestattet sein.
Zubehör und Garantie
In der Verpackung befinden sich außer dem Netzadapter und den Unterlagen keine weiteren Extras.
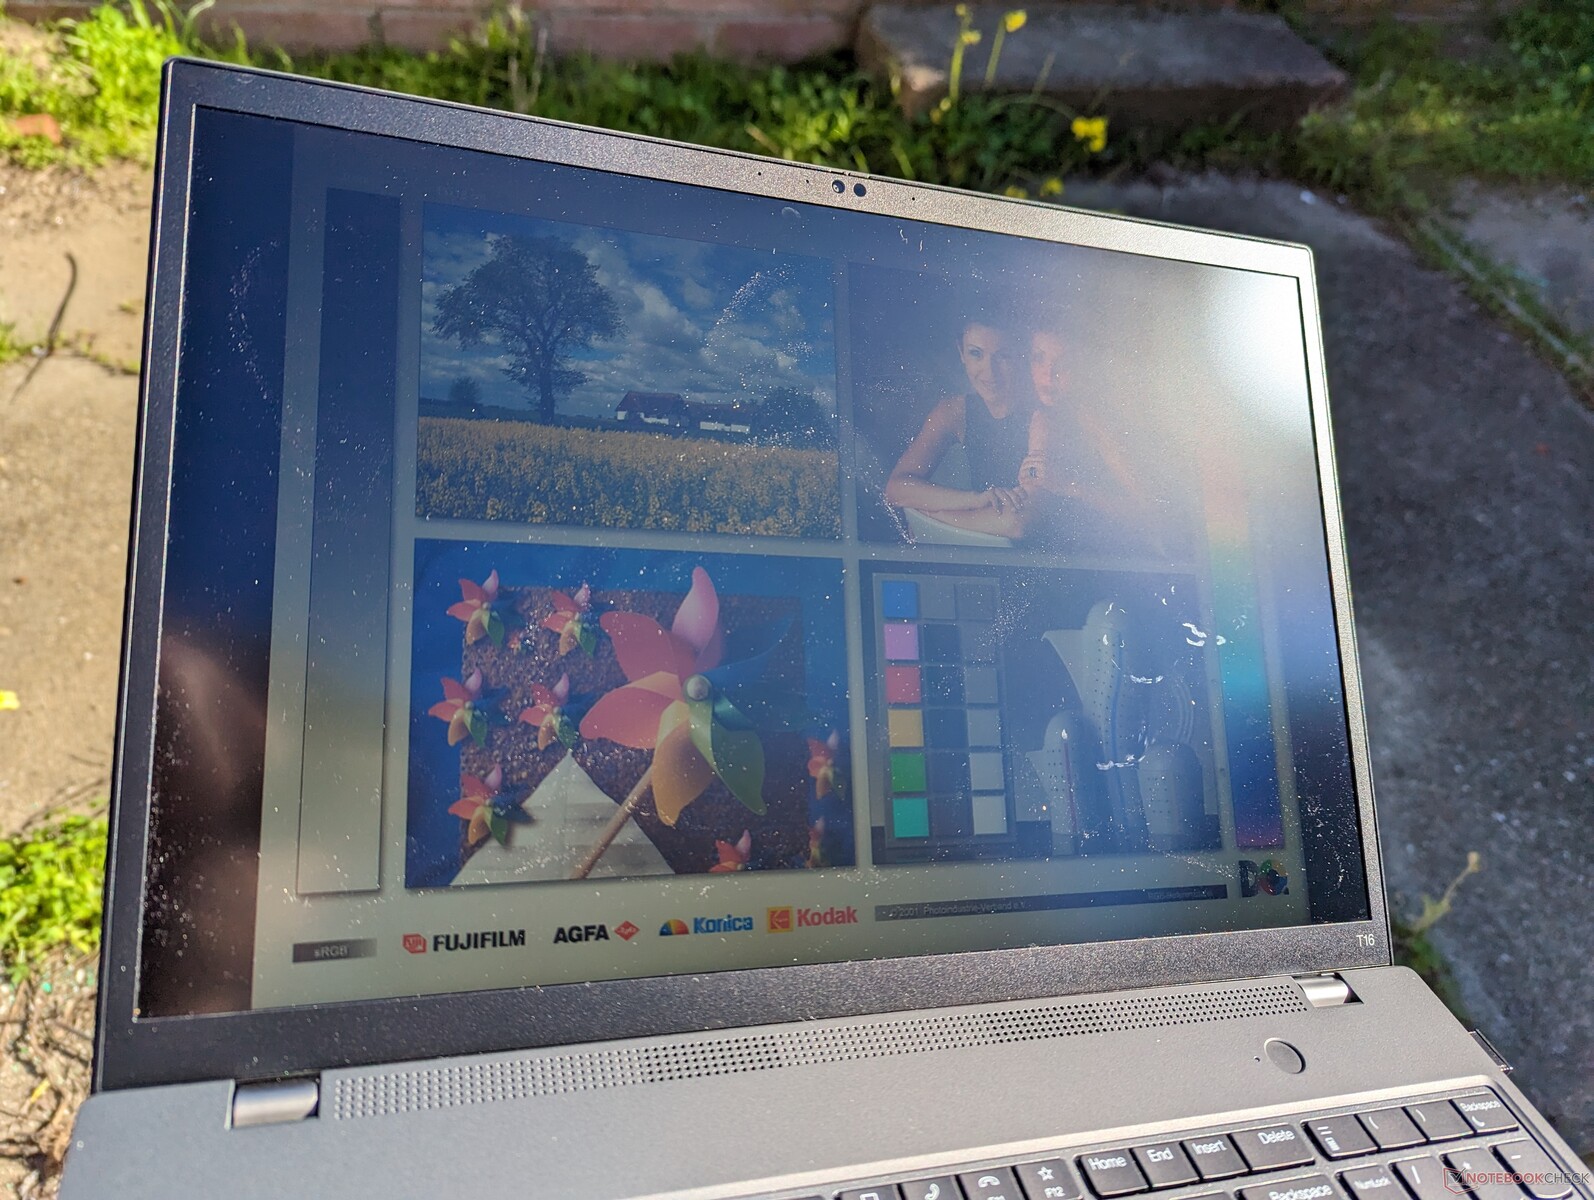
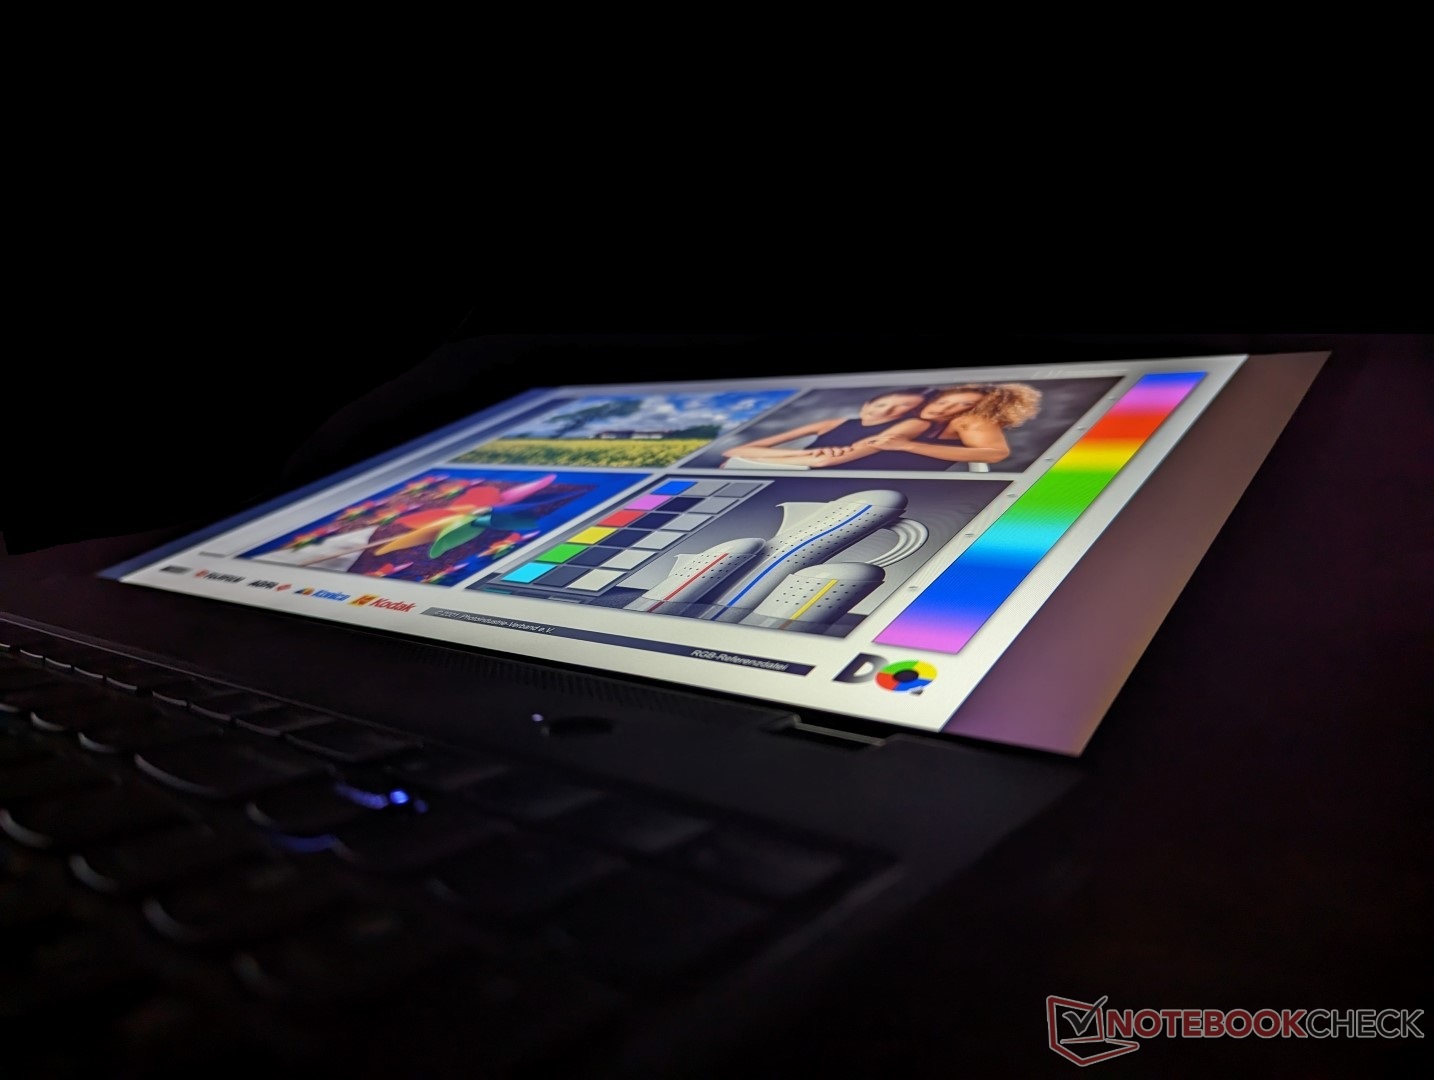
Display - Low-End bis High-End
Lenovo bietet derzeit fünf verschiedene Optionen für matte IPS-Displays an:
- 1920 x 1200, 300 nits, 45% NTSC
- 1920 x 1200, 300 nits, Touchscreen, 45 % NTSC
- 1920 x 1200, niedriger Stromverbrauch, 400 nits, 100% sRGB, low blue light
- 1920 x 1200, Touchscreen mit Privacy Guard, 500 nits, 100 % sRGB, low blue light
- 2560 x 1600, 400 nits, low blue light, kalibriert
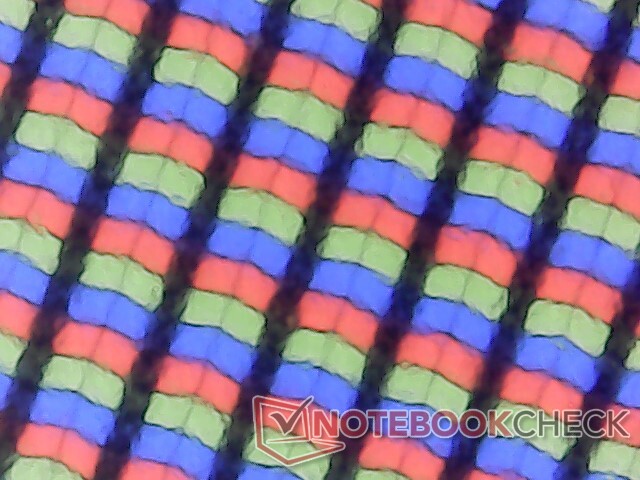
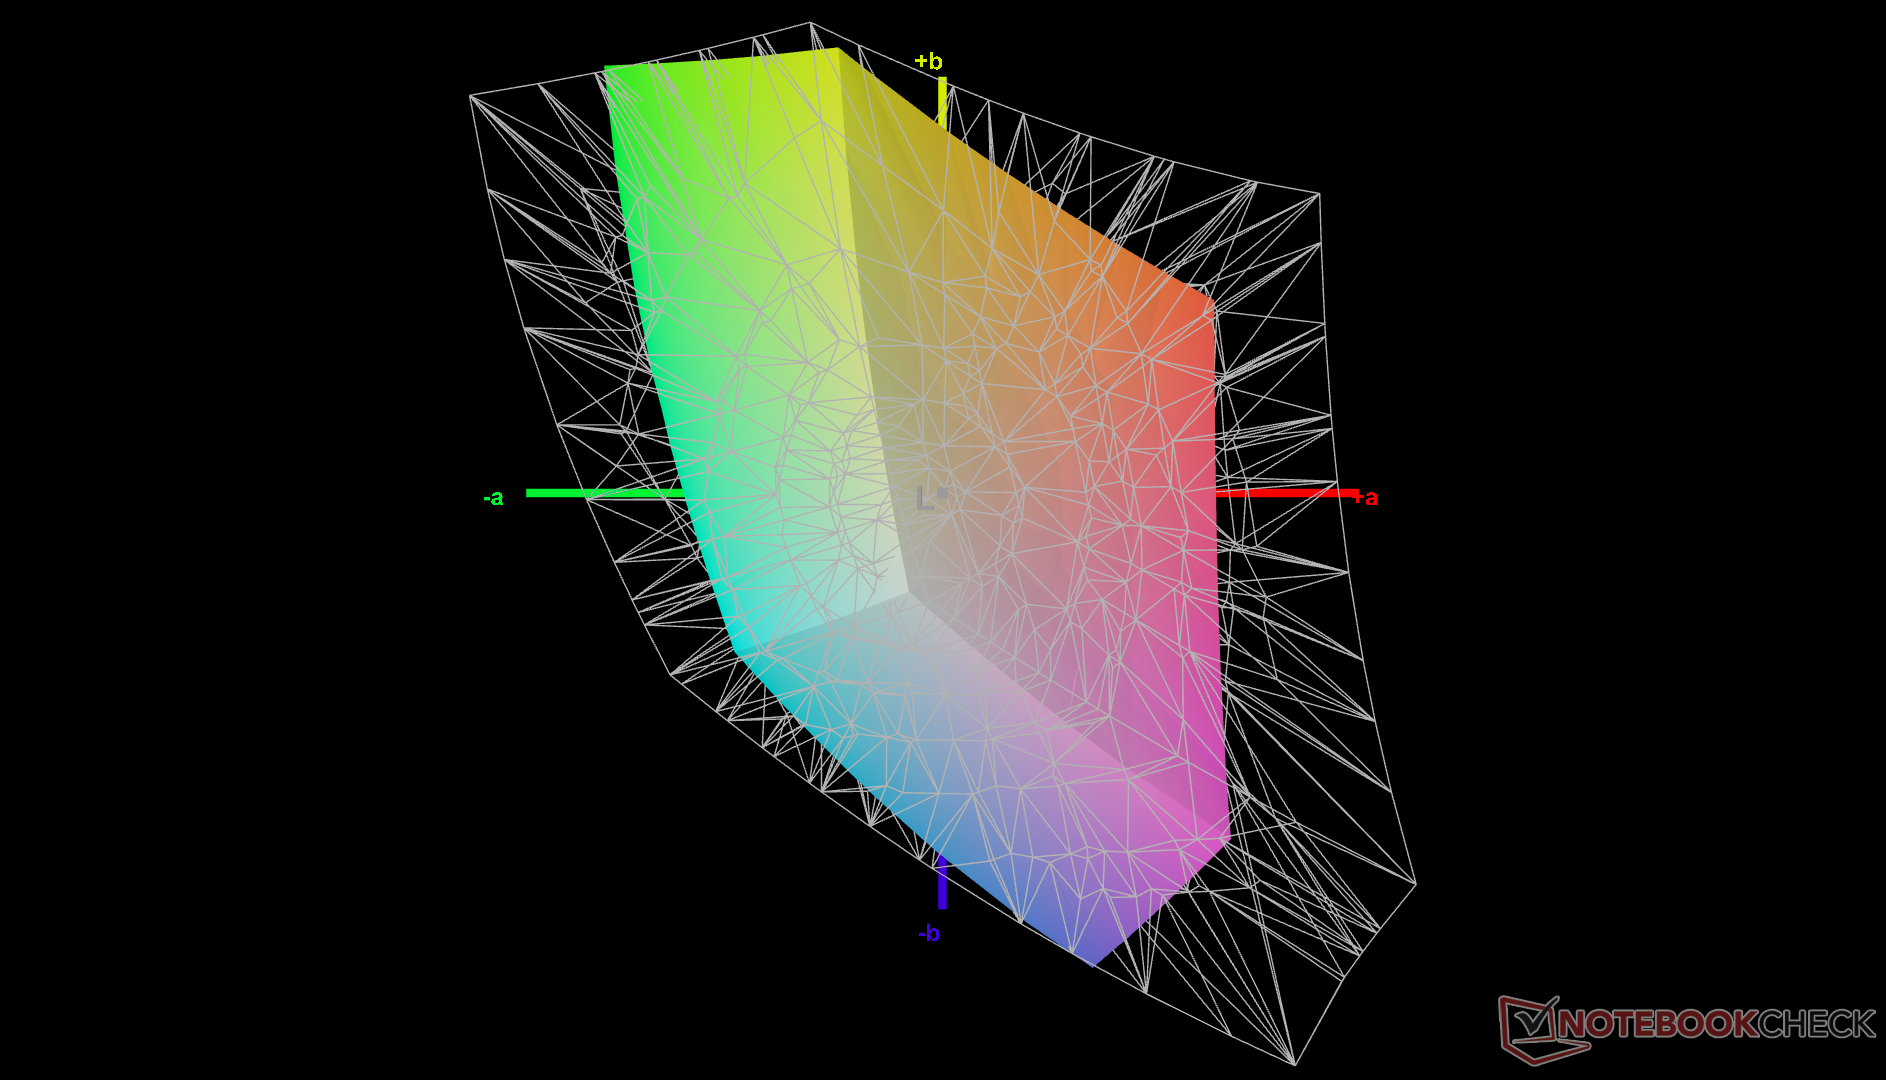
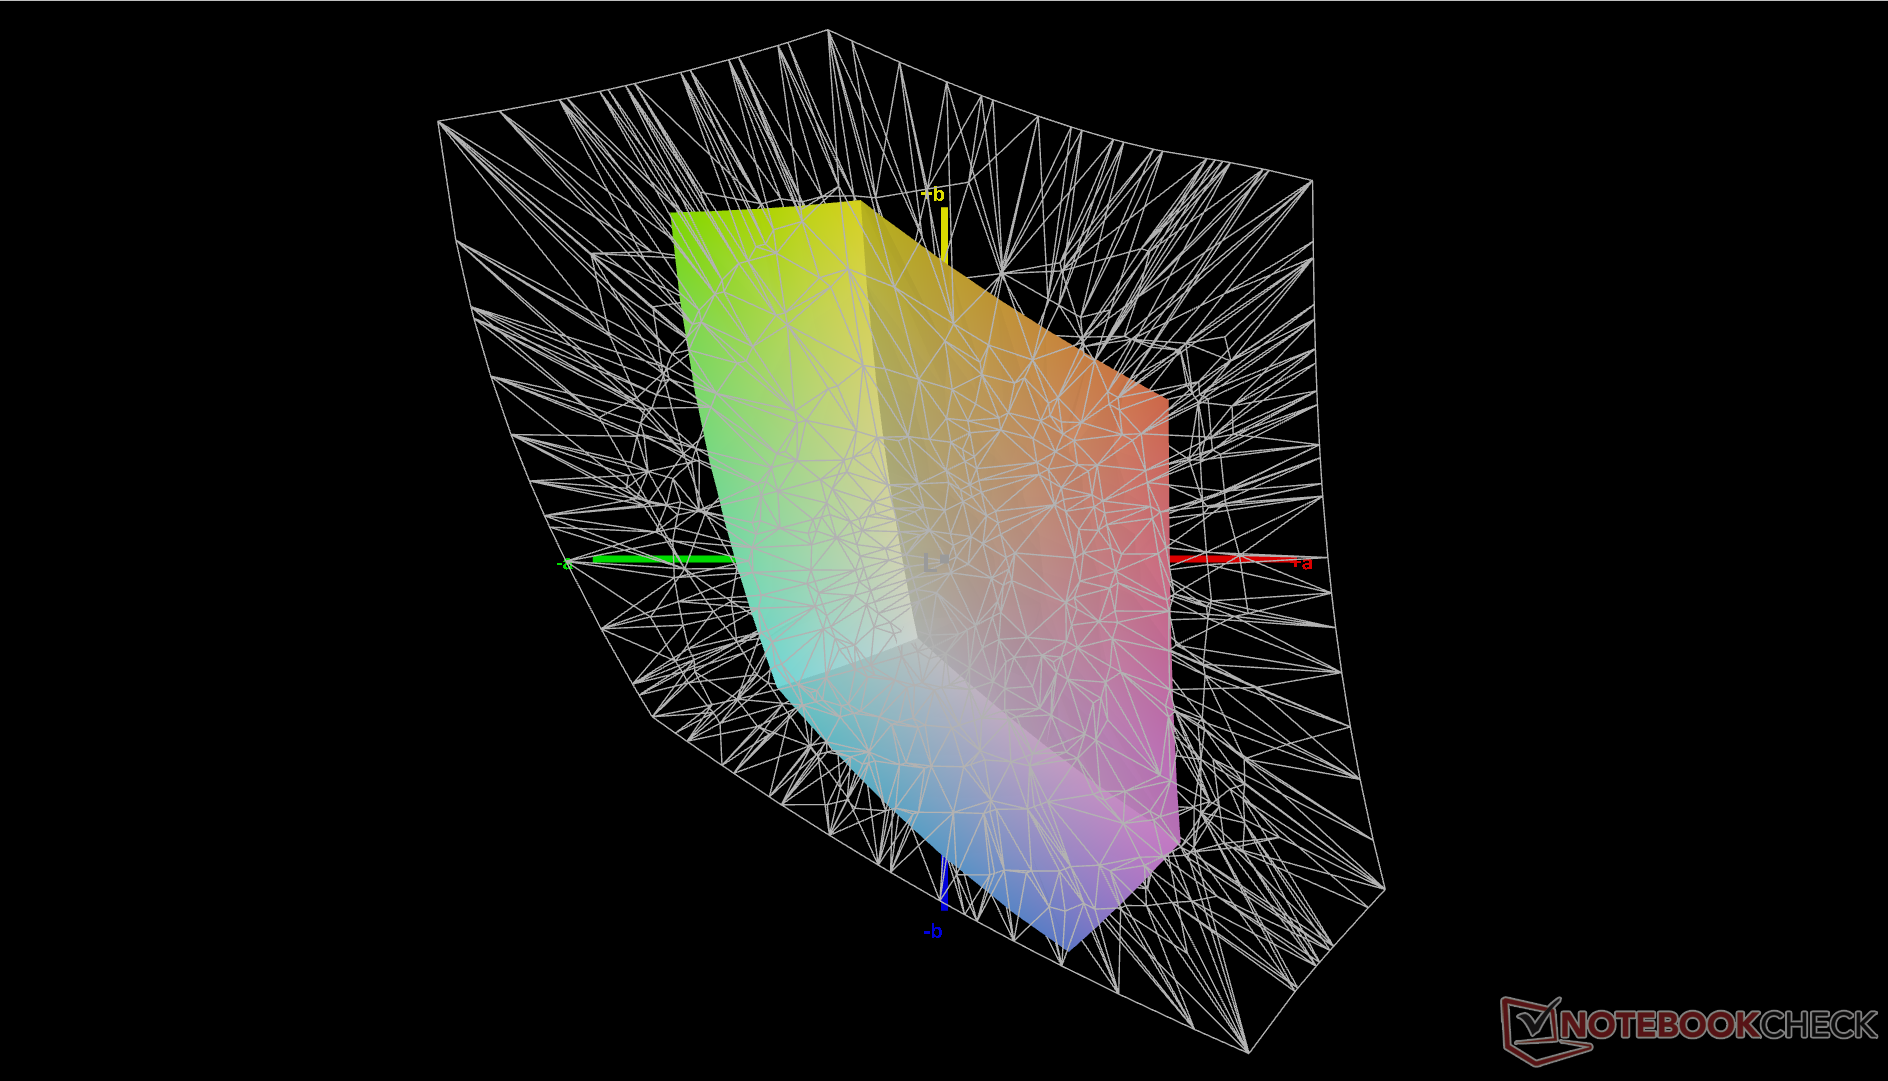
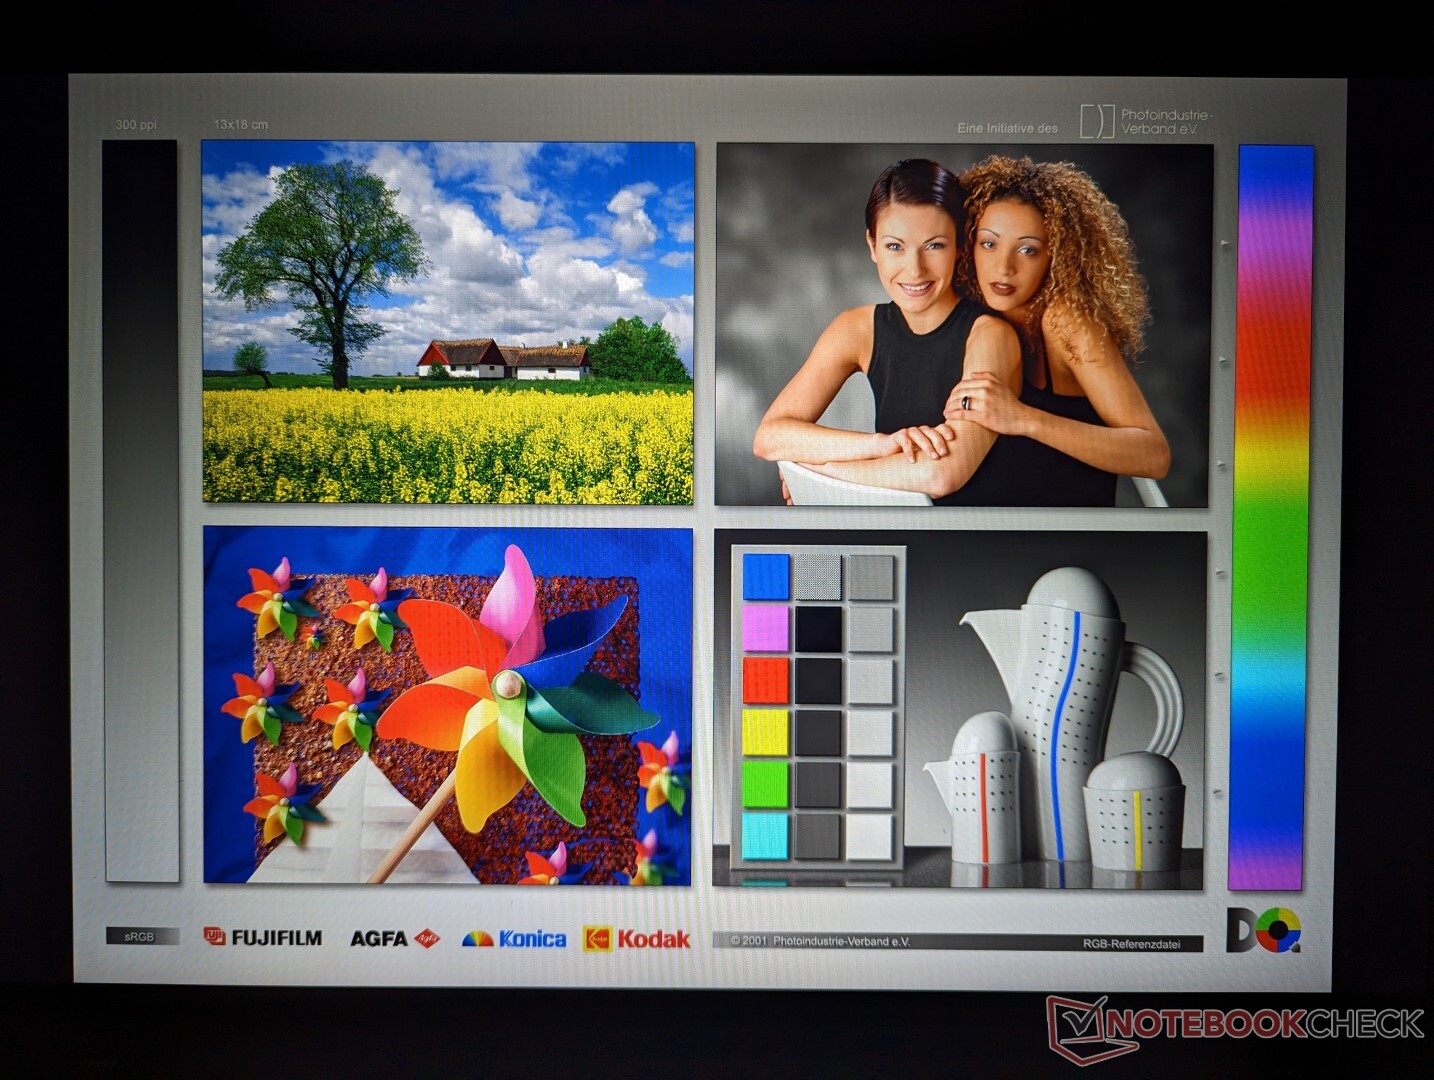
Unsere Konfiguration ist mit dem B160UAN03.2-Panel (fettgedruckt) ausgestattet, was die preiswerteste Option darstellt. Im Vergleich zu dem höherwertigen 1600p-Panel hat unser 1200p-Panel sowohl bei den Farben als auch bei der Schärfe deutliche Defizite. Es ist aber immer noch ein anständiges Display, vor allem im Vergleich zu anderen Panels mit einer ähnlichen 60-prozentigen sRGB-Abdeckung. Für jegliche Art von Video- oder Grafikbearbeitung sollten Sie allerdings eine Displayoption mit voller sRGB-Abdeckung wählen.


| |||||||||||||||||||||||||
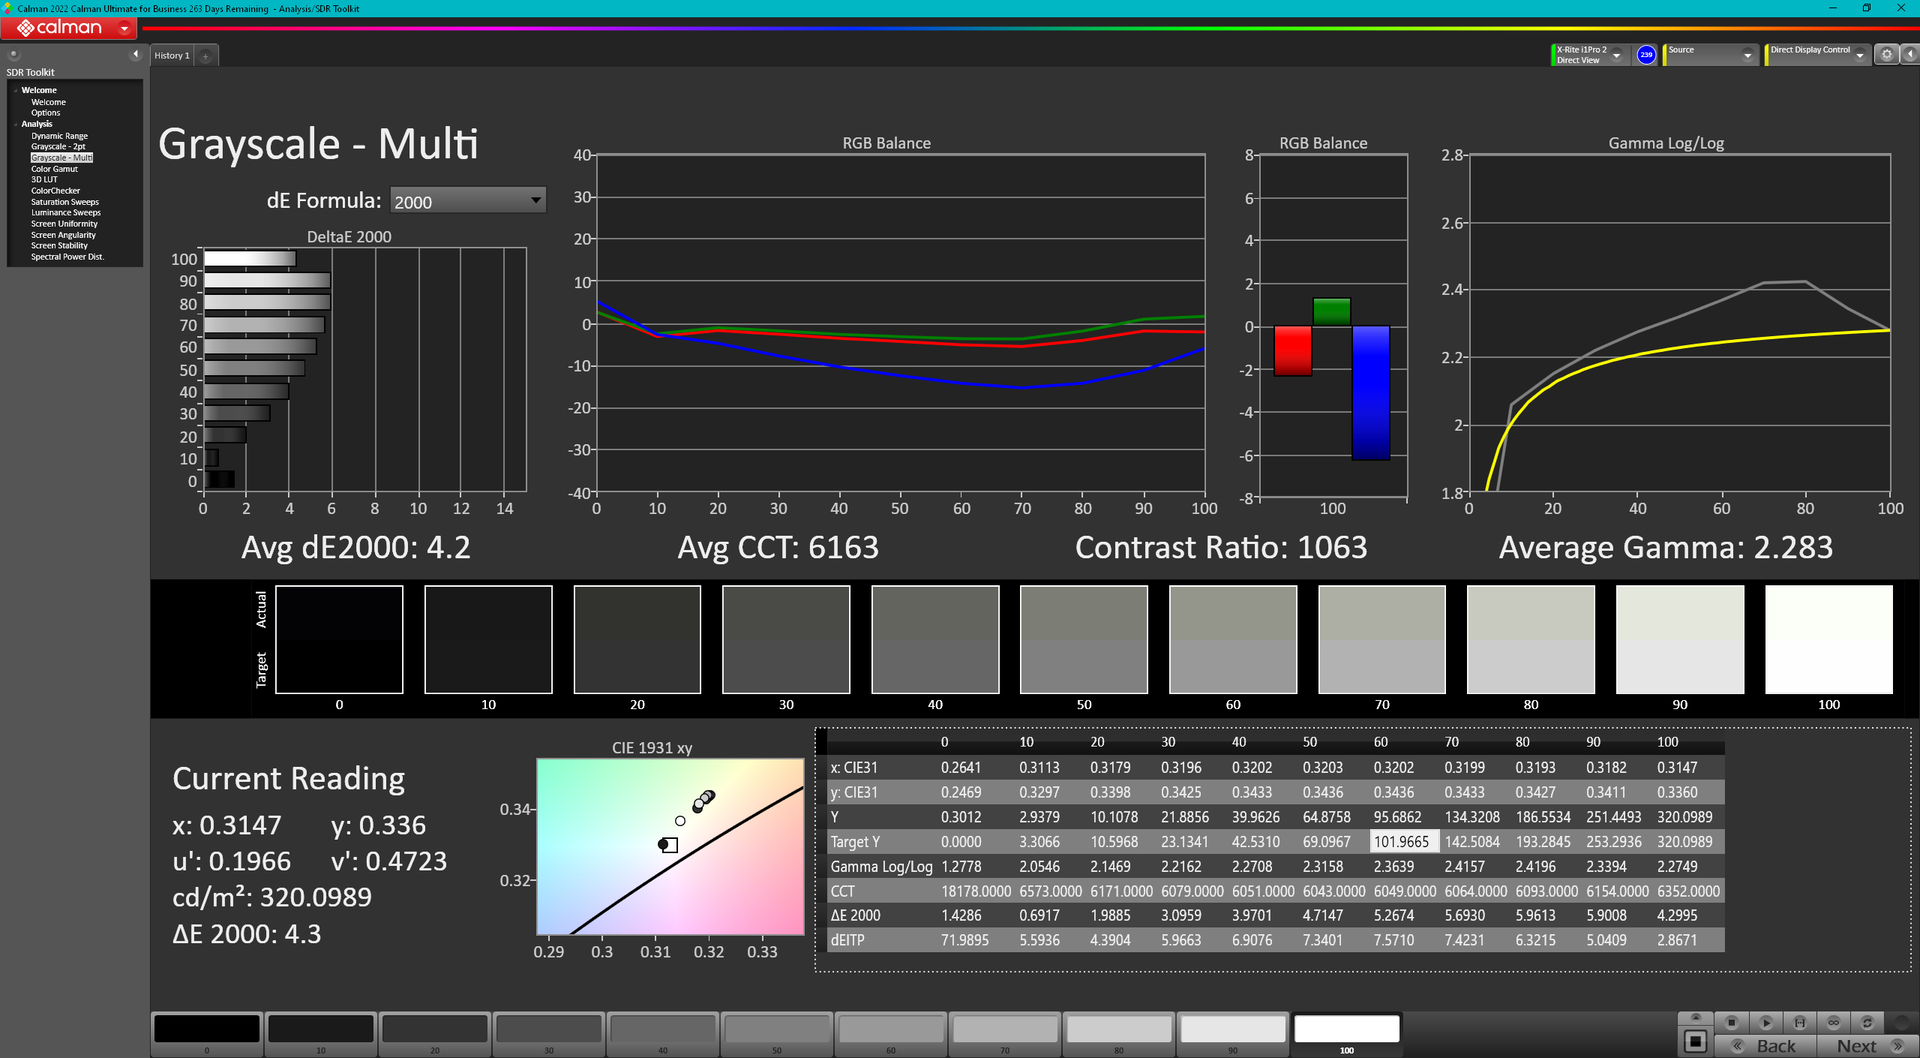
Ausleuchtung: 82 %
Helligkeit Akku: 321.3 cd/m²
Kontrast: 1036:1 (Schwarzwert: 0.31 cd/m²)
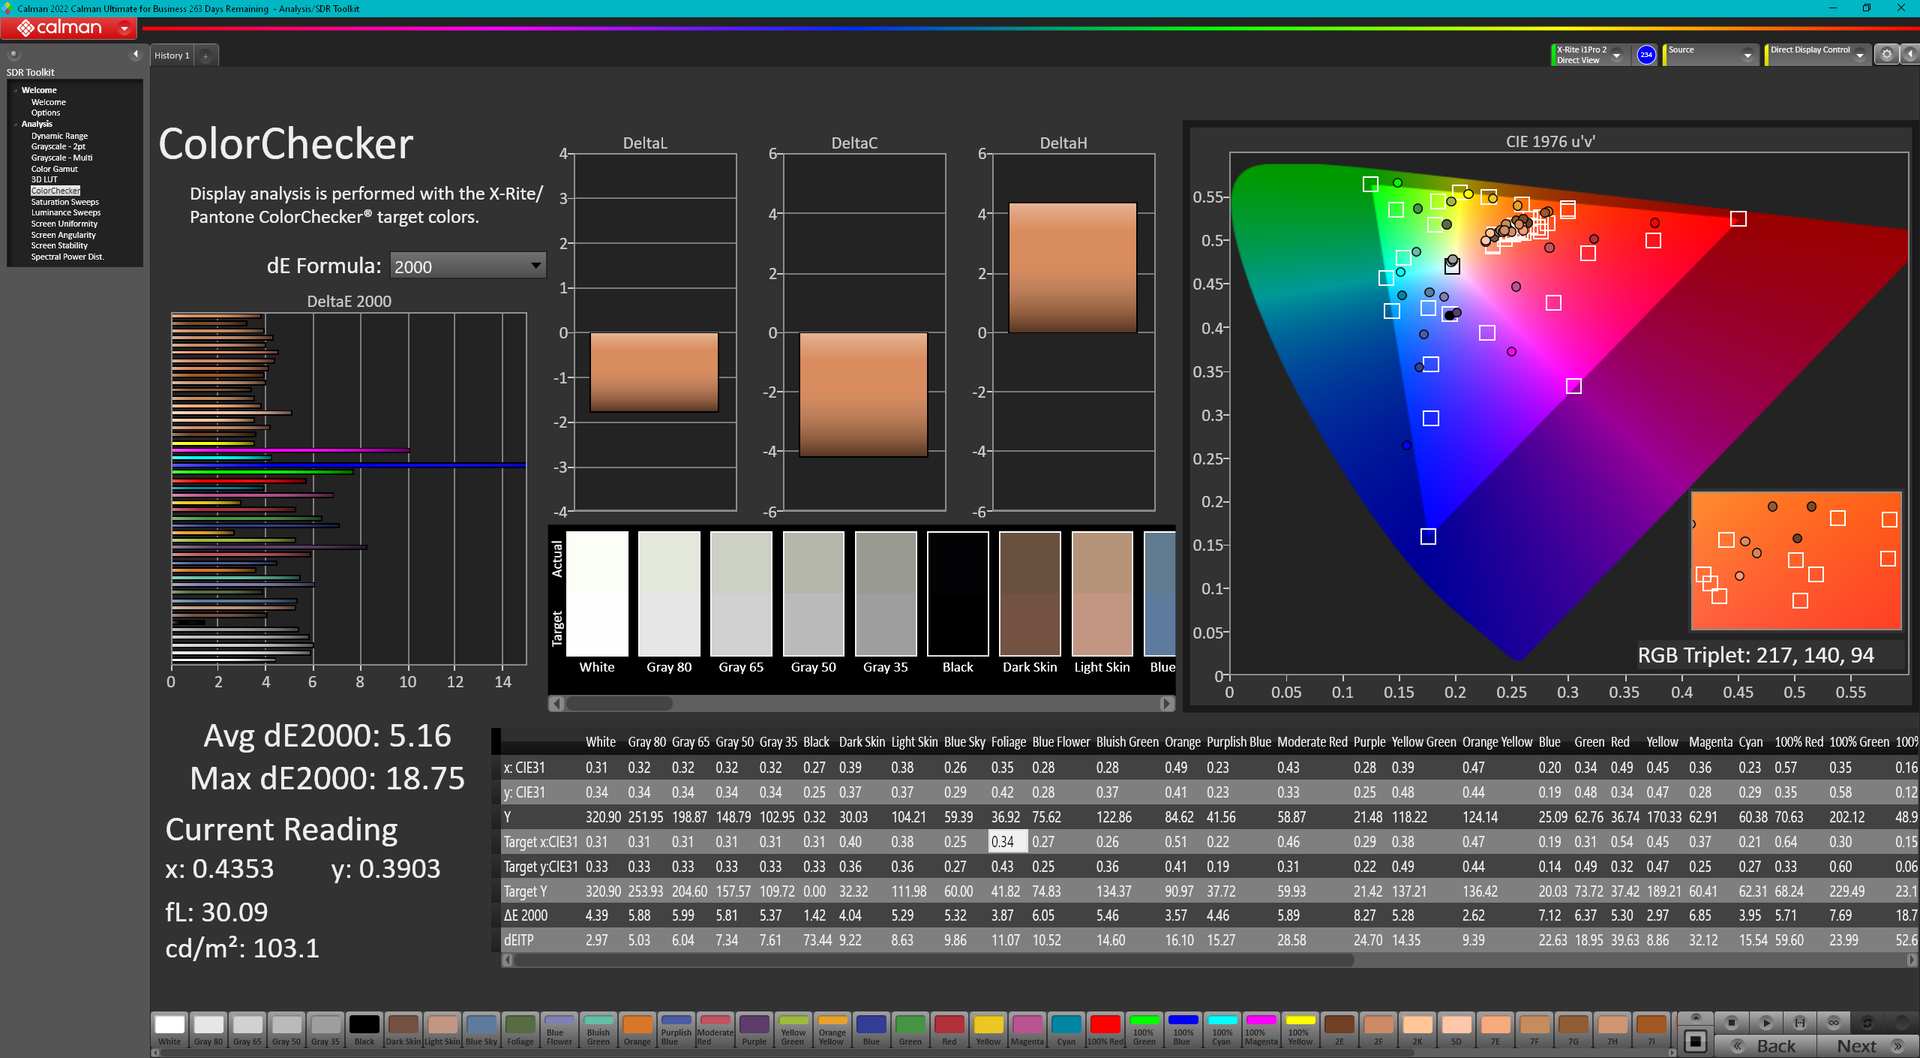
ΔE ColorChecker Calman: 5.16 | ∀{0.5-29.43 Ø4.72}
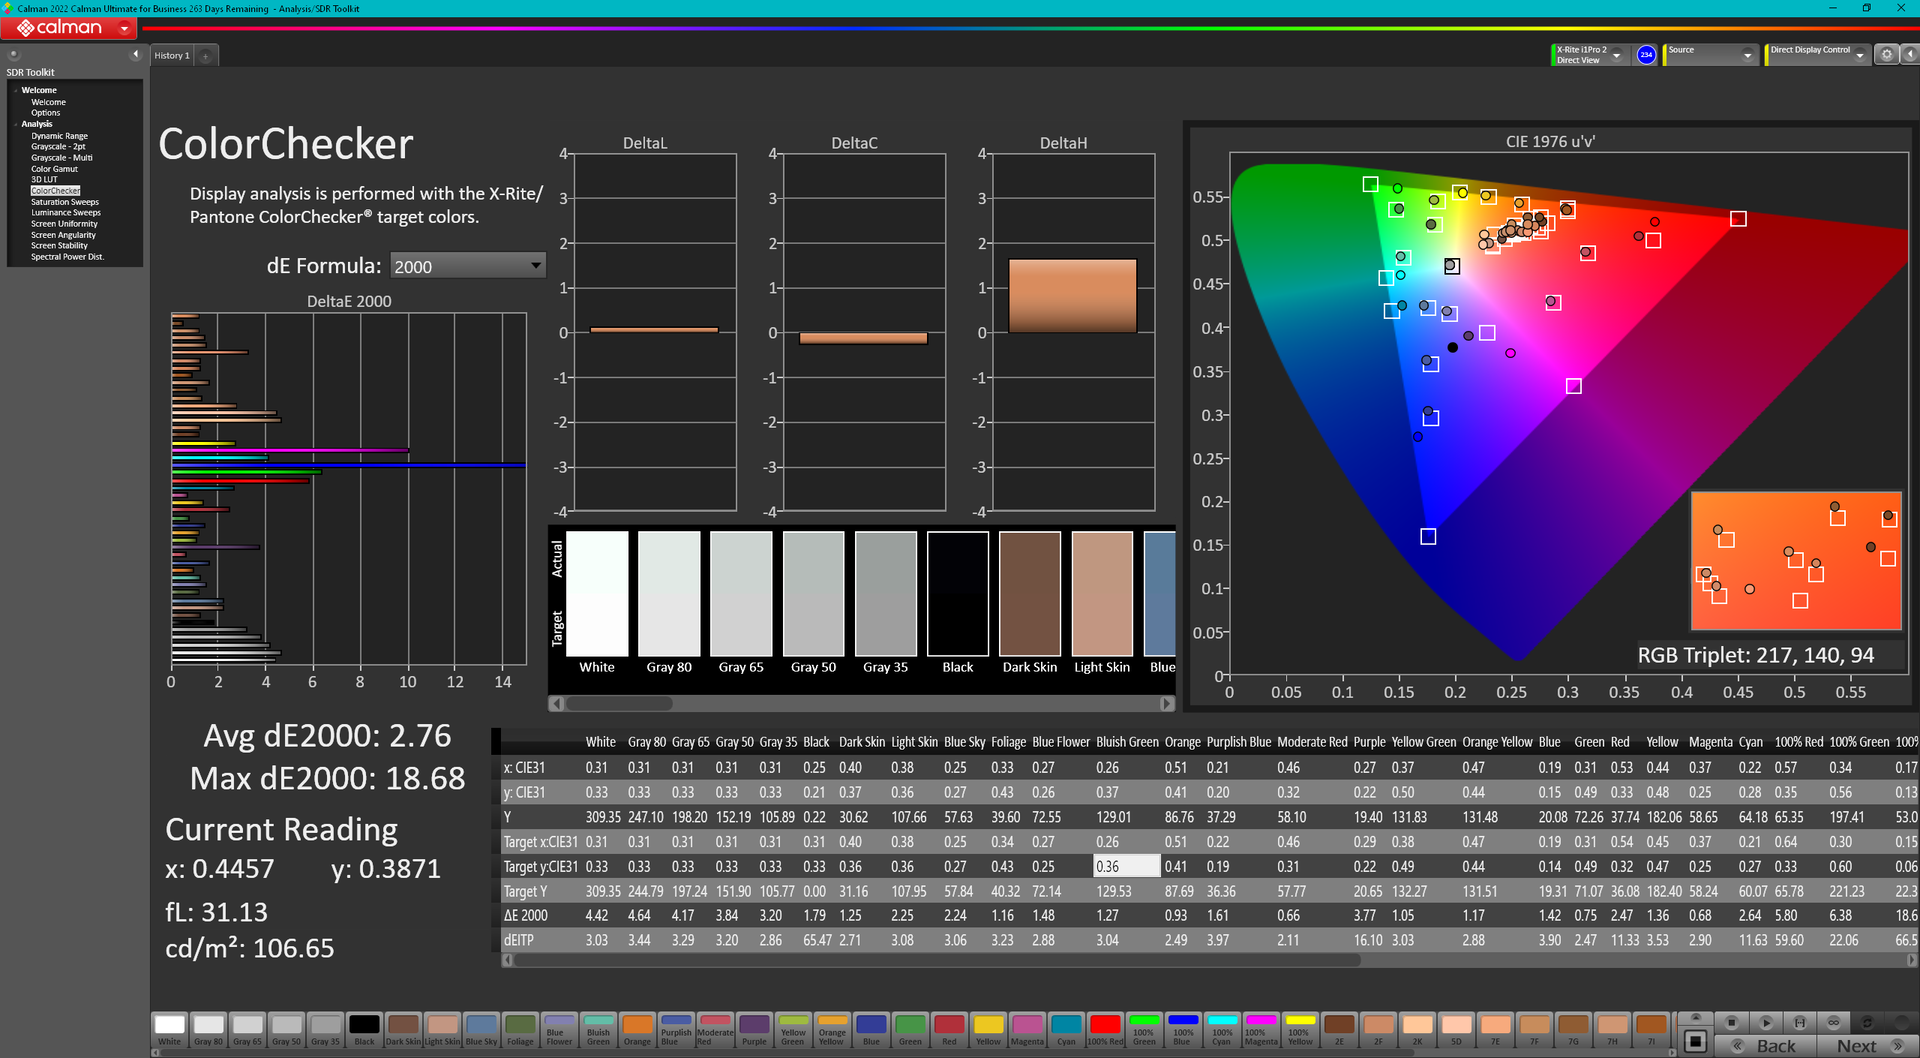
calibrated: 2.76
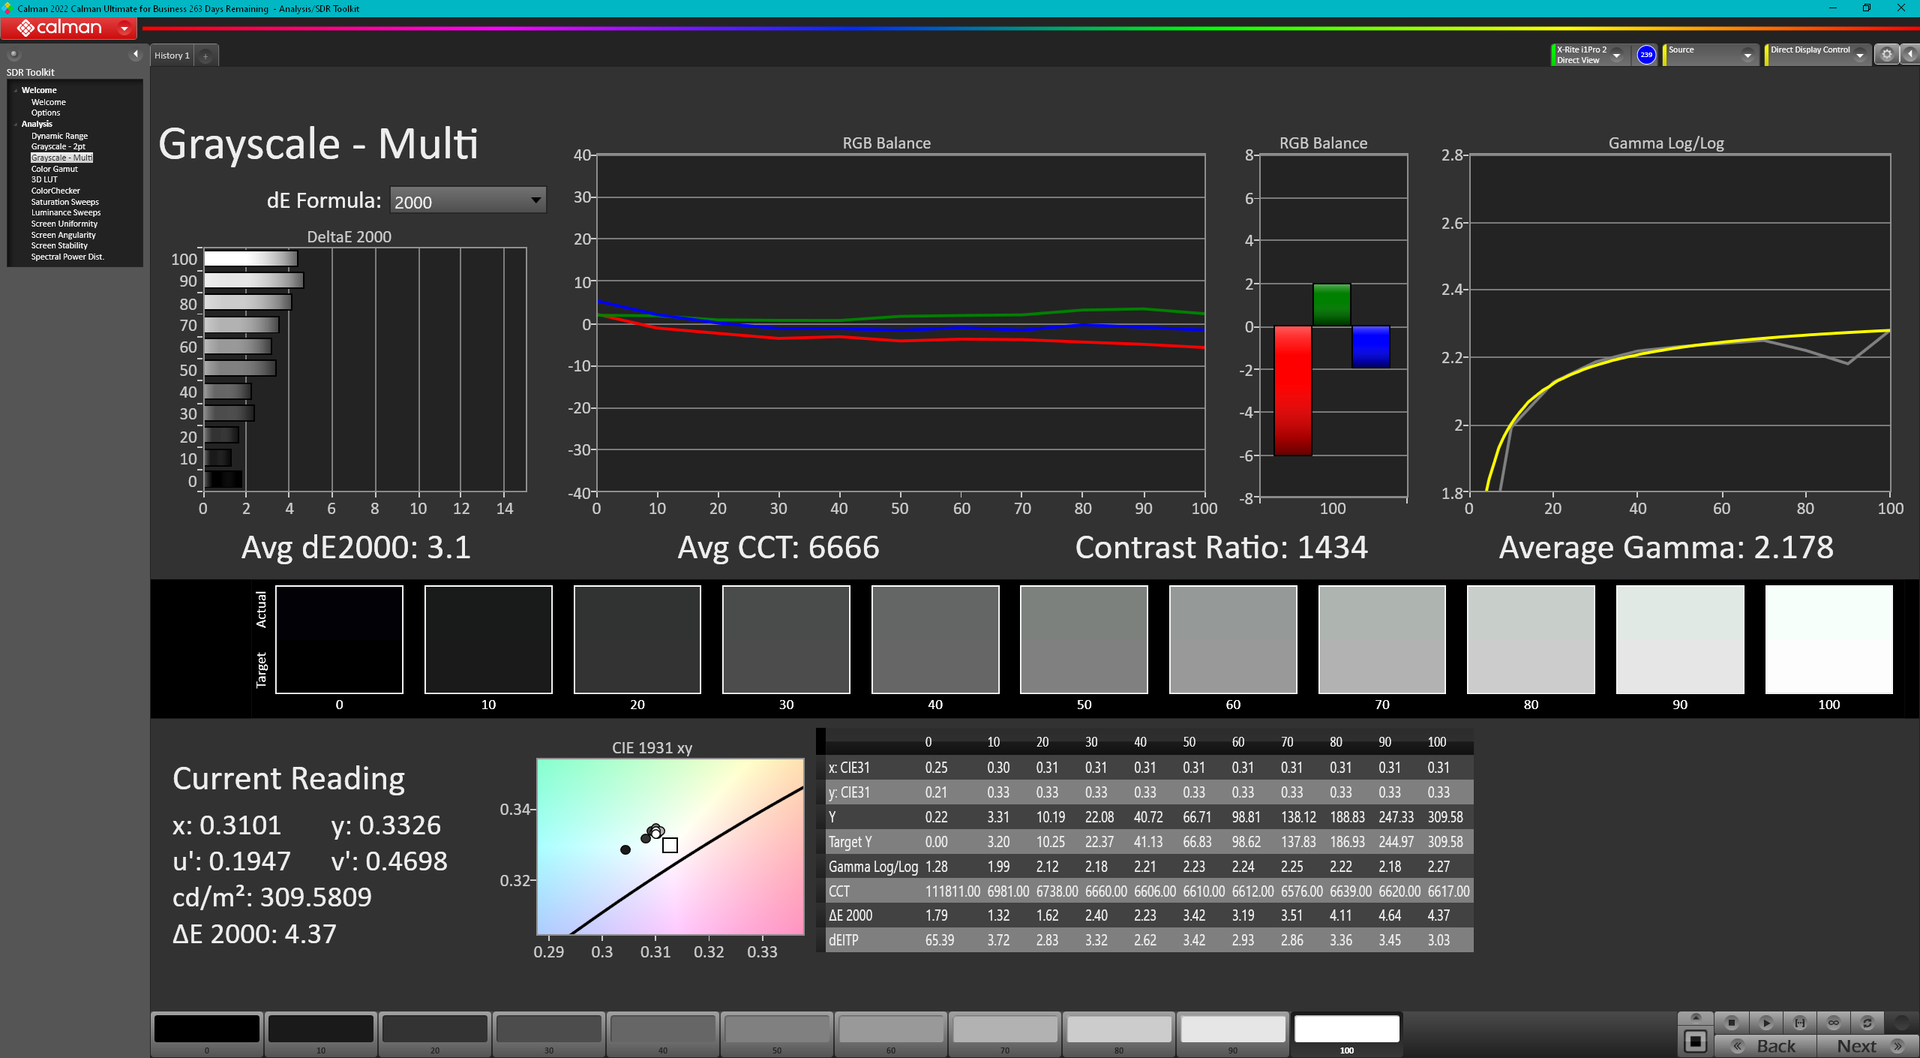
ΔE Greyscale Calman: 4.2 | ∀{0.09-98 Ø4.97}
41% AdobeRGB 1998 (Argyll 3D)
59% sRGB (Argyll 3D)
39.7% Display P3 (Argyll 3D)
Gamma: 2.28
CCT: 6163 K
| Lenovo ThinkPad T16 Gen 1 Core i7-1270P B160UAN3.2, IPS, 1920x1200, 16" | Lenovo ThinkPad T16 G1 21CH004MGE MNG007DA1-C, IPS-LED, 2560x1600, 16" | LG Gram 16Z90Q LG LP160WQ1-SPB2 (LGD06EB), IPS, 2560x1600, 16" | HP EliteBook 865 G9 X160NV42, IPS, 1920x1200, 16" | Huawei MateBook 16s i7 BOE XS TV160DKT-NH0, IPS, 2520x1680, 16" | Apple MacBook Pro 16 2021 M1 Pro Liquid Retina XDR, Mini-LED, 3456x2234, 16.2" | |
|---|---|---|---|---|---|---|
| Display | 66% | 106% | 76% | 63% | 111% | |
| Display P3 Coverage (%) | 39.7 | 66.7 68% | 96.8 144% | 71.4 80% | 64.5 62% | 99.1 150% |
| sRGB Coverage (%) | 59 | 95.7 62% | 99.9 69% | 99.3 68% | 96.7 64% | 100 69% |
| AdobeRGB 1998 Coverage (%) | 41 | 69.1 69% | 84.6 106% | 73.2 79% | 66.6 62% | 88 115% |
| Response Times | 7% | -19% | -9% | -9% | -161% | |
| Response Time Grey 50% / Grey 80% * (ms) | 29.2 ? | 32.1 ? -10% | 45.7 ? -57% | 35.5 ? -22% | 35.7 ? -22% | 42.8 ? -47% |
| Response Time Black / White * (ms) | 24.4 ? | 18.9 ? 23% | 19.7 ? 19% | 23.5 ? 4% | 23.2 ? 5% | 91.6 ? -275% |
| PWM Frequency (Hz) | 56.7 | 14880 | ||||
| Bildschirm | 43% | 23% | 73% | 49% | 352% | |
| Helligkeit Bildmitte (cd/m²) | 321.3 | 417 30% | 366 14% | 865 169% | 311 -3% | 514 60% |
| Brightness (cd/m²) | 315 | 388 23% | 347 10% | 771 145% | 319 1% | 497 58% |
| Brightness Distribution (%) | 82 | 81 -1% | 89 9% | 72 -12% | 91 11% | 95 16% |
| Schwarzwert * (cd/m²) | 0.31 | 0.24 23% | 0.32 -3% | 0.3 3% | 0.17 45% | 0.02 94% |
| Kontrast (:1) | 1036 | 1738 68% | 1144 10% | 2883 178% | 1829 77% | 25700 2381% |
| Delta E Colorchecker * | 5.16 | 1.7 67% | 2.82 45% | 2.4 53% | 1 81% | 1.4 73% |
| Colorchecker dE 2000 max. * | 18.75 | 3.5 81% | 4.65 75% | 5.8 69% | 1.7 91% | 2.8 85% |
| Colorchecker dE 2000 calibrated * | 2.76 | 1.4 49% | 2.69 3% | 1.5 46% | 0.8 71% | |
| Delta E Graustufen * | 4.2 | 2.4 43% | 2.3 45% | 3.8 10% | 1.5 64% | 2.3 45% |
| Gamma | 2.28 96% | 2.16 102% | 1.971 112% | 2.36 93% | 2.15 102% | 2.27 97% |
| CCT | 6163 105% | 6924 94% | 6796 96% | 6922 94% | 6432 101% | 6792 96% |
| Durchschnitt gesamt (Programm / Settings) | 39% /
43% | 37% /
35% | 47% /
62% | 34% /
44% | 101% /
217% |
* ... kleinere Werte sind besser
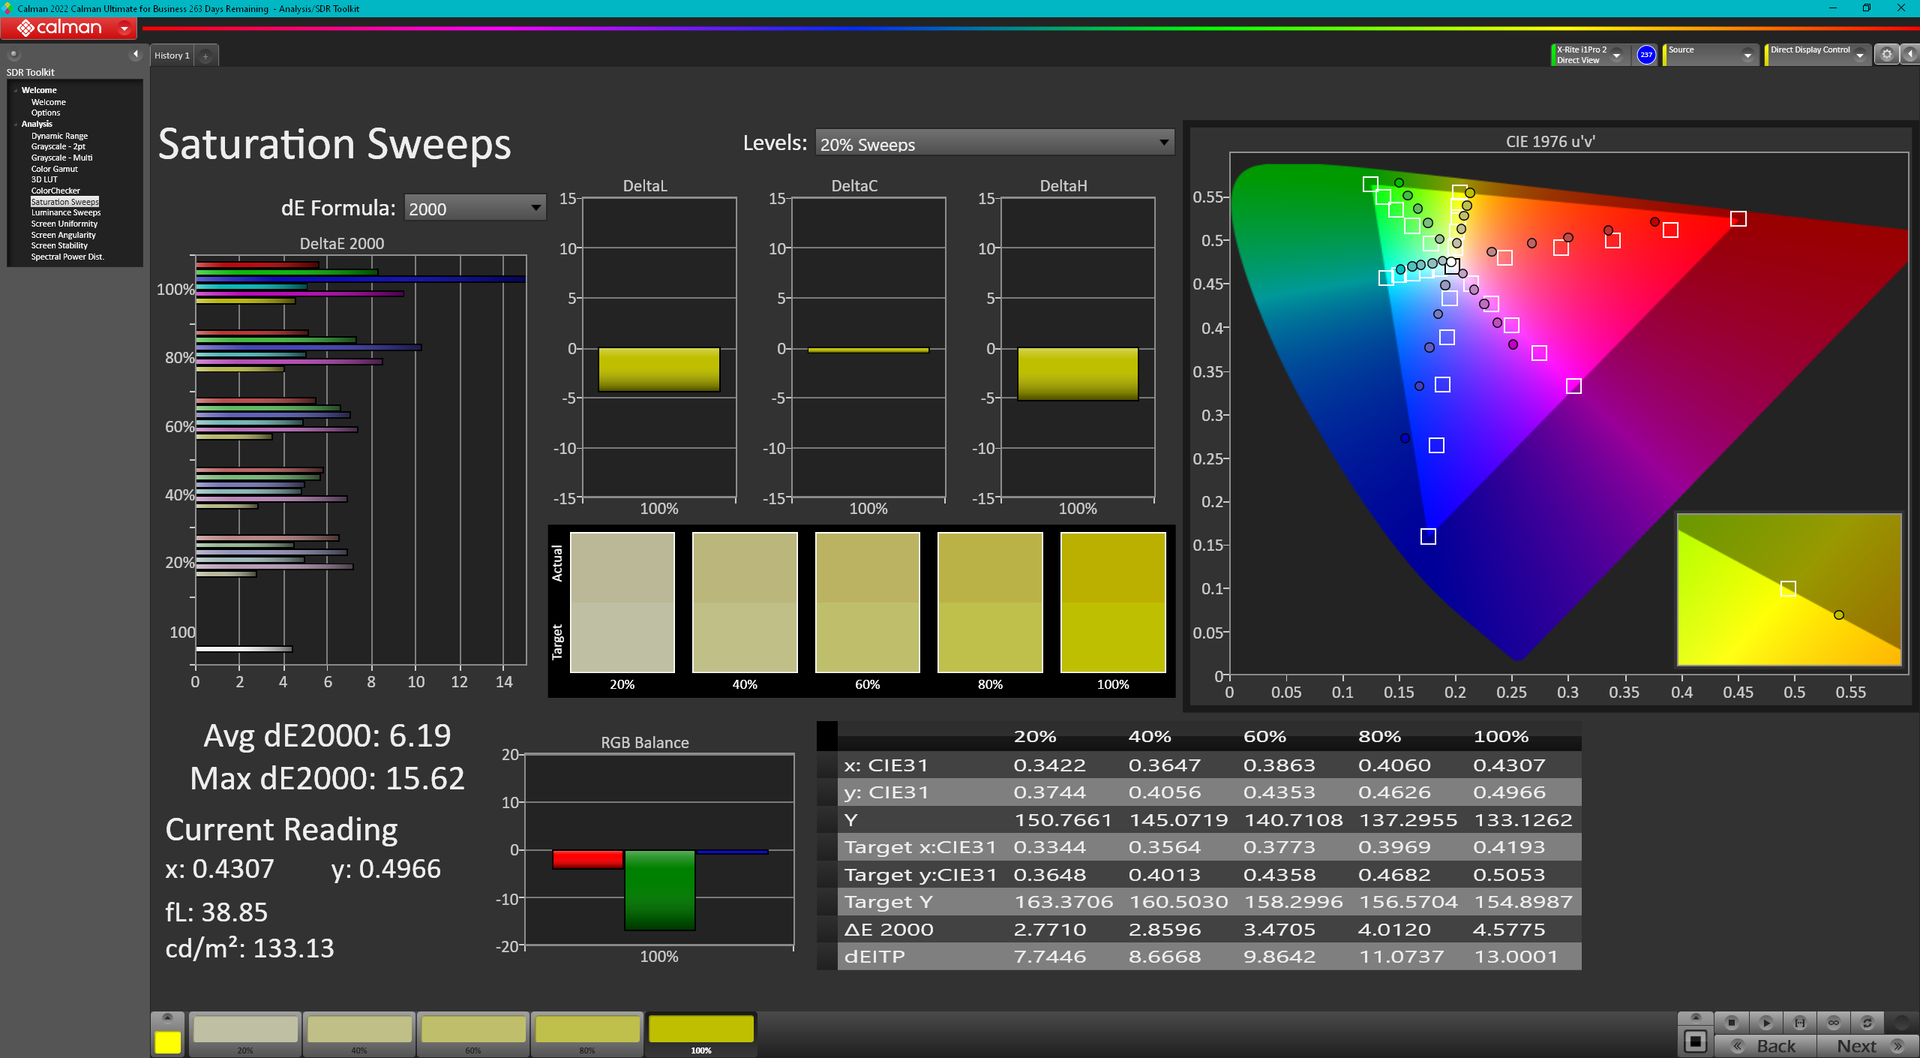
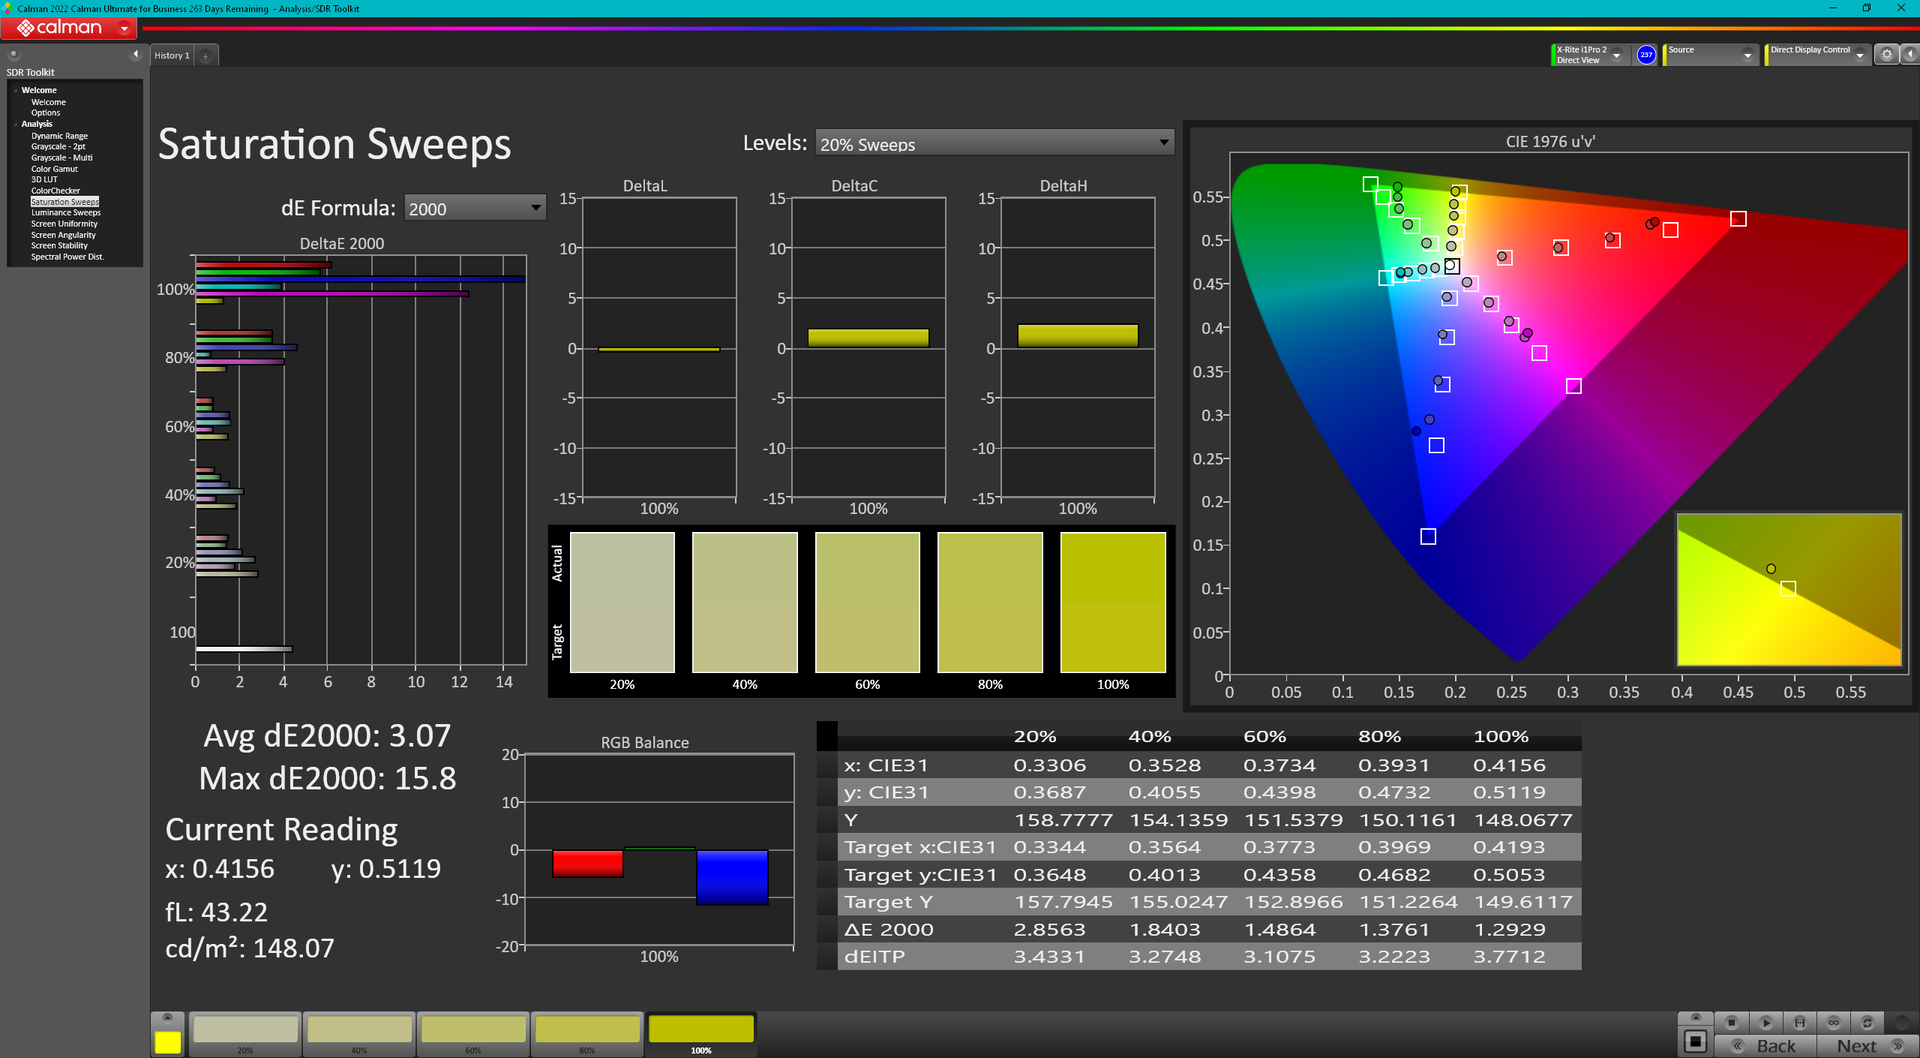
Die Farbtemperatur ist ab Werk zu warm, was glücklicherweise mit einer Kalibrierung behoben werden kann. Das durchschnittliche Farb-DeltaE würde sich von 5,05 auf 2,23 verbessern, aber die Farben sind bei hohen Sättigungswerten aufgrund der begrenzten Farbabdeckung des Panels immer noch ungenau. Wir empfehlen die Verwendung unseres kalibrierten ICM-Profils, da das Display ab Werk nicht kalibriert ist.
Reaktionszeiten (Response Times) des Displays
| ↔ Reaktionszeiten Schwarz zu Weiß | ||
|---|---|---|
| 24.4 ms ... steigend ↗ und fallend ↘ kombiniert | ↗ 14 ms steigend | 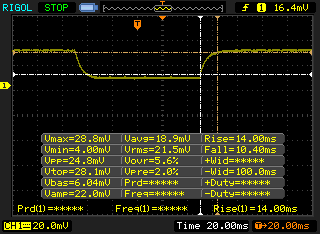 |
| ↘ 10.4 ms fallend | ||
| Die gemessenen Reaktionszeiten sind gut, für anspruchsvolle Spieler könnten der Bildschirm jedoch zu langsam sein. Im Vergleich rangierten die bei uns getesteten Geräte von 0.1 (Minimum) zu 240 (Maximum) ms. » 58 % aller Screens waren schneller als der getestete. Daher sind die gemessenen Reaktionszeiten schlechter als der Durchschnitt aller vermessenen Geräte (19.8 ms). | ||
| ↔ Reaktionszeiten 50% Grau zu 80% Grau | ||
| 29.2 ms ... steigend ↗ und fallend ↘ kombiniert | ↗ 15.6 ms steigend | 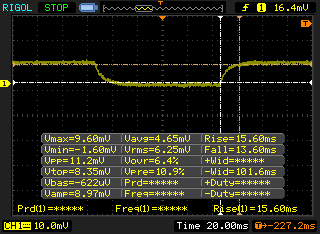 |
| ↘ 13.6 ms fallend | ||
| Die gemessenen Reaktionszeiten sind mittelmäßig und dadurch für Spieler eventuell zu langsam. Im Vergleich rangierten die bei uns getesteten Geräte von 0.165 (Minimum) zu 636 (Maximum) ms. » 39 % aller Screens waren schneller als der getestete. Daher sind die gemessenen Reaktionszeiten durchschnittlich (31 ms). | ||
Bildschirm-Flackern / PWM (Pulse-Width Modulation)
| Flackern / PWM nicht festgestellt | 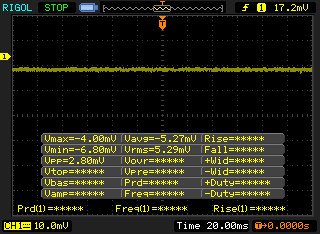 | ||
Im Vergleich: 52 % aller getesteten Geräte nutzten kein PWM um die Helligkeit zu reduzieren. Wenn PWM eingesetzt wurde, dann bei einer Frequenz von durchschnittlich 7763 (Minimum 5, Maximum 343500) Hz. | |||
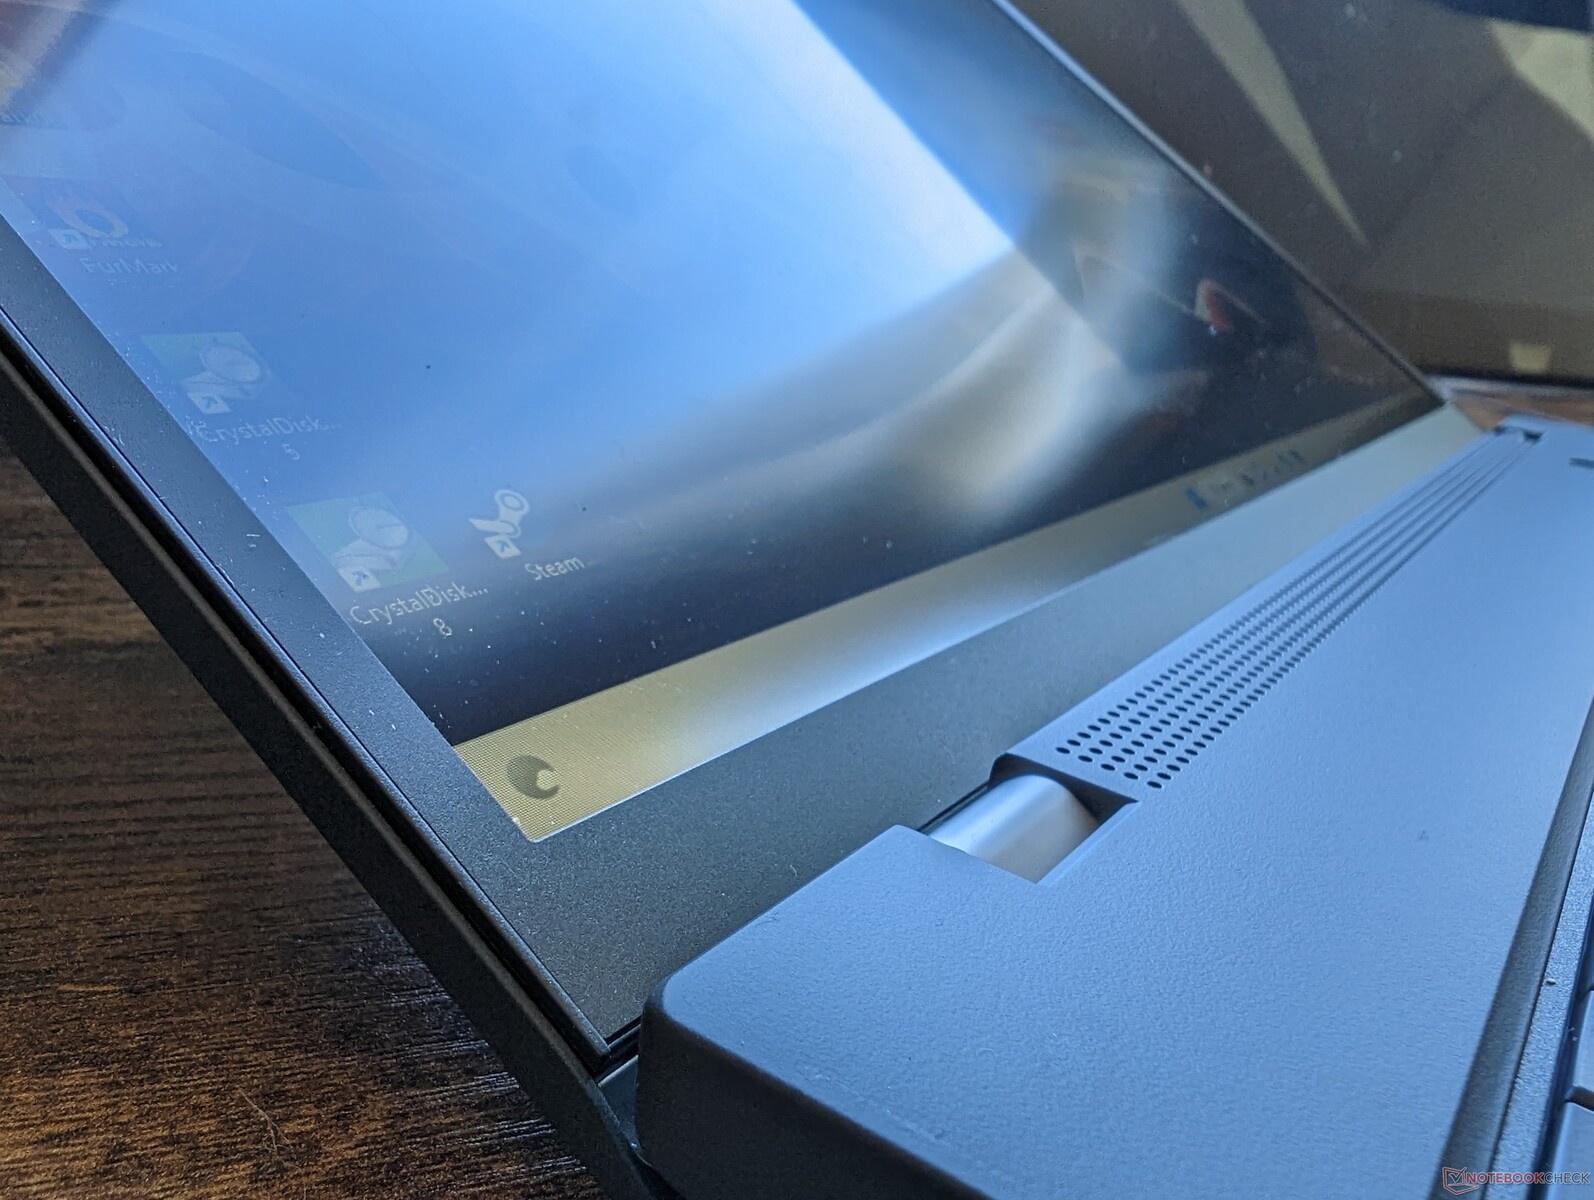
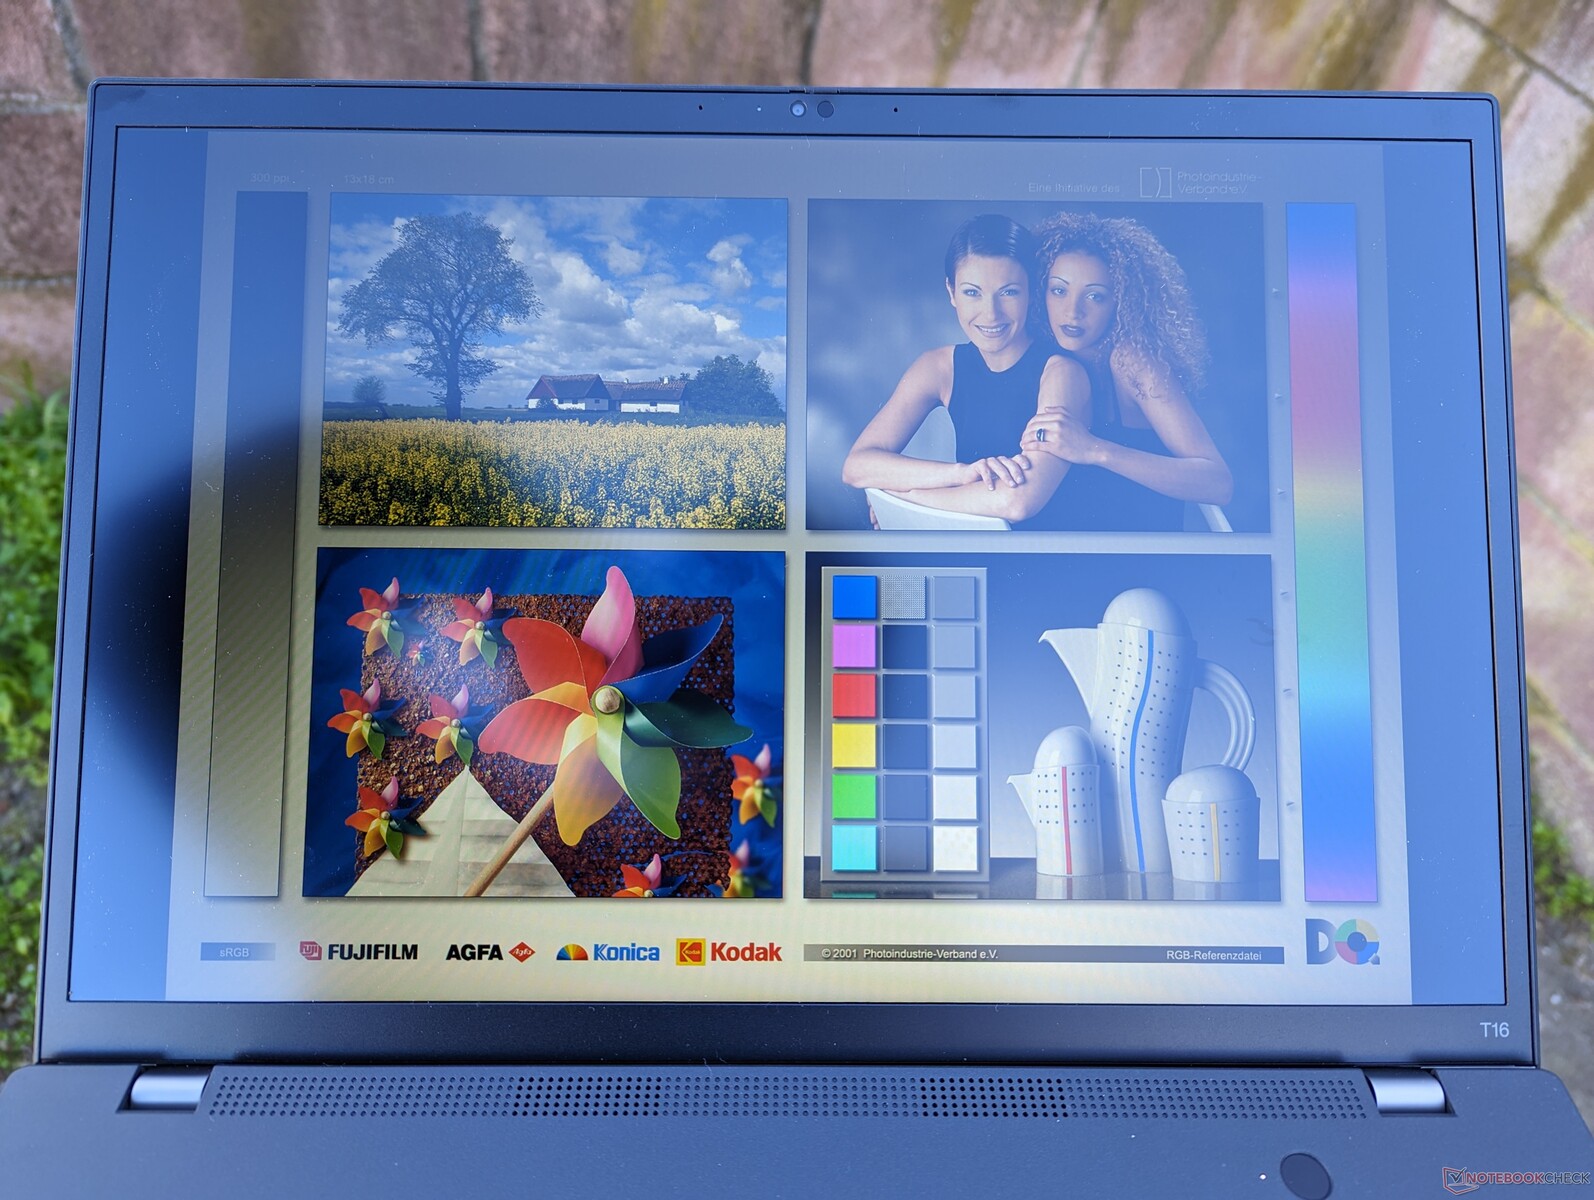
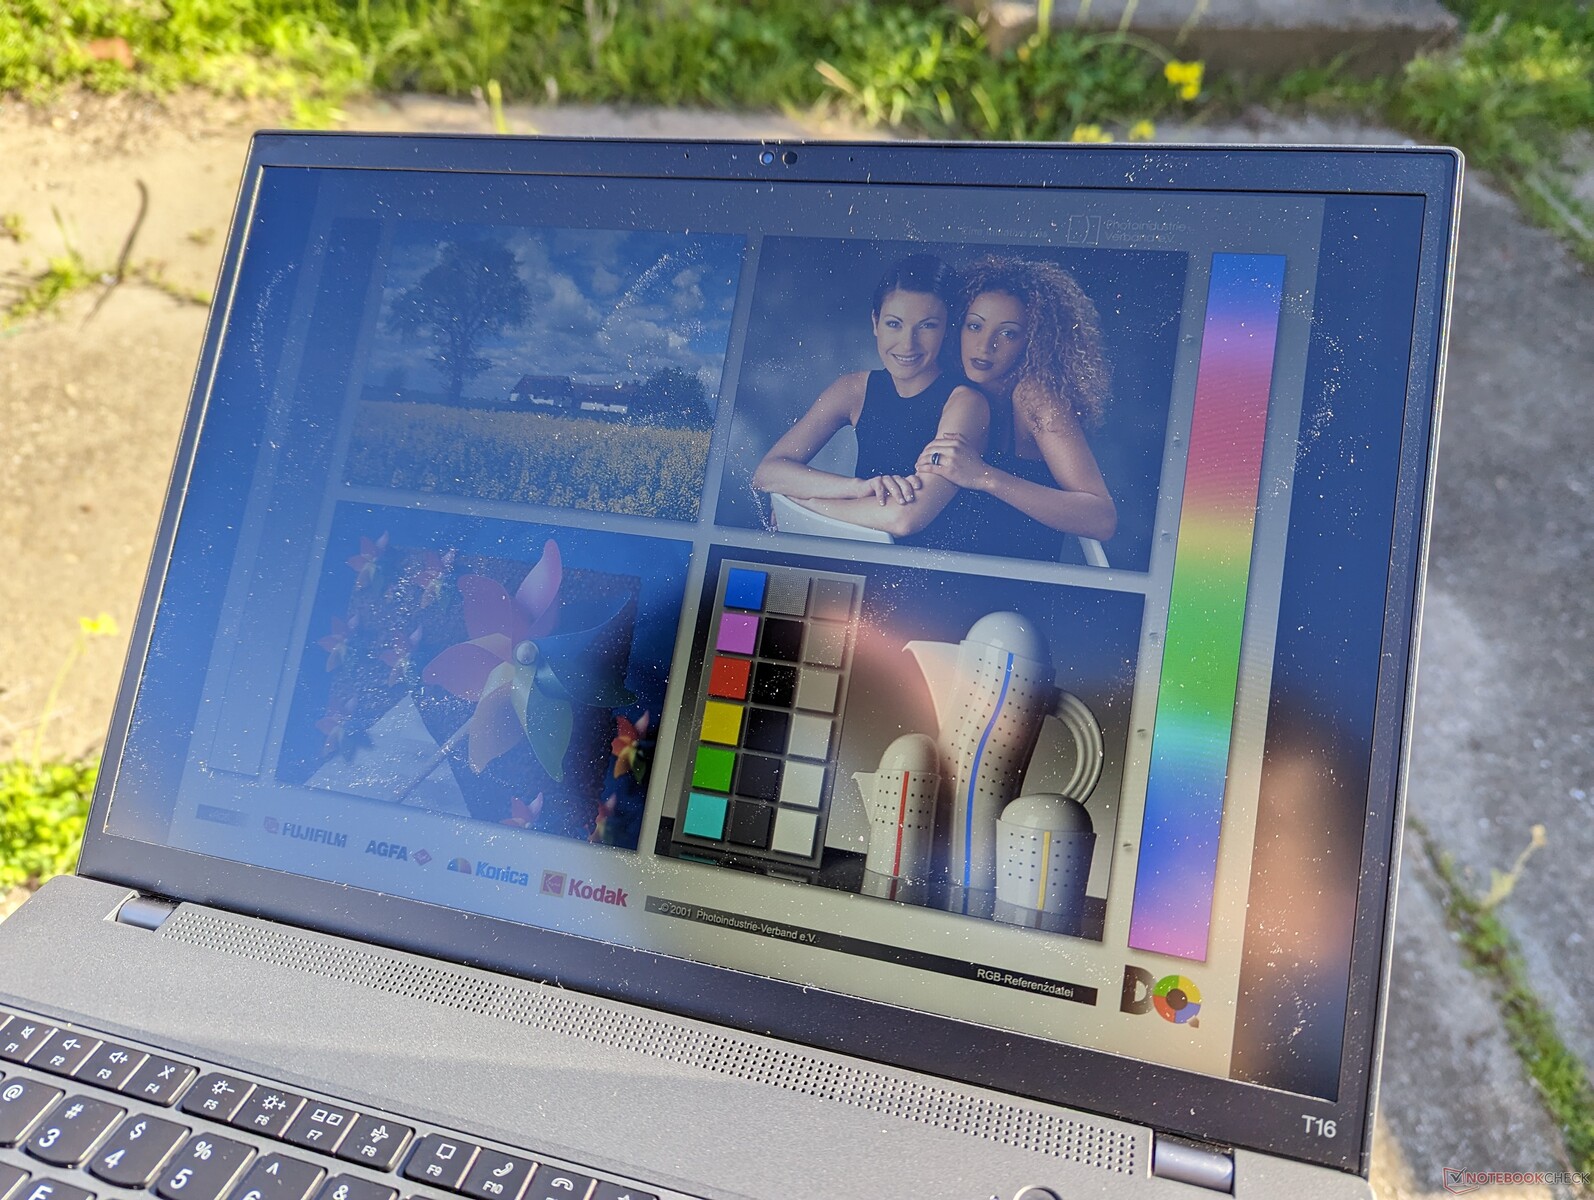
Die Ablesbarkeit im Freien ist bei unserem 300-Nit-Panel bestenfalls durchschnittlich. Nutzer sollten die 500-nit-Optionen in Betracht ziehen, um die Auswirkungen von Blendeffekten zu reduzieren. Wem die Ablesbarkeit zu gering ist, dem empfehlen wir einen Blick auf das HP EliteBook 860/865 G9 und seine viel helleren 1000-nit-Panel-Optionen zu werfen.
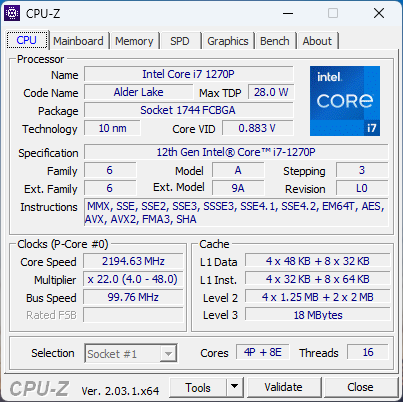
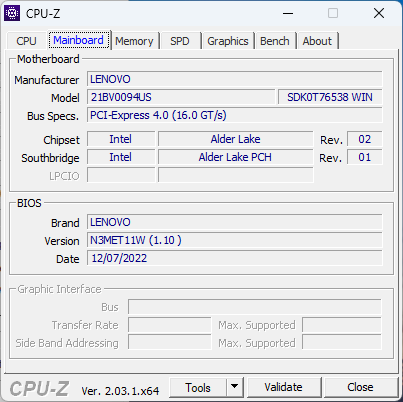
Performance - Intel-Optionen der 12. Generation
Testbedingungen
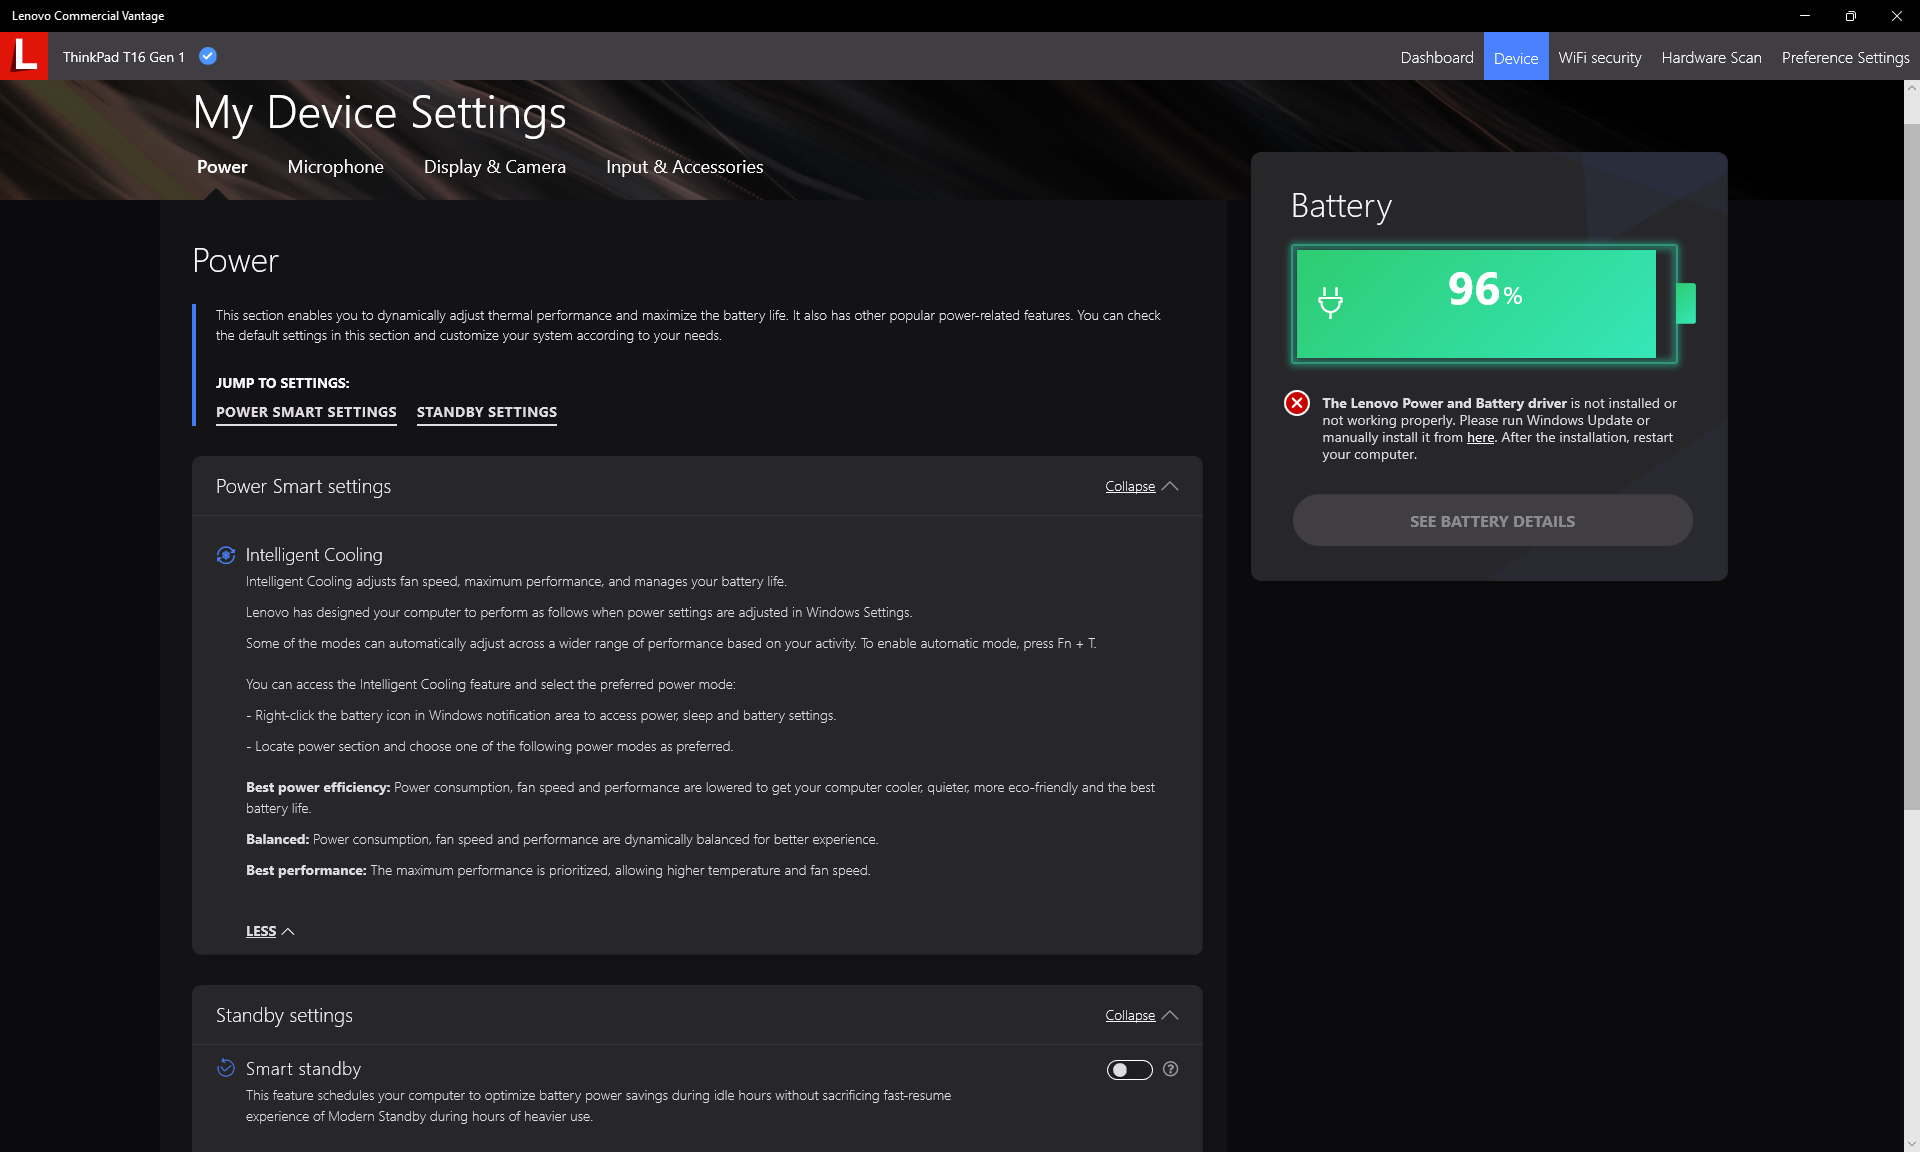
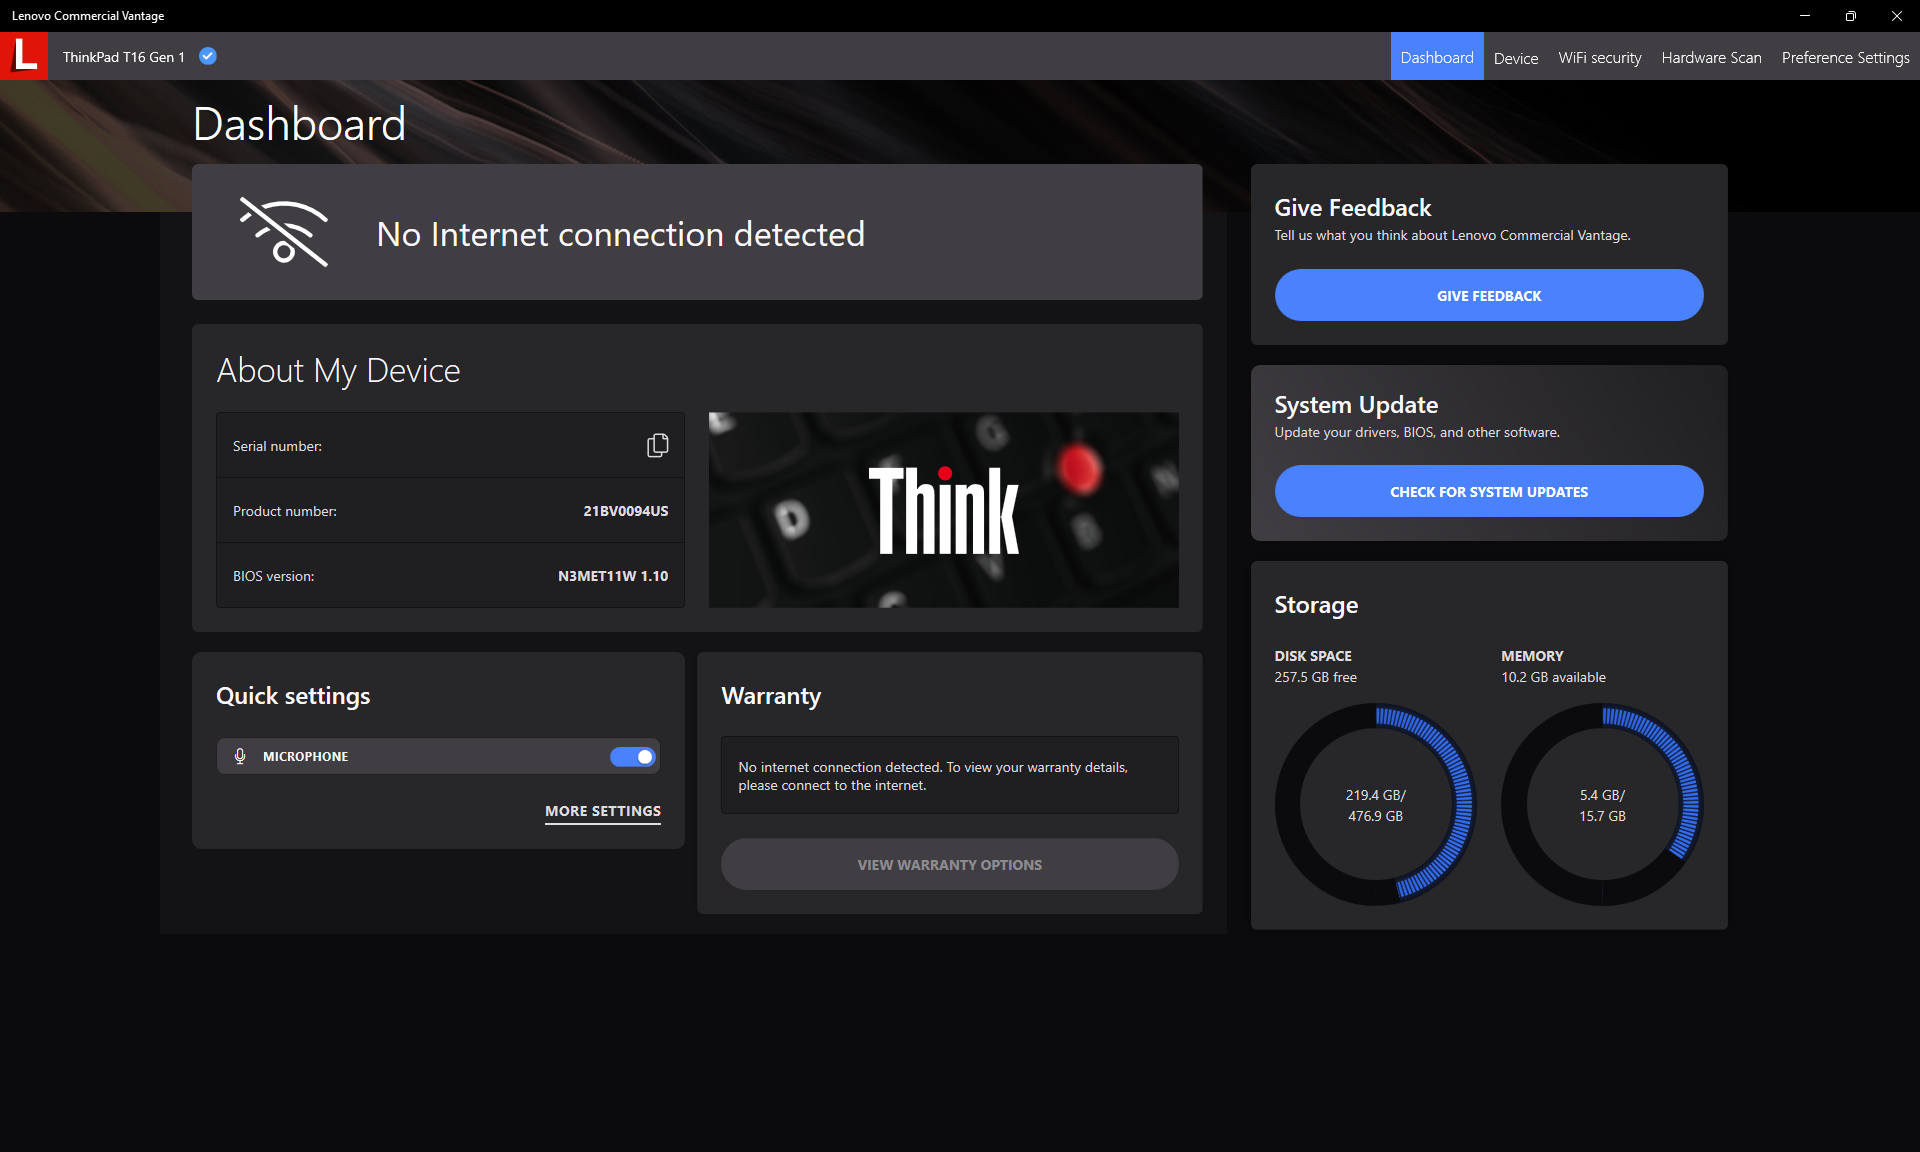
Wir haben unser Gerät für die folgenden Benchmarks in den Performance Modus versetzt. Benutzer sollten sich für zusätzliche Einstellungen in Bezug auf Updates, Garantie, Sicherheit und mehr mit der Lenovo Commercial Vantage Software vertraut machen. Die Screenshots unten zeigen einige der Optionen.
Prozessor - Turbo Boost könnte besser sein
Unser Core i7-1270P zeigte ein ähnliches Throttling-Verhalten wie die Core i5-1240P SKU. Wenn wir den CineBench R15 xT in einer Schleife laufen lassen, sinkt der anfängliche Score von 1782 Punkten im Laufe der Zeit um bis zu 44 Prozent, was deutlich mehr ist als bei den meisten anderen Laptops. Im Gegensatz dazu ist die Ryzen 5 PRO 6650U SKU während der wenigen Minuten des Schleifentests langsamer, kann aber über längere Zeiträume höhere Taktraten und Leistungen aufrechterhalten, wie unsere Grafik unten zeigt. Die Turbo-Boost-Vorteile des Core i7-1270P sind daher auf dem ThinkPad T16 G1 nur von kurzer Dauer.
Nutzer können ThrottleStop installieren, um die Leistungsdrosselung auf Wunsch um etwa 20 Prozent zu minimieren. Dennoch ist es enttäuschend, dass Lenovo eine solche Leistungsoption nicht anbietet.
Cinebench R15 Multi Loop
Cinebench R20: CPU (Multi Core) | CPU (Single Core)
Cinebench R23: Multi Core | Single Core
Cinebench R15: CPU Multi 64Bit | CPU Single 64Bit
Blender: v2.79 BMW27 CPU
7-Zip 18.03: 7z b 4 | 7z b 4 -mmt1
Geekbench 5.5: Multi-Core | Single-Core
HWBOT x265 Benchmark v2.2: 4k Preset
LibreOffice : 20 Documents To PDF
R Benchmark 2.5: Overall mean
* ... kleinere Werte sind besser
* ... kleinere Werte sind besser
AIDA64: FP32 Ray-Trace | FPU Julia | CPU SHA3 | CPU Queen | FPU SinJulia | FPU Mandel | CPU AES | CPU ZLib | FP64 Ray-Trace | CPU PhotoWorxx
| Performance Rating | |
| HP EliteBook 865 G9 | |
| Lenovo ThinkPad T16 G1 21CH004MGE | |
| Huawei MateBook 16s i7 | |
| Lenovo ThinkPad T16 Gen 1 Core i7-1270P | |
| LG Gram 16Z90Q | |
| Durchschnittliche Intel Core i7-1270P | |
| AIDA64 / FP32 Ray-Trace | |
| HP EliteBook 865 G9 | |
| Lenovo ThinkPad T16 G1 21CH004MGE | |
| Lenovo ThinkPad T16 Gen 1 Core i7-1270P | |
| LG Gram 16Z90Q | |
| Huawei MateBook 16s i7 | |
| Durchschnittliche Intel Core i7-1270P (4789 - 6722, n=2) | |
| AIDA64 / FPU Julia | |
| HP EliteBook 865 G9 | |
| Lenovo ThinkPad T16 G1 21CH004MGE | |
| Lenovo ThinkPad T16 Gen 1 Core i7-1270P | |
| Durchschnittliche Intel Core i7-1270P (22017 - 37567, n=2) | |
| Huawei MateBook 16s i7 | |
| LG Gram 16Z90Q | |
| AIDA64 / CPU SHA3 | |
| HP EliteBook 865 G9 | |
| Lenovo ThinkPad T16 G1 21CH004MGE | |
| Huawei MateBook 16s i7 | |
| Lenovo ThinkPad T16 Gen 1 Core i7-1270P | |
| Durchschnittliche Intel Core i7-1270P (1543 - 1853, n=2) | |
| LG Gram 16Z90Q | |
| AIDA64 / CPU Queen | |
| Huawei MateBook 16s i7 | |
| HP EliteBook 865 G9 | |
| Lenovo ThinkPad T16 G1 21CH004MGE | |
| Lenovo ThinkPad T16 Gen 1 Core i7-1270P | |
| LG Gram 16Z90Q | |
| Durchschnittliche Intel Core i7-1270P (61703 - 76671, n=2) | |
| AIDA64 / FPU SinJulia | |
| HP EliteBook 865 G9 | |
| Lenovo ThinkPad T16 G1 21CH004MGE | |
| Huawei MateBook 16s i7 | |
| Durchschnittliche Intel Core i7-1270P (5059 - 5210, n=2) | |
| Lenovo ThinkPad T16 Gen 1 Core i7-1270P | |
| LG Gram 16Z90Q | |
| AIDA64 / FPU Mandel | |
| HP EliteBook 865 G9 | |
| Lenovo ThinkPad T16 G1 21CH004MGE | |
| Lenovo ThinkPad T16 Gen 1 Core i7-1270P | |
| Huawei MateBook 16s i7 | |
| Durchschnittliche Intel Core i7-1270P (12876 - 17891, n=2) | |
| LG Gram 16Z90Q | |
| AIDA64 / CPU AES | |
| Lenovo ThinkPad T16 G1 21CH004MGE | |
| Huawei MateBook 16s i7 | |
| HP EliteBook 865 G9 | |
| Lenovo ThinkPad T16 Gen 1 Core i7-1270P | |
| Durchschnittliche Intel Core i7-1270P (33137 - 39956, n=2) | |
| LG Gram 16Z90Q | |
| AIDA64 / CPU ZLib | |
| Huawei MateBook 16s i7 | |
| HP EliteBook 865 G9 | |
| Lenovo ThinkPad T16 G1 21CH004MGE | |
| Lenovo ThinkPad T16 Gen 1 Core i7-1270P | |
| Durchschnittliche Intel Core i7-1270P (553 - 579, n=2) | |
| LG Gram 16Z90Q | |
| AIDA64 / FP64 Ray-Trace | |
| HP EliteBook 865 G9 | |
| Lenovo ThinkPad T16 G1 21CH004MGE | |
| LG Gram 16Z90Q | |
| Lenovo ThinkPad T16 Gen 1 Core i7-1270P | |
| Huawei MateBook 16s i7 | |
| Durchschnittliche Intel Core i7-1270P (2603 - 3521, n=2) | |
| AIDA64 / CPU PhotoWorxx | |
| Huawei MateBook 16s i7 | |
| LG Gram 16Z90Q | |
| Durchschnittliche Intel Core i7-1270P (21056 - 34745, n=2) | |
| Lenovo ThinkPad T16 G1 21CH004MGE | |
| Lenovo ThinkPad T16 Gen 1 Core i7-1270P | |
| HP EliteBook 865 G9 | |
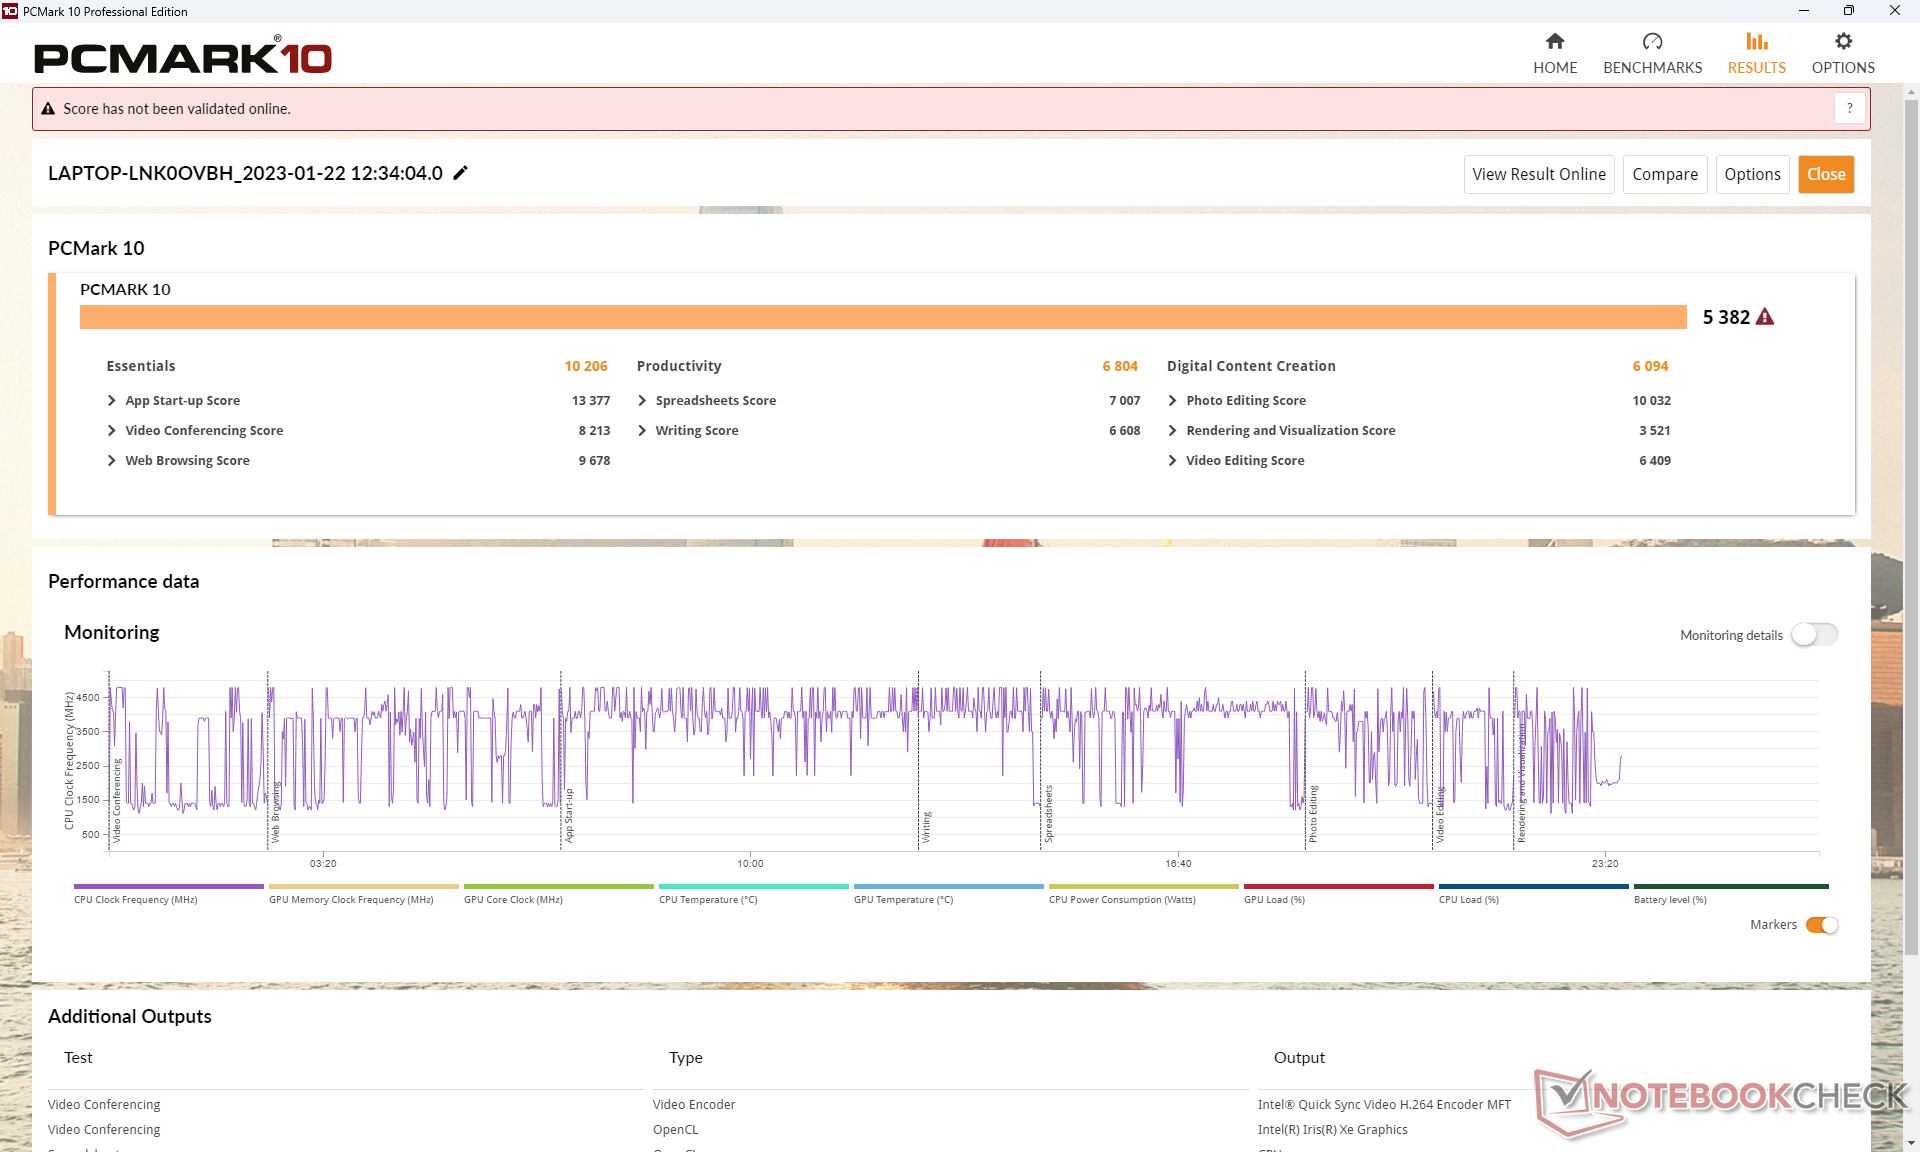
System Performance
Die durchschnittlichen PCMark-Ergebnisse liegen zwischen denen der langsameren Core-i5- und der schnelleren Ryzen-5-SKUs, wie das Vergleichsdiagramm unten zeigt. Die AMD-SKU liegt im Produktivitätstest deutlich vorne, was wahrscheinlich auf die schnellere Multi-Thread-Leistung und die integrierte GPU im Vergleich zu den Intel-SKUs zurückzuführen ist.
CrossMark: Overall | Productivity | Creativity | Responsiveness
| PCMark 10 / Score | |
| Huawei MateBook 16s i7 | |
| Lenovo ThinkPad T16 G1 21CH004MGE | |
| HP EliteBook 865 G9 | |
| Durchschnittliche Intel Core i7-1270P, Intel Iris Xe Graphics G7 96EUs (5382 - 5647, n=2) | |
| Lenovo ThinkPad T16 Gen 1 Core i7-1270P | |
| LG Gram 16Z90Q | |
| Lenovo ThinkPad T16 G1 21BWS00200 | |
| PCMark 10 / Essentials | |
| Huawei MateBook 16s i7 | |
| Durchschnittliche Intel Core i7-1270P, Intel Iris Xe Graphics G7 96EUs (10206 - 11224, n=2) | |
| Lenovo ThinkPad T16 Gen 1 Core i7-1270P | |
| LG Gram 16Z90Q | |
| Lenovo ThinkPad T16 G1 21CH004MGE | |
| Lenovo ThinkPad T16 G1 21BWS00200 | |
| HP EliteBook 865 G9 | |
| PCMark 10 / Productivity | |
| Lenovo ThinkPad T16 G1 21CH004MGE | |
| HP EliteBook 865 G9 | |
| Huawei MateBook 16s i7 | |
| Durchschnittliche Intel Core i7-1270P, Intel Iris Xe Graphics G7 96EUs (6804 - 6805, n=2) | |
| Lenovo ThinkPad T16 Gen 1 Core i7-1270P | |
| LG Gram 16Z90Q | |
| Lenovo ThinkPad T16 G1 21BWS00200 | |
| PCMark 10 / Digital Content Creation | |
| Huawei MateBook 16s i7 | |
| HP EliteBook 865 G9 | |
| Lenovo ThinkPad T16 G1 21CH004MGE | |
| Durchschnittliche Intel Core i7-1270P, Intel Iris Xe Graphics G7 96EUs (6094 - 6398, n=2) | |
| Lenovo ThinkPad T16 Gen 1 Core i7-1270P | |
| LG Gram 16Z90Q | |
| Lenovo ThinkPad T16 G1 21BWS00200 | |
| CrossMark / Overall | |
| Huawei MateBook 16s i7 | |
| Durchschnittliche Intel Core i7-1270P, Intel Iris Xe Graphics G7 96EUs (1585 - 1712, n=2) | |
| Lenovo ThinkPad T16 Gen 1 Core i7-1270P | |
| Apple MacBook Pro 16 2021 M1 Pro | |
| Lenovo ThinkPad T16 G1 21CH004MGE | |
| Lenovo ThinkPad T16 G1 21BWS00200 | |
| HP EliteBook 865 G9 | |
| CrossMark / Productivity | |
| Huawei MateBook 16s i7 | |
| Durchschnittliche Intel Core i7-1270P, Intel Iris Xe Graphics G7 96EUs (1567 - 1636, n=2) | |
| Lenovo ThinkPad T16 Gen 1 Core i7-1270P | |
| Lenovo ThinkPad T16 G1 21CH004MGE | |
| Lenovo ThinkPad T16 G1 21BWS00200 | |
| HP EliteBook 865 G9 | |
| Apple MacBook Pro 16 2021 M1 Pro | |
| CrossMark / Creativity | |
| Apple MacBook Pro 16 2021 M1 Pro | |
| Huawei MateBook 16s i7 | |
| Durchschnittliche Intel Core i7-1270P, Intel Iris Xe Graphics G7 96EUs (1684 - 1839, n=2) | |
| Lenovo ThinkPad T16 Gen 1 Core i7-1270P | |
| Lenovo ThinkPad T16 G1 21CH004MGE | |
| Lenovo ThinkPad T16 G1 21BWS00200 | |
| HP EliteBook 865 G9 | |
| CrossMark / Responsiveness | |
| Huawei MateBook 16s i7 | |
| Durchschnittliche Intel Core i7-1270P, Intel Iris Xe Graphics G7 96EUs (1365 - 1584, n=2) | |
| Lenovo ThinkPad T16 Gen 1 Core i7-1270P | |
| Lenovo ThinkPad T16 G1 21BWS00200 | |
| Lenovo ThinkPad T16 G1 21CH004MGE | |
| HP EliteBook 865 G9 | |
| Apple MacBook Pro 16 2021 M1 Pro | |
| PCMark 10 Score | 5382 Punkte | |
Hilfe | ||
| AIDA64 / Memory Copy | |
| Huawei MateBook 16s i7 | |
| LG Gram 16Z90Q | |
| Durchschnittliche Intel Core i7-1270P (39471 - 62300, n=2) | |
| Lenovo ThinkPad T16 G1 21CH004MGE | |
| Lenovo ThinkPad T16 Gen 1 Core i7-1270P | |
| HP EliteBook 865 G9 | |
| AIDA64 / Memory Read | |
| Huawei MateBook 16s i7 | |
| LG Gram 16Z90Q | |
| Durchschnittliche Intel Core i7-1270P (42289 - 72572, n=2) | |
| Lenovo ThinkPad T16 Gen 1 Core i7-1270P | |
| Lenovo ThinkPad T16 G1 21CH004MGE | |
| HP EliteBook 865 G9 | |
| AIDA64 / Memory Write | |
| LG Gram 16Z90Q | |
| Huawei MateBook 16s i7 | |
| Durchschnittliche Intel Core i7-1270P (43051 - 61340, n=2) | |
| Lenovo ThinkPad T16 G1 21CH004MGE | |
| Lenovo ThinkPad T16 Gen 1 Core i7-1270P | |
| HP EliteBook 865 G9 | |
| AIDA64 / Memory Latency | |
| Lenovo ThinkPad T16 G1 21CH004MGE | |
| Huawei MateBook 16s i7 | |
| LG Gram 16Z90Q | |
| HP EliteBook 865 G9 | |
| Lenovo ThinkPad T16 Gen 1 Core i7-1270P | |
| Durchschnittliche Intel Core i7-1270P (89.3 - 89.3, n=2) | |
* ... kleinere Werte sind besser
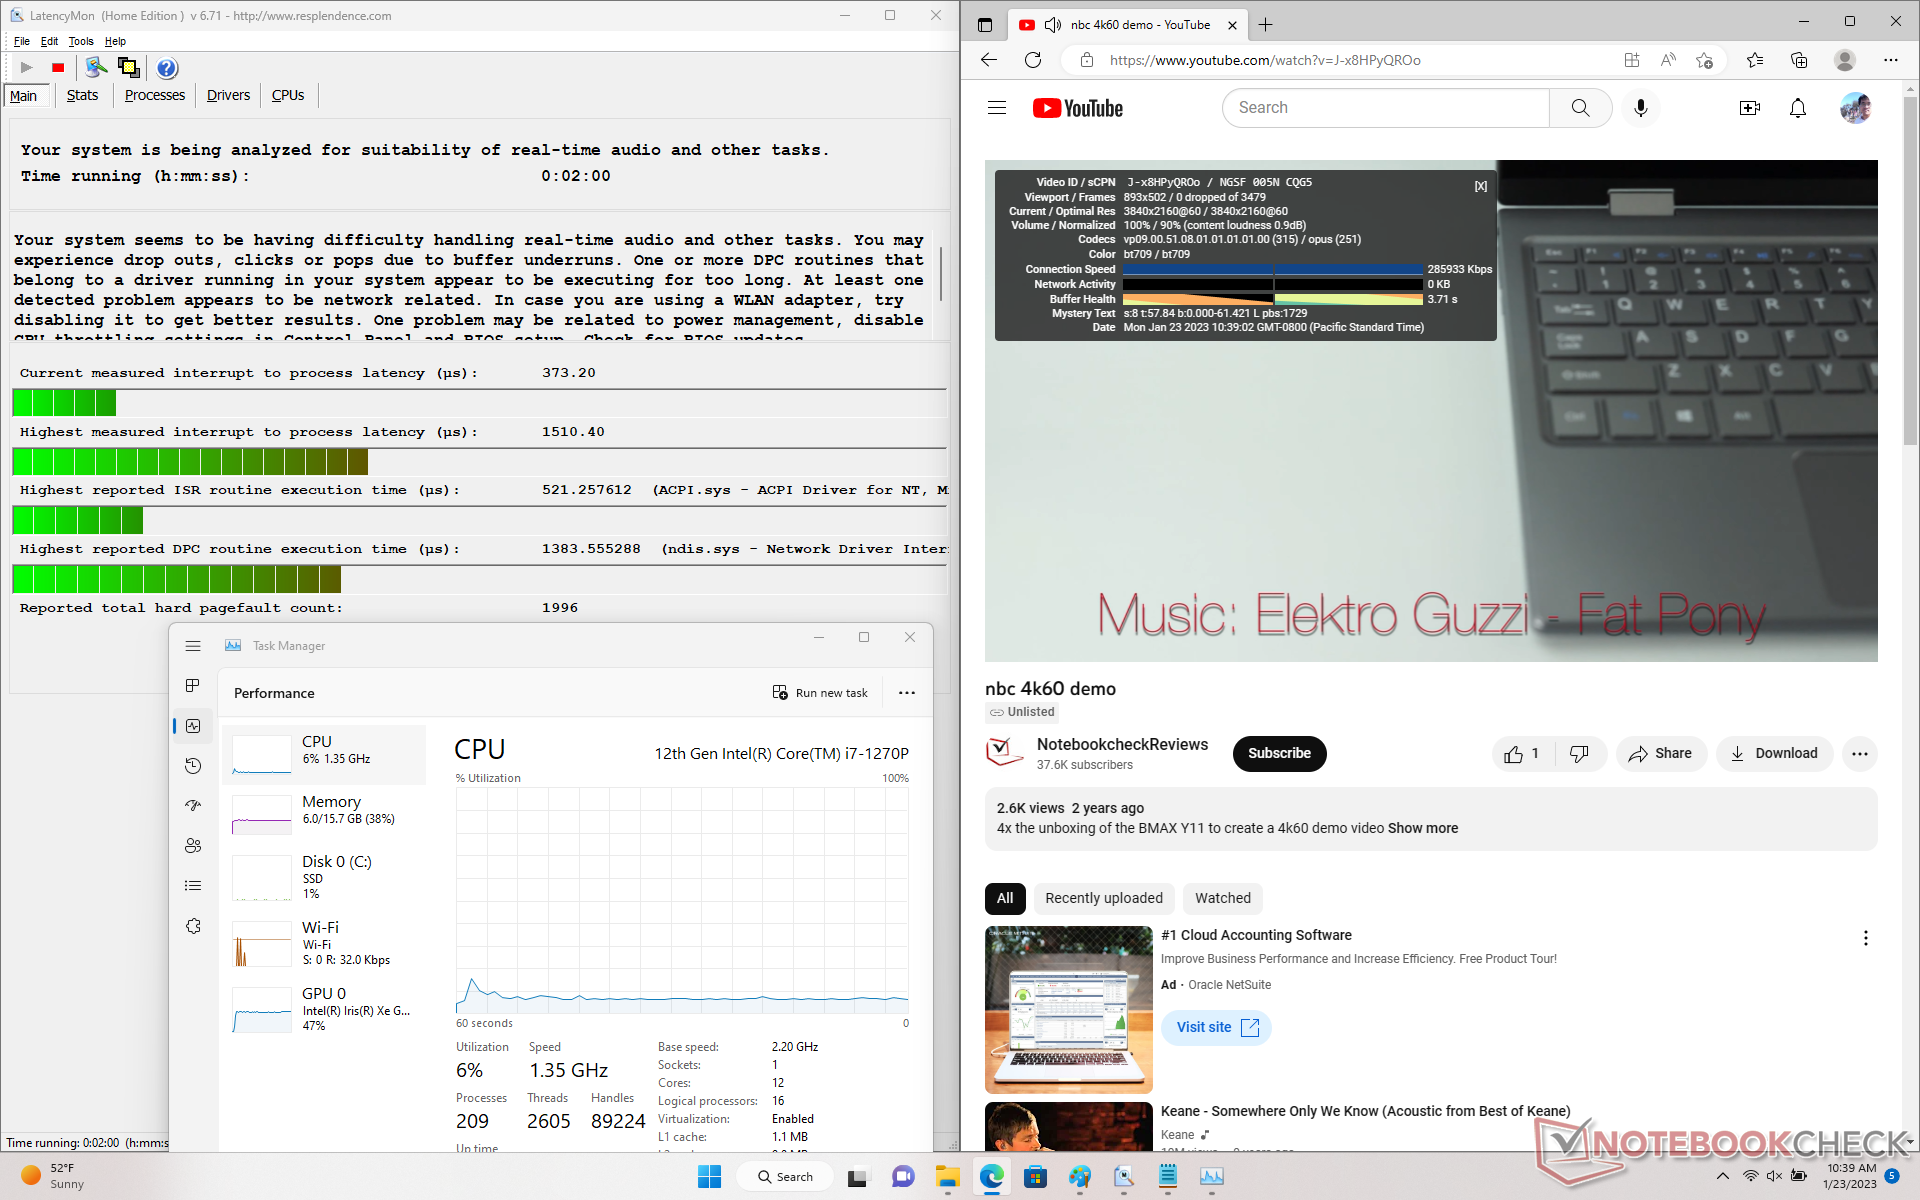
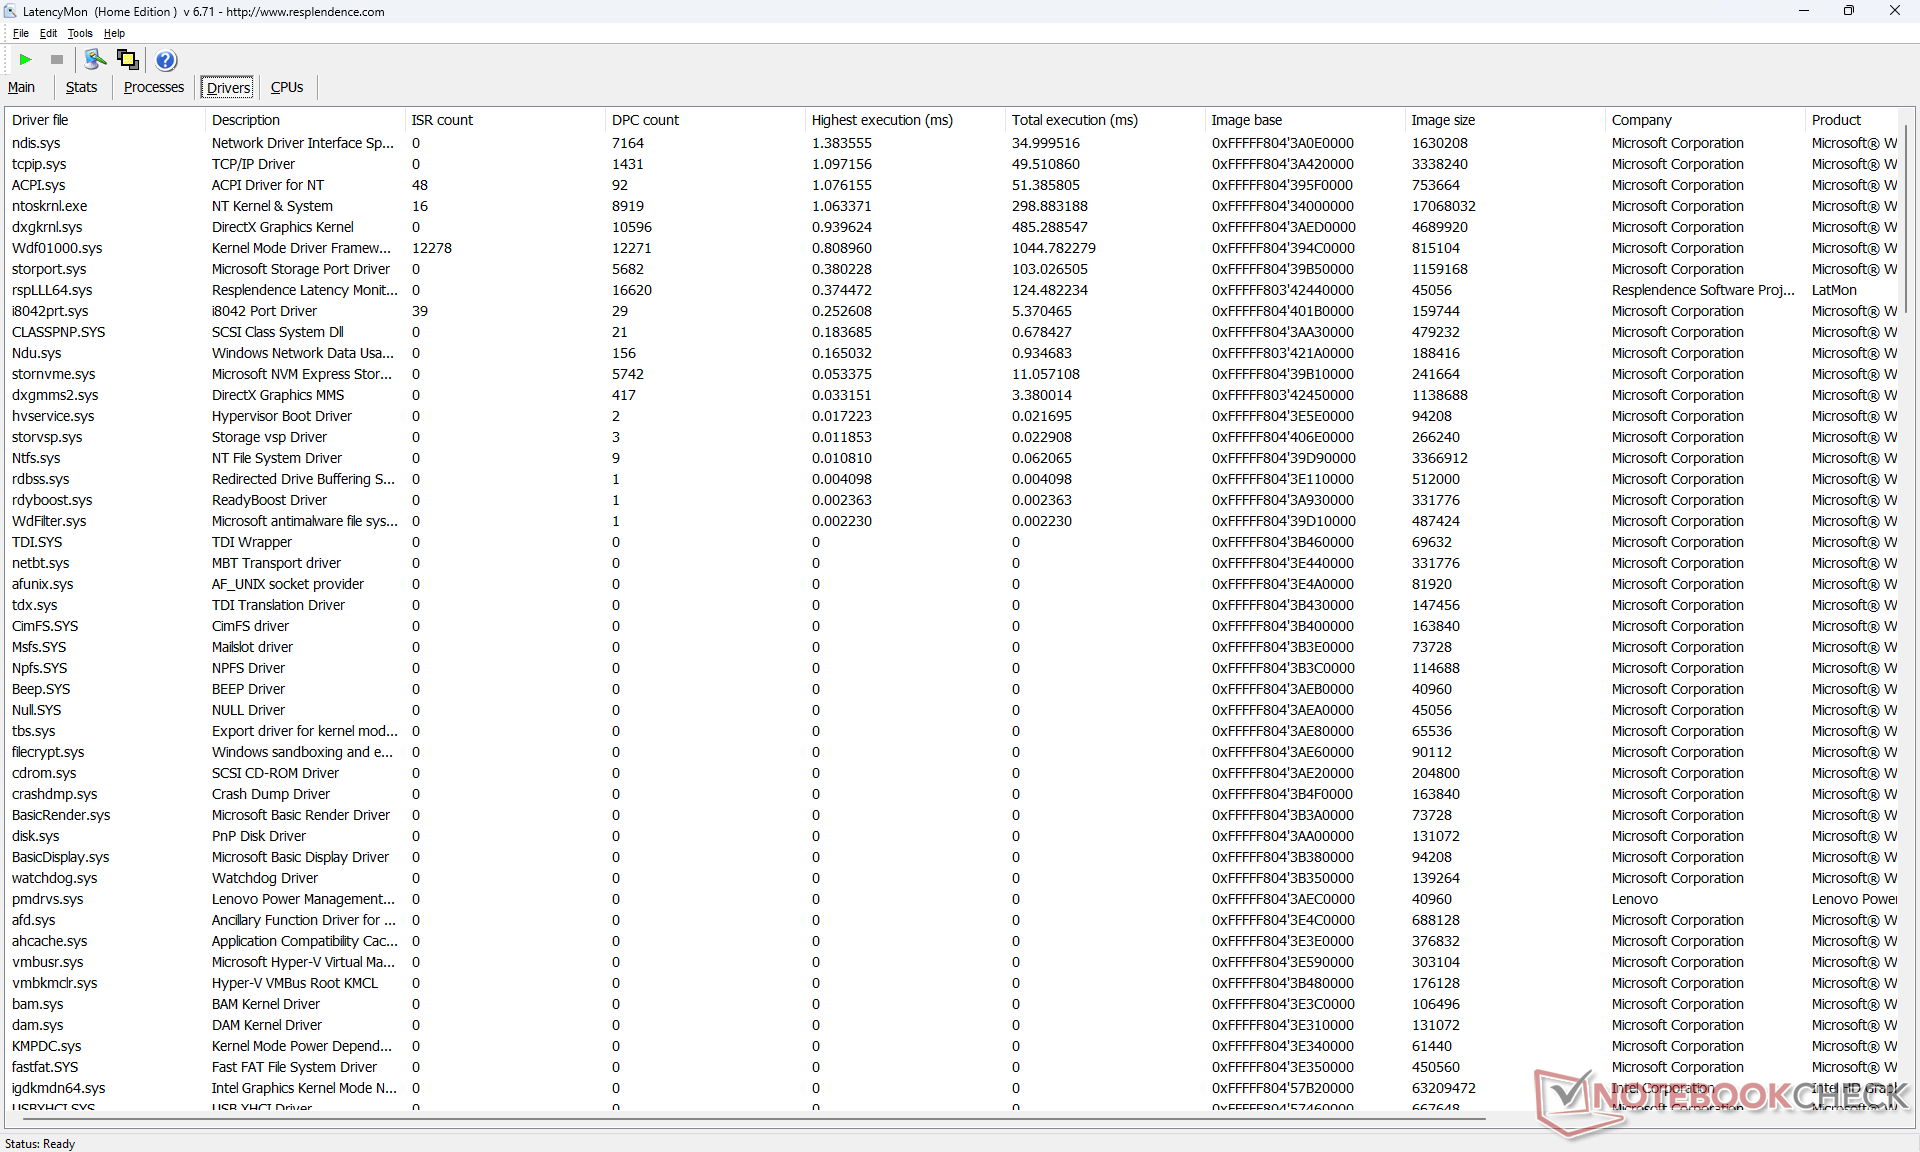
DPC-Latenzzeit
LatencyMon zeigt DPC-Probleme an, wenn mehrere Browsertabs geöffnet werden. Die 4K-Videowiedergabe bei 60 FPS ist ansonsten perfekt und ohne Bildaussetzer.
| DPC Latencies / LatencyMon - interrupt to process latency (max), Web, Youtube, Prime95 | |
| LG Gram 16Z90Q | |
| Lenovo ThinkPad T16 Gen 1 Core i7-1270P | |
| Lenovo ThinkPad T16 G1 21CH004MGE | |
| HP EliteBook 865 G9 | |
* ... kleinere Werte sind besser
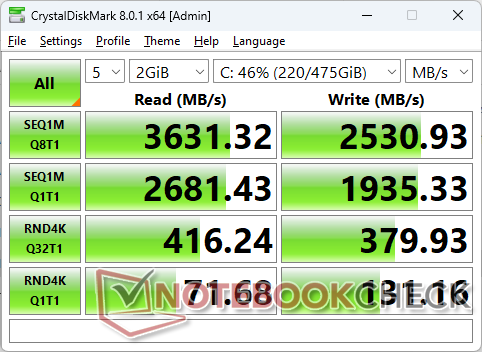
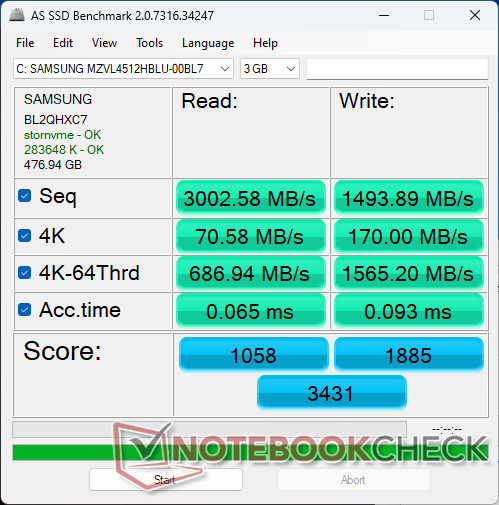
Speichergeräte
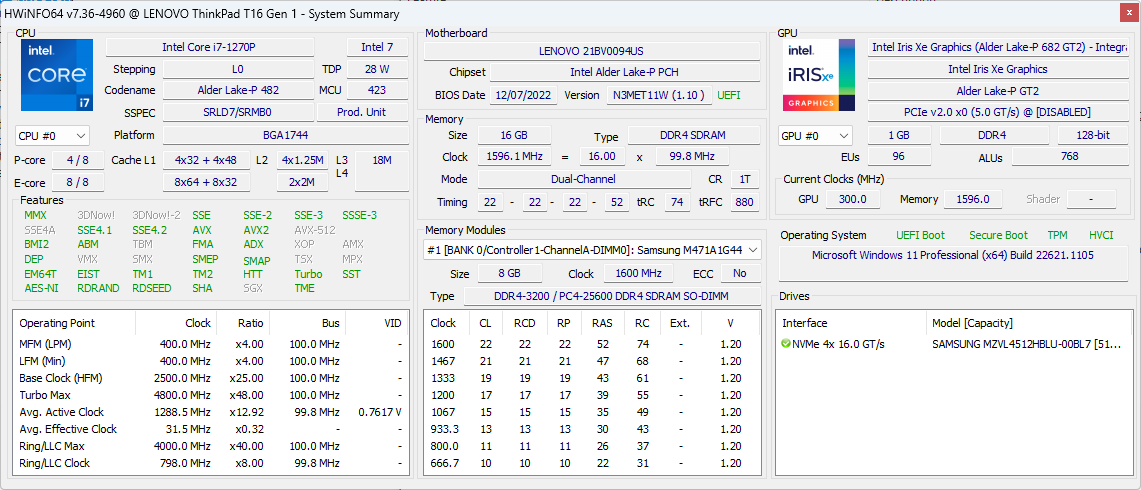
Unser Gerät wurde mit einer 512 GB Samsung PM9B1 PCIe4 x4 NVMe SSD anstelle der häufigeren Samsung PM9A1 ausgeliefert. Die PM9B1-Serie bietet um fast die Hälfte langsamere Übertragungsraten; die sequenziellen Leseraten erreichen bei unserem Gerät maximal ~3600 MB/s im Vergleich zu ~6300 MB/s beim LG Gram 16 mit dem Samsung PM9A1.

| Drive Performance Rating - Percent | |
| Huawei MateBook 16s i7 | |
| LG Gram 16Z90Q | |
| Lenovo ThinkPad T16 G1 21CH004MGE | |
| Lenovo ThinkPad T16 Gen 1 Core i7-1270P | |
| HP EliteBook 865 G9 | |
* ... kleinere Werte sind besser
Disk Throttling: DiskSpd Read Loop, Queue Depth 8
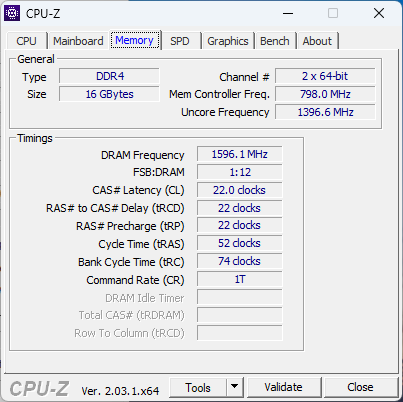
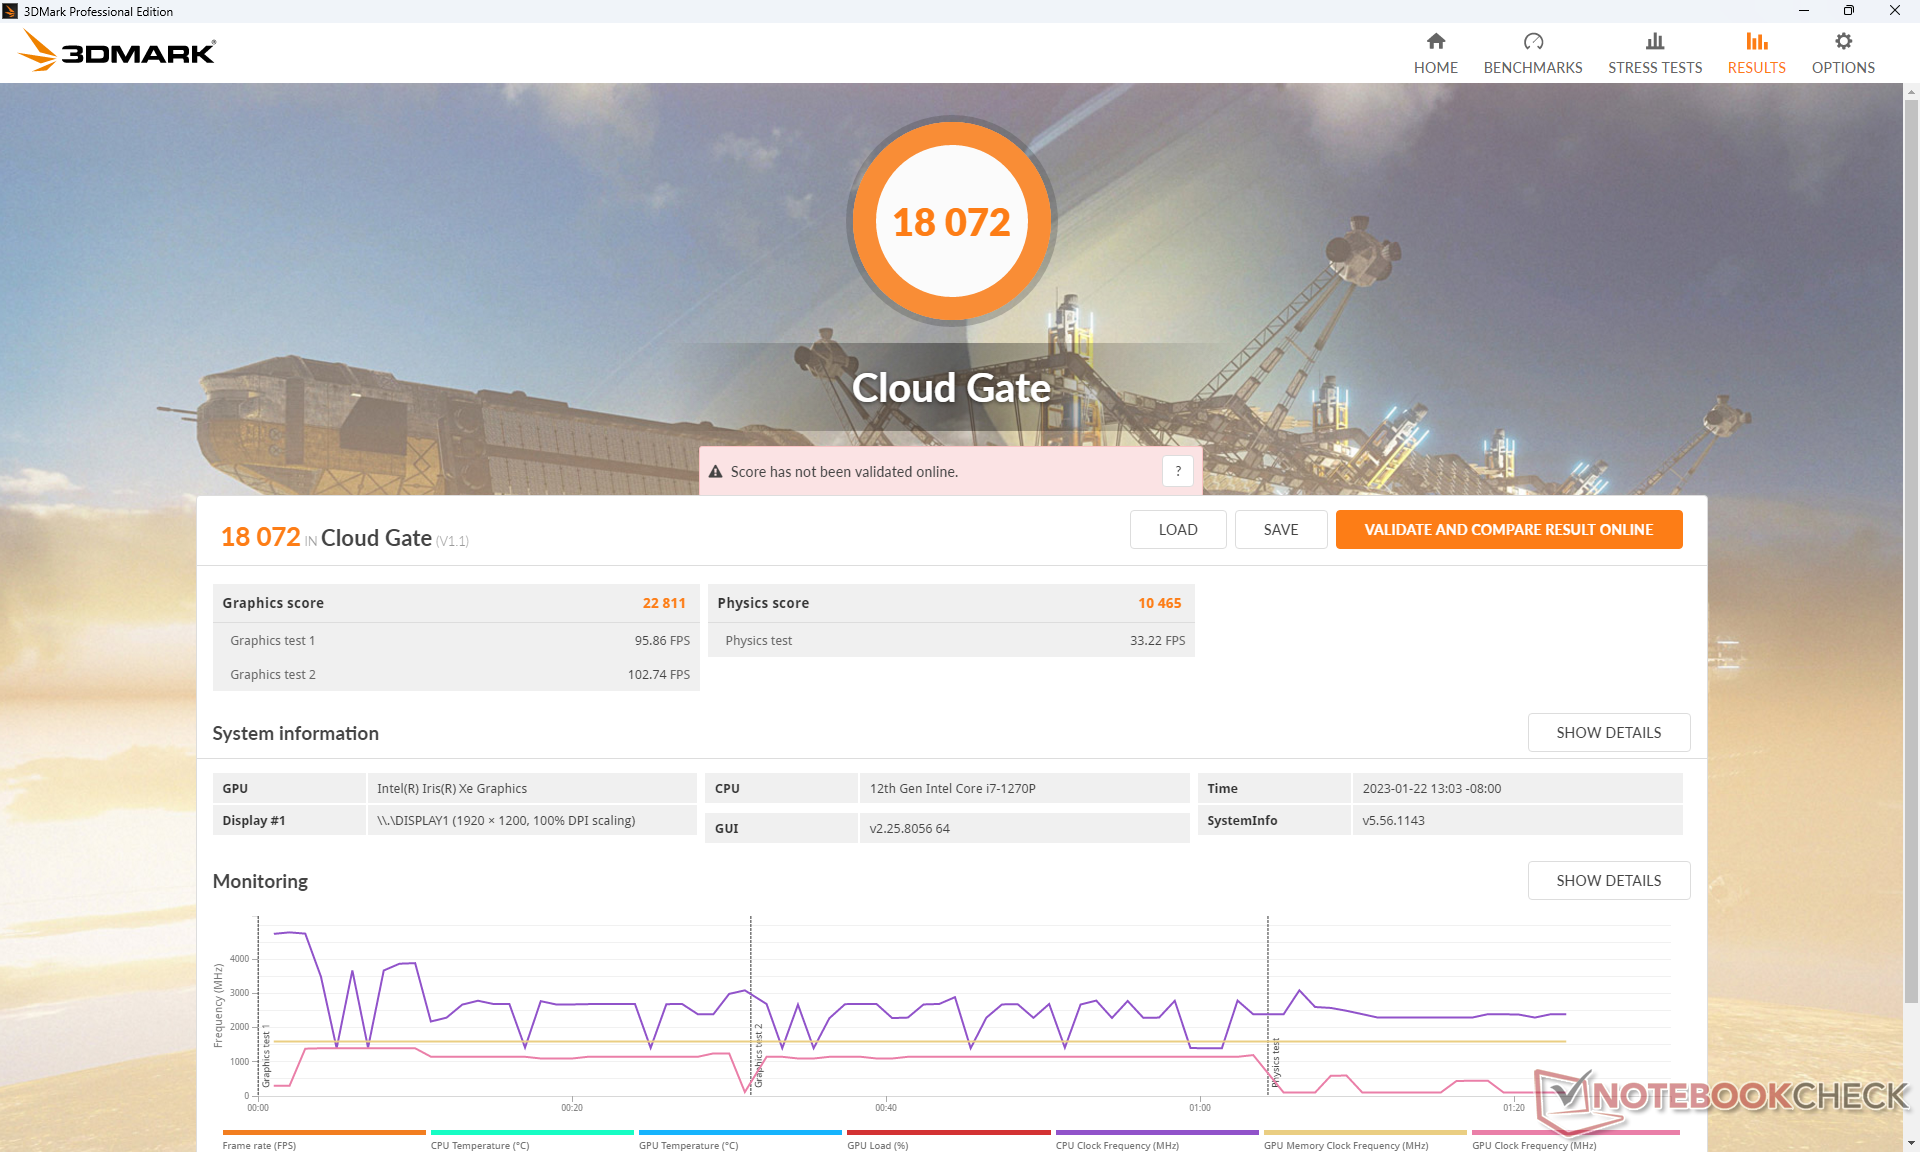
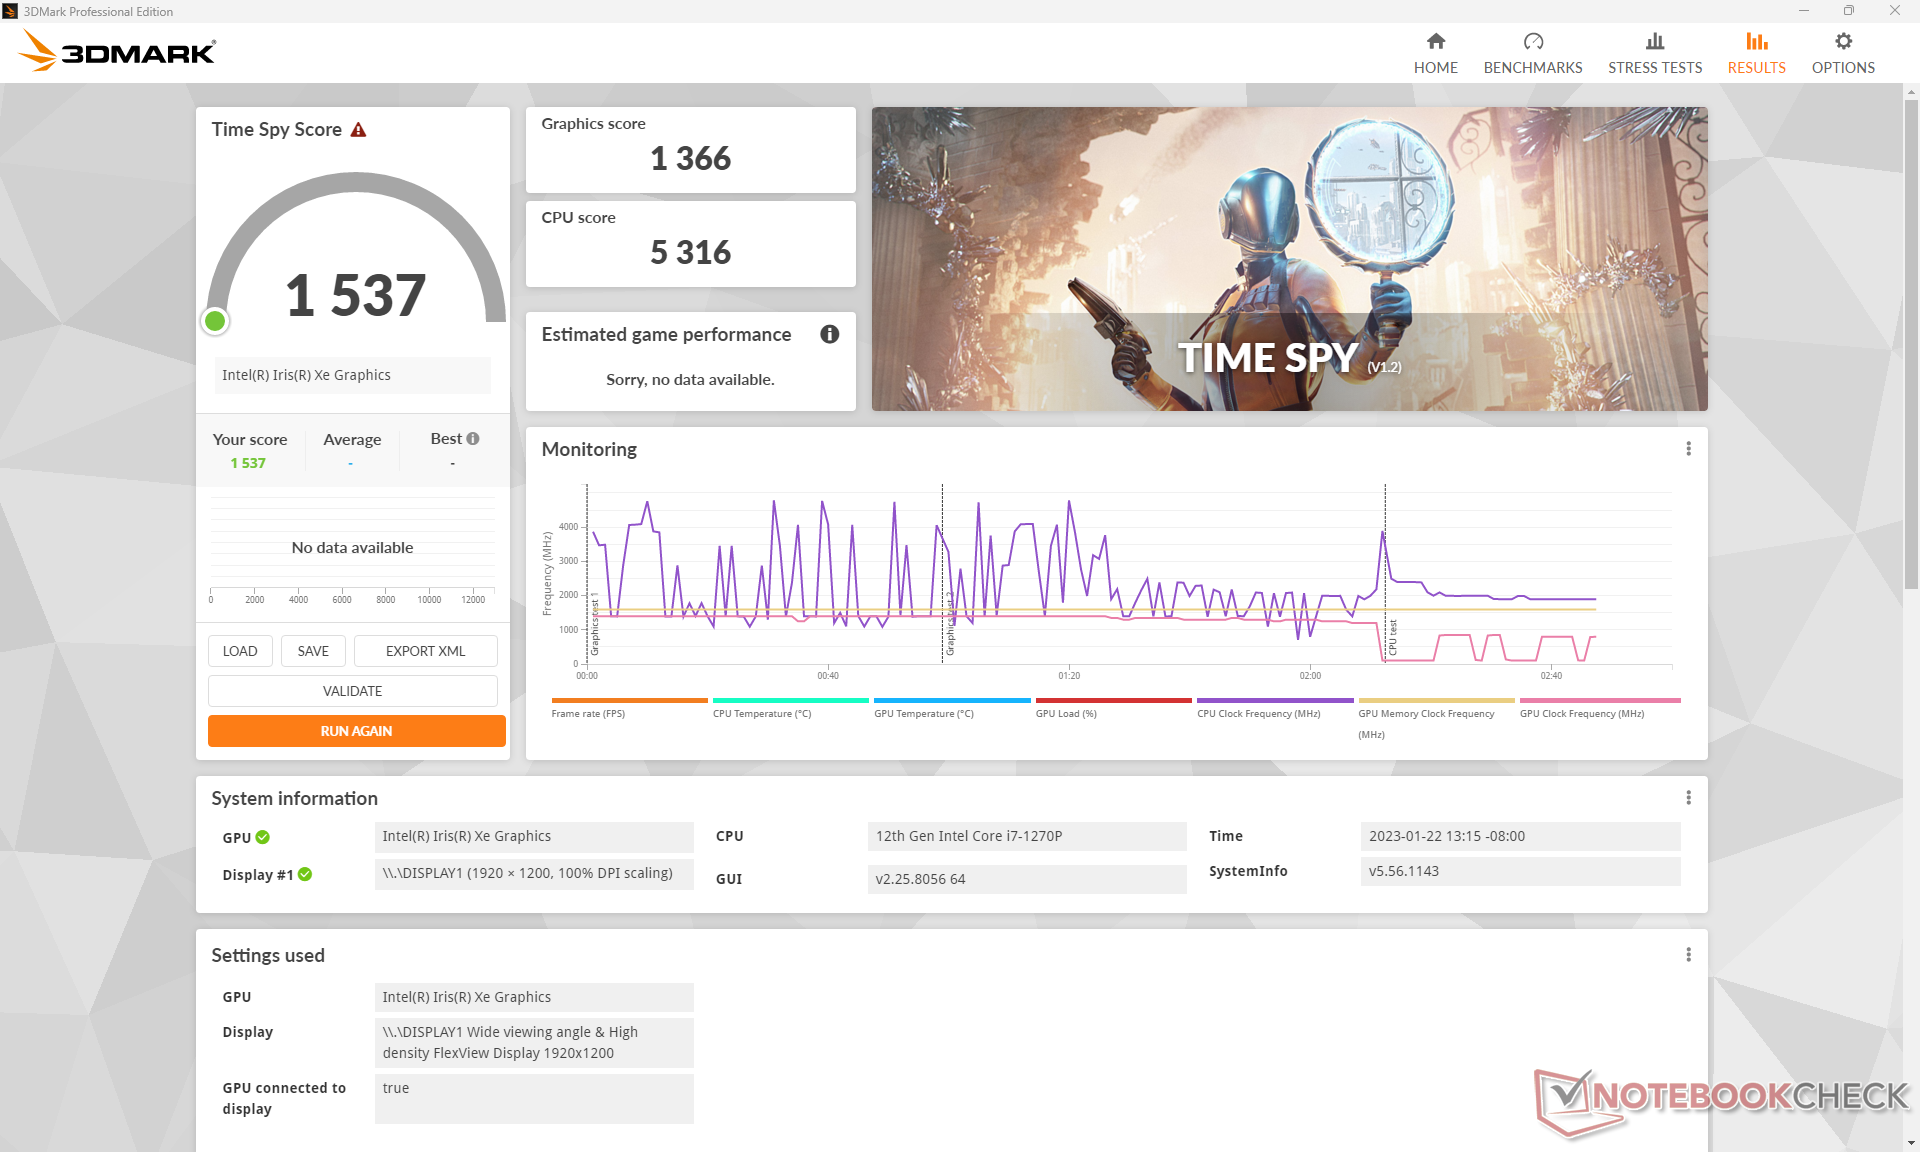
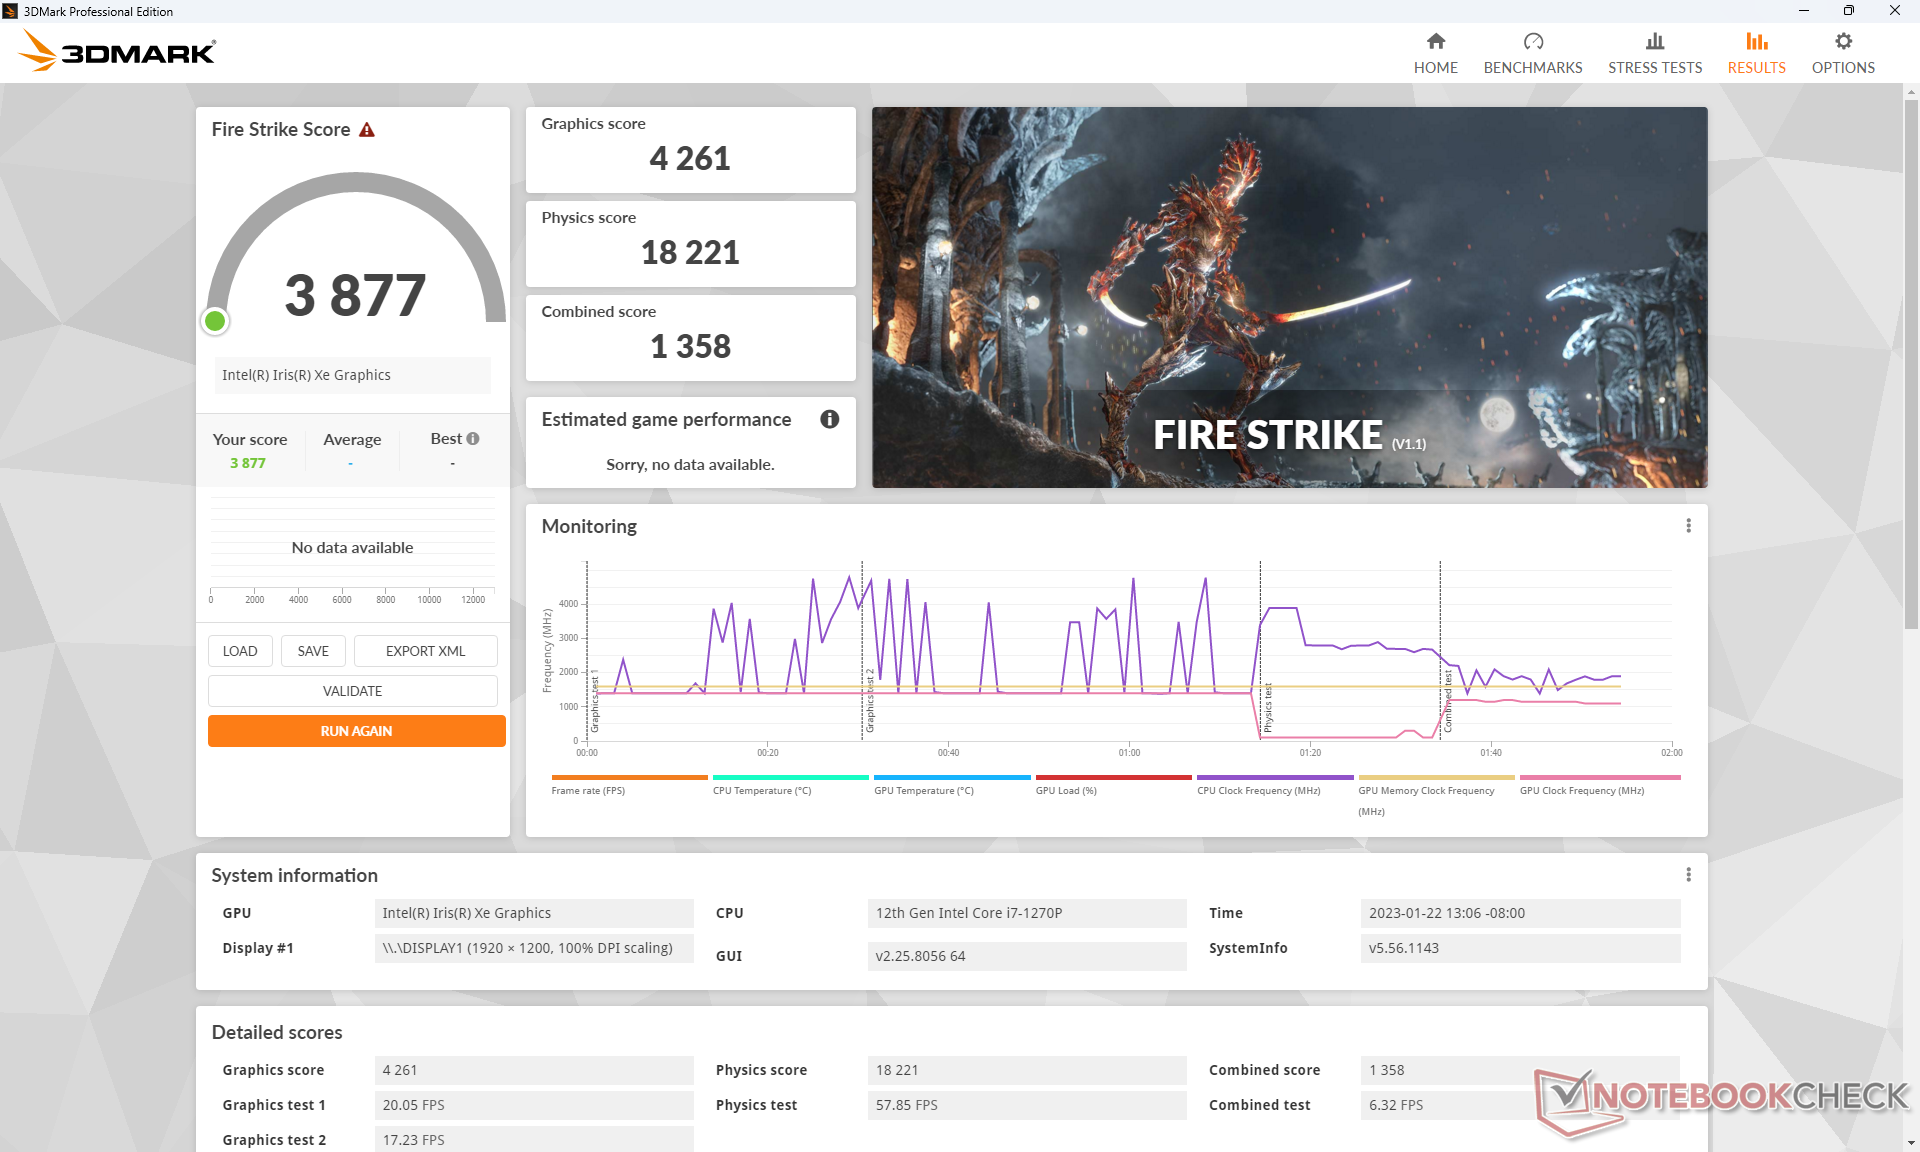
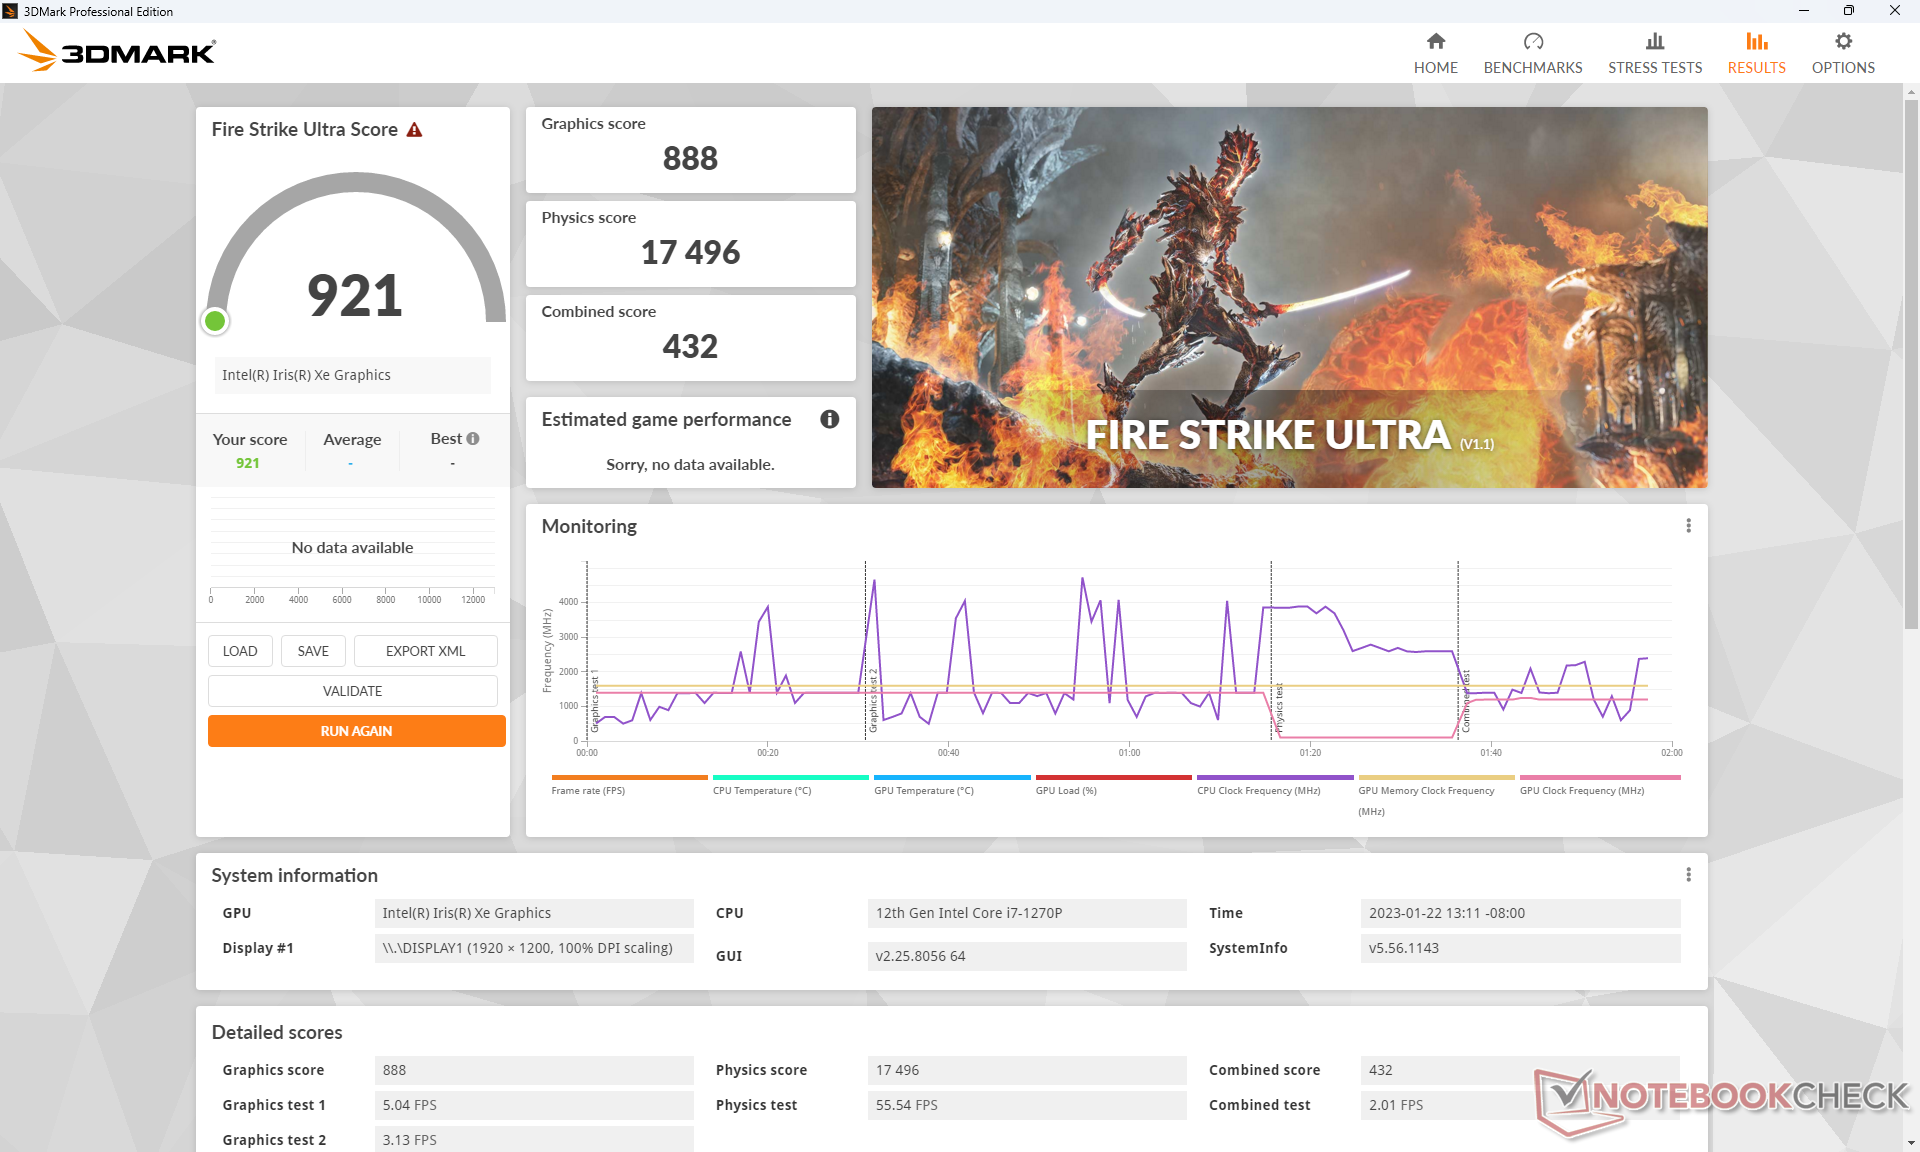
GPU Performance - Gebremst durch langsamen RAM
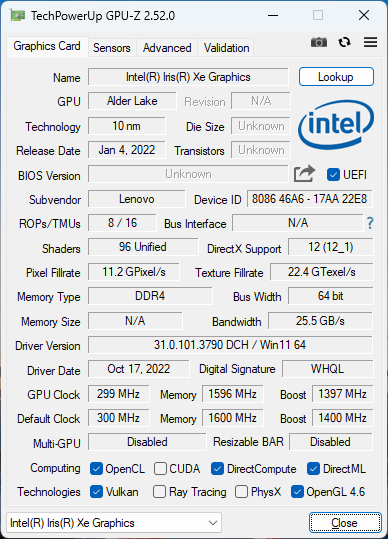
Die Grafikleistung ist etwa 10 % langsamer als die eines durchschnittlichen Notebooks in unserer Datenbank, das mit dem gleichen Iris Xe 96 EUs Grafikprozessor ausgestattet ist. Die schwache Leistung kann teilweise auf den langsamen DDR4-3200-RAM im Vergleich zu den meisten anderen Laptops mit Intel-CPUs der 12. Generation zurückgeführt werden. Das LG Gram 16 zum Beispiel wird mit schnellerem LPDDR5-5200 RAM ausgeliefert.
Außerdem kann die Grafikleistung allmählich langsamer werden, wenn hohe Lasten für längere Zeit ausgeführt werden. Im Leerlauf bei Witcher 3 bei niedrigen Einstellungen fielen die Bildraten von 84 FPS zu Beginn des Tests auf ~70 FPS nach ein paar Minuten, aufgrund des begrenzten Turbo-Boost-Potenzials des Systems.
Durch Aufrüsten auf eine Ryzen 5 Radeon 660M SKU wird die Grafikleistung um etwa 10 bis 15 Prozent gesteigert.
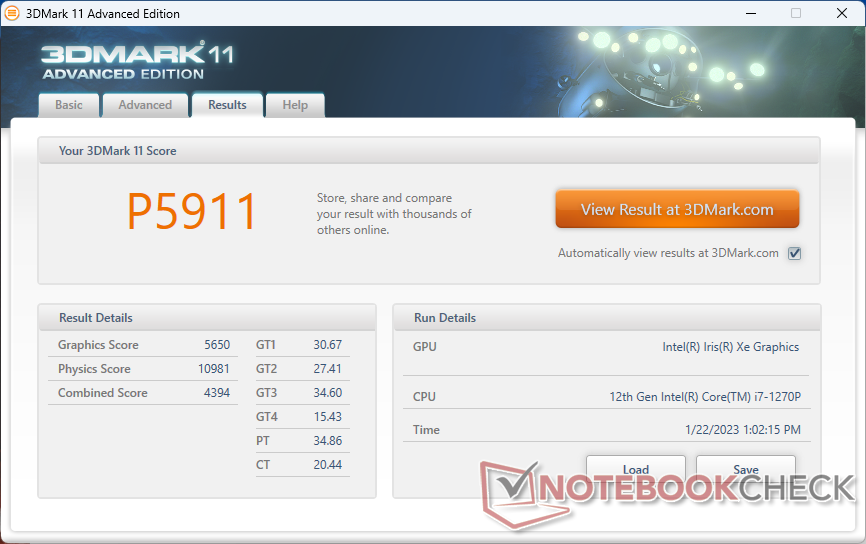
| 3DMark 11 Performance | 5911 Punkte | |
| 3DMark Cloud Gate Standard Score | 18072 Punkte | |
| 3DMark Fire Strike Score | 3877 Punkte | |
| 3DMark Time Spy Score | 1537 Punkte | |
Hilfe | ||
| Cyberpunk 2077 1.6 - 1920x1080 Low Preset | |
| Lenovo Yoga 7-14ARB G7 | |
| Asus ZenBook Flip 15 Q508U | |
| Durchschnittliche Intel Iris Xe Graphics G7 96EUs (13 - 25.9, n=42) | |
| Lenovo ThinkPad T16 Gen 1 Core i7-1270P | |
Witcher 3 FPS Chart
| min. | mittel | hoch | max. | |
|---|---|---|---|---|
| GTA V (2015) | 97.8 | 74.8 | 14.1 | 4.85 |
| The Witcher 3 (2015) | 82.1 | 50.4 | 24.4 | 11.2 |
| Dota 2 Reborn (2015) | 110.6 | 71.9 | 48.9 | 44.6 |
| Final Fantasy XV Benchmark (2018) | 31.4 | 16.8 | 12.6 | |
| X-Plane 11.11 (2018) | 39.7 | 31.9 | 29.2 | |
| Strange Brigade (2018) | 79.2 | 29.8 | 24.2 | 19.1 |
| Cyberpunk 2077 1.6 (2022) | 18.4 |
Emissionen
Systemgeräusche - Fast immer leise
Das beobachtete Lüftergeräusch ist eines der leisesten in dieser Gerätekategorie, was zum Teil die schlechte Performance-Konstanz des Prozessors in den obigen Benchmarks erklärt. Der interne Lüfter ist kaum hörbar, selbst wenn das System auf 'Performance' eingestellt ist und anspruchsvolle Lasten wie Spiele laufen. Hin und wieder pulsiert er für kurze Zeit auf bis zu 34 dB(A) bevor wieder Stille einkehrt, aber selbst dieses Maximum ist leiser als bei den meisten Laptops. Das HP EliteBook 865 G9 verfolgt einen ähnlichen Ansatz in Bezug auf die Lüftergeräusche, um auch hier ein sehr leises Nutzererlebnis zu gewährleisten. Daher gibt es kaum einen Grund, einen anderen Modus als Performance zu wählen.
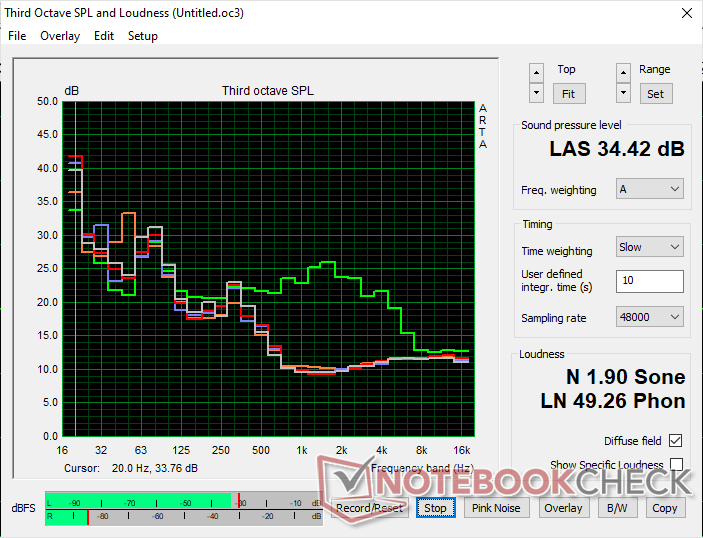
Lautstärkediagramm
| Idle |
| 24.7 / 24.7 / 24.7 dB(A) |
| Last |
| 24.5 / 34.4 dB(A) |
 | ||
30 dB leise 40 dB(A) deutlich hörbar 50 dB(A) störend |
||
min: | ||
| Lenovo ThinkPad T16 Gen 1 Core i7-1270P Iris Xe G7 96EUs, i7-1270P, Samsung PM9B1 512GB MZAL4512HBLU | Lenovo ThinkPad T16 G1 21CH004MGE Radeon 660M, R5 PRO 6650U, Micron 2450 512GB MTFDKBA512TFK | LG Gram 16Z90Q Iris Xe G7 96EUs, i7-1260P, Samsung PM9A1 MZVL21T0HCLR | HP EliteBook 865 G9 Radeon 680M, R7 PRO 6850U, Samsung PM991 MZVLQ512HBLU | Huawei MateBook 16s i7 Iris Xe G7 96EUs, i7-12700H, Silicon Motion PCIe-8 SSD | Apple MacBook Pro 16 2021 M1 Pro M1 Pro 16-Core GPU, M1 Pro, Apple SSD AP1024R | |
|---|---|---|---|---|---|---|
| Geräuschentwicklung | -6% | -21% | -1% | -15% | -3% | |
| aus / Umgebung * (dB) | 24.7 | 23.1 6% | 25 -1% | 23 7% | 24 3% | 24.7 -0% |
| Idle min * (dB) | 24.7 | 23.1 6% | 26 -5% | 23 7% | 24 3% | 24.7 -0% |
| Idle avg * (dB) | 24.7 | 23.1 6% | 27 -9% | 23 7% | 25.2 -2% | 24.7 -0% |
| Idle max * (dB) | 24.7 | 23.1 6% | 28 -13% | 23 7% | 27.2 -10% | 24.7 -0% |
| Last avg * (dB) | 24.5 | 25.4 -4% | 38 -55% | 29.1 -19% | 34.8 -42% | 26.1 -7% |
| Witcher 3 ultra * (dB) | 24.3 | 35.93 -48% | 37 -52% | 29.1 -20% | 34.8 -43% | |
| Last max * (dB) | 34.4 | 39.1 -14% | 38 -10% | 32.9 4% | 39 -13% | 37.4 -9% |
* ... kleinere Werte sind besser
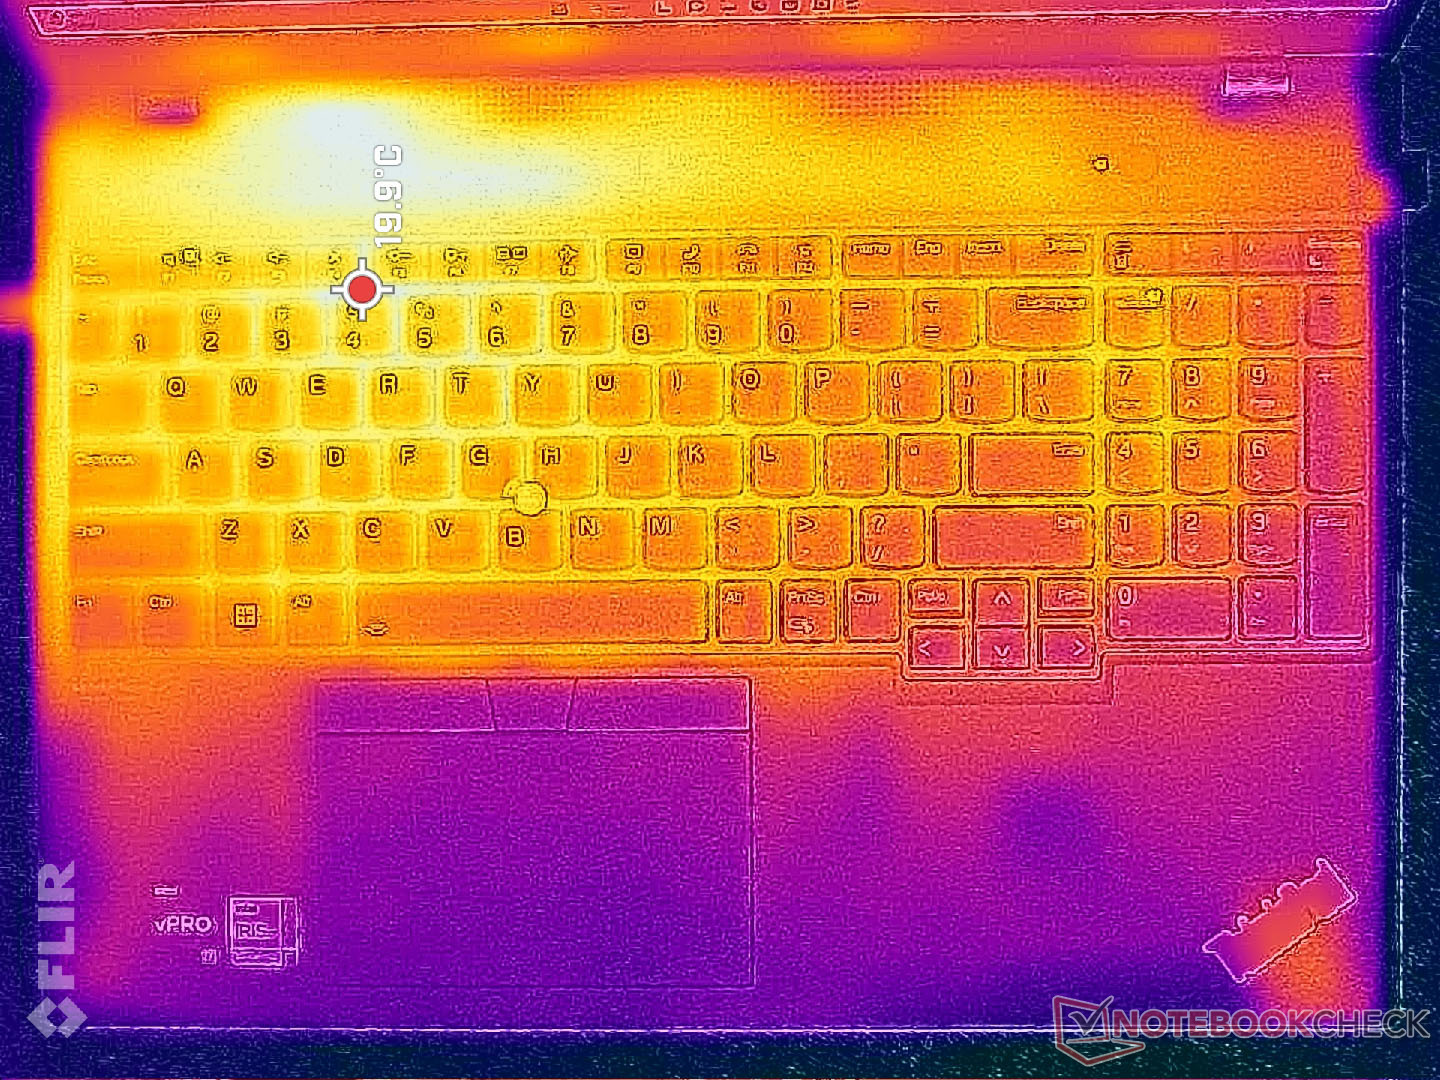
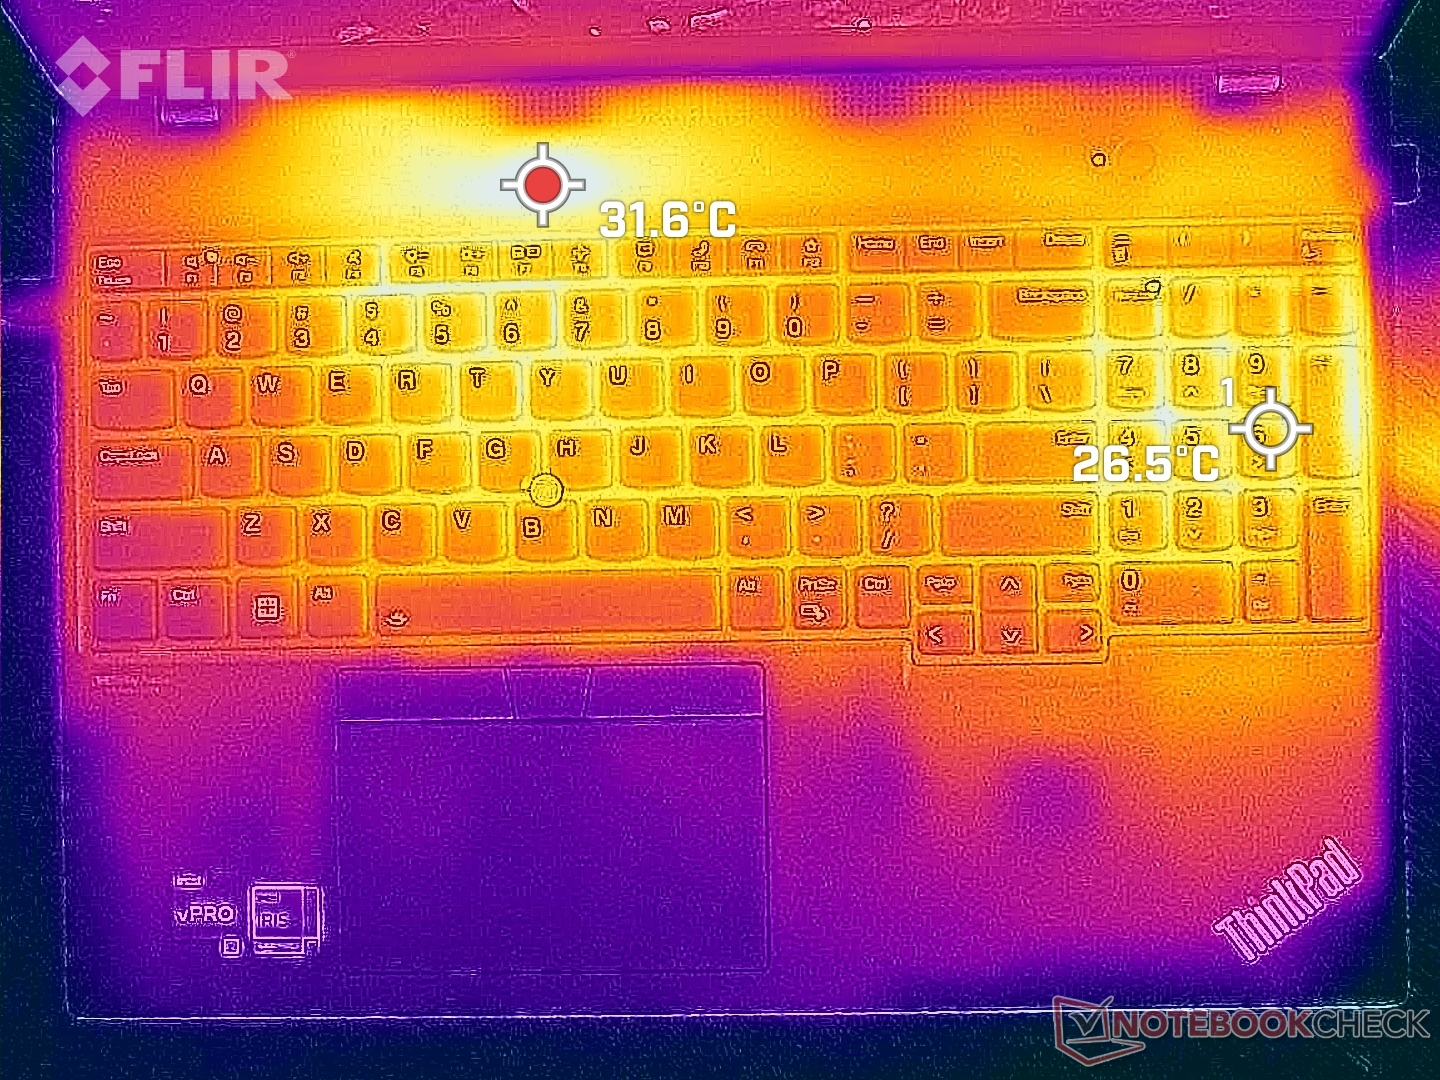
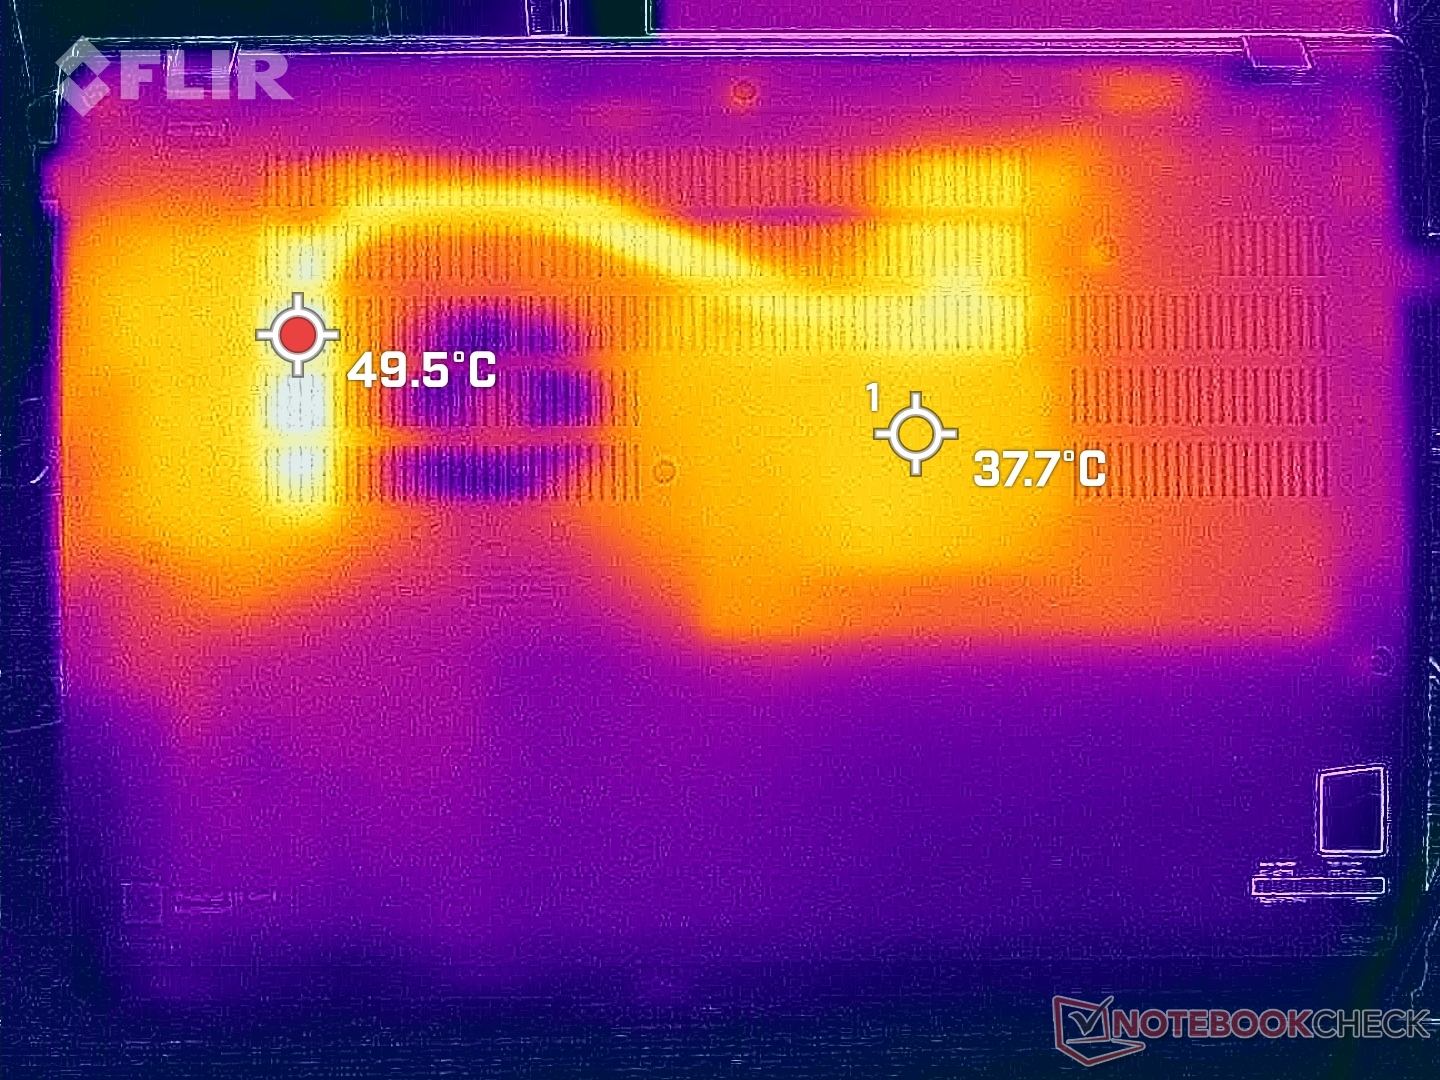
Temperatur
Die Temperaturen sind auf der Oberseite viel kühler als auf der Unterseite. Die durchschnittliche Temperatur auf der Tastatur und den Handballenablagen liegt bei anspruchsvollen Aufgaben bei 29 °C, während sie auf der Unterseite 36 °C beträgt. Dies steht im Gegensatz zu den meisten anderen Laptops wie dem LG Gram 16 wo die Tastatur 44 °C erreichen kann und damit über 10 °C wärmer ist als bei unserem ThinkPad T16 G1.
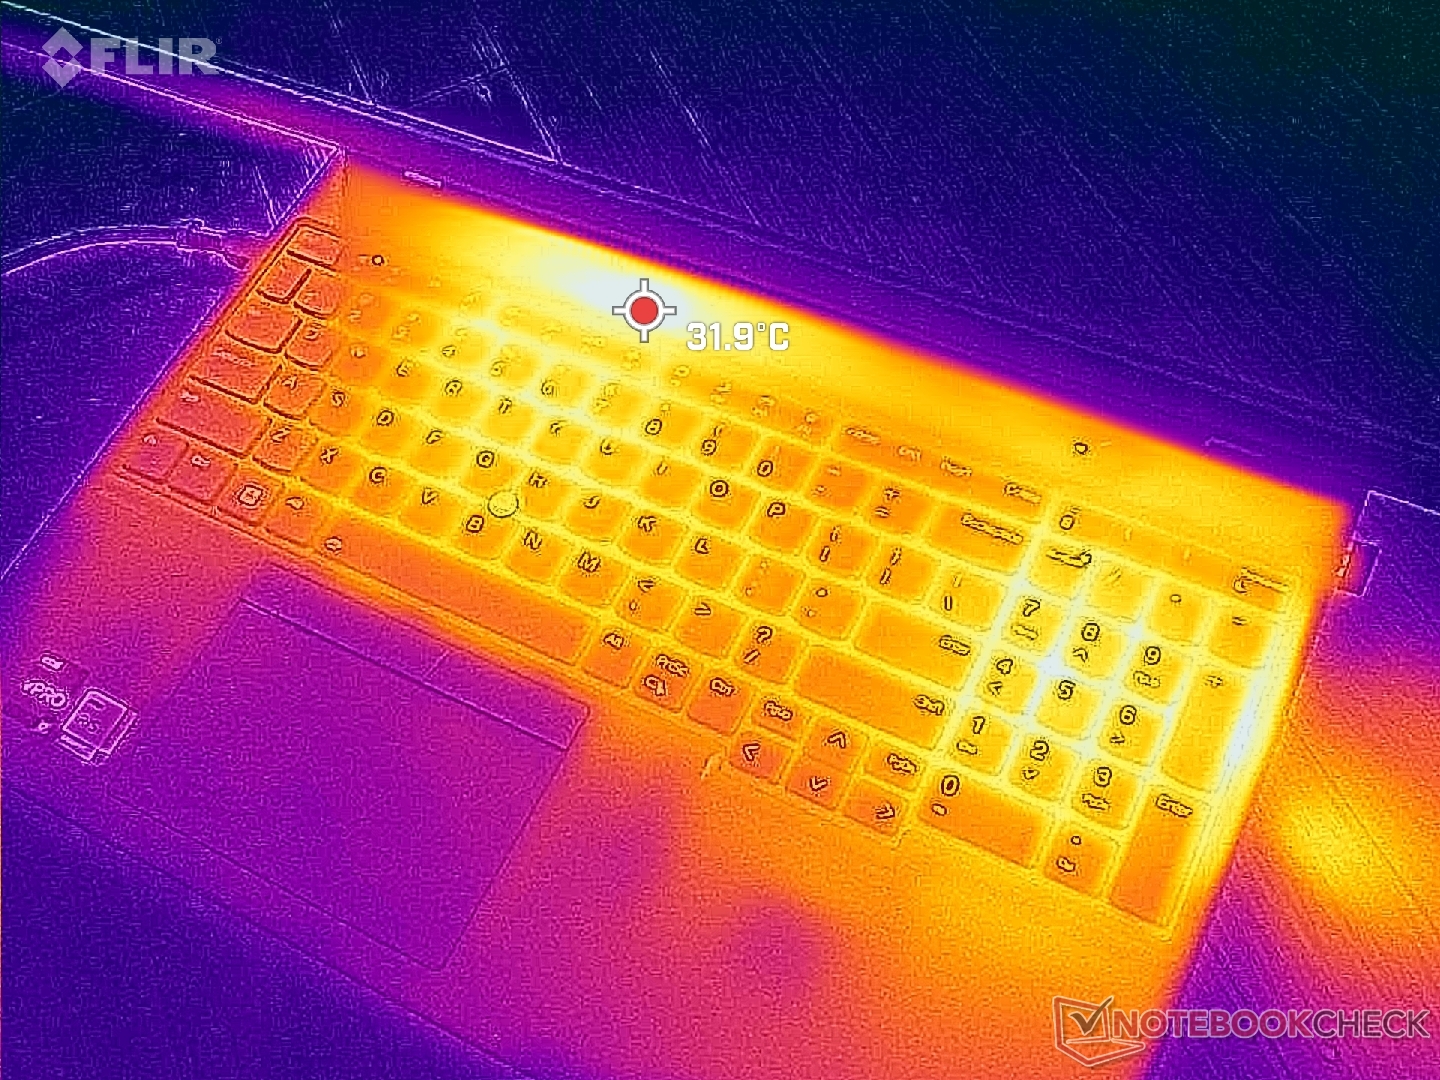
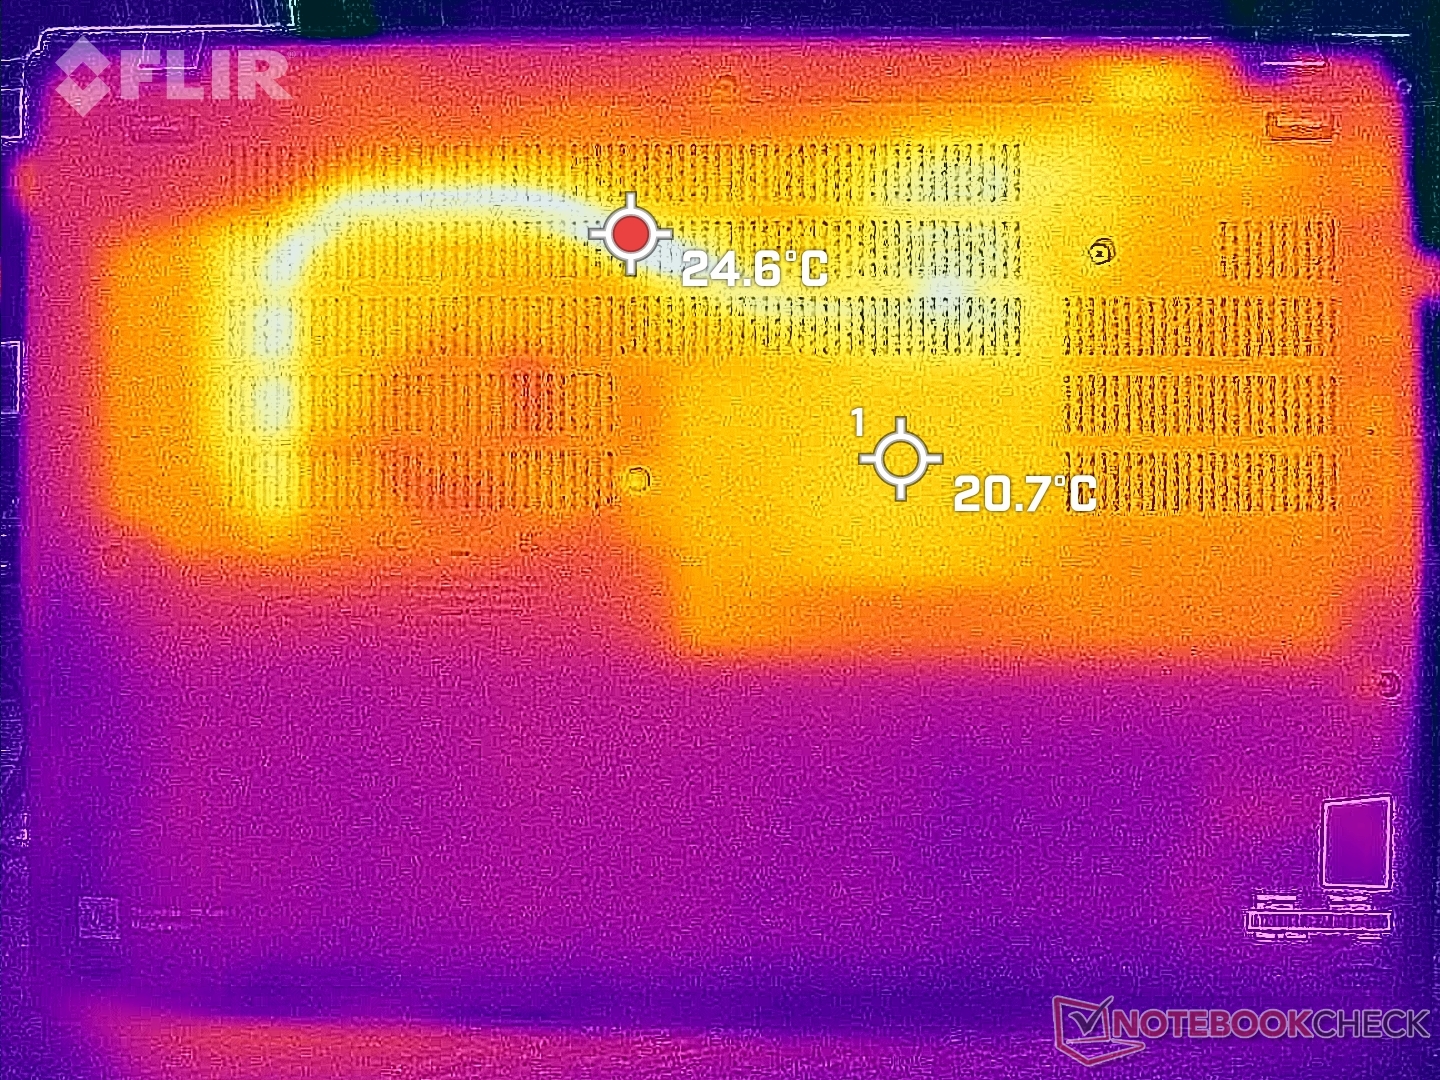
(+) Die maximale Temperatur auf der Oberseite ist 33.8 °C. Im Vergleich liegt der Klassendurchschnitt bei 34.3 °C (von 21.2 bis 62.5 °C für die Klasse Office).
(-) Auf der Unterseite messen wir eine maximalen Wert von 47 °C (im Vergleich zum Durchschnitt von 36.8 °C).
(+) Ohne Last messen wir eine durchschnittliche Temperatur von 22.6 °C auf der Oberseite. Der Klassendurchschnitt erreicht 29.5 °C.
(+) Die Handballen und der Touchpad-Bereich sind mit gemessenen 24.6 °C kühler als die typische Hauttemperatur und fühlen sich dadurch kühl an.
(+) Die durchschnittliche Handballen-Temperatur anderer getesteter Geräte war 27.5 °C (+2.9 °C).
| Lenovo ThinkPad T16 Gen 1 Core i7-1270P Intel Core i7-1270P, Intel Iris Xe Graphics G7 96EUs | Lenovo ThinkPad T16 G1 21BWS00200 Intel Core i5-1240P, Intel Iris Xe Graphics G7 80EUs | LG Gram 16Z90Q Intel Core i7-1260P, Intel Iris Xe Graphics G7 96EUs | HP EliteBook 865 G9 AMD Ryzen 7 PRO 6850U, AMD Radeon 680M | Huawei MateBook 16s i7 Intel Core i7-12700H, Intel Iris Xe Graphics G7 96EUs | Apple MacBook Pro 16 2021 M1 Pro Apple M1 Pro, Apple M1 Pro 16-Core GPU | |
|---|---|---|---|---|---|---|
| Hitze | -19% | -6% | 0% | -13% | 3% | |
| Last oben max * (°C) | 33.8 | 45 -33% | 45 -33% | 39.4 -17% | 40.9 -21% | 41 -21% |
| Last unten max * (°C) | 47 | 42.8 9% | 43 9% | 47.6 -1% | 48.3 -3% | 39 17% |
| Idle oben max * (°C) | 24.6 | 33 -34% | 26 -6% | 23.6 4% | 29.2 -19% | 24 2% |
| Idle unten max * (°C) | 28.2 | 33.6 -19% | 26 8% | 24.1 15% | 30.4 -8% | 24 15% |
* ... kleinere Werte sind besser
Stresstest
Der steile Leistungsabfall während unserer Witcher-3- und CineBench-R15-xT-Schleifentests kann über HWiNFO beobachtet werden. Bei der Ausführung von Prime95 beispielsweise steigen die CPU-Taktraten und die Leistungsaufnahme des Boards auf bis zu 3,5 GHz bzw. 48 W. Sobald die Kerntemperatur einige Sekunden später 97 °C erreicht, sinken die Taktraten und die Leistungsaufnahme auf 1,7 GHz bzw. 22 W, um eine kühlere Kerntemperatur von 69 °C aufrechtzuerhalten. Der Einsatz von ThrottleStop erhöht die stabile Taktrate auf einen höheren Bereich von 2 bis 3 GHz, allerdings auf Kosten wärmerer Kerntemperaturen.
Die GPU-Taktraten und die Temperatur in Witcher 3 stabilisiert sich bei 998 MHz bzw. 67 °C, verglichen mit 1100 MHz und 58 °C auf dem kleineren HP Dragonfly Folio 13.5 G3. Der Einsatz im Akkubetrieb scheint die Leistung nicht zu beeinträchtigen.
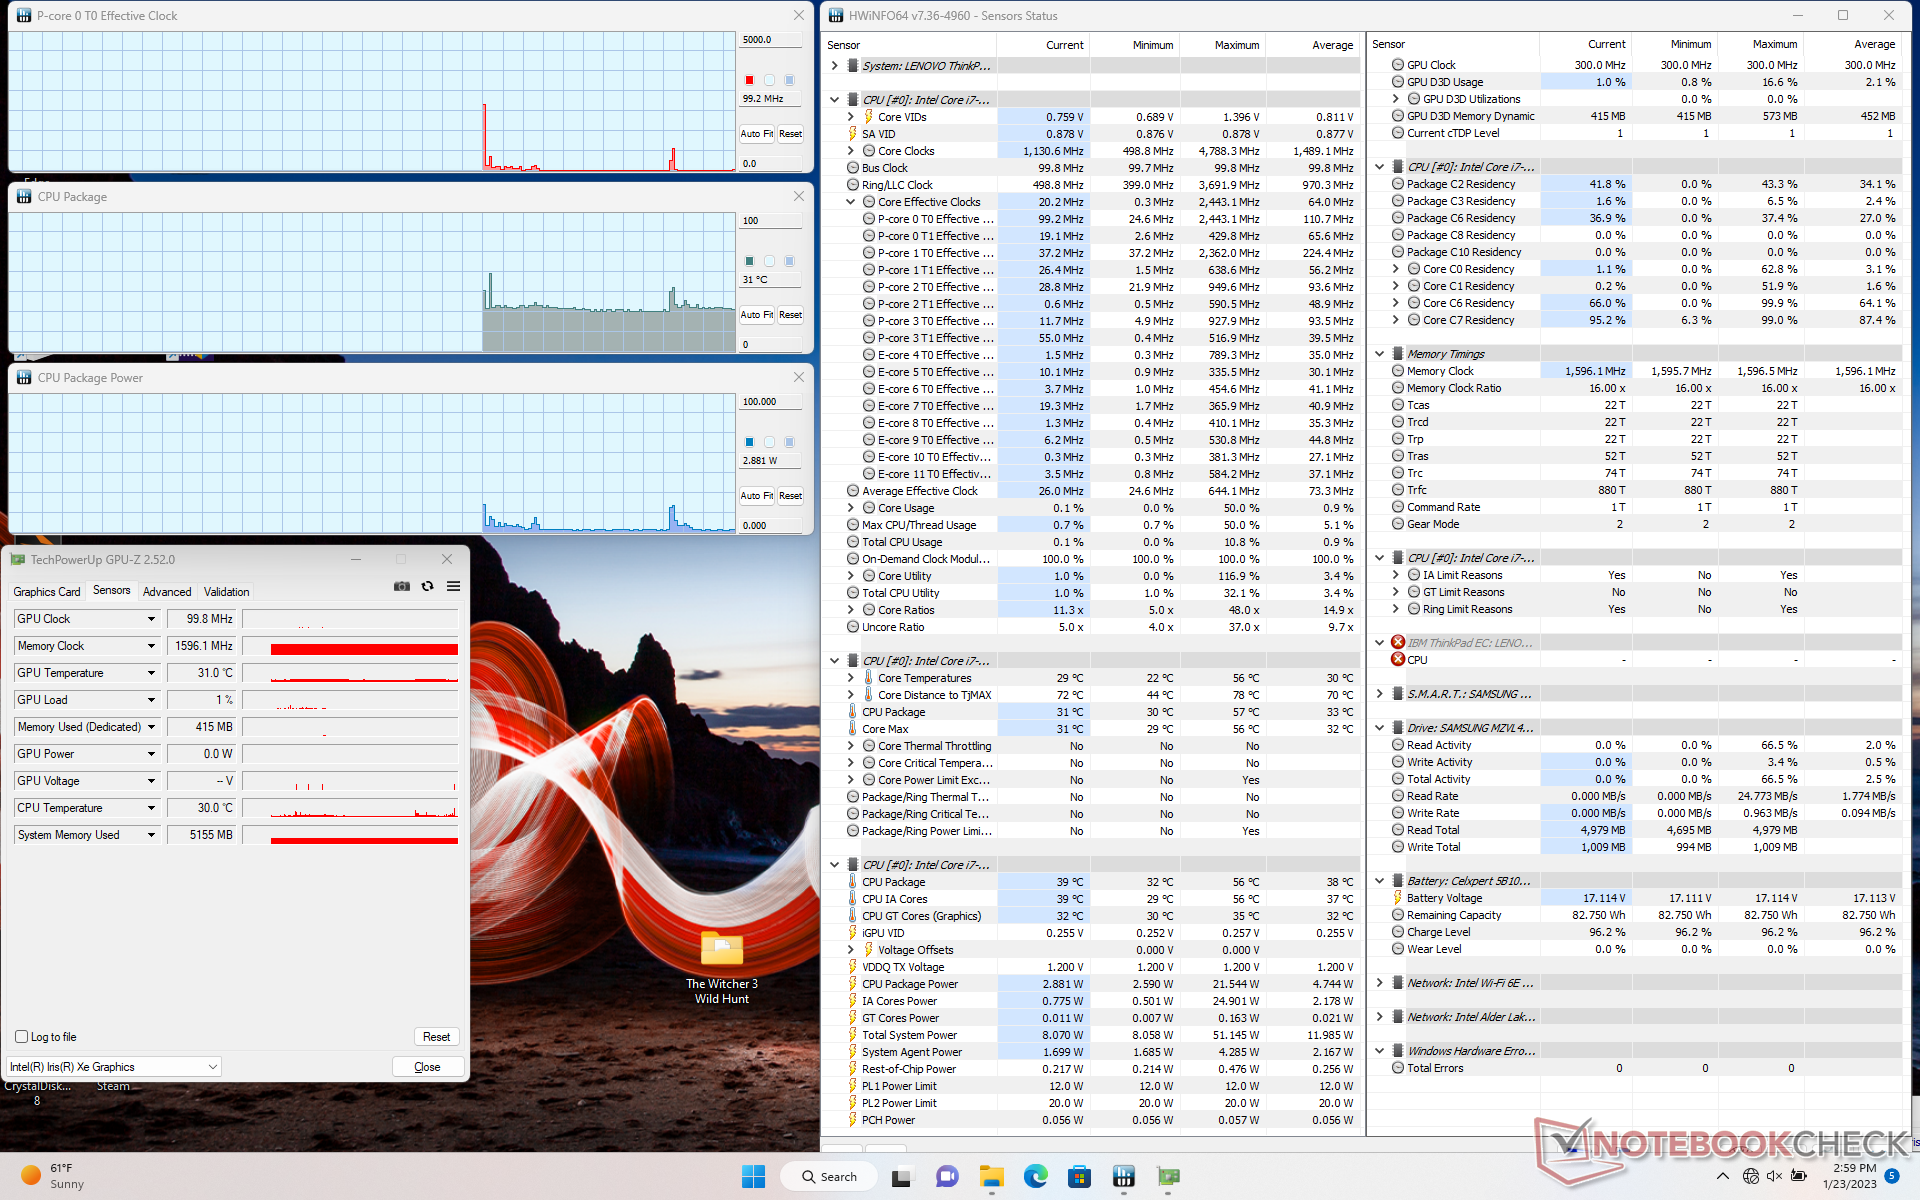
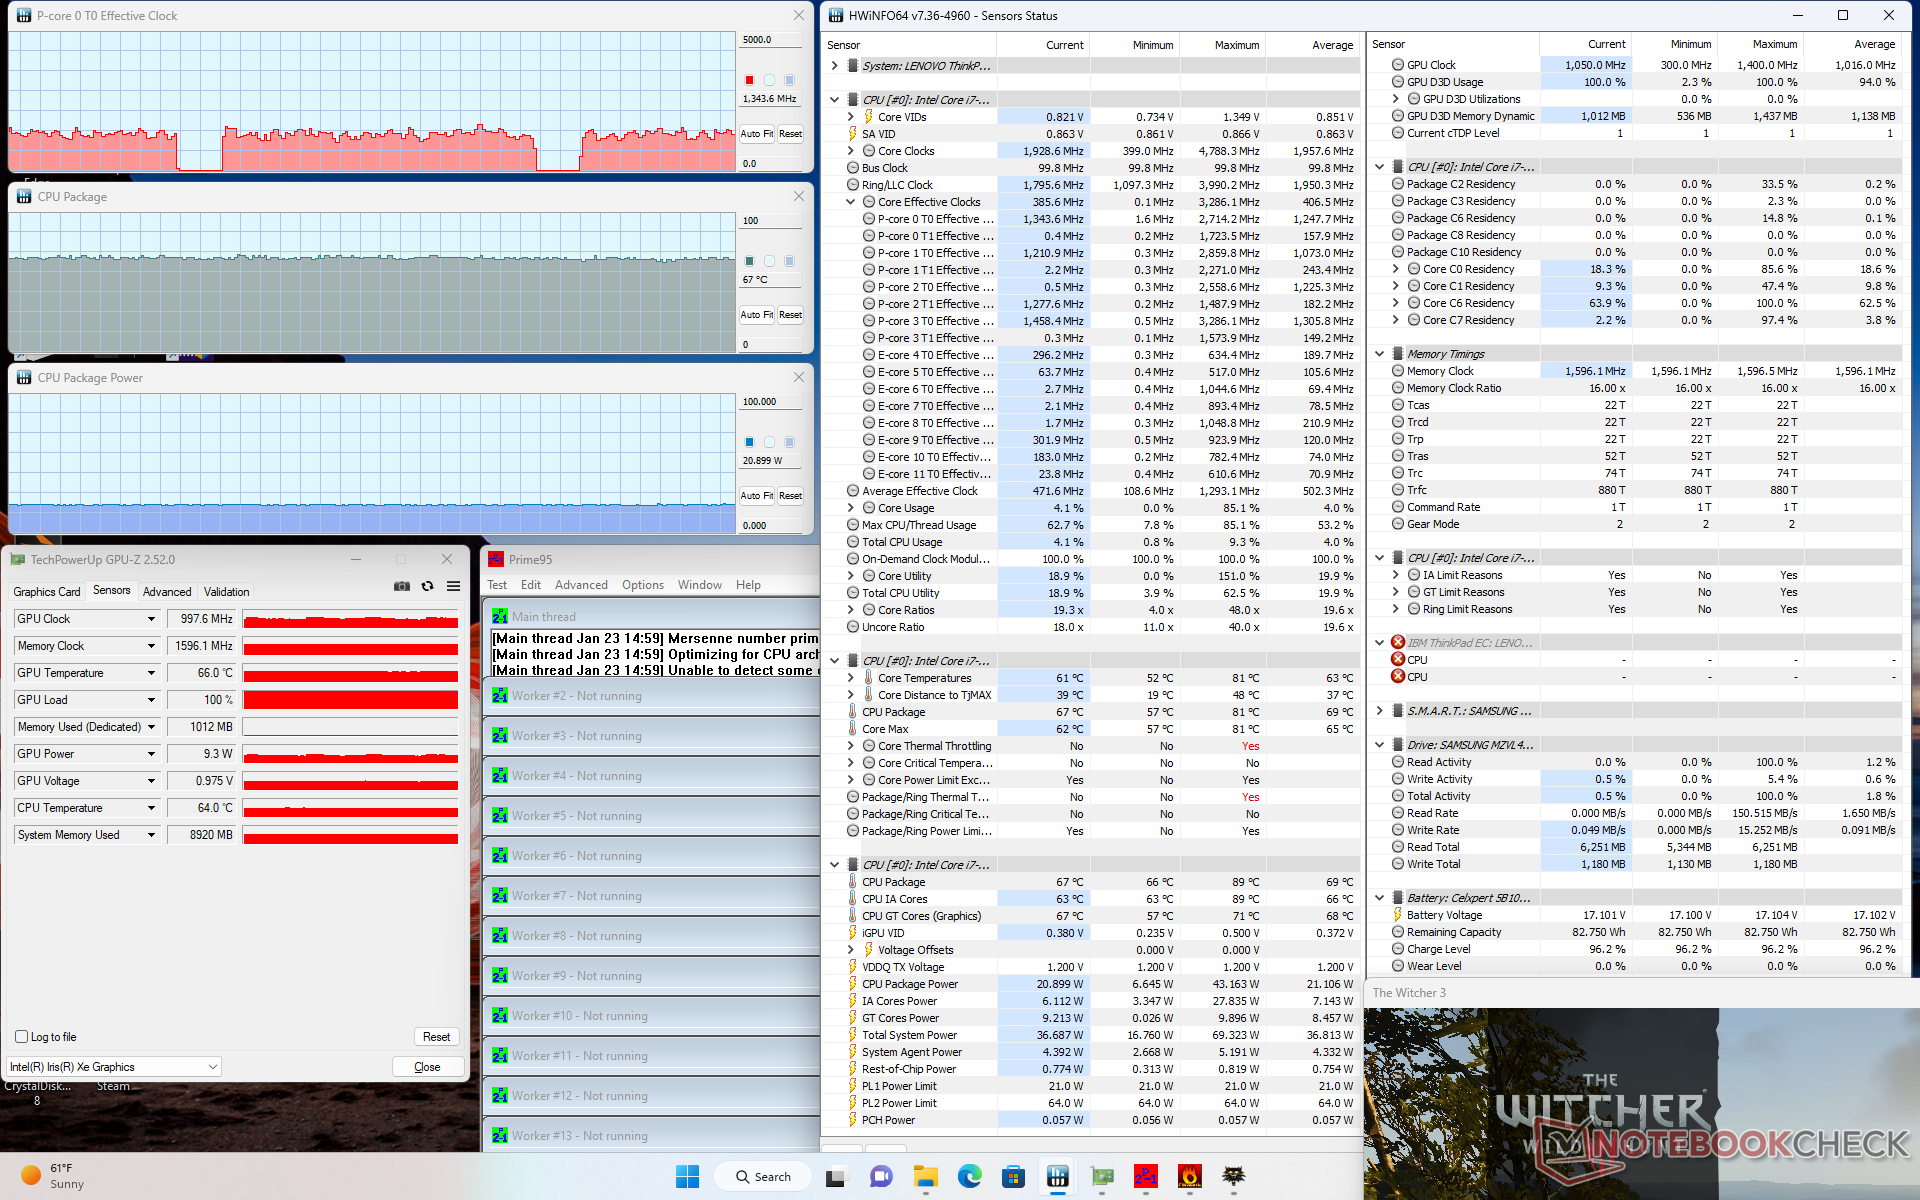
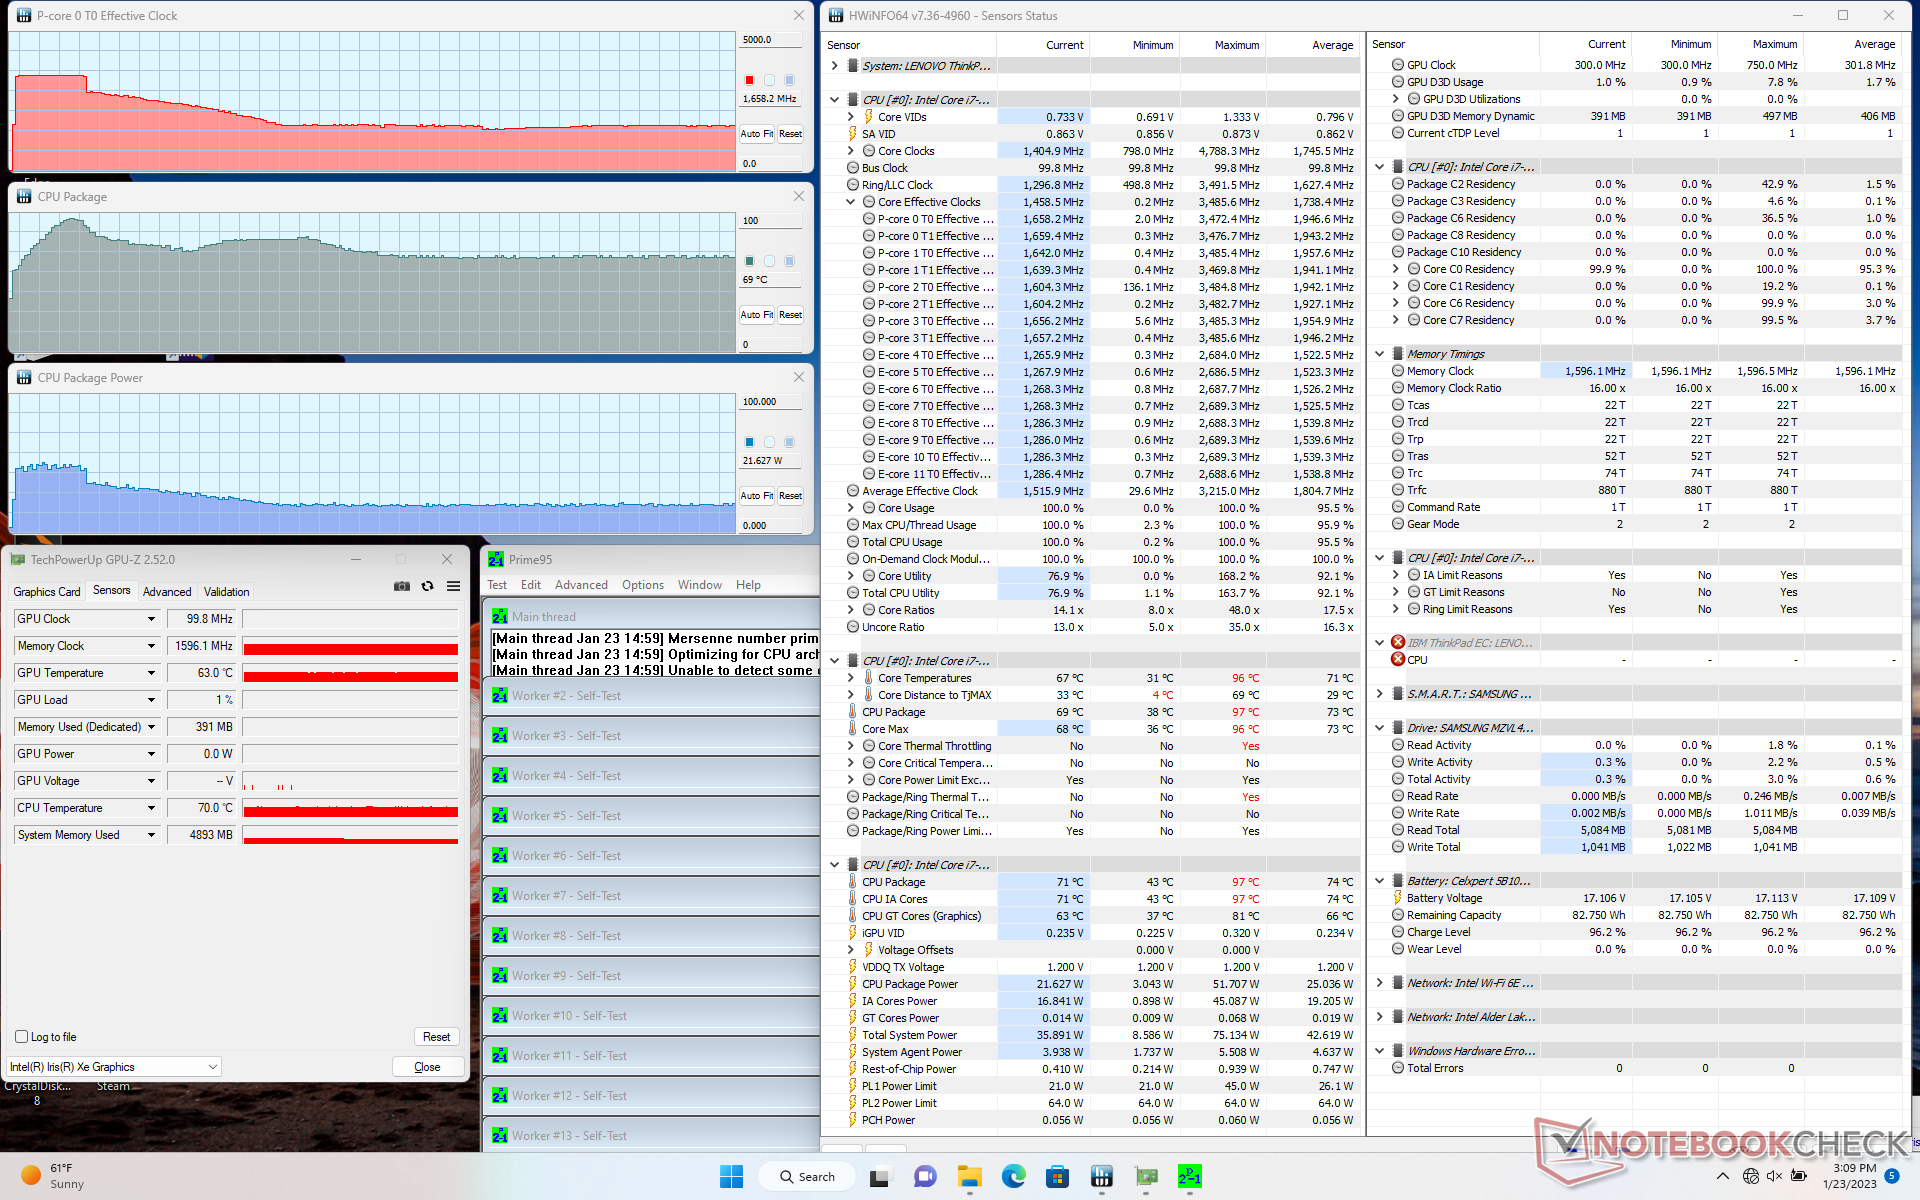
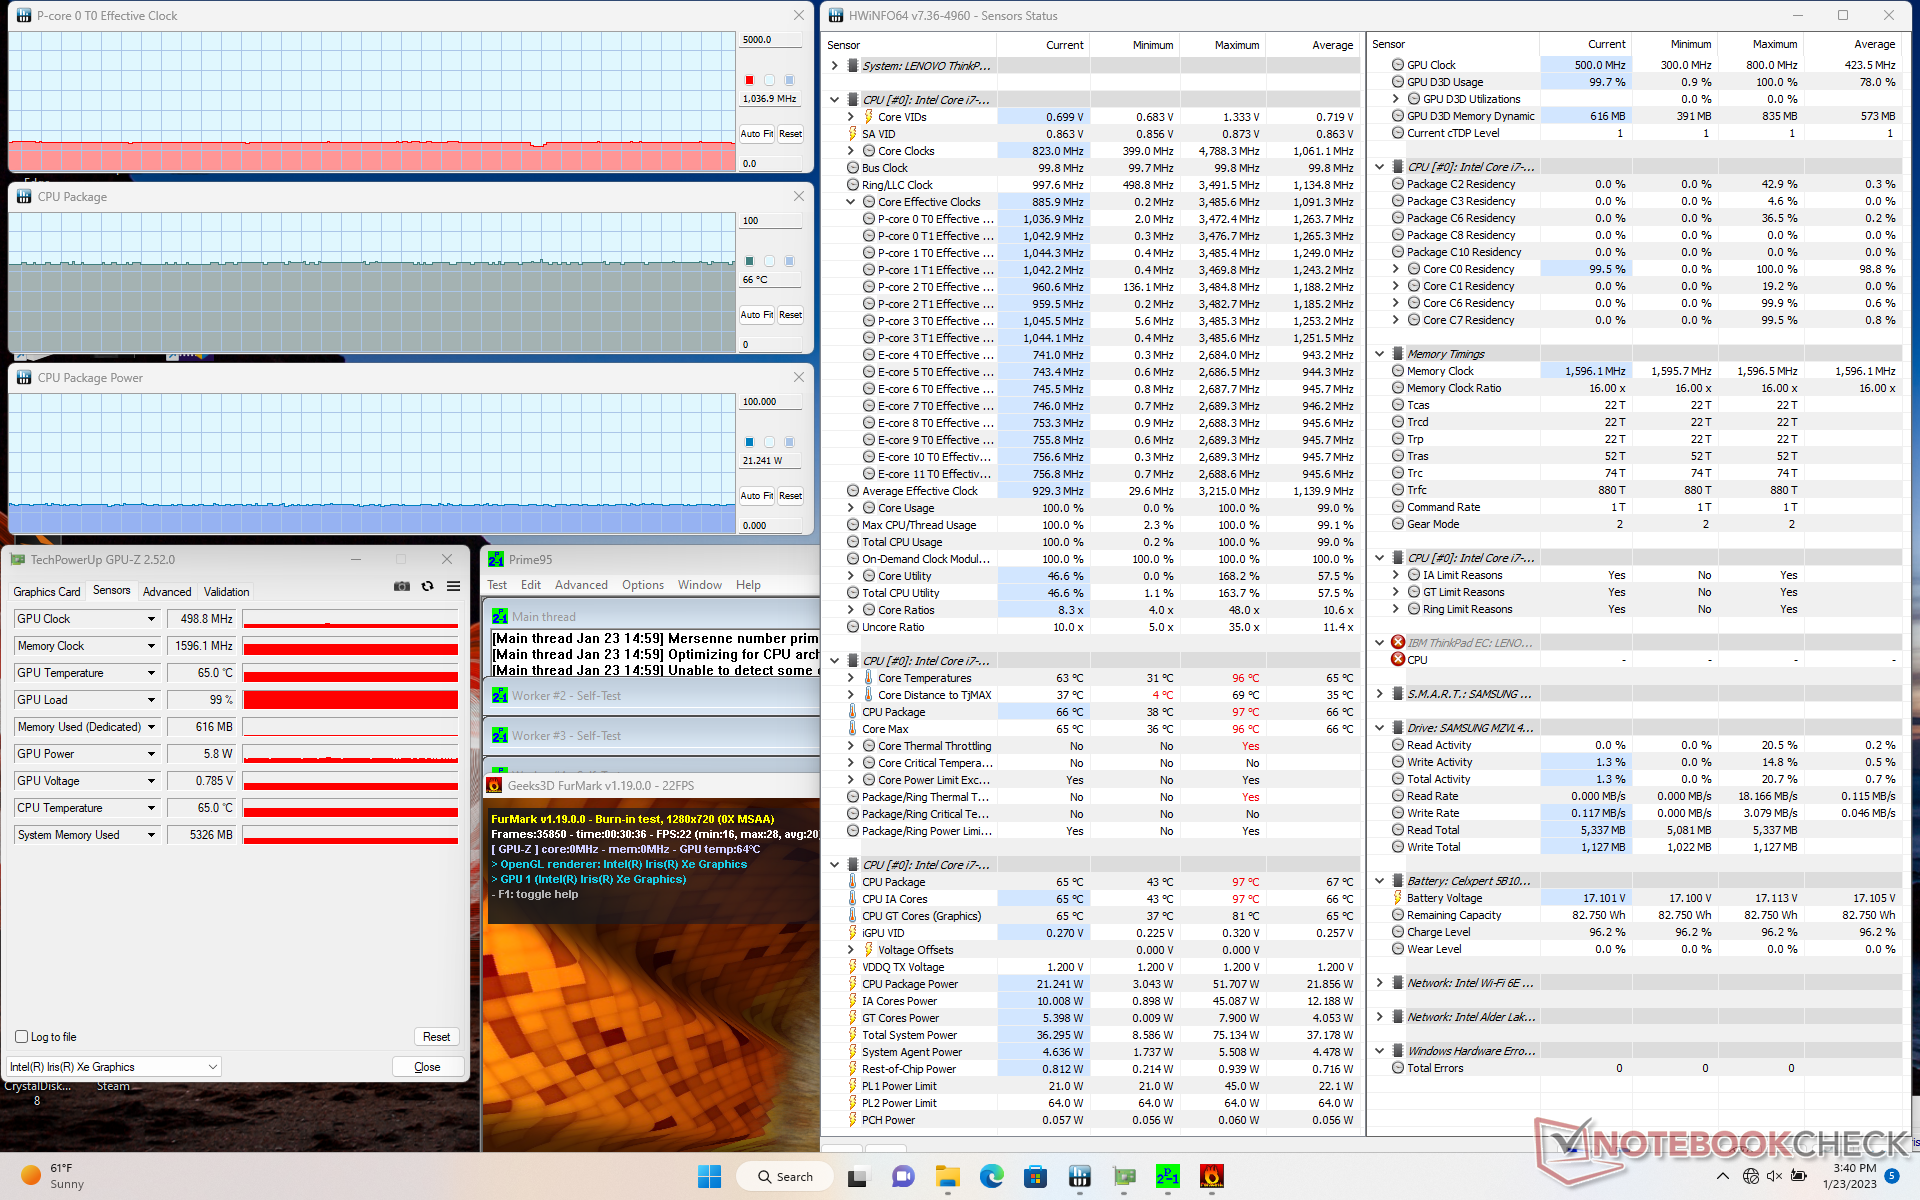
| CPU-Takt (GHz) | GPU-Takt (MHz) | Durchschnittliche CPU-Temperatur (°C) | |
| System Leerlauf | -- | -- | 31 |
| Prime95 Stress | 1.7 | -- | 69 |
| Prime95 + FurMark Stress | 1.0 | 499 | 66 |
| Witcher 3 Stress | ~1.3 | 998 | 67 |
Lautsprecher
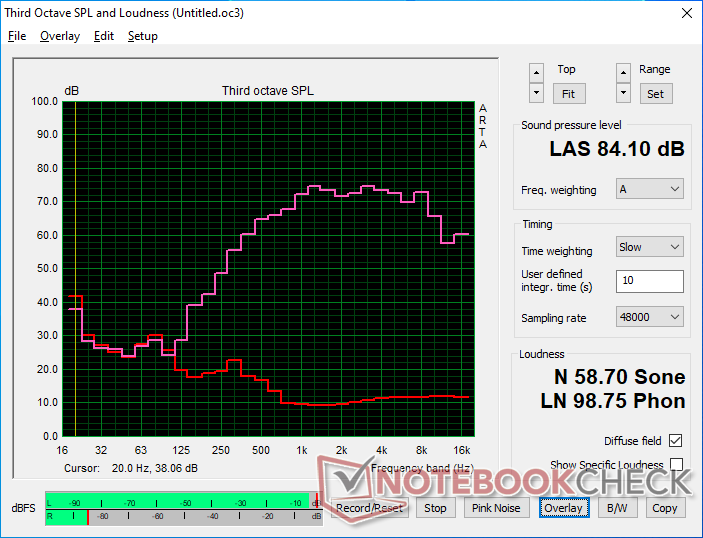
Lenovo ThinkPad T16 Gen 1 Core i7-1270P Audio Analyse
(+) | Die Lautsprecher können relativ laut spielen (84.1 dB)
Bass 100 - 315 Hz
(-) | kaum Bass - 26.3% niedriger als der Median
(±) | durchschnittlich lineare Bass-Wiedergabe (11.1% Delta zum Vorgänger)
Mitteltöne 400 - 2000 Hz
(+) | ausgeglichene Mitten, vom Median nur 4.5% abweichend
(+) | lineare Mitten (5.1% Delta zum Vorgänger)
Hochtöne 2 - 16 kHz
(±) | zu hohe Hochtöne, vom Median nur 5.8% abweichend
(+) | sehr lineare Hochtöne (4.8% Delta zum Vorgänger)
Gesamt im hörbaren Bereich 100 - 16.000 Hz
(±) | hörbarer Bereich ist durchschnittlich linear (20.1% Abstand zum Median)
Im Vergleich zu allen Geräten derselben Klasse
» 43% aller getesteten Geräte dieser Klasse waren besser, 10% vergleichbar, 47% schlechter
» Das beste Gerät hat einen Delta-Wert von 7%, durchschnittlich ist 21%, das schlechteste Gerät hat 53%
Im Vergleich zu allen Geräten im Test
» 52% aller getesteten Geräte waren besser, 8% vergleichbar, 40% schlechter
» Das beste Gerät hat einen Delta-Wert von 4%, durchschnittlich ist 23%, das schlechteste Gerät hat 134%
Apple MacBook Pro 16 2021 M1 Pro Audio Analyse
(+) | Die Lautsprecher können relativ laut spielen (84.7 dB)
Bass 100 - 315 Hz
(+) | guter Bass - nur 3.8% Abweichung vom Median
(+) | lineare Bass-Wiedergabe (5.2% Delta zum Vorgänger)
Mitteltöne 400 - 2000 Hz
(+) | ausgeglichene Mitten, vom Median nur 1.3% abweichend
(+) | lineare Mitten (2.1% Delta zum Vorgänger)
Hochtöne 2 - 16 kHz
(+) | ausgeglichene Hochtöne, vom Median nur 1.9% abweichend
(+) | sehr lineare Hochtöne (2.7% Delta zum Vorgänger)
Gesamt im hörbaren Bereich 100 - 16.000 Hz
(+) | hörbarer Bereich ist sehr linear (4.6% Abstand zum Median
Im Vergleich zu allen Geräten derselben Klasse
» 0% aller getesteten Geräte dieser Klasse waren besser, 0% vergleichbar, 100% schlechter
» Das beste Gerät hat einen Delta-Wert von 5%, durchschnittlich ist 17%, das schlechteste Gerät hat 45%
Im Vergleich zu allen Geräten im Test
» 0% aller getesteten Geräte waren besser, 0% vergleichbar, 100% schlechter
» Das beste Gerät hat einen Delta-Wert von 4%, durchschnittlich ist 23%, das schlechteste Gerät hat 134%
Energieverwaltung
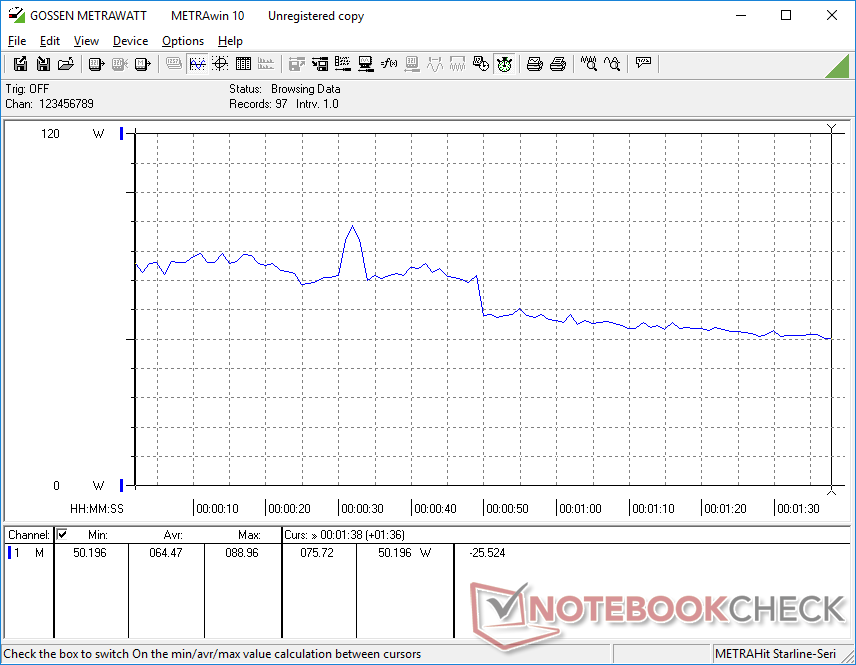
Stromverbrauch
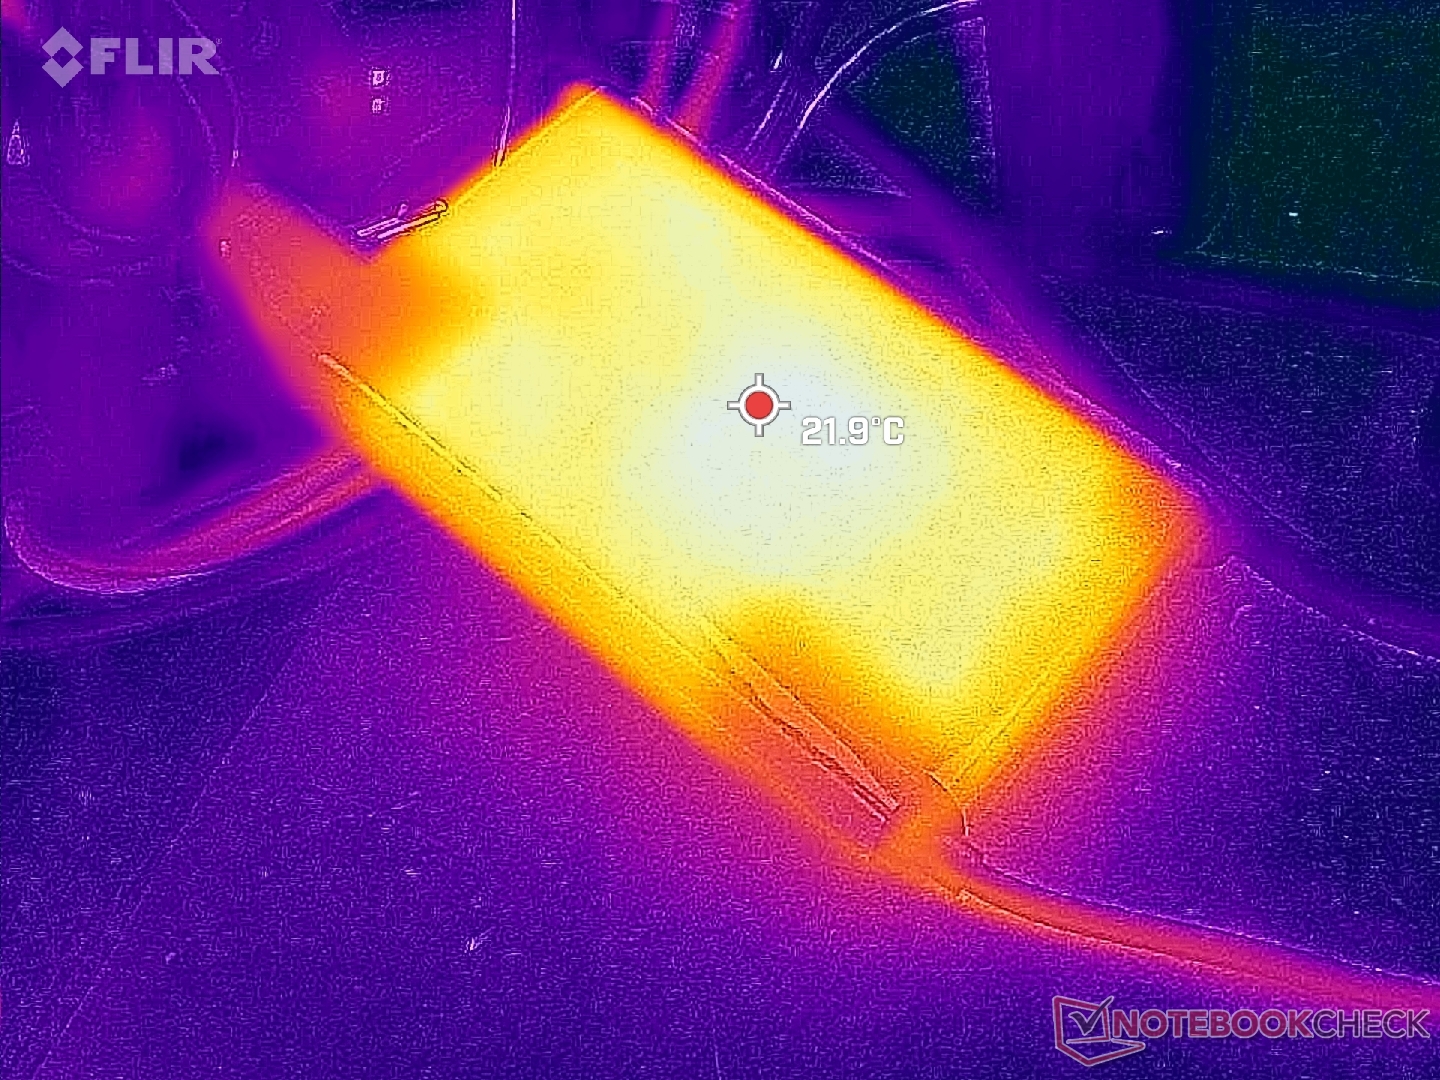
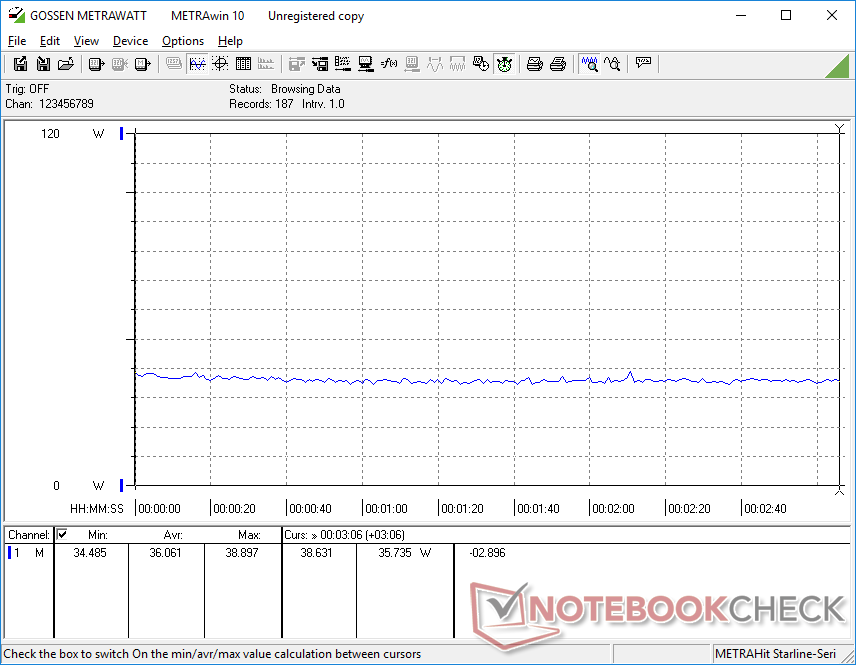
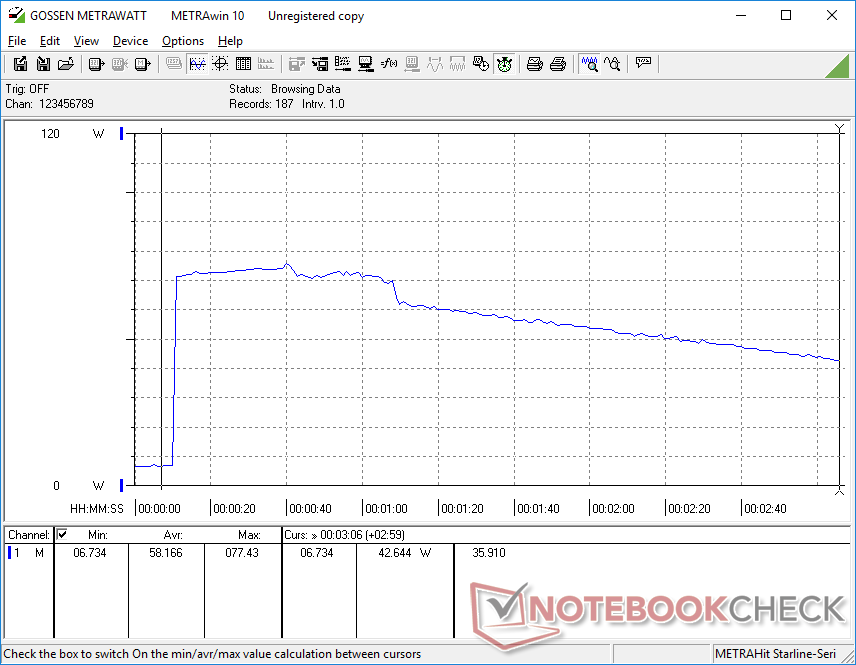
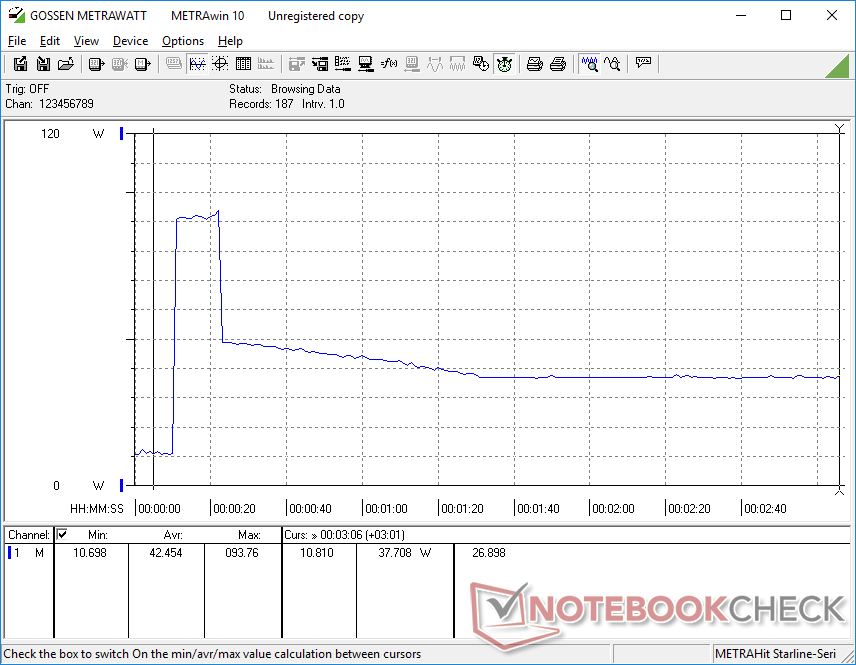
Der Stromverbrauch bei höherer Last spiegelt unsere obigen Beobachtungen zur Taktrate und Leistung wider. Er kann nämlich in den ersten Momenten des Stress-Betriebs sehr hoch sein, bevor er aufgrund der Leistungsdrosselung auf ein niedrigeres Niveau abfällt. Bei der Ausführung von Prime95 beispielsweise ist der Verbrauch für etwa 60 Sekunden mit etwa 77 W hoch, bevor er im Laufe der Zeit auf 42 W oder weniger fällt. Dies geschah selbst dann, wenn der Modus 'High Performance' eingestellt war.
Wir konnten eine maximale Leistungsaufnahme von 94 W unseres 135-W-USB-C-Netzteils (Größe: ~14,6 x 7,7 x 2,5 cm) aufzeichnen, wenn die CPU und die integrierte GPU jeweils zu 100 Prozent ausgelastet sind. Dieser Wert ist jedoch nur vorübergehend, wie die Grafik unten zeigt. Die relativ hohe Leistungsreserve des Netzteils ermöglicht es dem Notebook, anspruchsvollere Thunderbolt-Geräte wie bestimmte Docks und Monitore zu betreiben. Als Alternative bietet Lenovo ein kleineres 65-Watt-Netzteil an.
| Aus / Standby | |
| Idle | |
| Last |
|
Legende:
min: | |
| Lenovo ThinkPad T16 Gen 1 Core i7-1270P i7-1270P, Iris Xe G7 96EUs, Samsung PM9B1 512GB MZAL4512HBLU, IPS, 1920x1200, 16" | Lenovo ThinkPad T16 G1 21BWS00200 i5-1240P, Iris Xe G7 80EUs, Samsung PM9A1 MZVL2512HCJQ, IPS, 1920x1200, 16" | LG Gram 16Z90Q i7-1260P, Iris Xe G7 96EUs, Samsung PM9A1 MZVL21T0HCLR, IPS, 2560x1600, 16" | HP EliteBook 865 G9 R7 PRO 6850U, Radeon 680M, Samsung PM991 MZVLQ512HBLU, IPS, 1920x1200, 16" | Huawei MateBook 16s i7 i7-12700H, Iris Xe G7 96EUs, Silicon Motion PCIe-8 SSD, IPS, 2520x1680, 16" | Apple MacBook Pro 16 2021 M1 Pro M1 Pro, M1 Pro 16-Core GPU, Apple SSD AP1024R, Mini-LED, 3456x2234, 16.2" | |
|---|---|---|---|---|---|---|
| Stromverbrauch | 21% | -3% | -21% | -45% | -34% | |
| Idle min * (Watt) | 3.5 | 2.9 17% | 5 -43% | 5.3 -51% | 6.8 -94% | 5 -43% |
| Idle avg * (Watt) | 7.4 | 6 19% | 8 -8% | 12.8 -73% | 13.2 -78% | 15.1 -104% |
| Idle max * (Watt) | 10.7 | 6.9 36% | 14 -31% | 14.1 -32% | 13.8 -29% | 15.5 -45% |
| Last avg * (Watt) | 64.5 | 27.3 58% | 47 27% | 48.5 25% | 75.2 -17% | 54 16% |
| Witcher 3 ultra * (Watt) | 36.1 | 42.6 -18% | 37.8 -5% | 48.7 -35% | 56.1 -55% | |
| Last max * (Watt) | 93.8 | 81.53 13% | 56 40% | 56.6 40% | 90.6 3% | 90 4% |
* ... kleinere Werte sind besser
Power Consumption Witcher 3 / Stresstest
Power Consumption external Monitor
Akkulaufzeit - Ganztägiges Surfen im Internet
Wir haben darauf geachtet, den Test mit beiden Konfigurationen bei gleichen Einstellungen (Energieprofils "Ausbalanciert") durchzuführen, dennoch ist die WLAN-Laufzeit unseres heutigen Testnotebooks deutlich kürzer als beim Thinkpad T16 G1 mit Core i5, wie die Tabelle unten zeigt. 8 Stunden Surfen sollten aber für die meisten Nutzer ausreichend sein.
Das Aufladen des komplett entleerten Akkus dauert mit dem mitgelieferten Netzteil etwa 90 Minuten.
| Lenovo ThinkPad T16 Gen 1 Core i7-1270P i7-1270P, Iris Xe G7 96EUs, 86 Wh | Lenovo ThinkPad T16 G1 21BWS00200 i5-1240P, Iris Xe G7 80EUs, 86 Wh | LG Gram 16Z90Q i7-1260P, Iris Xe G7 96EUs, 80 Wh | HP EliteBook 865 G9 R7 PRO 6850U, Radeon 680M, 76 Wh | Huawei MateBook 16s i7 i7-12700H, Iris Xe G7 96EUs, 84 Wh | Apple MacBook Pro 16 2021 M1 Pro M1 Pro, M1 Pro 16-Core GPU, 99.6 Wh | |
|---|---|---|---|---|---|---|
| Akkulaufzeit | 76% | 26% | 88% | 1% | 111% | |
| WLAN (h) | 8 | 14.1 76% | 10.1 26% | 15 88% | 8.1 1% | 16.9 111% |
| H.264 (h) | 10.4 | 18.5 | 9.3 | 17.5 | ||
| Last (h) | 3.5 | 2.6 | 1.8 | 1.9 | ||
| Idle (h) | 18.1 |
Pro
Contra
Fazit - Nicht für Extremnutzer
Obwohl das ThinkPad T16 G1 nicht für High Performance User konzipiert wurde, ist es dennoch enttäuschend, solch steile CPU-Drosselungsraten zu sehen, wenn anspruchsvollere Lasten ausgeführt werden. Die Drosselung ist so stark, dass die Leistung unseres Core i7-1270P nach einer gewissen Zeit auf das Niveau des günstigeren Core i5-1240P abfällt. Ein solches Verhalten bedeutet, dass die Core-i7-1270P-Option nur für kurze Leistungsspitzen geeignet ist, z. B. beim Starten von Anwendungen oder bei der Verarbeitung von Bildern, und nicht für langwierige Videokodierung oder anspruchsvolle Grafikarbeiten, bei denen die Drosselung über einen längeren Zeitraum auftreten kann.
Die Ryzen 5 Pro 6650U-Option bietet eine konstantere Leistung als die Core i7-1270P-Option. Die Leistungsdrosselung ist bei der Konfiguration mit einer CPU der Core-P-Serie stärker.
Abgesehen vom Prozessor sollten potentielle Käufer auch auf den langsamen System-RAM und einige der verfügbaren Display-Optionen achten. Ersteres beeinträchtigt die Grafikleistung um bis zu 10 Prozent, während einige der Panels möglicherweise nicht die von Grafikprofis geforderten Farben bieten. Das konkurrierende HP EliteBook 865 G9 ist eine schlankere Alternative mit Optionen, die beim ThinkPad T16 G1 nicht verfügbar sind, darunter ein helleres 1000-Nit-Display und eine 5-MP-Webcam mit höherer Auflösung.
Preis und Verfügbarkeit
Das ThinkPad T16 G1 ist ab sofort direkt bei Lenovo erhältlich. Die Preise beginnen bei 1.360 Euro für die Core-i5-1235U-Basiskonfiguration und reichen bis über 2.000 Euro für die Core-i7-Modelle. Bei Cyberport gibt es ein mit i7-1260P-CPU und MX550-GPU ähnlich wie unser Testmodell ausgestattetes ThinkPad um rund 1.900 Euro.
Lenovo ThinkPad T16 Gen 1 Core i7-1270P
- 25.01.2023 v7 (old)
Allen Ngo
Transparenz
Die Auswahl der zu testenden Geräte erfolgt innerhalb der Redaktion. Das vorliegende Testmuster wurde dem Autor vom Hersteller oder einem Shop zu Testzwecken leihweise zur Verfügung gestellt. Eine Einflussnahme des Leihstellers auf den Testbericht gab es nicht, der Hersteller erhielt keine Version des Reviews vor der Veröffentlichung. Es bestand keine Verpflichtung zur Publikation. Als eigenständiges, unabhängiges Unternehmen unterliegt Notebookcheck keiner Diktion von Herstellern, Shops und Verlagen.
So testet Notebookcheck
Pro Jahr werden von Notebookcheck hunderte Laptops und Smartphones unabhängig in von uns standardisierten technischen Verfahren getestet, um eine Vergleichbarkeit aller Testergebnisse zu gewährleisten. Seit rund 20 Jahren entwickeln wir diese Testmethoden kontinuierlich weiter und setzen damit Branchenstandards. In unseren Testlaboren kommt ausschließlich hochwertiges Messequipment in die Hände erfahrener Techniker und Redakteure. Die Tests unterliegen einer mehrstufigen Kontrolle. Unsere komplexe Gesamtbewertung basiert auf hunderten fundierten Messergebnissen und Benchmarks, womit Ihnen Objektivität garantiert ist. Weitere Informationen zu unseren Testmethoden gibt es hier.
Preisvergleich

