Huawei MateBook D 16 2024 im Test - Multimedia-Laptop jetzt mit Intel Core i9-13900H
Huawei bringt eine neue Version seines MateBook D 16 auf den Markt, die mit dem Core i9-13900H (Raptor Lake) einen leistungsstarken Intel-Prozessor bietet. Verpackt wird dieser in einem Metallgehäuse und es gibt 16 GB RAM sowie eine 1-TB-SSD. Das matte IPS-Display bietet volle sRGB-Abdeckung, aber nur die Full-HD-Auflösung und auch keine besonderen Features wie eine höhere Frequenz. Wenn man genauer auf das Datenblatt schaut, findet man aber auch einige Dinge wie eine 720p-Webcam oder sogar einen alten USB-2.0-Anschluss. Huawei verlangt 1.399 Euro für das neue MateBook D 16 2024 und wir überprüfen, ob das gerechtfertigt ist.
Optional gibt es noch eine günstigere Variante mit dem Core i5-13420H, 16 GB RAM und einer 1-TB-SSD für 999 Euro, allerdings gibt es hier auch ein schlechteres Display (nur 45 % NTSC anstelle von 100 % sRGB) und einen kleineren Akku (56 Wh anstelle von 70 Wh).
Mögliche Konkurrenten im Vergleich
Bew. | Datum | Modell | Gewicht | Dicke | Größe | Auflösung | Preis ab |
|---|---|---|---|---|---|---|---|
| 85 % v7 (old) | 01 / 2024 | Huawei MateBook D 16 2024 i9-13900H, Iris Xe G7 96EUs | 1.7 kg | 18.4 mm | 16.00" | 1920x1200 | |
| 88.1 % v7 (old) | 12 / 2023 | MSI Prestige 16 B1MG-001US Ultra 7 155H, Arc 8-Core | 1.6 kg | 19.1 mm | 16.00" | 2560x1600 | |
| 88.6 % v7 (old) | 10 / 2023 | Acer Swift Edge SFE16 Ryzen 7 7840U R7 7840U, Radeon 780M | 1.2 kg | 13 mm | 16.00" | 3200x2000 | |
| 88.6 % v7 (old) | 08 / 2023 | Schenker Vision 16 PH6PRX1 i7-13700H, Iris Xe G7 96EUs | 1.5 kg | 17.1 mm | 16.00" | 2560x1600 | |
| 86.6 % v7 (old) | 06 / 2023 | Acer Swift Go SFG16-71 i7-13700H, Iris Xe G7 96EUs | 1.6 kg | 19 mm | 16.00" | 3200x2000 | |
| 85.8 % v7 (old) | 05 / 2023 | Lenovo Yoga 7 16IRL8 i7-1355U, Iris Xe G7 96EUs | 2 kg | 16.99 mm | 16.00" | 1920x1200 | |
| 85.6 % v7 (old) | 05 / 2023 | Samsung Galaxy Book3 Pro 16 i5-1340P, Iris Xe G7 80EUs | 1.6 kg | 12.5 mm | 16.00" | 2880x1800 | |
| 86 % v7 (old) | 06 / 2023 | Huawei MateBook 16s i9 i9-13900H, Iris Xe G7 96EUs | 2 kg | 17.8 mm | 16.00" | 2560x1680 |
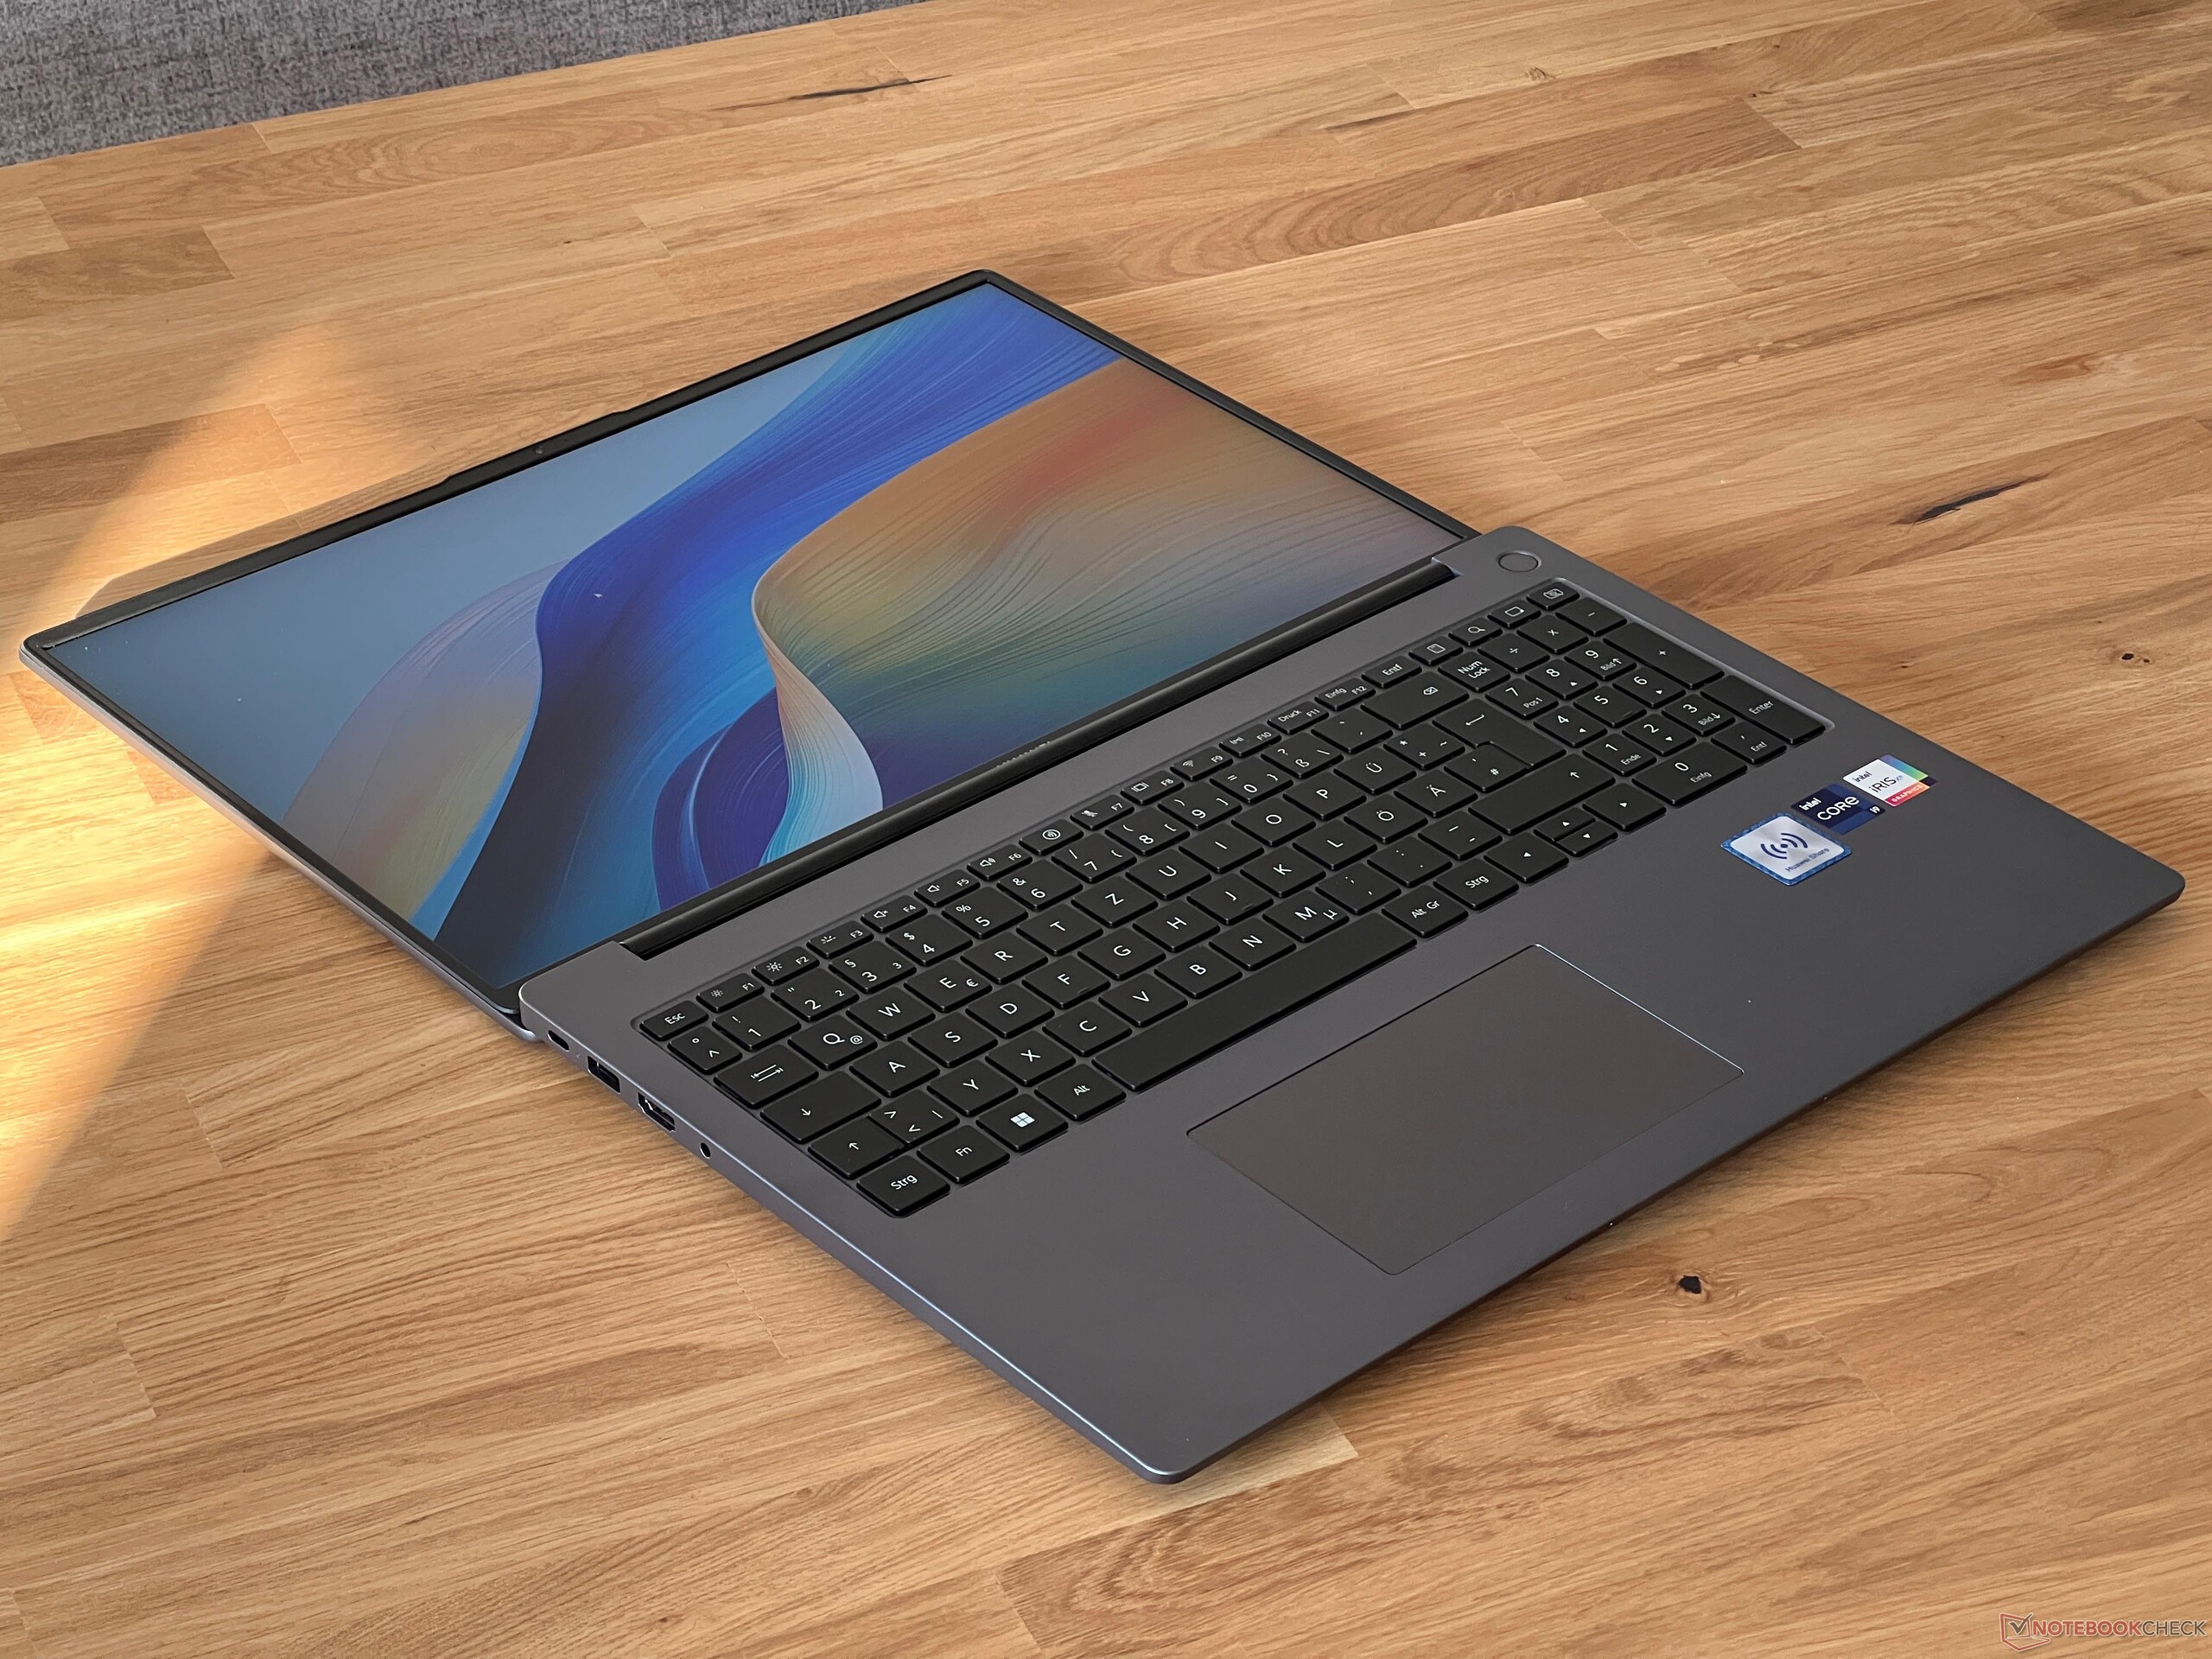
Gehäuse - MateBook D 16 mit Metallgehäuse
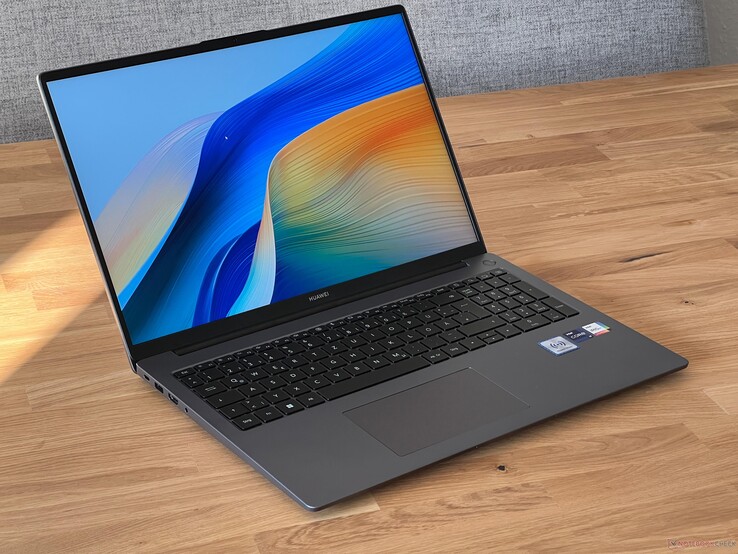
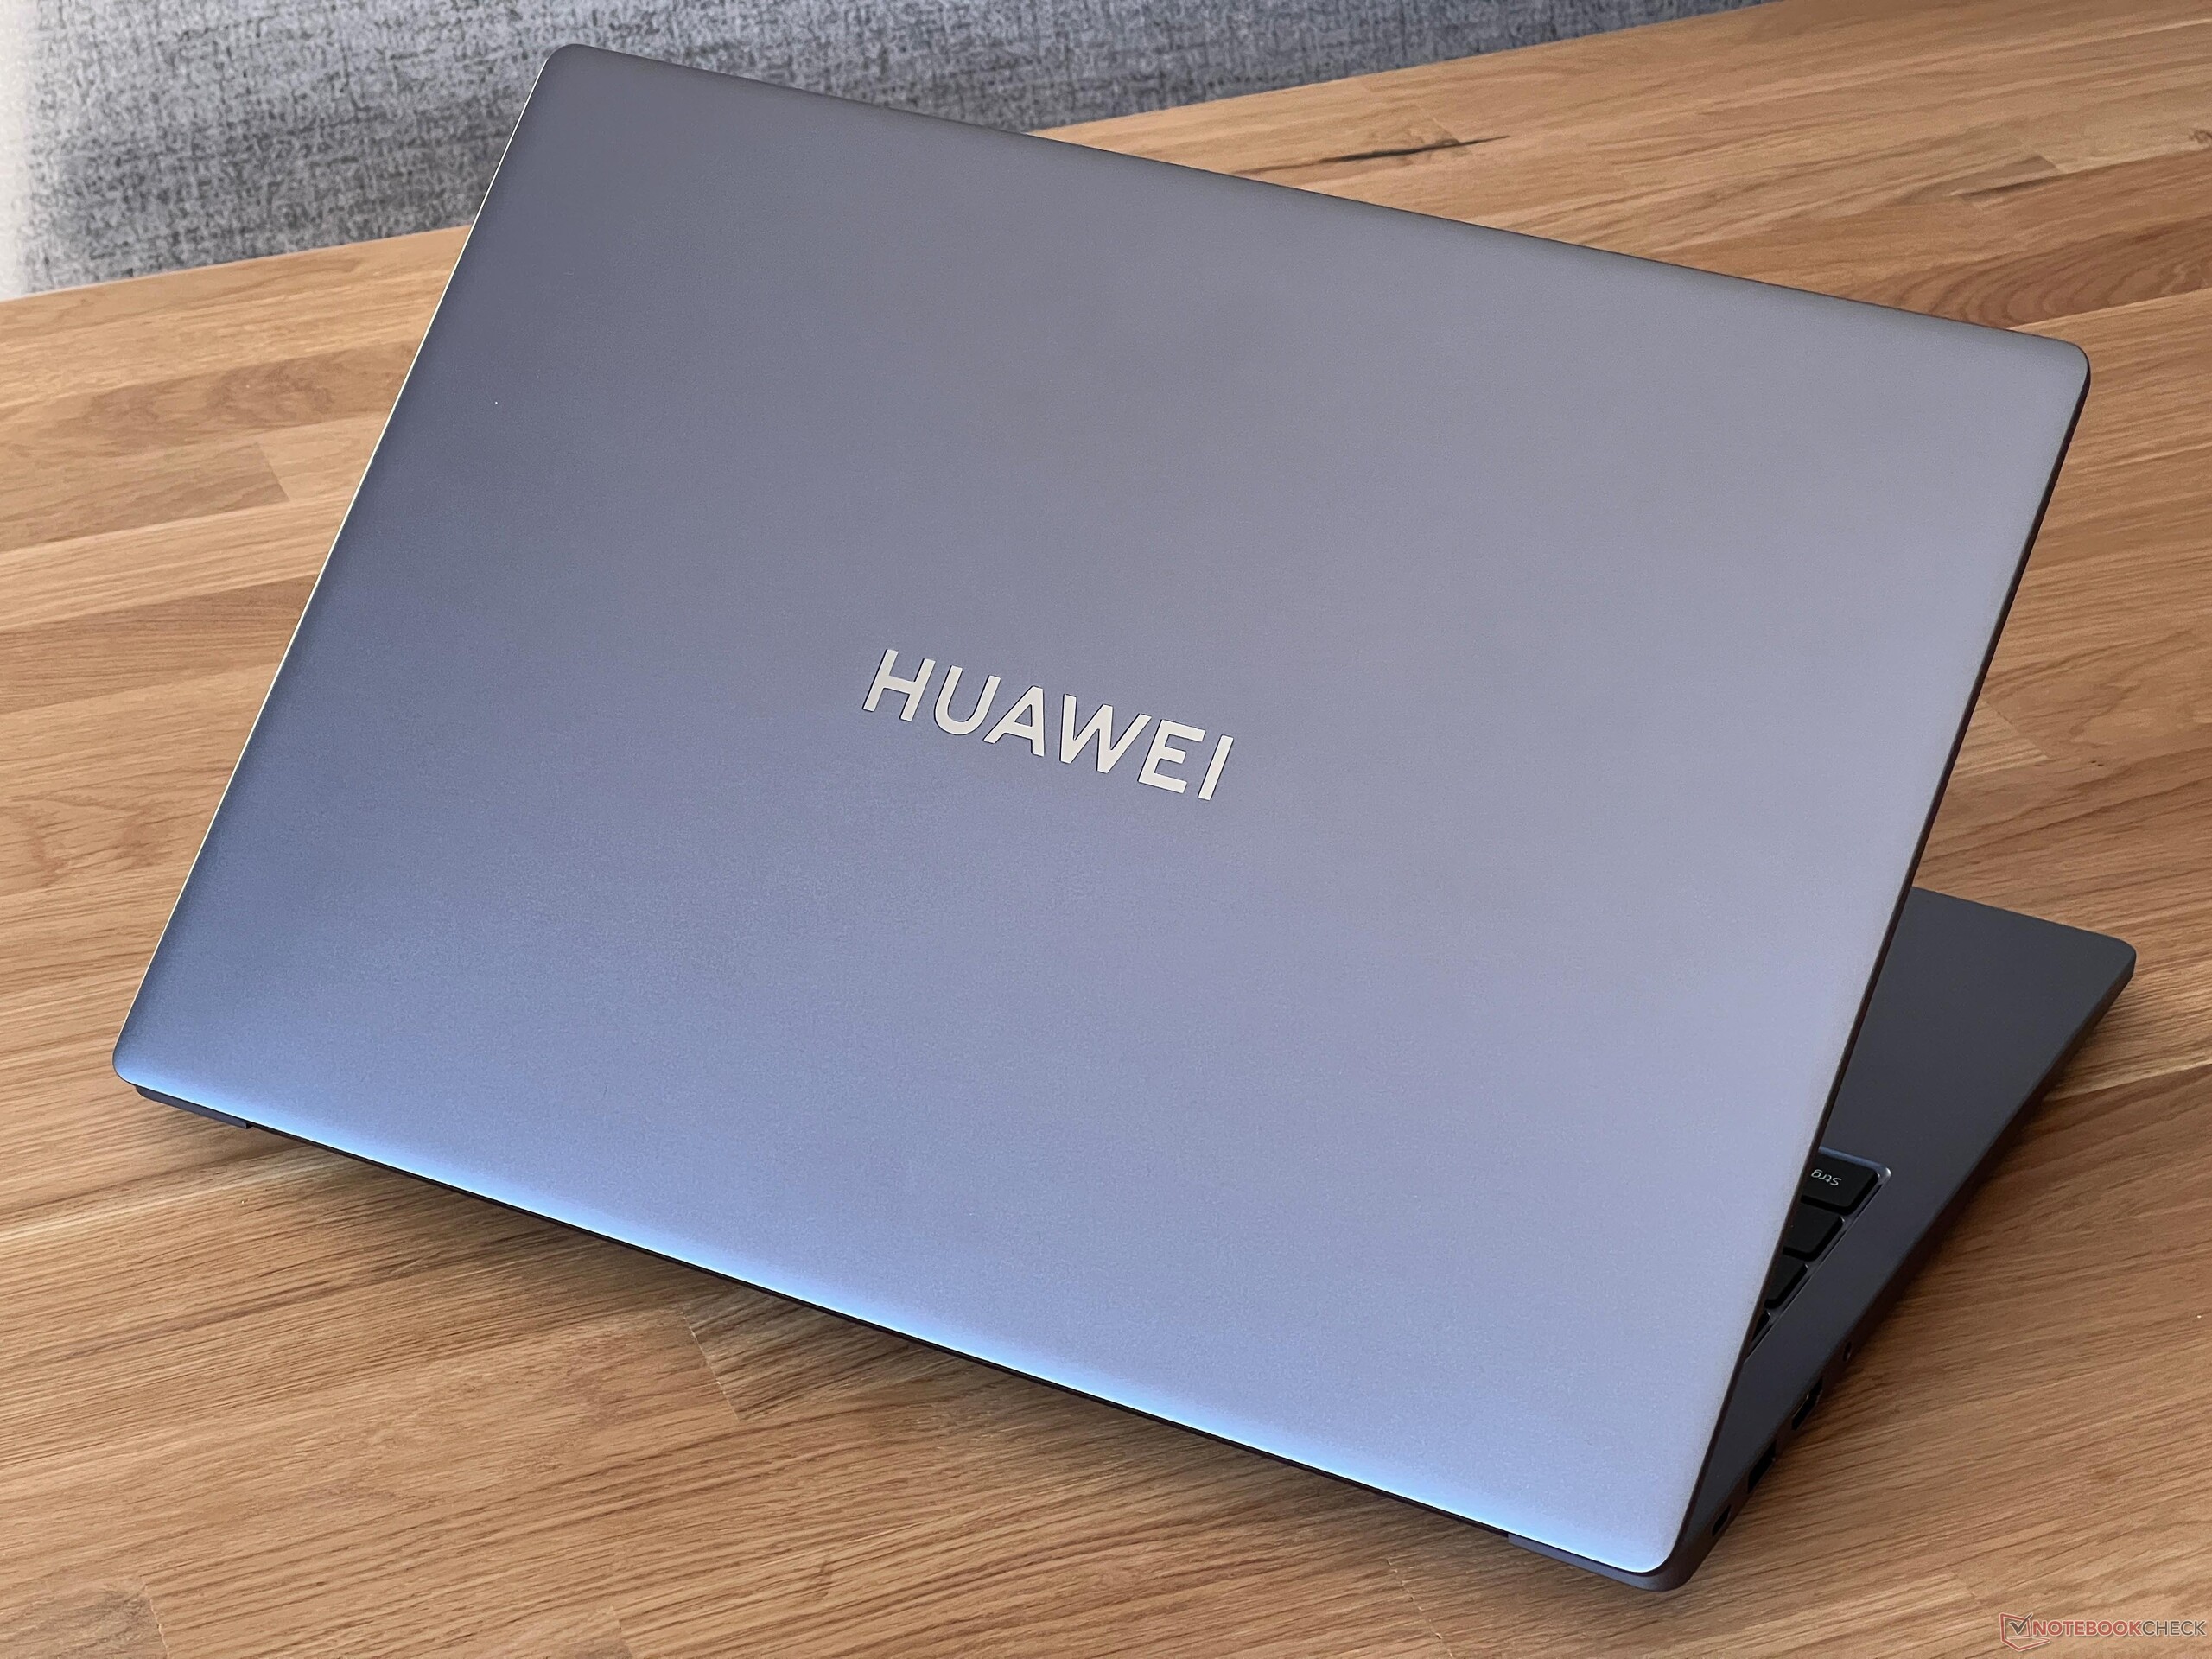
Auf den ersten Blick unterscheidet sich das dunkelgraue Gehäuse nicht von seinem Vorgänger, doch tatsächlich kommt eine neue Hülle zum Einsatz und der interne Aufbau hat sich ebenfalls verändert. Das Design wirkt auch dank der schmalen Displayränder modern und die Oberflächen sind nicht besonders anfällig für Schmutz und Fingerabdrücke. Eine Neuerung ist das Displayscharnier, welches jetzt einen maximalen Öffnungswinkel von 180 Grad ermöglicht. Die Scharniere an sich sind sehr stramm eingestellt und man kann den Deckel nicht mit einer Hand öffnen, doch trotzdem kommt es zu einem deutlich sichtbare Nachwippen, wenn man den Öffnungswinkel anpasst.
Qualitativ hinterlässt das Gehäuse einen ordentlichen Eindruck. Huawei verzichtet auf Metall und die Kunststoffkonstruktion ist insgesamt stabil, sowohl die Baseunit als auch den Deckel kann man im zentralen Bereich aber relativ leicht eindrücken. Zu Einschränkungen im Alltag kommt es dadurch aber nicht. Etwas unschön sind die Knarzgeräusche, wenn man die Baseunit verwindet.
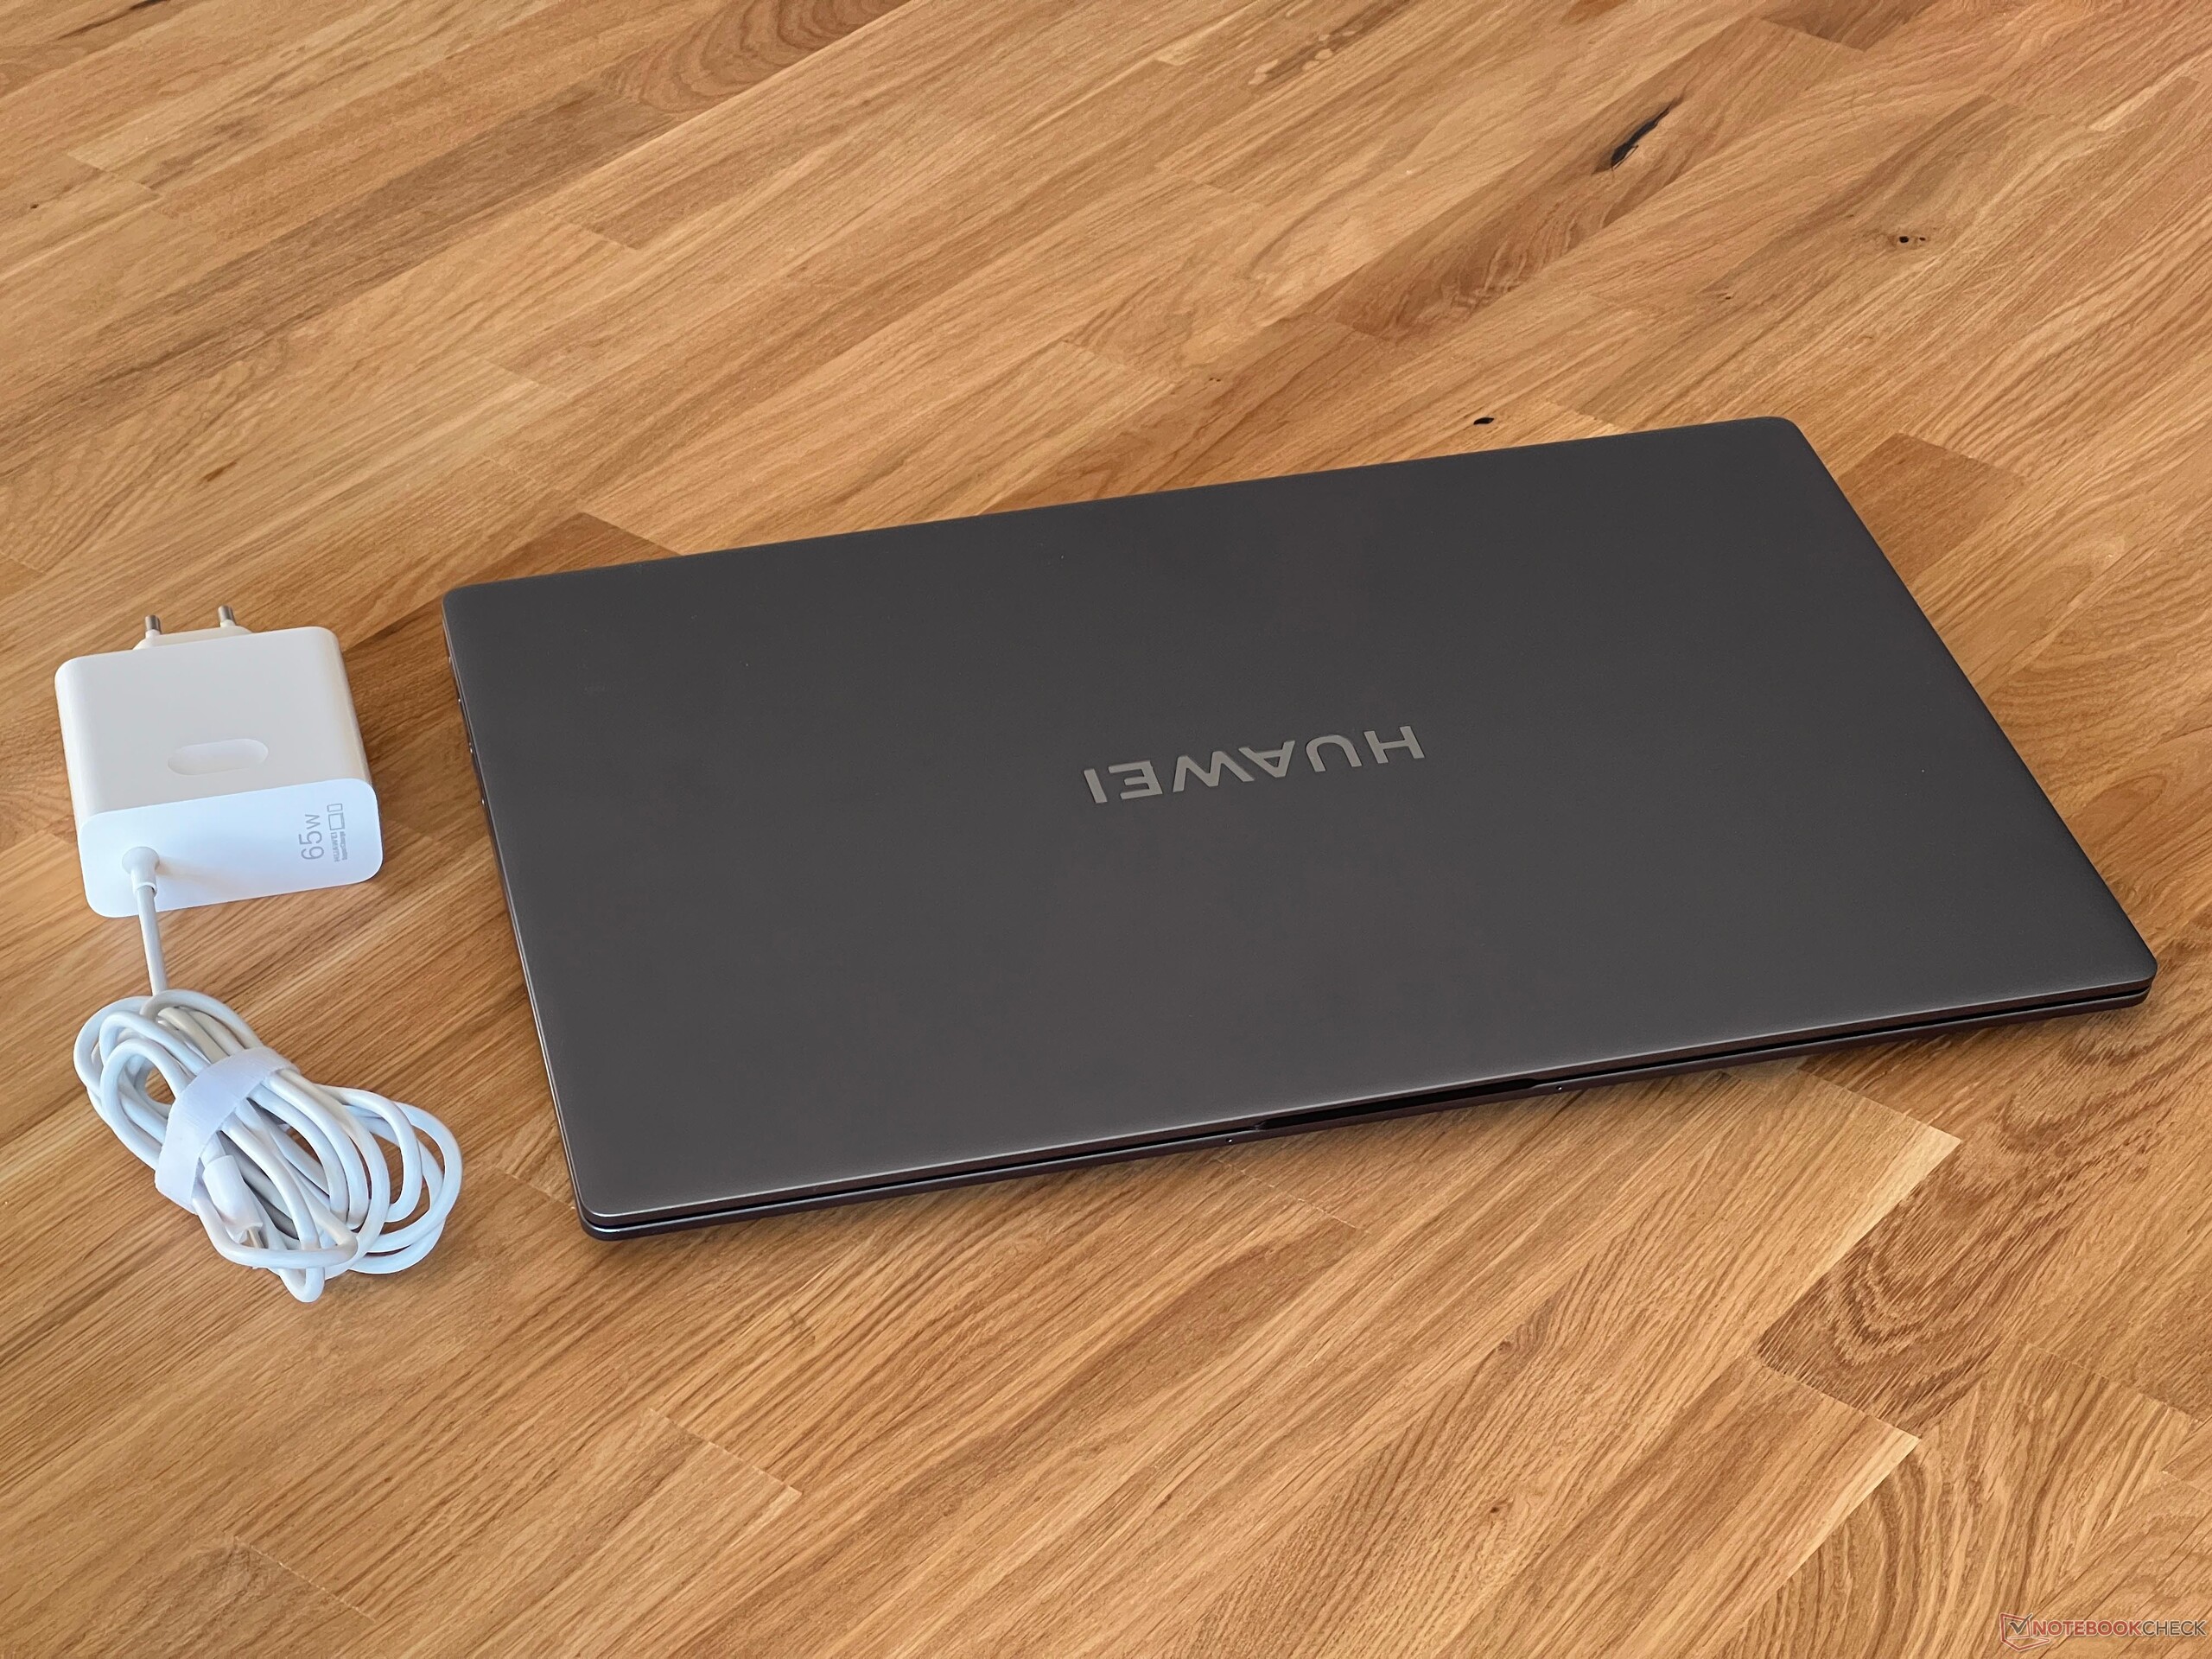
Bei der Stellfläche nehmen sich die Vergleichsgeräte nicht viel und mit einem Gewicht von etwas mehr als 1,7 kg liegt das MateBook im Durchschnitt. Das 65-Watt-Steckernetzteil ist mit 204 Gramm sehr leicht.
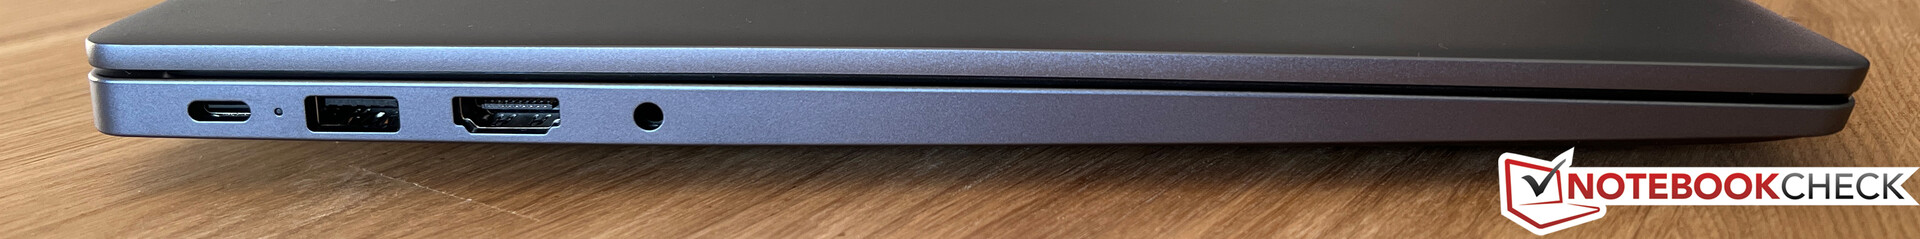
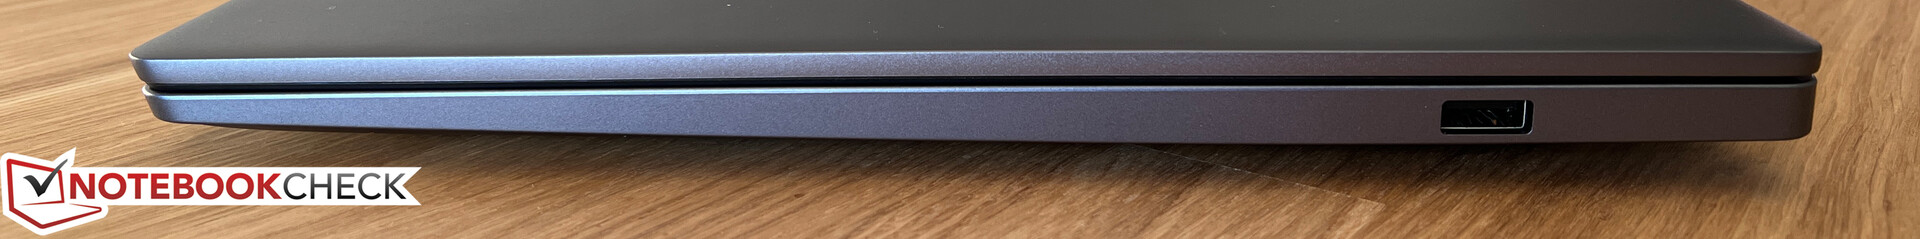
Ausstattung - Huawei verbaut USB 2.0 anstatt Thunderbolt
Bei den Anschlüssen bekommt man nur das absolute Minimum und selbst im Vergleich zum alten MateBook D 16 2022 ist die Situation ein ganz klarer Rückschritt. Auf Thunderbolt oder USB 4 verzichtet Huawei komplett, dafür gibt es nur einen einzigen USB-C-Anschluss (3.2 Gen.1), der aber auch für das Netzteil genutzt wird. Auf der rechten Seite gibt es nur einen einzigen USB-A-Anschluss, der aber noch dem alten 2.0-Standard entspricht. Das ist bei dieser Preisklasse ein absolutes No-Go. Auch der HDMI-Ausgang beherrscht nur den 1.4-Standard, es ist also nicht möglich, externe 4K-Bildschirme mit 60 Hz anzusteuern, sondern nur mit 30 Hz. Selbst beim alten 2022er-Modell war bereits ein HDMI-2.0-Ausgang integriert und es gab einen zusätzlichen USB-Anschluss. Der einzige Vorteil in dieser Sektion ist die geräteübergreifende Steuerung, wenn man weitere Huawei-Geräte (z. B. Smartphone, Tablet) nutzt.
Kommunikation
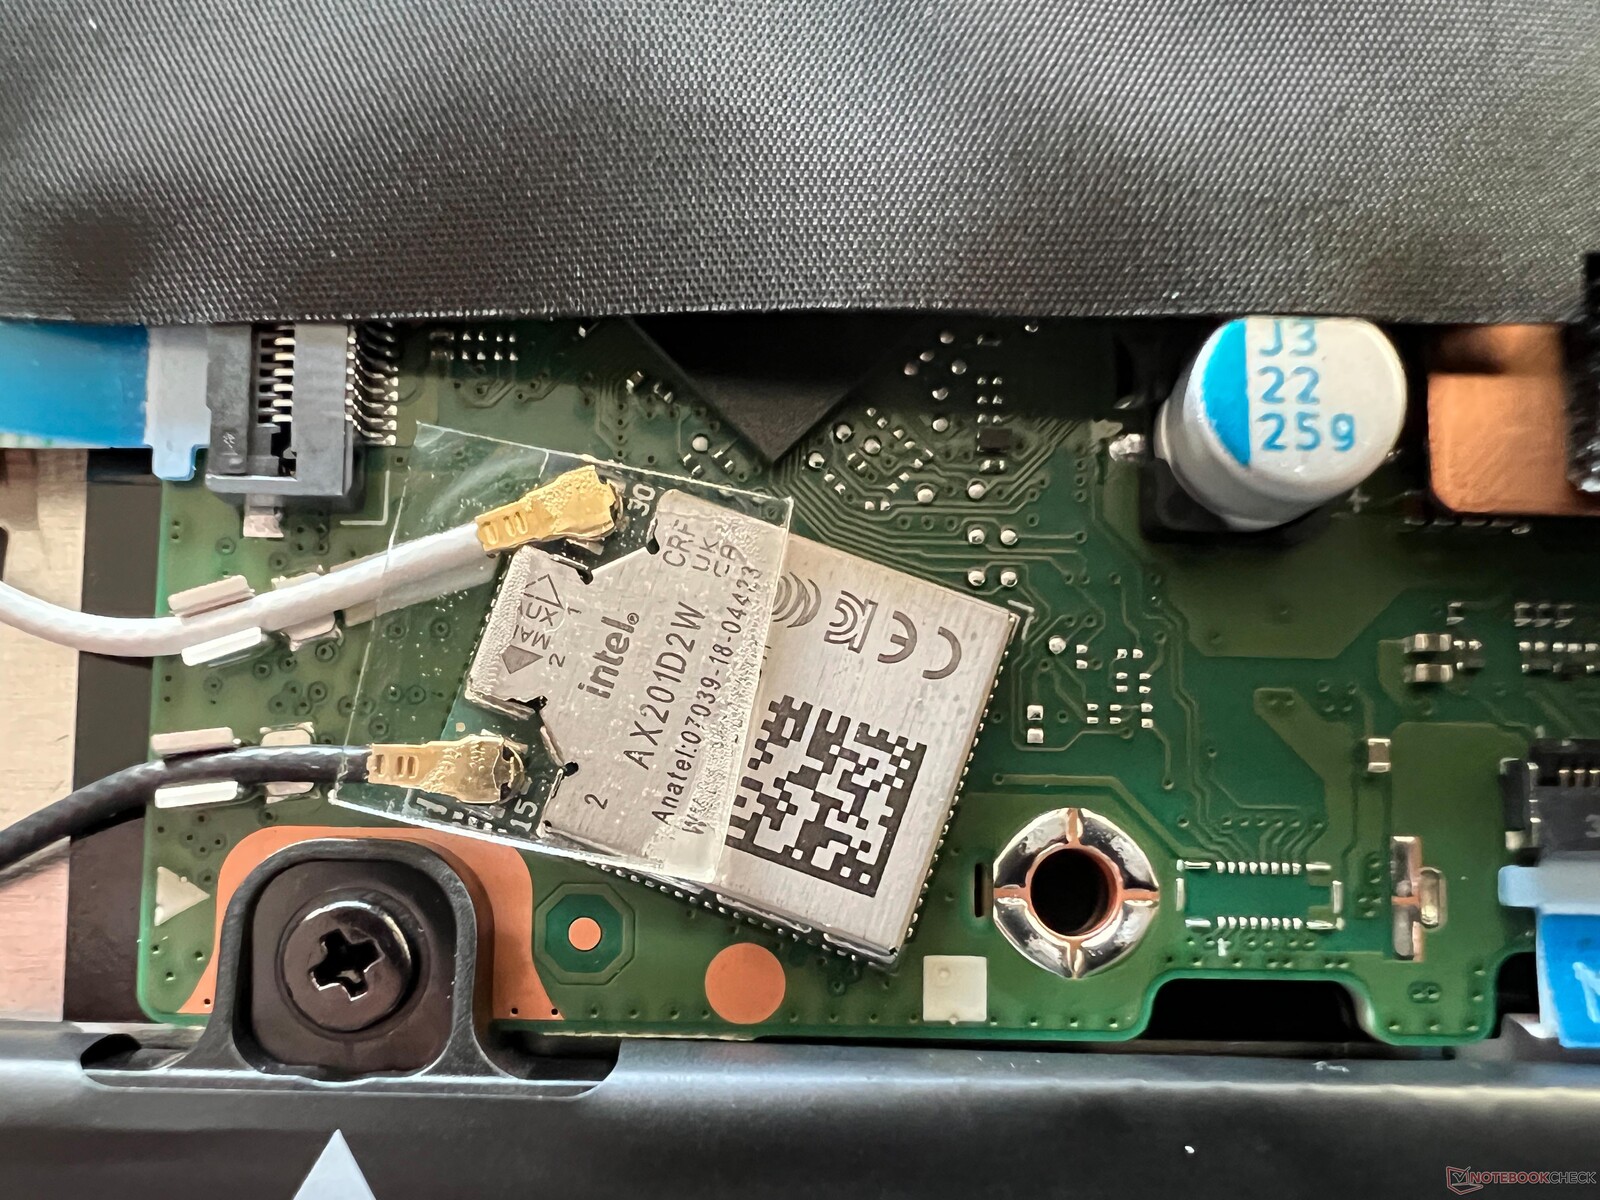
Huawei setzt auf das bekannte WLAN-Modul Intel AX201 mit Unterstützung für WLAN-6-Netzwerke, aber noch nicht den aktuellen Wi-Fi-6E-Standard. Die Leistung ist in Verbindung mit unserem Referenzrouter von Asus aber dennoch sehr gut und wir konnten auch während unseres Tests keinerlei Probleme mit der WLAN-Verbindung erkennen.
| Networking | |
| Huawei MateBook D 16 2024 | |
| iperf3 transmit AXE11000 | |
| iperf3 receive AXE11000 | |
| MSI Prestige 16 B1MG-001US | |
| iperf3 transmit AXE11000 | |
| iperf3 receive AXE11000 | |
| iperf3 transmit AXE11000 6GHz | |
| iperf3 receive AXE11000 6GHz | |
| Acer Swift Edge SFE16 Ryzen 7 7840U | |
| iperf3 transmit AXE11000 | |
| iperf3 receive AXE11000 | |
| iperf3 transmit AXE11000 6GHz | |
| iperf3 receive AXE11000 6GHz | |
| Schenker Vision 16 PH6PRX1 | |
| iperf3 transmit AXE11000 | |
| iperf3 receive AXE11000 | |
| Acer Swift Go SFG16-71 | |
| iperf3 transmit AXE11000 | |
| iperf3 receive AXE11000 | |
| iperf3 transmit AXE11000 6GHz | |
| iperf3 receive AXE11000 6GHz | |
| Lenovo Yoga 7 16IRL8 | |
| iperf3 transmit AXE11000 | |
| iperf3 receive AXE11000 | |
| iperf3 transmit AXE11000 6GHz | |
| iperf3 receive AXE11000 6GHz | |
| Samsung Galaxy Book3 Pro 16 | |
| iperf3 transmit AXE11000 | |
| iperf3 receive AXE11000 | |
| iperf3 transmit AXE11000 6GHz | |
| iperf3 receive AXE11000 6GHz | |
| Huawei MateBook 16s i9 | |
| iperf3 transmit AXE11000 | |
| iperf3 receive AXE11000 | |
| iperf3 transmit AXE11000 6GHz | |
| iperf3 receive AXE11000 6GHz | |
| Huawei MateBook D 16 2022 | |
| iperf3 transmit AXE11000 | |
| iperf3 receive AXE11000 | |
Webcam
Die Webcam im oberen Bildschirmrahmen bietet lediglich die mickrige 720p-Auflösung, was absolut nicht mehr zeitgemäß ist. Die Aufnahmen sind dementsprechend sehr detailarm und nicht besonders scharf.


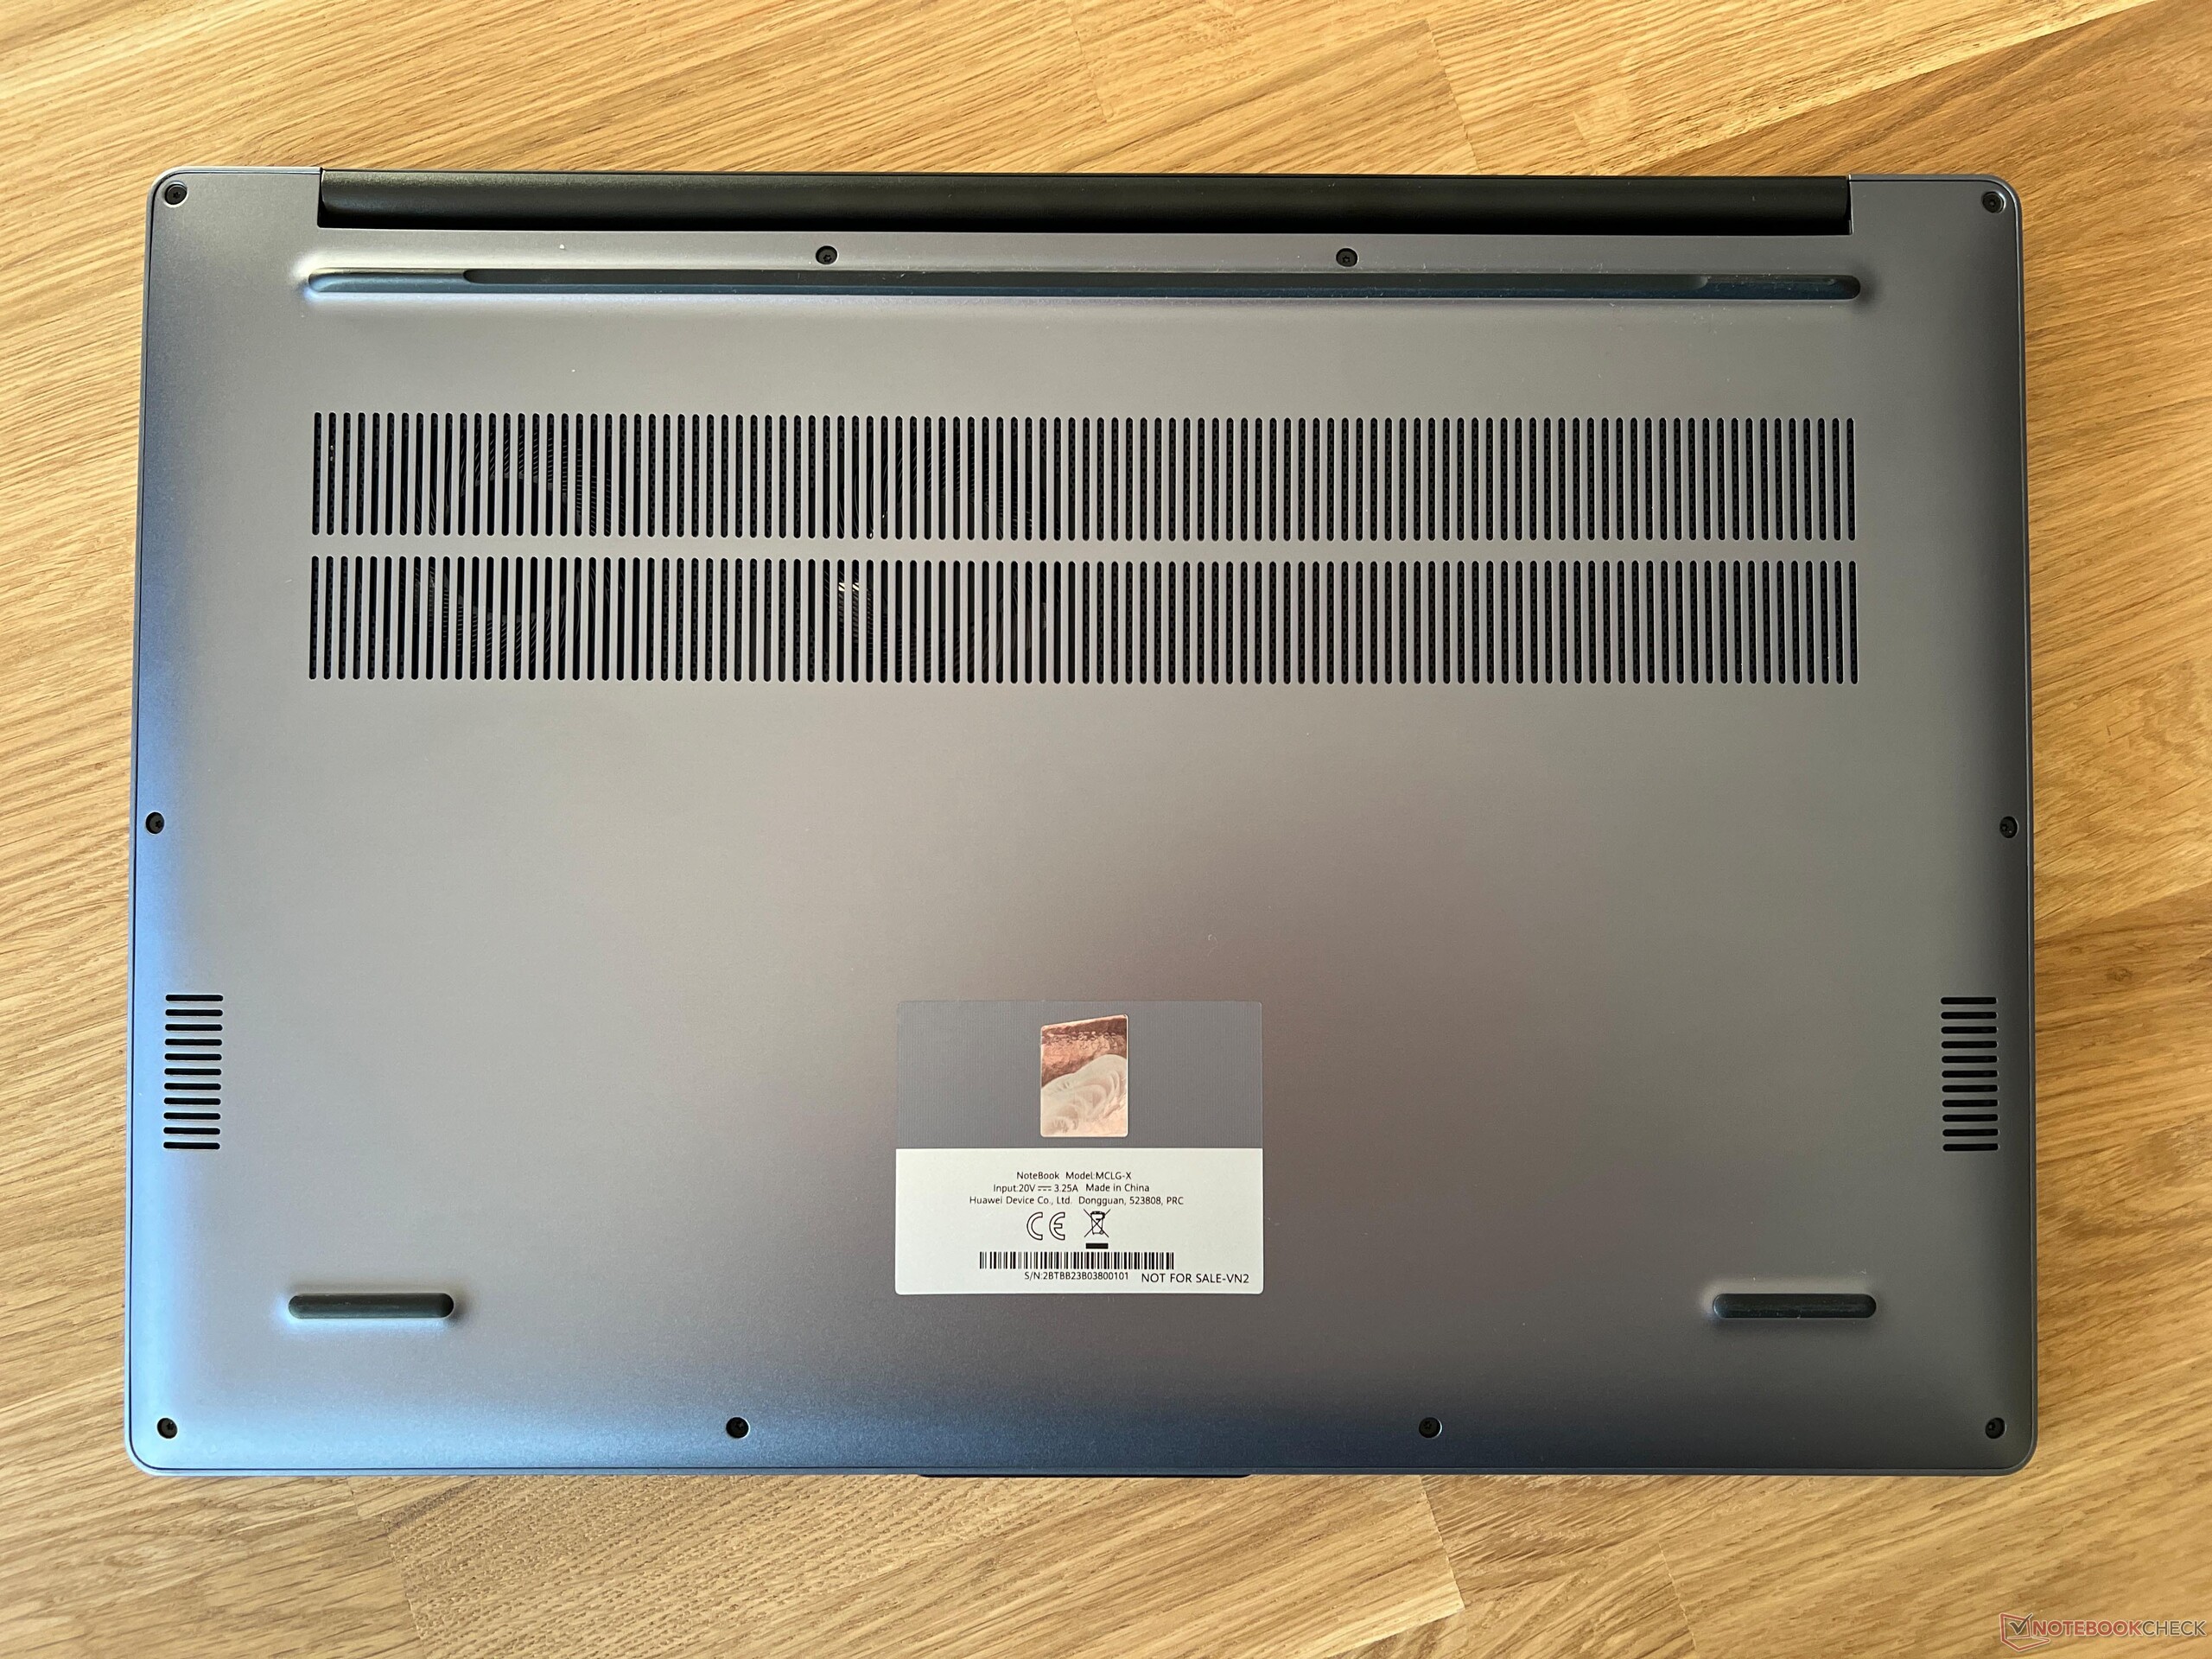
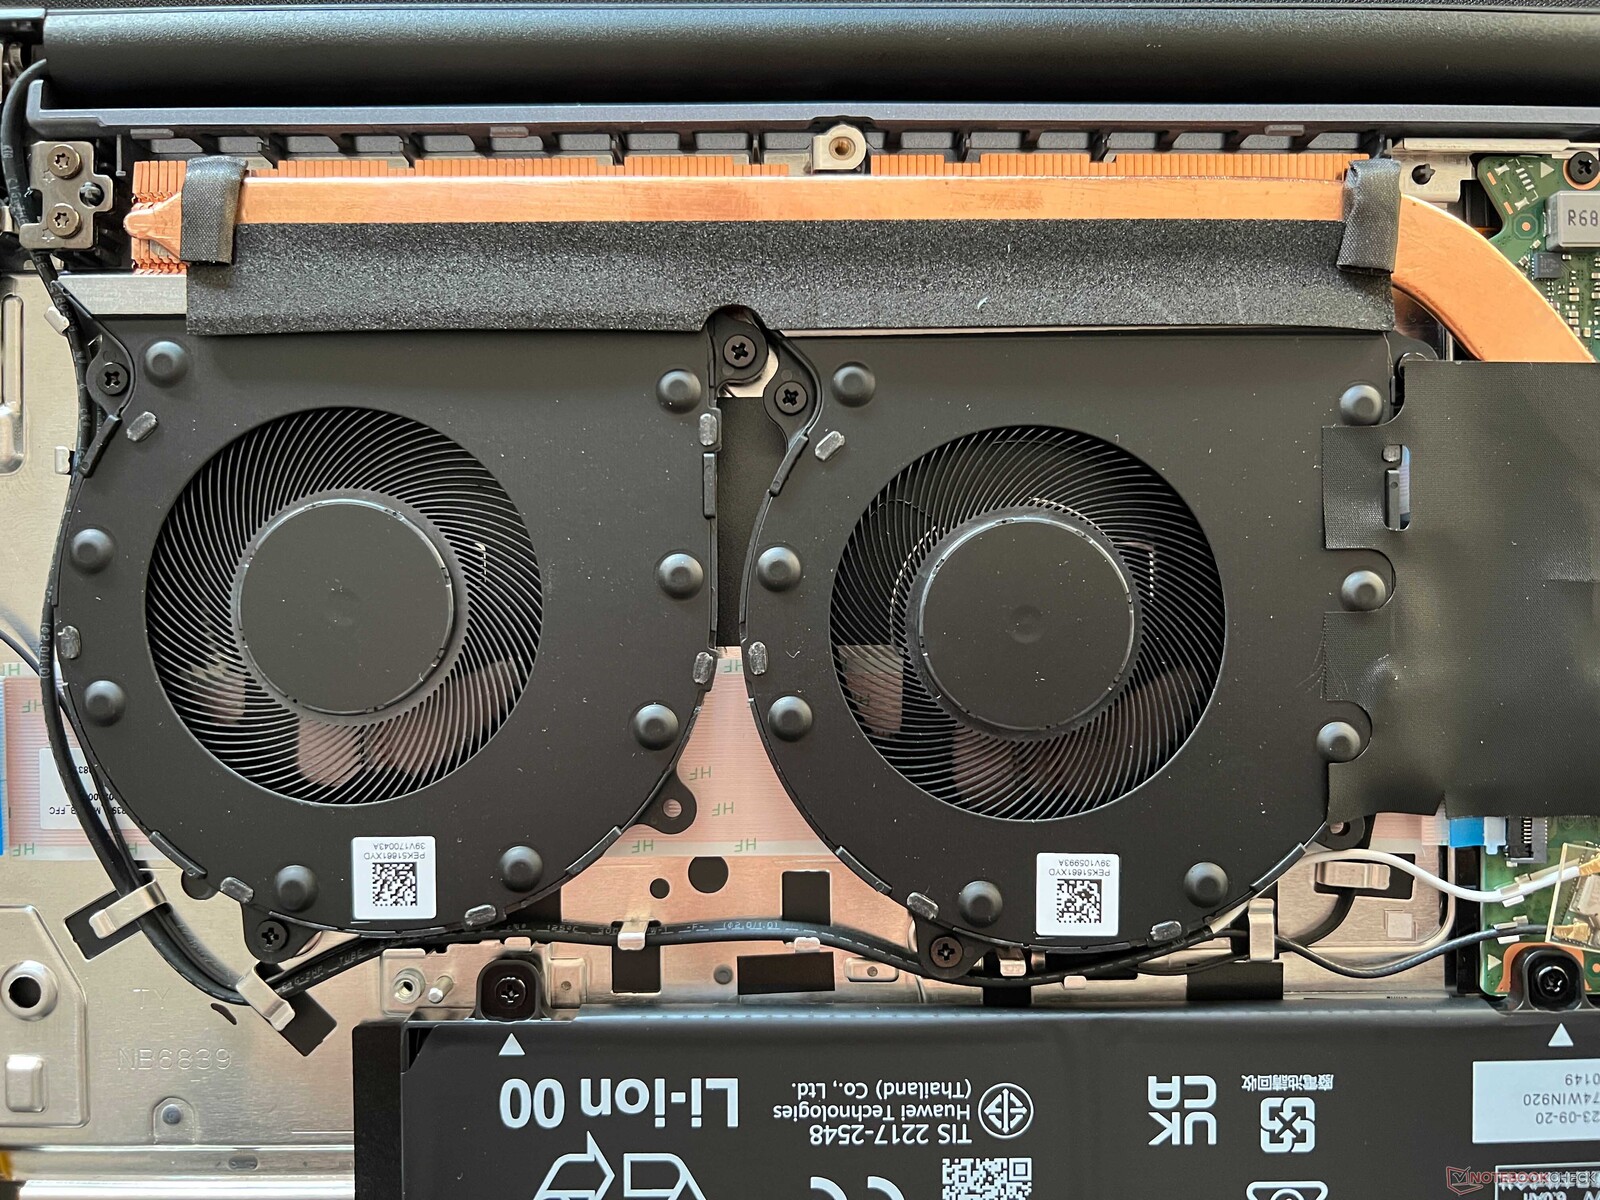
Wartung
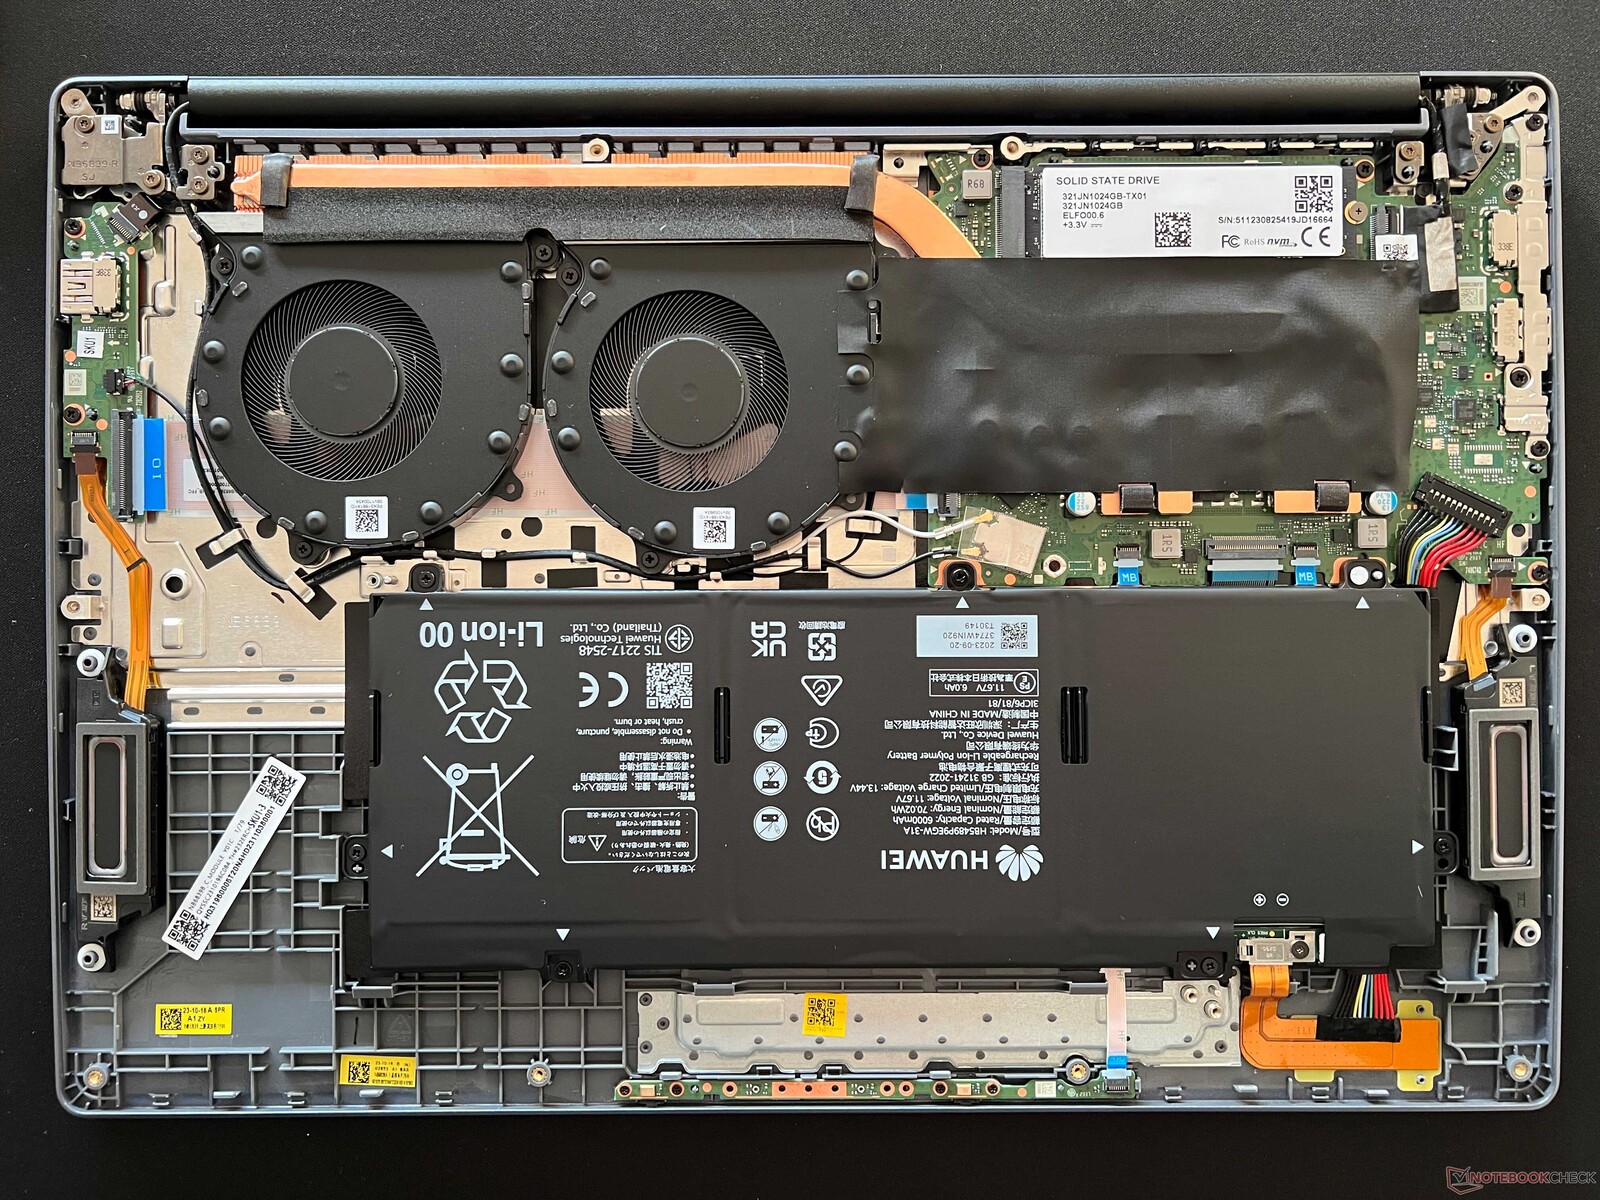
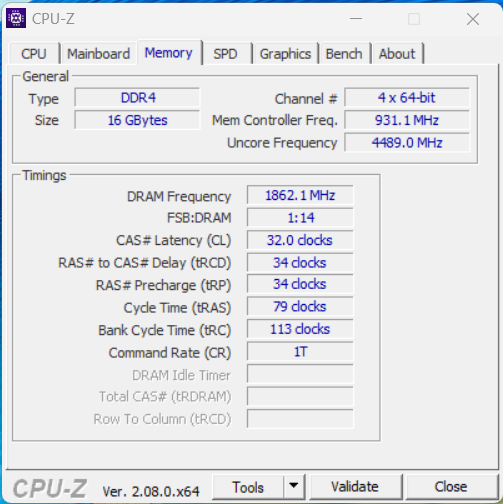
Die untere Abdeckung ist mit insgesamt 10 Torx-Schrauben (T5) gesichert und lässt sich abnehmen. Im Inneren erkennt man schnell ein neues Kühlsystem mit zwei Lüftern auf der rechten Seite der Baseunit. Zudem sieht man aber auch, dass es hier viel ungenutzten Platz gibt, den man problemlos für RAM-Slots oder einen zweiten M.2-2280-Steckplatz hätte nutzen können. So muss man aber mit einer SSD, 16 GB aufgelötetem RAM und einem aufgelöteten WLAN-Modul Vorlieb nehmen.
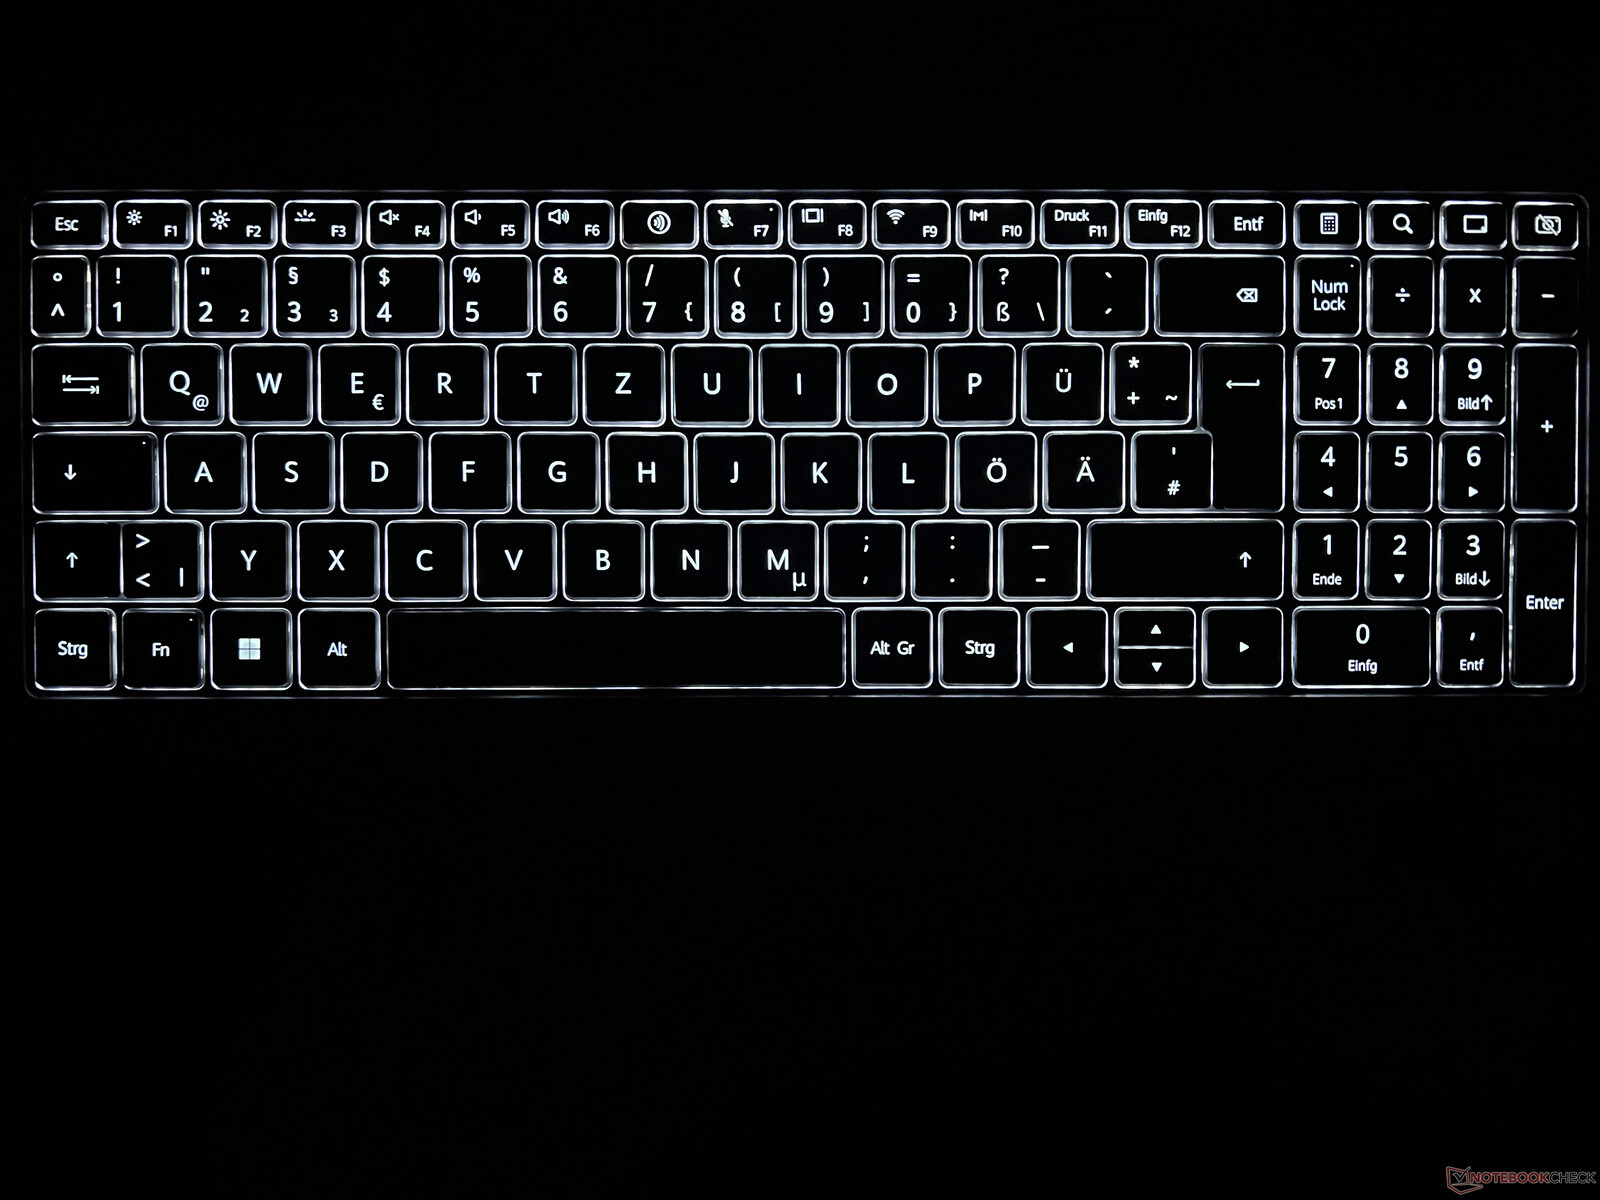
Eingabegeräte - Beleuchtete Tastatur mit Nummernblock
Das MateBook D 16 2024 bietet eine Tastatur inklusive dediziertem Nummernblock, wobei die Tasten hier etwas schmaler ausfallen. Insgesamt hinterlässt die Tastatur einen guten Eindruck, denn dank dem Tastenhub von 1,5 mm und dem präzisen Anschlag ist das Tippgefühl sehr komfortabel und auch längere Texte sind kein Problem. Allerdings gehört die Tastatur auch zu den lauteren Modellen. Huawei integriert eine zweistufige weiße Hintergrundbeleuchtung, die allerdings nicht automatisch via Sensor aktiviert werden kann. Der Power-Button befindet sich rechts oberhalb der Tastatur und beinhaltet auch den Fingerabdrucksensor.
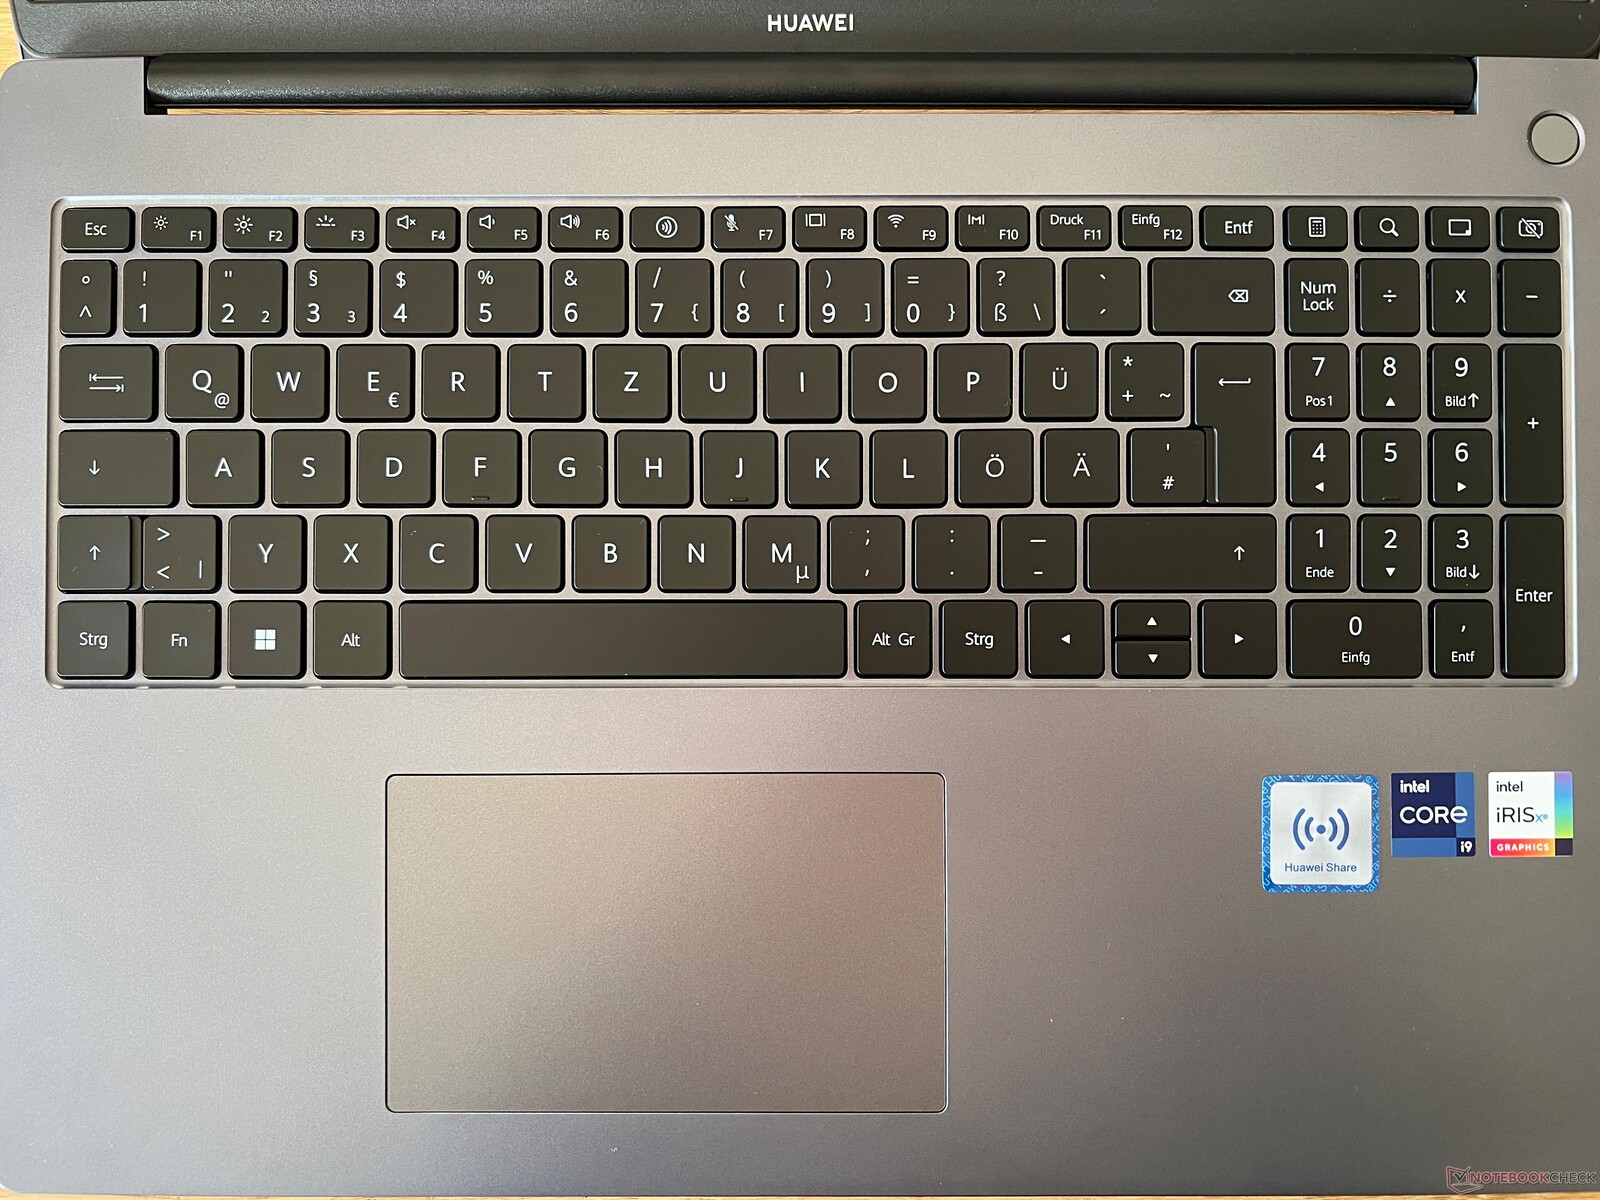
Das Clickpad ist mit 12 x 7,3 cm ausreichend groß und funktioniert einwandfrei. Wie üblich lässt sich der untere Teil des Pads physikalisch herunterdrücken, was aber mit lauten und billig wirkenden Klickgeräuschen quittiert wird. In der Praxis empfehlen wir daher, das Pad für Eingaben nur anzutippen.
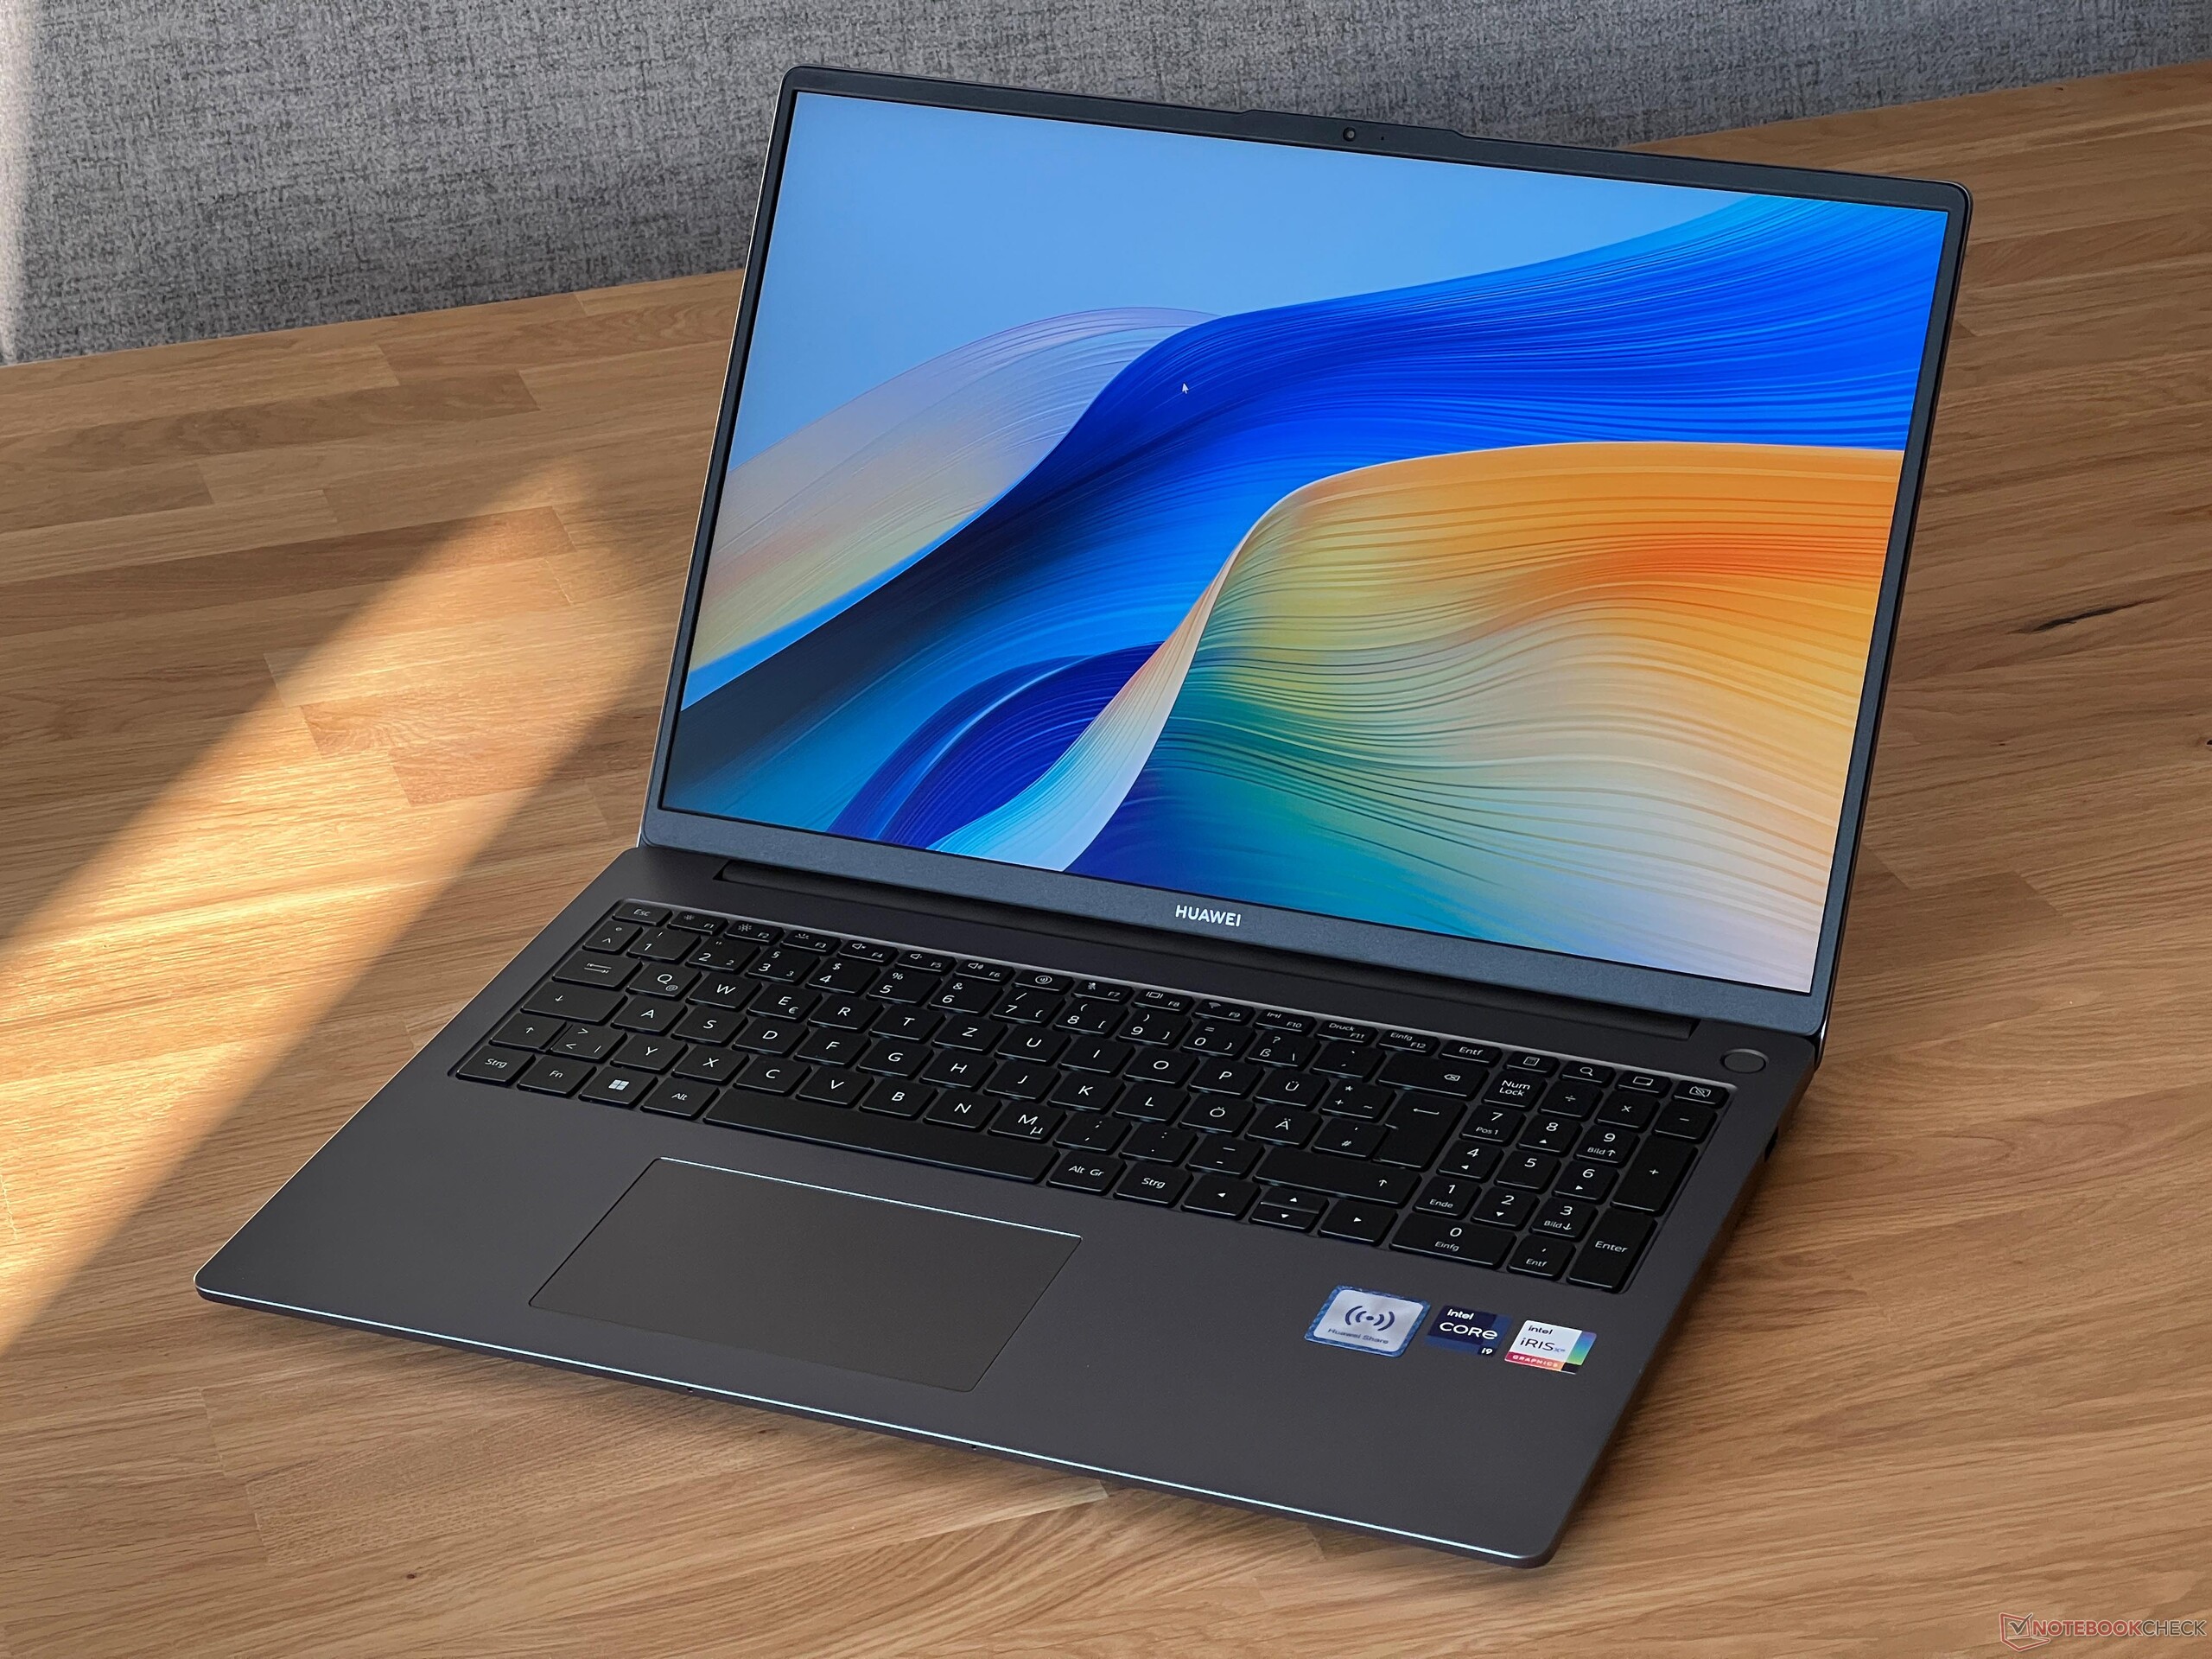
Display - 16:10 IPS-Panel
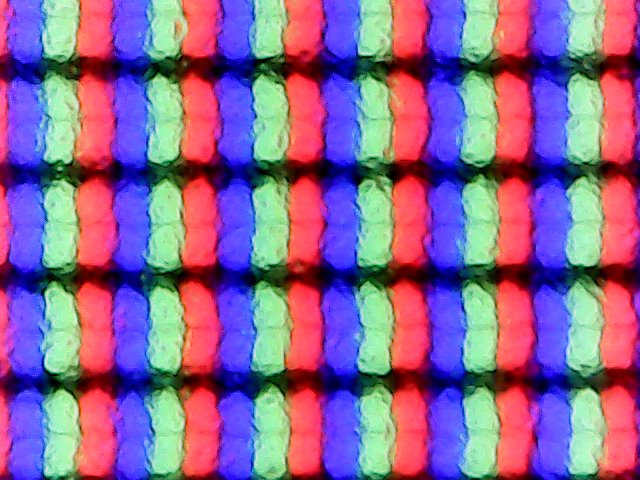
Das matte 16-Zoll IPS-Panel von BOE (NV160WUM-NH0) kennen wir bereits vom alten 2022er-Modell und es handelt sich um ein sehr einfaches Display mit der Auflösung von 1.920 x 1.200 Pixeln. Die subjektive Bildqualität ist gut, da auch helle Flächen keinen körnigen Bildeindruck aufweisen, doch mit 60 Hz und keinerlei zusätzlichen Features wie HDR hat man es in dieser Preisklasse schwer. Das erkennt man auch an den Vergleichsgeräten, die allesamt bessere Displays verwenden (höhere Auflösungen, teilweise OLED, höhere Frequenzen). Lediglich das Lenovo Yoga 7 setzt auf ein vergleichbares Panel.
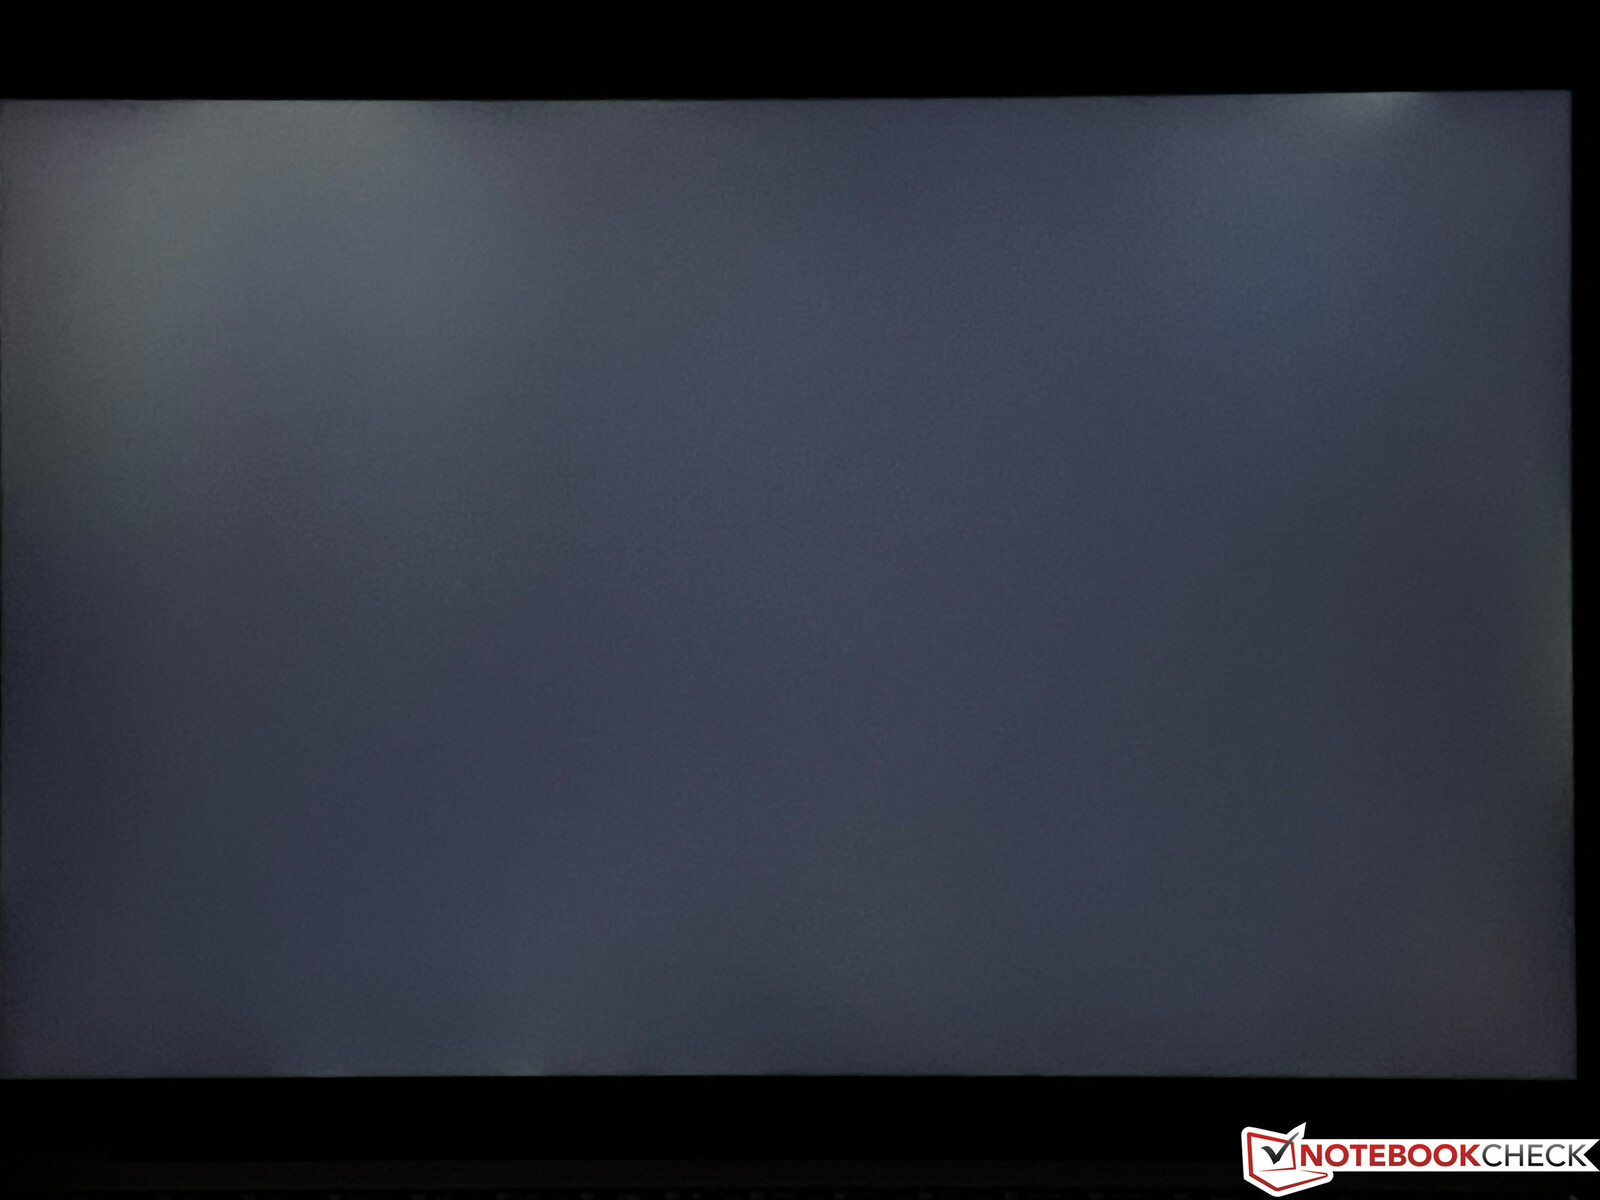
Huawei gibt eine Helligkeit von 300 cd/m² an, was unser Testgerät mit durchschnittlich 340 cd/m² aber klar übertrifft. Die Ausleuchtung ist mit 80 % allerdings nicht sehr gut. Wir ermitteln einen Schwarzwert von 0,24 cd/m², was insgesamt zu einem starken maximalen Kontrastverhältnis von knapp 1.500:1 führt.
| |||||||||||||||||||||||||
Ausleuchtung: 80 %
Helligkeit Akku: 349 cd/m²
Kontrast: 1454:1 (Schwarzwert: 0.24 cd/m²)
ΔE ColorChecker Calman: 2.8 | ∀{0.5-29.43 Ø4.73}
calibrated: 0.7
ΔE Greyscale Calman: 4.9 | ∀{0.09-98 Ø4.97}
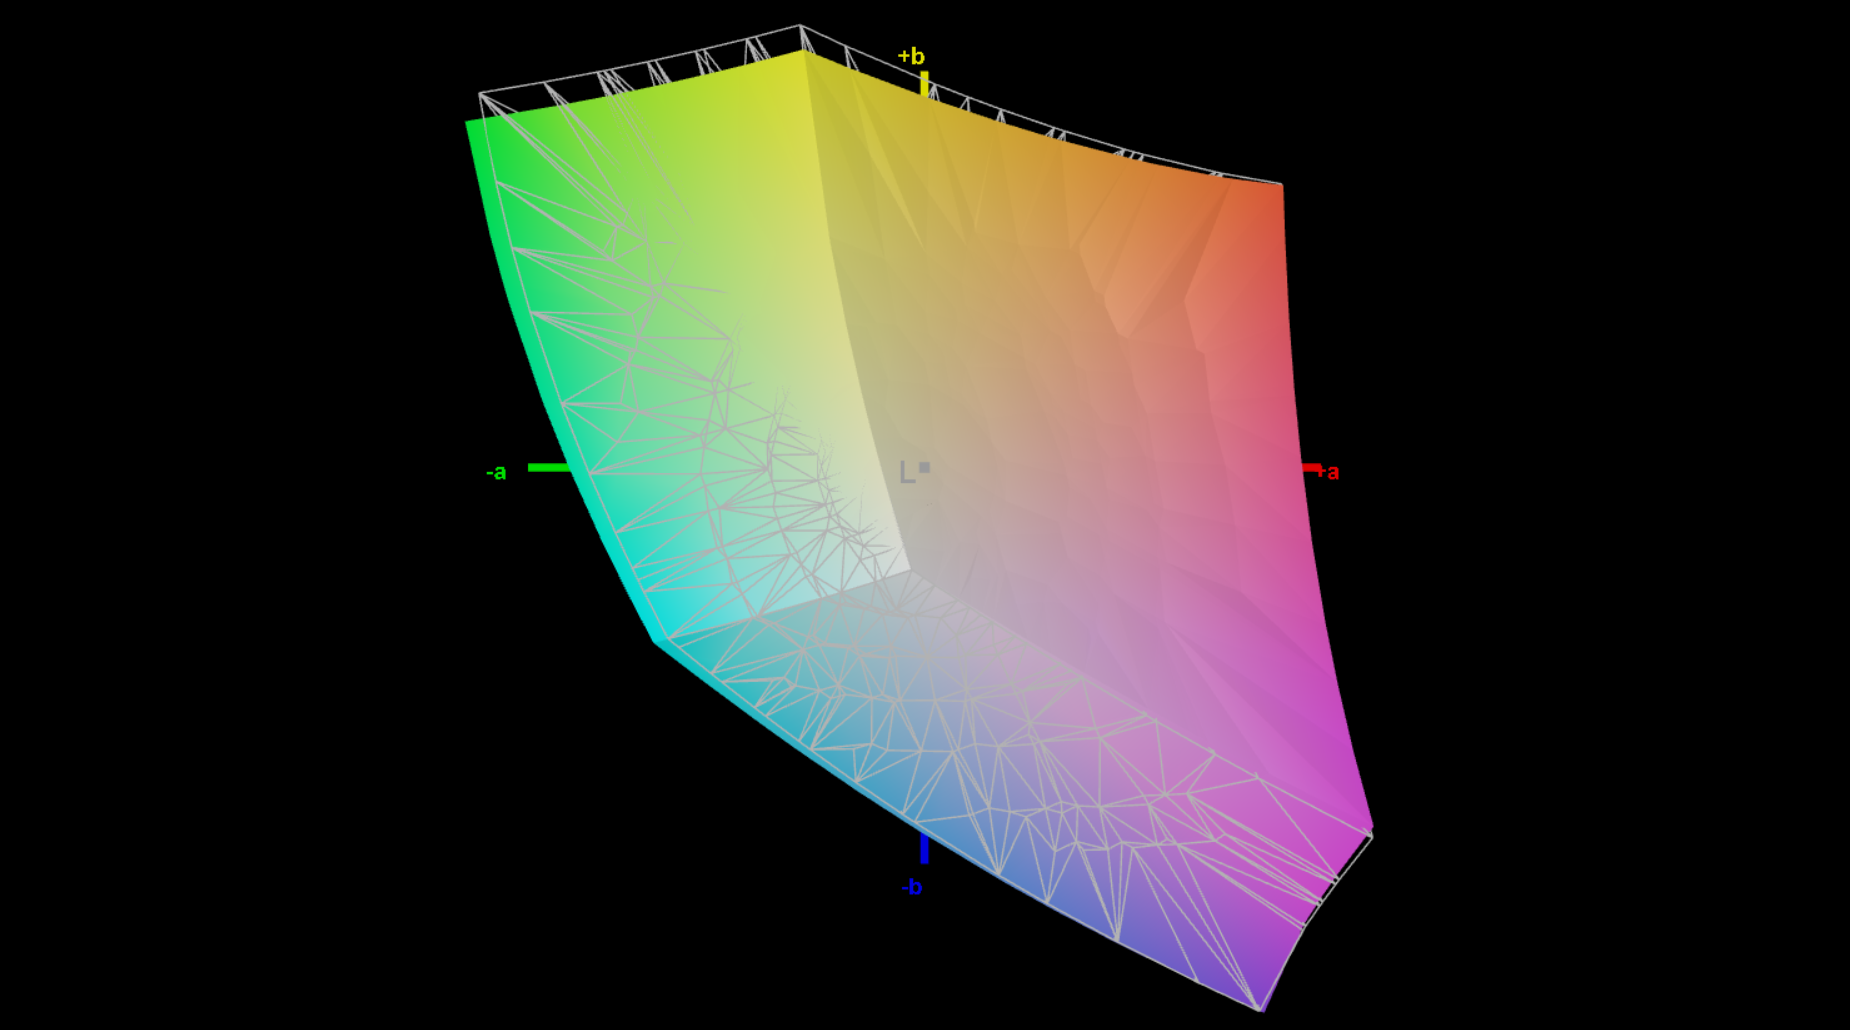
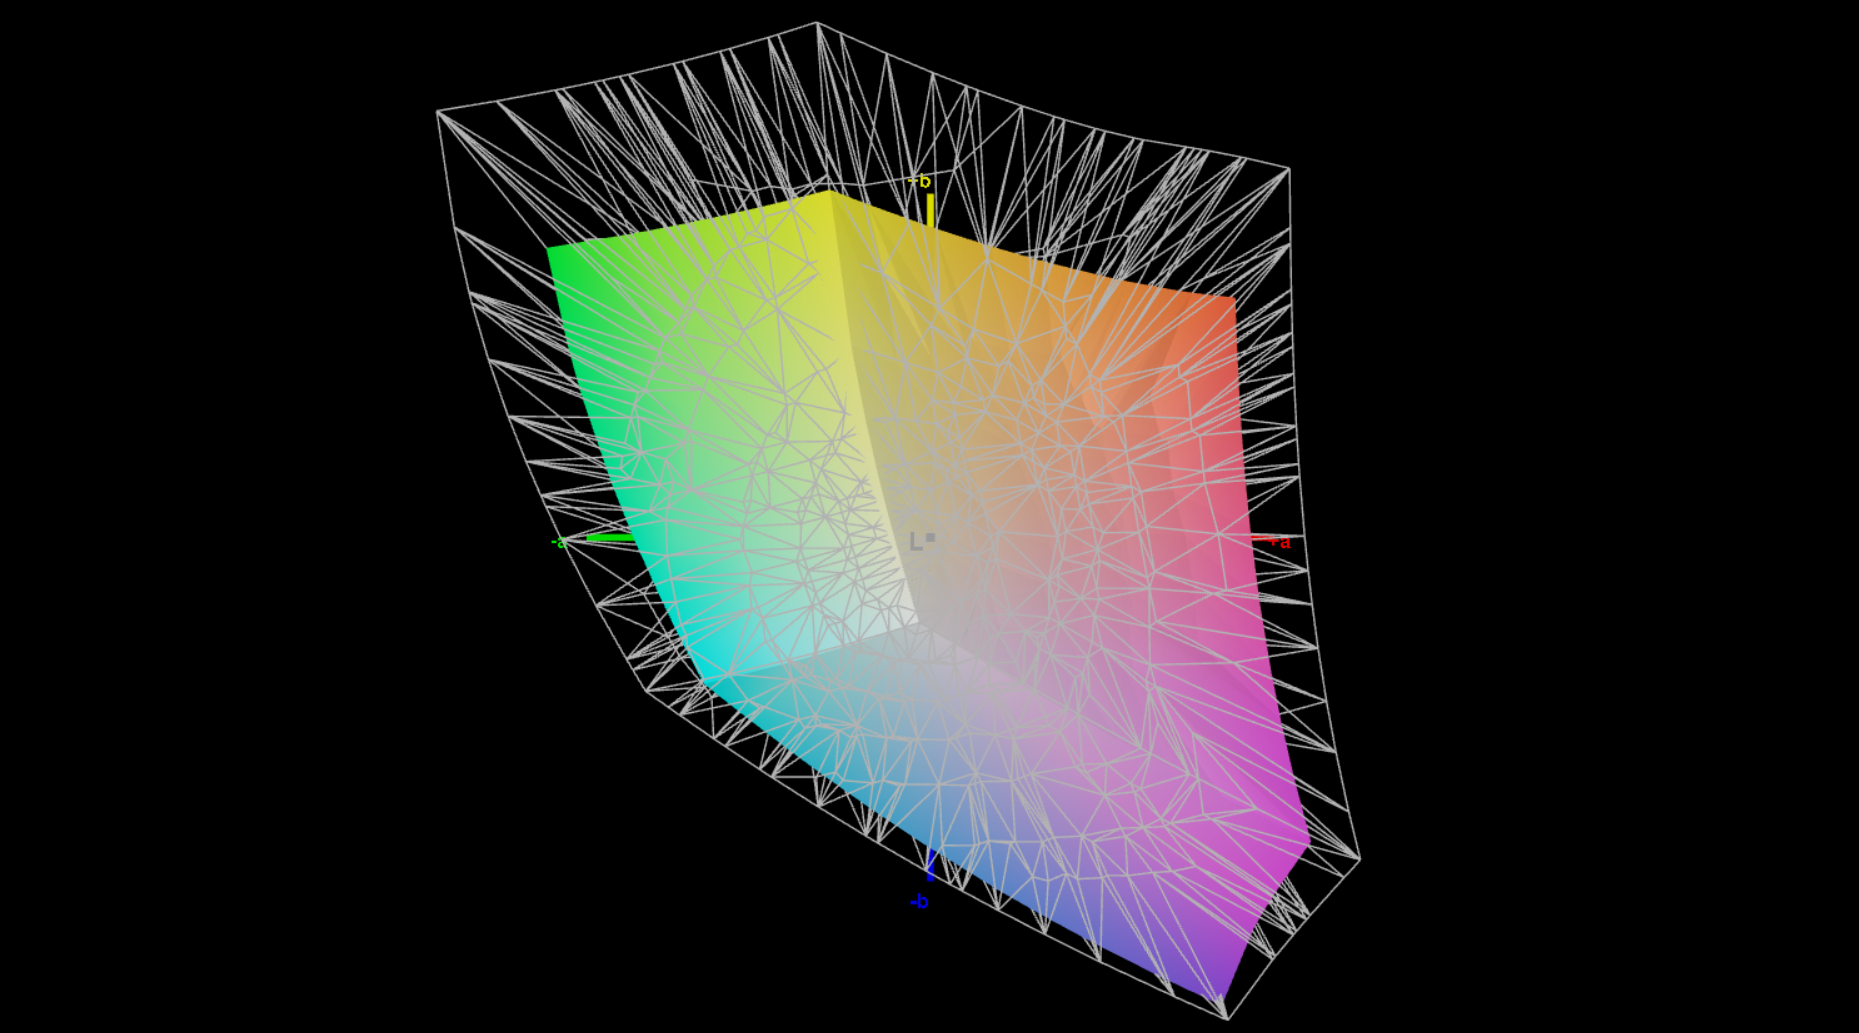
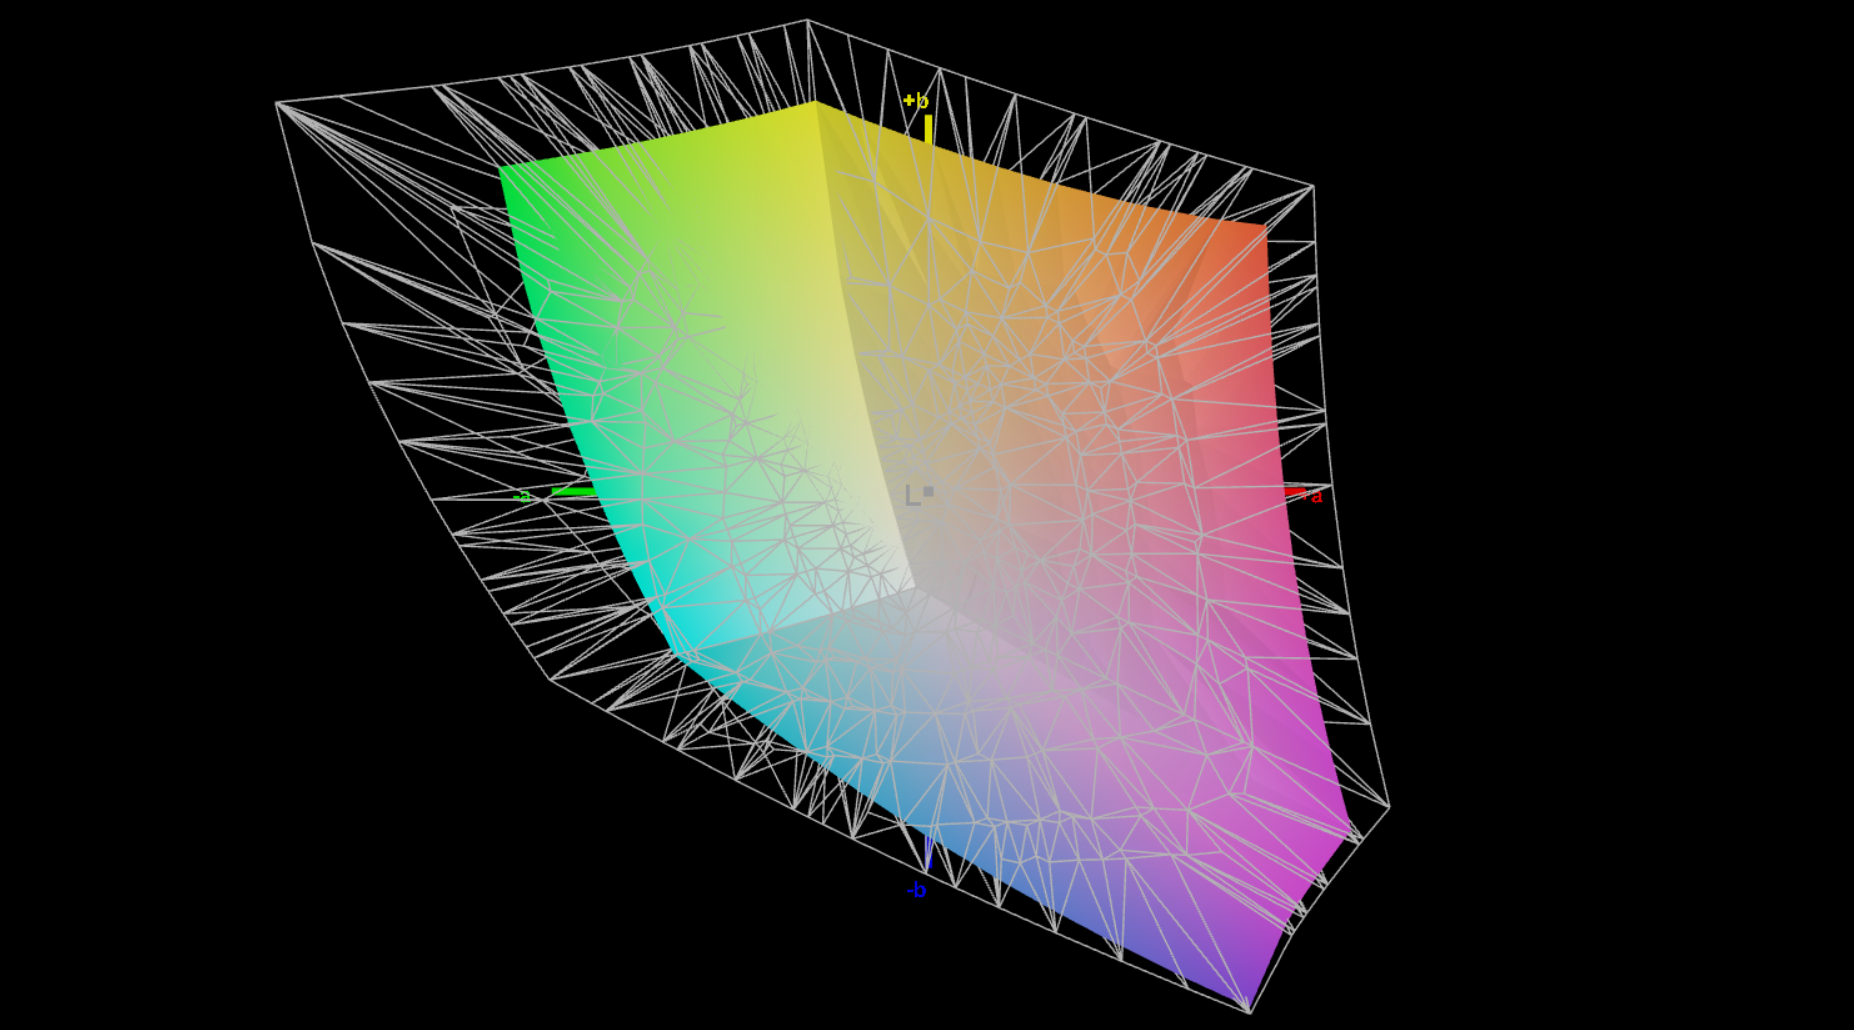
68.8% AdobeRGB 1998 (Argyll 3D)
96.5% sRGB (Argyll 3D)
66.7% Display P3 (Argyll 3D)
Gamma: 2.2
CCT: 7328 K
| Huawei MateBook D 16 2024 NV160WUM-NH0, IPS, 1920x1200, 16" | MSI Prestige 16 B1MG-001US AU Optronics B160QAN03.R, IPS, 2560x1600, 16" | Acer Swift Edge SFE16 Ryzen 7 7840U Samsung ATNA60BX03-0, OLED, 3200x2000, 16" | Schenker Vision 16 PH6PRX1 BOE CQ NE160QDM-NZ1 , IPS, 2560x1600, 16" | Acer Swift Go SFG16-71 Samsung SDC418D ATNA60BC03-0, OLED, 3200x2000, 16" | Lenovo Yoga 7 16IRL8 LEN160FHD, IPS, 1920x1200, 16" | Samsung Galaxy Book3 Pro 16 Samsung ATNA60CL03-0, AMOLED, 2880x1800, 16" | Huawei MateBook 16s i9 BOE0BB0 TV160DKT-NH1, IPS, 2560x1680, 16" | Huawei MateBook D 16 2022 BOE NV160WUM-NH0, IPS, 1920x1200, 16" | |
|---|---|---|---|---|---|---|---|---|---|
| Display | 24% | 33% | 4% | 33% | -36% | 31% | -4% | -1% | |
| Display P3 Coverage (%) | 66.7 | 96.7 45% | 99.9 50% | 70 5% | 99.91 50% | 42 -37% | 99.7 49% | 63 -6% | 66.2 -1% |
| sRGB Coverage (%) | 96.5 | 99.8 3% | 100 4% | 99.3 3% | 100 4% | 62.8 -35% | 100 4% | 94.9 -2% | 96.4 0% |
| AdobeRGB 1998 Coverage (%) | 68.8 | 84.6 23% | 100 45% | 71.2 3% | 98.87 44% | 43.5 -37% | 97 41% | 65.1 -5% | 68.3 -1% |
| Response Times | -63% | 97% | 63% | 92% | -3% | 92% | 3% | 5% | |
| Response Time Grey 50% / Grey 80% * (ms) | 31 ? | 49.4 ? -59% | 0.57 ? 98% | 11 ? 65% | 2 ? 94% | 31.8 ? -3% | 2 ? 94% | 34 ? -10% | 30.5 ? 2% |
| Response Time Black / White * (ms) | 20.3 ? | 33.9 ? -67% | 1 ? 95% | 8 ? 61% | 2 ? 90% | 20.9 ? -3% | 2 ? 90% | 17 ? 16% | 18.7 ? 8% |
| PWM Frequency (Hz) | 238.8 | 227 ? | 26 ? | ||||||
| Bildschirm | -5% | 11% | 13% | -25% | -48% | 193% | 16% | -7% | |
| Helligkeit Bildmitte (cd/m²) | 349 | 473.6 36% | 379.8 9% | 356 2% | 370 6% | 279.4 -20% | 412 18% | 448 28% | 319 -9% |
| Brightness (cd/m²) | 340 | 456 34% | 383 13% | 349 3% | 371 9% | 257 -24% | 412 21% | 436 28% | 317 -7% |
| Brightness Distribution (%) | 80 | 87 9% | 98 23% | 93 16% | 98 23% | 81 1% | 98 23% | 93 16% | 90 13% |
| Schwarzwert * (cd/m²) | 0.24 | 0.19 21% | 0.28 -17% | 0.18 25% | 0.015 94% | 0.35 -46% | 0.23 4% | ||
| Kontrast (:1) | 1454 | 2493 71% | 1271 -13% | 1552 7% | 27467 1789% | 1280 -12% | 1387 -5% | ||
| Delta E Colorchecker * | 2.8 | 5.9 -111% | 4.7 -68% | 1.7 39% | 2.77 1% | 5.12 -83% | 2.34 16% | 1.6 43% | 3.4 -21% |
| Colorchecker dE 2000 max. * | 7.3 | 9.37 -28% | 7.51 -3% | 3 59% | 4.08 44% | 19.42 -166% | 3.34 54% | 4.44 39% | 8.1 -11% |
| Colorchecker dE 2000 calibrated * | 0.7 | 0.89 -27% | 0.55 21% | 1 -43% | 2.83 -304% | 1.84 -163% | 2.95 -321% | 0.64 9% | 0.8 -14% |
| Delta E Graustufen * | 4.9 | 7.3 -49% | 0.8 84% | 1.3 73% | 2.58 47% | 5.5 -12% | 2.78 43% | 2.78 43% | 5.7 -16% |
| Gamma | 2.2 100% | 1.9 116% | 2.22 99% | 2.1 105% | 2.46 89% | 2.22 99% | 2.5 88% | 2.1 105% | |
| CCT | 7328 89% | 7260 90% | 6381 102% | 6625 98% | 6241 104% | 6407 101% | 6879 94% | 6582 99% | 7433 87% |
| Farbraum (Prozent von AdobeRGB 1998) (%) | 2.43 | ||||||||
| Durchschnitt gesamt (Programm / Settings) | -15% /
-7% | 47% /
31% | 27% /
18% | 33% /
9% | -29% /
-39% | 105% /
144% | 5% /
10% | -1% /
-4% |
* ... kleinere Werte sind besser
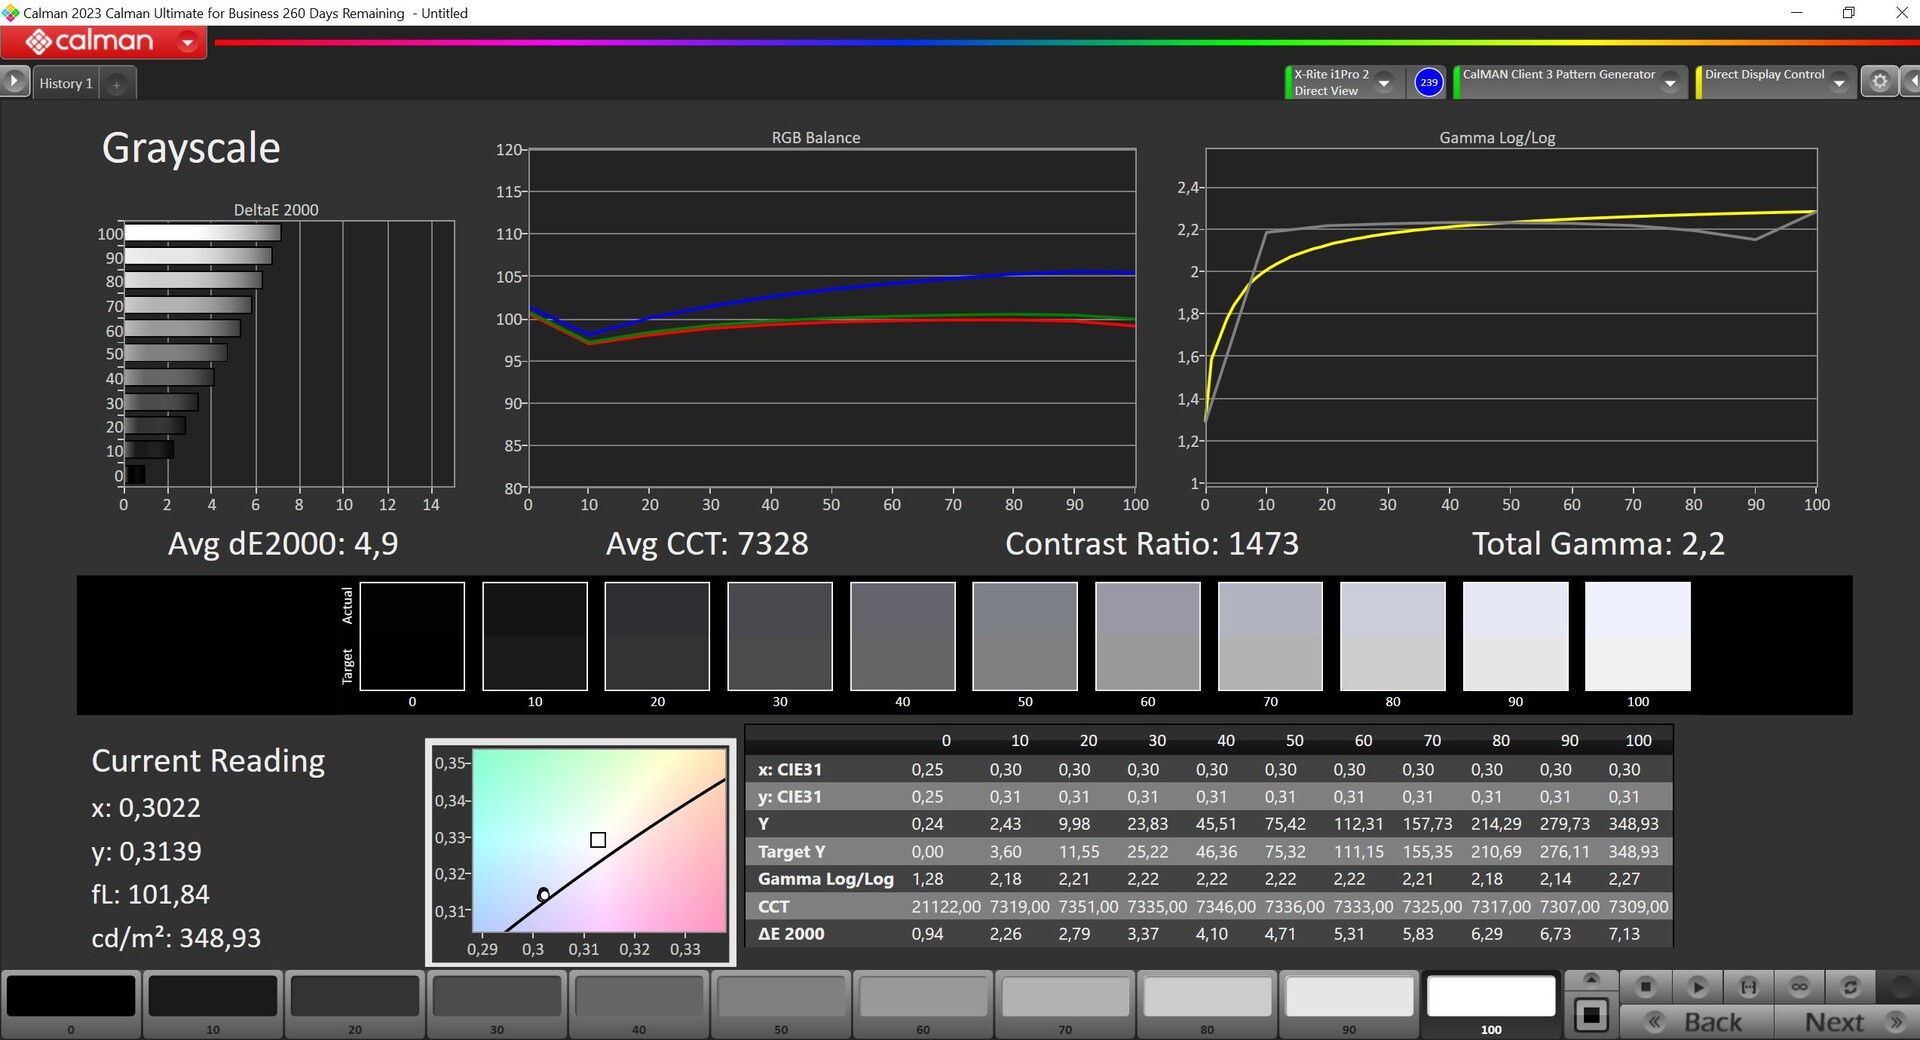
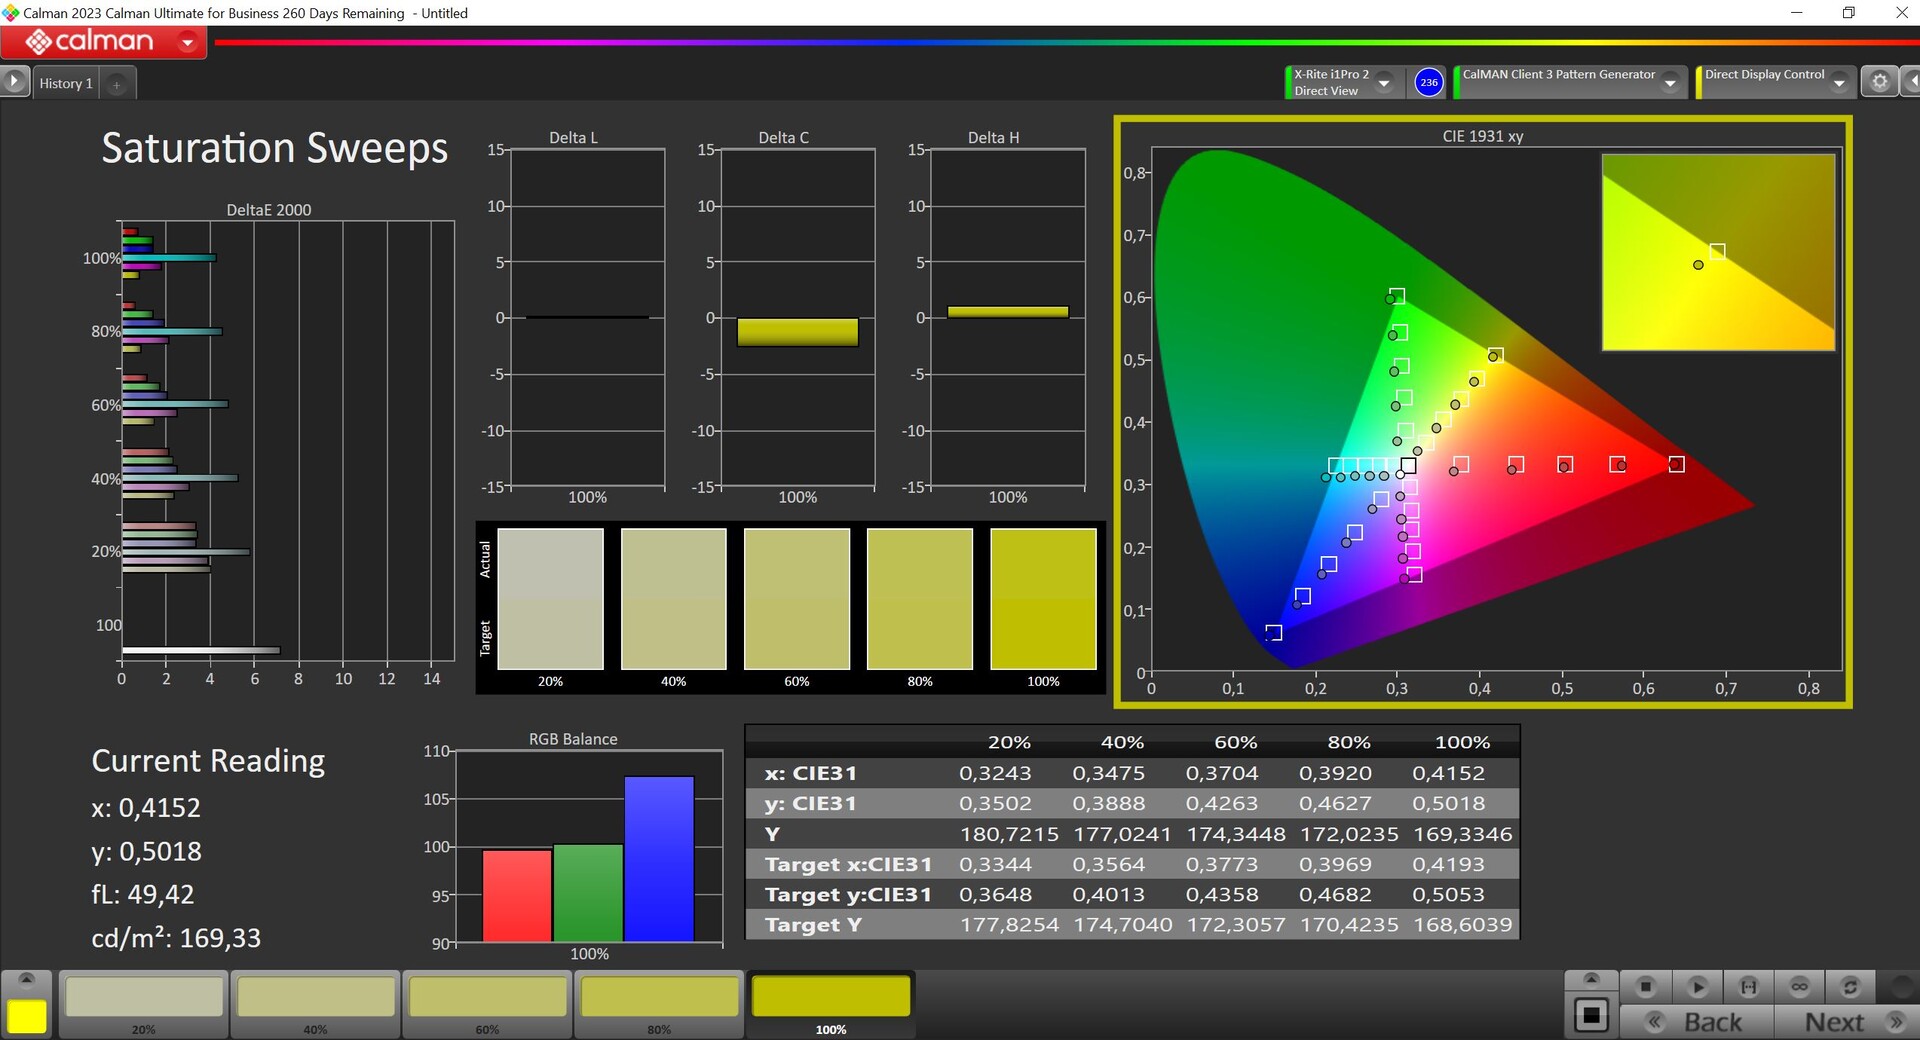
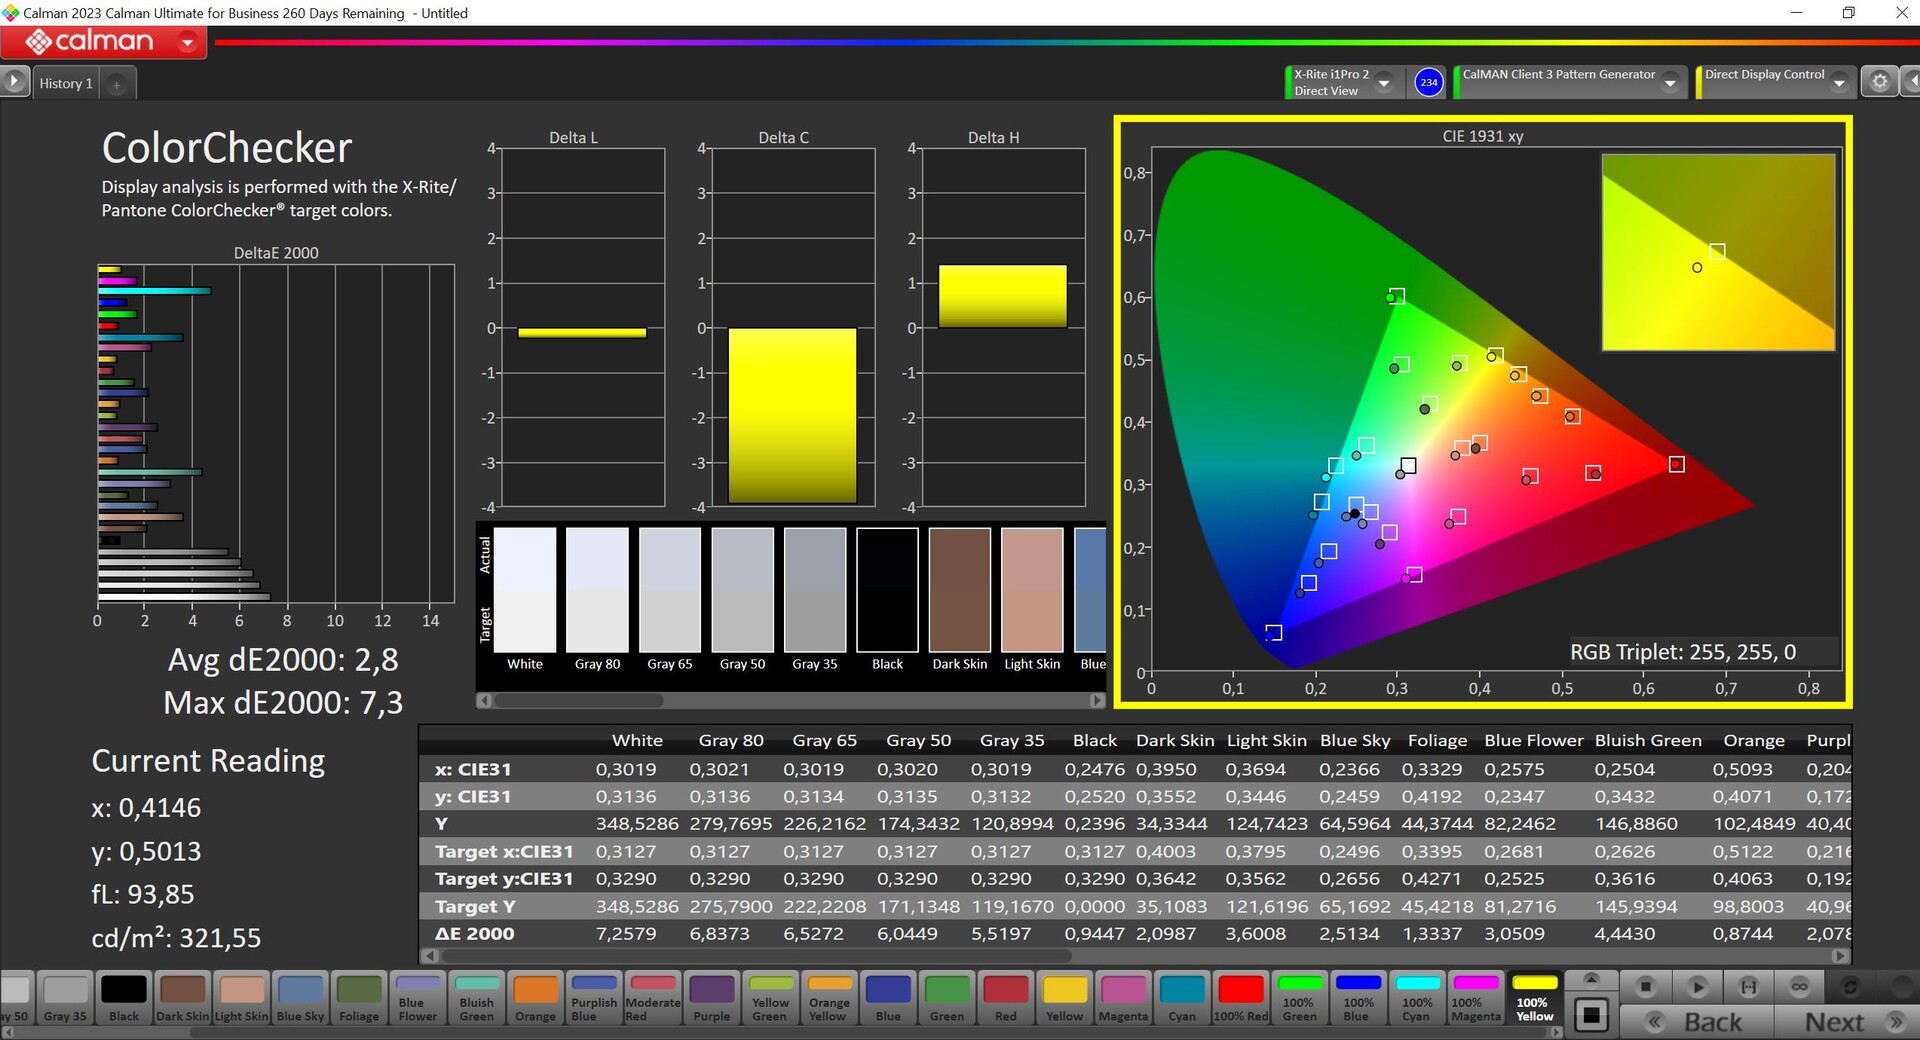
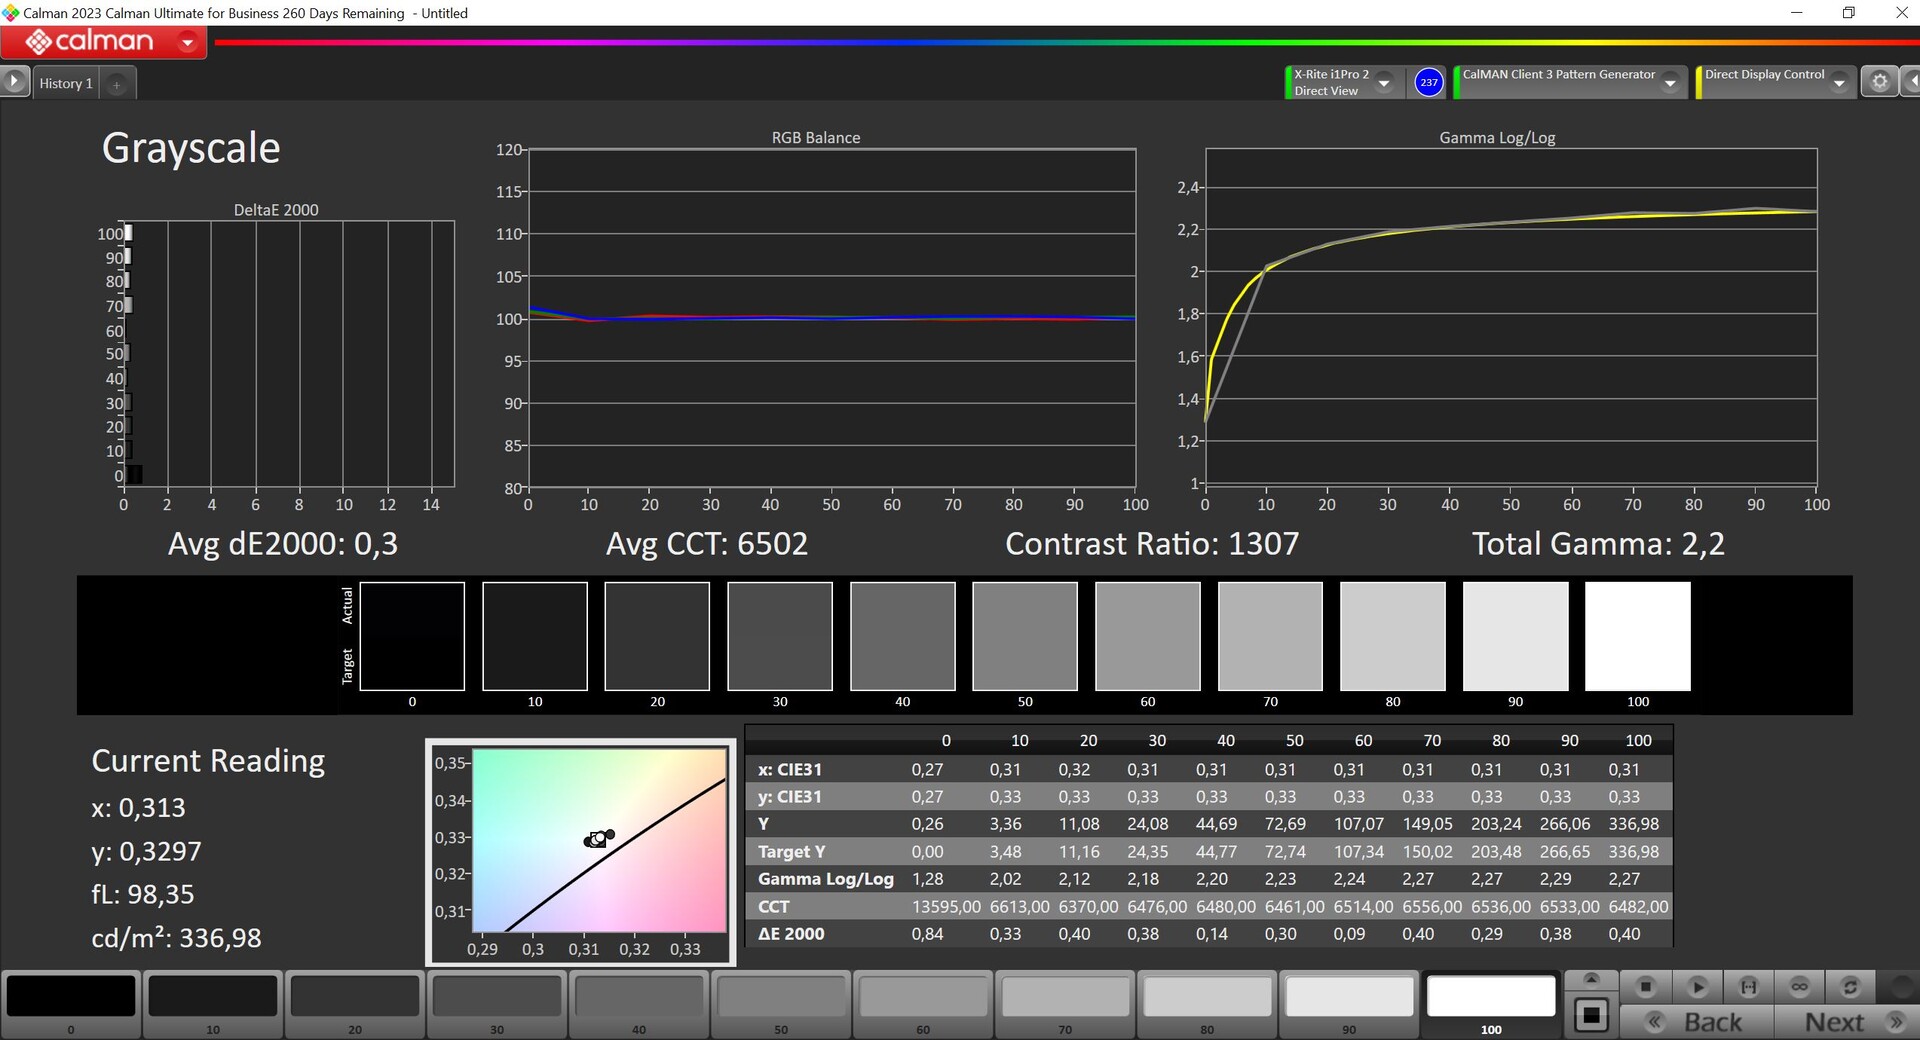

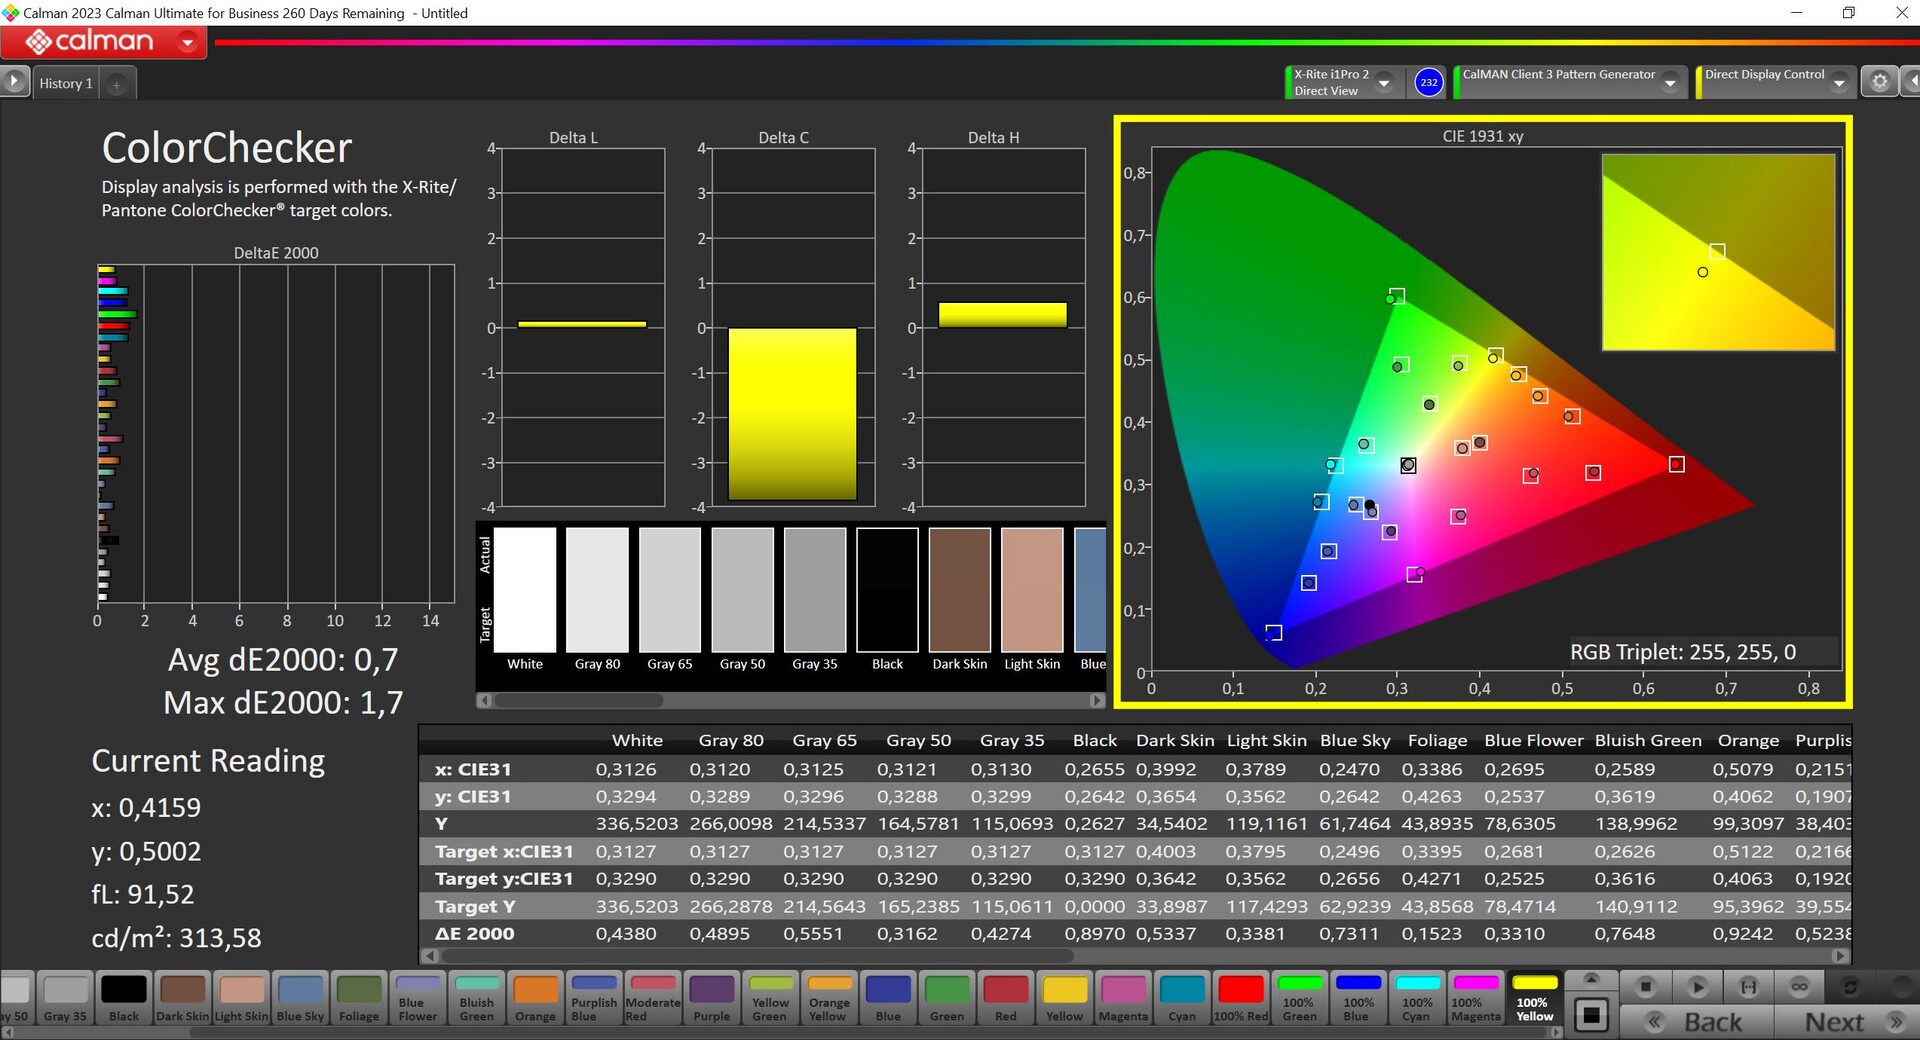
Unsere Analyse mit der professionellen CalMAN-Software (X-Rite i1 Pro2) zeigt, dass die Werkskalibrierung nicht besonders gut ist und es im Auslieferungszustand deutliche Abweichungen, sowohl bei den Graustufen als auch den Farben gibt. Zudem erkennt man einen leichten Blaustich in Verbindung mit einer zu kühlen Farbtemperatur, wovon aber die maximale Helligkeit profitiert. Nach unserer eigenen Kalibrierung (das entsprechende Profil steht weiter oben zum kostenlosen Download zur Verfügung) zeigt sich aber, wie viel Potenzial in dem Panel steckt, denn sowohl bei den Graustufen als auch den Farben sind die Abweichungen gegenüber dem sRGB-Referenzfarbraum (der fast vollständig abgedeckt wird) extrem gering und alle Werte liegen deutlich unterhalb der wichtigen DeltaE-2000-Abweichung von 3. Das ist eine sehr gute Leistung, weshalb sich das MateBook D 16 nach der Kalibrierung auch sehr gut für die Bearbeitung von Bildern/Videos im sRGB-Farbraum eignet.
Reaktionszeiten (Response Times) des Displays
| ↔ Reaktionszeiten Schwarz zu Weiß | ||
|---|---|---|
| 20.3 ms ... steigend ↗ und fallend ↘ kombiniert | ↗ 10.6 ms steigend | 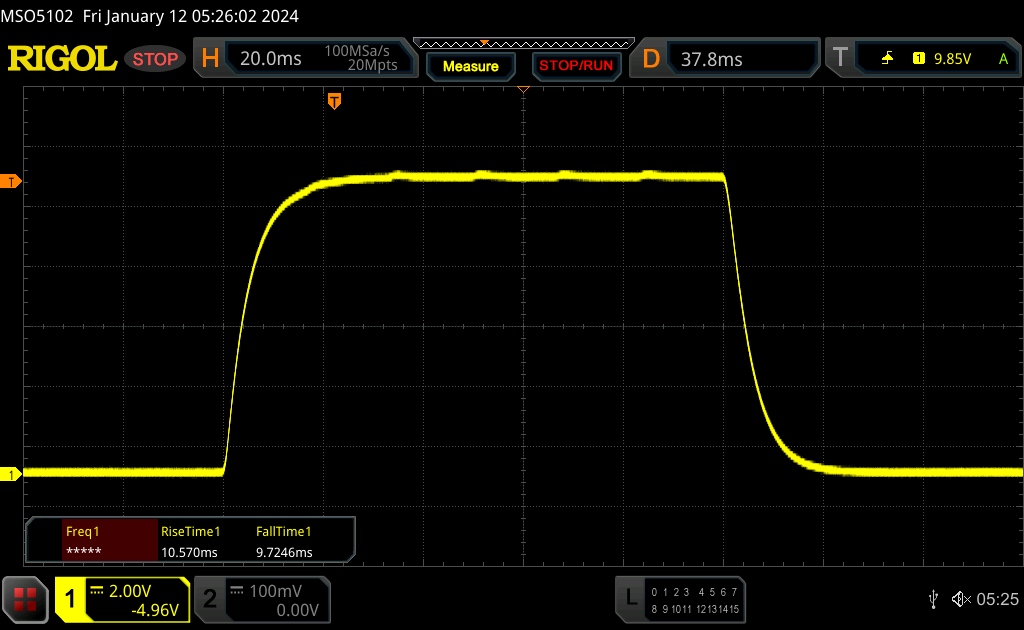 |
| ↘ 9.7 ms fallend | ||
| Die gemessenen Reaktionszeiten sind gut, für anspruchsvolle Spieler könnten der Bildschirm jedoch zu langsam sein. Im Vergleich rangierten die bei uns getesteten Geräte von 0.1 (Minimum) zu 240 (Maximum) ms. » 46 % aller Screens waren schneller als der getestete. Daher sind die gemessenen Reaktionszeiten durchschnittlich (19.9 ms). | ||
| ↔ Reaktionszeiten 50% Grau zu 80% Grau | ||
| 31 ms ... steigend ↗ und fallend ↘ kombiniert | ↗ 14.4 ms steigend | 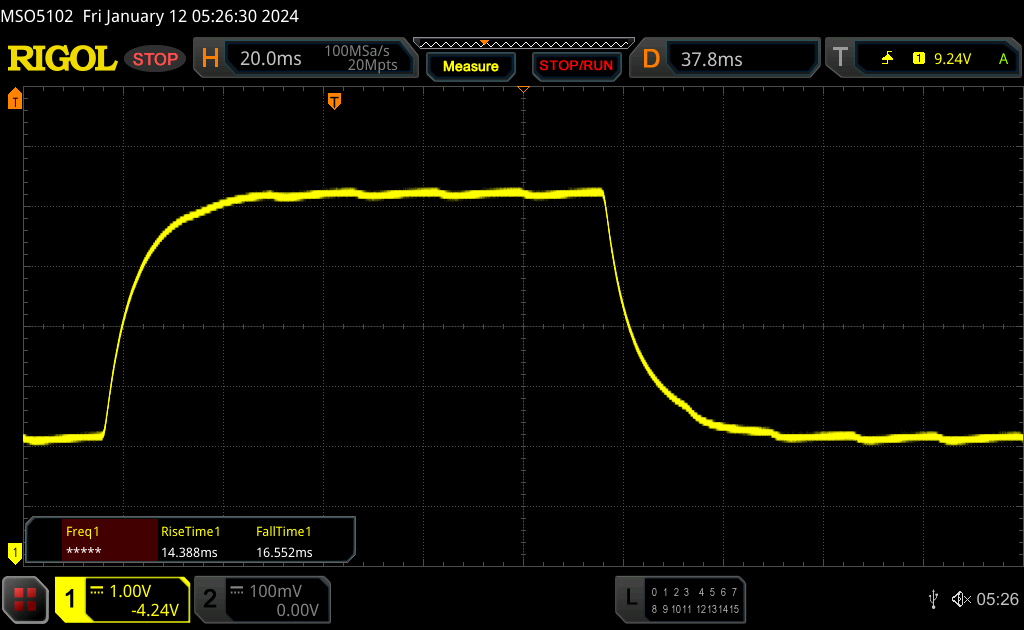 |
| ↘ 16.6 ms fallend | ||
| Die gemessenen Reaktionszeiten sind langsam und dadurch für viele Spieler wahrscheinlich zu langsam. Im Vergleich rangierten die bei uns getesteten Geräte von 0.165 (Minimum) zu 636 (Maximum) ms. » 42 % aller Screens waren schneller als der getestete. Daher sind die gemessenen Reaktionszeiten durchschnittlich (31.1 ms). | ||
Bildschirm-Flackern / PWM (Pulse-Width Modulation)
| Flackern / PWM nicht festgestellt | 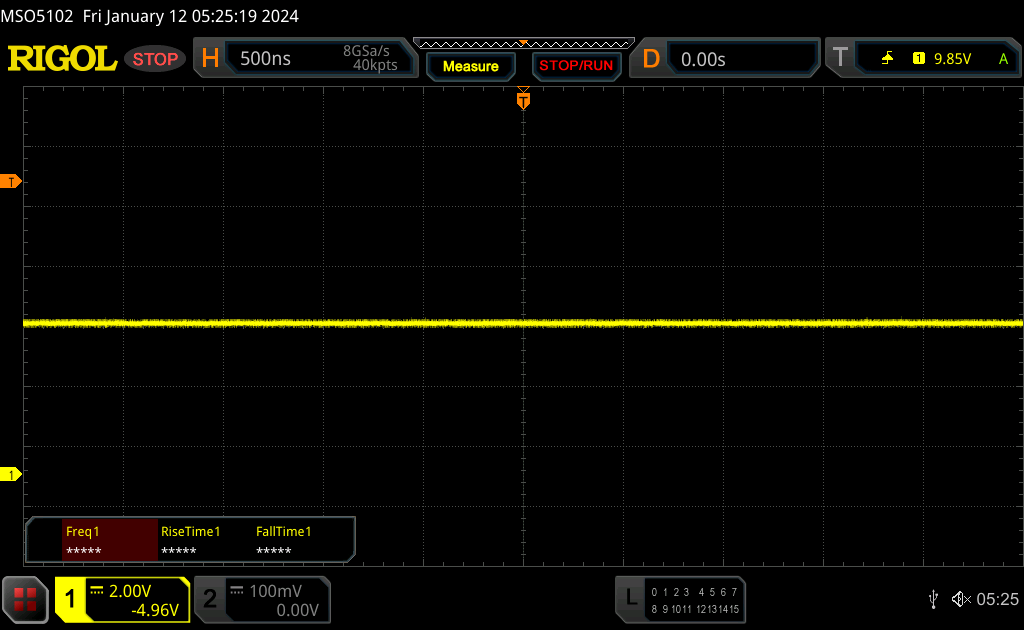 | ||
Im Vergleich: 52 % aller getesteten Geräte nutzten kein PWM um die Helligkeit zu reduzieren. Wenn PWM eingesetzt wurde, dann bei einer Frequenz von durchschnittlich 7791 (Minimum 5, Maximum 343500) Hz. | |||
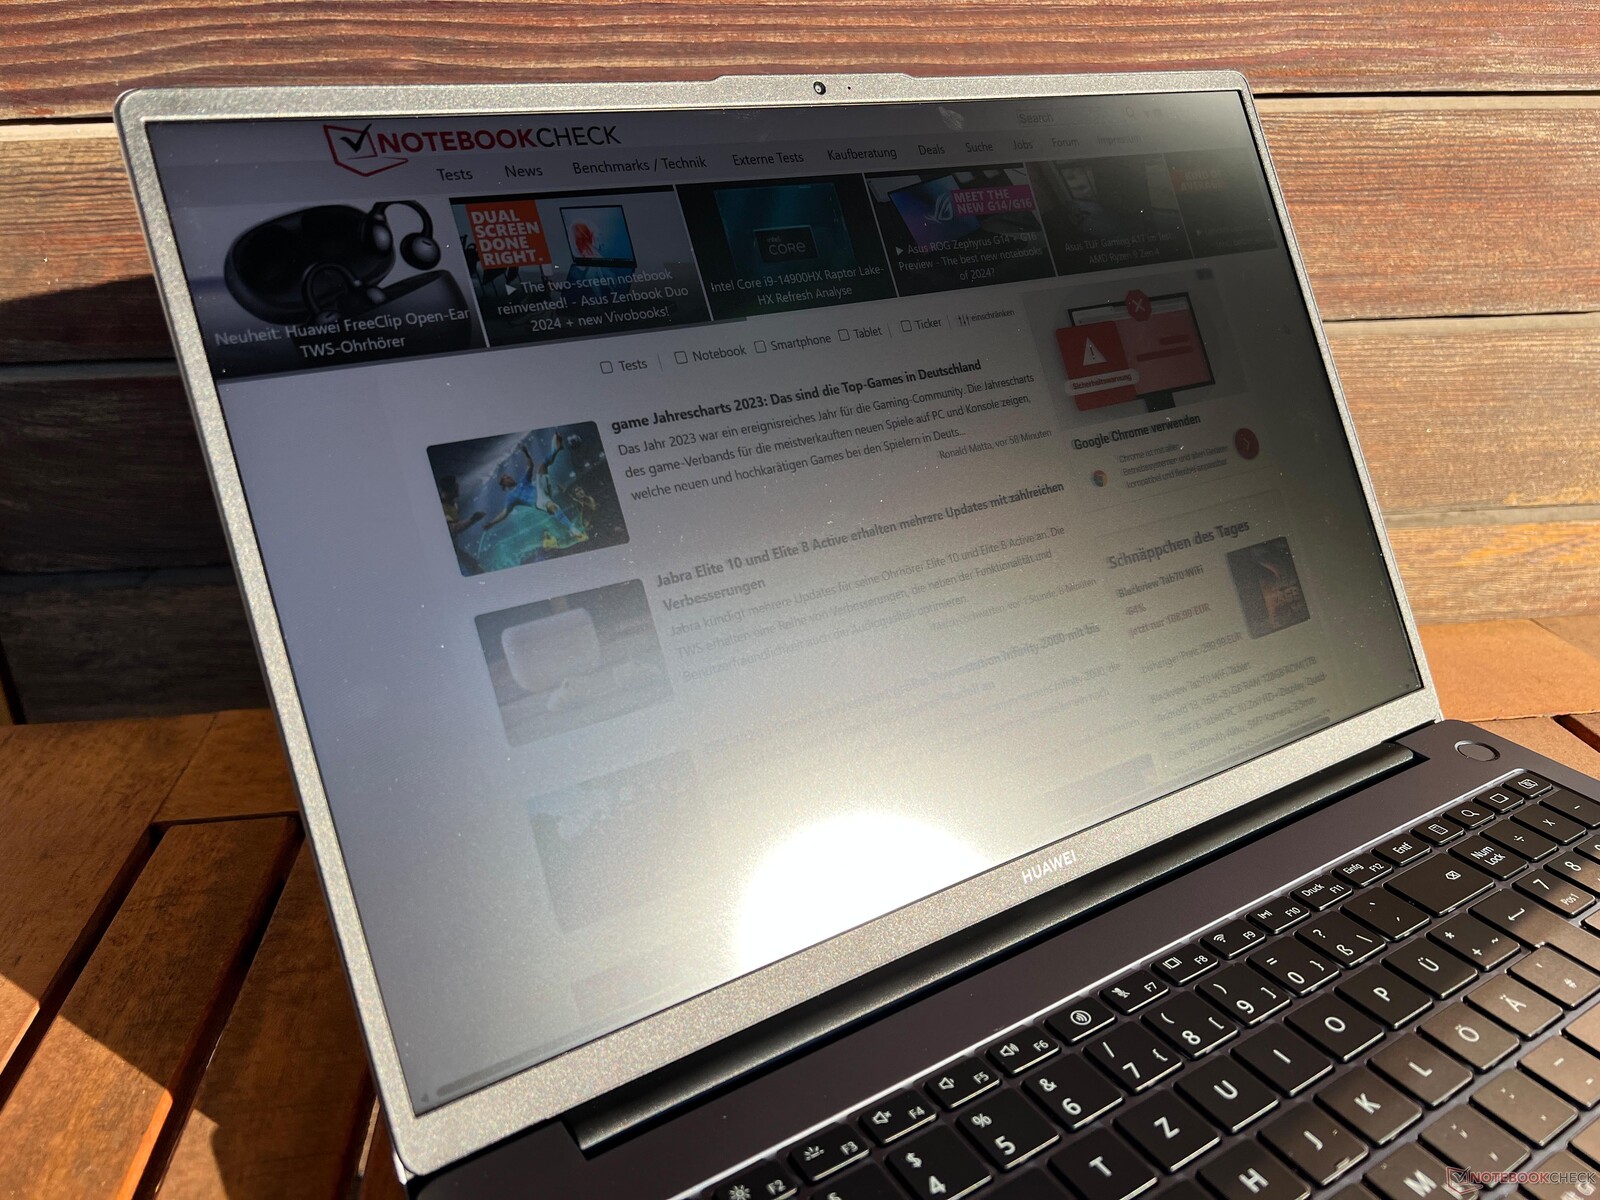


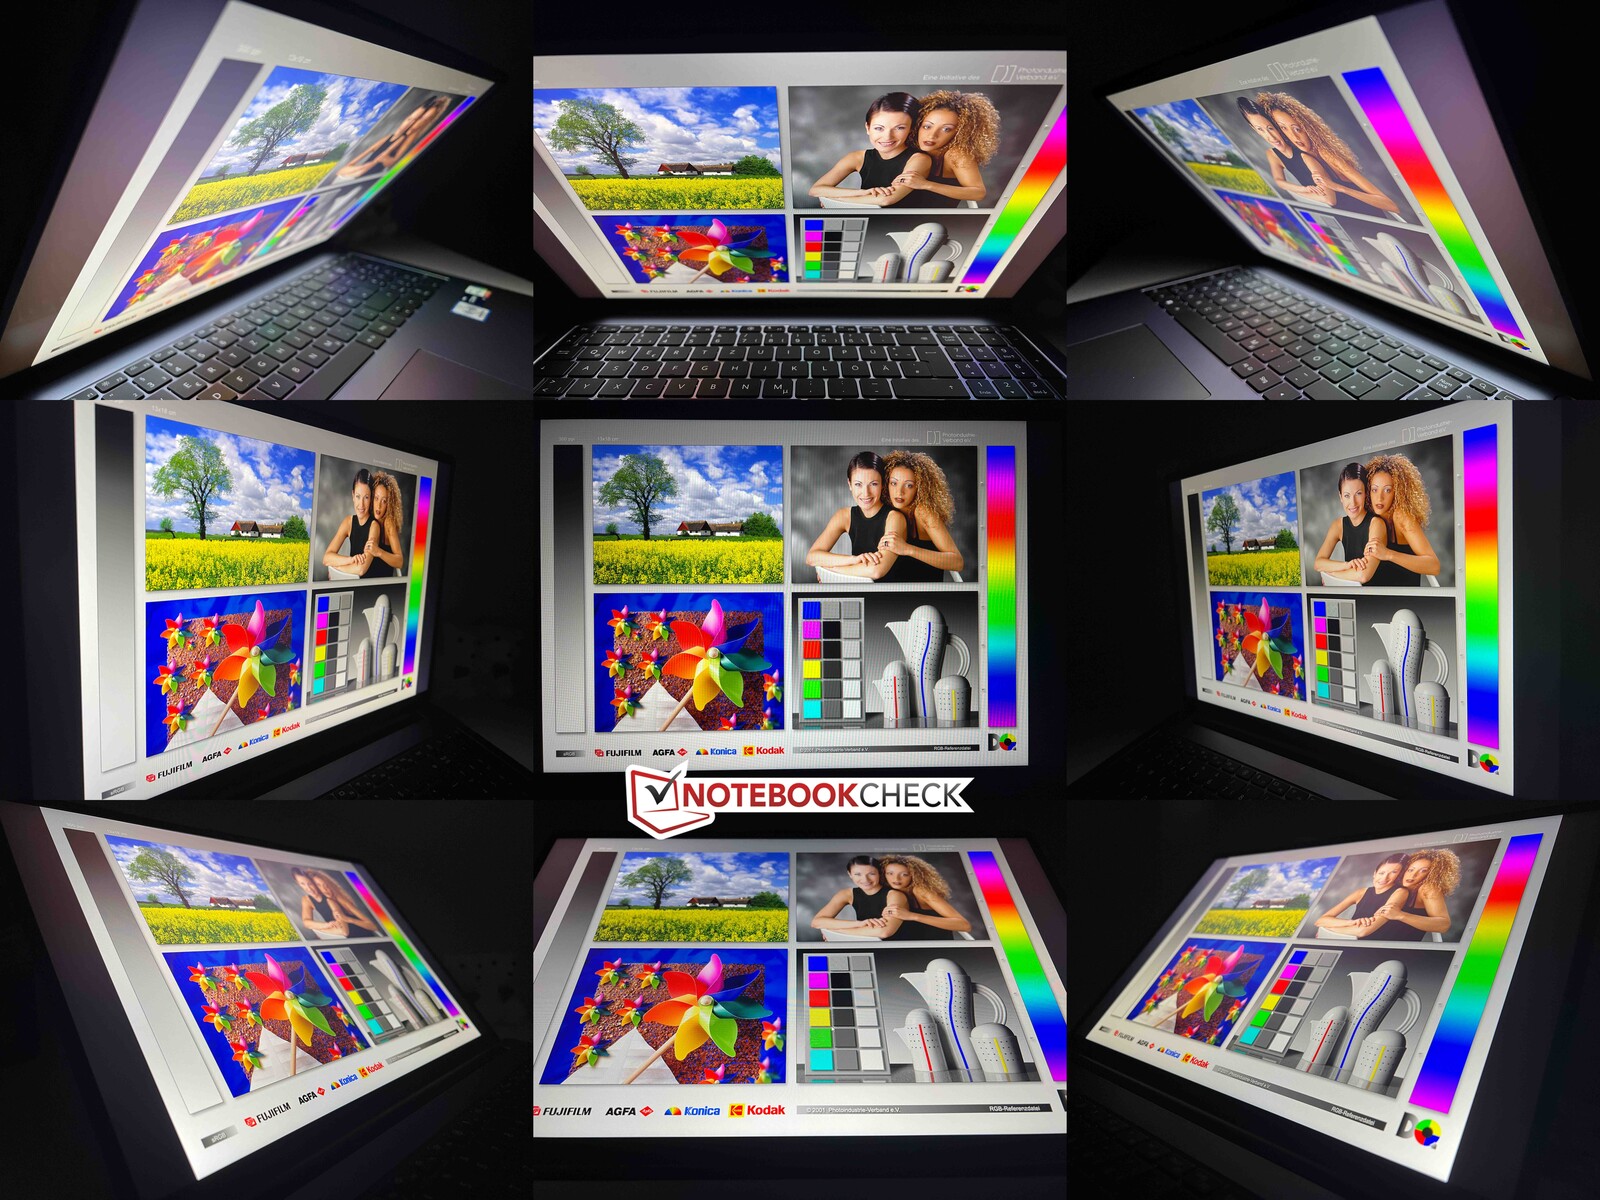
Dank dem matten IPS-Panel lässt sich das MateBook auch an sehr hellen Tagen im Freien verwenden, lediglich Reflexionen von Lichtquellen sollte man vermeiden. Die Blickwinkelstabilität ist insgesamt gut.
Leistung - Core i9 auf Sparflamme
Testbedingungen
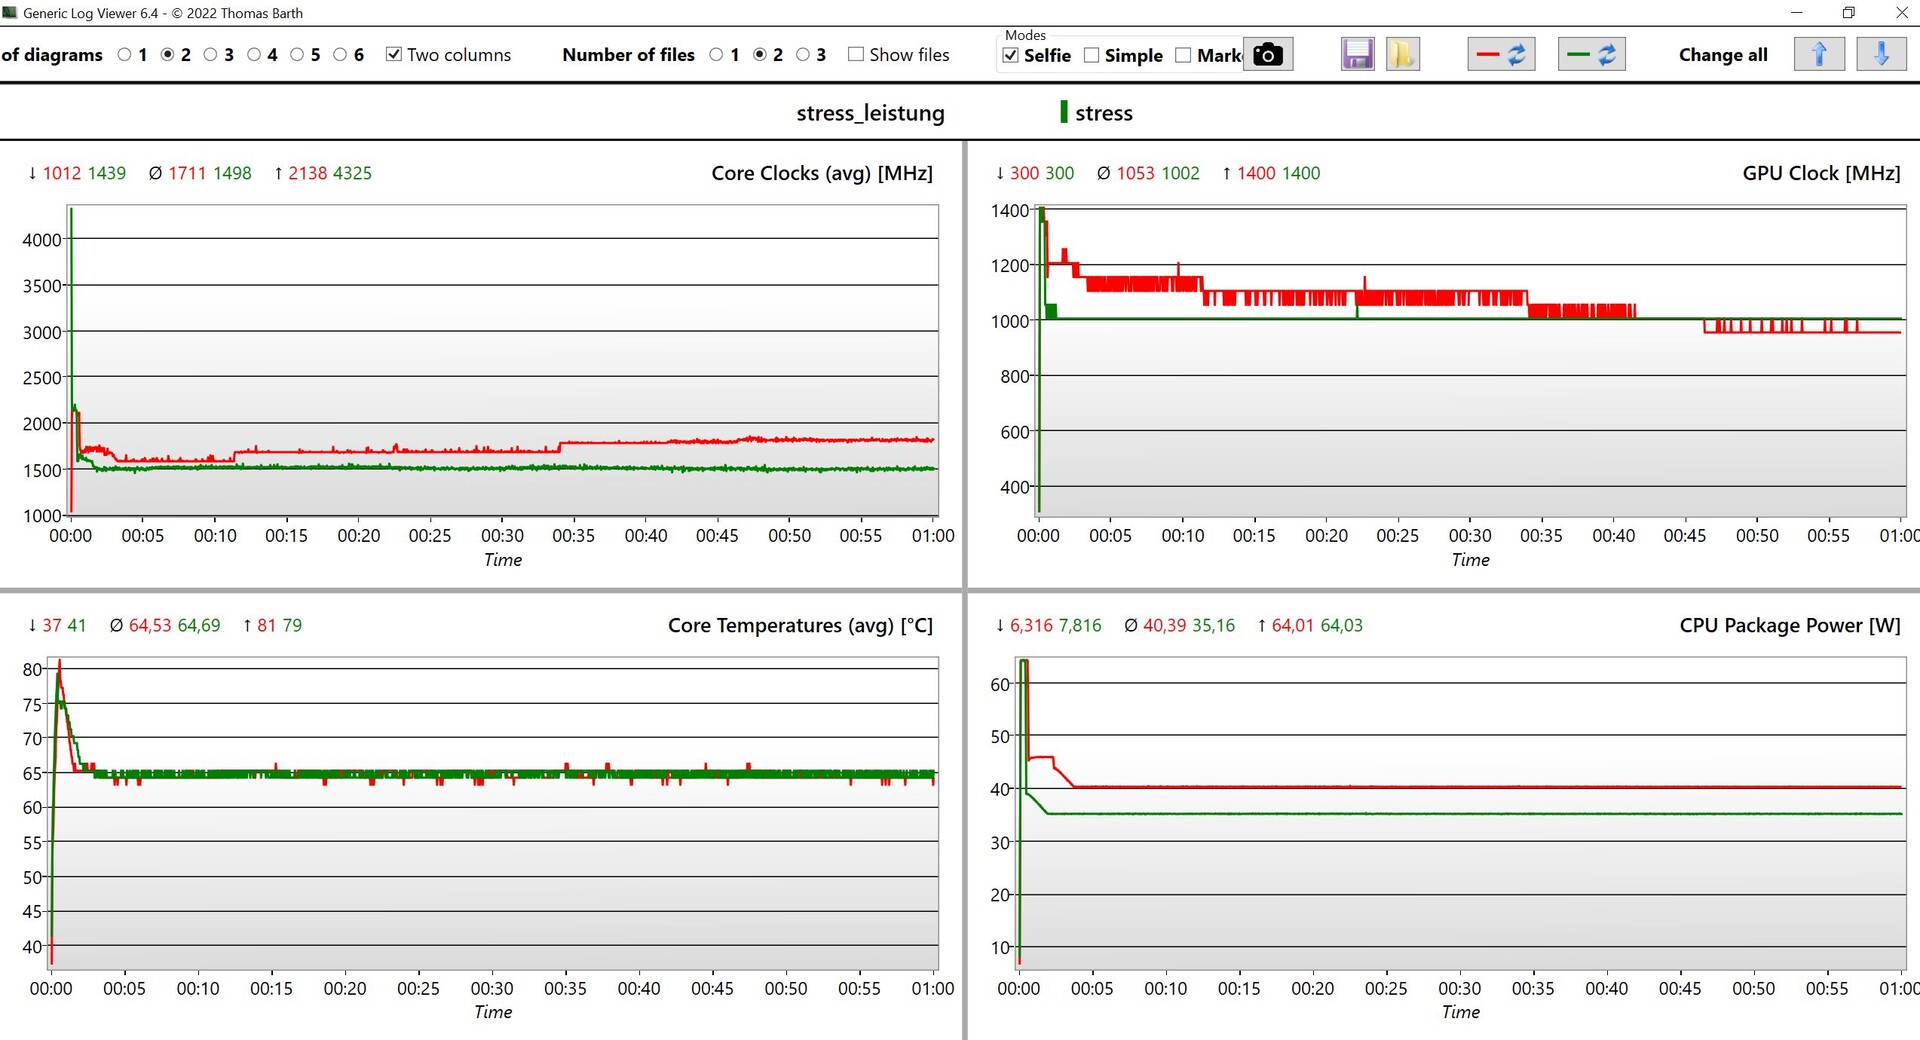
In Huaweis PC Manger gibt es zwei Energieeinstellungen, einmal den voreingestellten Modus Ausbalanciert und dann noch einen Leistungsmodus. Wirklich mehr Leistung bietet dieser aber nicht, lediglich bei dauerhafter Belastung sind 5 Watt (40 anstatt 35 Watt TDP) mehr, was aber in keinem Verhältnis zu den lauteren Lüftern steht (46,2 vs. 36,2 dB(A)). Daher kann man also bedenkenlos den Modus Ausbalanciert verwenden, was wir auch für unsere nachfolgenden Benchmarks und Messungen getan haben.
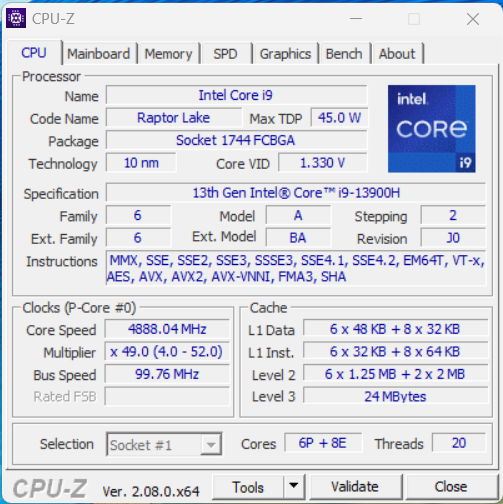
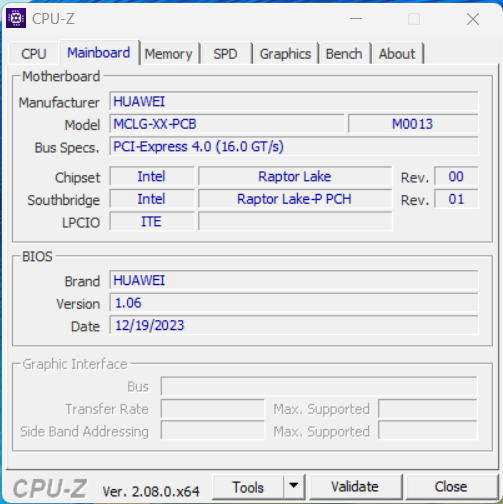
Prozessor - Core i9-13900H
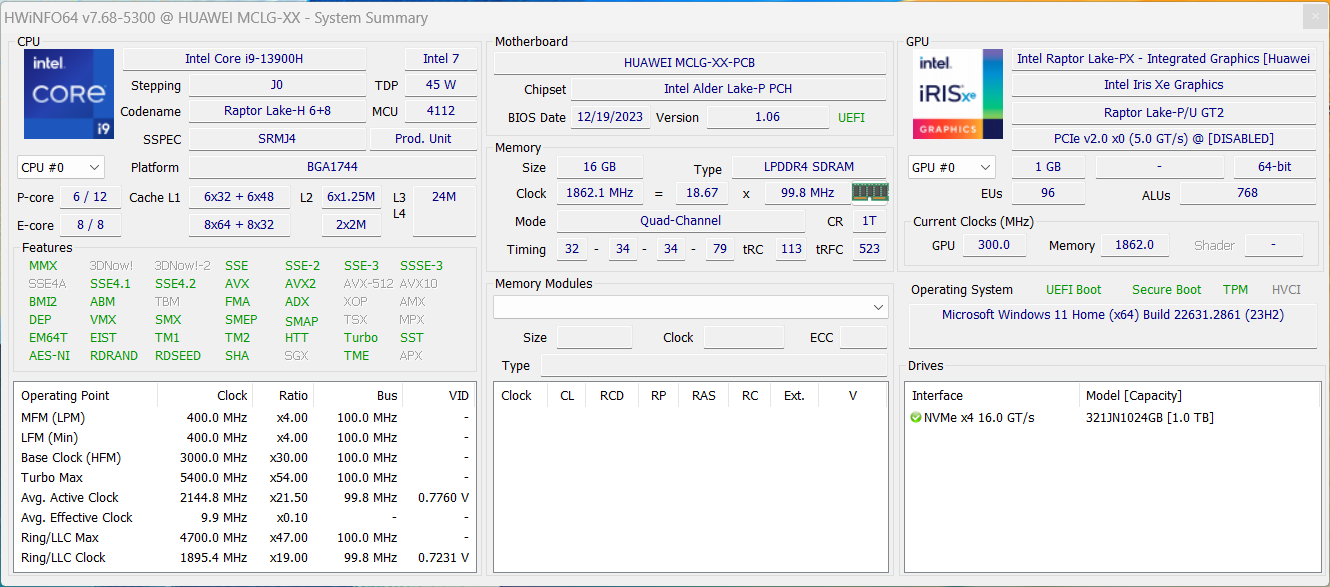
Der Intel Core i9-13900H ist eins ehr schneller Mobilprozessor der Raptor-Lake-Baureihe mit 6 schnellen Performance- und 8 Efficiency-Kernen, insgesamt kann er also bis zu 20 Threads gleichzeitig bearbeiten. Das Leistungspotenzial ist sehr hoch, allerdings wird der Core i9 im Fall des MateBook D 16 aufgrund von geringen Power Limits mit 64/45 Watt (und später dann 35 Watt) doch sehr stark eingebremst. Wirklich überzeugend ist nur die Single-Core-Leistung, die im Alltag auch eine wichtige Rolle spielt, doch im Grunde genommen wurde der Core i9 ausgewählt, um Eindruck auf dem Datenblatt zu machen. Mit einem günstigeren Core i7-13700H würden Kunden fast die gleiche Gesamtleistung bekommen. Zudem sinkt die Multi-Core-Leistung schon nach kurzer Zeit deutlich ab und der gleiche Prozessor im MateBook 16s ist bei Multi-Core-Last mehr als 20 % schneller. Im Akkubetrieb bleibt die CPU-Leistung nahezu konstant. Weitere CPU-Benchmarks stehen hier zur Verfügung.
Cinebench R15 Multi Dauertest
Cinebench R23: Multi Core | Single Core
Cinebench R20: CPU (Multi Core) | CPU (Single Core)
Cinebench R15: CPU Multi 64Bit | CPU Single 64Bit
Blender: v2.79 BMW27 CPU | v3.3 Classroom CPU
7-Zip 18.03: 7z b 4 | 7z b 4 -mmt1
Geekbench 5.5: Multi-Core | Single-Core
Geekbench 6.7: Multi-Core | Single-Core
HWBOT x265 Benchmark v2.2: 4k Preset
LibreOffice : 20 Documents To PDF
R Benchmark 2.5: Overall mean
| CPU Performance Rating | |
| Huawei MateBook 16s i9 -2! | |
| Durchschnittliche Intel Core i9-13900H | |
| Durchschnitt der Klasse Multimedia | |
| Huawei MateBook D 16 2024 | |
| MSI Prestige 16 B1MG-001US | |
| Acer Swift Go SFG16-71 -2! | |
| Schenker Vision 16 PH6PRX1 | |
| Acer Swift Edge SFE16 Ryzen 7 7840U | |
| Huawei MateBook D 16 2022 -2! | |
| Samsung Galaxy Book3 Pro 16 -2! | |
| Lenovo Yoga 7 16IRL8 -2! | |
| Cinebench R23 / Multi Core | |
| Huawei MateBook 16s i9 | |
| Durchschnittliche Intel Core i9-13900H (11997 - 20385, n=28) | |
| Durchschnitt der Klasse Multimedia (4861 - 33362, n=81, der letzten 2 Jahre) | |
| MSI Prestige 16 B1MG-001US | |
| Acer Swift Go SFG16-71 | |
| Huawei MateBook D 16 2024 | |
| Schenker Vision 16 PH6PRX1 | |
| Acer Swift Edge SFE16 Ryzen 7 7840U | |
| Huawei MateBook D 16 2022 | |
| Samsung Galaxy Book3 Pro 16 | |
| Lenovo Yoga 7 16IRL8 | |
| Cinebench R23 / Single Core | |
| Huawei MateBook 16s i9 | |
| Huawei MateBook D 16 2024 | |
| Durchschnitt der Klasse Multimedia (1128 - 2459, n=73, der letzten 2 Jahre) | |
| Acer Swift Go SFG16-71 | |
| Durchschnittliche Intel Core i9-13900H (1297 - 2054, n=26) | |
| Schenker Vision 16 PH6PRX1 | |
| Lenovo Yoga 7 16IRL8 | |
| Huawei MateBook D 16 2022 | |
| MSI Prestige 16 B1MG-001US | |
| Samsung Galaxy Book3 Pro 16 | |
| Acer Swift Edge SFE16 Ryzen 7 7840U | |
| Cinebench R20 / CPU (Multi Core) | |
| Huawei MateBook 16s i9 | |
| Durchschnittliche Intel Core i9-13900H (4935 - 7716, n=25) | |
| Durchschnitt der Klasse Multimedia (1887 - 12912, n=64, der letzten 2 Jahre) | |
| MSI Prestige 16 B1MG-001US | |
| Huawei MateBook D 16 2024 | |
| Acer Swift Go SFG16-71 | |
| Acer Swift Edge SFE16 Ryzen 7 7840U | |
| Schenker Vision 16 PH6PRX1 | |
| Samsung Galaxy Book3 Pro 16 | |
| Huawei MateBook D 16 2022 | |
| Lenovo Yoga 7 16IRL8 | |
| Cinebench R20 / CPU (Single Core) | |
| Huawei MateBook 16s i9 | |
| Huawei MateBook D 16 2024 | |
| Durchschnitt der Klasse Multimedia (425 - 853, n=64, der letzten 2 Jahre) | |
| Acer Swift Go SFG16-71 | |
| Durchschnittliche Intel Core i9-13900H (428 - 792, n=25) | |
| Schenker Vision 16 PH6PRX1 | |
| Lenovo Yoga 7 16IRL8 | |
| Huawei MateBook D 16 2022 | |
| MSI Prestige 16 B1MG-001US | |
| Acer Swift Edge SFE16 Ryzen 7 7840U | |
| Samsung Galaxy Book3 Pro 16 | |
| Cinebench R15 / CPU Multi 64Bit | |
| Huawei MateBook 16s i9 | |
| Durchschnittliche Intel Core i9-13900H (2061 - 3100, n=26) | |
| Durchschnitt der Klasse Multimedia (856 - 5224, n=68, der letzten 2 Jahre) | |
| Huawei MateBook D 16 2024 | |
| MSI Prestige 16 B1MG-001US | |
| Acer Swift Go SFG16-71 | |
| Huawei MateBook D 16 2022 | |
| Huawei MateBook D 16 2022 | |
| Acer Swift Edge SFE16 Ryzen 7 7840U | |
| Schenker Vision 16 PH6PRX1 | |
| Samsung Galaxy Book3 Pro 16 | |
| Lenovo Yoga 7 16IRL8 | |
| Cinebench R15 / CPU Single 64Bit | |
| Huawei MateBook 16s i9 | |
| Huawei MateBook D 16 2024 | |
| Durchschnitt der Klasse Multimedia (184.8 - 326, n=66, der letzten 2 Jahre) | |
| Durchschnittliche Intel Core i9-13900H (211 - 297, n=26) | |
| Acer Swift Edge SFE16 Ryzen 7 7840U | |
| Schenker Vision 16 PH6PRX1 | |
| Acer Swift Go SFG16-71 | |
| Huawei MateBook D 16 2022 | |
| Lenovo Yoga 7 16IRL8 | |
| MSI Prestige 16 B1MG-001US | |
| Samsung Galaxy Book3 Pro 16 | |
| Blender / v2.79 BMW27 CPU | |
| Lenovo Yoga 7 16IRL8 | |
| Samsung Galaxy Book3 Pro 16 | |
| Huawei MateBook D 16 2022 | |
| Acer Swift Edge SFE16 Ryzen 7 7840U | |
| Acer Swift Go SFG16-71 | |
| Schenker Vision 16 PH6PRX1 | |
| Durchschnitt der Klasse Multimedia (100 - 557, n=65, der letzten 2 Jahre) | |
| Huawei MateBook D 16 2024 | |
| MSI Prestige 16 B1MG-001US | |
| Durchschnittliche Intel Core i9-13900H (166 - 268, n=24) | |
| Huawei MateBook 16s i9 | |
| Blender / v3.3 Classroom CPU | |
| Lenovo Yoga 7 16IRL8 | |
| Samsung Galaxy Book3 Pro 16 | |
| Huawei MateBook D 16 2022 | |
| Acer Swift Edge SFE16 Ryzen 7 7840U | |
| Acer Swift Go SFG16-71 | |
| Schenker Vision 16 PH6PRX1 | |
| Huawei MateBook D 16 2024 | |
| Durchschnitt der Klasse Multimedia (134.5 - 1042, n=68, der letzten 2 Jahre) | |
| MSI Prestige 16 B1MG-001US | |
| Durchschnittliche Intel Core i9-13900H (279 - 475, n=24) | |
| Huawei MateBook 16s i9 | |
| 7-Zip 18.03 / 7z b 4 | |
| Huawei MateBook 16s i9 | |
| Durchschnittliche Intel Core i9-13900H (45045 - 79032, n=25) | |
| MSI Prestige 16 B1MG-001US | |
| Huawei MateBook D 16 2024 | |
| Durchschnitt der Klasse Multimedia (29095 - 130368, n=62, der letzten 2 Jahre) | |
| Acer Swift Go SFG16-71 | |
| Acer Swift Edge SFE16 Ryzen 7 7840U | |
| Huawei MateBook D 16 2022 | |
| Schenker Vision 16 PH6PRX1 | |
| Samsung Galaxy Book3 Pro 16 | |
| Lenovo Yoga 7 16IRL8 | |
| 7-Zip 18.03 / 7z b 4 -mmt1 | |
| Huawei MateBook 16s i9 | |
| Huawei MateBook D 16 2024 | |
| Acer Swift Go SFG16-71 | |
| Schenker Vision 16 PH6PRX1 | |
| Durchschnittliche Intel Core i9-13900H (3665 - 6600, n=25) | |
| Acer Swift Edge SFE16 Ryzen 7 7840U | |
| Durchschnitt der Klasse Multimedia (3666 - 7545, n=63, der letzten 2 Jahre) | |
| Huawei MateBook D 16 2022 | |
| Lenovo Yoga 7 16IRL8 | |
| Samsung Galaxy Book3 Pro 16 | |
| MSI Prestige 16 B1MG-001US | |
| Geekbench 5.5 / Multi-Core | |
| Huawei MateBook 16s i9 | |
| Durchschnitt der Klasse Multimedia (4652 - 20422, n=62, der letzten 2 Jahre) | |
| Durchschnittliche Intel Core i9-13900H (9094 - 15410, n=26) | |
| Huawei MateBook D 16 2024 | |
| MSI Prestige 16 B1MG-001US | |
| Acer Swift Go SFG16-71 | |
| Huawei MateBook D 16 2022 | |
| Samsung Galaxy Book3 Pro 16 | |
| Acer Swift Edge SFE16 Ryzen 7 7840U | |
| Lenovo Yoga 7 16IRL8 | |
| Schenker Vision 16 PH6PRX1 | |
| Geekbench 5.5 / Single-Core | |
| Huawei MateBook D 16 2024 | |
| Huawei MateBook 16s i9 | |
| Durchschnitt der Klasse Multimedia (805 - 2974, n=62, der letzten 2 Jahre) | |
| Acer Swift Edge SFE16 Ryzen 7 7840U | |
| Durchschnittliche Intel Core i9-13900H (1140 - 2043, n=26) | |
| Acer Swift Go SFG16-71 | |
| Schenker Vision 16 PH6PRX1 | |
| Huawei MateBook D 16 2022 | |
| Lenovo Yoga 7 16IRL8 | |
| MSI Prestige 16 B1MG-001US | |
| Samsung Galaxy Book3 Pro 16 | |
| Geekbench 6.7 / Multi-Core | |
| Durchschnitt der Klasse Multimedia (4983 - 29415, n=76, der letzten 2 Jahre) | |
| Huawei MateBook D 16 2024 | |
| Durchschnittliche Intel Core i9-13900H (11118 - 14404, n=14) | |
| MSI Prestige 16 B1MG-001US | |
| Acer Swift Edge SFE16 Ryzen 7 7840U | |
| Schenker Vision 16 PH6PRX1 | |
| Geekbench 6.7 / Single-Core | |
| Durchschnitt der Klasse Multimedia (1534 - 4335, n=75, der letzten 2 Jahre) | |
| Huawei MateBook D 16 2024 | |
| Durchschnittliche Intel Core i9-13900H (2415 - 2807, n=14) | |
| Schenker Vision 16 PH6PRX1 | |
| Acer Swift Edge SFE16 Ryzen 7 7840U | |
| MSI Prestige 16 B1MG-001US | |
| HWBOT x265 Benchmark v2.2 / 4k Preset | |
| Huawei MateBook 16s i9 | |
| Durchschnitt der Klasse Multimedia (5.26 - 36.1, n=63, der letzten 2 Jahre) | |
| Durchschnittliche Intel Core i9-13900H (14.1 - 22.3, n=25) | |
| Huawei MateBook D 16 2024 | |
| MSI Prestige 16 B1MG-001US | |
| Acer Swift Go SFG16-71 | |
| Acer Swift Edge SFE16 Ryzen 7 7840U | |
| Schenker Vision 16 PH6PRX1 | |
| Huawei MateBook D 16 2022 | |
| Samsung Galaxy Book3 Pro 16 | |
| Lenovo Yoga 7 16IRL8 | |
| LibreOffice / 20 Documents To PDF | |
| Durchschnitt der Klasse Multimedia (23.9 - 146.7, n=64, der letzten 2 Jahre) | |
| Durchschnittliche Intel Core i9-13900H (34.4 - 82.8, n=25) | |
| MSI Prestige 16 B1MG-001US | |
| Lenovo Yoga 7 16IRL8 | |
| Acer Swift Edge SFE16 Ryzen 7 7840U | |
| Samsung Galaxy Book3 Pro 16 | |
| Huawei MateBook 16s i9 | |
| Acer Swift Go SFG16-71 | |
| Huawei MateBook D 16 2024 | |
| Huawei MateBook D 16 2022 | |
| Schenker Vision 16 PH6PRX1 | |
| R Benchmark 2.5 / Overall mean | |
| Samsung Galaxy Book3 Pro 16 | |
| MSI Prestige 16 B1MG-001US | |
| Durchschnitt der Klasse Multimedia (0.3604 - 0.947, n=63, der letzten 2 Jahre) | |
| Lenovo Yoga 7 16IRL8 | |
| Acer Swift Edge SFE16 Ryzen 7 7840U | |
| Schenker Vision 16 PH6PRX1 | |
| Huawei MateBook D 16 2022 | |
| Durchschnittliche Intel Core i9-13900H (0.4052 - 0.723, n=25) | |
| Acer Swift Go SFG16-71 | |
| Huawei MateBook D 16 2024 | |
| Huawei MateBook 16s i9 | |
* ... kleinere Werte sind besser
AIDA64: FP32 Ray-Trace | FPU Julia | CPU SHA3 | CPU Queen | FPU SinJulia | FPU Mandel | CPU AES | CPU ZLib | FP64 Ray-Trace | CPU PhotoWorxx
| Performance Rating | |
| Huawei MateBook 16s i9 | |
| Durchschnitt der Klasse Multimedia | |
| MSI Prestige 16 B1MG-001US | |
| Durchschnittliche Intel Core i9-13900H | |
| Acer Swift Edge SFE16 Ryzen 7 7840U | |
| Huawei MateBook D 16 2024 | |
| Acer Swift Go SFG16-71 | |
| Huawei MateBook D 16 2022 | |
| Schenker Vision 16 PH6PRX1 | |
| Samsung Galaxy Book3 Pro 16 | |
| Lenovo Yoga 7 16IRL8 | |
| AIDA64 / FP32 Ray-Trace | |
| Acer Swift Edge SFE16 Ryzen 7 7840U | |
| Durchschnitt der Klasse Multimedia (2214 - 50388, n=60, der letzten 2 Jahre) | |
| Huawei MateBook 16s i9 | |
| MSI Prestige 16 B1MG-001US | |
| Durchschnittliche Intel Core i9-13900H (6788 - 19557, n=25) | |
| Acer Swift Go SFG16-71 | |
| Huawei MateBook D 16 2024 | |
| Schenker Vision 16 PH6PRX1 | |
| Huawei MateBook D 16 2022 | |
| Samsung Galaxy Book3 Pro 16 | |
| Lenovo Yoga 7 16IRL8 | |
| AIDA64 / FPU Julia | |
| Durchschnitt der Klasse Multimedia (12867 - 201874, n=61, der letzten 2 Jahre) | |
| MSI Prestige 16 B1MG-001US | |
| Acer Swift Edge SFE16 Ryzen 7 7840U | |
| Huawei MateBook 16s i9 | |
| Durchschnittliche Intel Core i9-13900H (22551 - 95579, n=25) | |
| Acer Swift Go SFG16-71 | |
| Huawei MateBook D 16 2024 | |
| Schenker Vision 16 PH6PRX1 | |
| Huawei MateBook D 16 2022 | |
| Samsung Galaxy Book3 Pro 16 | |
| Lenovo Yoga 7 16IRL8 | |
| AIDA64 / CPU SHA3 | |
| Durchschnitt der Klasse Multimedia (653 - 8623, n=61, der letzten 2 Jahre) | |
| Huawei MateBook 16s i9 | |
| MSI Prestige 16 B1MG-001US | |
| Durchschnittliche Intel Core i9-13900H (2491 - 4270, n=25) | |
| Acer Swift Edge SFE16 Ryzen 7 7840U | |
| Acer Swift Go SFG16-71 | |
| Huawei MateBook D 16 2024 | |
| Schenker Vision 16 PH6PRX1 | |
| Huawei MateBook D 16 2022 | |
| Samsung Galaxy Book3 Pro 16 | |
| Lenovo Yoga 7 16IRL8 | |
| AIDA64 / CPU Queen | |
| Huawei MateBook 16s i9 | |
| Huawei MateBook D 16 2024 | |
| Durchschnittliche Intel Core i9-13900H (65121 - 120936, n=25) | |
| Acer Swift Go SFG16-71 | |
| Huawei MateBook D 16 2022 | |
| Acer Swift Edge SFE16 Ryzen 7 7840U | |
| MSI Prestige 16 B1MG-001US | |
| Samsung Galaxy Book3 Pro 16 | |
| Durchschnitt der Klasse Multimedia (13483 - 181505, n=49, der letzten 2 Jahre) | |
| Schenker Vision 16 PH6PRX1 | |
| Lenovo Yoga 7 16IRL8 | |
| AIDA64 / FPU SinJulia | |
| Acer Swift Edge SFE16 Ryzen 7 7840U | |
| MSI Prestige 16 B1MG-001US | |
| Huawei MateBook 16s i9 | |
| Durchschnittliche Intel Core i9-13900H (6108 - 11631, n=25) | |
| Durchschnitt der Klasse Multimedia (1240 - 28794, n=61, der letzten 2 Jahre) | |
| Huawei MateBook D 16 2024 | |
| Acer Swift Go SFG16-71 | |
| Huawei MateBook D 16 2022 | |
| Schenker Vision 16 PH6PRX1 | |
| Samsung Galaxy Book3 Pro 16 | |
| Lenovo Yoga 7 16IRL8 | |
| AIDA64 / FPU Mandel | |
| Durchschnitt der Klasse Multimedia (6395 - 105740, n=60, der letzten 2 Jahre) | |
| Acer Swift Edge SFE16 Ryzen 7 7840U | |
| Huawei MateBook 16s i9 | |
| MSI Prestige 16 B1MG-001US | |
| Durchschnittliche Intel Core i9-13900H (11283 - 48474, n=25) | |
| Acer Swift Go SFG16-71 | |
| Huawei MateBook D 16 2024 | |
| Schenker Vision 16 PH6PRX1 | |
| Huawei MateBook D 16 2022 | |
| Samsung Galaxy Book3 Pro 16 | |
| Lenovo Yoga 7 16IRL8 | |
| AIDA64 / CPU AES | |
| Huawei MateBook 16s i9 | |
| Huawei MateBook D 16 2024 | |
| Huawei MateBook D 16 2022 | |
| Samsung Galaxy Book3 Pro 16 | |
| Durchschnittliche Intel Core i9-13900H (3691 - 149377, n=25) | |
| MSI Prestige 16 B1MG-001US | |
| Durchschnitt der Klasse Multimedia (13243 - 126790, n=61, der letzten 2 Jahre) | |
| Acer Swift Go SFG16-71 | |
| Acer Swift Edge SFE16 Ryzen 7 7840U | |
| Schenker Vision 16 PH6PRX1 | |
| Lenovo Yoga 7 16IRL8 | |
| AIDA64 / CPU ZLib | |
| MSI Prestige 16 B1MG-001US | |
| Durchschnittliche Intel Core i9-13900H (789 - 1254, n=25) | |
| Huawei MateBook 16s i9 | |
| Durchschnitt der Klasse Multimedia (167.2 - 2022, n=61, der letzten 2 Jahre) | |
| Huawei MateBook D 16 2024 | |
| Acer Swift Go SFG16-71 | |
| Acer Swift Edge SFE16 Ryzen 7 7840U | |
| Schenker Vision 16 PH6PRX1 | |
| Samsung Galaxy Book3 Pro 16 | |
| Huawei MateBook D 16 2022 | |
| Lenovo Yoga 7 16IRL8 | |
| AIDA64 / FP64 Ray-Trace | |
| Durchschnitt der Klasse Multimedia (1014 - 26875, n=61, der letzten 2 Jahre) | |
| Acer Swift Edge SFE16 Ryzen 7 7840U | |
| Huawei MateBook 16s i9 | |
| Durchschnittliche Intel Core i9-13900H (3655 - 10716, n=25) | |
| MSI Prestige 16 B1MG-001US | |
| Acer Swift Go SFG16-71 | |
| Huawei MateBook D 16 2024 | |
| Schenker Vision 16 PH6PRX1 | |
| Huawei MateBook D 16 2022 | |
| Samsung Galaxy Book3 Pro 16 | |
| Lenovo Yoga 7 16IRL8 | |
| AIDA64 / CPU PhotoWorxx | |
| Durchschnitt der Klasse Multimedia (12860 - 88154, n=61, der letzten 2 Jahre) | |
| MSI Prestige 16 B1MG-001US | |
| Samsung Galaxy Book3 Pro 16 | |
| Schenker Vision 16 PH6PRX1 | |
| Lenovo Yoga 7 16IRL8 | |
| Huawei MateBook 16s i9 | |
| Acer Swift Go SFG16-71 | |
| Durchschnittliche Intel Core i9-13900H (10871 - 50488, n=25) | |
| Huawei MateBook D 16 2022 | |
| Huawei MateBook D 16 2024 | |
| Acer Swift Edge SFE16 Ryzen 7 7840U | |
System Performance
Der subjektive Leistungseindruck des MateBook ist sehr hoch und alle Eingaben werden schnell umgesetzt. Die synthetischen Benchmark-Ergebnisse zeigen keine Auffälligkeiten und wir konnten beim Test auch keinerlei Probleme erkennen.
CrossMark: Overall | Productivity | Creativity | Responsiveness
WebXPRT 3: Overall
WebXPRT 4: Overall
Mozilla Kraken 1.1: Total
| PCMark 10 / Score | |
| Durchschnitt der Klasse Multimedia (4325 - 10386, n=58, der letzten 2 Jahre) | |
| MSI Prestige 16 B1MG-001US | |
| Acer Swift Edge SFE16 Ryzen 7 7840U | |
| Huawei MateBook D 16 2024 | |
| Huawei MateBook 16s i9 | |
| Durchschnittliche Intel Core i9-13900H, Intel Iris Xe Graphics G7 96EUs (5944 - 6802, n=8) | |
| Acer Swift Go SFG16-71 | |
| Huawei MateBook D 16 2022 | |
| Lenovo Yoga 7 16IRL8 | |
| Samsung Galaxy Book3 Pro 16 | |
| Schenker Vision 16 PH6PRX1 | |
| PCMark 10 / Essentials | |
| Lenovo Yoga 7 16IRL8 | |
| Huawei MateBook 16s i9 | |
| Huawei MateBook D 16 2024 | |
| Huawei MateBook D 16 2022 | |
| Durchschnittliche Intel Core i9-13900H, Intel Iris Xe Graphics G7 96EUs (10347 - 12286, n=8) | |
| MSI Prestige 16 B1MG-001US | |
| Acer Swift Go SFG16-71 | |
| Acer Swift Edge SFE16 Ryzen 7 7840U | |
| Samsung Galaxy Book3 Pro 16 | |
| Durchschnitt der Klasse Multimedia (8025 - 11664, n=57, der letzten 2 Jahre) | |
| Schenker Vision 16 PH6PRX1 | |
| PCMark 10 / Productivity | |
| Durchschnitt der Klasse Multimedia (7323 - 18233, n=57, der letzten 2 Jahre) | |
| Acer Swift Edge SFE16 Ryzen 7 7840U | |
| MSI Prestige 16 B1MG-001US | |
| Huawei MateBook D 16 2024 | |
| Durchschnittliche Intel Core i9-13900H, Intel Iris Xe Graphics G7 96EUs (7319 - 8526, n=8) | |
| Acer Swift Go SFG16-71 | |
| Huawei MateBook D 16 2022 | |
| Huawei MateBook 16s i9 | |
| Lenovo Yoga 7 16IRL8 | |
| Schenker Vision 16 PH6PRX1 | |
| Samsung Galaxy Book3 Pro 16 | |
| PCMark 10 / Digital Content Creation | |
| Durchschnitt der Klasse Multimedia (3651 - 16240, n=57, der letzten 2 Jahre) | |
| MSI Prestige 16 B1MG-001US | |
| Acer Swift Edge SFE16 Ryzen 7 7840U | |
| Huawei MateBook 16s i9 | |
| Huawei MateBook D 16 2024 | |
| Durchschnittliche Intel Core i9-13900H, Intel Iris Xe Graphics G7 96EUs (7527 - 8155, n=8) | |
| Acer Swift Go SFG16-71 | |
| Huawei MateBook D 16 2022 | |
| Lenovo Yoga 7 16IRL8 | |
| Samsung Galaxy Book3 Pro 16 | |
| Schenker Vision 16 PH6PRX1 | |
| CrossMark / Overall | |
| Huawei MateBook 16s i9 | |
| Huawei MateBook D 16 2024 | |
| Durchschnittliche Intel Core i9-13900H, Intel Iris Xe Graphics G7 96EUs (1766 - 2146, n=7) | |
| Acer Swift Go SFG16-71 | |
| Huawei MateBook D 16 2022 | |
| Durchschnitt der Klasse Multimedia (866 - 2728, n=67, der letzten 2 Jahre) | |
| Acer Swift Edge SFE16 Ryzen 7 7840U | |
| MSI Prestige 16 B1MG-001US | |
| Schenker Vision 16 PH6PRX1 | |
| Lenovo Yoga 7 16IRL8 | |
| Samsung Galaxy Book3 Pro 16 | |
| CrossMark / Productivity | |
| Huawei MateBook 16s i9 | |
| Huawei MateBook D 16 2024 | |
| Durchschnittliche Intel Core i9-13900H, Intel Iris Xe Graphics G7 96EUs (1684 - 2064, n=7) | |
| Acer Swift Edge SFE16 Ryzen 7 7840U | |
| Huawei MateBook D 16 2022 | |
| Acer Swift Go SFG16-71 | |
| Durchschnitt der Klasse Multimedia (931 - 2489, n=67, der letzten 2 Jahre) | |
| MSI Prestige 16 B1MG-001US | |
| Schenker Vision 16 PH6PRX1 | |
| Lenovo Yoga 7 16IRL8 | |
| Samsung Galaxy Book3 Pro 16 | |
| CrossMark / Creativity | |
| Huawei MateBook 16s i9 | |
| Huawei MateBook D 16 2024 | |
| Durchschnitt der Klasse Multimedia (907 - 3465, n=67, der letzten 2 Jahre) | |
| Durchschnittliche Intel Core i9-13900H, Intel Iris Xe Graphics G7 96EUs (1789 - 2224, n=7) | |
| Acer Swift Go SFG16-71 | |
| Huawei MateBook D 16 2022 | |
| MSI Prestige 16 B1MG-001US | |
| Acer Swift Edge SFE16 Ryzen 7 7840U | |
| Lenovo Yoga 7 16IRL8 | |
| Schenker Vision 16 PH6PRX1 | |
| Samsung Galaxy Book3 Pro 16 | |
| CrossMark / Responsiveness | |
| Huawei MateBook 16s i9 | |
| Huawei MateBook D 16 2024 | |
| Huawei MateBook D 16 2022 | |
| Durchschnittliche Intel Core i9-13900H, Intel Iris Xe Graphics G7 96EUs (1474 - 2171, n=7) | |
| Acer Swift Edge SFE16 Ryzen 7 7840U | |
| Acer Swift Go SFG16-71 | |
| Schenker Vision 16 PH6PRX1 | |
| MSI Prestige 16 B1MG-001US | |
| Samsung Galaxy Book3 Pro 16 | |
| Durchschnitt der Klasse Multimedia (605 - 2024, n=67, der letzten 2 Jahre) | |
| Lenovo Yoga 7 16IRL8 | |
| WebXPRT 3 / Overall | |
| Huawei MateBook 16s i9 | |
| Durchschnitt der Klasse Multimedia (136.4 - 596, n=70, der letzten 2 Jahre) | |
| Huawei MateBook D 16 2024 | |
| Durchschnittliche Intel Core i9-13900H, Intel Iris Xe Graphics G7 96EUs (271 - 339, n=8) | |
| Acer Swift Edge SFE16 Ryzen 7 7840U | |
| Acer Swift Go SFG16-71 | |
| MSI Prestige 16 B1MG-001US | |
| Lenovo Yoga 7 16IRL8 | |
| Huawei MateBook D 16 2022 | |
| Samsung Galaxy Book3 Pro 16 | |
| WebXPRT 4 / Overall | |
| Huawei MateBook D 16 2024 | |
| Huawei MateBook 16s i9 | |
| Durchschnittliche Intel Core i9-13900H, Intel Iris Xe Graphics G7 96EUs (244 - 348, n=6) | |
| Durchschnitt der Klasse Multimedia (167.3 - 402, n=71, der letzten 2 Jahre) | |
| Acer Swift Go SFG16-71 | |
| Huawei MateBook D 16 2022 | |
| MSI Prestige 16 B1MG-001US | |
| Lenovo Yoga 7 16IRL8 | |
| Acer Swift Edge SFE16 Ryzen 7 7840U | |
| Samsung Galaxy Book3 Pro 16 | |
| Mozilla Kraken 1.1 / Total | |
| Samsung Galaxy Book3 Pro 16 | |
| MSI Prestige 16 B1MG-001US | |
| Huawei MateBook D 16 2022 | |
| Acer Swift Edge SFE16 Ryzen 7 7840U | |
| Lenovo Yoga 7 16IRL8 | |
| Durchschnittliche Intel Core i9-13900H, Intel Iris Xe Graphics G7 96EUs (456 - 550, n=8) | |
| Acer Swift Go SFG16-71 | |
| Durchschnitt der Klasse Multimedia (228 - 835, n=74, der letzten 2 Jahre) | |
| Huawei MateBook 16s i9 | |
| Huawei MateBook D 16 2024 | |
* ... kleinere Werte sind besser
| PCMark 10 Score | 6472 Punkte | |
Hilfe | ||
| AIDA64 / Memory Copy | |
| Durchschnitt der Klasse Multimedia (21158 - 132135, n=61, der letzten 2 Jahre) | |
| MSI Prestige 16 B1MG-001US | |
| Samsung Galaxy Book3 Pro 16 | |
| Acer Swift Edge SFE16 Ryzen 7 7840U | |
| Schenker Vision 16 PH6PRX1 | |
| Huawei MateBook 16s i9 | |
| Lenovo Yoga 7 16IRL8 | |
| Durchschnittliche Intel Core i9-13900H (37448 - 74486, n=25) | |
| Acer Swift Go SFG16-71 | |
| Huawei MateBook D 16 2022 | |
| Huawei MateBook D 16 2024 | |
| AIDA64 / Memory Read | |
| Durchschnitt der Klasse Multimedia (19699 - 174586, n=61, der letzten 2 Jahre) | |
| MSI Prestige 16 B1MG-001US | |
| Schenker Vision 16 PH6PRX1 | |
| Durchschnittliche Intel Core i9-13900H (41599 - 75433, n=25) | |
| Huawei MateBook 16s i9 | |
| Samsung Galaxy Book3 Pro 16 | |
| Lenovo Yoga 7 16IRL8 | |
| Acer Swift Go SFG16-71 | |
| Huawei MateBook D 16 2022 | |
| Huawei MateBook D 16 2024 | |
| Acer Swift Edge SFE16 Ryzen 7 7840U | |
| AIDA64 / Memory Write | |
| Acer Swift Edge SFE16 Ryzen 7 7840U | |
| Samsung Galaxy Book3 Pro 16 | |
| Durchschnitt der Klasse Multimedia (17733 - 134998, n=61, der letzten 2 Jahre) | |
| Lenovo Yoga 7 16IRL8 | |
| MSI Prestige 16 B1MG-001US | |
| Huawei MateBook 16s i9 | |
| Acer Swift Go SFG16-71 | |
| Schenker Vision 16 PH6PRX1 | |
| Durchschnittliche Intel Core i9-13900H (36152 - 88505, n=25) | |
| Huawei MateBook D 16 2022 | |
| Huawei MateBook D 16 2024 | |
| AIDA64 / Memory Latency | |
| MSI Prestige 16 B1MG-001US | |
| Durchschnitt der Klasse Multimedia (7 - 535, n=60, der letzten 2 Jahre) | |
| Acer Swift Edge SFE16 Ryzen 7 7840U | |
| Huawei MateBook D 16 2022 | |
| Huawei MateBook D 16 2024 | |
| Lenovo Yoga 7 16IRL8 | |
| Samsung Galaxy Book3 Pro 16 | |
| Durchschnittliche Intel Core i9-13900H (75.8 - 102.3, n=25) | |
| Huawei MateBook 16s i9 | |
| Acer Swift Go SFG16-71 | |
| Schenker Vision 16 PH6PRX1 | |
* ... kleinere Werte sind besser
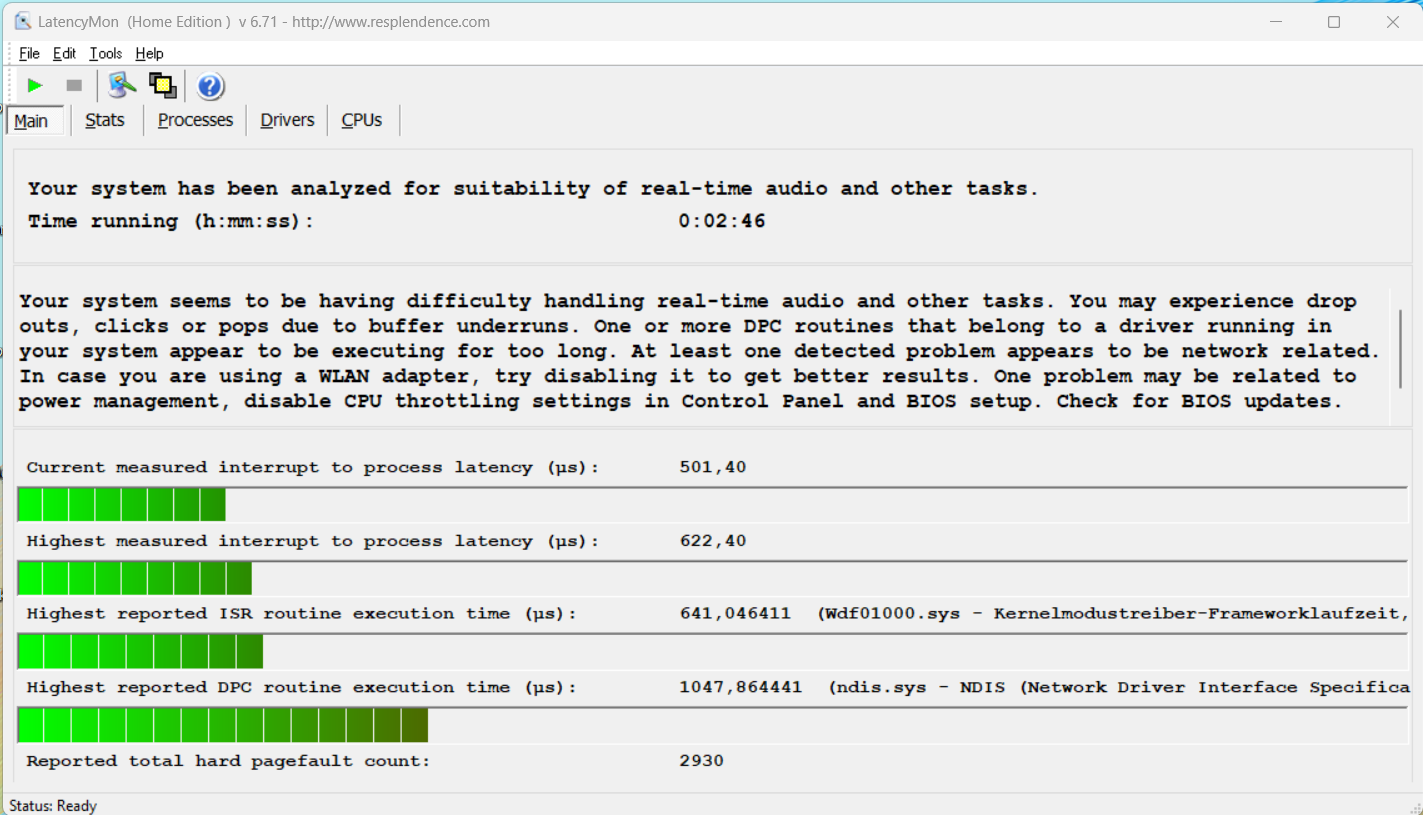
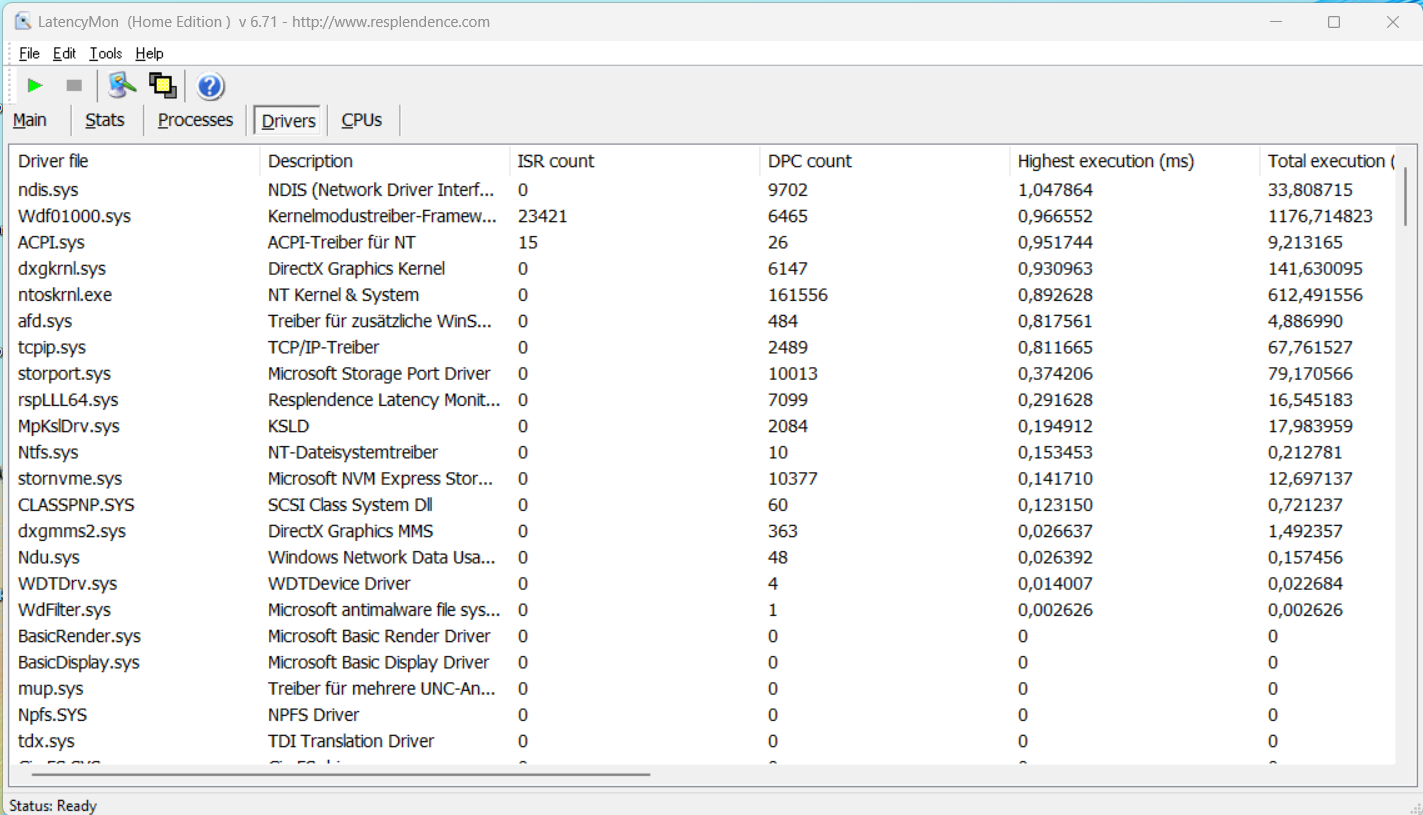
DPC-Latenzen
In unserem standardisierten Latency-Test (Surfen im Internet, 4K-YouTube-Wiedergabe, CPU-Last) zeigt das Testgerät mit der vorliegenden BIOS-Version keine Einschränkungen bei der Nutzung von Echtzeit-Audioanwendungen. Ein Treiber schlägt zwar etwas aus, doch der wichtig "interrupt-to-process-latency"-Wert ist unauffällig.
| DPC Latencies / LatencyMon - interrupt to process latency (max), Web, Youtube, Prime95 | |
| Acer Swift Go SFG16-71 | |
| Huawei MateBook 16s i9 | |
| Schenker Vision 16 PH6PRX1 | |
| Lenovo Yoga 7 16IRL8 | |
| Huawei MateBook D 16 2022 | |
| Huawei MateBook D 16 2024 | |
| Acer Swift Edge SFE16 Ryzen 7 7840U | |
| MSI Prestige 16 B1MG-001US | |
| Samsung Galaxy Book3 Pro 16 | |
* ... kleinere Werte sind besser
Massenspeicher
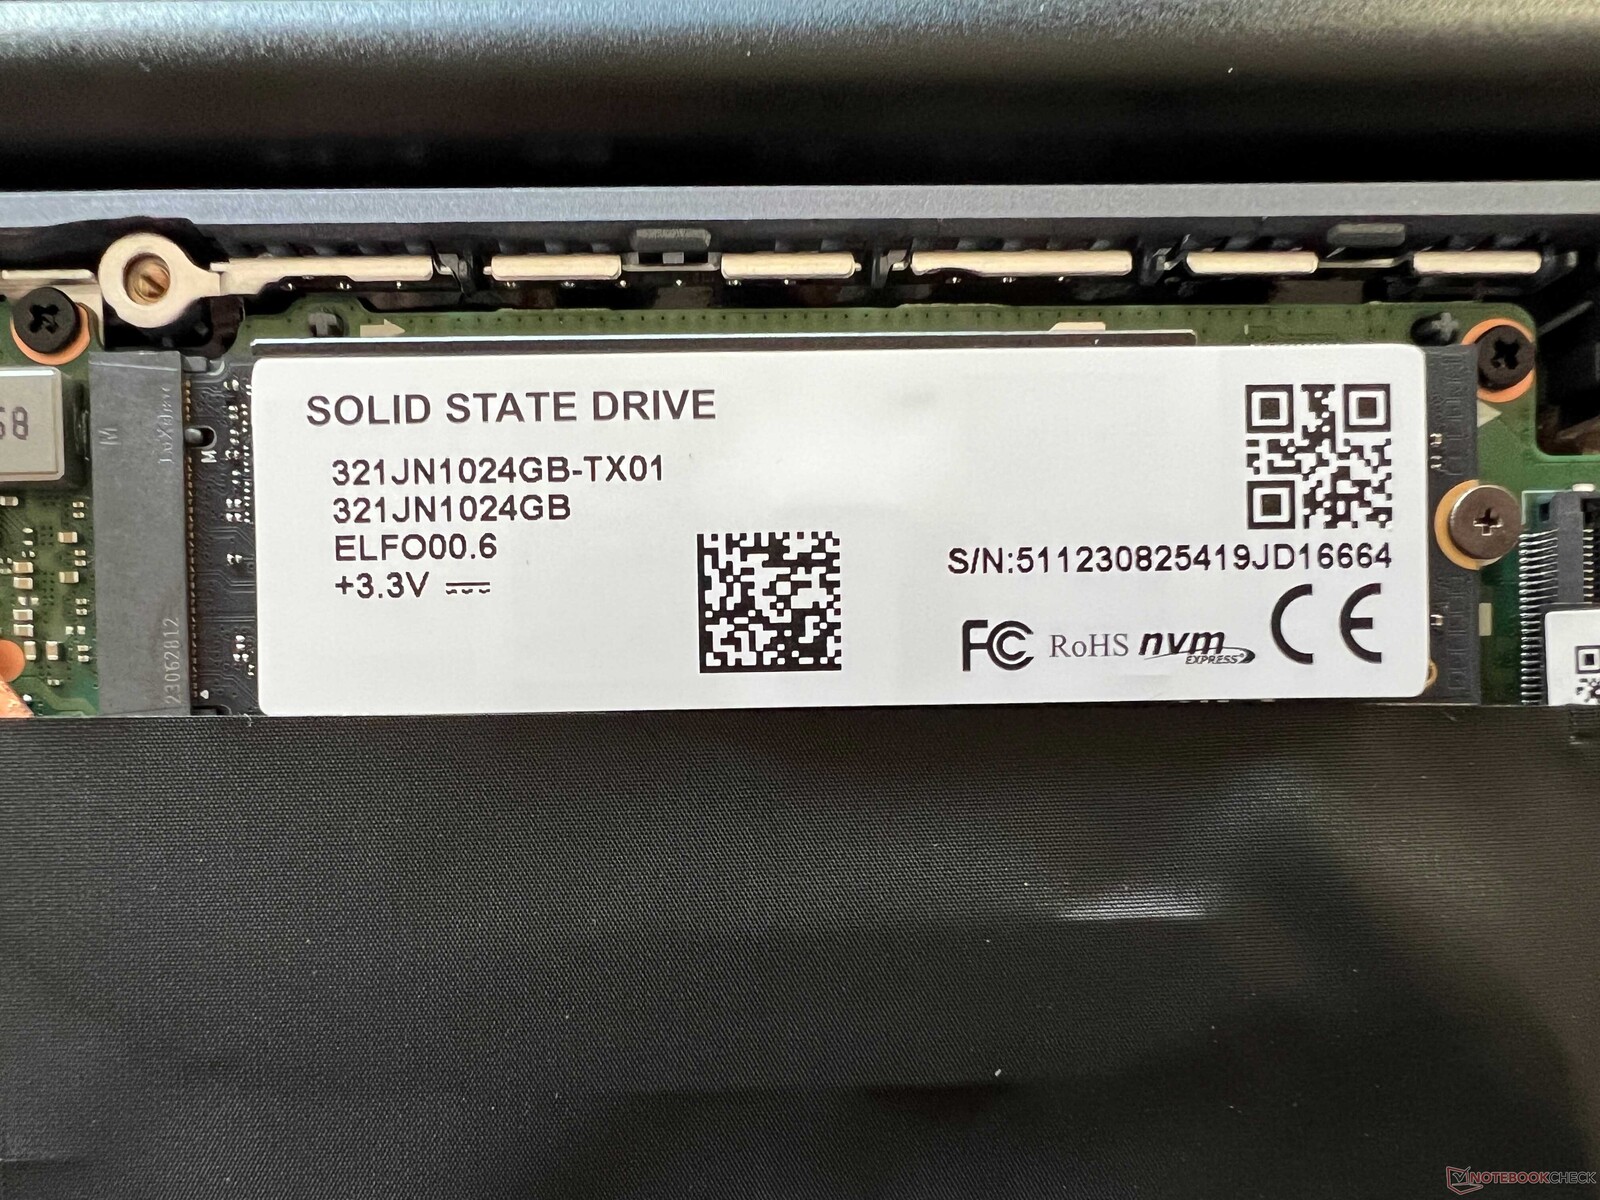
Wie schon beim MateBook 16s ist eine SSD ohne Herstellerkennung verbaut, lediglich die Modellnummer steht auf der SSD (321JN1024GB-TX01). Es handelt sich um eine M.2-2280-SSD, die via PCIe-4.0 angebunden ist und eine Kapazität von 1 TB bietet. Mit Transferraten von mehr als 4 GB/s ist die Leistung vollkommen in Ordnung und auch bei längerer Belastung bleiben die Werte stabil. Problematisch ist allerdings erneut die werksseitige Partitionierung der SSD. Auf dem Systemlaufwerk C stehen dem Nutzer gerade einmal 135 GB zur Verfügung, die restlichen 733 GB sind auf Laufwerk D. Das ist absolut unnötig und kann schnell problematisch werden, denn standardmäßig landen alle Anwendungen und Downloads auf dem C-Laufwerk. Weitere SSD-Benchmarks stehen hier zur Verfügung.

* ... kleinere Werte sind besser
Dauerleistung Lesen: DiskSpd Read Loop, Queue Depth 8
Grafikkarte
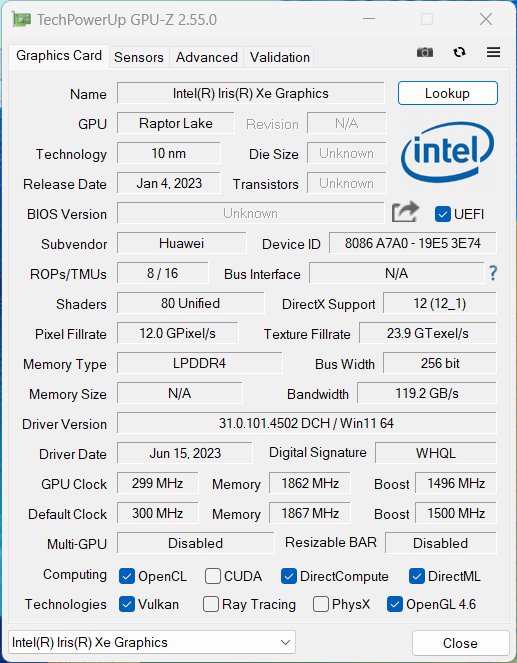
Für die Grafikberechnungen ist die integrierte Iris Xe Graphics G7 des Prozessors zuständig. Es ist die schnelle Variante mit 96 EUs und einem maximalen Takt von 1,5 GHz. Grundsätzlich reicht die Leistung aus, wenn man keine GPU intensiven Anwendungen verwendet und auch die Wiedergabe von hochauflösenden Videos ist problemlos möglich. Allerdings sind die AMD Radeon 780M als auch die neue Arc-iGPU von Intel deutlich schneller.
Große Gaming-Ambitionen sollte man als Nutzer des MateBook D 16 nicht haben und es besteht auch keine Möglichkeit, eine externe Grafikkarte zu verwenden, da es weder Thunderbolt noch USB 4.0 gibt. Selbst in älteren und anspruchslosen Titeln ist man somit in der Regel auf geringe Details beschränkt. Zumindest bleibt die Leistung auch bei längerer Belastung und im Akkubetrieb stabil. Weitere GPU-Benchmarks sind hier gelistet.
| 3DMark 11 Performance | 8141 Punkte | |
| 3DMark Fire Strike Score | 5618 Punkte | |
| 3DMark Time Spy Score | 2028 Punkte | |
Hilfe | ||
Witcher 3 FPS-Diagramm
| min. | mittel | hoch | max. | |
|---|---|---|---|---|
| GTA V (2015) | 130.4 | 112.3 | 25.6 | 10.6 |
| The Witcher 3 (2015) | 110 | 71 | 38 | 15.5 |
| Dota 2 Reborn (2015) | 121.3 | 91.1 | 74 | 65 |
| Final Fantasy XV Benchmark (2018) | 49.9 | 27 | 19.1 | |
| X-Plane 11.11 (2018) | 60.9 | 44.8 | 39.5 | |
| Far Cry 5 (2018) | 61 | 34 | 31 | 29 |
| Strange Brigade (2018) | 102.7 | 44.8 | 35.4 | 28.5 |
| F1 2021 (2021) | 114.8 | 59.1 | 46 | 31.7 |
| F1 22 (2022) | 53.4 | 47.6 | 33.6 | |
| F1 23 (2023) | 48.8 | 44.2 | 30.7 |
Emissionen - Leise Lüfter
Geräuschemissionen
Huawei hat die Kühlung umgebaut und verwendet nun zwei nebeneinander liegende Lüfter auf der rechten Seite des Gehäuses. Diese sind sehr leise und bei alltäglichen Aufgaben oftmals deaktiviert bzw. man hört nur ein extrem leises Rauschen. Selbst beim Spielen sind es gerade einmal 32 dB(A) und bei voller CPU-Last für mehrere Minuten kommt man auf 36,2 dB(A). Der optionale Leistungsmodus erhöht diesen Wert auf laute 46,2 dB(A) und sollte daher vermieden werden. Sonstige elektronische Geräusche gab es beim Testgerät nicht.
Lautstärkediagramm
| Idle |
| 23.2 / 23.2 / 24 dB(A) |
| Last |
| 28 / 36.2 dB(A) |
 | ||
30 dB leise 40 dB(A) deutlich hörbar 50 dB(A) störend |
||
min: | ||
| Huawei MateBook D 16 2024 Iris Xe G7 96EUs, i9-13900H, 321JN1024GB-TX01 | MSI Prestige 16 B1MG-001US Arc 8-Core, Ultra 7 155H, Samsung PM9A1 MZVL22T0HBLB | Acer Swift Edge SFE16 Ryzen 7 7840U Radeon 780M, R7 7840U, SK hynix HFS512GEJ9X125N | Schenker Vision 16 PH6PRX1 Iris Xe G7 96EUs, i7-13700H, Samsung 990 Pro 1 TB | Acer Swift Go SFG16-71 Iris Xe G7 96EUs, i7-13700H, Micron 2400 MTFDKBA1T0QFM | Lenovo Yoga 7 16IRL8 Iris Xe G7 96EUs, i7-1355U, WD PC SN740 512GB SDDPMQD-512G-1101 | Samsung Galaxy Book3 Pro 16 Iris Xe G7 80EUs, i5-1340P, WD PC SN740 256GB SDDPNQD-256G | Huawei MateBook 16s i9 Iris Xe G7 96EUs, i9-13900H, 321JN1024GB-TX01 | Huawei MateBook D 16 2022 Iris Xe G7 96EUs, i7-12700H, Silicon Motion PCIe-8 SSD | |
|---|---|---|---|---|---|---|---|---|---|
| Geräuschentwicklung | -22% | -16% | -18% | -23% | -15% | -24% | -25% | -18% | |
| aus / Umgebung * (dB) | 23.2 | 24.5 -6% | 23.4 -1% | 25.5 -10% | 25.7 -11% | 22.8 2% | 25.2 -9% | 25.7 -11% | 24.2 -4% |
| Idle min * (dB) | 23.2 | 24.5 -6% | 24.1 -4% | 25.5 -10% | 26.1 -13% | 22.9 1% | 25.2 -9% | 25.7 -11% | 24.2 -4% |
| Idle avg * (dB) | 23.2 | 26.3 -13% | 24.3 -5% | 28.7 -24% | 26.1 -13% | 22.9 1% | 25.2 -9% | 28.4 -22% | 25.8 -11% |
| Idle max * (dB) | 24 | 26.3 -10% | 28 -17% | 29.1 -21% | 27.2 -13% | 26.9 -12% | 29.3 -22% | 28.4 -18% | 30.5 -27% |
| Last avg * (dB) | 28 | 36.5 -30% | 41 -46% | 33.8 -21% | 44.2 -58% | 41.7 -49% | 46.4 -66% | 45.3 -62% | 39.8 -42% |
| Witcher 3 ultra * (dB) | 31.9 | 46.3 -45% | 40.9 -28% | 37.6 -18% | 41.5 -30% | 39.8 -25% | |||
| Last max * (dB) | 36.2 | 52.9 -46% | 40.9 -13% | 44.9 -24% | 47.5 -31% | 43.6 -20% | 46.4 -28% | 45.6 -26% | 39.8 -10% |
* ... kleinere Werte sind besser
Temperatur
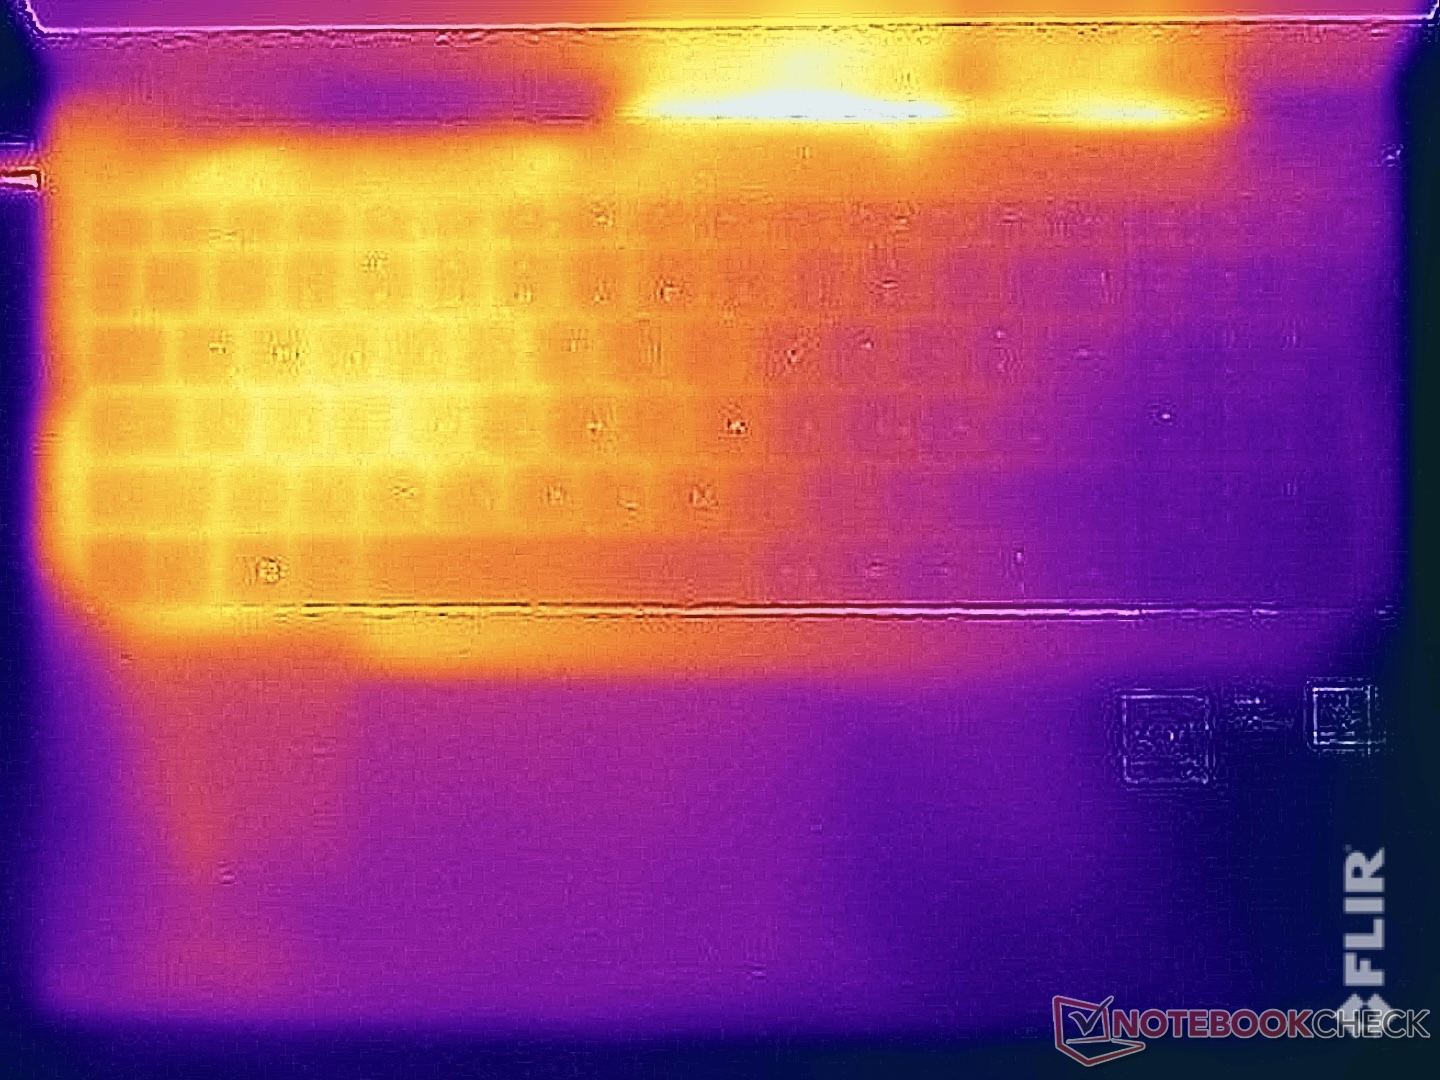
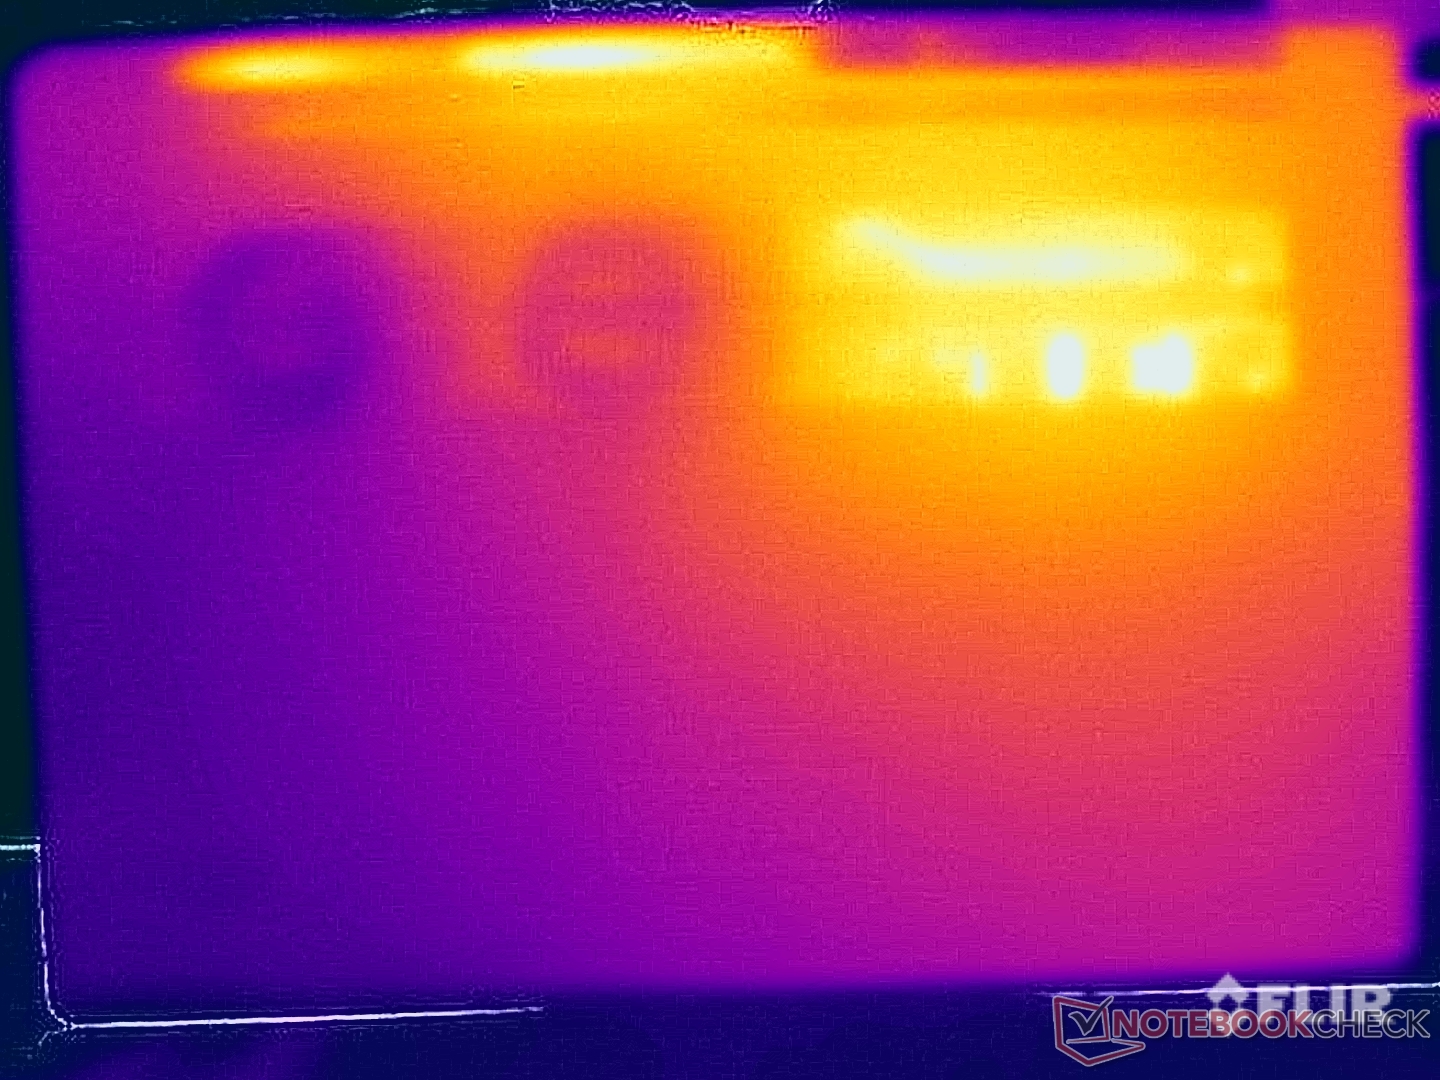
Aufgrund der asymmetrischen Anordnung der Lüfter wird unter Last vor allem die linke Seite des Gehäuses wärmer. insgesamt sind die Temperaturen aber unproblematisch, sowohl bei wenig als auch hoher Belastung. Im Stresstest pendelt sich der Stromverbrauch des Prozessors schnell bei 35 Watt ein, wenn man den Modus Ausbalanciert verwendet. Im optionalen Leistungsmodus sind es nach wenigen Minuten stabile 40 Watt, was die deutlich lauteren Lüfter keinesfalls rechtfertigt.
(±) Die maximale Temperatur auf der Oberseite ist 40.3 °C. Im Vergleich liegt der Klassendurchschnitt bei 36.8 °C (von 21 bis 71 °C für die Klasse Multimedia).
(-) Auf der Unterseite messen wir eine maximalen Wert von 45.1 °C (im Vergleich zum Durchschnitt von 39.1 °C).
(+) Ohne Last messen wir eine durchschnittliche Temperatur von 25.3 °C auf der Oberseite. Der Klassendurchschnitt erreicht 31.3 °C.
(±) Beim längeren Spielen von The Witcher 3 erhitzt sich das Gerät durchschnittlich auf 33.5 °C. Der Durchschnitt der Klasse ist derzeit 31.3 °C.
(+) Die Handballen und der Touchpad-Bereich sind mit gemessenen 30.2 °C kühler als die typische Hauttemperatur und fühlen sich dadurch kühl an.
(±) Die durchschnittliche Handballen-Temperatur anderer getesteter Geräte war 28.7 °C (-1.5 °C).
| Huawei MateBook D 16 2024 Intel Core i9-13900H, Intel Iris Xe Graphics G7 96EUs | MSI Prestige 16 B1MG-001US Intel Core Ultra 7 155H, Intel Arc 8-Core iGPU | Acer Swift Edge SFE16 Ryzen 7 7840U AMD Ryzen 7 7840U, AMD Radeon 780M | Schenker Vision 16 PH6PRX1 Intel Core i7-13700H, Intel Iris Xe Graphics G7 96EUs | Acer Swift Go SFG16-71 Intel Core i7-13700H, Intel Iris Xe Graphics G7 96EUs | Lenovo Yoga 7 16IRL8 Intel Core i7-1355U, Intel Iris Xe Graphics G7 96EUs | Samsung Galaxy Book3 Pro 16 Intel Core i5-1340P, Intel Iris Xe Graphics G7 80EUs | Huawei MateBook 16s i9 Intel Core i9-13900H, Intel Iris Xe Graphics G7 96EUs | Huawei MateBook D 16 2022 Intel Core i7-12700H, Intel Iris Xe Graphics G7 96EUs | |
|---|---|---|---|---|---|---|---|---|---|
| Hitze | -1% | -9% | -0% | -14% | -2% | -11% | -10% | -7% | |
| Last oben max * (°C) | 40.3 | 48.8 -21% | 41.6 -3% | 41.1 -2% | 44.4 -10% | 37.6 7% | 41.6 -3% | 43.2 -7% | 41.8 -4% |
| Last unten max * (°C) | 45.1 | 47.6 -6% | 46.6 -3% | 42 7% | 48 -6% | 40 11% | 45 -0% | 44.7 1% | 47.3 -5% |
| Idle oben max * (°C) | 26.6 | 24.2 9% | 30.4 -14% | 28.5 -7% | 31.9 -20% | 30.4 -14% | 31 -17% | 32.1 -21% | 28.3 -6% |
| Idle unten max * (°C) | 27.1 | 23.6 13% | 31 -14% | 26.8 1% | 31.9 -18% | 30.6 -13% | 33.6 -24% | 30.1 -11% | 30.2 -11% |
* ... kleinere Werte sind besser
Lautsprecher
Die beiden Stereo-Lautsprecher sind nur durchschnittlich, denn es fehlt ihnen an Druck und Räumlichkeit. Der Vorteil ist die klare Wiedergabe von Höhen, was vor allem bei der Sprachwiedergabe (z. B. bei Konferenzen) positiv ist.
Huawei MateBook D 16 2024 Audio Analyse
(+) | Die Lautsprecher können relativ laut spielen (83.5 dB)
Bass 100 - 315 Hz
(-) | kaum Bass - 18.4% niedriger als der Median
(±) | durchschnittlich lineare Bass-Wiedergabe (8.8% Delta zum Vorgänger)
Mitteltöne 400 - 2000 Hz
(+) | ausgeglichene Mitten, vom Median nur 3.9% abweichend
(+) | lineare Mitten (6.5% Delta zum Vorgänger)
Hochtöne 2 - 16 kHz
(+) | ausgeglichene Hochtöne, vom Median nur 3.7% abweichend
(+) | sehr lineare Hochtöne (4.3% Delta zum Vorgänger)
Gesamt im hörbaren Bereich 100 - 16.000 Hz
(+) | hörbarer Bereich ist sehr linear (14% Abstand zum Median
Im Vergleich zu allen Geräten derselben Klasse
» 32% aller getesteten Geräte dieser Klasse waren besser, 3% vergleichbar, 65% schlechter
» Das beste Gerät hat einen Delta-Wert von 5%, durchschnittlich ist 17%, das schlechteste Gerät hat 45%
Im Vergleich zu allen Geräten im Test
» 16% aller getesteten Geräte waren besser, 4% vergleichbar, 80% schlechter
» Das beste Gerät hat einen Delta-Wert von 4%, durchschnittlich ist 24%, das schlechteste Gerät hat 134%
MSI Prestige 16 B1MG-001US Audio Analyse
(+) | Die Lautsprecher können relativ laut spielen (84 dB)
Bass 100 - 315 Hz
(-) | kaum Bass - 15.3% niedriger als der Median
(±) | durchschnittlich lineare Bass-Wiedergabe (7% Delta zum Vorgänger)
Mitteltöne 400 - 2000 Hz
(+) | ausgeglichene Mitten, vom Median nur 4.3% abweichend
(+) | lineare Mitten (4.3% Delta zum Vorgänger)
Hochtöne 2 - 16 kHz
(+) | ausgeglichene Hochtöne, vom Median nur 3.2% abweichend
(+) | sehr lineare Hochtöne (6.5% Delta zum Vorgänger)
Gesamt im hörbaren Bereich 100 - 16.000 Hz
(+) | hörbarer Bereich ist sehr linear (13.3% Abstand zum Median
Im Vergleich zu allen Geräten derselben Klasse
» 28% aller getesteten Geräte dieser Klasse waren besser, 4% vergleichbar, 68% schlechter
» Das beste Gerät hat einen Delta-Wert von 5%, durchschnittlich ist 17%, das schlechteste Gerät hat 45%
Im Vergleich zu allen Geräten im Test
» 14% aller getesteten Geräte waren besser, 3% vergleichbar, 83% schlechter
» Das beste Gerät hat einen Delta-Wert von 4%, durchschnittlich ist 24%, das schlechteste Gerät hat 134%
Samsung Galaxy Book3 Pro 16 Audio Analyse
(+) | Die Lautsprecher können relativ laut spielen (84.8 dB)
Bass 100 - 315 Hz
(-) | kaum Bass - 15.4% niedriger als der Median
(-) | keine lineare Bass-Wiedergabe (15% Delta zum Vorgänger)
Mitteltöne 400 - 2000 Hz
(+) | ausgeglichene Mitten, vom Median nur 2.7% abweichend
(+) | lineare Mitten (5.4% Delta zum Vorgänger)
Hochtöne 2 - 16 kHz
(+) | ausgeglichene Hochtöne, vom Median nur 4.7% abweichend
(±) | durchschnittlich lineare Hochtöne (7.9% Delta zum Vorgänger)
Gesamt im hörbaren Bereich 100 - 16.000 Hz
(+) | hörbarer Bereich ist sehr linear (13.4% Abstand zum Median
Im Vergleich zu allen Geräten derselben Klasse
» 7% aller getesteten Geräte dieser Klasse waren besser, 4% vergleichbar, 89% schlechter
» Das beste Gerät hat einen Delta-Wert von 7%, durchschnittlich ist 21%, das schlechteste Gerät hat 53%
Im Vergleich zu allen Geräten im Test
» 14% aller getesteten Geräte waren besser, 4% vergleichbar, 83% schlechter
» Das beste Gerät hat einen Delta-Wert von 4%, durchschnittlich ist 24%, das schlechteste Gerät hat 134%
Huawei MateBook 16s i9 Audio Analyse
(+) | Die Lautsprecher können relativ laut spielen (87.6 dB)
Bass 100 - 315 Hz
(±) | abgesenkter Bass - 10.5% geringer als der Median
(±) | durchschnittlich lineare Bass-Wiedergabe (10.6% Delta zum Vorgänger)
Mitteltöne 400 - 2000 Hz
(+) | ausgeglichene Mitten, vom Median nur 4.1% abweichend
(+) | lineare Mitten (5% Delta zum Vorgänger)
Hochtöne 2 - 16 kHz
(±) | zu hohe Hochtöne, vom Median nur 5.4% abweichend
(+) | sehr lineare Hochtöne (6.1% Delta zum Vorgänger)
Gesamt im hörbaren Bereich 100 - 16.000 Hz
(+) | hörbarer Bereich ist sehr linear (11.7% Abstand zum Median
Im Vergleich zu allen Geräten derselben Klasse
» 19% aller getesteten Geräte dieser Klasse waren besser, 3% vergleichbar, 77% schlechter
» Das beste Gerät hat einen Delta-Wert von 5%, durchschnittlich ist 17%, das schlechteste Gerät hat 45%
Im Vergleich zu allen Geräten im Test
» 8% aller getesteten Geräte waren besser, 3% vergleichbar, 89% schlechter
» Das beste Gerät hat einen Delta-Wert von 4%, durchschnittlich ist 24%, das schlechteste Gerät hat 134%
Energieverwaltung - Schwaches Netzteil und lange Akkulaufzeiten
Energieaufnahme
Im Leerlauf geht der maximale Stromverbrauch mit 10 Watt bei voller Bildschirmhelligkeit. Unter Last begrenzt das 65-Watt-Netzteil allerdings den Stromverbrauch. Wenn man sich vorstellt, dass der Prozessor zumindest kurzzeitig 64 Watt verbrauchen darf, ist es wenig überraschend, dass ein 65-Watt-Netzteil in diesen Situationen nicht genügend Leistung für das gesamte Notebook bereitstellen kann. In diesen Fällen muss also immer kurzzeitig der Akku angezapft werden, was sicherlich kein Vorteil für die Haltbarkeit ist. Maximal werden dem Akku mehr als 20 Watt entnommen. Bei dauerhafter Belastung pendelt sich das im Modus Ausbalanciert ein und das Netzteil reicht dann aus, wenn man aber über einen längeren Modus den Leistungsmodus nutzt (wo sich die CPU bei 40 Watt einpendelt), sinkt die Akkukapazität kontinuierlich (2-3 % pro Stunde). Interessanterweise kann man dieses Problem auch nicht umgehen, denn selbst mit einem stärkeren 100-Watt-Netzteil hat das MateBook nicht mehr Energie aufgenommen.
| Aus / Standby | |
| Idle | |
| Last |
|
Legende:
min: | |
| Huawei MateBook D 16 2024 i9-13900H, Iris Xe G7 96EUs, 321JN1024GB-TX01, IPS, 1920x1200, 16" | MSI Prestige 16 B1MG-001US Ultra 7 155H, Arc 8-Core, Samsung PM9A1 MZVL22T0HBLB, IPS, 2560x1600, 16" | Acer Swift Edge SFE16 Ryzen 7 7840U R7 7840U, Radeon 780M, SK hynix HFS512GEJ9X125N, OLED, 3200x2000, 16" | Schenker Vision 16 PH6PRX1 i7-13700H, Iris Xe G7 96EUs, Samsung 990 Pro 1 TB, IPS, 2560x1600, 16" | Acer Swift Go SFG16-71 i7-13700H, Iris Xe G7 96EUs, Micron 2400 MTFDKBA1T0QFM, OLED, 3200x2000, 16" | Lenovo Yoga 7 16IRL8 i7-1355U, Iris Xe G7 96EUs, WD PC SN740 512GB SDDPMQD-512G-1101, IPS, 1920x1200, 16" | Samsung Galaxy Book3 Pro 16 i5-1340P, Iris Xe G7 80EUs, WD PC SN740 256GB SDDPNQD-256G, AMOLED, 2880x1800, 16" | Huawei MateBook 16s i9 i9-13900H, Iris Xe G7 96EUs, 321JN1024GB-TX01, IPS, 2560x1680, 16" | Huawei MateBook D 16 2022 i7-12700H, Iris Xe G7 96EUs, Silicon Motion PCIe-8 SSD, IPS, 1920x1200, 16" | Durchschnittliche Intel Iris Xe Graphics G7 96EUs | Durchschnitt der Klasse Multimedia | |
|---|---|---|---|---|---|---|---|---|---|---|---|
| Stromverbrauch | -13% | -13% | -25% | -2% | 6% | 19% | -28% | -16% | -2% | -30% | |
| Idle min * (Watt) | 4.7 | 3 36% | 7.1 -51% | 6.3 -34% | 5.8 -23% | 3.3 30% | 3.9 17% | 5.8 -23% | 6.1 -30% | 5.51 ? -17% | 5.71 ? -21% |
| Idle avg * (Watt) | 9.5 | 9.5 -0% | 10.1 -6% | 14.4 -52% | 6 37% | 10.2 -7% | 4.8 49% | 7.7 19% | 10.6 -12% | 8.66 ? 9% | 10.1 ? -6% |
| Idle max * (Watt) | 10.1 | 12 -19% | 18.6 -84% | 16.2 -60% | 6.9 32% | 10.3 -2% | 10 1% | 10.6 -5% | 11.5 -14% | 10.9 ? -8% | 12.4 ? -23% |
| Last avg * (Watt) | 49.7 | 68.3 -37% | 45.3 9% | 46.2 7% | 59 -19% | 55.2 -11% | 44 11% | 76.9 -55% | 65.5 -32% | 45.6 ? 8% | 65 ? -31% |
| Witcher 3 ultra * (Watt) | 60 | 59.8 -0% | 39.5 34% | 49.4 18% | 61.1 -2% | 43.8 27% | 42.3 29% | 76.7 -28% | 61.2 -2% | ||
| Last max * (Watt) | 66.3 | 104.8 -58% | 52.9 20% | 85.2 -29% | 92 -39% | 65.7 1% | 63 5% | 118 -78% | 68.4 -3% | 67.8 ? -2% | 112.2 ? -69% |
* ... kleinere Werte sind besser
Energieaufnahme Witcher 3 / Stresstest
Energieaufnahme mit externem Monitor
Akkulaufzeit
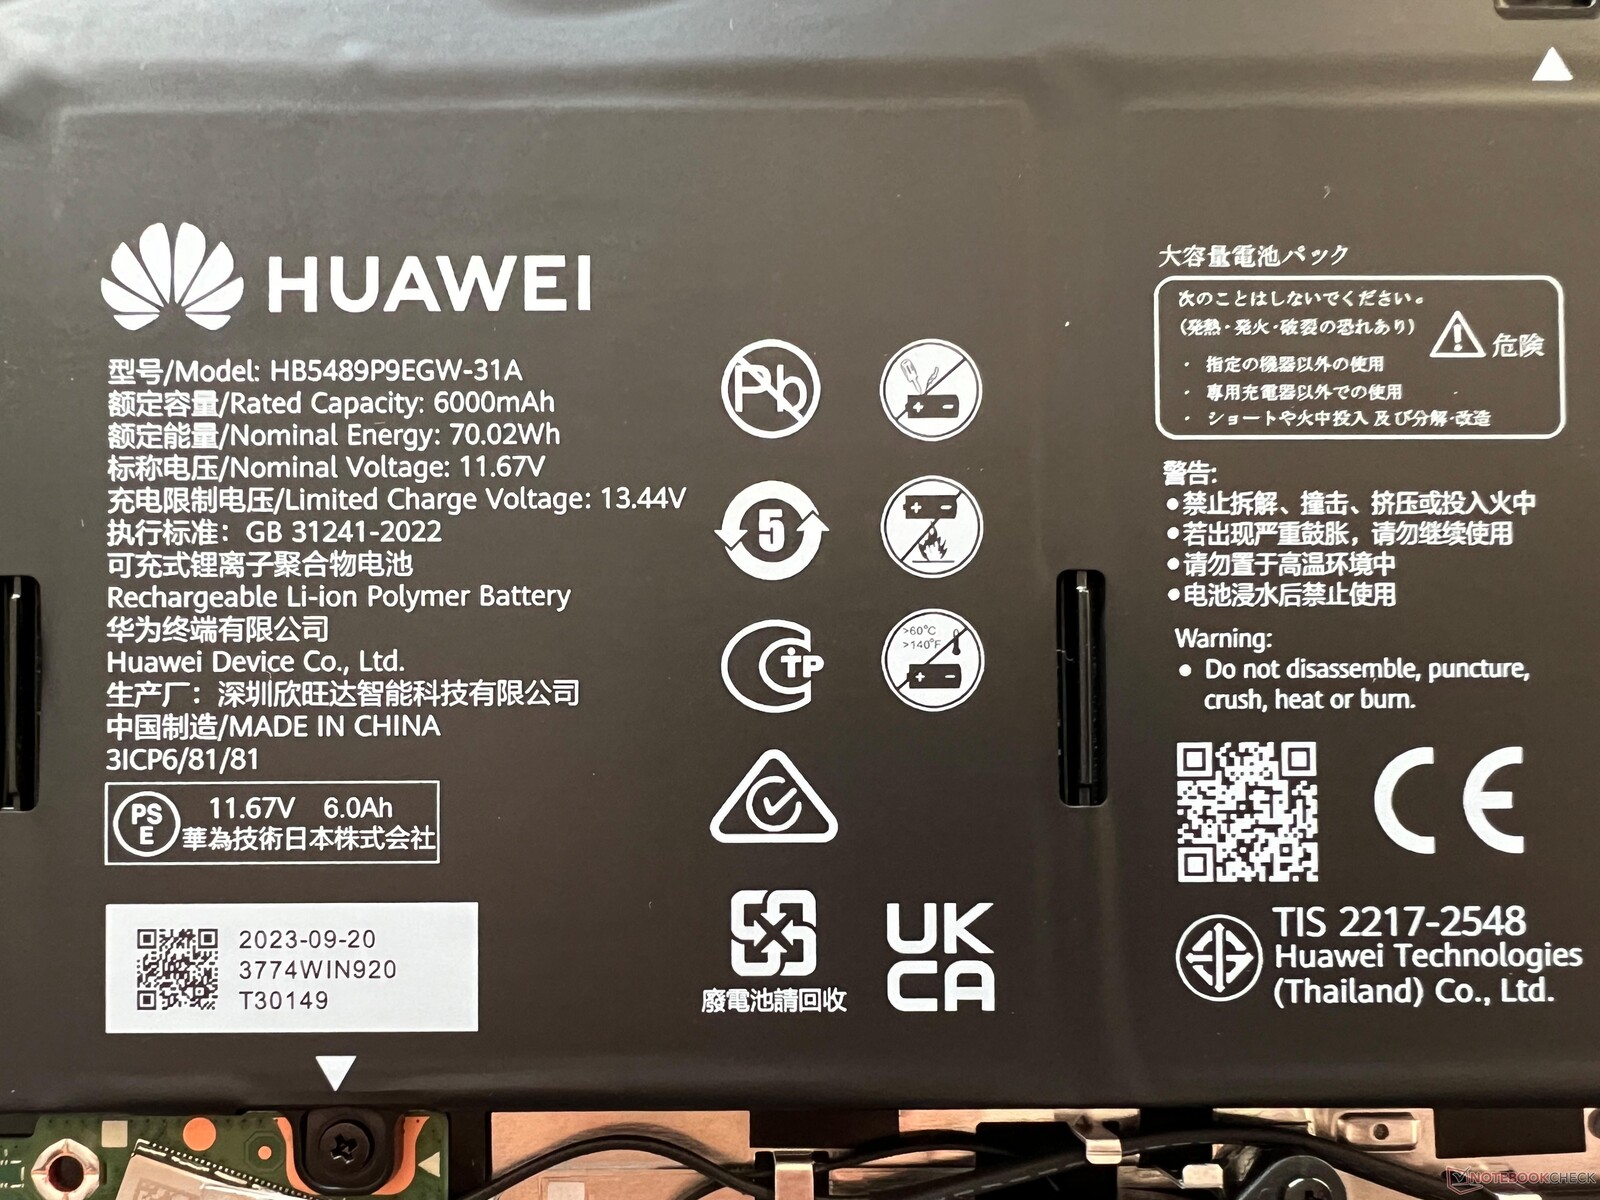
Die Akkukapazität des Core-i9-Modells ist auf 70 Wh gewachsen (i5-Version: 56 Wh) und das Ergebnis sind sehr lange Laufzeiten. In unserem WLAN-Test mit 150 cd/m² (entspricht beim Testgerät einer Helligkeit von 54 %) liegt die Laufzeit bei sehr guten 11:14 Stunden und bei voller Bildschirmhelligkeit immer noch bei 08:21 Stunden. Unser Videotest mit 150 cd/m² läuft sogar fast 14 Stunden lang. Ein vollständiger Ladevorgang bei eingeschaltetem Gerät dauert etwas mehr als zwei Stunden und eine Schnelladefunktion gibt es nicht.
| Huawei MateBook D 16 2024 i9-13900H, Iris Xe G7 96EUs, 70 Wh | MSI Prestige 16 B1MG-001US Ultra 7 155H, Arc 8-Core, 99.9 Wh | Acer Swift Edge SFE16 Ryzen 7 7840U R7 7840U, Radeon 780M, 54 Wh | Schenker Vision 16 PH6PRX1 i7-13700H, Iris Xe G7 96EUs, 80 Wh | Acer Swift Go SFG16-71 i7-13700H, Iris Xe G7 96EUs, 65 Wh | Lenovo Yoga 7 16IRL8 i7-1355U, Iris Xe G7 96EUs, 71 Wh | Samsung Galaxy Book3 Pro 16 i5-1340P, Iris Xe G7 80EUs, 76 Wh | Huawei MateBook 16s i9 i9-13900H, Iris Xe G7 96EUs, 84 Wh | Huawei MateBook D 16 2022 i7-12700H, Iris Xe G7 96EUs, 60 Wh | Durchschnitt der Klasse Multimedia | |
|---|---|---|---|---|---|---|---|---|---|---|
| Akkulaufzeit | 82% | -50% | 29% | 7% | 17% | 13% | 44% | -37% | 15% | |
| H.264 (h) | 13.9 | 14.4 4% | 16.4 ? 18% | |||||||
| WLAN (h) | 11.2 | 18.3 63% | 5.6 -50% | 8 -29% | 7.8 -30% | 9.4 -16% | 10.2 -9% | 13.1 17% | 7.1 -37% | 12 ? 7% |
| Last (h) | 1.4 | 2.8 100% | 2.6 86% | 2 43% | 2.1 50% | 2 43% | 2.4 71% | 1.675 ? 20% | ||
| Idle (h) | 25.1 | 19 | 30.4 | 25.2 ? |
Pro
Contra
Fazit - MateBook D 16 ist technisch überholt und viel zu teuer

Das neue MateBook D 16 2024 hat bei uns für Verwunderung gesorgt und das Gesamtpaket ist ziemlich unausgewogen. Der 16 Zoll große Multimedia-Laptop bietet positive Aspekte wie den leistungsstarken Prozessor, wobei man hier kritisch anmerken kann, dass der Core i9 vor allem auf dem Datenblatt eine gute Figur macht und ein Core i7 im Endeffekt praktisch die gleiche Performance gebracht hätte. Die Power Limits sind wie beim Vorgänger recht gering, aber für alltägliche Aufgaben reicht das vollkommen aus und auch die beiden Lüfter haben in der Regel nicht viel zu tun.
Das matte IPS-Display kann zwar nicht mit vielen Features begeistern, aber die subjektive Bildqualität ist gut und kalibriert ist die Farbdarstellung auf Referenzniveau, zusammen mit der vollen sRGB-Abdeckung ist also auch die Bildbearbeitung kein Problem. Zudem kommt kein PWM zum Einsatz. Weitere positive Aspekte sind die langen Akkulaufzeiten sowie die komfortable Tastatur.
Das neue MateBook D 16 2024 ist ein sehr unausgewogenes Multimedia-Notebook, bei dem ein schneller Prozessor, ein vernünftiges IPS-Display und lange Akkulaufzeiten einer komplett überholten Ausstattung gegenüberstehen. Bei einem Preis von 1.399 Euro sind Dinge wie USB 2.0 einfach nicht akzeptabel und insgesamt ist das neue MateBook zu teuer.
Auf der anderen Seite leistet sich das MateBook D 16 2024 aber auch einige Patzer und vor allem die Anschlussausstattung muss kritisiert werden. Huawei hat hier im Vergleich zu den Vorgängern weiter reduziert und verbaut nur noch einen einzigen USB-C-Anschluss, der aber für die Stromversorgung genutzt wird. Auf Thunderbolt 4 oder USB 4.0 verzichtet der Hersteller, dafür gibt es auf der rechten Seite einen alten USB-2.0-Anschluss. Zudem gibt es nur eine 720p-Webcam und moderne Wi-Fi-6E-Netze werden nicht unterstützt.
Es gibt aber noch weitere Probleme, denn auch das Netzteil ist zu schwach dimensioniert und wenn der Prozessor (auch wenn es kurzzeitig ist) maximal 64 Watt verbrauchen darf, ist es wenig überraschend, dass ein 65-Watt-Netzteil nicht genügend Leistung liefert. Im Inneren des Gehäuses wird zudem recht viel Platz verschwendet und hier hätte man durchaus zwei SO-DIMM-Steckplätze integrieren können. Das kleinere Modell für 999 Euro können wir nicht beurteilen, da hier neben einem schwächeren Prozessor (mit noch schwächerer iGPU) ein schlechteres Display (45 % NTSC) und ein kleinerer Akku zum Einsatz kommen. Im schlimmsten Fall sind damit die positiven Eigenschaften, die wir oben beschrieben haben, dort nicht vorhanden.
Insgesamt kann sich die teure Variante des MateBook D 16 2024 dank der positiven Aspekte mit 85 % noch eine gute Bewertung sichern, doch das Preis-Leistungsverhältnis passt einfach nicht und wir können keine Kaufempfehlung aussprechen.
Preis und Verfügbarkeit
Das neue MateBook D 16 2024 ist ab dem 01. Februar 2024 verfügbar, kann aber bereits bei Huawei vorbestellt werden. Wer das Gerät im Zeitraum vom 12. Januar bis 29. Februar 2024 bestellt, erhält die Huawei FreeBuds 5 gratis dazu. bis 31. Januar gibt es zudem einen Pre-Order-Rabatt in Höhe von 50 Euro.
Huawei MateBook D 16 2024
- 12.01.2024 v7 (old)
Andreas Osthoff
Transparenz
Die Auswahl der zu testenden Geräte erfolgt innerhalb der Redaktion. Das vorliegende Testmuster wurde dem Autor vom Hersteller oder einem Shop zu Testzwecken leihweise zur Verfügung gestellt. Eine Einflussnahme des Leihstellers auf den Testbericht gab es nicht, der Hersteller erhielt keine Version des Reviews vor der Veröffentlichung. Es bestand keine Verpflichtung zur Publikation. Als eigenständiges, unabhängiges Unternehmen unterliegt Notebookcheck keiner Diktion von Herstellern, Shops und Verlagen.
So testet Notebookcheck
Pro Jahr werden von Notebookcheck hunderte Laptops und Smartphones unabhängig in von uns standardisierten technischen Verfahren getestet, um eine Vergleichbarkeit aller Testergebnisse zu gewährleisten. Seit rund 20 Jahren entwickeln wir diese Testmethoden kontinuierlich weiter und setzen damit Branchenstandards. In unseren Testlaboren kommt ausschließlich hochwertiges Messequipment in die Hände erfahrener Techniker und Redakteure. Die Tests unterliegen einer mehrstufigen Kontrolle. Unsere komplexe Gesamtbewertung basiert auf hunderten fundierten Messergebnissen und Benchmarks, womit Ihnen Objektivität garantiert ist. Weitere Informationen zu unseren Testmethoden gibt es hier.
Preisvergleich
