

Notebookcheck Logo
Teaser

Testbericht zum Framework Laptop 13 Pro: Der König der Reparierbarkeit ist zurück

LPCAMM2 und austauschbares Motherboard.

Nach fünf ganzen Jahren mit demselben Laptop-13,5-Modell hat Framework endlich einen Nachfolger entwickelt, der den Namen „Pro“ verdient. Das längst überfällige Update setzt noch stärker auf alles, was das Original so besonders gemacht hat, und geht zugleich auf viele der häufigsten Kritikpunkte ein.
Allen Ngo, 👁 Allen Ngo, Stefanie Voigt (übersetzt von DeepL / Ninh Duy) Veröffentlicht am 🇺🇸 🇳🇱 ...
Intel Panther Lake Laptop / Notebook DIY

Fazit – Auf Augenhöhe mit den Großen der Branche

Einer unserer Hauptkritikpunkte am Laptop 13,5 war, dass er im Vergleich zu bekannteren Prosumer-Laptops wie dem Dell XPS, dem Lenovo Yoga oder der HP-OmniBook-Serie zugunsten einer besseren Wartbarkeit und Nutzbarkeit Abstriche bei der Steifigkeit und Robustheit machte. Das Laptop 13 Pro geht dieses Problem direkt an – mit einem deutlich stabileren Gehäusedesign, das sich im Vergleich zum unmittelbaren Vorgängermodell sofort fester und widerstandsfähiger anfühlt. Der Qualitätssprung bei den Materialien ist so bedeutend, dass er wohl der wichtigste Grund dafür ist, das Laptop 13 Pro dem Standardmodell Laptop 13,5 vorzuziehen, da beide Modelle ansonsten nahezu identische Komponenten und Display-Optionen aufweisen. Das etwas höhere Gewicht nimmt man gerne in Kauf, wenn man die hohe Reparaturfreundlichkeit und die enormen Verbesserungen gegenüber der Vorgängergeneration berücksichtigt.

Über das Gehäuse hinaus hat sich die Akkulaufzeit um ebenso beeindruckende Werte verbessert, was vor allem auf die effiziente Panther-Lake-CPU zurückzuführen ist.

Download der lizensierten Bewertungsgrafik als SVG / PNG

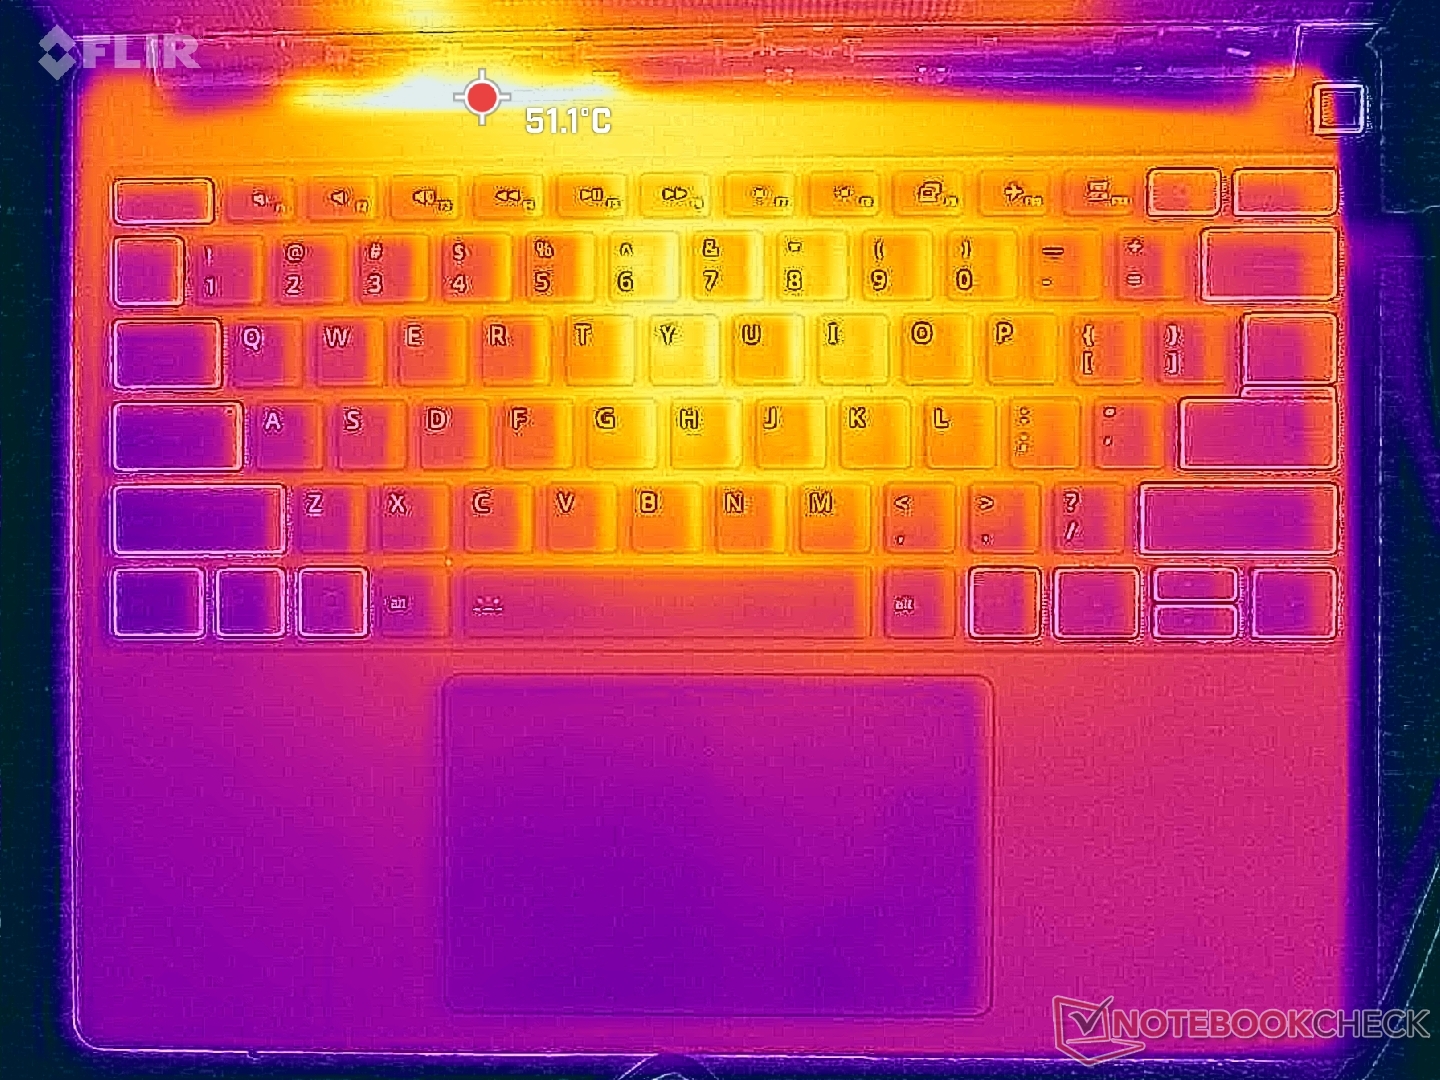
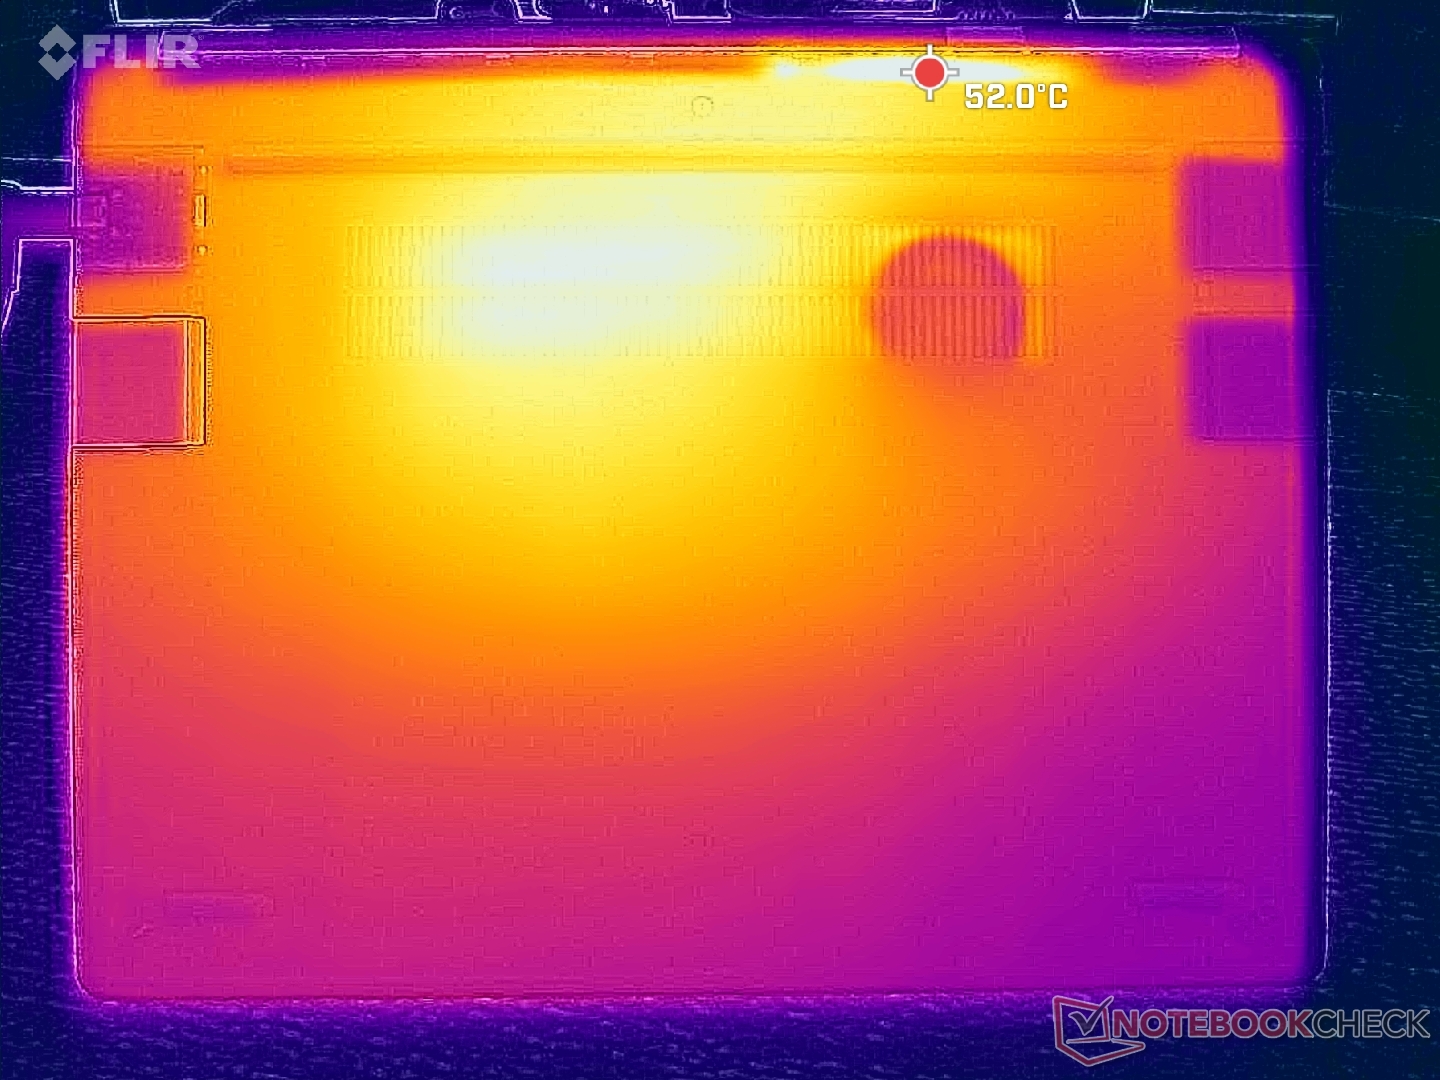
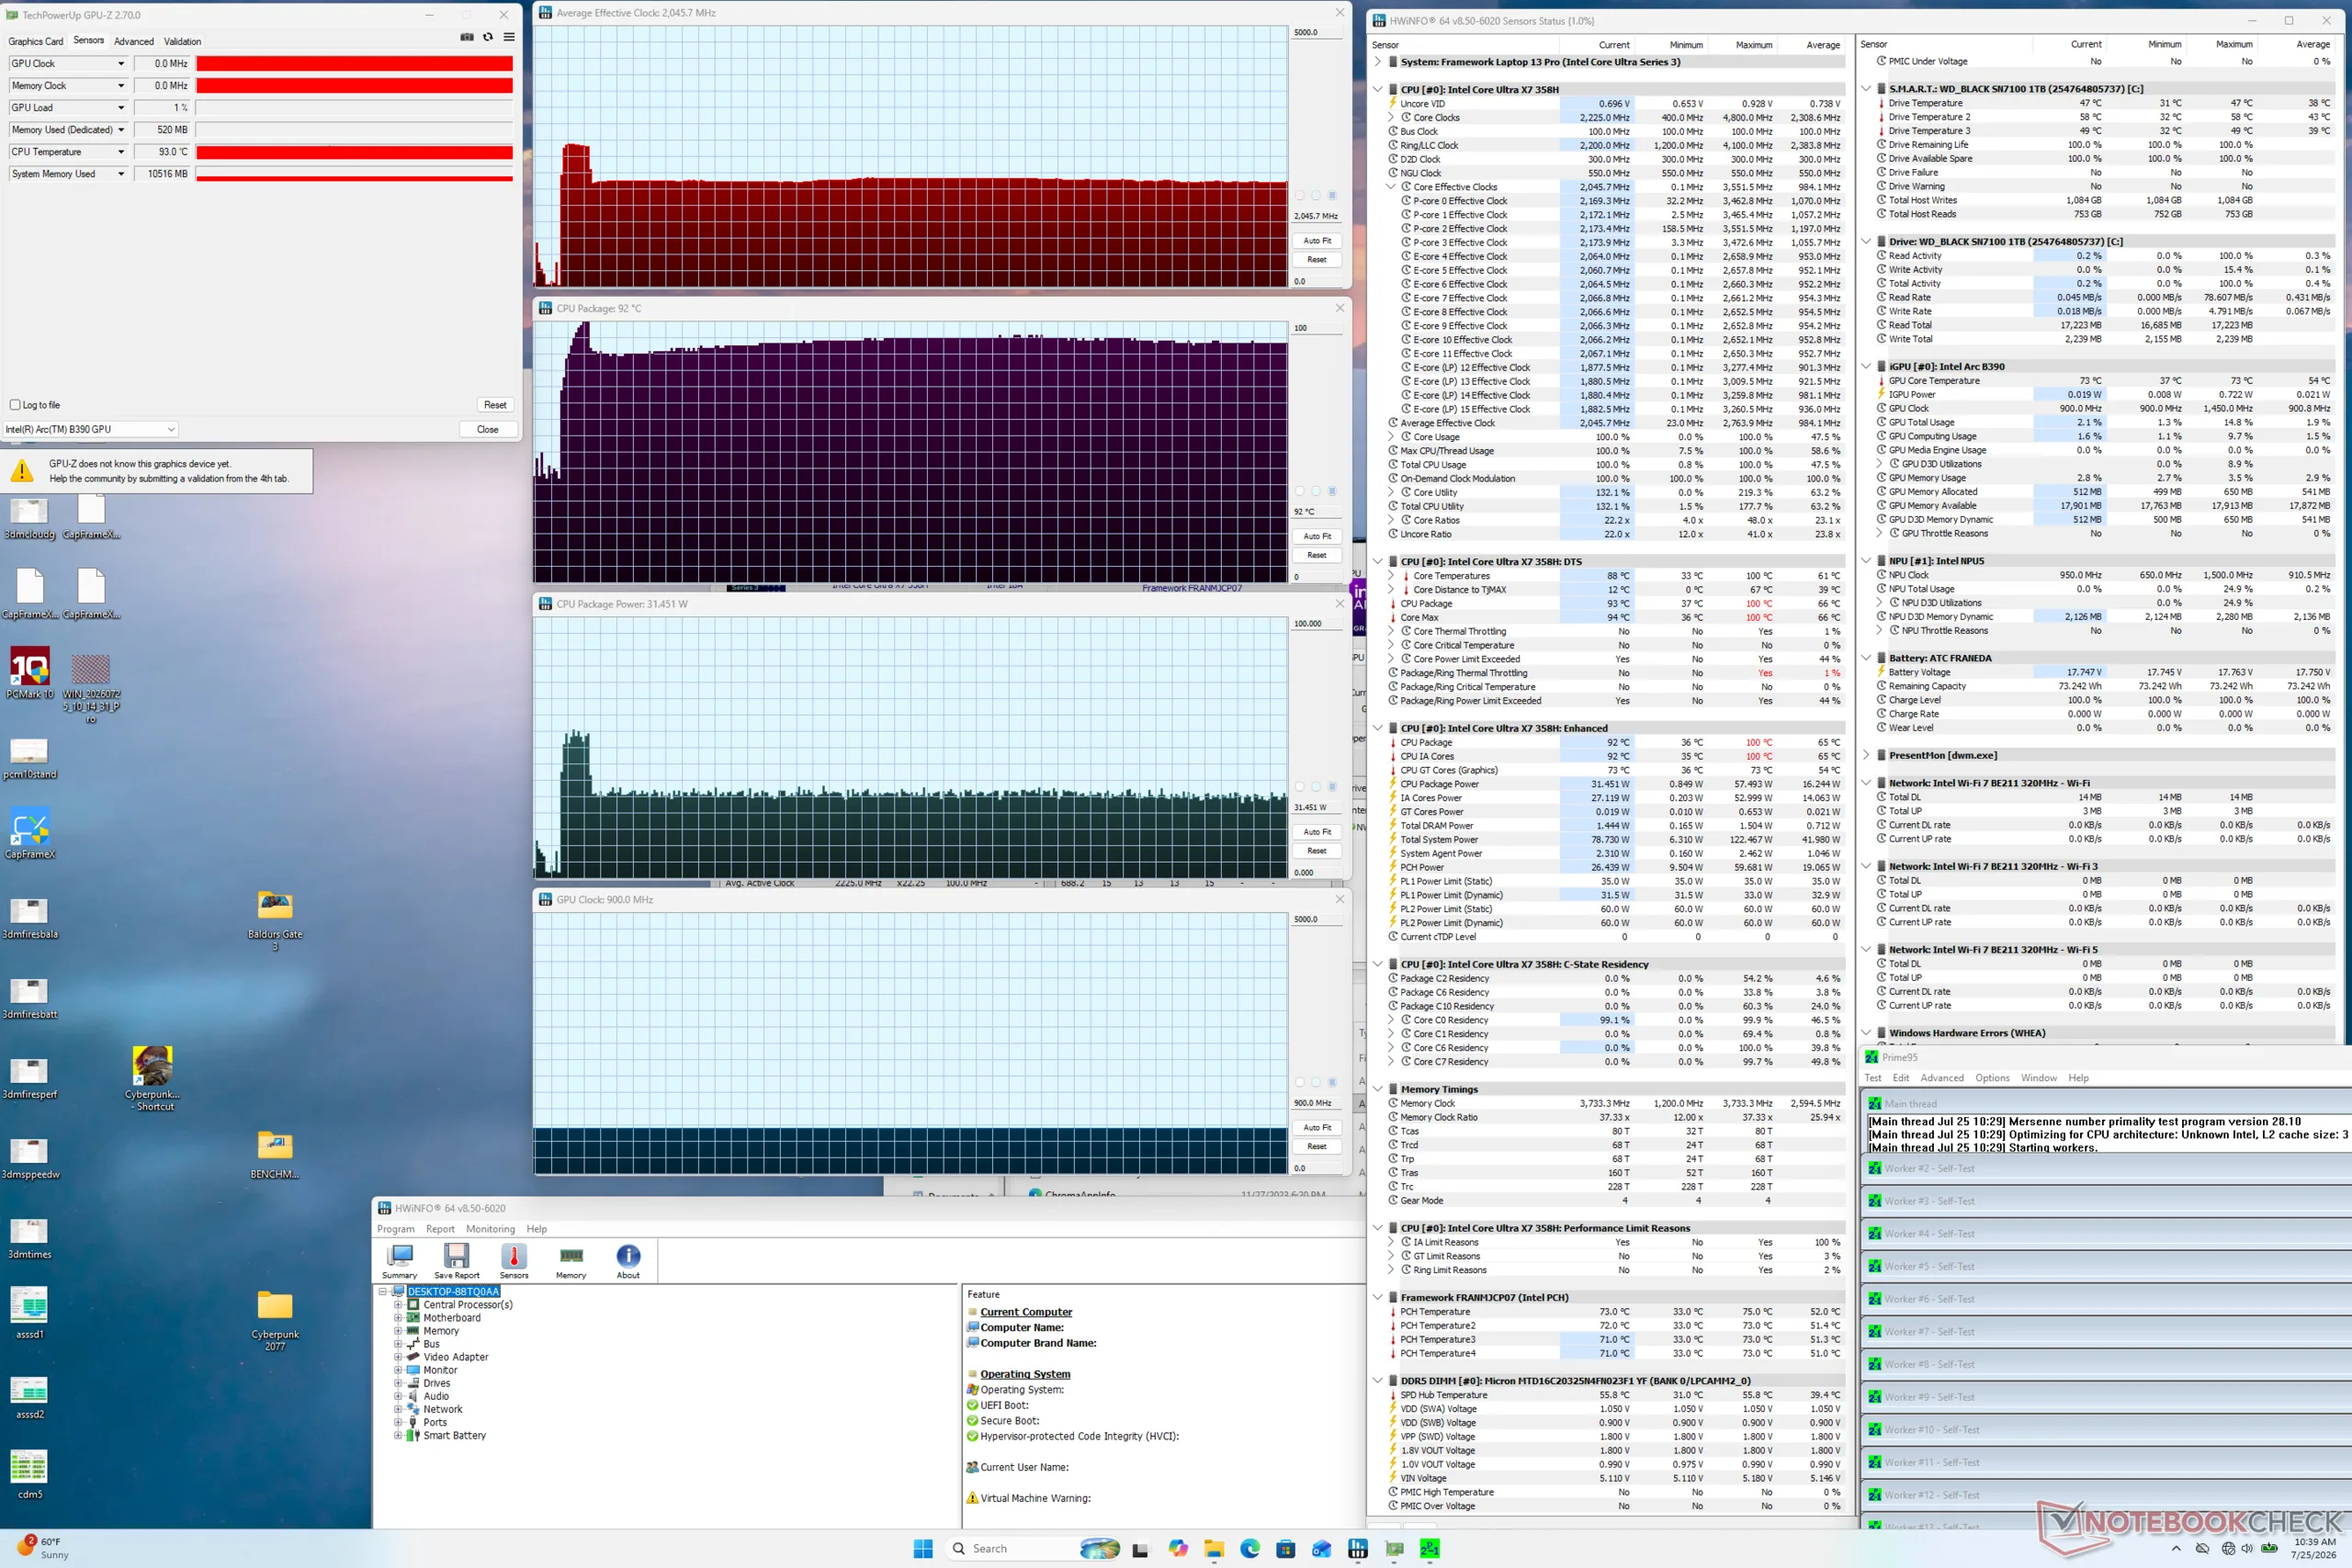
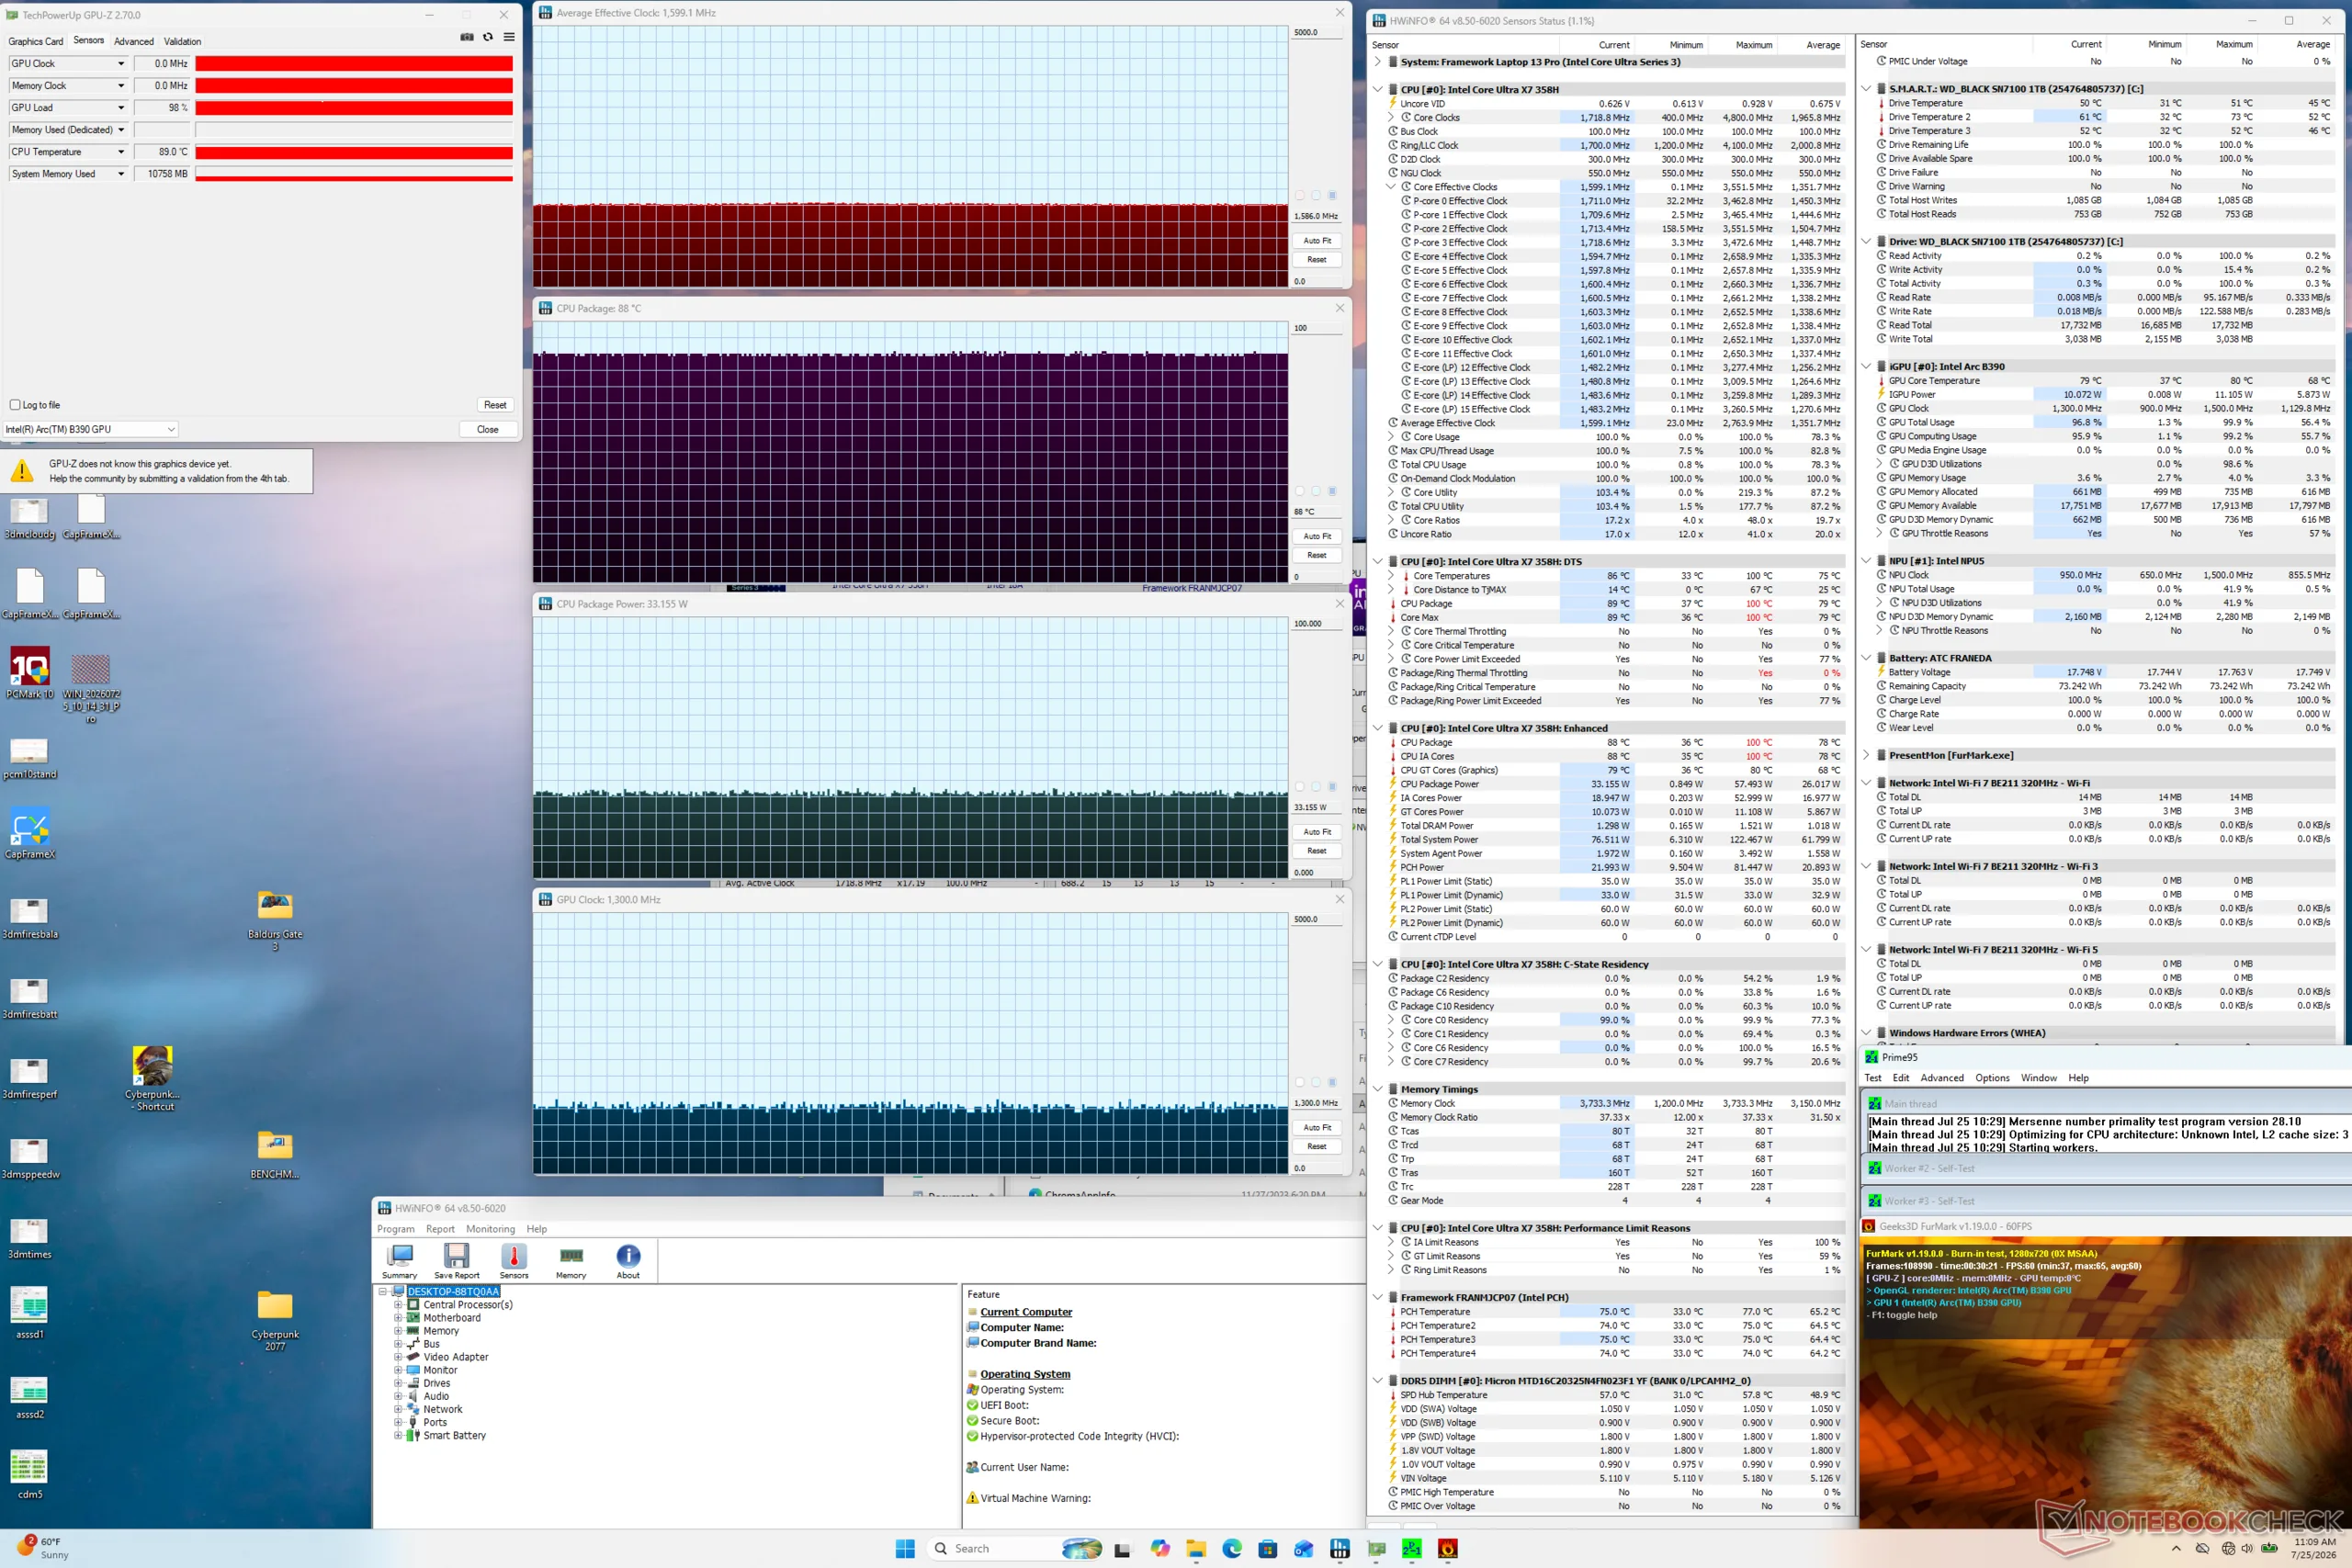
Ein bemerkenswerter Nachteil, der vom Laptop 13,5 übernommen wurde, bleibt bestehen: hohe Kerntemperaturen. Die CPU erreicht unter Last Temperaturen von über 90 °C, verglichen mit nur 74 °C beim Dell XPS 13, das mit genau dem gleichen Core-Ultra-X7-Prozessor ausgestattet ist – was wahrscheinlich auf die kleinere Kühllösung des Framework zurückzuführen ist. Es ist bedauerlich, dass der durch den Wechsel von SODIMM zu LPCAMM2 gewonnene Platz nicht anderweitig für die Kühlung genutzt wird. Folglich wird die Turbo-Boost-Leistung beeinträchtigt, und die reine Rechenleistung fällt geringer aus als erwartet. Das soll nicht heißen, dass der Laptop 13 Pro träge ist, aber er hätte auf der Grundlage unserer Erfahrungen mit konkurrierenden Panther-Lake-Laptops sicherlich schneller sein können.

Das Fehlen von OLED und HDR lässt sich leichter verzeihen, da Framework-Laptops nicht in erster Linie für den Multimedia-Konsum konzipiert sind. Dennoch könnte das Fehlen der P3-Farbraumunterstützung einige professionelle Künstler abschrecken.

Für zukünftige Konfigurationen würden wir uns optionales Gorilla Glas zur Verstärkung des Deckels, vPro sowie Clickpads mit dedizierten Maustasten wünschen, um die Vielseitigkeit des Designs weiter auszubauen.

Pro

+ nach wie vor führend in Sachen Reparaturfreundlichkeit, Anpassbarkeit und Support
+ deutlich verbessertes Gehäuse und höhere Steifigkeit
+ für einen IPS-Touchscreen sehr hell
+ austauschbare Anschlüsse und Hauptplatine
+ komfortable Tastatur
+ lange Akkulaufzeit

Contra

- Die Turbo-Boost-Leistung könnte besser sein
- hohe Kerntemperaturen unter Last
- Der Displayrahmen aus Kunststoff wirkt etwas billig
- Die Lautsprecher könnten besser sein
- keine HDR- oder OLED-Optionen
- etwas schwerer

Preis und Verfügbarkeit

Der Framework Laptop 13 Pro ist ab sofort erhältlich, wobei die Preise bei der Basisausstattung bei 1.349 Euro beginnen und bis über 3.489 Euro reichen.

Amazon Logo
  • 1.249,00 €
    GEEKOM GeekBook X14 Pro Laptop, 999 g Ultraleicht, 14" 2.8K OLED Notebook
  • 1.684,90 €
    Lenovo ThinkPad E14 Gen 7 Business Laptop, AMD Ryzen 7 250, 32 GB DDR5 RAM, 2 TB PCIe SSD, 14" WUXGA (1920x1200) Display, AMD Radeon 780M Graphics, Deutsches Tastatur-Layout, W11 Pro, Schwarz
  • 1.929,00 €
    ASUS ExpertBook B5 | 14" WQXGA | Ultra 7 255H | RAM: 32GB | SSD: 2TB

Der erst im vergangenen April vorgestellte Framework Laptop 13 Pro ist das neueste Modell der Framework Reihe und ergänzt den bewährten, aber wohl in die Jahre gekommenen Framework Laptop 13,5. Auch wenn der Hersteller dies nicht direkt zugibt, ist der Laptop 13 Pro im Wesentlichen ein Nachfolger des ursprünglichen Laptop 13,5, da er viele der bisherigen Probleme behebt und gleichzeitig die Kompatibilität und Reparierbarkeit mit möglichst vielen bestehenden Komponenten gewährleistet. Die Modelle können wahlweise mit Intel-Panther-Lake- oder AMD-Ryzen-AI-300-Zen-5-Prozessoren konfiguriert werden, jeweils mit LPCAMM2 bzw. DDR5-SODIMM.

Unser Testgerät ist eine mittlere Intel Konfiguration mit der Core-Ultra-X7-358H-CPU für etwa 3.000 US-Dollar. Die Preise variieren stark je nach Arbeitsspeicher, Speicherplatz und Zubehör. Alle Konfigurationen werden derzeit mit dem gleichen IPS-Touchscreen mit einer Auflösung von 2.880 x 1.920 Pixeln und einer Bildwiederholfrequenz von 120 Hz ausgeliefert.

Der Laptop 13 Pro konkurriert mit herkömmlichen Prosumer-Clamshells wie dem Dell XPS 13, der Lenovo-ThinkPad T- oder Yoga-Pro-9-Serie, dem Microsoft Surface Laptop oder dem Asus ExpertBook Ultra.

Weitere Framework Testberichte:

Spezifikationen

Framework Laptop 13 Pro (Laptop Serie)
Prozessor
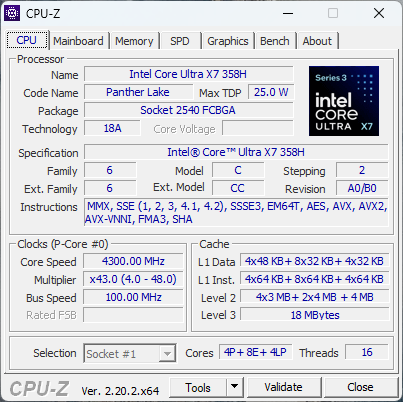
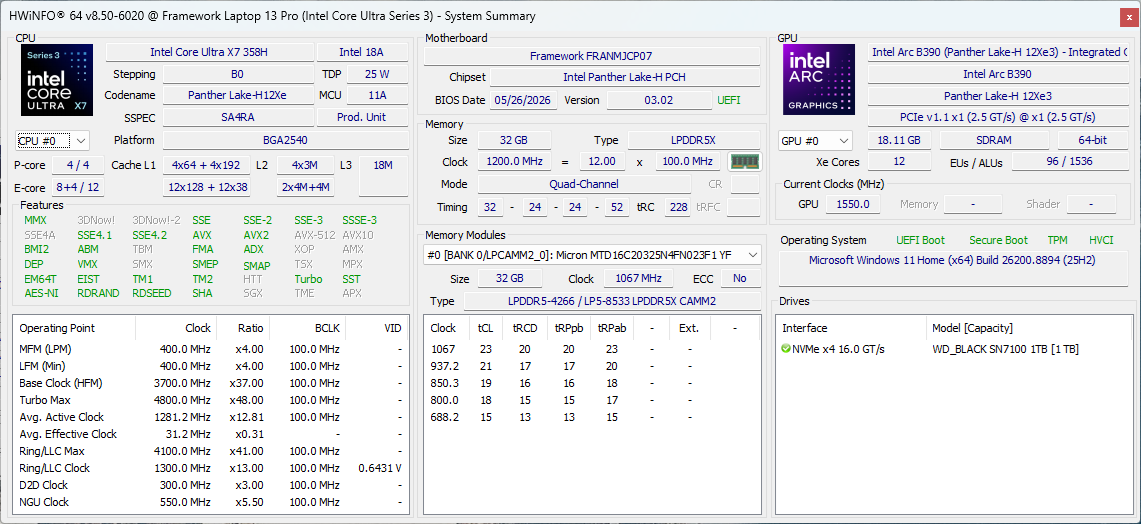
Intel Core Ultra X7 358H 16c/16t, 4 x 4.8 GHz Intel Cougar Cove P-Core, 8 x 3.7 GHz Intel Darkmont E-Core, 4 x 3.3 GHz Intel Darkmont E-Core, 58 W PL2 / Short Burst, 31 W PL1 / Sustained, Panther Lake
Grafikkarte
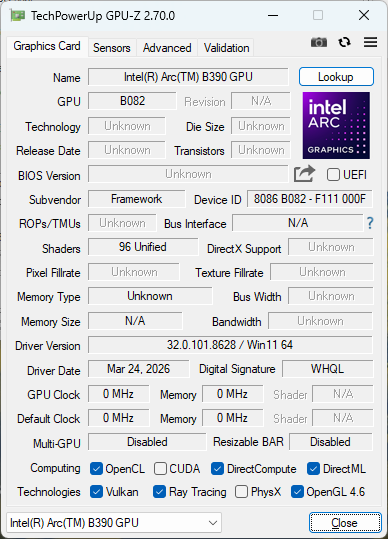
Intel Arc B390 12 Xe3 Panther Lake iGPU, Kerntakt: 1900 MHz, LPDDR5X, 32.0.101.8628
RAM
32 GB 
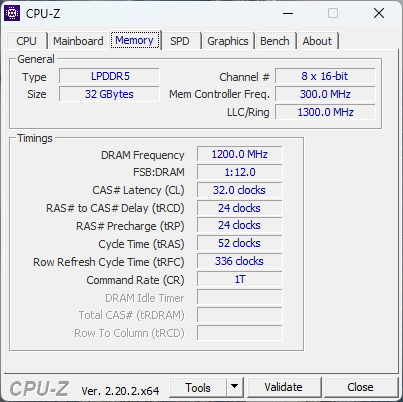
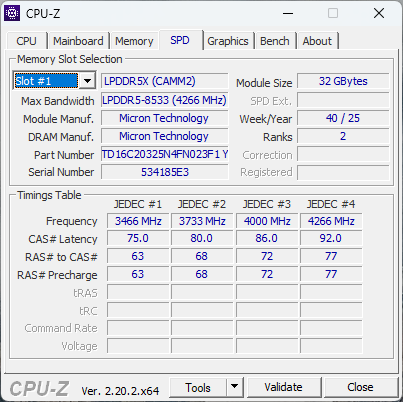
, Micron, LPDDR5-8533, Dual-Channel, LPCAMM2
Bildschirm
13.50 Zoll 3:2, 2880 x 1920 Pixel 256 PPI, 10-point capacitive, MND508ZB1-1, IPS, spiegelnd: nein, 120 Hz
Mainboard
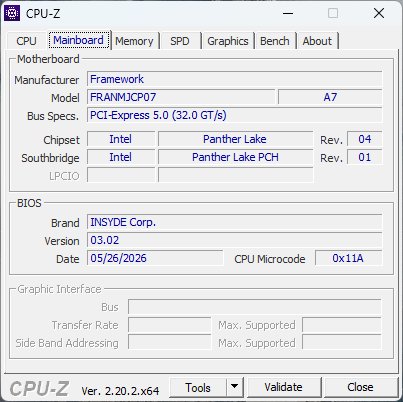
Intel Panther Lake-H PCH
Massenspeicher
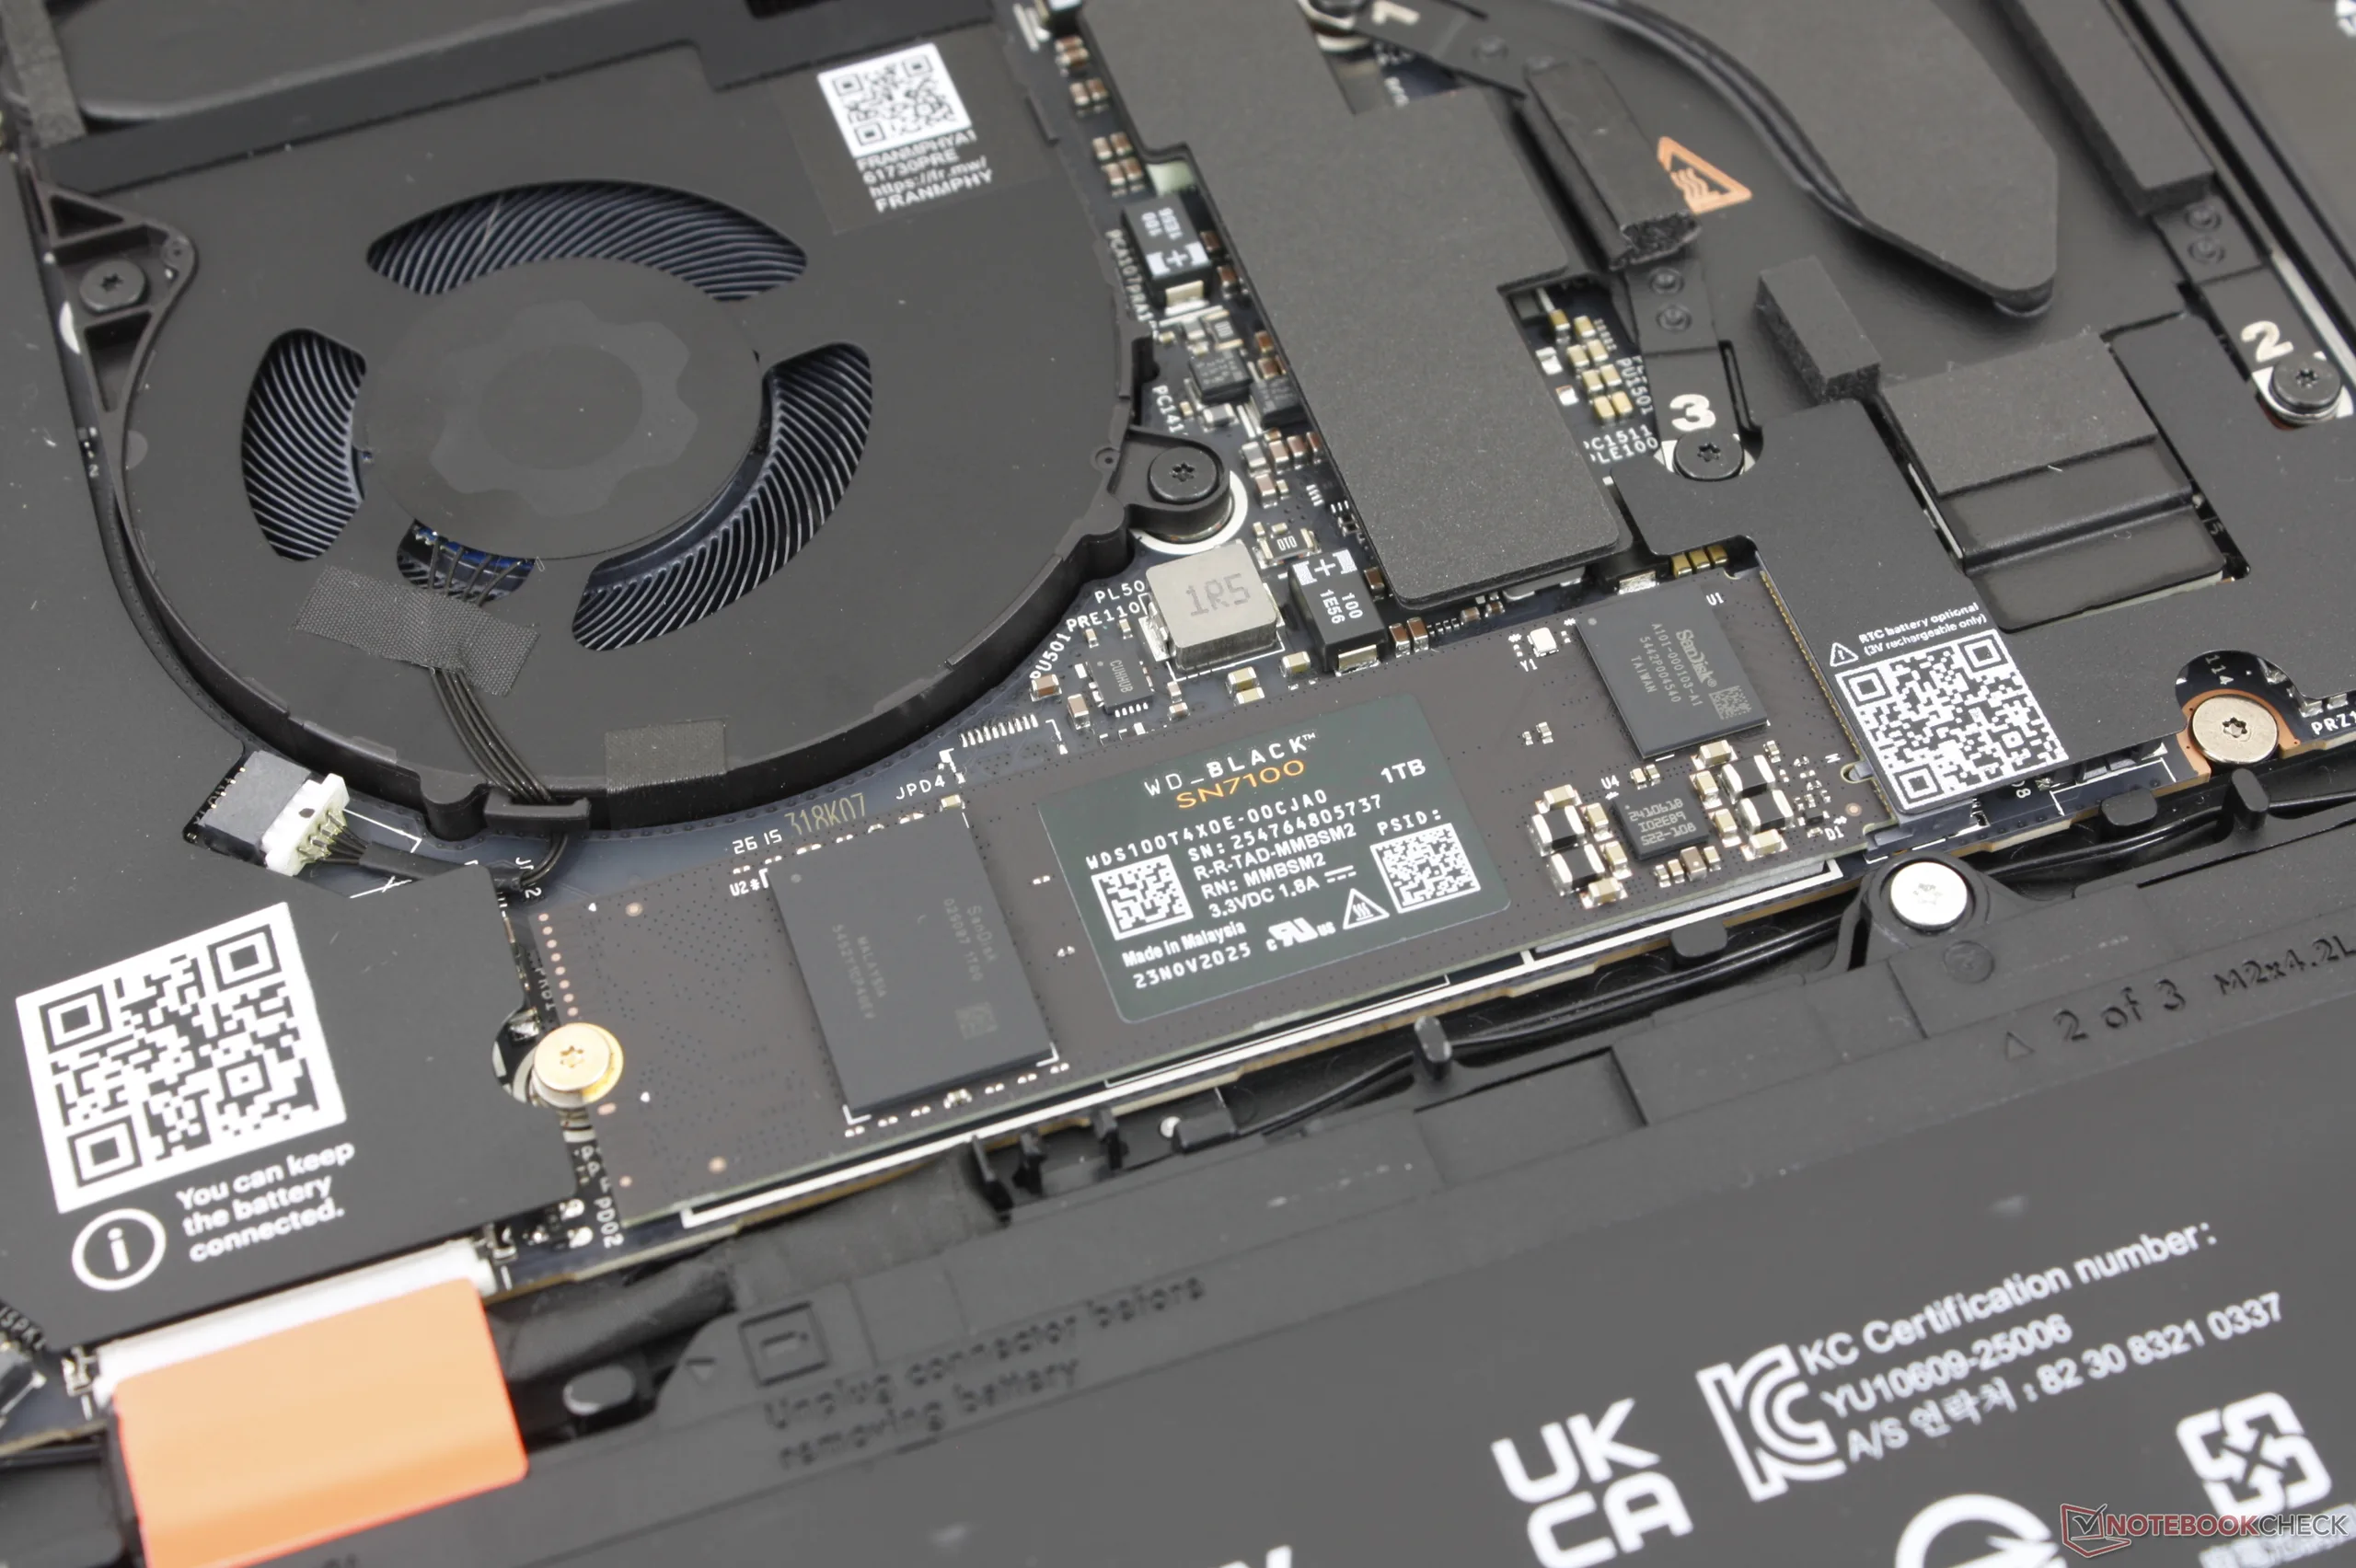
WD PC SN7100S SDFPMSL-1T00-1101, 1024 GB 
Soundkarte
Intel Panther Lake-H PCH - High Definition Audio - AVS (Audio, Voice, Speech)
Anschlüsse
4 Thunderbolt 4, USB-C Power Delivery (PD), 4 DisplayPort, Audio Anschlüsse: 3.5 mm combo, 1 Fingerprint Reader, Helligkeitssensor
Netzwerk
Intel Wi-Fi 7 BE211 320MHz (a/b/g/n = Wi-Fi 4/ac = Wi-Fi 5/ax = Wi-Fi 6/ Wi-Fi 6E 6 GHz be = Wi-Fi 7), Bluetooth 6
Abmessungen
Höhe x Breite x Tiefe (in mm): 15.85 x 296.63 x 228.98
Akku
74.5 Wh Lithium-Polymer
Betriebssystem
Microsoft Windows 11 Pro
Kamera
Webcam: 1080p30
Primary Camera: 9.2 MPix
Sonstiges
Lautsprecher: 2x 2 W stereo, Tastatur: Chiclet, Tastatur-Beleuchtung: ja, Torx screwdriver, 12 Monate Garantie
Gewicht
1.437 kg, Netzteil: 370 g
Preis
3000 USD
Hinweis: Der Hersteller kann abweichende Bauteile wie Bildschirme, Laufwerke und Speicherriegel mit ähnlichen Spezifikationen unter dem gleichen Modellnamen einsetzen.


Gehäuse

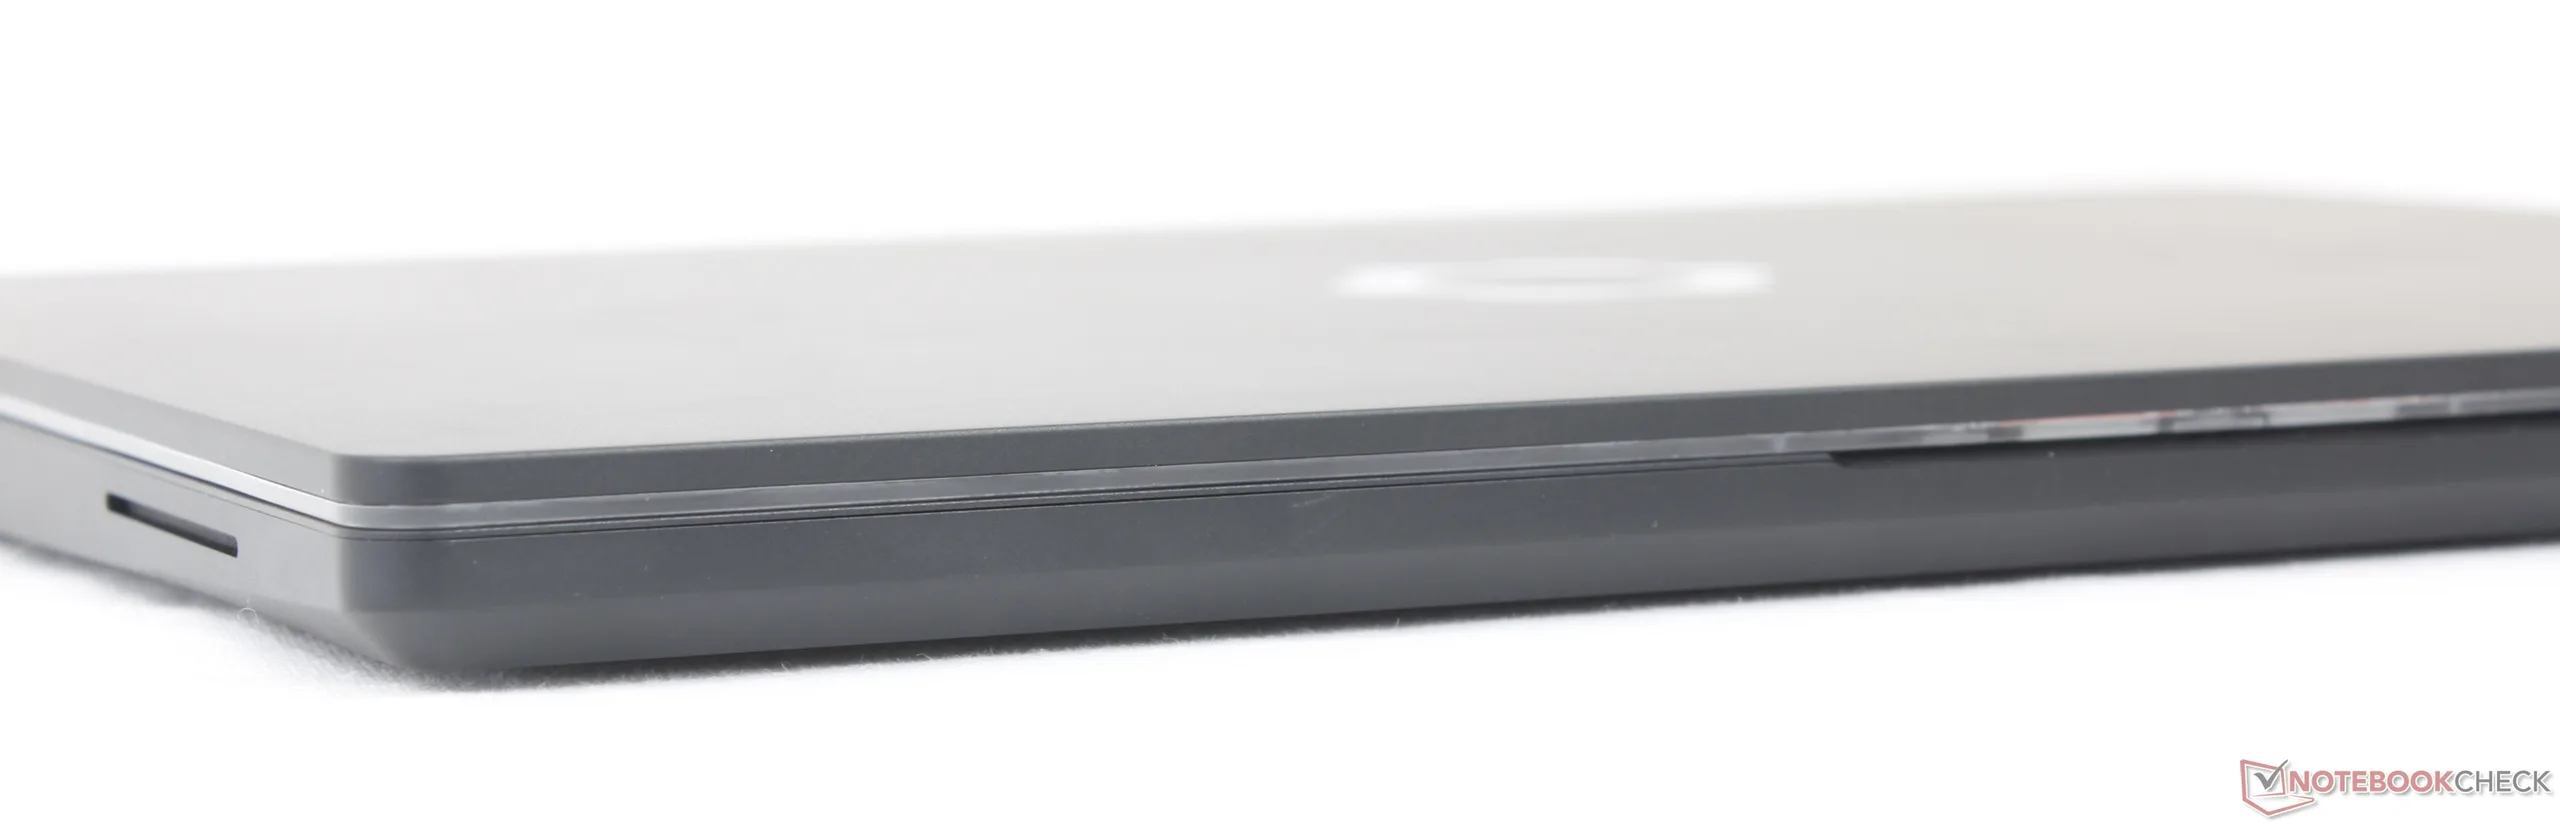
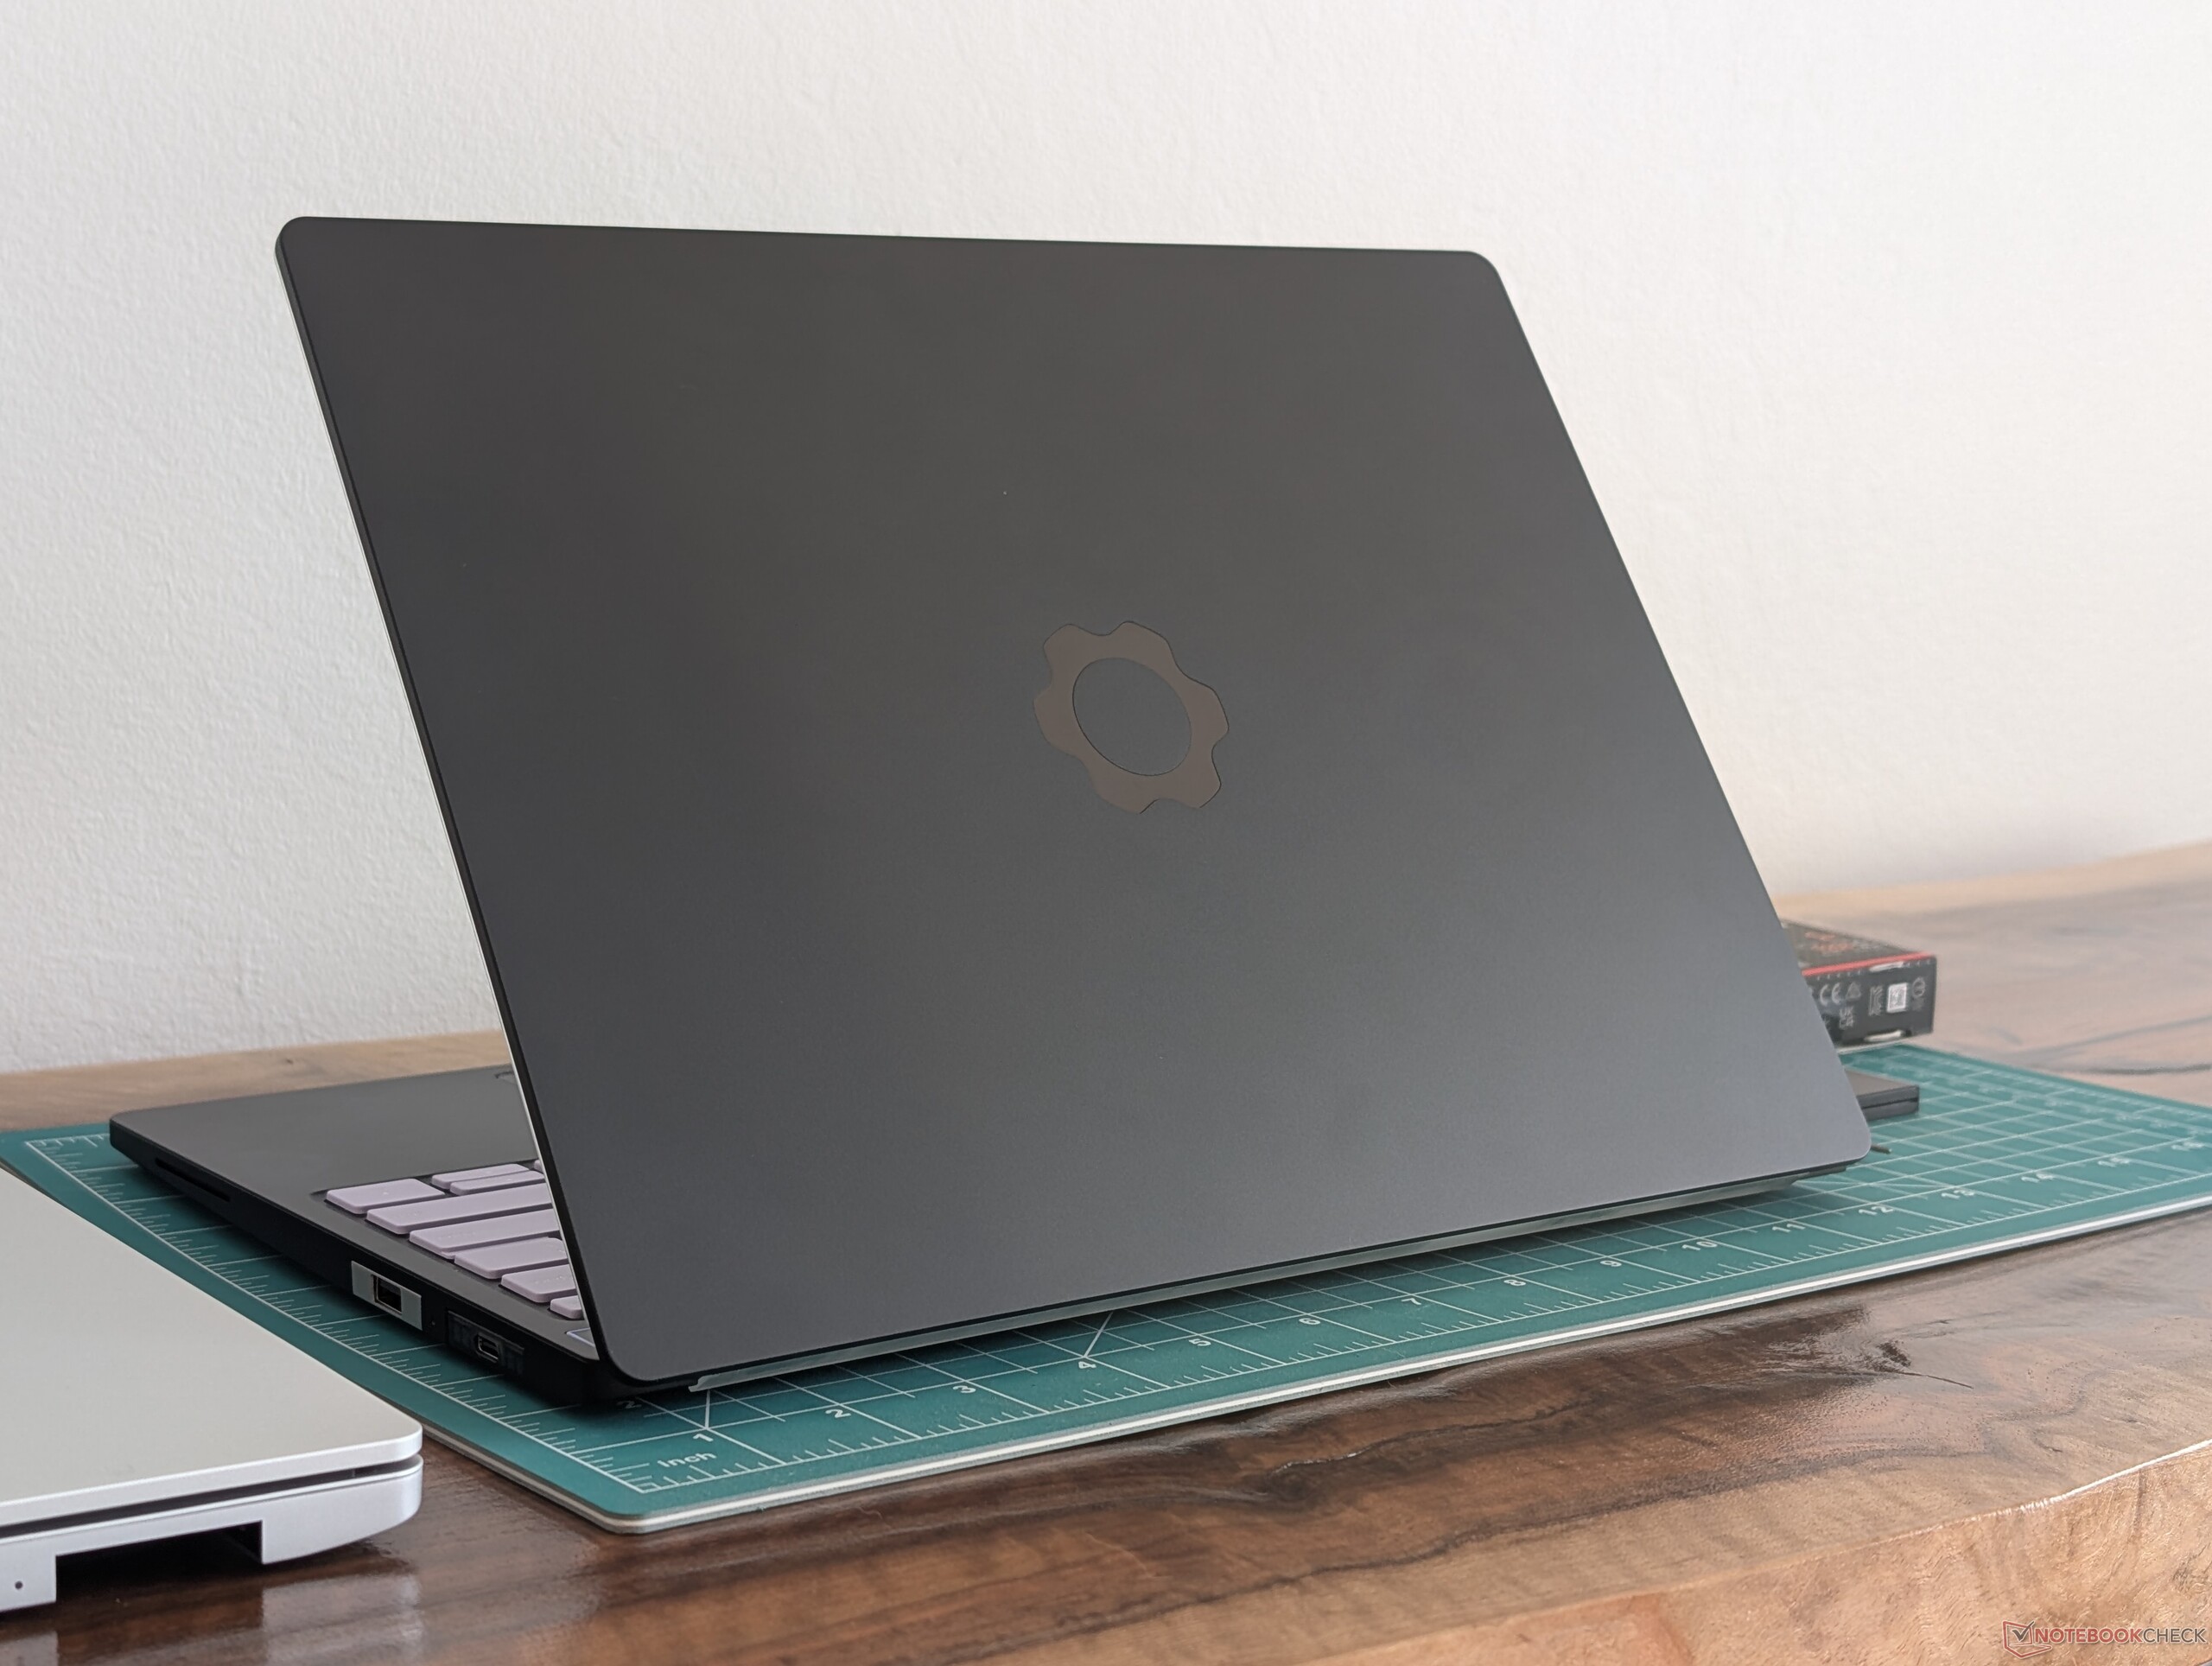
Das neue Gehäuse besteht aus 6063er Aluminium und vermittelt ein deutlich stabileres und steiferes Gefühl als der ursprüngliche Laptop 13,5, ohne dass die Dicke erhöht werden musste. Zu beachten ist jedoch, dass das neue Modell ebenfalls etwas schwerer ist als der Laptop 13,5.

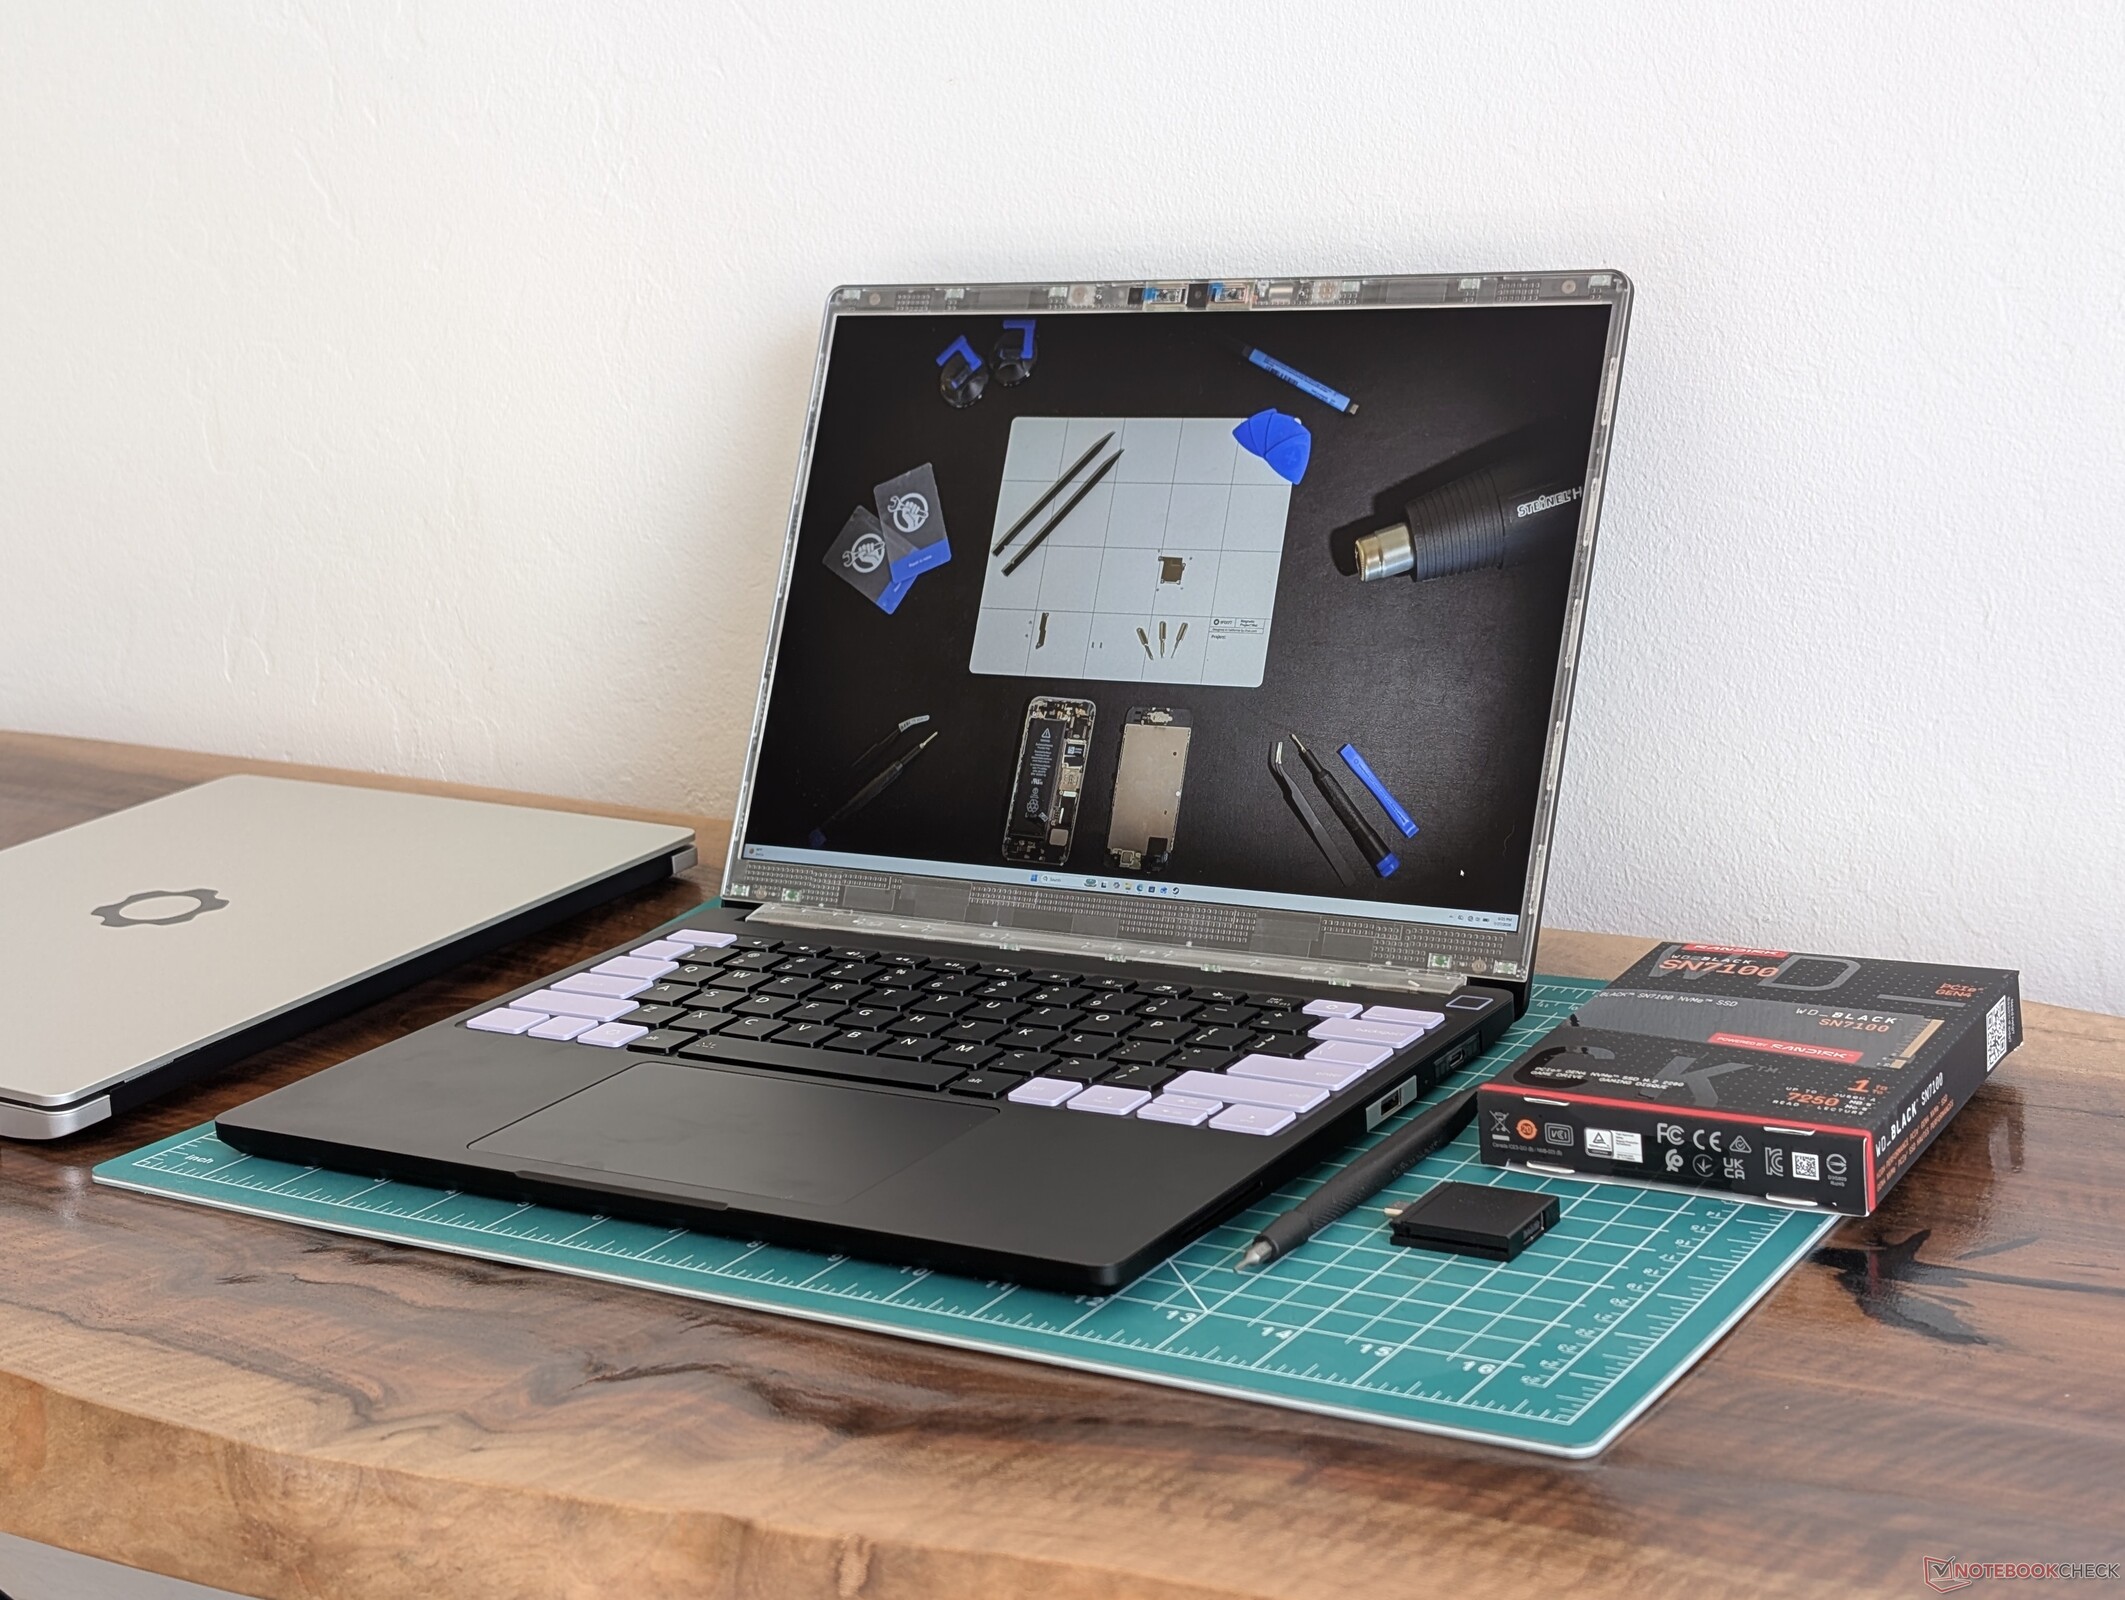
Unser Testgerät wurde mit einem durchsichtigen Kunststoffrahmen und einer lavendelfarbenen Tastatur ausgestattet.
Größenvergleich

310.9 mm 212.8 mm 15.9 mm 1.1 kg309.52 mm 209.71 mm 14.62 mm 1.4 kg301 mm 220 mm 17.5 mm 1.3 kg299 mm 210 mm 15.9 mm 888 g296.63 mm 228.98 mm 15.85 mm 1.4 kg296.63 mm 228.98 mm 15.85 mm 1.3 kg297 mm 210 mm 1 mm 5.7 g

Anschlussausstattung

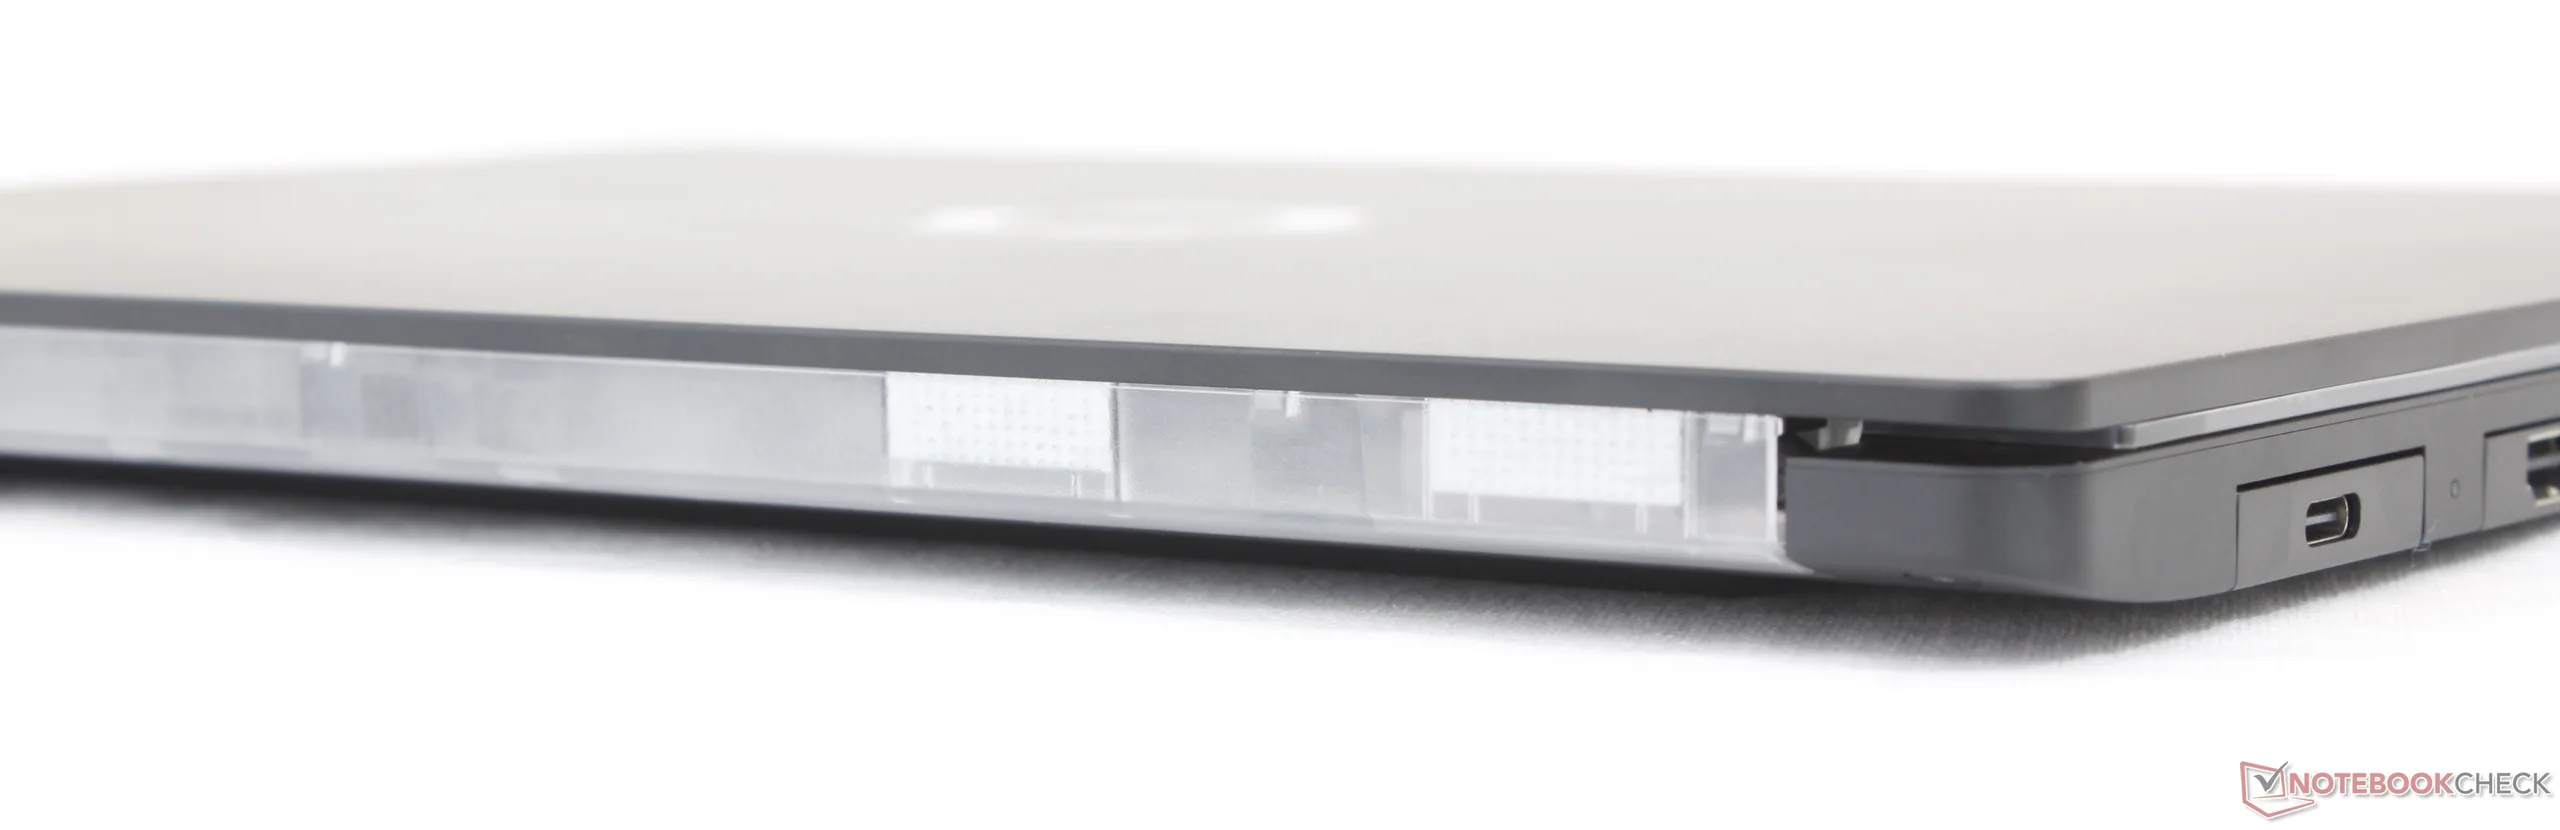
Vorderseite: keine Anschlüsse
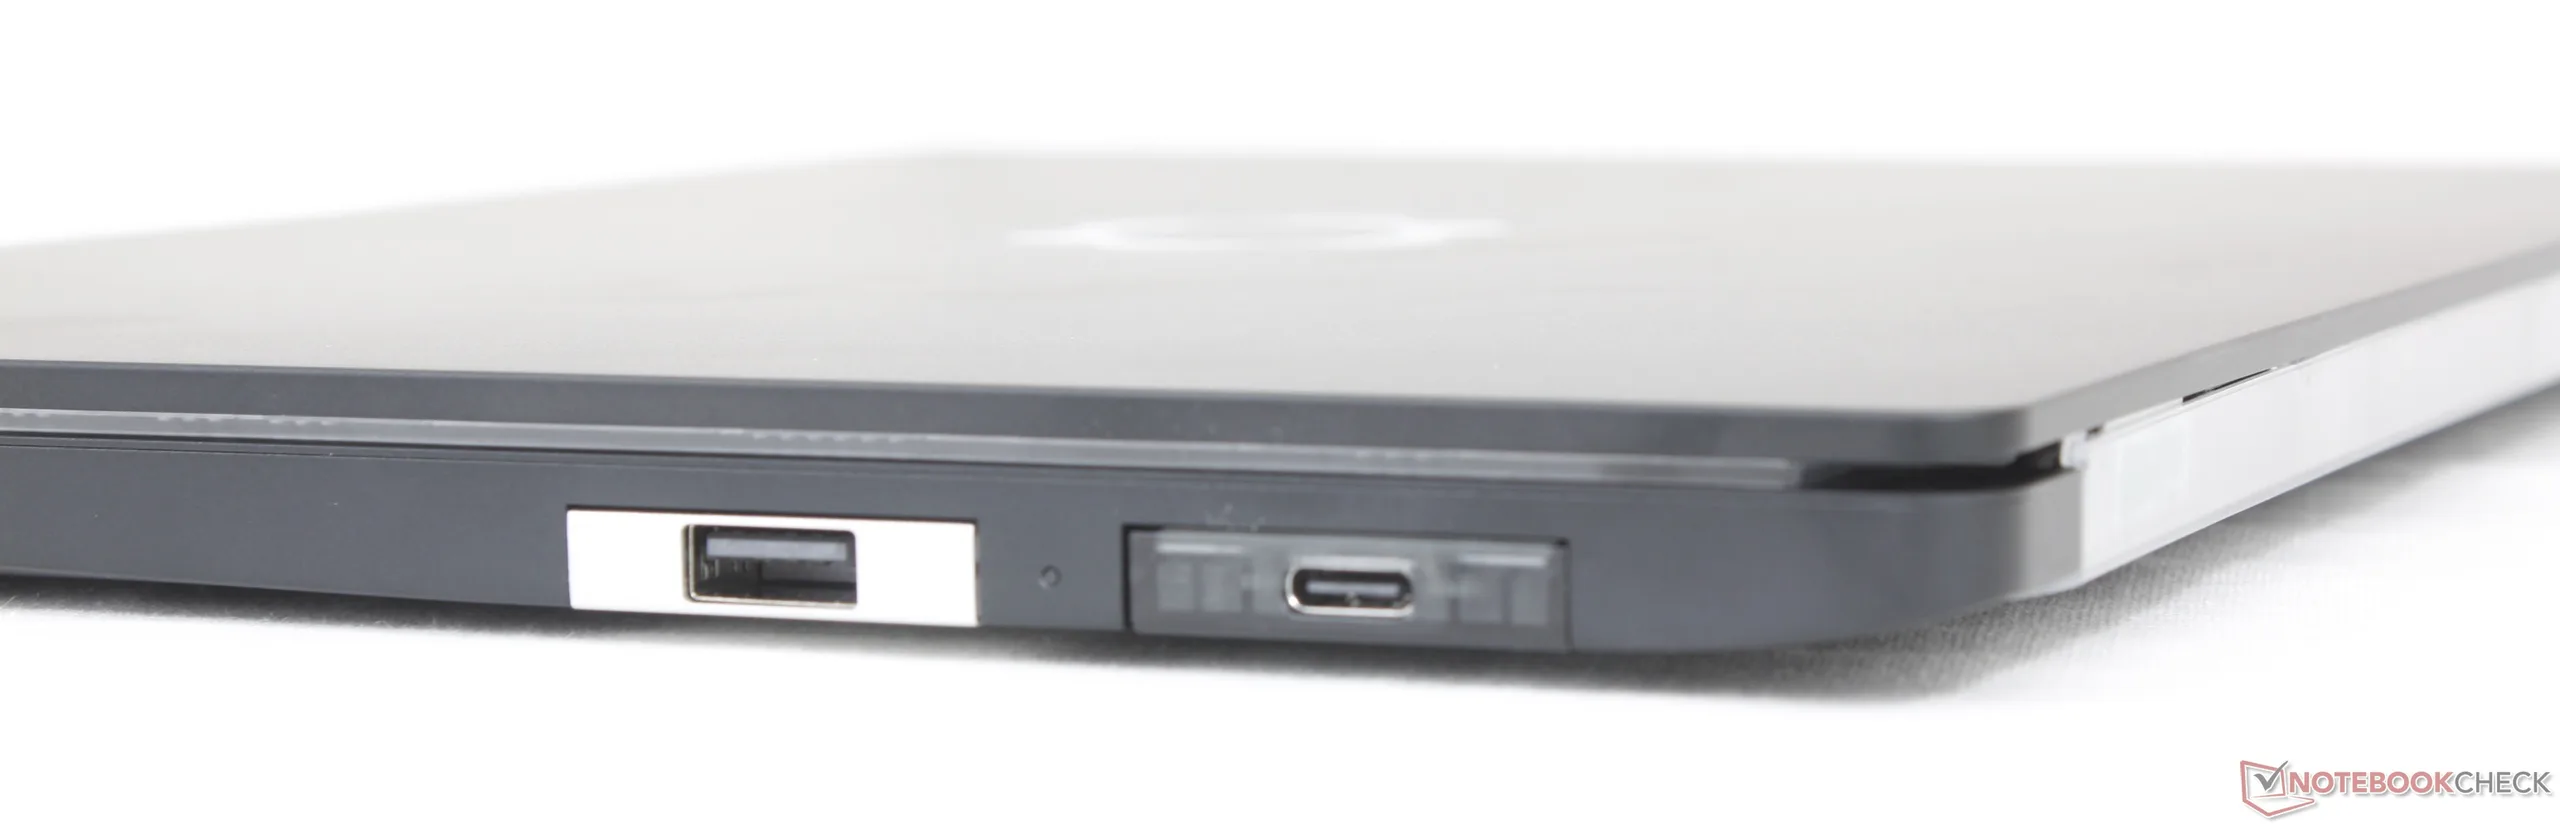
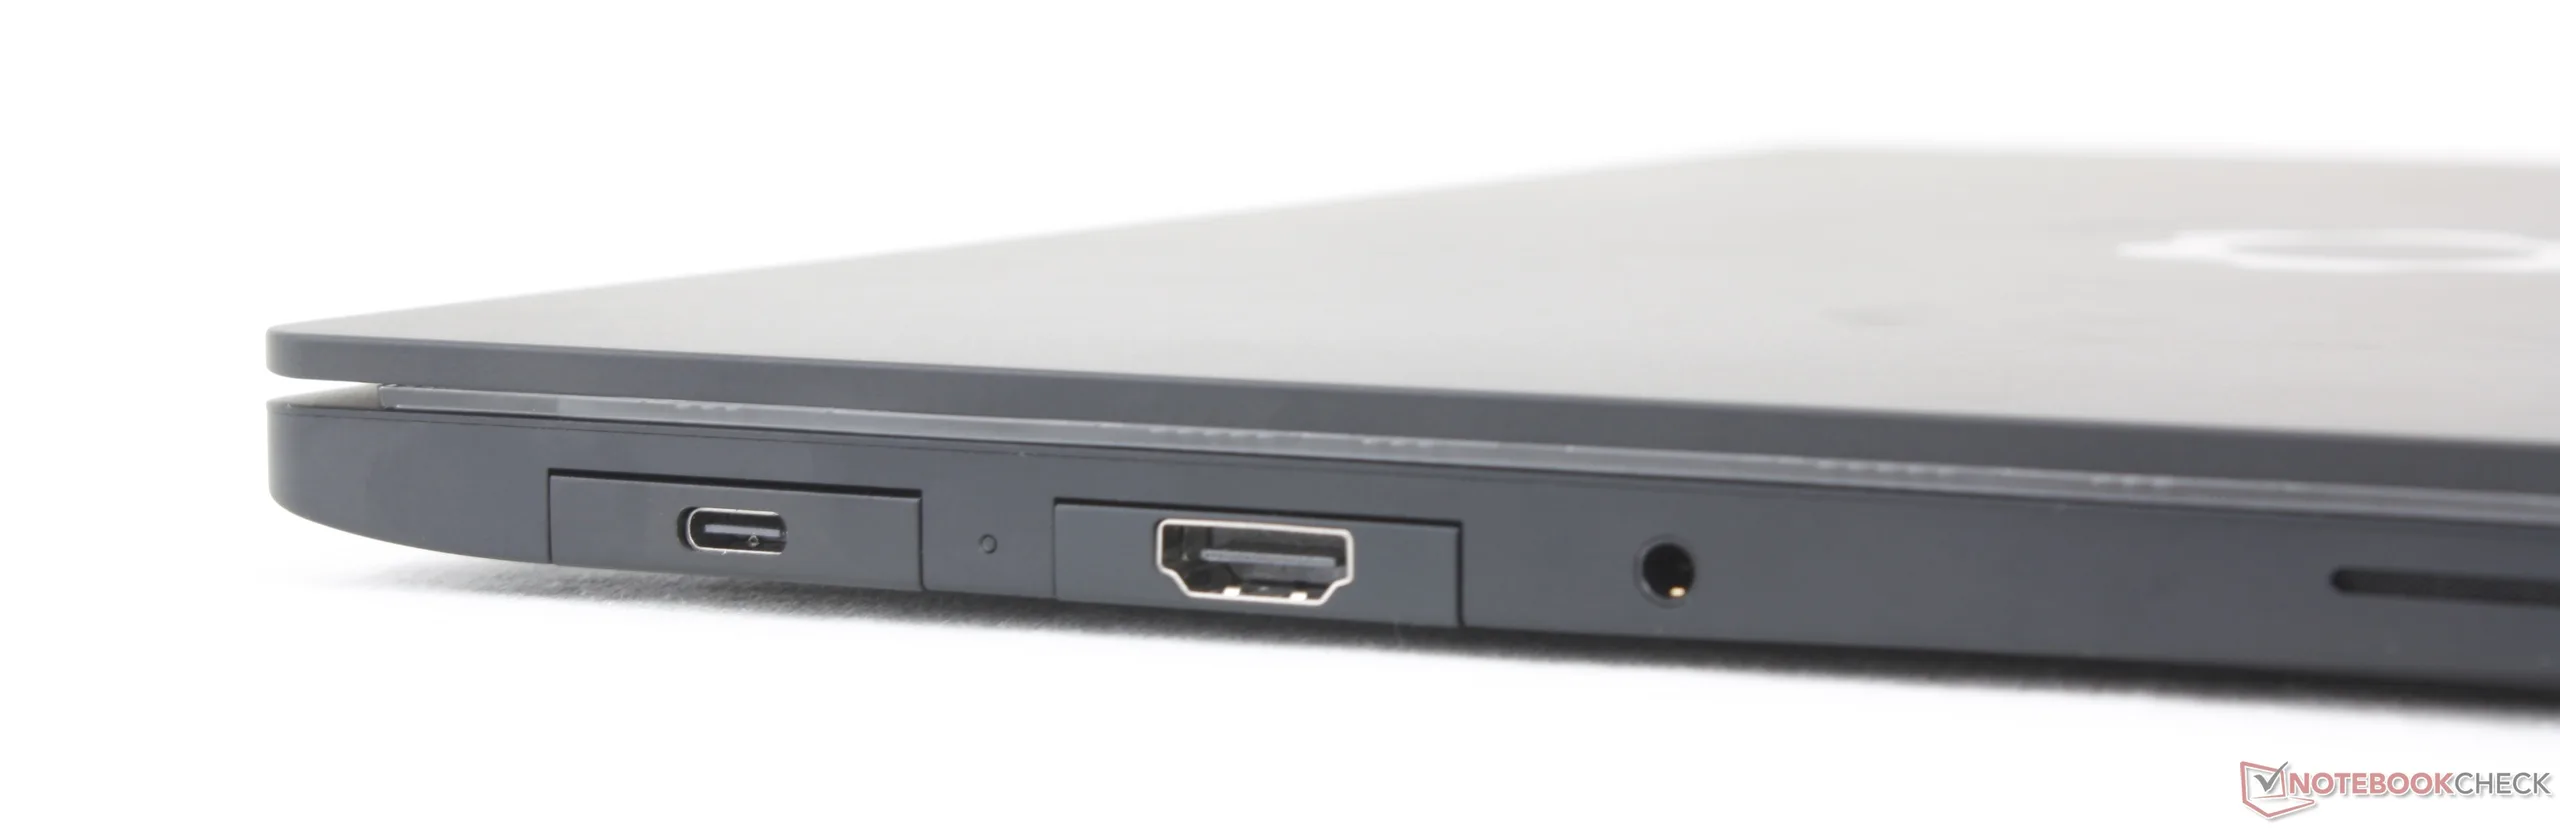
Rechts: 2x USB-C Thunderbolt 4 mit DisplayPort 2.1 + Power Delivery mit 140 W
Rückseite: keine Anschlüsse
Links: 2x USB-C Thunderbolt 4 mit DisplayPort 2.1 + Power Delivery mit 140 W, 3,5-mm-Headset-Anschluss

Kommunikation

Networking
iperf3 transmit Wi-Fi6/7 RT-BE96U
Microsoft Surface Laptop 8 13.8
Qualcomm FastConnect 7800
3656 (3471min - 3828max) MBit/s
MSI Prestige 13 AI+ A3MG
Intel® Killer™ Wi-Fi 7 BE1775s
2156 (1157min - 2458max) MBit/s
iperf3 receive Wi-Fi6/7 RT-BE96U
Microsoft Surface Laptop 8 13.8
Qualcomm FastConnect 7800
3088 (2889min - 3217max) MBit/s
MSI Prestige 13 AI+ A3MG
Intel® Killer™ Wi-Fi 7 BE1775s
2236 (2052min - 2301max) MBit/s
iperf3 receive AXE11000 6GHz
Dell XPS 14 Core Ultra X7 358H
Intel Wi-Fi 7 BE211 320MHz
1740 (1711min - 1757max) MBit/s +6%
Framework Laptop 13 Pro
Intel Wi-Fi 7 BE211 320MHz
1638 (1617min - 1668max) MBit/s
Asus ExpertBook Ultra B9406CAA
Intel Wi-Fi 7 BE211 320MHz
1621 (1600min - 1650max) MBit/s -1%
Framework Laptop 13.5 Ryzen AI 9 HX 370
Mediatek RZ717 WiFi 7 160 MHz
1260 (1195min - 1293max) MBit/s -23%
iperf3 transmit AXE11000 6GHz
Asus ExpertBook Ultra B9406CAA
Intel Wi-Fi 7 BE211 320MHz
1625 (848min - 1675max) MBit/s 0%
Framework Laptop 13 Pro
Intel Wi-Fi 7 BE211 320MHz
1620 (1502min - 1685max) MBit/s
Dell XPS 14 Core Ultra X7 358H
Intel Wi-Fi 7 BE211 320MHz
1440 (1053min - 1526max) MBit/s -11%
Framework Laptop 13.5 Ryzen AI 9 HX 370
Mediatek RZ717 WiFi 7 160 MHz
1019 (975min - 1053max) MBit/s -37%
01002003004005006007008009001000110012001300140015001600Tooltip
Framework Laptop 13 Pro; iperf3 receive AXE11000 6GHz; iperf 3.1.3: Ø1637 (1617-1668) MBit/s
Framework Laptop 13 Pro; iperf3 transmit AXE11000 6GHz; iperf 3.1.3: Ø1620 (1502-1685) MBit/s

Webcam

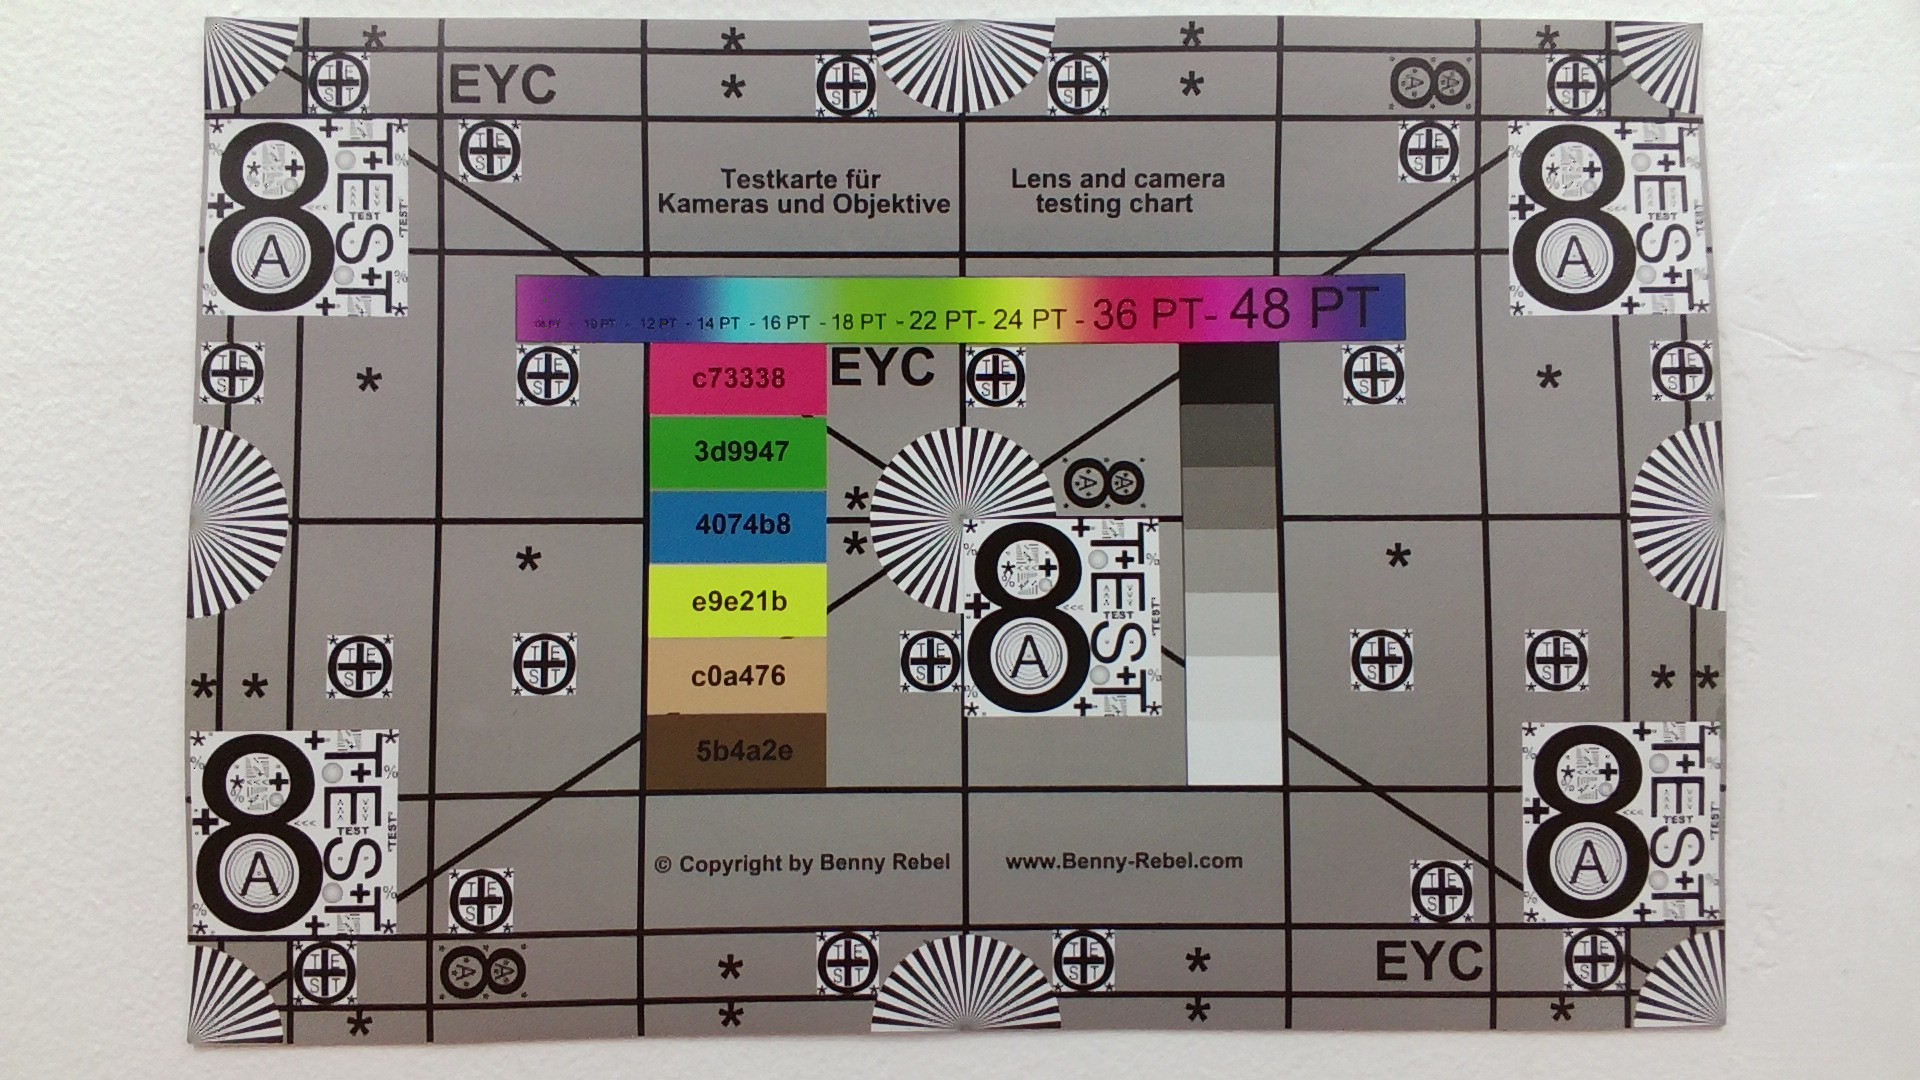
Obwohl Framework mit einem 9,2-MP-Sensor wirbt, erreicht unsere Webcam selbst nach der Installation der neuesten offiziellen Treiber des Herstellers lediglich 2,1 MP.

Sowohl ein IR-Sensor als auch ein physischer Verschluss gehören zur Standardausstattung.

ColorChecker
10.3 ∆E
10.5 ∆E
14.4 ∆E
11.3 ∆E
10.5 ∆E
9.4 ∆E
23 ∆E
4.7 ∆E
13 ∆E
4.4 ∆E
8.6 ∆E
14.9 ∆E
7.8 ∆E
11.5 ∆E
15.3 ∆E
9.8 ∆E
4.8 ∆E
16 ∆E
8.4 ∆E
2.5 ∆E
6.6 ∆E
6.1 ∆E
1.9 ∆E
3.9 ∆E
ColorChecker Framework Laptop 13 Pro: 9.56 ∆E min: 1.92 - max: 22.98 ∆E

Zubehör

Die bekannten Erweiterungskarten kehren zurück, ergänzt durch Neuheiten wie 10-Gbit/s-RJ-45, HDMI 2.0b sowie zusätzliche Farben für das Gehäuse und die Tastatur.

Wartung

Die offizielle Demontageanleitung für den Framework Laptop 13 Pro finden Sie hier.
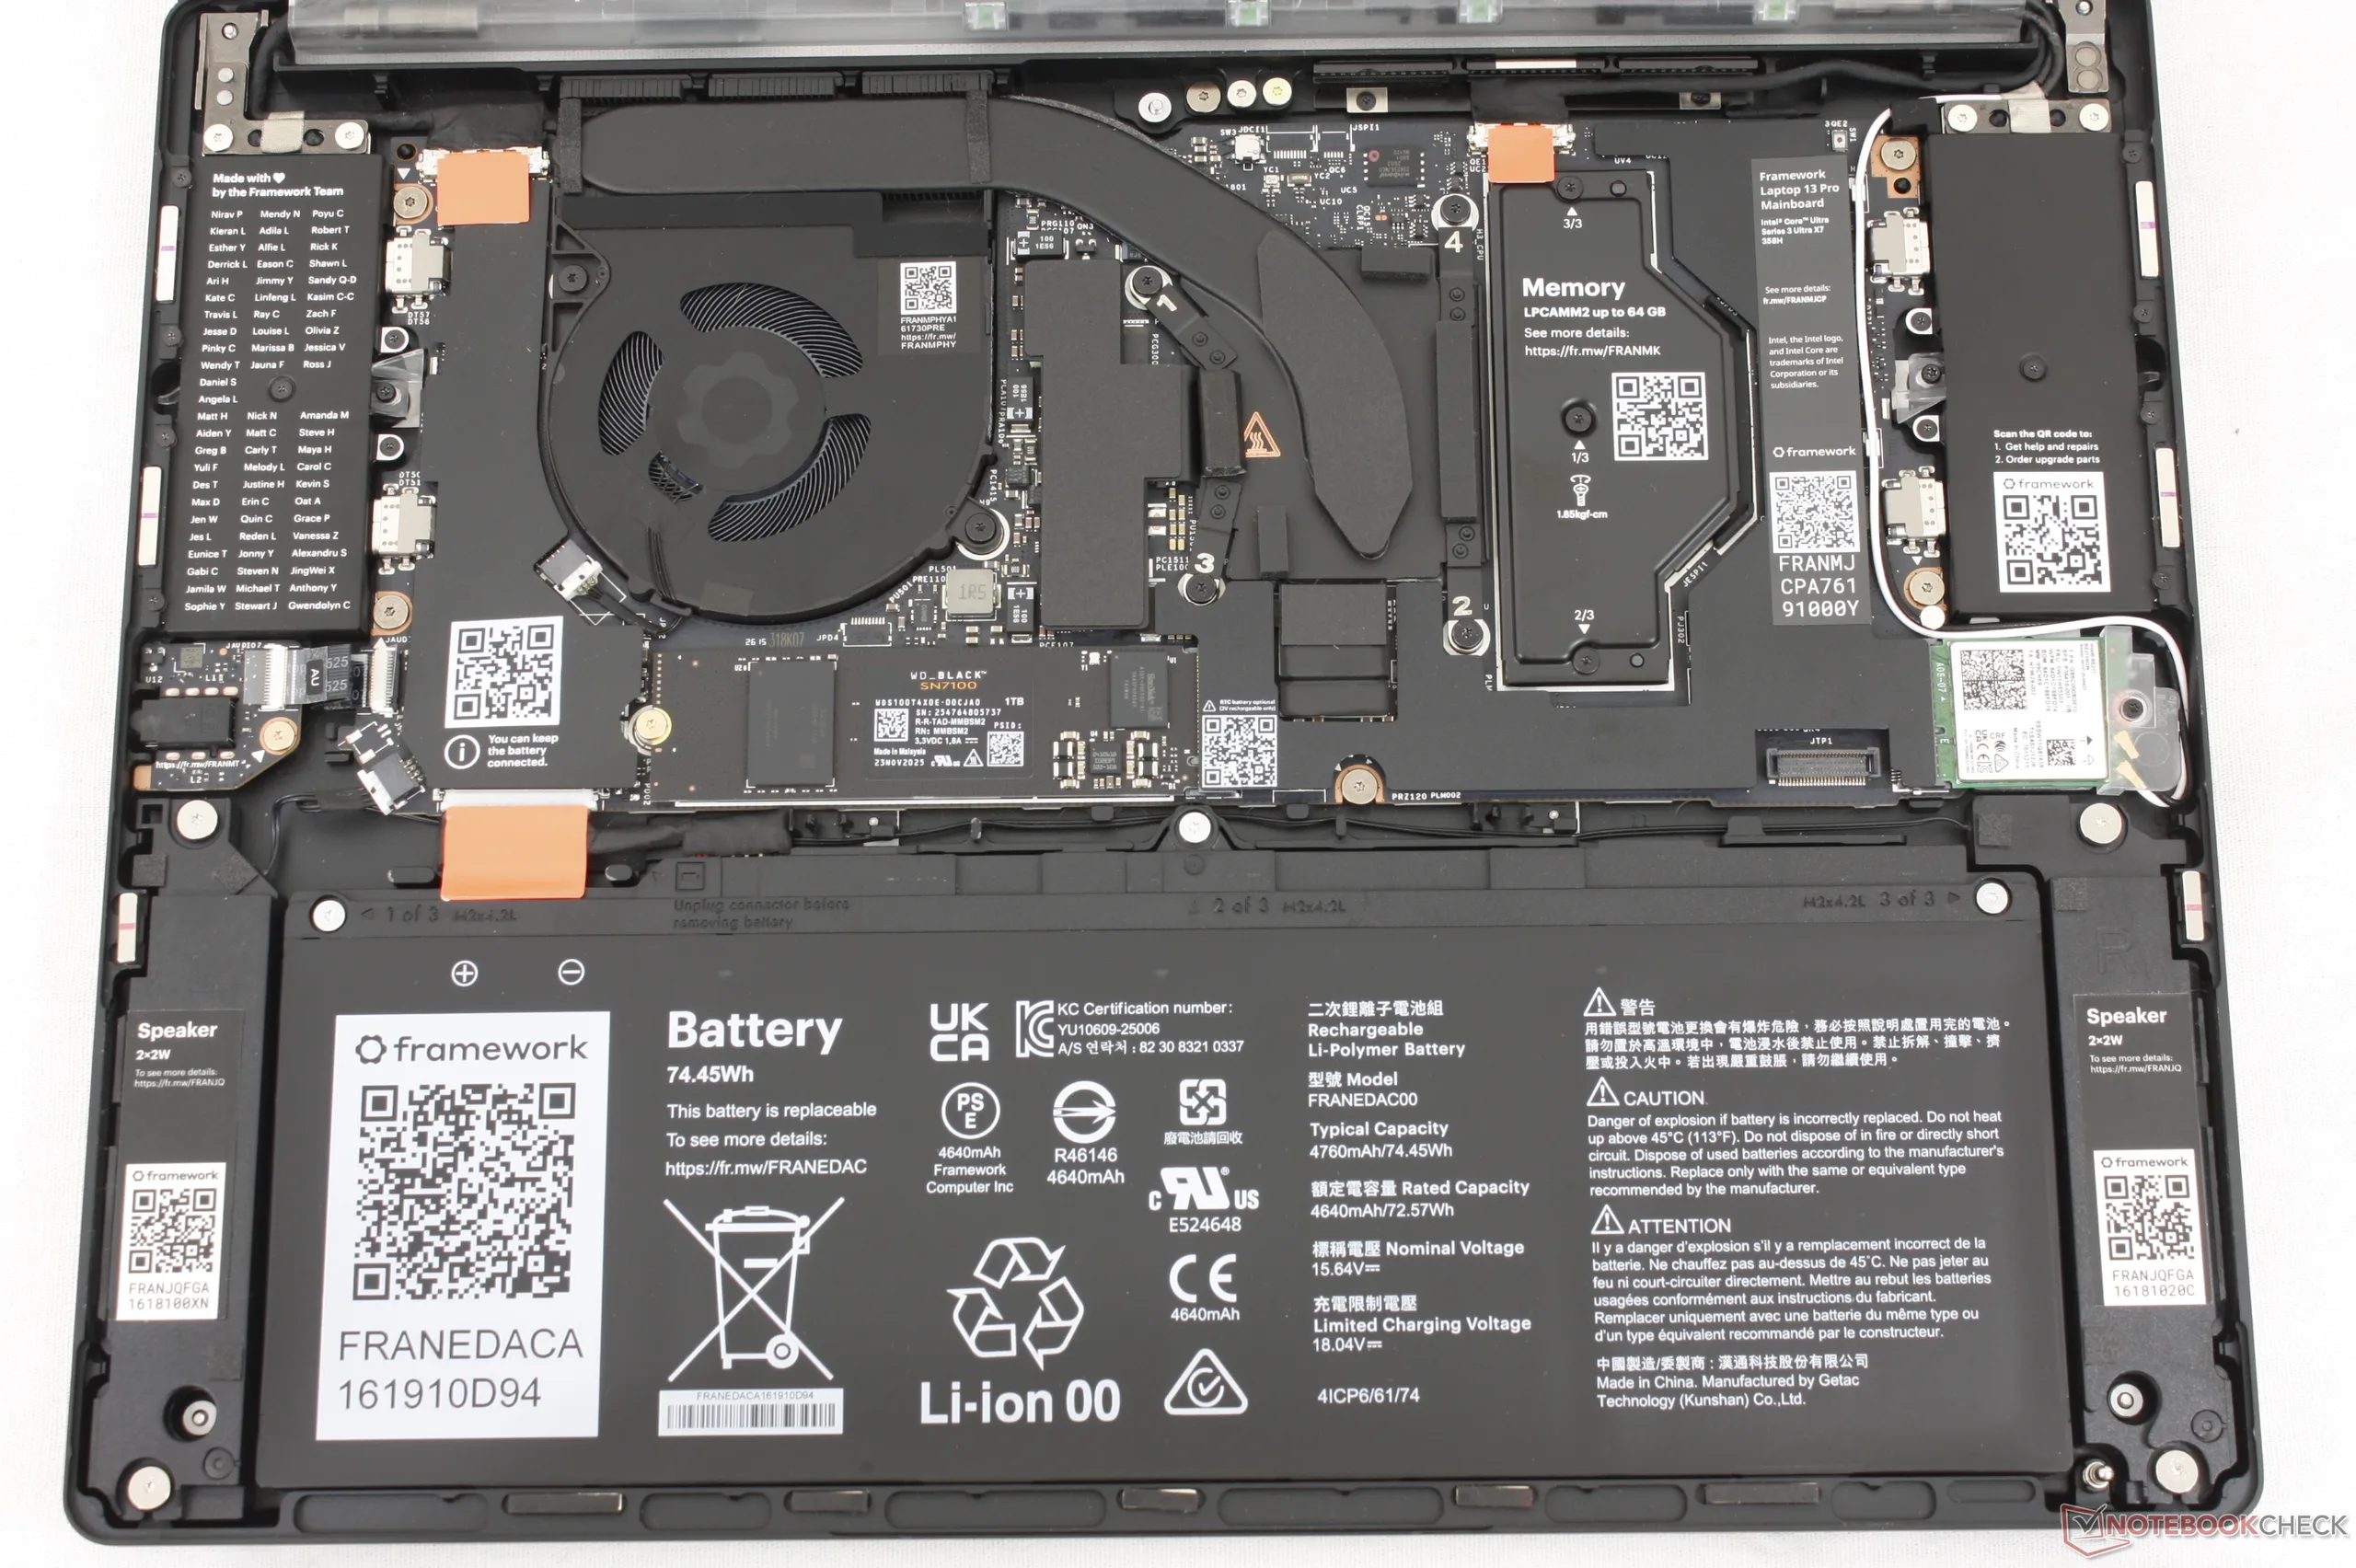
Laptop 13 Pro
Laptop 13 Pro
Laptop 13,5 zum Vergleich

Nachhaltigkeit

Das Gehäuse besteht zu bis zu 75 Prozent aus vorverbrauchsbedingtem (nicht aus postverbrauchsbedingtem) recyceltem Aluminium und verfügt über eine zu 100 % recycelbare Verpackung. Allerdings werden in der Verpackung zum Schutz weiterhin einige Kunststoffplatten verwendet.

Es sei darauf hingewiesen, dass das Motherboard des älteren Laptop 13,5 physisch in das neue Gehäuse des Laptop 13 Pro eingebaut werden kann, falls bestehende Besitzer ein Upgrade vornehmen möchten.

Garantie

Beim Kauf in den USA gilt standardmäßig eine einjährige beschränkte Herstellergarantie.

Eingabegeräte
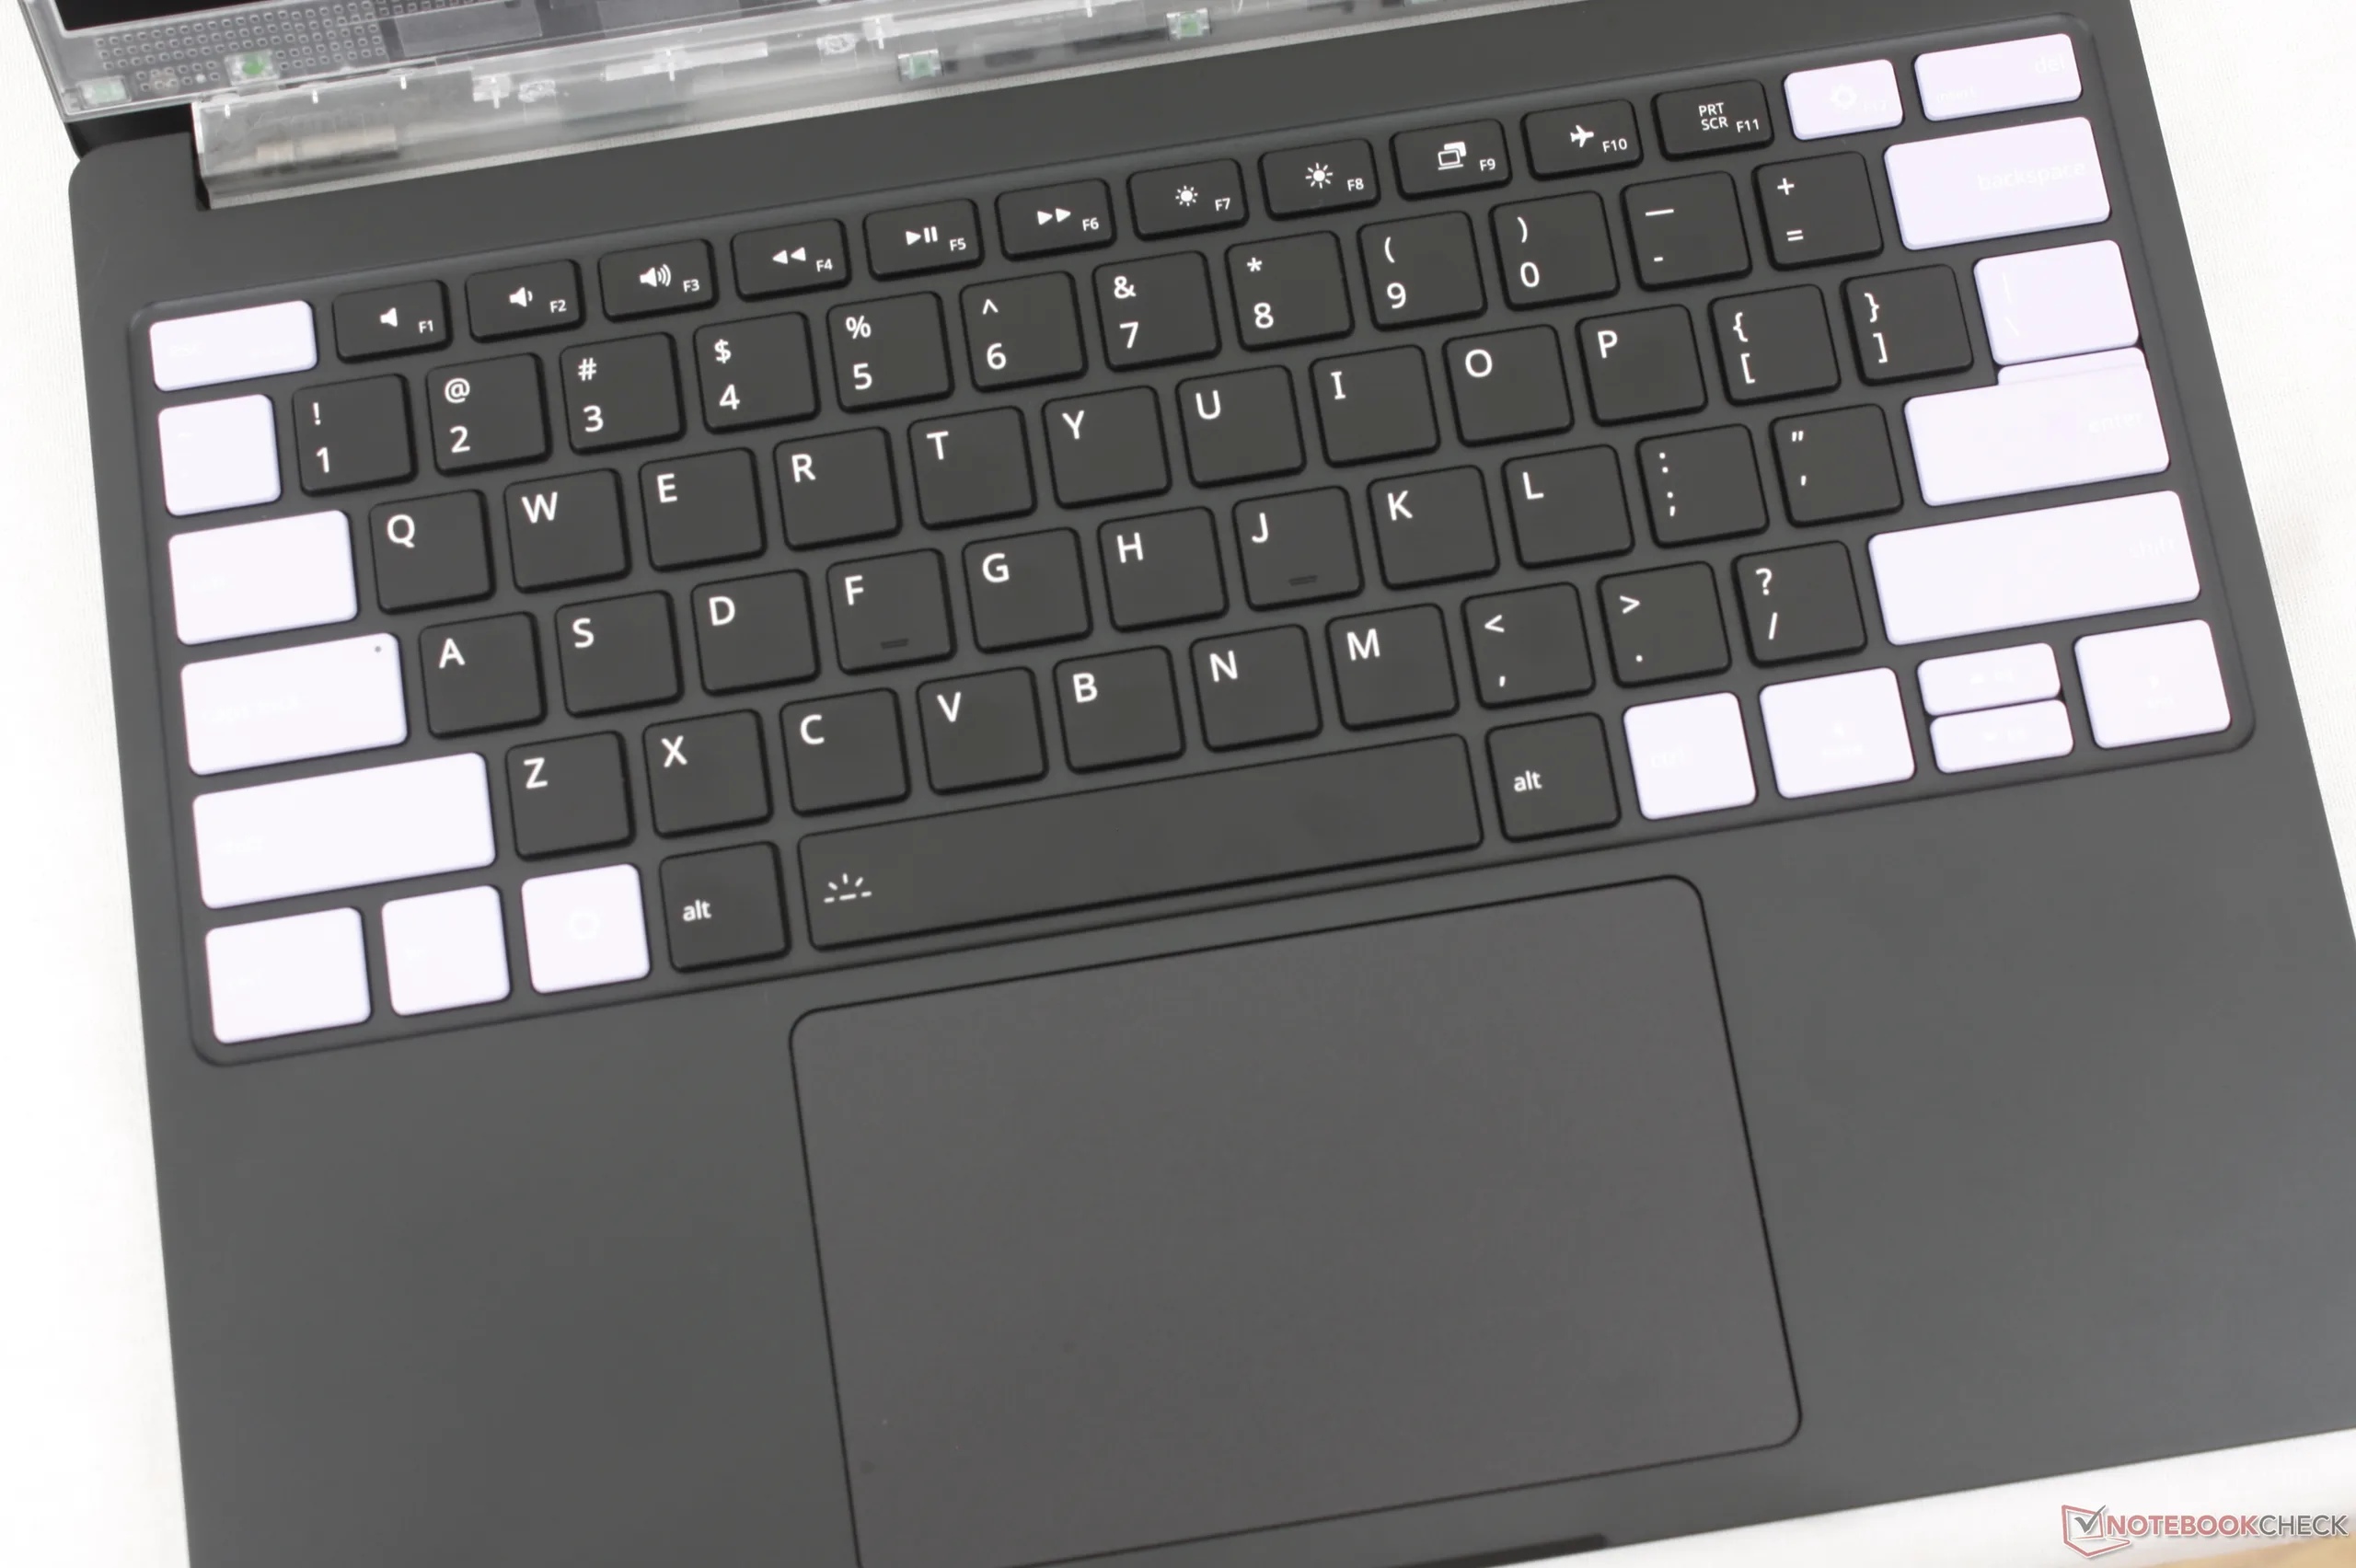
Komfortable Tasten mit 1,5 mm Tastenhub und großzügigem (12,37 x 7,67 cm) Clickpad

Display

Das neue IPS-Display bietet dieselbe native Auflösung, sRGB-Farbraum, Schwarz-Weiß-Reaktionszeiten und eine Bildwiederholfrequenz von 120 Hz wie das Display des älteren Laptop 13,5 und sorgt so für ein sehr ähnliches Seherlebnis. Darüber hinaus verfügt es über einige neue Zusatzfunktionen, darunter eine hellere Hintergrundbeleuchtung, VRR bis hinunter zu 30 Hz und Touchscreen-Unterstützung.
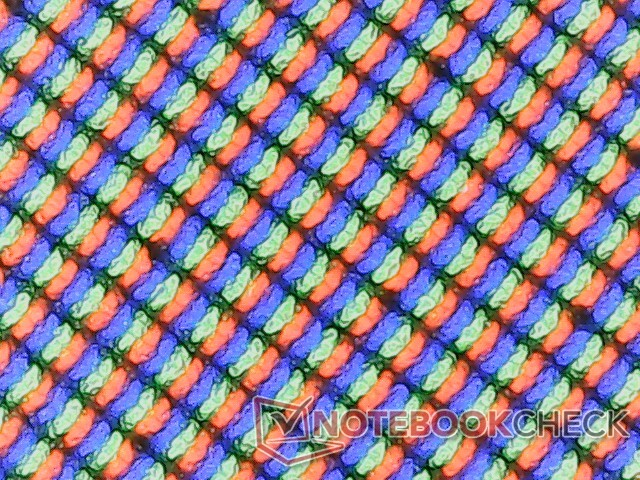

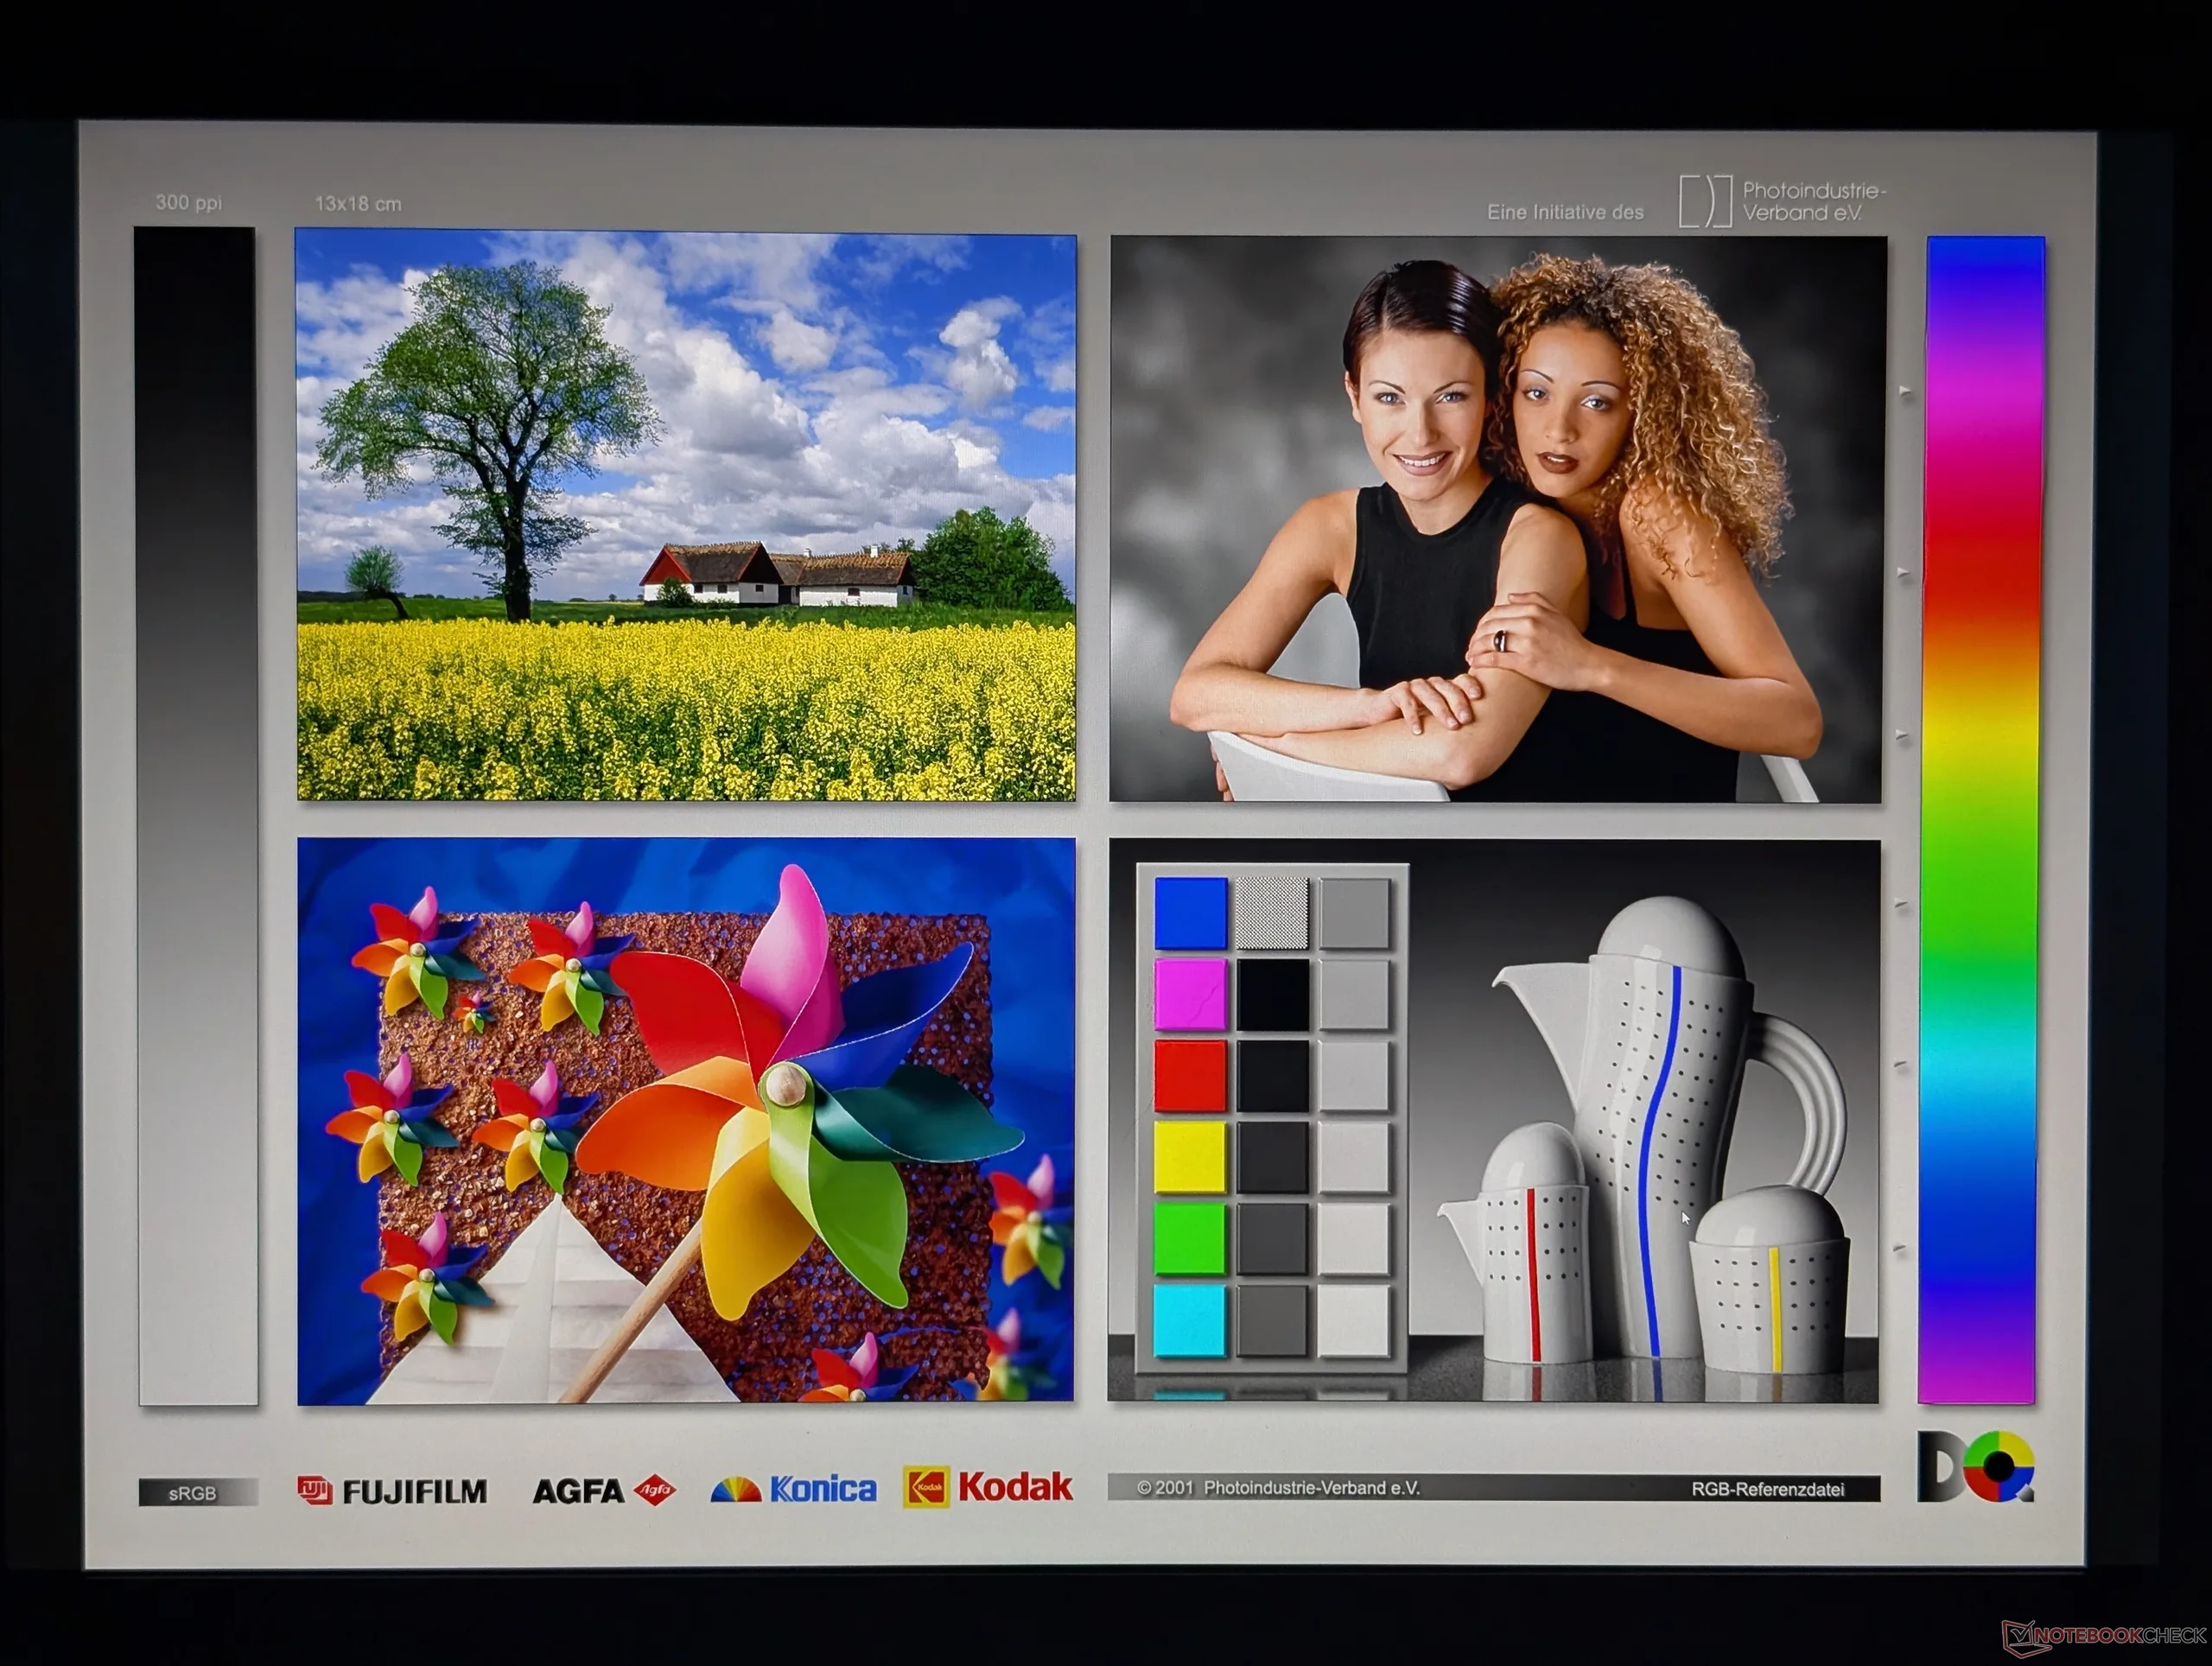
Eine matte Beschichtung ist etwas körniger als eine glänzende Variante.
Leichtes bis mäßiges ungleichmäßiges Backlight-Bleeding an den Ecken
765.1
cd/m²
738.8
cd/m²
769.2
cd/m²
676.5
cd/m²
773.3
cd/m²
688.8
cd/m²
693.7
cd/m²
702.6
cd/m²
692.1
cd/m²
Ausleuchtung des Bildschirms
MND508ZB1-1 getestet mit X-Rite i1Pro 3
Maximal: 773.3 cd/m² (Nits) Durchschnitt: 722.2 cd/m² Minimum: 7 cd/m²
Ausleuchtung: 87 %
Helligkeit Akku: 773.3 cd/m²
Kontrast: 2148:1 (Schwarzwert: 0.36 cd/m²)
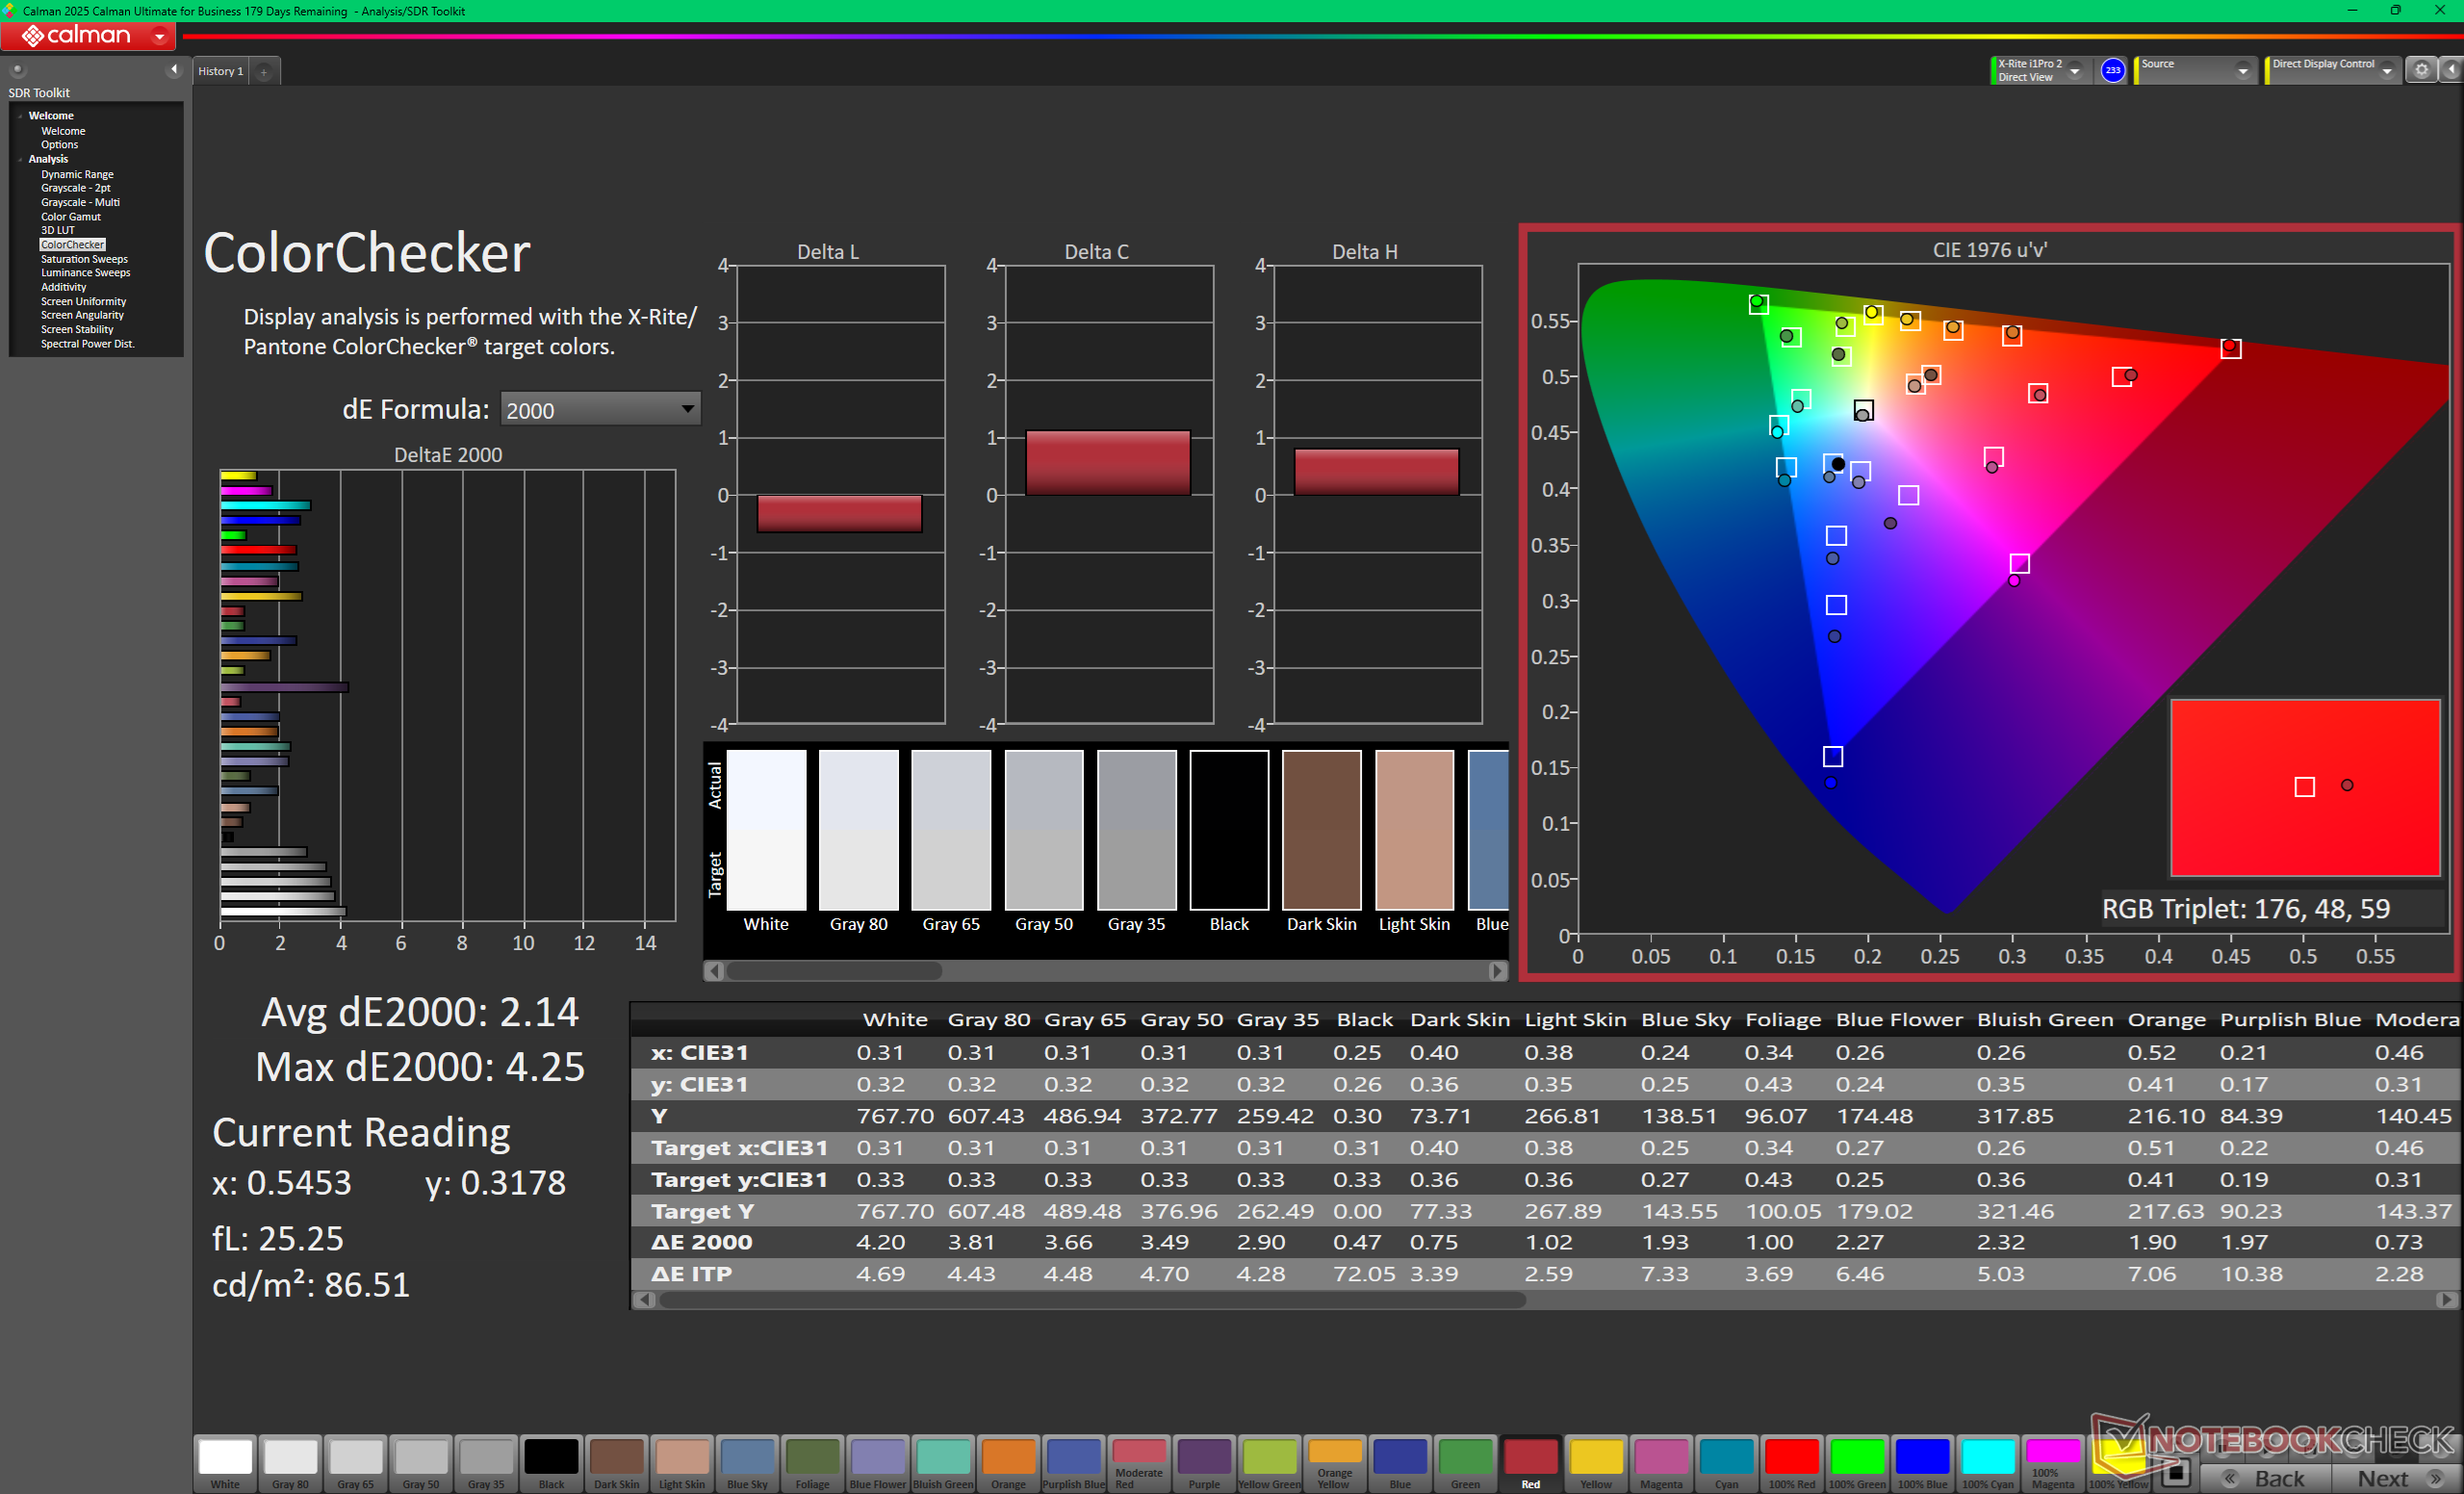
ΔE ColorChecker Calman: 2.14 | ∀{0.5-29.43 Ø4.71}
calibrated: 0.61
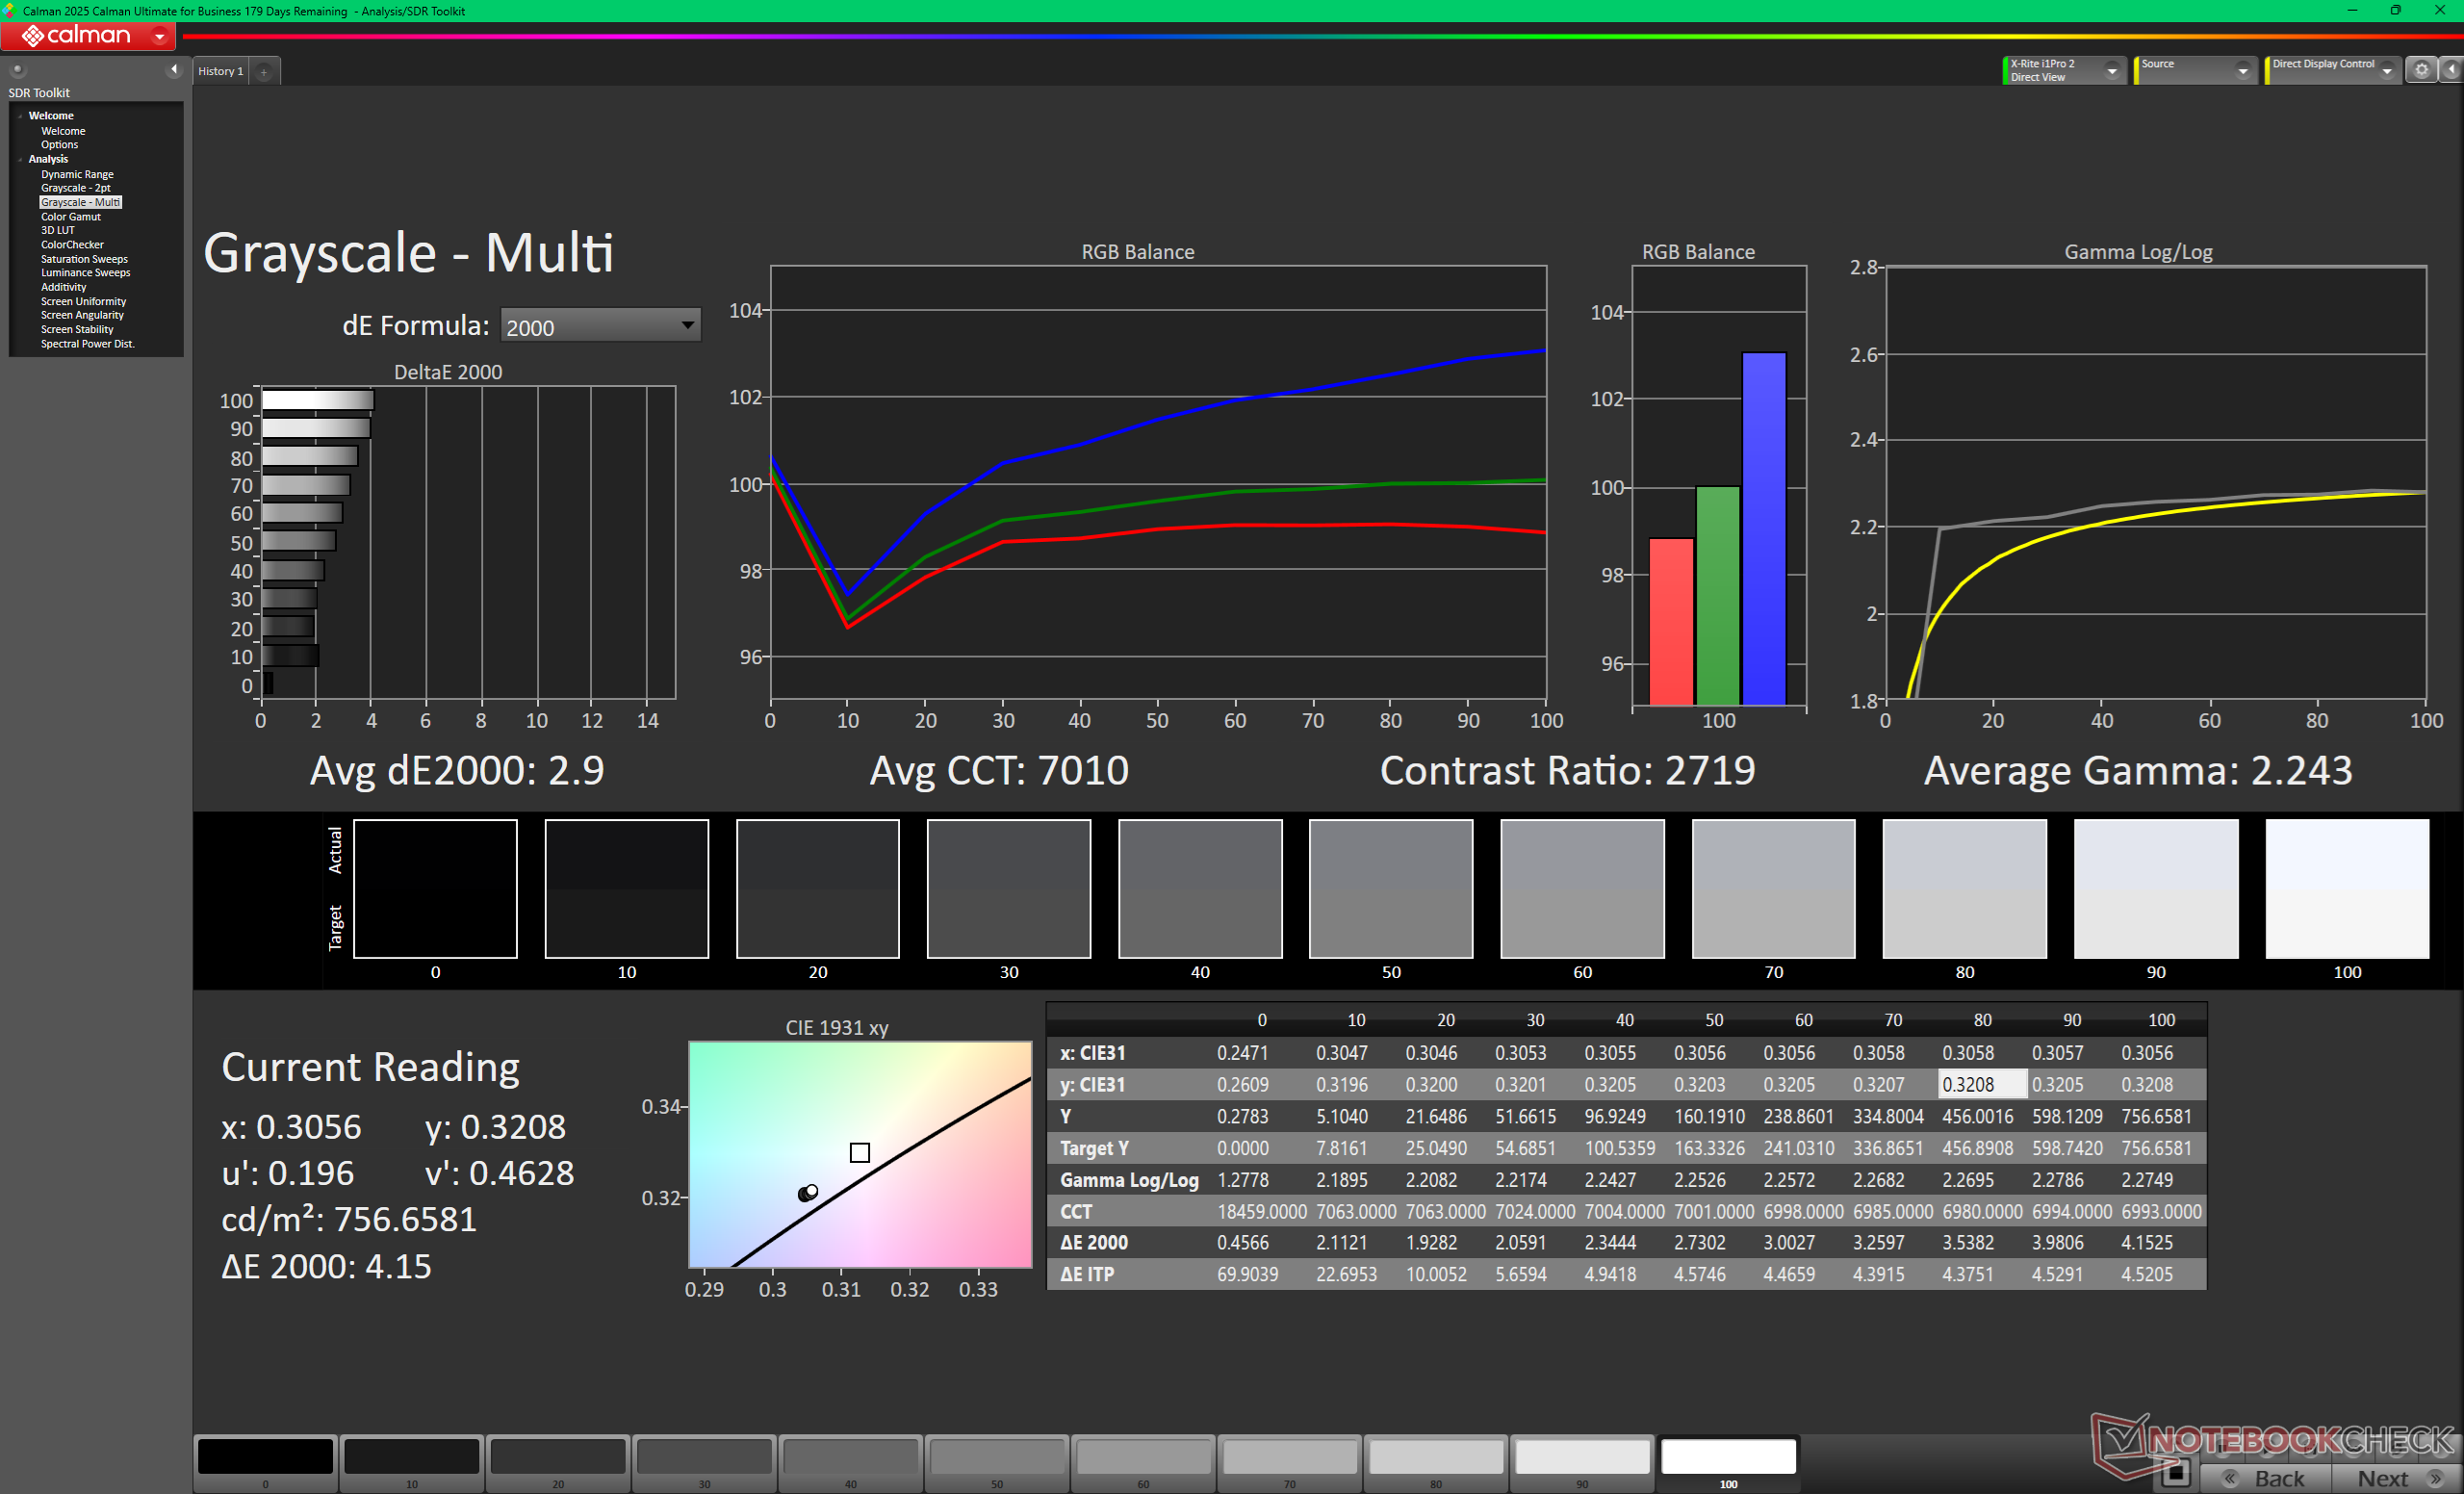
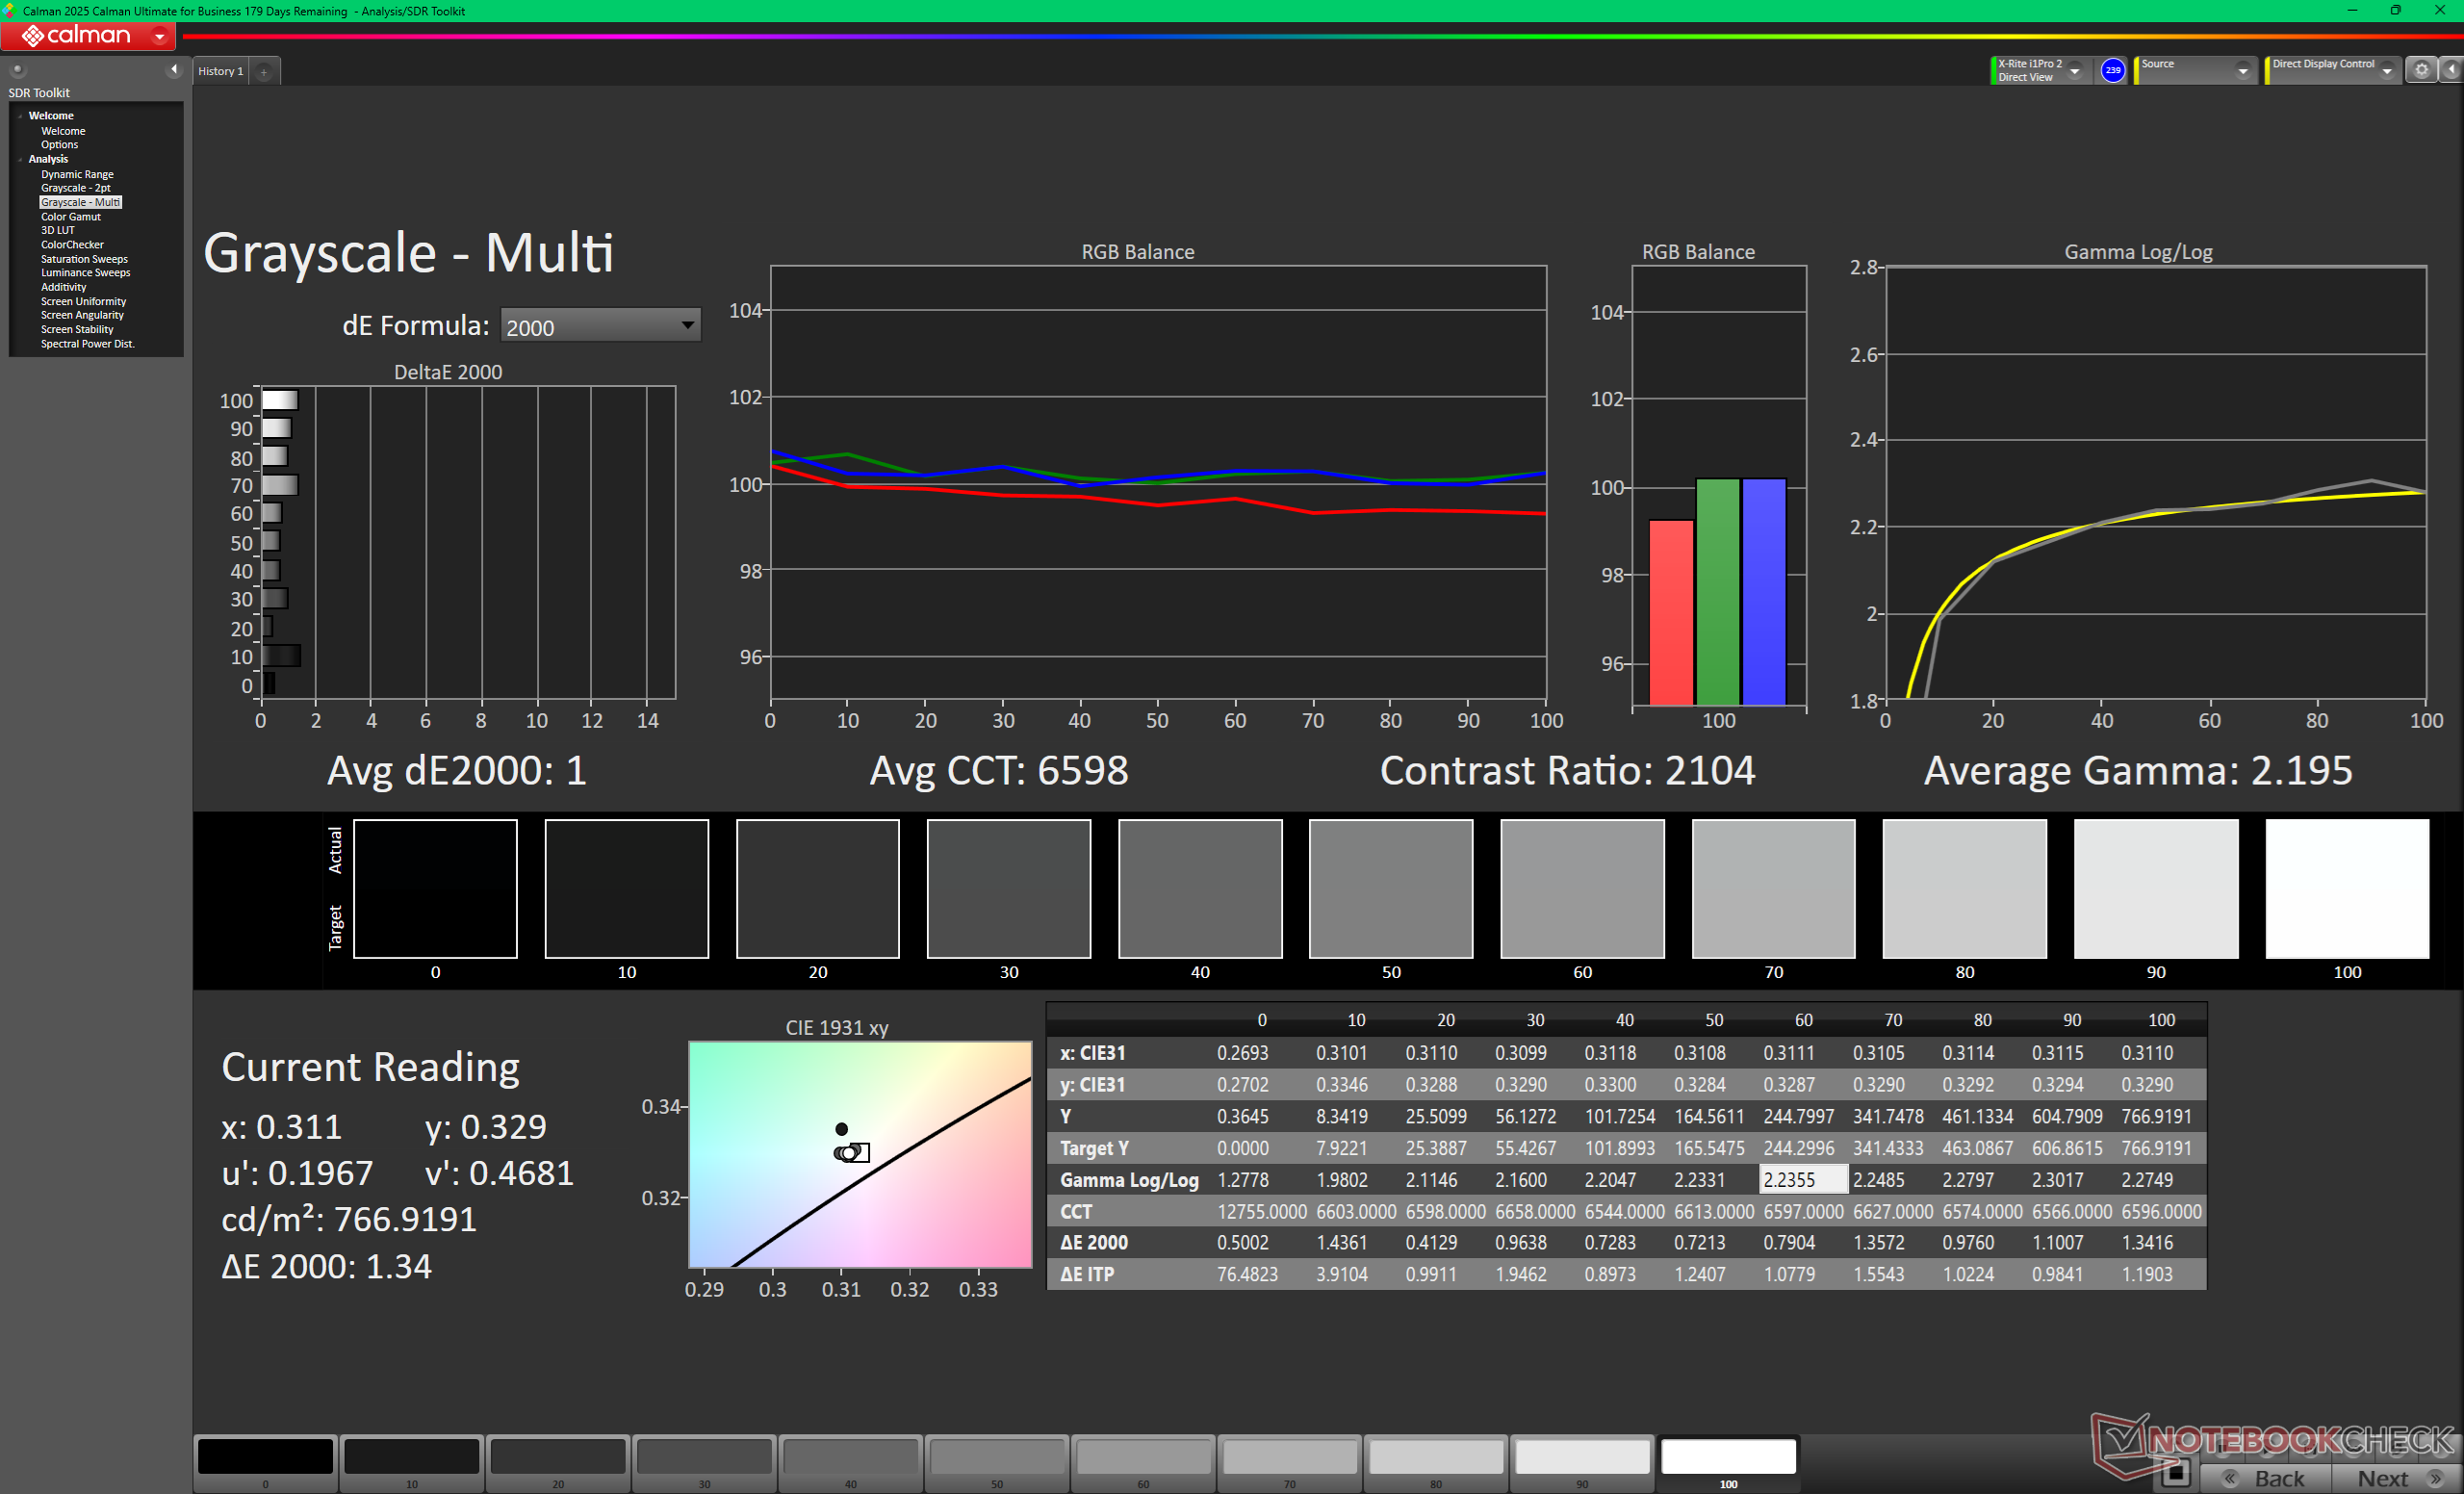
ΔE Greyscale Calman: 2.9 | ∀{0.09-98 Ø4.96}
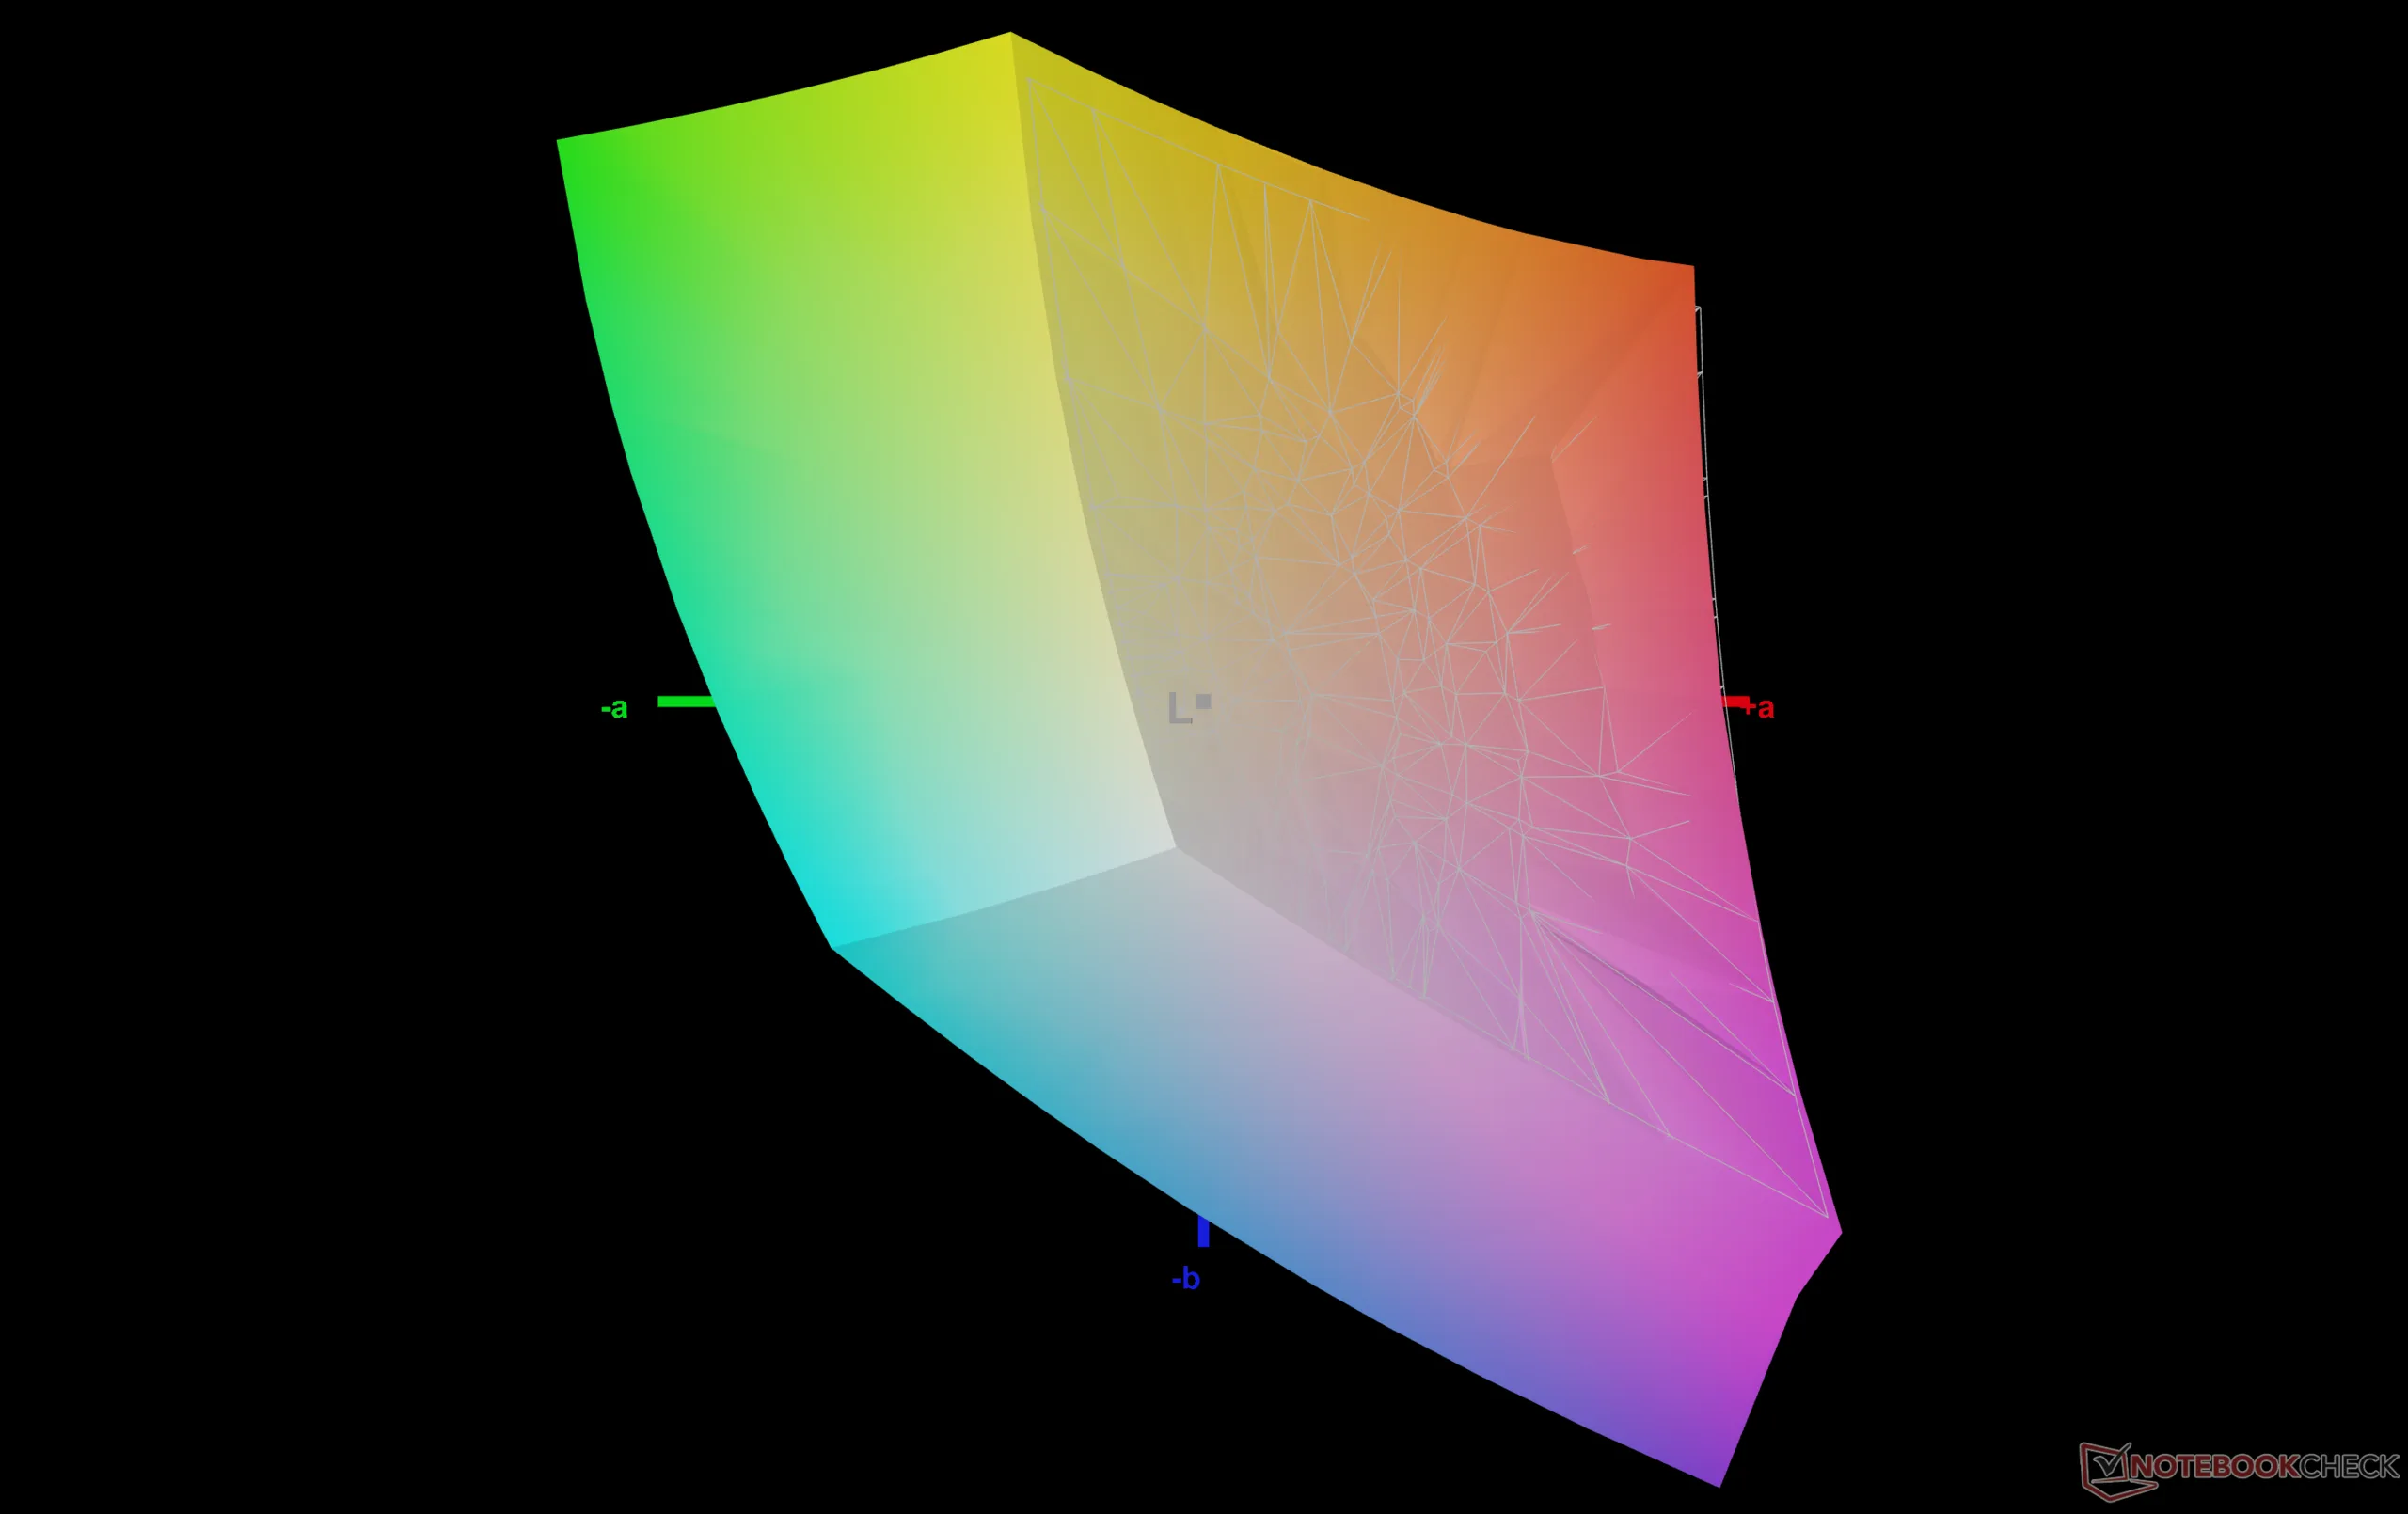
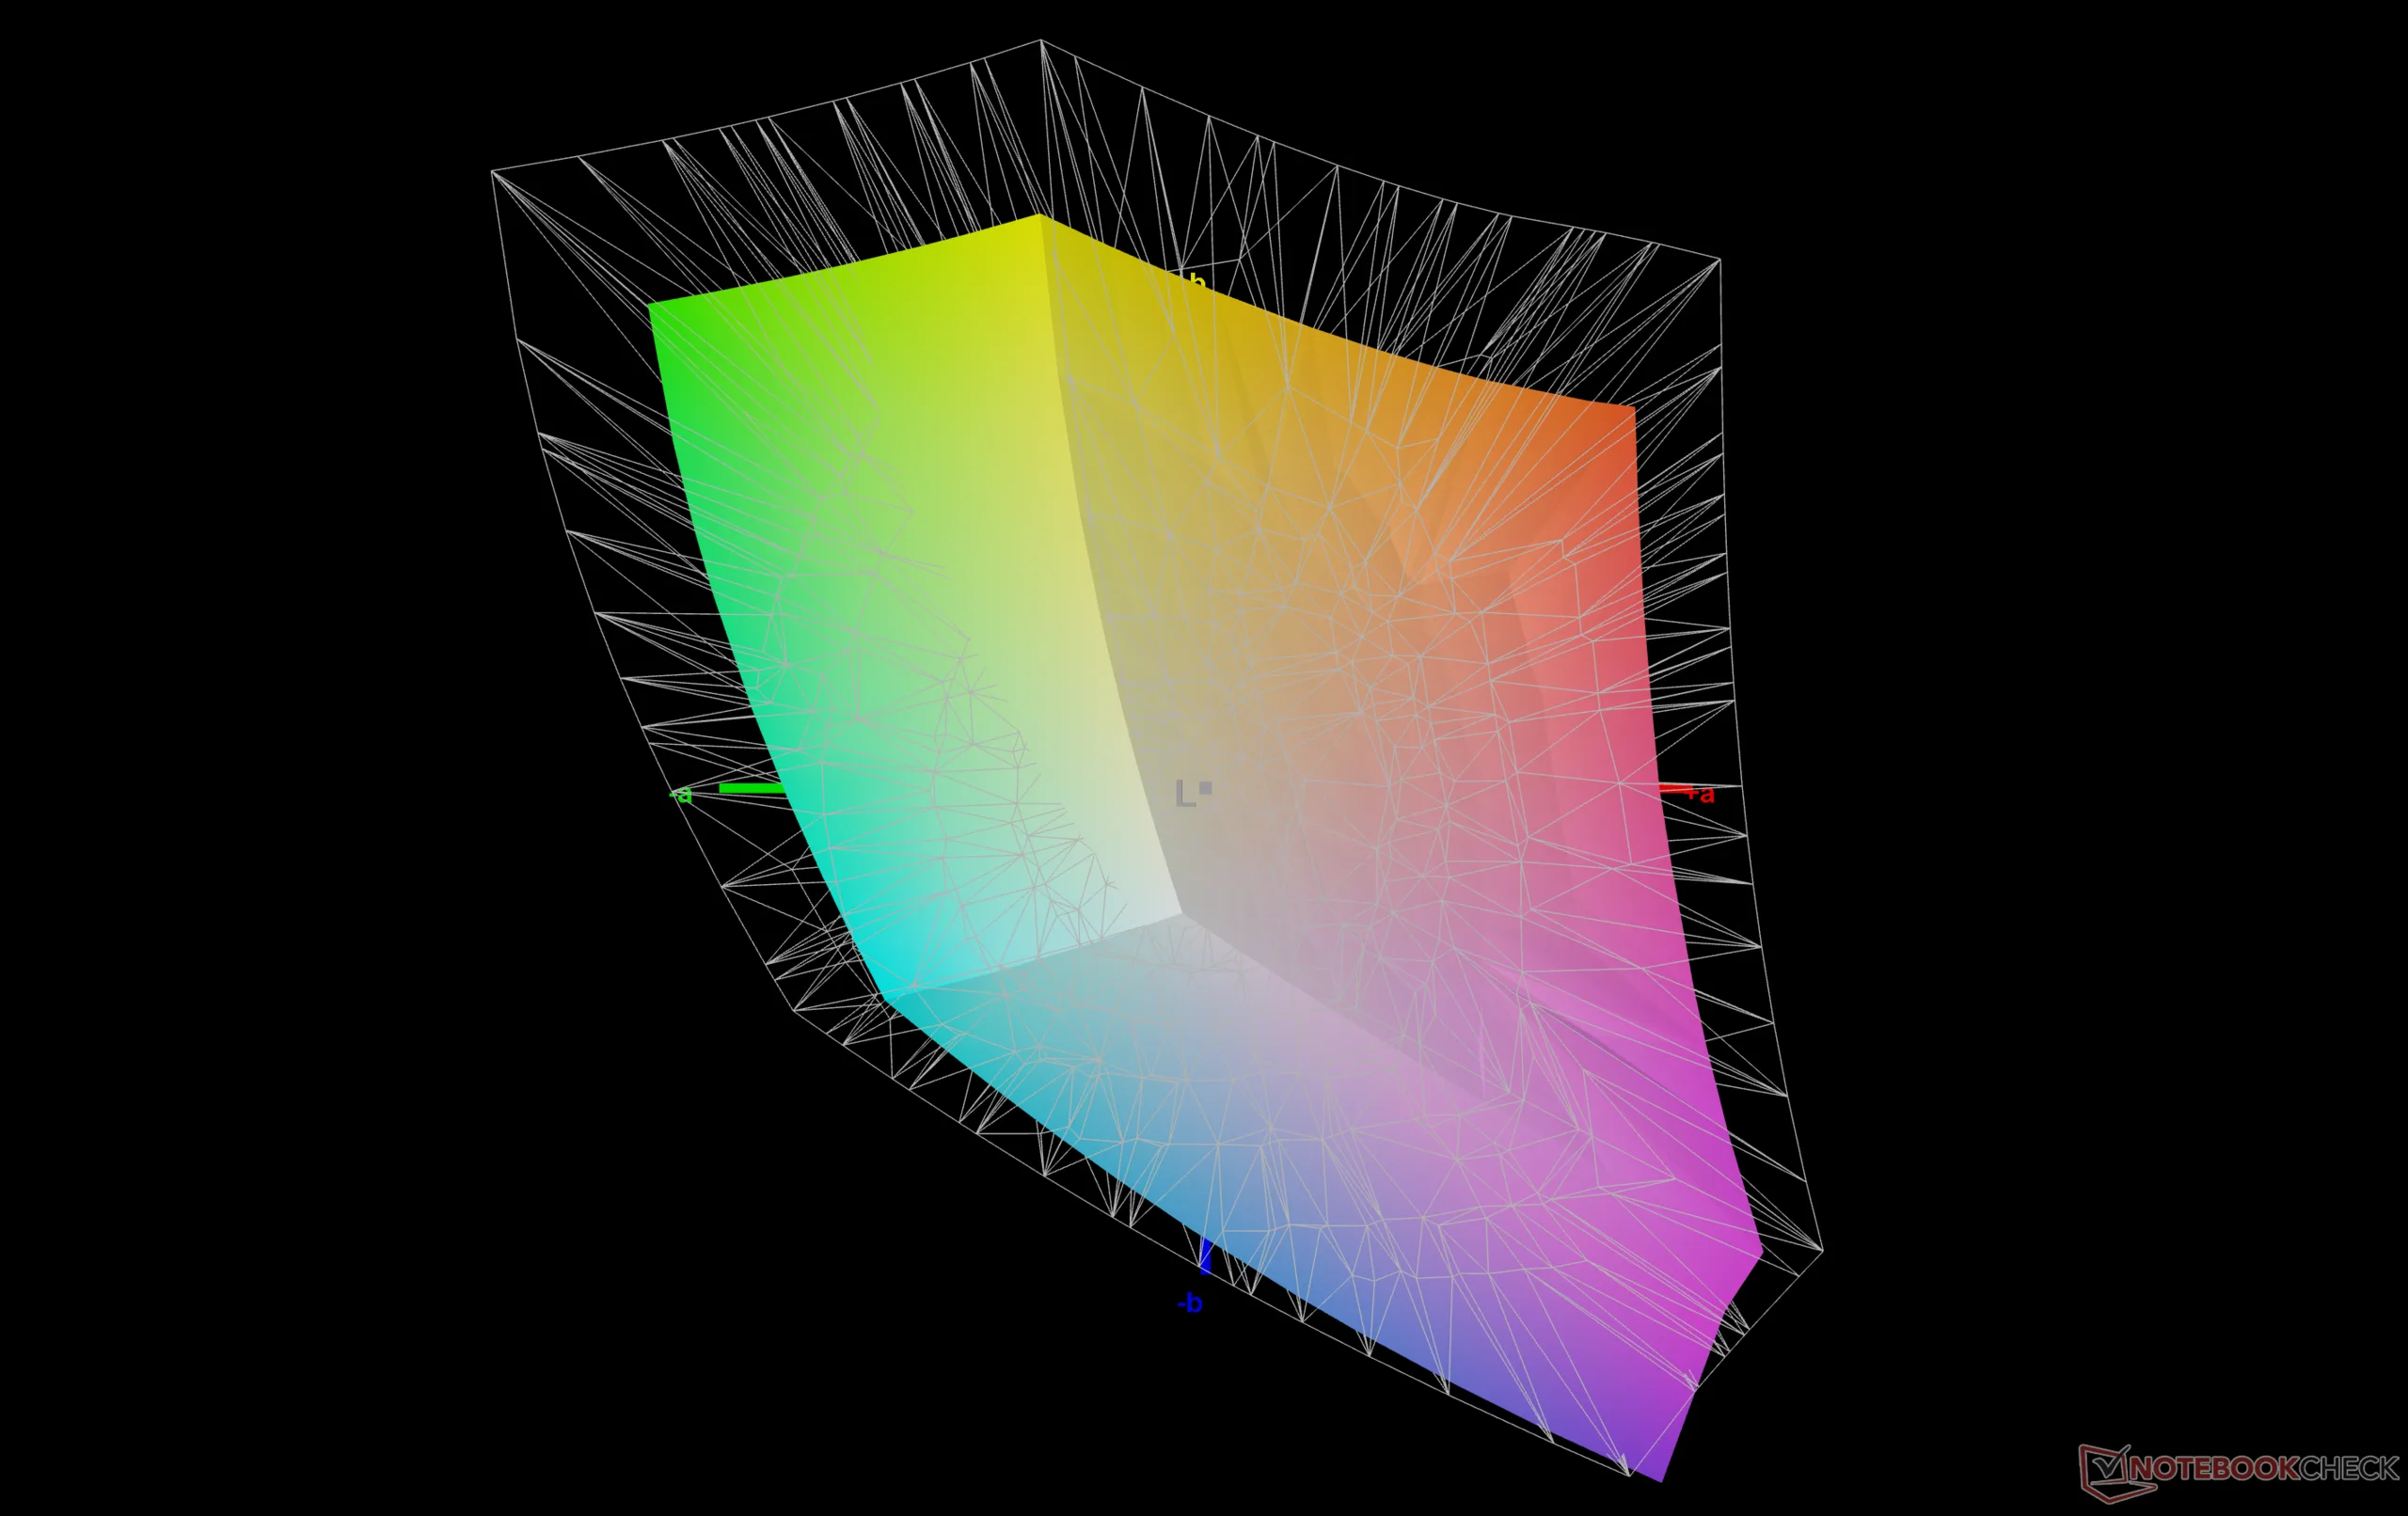
71.9% AdobeRGB 1998 (Argyll 3D)
99.6% sRGB (Argyll 3D)
70.7% Display P3 (Argyll 3D)
Gamma: 2.24
CCT: 7010 K
Framework Laptop 13 Pro
MND508ZB1-1, IPS, 2880x1920, 13.5", 120 Hz
Framework Laptop 13.5 Ryzen AI 9 HX 370
BOE NE135A1M-NY1, IPS, 2880x1920, 13.5", 120 Hz
Microsoft Surface Laptop 8 13.8
LQ138P1JX61, IPS, 2304x1536, 13.8", 120 Hz
MSI Prestige 13 AI+ A3MG
ATNA33AA07-0, OLED, 2880x1800, 13.3", 60 Hz
Asus ExpertBook Ultra B9406CAA
Samsung ATNA40LE01-0, OLED, 2880x1800, 14", 120 Hz
Dell XPS 14 Core Ultra X7 358H
LG Philips 140WT2, OLED, 2880x1800, 14", 120 Hz
Display
-1%
18%
25%
19%
26%
Display P3 Coverage (%)
70.7
71.9
2%
96.5
36%
99.9
41%
96.2
36%
99.7
41%
sRGB Coverage (%)
99.6
95.9
-4%
97.8
-2%
100
0%
100
0%
100
0%
AdobeRGB 1998 Coverage (%)
71.9
70.8
-2%
86.5
20%
95.7
33%
86.7
21%
98.2
37%
Response Times
-4%
6%
95%
97%
97%
Response Time Grey 50% / Grey 80% * (ms)
35.1 ?(16.5, 18.6)
40 ?(18.2, 21.8)
-14%
38.8 ?(14.1, 24.7)
-11%
1.8 ?(0.9, 0.9)
95%
0.71 ?(0.38, 0.33)
98%
0.75 ?(0.43, 0.32)
98%
Response Time Black / White * (ms)
23.6 ?(12.1, 11.5)
22.3 ?(11.1, 11.2)
6%
18.3 ?(5.8, 12.5)
22%
1.5 ?(0.8, 0.7)
94%
0.94 ?(0.49, 0.45)
96%
1.03 ?(0.53, 0.5)
96%
PWM Frequency (Hz)
60 ?(90)
968.8 ?(100)
240.62 ?(100)
PWM Amplitude * (%)
33
20
29
Bildschirm
-75%
6%
460%
12%
-1%
Helligkeit Bildmitte (cd/m²)
773.3
529.9
-31%
617
-20%
394
-49%
600.5
-22%
393.8
-49%
Brightness (cd/m²)
722
506
-30%
623
-14%
395
-45%
612
-15%
389
-46%
Brightness Distribution (%)
87
94
8%
91
5%
98
13%
96
10%
96
10%
Schwarzwert * (cd/m²)
0.36
0.3
17%
0.44
-22%
0.005
99%
Kontrast (:1)
2148
1766
-18%
1402
-35%
78800
3569%
Delta E Colorchecker *
2.14
5.7
-166%
0.9
58%
1.67
22%
1.18
45%
1.27
41%
Colorchecker dE 2000 max. *
4.25
10.6
-149%
2.2
48%
3.9
8%
3.4
20%
3.35
21%
Colorchecker dE 2000 calibrated *
0.61
1.5
-146%
0.73
-20%
0.71
-16%
Delta E Graustufen *
2.9
7.5
-159%
2
31%
1.2
59%
1
66%
2
31%
Gamma
2.24 98%
2.07 106%
2.19 100%
2.212 99%
2.27 97%
2.19 100%
CCT
7010 93%
6967 93%
6810 95%
6470 100%
6567 99%
6379 102%
Durchschnitt gesamt (Programm / Settings)
-27% / -49%
10% / 9%
193% / 303%
43% / 28%
41% / 22%

* ... kleinere Werte sind besser
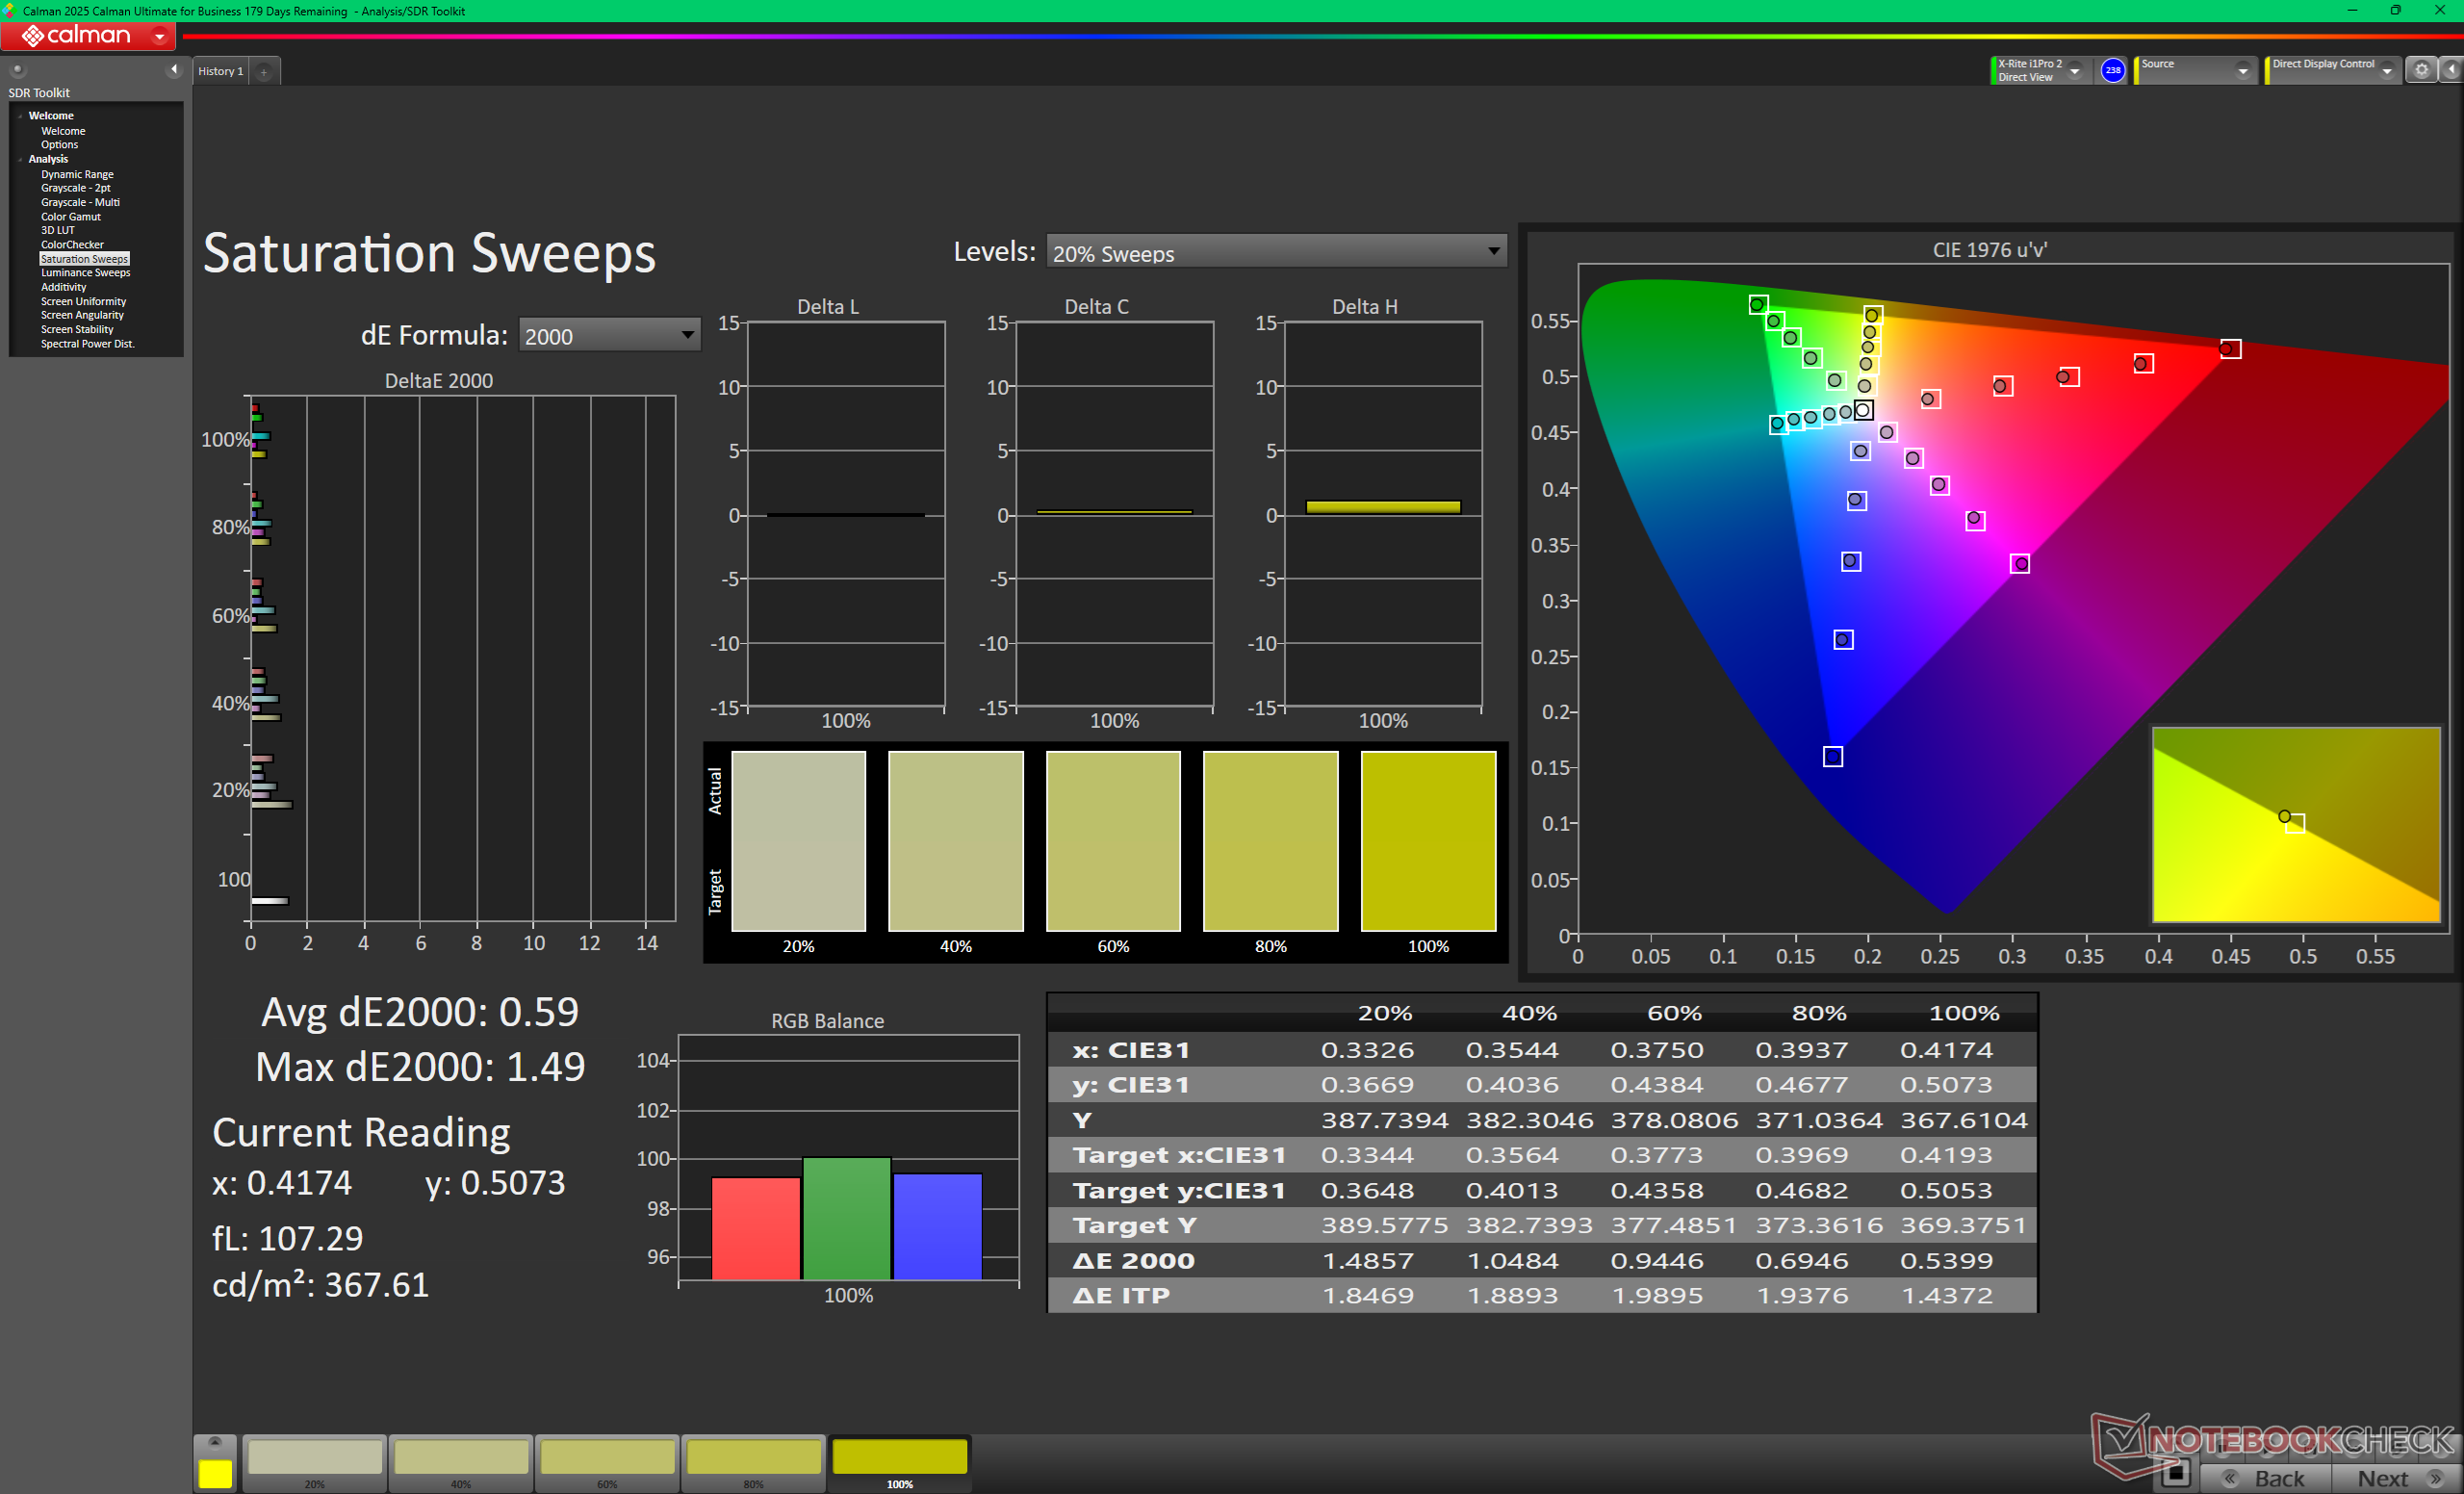
vs. sRGB
vs. sRGB
vs. P3
vs. P3
Graustufen vor der Kalibrierung
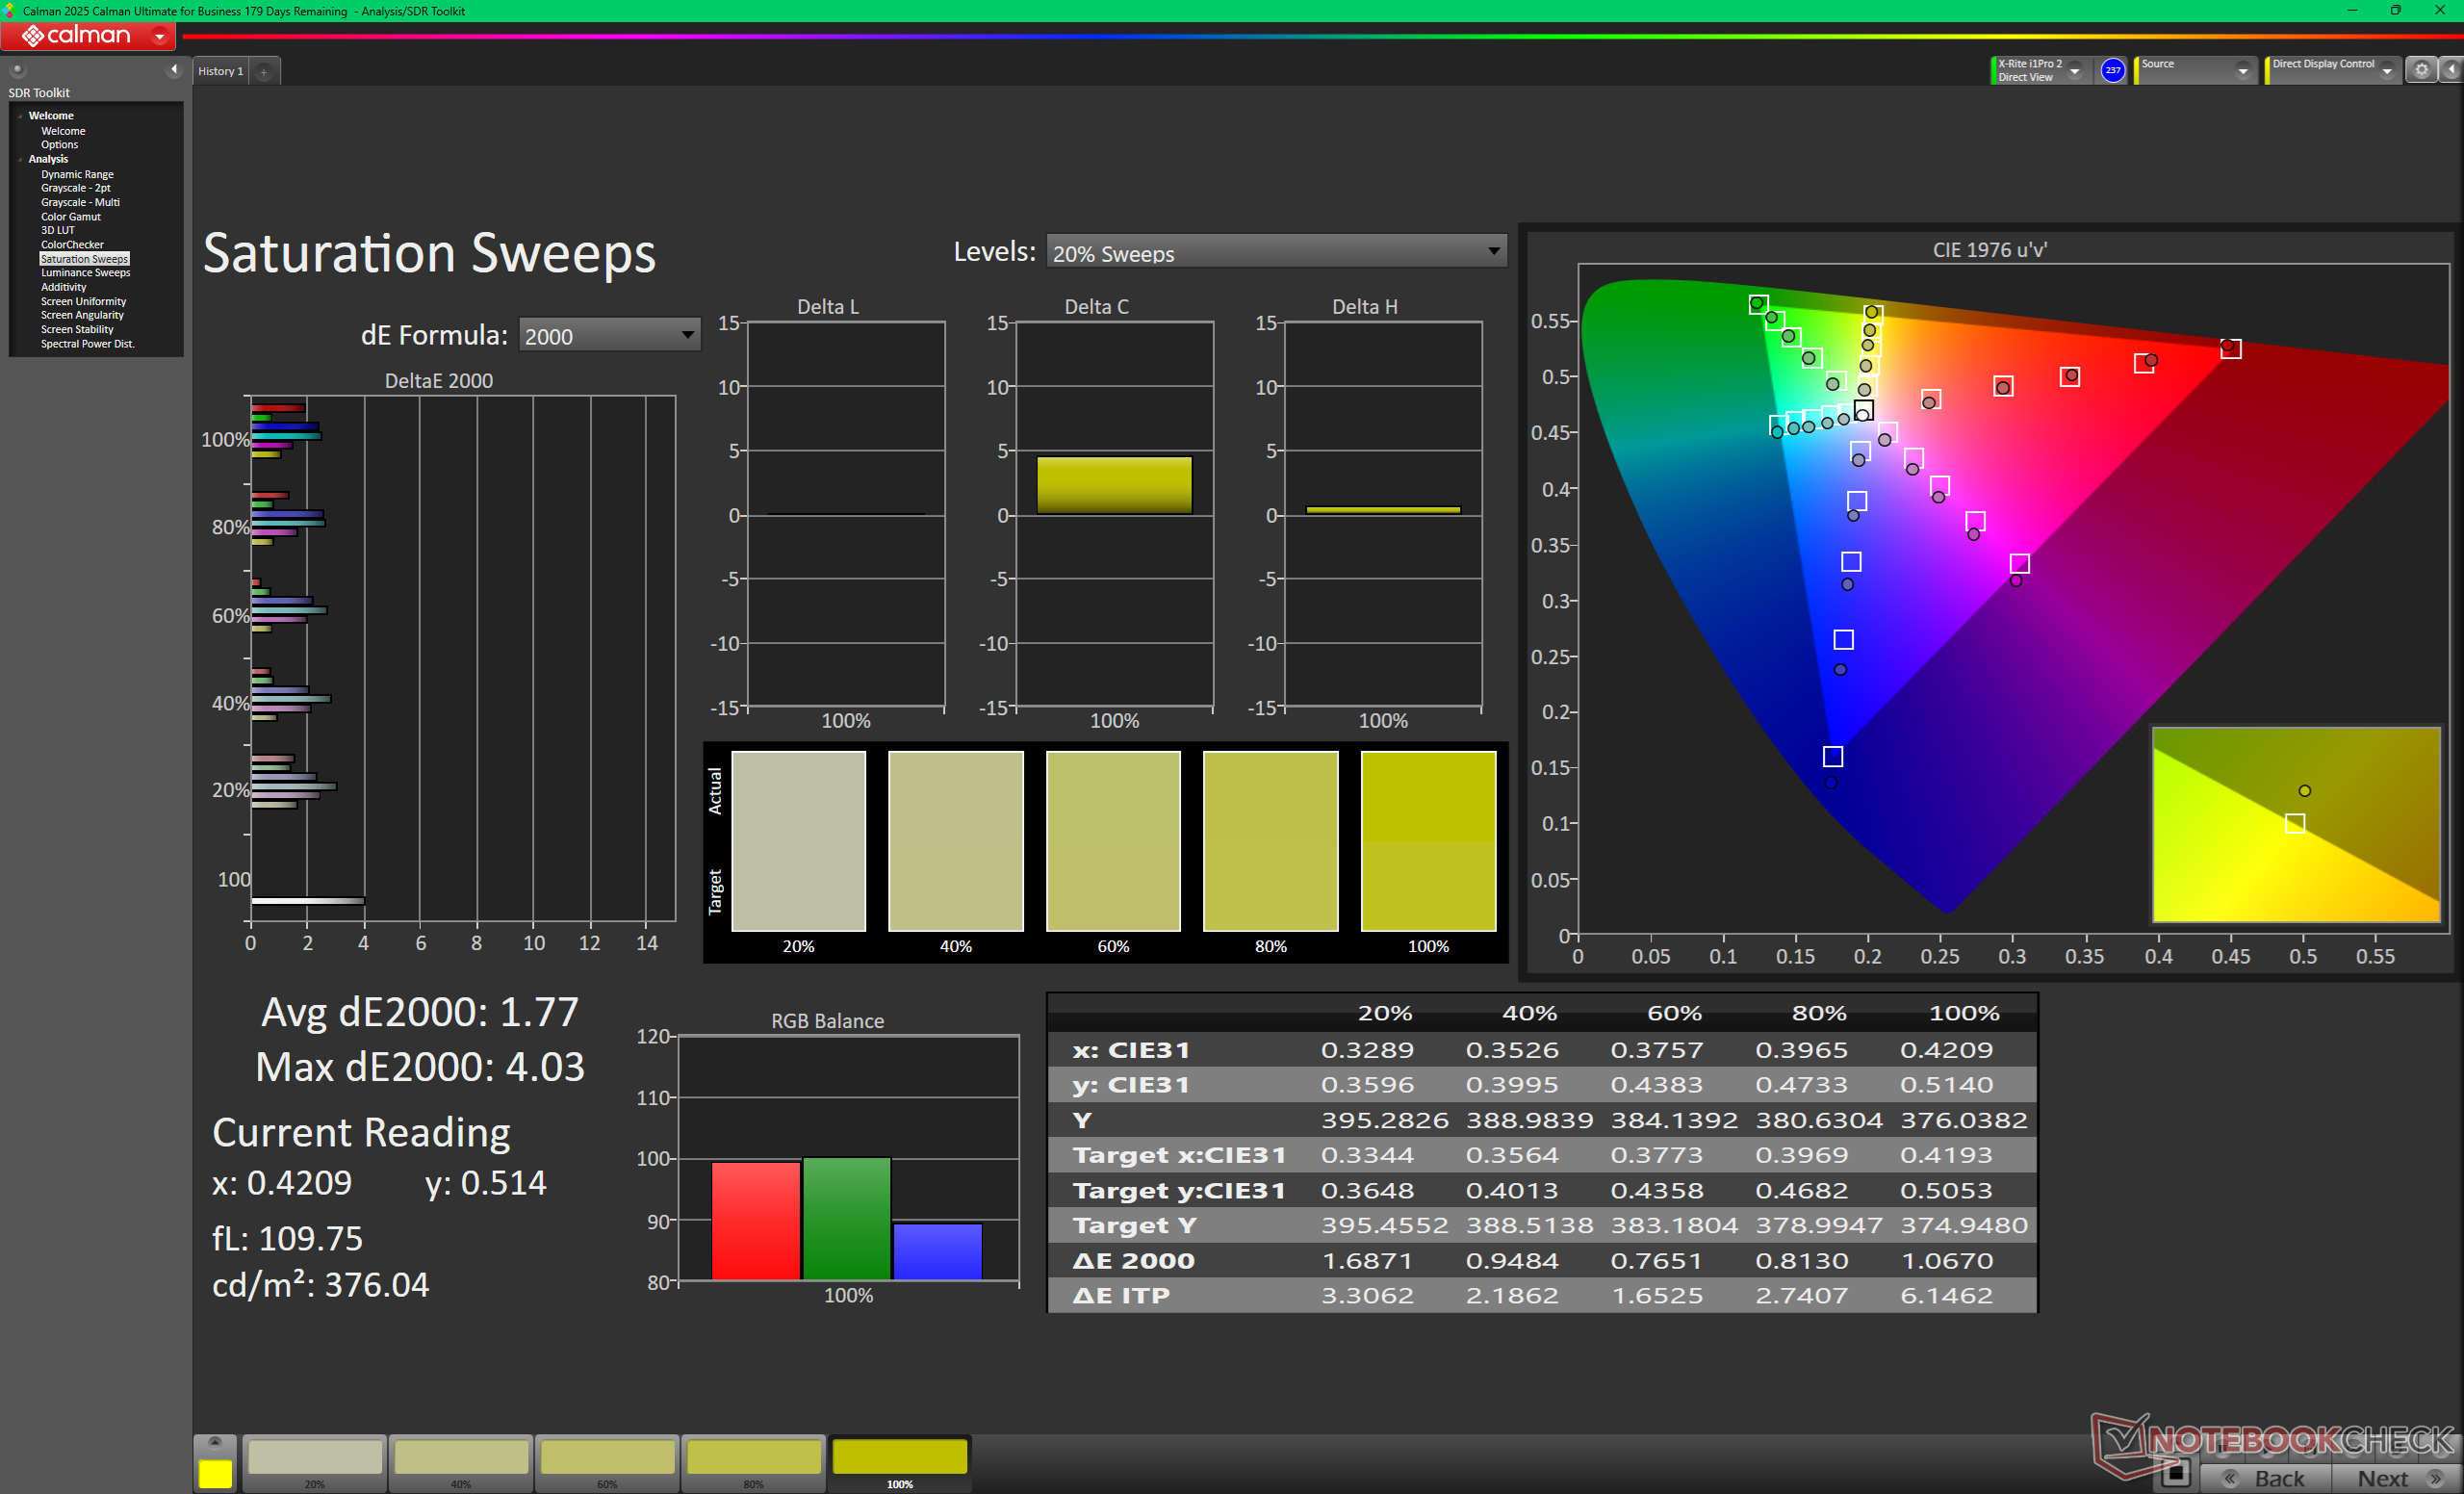
Sättigungsmessungen vor der Kalibrierung
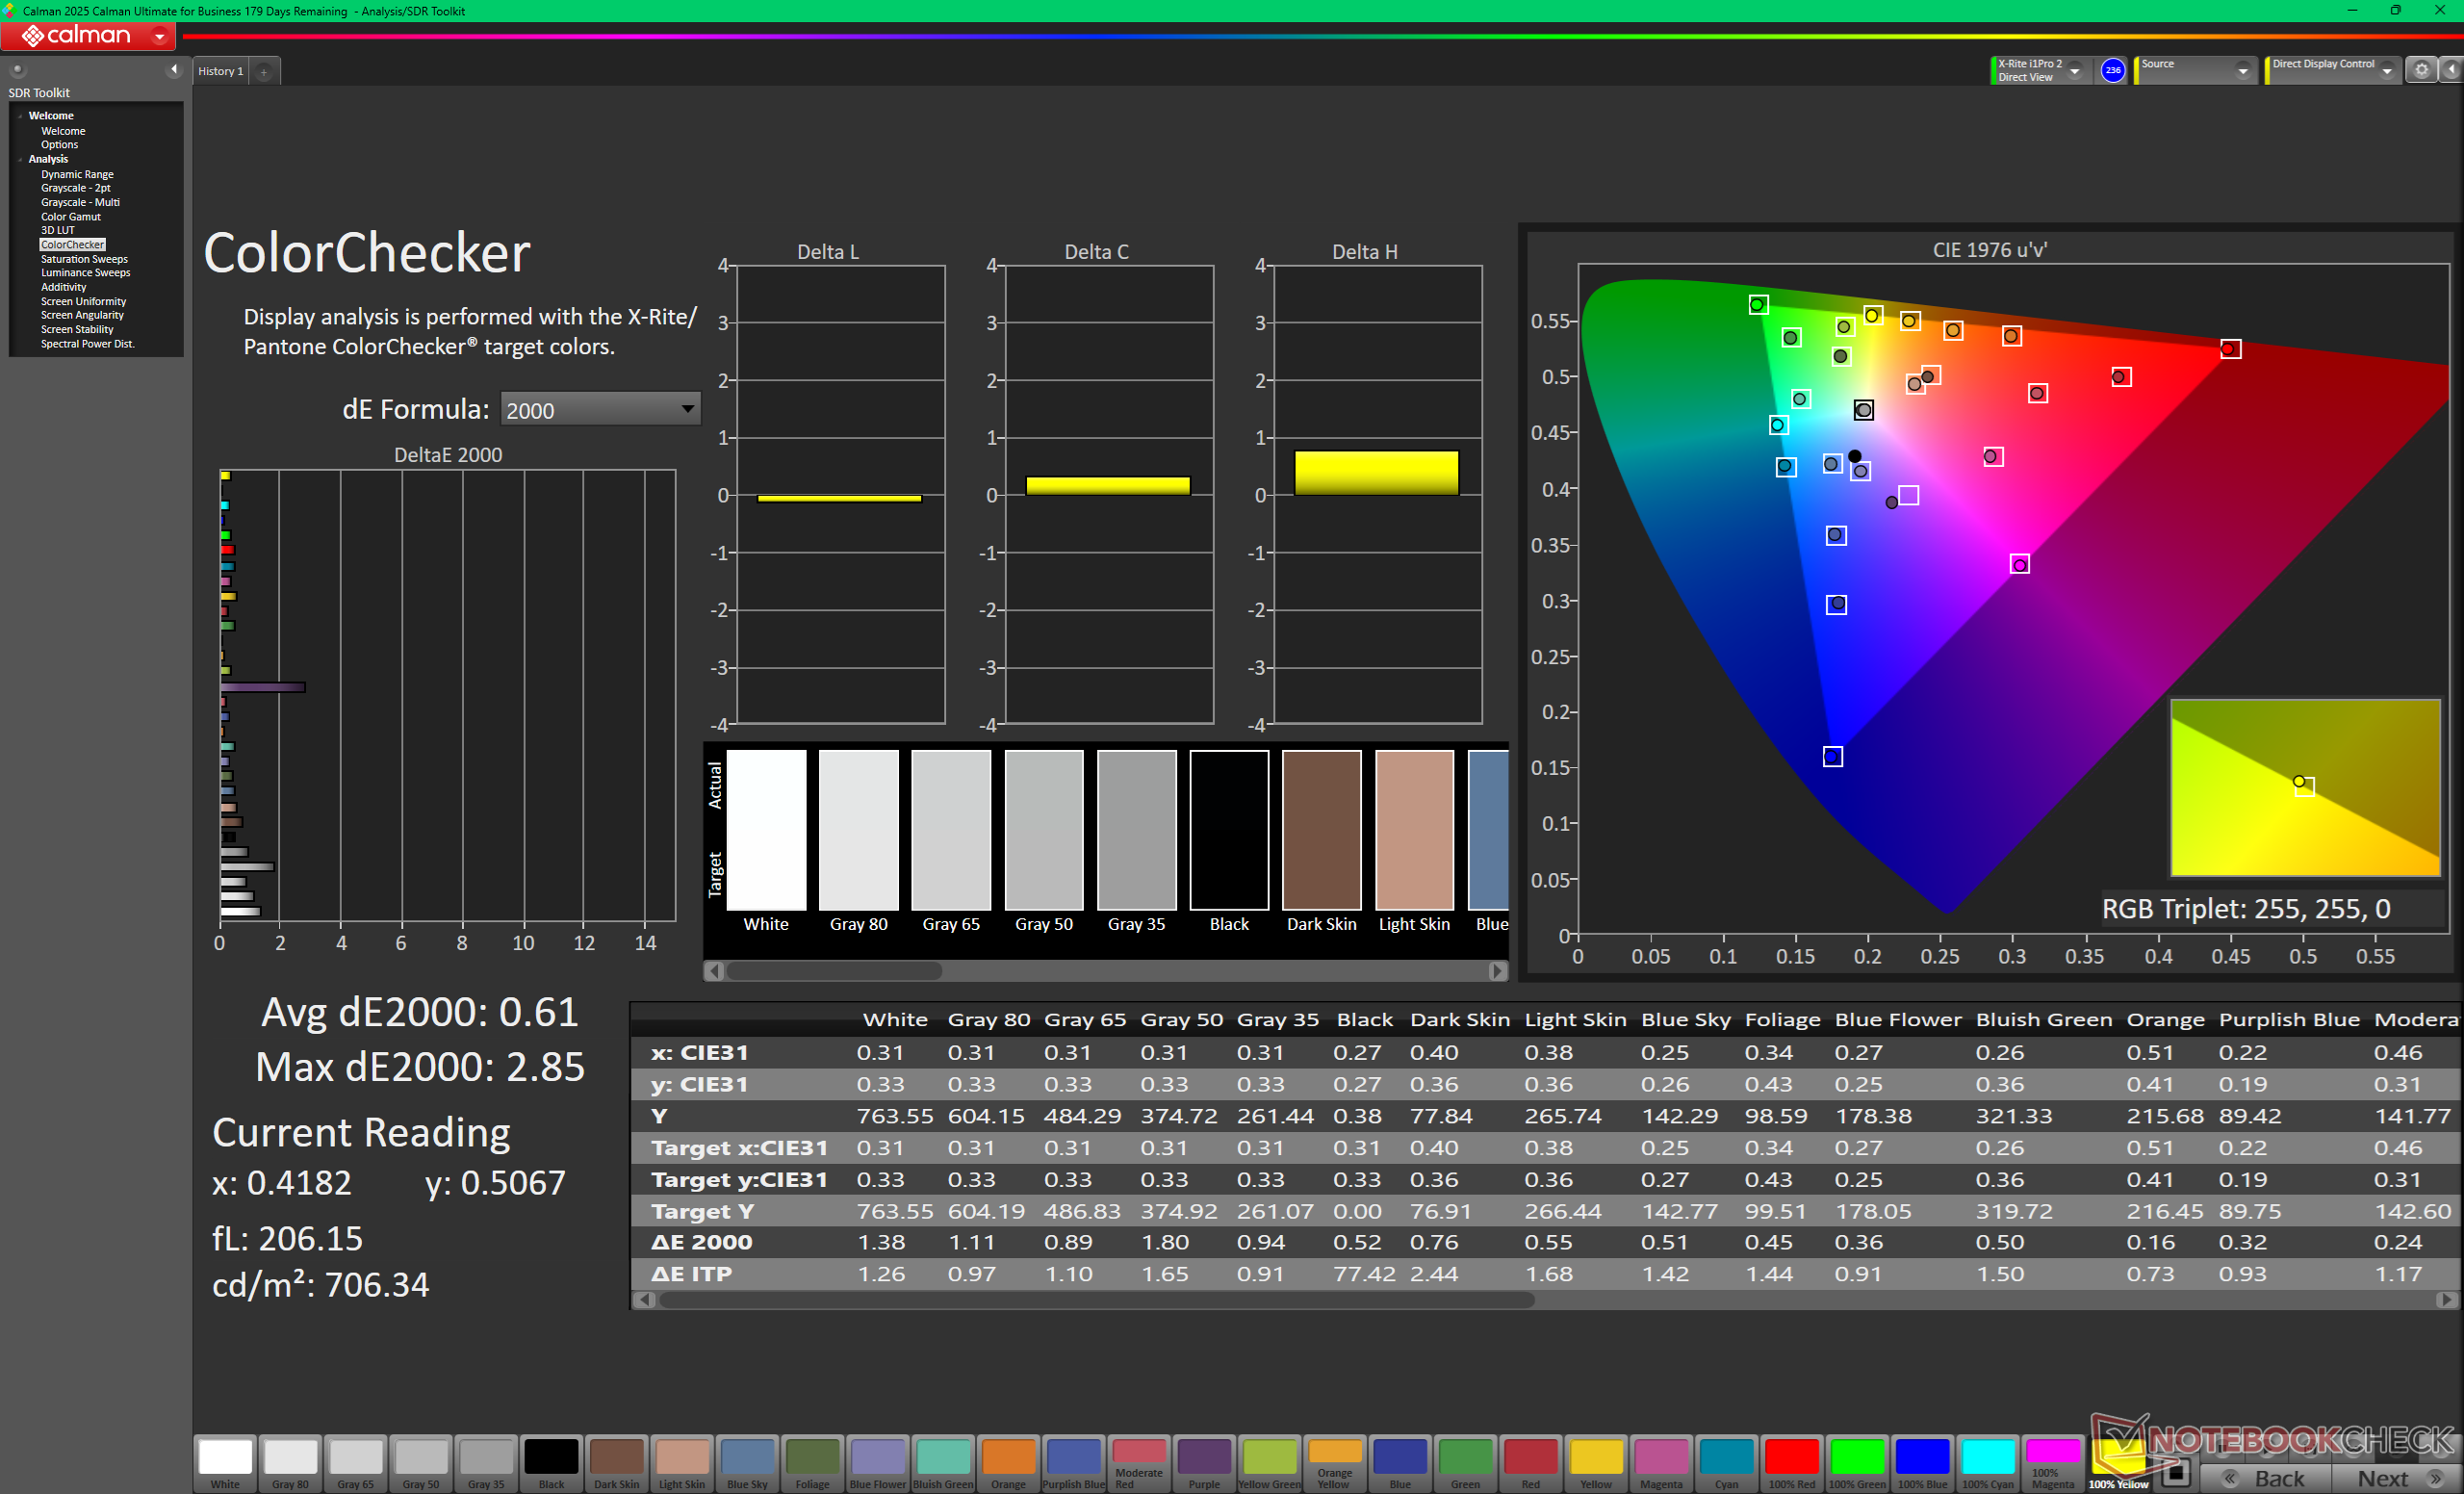
ColorChecker vor der Kalibrierung
Graustufen nach der Kalibrierung
Sättigungsmessungen nach der Kalibrierung
ColorChecker nach der Kalibrierung

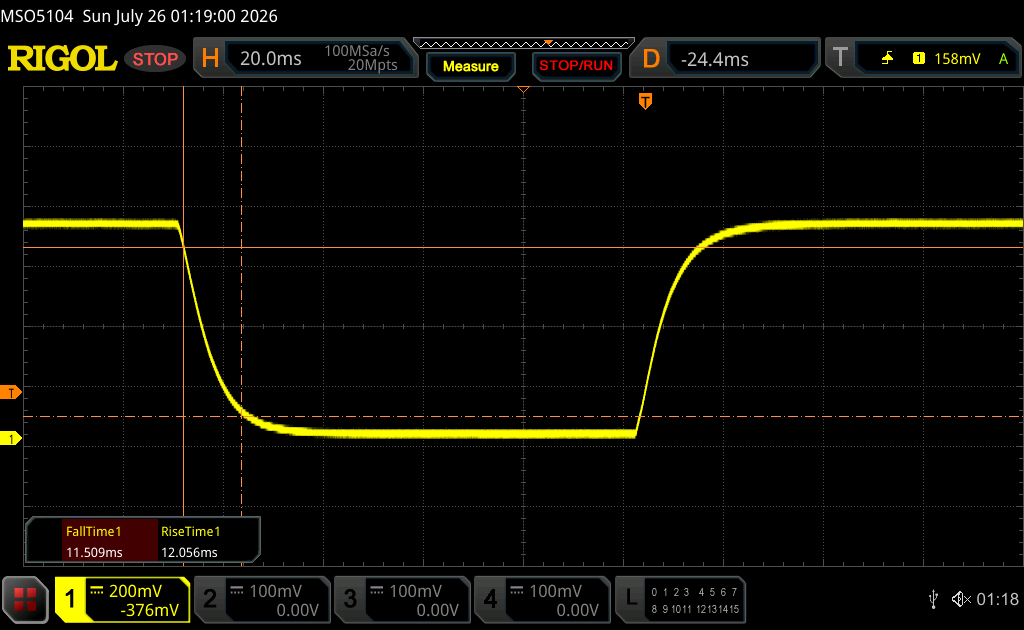
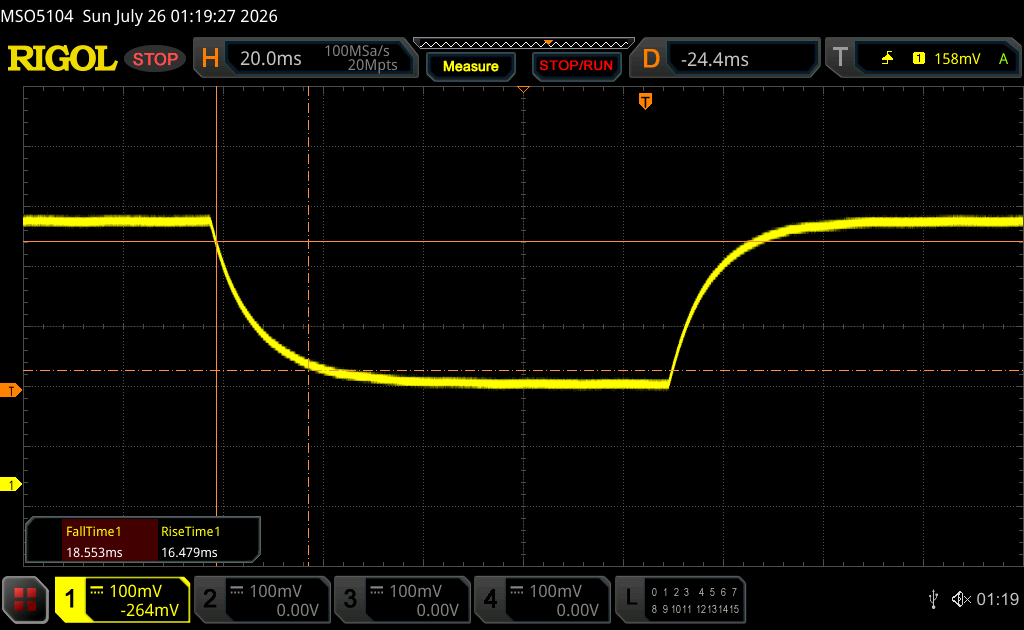
Reaktionszeiten (Response Times) des Displays

Die Reaktionszeiten (Response Times) beschreiben wie schnell zwischen zwei Farben eines Pixels umgeschaltet werden kann. Langsame Response Times können zu einer verschwommenen Darstellung, Schlieren und Geisterbilder führen. Besonders bei schnellen 3D-Spielen sind kurze Umschaltzeiten wichtig.
       Reaktionszeiten Schwarz zu Weiß
23.6 ms ... steigend ↗ und fallend ↘ kombiniert↗ 12.1 ms steigend
↘ 11.5 ms fallend
Die gemessenen Reaktionszeiten sind gut, für anspruchsvolle Spieler könnten der Bildschirm jedoch zu langsam sein.
Im Vergleich rangierten die bei uns getesteten Geräte von 0.1 (Minimum) zu 240 (Maximum) ms. » 54 % aller Screens waren schneller als der getestete.
Daher sind die gemessenen Reaktionszeiten schlechter als der Durchschnitt aller vermessenen Geräte (19.8 ms).
       Reaktionszeiten 50% Grau zu 80% Grau
35.1 ms ... steigend ↗ und fallend ↘ kombiniert↗ 16.5 ms steigend
↘ 18.6 ms fallend
Die gemessenen Reaktionszeiten sind langsam und dadurch für viele Spieler wahrscheinlich zu langsam.
Im Vergleich rangierten die bei uns getesteten Geräte von 0.165 (Minimum) zu 636 (Maximum) ms. » 49 % aller Screens waren schneller als der getestete.
Daher sind die gemessenen Reaktionszeiten schlechter als der Durchschnitt aller vermessenen Geräte (30.9 ms).

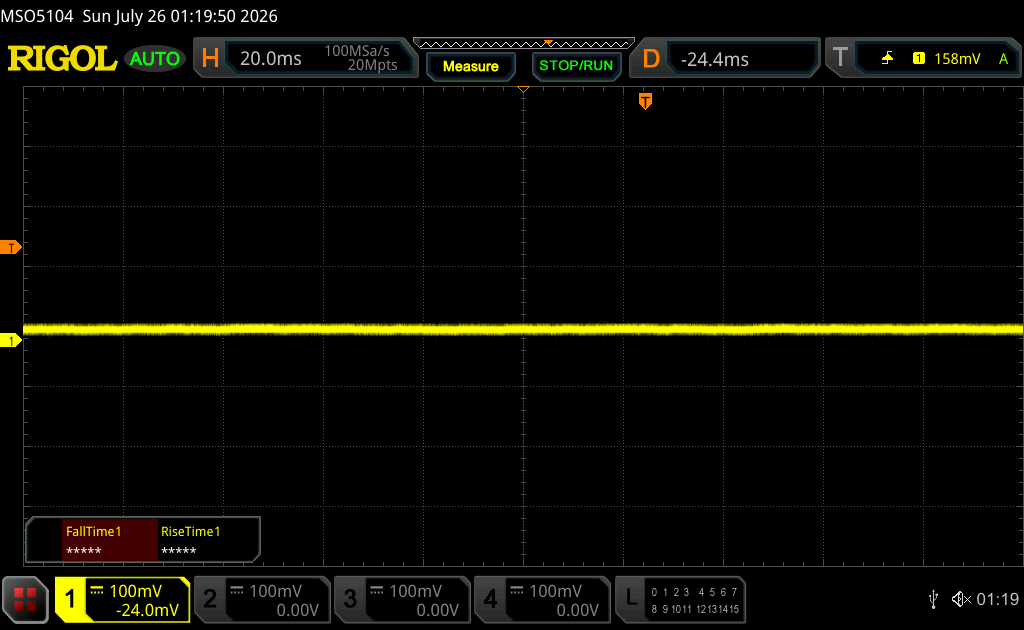
Bildschirm-Flackern / PWM (Pulse-Width Modulation)

Eine günstige Methode um die Helligkeit eines Bildschirms zu steuern, ist die Beleuchtung periodisch ein- und auszuschalten. Dies nennt sich PWM (Pulsweitenmodulation) Diese Umschaltung sollte mit einer hohen Frequenz stattfinden damit das menschliche Auge kein Flimmern wahrnimmt. Wenn die Frequenz zu niedrig ist, kann dies zu Ermüdungserscheinungen, Augenbrennen, Kopfweh und auch sichtbaren Flackern führen.
Flackern / PWM nicht festgestellt

Im Vergleich: 52 % aller getesteten Geräte nutzten kein PWM um die Helligkeit zu reduzieren. Wenn PWM eingesetzt wurde, dann bei einer Frequenz von durchschnittlich 7741 (Minimum 5, Maximum 343500) Hz.

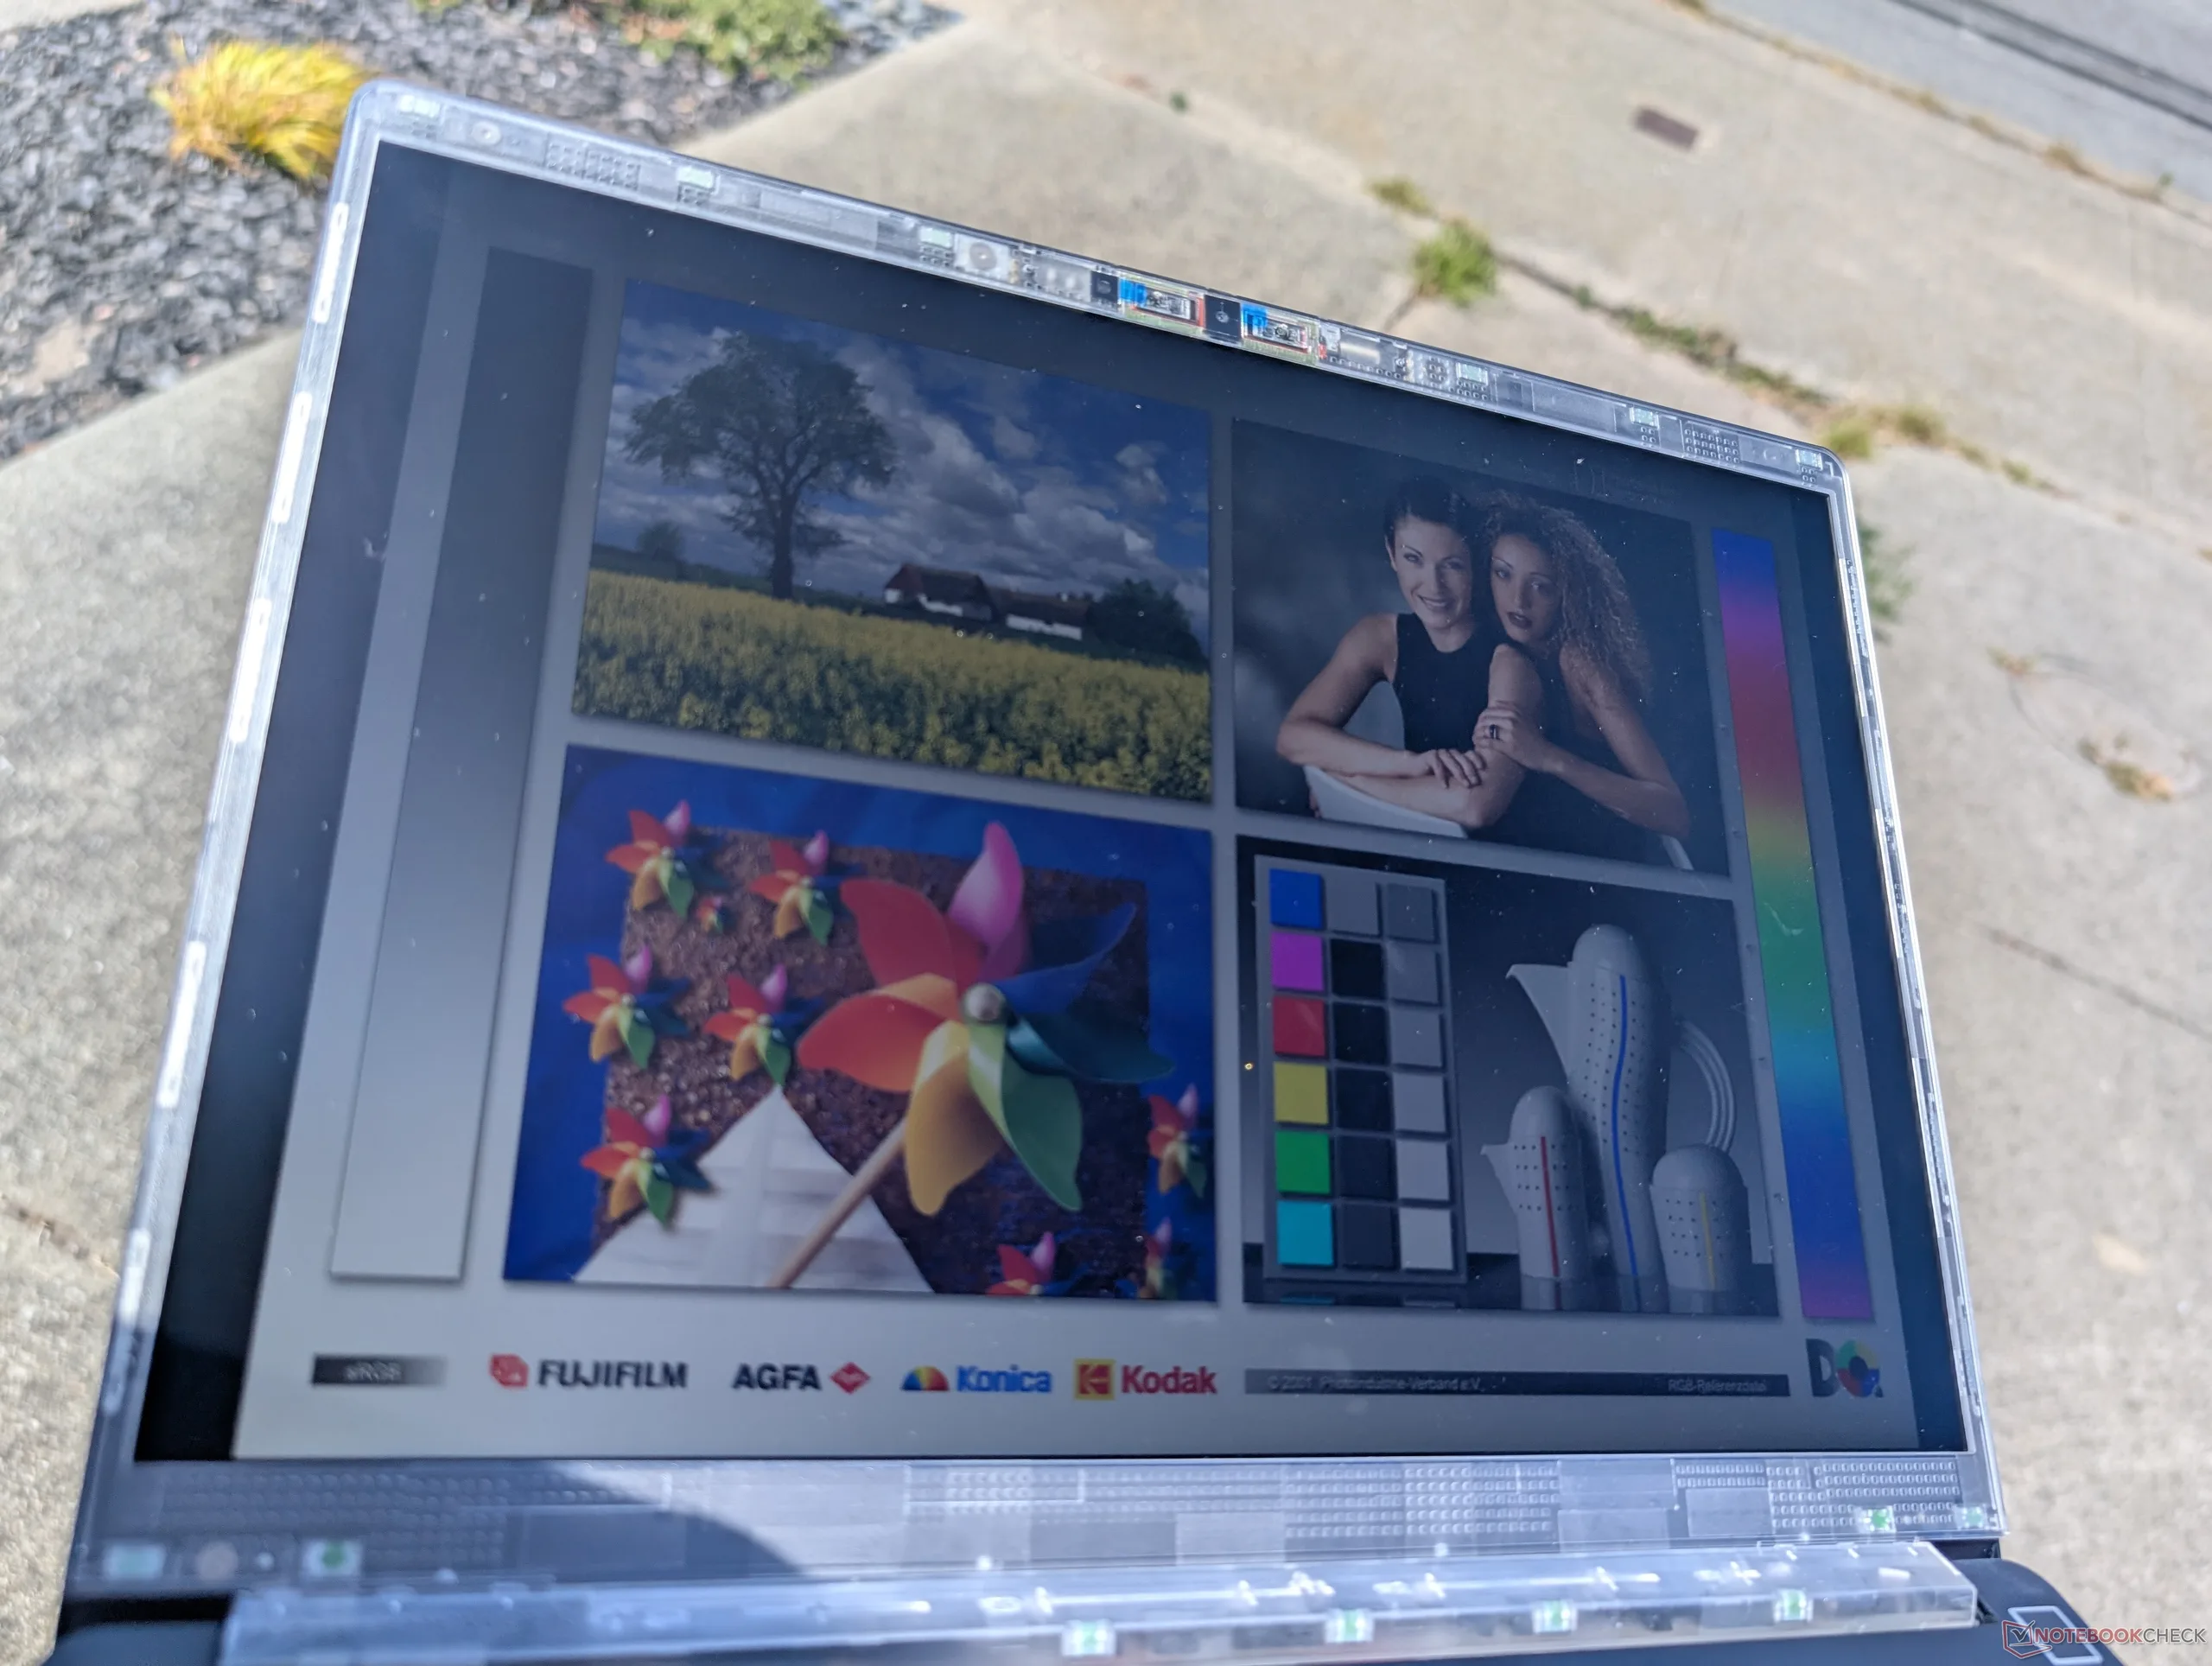
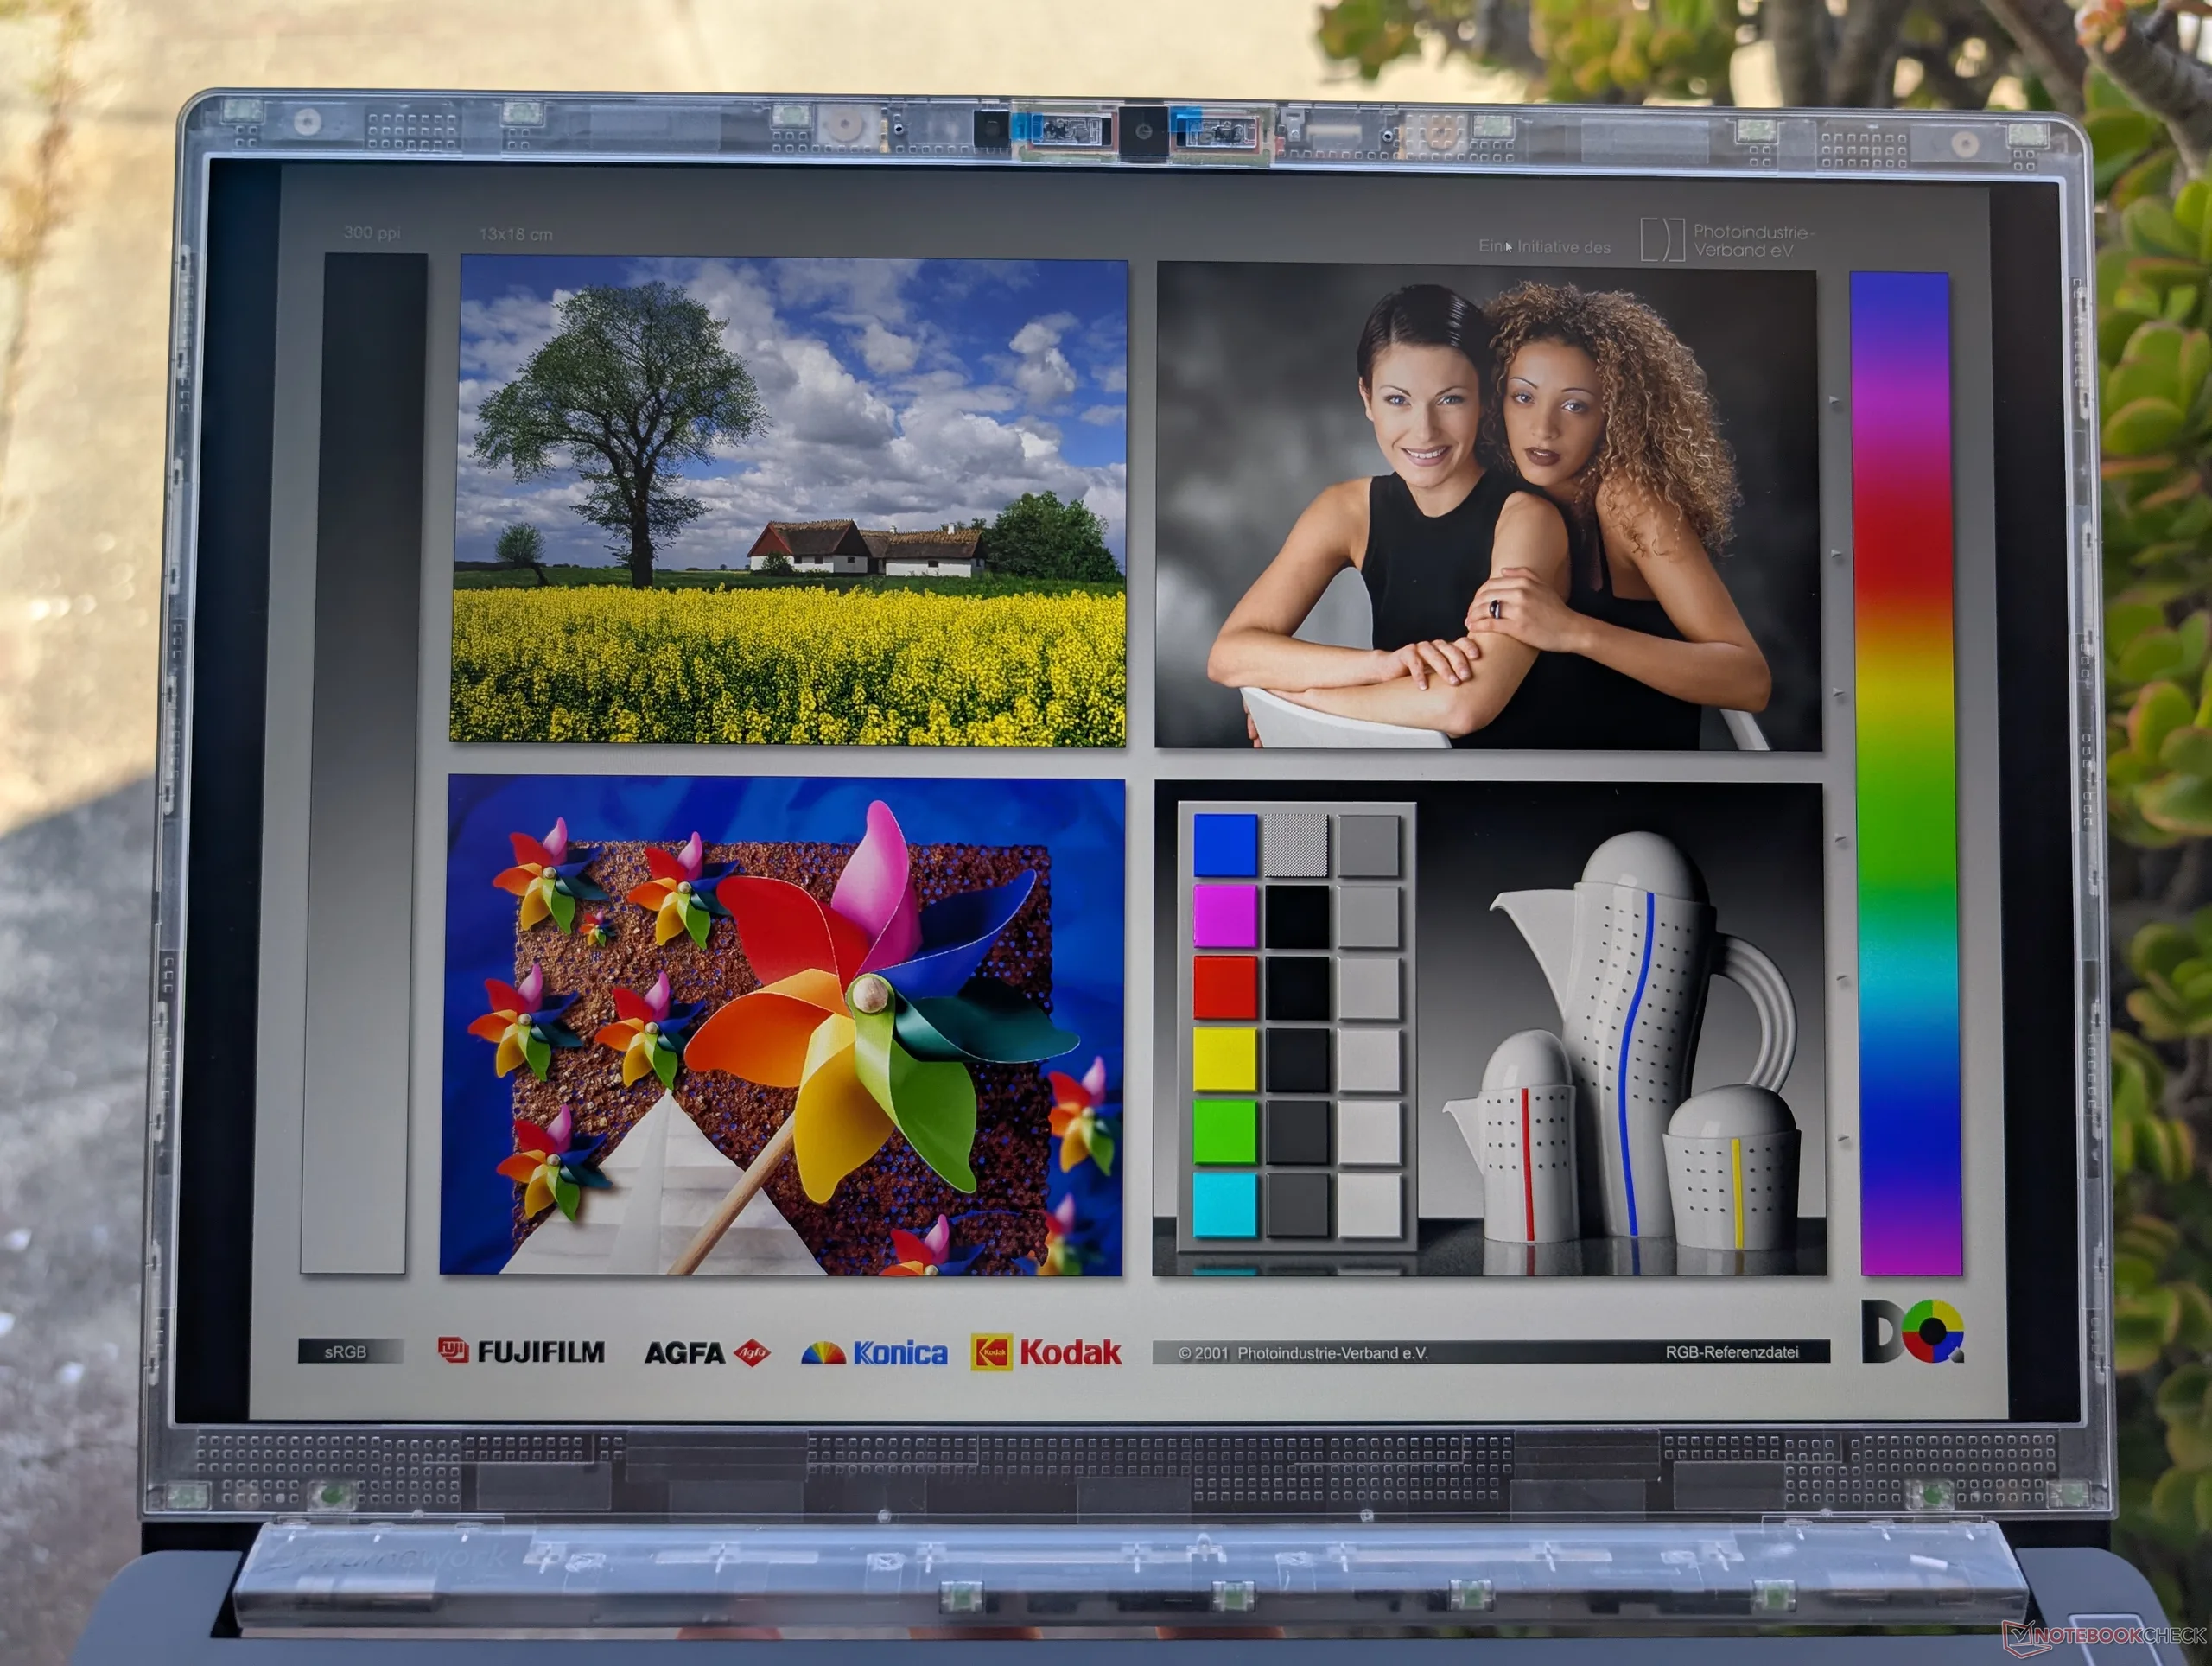
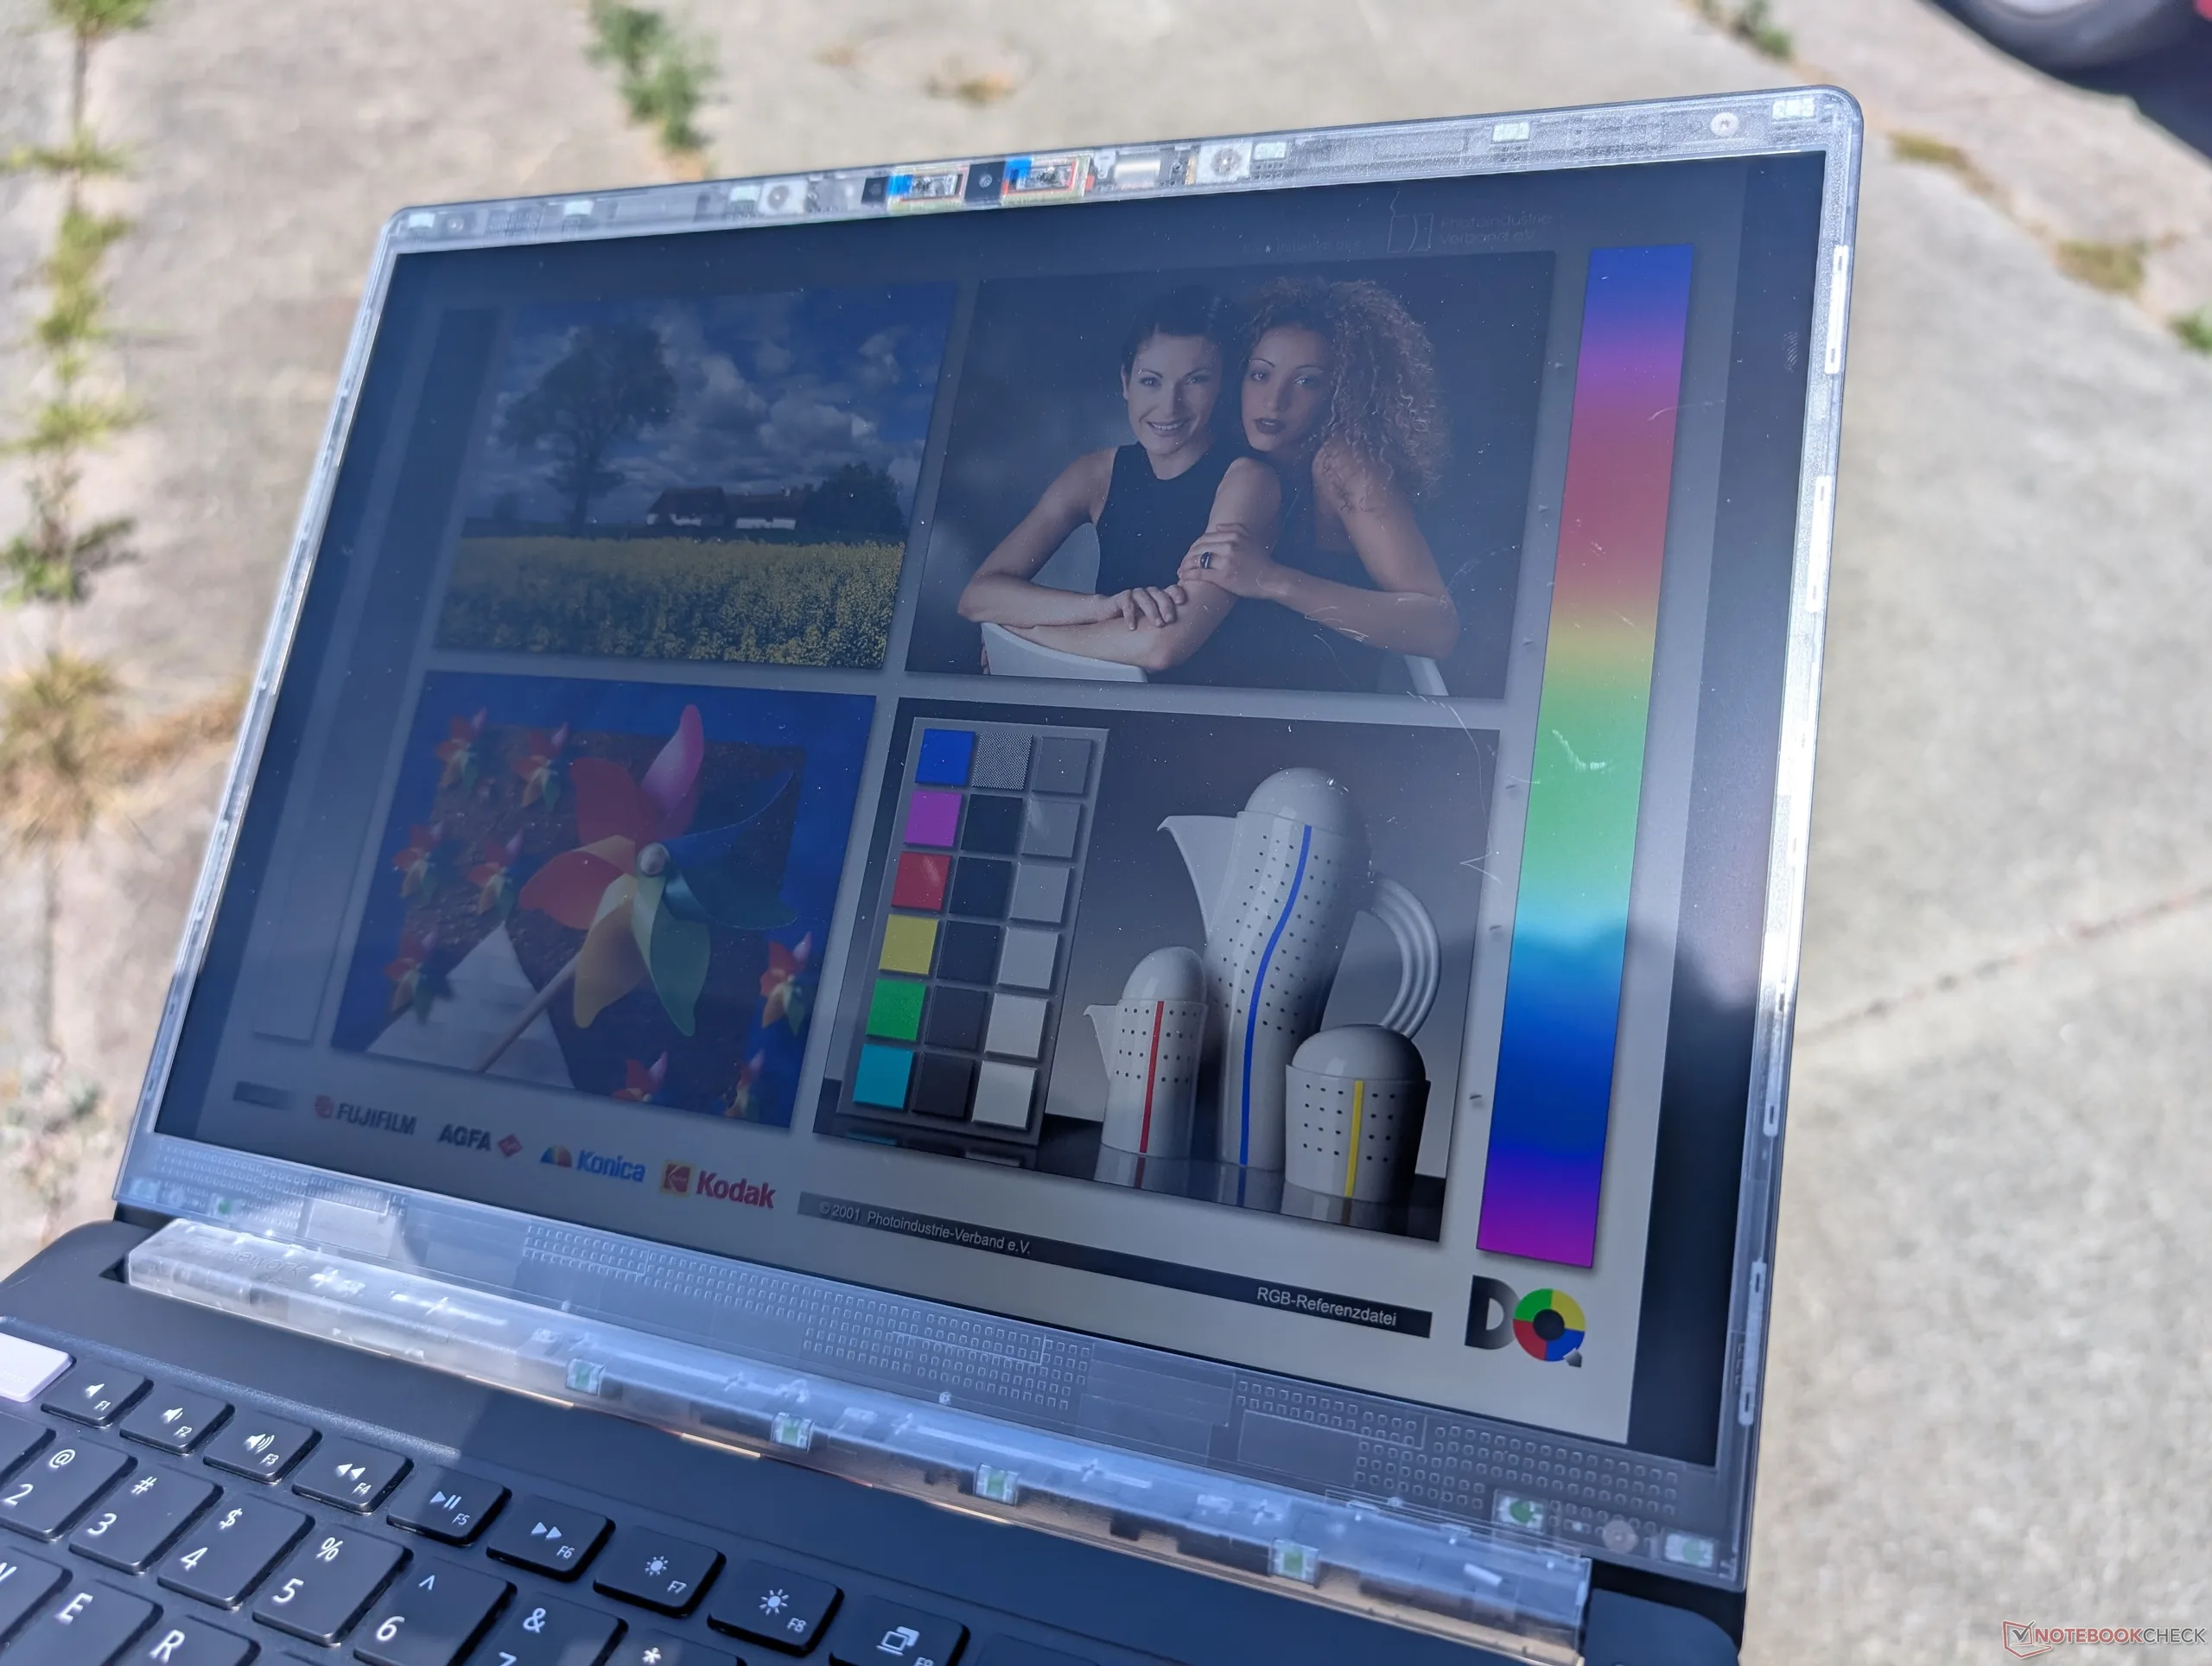
Im Freien unter Sonneneinstrahlung
ⓘ Notebookcheck
Im Freien unter Sonneneinstrahlung
Im Freien im Schatten
Im Freien unter Sonneneinstrahlung
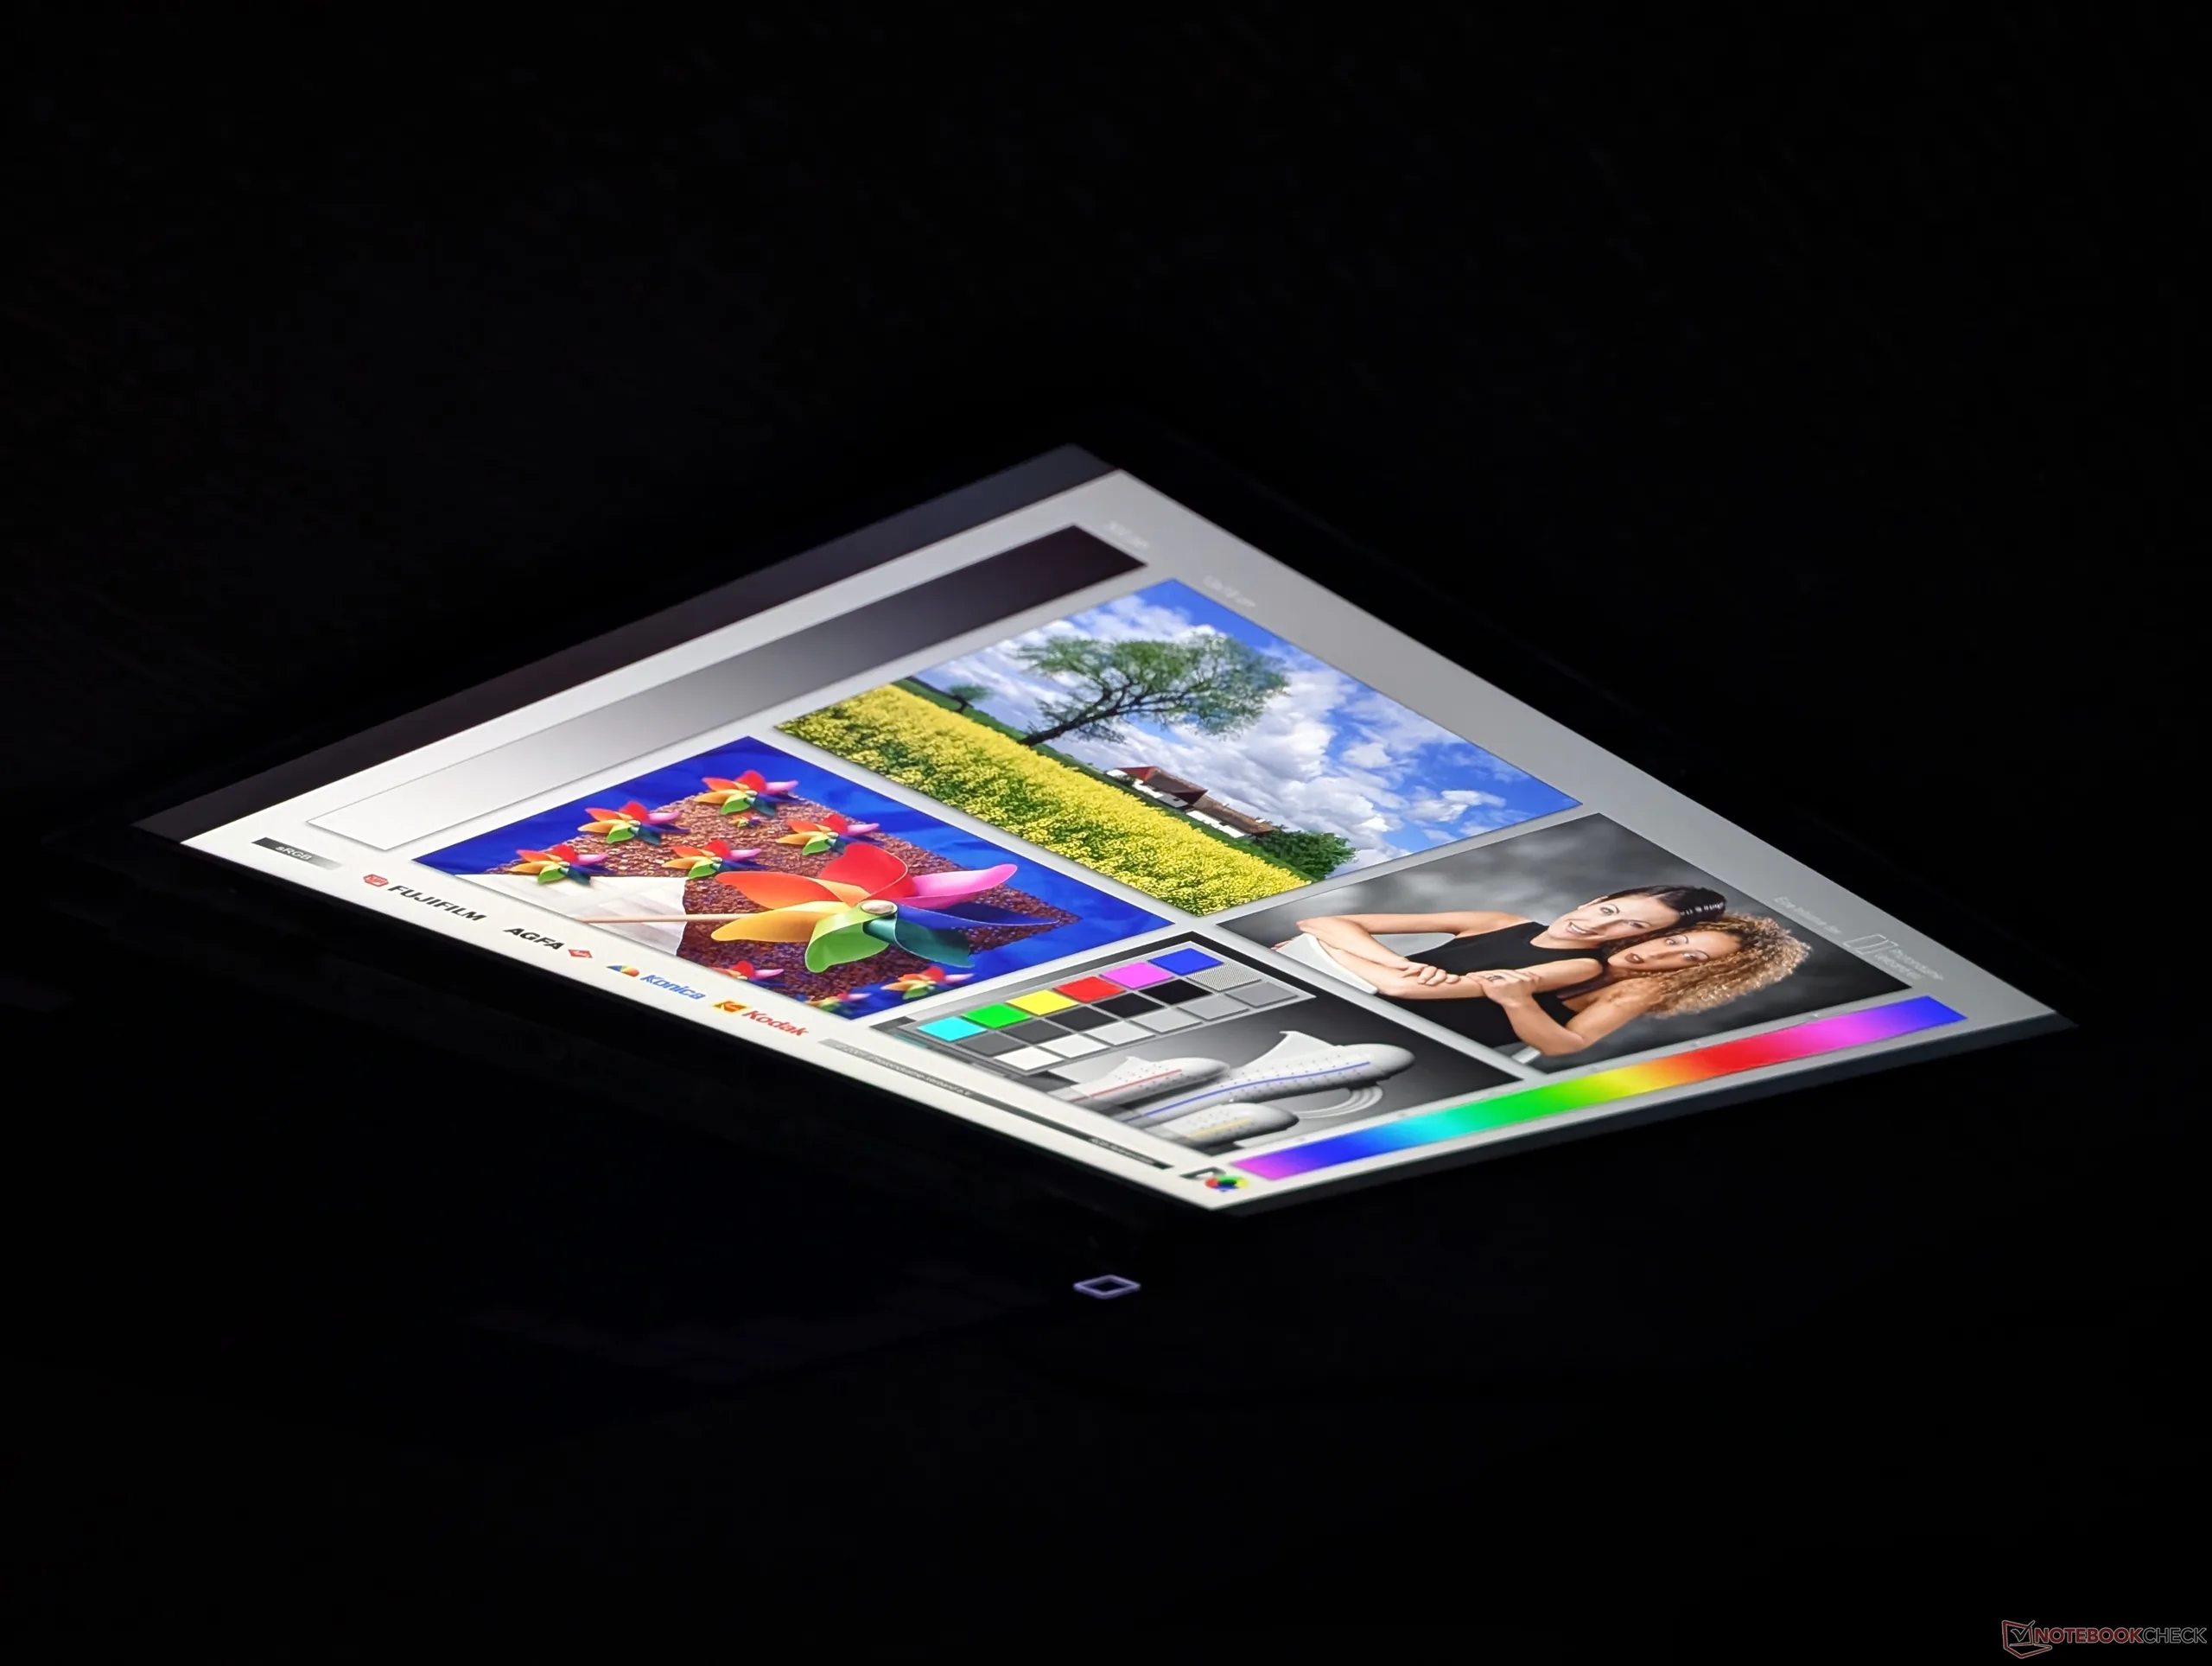
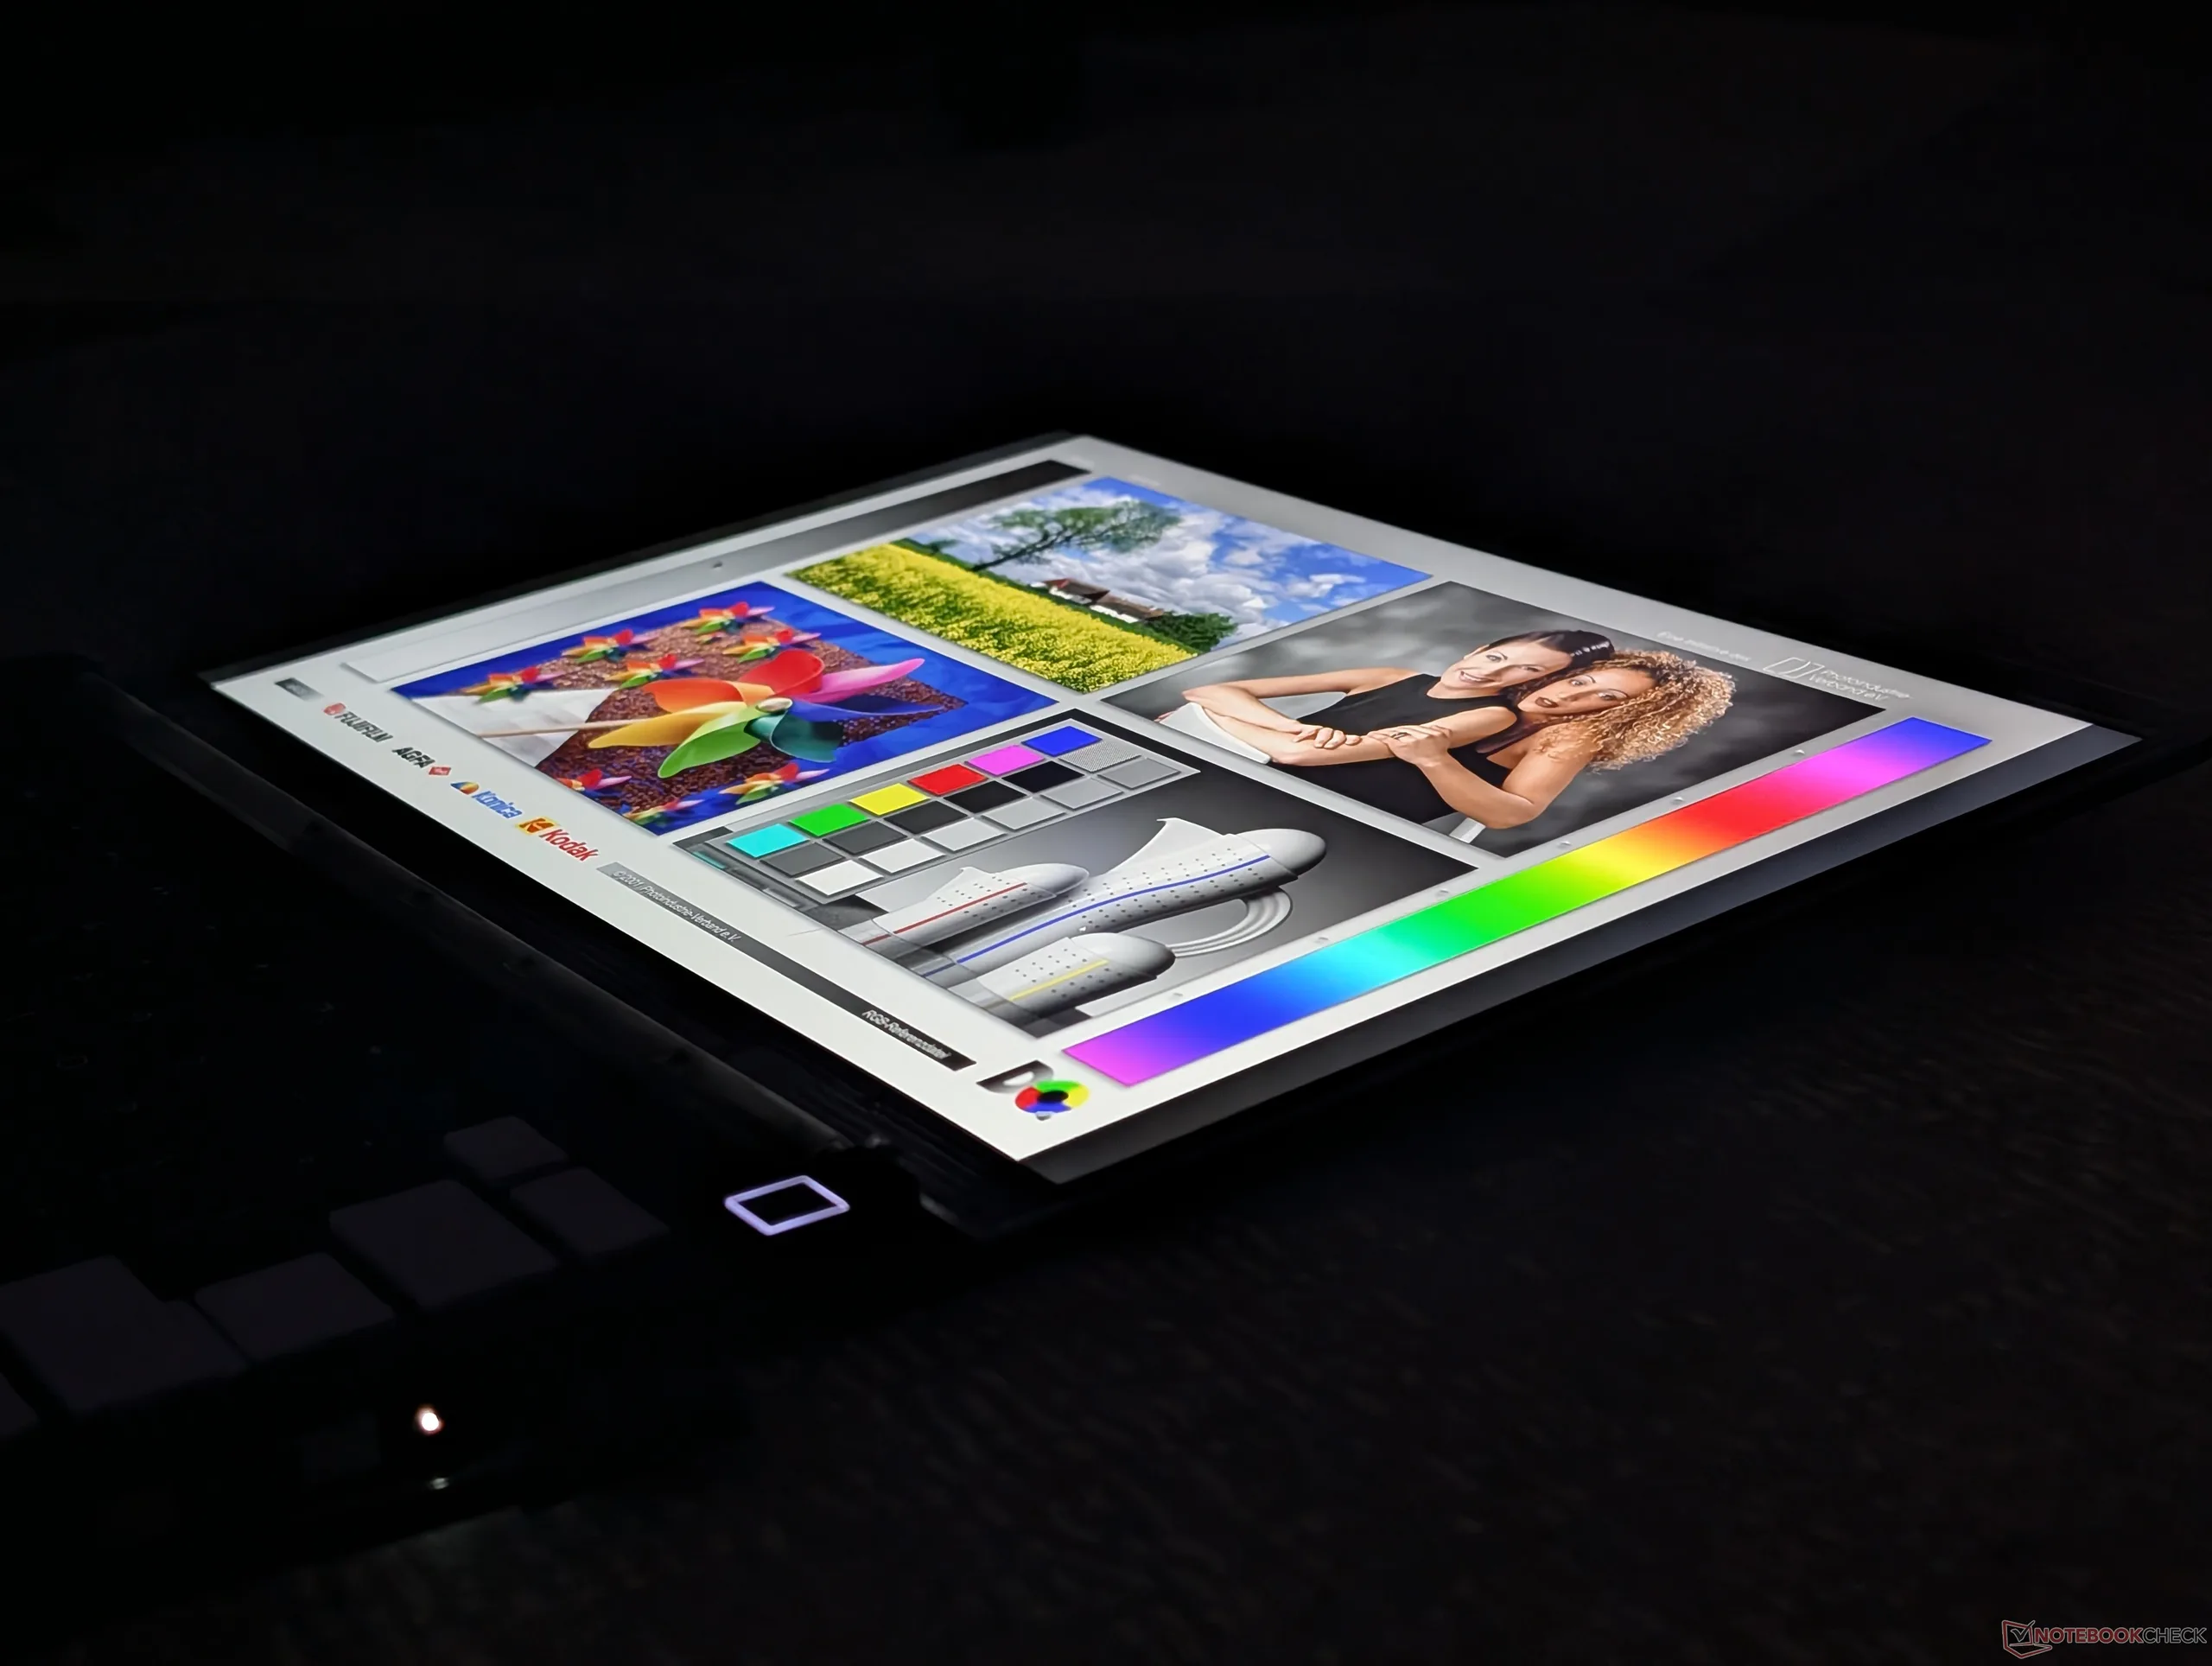
Breite IPS-Betrachtungswinkel

Leistung

Testbedingungen

Wir haben sowohl Windows als auch das BIOS vor der Durchführung der folgenden Benchmarks auf den Leistungsmodus eingestellt.

Prozessorleistung

Die reine Multithread-Leistung liegt zwischen 5 und 15 Prozent unter der anderer PCs mit dem gleichen Core Ultra X7 358H, einschließlich des aktuellen Dell XPS 13.

Cinebench R15 Multi Loop

065130195260325390455520585650715780845910975104011051170123513001365143014951560162516901755182018851950201520802145221022752340240524702535260026652730279528602925299030553120Tooltip
Framework Laptop 13 Pro Intel Core Ultra X7 358H: Ø2056 (1986.89-2374.87) Points
Framework Laptop 13.5 Ryzen AI 9 HX 370 AMD Ryzen AI 9 HX 370: Ø2507 (2436.8-2822.67) Points
Microsoft Surface Laptop 8 13.8 Qualcomm Snapdragon X2 Plus X2P-64-100: Ø1661 (1593.24-1992.73) Points
MSI Prestige 13 AI+ A3MG Intel Core Ultra 9 386H: Ø1637 (1576.85-2196.6) Points
Asus ExpertBook Ultra B9406CAA Intel Core Ultra X7 358H: Ø2886 (2802.49-3038.82) Points
Dell XPS 14 Core Ultra X7 358H Intel Core Ultra X7 358H: Ø2340 (2099.85-3134.55) Points
CPU Performance Rating: Percent
Cinebench 2026: CPU Multi
Cinebench 2024: CPU Single Core | CPU Multi Core
Cinebench R23: Multi Core | Single Core
Cinebench R20: CPU (Multi Core) | CPU (Single Core)
Cinebench R15: CPU Multi 64Bit | CPU Single 64Bit
Blender: v2.79 BMW27 CPU
7-Zip 18.03: 7z b 4 | 7z b 4 -mmt1
Geekbench 6.7: Multi-Core | Single-Core
Geekbench 5.5: Multi-Core | Single-Core
HWBOT x265 Benchmark v2.2: 4k Preset
LibreOffice : 20 Documents To PDF
R Benchmark 2.5: Overall mean
CPU Performance Rating
Asus ExpertBook Ultra B9406CAA
Intel Core Ultra X7 358H
88.1 pt
Dell XPS 14 Core Ultra X7 358H
Intel Core Ultra X7 358H
86.8 pt
Durchschnittliche Intel Core Ultra X7 358H
 
84.8 pt
Framework Laptop 13.5 Ryzen AI 9 HX 370 -1!
AMD Ryzen AI 9 HX 370
81.8 pt
Framework Laptop 13 Pro
Intel Core Ultra X7 358H
74.6 pt
HP OmniBook 7 Aero 13-bg1077nr -1!
AMD Ryzen AI 7 350
72.9 pt
MSI Prestige 13 AI+ A3MG -1!
Intel Core Ultra 9 386H
71.7 pt
Framework Laptop 13.5 Core Ultra 7 155H -1!
Intel Core Ultra 7 155H
66.8 pt
Microsoft Surface Laptop 8 13.8 -2!
Qualcomm Snapdragon X2 Plus X2P-64-100
62.3 pt
Dell Pro 13 Premium PA13250 -3!
Intel Core Ultra 7 268V
60.6 pt
HP EliteBook 8 Flip G1i 13 -1!
Intel Core Ultra 7 265U
58.6 pt
HP Elite Dragonfly G3 -5!
Intel Core i7-1265U
43.7 pt
Framework Laptop 13.5 -7!
Intel Core i7-1165G7
39.8 pt
Cinebench 2026 / CPU Multi
Asus ExpertBook Ultra B9406CAA
Intel Core Ultra X7 358H
4512 Points +31%
Durchschnittliche Intel Core Ultra X7 358H
  (3446 - 4512, n=6)
4072 Points +18%
Dell XPS 14 Core Ultra X7 358H
Intel Core Ultra X7 358H
3990 Points +16%
Microsoft Surface Laptop 8 13.8
Qualcomm Snapdragon X2 Plus X2P-64-100
3695 Points +7%
Framework Laptop 13 Pro
Intel Core Ultra X7 358H
3446 Points
Cinebench 2024 / CPU Single Core
Microsoft Surface Laptop 8 13.8
Qualcomm Snapdragon X2 Plus X2P-64-100
134 Points +15%
Dell XPS 14 Core Ultra X7 358H
Intel Core Ultra X7 358H
125.5 Points +7%
Asus ExpertBook Ultra B9406CAA
Intel Core Ultra X7 358H
124.2 Points +6%
Durchschnittliche Intel Core Ultra X7 358H
  (116.8 - 125.5, n=7)
123 Points +5%
MSI Prestige 13 AI+ A3MG
Intel Core Ultra 9 386H
120 Points +3%
Framework Laptop 13 Pro
Intel Core Ultra X7 358H
116.8 Points
HP OmniBook 7 Aero 13-bg1077nr
AMD Ryzen AI 7 350
115.5 Points -1%
Framework Laptop 13.5 Ryzen AI 9 HX 370
AMD Ryzen AI 9 HX 370
114.2 Points -2%
Framework Laptop 13.5 Core Ultra 7 155H
Intel Core Ultra 7 155H
103.5 Points -11%
HP EliteBook 8 Flip G1i 13
Intel Core Ultra 7 265U
102.3 Points -12%
Cinebench 2024 / CPU Multi Core
Asus ExpertBook Ultra B9406CAA
Intel Core Ultra X7 358H
1125 Points +31%
Durchschnittliche Intel Core Ultra X7 358H
  (859 - 1125, n=7)
1004 Points +17%
Dell XPS 14 Core Ultra X7 358H
Intel Core Ultra X7 358H
974 Points +13%
Framework Laptop 13.5 Ryzen AI 9 HX 370
AMD Ryzen AI 9 HX 370
916 Points +7%
MSI Prestige 13 AI+ A3MG
Intel Core Ultra 9 386H
873 Points +2%
Framework Laptop 13 Pro
Intel Core Ultra X7 358H
859 Points
Microsoft Surface Laptop 8 13.8
Qualcomm Snapdragon X2 Plus X2P-64-100
854 Points -1%
HP OmniBook 7 Aero 13-bg1077nr
AMD Ryzen AI 7 350
819 Points -5%
Framework Laptop 13.5 Core Ultra 7 155H
Intel Core Ultra 7 155H
677 Points -21%
HP EliteBook 8 Flip G1i 13
Intel Core Ultra 7 265U
517 Points -40%
Cinebench R23 / Multi Core
Asus ExpertBook Ultra B9406CAA
Intel Core Ultra X7 358H
19841 (17837.1min - 19840.9max) Points +50%
Dell XPS 14 Core Ultra X7 358H
Intel Core Ultra X7 358H
18932 (14811.1min - 18932.2max) Points +43%
Framework Laptop 13.5 Ryzen AI 9 HX 370
AMD Ryzen AI 9 HX 370
17963 (16252min - 17963max) Points +36%
Durchschnittliche Intel Core Ultra X7 358H
  (13187 - 19841, n=12)
17934 Points +36%
HP OmniBook 7 Aero 13-bg1077nr
AMD Ryzen AI 7 350
14244 (12235.7min - 14243.7max) Points +8%
Framework Laptop 13.5 Core Ultra 7 155H
Intel Core Ultra 7 155H
13247 (11787.9min - 13246.9max) Points 0%
Framework Laptop 13 Pro
Intel Core Ultra X7 358H
13204 (9744.21min - 13204.4max) Points
MSI Prestige 13 AI+ A3MG
Intel Core Ultra 9 386H
12144 Points -8%
HP EliteBook 8 Flip G1i 13
Intel Core Ultra 7 265U
10623 (8296.55min - 10623.2max) Points -20%
Dell Pro 13 Premium PA13250
Intel Core Ultra 7 268V
9835 Points -26%
Microsoft Surface Laptop 8 13.8
Qualcomm Snapdragon X2 Plus X2P-64-100
9777 Points -26%
HP Elite Dragonfly G3
Intel Core i7-1265U
6145 (5739.99min - 6144.82max) Points -53%
Framework Laptop 13.5
Intel Core i7-1165G7
5477 (5385.09min - 5477.06max) Points -59%
Cinebench R23 / Single Core
Dell XPS 14 Core Ultra X7 358H
Intel Core Ultra X7 358H
2086 Points +8%
Asus ExpertBook Ultra B9406CAA
Intel Core Ultra X7 358H
2079 Points +7%
MSI Prestige 13 AI+ A3MG
Intel Core Ultra 9 386H
2077 Points +7%
Durchschnittliche Intel Core Ultra X7 358H
  (1936 - 2087, n=11)
2062 Points +7%
Dell Pro 13 Premium PA13250
Intel Core Ultra 7 268V
1985 Points +3%
HP OmniBook 7 Aero 13-bg1077nr
AMD Ryzen AI 7 350
1979 Points +2%
Framework Laptop 13 Pro
Intel Core Ultra X7 358H
1936 Points
Framework Laptop 13.5 Ryzen AI 9 HX 370
AMD Ryzen AI 9 HX 370
1921 Points -1%
Framework Laptop 13.5 Core Ultra 7 155H
Intel Core Ultra 7 155H
1757 Points -9%
HP EliteBook 8 Flip G1i 13
Intel Core Ultra 7 265U
1749 Points -10%
HP Elite Dragonfly G3
Intel Core i7-1265U
1529 Points -21%
Framework Laptop 13.5
Intel Core i7-1165G7
1507 Points -22%
Microsoft Surface Laptop 8 13.8
Qualcomm Snapdragon X2 Plus X2P-64-100
1390 Points -28%
Cinebench R20 / CPU (Multi Core)
Asus ExpertBook Ultra B9406CAA
Intel Core Ultra X7 358H
7736 Points +63%
Dell XPS 14 Core Ultra X7 358H
Intel Core Ultra X7 358H
7437 Points +57%
Durchschnittliche Intel Core Ultra X7 358H
  (4751 - 7749, n=10)
7110 Points +50%
Framework Laptop 13.5 Ryzen AI 9 HX 370
AMD Ryzen AI 9 HX 370
7048 Points +48%
HP OmniBook 7 Aero 13-bg1077nr
AMD Ryzen AI 7 350
5404 Points +14%
Framework Laptop 13.5 Core Ultra 7 155H
Intel Core Ultra 7 155H
5160 Points +9%
MSI Prestige 13 AI+ A3MG
Intel Core Ultra 9 386H
4757 Points 0%
Framework Laptop 13 Pro
Intel Core Ultra X7 358H
4751 Points
HP EliteBook 8 Flip G1i 13
Intel Core Ultra 7 265U
4061 Points -15%
Dell Pro 13 Premium PA13250
Intel Core Ultra 7 268V
3811 Points -20%
Microsoft Surface Laptop 8 13.8
Qualcomm Snapdragon X2 Plus X2P-64-100
3773 Points -21%
HP Elite Dragonfly G3
Intel Core i7-1265U
2365 Points -50%
Framework Laptop 13.5
Intel Core i7-1165G7
2119 Points -55%
Cinebench R20 / CPU (Single Core)
Dell XPS 14 Core Ultra X7 358H
Intel Core Ultra X7 358H
792 Points +8%
Asus ExpertBook Ultra B9406CAA
Intel Core Ultra X7 358H
788 Points +7%
MSI Prestige 13 AI+ A3MG
Intel Core Ultra 9 386H
787 Points +7%
Durchschnittliche Intel Core Ultra X7 358H
  (736 - 792, n=10)
778 Points +6%
HP OmniBook 7 Aero 13-bg1077nr
AMD Ryzen AI 7 350
774 Points +5%
Dell Pro 13 Premium PA13250
Intel Core Ultra 7 268V
764 Points +4%
Framework Laptop 13.5 Ryzen AI 9 HX 370
AMD Ryzen AI 9 HX 370
753 Points +2%
Framework Laptop 13 Pro
Intel Core Ultra X7 358H
736 Points
HP EliteBook 8 Flip G1i 13
Intel Core Ultra 7 265U
678 Points -8%
Framework Laptop 13.5 Core Ultra 7 155H
Intel Core Ultra 7 155H
669 Points -9%
HP Elite Dragonfly G3
Intel Core i7-1265U
586 Points -20%
Framework Laptop 13.5
Intel Core i7-1165G7
580 Points -21%
Microsoft Surface Laptop 8 13.8
Qualcomm Snapdragon X2 Plus X2P-64-100
533 Points -28%
Cinebench R15 / CPU Multi 64Bit
Dell XPS 14 Core Ultra X7 358H
Intel Core Ultra X7 358H
3135 (2099.85min - 3134.55max) Points +32%
Asus ExpertBook Ultra B9406CAA
Intel Core Ultra X7 358H
3039 (2802.49min - 3038.82max) Points +28%
Durchschnittliche Intel Core Ultra X7 358H
  (2375 - 3135, n=10)
2963 Points +25%
Framework Laptop 13.5 Ryzen AI 9 HX 370
AMD Ryzen AI 9 HX 370
2823 (2436.8min - 2822.67max) Points +19%
Framework Laptop 13 Pro
Intel Core Ultra X7 358H
2375 (1986.89min - 2374.87max) Points
Framework Laptop 13.5 Core Ultra 7 155H
Intel Core Ultra 7 155H
2337 (1807.26min - 2336.72max) Points -2%
MSI Prestige 13 AI+ A3MG
Intel Core Ultra 9 386H
2197 (1576.85min - 2196.6max) Points -7%
HP OmniBook 7 Aero 13-bg1077nr
AMD Ryzen AI 7 350
2038 (1917.36min - 2037.7max) Points -14%
Microsoft Surface Laptop 8 13.8
Qualcomm Snapdragon X2 Plus X2P-64-100
1993 (1593.24min - 1992.73max) Points -16%
HP EliteBook 8 Flip G1i 13
Intel Core Ultra 7 265U
1736 (1258.93min - 1735.81max) Points -27%
Dell Pro 13 Premium PA13250
Intel Core Ultra 7 268V
1601 (1128.6min - 1600.9max) Points -33%
HP Elite Dragonfly G3
Intel Core i7-1265U
1204 (961.28min - 1204.49max) Points -49%
Framework Laptop 13.5
Intel Core i7-1165G7
850 (812.27min - 850.43max) Points -64%
Cinebench R15 / CPU Single 64Bit
Dell XPS 14 Core Ultra X7 358H
Intel Core Ultra X7 358H
312 Points +19%
Asus ExpertBook Ultra B9406CAA
Intel Core Ultra X7 358H
309 Points +18%
Dell Pro 13 Premium PA13250
Intel Core Ultra 7 268V
302 Points +15%
Durchschnittliche Intel Core Ultra X7 358H
  (262 - 312, n=10)
298 Points +14%
HP OmniBook 7 Aero 13-bg1077nr
AMD Ryzen AI 7 350
297 Points +13%
Framework Laptop 13.5 Ryzen AI 9 HX 370
AMD Ryzen AI 9 HX 370
293 Points +12%
MSI Prestige 13 AI+ A3MG
Intel Core Ultra 9 386H
293 Points +12%
Framework Laptop 13 Pro
Intel Core Ultra X7 358H
262 Points
Microsoft Surface Laptop 8 13.8
Qualcomm Snapdragon X2 Plus X2P-64-100
260 Points -1%
Framework Laptop 13.5 Core Ultra 7 155H
Intel Core Ultra 7 155H
257 Points -2%
HP EliteBook 8 Flip G1i 13
Intel Core Ultra 7 265U
244 Points -7%
Framework Laptop 13.5
Intel Core i7-1165G7
224 Points -15%
HP Elite Dragonfly G3
Intel Core i7-1265U
224 Points -15%
Blender / v2.79 BMW27 CPU
Framework Laptop 13.5
Intel Core i7-1165G7
551 Seconds * -154%
HP Elite Dragonfly G3
Intel Core i7-1265U
484 Seconds * -123%
Dell Pro 13 Premium PA13250
Intel Core Ultra 7 268V
410 Seconds * -89%
Microsoft Surface Laptop 8 13.8
Qualcomm Snapdragon X2 Plus X2P-64-100
358 Seconds * -65%
HP EliteBook 8 Flip G1i 13
Intel Core Ultra 7 265U
335 Seconds * -54%
MSI Prestige 13 AI+ A3MG
Intel Core Ultra 9 386H
299 Seconds * -38%
Framework Laptop 13.5 Core Ultra 7 155H
Intel Core Ultra 7 155H
258 Seconds * -19%
HP OmniBook 7 Aero 13-bg1077nr
AMD Ryzen AI 7 350
230 Seconds * -6%
Framework Laptop 13 Pro
Intel Core Ultra X7 358H
217 Seconds *
Dell XPS 14 Core Ultra X7 358H
Intel Core Ultra X7 358H
196 Seconds * +10%
Durchschnittliche Intel Core Ultra X7 358H
  (171 - 218, n=10)
193 Seconds * +11%
Framework Laptop 13.5 Ryzen AI 9 HX 370
AMD Ryzen AI 9 HX 370
182 Seconds * +16%
Asus ExpertBook Ultra B9406CAA
Intel Core Ultra X7 358H
175 Seconds * +19%
7-Zip 18.03 / 7z b 4
Framework Laptop 13.5 Ryzen AI 9 HX 370
AMD Ryzen AI 9 HX 370
70680 MIPS +27%
Asus ExpertBook Ultra B9406CAA
Intel Core Ultra X7 358H
68533 MIPS +24%
Dell XPS 14 Core Ultra X7 358H
Intel Core Ultra X7 358H
64255 MIPS +16%
Durchschnittliche Intel Core Ultra X7 358H
  (55491 - 68930, n=10)
63928 MIPS +15%
Framework Laptop 13 Pro
Intel Core Ultra X7 358H
55491 MIPS
HP OmniBook 7 Aero 13-bg1077nr
AMD Ryzen AI 7 350
55010 MIPS -1%
Framework Laptop 13.5 Core Ultra 7 155H
Intel Core Ultra 7 155H
52680 MIPS -5%
MSI Prestige 13 AI+ A3MG
Intel Core Ultra 9 386H
44980 MIPS -19%
Microsoft Surface Laptop 8 13.8
Qualcomm Snapdragon X2 Plus X2P-64-100
43860 MIPS -21%
HP EliteBook 8 Flip G1i 13
Intel Core Ultra 7 265U
38771 MIPS -30%
Dell Pro 13 Premium PA13250
Intel Core Ultra 7 268V
32797 MIPS -41%
HP Elite Dragonfly G3
Intel Core i7-1265U
30561 MIPS -45%
Framework Laptop 13.5
Intel Core i7-1165G7
24436 MIPS -56%
7-Zip 18.03 / 7z b 4 -mmt1
Dell XPS 14 Core Ultra X7 358H
Intel Core Ultra X7 358H
6526 MIPS +9%
Durchschnittliche Intel Core Ultra X7 358H
  (5984 - 6526, n=10)
6254 MIPS +5%
Asus ExpertBook Ultra B9406CAA
Intel Core Ultra X7 358H
6170 MIPS +3%
Framework Laptop 13.5 Ryzen AI 9 HX 370
AMD Ryzen AI 9 HX 370
6041 MIPS +1%
HP OmniBook 7 Aero 13-bg1077nr
AMD Ryzen AI 7 350
6025 MIPS +1%
MSI Prestige 13 AI+ A3MG
Intel Core Ultra 9 386H
6001 MIPS 0%
Framework Laptop 13 Pro
Intel Core Ultra X7 358H
5984 MIPS
Dell Pro 13 Premium PA13250
Intel Core Ultra 7 268V
5884 MIPS -2%
Microsoft Surface Laptop 8 13.8
Qualcomm Snapdragon X2 Plus X2P-64-100
5710 MIPS -5%
Framework Laptop 13.5
Intel Core i7-1165G7
5405 MIPS -10%
Framework Laptop 13.5 Core Ultra 7 155H
Intel Core Ultra 7 155H
5355 MIPS -11%
HP EliteBook 8 Flip G1i 13
Intel Core Ultra 7 265U
5088 MIPS -15%
HP Elite Dragonfly G3
Intel Core i7-1265U
4976 MIPS -17%
Geekbench 6.7 / Multi-Core
Dell XPS 14 Core Ultra X7 358H
Intel Core Ultra X7 358H
17121 Points +20%
Asus ExpertBook Ultra B9406CAA
Intel Core Ultra X7 358H
16674 Points +17%
Durchschnittliche Intel Core Ultra X7 358H
  (14309 - 17121, n=11)
16403 Points +15%
Framework Laptop 13.5 Ryzen AI 9 HX 370
AMD Ryzen AI 9 HX 370
14531 Points +2%
Framework Laptop 13 Pro
Intel Core Ultra X7 358H
14309 Points
Microsoft Surface Laptop 8 13.8
Qualcomm Snapdragon X2 Plus X2P-64-100
14277 Points 0%
MSI Prestige 13 AI+ A3MG
Intel Core Ultra 9 386H
13776 Points -4%
HP OmniBook 7 Aero 13-bg1077nr
AMD Ryzen AI 7 350
13083 Points -9%
Framework Laptop 13.5 Core Ultra 7 155H
Intel Core Ultra 7 155H
12027 Points -16%
HP EliteBook 8 Flip G1i 13
Intel Core Ultra 7 265U
10707 Points -25%
Dell Pro 13 Premium PA13250
Intel Core Ultra 7 268V
10589 Points -26%
Geekbench 6.7 / Single-Core
Microsoft Surface Laptop 8 13.8
Qualcomm Snapdragon X2 Plus X2P-64-100
3265 Points +18%
Dell XPS 14 Core Ultra X7 358H
Intel Core Ultra X7 358H
2927 Points +5%
HP OmniBook 7 Aero 13-bg1077nr
AMD Ryzen AI 7 350
2886 Points +4%
MSI Prestige 13 AI+ A3MG
Intel Core Ultra 9 386H
2873 Points +3%
Durchschnittliche Intel Core Ultra X7 358H
  (2778 - 2927, n=11)
2867 Points +3%
Framework Laptop 13.5 Ryzen AI 9 HX 370
AMD Ryzen AI 9 HX 370
2857 Points +3%
Asus ExpertBook Ultra B9406CAA
Intel Core Ultra X7 358H
2836 Points +2%
Dell Pro 13 Premium PA13250
Intel Core Ultra 7 268V
2809 Points +1%
Framework Laptop 13 Pro
Intel Core Ultra X7 358H
2778 Points
HP EliteBook 8 Flip G1i 13
Intel Core Ultra 7 265U
2477 Points -11%
Framework Laptop 13.5 Core Ultra 7 155H
Intel Core Ultra 7 155H
2414 Points -13%
Geekbench 5.5 / Multi-Core
Dell XPS 14 Core Ultra X7 358H
Intel Core Ultra X7 358H
17028 Points +22%
Asus ExpertBook Ultra B9406CAA
Intel Core Ultra X7 358H
16929 Points +21%
Durchschnittliche Intel Core Ultra X7 358H
  (13951 - 17028, n=10)
16306 Points +17%
Framework Laptop 13.5 Ryzen AI 9 HX 370
AMD Ryzen AI 9 HX 370
14192 Points +2%
Framework Laptop 13 Pro
Intel Core Ultra X7 358H
13951 Points
MSI Prestige 13 AI+ A3MG
Intel Core Ultra 9 386H
13098 Points -6%
Framework Laptop 13.5 Core Ultra 7 155H
Intel Core Ultra 7 155H
11409 Points -18%
HP OmniBook 7 Aero 13-bg1077nr
AMD Ryzen AI 7 350
11254 Points -19%
HP EliteBook 8 Flip G1i 13
Intel Core Ultra 7 265U
9683 Points -31%
Dell Pro 13 Premium PA13250
Intel Core Ultra 7 268V
9491 Points -32%
HP Elite Dragonfly G3
Intel Core i7-1265U
8096 Points -42%
Geekbench 5.5 / Single-Core
Dell XPS 14 Core Ultra X7 358H
Intel Core Ultra X7 358H
2142 Points +6%
HP OmniBook 7 Aero 13-bg1077nr
AMD Ryzen AI 7 350
2132 Points +5%
Asus ExpertBook Ultra B9406CAA
Intel Core Ultra X7 358H
2116 Points +4%
MSI Prestige 13 AI+ A3MG
Intel Core Ultra 9 386H
2104 Points +4%
Framework Laptop 13.5 Ryzen AI 9 HX 370
AMD Ryzen AI 9 HX 370
2096 Points +3%
Durchschnittliche Intel Core Ultra X7 358H
  (2027 - 2142, n=10)
2093 Points +3%
Framework Laptop 13 Pro
Intel Core Ultra X7 358H
2027 Points
Dell Pro 13 Premium PA13250
Intel Core Ultra 7 268V
2008 Points -1%
HP EliteBook 8 Flip G1i 13
Intel Core Ultra 7 265U
1815 Points -10%
Framework Laptop 13.5 Core Ultra 7 155H
Intel Core Ultra 7 155H
1753 Points -14%
HP Elite Dragonfly G3
Intel Core i7-1265U
1515 Points -25%
HWBOT x265 Benchmark v2.2 / 4k Preset
Asus ExpertBook Ultra B9406CAA
Intel Core Ultra X7 358H
23.1 fps +28%
Framework Laptop 13.5 Ryzen AI 9 HX 370
AMD Ryzen AI 9 HX 370
22.4 fps +24%
Durchschnittliche Intel Core Ultra X7 358H
  (18.1 - 23.1, n=10)
21.1 fps +17%
Dell XPS 14 Core Ultra X7 358H
Intel Core Ultra X7 358H
20.7 fps +14%
Framework Laptop 13 Pro
Intel Core Ultra X7 358H
18.1 fps
Framework Laptop 13.5 Core Ultra 7 155H
Intel Core Ultra 7 155H
14 fps -23%
HP OmniBook 7 Aero 13-bg1077nr
AMD Ryzen AI 7 350
14 fps -23%
MSI Prestige 13 AI+ A3MG
Intel Core Ultra 9 386H
13.2 fps -27%
HP EliteBook 8 Flip G1i 13
Intel Core Ultra 7 265U
11.4 fps -37%
Dell Pro 13 Premium PA13250
Intel Core Ultra 7 268V
10.4 fps -43%
HP Elite Dragonfly G3
Intel Core i7-1265U
7.76 fps -57%
Microsoft Surface Laptop 8 13.8
Qualcomm Snapdragon X2 Plus X2P-64-100
7.14 fps -61%
Framework Laptop 13.5
Intel Core i7-1165G7
7.05 fps -61%
LibreOffice / 20 Documents To PDF
HP Elite Dragonfly G3
Intel Core i7-1265U
61.6 s * -34%
Dell Pro 13 Premium PA13250
Intel Core Ultra 7 268V
60.8 s * -32%
HP EliteBook 8 Flip G1i 13
Intel Core Ultra 7 265U
58.1 s * -26%
MSI Prestige 13 AI+ A3MG
Intel Core Ultra 9 386H
56.1 s * -22%
Framework Laptop 13.5 Ryzen AI 9 HX 370
AMD Ryzen AI 9 HX 370
52.9 s * -15%
Asus ExpertBook Ultra B9406CAA
Intel Core Ultra X7 358H
51.9 s * -13%
HP OmniBook 7 Aero 13-bg1077nr
AMD Ryzen AI 7 350
51.2 s * -11%
Framework Laptop 13.5 Core Ultra 7 155H
Intel Core Ultra 7 155H
47.9 s * -4%
Microsoft Surface Laptop 8 13.8
Qualcomm Snapdragon X2 Plus X2P-64-100
47.6 s * -3%
Durchschnittliche Intel Core Ultra X7 358H
  (38.5 - 56.9, n=10)
47.4 s * -3%
Framework Laptop 13 Pro
Intel Core Ultra X7 358H
46.1 s *
Dell XPS 14 Core Ultra X7 358H
Intel Core Ultra X7 358H
45.9 s * -0%
Framework Laptop 13.5
Intel Core i7-1165G7
45.1 s * +2%
R Benchmark 2.5 / Overall mean
Microsoft Surface Laptop 8 13.8
Qualcomm Snapdragon X2 Plus X2P-64-100
0.586 sec * -33%
Framework Laptop 13.5
Intel Core i7-1165G7
0.566 sec * -28%
HP Elite Dragonfly G3
Intel Core i7-1265U
0.533 sec * -21%
HP EliteBook 8 Flip G1i 13
Intel Core Ultra 7 265U
0.492 sec * -11%
Framework Laptop 13.5 Core Ultra 7 155H
Intel Core Ultra 7 155H
0.4706 sec * -6%
HP OmniBook 7 Aero 13-bg1077nr
AMD Ryzen AI 7 350
0.4555 sec * -3%
Framework Laptop 13 Pro
Intel Core Ultra X7 358H
0.442 sec *
Dell Pro 13 Premium PA13250
Intel Core Ultra 7 268V
0.4344 sec * +2%
MSI Prestige 13 AI+ A3MG
Intel Core Ultra 9 386H
0.4312 sec * +2%
Durchschnittliche Intel Core Ultra X7 358H
  (0.4127 - 0.4483, n=11)
0.4265 sec * +4%
Asus ExpertBook Ultra B9406CAA
Intel Core Ultra X7 358H
0.4247 sec * +4%
Framework Laptop 13.5 Ryzen AI 9 HX 370
AMD Ryzen AI 9 HX 370
0.4151 sec * +6%
Dell XPS 14 Core Ultra X7 358H
Intel Core Ultra X7 358H
0.4127 sec * +7%
CPU Performance Rating: Percent
Cinebench 2026: CPU Multi
Cinebench 2024: CPU Single Core | CPU Multi Core
Cinebench R23: Multi Core | Single Core
Cinebench R20: CPU (Multi Core) | CPU (Single Core)
Cinebench R15: CPU Multi 64Bit | CPU Single 64Bit
Blender: v2.79 BMW27 CPU
7-Zip 18.03: 7z b 4 | 7z b 4 -mmt1
Geekbench 6.7: Multi-Core | Single-Core
Geekbench 5.5: Multi-Core | Single-Core
HWBOT x265 Benchmark v2.2: 4k Preset
LibreOffice : 20 Documents To PDF
R Benchmark 2.5: Overall mean

* ... kleinere Werte sind besser
Cinebench R15 CPU Multi 64Bit
2375 Points
Cinebench R15 OpenGL 64Bit
163.9 fps
Cinebench R15 Ref. Match 64Bit
97.8 %
Cinebench R15 CPU Single 64Bit
262 Points
Cinebench R20 CPU (Multi Core)
4751 Points
Cinebench R20 CPU (Single Core)
736 Points
Cinebench R23 Single Core
1936 Points
Cinebench R23 Multi Core
13204 Points
Cinebench 2024 CPU Multi Core
859 Points
Cinebench 2024 CPU Single Core
116.8 Points
Cinebench 2026 CPU Single Thread
479 Points
Cinebench 2026 CPU Multi
3446 Points
Hilfe
Performance Rating
Framework Laptop 13.5 Ryzen AI 9 HX 370 -1!
AMD Ryzen AI 9 HX 370, Radeon 890M
95.3 pt
Dell XPS 14 Core Ultra X7 358H
Intel Core Ultra X7 358H, Arc B390 Panther Lake iGPU
73.9 pt
Durchschnittliche Intel Core Ultra X7 358H
 
73.1 pt
Framework Laptop 13 Pro -1!
Intel Core Ultra X7 358H, Arc B390 Panther Lake iGPU
68.2 pt
MSI Prestige 13 AI+ A3MG -2!
Intel Core Ultra 9 386H, Intel Graphics 4 Xe3 PTL
49.5 pt
Asus ExpertBook Ultra B9406CAA -1!
Intel Core Ultra X7 358H, Arc B390 Panther Lake iGPU
48.2 pt
Microsoft Surface Laptop 8 13.8 -1!
Qualcomm Snapdragon X2 Plus X2P-64-100, Adreno X2-45
32.5 pt
AIDA64 / FP32 Ray-Trace
Framework Laptop 13.5 Ryzen AI 9 HX 370
AMD Ryzen AI 9 HX 370, Radeon 890M (v6.92.6600)
27217 KRay/s +77%
Durchschnittliche Intel Core Ultra X7 358H
  (12221 - 18710, n=10)
15799 KRay/s +3%
Framework Laptop 13 Pro
Intel Core Ultra X7 358H, Arc B390 Panther Lake iGPU (v8.20.8100)
15375 KRay/s
Dell XPS 14 Core Ultra X7 358H
Intel Core Ultra X7 358H, Arc B390 Panther Lake iGPU (v8.20.8100)
14318 KRay/s -7%
Asus ExpertBook Ultra B9406CAA
Intel Core Ultra X7 358H, Arc B390 Panther Lake iGPU (v6.92.6600)
12221 KRay/s -21%
MSI Prestige 13 AI+ A3MG
Intel Core Ultra 9 386H, Intel Graphics 4 Xe3 PTL (v8.20.8100)
10001 KRay/s -35%
Microsoft Surface Laptop 8 13.8
Qualcomm Snapdragon X2 Plus X2P-64-100, Adreno X2-45 (v8.20.8100)
6001 KRay/s -61%
AIDA64 / FPU Julia
Framework Laptop 13.5 Ryzen AI 9 HX 370
AMD Ryzen AI 9 HX 370, Radeon 890M (v6.92.6600)
104423 Points +38%
Durchschnittliche Intel Core Ultra X7 358H
  (29930 - 96559, n=10)
79052 Points +5%
Dell XPS 14 Core Ultra X7 358H
Intel Core Ultra X7 358H, Arc B390 Panther Lake iGPU (v8.20.8100)
77086 Points +2%
Framework Laptop 13 Pro
Intel Core Ultra X7 358H, Arc B390 Panther Lake iGPU (v8.20.8100)
75574 Points
MSI Prestige 13 AI+ A3MG
Intel Core Ultra 9 386H, Intel Graphics 4 Xe3 PTL (v8.20.8100)
53370 Points -29%
Asus ExpertBook Ultra B9406CAA
Intel Core Ultra X7 358H, Arc B390 Panther Lake iGPU (v6.92.6600)
29930 Points -60%
Microsoft Surface Laptop 8 13.8
Qualcomm Snapdragon X2 Plus X2P-64-100, Adreno X2-45 (v8.20.8100)
24238 Points -68%
AIDA64 / CPU SHA3
Framework Laptop 13.5 Ryzen AI 9 HX 370
AMD Ryzen AI 9 HX 370, Radeon 890M (v6.92.6600)
4796 MB/s +14%
Asus ExpertBook Ultra B9406CAA
Intel Core Ultra X7 358H, Arc B390 Panther Lake iGPU (v6.92.6600)
4549 MB/s +8%
Durchschnittliche Intel Core Ultra X7 358H
  (3910 - 4955, n=10)
4374 MB/s +4%
Framework Laptop 13 Pro
Intel Core Ultra X7 358H, Arc B390 Panther Lake iGPU (v8.20.8100)
4224 MB/s
Dell XPS 14 Core Ultra X7 358H
Intel Core Ultra X7 358H, Arc B390 Panther Lake iGPU (v8.20.8100)
4033 MB/s -5%
MSI Prestige 13 AI+ A3MG
Intel Core Ultra 9 386H, Intel Graphics 4 Xe3 PTL (v8.20.8100)
2776 MB/s -34%
Microsoft Surface Laptop 8 13.8
Qualcomm Snapdragon X2 Plus X2P-64-100, Adreno X2-45 (v8.20.8100)
2630 MB/s -38%
AIDA64 / CPU Queen
Framework Laptop 13.5 Ryzen AI 9 HX 370
AMD Ryzen AI 9 HX 370, Radeon 890M (v6.92.6600)
84646 Points
Dell XPS 14 Core Ultra X7 358H
Intel Core Ultra X7 358H, Arc B390 Panther Lake iGPU (v6.92.6600)
63827 Points
Durchschnittliche Intel Core Ultra X7 358H
  (63425 - 63827, n=2)
63626 Points
Asus ExpertBook Ultra B9406CAA
Intel Core Ultra X7 358H, Arc B390 Panther Lake iGPU (v6.92.6600)
63425 Points
AIDA64 / FPU SinJulia
Framework Laptop 13.5 Ryzen AI 9 HX 370
AMD Ryzen AI 9 HX 370, Radeon 890M (v6.92.6600)
16879 Points +192%
Dell XPS 14 Core Ultra X7 358H
Intel Core Ultra X7 358H, Arc B390 Panther Lake iGPU (v8.20.8100)
6919 Points +20%
Durchschnittliche Intel Core Ultra X7 358H
  (4735 - 7038, n=10)
6539 Points +13%
Framework Laptop 13 Pro
Intel Core Ultra X7 358H, Arc B390 Panther Lake iGPU (v8.20.8100)
5772 Points
MSI Prestige 13 AI+ A3MG
Intel Core Ultra 9 386H, Intel Graphics 4 Xe3 PTL (v8.20.8100)
5314 Points -8%
Asus ExpertBook Ultra B9406CAA
Intel Core Ultra X7 358H, Arc B390 Panther Lake iGPU (v6.92.6600)
4735 Points -18%
Microsoft Surface Laptop 8 13.8
Qualcomm Snapdragon X2 Plus X2P-64-100, Adreno X2-45 (v8.20.8100)
2099 Points -64%
AIDA64 / FPU Mandel
Framework Laptop 13.5 Ryzen AI 9 HX 370
AMD Ryzen AI 9 HX 370, Radeon 890M (v6.92.6600)
54537 Points +34%
Durchschnittliche Intel Core Ultra X7 358H
  (14716 - 50766, n=10)
42014 Points +3%
Framework Laptop 13 Pro
Intel Core Ultra X7 358H, Arc B390 Panther Lake iGPU (v8.20.8100)
40607 Points
Dell XPS 14 Core Ultra X7 358H
Intel Core Ultra X7 358H, Arc B390 Panther Lake iGPU (v8.20.8100)
40542 Points 0%
MSI Prestige 13 AI+ A3MG
Intel Core Ultra 9 386H, Intel Graphics 4 Xe3 PTL (v8.20.8100)
28414 Points -30%
Asus ExpertBook Ultra B9406CAA
Intel Core Ultra X7 358H, Arc B390 Panther Lake iGPU (v6.92.6600)
14716 Points -64%
Microsoft Surface Laptop 8 13.8
Qualcomm Snapdragon X2 Plus X2P-64-100, Adreno X2-45 (v8.20.8100)
12620 Points -69%
AIDA64 / CPU AES
Framework Laptop 13.5 Ryzen AI 9 HX 370
AMD Ryzen AI 9 HX 370, Radeon 890M (v6.92.6600)
96781 MB/s +76%
Dell XPS 14 Core Ultra X7 358H
Intel Core Ultra X7 358H, Arc B390 Panther Lake iGPU (v8.20.8100)
63775 MB/s +16%
Durchschnittliche Intel Core Ultra X7 358H
  (5127 - 68737, n=10)
57135 MB/s +4%
Framework Laptop 13 Pro
Intel Core Ultra X7 358H, Arc B390 Panther Lake iGPU (v8.20.8100)
55091 MB/s
Microsoft Surface Laptop 8 13.8
Qualcomm Snapdragon X2 Plus X2P-64-100, Adreno X2-45 (v8.20.8100)
53201 MB/s -3%
MSI Prestige 13 AI+ A3MG
Intel Core Ultra 9 386H, Intel Graphics 4 Xe3 PTL (v8.20.8100)
46362 MB/s -16%
Asus ExpertBook Ultra B9406CAA
Intel Core Ultra X7 358H, Arc B390 Panther Lake iGPU (v6.92.6600)
5127 MB/s -91%
AIDA64 / CPU ZLib
Framework Laptop 13.5 Ryzen AI 9 HX 370
AMD Ryzen AI 9 HX 370, Radeon 890M (v6.92.6600)
1171 MB/s +20%
Asus ExpertBook Ultra B9406CAA
Intel Core Ultra X7 358H, Arc B390 Panther Lake iGPU (v6.92.6600)
1168 MB/s +20%
Dell XPS 14 Core Ultra X7 358H
Intel Core Ultra X7 358H, Arc B390 Panther Lake iGPU (v8.20.8100)
1103 MB/s +13%
Durchschnittliche Intel Core Ultra X7 358H
  (932 - 1179, n=10)
1062 MB/s +9%
Framework Laptop 13 Pro
Intel Core Ultra X7 358H, Arc B390 Panther Lake iGPU (v8.20.8100)
977 MB/s
MSI Prestige 13 AI+ A3MG
Intel Core Ultra 9 386H, Intel Graphics 4 Xe3 PTL (v8.20.8100)
669 MB/s -32%
Microsoft Surface Laptop 8 13.8
Qualcomm Snapdragon X2 Plus X2P-64-100, Adreno X2-45 (v8.20.8100)
653 MB/s -33%
AIDA64 / FP64 Ray-Trace
Framework Laptop 13.5 Ryzen AI 9 HX 370
AMD Ryzen AI 9 HX 370, Radeon 890M (v6.92.6600)
14707 KRay/s +96%
Durchschnittliche Intel Core Ultra X7 358H
  (6506 - 9612, n=10)
8198 KRay/s +9%
Dell XPS 14 Core Ultra X7 358H
Intel Core Ultra X7 358H, Arc B390 Panther Lake iGPU (v8.20.8100)
7603 KRay/s +1%
Framework Laptop 13 Pro
Intel Core Ultra X7 358H, Arc B390 Panther Lake iGPU (v8.20.8100)
7516 KRay/s
Asus ExpertBook Ultra B9406CAA
Intel Core Ultra X7 358H, Arc B390 Panther Lake iGPU (v6.92.6600)
6506 KRay/s -13%
MSI Prestige 13 AI+ A3MG
Intel Core Ultra 9 386H, Intel Graphics 4 Xe3 PTL (v8.20.8100)
5138 KRay/s -32%
Microsoft Surface Laptop 8 13.8
Qualcomm Snapdragon X2 Plus X2P-64-100, Adreno X2-45 (v8.20.8100)
3212 KRay/s -57%
AIDA64 / CPU PhotoWorxx
Dell XPS 14 Core Ultra X7 358H
Intel Core Ultra X7 358H, Arc B390 Panther Lake iGPU (v8.20.8100)
88086 MPixel/s +22%
Durchschnittliche Intel Core Ultra X7 358H
  (30538 - 88533, n=10)
76762 MPixel/s +7%
Framework Laptop 13 Pro
Intel Core Ultra X7 358H, Arc B390 Panther Lake iGPU (v8.20.8100)
72063 MPixel/s
MSI Prestige 13 AI+ A3MG
Intel Core Ultra 9 386H, Intel Graphics 4 Xe3 PTL (v8.20.8100)
66781 MPixel/s -7%
Framework Laptop 13.5 Ryzen AI 9 HX 370
AMD Ryzen AI 9 HX 370, Radeon 890M (v6.92.6600)
46747 MPixel/s -35%
Microsoft Surface Laptop 8 13.8
Qualcomm Snapdragon X2 Plus X2P-64-100, Adreno X2-45 (v8.20.8100)
35535 MPixel/s -51%
Asus ExpertBook Ultra B9406CAA
Intel Core Ultra X7 358H, Arc B390 Panther Lake iGPU (v6.92.6600)
30538 MPixel/s -58%
AIDA64 / CPU CheckMate
Dell XPS 14 Core Ultra X7 358H
Intel Core Ultra X7 358H, Arc B390 Panther Lake iGPU (v8.20.8100)
4475 MP/s +20%
Durchschnittliche Intel Core Ultra X7 358H
  (3721 - 4475, n=9)
4265 MP/s +15%
Framework Laptop 13 Pro
Intel Core Ultra X7 358H, Arc B390 Panther Lake iGPU (v8.20.8100)
3721 MP/s
Microsoft Surface Laptop 8 13.8
Qualcomm Snapdragon X2 Plus X2P-64-100, Adreno X2-45 (v8.20.8100)
756 MP/s -80%

Systemleistung

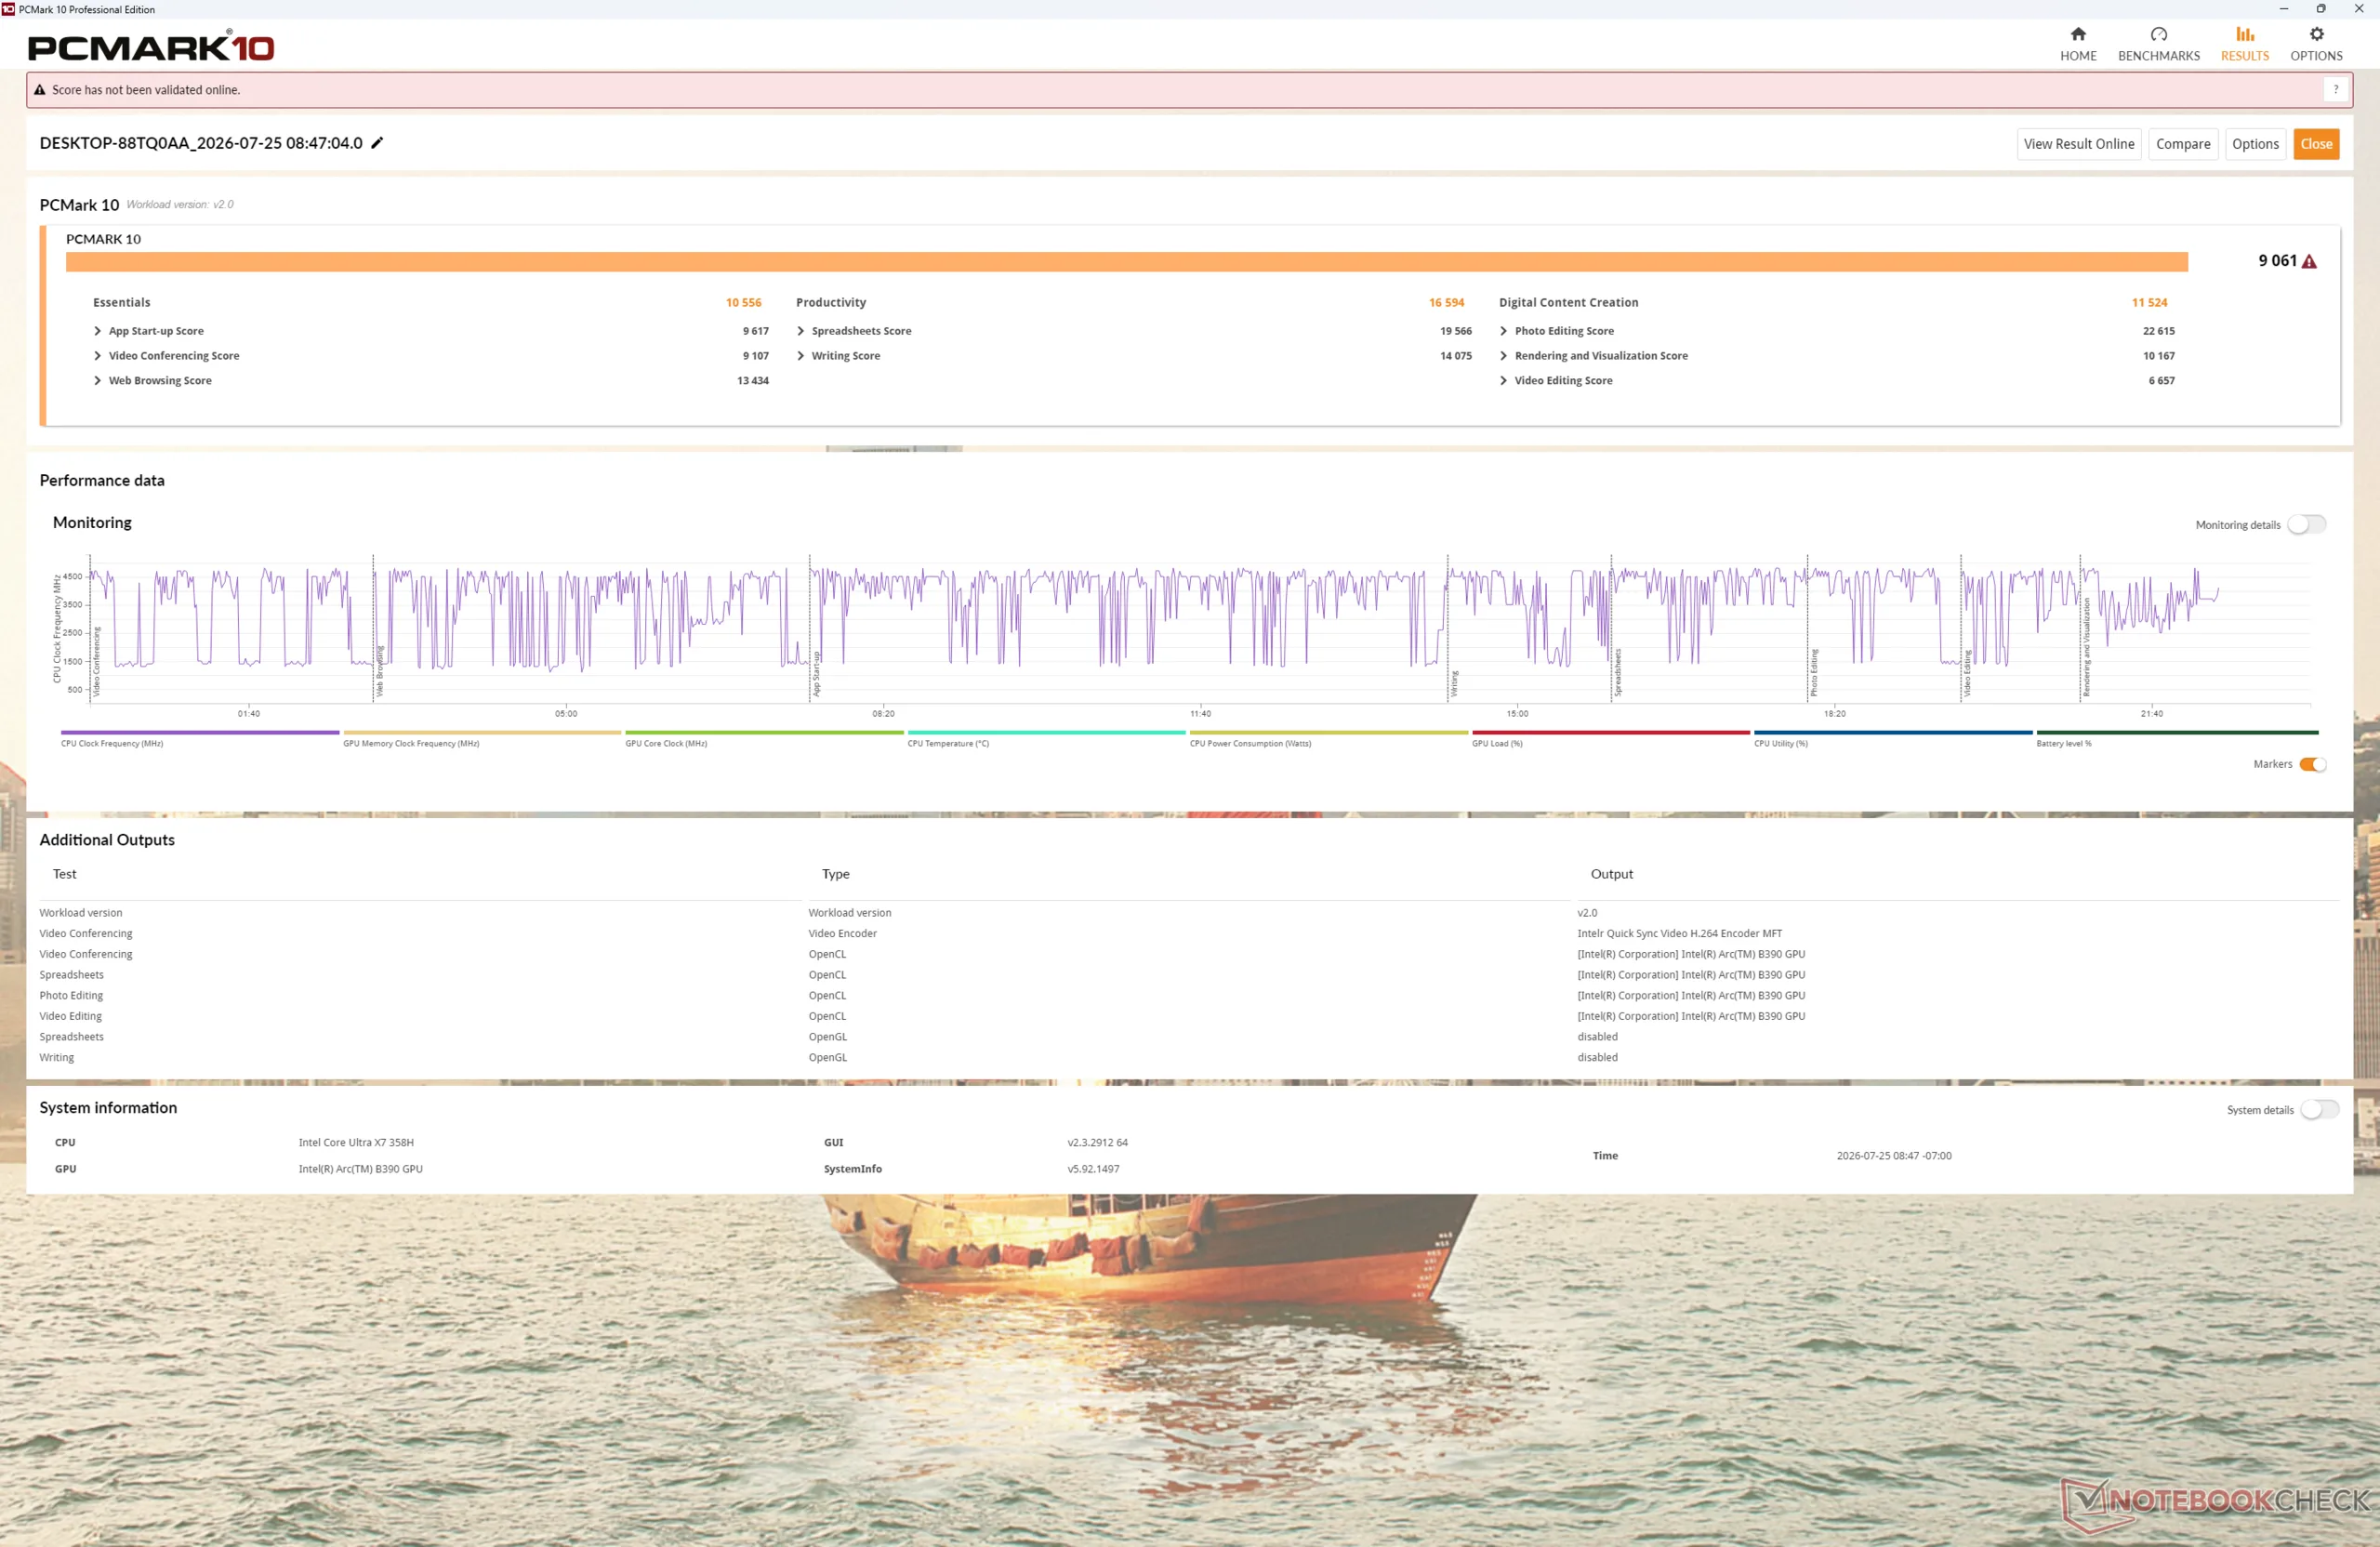
Die PCMark Ergebnisse liegen durchweg über denen des Laptop 13,5, insbesondere in den Teilbereichen „Produktivität“ und „Erstellung digitaler Inhalte“.
Performance Rating: Percent
PCMark 10: Score | Essentials | Productivity | Digital Content Creation
CrossMark: Overall | Productivity | Creativity | Responsiveness
WebXPRT 3: Overall
WebXPRT 4: Overall
Mozilla Kraken 1.1: Total
Performance Rating
Dell XPS 14 Core Ultra X7 358H
Arc B390 Panther Lake iGPU, Ultra X7 358H, Samsung PM9C1b MZVL81T0HFLB-00BH1
85.6 pt
Durchschnittliche Intel Core Ultra X7 358H, Intel Arc B390 12 Xe3 Panther Lake iGPU
 
85 pt
Framework Laptop 13 Pro
Arc B390 Panther Lake iGPU, Ultra X7 358H, WD PC SN7100S SDFPMSL-1T00-1101
83.8 pt
Asus ExpertBook Ultra B9406CAA
Arc B390 Panther Lake iGPU, Ultra X7 358H, Samsung PM9E1 MZVLC2T0HBLD
81.1 pt
Microsoft Surface Laptop 8 13.8 -4!
Adreno X2-45, SD X2 Plus X2P-64-100, SK hynix PVC10 HFS512GEM4X182N
78.6 pt
MSI Prestige 13 AI+ A3MG
Intel Graphics 4 Xe3 PTL, Ultra 9 386H, Micron 2500 1TB MTFDKBA1T0QGN
78.2 pt
Framework Laptop 13.5 Ryzen AI 9 HX 370
Radeon 890M, Ryzen AI 9 HX 370
74.3 pt
PCMark 10 / Score
Dell XPS 14 Core Ultra X7 358H
Arc B390 Panther Lake iGPU, Ultra X7 358H, Samsung PM9C1b MZVL81T0HFLB-00BH1
9880 Points +9%
Durchschnittliche Intel Core Ultra X7 358H, Intel Arc B390 12 Xe3 Panther Lake iGPU
  (8834 - 9880, n=10)
9402 Points +4%
Asus ExpertBook Ultra B9406CAA
Arc B390 Panther Lake iGPU, Ultra X7 358H, Samsung PM9E1 MZVLC2T0HBLD
9298 Points +3%
Framework Laptop 13 Pro
Arc B390 Panther Lake iGPU, Ultra X7 358H, WD PC SN7100S SDFPMSL-1T00-1101
9061 Points
MSI Prestige 13 AI+ A3MG
Intel Graphics 4 Xe3 PTL, Ultra 9 386H, Micron 2500 1TB MTFDKBA1T0QGN
7679 Points -15%
Framework Laptop 13.5 Ryzen AI 9 HX 370
Radeon 890M, Ryzen AI 9 HX 370
7530 Points -17%
PCMark 10 / Essentials
Dell XPS 14 Core Ultra X7 358H
Arc B390 Panther Lake iGPU, Ultra X7 358H, Samsung PM9C1b MZVL81T0HFLB-00BH1
11263 Points +7%
Framework Laptop 13.5 Ryzen AI 9 HX 370
Radeon 890M, Ryzen AI 9 HX 370
11159 Points +6%
MSI Prestige 13 AI+ A3MG
Intel Graphics 4 Xe3 PTL, Ultra 9 386H, Micron 2500 1TB MTFDKBA1T0QGN
10894 Points +3%
Durchschnittliche Intel Core Ultra X7 358H, Intel Arc B390 12 Xe3 Panther Lake iGPU
  (10282 - 11263, n=9)
10840 Points +3%
Asus ExpertBook Ultra B9406CAA
Arc B390 Panther Lake iGPU, Ultra X7 358H, Samsung PM9E1 MZVLC2T0HBLD
10811 Points +2%
Framework Laptop 13 Pro
Arc B390 Panther Lake iGPU, Ultra X7 358H, WD PC SN7100S SDFPMSL-1T00-1101
10556 Points
PCMark 10 / Productivity
Dell XPS 14 Core Ultra X7 358H
Arc B390 Panther Lake iGPU, Ultra X7 358H, Samsung PM9C1b MZVL81T0HFLB-00BH1
16780 Points +1%
Framework Laptop 13 Pro
Arc B390 Panther Lake iGPU, Ultra X7 358H, WD PC SN7100S SDFPMSL-1T00-1101
16594 Points
Durchschnittliche Intel Core Ultra X7 358H, Intel Arc B390 12 Xe3 Panther Lake iGPU
  (13908 - 16780, n=9)
15691 Points -5%
Asus ExpertBook Ultra B9406CAA
Arc B390 Panther Lake iGPU, Ultra X7 358H, Samsung PM9E1 MZVLC2T0HBLD
14899 Points -10%
MSI Prestige 13 AI+ A3MG
Intel Graphics 4 Xe3 PTL, Ultra 9 386H, Micron 2500 1TB MTFDKBA1T0QGN
12295 Points -26%
Framework Laptop 13.5 Ryzen AI 9 HX 370
Radeon 890M, Ryzen AI 9 HX 370
10069 Points -39%
PCMark 10 / Digital Content Creation
Dell XPS 14 Core Ultra X7 358H
Arc B390 Panther Lake iGPU, Ultra X7 358H, Samsung PM9C1b MZVL81T0HFLB-00BH1
13847 Points +20%
Asus ExpertBook Ultra B9406CAA
Arc B390 Panther Lake iGPU, Ultra X7 358H, Samsung PM9E1 MZVLC2T0HBLD
13541 Points +18%
Durchschnittliche Intel Core Ultra X7 358H, Intel Arc B390 12 Xe3 Panther Lake iGPU
  (11524 - 13893, n=9)
13346 Points +16%
Framework Laptop 13 Pro
Arc B390 Panther Lake iGPU, Ultra X7 358H, WD PC SN7100S SDFPMSL-1T00-1101
11524 Points
Framework Laptop 13.5 Ryzen AI 9 HX 370
Radeon 890M, Ryzen AI 9 HX 370
10313 Points -11%
MSI Prestige 13 AI+ A3MG
Intel Graphics 4 Xe3 PTL, Ultra 9 386H, Micron 2500 1TB MTFDKBA1T0QGN
9175 Points -20%
CrossMark / Overall
Durchschnittliche Intel Core Ultra X7 358H, Intel Arc B390 12 Xe3 Panther Lake iGPU
  (1884 - 2182, n=10)
2044 Points +2%
Framework Laptop 13 Pro
Arc B390 Panther Lake iGPU, Ultra X7 358H, WD PC SN7100S SDFPMSL-1T00-1101
2002 Points
MSI Prestige 13 AI+ A3MG
Intel Graphics 4 Xe3 PTL, Ultra 9 386H, Micron 2500 1TB MTFDKBA1T0QGN
1975 Points -1%
Dell XPS 14 Core Ultra X7 358H
Arc B390 Panther Lake iGPU, Ultra X7 358H, Samsung PM9C1b MZVL81T0HFLB-00BH1
1955 Points -2%
Asus ExpertBook Ultra B9406CAA
Arc B390 Panther Lake iGPU, Ultra X7 358H, Samsung PM9E1 MZVLC2T0HBLD
1884 Points -6%
Framework Laptop 13.5 Ryzen AI 9 HX 370
Radeon 890M, Ryzen AI 9 HX 370
1823 Points -9%
Microsoft Surface Laptop 8 13.8
Adreno X2-45, SD X2 Plus X2P-64-100, SK hynix PVC10 HFS512GEM4X182N
1594 Points -20%
CrossMark / Productivity
Durchschnittliche Intel Core Ultra X7 358H, Intel Arc B390 12 Xe3 Panther Lake iGPU
  (1678 - 1960, n=10)
1843 Points +1%
MSI Prestige 13 AI+ A3MG
Intel Graphics 4 Xe3 PTL, Ultra 9 386H, Micron 2500 1TB MTFDKBA1T0QGN
1842 Points +1%
Framework Laptop 13 Pro
Arc B390 Panther Lake iGPU, Ultra X7 358H, WD PC SN7100S SDFPMSL-1T00-1101
1817 Points
Dell XPS 14 Core Ultra X7 358H
Arc B390 Panther Lake iGPU, Ultra X7 358H, Samsung PM9C1b MZVL81T0HFLB-00BH1
1719 Points -5%
Asus ExpertBook Ultra B9406CAA
Arc B390 Panther Lake iGPU, Ultra X7 358H, Samsung PM9E1 MZVLC2T0HBLD
1678 Points -8%
Framework Laptop 13.5 Ryzen AI 9 HX 370
Radeon 890M, Ryzen AI 9 HX 370
1662 Points -9%
Microsoft Surface Laptop 8 13.8
Adreno X2-45, SD X2 Plus X2P-64-100, SK hynix PVC10 HFS512GEM4X182N
1468 Points -19%
CrossMark / Creativity
Durchschnittliche Intel Core Ultra X7 358H, Intel Arc B390 12 Xe3 Panther Lake iGPU
  (2241 - 2563, n=10)
2415 Points +4%
Dell XPS 14 Core Ultra X7 358H
Arc B390 Panther Lake iGPU, Ultra X7 358H, Samsung PM9C1b MZVL81T0HFLB-00BH1
2398 Points +3%
Framework Laptop 13 Pro
Arc B390 Panther Lake iGPU, Ultra X7 358H, WD PC SN7100S SDFPMSL-1T00-1101
2317 Points
Asus ExpertBook Ultra B9406CAA
Arc B390 Panther Lake iGPU, Ultra X7 358H, Samsung PM9E1 MZVLC2T0HBLD
2241 Points -3%
MSI Prestige 13 AI+ A3MG
Intel Graphics 4 Xe3 PTL, Ultra 9 386H, Micron 2500 1TB MTFDKBA1T0QGN
2240 Points -3%
Framework Laptop 13.5 Ryzen AI 9 HX 370
Radeon 890M, Ryzen AI 9 HX 370
2155 Points -7%
Microsoft Surface Laptop 8 13.8
Adreno X2-45, SD X2 Plus X2P-64-100, SK hynix PVC10 HFS512GEM4X182N
1753 Points -24%
CrossMark / Responsiveness
Framework Laptop 13 Pro
Arc B390 Panther Lake iGPU, Ultra X7 358H, WD PC SN7100S SDFPMSL-1T00-1101
1729 Points
Durchschnittliche Intel Core Ultra X7 358H, Intel Arc B390 12 Xe3 Panther Lake iGPU
  (1560 - 1855, n=10)
1691 Points -2%
MSI Prestige 13 AI+ A3MG
Intel Graphics 4 Xe3 PTL, Ultra 9 386H, Micron 2500 1TB MTFDKBA1T0QGN
1667 Points -4%
Asus ExpertBook Ultra B9406CAA
Arc B390 Panther Lake iGPU, Ultra X7 358H, Samsung PM9E1 MZVLC2T0HBLD
1585 Points -8%
Dell XPS 14 Core Ultra X7 358H
Arc B390 Panther Lake iGPU, Ultra X7 358H, Samsung PM9C1b MZVL81T0HFLB-00BH1
1560 Points -10%
Microsoft Surface Laptop 8 13.8
Adreno X2-45, SD X2 Plus X2P-64-100, SK hynix PVC10 HFS512GEM4X182N
1536 Points -11%
Framework Laptop 13.5 Ryzen AI 9 HX 370
Radeon 890M, Ryzen AI 9 HX 370
1457 Points -16%
WebXPRT 3 / Overall
Microsoft Surface Laptop 8 13.8
Adreno X2-45, SD X2 Plus X2P-64-100, SK hynix PVC10 HFS512GEM4X182N
471 Points +39%
Framework Laptop 13.5 Ryzen AI 9 HX 370
Radeon 890M, Ryzen AI 9 HX 370
342 Points +1%
Framework Laptop 13 Pro
Arc B390 Panther Lake iGPU, Ultra X7 358H, WD PC SN7100S SDFPMSL-1T00-1101
339 Points
Dell XPS 14 Core Ultra X7 358H
Arc B390 Panther Lake iGPU, Ultra X7 358H, Samsung PM9C1b MZVL81T0HFLB-00BH1
338 Points 0%
MSI Prestige 13 AI+ A3MG
Intel Graphics 4 Xe3 PTL, Ultra 9 386H, Micron 2500 1TB MTFDKBA1T0QGN
323 Points -5%
Durchschnittliche Intel Core Ultra X7 358H, Intel Arc B390 12 Xe3 Panther Lake iGPU
  (293 - 350, n=10)
323 Points -5%
Asus ExpertBook Ultra B9406CAA
Arc B390 Panther Lake iGPU, Ultra X7 358H, Samsung PM9E1 MZVLC2T0HBLD
304 Points -10%
WebXPRT 4 / Overall
Microsoft Surface Laptop 8 13.8
Adreno X2-45, SD X2 Plus X2P-64-100, SK hynix PVC10 HFS512GEM4X182N
344 Points +11%
Framework Laptop 13 Pro
Arc B390 Panther Lake iGPU, Ultra X7 358H, WD PC SN7100S SDFPMSL-1T00-1101
310 Points
MSI Prestige 13 AI+ A3MG
Intel Graphics 4 Xe3 PTL, Ultra 9 386H, Micron 2500 1TB MTFDKBA1T0QGN
309 Points 0%
Dell XPS 14 Core Ultra X7 358H
Arc B390 Panther Lake iGPU, Ultra X7 358H, Samsung PM9C1b MZVL81T0HFLB-00BH1
305 Points -2%
Durchschnittliche Intel Core Ultra X7 358H, Intel Arc B390 12 Xe3 Panther Lake iGPU
  (278 - 310, n=9)
297 Points -4%
Asus ExpertBook Ultra B9406CAA
Arc B390 Panther Lake iGPU, Ultra X7 358H, Samsung PM9E1 MZVLC2T0HBLD
279 Points -10%
Framework Laptop 13.5 Ryzen AI 9 HX 370
Radeon 890M, Ryzen AI 9 HX 370
277 Points -11%
Mozilla Kraken 1.1 / Total
Framework Laptop 13 Pro
Arc B390 Panther Lake iGPU, Ultra X7 358H, WD PC SN7100S SDFPMSL-1T00-1101
459 ms *
Durchschnittliche Intel Core Ultra X7 358H, Intel Arc B390 12 Xe3 Panther Lake iGPU
  (445 - 465, n=10)
453 ms * +1%
Framework Laptop 13.5 Ryzen AI 9 HX 370
Radeon 890M, Ryzen AI 9 HX 370
450 ms * +2%
Asus ExpertBook Ultra B9406CAA
Arc B390 Panther Lake iGPU, Ultra X7 358H, Samsung PM9E1 MZVLC2T0HBLD
449 ms * +2%
MSI Prestige 13 AI+ A3MG
Intel Graphics 4 Xe3 PTL, Ultra 9 386H, Micron 2500 1TB MTFDKBA1T0QGN
447 ms * +3%
Dell XPS 14 Core Ultra X7 358H
Arc B390 Panther Lake iGPU, Ultra X7 358H, Samsung PM9C1b MZVL81T0HFLB-00BH1
445 ms * +3%
Microsoft Surface Laptop 8 13.8
Adreno X2-45, SD X2 Plus X2P-64-100, SK hynix PVC10 HFS512GEM4X182N
316.7 ms * +31%

* ... kleinere Werte sind besser

PCMark 10 Score
9061 Punkte
Hilfe
AIDA64 / Memory Copy
Dell XPS 14 Core Ultra X7 358H
Intel Core Ultra X7 358H, Arc B390 Panther Lake iGPU
131796 MB/s +25%
Durchschnittliche Intel Core Ultra X7 358H
  (102745 - 132135, n=9)
119898 MB/s +14%
Framework Laptop 13 Pro
Intel Core Ultra X7 358H, Arc B390 Panther Lake iGPU
105315 MB/s
MSI Prestige 13 AI+ A3MG
Intel Core Ultra 9 386H, Intel Graphics 4 Xe3 PTL
104775 MB/s -1%
Framework Laptop 13.5 Ryzen AI 9 HX 370
AMD Ryzen AI 9 HX 370, Radeon 890M
73224 MB/s -30%
Microsoft Surface Laptop 8 13.8
Qualcomm Snapdragon X2 Plus X2P-64-100, Adreno X2-45
57846 MB/s -45%
AIDA64 / Memory Read
Asus ExpertBook Ultra B9406CAA
Intel Core Ultra X7 358H, Arc B390 Panther Lake iGPU
117245 MB/s +16%
Microsoft Surface Laptop 8 13.8
Qualcomm Snapdragon X2 Plus X2P-64-100, Adreno X2-45
117229 MB/s +16%
Dell XPS 14 Core Ultra X7 358H
Intel Core Ultra X7 358H, Arc B390 Panther Lake iGPU
114349 MB/s +13%
Durchschnittliche Intel Core Ultra X7 358H
  (97755 - 120727, n=10)
110738 MB/s +9%
Framework Laptop 13 Pro
Intel Core Ultra X7 358H, Arc B390 Panther Lake iGPU
101309 MB/s
MSI Prestige 13 AI+ A3MG
Intel Core Ultra 9 386H, Intel Graphics 4 Xe3 PTL
97068 MB/s -4%
Framework Laptop 13.5 Ryzen AI 9 HX 370
AMD Ryzen AI 9 HX 370, Radeon 890M
85111 MB/s -16%
AIDA64 / Memory Write
Dell XPS 14 Core Ultra X7 358H
Intel Core Ultra X7 358H, Arc B390 Panther Lake iGPU
134916 MB/s +28%
Durchschnittliche Intel Core Ultra X7 358H
  (105712 - 134998, n=10)
121741 MB/s +15%
Asus ExpertBook Ultra B9406CAA
Intel Core Ultra X7 358H, Arc B390 Panther Lake iGPU
119858 MB/s +13%
MSI Prestige 13 AI+ A3MG
Intel Core Ultra 9 386H, Intel Graphics 4 Xe3 PTL
106460 MB/s +1%
Framework Laptop 13 Pro
Intel Core Ultra X7 358H, Arc B390 Panther Lake iGPU
105712 MB/s
Framework Laptop 13.5 Ryzen AI 9 HX 370
AMD Ryzen AI 9 HX 370, Radeon 890M
83907 MB/s -21%
Microsoft Surface Laptop 8 13.8
Qualcomm Snapdragon X2 Plus X2P-64-100, Adreno X2-45
43017 MB/s -59%
AIDA64 / Memory Latency
MSI Prestige 13 AI+ A3MG
Intel Core Ultra 9 386H, Intel Graphics 4 Xe3 PTL
104.1 ns * -1%
Framework Laptop 13 Pro
Intel Core Ultra X7 358H, Arc B390 Panther Lake iGPU
103.3 ns *
Framework Laptop 13.5 Ryzen AI 9 HX 370
AMD Ryzen AI 9 HX 370, Radeon 890M
95.3 ns * +8%
Dell XPS 14 Core Ultra X7 358H
Intel Core Ultra X7 358H, Arc B390 Panther Lake iGPU
87.8 ns * +15%
Durchschnittliche Intel Core Ultra X7 358H
  (84.1 - 103.3, n=10)
82.9 ns * +20%
Microsoft Surface Laptop 8 13.8
Qualcomm Snapdragon X2 Plus X2P-64-100, Adreno X2-45
6.2 ns * +94%

* ... kleinere Werte sind besser

DPC-Latenz
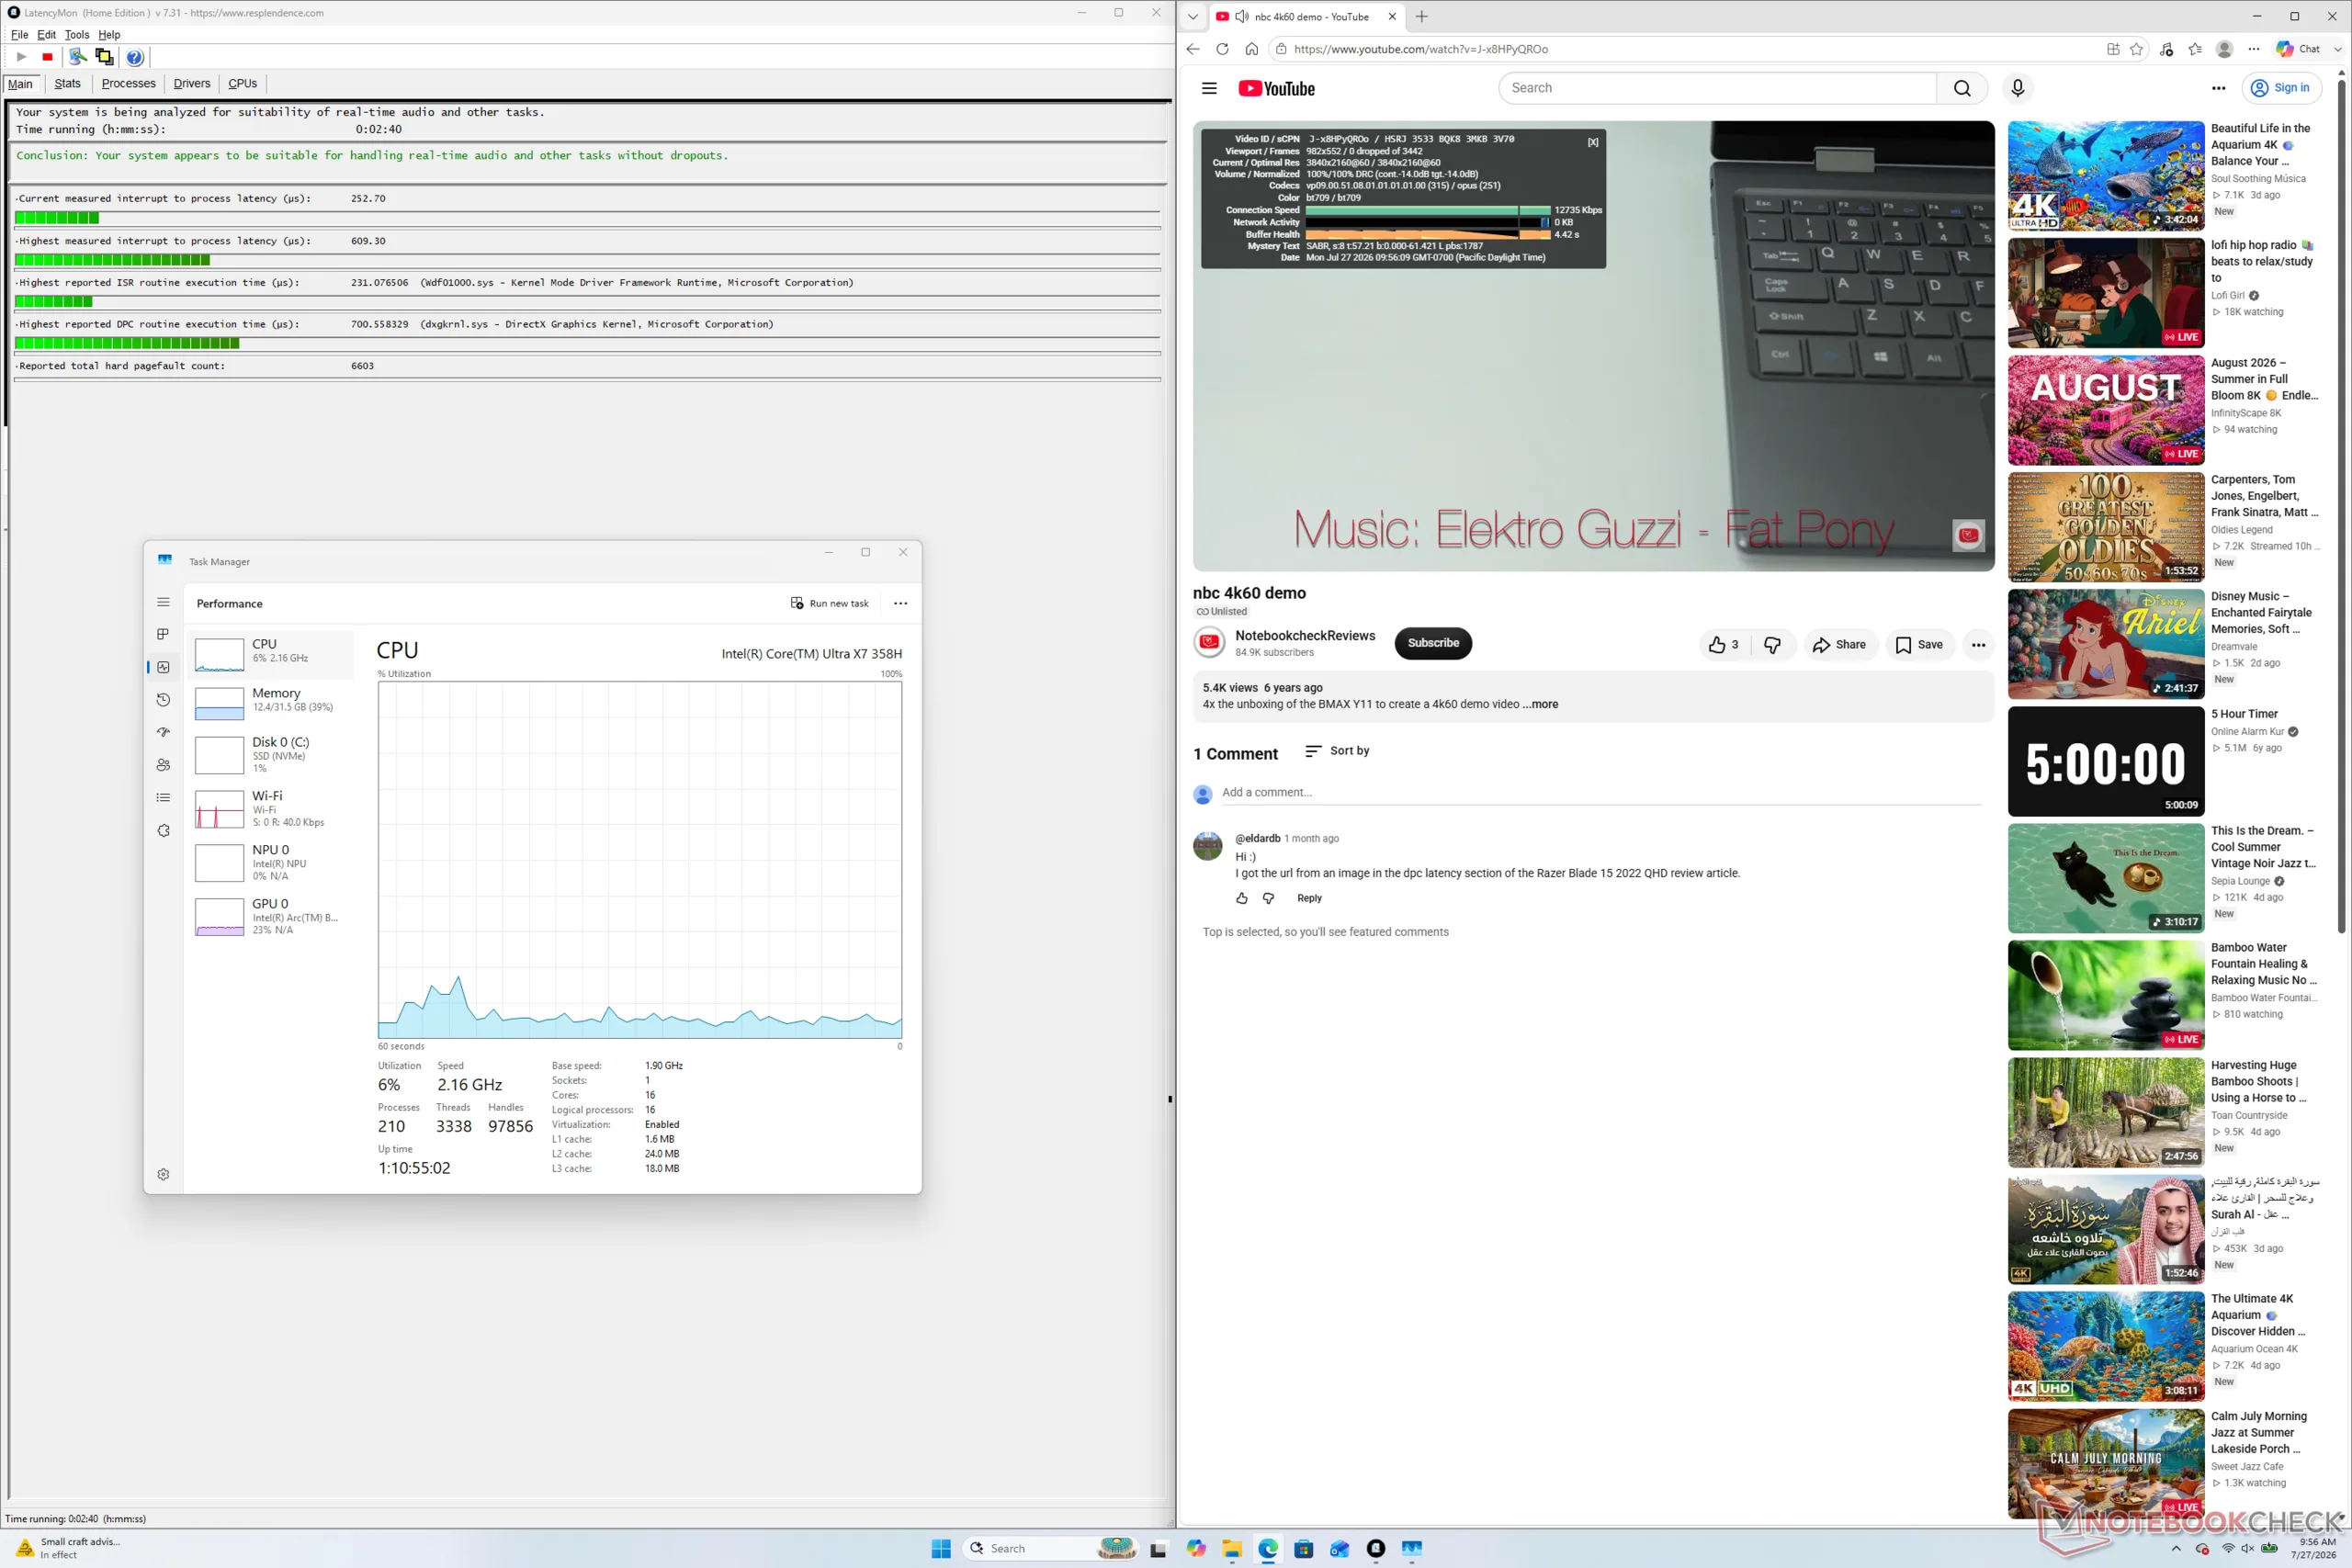
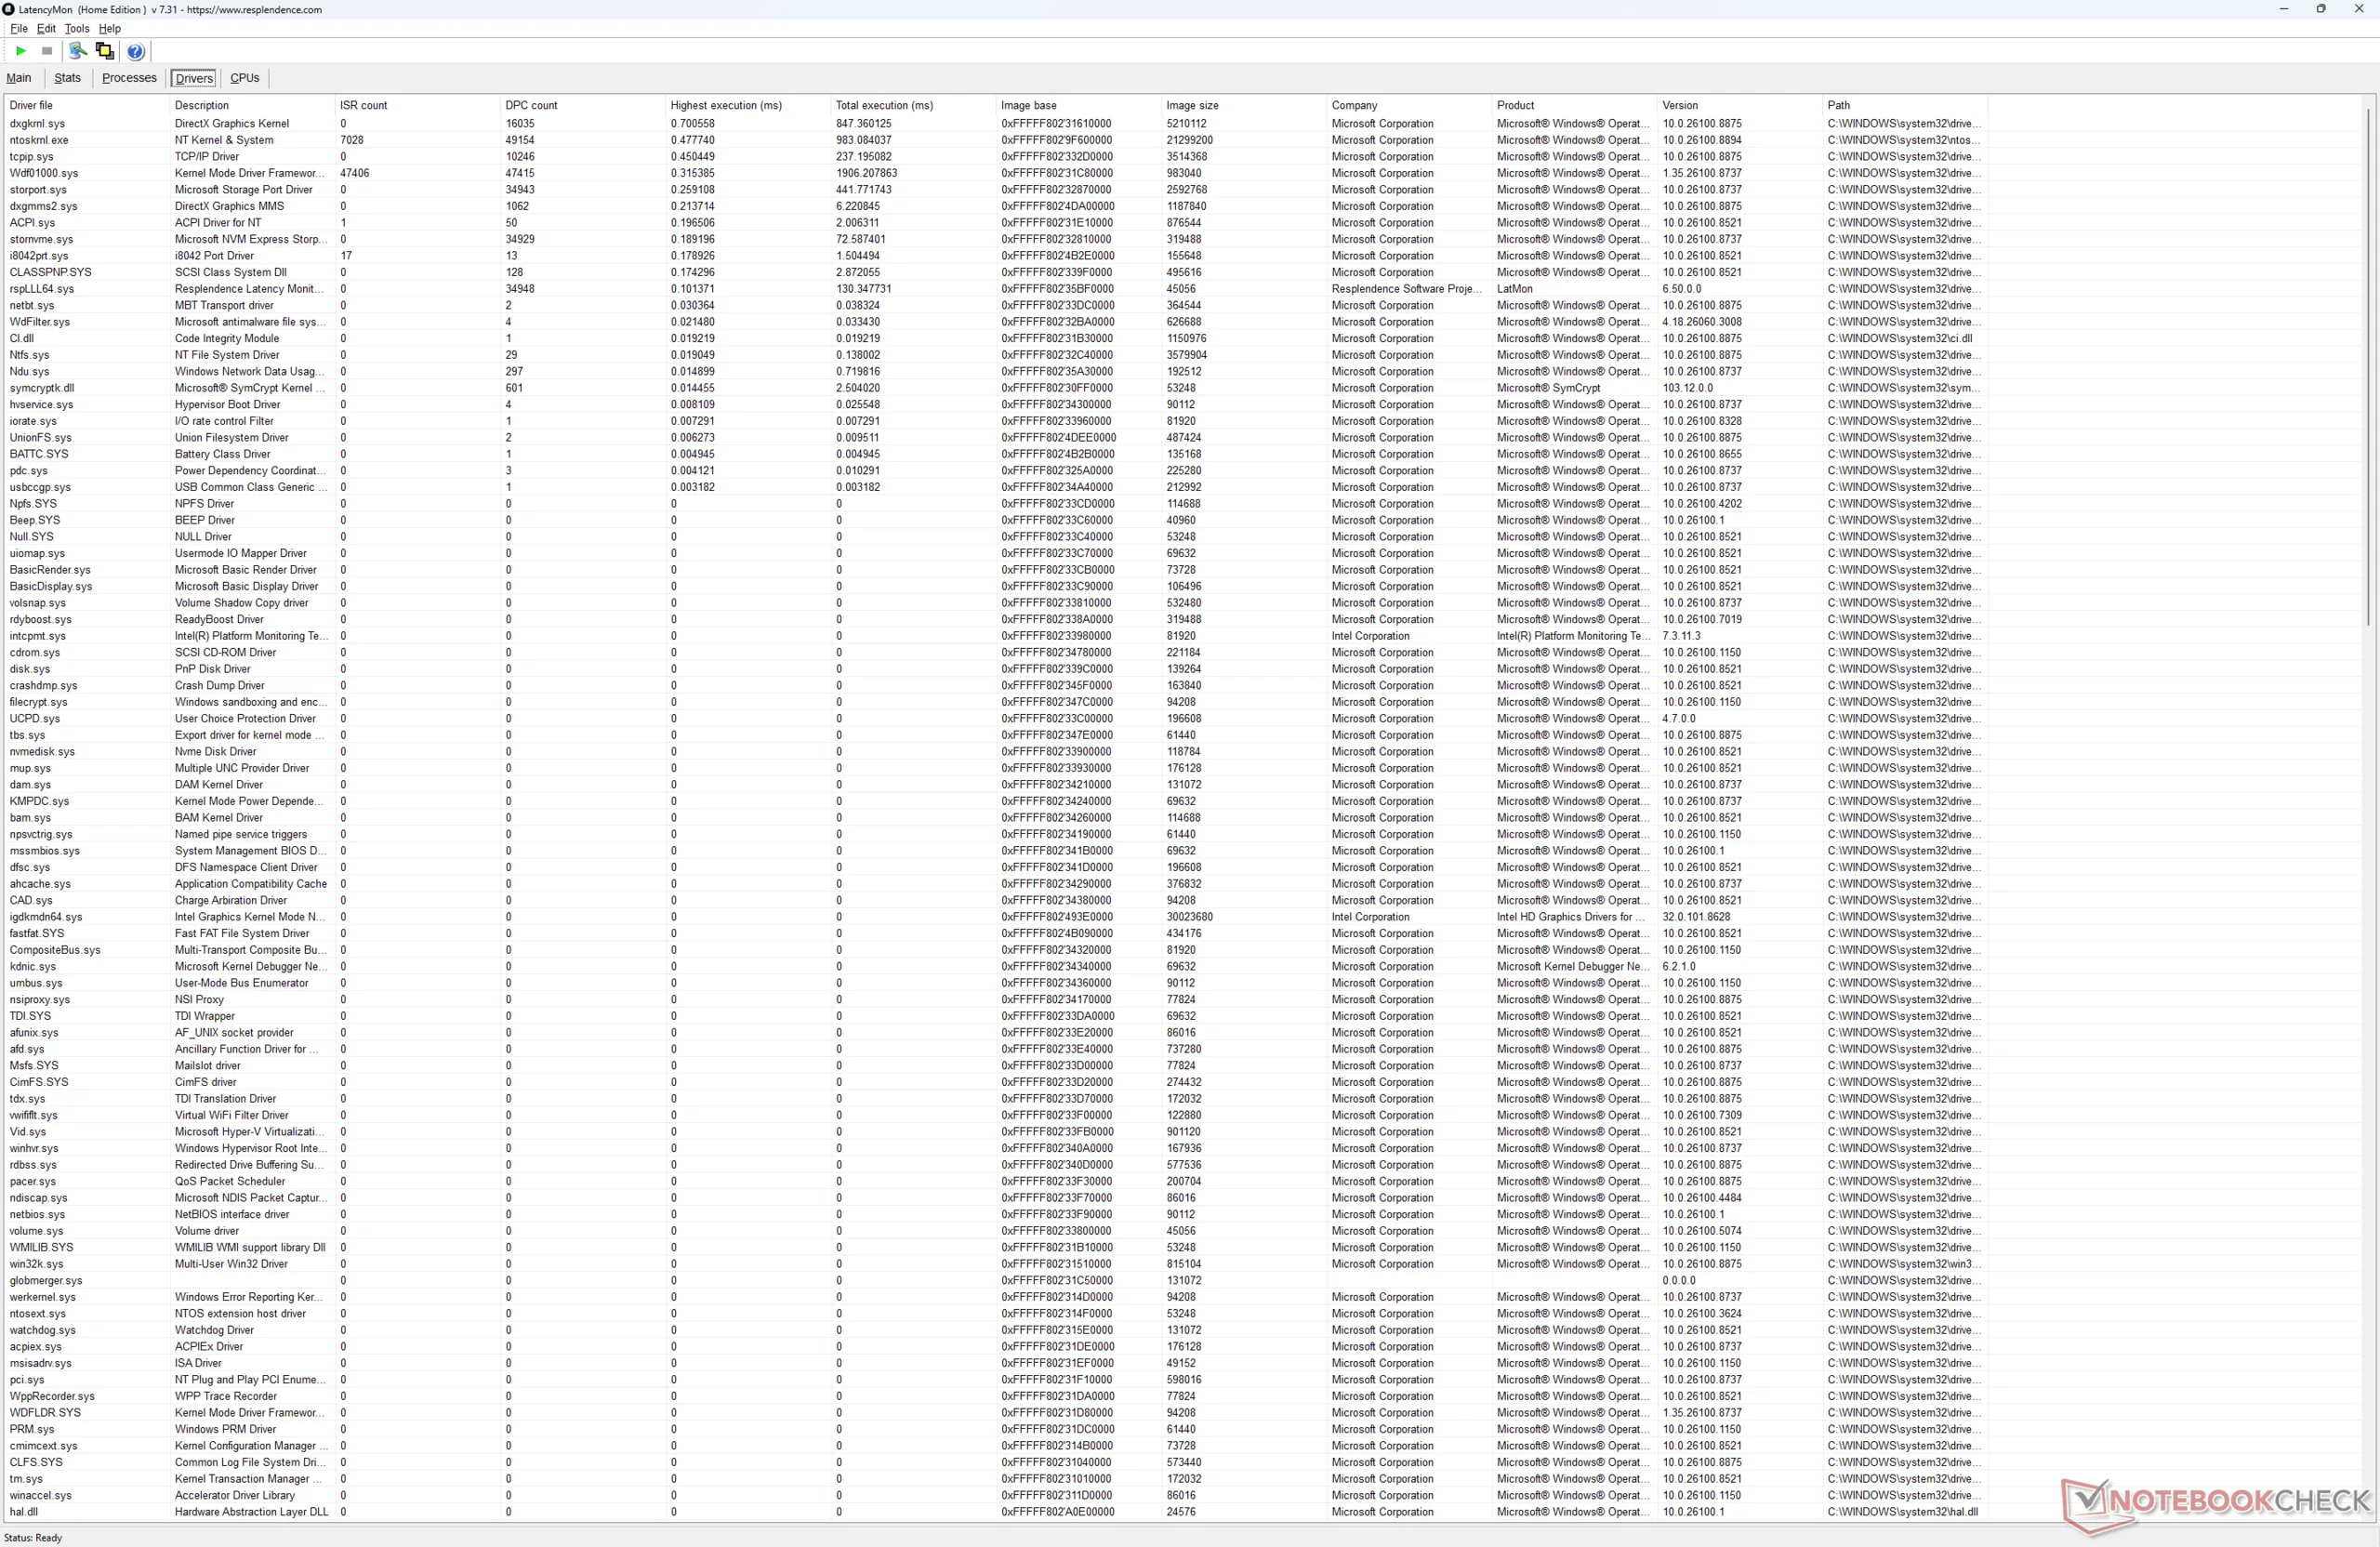
LatencyMon zeigt bei der Wiedergabe von 4K60-Videoinhalten keine nennenswerten DPC-Probleme und keine Bildausfälle an.
Liste der Treiber
Liste der Treiber
DPC Latencies / LatencyMon - interrupt to process latency (max), Web, Youtube, Prime95
Framework Laptop 13.5 Ryzen AI 9 HX 370
Radeon 890M, Ryzen AI 9 HX 370
6956.5 μs * -1042%
Dell XPS 14 Core Ultra X7 358H
Arc B390 Panther Lake iGPU, Ultra X7 358H, Samsung PM9C1b MZVL81T0HFLB-00BH1
872.4 μs * -43%
Framework Laptop 13 Pro
Arc B390 Panther Lake iGPU, Ultra X7 358H, WD PC SN7100S SDFPMSL-1T00-1101
609.3 μs *
Asus ExpertBook Ultra B9406CAA
Arc B390 Panther Lake iGPU, Ultra X7 358H, Samsung PM9E1 MZVLC2T0HBLD
398 μs * +35%

* ... kleinere Werte sind besser

Speichergeräte
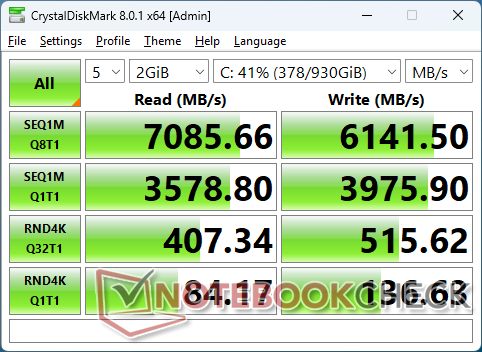
CDM 8
CDM 8
AS SSD
AS SSD
Unterstützt nur eine einzige M.2-2280-SSD
WD PC SN7100S SDFPMSL-1T00-1101
CDM 5/6 Read Seq Q32T1: 6855 MB/s
CDM 5/6 Write Seq Q32T1: 5733 MB/s
CDM 5/6 Read 4K Q32T1: 408.7 MB/s
CDM 5/6 Write 4K Q32T1: 513.4 MB/s
CDM 5 Read Seq: 3196 MB/s
CDM 5 Write Seq: 3656 MB/s
CDM 5/6 Read 4K: 77.38 MB/s
CDM 5/6 Write 4K: 135.6 MB/s
Drive Performance Rating - Percent
Asus ExpertBook Ultra B9406CAA
Samsung PM9E1 MZVLC2T0HBLD
81 pt
MSI Prestige 13 AI+ A3MG
Micron 2500 1TB MTFDKBA1T0QGN
69.8 pt
Framework Laptop 13 Pro
WD PC SN7100S SDFPMSL-1T00-1101
67.7 pt
Framework Laptop 13.5 Ryzen AI 9 HX 370
 
63.5 pt
Dell XPS 14 Core Ultra X7 358H
Samsung PM9C1b MZVL81T0HFLB-00BH1
63.2 pt
Microsoft Surface Laptop 8 13.8
SK hynix PVC10 HFS512GEM4X182N
53.6 pt
DiskSpd
seq read
Asus ExpertBook Ultra B9406CAA
Samsung PM9E1 MZVLC2T0HBLD
5202 (5000.31min - 5202.2max) MB/s +59%
Framework Laptop 13.5 Ryzen AI 9 HX 370
 
4074 (3998.64min - 4073.75max) MB/s +25%
Microsoft Surface Laptop 8 13.8
SK hynix PVC10 HFS512GEM4X182N
3599 (3587.34min - 3599.27max) MB/s +10%
Framework Laptop 13 Pro
WD PC SN7100S SDFPMSL-1T00-1101
3263 (2905.6min - 3262.72max) MB/s
MSI Prestige 13 AI+ A3MG
Micron 2500 1TB MTFDKBA1T0QGN
3220 (3165.44min - 3219.55max) MB/s -1%
Dell XPS 14 Core Ultra X7 358H
Samsung PM9C1b MZVL81T0HFLB-00BH1
2967 (2659.4min - 2966.9max) MB/s -9%
seq write
Framework Laptop 13.5 Ryzen AI 9 HX 370
 
4074 (3859.6min - 4074.17max) MB/s +21%
Microsoft Surface Laptop 8 13.8
SK hynix PVC10 HFS512GEM4X182N
3478 (3332.58min - 3477.92max) MB/s +3%
MSI Prestige 13 AI+ A3MG
Micron 2500 1TB MTFDKBA1T0QGN
3455 (3334.51min - 3454.86max) MB/s +3%
Framework Laptop 13 Pro
WD PC SN7100S SDFPMSL-1T00-1101
3361 (3157.47min - 3361.32max) MB/s
Asus ExpertBook Ultra B9406CAA
Samsung PM9E1 MZVLC2T0HBLD
2975 (2363.07min - 2974.81max) MB/s -11%
Dell XPS 14 Core Ultra X7 358H
Samsung PM9C1b MZVL81T0HFLB-00BH1
2327 (2217.14min - 2327max) MB/s -31%
seq q8 t1 read
Asus ExpertBook Ultra B9406CAA
Samsung PM9E1 MZVLC2T0HBLD
14067 (11621.3min - 14067.1max) MB/s +99%
Framework Laptop 13 Pro
WD PC SN7100S SDFPMSL-1T00-1101
7060 (6414.35min - 7060.48max) MB/s
Dell XPS 14 Core Ultra X7 358H
Samsung PM9C1b MZVL81T0HFLB-00BH1
7037 (5759.83min - 7037.41max) MB/s 0%
MSI Prestige 13 AI+ A3MG
Micron 2500 1TB MTFDKBA1T0QGN
6982 (5981.29min - 6982.05max) MB/s -1%
Framework Laptop 13.5 Ryzen AI 9 HX 370
 
6962 (6422.32min - 6961.83max) MB/s -1%
Microsoft Surface Laptop 8 13.8
SK hynix PVC10 HFS512GEM4X182N
6522 (5401.21min - 6521.51max) MB/s -8%
seq q8 t1 write
Asus ExpertBook Ultra B9406CAA
Samsung PM9E1 MZVLC2T0HBLD
9127 (8641.19min - 9127.43max) MB/s +36%
Framework Laptop 13 Pro
WD PC SN7100S SDFPMSL-1T00-1101
6717 (5888.59min - 6716.97max) MB/s
Framework Laptop 13.5 Ryzen AI 9 HX 370
 
6068 (5554.1min - 6068.14max) MB/s -10%
MSI Prestige 13 AI+ A3MG
Micron 2500 1TB MTFDKBA1T0QGN
5775 (5721.12min - 5775.12max) MB/s -14%
Dell XPS 14 Core Ultra X7 358H
Samsung PM9C1b MZVL81T0HFLB-00BH1
5595 (5550.94min - 5595.34max) MB/s -17%
Microsoft Surface Laptop 8 13.8
SK hynix PVC10 HFS512GEM4X182N
5577 (5179.55min - 5576.71max) MB/s -17%
4k q1 t1 read
Microsoft Surface Laptop 8 13.8
SK hynix PVC10 HFS512GEM4X182N
92.9 (90.22min - 92.9max) MB/s +1%
Framework Laptop 13 Pro
WD PC SN7100S SDFPMSL-1T00-1101
92.3 (92.09min - 92.28max) MB/s
Asus ExpertBook Ultra B9406CAA
Samsung PM9E1 MZVLC2T0HBLD
69.7 (68.02min - 69.67max) MB/s -24%
MSI Prestige 13 AI+ A3MG
Micron 2500 1TB MTFDKBA1T0QGN
67.3 (66.31min - 67.31max) MB/s -27%
Dell XPS 14 Core Ultra X7 358H
Samsung PM9C1b MZVL81T0HFLB-00BH1
61.8 (59.95min - 61.82max) MB/s -33%
Framework Laptop 13.5 Ryzen AI 9 HX 370
 
61.1 (60.19min - 61.07max) MB/s -34%
4k q1 t1 write
Microsoft Surface Laptop 8 13.8
SK hynix PVC10 HFS512GEM4X182N
217 (204.48min - 217.36max) MB/s +32%
MSI Prestige 13 AI+ A3MG
Micron 2500 1TB MTFDKBA1T0QGN
183.2 (143.32min - 183.17max) MB/s +12%
Framework Laptop 13 Pro
WD PC SN7100S SDFPMSL-1T00-1101
163.9 (137.12min - 163.92max) MB/s
Framework Laptop 13.5 Ryzen AI 9 HX 370
 
145.1 (139.79min - 145.14max) MB/s -11%
Dell XPS 14 Core Ultra X7 358H
Samsung PM9C1b MZVL81T0HFLB-00BH1
139.7 (138.86min - 139.67max) MB/s -15%
Asus ExpertBook Ultra B9406CAA
Samsung PM9E1 MZVLC2T0HBLD
125.3 (122.16min - 125.28max) MB/s -24%
4k q32 t16 read
Microsoft Surface Laptop 8 13.8
SK hynix PVC10 HFS512GEM4X182N
1375 (1350.46min - 1374.69max) MB/s +56%
Framework Laptop 13 Pro
WD PC SN7100S SDFPMSL-1T00-1101
881 (849.43min - 880.74max) MB/s
Framework Laptop 13.5 Ryzen AI 9 HX 370
 
809 (764.38min - 809.22max) MB/s -8%
MSI Prestige 13 AI+ A3MG
Micron 2500 1TB MTFDKBA1T0QGN
790 (622.32min - 789.52max) MB/s -10%
Dell XPS 14 Core Ultra X7 358H
Samsung PM9C1b MZVL81T0HFLB-00BH1
711 (562.02min - 711.38max) MB/s -19%
Asus ExpertBook Ultra B9406CAA
Samsung PM9E1 MZVLC2T0HBLD
690 (639.86min - 689.58max) MB/s -22%
4k q32 t16 write
Microsoft Surface Laptop 8 13.8
SK hynix PVC10 HFS512GEM4X182N
966 (949.11min - 965.96max) MB/s +84%
Framework Laptop 13.5 Ryzen AI 9 HX 370
 
547 (506min - 546.6max) MB/s +4%
Framework Laptop 13 Pro
WD PC SN7100S SDFPMSL-1T00-1101
524 (420.7min - 523.59max) MB/s
MSI Prestige 13 AI+ A3MG
Micron 2500 1TB MTFDKBA1T0QGN
470 (362.61min - 470.31max) MB/s -10%
Dell XPS 14 Core Ultra X7 358H
Samsung PM9C1b MZVL81T0HFLB-00BH1
432 (319.99min - 432.49max) MB/s -18%
Asus ExpertBook Ultra B9406CAA
Samsung PM9E1 MZVLC2T0HBLD
390 (355.81min - 389.58max) MB/s -26%
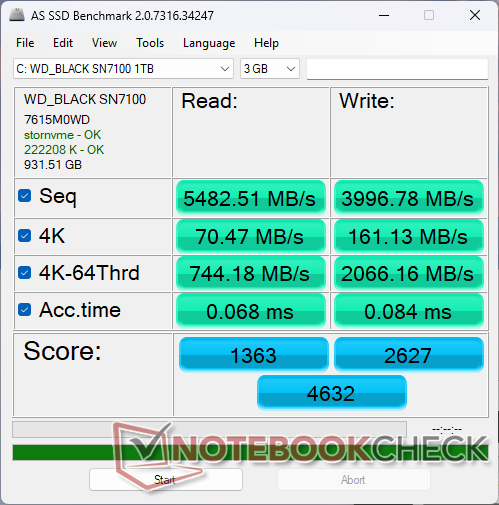
AS SSD
Score Total
Asus ExpertBook Ultra B9406CAA
Samsung PM9E1 MZVLC2T0HBLD
6239 Points +35%
Dell XPS 14 Core Ultra X7 358H
Samsung PM9C1b MZVL81T0HFLB-00BH1
5466 Points +18%
MSI Prestige 13 AI+ A3MG
Micron 2500 1TB MTFDKBA1T0QGN
4707 Points +2%
Framework Laptop 13 Pro
WD PC SN7100S SDFPMSL-1T00-1101
4632 Points
Framework Laptop 13.5 Ryzen AI 9 HX 370
 
3615 Points -22%
Microsoft Surface Laptop 8 13.8
SK hynix PVC10 HFS512GEM4X182N
1492 Points -68%
Score Read
Asus ExpertBook Ultra B9406CAA
Samsung PM9E1 MZVLC2T0HBLD
1804 Points +32%
Dell XPS 14 Core Ultra X7 358H
Samsung PM9C1b MZVL81T0HFLB-00BH1
1402 Points +3%
MSI Prestige 13 AI+ A3MG
Micron 2500 1TB MTFDKBA1T0QGN
1377 Points +1%
Framework Laptop 13 Pro
WD PC SN7100S SDFPMSL-1T00-1101
1363 Points
Framework Laptop 13.5 Ryzen AI 9 HX 370
 
1238 Points -9%
Microsoft Surface Laptop 8 13.8
SK hynix PVC10 HFS512GEM4X182N
515 Points -62%
Score Write
Asus ExpertBook Ultra B9406CAA
Samsung PM9E1 MZVLC2T0HBLD
3672 Points +40%
Dell XPS 14 Core Ultra X7 358H
Samsung PM9C1b MZVL81T0HFLB-00BH1
3375 Points +28%
MSI Prestige 13 AI+ A3MG
Micron 2500 1TB MTFDKBA1T0QGN
2740 Points +4%
Framework Laptop 13 Pro
WD PC SN7100S SDFPMSL-1T00-1101
2627 Points
Framework Laptop 13.5 Ryzen AI 9 HX 370
 
1848 Points -30%
Microsoft Surface Laptop 8 13.8
SK hynix PVC10 HFS512GEM4X182N
773 Points -71%
Seq Read
Asus ExpertBook Ultra B9406CAA
Samsung PM9E1 MZVLC2T0HBLD
8710.83 MB/s +59%
Framework Laptop 13 Pro
WD PC SN7100S SDFPMSL-1T00-1101
5482.51 MB/s
Framework Laptop 13.5 Ryzen AI 9 HX 370
 
5343.67 MB/s -3%
MSI Prestige 13 AI+ A3MG
Micron 2500 1TB MTFDKBA1T0QGN
5274.47 MB/s -4%
Dell XPS 14 Core Ultra X7 358H
Samsung PM9C1b MZVL81T0HFLB-00BH1
4161.24 MB/s -24%
Microsoft Surface Laptop 8 13.8
SK hynix PVC10 HFS512GEM4X182N
2945 MB/s -46%
Seq Write
Asus ExpertBook Ultra B9406CAA
Samsung PM9E1 MZVLC2T0HBLD
5359.95 MB/s +34%
Framework Laptop 13 Pro
WD PC SN7100S SDFPMSL-1T00-1101
3996.78 MB/s
Dell XPS 14 Core Ultra X7 358H
Samsung PM9C1b MZVL81T0HFLB-00BH1
3356.2 MB/s -16%
Framework Laptop 13.5 Ryzen AI 9 HX 370
 
2942.58 MB/s -26%
MSI Prestige 13 AI+ A3MG
Micron 2500 1TB MTFDKBA1T0QGN
2669.89 MB/s -33%
Microsoft Surface Laptop 8 13.8
SK hynix PVC10 HFS512GEM4X182N
1365 MB/s -66%
4K Read
Framework Laptop 13 Pro
WD PC SN7100S SDFPMSL-1T00-1101
70.47 MB/s
MSI Prestige 13 AI+ A3MG
Micron 2500 1TB MTFDKBA1T0QGN
62.69 MB/s -11%
Framework Laptop 13.5 Ryzen AI 9 HX 370
 
59.65 MB/s -15%
Dell XPS 14 Core Ultra X7 358H
Samsung PM9C1b MZVL81T0HFLB-00BH1
57.94 MB/s -18%
Asus ExpertBook Ultra B9406CAA
Samsung PM9E1 MZVLC2T0HBLD
57.24 MB/s -19%
Microsoft Surface Laptop 8 13.8
SK hynix PVC10 HFS512GEM4X182N
51.7 MB/s -27%
4K Write
MSI Prestige 13 AI+ A3MG
Micron 2500 1TB MTFDKBA1T0QGN
195.91 MB/s +22%
Framework Laptop 13.5 Ryzen AI 9 HX 370
 
189.79 MB/s +18%
Dell XPS 14 Core Ultra X7 358H
Samsung PM9C1b MZVL81T0HFLB-00BH1
183.04 MB/s +14%
Framework Laptop 13 Pro
WD PC SN7100S SDFPMSL-1T00-1101
161.13 MB/s
Asus ExpertBook Ultra B9406CAA
Samsung PM9E1 MZVLC2T0HBLD
161.08 MB/s 0%
Microsoft Surface Laptop 8 13.8
SK hynix PVC10 HFS512GEM4X182N
101.5 MB/s -37%
4K-64 Read
Dell XPS 14 Core Ultra X7 358H
Samsung PM9C1b MZVL81T0HFLB-00BH1
927.71 MB/s +25%
Asus ExpertBook Ultra B9406CAA
Samsung PM9E1 MZVLC2T0HBLD
875.94 MB/s +18%
MSI Prestige 13 AI+ A3MG
Micron 2500 1TB MTFDKBA1T0QGN
787.06 MB/s +6%
Framework Laptop 13 Pro
WD PC SN7100S SDFPMSL-1T00-1101
744.18 MB/s
Framework Laptop 13.5 Ryzen AI 9 HX 370
 
644.18 MB/s -13%
Microsoft Surface Laptop 8 13.8
SK hynix PVC10 HFS512GEM4X182N
168.4 MB/s -77%
4K-64 Write
Asus ExpertBook Ultra B9406CAA
Samsung PM9E1 MZVLC2T0HBLD
2974.88 MB/s +44%
Dell XPS 14 Core Ultra X7 358H
Samsung PM9C1b MZVL81T0HFLB-00BH1
2856.06 MB/s +38%
MSI Prestige 13 AI+ A3MG
Micron 2500 1TB MTFDKBA1T0QGN
2277.19 MB/s +10%
Framework Laptop 13 Pro
WD PC SN7100S SDFPMSL-1T00-1101
2066.16 MB/s
Framework Laptop 13.5 Ryzen AI 9 HX 370
 
1363.6 MB/s -34%
Microsoft Surface Laptop 8 13.8
SK hynix PVC10 HFS512GEM4X182N
535 MB/s -74%
Access Time Read
Dell XPS 14 Core Ultra X7 358H
Samsung PM9C1b MZVL81T0HFLB-00BH1
0.103 ms * -51%
Microsoft Surface Laptop 8 13.8
SK hynix PVC10 HFS512GEM4X182N
0.092 ms * -35%
Framework Laptop 13 Pro
WD PC SN7100S SDFPMSL-1T00-1101
0.068 ms *
Framework Laptop 13.5 Ryzen AI 9 HX 370
 
0.06 ms * +12%
MSI Prestige 13 AI+ A3MG
Micron 2500 1TB MTFDKBA1T0QGN
0.057 ms * +16%
Asus ExpertBook Ultra B9406CAA
Samsung PM9E1 MZVLC2T0HBLD
0.033 ms * +51%
Access Time Write
Framework Laptop 13 Pro
WD PC SN7100S SDFPMSL-1T00-1101
0.084 ms *
Dell XPS 14 Core Ultra X7 358H
Samsung PM9C1b MZVL81T0HFLB-00BH1
0.077 ms * +8%
Asus ExpertBook Ultra B9406CAA
Samsung PM9E1 MZVLC2T0HBLD
0.07 ms * +17%
Framework Laptop 13.5 Ryzen AI 9 HX 370
 
0.057 ms * +32%
Microsoft Surface Laptop 8 13.8
SK hynix PVC10 HFS512GEM4X182N
0.04 ms * +52%
MSI Prestige 13 AI+ A3MG
Micron 2500 1TB MTFDKBA1T0QGN
0.024 ms * +71%

* ... kleinere Werte sind besser

Festplatten-Drosselung: DiskSpd-Lese-Schleife, Warteschlangentiefe 8

0145290435580725870101511601305145015951740188520302175232024652610275529003045319033353480362537703915406042054350449546404785493050755220536555105655580059456090623563806525667068156960Tooltip
Framework Laptop 13 Pro WD PC SN7100S SDFPMSL-1T00-1101; diskspd 2.0.17 f: Ø7020 (6381.6-7074.85) MB/s
Framework Laptop 13.5 Ryzen AI 9 HX 370  ; diskspd 2.0.17 f: Ø6511 (5854.24-6961.71) MB/s

GPU-Leistung

Die Grafikleistung ist im Vergleich zu anderen PCs mit der gleichen Arc-B390-GPU um etwa 20 Prozent geringer.

LeistungsprofilGrafics-ErgebnisPhysics-ErgebnisKombinierte Punktzahl
Leistungsmodus13.41024.1393.843
Ausgewogener Modus13.44223.1683.836
Batterieleistung13.90123.9943.894
3DMark 11
3DMark 11
Fire Strike
Fire Strike
Time Spy
Time Spy
Speed Way
Speed Way
3DMark Performance Rating - Percent
Dell XPS 14 Core Ultra X7 358H
Intel Arc B390 12 Xe3 Panther Lake iGPU, Intel Core Ultra X7 358H
100 pt
Asus ExpertBook Ultra B9406CAA
Intel Arc B390 12 Xe3 Panther Lake iGPU, Intel Core Ultra X7 358H
96.8 pt
Durchschnittliche Intel Arc B390 12 Xe3 Panther Lake iGPU
 
95 pt
Framework Laptop 13 Pro
Intel Arc B390 12 Xe3 Panther Lake iGPU, Intel Core Ultra X7 358H
77.7 pt
Dell Pro 13 Premium PA13250
Intel Arc Graphics 140V, Intel Core Ultra 7 268V
55.1 pt
Framework Laptop 13.5 Core Ultra 7 155H
Intel Arc 8-Core iGPU, Intel Core Ultra 7 155H
53.7 pt
Framework Laptop 13.5 Ryzen AI 9 HX 370
AMD Radeon 890M, AMD Ryzen AI 9 HX 370
49.7 pt
HP OmniBook 7 Aero 13-bg1077nr
AMD Radeon 860M, AMD Ryzen AI 7 350
40.5 pt
Microsoft Surface Laptop 8 13.8
Qualcomm SD X2 Adreno X2-45, Qualcomm Snapdragon X2 Plus X2P-64-100
36.2 pt
MSI Prestige 13 AI+ A3MG
Intel Graphics 4 Xe3 Panther Lake iGPU, Intel Core Ultra 9 386H
34.2 pt
HP EliteBook 8 Flip G1i 13
Intel Graphics 4-Core iGPU (Meteor / Arrow Lake), Intel Core Ultra 7 265U
28.6 pt
HP Elite Dragonfly G3
Intel Iris Xe Graphics G7 96EUs, Intel Core i7-1265U
26.6 pt
Framework Laptop 13.5
Intel Iris Xe Graphics G7 96EUs, Intel Core i7-1165G7
21.8 pt
3DMark
1920x1080 Fire Strike Graphics
Dell XPS 14 Core Ultra X7 358H
Intel Arc B390 12 Xe3 Panther Lake iGPU, Intel Core Ultra X7 358H
17324 Points +29%
Asus ExpertBook Ultra B9406CAA
Intel Arc B390 12 Xe3 Panther Lake iGPU, Intel Core Ultra X7 358H
17054 Points +27%
Durchschnittliche Intel Arc B390 12 Xe3 Panther Lake iGPU
  (13410 - 17498, n=13)
16590 Points +24%
Framework Laptop 13 Pro
Intel Arc B390 12 Xe3 Panther Lake iGPU, Intel Core Ultra X7 358H
13410 Points
Dell Pro 13 Premium PA13250
Intel Arc Graphics 140V, Intel Core Ultra 7 268V
9554 Points -29%
Framework Laptop 13.5 Core Ultra 7 155H
Intel Arc 8-Core iGPU, Intel Core Ultra 7 155H
8513 Points -37%
Framework Laptop 13.5 Ryzen AI 9 HX 370
AMD Radeon 890M, AMD Ryzen AI 9 HX 370
7999 Points -40%
Microsoft Surface Laptop 8 13.8
Qualcomm SD X2 Adreno X2-45, Qualcomm Snapdragon X2 Plus X2P-64-100
6626 Points -51%
HP OmniBook 7 Aero 13-bg1077nr
AMD Radeon 860M, AMD Ryzen AI 7 350
6462 Points -52%
MSI Prestige 13 AI+ A3MG
Intel Graphics 4 Xe3 Panther Lake iGPU, Intel Core Ultra 9 386H
5688 Points -58%
HP EliteBook 8 Flip G1i 13
Intel Graphics 4-Core iGPU (Meteor / Arrow Lake), Intel Core Ultra 7 265U
5143 Points -62%
HP Elite Dragonfly G3
Intel Iris Xe Graphics G7 96EUs, Intel Core i7-1265U
4954 Points -63%
Framework Laptop 13.5
Intel Iris Xe Graphics G7 96EUs, Intel Core i7-1165G7
3709 Points -72%
2560x1440 Time Spy Graphics
Dell XPS 14 Core Ultra X7 358H
Intel Arc B390 12 Xe3 Panther Lake iGPU, Intel Core Ultra X7 358H
7043 Points +30%
Asus ExpertBook Ultra B9406CAA
Intel Arc B390 12 Xe3 Panther Lake iGPU, Intel Core Ultra X7 358H
6679 Points +23%
Durchschnittliche Intel Arc B390 12 Xe3 Panther Lake iGPU
  (4567 - 7257, n=20)
6468 Points +19%
Framework Laptop 13 Pro
Intel Arc B390 12 Xe3 Panther Lake iGPU, Intel Core Ultra X7 358H
5422 Points
Dell Pro 13 Premium PA13250
Intel Arc Graphics 140V, Intel Core Ultra 7 268V
3755 Points -31%
Framework Laptop 13.5 Core Ultra 7 155H
Intel Arc 8-Core iGPU, Intel Core Ultra 7 155H
3401 Points -37%
Framework Laptop 13.5 Ryzen AI 9 HX 370
AMD Radeon 890M, AMD Ryzen AI 9 HX 370
2942 Points -46%
MSI Prestige 13 AI+ A3MG
Intel Graphics 4 Xe3 Panther Lake iGPU, Intel Core Ultra 9 386H
2391 Points -56%
HP OmniBook 7 Aero 13-bg1077nr
AMD Radeon 860M, AMD Ryzen AI 7 350
2271 Points -58%
Microsoft Surface Laptop 8 13.8
Qualcomm SD X2 Adreno X2-45, Qualcomm Snapdragon X2 Plus X2P-64-100
2262 Points -58%
HP EliteBook 8 Flip G1i 13
Intel Graphics 4-Core iGPU (Meteor / Arrow Lake), Intel Core Ultra 7 265U
1808 Points -67%
HP Elite Dragonfly G3
Intel Iris Xe Graphics G7 96EUs, Intel Core i7-1265U
1549 Points -71%
Framework Laptop 13.5
Intel Iris Xe Graphics G7 96EUs, Intel Core i7-1165G7
1216 Points -78%
2560x1440 Time Spy Score
Dell XPS 14 Core Ultra X7 358H
Intel Arc B390 12 Xe3 Panther Lake iGPU, Intel Core Ultra X7 358H
7546 Points +28%
Asus ExpertBook Ultra B9406CAA
Intel Arc B390 12 Xe3 Panther Lake iGPU, Intel Core Ultra X7 358H
7270 Points +23%
Durchschnittliche Intel Arc B390 12 Xe3 Panther Lake iGPU
  (5915 - 7842, n=14)
7165 Points +21%
Framework Laptop 13 Pro
Intel Arc B390 12 Xe3 Panther Lake iGPU, Intel Core Ultra X7 358H
5915 Points
Dell Pro 13 Premium PA13250
Intel Arc Graphics 140V, Intel Core Ultra 7 268V
3969 Points -33%
Framework Laptop 13.5 Core Ultra 7 155H
Intel Arc 8-Core iGPU, Intel Core Ultra 7 155H
3725 Points -37%
Framework Laptop 13.5 Ryzen AI 9 HX 370
AMD Radeon 890M, AMD Ryzen AI 9 HX 370
3287 Points -44%
MSI Prestige 13 AI+ A3MG
Intel Graphics 4 Xe3 Panther Lake iGPU, Intel Core Ultra 9 386H
2672 Points -55%
Microsoft Surface Laptop 8 13.8
Qualcomm SD X2 Adreno X2-45, Qualcomm Snapdragon X2 Plus X2P-64-100
2538 Points -57%
HP OmniBook 7 Aero 13-bg1077nr
AMD Radeon 860M, AMD Ryzen AI 7 350
2533 Points -57%
HP EliteBook 8 Flip G1i 13
Intel Graphics 4-Core iGPU (Meteor / Arrow Lake), Intel Core Ultra 7 265U
2010 Points -66%
HP Elite Dragonfly G3
Intel Iris Xe Graphics G7 96EUs, Intel Core i7-1265U
1727 Points -71%
Framework Laptop 13.5
Intel Iris Xe Graphics G7 96EUs, Intel Core i7-1165G7
1361 Points -77%
3DMark 11 - 1280x720 Performance GPU
Dell XPS 14 Core Ultra X7 358H
Intel Arc B390 12 Xe3 Panther Lake iGPU, Intel Core Ultra X7 358H
18743 Points +28%
Asus ExpertBook Ultra B9406CAA
Intel Arc B390 12 Xe3 Panther Lake iGPU, Intel Core Ultra X7 358H
18313 Points +25%
Durchschnittliche Intel Arc B390 12 Xe3 Panther Lake iGPU
  (14637 - 18972, n=13)
18243 Points +25%
Framework Laptop 13 Pro
Intel Arc B390 12 Xe3 Panther Lake iGPU, Intel Core Ultra X7 358H
14637 Points
Framework Laptop 13.5 Core Ultra 7 155H
Intel Arc 8-Core iGPU, Intel Core Ultra 7 155H
12739 Points -13%
Framework Laptop 13.5 Ryzen AI 9 HX 370
AMD Radeon 890M, AMD Ryzen AI 9 HX 370
12641 Points -14%
Dell Pro 13 Premium PA13250
Intel Arc Graphics 140V, Intel Core Ultra 7 268V
11147 Points -24%
HP OmniBook 7 Aero 13-bg1077nr
AMD Radeon 860M, AMD Ryzen AI 7 350
11064 Points -24%
Microsoft Surface Laptop 8 13.8
Qualcomm SD X2 Adreno X2-45, Qualcomm Snapdragon X2 Plus X2P-64-100
7647 Points -48%
MSI Prestige 13 AI+ A3MG
Intel Graphics 4 Xe3 Panther Lake iGPU, Intel Core Ultra 9 386H
6500 Points -56%
HP Elite Dragonfly G3
Intel Iris Xe Graphics G7 96EUs, Intel Core i7-1265U
6155 Points -58%
HP EliteBook 8 Flip G1i 13
Intel Graphics 4-Core iGPU (Meteor / Arrow Lake), Intel Core Ultra 7 265U
6090 Points -58%
Framework Laptop 13.5
Intel Iris Xe Graphics G7 96EUs, Intel Core i7-1165G7
5702 Points -61%
3DMark 11 Performance
14386 Punkte
3DMark Cloud Gate Standard Score
34227 Punkte
3DMark Fire Strike Score
11342 Punkte
3DMark Time Spy Score
5915 Punkte
Hilfe
Blender
v3.3 Classroom CPU
HP Elite Dragonfly G3
Intel Iris Xe Graphics G7 96EUs, Intel Core i7-1265U
923 Seconds * -155%
Dell Pro 13 Premium PA13250
Intel Arc Graphics 140V, Intel Core Ultra 7 268V
698 Seconds * -93%
Microsoft Surface Laptop 8 13.8
Qualcomm SD X2 Adreno X2-45, Qualcomm Snapdragon X2 Plus X2P-64-100
693 Seconds * -91%
HP EliteBook 8 Flip G1i 13
Intel Graphics 4-Core iGPU (Meteor / Arrow Lake), Intel Core Ultra 7 265U
667 Seconds * -84%
MSI Prestige 13 AI+ A3MG
Intel Graphics 4 Xe3 Panther Lake iGPU, Intel Core Ultra 9 386H
503 Seconds * -39%
Framework Laptop 13.5 Core Ultra 7 155H
Intel Arc 8-Core iGPU, Intel Core Ultra 7 155H
451 Seconds * -25%
HP OmniBook 7 Aero 13-bg1077nr
AMD Radeon 860M, AMD Ryzen AI 7 350
365 Seconds * -1%
Framework Laptop 13 Pro
Intel Arc B390 12 Xe3 Panther Lake iGPU, Intel Core Ultra X7 358H
362 Seconds *
Dell XPS 14 Core Ultra X7 358H
Intel Arc B390 12 Xe3 Panther Lake iGPU, Intel Core Ultra X7 358H
335 Seconds * +7%
Durchschnittliche Intel Arc B390 12 Xe3 Panther Lake iGPU
  (282 - 409, n=13)
329 Seconds * +9%
Framework Laptop 13.5 Ryzen AI 9 HX 370
AMD Radeon 890M, AMD Ryzen AI 9 HX 370
292 Seconds * +19%
Asus ExpertBook Ultra B9406CAA
Intel Arc B390 12 Xe3 Panther Lake iGPU, Intel Core Ultra X7 358H
288 Seconds * +20%
v3.3 Classroom oneAPI/Intel
Dell Pro 13 Premium PA13250
Intel Arc Graphics 140V, Intel Core Ultra 7 268V
368 Seconds *
HP EliteBook 8 Flip G1i 13
Intel Graphics 4-Core iGPU (Meteor / Arrow Lake), Intel Core Ultra 7 265U
313 Seconds *
Framework Laptop 13.5 Core Ultra 7 155H
Intel Arc 8-Core iGPU, Intel Core Ultra 7 155H
235 Seconds *
Durchschnittliche Intel Arc B390 12 Xe3 Panther Lake iGPU
  (105 - 254, n=6)
131.5 Seconds *
Asus ExpertBook Ultra B9406CAA
Intel Arc B390 12 Xe3 Panther Lake iGPU, Intel Core Ultra X7 358H
110 Seconds *
Dell XPS 14 Core Ultra X7 358H
Intel Arc B390 12 Xe3 Panther Lake iGPU, Intel Core Ultra X7 358H
106 Seconds *
v4.3 Barbershop CPU
HP EliteBook 8 Flip G1i 13
Intel Graphics 4-Core iGPU (Meteor / Arrow Lake), Intel Core Ultra 7 265U
3358 Seconds * -87%
HP OmniBook 7 Aero 13-bg1077nr
AMD Radeon 860M, AMD Ryzen AI 7 350
2075 Seconds * -15%
Framework Laptop 13 Pro
Intel Arc B390 12 Xe3 Panther Lake iGPU, Intel Core Ultra X7 358H
1800 Seconds *
Dell XPS 14 Core Ultra X7 358H
Intel Arc B390 12 Xe3 Panther Lake iGPU, Intel Core Ultra X7 358H
1711 Seconds * +5%
Durchschnittliche Intel Arc B390 12 Xe3 Panther Lake iGPU
  (1382 - 1800, n=8)
1590 Seconds * +12%
Framework Laptop 13.5 Ryzen AI 9 HX 370
AMD Radeon 890M, AMD Ryzen AI 9 HX 370
1532 Seconds * +15%
Asus ExpertBook Ultra B9406CAA
Intel Arc B390 12 Xe3 Panther Lake iGPU, Intel Core Ultra X7 358H
1439 Seconds * +20%

* ... kleinere Werte sind besser

Performance Rating - Percent
Asus ExpertBook Ultra B9406CAA
Intel Core Ultra X7 358H, Intel Arc B390 12 Xe3 Panther Lake iGPU
97.8 pt
Dell XPS 14 Core Ultra X7 358H
Intel Core Ultra X7 358H, Intel Arc B390 12 Xe3 Panther Lake iGPU
93.3 pt
Framework Laptop 13 Pro
Intel Core Ultra X7 358H, Intel Arc B390 12 Xe3 Panther Lake iGPU
79.1 pt
Framework Laptop 13.5 Ryzen AI 9 HX 370
AMD Ryzen AI 9 HX 370, AMD Radeon 890M
59.3 pt
MSI Prestige 13 AI+ A3MG -4!
Intel Core Ultra 9 386H, Intel Graphics 4 Xe3 Panther Lake iGPU
58.7 pt
Microsoft Surface Laptop 8 13.8
Qualcomm Snapdragon X2 Plus X2P-64-100, Qualcomm SD X2 Adreno X2-45
51 pt
Cyberpunk 2077 - 1920x1080 Ultra Preset (FSR off)
Asus ExpertBook Ultra B9406CAA
Intel Core Ultra X7 358H, Intel Arc B390 12 Xe3 Panther Lake iGPU
47.2 (39.1min, 36.3P1) fps +23%
Dell XPS 14 Core Ultra X7 358H
Intel Core Ultra X7 358H, Intel Arc B390 12 Xe3 Panther Lake iGPU
40.9 (33.3min, 30.6P1) fps +7%
Framework Laptop 13 Pro
Intel Core Ultra X7 358H, Intel Arc B390 12 Xe3 Panther Lake iGPU
38.3 (31.7min, 30P1) fps
Framework Laptop 13.5 Ryzen AI 9 HX 370
AMD Ryzen AI 9 HX 370, AMD Radeon 890M
24.4 (20.6min, 17.8P1) fps -36%
MSI Prestige 13 AI+ A3MG
Intel Core Ultra 9 386H, Intel Graphics 4 Xe3 Panther Lake iGPU
19.1 (16min) fps -50%
Microsoft Surface Laptop 8 13.8
Qualcomm Snapdragon X2 Plus X2P-64-100, Qualcomm SD X2 Adreno X2-45
19.1 (15.6min) fps -50%
Baldur's Gate 3 - 1920x1080 Ultra Preset AA:T
Asus ExpertBook Ultra B9406CAA
Intel Core Ultra X7 358H, Intel Arc B390 12 Xe3 Panther Lake iGPU
53.4 (45.4min, 46.4P0.1, 49.5P1) fps +28%
Dell XPS 14 Core Ultra X7 358H
Intel Core Ultra X7 358H, Intel Arc B390 12 Xe3 Panther Lake iGPU
48.7 (43.1min, 44.3P0.1, 45.5P1) fps +17%
Framework Laptop 13 Pro
Intel Core Ultra X7 358H, Intel Arc B390 12 Xe3 Panther Lake iGPU
41.7 (38.5min, 38.5P0.1, 38.8P1) fps
Framework Laptop 13.5 Ryzen AI 9 HX 370
AMD Ryzen AI 9 HX 370, AMD Radeon 890M
30 fps -28%
Microsoft Surface Laptop 8 13.8
Qualcomm Snapdragon X2 Plus X2P-64-100, Qualcomm SD X2 Adreno X2-45
21.4 (19.1min, 19.1P0.1, 19.5P1) fps -49%
GTA V - 1920x1080 Highest AA:4xMSAA + FX AF:16x
Asus ExpertBook Ultra B9406CAA
Intel Core Ultra X7 358H, Intel Arc B390 12 Xe3 Panther Lake iGPU
45.3 (11.1min, 34.5P1) fps +28%
Dell XPS 14 Core Ultra X7 358H
Intel Core Ultra X7 358H, Intel Arc B390 12 Xe3 Panther Lake iGPU
43.3 (6.46min, 33.3P1) fps +22%
Framework Laptop 13 Pro
Intel Core Ultra X7 358H, Intel Arc B390 12 Xe3 Panther Lake iGPU
35.4 (7.09min, 25.6P1) fps
Framework Laptop 13.5 Ryzen AI 9 HX 370
AMD Ryzen AI 9 HX 370, AMD Radeon 890M
29.7 (4.74min, 20.8P1) fps -16%
Microsoft Surface Laptop 8 13.8
Qualcomm Snapdragon X2 Plus X2P-64-100, Qualcomm SD X2 Adreno X2-45
23 (3.03min, 15.9P1) fps -35%
Final Fantasy XV Benchmark - 1920x1080 High Quality
Asus ExpertBook Ultra B9406CAA
Intel Core Ultra X7 358H, Intel Arc B390 12 Xe3 Panther Lake iGPU
55.4 fps +29%
Dell XPS 14 Core Ultra X7 358H
Intel Core Ultra X7 358H, Intel Arc B390 12 Xe3 Panther Lake iGPU
52.8 fps +23%
Framework Laptop 13 Pro
Intel Core Ultra X7 358H, Intel Arc B390 12 Xe3 Panther Lake iGPU
43.1 fps
Framework Laptop 13.5 Ryzen AI 9 HX 370
AMD Ryzen AI 9 HX 370, AMD Radeon 890M
27.8 fps -35%
Microsoft Surface Laptop 8 13.8
Qualcomm Snapdragon X2 Plus X2P-64-100, Qualcomm SD X2 Adreno X2-45
21.1 fps -51%
Strange Brigade - 1920x1080 ultra AA:ultra AF:16
Asus ExpertBook Ultra B9406CAA
Intel Core Ultra X7 358H, Intel Arc B390 12 Xe3 Panther Lake iGPU
99.5 (24.8min, 76.1P1) fps +24%
Dell XPS 14 Core Ultra X7 358H
Intel Core Ultra X7 358H, Intel Arc B390 12 Xe3 Panther Lake iGPU
95.1 (51.4min, 79.8P1) fps +18%
Framework Laptop 13 Pro
Intel Core Ultra X7 358H, Intel Arc B390 12 Xe3 Panther Lake iGPU
80.4 (46.7min, 57.8P1) fps
Framework Laptop 13.5 Ryzen AI 9 HX 370
AMD Ryzen AI 9 HX 370, AMD Radeon 890M
48.5 (22.1min, 26.5P1) fps -40%
Microsoft Surface Laptop 8 13.8
Qualcomm Snapdragon X2 Plus X2P-64-100, Qualcomm SD X2 Adreno X2-45
44 (9.2min, 12.6P1) fps -45%
Dota 2 Reborn - 1920x1080 ultra (3/3) best looking
Dell XPS 14 Core Ultra X7 358H
Intel Core Ultra X7 358H, Intel Arc B390 12 Xe3 Panther Lake iGPU
105.4 (70.1min) fps +32%
Asus ExpertBook Ultra B9406CAA
Intel Core Ultra X7 358H, Intel Arc B390 12 Xe3 Panther Lake iGPU
102.5 (67.7min) fps +29%
Framework Laptop 13 Pro
Intel Core Ultra X7 358H, Intel Arc B390 12 Xe3 Panther Lake iGPU
79.7 (62.4min) fps
MSI Prestige 13 AI+ A3MG
Intel Core Ultra 9 386H, Intel Graphics 4 Xe3 Panther Lake iGPU
73 (46.6min) fps -8%
Microsoft Surface Laptop 8 13.8
Qualcomm Snapdragon X2 Plus X2P-64-100, Qualcomm SD X2 Adreno X2-45
60.7 (46.4min) fps -24%
Framework Laptop 13.5 Ryzen AI 9 HX 370
AMD Ryzen AI 9 HX 370, AMD Radeon 890M
45.1 (33.5min) fps -43%
X-Plane 11.11 - 1920x1080 high (fps_test=3)
Framework Laptop 13.5 Ryzen AI 9 HX 370
AMD Ryzen AI 9 HX 370, AMD Radeon 890M
45.4 fps +22%
Dell XPS 14 Core Ultra X7 358H
Intel Core Ultra X7 358H, Intel Arc B390 12 Xe3 Panther Lake iGPU
40.3 fps +8%
Asus ExpertBook Ultra B9406CAA
Intel Core Ultra X7 358H, Intel Arc B390 12 Xe3 Panther Lake iGPU
39.7 fps +7%
Microsoft Surface Laptop 8 13.8
Qualcomm Snapdragon X2 Plus X2P-64-100, Qualcomm SD X2 Adreno X2-45
38.8 fps +4%
Framework Laptop 13 Pro
Intel Core Ultra X7 358H, Intel Arc B390 12 Xe3 Panther Lake iGPU
37.2 fps
MSI Prestige 13 AI+ A3MG
Intel Core Ultra 9 386H, Intel Graphics 4 Xe3 Panther Lake iGPU
30.1 fps -19%
GTA V
1920x1080 High/On (Advanced Graphics Off) AA:2xMSAA + FX AF:8x
Asus ExpertBook Ultra B9406CAA
Intel Core Ultra X7 358H, Intel Arc B390 12 Xe3 Panther Lake iGPU
111.9 (7.17min, 76.9P1) fps +36%
Durchschnittliche Intel Arc B390 12 Xe3 Panther Lake iGPU
  (82.3 - 114.5, n=12)
101.8 fps +24%
Dell XPS 14 Core Ultra X7 358H
Intel Core Ultra X7 358H, Intel Arc B390 12 Xe3 Panther Lake iGPU
98.2 (6.53min, 66.7P1) fps +19%
Framework Laptop 13 Pro
Intel Core Ultra X7 358H, Intel Arc B390 12 Xe3 Panther Lake iGPU
82.3 (11min, 50P1) fps
Framework Laptop 13.5 Ryzen AI 9 HX 370
AMD Ryzen AI 9 HX 370, AMD Radeon 890M
71.2 (6.91min, 50P1) fps -13%
HP OmniBook 7 Aero 13-bg1077nr
AMD Ryzen AI 7 350, AMD Radeon 860M
60.8 (3.38min, 41.7P1) fps -26%
Microsoft Surface Laptop 8 13.8
Qualcomm Snapdragon X2 Plus X2P-64-100, Qualcomm SD X2 Adreno X2-45
57.9 (1.678min, 31.3P1) fps -30%
Framework Laptop 13.5 Core Ultra 7 155H
Intel Core Ultra 7 155H, Intel Arc 8-Core iGPU
43.5 (2.85min, 21.7P1) fps -47%
HP EliteBook 8 Flip G1i 13
Intel Core Ultra 7 265U, Intel Graphics 4-Core iGPU (Meteor / Arrow Lake)
24.4 (7.21min, 18.5P1) fps -70%
HP Elite Dragonfly G3
Intel Core i7-1265U, Intel Iris Xe Graphics G7 96EUs
23.3 (7.35min, 16.7P1) fps -72%
1920x1080 Highest AA:4xMSAA + FX AF:16x
Asus ExpertBook Ultra B9406CAA
Intel Core Ultra X7 358H, Intel Arc B390 12 Xe3 Panther Lake iGPU
45.3 (11.1min, 34.5P1) fps +28%
Dell XPS 14 Core Ultra X7 358H
Intel Core Ultra X7 358H, Intel Arc B390 12 Xe3 Panther Lake iGPU
43.3 (6.46min, 33.3P1) fps +22%
Durchschnittliche Intel Arc B390 12 Xe3 Panther Lake iGPU
  (35.4 - 46.2, n=13)
42.6 fps +20%
Framework Laptop 13 Pro
Intel Core Ultra X7 358H, Intel Arc B390 12 Xe3 Panther Lake iGPU
35.4 (7.09min, 25.6P1) fps
Framework Laptop 13.5 Ryzen AI 9 HX 370
AMD Ryzen AI 9 HX 370, AMD Radeon 890M
29.7 (4.74min, 20.8P1) fps -16%
Dell Pro 13 Premium PA13250
Intel Core Ultra 7 268V, Intel Arc Graphics 140V
26.3 (6.46min, 20P1) fps -26%
HP OmniBook 7 Aero 13-bg1077nr
AMD Ryzen AI 7 350, AMD Radeon 860M
25.7 (2.43min, 16.9P1) fps -27%
Microsoft Surface Laptop 8 13.8
Qualcomm Snapdragon X2 Plus X2P-64-100, Qualcomm SD X2 Adreno X2-45
23 (3.03min, 15.9P1) fps -35%
Framework Laptop 13.5 Core Ultra 7 155H
Intel Core Ultra 7 155H, Intel Arc 8-Core iGPU
17.5 (2.07min, 12P1) fps -51%
HP Elite Dragonfly G3
Intel Core i7-1265U, Intel Iris Xe Graphics G7 96EUs
10.2 (3.63min, 6.9P1) fps -71%
HP EliteBook 8 Flip G1i 13
Intel Core Ultra 7 265U, Intel Graphics 4-Core iGPU (Meteor / Arrow Lake)
9.99 (2.84min, 7.46P1) fps -72%
Dota 2 Reborn - 1920x1080 ultra (3/3) best looking
Dell XPS 14 Core Ultra X7 358H
Intel Core Ultra X7 358H, Intel Arc B390 12 Xe3 Panther Lake iGPU
105.4 (70.1min) fps +32%
Asus ExpertBook Ultra B9406CAA
Intel Core Ultra X7 358H, Intel Arc B390 12 Xe3 Panther Lake iGPU
102.5 (67.7min) fps +29%
Durchschnittliche Intel Arc B390 12 Xe3 Panther Lake iGPU
  (79.7 - 117.2, n=14)
101.3 fps +27%
Framework Laptop 13 Pro
Intel Core Ultra X7 358H, Intel Arc B390 12 Xe3 Panther Lake iGPU
79.7 (62.4min) fps
HP OmniBook 7 Aero 13-bg1077nr
AMD Ryzen AI 7 350, AMD Radeon 860M
73.3 (66min) fps -8%
MSI Prestige 13 AI+ A3MG
Intel Core Ultra 9 386H, Intel Graphics 4 Xe3 Panther Lake iGPU
73 (46.6min) fps -8%
Dell Pro 13 Premium PA13250
Intel Core Ultra 7 268V, Intel Arc Graphics 140V
71.2 (43.6min) fps -11%
Framework Laptop 13.5 Core Ultra 7 155H
Intel Core Ultra 7 155H, Intel Arc 8-Core iGPU
62.1 (35.2min) fps -22%
Microsoft Surface Laptop 8 13.8
Qualcomm Snapdragon X2 Plus X2P-64-100, Qualcomm SD X2 Adreno X2-45
60.7 (46.4min) fps -24%
HP EliteBook 8 Flip G1i 13
Intel Core Ultra 7 265U, Intel Graphics 4-Core iGPU (Meteor / Arrow Lake)
52.4 (32.2min) fps -34%
HP Elite Dragonfly G3
Intel Core i7-1265U, Intel Iris Xe Graphics G7 96EUs
50.9 (42.5min) fps -36%
Framework Laptop 13.5 Ryzen AI 9 HX 370
AMD Ryzen AI 9 HX 370, AMD Radeon 890M
45.1 (33.5min) fps -43%
Framework Laptop 13.5
Intel Core i7-1165G7, Intel Iris Xe Graphics G7 96EUs
38.2 (33.7min) fps -52%
Final Fantasy XV Benchmark
1280x720 Lite Quality
Asus ExpertBook Ultra B9406CAA
Intel Core Ultra X7 358H, Intel Arc B390 12 Xe3 Panther Lake iGPU
134.5 fps +33%
Durchschnittliche Intel Arc B390 12 Xe3 Panther Lake iGPU
  (101.3 - 140.4, n=12)
126.4 fps +25%
Dell XPS 14 Core Ultra X7 358H
Intel Core Ultra X7 358H, Intel Arc B390 12 Xe3 Panther Lake iGPU
123.5 fps +22%
Framework Laptop 13 Pro
Intel Core Ultra X7 358H, Intel Arc B390 12 Xe3 Panther Lake iGPU
101.3 fps
Dell Pro 13 Premium PA13250
Intel Core Ultra 7 268V, Intel Arc Graphics 140V
74.9 fps -26%
Framework Laptop 13.5 Ryzen AI 9 HX 370
AMD Ryzen AI 9 HX 370, AMD Radeon 890M
73 fps -28%
Microsoft Surface Laptop 8 13.8
Qualcomm Snapdragon X2 Plus X2P-64-100, Qualcomm SD X2 Adreno X2-45
71.9 fps -29%
Framework Laptop 13.5 Core Ultra 7 155H
Intel Core Ultra 7 155H, Intel Arc 8-Core iGPU
70 fps -31%
HP OmniBook 7 Aero 13-bg1077nr
AMD Ryzen AI 7 350, AMD Radeon 860M
63.4 fps -37%
HP EliteBook 8 Flip G1i 13
Intel Core Ultra 7 265U, Intel Graphics 4-Core iGPU (Meteor / Arrow Lake)
42.6 fps -58%
HP Elite Dragonfly G3
Intel Core i7-1265U, Intel Iris Xe Graphics G7 96EUs
39.7 fps -61%
Framework Laptop 13.5
Intel Core i7-1165G7, Intel Iris Xe Graphics G7 96EUs
29.4 fps -71%
1920x1080 Standard Quality
Asus ExpertBook Ultra B9406CAA
Intel Core Ultra X7 358H, Intel Arc B390 12 Xe3 Panther Lake iGPU
76.1 fps +22%
Dell XPS 14 Core Ultra X7 358H
Intel Core Ultra X7 358H, Intel Arc B390 12 Xe3 Panther Lake iGPU
73.7 fps +18%
Durchschnittliche Intel Arc B390 12 Xe3 Panther Lake iGPU
  (60.7 - 83, n=12)
73.6 fps +18%
Framework Laptop 13 Pro
Intel Core Ultra X7 358H, Intel Arc B390 12 Xe3 Panther Lake iGPU
62.3 fps
Dell Pro 13 Premium PA13250
Intel Core Ultra 7 268V, Intel Arc Graphics 140V
42.3 fps -32%
Framework Laptop 13.5 Ryzen AI 9 HX 370
AMD Ryzen AI 9 HX 370, AMD Radeon 890M
39.1 fps -37%
Framework Laptop 13.5 Core Ultra 7 155H
Intel Core Ultra 7 155H, Intel Arc 8-Core iGPU
38 fps -39%
Microsoft Surface Laptop 8 13.8
Qualcomm Snapdragon X2 Plus X2P-64-100, Qualcomm SD X2 Adreno X2-45
37.2 fps -40%
HP OmniBook 7 Aero 13-bg1077nr
AMD Ryzen AI 7 350, AMD Radeon 860M
32.7 fps -48%
HP EliteBook 8 Flip G1i 13
Intel Core Ultra 7 265U, Intel Graphics 4-Core iGPU (Meteor / Arrow Lake)
24.9 fps -60%
HP Elite Dragonfly G3
Intel Core i7-1265U, Intel Iris Xe Graphics G7 96EUs
22.7 fps -64%
Framework Laptop 13.5
Intel Core i7-1165G7, Intel Iris Xe Graphics G7 96EUs
15.7 fps -75%
1920x1080 High Quality
Asus ExpertBook Ultra B9406CAA
Intel Core Ultra X7 358H, Intel Arc B390 12 Xe3 Panther Lake iGPU
55.4 fps +29%
Dell XPS 14 Core Ultra X7 358H
Intel Core Ultra X7 358H, Intel Arc B390 12 Xe3 Panther Lake iGPU
52.8 fps +23%
Durchschnittliche Intel Arc B390 12 Xe3 Panther Lake iGPU
  (37.8 - 57.9, n=12)
51.4 fps +19%
Framework Laptop 13 Pro
Intel Core Ultra X7 358H, Intel Arc B390 12 Xe3 Panther Lake iGPU
43.1 fps
Dell Pro 13 Premium PA13250
Intel Core Ultra 7 268V, Intel Arc Graphics 140V
29.1 fps -32%
Framework Laptop 13.5 Ryzen AI 9 HX 370
AMD Ryzen AI 9 HX 370, AMD Radeon 890M
27.8 fps -35%
Framework Laptop 13.5 Core Ultra 7 155H
Intel Core Ultra 7 155H, Intel Arc 8-Core iGPU
27.2 fps -37%
HP OmniBook 7 Aero 13-bg1077nr
AMD Ryzen AI 7 350, AMD Radeon 860M
23.3 fps -46%
Microsoft Surface Laptop 8 13.8
Qualcomm Snapdragon X2 Plus X2P-64-100, Qualcomm SD X2 Adreno X2-45
21.1 fps -51%
HP EliteBook 8 Flip G1i 13
Intel Core Ultra 7 265U, Intel Graphics 4-Core iGPU (Meteor / Arrow Lake)
18.2 fps -58%
HP Elite Dragonfly G3
Intel Core i7-1265U, Intel Iris Xe Graphics G7 96EUs
15.8 fps -63%
Framework Laptop 13.5
Intel Core i7-1165G7, Intel Iris Xe Graphics G7 96EUs
12.1 fps -72%
X-Plane 11.11 - 1920x1080 high (fps_test=3)
Framework Laptop 13.5 Ryzen AI 9 HX 370
AMD Ryzen AI 9 HX 370, AMD Radeon 890M
45.4 fps +22%
HP OmniBook 7 Aero 13-bg1077nr
AMD Ryzen AI 7 350, AMD Radeon 860M
40.4 fps +9%
Durchschnittliche Intel Arc B390 12 Xe3 Panther Lake iGPU
  (37.2 - 44.5, n=14)
40.4 fps +9%
Dell XPS 14 Core Ultra X7 358H
Intel Core Ultra X7 358H, Intel Arc B390 12 Xe3 Panther Lake iGPU
40.3 fps +8%
Asus ExpertBook Ultra B9406CAA
Intel Core Ultra X7 358H, Intel Arc B390 12 Xe3 Panther Lake iGPU
39.7 fps +7%
Microsoft Surface Laptop 8 13.8
Qualcomm Snapdragon X2 Plus X2P-64-100, Qualcomm SD X2 Adreno X2-45
38.8 fps +4%
Framework Laptop 13 Pro
Intel Core Ultra X7 358H, Intel Arc B390 12 Xe3 Panther Lake iGPU
37.2 fps
Framework Laptop 13.5 Core Ultra 7 155H
Intel Core Ultra 7 155H, Intel Arc 8-Core iGPU
33.7 fps -9%
Dell Pro 13 Premium PA13250
Intel Core Ultra 7 268V, Intel Arc Graphics 140V
32.7 fps -12%
HP Elite Dragonfly G3
Intel Core i7-1265U, Intel Iris Xe Graphics G7 96EUs
31.2 fps -16%
MSI Prestige 13 AI+ A3MG
Intel Core Ultra 9 386H, Intel Graphics 4 Xe3 Panther Lake iGPU
30.1 fps -19%
Framework Laptop 13.5
Intel Core i7-1165G7, Intel Iris Xe Graphics G7 96EUs
29.5 fps -21%
HP EliteBook 8 Flip G1i 13
Intel Core Ultra 7 265U, Intel Graphics 4-Core iGPU (Meteor / Arrow Lake)
23.7 fps -36%
Strange Brigade
1920x1080 high AA:high AF:8
Asus ExpertBook Ultra B9406CAA
Intel Core Ultra X7 358H, Intel Arc B390 12 Xe3 Panther Lake iGPU
107.6 (64.5min, 89P1) fps +17%
Durchschnittliche Intel Arc B390 12 Xe3 Panther Lake iGPU
  (91.8 - 116.7, n=12)
105 fps +14%
Dell XPS 14 Core Ultra X7 358H
Intel Core Ultra X7 358H, Intel Arc B390 12 Xe3 Panther Lake iGPU
103.3 (57.4min, 80.8P1) fps +13%
Framework Laptop 13 Pro
Intel Core Ultra X7 358H, Intel Arc B390 12 Xe3 Panther Lake iGPU
91.8 (53min, 72.4P1) fps
Dell Pro 13 Premium PA13250
Intel Core Ultra 7 268V, Intel Arc Graphics 140V
69.5 (38.9min, 55.1P1) fps -24%
Framework Laptop 13.5 Core Ultra 7 155H
Intel Core Ultra 7 155H, Intel Arc 8-Core iGPU
59.6 (42.8min, 48.2P1) fps -35%
Framework Laptop 13.5 Ryzen AI 9 HX 370
AMD Ryzen AI 9 HX 370, AMD Radeon 890M
58.7 (39.9min, 44.5P1) fps -36%
Microsoft Surface Laptop 8 13.8
Qualcomm Snapdragon X2 Plus X2P-64-100, Qualcomm SD X2 Adreno X2-45
52.9 (12.1min, 16.9P1) fps -42%
HP OmniBook 7 Aero 13-bg1077nr
AMD Ryzen AI 7 350, AMD Radeon 860M
48.4 (27.2min, 37P1) fps -47%
HP EliteBook 8 Flip G1i 13
Intel Core Ultra 7 265U, Intel Graphics 4-Core iGPU (Meteor / Arrow Lake)
32.4 (17.9min, 22.3P1) fps -65%
HP Elite Dragonfly G3
Intel Core i7-1265U, Intel Iris Xe Graphics G7 96EUs
31.4 (11.3min, 17.1P1) fps -66%
1920x1080 ultra AA:ultra AF:16
Asus ExpertBook Ultra B9406CAA
Intel Core Ultra X7 358H, Intel Arc B390 12 Xe3 Panther Lake iGPU
99.5 (24.8min, 76.1P1) fps +24%
Dell XPS 14 Core Ultra X7 358H
Intel Core Ultra X7 358H, Intel Arc B390 12 Xe3 Panther Lake iGPU
95.1 (51.4min, 79.8P1) fps +18%
Durchschnittliche Intel Arc B390 12 Xe3 Panther Lake iGPU
  (80 - 101.4, n=12)
92.9 fps +16%
Framework Laptop 13 Pro
Intel Core Ultra X7 358H, Intel Arc B390 12 Xe3 Panther Lake iGPU
80.4 (46.7min, 57.8P1) fps
Dell Pro 13 Premium PA13250
Intel Core Ultra 7 268V, Intel Arc Graphics 140V
57.8 (16min, 33.5P1) fps -28%
Framework Laptop 13.5 Core Ultra 7 155H
Intel Core Ultra 7 155H, Intel Arc 8-Core iGPU
48.5 (12.8min, 21.5P1) fps -40%
Framework Laptop 13.5 Ryzen AI 9 HX 370
AMD Ryzen AI 9 HX 370, AMD Radeon 890M
48.5 (22.1min, 26.5P1) fps -40%
Microsoft Surface Laptop 8 13.8
Qualcomm Snapdragon X2 Plus X2P-64-100, Qualcomm SD X2 Adreno X2-45
44 (9.2min, 12.6P1) fps -45%
HP OmniBook 7 Aero 13-bg1077nr
AMD Ryzen AI 7 350, AMD Radeon 860M
40.3 (28.2min, 31.5P1) fps -50%
HP EliteBook 8 Flip G1i 13
Intel Core Ultra 7 265U, Intel Graphics 4-Core iGPU (Meteor / Arrow Lake)
27.1 (16.1min, 18.4P1) fps -66%
HP Elite Dragonfly G3
Intel Core i7-1265U, Intel Iris Xe Graphics G7 96EUs
25.4 (6.6min, 8.78P1) fps -68%
Baldur's Gate 3
1920x1080 Medium Preset AA:T
Asus ExpertBook Ultra B9406CAA
Intel Core Ultra X7 358H, Intel Arc B390 12 Xe3 Panther Lake iGPU
60.8 (50.7min, 51.4P0.1, 55.8P1) fps +28%
Dell XPS 14 Core Ultra X7 358H
Intel Core Ultra X7 358H, Intel Arc B390 12 Xe3 Panther Lake iGPU
55.4 (49.6min, 49.9P0.1, 51P1) fps +16%
Durchschnittliche Intel Arc B390 12 Xe3 Panther Lake iGPU
  (47.5 - 62.3, n=11)
55.4 fps +16%
Framework Laptop 13 Pro
Intel Core Ultra X7 358H, Intel Arc B390 12 Xe3 Panther Lake iGPU
47.6 (42.8min, 43.3P0.1, 44.5P1) fps
Framework Laptop 13.5 Ryzen AI 9 HX 370
AMD Ryzen AI 9 HX 370, AMD Radeon 890M
36.9 fps -22%
Dell Pro 13 Premium PA13250
Intel Core Ultra 7 268V, Intel Arc Graphics 140V
35.7 fps -25%
Framework Laptop 13.5 Core Ultra 7 155H
Intel Core Ultra 7 155H, Intel Arc 8-Core iGPU
30.7 fps -36%
HP OmniBook 7 Aero 13-bg1077nr
AMD Ryzen AI 7 350, AMD Radeon 860M
26.4 (15.9min, 16.5P0.1, 20.8P1) fps -45%
Microsoft Surface Laptop 8 13.8
Qualcomm Snapdragon X2 Plus X2P-64-100, Qualcomm SD X2 Adreno X2-45
25 (22.2min, 22.3P0.1, 22.8P1) fps -47%
HP EliteBook 8 Flip G1i 13
Intel Core Ultra 7 265U, Intel Graphics 4-Core iGPU (Meteor / Arrow Lake)
14.9 fps -69%
1920x1080 High Preset AA:T
Asus ExpertBook Ultra B9406CAA
Intel Core Ultra X7 358H, Intel Arc B390 12 Xe3 Panther Lake iGPU
54.3 (45.6min, 47.8P0.1, 50P1) fps +28%
Durchschnittliche Intel Arc B390 12 Xe3 Panther Lake iGPU
  (42.5 - 57.6, n=11)
49.6 fps +17%
Dell XPS 14 Core Ultra X7 358H
Intel Core Ultra X7 358H, Intel Arc B390 12 Xe3 Panther Lake iGPU
49 (44.2min, 44.5P0.1, 46.3P1) fps +15%
Framework Laptop 13 Pro
Intel Core Ultra X7 358H, Intel Arc B390 12 Xe3 Panther Lake iGPU
42.5 (38.1min, 39P0.1, 39.8P1) fps
Dell Pro 13 Premium PA13250
Intel Core Ultra 7 268V, Intel Arc Graphics 140V
31.3 fps -26%
Framework Laptop 13.5 Ryzen AI 9 HX 370
AMD Ryzen AI 9 HX 370, AMD Radeon 890M
30.8 fps -28%
Framework Laptop 13.5 Core Ultra 7 155H
Intel Core Ultra 7 155H, Intel Arc 8-Core iGPU
26.7 fps -37%
Microsoft Surface Laptop 8 13.8
Qualcomm Snapdragon X2 Plus X2P-64-100, Qualcomm SD X2 Adreno X2-45
21.6 (19.7min, 19.7P0.1, 19.9P1) fps -49%
HP OmniBook 7 Aero 13-bg1077nr
AMD Ryzen AI 7 350, AMD Radeon 860M
21.1 (16.7min, 17.1P0.1, 18.9P1) fps -50%
HP EliteBook 8 Flip G1i 13
Intel Core Ultra 7 265U, Intel Graphics 4-Core iGPU (Meteor / Arrow Lake)
12.8 fps -70%
1920x1080 Ultra Preset AA:T
Asus ExpertBook Ultra B9406CAA
Intel Core Ultra X7 358H, Intel Arc B390 12 Xe3 Panther Lake iGPU
53.4 (45.4min, 46.4P0.1, 49.5P1) fps +28%
Dell XPS 14 Core Ultra X7 358H
Intel Core Ultra X7 358H, Intel Arc B390 12 Xe3 Panther Lake iGPU
48.7 (43.1min, 44.3P0.1, 45.5P1) fps +17%
Durchschnittliche Intel Arc B390 12 Xe3 Panther Lake iGPU
  (39.4 - 54.3, n=14)
47.7 fps +14%
Framework Laptop 13 Pro
Intel Core Ultra X7 358H, Intel Arc B390 12 Xe3 Panther Lake iGPU
41.7 (38.5min, 38.5P0.1, 38.8P1) fps
Dell Pro 13 Premium PA13250
Intel Core Ultra 7 268V, Intel Arc Graphics 140V
30.8 fps -26%
Framework Laptop 13.5 Ryzen AI 9 HX 370
AMD Ryzen AI 9 HX 370, AMD Radeon 890M
30 fps -28%
Framework Laptop 13.5 Core Ultra 7 155H
Intel Core Ultra 7 155H, Intel Arc 8-Core iGPU
25.7 fps -38%
Microsoft Surface Laptop 8 13.8
Qualcomm Snapdragon X2 Plus X2P-64-100, Qualcomm SD X2 Adreno X2-45
21.4 (19.1min, 19.1P0.1, 19.5P1) fps -49%
HP OmniBook 7 Aero 13-bg1077nr
AMD Ryzen AI 7 350, AMD Radeon 860M
20.6 (17.1min, 17.1P0.1, 18.4P1) fps -51%
HP EliteBook 8 Flip G1i 13
Intel Core Ultra 7 265U, Intel Graphics 4-Core iGPU (Meteor / Arrow Lake)
12.7 fps -70%
Cyberpunk 2077
1920x1080 Low Preset (FSR off)
Asus ExpertBook Ultra B9406CAA
Intel Core Ultra X7 358H, Intel Arc B390 12 Xe3 Panther Lake iGPU
77.7 (67min, 64.3P1) fps +19%
Durchschnittliche Intel Arc B390 12 Xe3 Panther Lake iGPU
  (65.3 - 85.6, n=12)
75.3 fps +15%
Dell XPS 14 Core Ultra X7 358H
Intel Core Ultra X7 358H, Intel Arc B390 12 Xe3 Panther Lake iGPU
68.6 (57.3min, 52.9P1) fps +5%
Framework Laptop 13 Pro
Intel Core Ultra X7 358H, Intel Arc B390 12 Xe3 Panther Lake iGPU
65.3 (55min, 52.4P1) fps
Framework Laptop 13.5 Ryzen AI 9 HX 370
AMD Ryzen AI 9 HX 370, AMD Radeon 890M
44.5 (37.5min, 34.6P1) fps -32%
Dell Pro 13 Premium PA13250
Intel Core Ultra 7 268V, Intel Arc Graphics 140V
43.5 (35.2min) fps -33%
MSI Prestige 13 AI+ A3MG
Intel Core Ultra 9 386H, Intel Graphics 4 Xe3 Panther Lake iGPU
37.3 (32min) fps -43%
Microsoft Surface Laptop 8 13.8
Qualcomm Snapdragon X2 Plus X2P-64-100, Qualcomm SD X2 Adreno X2-45
34.9 (29.1min) fps -47%
Framework Laptop 13.5 Core Ultra 7 155H
Intel Core Ultra 7 155H, Intel Arc 8-Core iGPU
34.3 (29.3min) fps -47%
HP OmniBook 7 Aero 13-bg1077nr
AMD Ryzen AI 7 350, AMD Radeon 860M
32.5 (27min, 25.2P1) fps -50%
HP EliteBook 8 Flip G1i 13
Intel Core Ultra 7 265U, Intel Graphics 4-Core iGPU (Meteor / Arrow Lake)
21.1 (17.8min, 16.2P1) fps -68%
1920x1080 Medium Preset (FSR off)
Asus ExpertBook Ultra B9406CAA
Intel Core Ultra X7 358H, Intel Arc B390 12 Xe3 Panther Lake iGPU
63.1 (54.6min, 52.4P1) fps +22%
Durchschnittliche Intel Arc B390 12 Xe3 Panther Lake iGPU
  (49.3 - 68.6, n=13)
60.5 fps +17%
Dell XPS 14 Core Ultra X7 358H
Intel Core Ultra X7 358H, Intel Arc B390 12 Xe3 Panther Lake iGPU
56.2 (48.2min, 44.5P1) fps +8%
Framework Laptop 13 Pro
Intel Core Ultra X7 358H, Intel Arc B390 12 Xe3 Panther Lake iGPU
51.8 (45min, 43.5P1) fps
Dell Pro 13 Premium PA13250
Intel Core Ultra 7 268V, Intel Arc Graphics 140V
35.4 (29.4min) fps -32%
Framework Laptop 13.5 Ryzen AI 9 HX 370
AMD Ryzen AI 9 HX 370, AMD Radeon 890M
34.7 (29.9min, 27.8P1) fps -33%
MSI Prestige 13 AI+ A3MG
Intel Core Ultra 9 386H, Intel Graphics 4 Xe3 Panther Lake iGPU
28.8 (25min) fps -44%
Framework Laptop 13.5 Core Ultra 7 155H
Intel Core Ultra 7 155H, Intel Arc 8-Core iGPU
27.8 (24.1min) fps -46%
Microsoft Surface Laptop 8 13.8
Qualcomm Snapdragon X2 Plus X2P-64-100, Qualcomm SD X2 Adreno X2-45
27.5 (23.4min) fps -47%
HP OmniBook 7 Aero 13-bg1077nr
AMD Ryzen AI 7 350, AMD Radeon 860M
24.9 (21.2min, 18.5P1) fps -52%
HP EliteBook 8 Flip G1i 13
Intel Core Ultra 7 265U, Intel Graphics 4-Core iGPU (Meteor / Arrow Lake)
17.1 (14.8min, 14.3P1) fps -67%
1920x1080 High Preset (FSR off)
Asus ExpertBook Ultra B9406CAA
Intel Core Ultra X7 358H, Intel Arc B390 12 Xe3 Panther Lake iGPU
53.8 (46.6min, 44.7P1) fps +21%
Durchschnittliche Intel Arc B390 12 Xe3 Panther Lake iGPU
  (43.2 - 58.8, n=12)
51.4 fps +15%
Dell XPS 14 Core Ultra X7 358H
Intel Core Ultra X7 358H, Intel Arc B390 12 Xe3 Panther Lake iGPU
46.9 (39.2min, 36.5P1) fps +5%
Framework Laptop 13 Pro
Intel Core Ultra X7 358H, Intel Arc B390 12 Xe3 Panther Lake iGPU
44.6 (38min, 36.8P1) fps
Dell Pro 13 Premium PA13250
Intel Core Ultra 7 268V, Intel Arc Graphics 140V
28.6 (22.4min) fps -36%
Framework Laptop 13.5 Ryzen AI 9 HX 370
AMD Ryzen AI 9 HX 370, AMD Radeon 890M
27.4 (23.6min, 20.6P1) fps -39%
MSI Prestige 13 AI+ A3MG
Intel Core Ultra 9 386H, Intel Graphics 4 Xe3 Panther Lake iGPU
24.4 (21min) fps -45%
Framework Laptop 13.5 Core Ultra 7 155H
Intel Core Ultra 7 155H, Intel Arc 8-Core iGPU
23.4 (20.1min) fps -48%
Microsoft Surface Laptop 8 13.8
Qualcomm Snapdragon X2 Plus X2P-64-100, Qualcomm SD X2 Adreno X2-45
22.3 (18.5min) fps -50%
HP OmniBook 7 Aero 13-bg1077nr
AMD Ryzen AI 7 350, AMD Radeon 860M
19.8 (16.2min, 14.7P1) fps -56%
HP EliteBook 8 Flip G1i 13
Intel Core Ultra 7 265U, Intel Graphics 4-Core iGPU (Meteor / Arrow Lake)
14.6 (12.5min, 12.2P1) fps -67%
1920x1080 Ultra Preset (FSR off)
Asus ExpertBook Ultra B9406CAA
Intel Core Ultra X7 358H, Intel Arc B390 12 Xe3 Panther Lake iGPU
47.2 (39.1min, 36.3P1) fps +23%
Durchschnittliche Intel Arc B390 12 Xe3 Panther Lake iGPU
  (27.2 - 50.6, n=18)
42.4 fps +11%
Dell XPS 14 Core Ultra X7 358H
Intel Core Ultra X7 358H, Intel Arc B390 12 Xe3 Panther Lake iGPU
40.9 (33.3min, 30.6P1) fps +7%
Framework Laptop 13 Pro
Intel Core Ultra X7 358H, Intel Arc B390 12 Xe3 Panther Lake iGPU
38.3 (31.7min, 30P1) fps
Dell Pro 13 Premium PA13250
Intel Core Ultra 7 268V, Intel Arc Graphics 140V
28.1 (22.8min) fps -27%
Framework Laptop 13.5 Ryzen AI 9 HX 370
AMD Ryzen AI 9 HX 370, AMD Radeon 890M
24.4 (20.6min, 17.8P1) fps -36%
Framework Laptop 13.5 Core Ultra 7 155H
Intel Core Ultra 7 155H, Intel Arc 8-Core iGPU
21.1 (17.4min) fps -45%
MSI Prestige 13 AI+ A3MG
Intel Core Ultra 9 386H, Intel Graphics 4 Xe3 Panther Lake iGPU
19.1 (16min) fps -50%
Microsoft Surface Laptop 8 13.8
Qualcomm Snapdragon X2 Plus X2P-64-100, Qualcomm SD X2 Adreno X2-45
19.1 (15.6min) fps -50%
HP OmniBook 7 Aero 13-bg1077nr
AMD Ryzen AI 7 350, AMD Radeon 860M
16.5 (13.6min, 12.7P1) fps -57%
HP EliteBook 8 Flip G1i 13
Intel Core Ultra 7 265U, Intel Graphics 4-Core iGPU (Meteor / Arrow Lake)
12 (10.3min, 9.93P1) fps -69%
F1 24
1920x1080 High Preset AA:T AF:16x
Asus ExpertBook Ultra B9406CAA
Intel Core Ultra X7 358H, Intel Arc B390 12 Xe3 Panther Lake iGPU
104.3 (91min, 76P1) fps +26%
Dell XPS 14 Core Ultra X7 358H
Intel Core Ultra X7 358H, Intel Arc B390 12 Xe3 Panther Lake iGPU
100.7 (92min, 71P1) fps +21%
Durchschnittliche Intel Arc B390 12 Xe3 Panther Lake iGPU
  (82.9 - 109.6, n=11)
100.5 fps +21%
Framework Laptop 13 Pro
Intel Core Ultra X7 358H, Intel Arc B390 12 Xe3 Panther Lake iGPU
82.9 (71min, 61P1) fps
HP OmniBook 7 Aero 13-bg1077nr
AMD Ryzen AI 7 350, AMD Radeon 860M
37.8 (27min, 22P1) fps -54%
HP EliteBook 8 Flip G1i 13
Intel Core Ultra 7 265U, Intel Graphics 4-Core iGPU (Meteor / Arrow Lake)
23.8 (16P1) fps -71%
1920x1080 Ultra High Preset AA:T AF:16x
Asus ExpertBook Ultra B9406CAA
Intel Core Ultra X7 358H, Intel Arc B390 12 Xe3 Panther Lake iGPU
38 (31min, 30P1) fps +25%
Dell XPS 14 Core Ultra X7 358H
Intel Core Ultra X7 358H, Intel Arc B390 12 Xe3 Panther Lake iGPU
36.2 (30min, 28P1) fps +19%
Durchschnittliche Intel Arc B390 12 Xe3 Panther Lake iGPU
  (30.5 - 38.6, n=11)
36 fps +18%
Framework Laptop 13 Pro
Intel Core Ultra X7 358H, Intel Arc B390 12 Xe3 Panther Lake iGPU
30.5 (24min, 24P1) fps
HP OmniBook 7 Aero 13-bg1077nr
AMD Ryzen AI 7 350, AMD Radeon 860M
8 (3min, 4P1) fps -74%
HP EliteBook 8 Flip G1i 13
Intel Core Ultra 7 265U, Intel Graphics 4-Core iGPU (Meteor / Arrow Lake)
7.21 (1min, 4P1) fps -76%

Cyberpunk 2077 – Ultra-fps-Diagramm

05101520253035Tooltip
Framework Laptop 13 Pro Ultra X7 358H, Arc B390 Panther Lake iGPU: Ø35.1 (29.4-37.1) fps
Framework Laptop 13.5 Ryzen AI 9 HX 370 Ryzen AI 9 HX 370, Radeon 890M: Ø22.8 (21.9-23.7) fps
min.mittelhochmax.
GTA V (2015) 134.2 121.9 82.3 35.4
Dota 2 Reborn (2015) 102.8 67.8 83.9 79.7
Final Fantasy XV Benchmark (2018) 101.3 62.3 43.1
X-Plane 11.11 (2018) 56.1 44.4 37.2
Strange Brigade (2018) 254 104.4 91.8 80.4
Baldur's Gate 3 (2023) 55.9 47.6 42.5 41.7
Cyberpunk 2077 (2023) 65.3 51.8 44.6 38.3
F1 24 (2024) 118.4 107.3 82.9 30.5

Emissionen

Systemgeräusche

Der Lüfter läuft deutlich leiser als beim ursprünglichen Laptop 13,5, selbst im Leistungsmodus.
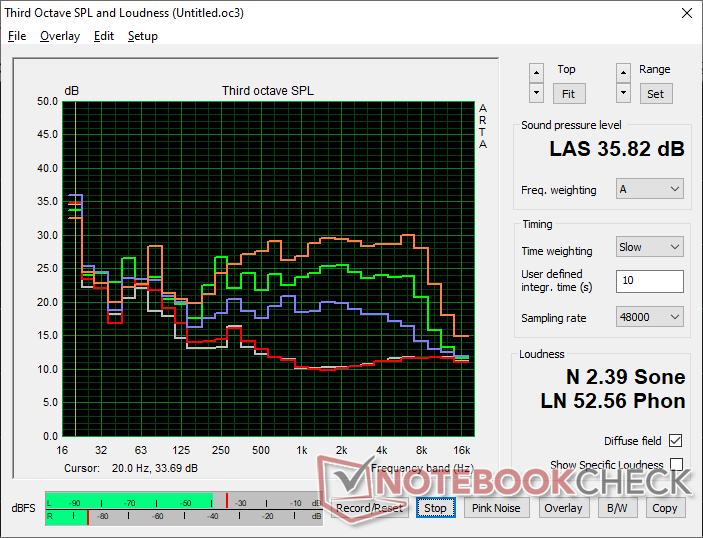
Geräuschprofil des Lüfters (Weiß: Hintergrund, Rot: System im Leerlauf, Blau: 3DMark 06, Orange: Cyberpunk 2077, Grün: Prime95 Stress)

Lautstärkediagramm

Idle
23.4 / 23.4 / 23.4 dB(A)
Last
30.5 / 35.8 dB(A)
  red to green bar
 
 
30 dB
leise
40 dB(A)
deutlich hörbar
50 dB(A)
störend
 
min: dark, med: mid, max: light   Earthworks M23R, Arta (aus 15 cm gemessen)   Umgebungsgeräusche: 23.4 dB(A)
dB(A) 0102030405060708090Deep BassMiddle BassHigh BassLower RangeMidsHigher MidsLower HighsMid HighsUpper HighsSuper Highs2032.53634.734.634.22524.425.323.522.223.83122.924.522.122.224.3402018.816.818.2235022.223.623.620.526.36322.723.522.622.123.38028.423.421.718.723.310021.320.819.117.920.712520.420.116.914.619.616019.916.31413.217.520021.217.614.213.222.625024.318.314.513.326.931525.720.516.116.522.240027.118.714.213.224.350027.617.51312.322.263029.119.411.811.924.180026.32111.311.622.5100026.918.610.210.223.8125028.818.61010.124.3160029.519.99.910.225.3200029.419.910.110.325.5250029.11910.510.524.5315028.318.110.710.723.6400028.718.211.211.224500028.717.211.211.623.863003016.411.611.823.8800028.114.211.711.720.71000022.81311.711.915.81250018.112.511.711.713.31600014.911.911.111.211.6SPL40.430.523.423.435.8N3.61.30.50.52.4median 27.1median 18.3median 11.7median 11.7median 23.6Delta3.81.71.81.22.3hearing rangehide median Fan NoiseFramework Laptop 13 Pro
Framework Laptop 13 Pro
Ultra X7 358H, Arc B390 Panther Lake iGPU
Framework Laptop 13.5 Ryzen AI 9 HX 370
Ryzen AI 9 HX 370, Radeon 890M
Microsoft Surface Laptop 8 13.8
SD X2 Plus X2P-64-100, Adreno X2-45
MSI Prestige 13 AI+ A3MG
Ultra 9 386H, Intel Graphics 4 Xe3 PTL
Asus ExpertBook Ultra B9406CAA
Ultra X7 358H, Arc B390 Panther Lake iGPU
Dell XPS 14 Core Ultra X7 358H
Ultra X7 358H, Arc B390 Panther Lake iGPU
Geräuschentwicklung
-18%
-3%
-10%
-3%
-6%
aus / Umgebung * (dB)
23.4
24.2
-3%
25.1
-7%
25
-7%
22.9
2%
22.9
2%
Idle min * (dB)
23.4
24.4
-4%
25.1
-7%
26
-11%
23.4
-0%
23.3
-0%
Idle avg * (dB)
23.4
24.4
-4%
25.1
-7%
27
-15%
23.4
-0%
23.3
-0%
Idle max * (dB)
23.4
28
-20%
25.1
-7%
28
-20%
23.4
-0%
23.3
-0%
Last avg * (dB)
30.5
46.2
-51%
25.1
18%
31
-2%
28.6
6%
34
-11%
Cyberpunk 2077 ultra * (dB)
40.4
45.8
-13%
37.4
7%
41
-1%
42.8
-6%
43.5
-8%
Last max * (dB)
35.8
45.9
-28%
42.4
-18%
42
-17%
45.2
-26%
45.7
-28%

* ... kleinere Werte sind besser

Temperatur
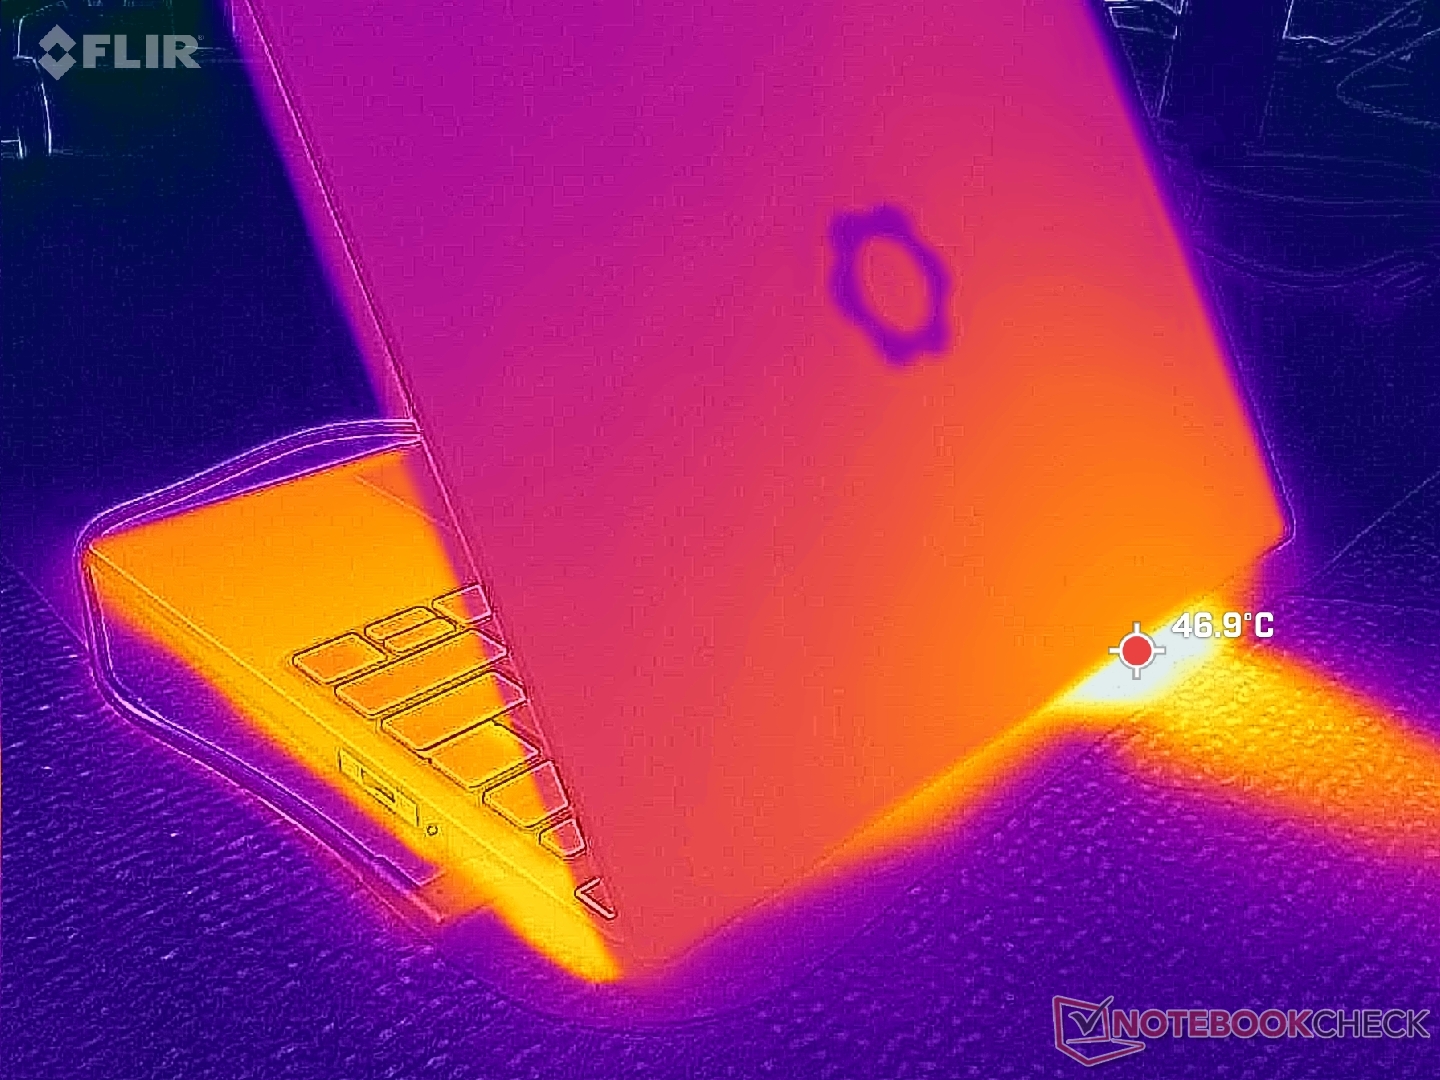
Auslass am Heck
Auslass am Heck
Das Netzteil erreicht bei hoher Auslastung Temperaturen von über 40 °C.
Max. Last
 38.2 °C43.2 °C39.2 °C 
 35 °C42.6 °C38.6 °C 
 30.2 °C30.4 °C32.2 °C 
Maximal: 43.2 °C
Durchschnitt: 36.6 °C
42.6 °C44.2 °C38.2 °C
38.4 °C41.6 °C35.2 °C
33.2 °C32.4 °C31.8 °C
Maximal: 44.2 °C
Durchschnitt: 37.5 °C
Netzteil (max.)  41.2 °C | Raumtemperatur 20 °C | Fluke 62 Mini IR Thermometer
(±) Die Durchschnittstemperatur auf der Oberseite unter extremer Last ist 36.6 °C. Im Vergleich erhitzte sich der Durchschnitt der Geräteklasse Subnotebook auf 30.8 °C.
(±) Die maximale Temperatur auf der Oberseite ist 43.2 °C. Im Vergleich liegt der Klassendurchschnitt bei 35.9 °C (von 21.4 bis 59 °C für die Klasse Subnotebook).
(±) Auf der Unterseite messen wir eine maximalen Wert von 44.2 °C (im Vergleich zum Durchschnitt von 39.2 °C).
(+) Ohne Last messen wir eine durchschnittliche Temperatur von 28.4 °C auf der Oberseite. Der Klassendurchschnitt erreicht 30.8 °C.
(+) Die Handballen und der Touchpad-Bereich erreichen maximal 32.2 °C und damit die typische Hauttemperatur und fühlen sich daher nicht heiß an.
(-) Die durchschnittliche Handballen-Temperatur anderer getesteter Geräte war 28.2 °C (-4 °C).
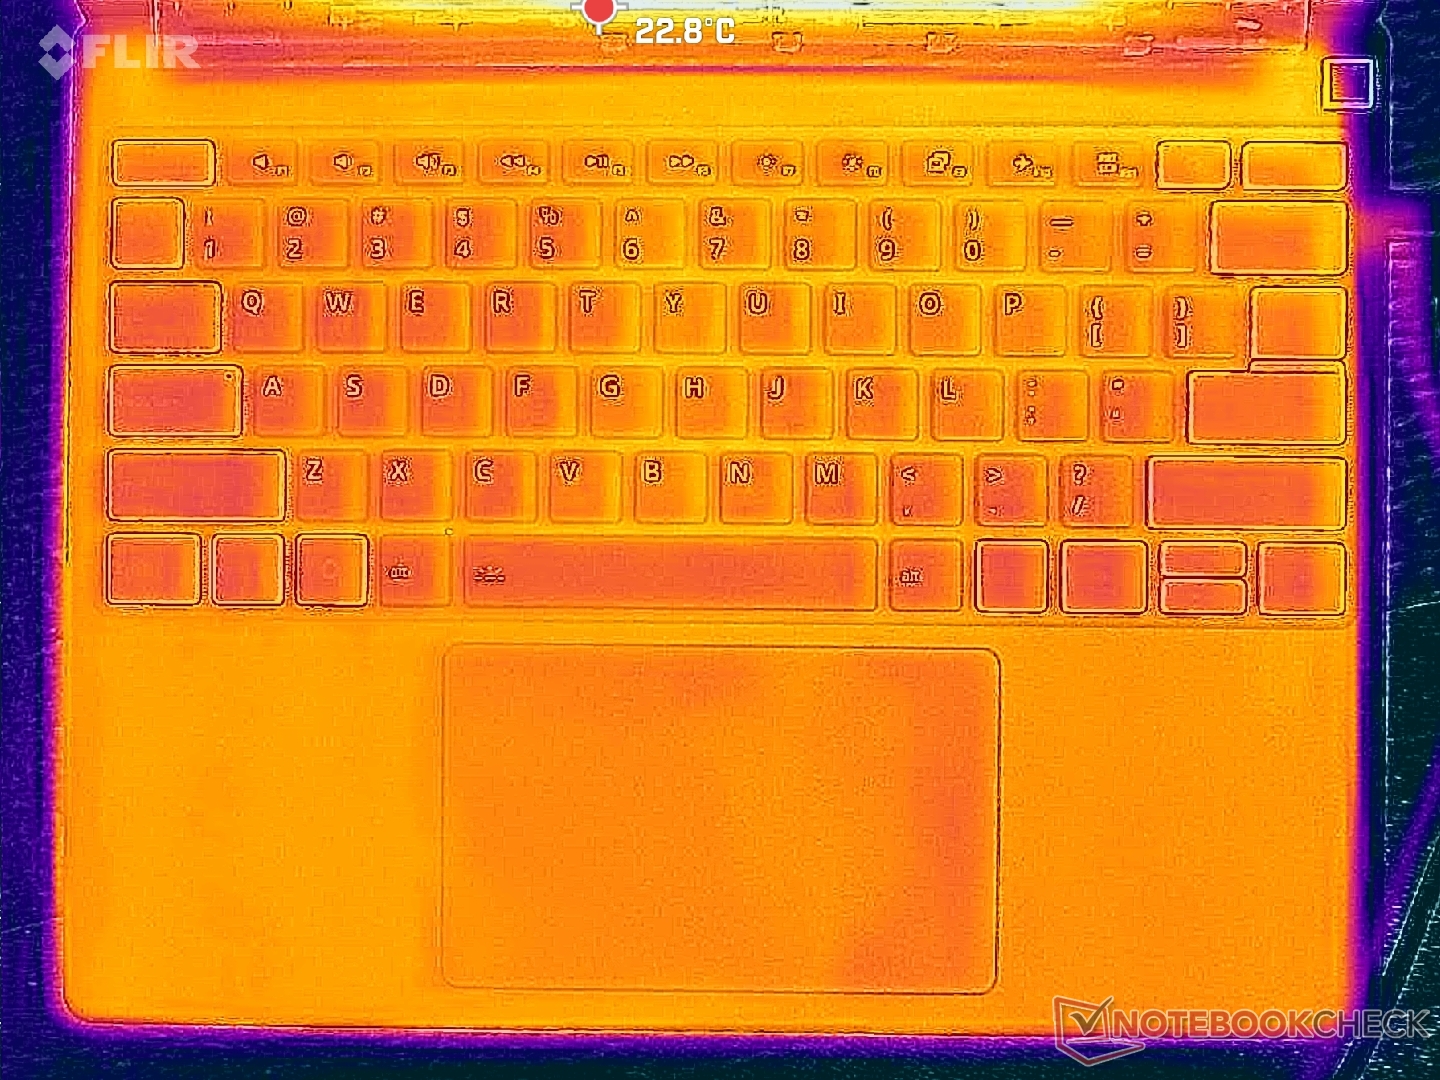
System im Leerlauf (C-Cover)
System im Leerlauf (D-Cover)
Prime95+FurMark Stresstest (C-Cover)
Prime95+FurMark Stresstest (D-Cover)
Framework Laptop 13 Pro
Ultra X7 358H, Arc B390 Panther Lake iGPU
Framework Laptop 13.5 Ryzen AI 9 HX 370
Ryzen AI 9 HX 370, Radeon 890M
Microsoft Surface Laptop 8 13.8
SD X2 Plus X2P-64-100, Adreno X2-45
MSI Prestige 13 AI+ A3MG
Ultra 9 386H, Intel Graphics 4 Xe3 PTL
Asus ExpertBook Ultra B9406CAA
Ultra X7 358H, Arc B390 Panther Lake iGPU
Dell XPS 14 Core Ultra X7 358H
Ultra X7 358H, Arc B390 Panther Lake iGPU
Hitze
-5%
6%
5%
13%
16%
Last oben max * (°C)
43.2
42.2
2%
44.4
-3%
42
3%
38.6
11%
34
21%
Last unten max * (°C)
44.2
46.8
-6%
42.5
4%
41
7%
38.4
13%
35.8
19%
Idle oben max * (°C)
29.2
31
-6%
25.9
11%
24.6
16%
25.6
12%
Idle unten max * (°C)
29.8
32.2
-8%
26
13%
26
13%
26.4
11%

* ... kleinere Werte sind besser

Stresstest

Die CPU dreht für etwa 20 Sekunden auf 2,8 GHz und 55 W hoch, bevor sie sich bei 2 GHz, 32 W und 92 °C stabilisiert.
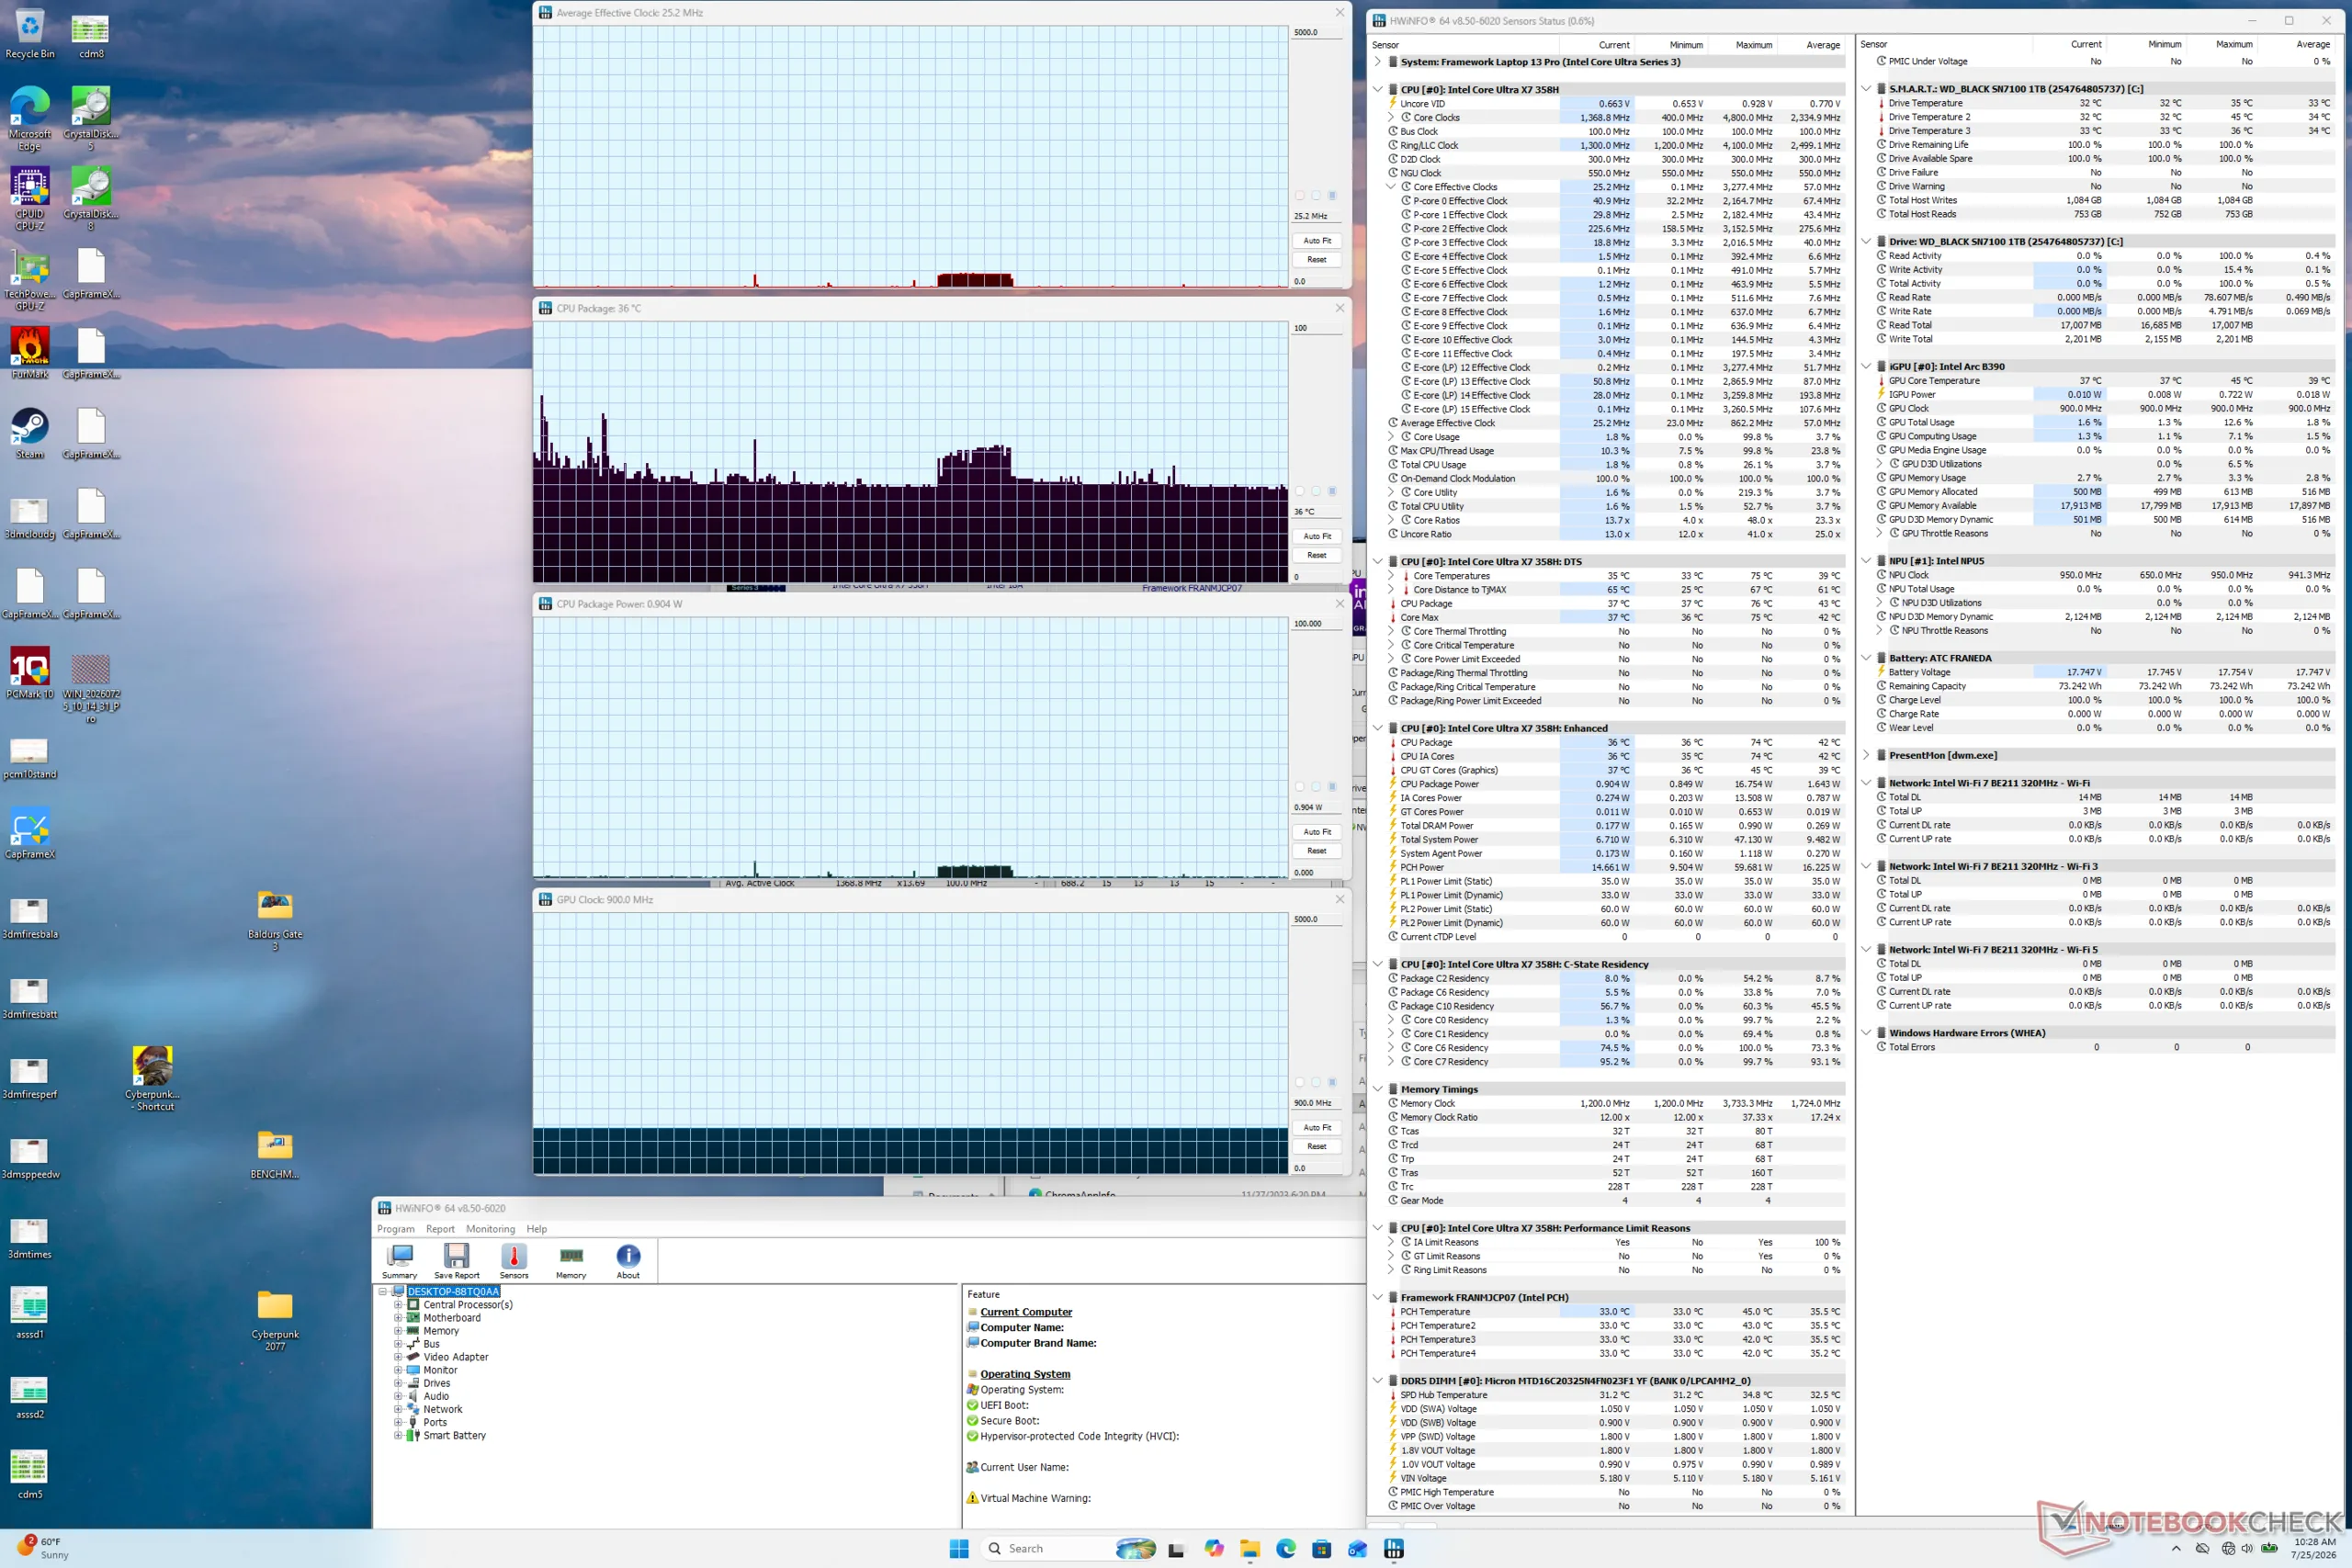
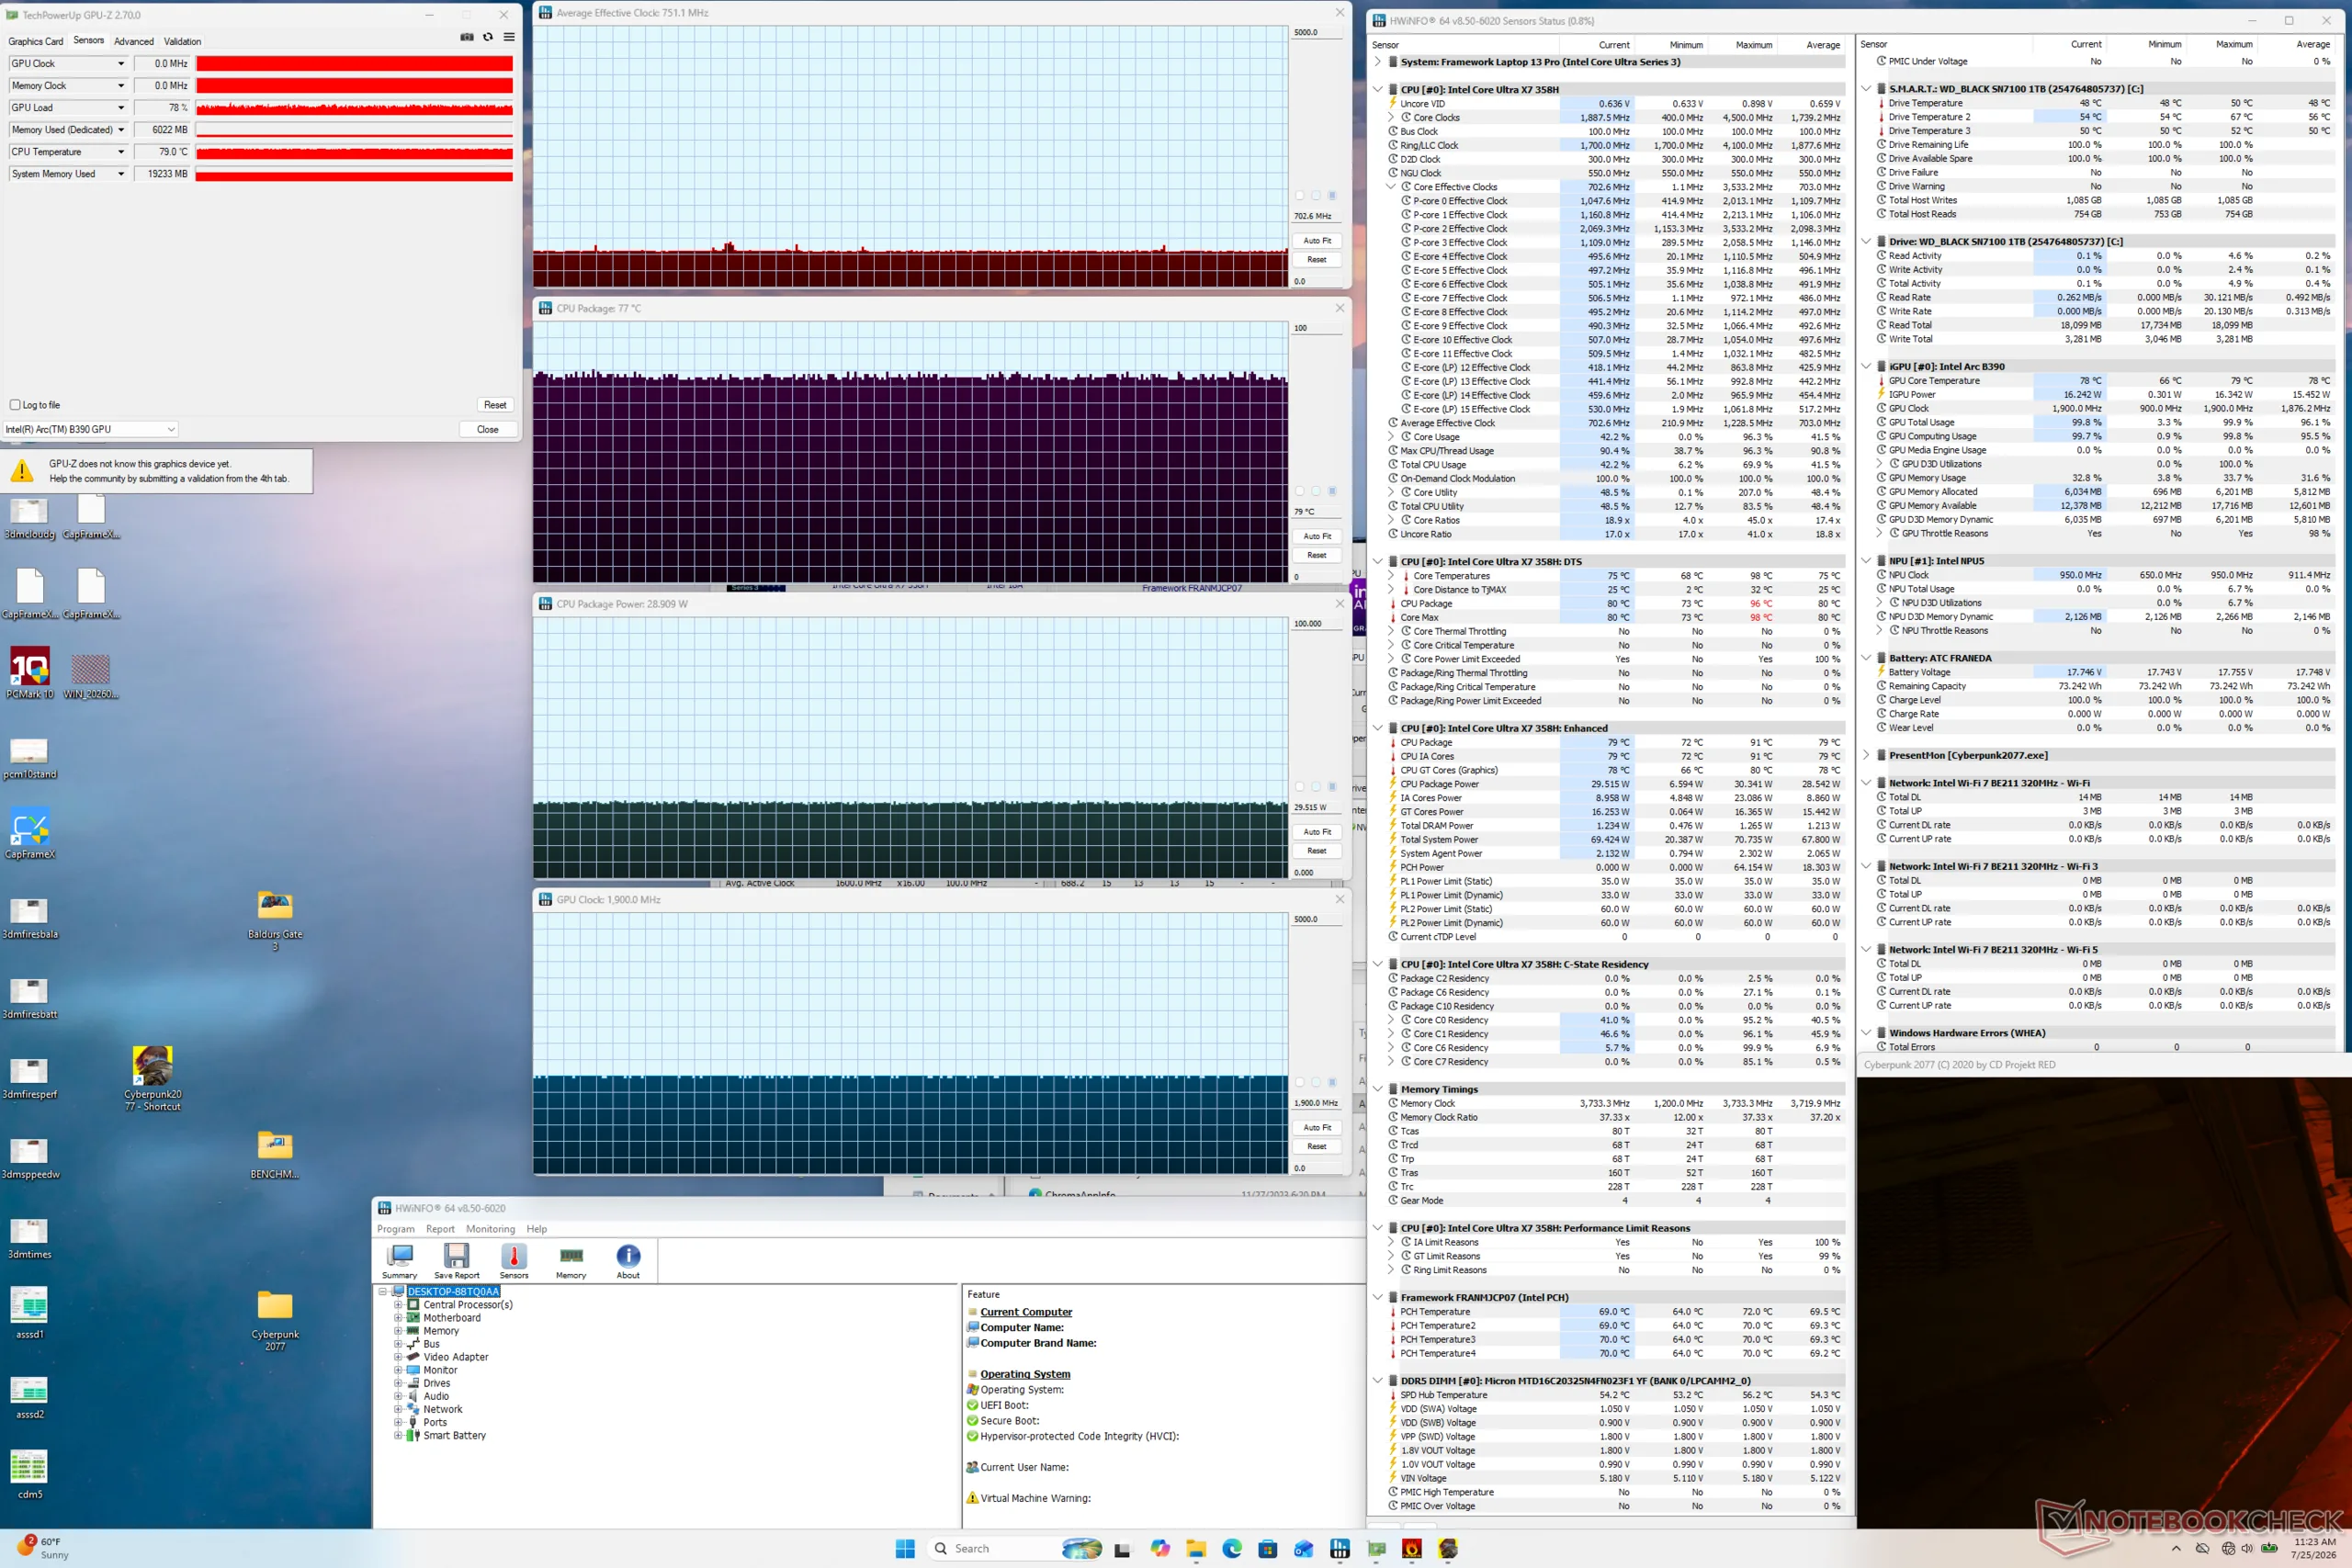
System im Leerlauf
System im Leerlauf
Cyberpunk 2077 – Stress
Prime95 - Stress
Prime95 - Stress
Prime95+FurMark - Stress
durchschnittliche CPU-Taktfrequenz (GHz) GPU-Taktfrequenz (MHz) durchschnittliche CPU-Temperatur (°C)
System im Leerlauf -- 900 36
Prime95 Stress 2,0 900 92
Prime95 + FurMark Stress 1,6 1.300 88
Cyberpunk 2077 Stress 0,7 1.900 79

Lautsprecher

Bei Pink Noise liegt die maximale Lautstärke unter den Erwartungen, und selbst für einen Laptop ist der Lautstärkebereich nur durchschnittlich.
dB(A) 0102030405060708090Deep BassMiddle BassHigh BassLower RangeMidsHigher MidsLower HighsMid HighsUpper HighsSuper Highs2034.736.52523.522.73122.1244016.821.35023.627.36322.631.58021.737.410019.141.212516.944.21601451.220014.253.325014.560.131516.164.840014.2665001363.663011.866.780011.368.6100010.268.912501067.916009.966.1200010.166.2250010.562.9315010.763.5400011.262.3500011.260.2630011.658.3800011.7551000011.756.21250011.753.71600011.151.7SPL23.476.9N0.540.3median 11.7median 62.3Delta1.86.226.325.821.422.12624.925.127.622.532.523.448.72655.818.860.922.167.2267019.372.317.674.217.774.319.575.31571.711.871.311.27410.574.21072.710.17210.67210.97511.374.811.671.71269.71269.612.371.112.669.61270.111.269.824.784.70.666.6median 12median 71.73.42.2hearing rangehide median Pink NoiseFramework Laptop 13 ProApple MacBook Pro 16 2021 M1 Pro
Frequenzdiagramm (für Vergleiche die Checkboxen oben an-/abwählen)
Framework Laptop 13 Pro Audio Analyse

(±) | Mittelmäßig laut spielende Lautsprecher (76.9 dB)
Bass 100 - 315 Hz
(±) | abgesenkter Bass - 10.7% geringer als der Median
(±) | durchschnittlich lineare Bass-Wiedergabe (9% Delta zum Vorgänger)
Mitteltöne 400 - 2000 Hz
(+) | ausgeglichene Mitten, vom Median nur 4.4% abweichend
(+) | lineare Mitten (2.9% Delta zum Vorgänger)
Hochtöne 2 - 16 kHz
(+) | ausgeglichene Hochtöne, vom Median nur 3.1% abweichend
(+) | sehr lineare Hochtöne (3.8% Delta zum Vorgänger)
Gesamt im hörbaren Bereich 100 - 16.000 Hz
(+) | hörbarer Bereich ist sehr linear (14% Abstand zum Median
Im Vergleich zu allen Geräten derselben Klasse
» 26% aller getesteten Geräte dieser Klasse waren besser, 6% vergleichbar, 68% schlechter
» Das beste Gerät hat einen Delta-Wert von 5%, durchschnittlich ist 18%, das schlechteste Gerät hat 53%
Im Vergleich zu allen Geräten im Test
» 16% aller getesteten Geräte waren besser, 4% vergleichbar, 80% schlechter
» Das beste Gerät hat einen Delta-Wert von 4%, durchschnittlich ist 23%, das schlechteste Gerät hat 134%

Apple MacBook Pro 16 2021 M1 Pro Audio Analyse

(+) | Die Lautsprecher können relativ laut spielen (84.7 dB)
Bass 100 - 315 Hz
(+) | guter Bass - nur 3.8% Abweichung vom Median
(+) | lineare Bass-Wiedergabe (5.2% Delta zum Vorgänger)
Mitteltöne 400 - 2000 Hz
(+) | ausgeglichene Mitten, vom Median nur 1.3% abweichend
(+) | lineare Mitten (2.1% Delta zum Vorgänger)
Hochtöne 2 - 16 kHz
(+) | ausgeglichene Hochtöne, vom Median nur 1.9% abweichend
(+) | sehr lineare Hochtöne (2.7% Delta zum Vorgänger)
Gesamt im hörbaren Bereich 100 - 16.000 Hz
(+) | hörbarer Bereich ist sehr linear (4.6% Abstand zum Median
Im Vergleich zu allen Geräten derselben Klasse
» 0% aller getesteten Geräte dieser Klasse waren besser, 0% vergleichbar, 100% schlechter
» Das beste Gerät hat einen Delta-Wert von 5%, durchschnittlich ist 17%, das schlechteste Gerät hat 45%
Im Vergleich zu allen Geräten im Test
» 0% aller getesteten Geräte waren besser, 0% vergleichbar, 100% schlechter
» Das beste Gerät hat einen Delta-Wert von 4%, durchschnittlich ist 23%, das schlechteste Gerät hat 134%

Energieverwaltung

Stromverbrauch

3DMark 06 – Verbrauch
Cyberpunk 2077 – 1.080p Ultra – Verbrauch
Der Stromverbrauch stieg beim Starten des Prime95 Stresstests sprunghaft auf 84 W an, bevor er 20 Sekunden später steil auf nur noch 51 W abfiel, was die begrenzte Nachhaltigkeit des Turbo-Boost-Modus verdeutlicht.
Der Prime95+FurMark Stresstest wurde nach 10 Sekunden gestartet
Stromverbrauch
Aus / Standbydarklight 0.33 / 0.72 Watt
Idledarkmidlight 2.3 / 8.4 / 8.5 Watt
Last midlight 32.1 / 84.2 Watt
 color bar
Legende: min: dark, med: mid, max: light        Metrahit Energy
Framework Laptop 13 Pro
Ultra X7 358H, Arc B390 Panther Lake iGPU, WD PC SN7100S SDFPMSL-1T00-1101, IPS, 2880x1920, 13.5"
Framework Laptop 13.5 Ryzen AI 9 HX 370
Ryzen AI 9 HX 370, Radeon 890M, , IPS, 2880x1920, 13.5"
Microsoft Surface Laptop 8 13.8
SD X2 Plus X2P-64-100, Adreno X2-45, SK hynix PVC10 HFS512GEM4X182N, IPS, 2304x1536, 13.8"
MSI Prestige 13 AI+ A3MG
Ultra 9 386H, Intel Graphics 4 Xe3 PTL, Micron 2500 1TB MTFDKBA1T0QGN, OLED, 2880x1800, 13.3"
Asus ExpertBook Ultra B9406CAA
Ultra X7 358H, Arc B390 Panther Lake iGPU, Samsung PM9E1 MZVLC2T0HBLD, OLED, 2880x1800, 14"
Dell XPS 14 Core Ultra X7 358H
Ultra X7 358H, Arc B390 Panther Lake iGPU, Samsung PM9C1b MZVL81T0HFLB-00BH1, OLED, 2880x1800, 14"
Stromverbrauch
-50%
21%
8%
-3%
-6%
Idle min * (Watt)
2.3
7.6
-230%
1.7
26%
3.5
-52%
3.5
-52%
3.1
-35%
Idle avg * (Watt)
8.4
11.3
-35%
6.8
19%
4
52%
4
52%
3.6
57%
Idle max * (Watt)
8.5
11.5
-35%
7.5
12%
6.4
25%
5.3
38%
10
-18%
Last avg * (Watt)
32.1
54.7
-70%
28
13%
44
-37%
43.7
-36%
39.2
-22%
Cyberpunk 2077 ultra external monitor * (Watt)
47.4
51.3
-8%
38.1
20%
61.4
-30%
51.2
-8%
Cyberpunk 2077 ultra * (Watt)
52.9
54.6
-3%
37.9
28%
41
22%
61.3
-16%
51.4
3%
Last max * (Watt)
84.2
60.9
28%
61.3
27%
54
36%
63.4
25%
101.4
-20%

* ... kleinere Werte sind besser

Stromverbrauch Cyberpunk/Stresstest

05101520253035404550556065707580Tooltip
Framework Laptop 13 Pro Ultra X7 358H, Arc B390 Panther Lake iGPU; 1280x720 Prime95 28.10 and Furmark 1.25: Ø61.5 (56.2-82.7) Watt
Framework Laptop 13.5 Ryzen AI 9 HX 370 Ryzen AI 9 HX 370, Radeon 890M; 1280x720 Prime95 28.10 and Furmark 1.25: Ø59 (56.8-60.9) Watt
Framework Laptop 13 Pro Ultra X7 358H, Arc B390 Panther Lake iGPU; Idle 150cd/m2: Ø3.67 (3.35-5.45) Watt
Framework Laptop 13.5 Ryzen AI 9 HX 370 Ryzen AI 9 HX 370, Radeon 890M; Idle 150cd/m2: Ø8.46 (7.43-9.99) Watt
Framework Laptop 13 Pro Ultra X7 358H, Arc B390 Panther Lake iGPU; Cyberpunk 2077 FHD ultra no FSR 150cd: Ø52.9 (51.6-54.3) Watt
Framework Laptop 13.5 Ryzen AI 9 HX 370 Ryzen AI 9 HX 370, Radeon 890M; Cyberpunk 2077 FHD ultra no FSR 150cd: Ø54.6 (52.3-57.5) Watt

Stromverbrauch des externen Monitors

05101520253035404550556065707580Tooltip
Framework Laptop 13 Pro Ultra X7 358H, Arc B390 Panther Lake iGPU; Prime95 V2810 Stress (external Monitor): Ø55.4 (50.1-84.1) Watt
Framework Laptop 13.5 Ryzen AI 9 HX 370 Ryzen AI 9 HX 370, Radeon 890M; Prime95 V2810 Stress (external Monitor): Ø56.9 (54.5-61) Watt
Framework Laptop 13.5 Ryzen AI 9 HX 370 Ryzen AI 9 HX 370, Radeon 890M; Cinebench R15 Multi (external Monitor): Ø58.9 (56.5-60.9) Watt
Framework Laptop 13 Pro Ultra X7 358H, Arc B390 Panther Lake iGPU; Cinebench R23 Multi (external Monitor): Ø57.4 (47.9-64.4) Watt
Framework Laptop 13 Pro Ultra X7 358H, Arc B390 Panther Lake iGPU; 1280x720 FurMark 1.19 GPU Stress Test (external Monitor): Ø43.6 (41.3-45) Watt
Framework Laptop 13.5 Ryzen AI 9 HX 370 Ryzen AI 9 HX 370, Radeon 890M; 1280x720 FurMark 1.19 GPU Stress Test (external Monitor): Ø56.1 (54.4-59.3) Watt
Framework Laptop 13 Pro Ultra X7 358H, Arc B390 Panther Lake iGPU; Idle 1min (external Monitor): Ø2.58 (2.24-3.32) Watt
Framework Laptop 13.5 Ryzen AI 9 HX 370 Ryzen AI 9 HX 370, Radeon 890M; Idle 1min (external Monitor): Ø7.59 (7.04-9.03) Watt
Framework Laptop 13 Pro Ultra X7 358H, Arc B390 Panther Lake iGPU; Cyberpunk 2077 FHD ultra no FSR (external Monitor): Ø47.4 (46-50.3) Watt
Framework Laptop 13.5 Ryzen AI 9 HX 370 Ryzen AI 9 HX 370, Radeon 890M; Cyberpunk 2077 FHD ultra no FSR (external Monitor): Ø51.3 (50.5-52.8) Watt

Akkulaufzeit

Akkulaufzeit
WiFi Websurfing
19h 18min
Framework Laptop 13 Pro
Ultra X7 358H, Arc B390 Panther Lake iGPU, 74.5 Wh
Framework Laptop 13.5 Ryzen AI 9 HX 370
Ryzen AI 9 HX 370, Radeon 890M, 61 Wh
Microsoft Surface Laptop 8 13.8
SD X2 Plus X2P-64-100, Adreno X2-45, 54 Wh
MSI Prestige 13 AI+ A3MG
Ultra 9 386H, Intel Graphics 4 Xe3 PTL, 53.8 Wh
Asus ExpertBook Ultra B9406CAA
Ultra X7 358H, Arc B390 Panther Lake iGPU, 70 Wh
Dell XPS 14 Core Ultra X7 358H
Ultra X7 358H, Arc B390 Panther Lake iGPU, 70 Wh
Akkulaufzeit
WLAN (h)
19.3
8
-59%
18.9
-2%
12
-38%
16.1
-17%
16.8
-13%

Notebookcheck Bewertung

Der Framework Laptop 13 Pro wirkt wesentlich robuster und professioneller als der Standard-Laptop 13,5, wobei die Reparaturfreundlichkeit und die Kompatibilität mit Komponenten erhalten bleiben.

Framework Laptop 13 Pro - 28.07.2026 v8
Allen Ngo

Gehäuse
85 / 98 → 87%
Tastatur
87%
Pointing Device
86%
Konnektivität
73 / 74 → 98%
Gewicht
70 / 20-77 → 87%
Akkulaufzeit
92%
Display
87%
Leistung Spiele
62 / 75 → 83%
Leistung Anwendungen
86 / 92 → 93%
AI Performance
90%
Temperatur
89%
Lautstärke
90%
Audio
76 / 91 → 84%
Kamera
34 / 75 → 45%
Durchschnitt
73%
88%
Subnotebook - gewichteter Durchschnitt
Weitere Informationen über unsere Bewertung finden Sie hier.
CO2 Emissions
No Data
Materials
50%
Packaging
100%
Power Use
85.4%
Repairability
100%
Software Updates
22.3%
Recycle Logo Total Sustainability Score: 59.6%

Mögliche Wettbewerber im Vergleich

Bild
Modell / Test
Preis ab
Gewicht
Dicke
Display
1.
87.9%
Framework Laptop 13 Pro
Intel Core Ultra X7 358H ⎘
Intel Arc B390 12 Xe3 Panther Lake iGPU ⎘
32 GB RAM, 1024 GB SSD
Amazon:
1. 1.249,00 €
GEEKOM GeekBook X14 Pro Lapt...
2. 1.684,90 €
Lenovo ThinkPad E14 Gen 7 Bu...
3. 1.929,00 €
ASUS ExpertBook B5 | 14" WQX...
Listenpreis: 3000 USD
1.4 kg15.85 mm13.50"
2880x1920
256 PPI
IPS
2.
83.8%
Framework Laptop 13.5 Ryzen AI 9 HX 370
AMD Ryzen AI 9 HX 370 ⎘
AMD Radeon 890M ⎘
32 GB RAM
Amazon:
Listenpreis: 2100 USD
1.3 kg15.85 mm13.50"
2880x1920
256 PPI
IPS
3.
88.4%
Microsoft Surface Laptop 8 13.8
Qualcomm Snapdragon X2 Plus X2P-64-100 ⎘
Qualcomm SD X2 Adreno X2-45 ⎘
16 GB RAM, 512 GB SSD
Amazon: 1.799,00 €
Bestpreis 1699€ Media Markt.at
2. 1699€ saturn
3. 1699€ Saturn.de
1.3 kg17.5 mm13.80"
2304x1536
201 PPI
IPS
4.
84%
MSI Prestige 13 AI+ A3MG
Intel Core Ultra 9 386H ⎘
Intel Graphics 4 Xe3 Panther Lake iGPU ⎘
32 GB RAM, 1024 GB SSD
Amazon: 1.620,99 €
Bestpreis 1580.99€ voelkner.de
2. 1580.99€ computeruniverse.net
3. 1580.99€ Cyberport.de
888 g15.9 mm13.30"
2880x1800
255 PPI
OLED
5.
87.6%
Asus ExpertBook Ultra B9406CAA
Intel Core Ultra X7 358H ⎘
Intel Arc B390 12 Xe3 Panther Lake iGPU ⎘
32 GB RAM, 2048 GB SSD
Amazon: 1.620,56 €
Bestpreis 3556.89€ playox.de
2. 3556.9€ office-partner.de
3. 3556.9€ computeruniverse.net
1.1 kg15.9 mm14.00"
2880x1800
243 PPI
OLED
6.
87.4%
Dell XPS 14 Core Ultra X7 358H
Intel Core Ultra X7 358H ⎘
Intel Arc B390 12 Xe3 Panther Lake iGPU ⎘
32 GB RAM, 1000 GB SSD
Amazon:
1. 3.239,29 €
ASUS ExpertBook Ultra 14 Zol...
2. 1.478,54 €
Dell Pro 14 Plus PB14250 - I...
3. 3.599,00 €
Dell XPS 16 9640 Laptop 16.3...
Geizhals Suche
1.4 kg14.62 mm14.00"
2880x1800
243 PPI
OLED

Transparenz

Die Auswahl der zu testenden Geräte erfolgt innerhalb der Redaktion. Das vorliegende Testmuster wurde dem Autor vom Hersteller oder einem Shop zu Testzwecken leihweise zur Verfügung gestellt. Eine Einflussnahme des Leihstellers auf den Testbericht gab es nicht, der Hersteller erhielt keine Version des Reviews vor der Veröffentlichung. Es bestand keine Verpflichtung zur Publikation. Als eigenständiges, unabhängiges Unternehmen unterliegt Notebookcheck keiner Diktion von Herstellern, Shops und Verlagen.

So testet Notebookcheck

Pro Jahr werden von Notebookcheck hunderte Laptops und Smartphones unabhängig in von uns standardisierten technischen Verfahren getestet, um eine Vergleichbarkeit aller Testergebnisse zu gewährleisten. Seit rund 20 Jahren entwickeln wir diese Testmethoden kontinuierlich weiter und setzen damit Branchenstandards. In unseren Testlaboren kommt ausschließlich hochwertiges Messequipment in die Hände erfahrener Techniker und Redakteure. Die Tests unterliegen einer mehrstufigen Kontrolle. Unsere komplexe Gesamtbewertung basiert auf hunderten fundierten Messergebnissen und Benchmarks, womit Ihnen Objektivität garantiert ist. Weitere Informationen zu unseren Testmethoden gibt es hier.

Google LogoAls bevorzugte Quelle auf Google hinzufügen
Mail Logo

Keine Kommentare zum Artikel

Fragen, Anregungen, zusätzliche Informationen zu diesem Artikel? - Uns interessiert Deine Meinung (auch ohne Anmeldung möglich)!
Keine Kommentare zum Artikel / Antworten

static version load dynamic
Loading Comments
Diesen Artikel kommentieren / Antworten
> Notebook Test, Laptop Test und News > Tests > Notebook Testberichte > Testbericht zum Framework Laptop 13 Pro: Der König der Reparierbarkeit ist zurück
Autor: Allen Ngo,  1.08.2026 (Update:  1.08.2026)