MSI Summit E13 AI Evo Convertible Test : Schwere Throttling-Probleme mit Core Ultra 7
Einfach zu schnell.
Der neueste Summit E13 A1MTG zeigt, was passiert, wenn man eine Core-Ultra-H-CPU in einen Laptop einbaut, der ursprünglich für einen Prozessor der Core-U-Serie entwickelt wurde. Auf dem Papier mag das sehr schnell klingen, aber das resultierende Throttling und die Temperaturwerte erfordern Aufmerksamkeit.Allen Ngo, 👁 Allen Ngo, ✓ Stefanie Voigt (übersetzt von DeepL / Ninh Duy) Veröffentlicht am 🇺🇸 🇫🇷 ...
Fazit - Ein Schritt vor und zwei Schritte zurück
Der Summit E13 AI Evo A1MTG kann sich im Vergleich zu seinem Vorgänger wie ein Downgrade anfühlen. Auf dem Papier klingt er gut mit seiner Core-Ultra-H-CPU, aber in der Praxis drosselt der Prozessor viel schneller und stärker als die meisten anderen Laptops mit der gleichen CPU-Option, da der Summit E13 ursprünglich für ULV-Prozessoren der Core-U-Serie entwickelt wurde. Das neuere Modell ist sicherlich schneller als die ursprüngliche Version von 2021, aber der Unterschied ist nicht so groß, wie er angesichts unserer Erfahrungen mit anderen Core-Ultra-H-Laptops wie dem Framework Laptop 13.5 sein könnte. Auch Aspekte wie Akkulaufzeit und die Kerntemperatur leiden unter dem Prozessorwechsel.
Andere enttäuschende Änderungen sind die geringer Anzahl an USB-C-Ports und der Wegfall des MicroSD-Lesegeräts. Sogar das IPS-Basisdisplay wurde von 120 Hz auf nur 60 Hz herabgestuft, ohne dass sich die langsamen Schwarz-Weiß-Reaktionszeiten verbessert hätten.
Jetzt, da das Summit E13 fast vier Jahre alt ist, könnte es Zeit für ein Gehäuse-Redesign sein. Der Core Ultra-H-Prozessor hilft, das MSI Modell von anderen 13-Zoll-Convertibles zu unterscheiden. Doch seine Implementierung hätte besser gehandhabt werden können, indem man zuerst die Kühllösung verbessert hätte, um die höheren CPU-Anforderungen zu unterstützen. Die überdurchschnittlich hohen Temperaturen und das Lüftergeräusch deuten auf eine Kühllösung hin, die damit kämpft, den neuen Prozessor über Wasser zu halten.
Pro
Contra
Preis und Verfügbarkeit
Amazon bietet derzeit das Summit E13 AI Evo mit dem Core Ultra 7, 32 GB LPDDR5 RAM und 1-TB-SSD für 1.710 Euro an.
Mögliche Konkurrenten im Vergleich
Bild | Modell / Test | Preis ab | Gewicht | Dicke | Display |
|---|---|---|---|---|---|
1. 78.6%  | MSI Summit E13 AI Evo A1MTG Intel Core Ultra 7 155H ⎘ Intel Arc 8-Core iGPU ⎘ 16 GB RAM, 1024 GB SSD | Amazon: 1.131,14 € Geizhals Suche | 1.3 kg | 16.2 mm | 13.30" 1920x1200 170 PPI IPS |
2. 86.9% v7 (old)  | MSI Summit E13 Flip Evo A11MT Intel Core i7-1185G7 ⎘ Intel Iris Xe Graphics G7 96EUs ⎘ 32 GB RAM, 1024 GB SSD | Amazon: 1. 1.709,10 € MSI Summit 13 AI+, Business ... 2. 920,83 € MSI Summit E14 Evo Business ... 3. 29,99 € PowerPortnerLink 100W 65W US... Listenpreis: 1900 USD | 1.4 kg | 14.9 mm | 13.40" 1920x1200 169 PPI IPS |
3. 87% v7 (old)  | Lenovo Yoga Book 9 13IMU9 Intel Core Ultra 7 155U ⎘ Intel Graphics 4-Core iGPU (Meteor / Arrow Lake) ⎘ 16 GB RAM | Amazon: 1.538,97 € Geizhals Suche | 1.4 kg | 15.95 mm | 13.30" 2880x1800 255 PPI OLED |
4. 88.1% v7 (old)  | Lenovo ThinkPad L13 Yoga G4 i7-1355U Intel Core i7-1355U ⎘ Intel Iris Xe Graphics G7 96EUs ⎘ 16 GB RAM, 512 GB SSD | Amazon: 1. 650,00 € Lenovo ThinkPad X1 Yoga Gen ... 2. 399,00 € Lenovo ThinkPad X1 Yoga Gen ... 3. 799,00 € Lenovo i7 17,3 Zoll IPS Full... Listenpreis: 1589 USD | 1.4 kg | 17.1 mm | 13.30" 1920x1200 170 PPI IPS |
5. 90.3% v7 (old)  | HP Elite Dragonfly Folio 13.5 G3 Intel Core i7-1265U ⎘ Intel Iris Xe Graphics G7 96EUs ⎘ 16 GB RAM, 512 GB SSD | Amazon: 1. 53,90 € Akku für HP Elite Dragonfly... 2. 499,90 € HP Business Laptop Notebook ... 3. 46,79 € upscreen Anti-Spy Blickschut... Listenpreis: 3900 USD | 1.4 kg | 17.8 mm | 13.50" 1920x1280 171 PPI IPS |
6. 89% v7 (old)  | Dell Latitude 9330 Intel Core i7-1260U ⎘ Intel Iris Xe Graphics G7 96EUs ⎘ 16 GB RAM | Amazon: 1. 45,11 € ANTIEE 50Wh 47XV3 31CP5/73/7... 2. 23,99 € Superer 65W Type C Ladegerä... 3. 114,00 € Dell PN7522W Original Active... | 1.2 kg | 14.1 mm | 13.30" 2560x1600 227 PPI IPS |
Inhaltsverzeichnis
- Fazit - Ein Schritt vor und zwei Schritte zurück
- Spezifikationen
- Gehäuse - Goldene Zierleisten
- Anschlussausstattung - Neue, aber nicht bessere Anschlussoptionen
- Eingabegeräte
- Display - Nur durchschnittlich für den Preis
- Performance - Core Ultra-H ist zu viel des Guten
- Emissionen
- Energieverwaltung
- Notebookcheck Bewertung
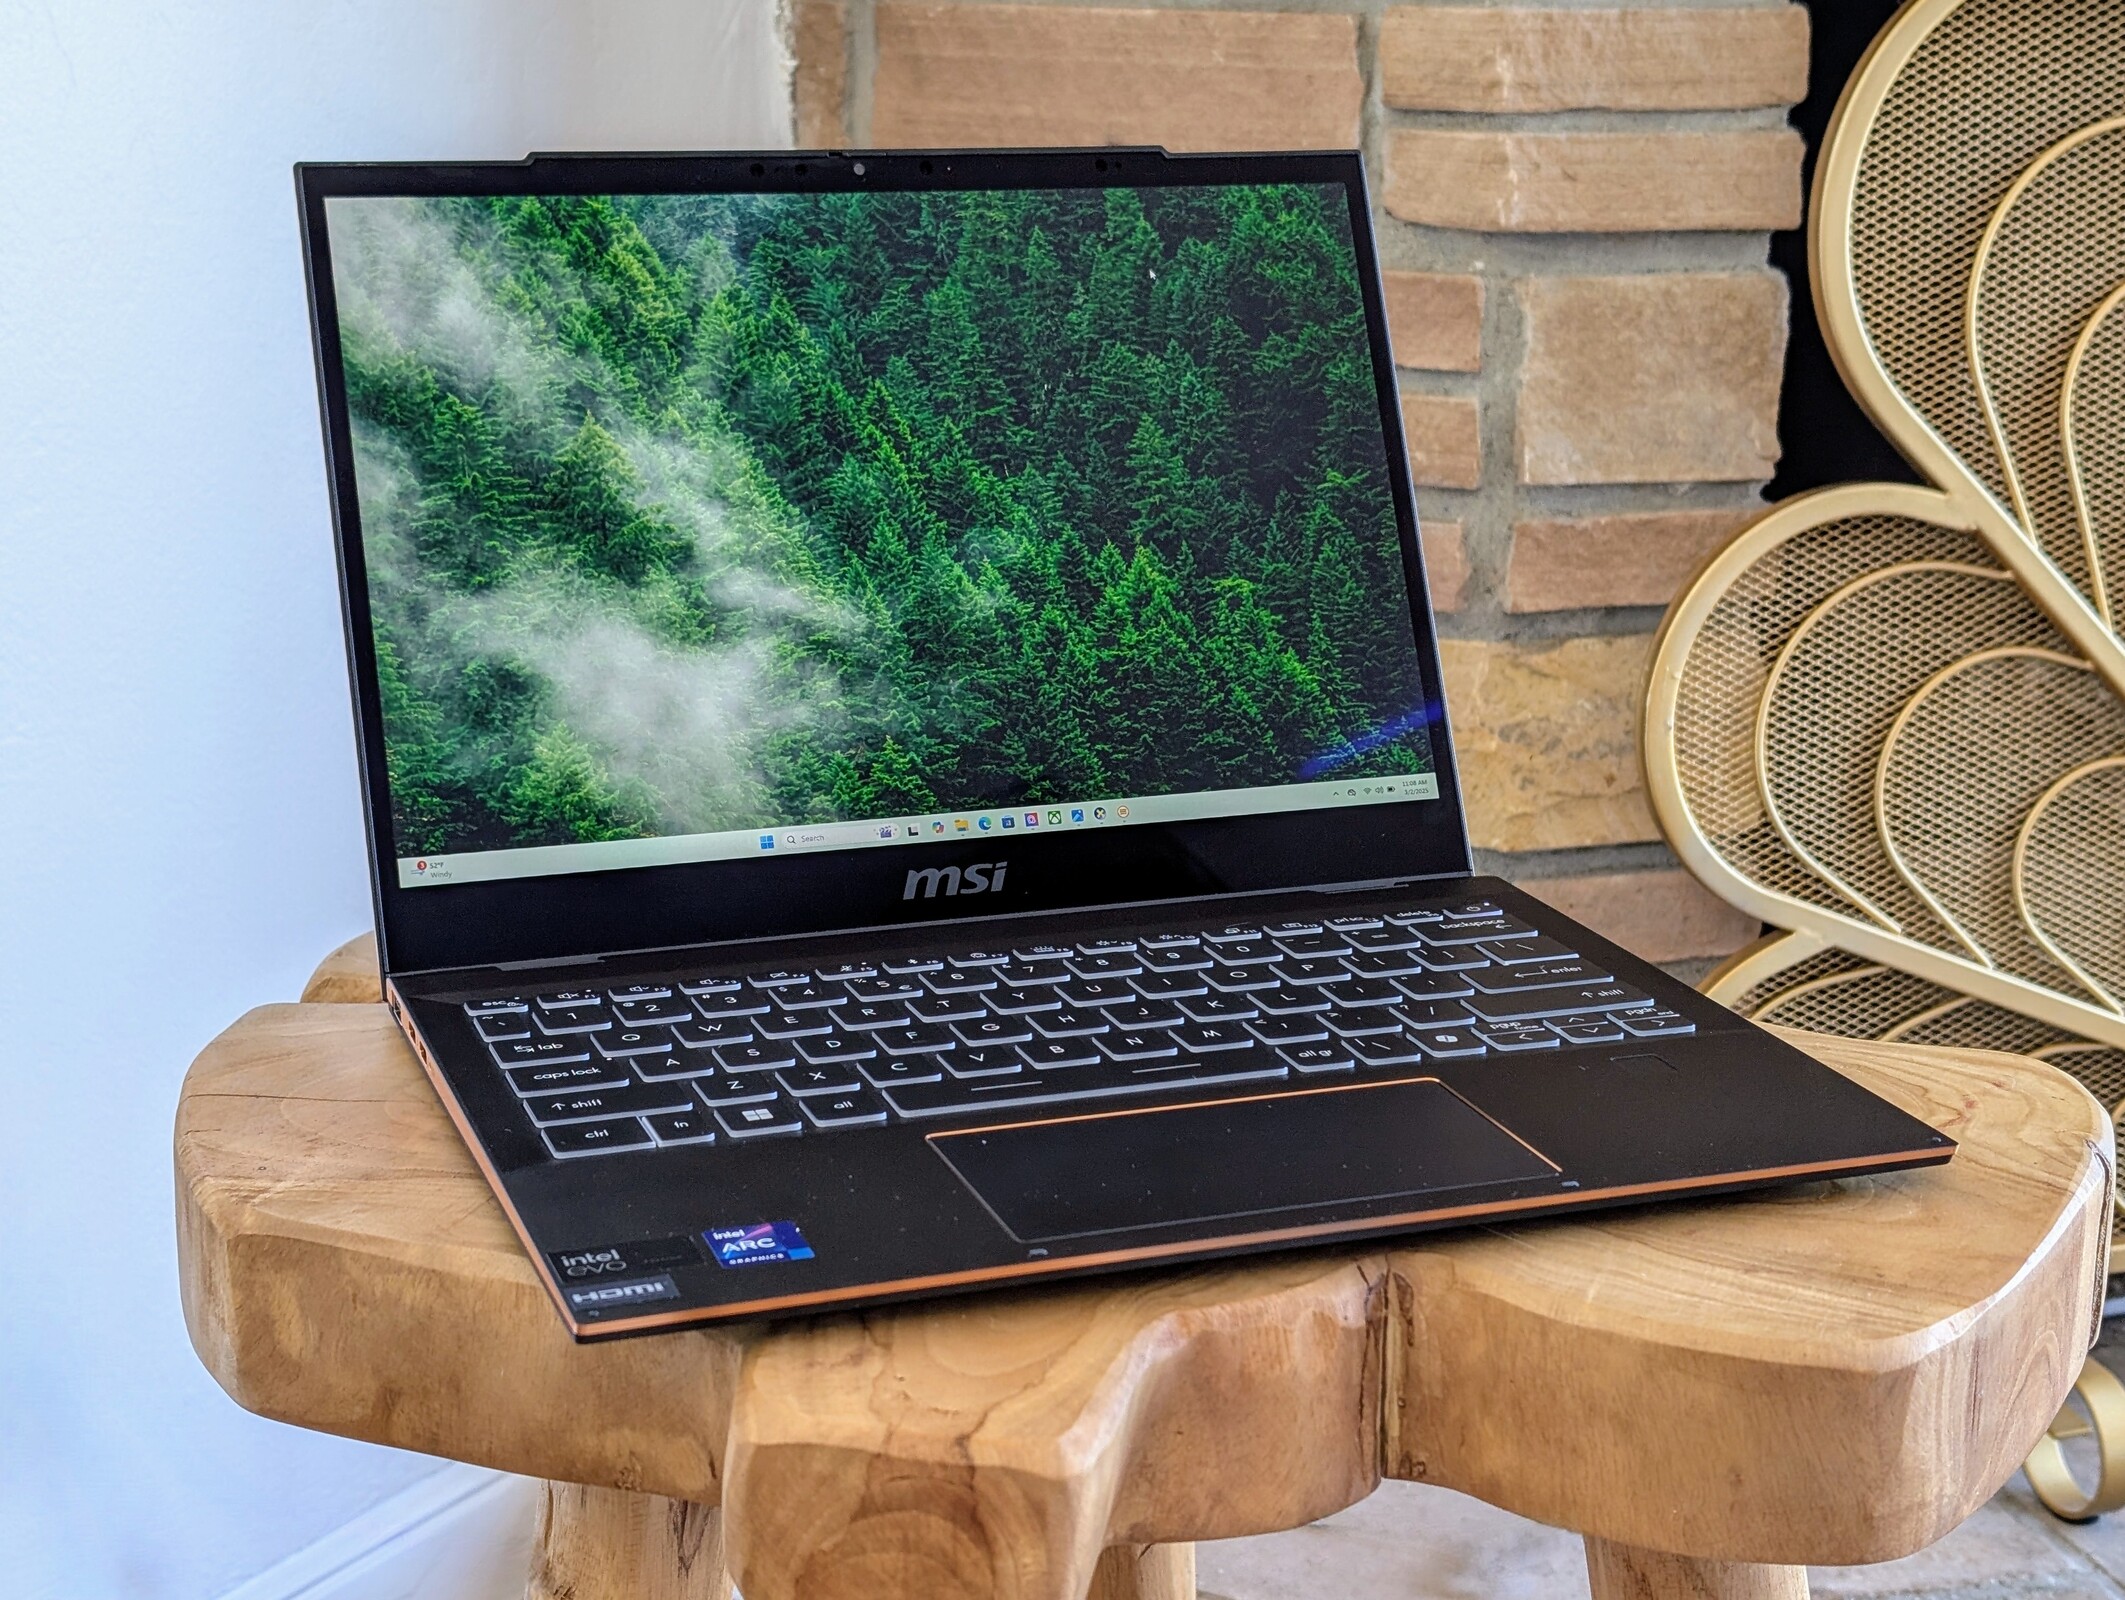
Das 2024 Summit E13 AI Evo A1MTG ist die aktualisierte Version des 2021 Summit E13 Flip Evo. Der Name "Flip" wurde zwar fallen gelassen, aber das Modell hat immer noch einen 2-in-1-Formfaktor, genau wie sein Vorgänger. Es ist mit einem neueren Intel-Core-Meteor-Lake-H-Prozessor ausgestattet, der die ältere Tiger-Lake-U-Option des 2021er Modells ersetzt.
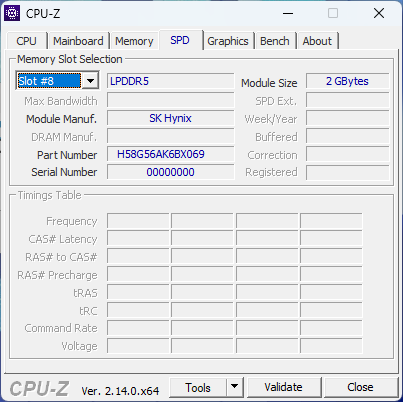
Unser Testgerät ist mit der Core-Ultra-7-155H-CPU, 16 GB LPDDR5-5600 RAM und 1-TB-SSD für etwa 1.100 US-Dollar ausgestattet. Andere SKUs bieten möglicherweise 32 GB LPDDR5-6400 RAM oder den langsameren Core Ultra 5 125H, aber der 1.200p-IPS-Touchscreen scheint in der gesamten Produktpalette enthalten zu sein.
Zu den Konkurrenten gehören andere 13-Zoll-Büro-Subnotebooks wie das Dell Latitude 9330, HP Elite Dragonfly Folio oder Lenovo ThinkPad L13 Yoga G4.
Weitere MSI Testberichte:
Spezifikationen
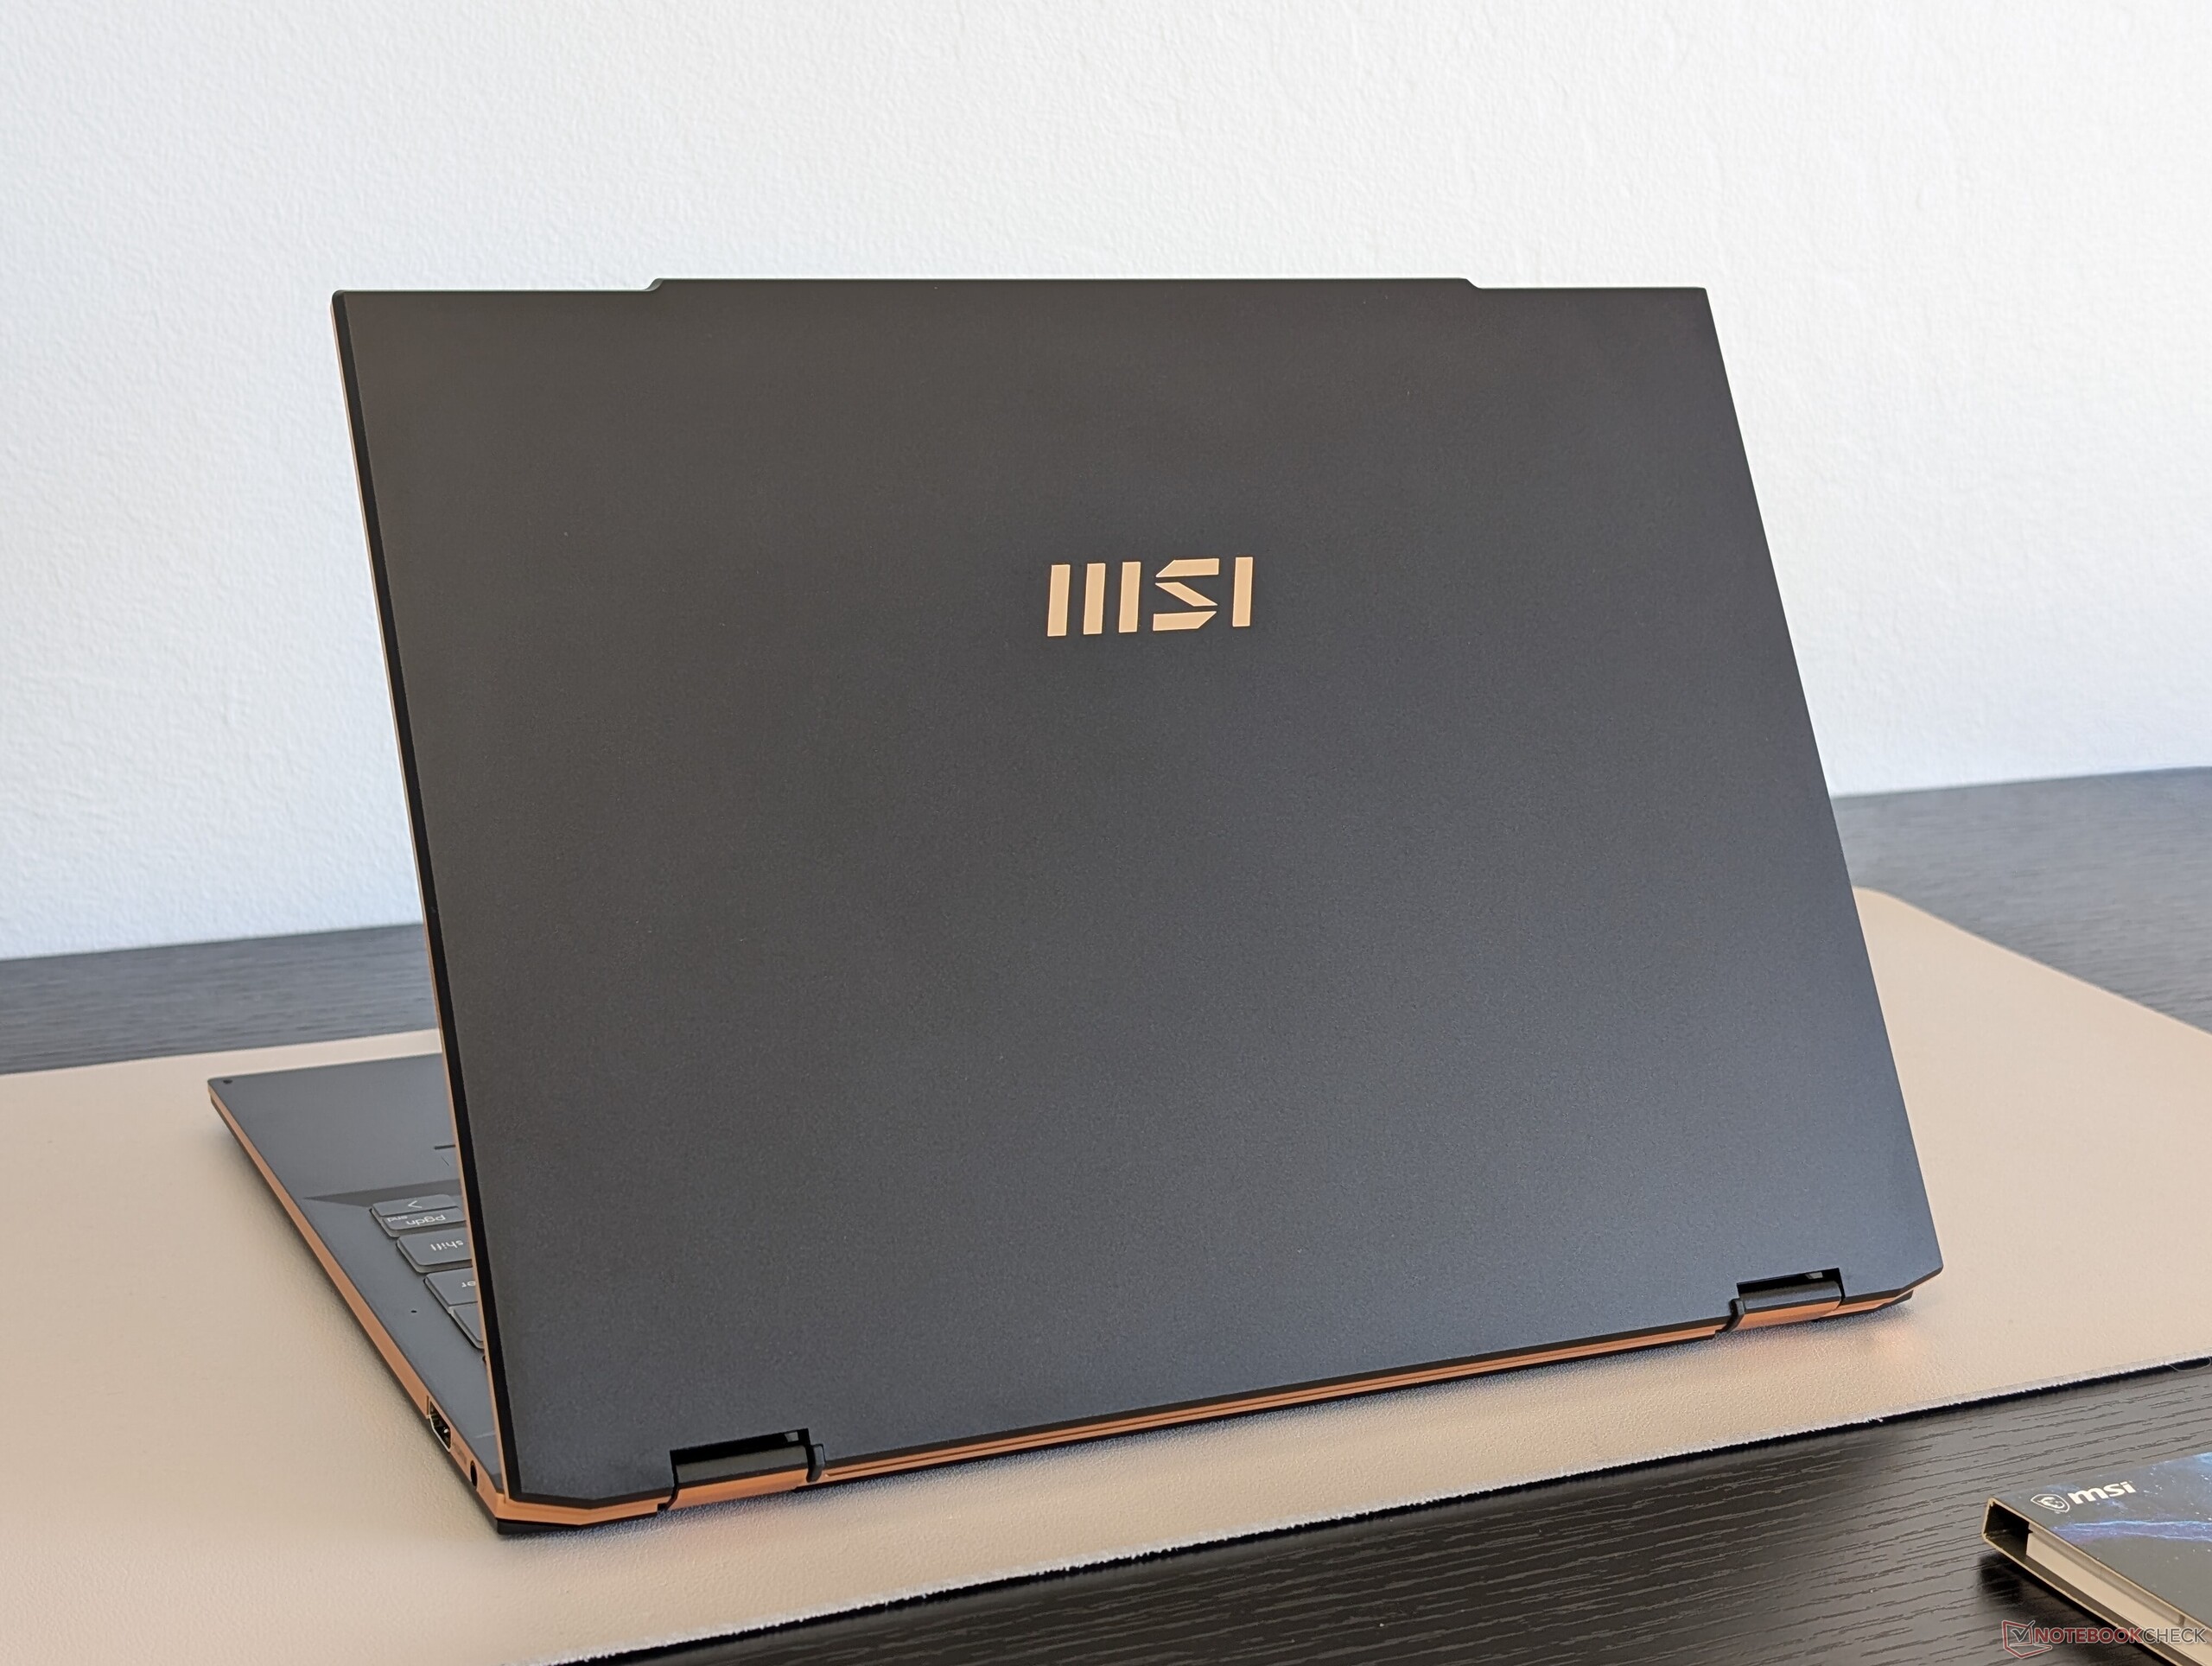
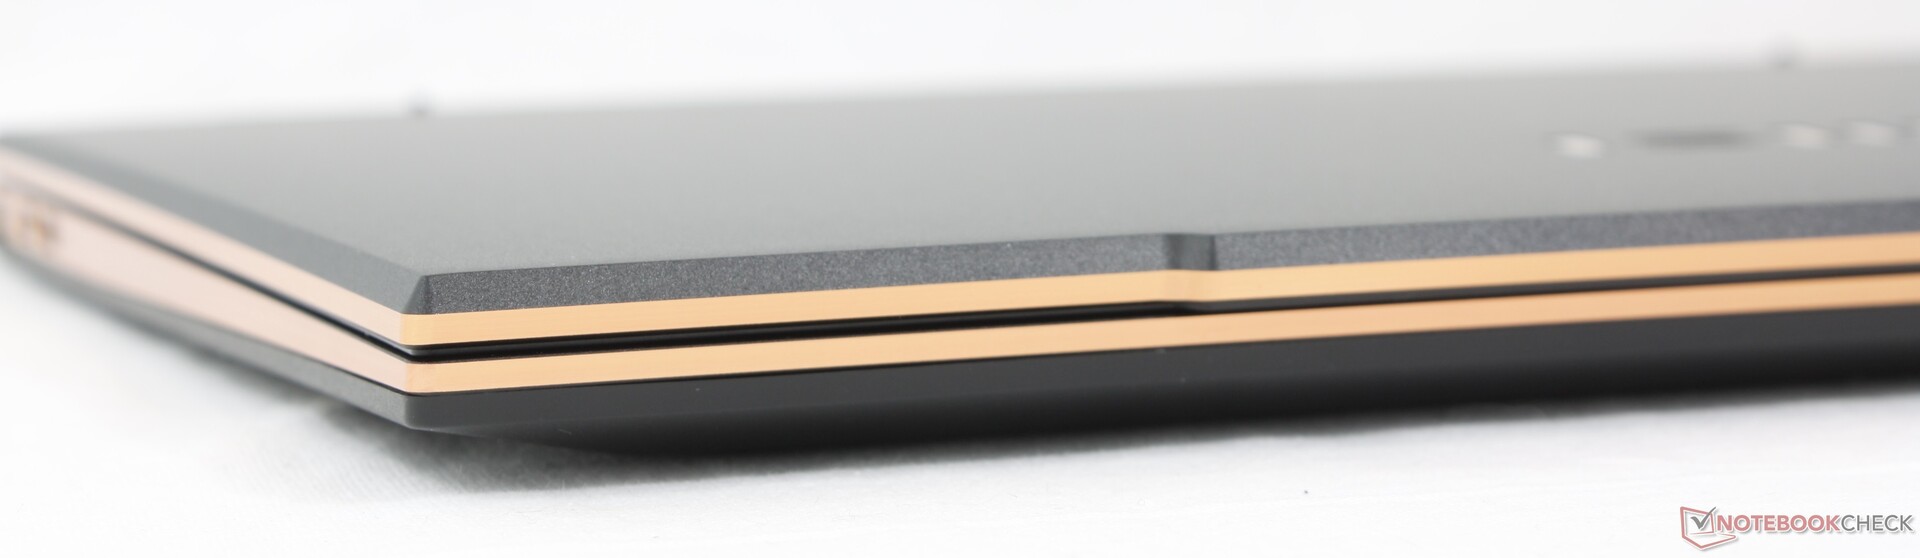
Gehäuse - Goldene Zierleisten
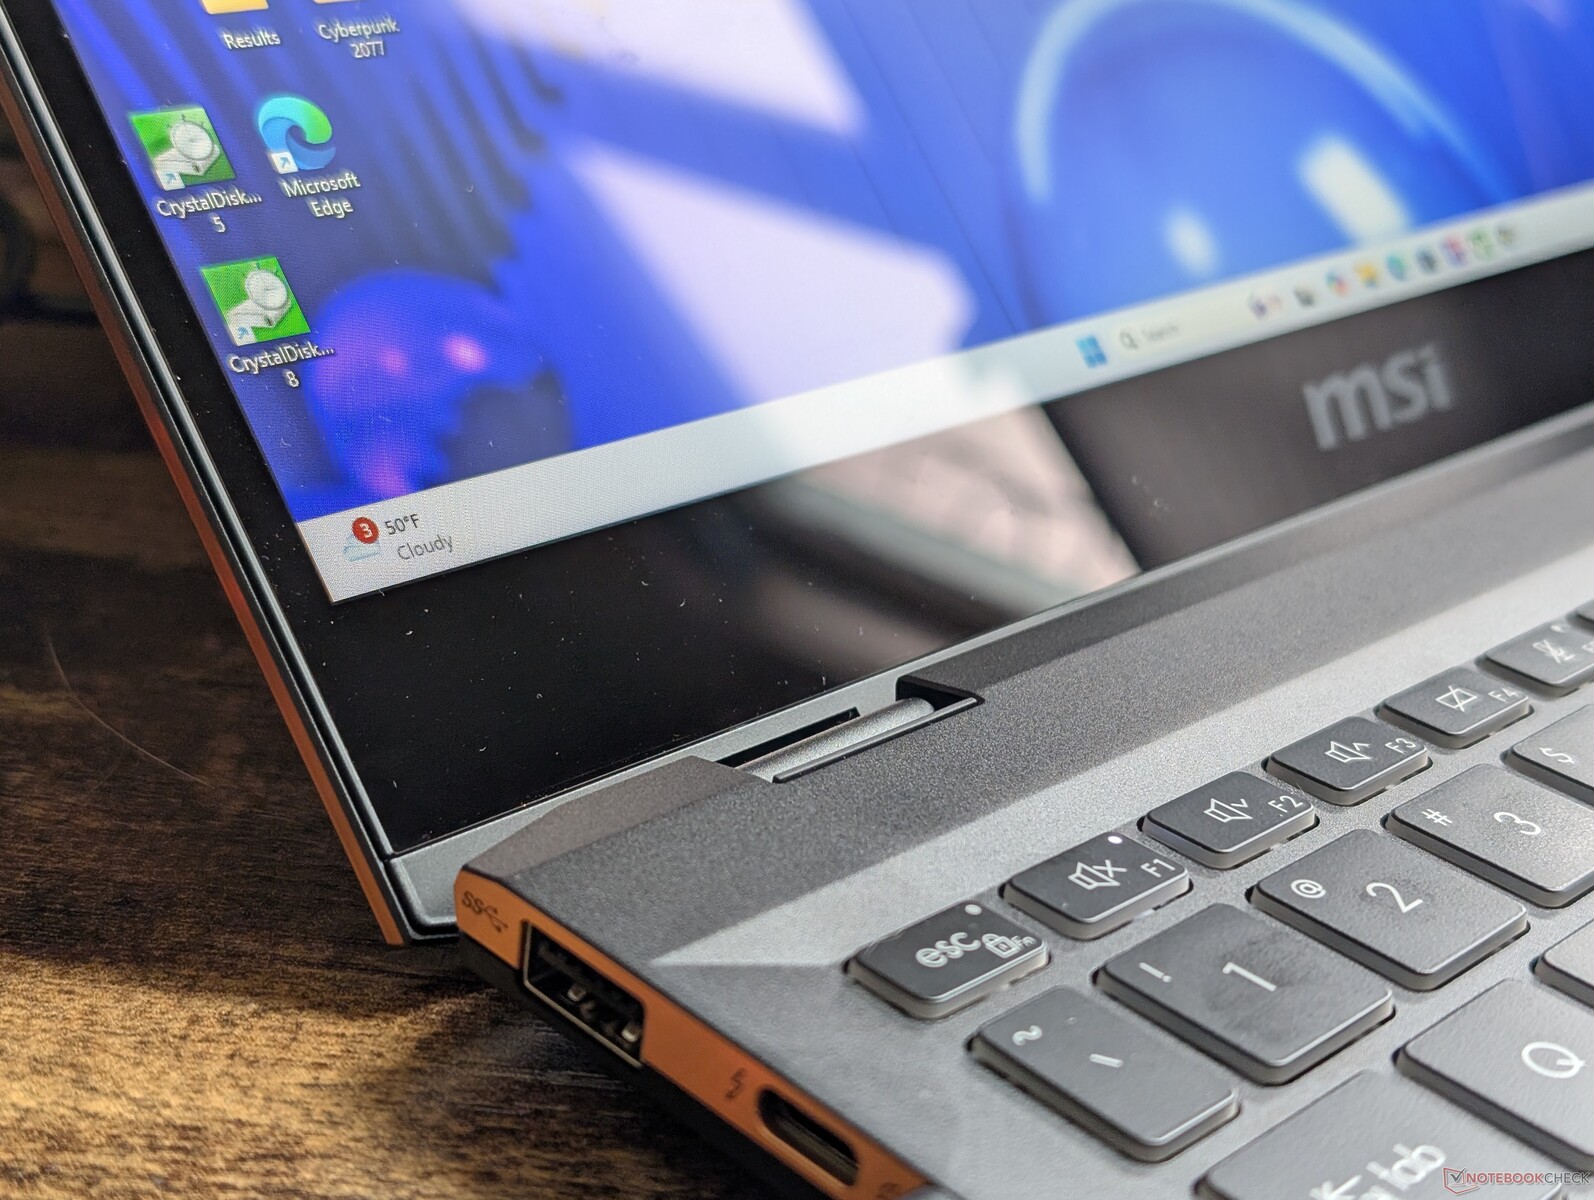
Das 2024 Summit E13 hat andere Ports und einen neuen Webcam-Verschluss im Vergleich zur 2021er Version. Ansonsten sind die Gehäuse identisch, denn es gibt keine größeren Änderungen, weder äußerlich noch innerlich.
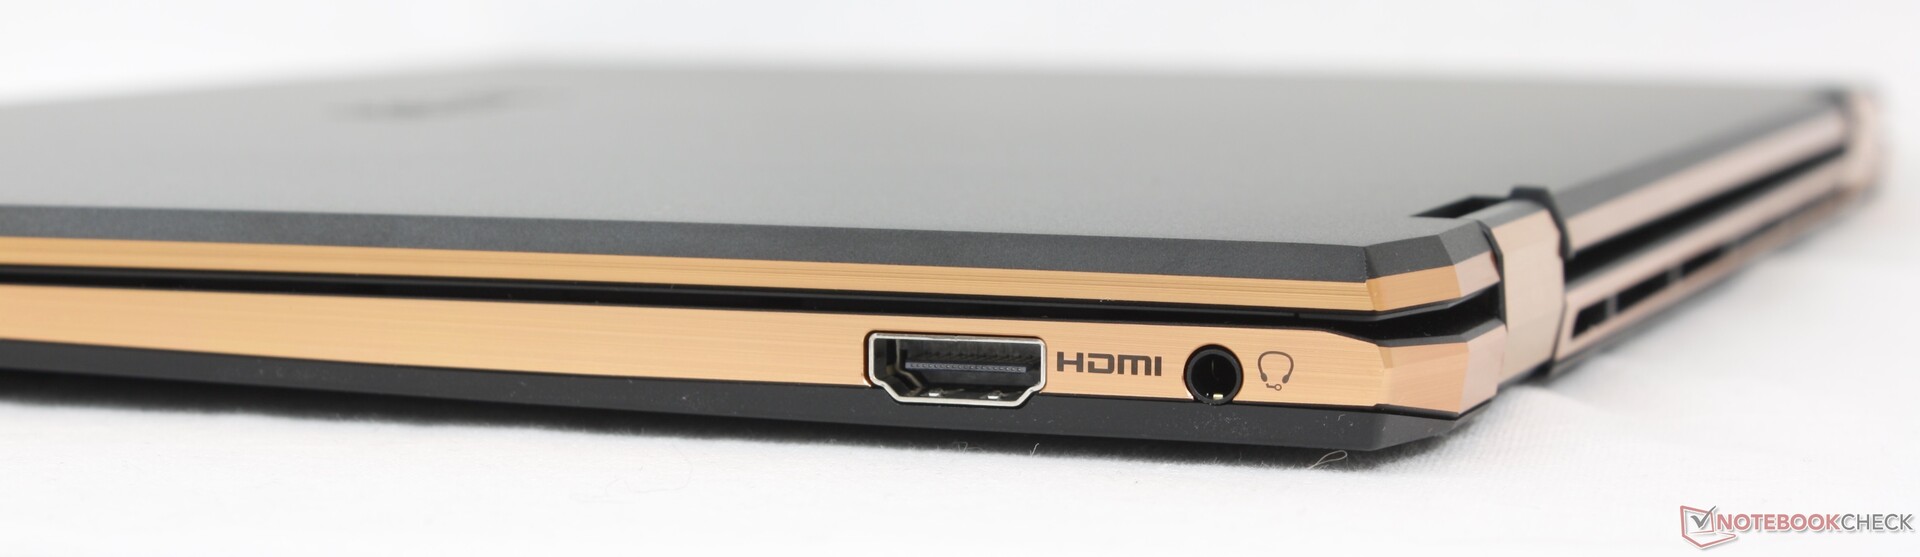
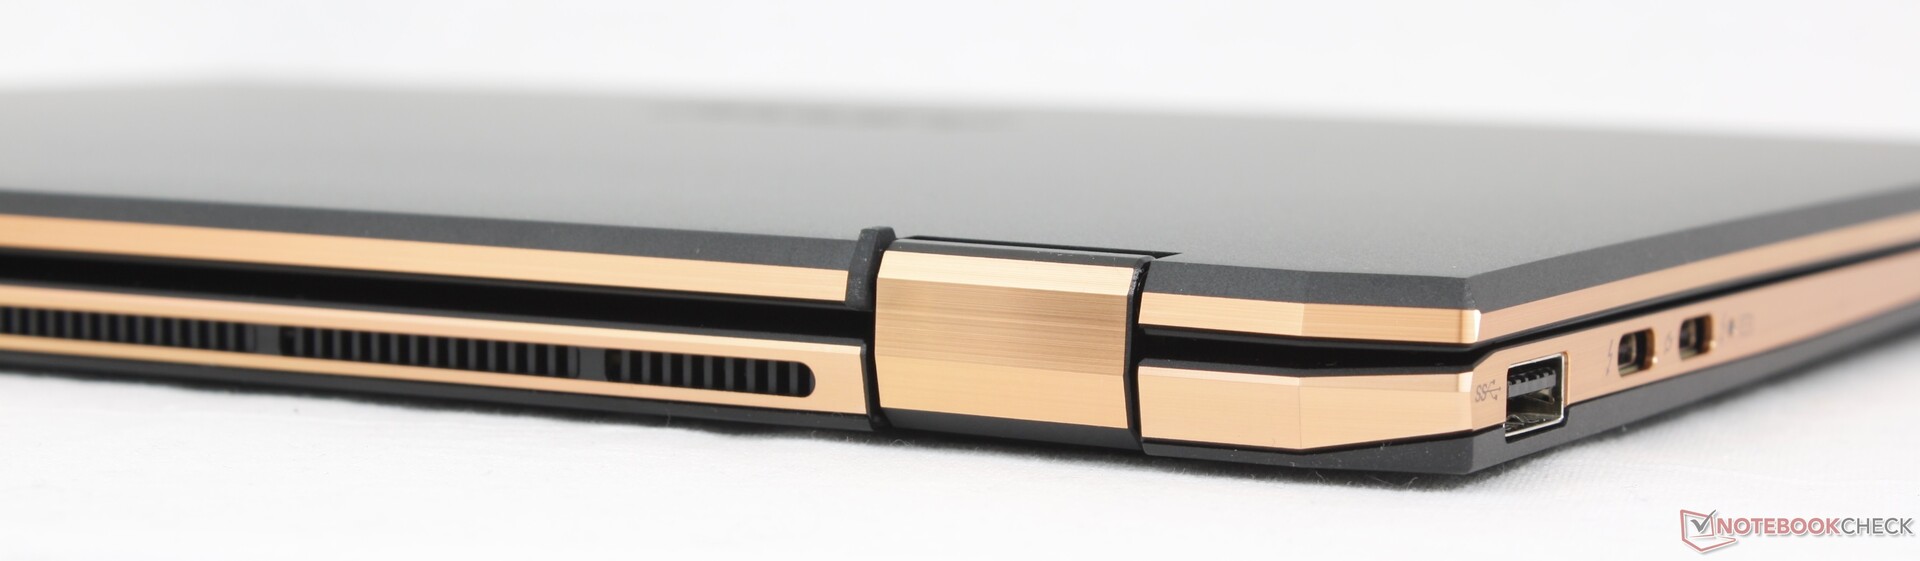
Anschlussausstattung - Neue, aber nicht bessere Anschlussoptionen
Die Anschlussoptionen haben sich gegenüber dem Modell 2021 geändert, und das nicht unbedingt zum Besseren. Einer der USB-C Ports wurde zugunsten von HDMI entfernt, und der MicroSD-Leser wurde komplett gestrichen.

Kommunikation
| Networking | |
| iperf3 transmit AX12 | |
| MSI Summit E13 Flip Evo A11MT | |
| iperf3 receive AX12 | |
| MSI Summit E13 Flip Evo A11MT | |
| iperf3 transmit AXE11000 | |
| Lenovo ThinkPad L13 Yoga G4 i7-1355U | |
| HP Elite Dragonfly Folio 13.5 G3 | |
| Dell Latitude 9330 | |
| Lenovo Yoga Book 9 13IMU9 | |
| MSI Summit E13 AI Evo A1MTG | |
| iperf3 receive AXE11000 | |
| Lenovo ThinkPad L13 Yoga G4 i7-1355U | |
| Lenovo Yoga Book 9 13IMU9 | |
| HP Elite Dragonfly Folio 13.5 G3 | |
| Dell Latitude 9330 | |
| MSI Summit E13 AI Evo A1MTG | |
| iperf3 transmit AXE11000 6GHz | |
| HP Elite Dragonfly Folio 13.5 G3 | |
| Dell Latitude 9330 | |
| MSI Summit E13 AI Evo A1MTG | |
| Lenovo Yoga Book 9 13IMU9 | |
| iperf3 receive AXE11000 6GHz | |
| HP Elite Dragonfly Folio 13.5 G3 | |
| MSI Summit E13 AI Evo A1MTG | |
| Dell Latitude 9330 | |
| Lenovo Yoga Book 9 13IMU9 | |
Webcam
Die Webcam bleibt unverändert bei 1.080p oder 2 MP, nur mit IR-Unterstützung.


Wartung
Die Wartung ist ähnlich wie beim Modell 2021, bis hin zum Layout der Hauptplatine gemäß dem Laptop-Media-Wartungsvideo. Der Arbeitsspeicher ist nicht aufrüstbar, und es wird nur eine M.2-2280-SSD unterstützt.
Nachhaltigkeit
MSI zeigt an, dass bei der Herstellung keine nachhaltigen Maßnahmen ergriffen wurden. Die Verkaufsverpackung besteht ansonsten hauptsächlich aus Papier und Pappe mit einer Plastikverpackung für das Netzteil.
Zubehör und Garantie
Die Verkaufsverpackung enthält neben dem Netzteil und den Papieren auch den MSI Pen 2 Active Stylus. Beim Kauf in den USA gilt die übliche einjährige eingeschränkte Herstellergarantie.
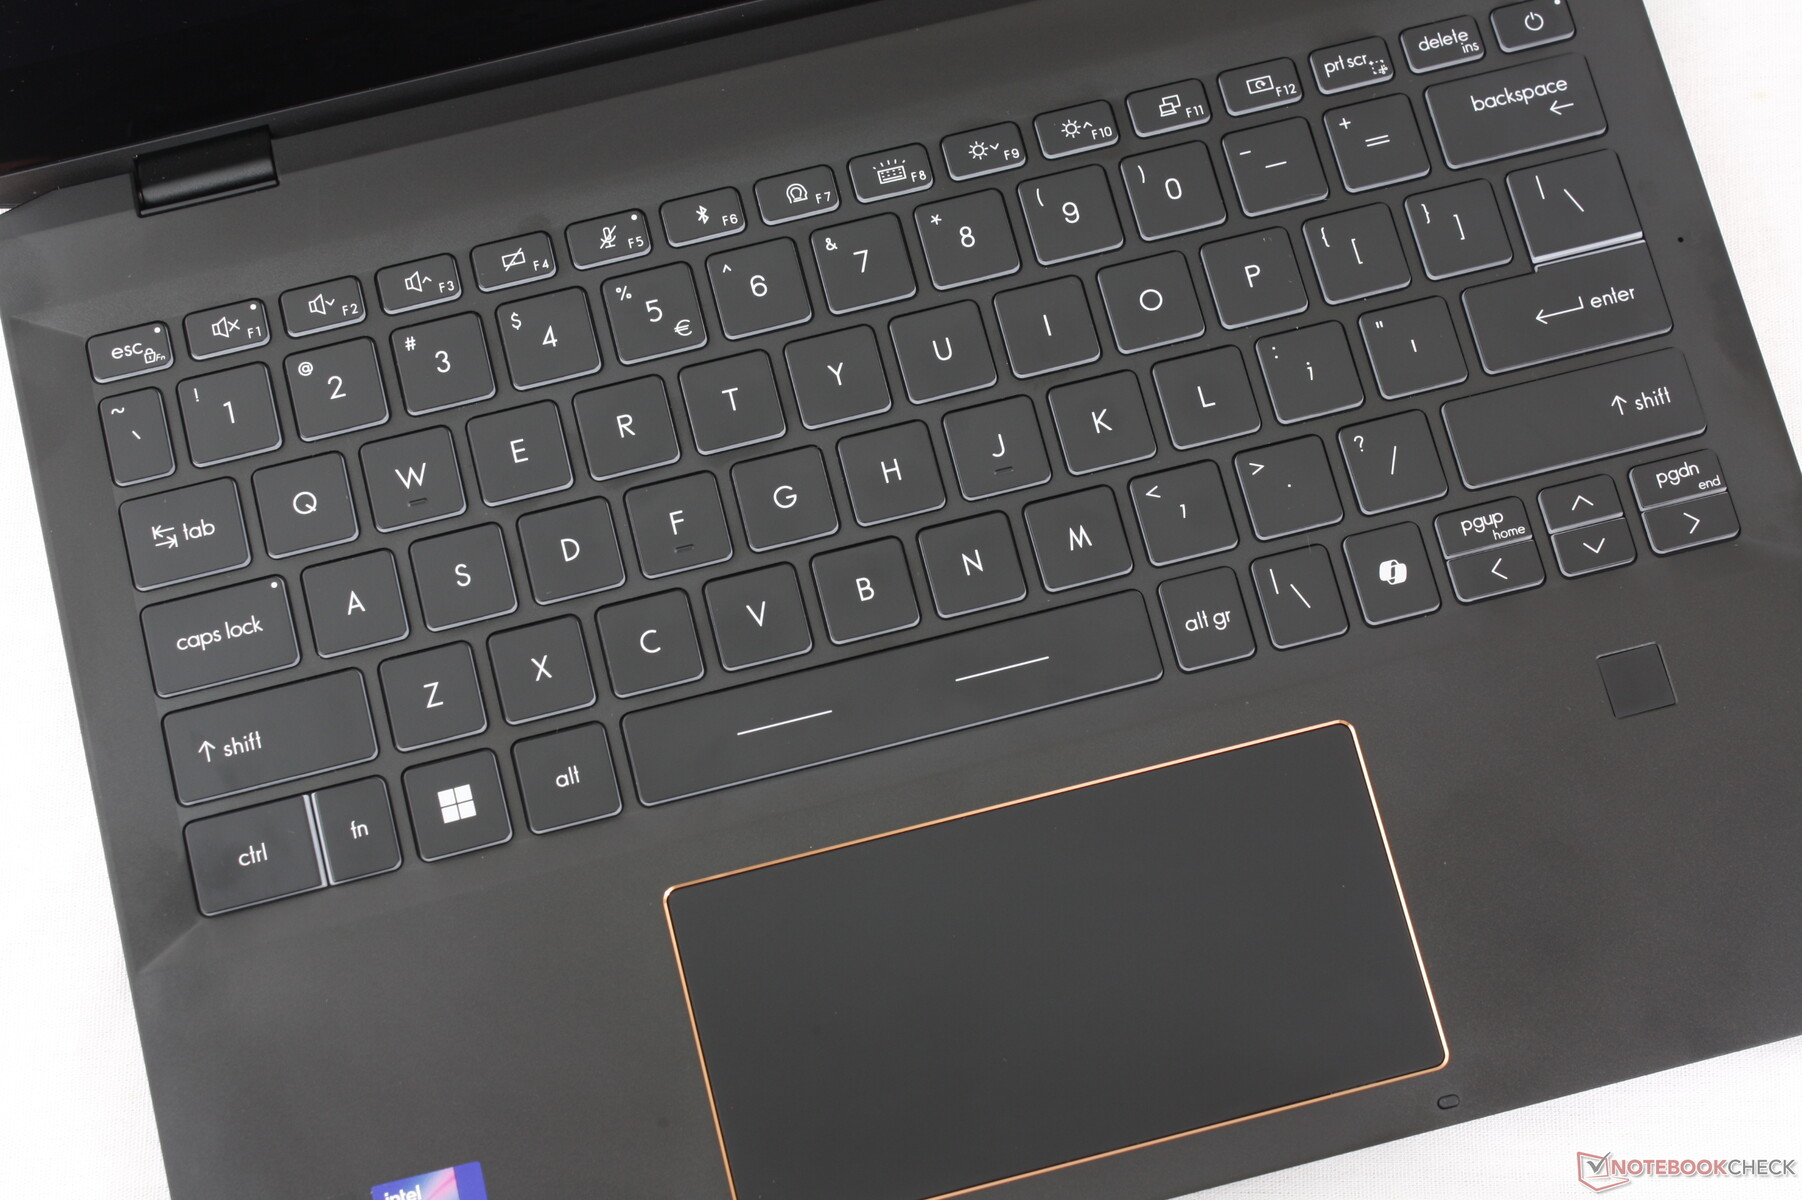
Eingabegeräte
Die Tastatur und das Clickpad haben sich in Bezug auf die Größe und das Feedback nicht verändert und bieten das gleiche Tipperlebnis wie das Modell von 2021. Neu in diesem Jahr sind die spezielle Co-Pilot-Taste und die leicht überarbeiteten Fn- und Strg-Tasten. Leider sind die kleinen PgUp-, PgDn- und Pfeiltasten nach wie vor sehr beengt, schwammig und generell unzuverlässig.
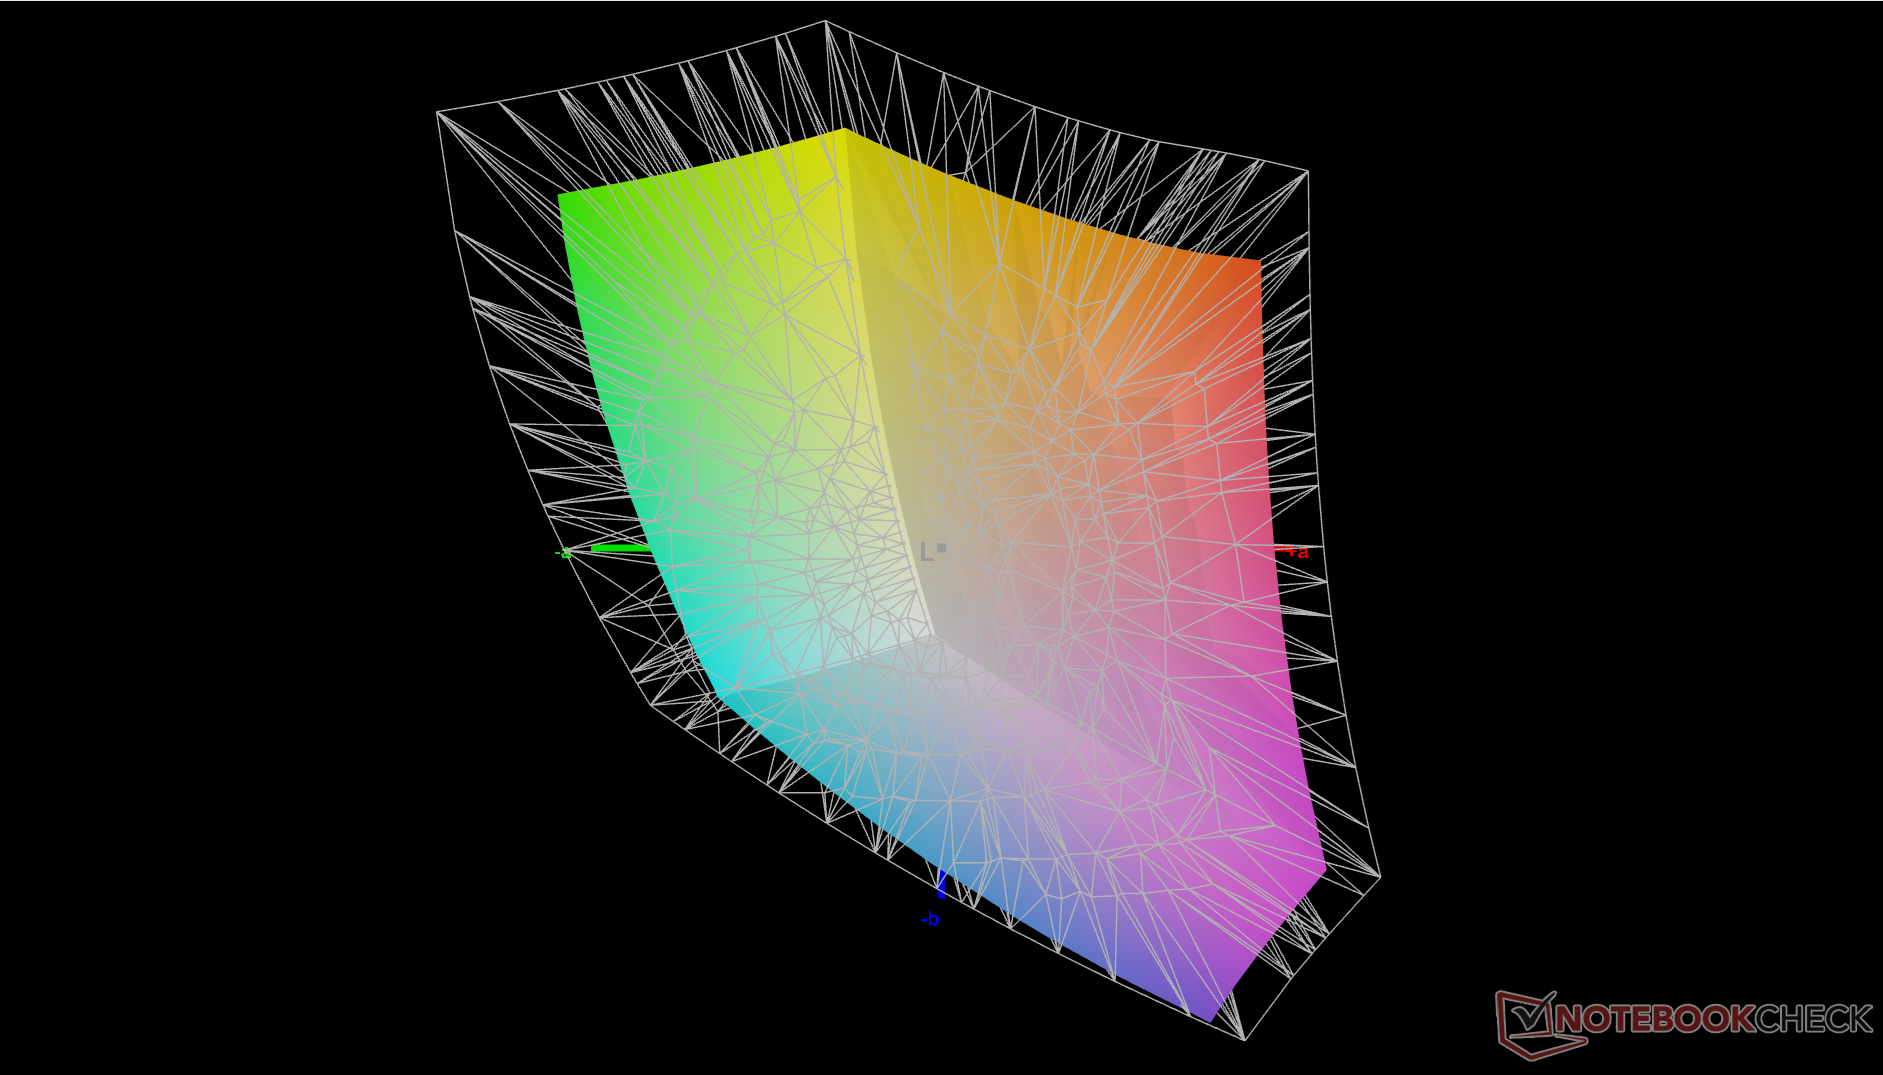
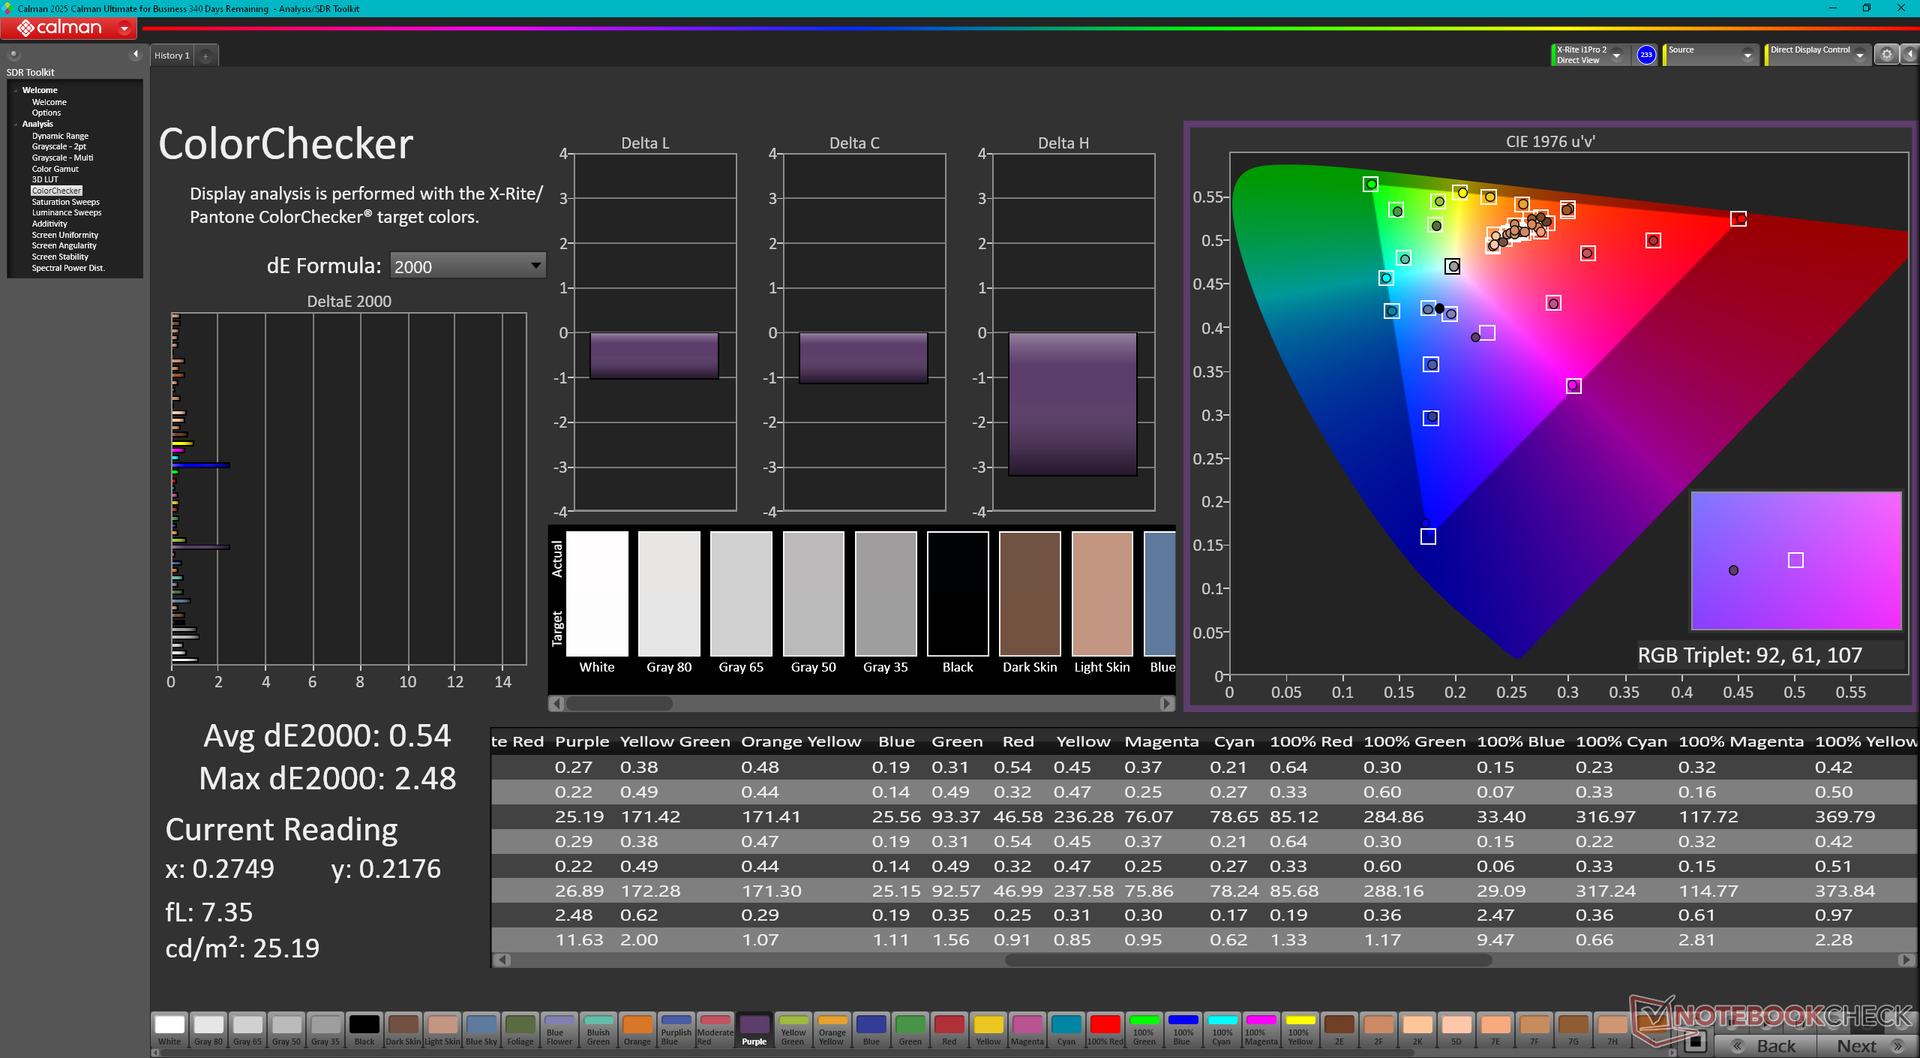
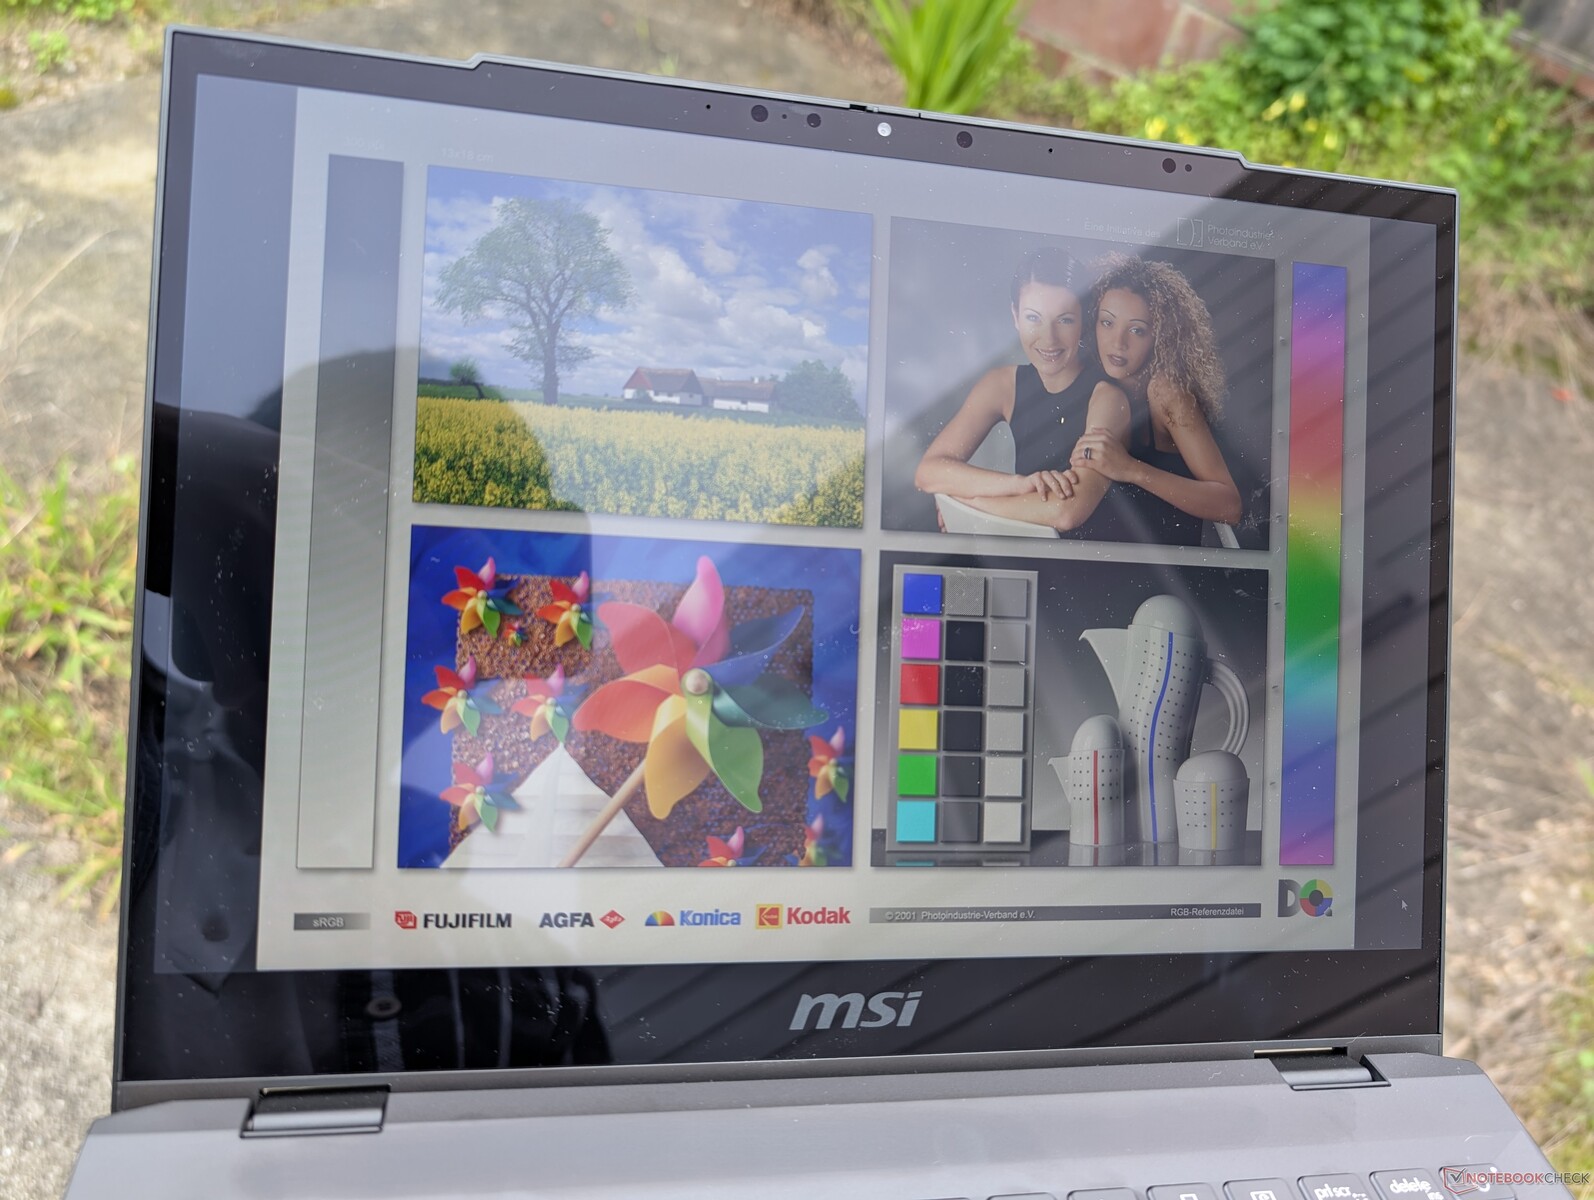
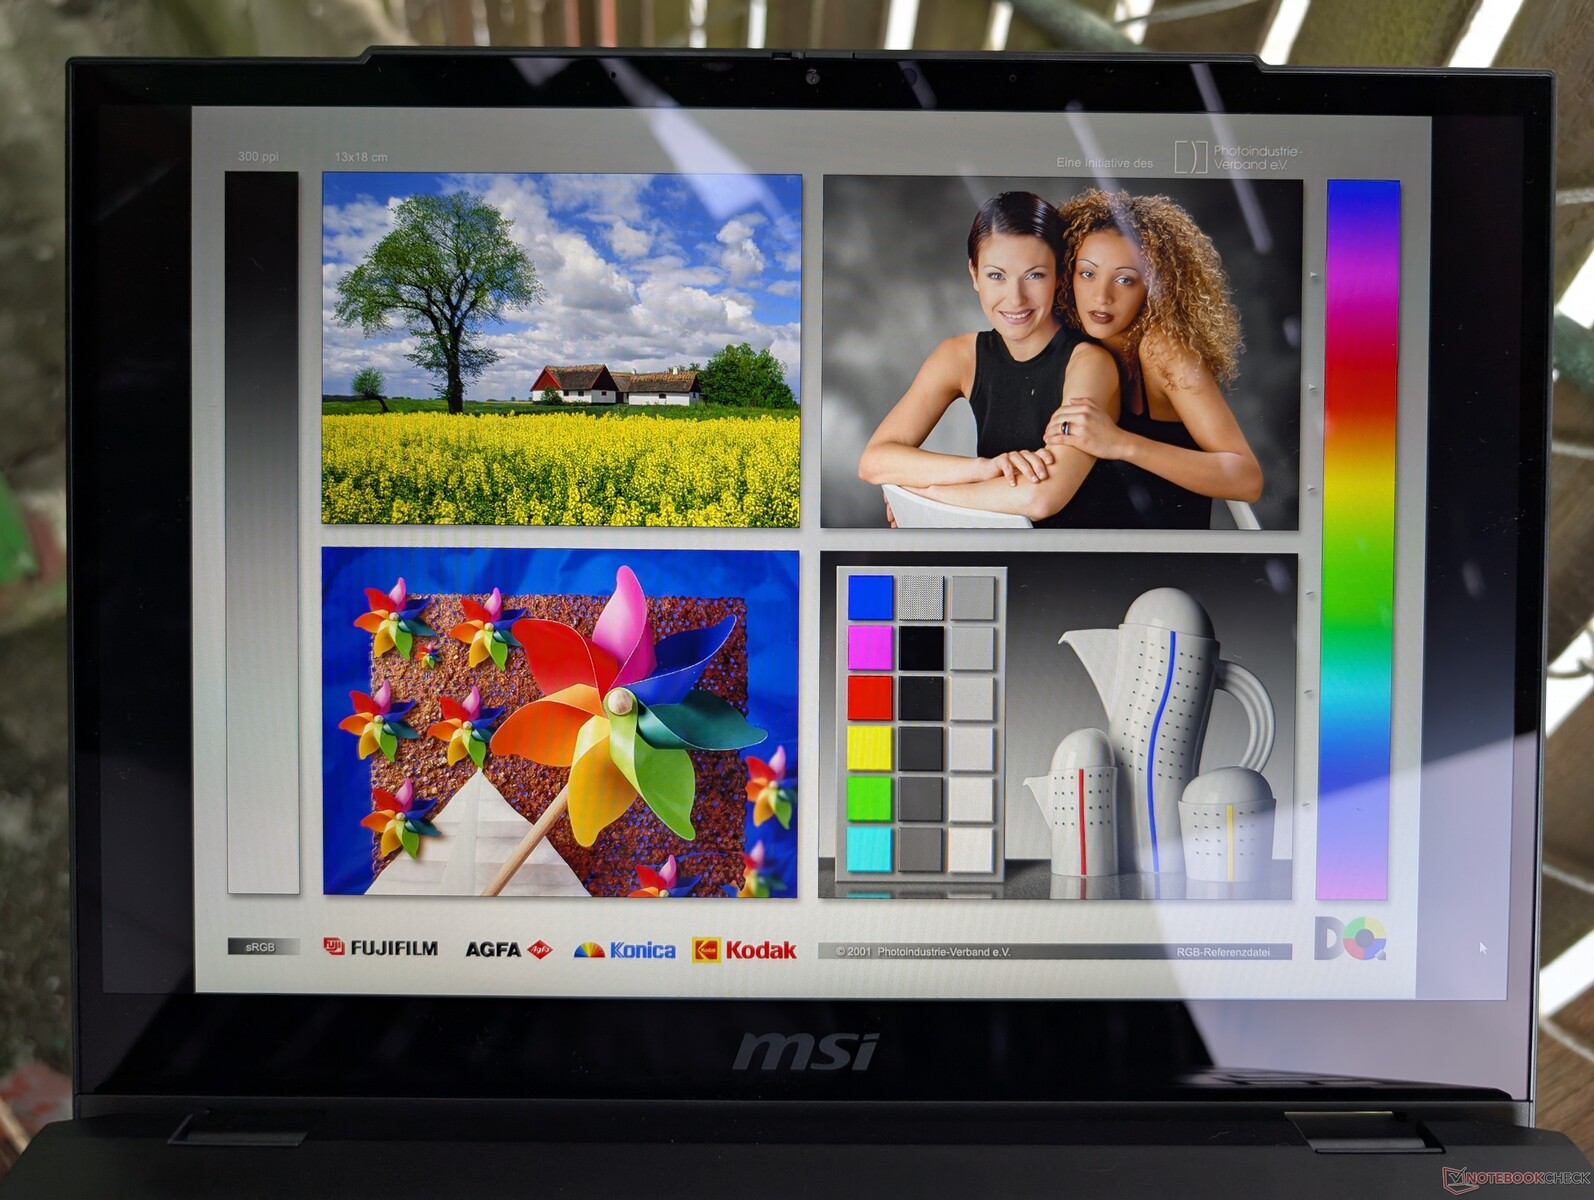
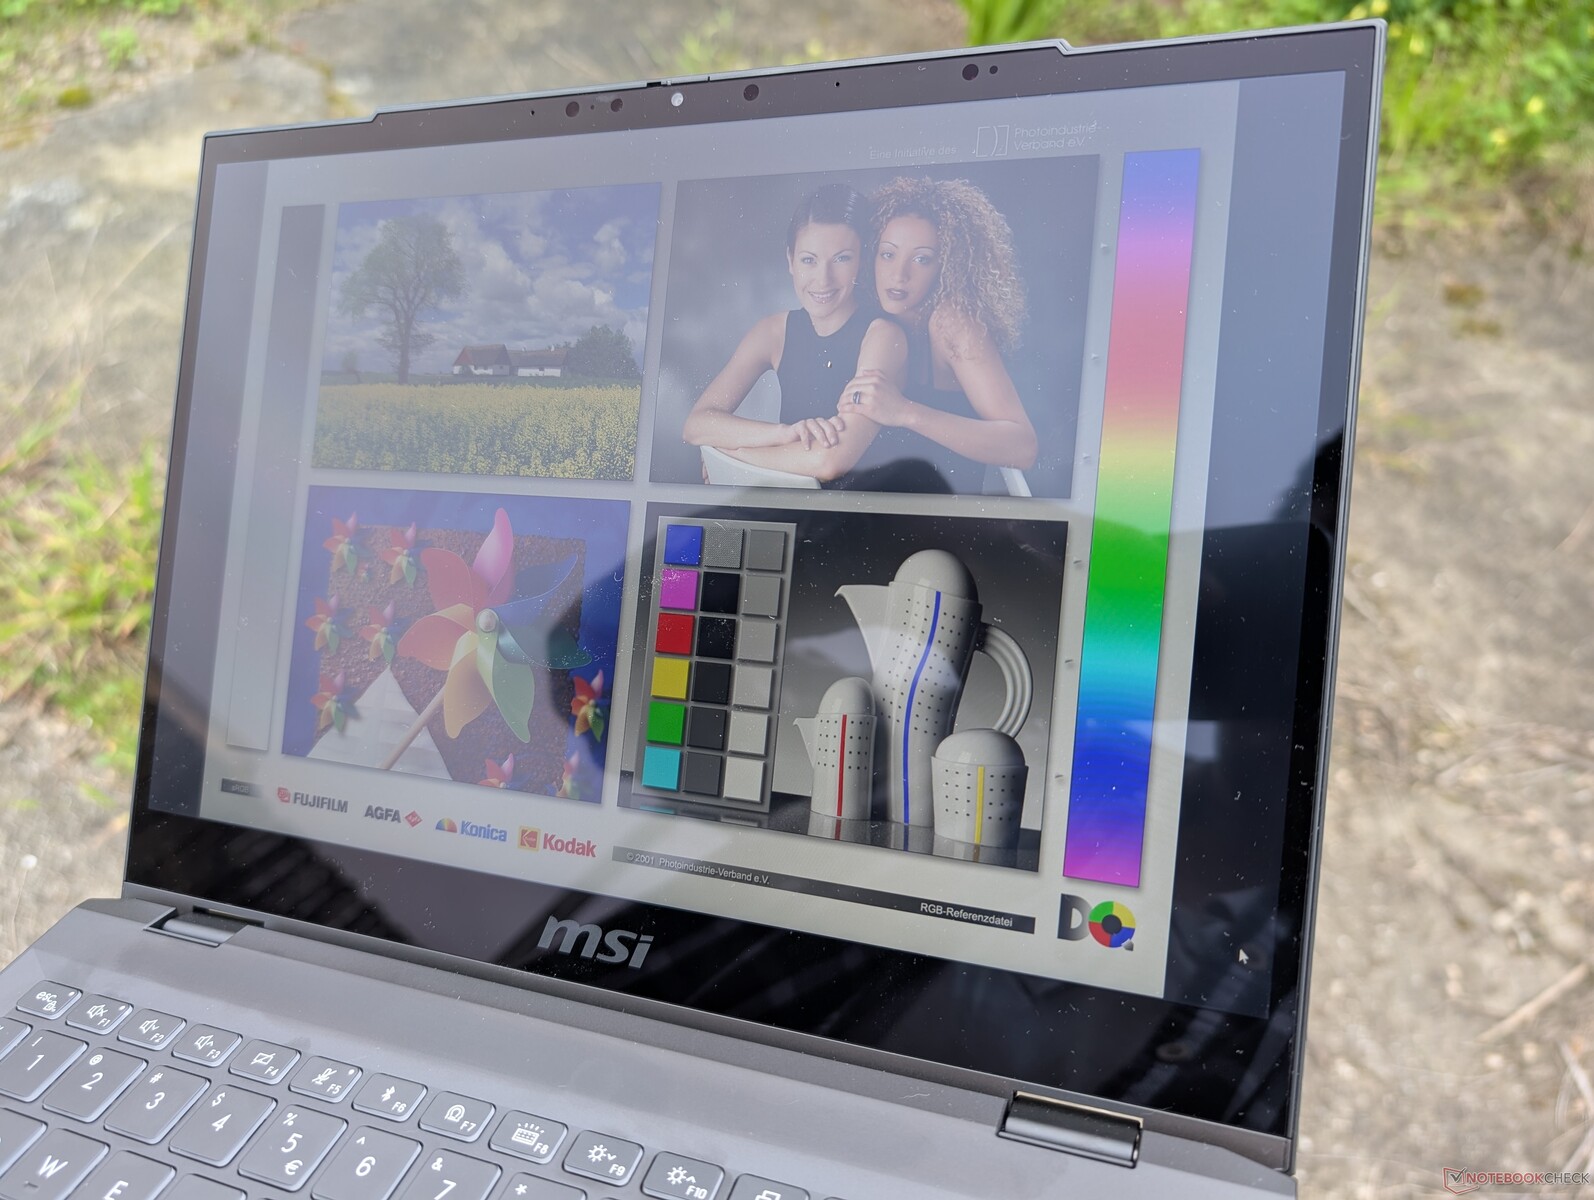
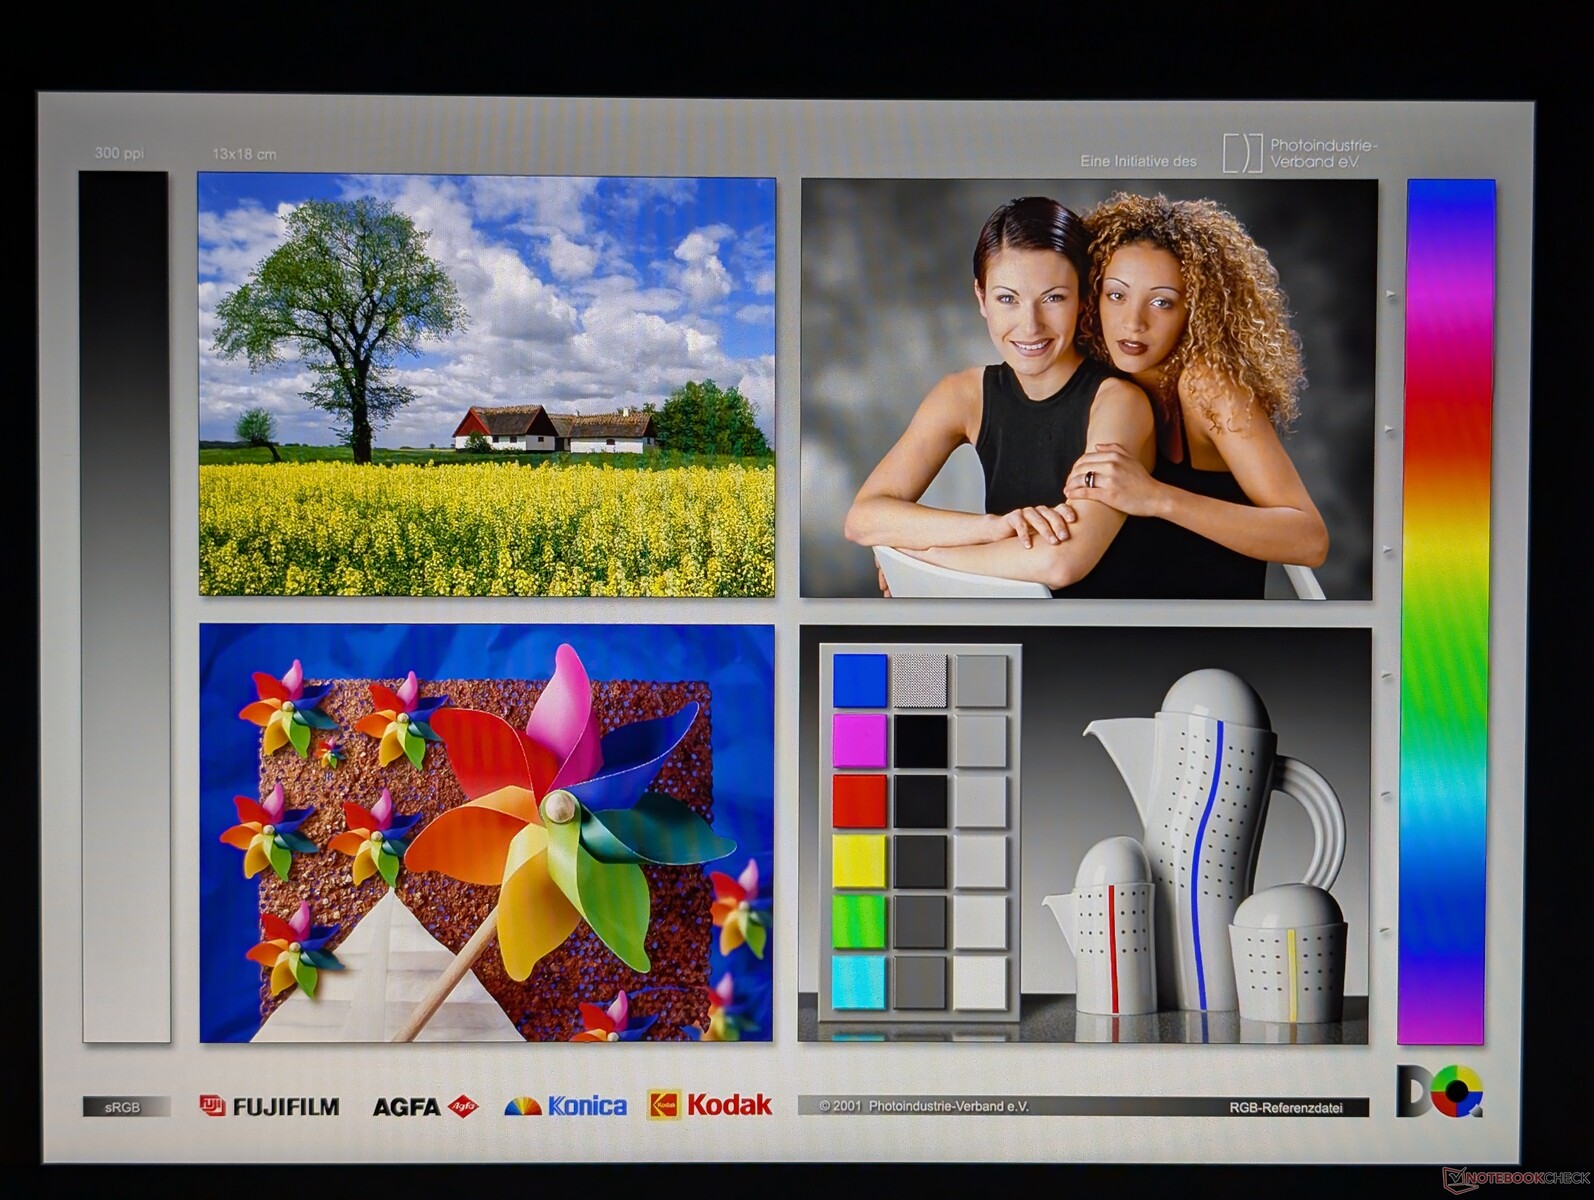
Display - Nur durchschnittlich für den Preis
Unser Gerät verwendet ein 60-Hz-Chi-Mei-Panel anstelle des 120-Hz-Sharp-Panels des Modells 2021. Das Chi-Mei-Panel bietet ähnliche sRGB-Farben, allerdings mit etwas geringerem Kontrast. Die Reaktionszeiten bei Schwarz-Weiß und Grau-Grau sind selbst für Nicht-Gaming-Verhältnisse sehr langsam.
| |||||||||||||||||||||||||
Ausleuchtung: 88 %
Helligkeit Akku: 405.2 cd/m²
Kontrast: 1192:1 (Schwarzwert: 0.34 cd/m²)
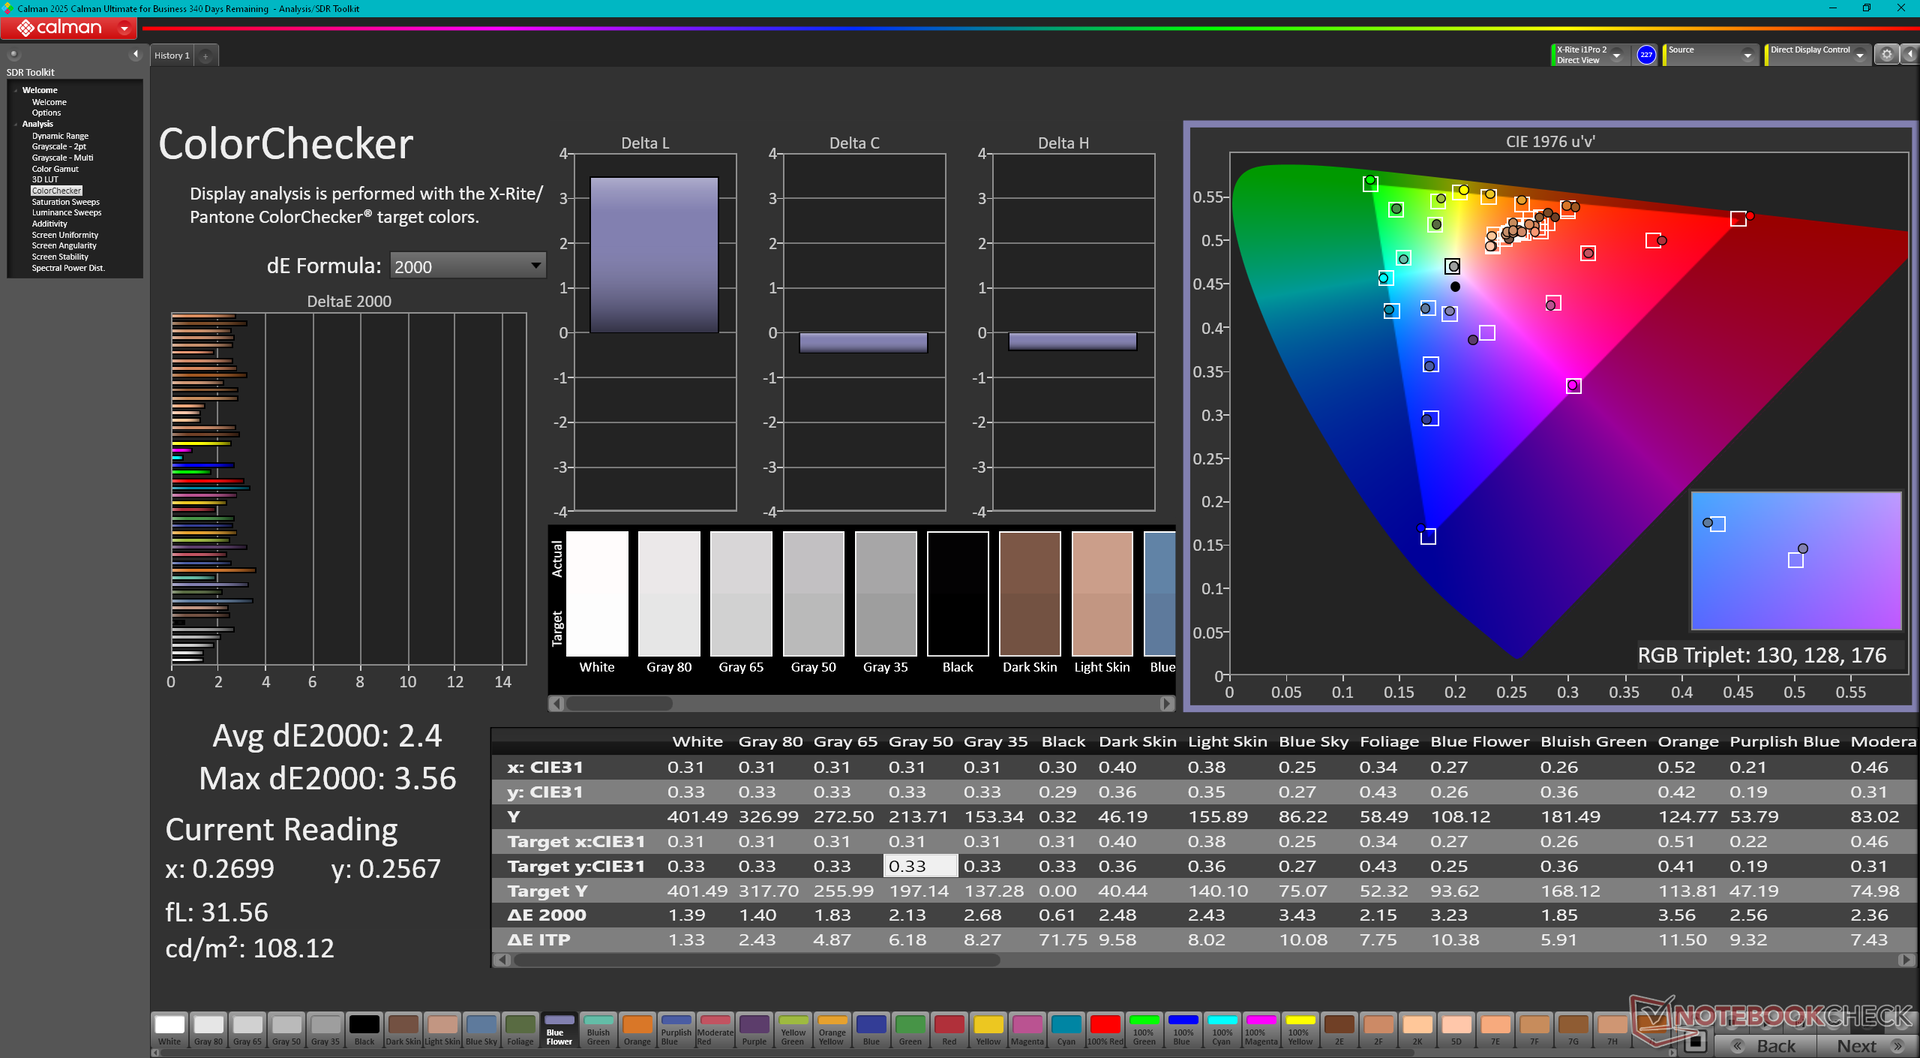
ΔE ColorChecker Calman: 2.4 | ∀{0.5-29.43 Ø4.72}
calibrated: 0.54
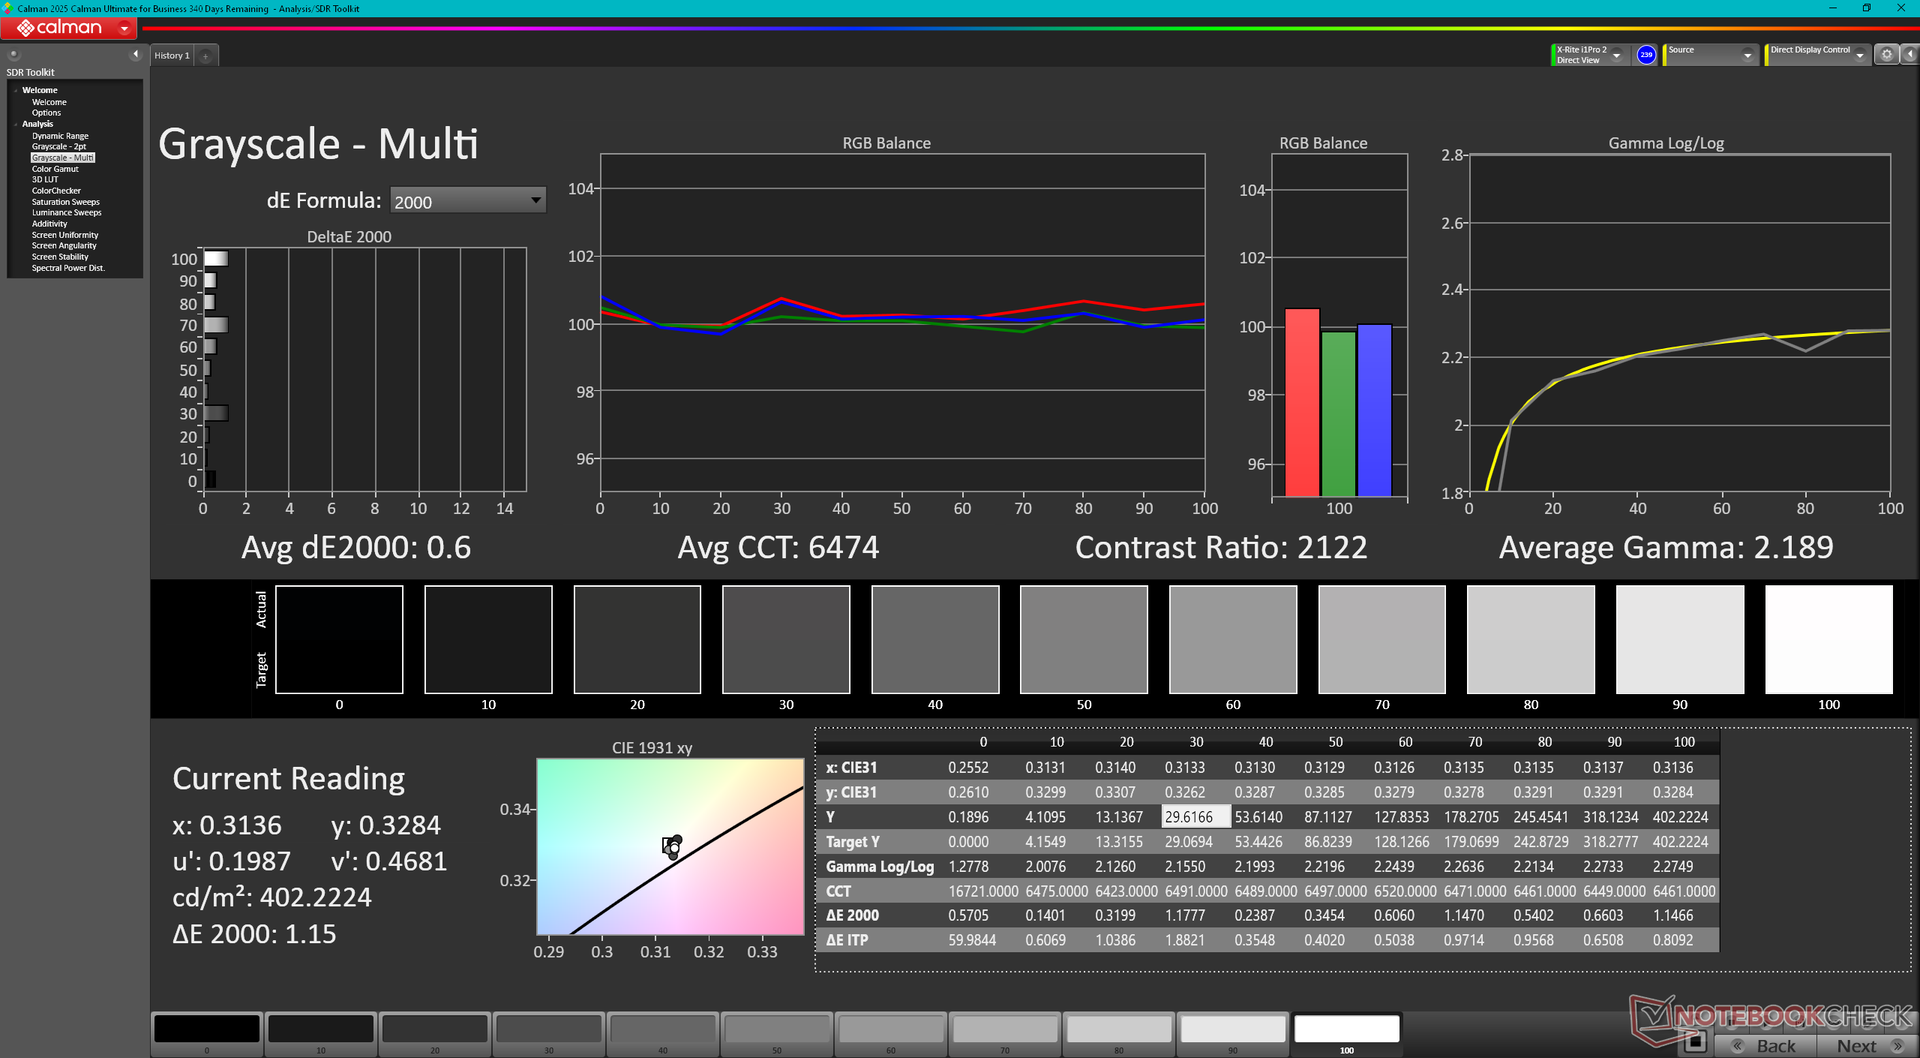
ΔE Greyscale Calman: 1.9 | ∀{0.09-98 Ø4.97}
73.1% AdobeRGB 1998 (Argyll 3D)
98.6% sRGB (Argyll 3D)
71.6% Display P3 (Argyll 3D)
Gamma: 2
CCT: 6503 K
| MSI Summit E13 AI Evo A1MTG CMN13C6, IPS, 1920x1200, 13.3", 60 Hz | MSI Summit E13 Flip Evo A11MT Sharp LQ134N1JW53, IPS, 1920x1200, 13.4", 120 Hz | Lenovo Yoga Book 9 13IMU9 SDC ATNA33AA02-0, OLED, 2880x1800, 13.3", 60 Hz | Lenovo ThinkPad L13 Yoga G4 i7-1355U NV133WUM-N61, IPS, 1920x1200, 13.3", 60 Hz | HP Elite Dragonfly Folio 13.5 G3 Chi Mei CMN13C0, IPS, 1920x1280, 13.5", 60 Hz | Dell Latitude 9330 AU Optronics B133QAA, IPS, 2560x1600, 13.3", 60 Hz | |
|---|---|---|---|---|---|---|
| Display | -2% | 24% | -0% | -3% | 5% | |
| Display P3 Coverage (%) | 71.6 | 69.8 -3% | 99.7 39% | 71.6 0% | 68.3 -5% | 77.8 9% |
| sRGB Coverage (%) | 98.6 | 98.8 0% | 100 1% | 99.8 1% | 98.6 0% | 99.9 1% |
| AdobeRGB 1998 Coverage (%) | 73.1 | 70.6 -3% | 97 33% | 71.9 -2% | 70.2 -4% | 77.5 6% |
| Response Times | -16% | 96% | 52% | -19% | -29% | |
| Response Time Grey 50% / Grey 80% * (ms) | 60 ? | 64 ? -7% | 1.88 ? 97% | 27.3 ? 54% | 66.8 ? -11% | 67.6 ? -13% |
| Response Time Black / White * (ms) | 35.1 ? | 44 ? -25% | 2.1 ? 94% | 17.9 ? 49% | 44.4 ? -26% | 50.4 ? -44% |
| PWM Frequency (Hz) | 60 ? | |||||
| Bildschirm | -3% | -34% | -25% | -6% | -12% | |
| Helligkeit Bildmitte (cd/m²) | 405.2 | 551.3 36% | 362.6 -11% | 278.1 -31% | 369.5 -9% | 542.3 34% |
| Brightness (cd/m²) | 372 | 517 39% | 368 -1% | 280 -25% | 350 -6% | 516 39% |
| Brightness Distribution (%) | 88 | 91 3% | 97 10% | 92 5% | 87 -1% | 85 -3% |
| Schwarzwert * (cd/m²) | 0.34 | 0.37 -9% | 0.34 -0% | 0.24 29% | 0.38 -12% | |
| Kontrast (:1) | 1192 | 1490 25% | 818 -31% | 1540 29% | 1427 20% | |
| Delta E Colorchecker * | 2.4 | 1.45 40% | 4.66 -94% | 2.6 -8% | 2.3 4% | 3.18 -33% |
| Colorchecker dE 2000 max. * | 3.56 | 2.86 20% | 7.25 -104% | 4.81 -35% | 4.34 -22% | 6.05 -70% |
| Colorchecker dE 2000 calibrated * | 0.54 | 1.7 -215% | 0.56 -4% | 0.51 6% | 0.6 -11% | 0.67 -24% |
| Delta E Graustufen * | 1.9 | 1.3 32% | 2.6 -37% | 3.9 -105% | 3.1 -63% | 3.1 -63% |
| Gamma | 2 110% | 2.14 103% | 2.2 100% | 2.29 96% | 2.1 105% | 2.08 106% |
| CCT | 6503 100% | 6580 99% | 6055 107% | 5877 111% | 6248 104% | 6140 106% |
| Farbraum (Prozent von AdobeRGB 1998) (%) | 65 | |||||
| Color Space (Percent of sRGB) (%) | 99 | |||||
| Durchschnitt gesamt (Programm / Settings) | -7% /
-5% | 29% /
2% | 9% /
-9% | -9% /
-7% | -12% /
-11% |
* ... kleinere Werte sind besser

Das Display ist zwar anständig kalibriert ab Werk, aber unsere eigene X-Rite-Kalibrierung würde die Farben noch weiter verbessern. Die durchschnittlichen Graustufen- und Farb-DeltaE-Werte können bis zu 0,6 bzw. 0,54 betragen.


Reaktionszeiten (Response Times) des Displays
| ↔ Reaktionszeiten Schwarz zu Weiß | ||
|---|---|---|
| 35.1 ms ... steigend ↗ und fallend ↘ kombiniert | ↗ 17 ms steigend | 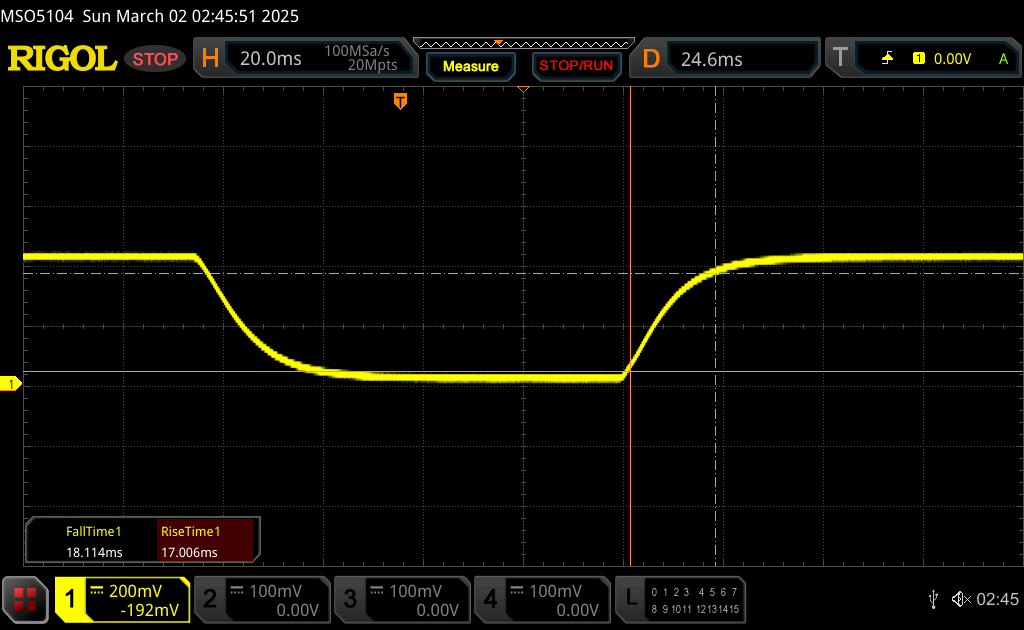 |
| ↘ 18.1 ms fallend | ||
| Die gemessenen Reaktionszeiten sind langsam und dadurch für viele Spieler wahrscheinlich zu langsam. Im Vergleich rangierten die bei uns getesteten Geräte von 0.1 (Minimum) zu 240 (Maximum) ms. » 93 % aller Screens waren schneller als der getestete. Daher sind die gemessenen Reaktionszeiten schlechter als der Durchschnitt aller vermessenen Geräte (19.8 ms). | ||
| ↔ Reaktionszeiten 50% Grau zu 80% Grau | ||
| 60 ms ... steigend ↗ und fallend ↘ kombiniert | ↗ 27.2 ms steigend | 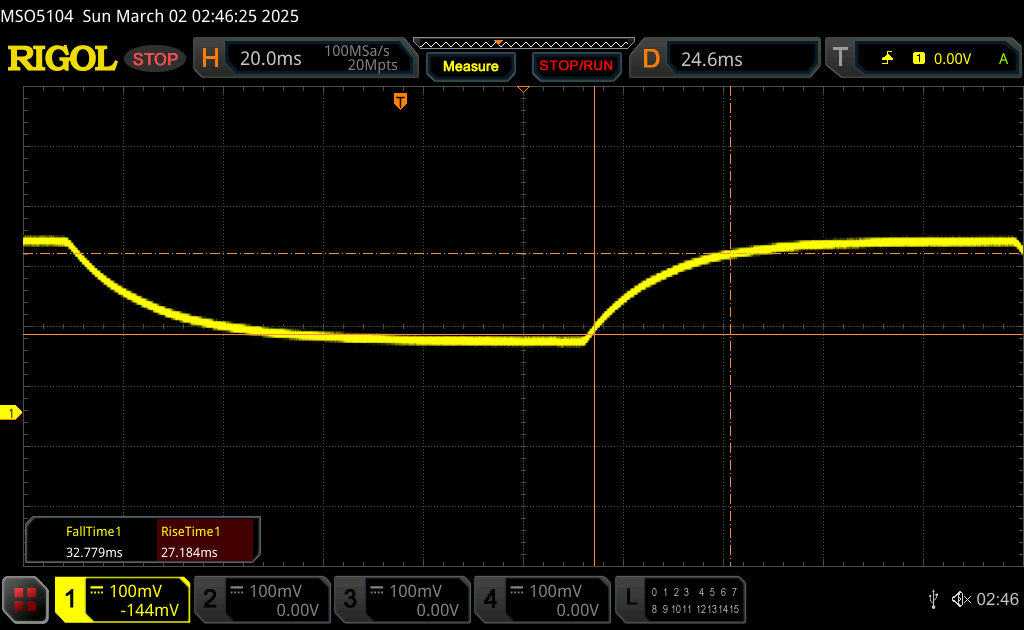 |
| ↘ 32.8 ms fallend | ||
| Die gemessenen Reaktionszeiten sind langsam und dadurch für viele Spieler wahrscheinlich zu langsam. Im Vergleich rangierten die bei uns getesteten Geräte von 0.165 (Minimum) zu 636 (Maximum) ms. » 96 % aller Screens waren schneller als der getestete. Daher sind die gemessenen Reaktionszeiten schlechter als der Durchschnitt aller vermessenen Geräte (31 ms). | ||
Bildschirm-Flackern / PWM (Pulse-Width Modulation)
| Flackern / PWM nicht festgestellt | 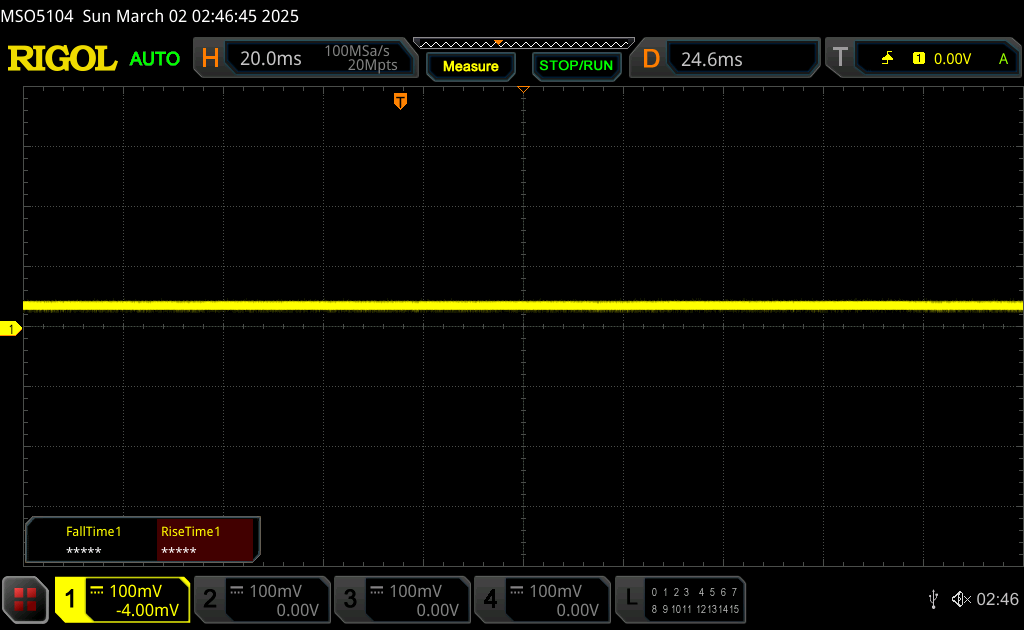 | ||
Im Vergleich: 52 % aller getesteten Geräte nutzten kein PWM um die Helligkeit zu reduzieren. Wenn PWM eingesetzt wurde, dann bei einer Frequenz von durchschnittlich 7772 (Minimum 5, Maximum 343500) Hz. | |||
Performance - Core Ultra-H ist zu viel des Guten

Testbedingungen
Wir haben Windows auf den Modus Performance und das MSI Center auf den Modus Extreme Performance eingestellt, bevor wir die folgenden Benchmarks durchgeführt haben.
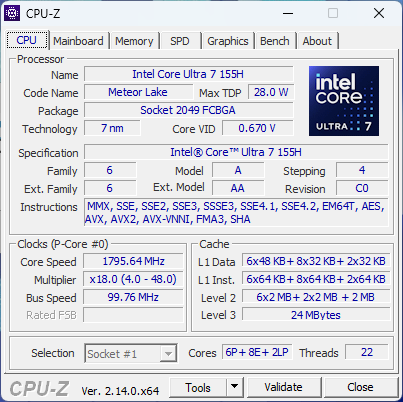
Prozessor
Die rohe Multi-Thread-CPU-Leistung fiel bereits nach der ersten Schleife unseres CineBench-R15-xT-Stresstests um über 20 Prozent. Folglich arbeitet unser System etwa 20 Prozent langsamer als der durchschnittliche Laptop in unserer Datenbank, der mit dem gleichen Core-Ultra-7-155H-Prozessor ausgestattet ist.
Cinebench R15 Multi Loop
Cinebench R23: Multi Core | Single Core
Cinebench R20: CPU (Multi Core) | CPU (Single Core)
Cinebench R15: CPU Multi 64Bit | CPU Single 64Bit
Blender: v2.79 BMW27 CPU
7-Zip 18.03: 7z b 4 | 7z b 4 -mmt1
Geekbench 6.7: Multi-Core | Single-Core
Geekbench 5.5: Multi-Core | Single-Core
HWBOT x265 Benchmark v2.2: 4k Preset
LibreOffice : 20 Documents To PDF
R Benchmark 2.5: Overall mean
| CPU Performance Rating | |
| Asus ROG Flow Z13 GZ302EA-RU073W | |
| Framework Laptop 13.5 Ryzen 7 7840U | |
| Durchschnittliche Intel Core Ultra 7 155H | |
| MSI Prestige 13 AI Plus Evo A2VMG | |
| MSI Summit E13 AI Evo A1MTG | |
| Dell XPS 13 Plus 9320 4K -2! | |
| Lenovo Yoga Book 9 13IMU9 | |
| Lenovo ThinkPad L13 Yoga G4 i7-1355U | |
| HP Elite Dragonfly Folio 13.5 G3 -2! | |
| Lenovo ThinkPad X13 G3 21BN0046GE -2! | |
| Dell Latitude 9330 -2! | |
| MSI Summit E13 Flip Evo A11MT -2! | |
| Geekbench 6.7 / Multi-Core | |
| Asus ROG Flow Z13 GZ302EA-RU073W | |
| Durchschnittliche Intel Core Ultra 7 155H (7732 - 13656, n=55) | |
| Framework Laptop 13.5 Ryzen 7 7840U | |
| MSI Prestige 13 AI Plus Evo A2VMG | |
| MSI Summit E13 AI Evo A1MTG | |
| Lenovo Yoga Book 9 13IMU9 | |
| Lenovo ThinkPad L13 Yoga G4 i7-1355U | |
| Geekbench 6.7 / Single-Core | |
| Asus ROG Flow Z13 GZ302EA-RU073W | |
| MSI Prestige 13 AI Plus Evo A2VMG | |
| Framework Laptop 13.5 Ryzen 7 7840U | |
| Lenovo ThinkPad L13 Yoga G4 i7-1355U | |
| Durchschnittliche Intel Core Ultra 7 155H (1901 - 2473, n=52) | |
| Lenovo Yoga Book 9 13IMU9 | |
| MSI Summit E13 AI Evo A1MTG | |
* ... kleinere Werte sind besser
AIDA64: FP32 Ray-Trace | FPU Julia | CPU SHA3 | CPU Queen | FPU SinJulia | FPU Mandel | CPU AES | CPU ZLib | FP64 Ray-Trace | CPU PhotoWorxx
| Performance Rating | |
| Durchschnittliche Intel Core Ultra 7 155H | |
| MSI Summit E13 AI Evo A1MTG | |
| Lenovo Yoga Book 9 13IMU9 | |
| MSI Summit E13 Flip Evo A11MT | |
| HP Elite Dragonfly Folio 13.5 G3 | |
| Lenovo ThinkPad L13 Yoga G4 i7-1355U | |
| Dell Latitude 9330 | |
| AIDA64 / FP32 Ray-Trace | |
| Durchschnittliche Intel Core Ultra 7 155H (6670 - 18470, n=50) | |
| MSI Summit E13 AI Evo A1MTG | |
| Lenovo Yoga Book 9 13IMU9 | |
| MSI Summit E13 Flip Evo A11MT | |
| Dell Latitude 9330 | |
| HP Elite Dragonfly Folio 13.5 G3 | |
| Lenovo ThinkPad L13 Yoga G4 i7-1355U | |
| AIDA64 / FPU Julia | |
| Durchschnittliche Intel Core Ultra 7 155H (40905 - 93181, n=50) | |
| MSI Summit E13 AI Evo A1MTG | |
| Lenovo Yoga Book 9 13IMU9 | |
| HP Elite Dragonfly Folio 13.5 G3 | |
| Dell Latitude 9330 | |
| Lenovo ThinkPad L13 Yoga G4 i7-1355U | |
| MSI Summit E13 Flip Evo A11MT | |
| AIDA64 / CPU SHA3 | |
| Durchschnittliche Intel Core Ultra 7 155H (1940 - 4436, n=50) | |
| MSI Summit E13 AI Evo A1MTG | |
| Lenovo Yoga Book 9 13IMU9 | |
| MSI Summit E13 Flip Evo A11MT | |
| Dell Latitude 9330 | |
| Lenovo ThinkPad L13 Yoga G4 i7-1355U | |
| HP Elite Dragonfly Folio 13.5 G3 | |
| AIDA64 / CPU Queen | |
| Durchschnittliche Intel Core Ultra 7 155H (64698 - 94181, n=50) | |
| MSI Summit E13 AI Evo A1MTG | |
| HP Elite Dragonfly Folio 13.5 G3 | |
| Lenovo ThinkPad L13 Yoga G4 i7-1355U | |
| MSI Summit E13 Flip Evo A11MT | |
| Dell Latitude 9330 | |
| Lenovo Yoga Book 9 13IMU9 | |
| AIDA64 / FPU SinJulia | |
| Durchschnittliche Intel Core Ultra 7 155H (5639 - 10647, n=50) | |
| MSI Summit E13 AI Evo A1MTG | |
| Lenovo Yoga Book 9 13IMU9 | |
| MSI Summit E13 Flip Evo A11MT | |
| HP Elite Dragonfly Folio 13.5 G3 | |
| Lenovo ThinkPad L13 Yoga G4 i7-1355U | |
| Dell Latitude 9330 | |
| AIDA64 / FPU Mandel | |
| Durchschnittliche Intel Core Ultra 7 155H (18236 - 47685, n=50) | |
| MSI Summit E13 AI Evo A1MTG | |
| Lenovo Yoga Book 9 13IMU9 | |
| MSI Summit E13 Flip Evo A11MT | |
| HP Elite Dragonfly Folio 13.5 G3 | |
| Dell Latitude 9330 | |
| Lenovo ThinkPad L13 Yoga G4 i7-1355U | |
| AIDA64 / CPU AES | |
| Durchschnittliche Intel Core Ultra 7 155H (45713 - 152179, n=50) | |
| MSI Summit E13 Flip Evo A11MT | |
| MSI Summit E13 AI Evo A1MTG | |
| Lenovo Yoga Book 9 13IMU9 | |
| HP Elite Dragonfly Folio 13.5 G3 | |
| Lenovo ThinkPad L13 Yoga G4 i7-1355U | |
| Dell Latitude 9330 | |
| AIDA64 / CPU ZLib | |
| Durchschnittliche Intel Core Ultra 7 155H (557 - 1250, n=50) | |
| MSI Summit E13 AI Evo A1MTG | |
| Lenovo Yoga Book 9 13IMU9 | |
| HP Elite Dragonfly Folio 13.5 G3 | |
| Lenovo ThinkPad L13 Yoga G4 i7-1355U | |
| Dell Latitude 9330 | |
| MSI Summit E13 Flip Evo A11MT | |
| AIDA64 / FP64 Ray-Trace | |
| Durchschnittliche Intel Core Ultra 7 155H (3569 - 9802, n=50) | |
| MSI Summit E13 AI Evo A1MTG | |
| Lenovo Yoga Book 9 13IMU9 | |
| MSI Summit E13 Flip Evo A11MT | |
| Dell Latitude 9330 | |
| HP Elite Dragonfly Folio 13.5 G3 | |
| Lenovo ThinkPad L13 Yoga G4 i7-1355U | |
| AIDA64 / CPU PhotoWorxx | |
| Durchschnittliche Intel Core Ultra 7 155H (32719 - 54223, n=50) | |
| Lenovo Yoga Book 9 13IMU9 | |
| HP Elite Dragonfly Folio 13.5 G3 | |
| MSI Summit E13 AI Evo A1MTG | |
| MSI Summit E13 Flip Evo A11MT | |
| Dell Latitude 9330 | |
| Lenovo ThinkPad L13 Yoga G4 i7-1355U | |
Stresstest

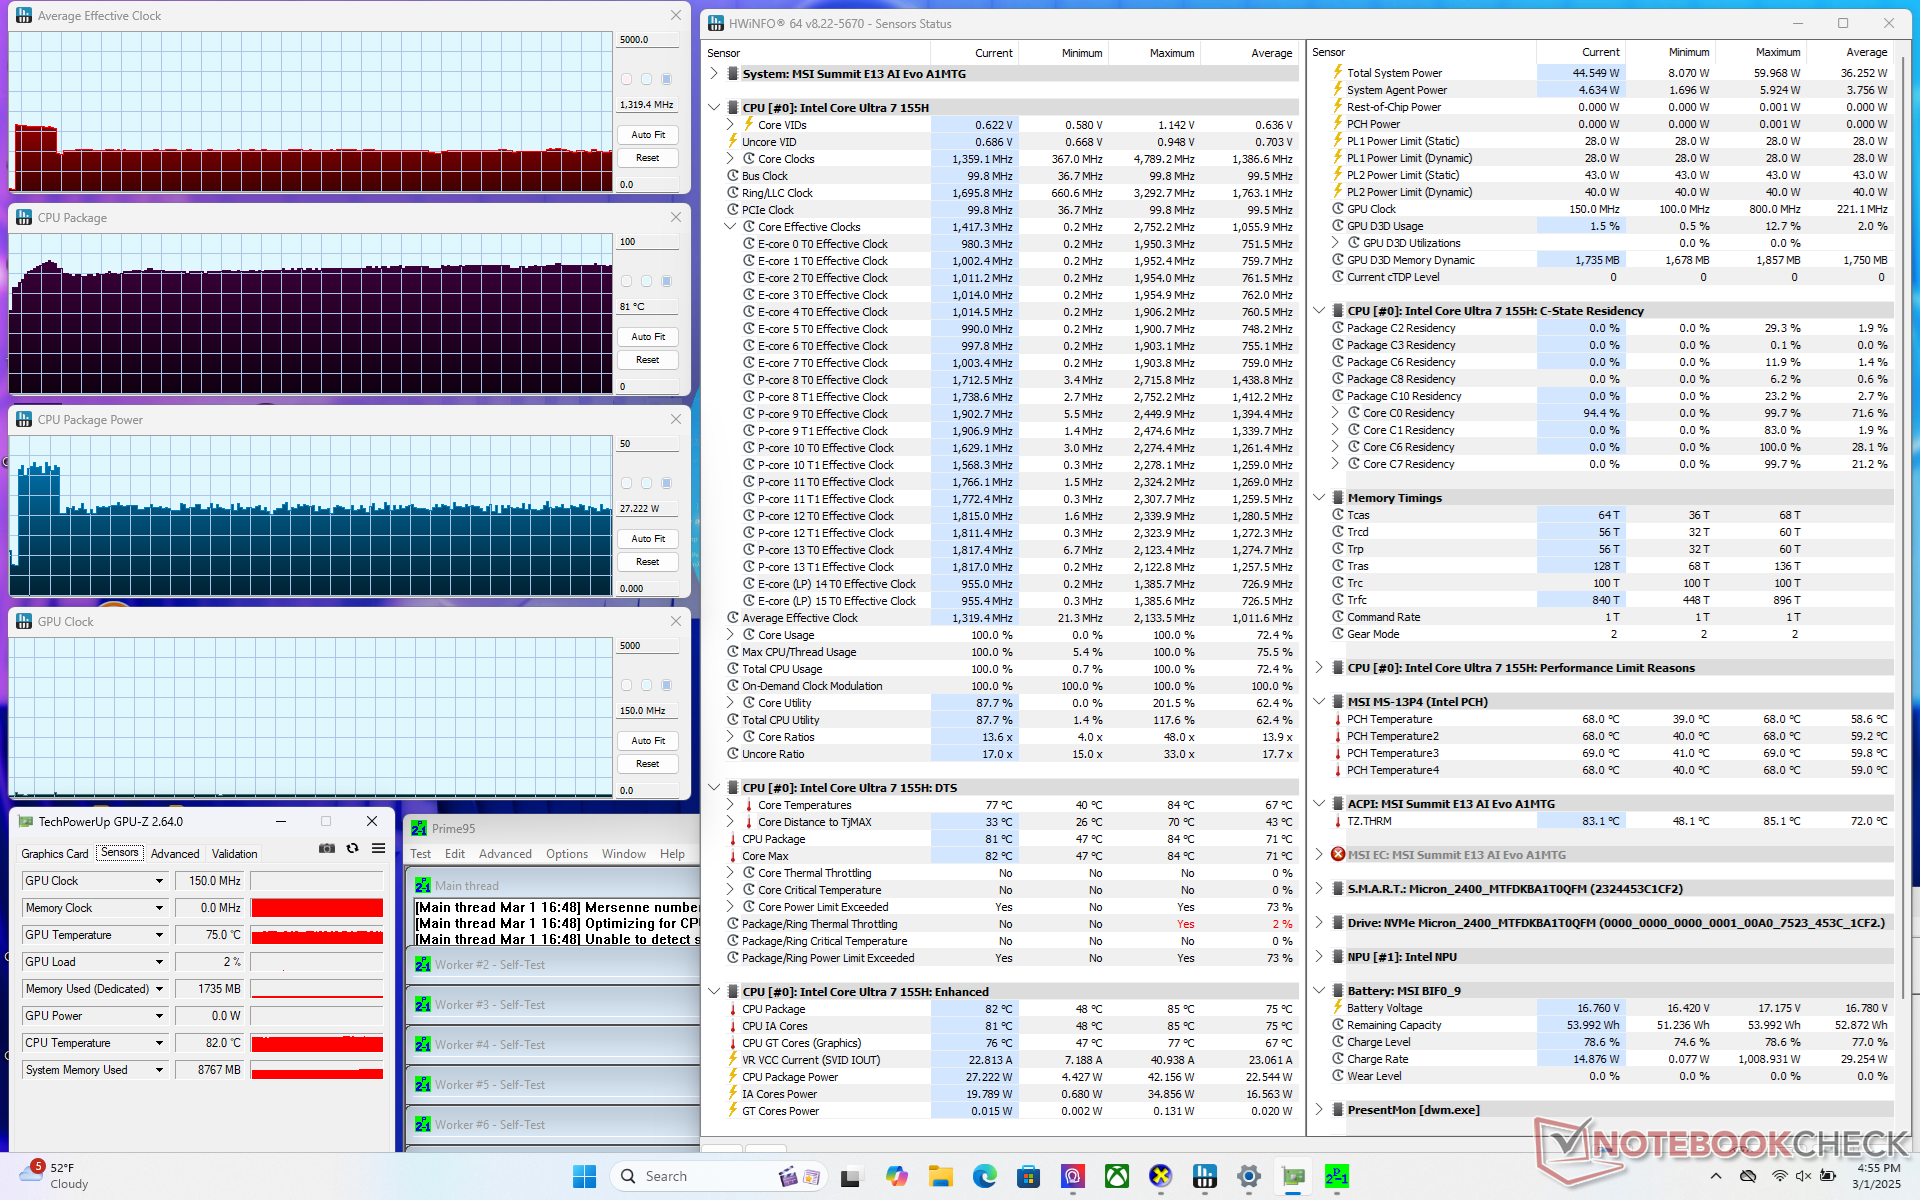
Bei der Ausführung von Prime95 wurde die CPU auf 2,1 GHz und 41 W hochgefahren, bis sie einige Augenblicke später eine Kerntemperatur von 84 °C erreichte. Danach stabilisiert er sich bei 1,3 GHz und 28 W, um eine Kerntemperatur von 81 °C zu halten, wenn der Cooler Boost aktiviert ist. Ist er deaktiviert, steigt die Kerntemperatur nur um wenige Grad.
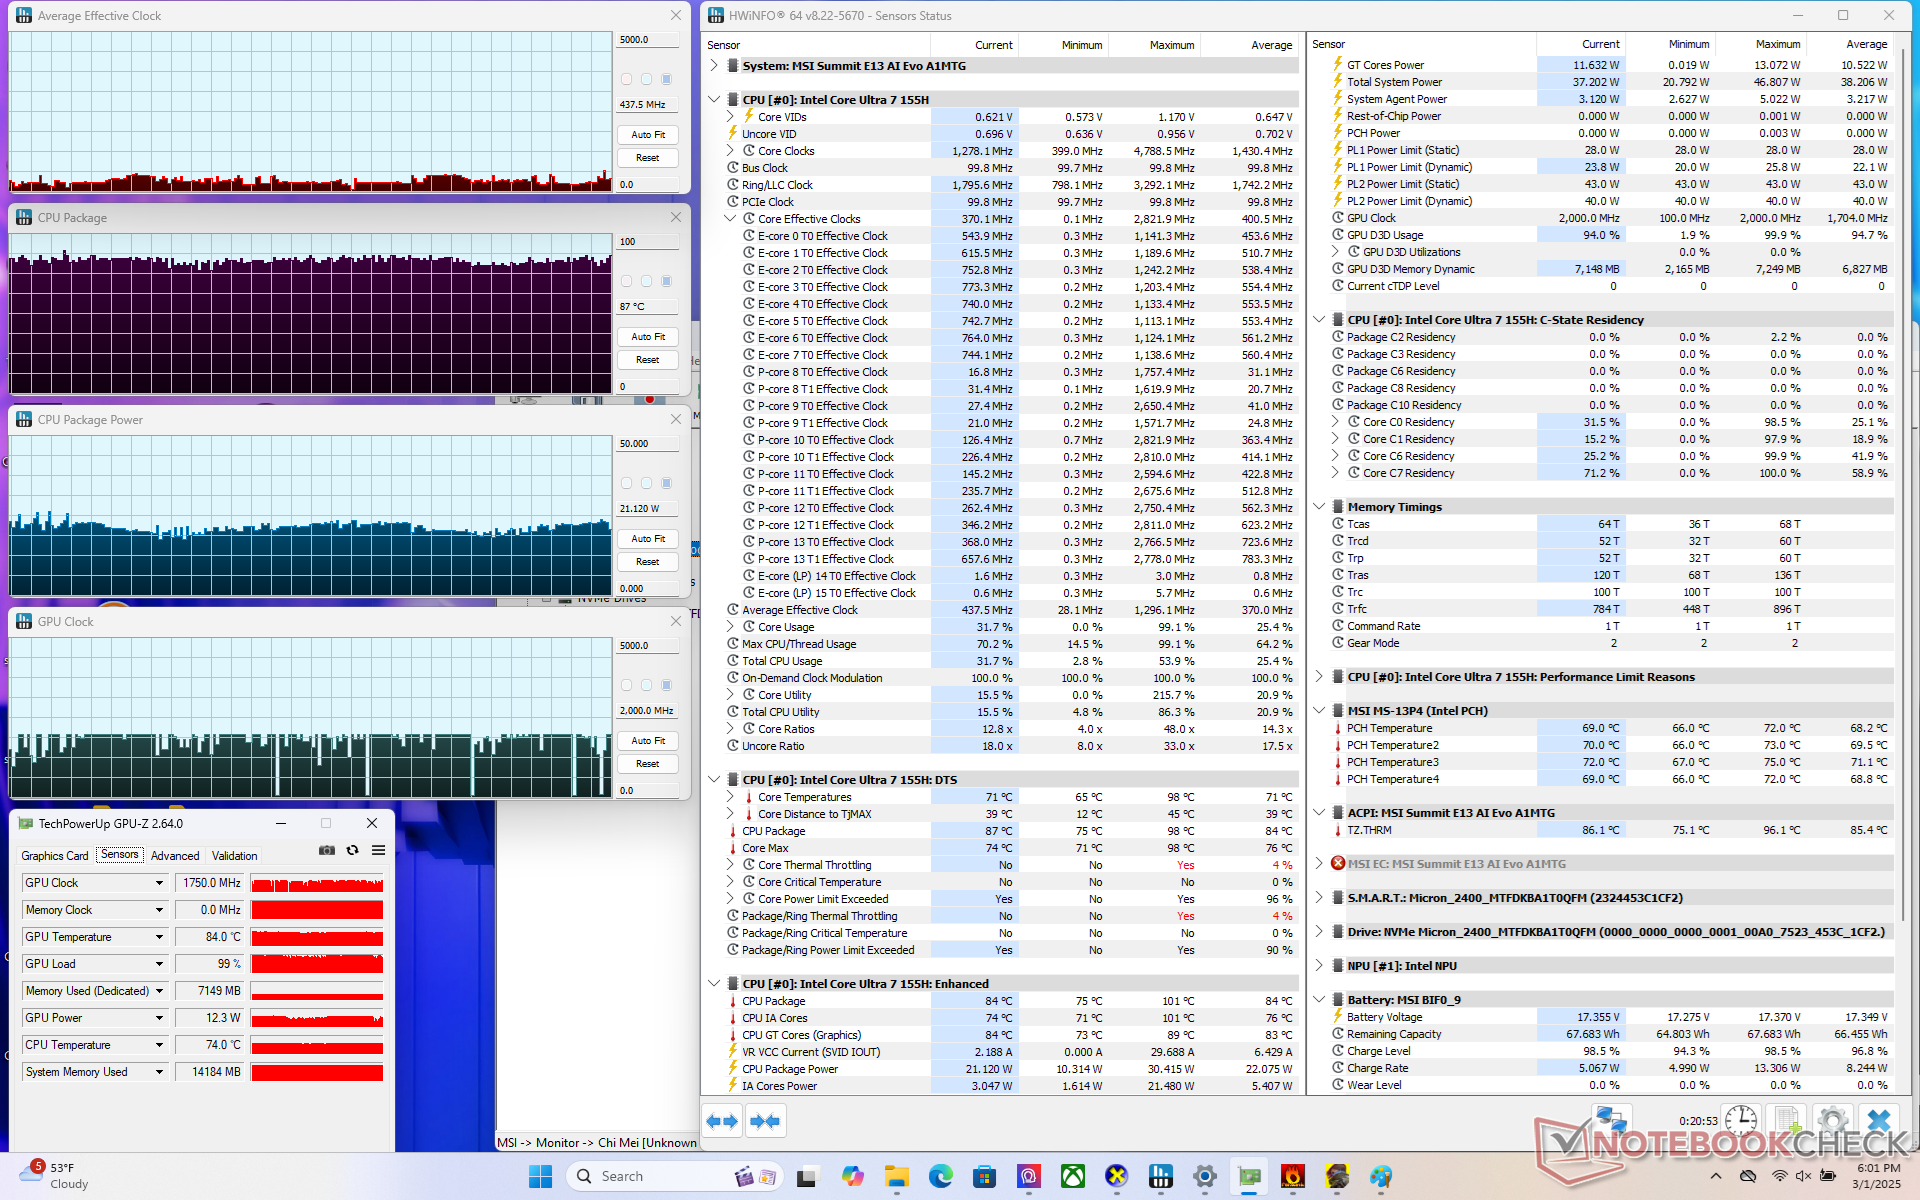
Bei der Ausführung von Cyberpunk 2077 ist die GPU-Taktrate relativ unstetig, wie der Screenshot unten zeigt, selbst wenn das Spiel im Leerlauf lief. Dies spiegelt die instabilen Bildraten wider, wie im Abschnitt GPU-Performance unten beschrieben. Die Kerntemperatur war mit 87 °C ebenfalls sehr hoch und damit über 10 °C wärmer als beim 2021er Modell.
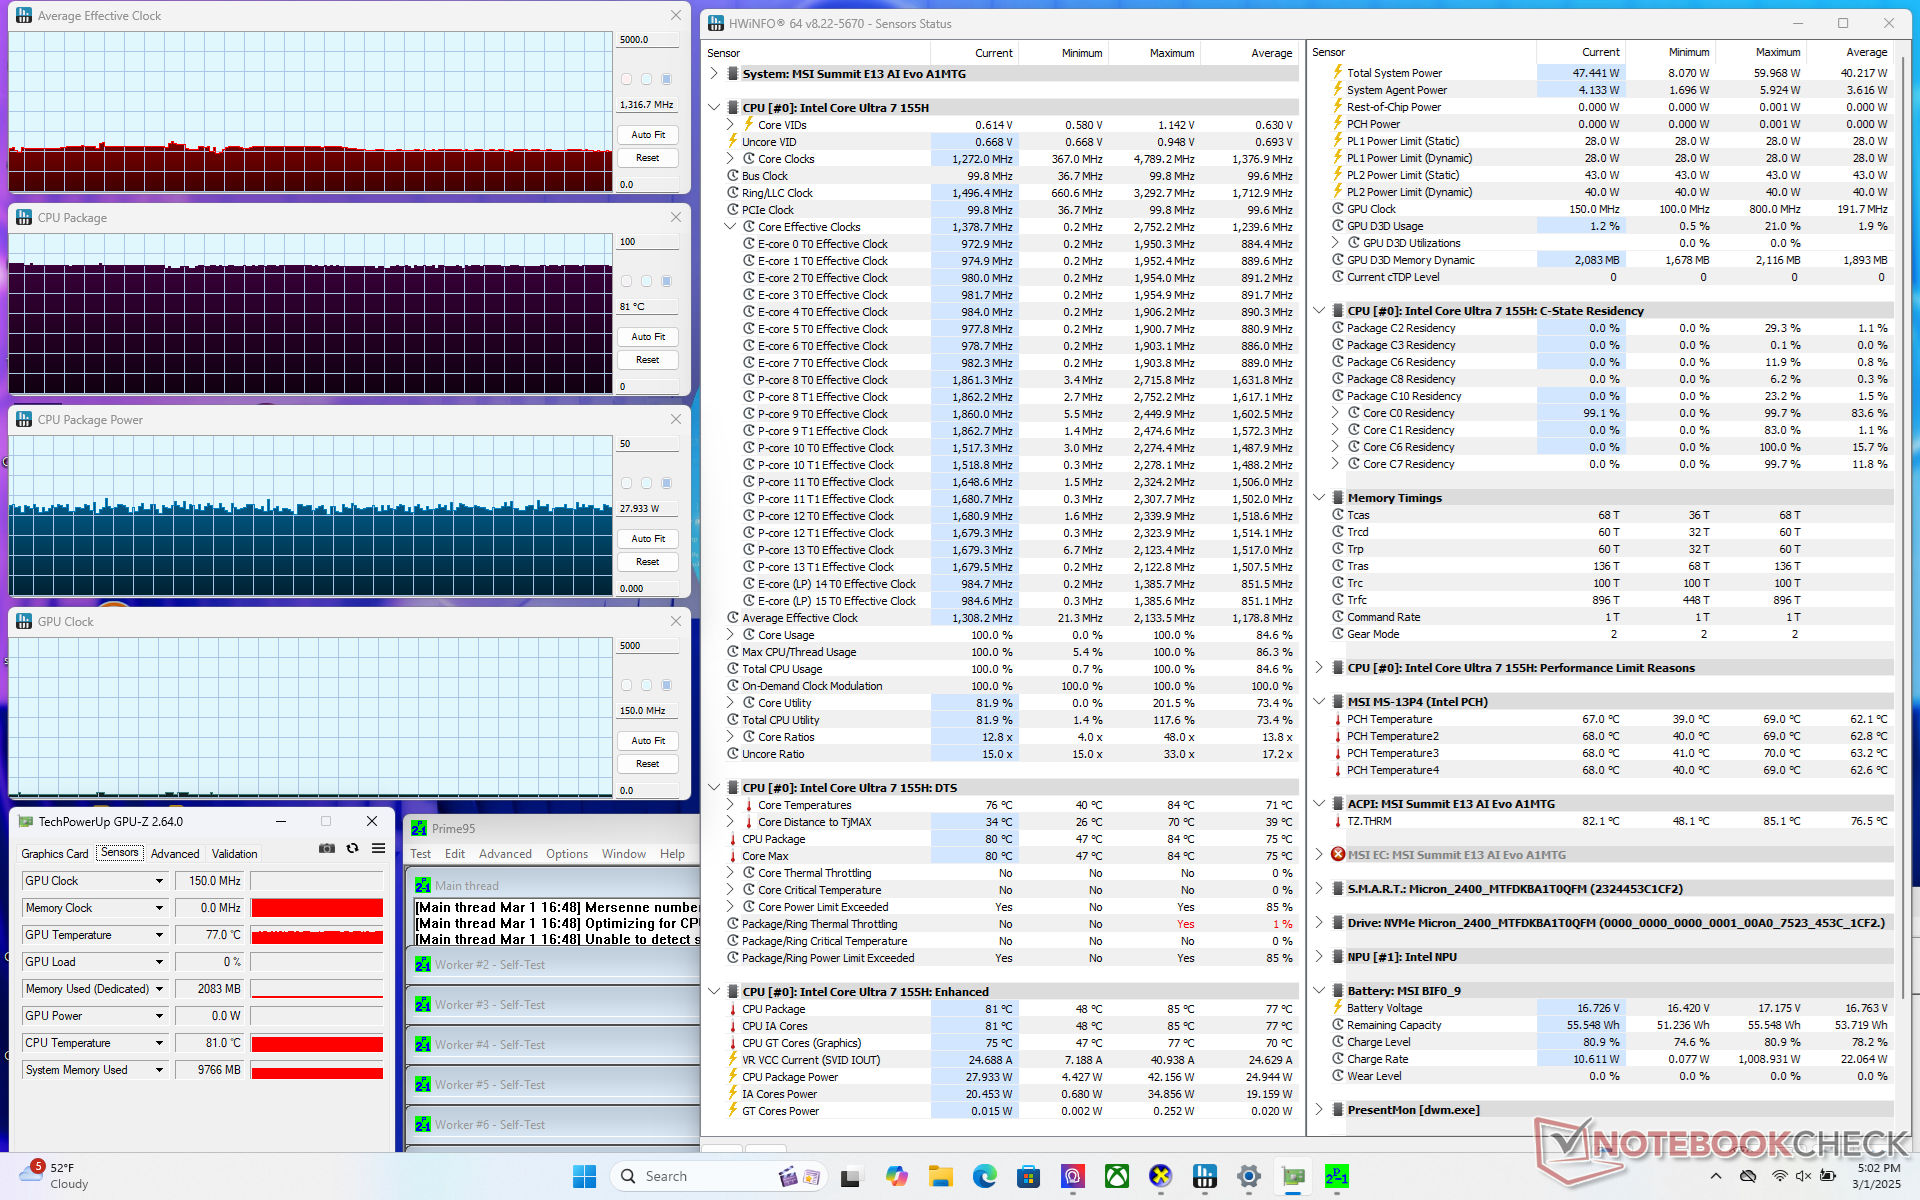

| durchschnittlicher CPU-Takt (GHz) | GPU-Takt (MHz) | durchschnittliche CPU-Temperatur (°C) | |
| System Leerlauf | -- | -- | 48 |
| Prime95 Stress (Cooler Boost an) | 1,3 | -- | 81 |
| Prime95 Stress (Cooler Boost aus) | 1,3 | -- | 81 |
| Prime95 + FurMark Stress | 0,6 | 1.050 | 82 |
| Cyberpunk 2077 Stress | 0,4 | ~2.000 | 87 |
System Performance
CrossMark: Overall | Productivity | Creativity | Responsiveness
WebXPRT 3: Overall
WebXPRT 4: Overall
Mozilla Kraken 1.1: Total
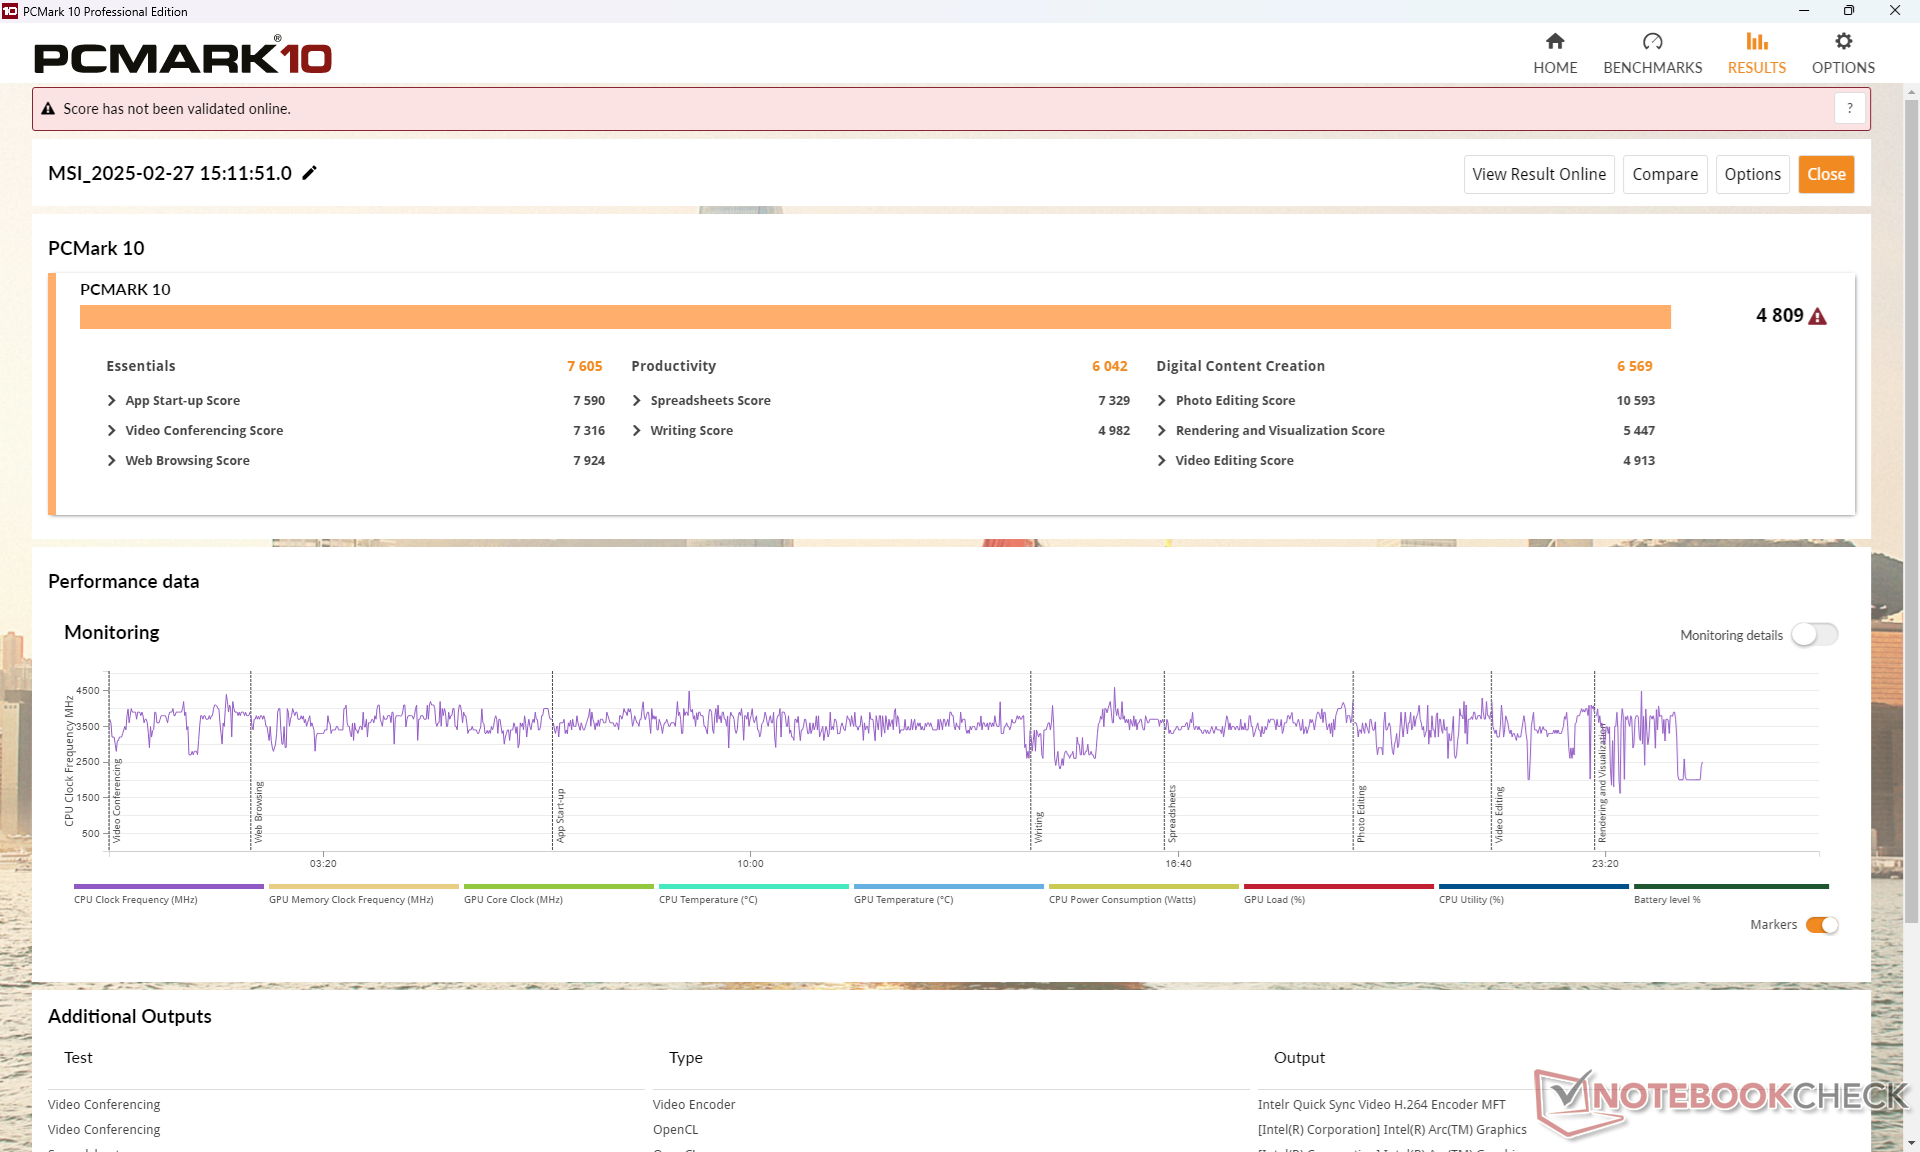
| PCMark 10 / Score | |
| Durchschnittliche Intel Core Ultra 7 155H, Intel Arc 8-Core iGPU (4809 - 7529, n=34) | |
| Lenovo Yoga Book 9 13IMU9 | |
| Lenovo ThinkPad L13 Yoga G4 i7-1355U | |
| HP Elite Dragonfly Folio 13.5 G3 | |
| Dell Latitude 9330 | |
| MSI Summit E13 AI Evo A1MTG | |
| MSI Summit E13 Flip Evo A11MT | |
| PCMark 10 / Essentials | |
| HP Elite Dragonfly Folio 13.5 G3 | |
| Lenovo ThinkPad L13 Yoga G4 i7-1355U | |
| Lenovo Yoga Book 9 13IMU9 | |
| Durchschnittliche Intel Core Ultra 7 155H, Intel Arc 8-Core iGPU (7605 - 11289, n=34) | |
| Dell Latitude 9330 | |
| MSI Summit E13 Flip Evo A11MT | |
| MSI Summit E13 AI Evo A1MTG | |
| PCMark 10 / Productivity | |
| Durchschnittliche Intel Core Ultra 7 155H, Intel Arc 8-Core iGPU (6042 - 10591, n=34) | |
| Lenovo Yoga Book 9 13IMU9 | |
| Lenovo ThinkPad L13 Yoga G4 i7-1355U | |
| HP Elite Dragonfly Folio 13.5 G3 | |
| Dell Latitude 9330 | |
| MSI Summit E13 Flip Evo A11MT | |
| MSI Summit E13 AI Evo A1MTG | |
| PCMark 10 / Digital Content Creation | |
| Durchschnittliche Intel Core Ultra 7 155H, Intel Arc 8-Core iGPU (4985 - 10709, n=34) | |
| Lenovo Yoga Book 9 13IMU9 | |
| MSI Summit E13 AI Evo A1MTG | |
| Lenovo ThinkPad L13 Yoga G4 i7-1355U | |
| HP Elite Dragonfly Folio 13.5 G3 | |
| Dell Latitude 9330 | |
| MSI Summit E13 Flip Evo A11MT | |
| CrossMark / Overall | |
| Durchschnittliche Intel Core Ultra 7 155H, Intel Arc 8-Core iGPU (1366 - 1903, n=34) | |
| MSI Summit E13 AI Evo A1MTG | |
| HP Elite Dragonfly Folio 13.5 G3 | |
| Lenovo ThinkPad L13 Yoga G4 i7-1355U | |
| Lenovo Yoga Book 9 13IMU9 | |
| CrossMark / Productivity | |
| Durchschnittliche Intel Core Ultra 7 155H, Intel Arc 8-Core iGPU (1291 - 1798, n=33) | |
| HP Elite Dragonfly Folio 13.5 G3 | |
| MSI Summit E13 AI Evo A1MTG | |
| Lenovo ThinkPad L13 Yoga G4 i7-1355U | |
| Lenovo Yoga Book 9 13IMU9 | |
| CrossMark / Creativity | |
| Durchschnittliche Intel Core Ultra 7 155H, Intel Arc 8-Core iGPU (1519 - 1929, n=33) | |
| MSI Summit E13 AI Evo A1MTG | |
| HP Elite Dragonfly Folio 13.5 G3 | |
| Lenovo ThinkPad L13 Yoga G4 i7-1355U | |
| Lenovo Yoga Book 9 13IMU9 | |
| CrossMark / Responsiveness | |
| HP Elite Dragonfly Folio 13.5 G3 | |
| MSI Summit E13 AI Evo A1MTG | |
| Durchschnittliche Intel Core Ultra 7 155H, Intel Arc 8-Core iGPU (939 - 1802, n=33) | |
| Lenovo Yoga Book 9 13IMU9 | |
| Lenovo ThinkPad L13 Yoga G4 i7-1355U | |
| WebXPRT 3 / Overall | |
| Lenovo ThinkPad L13 Yoga G4 i7-1355U | |
| HP Elite Dragonfly Folio 13.5 G3 | |
| MSI Summit E13 AI Evo A1MTG | |
| Durchschnittliche Intel Core Ultra 7 155H, Intel Arc 8-Core iGPU (252 - 299, n=34) | |
| Lenovo Yoga Book 9 13IMU9 | |
| MSI Summit E13 Flip Evo A11MT | |
| Dell Latitude 9330 | |
| WebXPRT 4 / Overall | |
| Lenovo ThinkPad L13 Yoga G4 i7-1355U | |
| Durchschnittliche Intel Core Ultra 7 155H, Intel Arc 8-Core iGPU (166.4 - 309, n=29) | |
| Lenovo Yoga Book 9 13IMU9 | |
| HP Elite Dragonfly Folio 13.5 G3 | |
| Dell Latitude 9330 | |
| MSI Summit E13 AI Evo A1MTG | |
| Mozilla Kraken 1.1 / Total | |
| MSI Summit E13 Flip Evo A11MT | |
| Dell Latitude 9330 | |
| HP Elite Dragonfly Folio 13.5 G3 | |
| Lenovo Yoga Book 9 13IMU9 | |
| MSI Summit E13 AI Evo A1MTG | |
| Durchschnittliche Intel Core Ultra 7 155H, Intel Arc 8-Core iGPU (517 - 614, n=35) | |
| Lenovo ThinkPad L13 Yoga G4 i7-1355U | |
* ... kleinere Werte sind besser
| PCMark 10 Score | 4809 Punkte | |
Hilfe | ||
| AIDA64 / Memory Copy | |
| Durchschnittliche Intel Core Ultra 7 155H (62397 - 96791, n=50) | |
| Lenovo Yoga Book 9 13IMU9 | |
| MSI Summit E13 AI Evo A1MTG | |
| Dell Latitude 9330 | |
| HP Elite Dragonfly Folio 13.5 G3 | |
| Lenovo ThinkPad L13 Yoga G4 i7-1355U | |
| MSI Summit E13 Flip Evo A11MT | |
| AIDA64 / Memory Read | |
| Durchschnittliche Intel Core Ultra 7 155H (60544 - 90647, n=50) | |
| MSI Summit E13 AI Evo A1MTG | |
| HP Elite Dragonfly Folio 13.5 G3 | |
| Lenovo Yoga Book 9 13IMU9 | |
| Dell Latitude 9330 | |
| MSI Summit E13 Flip Evo A11MT | |
| Lenovo ThinkPad L13 Yoga G4 i7-1355U | |
| AIDA64 / Memory Write | |
| HP Elite Dragonfly Folio 13.5 G3 | |
| MSI Summit E13 AI Evo A1MTG | |
| Durchschnittliche Intel Core Ultra 7 155H (58692 - 93451, n=50) | |
| Lenovo ThinkPad L13 Yoga G4 i7-1355U | |
| Dell Latitude 9330 | |
| Lenovo Yoga Book 9 13IMU9 | |
| MSI Summit E13 Flip Evo A11MT | |
| AIDA64 / Memory Latency | |
| Lenovo Yoga Book 9 13IMU9 | |
| Durchschnittliche Intel Core Ultra 7 155H (116.2 - 233, n=50) | |
| MSI Summit E13 AI Evo A1MTG | |
| HP Elite Dragonfly Folio 13.5 G3 | |
| Dell Latitude 9330 | |
| Lenovo ThinkPad L13 Yoga G4 i7-1355U | |
| MSI Summit E13 Flip Evo A11MT | |
* ... kleinere Werte sind besser
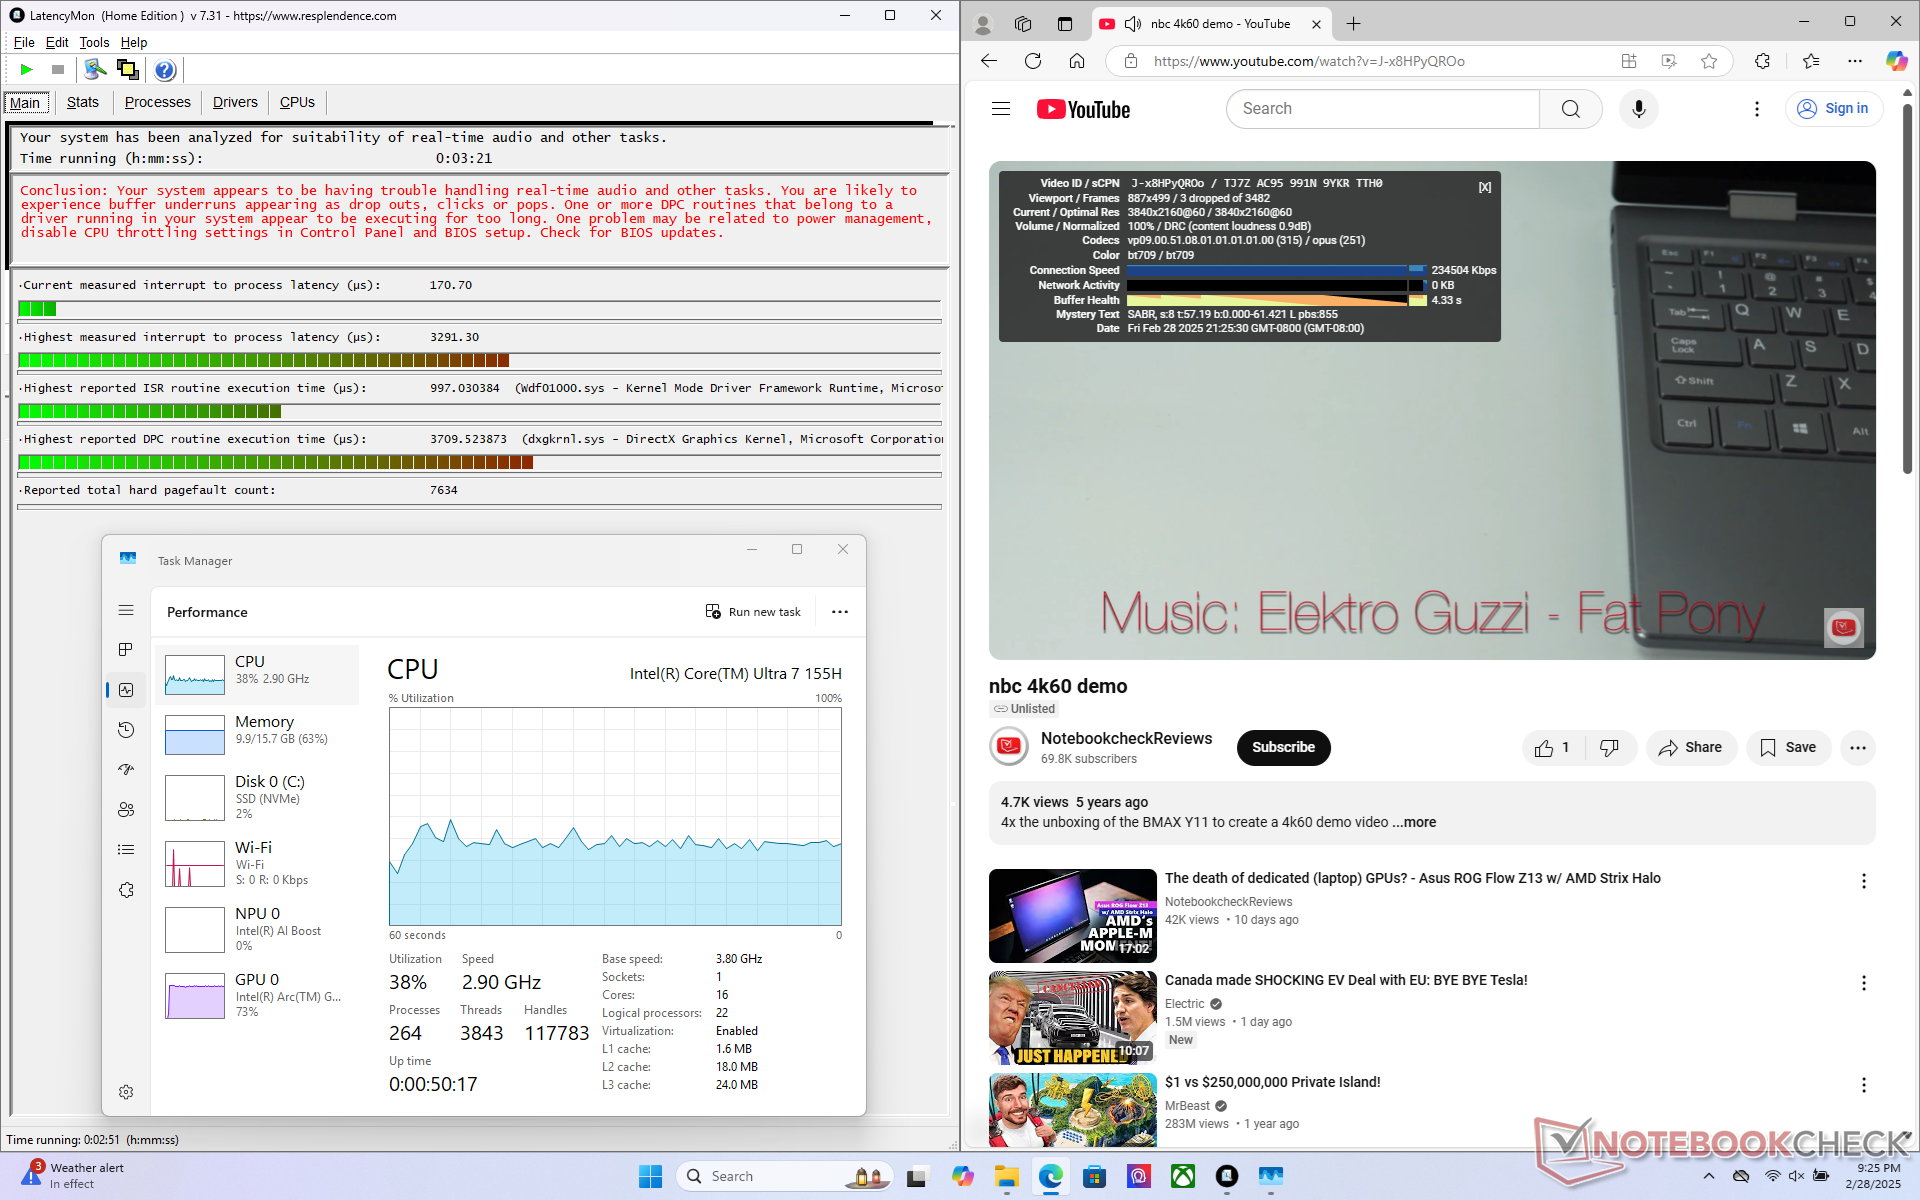
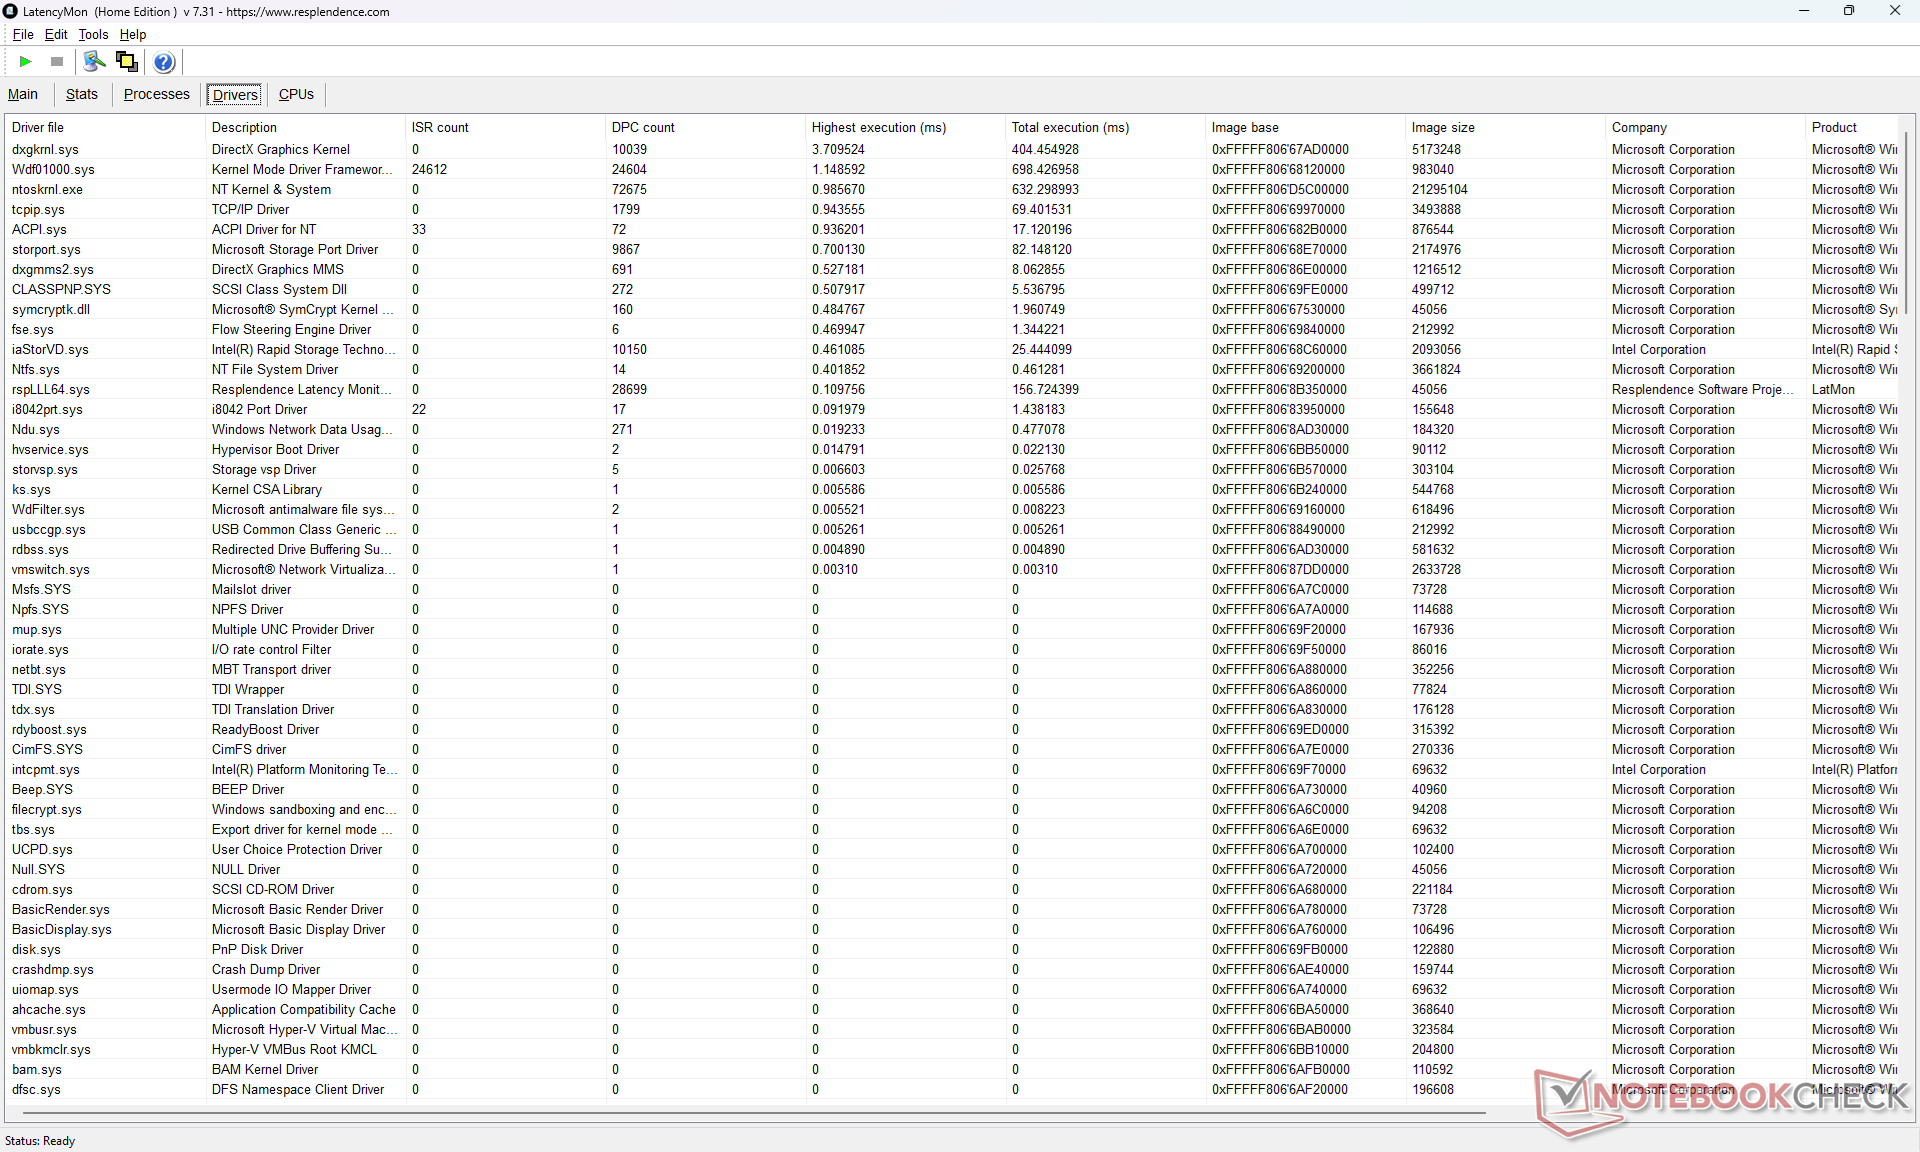
DPC-Latenzzeit
LatencyMon zeigt DPC-Probleme beim Öffnen mehrerer Browser Tabs unserer Homepage. Die 4K60-Videowiedergabe ist unvollkommen, aber immer noch flüssig mit nur drei Bildaussetzern zu Beginn des Tests.
| DPC Latencies / LatencyMon - interrupt to process latency (max), Web, Youtube, Prime95 | |
| Dell Latitude 9330 | |
| HP Elite Dragonfly Folio 13.5 G3 | |
| MSI Summit E13 AI Evo A1MTG | |
| MSI Summit E13 Flip Evo A11MT | |
| Lenovo ThinkPad L13 Yoga G4 i7-1355U | |
| Lenovo Yoga Book 9 13IMU9 | |
* ... kleinere Werte sind besser
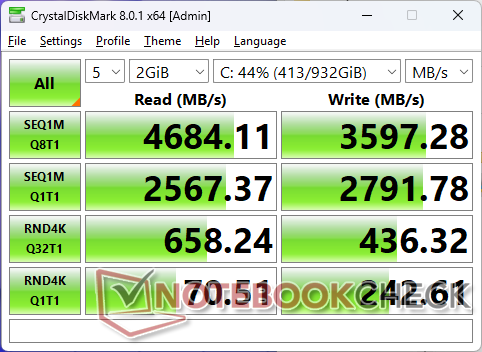
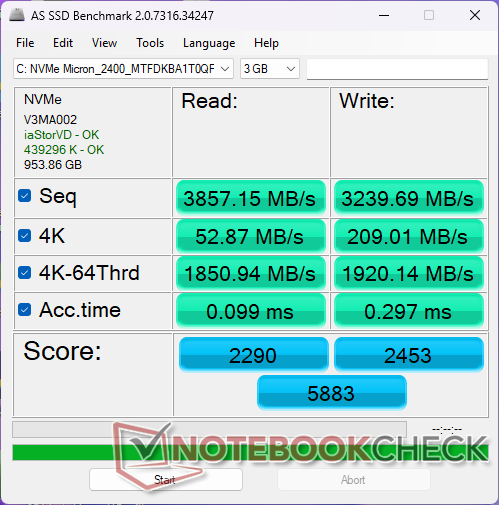
Speichergeräte
Die Micron 2400 PCIe4 x4 NVMe SSD drosselt unter Stress. Wenn DiskSpd in einer Schleife läuft, erreichen die Transferraten beispielsweise ~4.300 MB/s, bevor sie nach etwa 5 Minuten des Tests auf ~2.600 MB/s fallen.

* ... kleinere Werte sind besser
Disk Throttling: DiskSpd Read Loop, Queue Depth 8
GPU Performance
Die oben erwähnte, langsamer als erwartete CPU-Leistung hat zu einer langsamer als erwarteten Grafikleistung geführt. Die Arc 8 in unserem MSI ist laut 3DMark Benchmarks etwa 15 bis 25 Prozent langsamer als der durchschnittliche Laptop in unserer Datenbank mit der gleichen integrierten Grafik.
F1 22 und Cyberpunk 2077 stürzten ab, wenn die Einstellungen auf Hoch oder Ultra gestellt wurden.
| Leistungsprofil | Grafisch Score | Physics Score | kombinierte Punktzahl |
| Performance-Modus | 6.280 | 14.873 | 2.346 |
| Ausgeglichener Modus | 5.786 (-8 %) | 9.842 (-34 %) | 1.685 (-28 %) |
| Akku-Leistung | 5.196 (-17 %) | 15.031 (-0 %) | 2.267 (-3 %) |
Der Betrieb im Modus "Ausgewogen" kann die CPU-Leistung erheblich beeinträchtigen, wie aus der obigen Tabelle Fire Strike hervorgeht.
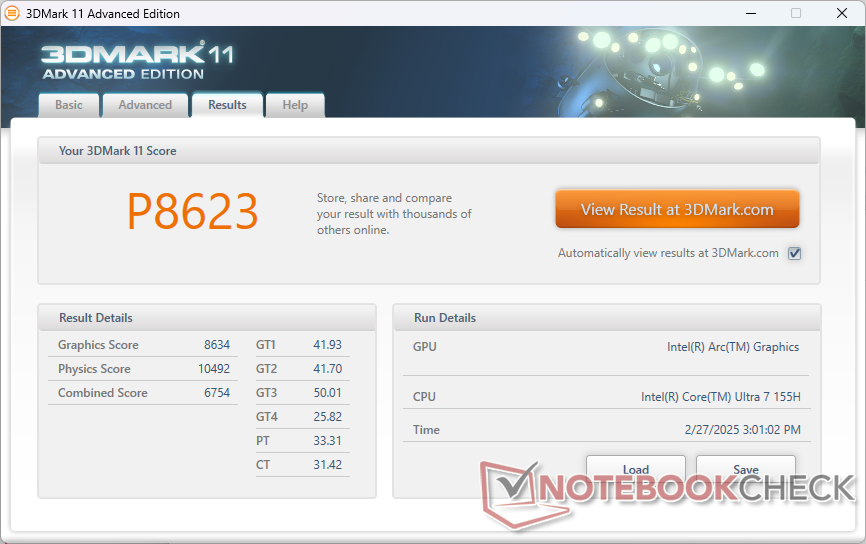
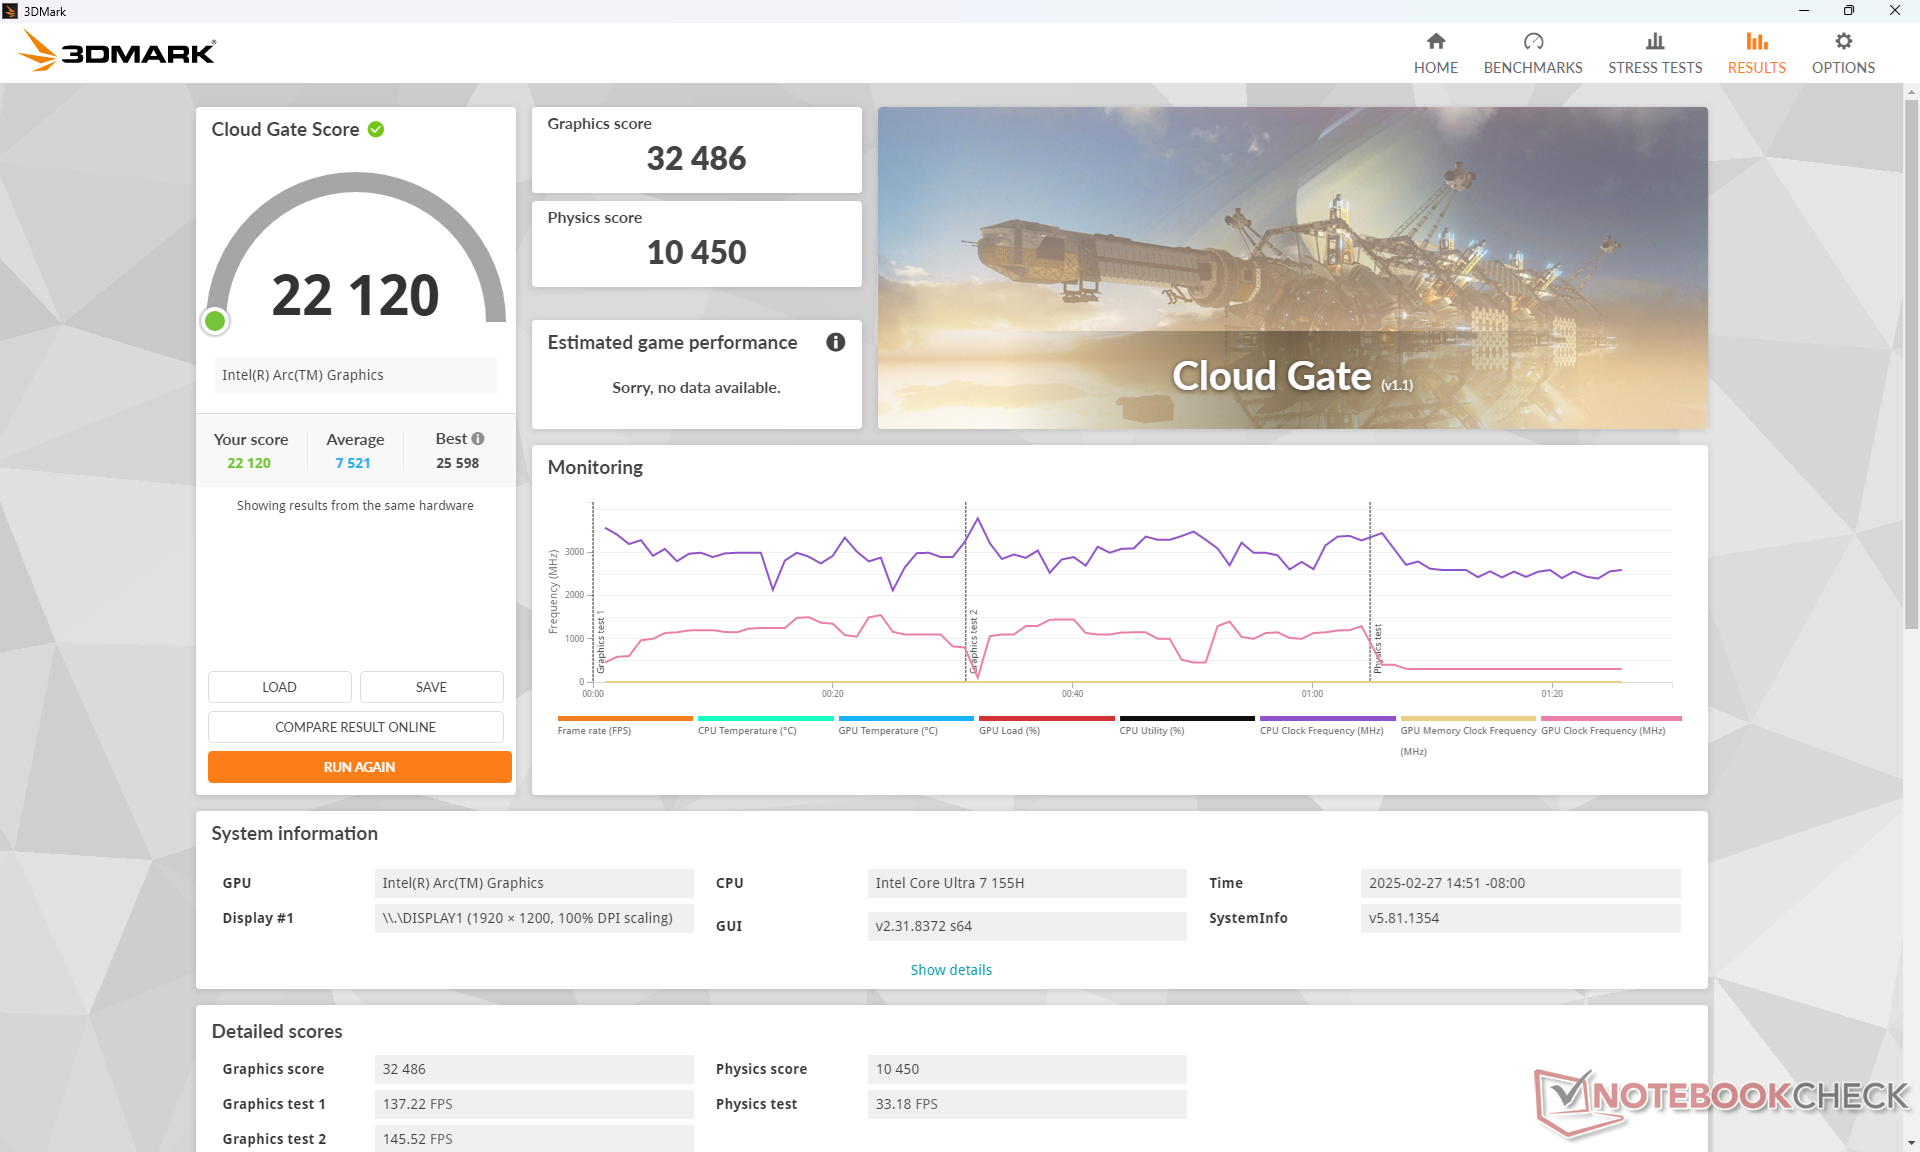
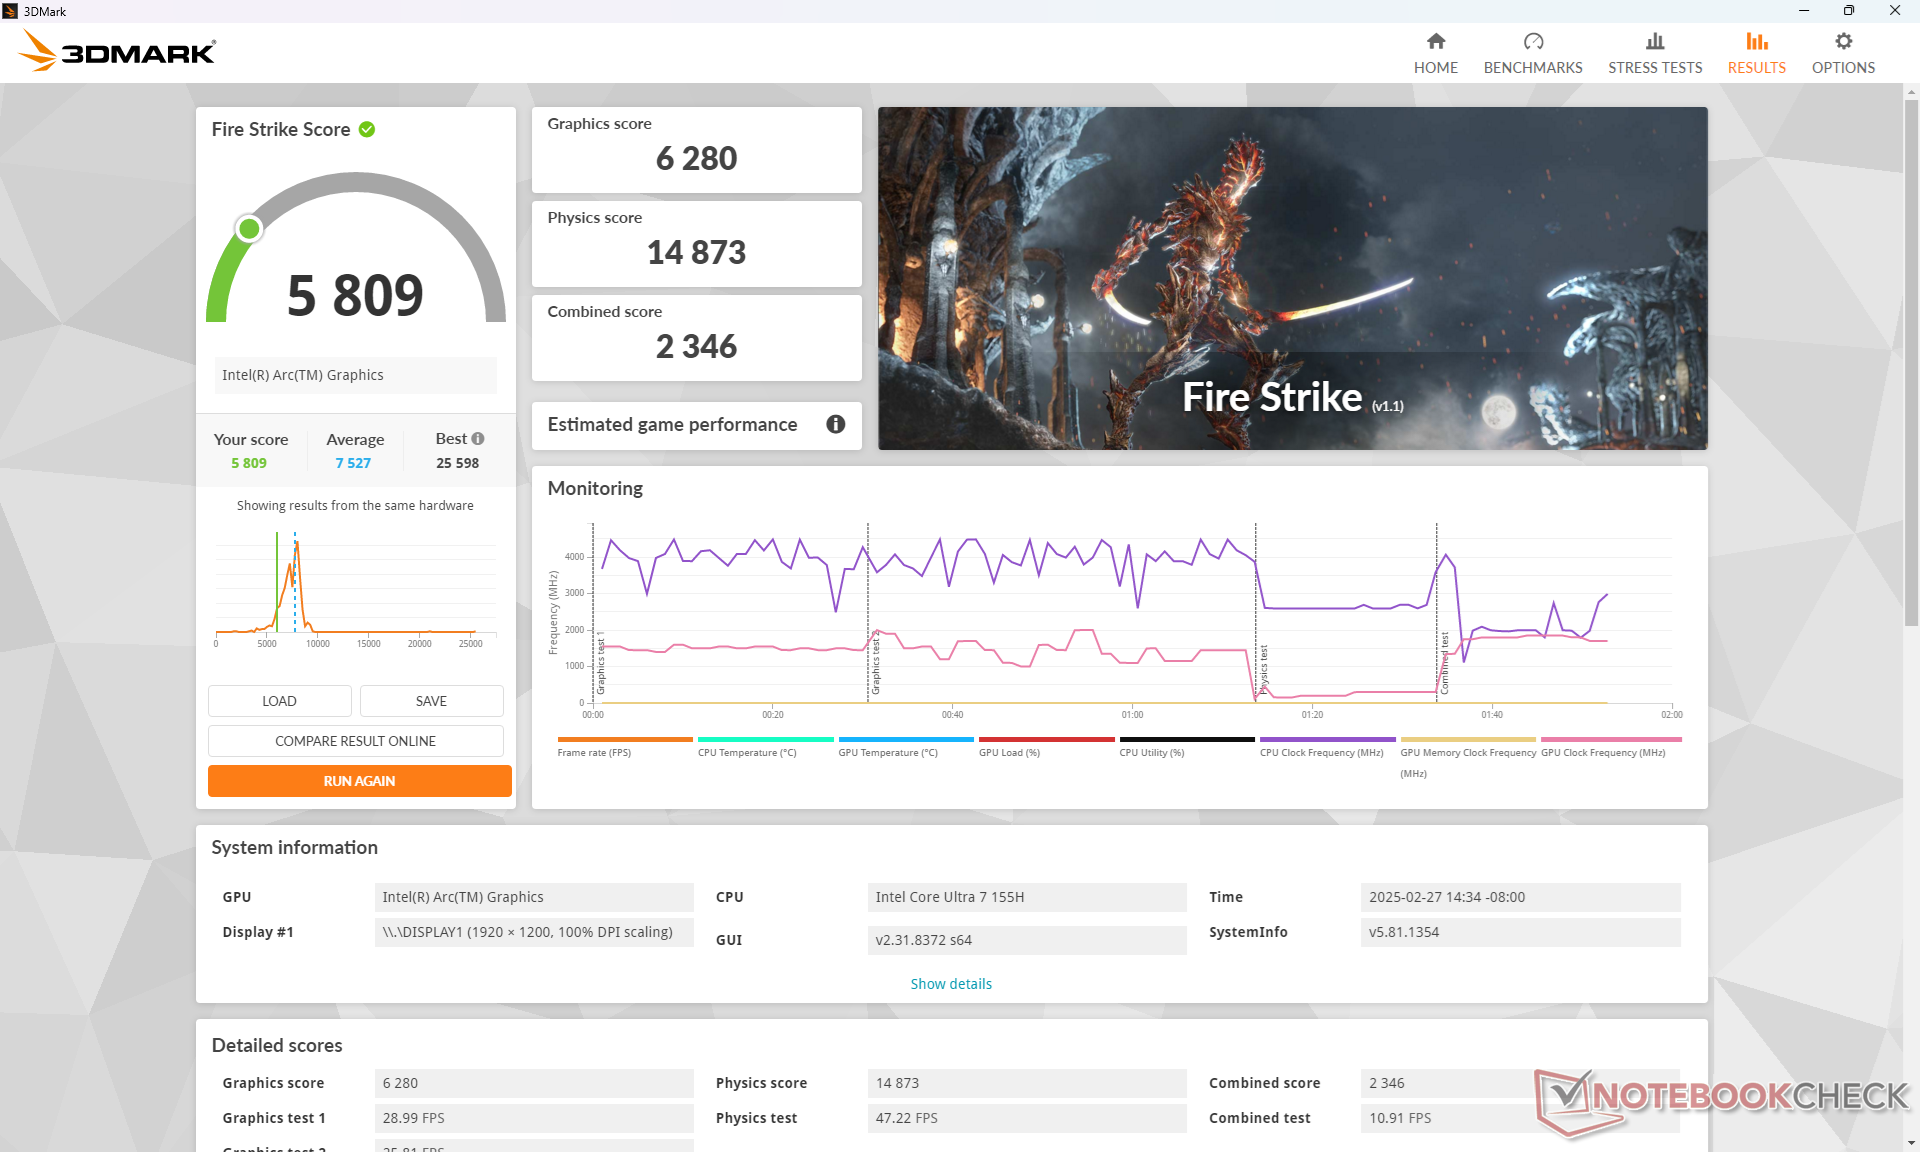

| 3DMark 11 Performance | 8623 Punkte | |
| 3DMark Cloud Gate Standard Score | 22120 Punkte | |
| 3DMark Fire Strike Score | 5809 Punkte | |
| 3DMark Time Spy Score | 2989 Punkte | |
Hilfe | ||
* ... kleinere Werte sind besser
Spiele-Performance
Die Spieleleistung ist schlecht. Zusätzlich zu den oben erwähnten CPU- und GPU-Defiziten können auffällige Ghosting- und Stotterprobleme selbst bei anspruchslosen Titeln wie DOTA 2 Reborn störend sein.
Cyberpunk 2077 ultra FPS Chart
| min. | mittel | hoch | max. | |
|---|---|---|---|---|
| GTA V (2015) | 50.6 | 51.1 | 23.9 | 12 |
| Dota 2 Reborn (2015) | 93.2 | 83.5 | 65.2 | 63 |
| Final Fantasy XV Benchmark (2018) | 49.2 | 29.4 | 20.7 | |
| X-Plane 11.11 (2018) | 46.2 | 37.5 | 31.4 | |
| Strange Brigade (2018) | 131.2 | 61.3 | 45.7 | 33.9 |
| Tiny Tina's Wonderlands (2022) | 41.5 | 31.7 | 22 | 17.7 |
| F1 22 (2022) | 57.8 | 53.5 | ||
| Baldur's Gate 3 (2023) | 22.8 | 19.5 | 16.8 | 16.3 |
| Cyberpunk 2077 (2023) | 28.3 | 23.4 |
Emissionen
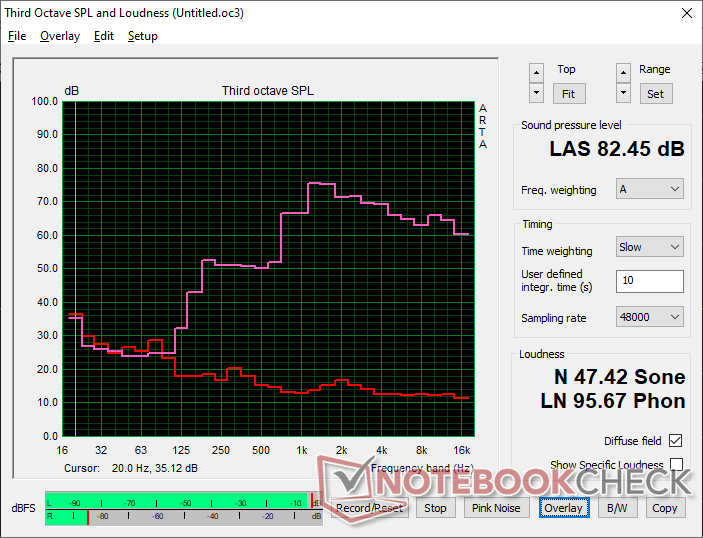
Systemrauschen
Das Lüftergeräusch ist leise, wenn man nur surft oder streamt, aber es nimmt ziemlich schnell zu, wenn höhere Lasten anfallen. Außerdem ist das Geräusch relativ hoch, so dass jede Drehzahländerung wahrnehmbar ist. Die Lüfter sind aufgrund der anspruchsvolleren Core-Ultra-H-CPU lauter als bei den meisten anderen 13-Zoll-Business-Laptops, wenn anspruchsvolle Aufgaben wie Spiele ausgeführt werden.
Lautstärkediagramm
| Idle |
| 24.1 / 24.8 / 26.5 dB(A) |
| Last |
| 39.3 / 49.1 dB(A) |
 | ||
30 dB leise 40 dB(A) deutlich hörbar 50 dB(A) störend |
||
min: | ||
| MSI Summit E13 AI Evo A1MTG Arc 8-Core, Ultra 7 155H, Micron 2400 MTFDKBA1T0QFM | MSI Summit E13 Flip Evo A11MT Iris Xe G7 96EUs, i7-1185G7, Phison 1TB SM2801T24GKBB4S-E162 | Lenovo Yoga Book 9 13IMU9 Graphics 4-Core iGPU (Arrow Lake), Ultra 7 155U | Lenovo ThinkPad L13 Yoga G4 i7-1355U Iris Xe G7 96EUs, i7-1355U, Samsung PM9B1 512GB MZAL4512HBLU | HP Elite Dragonfly Folio 13.5 G3 Iris Xe G7 96EUs, i7-1265U, Samsung PM9A1 MZVL2512HCJQ | Dell Latitude 9330 Iris Xe G7 96EUs, i7-1260U | |
|---|---|---|---|---|---|---|
| Geräuschentwicklung | 0% | 16% | 11% | 11% | 9% | |
| aus / Umgebung * (dB) | 24 | 24.5 -2% | 23.3 3% | 23.1 4% | 24.6 -3% | 23 4% |
| Idle min * (dB) | 24.1 | 24.7 -2% | 23.3 3% | 23.4 3% | 24.6 -2% | 23 5% |
| Idle avg * (dB) | 24.8 | 24.7 -0% | 23.3 6% | 23.4 6% | 24.6 1% | 23.1 7% |
| Idle max * (dB) | 26.5 | 26.4 -0% | 24.6 7% | 23.4 12% | 24.6 7% | 23.1 13% |
| Last avg * (dB) | 39.3 | 37.8 4% | 26.2 33% | 33.9 14% | 27.8 29% | 37.1 6% |
| Cyberpunk 2077 ultra * (dB) | 45 | |||||
| Last max * (dB) | 49.1 | 48.8 1% | 27.3 44% | 36.9 25% | 33.4 32% | 40.5 18% |
| Witcher 3 ultra * (dB) | 41.4 | 27.3 | 36.9 | 33.4 | 40.6 |
* ... kleinere Werte sind besser
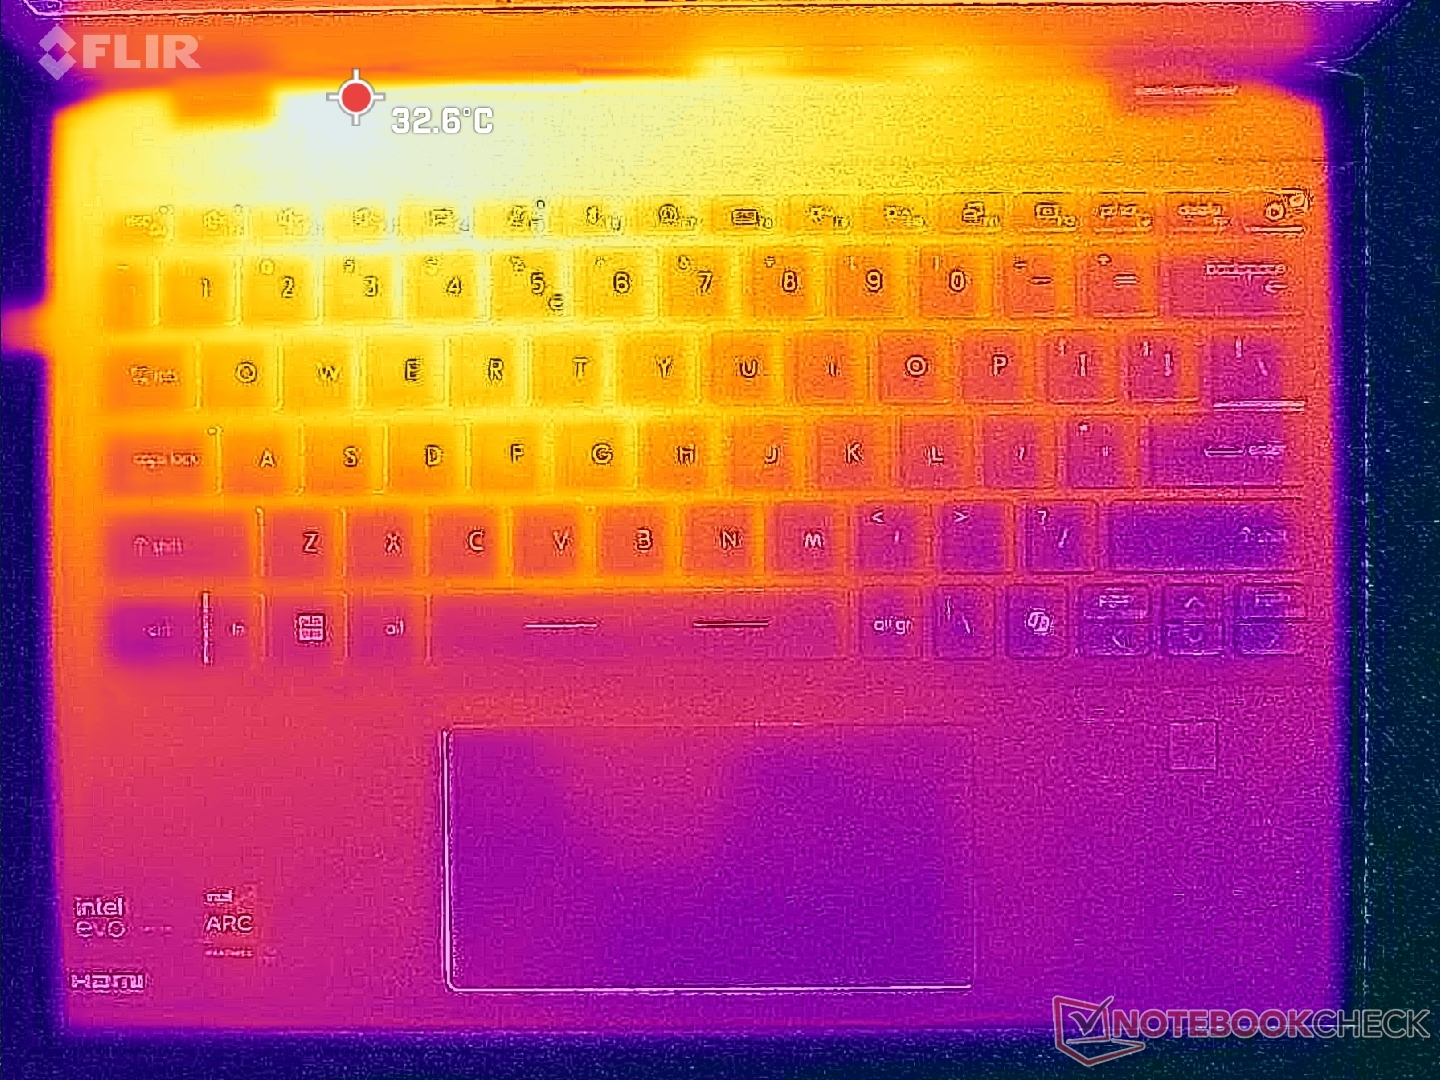
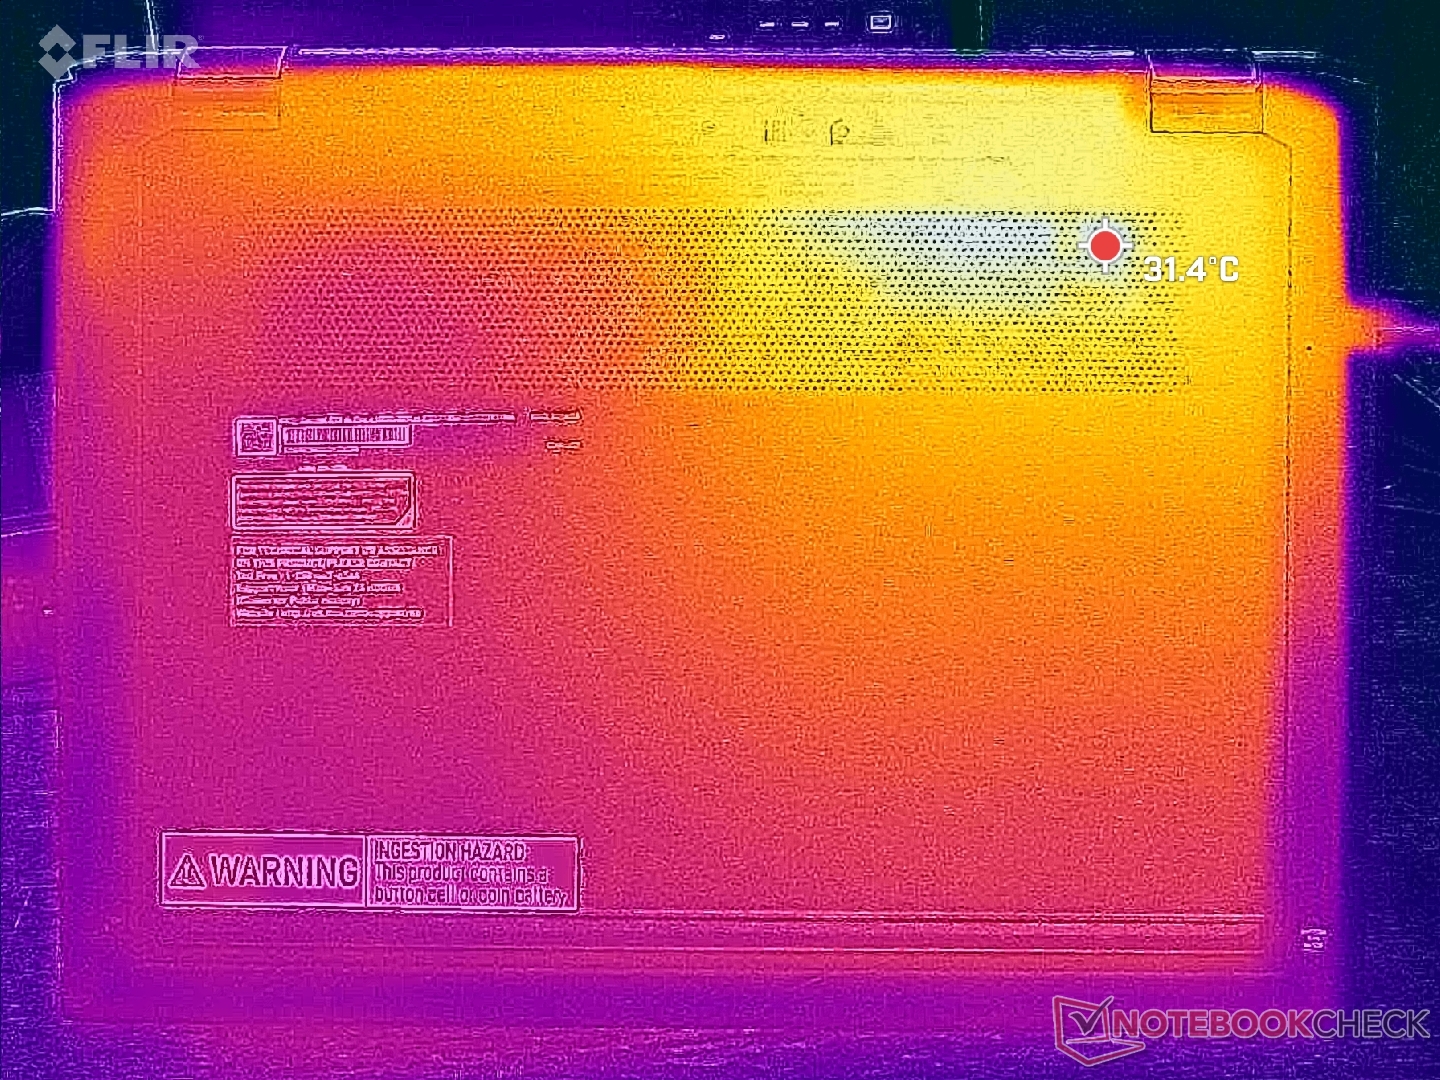
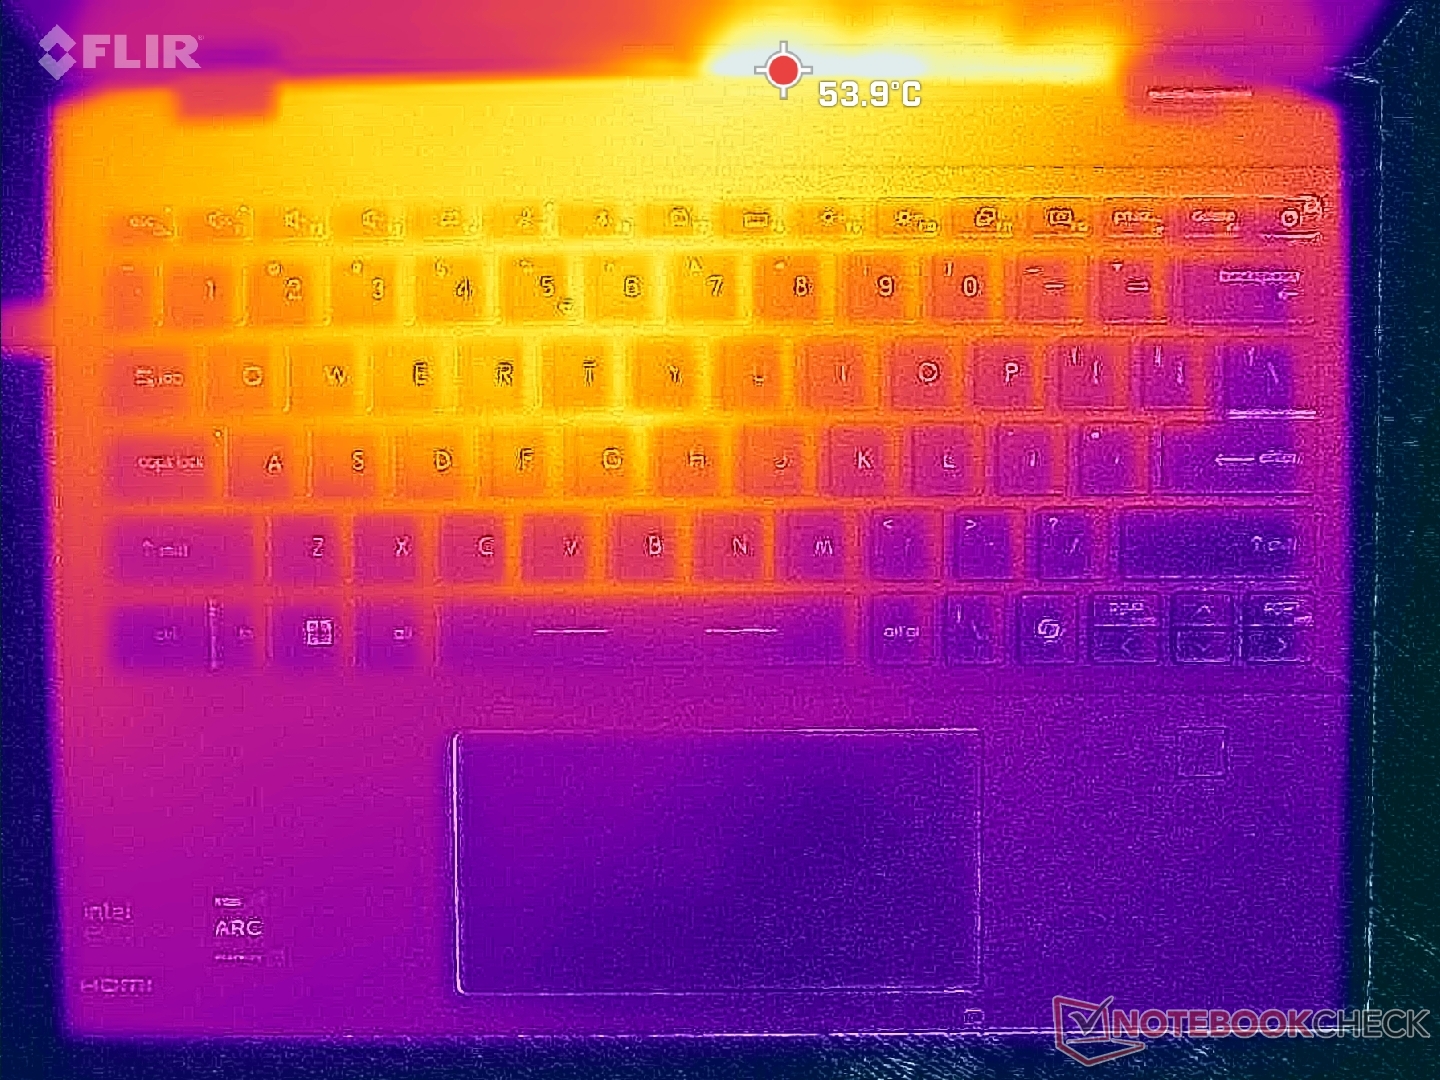
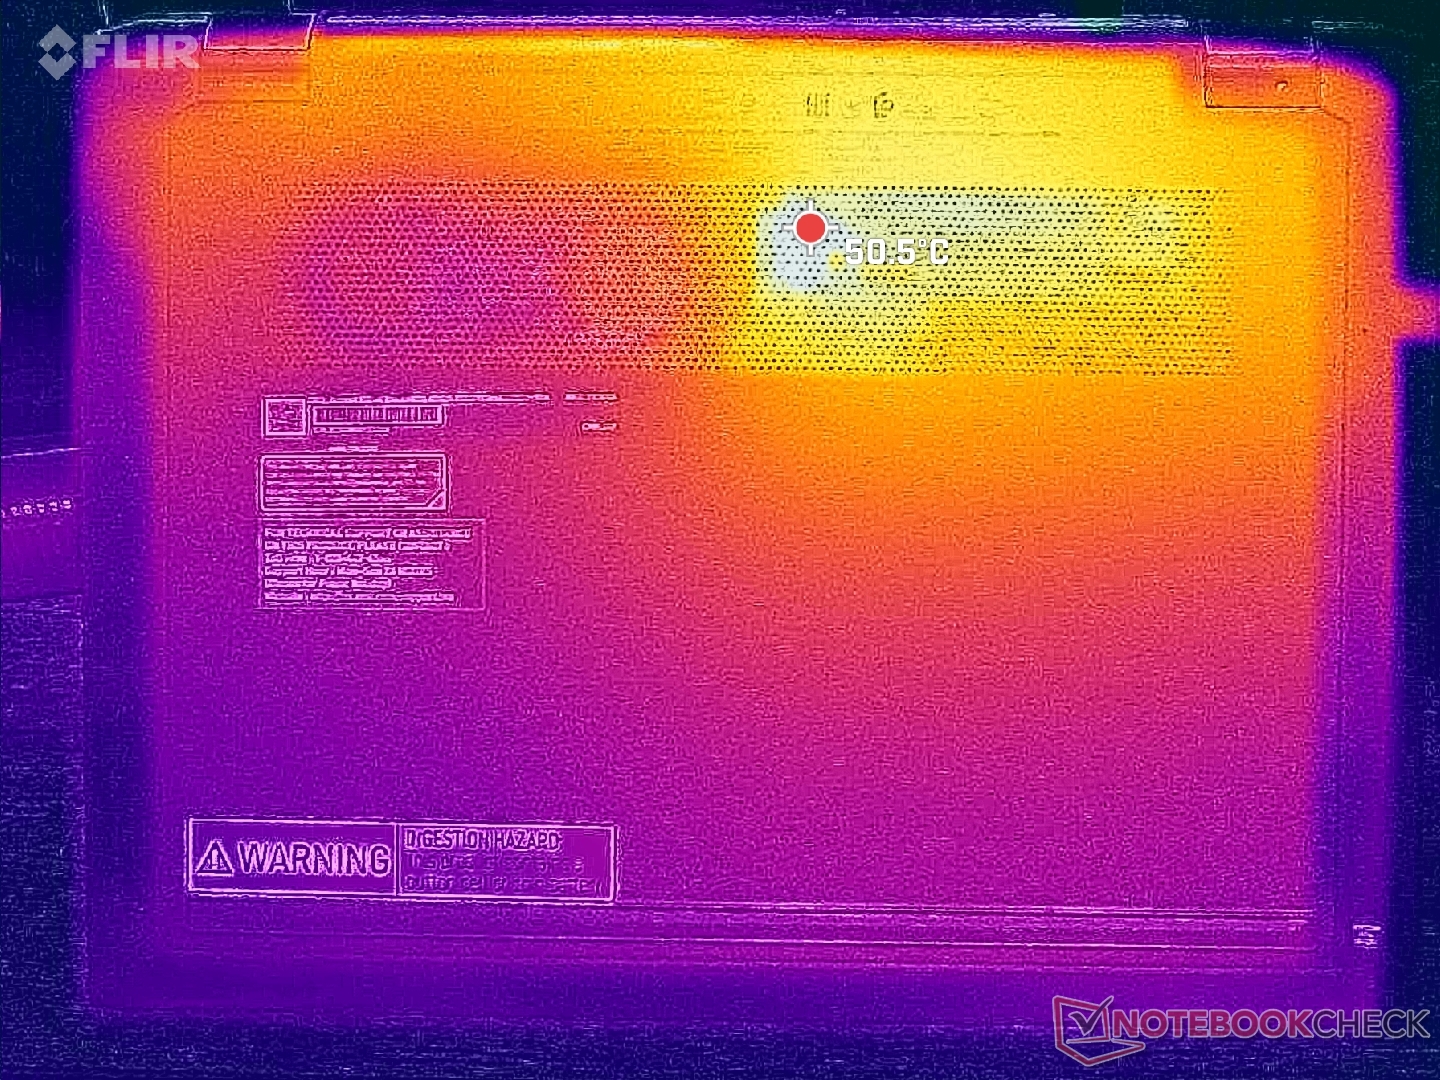
Temperatur
Die Oberflächentemperaturen sind selbst im Leerlauf auf dem Desktop sehr warm. Die Temperaturen reichen von 36 °C im Leerlauf bis zu über 45 °C bei anspruchsvoller Last. Das ist wärmer als bei den meisten anderen 13-Zoll-Convertibles.
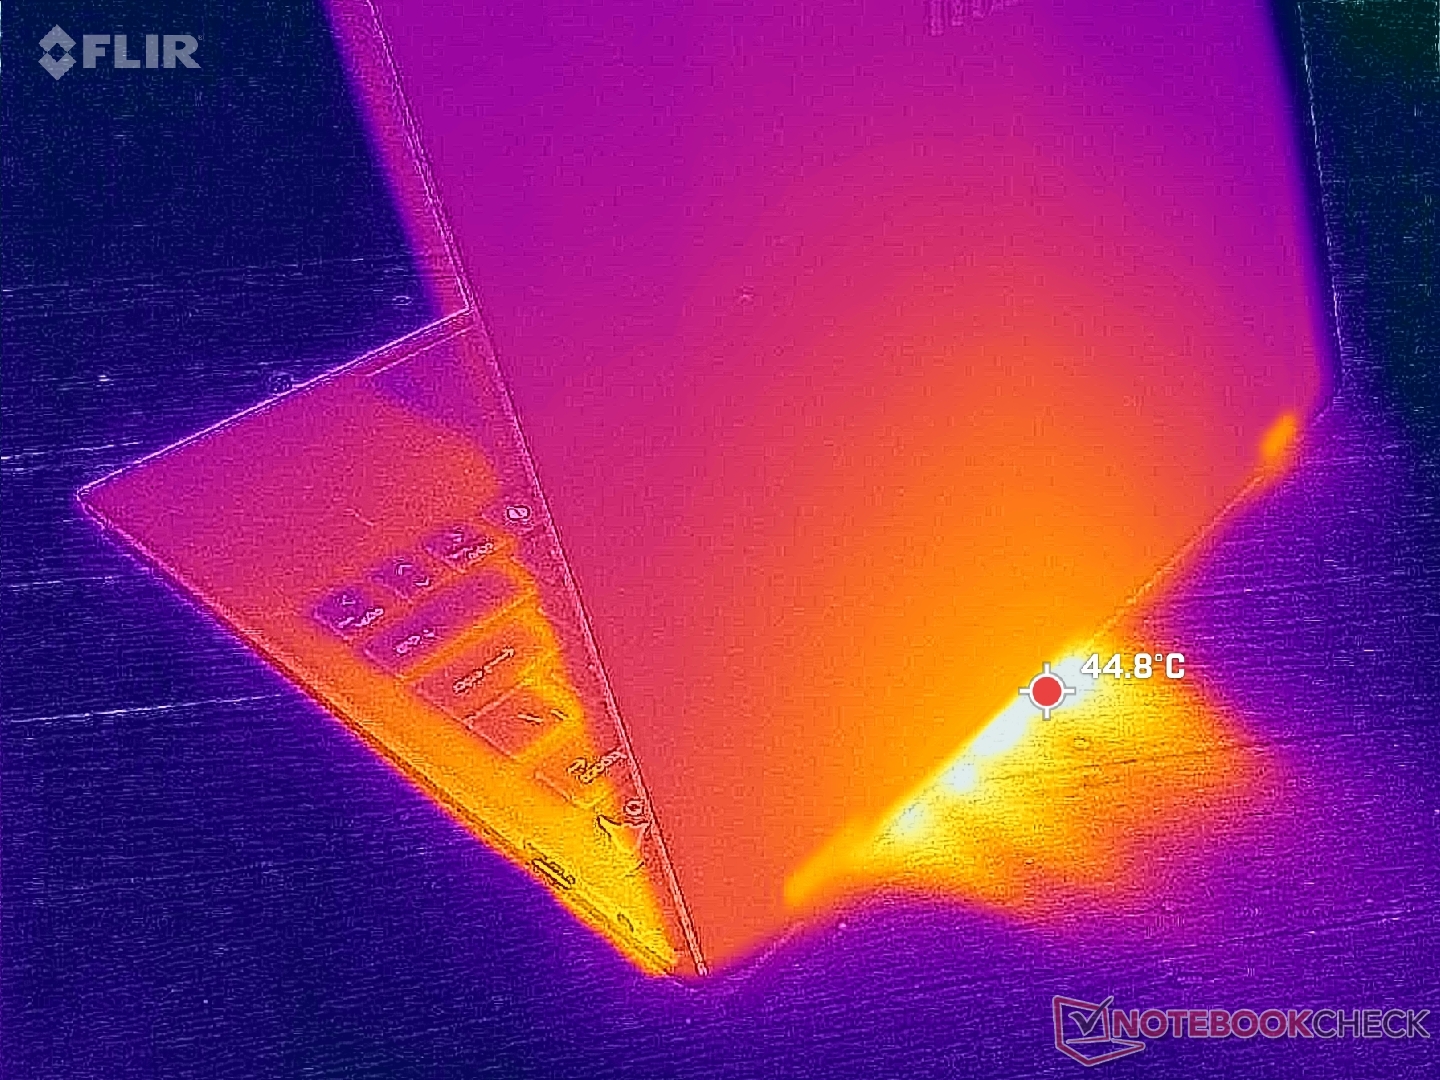
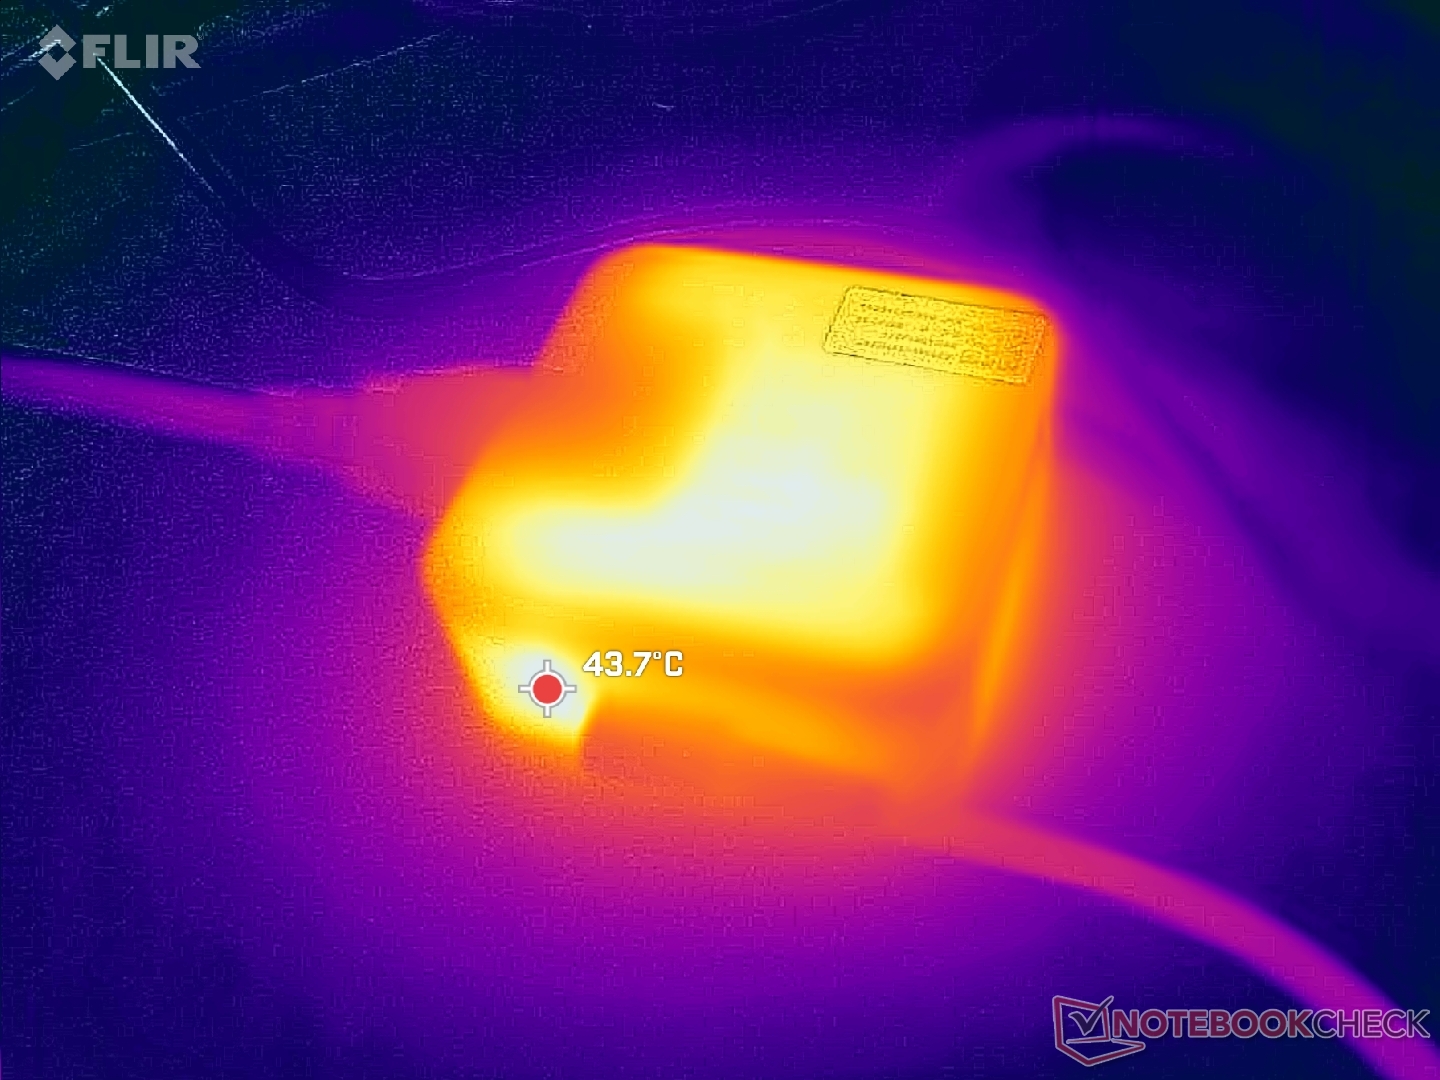
(-) Die maximale Temperatur auf der Oberseite ist 45.2 °C. Im Vergleich liegt der Klassendurchschnitt bei 35.4 °C (von 19.6 bis 60 °C für die Klasse Convertible).
(±) Auf der Unterseite messen wir eine maximalen Wert von 44.8 °C (im Vergleich zum Durchschnitt von 36.9 °C).
(+) Ohne Last messen wir eine durchschnittliche Temperatur von 30.1 °C auf der Oberseite. Der Klassendurchschnitt erreicht 30.3 °C.
(+) Die Handballen und der Touchpad-Bereich sind mit gemessenen 28.8 °C kühler als die typische Hauttemperatur und fühlen sich dadurch kühl an.
(±) Die durchschnittliche Handballen-Temperatur anderer getesteter Geräte war 28 °C (-0.8 °C).
| MSI Summit E13 AI Evo A1MTG Intel Core Ultra 7 155H, Intel Arc 8-Core iGPU | MSI Summit E13 Flip Evo A11MT Intel Core i7-1185G7, Intel Iris Xe Graphics G7 96EUs | Lenovo Yoga Book 9 13IMU9 Intel Core Ultra 7 155U, Intel Graphics 4-Core iGPU (Meteor / Arrow Lake) | Lenovo ThinkPad L13 Yoga G4 i7-1355U Intel Core i7-1355U, Intel Iris Xe Graphics G7 96EUs | HP Elite Dragonfly Folio 13.5 G3 Intel Core i7-1265U, Intel Iris Xe Graphics G7 96EUs | Dell Latitude 9330 Intel Core i7-1260U, Intel Iris Xe Graphics G7 96EUs | |
|---|---|---|---|---|---|---|
| Hitze | -7% | 10% | 6% | 28% | 12% | |
| Last oben max * (°C) | 45.2 | 52 -15% | 39.2 13% | 38.4 15% | 32.8 27% | 40.6 10% |
| Last unten max * (°C) | 44.8 | 57.4 -28% | 41 8% | 46 -3% | 33.4 25% | 50.2 -12% |
| Idle oben max * (°C) | 34.8 | 30.4 13% | 32.2 7% | 31.2 10% | 24.6 29% | 25 28% |
| Idle unten max * (°C) | 35.8 | 34.2 4% | 31.6 12% | 34.8 3% | 24.6 31% | 27.6 23% |
* ... kleinere Werte sind besser
Lautsprecher
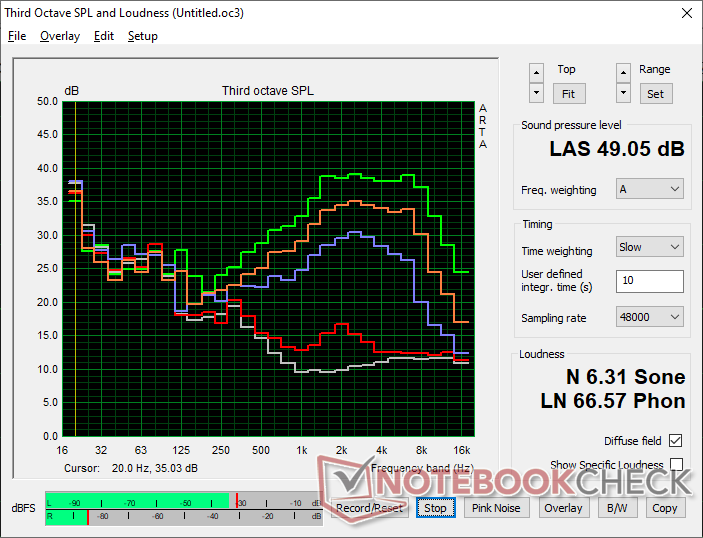
MSI Summit E13 AI Evo A1MTG Audio Analyse
(+) | Die Lautsprecher können relativ laut spielen (82.5 dB)
Bass 100 - 315 Hz
(-) | kaum Bass - 21.9% niedriger als der Median
(±) | durchschnittlich lineare Bass-Wiedergabe (9.9% Delta zum Vorgänger)
Mitteltöne 400 - 2000 Hz
(±) | verringerte Mitten, vom Median 9.2% abweichend
(±) | Linearität der Mitten ist durchschnittlich (7.6% Delta zum Vorgänger)
Hochtöne 2 - 16 kHz
(+) | ausgeglichene Hochtöne, vom Median nur 3.2% abweichend
(+) | sehr lineare Hochtöne (3.3% Delta zum Vorgänger)
Gesamt im hörbaren Bereich 100 - 16.000 Hz
(±) | hörbarer Bereich ist durchschnittlich linear (21.4% Abstand zum Median)
Im Vergleich zu allen Geräten derselben Klasse
» 57% aller getesteten Geräte dieser Klasse waren besser, 12% vergleichbar, 32% schlechter
» Das beste Gerät hat einen Delta-Wert von 6%, durchschnittlich ist 20%, das schlechteste Gerät hat 57%
Im Vergleich zu allen Geräten im Test
» 60% aller getesteten Geräte waren besser, 7% vergleichbar, 33% schlechter
» Das beste Gerät hat einen Delta-Wert von 4%, durchschnittlich ist 24%, das schlechteste Gerät hat 134%
Apple MacBook Pro 16 2021 M1 Pro Audio Analyse
(+) | Die Lautsprecher können relativ laut spielen (84.7 dB)
Bass 100 - 315 Hz
(+) | guter Bass - nur 3.8% Abweichung vom Median
(+) | lineare Bass-Wiedergabe (5.2% Delta zum Vorgänger)
Mitteltöne 400 - 2000 Hz
(+) | ausgeglichene Mitten, vom Median nur 1.3% abweichend
(+) | lineare Mitten (2.1% Delta zum Vorgänger)
Hochtöne 2 - 16 kHz
(+) | ausgeglichene Hochtöne, vom Median nur 1.9% abweichend
(+) | sehr lineare Hochtöne (2.7% Delta zum Vorgänger)
Gesamt im hörbaren Bereich 100 - 16.000 Hz
(+) | hörbarer Bereich ist sehr linear (4.6% Abstand zum Median
Im Vergleich zu allen Geräten derselben Klasse
» 0% aller getesteten Geräte dieser Klasse waren besser, 0% vergleichbar, 100% schlechter
» Das beste Gerät hat einen Delta-Wert von 5%, durchschnittlich ist 17%, das schlechteste Gerät hat 45%
Im Vergleich zu allen Geräten im Test
» 0% aller getesteten Geräte waren besser, 0% vergleichbar, 100% schlechter
» Das beste Gerät hat einen Delta-Wert von 4%, durchschnittlich ist 24%, das schlechteste Gerät hat 134%
Energieverwaltung
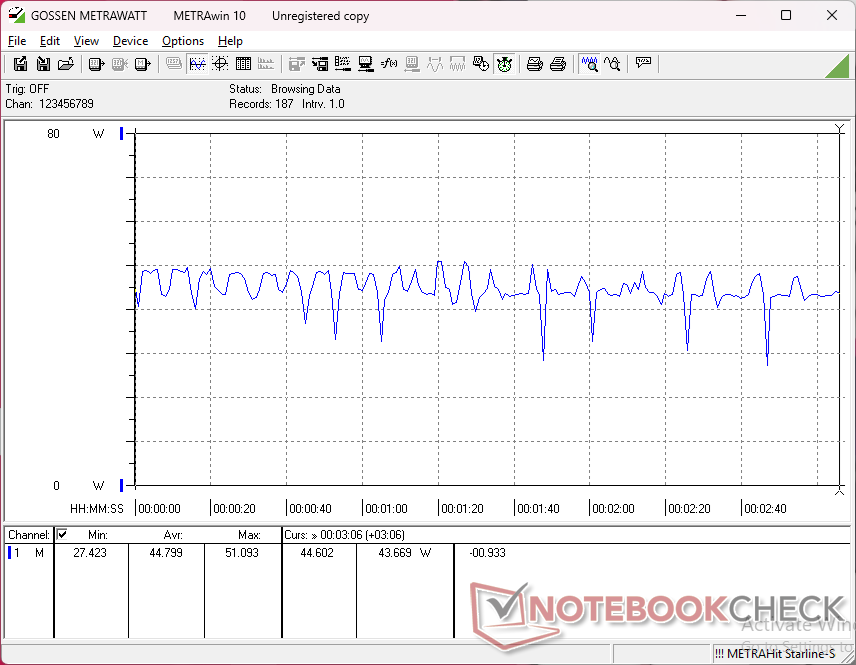
Stromverbrauch
Der Stromverbrauch kann bei anspruchsvoller GPU-Belastung wie Cyberpunk 2077 unstetig sein, was mit den oben erwähnten Einbrüchen der Bildrate zusammenhängt. Dies steht im Gegensatz zu dem Framework 13.5, das mit der exakt gleichen Core-Ultra-7-155H-CPU ausgeliefert wird, aber einen viel gleichmäßigeren Verbrauch unter Last aufweist.
| Aus / Standby | |
| Idle | |
| Last |
|
Legende:
min: | |
| MSI Summit E13 AI Evo A1MTG Ultra 7 155H, Arc 8-Core, Micron 2400 MTFDKBA1T0QFM, IPS, 1920x1200, 13.3" | MSI Summit E13 Flip Evo A11MT i7-1185G7, Iris Xe G7 96EUs, Phison 1TB SM2801T24GKBB4S-E162, IPS, 1920x1200, 13.4" | Lenovo Yoga Book 9 13IMU9 Ultra 7 155U, Graphics 4-Core iGPU (Arrow Lake), , OLED, 2880x1800, 13.3" | Lenovo ThinkPad L13 Yoga G4 i7-1355U i7-1355U, Iris Xe G7 96EUs, Samsung PM9B1 512GB MZAL4512HBLU, IPS, 1920x1200, 13.3" | HP Elite Dragonfly Folio 13.5 G3 i7-1265U, Iris Xe G7 96EUs, Samsung PM9A1 MZVL2512HCJQ, IPS, 1920x1280, 13.5" | Dell Latitude 9330 i7-1260U, Iris Xe G7 96EUs, , IPS, 2560x1600, 13.3" | |
|---|---|---|---|---|---|---|
| Stromverbrauch | -52% | -116% | -59% | -26% | -40% | |
| Idle min * (Watt) | 2.3 | 4.8 -109% | 7.1 -209% | 5.5 -139% | 3.4 -48% | 4.7 -104% |
| Idle avg * (Watt) | 4.8 | 8.4 -75% | 9.1 -90% | 8.3 -73% | 4.9 -2% | 8.2 -71% |
| Idle max * (Watt) | 5 | 8.6 -72% | 18.4 -268% | 9.1 -82% | 9.3 -86% | 8.4 -68% |
| Last avg * (Watt) | 46.2 | 47.1 -2% | 51.3 -11% | 49.9 -8% | 41.9 9% | 36.8 20% |
| Cyberpunk 2077 ultra external monitor * (Watt) | 41.9 | |||||
| Cyberpunk 2077 ultra * (Watt) | 44.8 | |||||
| Last max * (Watt) | 65 | 65.9 -1% | 65.5 -1% | 60 8% | 67.5 -4% | 49.9 23% |
| Witcher 3 ultra * (Watt) | 51.6 | 41.5 | 42.4 | 36.4 | 30.4 |
* ... kleinere Werte sind besser
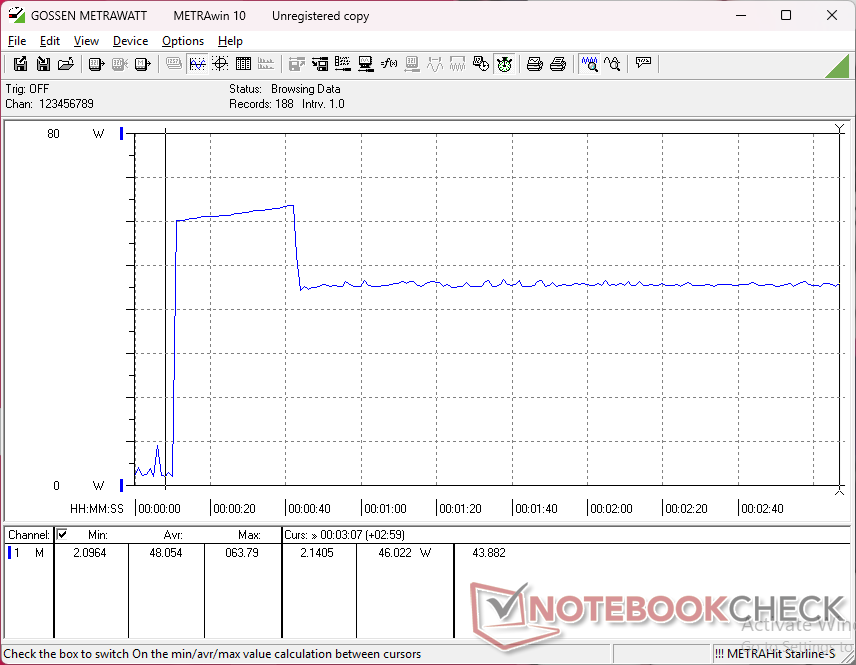
Power Consumption Cyberpunk / Stress Test
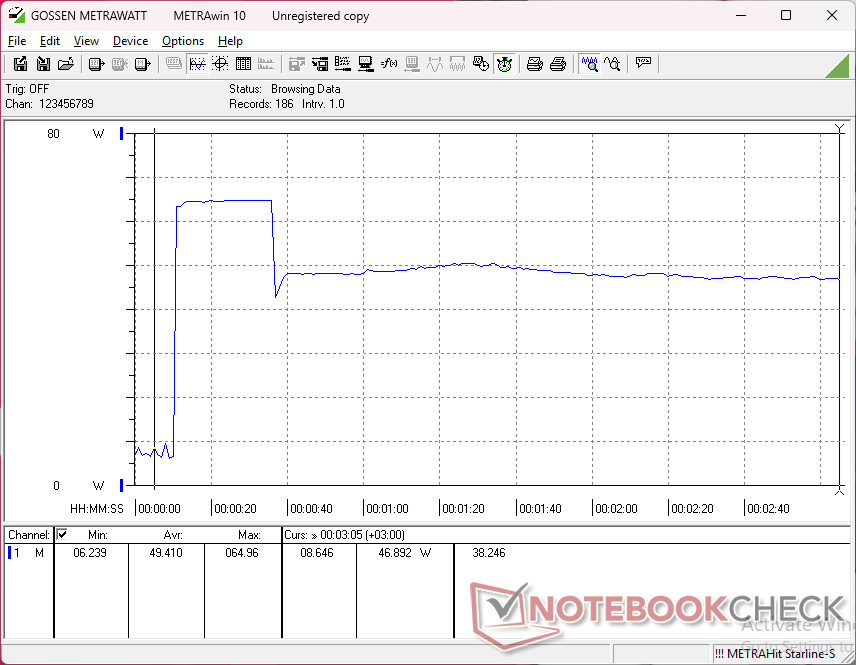
Power Consumption external Monitor
Akkulaufzeit
Die WLAN-Laufzeit ist ein paar Stunden kürzer als beim älteren Summit E13, aber mit fast 9,5 Stunden realer Nutzung insgesamt immer noch gut.
| MSI Summit E13 AI Evo A1MTG Ultra 7 155H, Arc 8-Core, 70 Wh | MSI Summit E13 Flip Evo A11MT i7-1185G7, Iris Xe G7 96EUs, 70 Wh | Lenovo Yoga Book 9 13IMU9 Ultra 7 155U, Graphics 4-Core iGPU (Arrow Lake), 80 Wh | Lenovo ThinkPad L13 Yoga G4 i7-1355U i7-1355U, Iris Xe G7 96EUs, 46 Wh | HP Elite Dragonfly Folio 13.5 G3 i7-1265U, Iris Xe G7 96EUs, 53 Wh | Dell Latitude 9330 i7-1260U, Iris Xe G7 96EUs, 50 Wh | |
|---|---|---|---|---|---|---|
| Akkulaufzeit | 18% | 6% | -35% | -1% | -1% | |
| WLAN (h) | 9.5 | 11.2 18% | 10.1 6% | 6.2 -35% | 9.4 -1% | 9.4 -1% |
| Idle (h) | 21.1 | 27.3 | 15.4 | |||
| Last (h) | 1.8 | 2.6 | 2.3 |
Notebookcheck Bewertung
MSI Summit E13 AI Evo A1MTG
- 04.03.2025 v8
Allen Ngo
 Total Sustainability Score:
 Transparenz
Die Auswahl der zu testenden Geräte erfolgt innerhalb der Redaktion. Das vorliegende Testmuster wurde vom Autor auf eigene Kosten im freien Handel erworben. Der Hersteller erhielt keine Version des Reviews vor der Veröffentlichung, es bestand keine Verpflichtung zur Publikation. Als eigenständiges, unabhängiges Unternehmen unterliegt Notebookcheck keiner Diktion von Herstellern, Shops und Verlagen.
So testet Notebookcheck
Pro Jahr werden von Notebookcheck hunderte Laptops und Smartphones unabhängig in von uns standardisierten technischen Verfahren getestet, um eine Vergleichbarkeit aller Testergebnisse zu gewährleisten. Seit rund 20 Jahren entwickeln wir diese Testmethoden kontinuierlich weiter und setzen damit Branchenstandards. In unseren Testlaboren kommt ausschließlich hochwertiges Messequipment in die Hände erfahrener Techniker und Redakteure. Die Tests unterliegen einer mehrstufigen Kontrolle. Unsere komplexe Gesamtbewertung basiert auf hunderten fundierten Messergebnissen und Benchmarks, womit Ihnen Objektivität garantiert ist. Weitere Informationen zu unseren Testmethoden gibt es hier.

