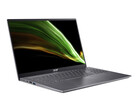
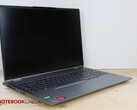
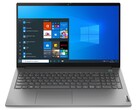
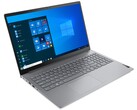
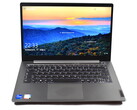
Lenovo ThinkBook 16p im Laptop-Test: Spielt auf allen Hochzeiten, wenn man kompromissbereit ist

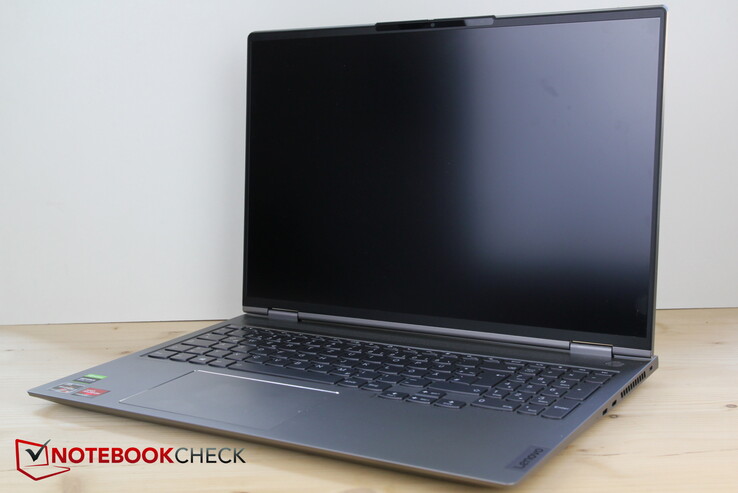
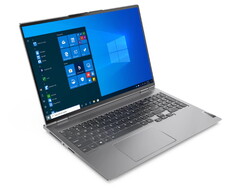
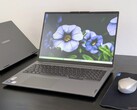
Wem das ThinkBook 15p noch etwas zu altbacken war, sollte sich jetzt das neue ThinkBook 16p anschauen. Statt 16:9 gibt es 16:10, statt üppiger Ränder ein hohes Screen-To-Body-Verhältnis, dazu kommt eine potentiell leistungsstarke Grafikkarte und ein starker Prozessor. Lenovo zwängt einen der immer beliebter werdenden 16-Zoll-Bildschirme in ein 15-Zoll-Gehäuse und erhöht die vertikale Pixelanzahl. Und statt NVIDIA GeForce GTX 1650 Ti Max-Q gibt es gleich eine NVIDIA GeForce RTX 3060 Laptop GPU und einen starken AMD Ryzen 9 5900HX dazu. Damit legt das ThinkBook einen immensen Performancesprung hin und drängt damit in den Gamingbereich vor.
Zu den Konkurrenten des "leistungsstarken Kreativitätswerkzeugs" (Lenovo) zählen Gaming- und Multimedia-Laptops wie das Dell Inspiron 16 Plus 7610 mit RTX 3050, das Razer Blade 15 Base Model, aber auch reine Gamer wie das Alienware m15 R5 oder das Schenker XMG Core 15. Zudem ziehen wir den Quasi-Vorgänger Lenovo ThinkBook 15p zum Vergleich heran.
mögliche Konkurrenten im Vergleich
Bew. | Datum | Modell | Gewicht | Dicke | Größe | Auflösung | Preis ab |
|---|---|---|---|---|---|---|---|
| 87 % v7 (old) | 09 / 2021 | Lenovo ThinkBook 16p G2 ACH R9 5900HX, GeForce RTX 3060 Laptop GPU | 2 kg | 19.5 mm | 16.00" | 2560x1600 | |
| 86.4 % v7 (old) | 03 / 2021 | Lenovo ThinkBook 15p Gen1 4K i7-10750H, GeForce GTX 1650 Ti Max-Q | 2 kg | 19.9 mm | 15.60" | 3840x2160 | |
| 86.7 % v7 (old) | 08 / 2021 | Dell Inspiron 16 Plus 7610 i7-11800H, GeForce RTX 3050 4GB Laptop GPU | 2 kg | 18.99 mm | 16.00" | 3072x1920 | |
| 85.5 % v7 (old) | 03 / 2021 | Razer Blade 15 Base Edition 2021, i7-10750H RTX 3060 i7-10750H, GeForce RTX 3060 Laptop GPU | 2.1 kg | 19.9 mm | 15.60" | 1920x1080 | |
| 84.7 % v7 (old) | 06 / 2021 | Alienware m15 R5 Ryzen Edition R7 5800H, GeForce RTX 3060 Laptop GPU | 2.5 kg | 22.85 mm | 15.60" | 1920x1080 | |
| 84.9 % v7 (old) | 03 / 2021 | Schenker XMG Core 15 Ampere R7 4800H, GeForce RTX 3060 Laptop GPU | 2 kg | 22.9 mm | 15.60" | 2560x1440 |
Gehäuse - Metall-Unibody mit Spaltmaßen
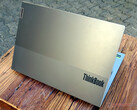
Das Gehäuse unterschiedet sich nicht wesentlich von dem des Lenovo ThinkBook 15p. Es ist quasi komplett aus Aluminium gefertigt, was vor allem dem Display und auch dem Tastaturuntergrund eine vergleichsweise hohe Stabilität verleiht. Das silbergraue Metallgehäuse ist auf der Oberseite durch einen Lenovo- und einen ThinkBook-Schriftzug verziert.
Die beiden Scharniere haben das Display gut im Griff, dennoch lässt sich der Laptop auch einhändig gut öffnen. An der Unterseite sind uns an mindestens einer Stelle ungleichmäßige Spaltmaße aufgefallen, davon abgesehen scheint die Verarbeitungsqualität aber auf einem guten Niveau zu sein, Knarzgeräusche kamen kaum vor.
Von unten wird Frischluft angesaugt, Abwärme wird nach hinten und zur Seite über jeweils zwei Lüftungsgitter links und rechts abgegeben.
Das Dell Inspiron 16 Plus 7610 ist einen halben Millimeter dünner als das ThinkBook, insgesamt aber sehr ähnlich von den Abmaßen und dem Gewicht. Die 2 kg, die es auf die Waage bringt, unterscheiden es ansonsten kaum von den Konkurrenten, nur das Alienware ist fast 500 g schwerer. Und trotz des 16-Zoll-Displays mit 16:10-Seitenverhältnis ist das ThinkBook 16p kaum größer als die 15-Zoll-Konkurrenz, von denen nur manche Modelle ein paar Millimeter weniger in der Tiefe messen.
Ausstattung - Super spartanisches ThinkBook 16p
Die Ausstattung hatten wir bereits im ThinkBook 15p bemängelt und das 16p macht es nicht besser. Ein dedizierter HDMI- oder Displayport-Eingang fehlt, man ist somit auf einen Adapter für einen der beiden USB-C-Ports mit Displayport-1.4-Unterstützung angewiesen, welcher zudem nicht von Lenovo beigelegt wird. Vor dem Anschluss eines externen Monitors muss man sich also extra noch einen Adapter oder Hub anschaffen.Thunderbolt fehlt durch die AMD-Plattform ebenso.
Zusätzlich fehlt ein LAN-Anschluss, ob das Fehlen einer schnellen Internetverbindung via Kabel einem "Leistungsstarken Kreativitätswerkzeug" gerecht wird, nunja. Immerhin gibt es einen vollwertigen SD-Reader, was auch keine Selbstverständlichkeit mehr ist. Insgesamt gibt es nur 4 USB-Ports und 1 Headset-Anschluss, das ist recht wenig!
Die USB-C-Anschlüsse sitzen auf der rechten Seite. Da hier fast zwangsläufig Adapter oder gar Hubs mit langen Kabeln zum Einsatz kommen werden, ist die Positionierung womöglich nicht optimal. Die zwei USB-A-Ports sitzen mit dem Stromanschluss hinten, wir haben es als etwas nervig empfunden bei jedem Einstecken eines simplen USB-A-Sticks über das Display nach hinten langen zu müssen. Links sitzen der Reader und der Headset-Port.
SDCardreader
SD-Karten lassen sich ohne Einrastmechanismus einschieben und ragen etwa zur Hälfte heraus. Die Geschwindigkeit des Kartenlesers ist gegenüber dem Vorgänger ein Schritt nach vorne und liegt nun im Klassendurchschnitt. Das Kopieren von 1 GB an Bildern von unserer AV PRO microSD 128 GB V60 Referenz-Speicherkarte auf den Desktop gelingt in etwa 13 Sekunden.
| SD Card Reader | |
| average JPG Copy Test (av. of 3 runs) | |
| Durchschnitt der Klasse Multimedia (21.1 - 198, n=41, der letzten 2 Jahre) | |
| Schenker XMG Core 15 Ampere (Toshiba Exceria Pro SDXC 64 GB UHS-II) | |
| Lenovo ThinkBook 16p G2 ACH | |
| Lenovo ThinkBook 15p Gen1 4K (AV Pro V60) | |
| Dell Inspiron 16 Plus 7610 (AV PRO microSD 128 GB V60) | |
| maximum AS SSD Seq Read Test (1GB) | |
| Durchschnitt der Klasse Multimedia (27.4 - 262, n=41, der letzten 2 Jahre) | |
| Schenker XMG Core 15 Ampere (Toshiba Exceria Pro SDXC 64 GB UHS-II) | |
| Lenovo ThinkBook 16p G2 ACH | |
| Lenovo ThinkBook 15p Gen1 4K (AV Pro V60) | |
| Dell Inspiron 16 Plus 7610 (AV PRO microSD 128 GB V60) | |
Kommunikation
Durch das Fehlen eines LAN-Adapters und -anschlusses, stehen nur kabellose Kommunikationsmöglichkeiten wie WLAN und Bluetooth 5 zur Verfügung. Das WLAN-Modul Intel AX200 agiert in unseren Messungen etwas unterdurchschnittlich.
Webcam
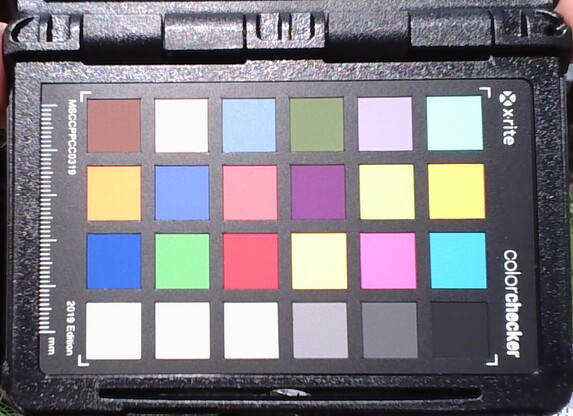
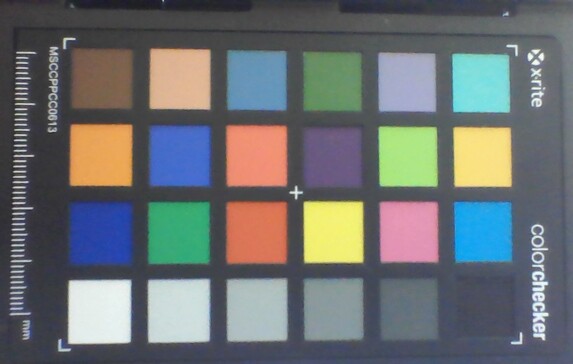
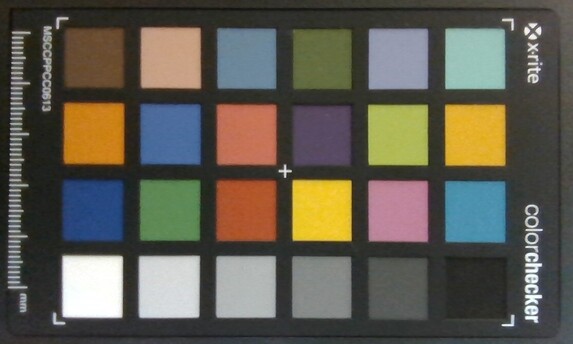
Wundervoll, möchte man meinen, immerhin verzichtet Lenovo auf die sonst übliche Standard-720p-Kamera und setzt stattdessen auf ein FullHD-Modell. Allerdings ist das verbaute Modul kein echtes Kaufargument, denn die Farbabweichungen sind recht groß und das Bild trotz FullHD-Auflösung körnig und verwaschen. Positiv hingegen ist, dass es einen manuellen Shutter gibt, wodurch die Kamera nicht unerlaubt Bilder einfängt.
Die KI-Steuerung zum Separieren der Person vom Hintergrund ist immer wieder fehlerhaft.
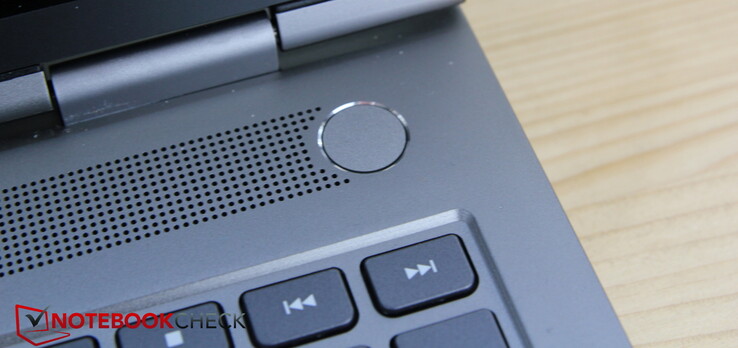
Sicherheit
Zubehör
Zubehör legt Lenovo nicht bei, USB-C-Adapter auf LAN und/oder HDMI bzw. Displayport wären wünschenswert gewesen.
Wartung
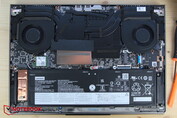
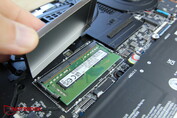
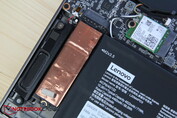
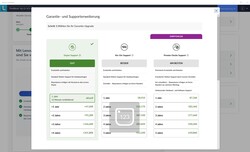
Die Wartung gestaltet sich für Nutzer schwierig, da ein werkseitiger, roter Siegelsticker eine der 8 Torx-Schrauben auf der Unterseite verdeckt. Ein Entfernen hat womöglich einen Garantieverlust zur Folge. Eine Wartungsklappe zum Ausgleich gibt es nicht. Zudem sind 16 GB RAM fest verlötet, der Inhalt des anderen RAM-Slots lässt sich austauschen.
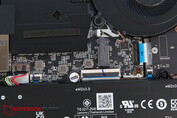
Nach dem Lösen der Schrauben sitzt die Unterseite noch sehr fest und muss mit geeignetem Werkzeug aufgehebelt werden. Sodann erhält man Zugang zu den Lüftern, dem WLAN-Modul, dem RAM-Slot und der SSD. Die letzten beiden verbergen sich aber noch hinter Abdeckhauben und sind teils mit Plastikschalten oder Metallplättchen überklebt. Beispielsweise sitzt auf der SSD ein Plastikstreifen und darüber noch ein Kupferstreifen zum Ableiten von Hitze. Insgesamt sind die Komponenten durch das Überkleben nicht besonders gut zuganglich.
Es scheint noch einen weiteren SSD-Slot ("SSD1") zu geben, der Platz dafür wird jedoch von einigen der übrigen Plastikschalen behindert bzw. überdeckt.
Garantie
Eingabegeräte - Kein ThinkPad, aber ok
Tastatur
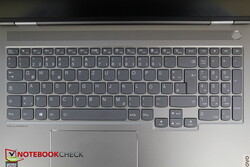
Das Tastenlayout ist etwas anders als noch beim 15p. Im Bereich der Pfeiltasten hat der Tastenuntergrund nun eine Ausbuchtung nach unten, sodass die Pfeiltasten nun normal groß und nun auch besser von den benachbarten Tasten abgesetzt sind.
Die Tasten sind etwa 1,5 cm groß und nach unten hin abgerundet, was einen aufgeräumten Eindruck hinterlässt. Neben den üblichen Sonderfunktionen gibt es eine Taste, welche automatisch die Webseite des Lenovo-Supports aufruft.
Der Hub ist relativ kurz, aber gerade noch ausreichend, das Feedback ist etwas weich geraten. Dennoch gelingt das Schreiben recht flott, die Tippgeräusche sind moderat.
Bei schlechtem Umgebungslicht freut man sich über die zweistufige, weiße Hintergrundbeleuchtung.
Touchpad
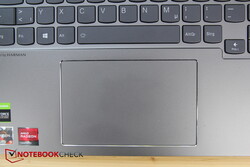
Das Touchpad misst etwa 12 x 7,5 cm und ist somit von einer guten Größe. Die Gleitfähigkeit ist auch bei langsamen Bewegungen noch sehr gut, nur an den äußersten Ecken gibt es Ausfälle.
Dedizierte Maustasten gibt es nicht, die in die Padoberfläche integrierten Tasten lösen zuverlässig aus, die Klickgeräusche sind passabel.
Display - 16:10, aber nur 60 Hz
Das IPS-Display stellt eine der Besonderheiten des ThinkBook 16p dar. Es löst mit 2560 x 1600 Pixel auf, hat also ein Seitenverhältnis von 16:10, bietet allerdings nur 60 Hz - hier wird klar, dass das ThinkBook eben kein reiner Gamer sein soll, denn deren Displays bieten heutzutage zumeist eine höhere Bildwiederholfrequenz.
Die Helligkeit von annähernd 400 Nits ist gut, die Helligkeitsverteilung könnte aber besser sein, die Leuchtkraft nimmt insbesondere in der unteren, rechten Ecke stark ab.
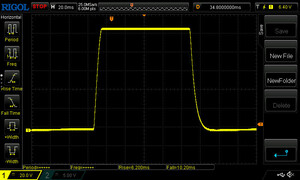
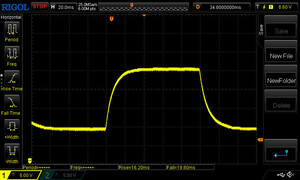
PWM wird nicht eingesetzt. Die Reaktionszeiten sind zumindest für Gamingverhältnisse enttäuschend.
| |||||||||||||||||||||||||
Ausleuchtung: 83 %
Helligkeit Akku: 438 cd/m²
Kontrast: 998:1 (Schwarzwert: 0.44 cd/m²)
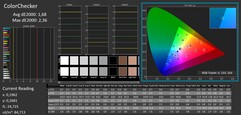
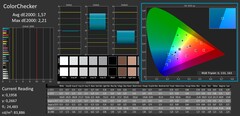
ΔE ColorChecker Calman: 1.68 | ∀{0.5-29.43 Ø4.77}
calibrated: 1.57
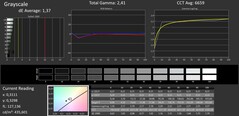
ΔE Greyscale Calman: 1.64 | ∀{0.09-98 Ø5}
77.4% AdobeRGB 1998 (Argyll 3D)
100% sRGB (Argyll 3D)
76.4% Display P3 (Argyll 3D)
Gamma: 2.39
CCT: 6616 K
| Lenovo ThinkBook 16p G2 ACH Lenovo LEN8A95 (AUO B160QAN02.M), IPS, 2560x1600, 16" | Lenovo ThinkBook 15p Gen1 4K CSOT T3 MNF601EA-1, IPS, 3840x2160, 15.6" | Dell Inspiron 16 Plus 7610 AU Optronics B160QAN, IPS, 3072x1920, 16" | Razer Blade 15 Base Edition 2021, i7-10750H RTX 3060 BOE NV156FHM-N4K, IPS, 1920x1080, 15.6" | Alienware m15 R5 Ryzen Edition B156HAN, IPS, 1920x1080, 15.6" | Schenker XMG Core 15 Ampere BOE CQ NE156QHM-NY2, IPS, 2560x1440, 15.6" | |
|---|---|---|---|---|---|---|
| Display | 13% | -2% | -13% | -6% | ||
| Display P3 Coverage (%) | 76.4 | 87.4 14% | 74.1 -3% | 64.3 -16% | 69.8 -9% | |
| sRGB Coverage (%) | 100 | 99.6 0% | 99.4 -1% | 91.8 -8% | 98.8 -1% | |
| AdobeRGB 1998 Coverage (%) | 77.4 | 96.9 25% | 75.8 -2% | 65.5 -15% | 70.7 -9% | |
| Response Times | -44% | -81% | 58% | 69% | 48% | |
| Response Time Grey 50% / Grey 80% * (ms) | 36 | 44.8 ? -24% | 49.2 ? -37% | 8.8 ? 76% | 4 ? 89% | 14.8 ? 59% |
| Response Time Black / White * (ms) | 16.4 | 26.8 ? -63% | 36.8 ? -124% | 10 ? 39% | 8.4 ? 49% | 10.4 ? 37% |
| PWM Frequency (Hz) | 1000 ? | |||||
| Bildschirm | 17% | -21% | -66% | -22% | 4% | |
| Helligkeit Bildmitte (cd/m²) | 439 | 599 36% | 296.8 -32% | 317.2 -28% | 329 -25% | 347 -21% |
| Brightness (cd/m²) | 397 | 599 51% | 292 -26% | 306 -23% | 321 -19% | 328 -17% |
| Brightness Distribution (%) | 83 | 91 10% | 87 5% | 89 7% | 92 11% | 89 7% |
| Schwarzwert * (cd/m²) | 0.44 | 0.37 16% | 0.21 52% | 0.31 30% | 0.27 39% | 0.27 39% |
| Kontrast (:1) | 998 | 1619 62% | 1413 42% | 1023 3% | 1219 22% | 1285 29% |
| Delta E Colorchecker * | 1.68 | 1.4 17% | 2.56 -52% | 4.37 -160% | 2.78 -65% | 1.66 1% |
| Colorchecker dE 2000 max. * | 2.36 | 2.9 -23% | 4.76 -102% | 6.62 -181% | 4.88 -107% | 3.03 -28% |
| Colorchecker dE 2000 calibrated * | 1.57 | 1.86 -18% | 2.67 -70% | 1.63 -4% | 1.23 22% | |
| Delta E Graustufen * | 1.64 | 2.2 -34% | 2.6 -59% | 4.5 -174% | 2.5 -52% | 1.6 2% |
| Gamma | 2.39 92% | 2.14 103% | 2.07 106% | 2.4 92% | 2.106 104% | 2.278 97% |
| CCT | 6616 98% | 6842 95% | 6628 98% | 7418 88% | 6201 105% | 6430 101% |
| Farbraum (Prozent von AdobeRGB 1998) (%) | 83.6 | 59.2 | 76 | 71 | ||
| Color Space (Percent of sRGB) (%) | 99.5 | 91.4 | 99 | 94 | ||
| Durchschnitt gesamt (Programm / Settings) | -5% /
7% | -35% /
-26% | -7% /
-37% | 24% /
-6% | 15% /
8% |
* ... kleinere Werte sind besser
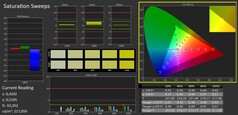
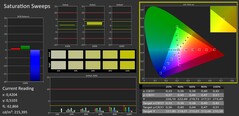
Kontrast und Schwarzwert sind verbesserungswürdig, dafür ist das Display aber schon ab Werk gut konfiguriert mit dementsprechend geringen Farbabweichungen. Eine erneute Kalibrierung bringt kaum noch Verbesserungen.
Lenovo bewirbt den Bildschirm mit einer kompletten sRGB-Abdeckung, was unsere Messwerte bestätigen. AdobeRGB und Display P3 werden noch zu jeweils rund 77 Prozent abgedeckt. Der 4K-Bildschirm des ThinkBook 15p war hier nochmals deutlich besser und deckte auch AdobeRGB fast vollständig ab. Hier gibt es für Kreative also einen kleinen Makel, denn ein optionales 4K-Display wird durch das 16:10-Seitenverhältnis nicht angeboten.
Reaktionszeiten (Response Times) des Displays
| ↔ Reaktionszeiten Schwarz zu Weiß | ||
|---|---|---|
| 16.4 ms ... steigend ↗ und fallend ↘ kombiniert | ↗ ms steigend | |
| ↘ ms fallend | ||
| Die gemessenen Reaktionszeiten sind gut, für anspruchsvolle Spieler könnten der Bildschirm jedoch zu langsam sein. Im Vergleich rangierten die bei uns getesteten Geräte von 0.1 (Minimum) zu 240 (Maximum) ms. » 37 % aller Screens waren schneller als der getestete. Daher sind die gemessenen Reaktionszeiten besser als der Durchschnitt aller vermessenen Geräte (20.2 ms). | ||
| ↔ Reaktionszeiten 50% Grau zu 80% Grau | ||
| 36 ms ... steigend ↗ und fallend ↘ kombiniert | ↗ ms steigend | |
| ↘ ms fallend | ||
| Die gemessenen Reaktionszeiten sind langsam und dadurch für viele Spieler wahrscheinlich zu langsam. Im Vergleich rangierten die bei uns getesteten Geräte von 0.165 (Minimum) zu 636 (Maximum) ms. » 49 % aller Screens waren schneller als der getestete. Daher sind die gemessenen Reaktionszeiten schlechter als der Durchschnitt aller vermessenen Geräte (31.6 ms). | ||
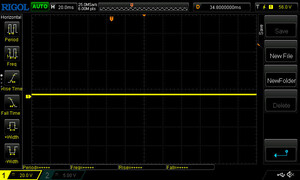
Bildschirm-Flackern / PWM (Pulse-Width Modulation)
| Flackern / PWM nicht festgestellt | |||
Im Vergleich: 53 % aller getesteten Geräte nutzten kein PWM um die Helligkeit zu reduzieren. Wenn PWM eingesetzt wurde, dann bei einer Frequenz von durchschnittlich 8091 (Minimum 5, Maximum 343500) Hz. | |||
Der Anschluss an einen externen Monitor klappte mit Hilfe eines USB-Hubs mit HDMI-Anschluss problemlos.
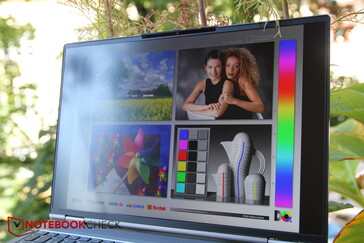
IPS-typisch ist das Display relativ blickwinkelstabil. Allerdings fällt schon beim Blick aus geringen Winkeln auf, dass der "Glanz" verschwindet und das Bild etwas dumpfer wird, was sich danach aber kaum mehr verschlechtert.
Leistung - Ryzen top, gebremste RTX
Für ein Businesslaptop ist das ThinkBook mit seiner NVIDIA GeForce RTX 3060 Laptop GPU, 32 GB RAM und seinem AMD Ryzen 9 5900HX eigentlich überdimensioniert, weshalb Lenovo es vor allem Creators schmackhaft machen möchte. Wenn man einmal von der niedrigen Bildwiederholrate und den weniger guten Reaktionszeiten des Displays absieht, könnte sich der Laptop aber auch als Gamer empfehlen, die Leistung dafür sollte vorhanden sein.
Prozessor
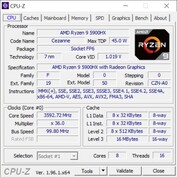
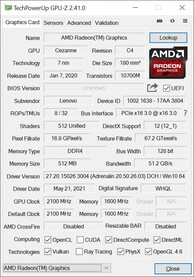
Der AMD Ryzen 9 5900HX ist ein leistungsstarker Prozessor mit 8 Kernen, welche im Turbo mit bis zu 4,6 GHz takten und insgesamt 16 Threads gleichzeitig bearbeiten können. Zudem ist die GPU Radeon RX Vega 8 integriert.
Die Leistung in unserem Cinebench-R15-Dauertest ist sehr konstant, ohne den sonst typischen Abfall nach den ersten Durchläufen. Den Intel Core i7-11800H mit ebenfalls 8 Kernen übertrifft der Ryzen klar. Während sie im Single-Thread auf Augenhöhe liegen, hat die AMD-CPU in Multi-Thread-Tests etwa 20 Prozent Vorsprung! Die CPU im ThinkBook ist erwartungsgemäß sogar etwas schneller als der AMD Ryzen 7 5800H im Alienware-Gamer.
Im Akkumodus sinkt die Cinebench-R15-Punktzahl auf 1.444 ab, das entspricht einem Leistungsrückgang von rund 33 Prozent!
Cinebench R15 Multi Dauertest
Cinebench R20: CPU (Single Core) | CPU (Multi Core)
Cinebench R15: CPU Single 64Bit | CPU Multi 64Bit
Blender: v2.79 BMW27 CPU
7-Zip 18.03: 7z b 4 -mmt1 | 7z b 4
Geekbench 5.5: Single-Core | Multi-Core
HWBOT x265 Benchmark v2.2: 4k Preset
LibreOffice : 20 Documents To PDF
R Benchmark 2.5: Overall mean
| Cinebench R23 / Single Core | |
| Durchschnitt der Klasse Multimedia (1128 - 2459, n=71, der letzten 2 Jahre) | |
| Dell Inspiron 16 Plus 7610 | |
| Lenovo ThinkBook 16p G2 ACH | |
| Durchschnittliche AMD Ryzen 9 5900HX (1218 - 1499, n=29) | |
| Alienware m15 R5 Ryzen Edition | |
| Schenker XMG Core 15 Ampere | |
| Razer Blade 15 Base Edition 2021, i7-10750H RTX 3060 | |
| Lenovo ThinkBook 15p Gen1 4K | |
| Cinebench R23 / Multi Core | |
| Durchschnitt der Klasse Multimedia (4861 - 33362, n=79, der letzten 2 Jahre) | |
| Lenovo ThinkBook 16p G2 ACH | |
| Durchschnittliche AMD Ryzen 9 5900HX (6622 - 14363, n=30) | |
| Alienware m15 R5 Ryzen Edition | |
| Schenker XMG Core 15 Ampere | |
| Dell Inspiron 16 Plus 7610 | |
| Lenovo ThinkBook 15p Gen1 4K | |
| Razer Blade 15 Base Edition 2021, i7-10750H RTX 3060 | |
| Cinebench R20 / CPU (Single Core) | |
| Durchschnitt der Klasse Multimedia (420 - 853, n=62, der letzten 2 Jahre) | |
| Dell Inspiron 16 Plus 7610 | |
| Lenovo ThinkBook 16p G2 ACH | |
| Durchschnittliche AMD Ryzen 9 5900HX (471 - 584, n=29) | |
| Alienware m15 R5 Ryzen Edition | |
| Schenker XMG Core 15 Ampere | |
| Razer Blade 15 Base Edition 2021, i7-10750H RTX 3060 | |
| Lenovo ThinkBook 15p Gen1 4K | |
| Cinebench R20 / CPU (Multi Core) | |
| Durchschnitt der Klasse Multimedia (1887 - 12912, n=62, der letzten 2 Jahre) | |
| Lenovo ThinkBook 16p G2 ACH | |
| Durchschnittliche AMD Ryzen 9 5900HX (2242 - 5476, n=30) | |
| Alienware m15 R5 Ryzen Edition | |
| Schenker XMG Core 15 Ampere | |
| Dell Inspiron 16 Plus 7610 | |
| Lenovo ThinkBook 15p Gen1 4K | |
| Razer Blade 15 Base Edition 2021, i7-10750H RTX 3060 | |
| Cinebench R15 / CPU Single 64Bit | |
| Durchschnitt der Klasse Multimedia (99.6 - 326, n=65, der letzten 2 Jahre) | |
| Lenovo ThinkBook 16p G2 ACH | |
| Durchschnittliche AMD Ryzen 9 5900HX (197 - 243, n=25) | |
| Alienware m15 R5 Ryzen Edition | |
| Dell Inspiron 16 Plus 7610 | |
| Razer Blade 15 Base Edition 2021, i7-10750H RTX 3060 | |
| Lenovo ThinkBook 15p Gen1 4K | |
| Schenker XMG Core 15 Ampere | |
| Cinebench R15 / CPU Multi 64Bit | |
| Durchschnitt der Klasse Multimedia (856 - 5224, n=68, der letzten 2 Jahre) | |
| Lenovo ThinkBook 16p G2 ACH | |
| Durchschnittliche AMD Ryzen 9 5900HX (1076 - 2267, n=29) | |
| Alienware m15 R5 Ryzen Edition | |
| Schenker XMG Core 15 Ampere | |
| Dell Inspiron 16 Plus 7610 | |
| Lenovo ThinkBook 15p Gen1 4K | |
| Razer Blade 15 Base Edition 2021, i7-10750H RTX 3060 | |
| Blender / v2.79 BMW27 CPU | |
| Razer Blade 15 Base Edition 2021, i7-10750H RTX 3060 | |
| Lenovo ThinkBook 15p Gen1 4K | |
| Dell Inspiron 16 Plus 7610 | |
| Alienware m15 R5 Ryzen Edition | |
| Schenker XMG Core 15 Ampere | |
| Durchschnittliche AMD Ryzen 9 5900HX (219 - 442, n=29) | |
| Durchschnitt der Klasse Multimedia (100 - 557, n=63, der letzten 2 Jahre) | |
| Lenovo ThinkBook 16p G2 ACH | |
| 7-Zip 18.03 / 7z b 4 -mmt1 | |
| Lenovo ThinkBook 16p G2 ACH | |
| Durchschnitt der Klasse Multimedia (3666 - 7545, n=61, der letzten 2 Jahre) | |
| Durchschnittliche AMD Ryzen 9 5900HX (4791 - 5905, n=29) | |
| Alienware m15 R5 Ryzen Edition | |
| Dell Inspiron 16 Plus 7610 | |
| Razer Blade 15 Base Edition 2021, i7-10750H RTX 3060 | |
| Lenovo ThinkBook 15p Gen1 4K | |
| Schenker XMG Core 15 Ampere | |
| 7-Zip 18.03 / 7z b 4 | |
| Durchschnitt der Klasse Multimedia (29095 - 130368, n=61, der letzten 2 Jahre) | |
| Lenovo ThinkBook 16p G2 ACH | |
| Durchschnittliche AMD Ryzen 9 5900HX (36011 - 62503, n=29) | |
| Alienware m15 R5 Ryzen Edition | |
| Schenker XMG Core 15 Ampere | |
| Dell Inspiron 16 Plus 7610 | |
| Lenovo ThinkBook 15p Gen1 4K | |
| Razer Blade 15 Base Edition 2021, i7-10750H RTX 3060 | |
| Geekbench 5.5 / Single-Core | |
| Durchschnitt der Klasse Multimedia (805 - 2974, n=62, der letzten 2 Jahre) | |
| Lenovo ThinkBook 16p G2 ACH | |
| Durchschnittliche AMD Ryzen 9 5900HX (1271 - 1574, n=27) | |
| Alienware m15 R5 Ryzen Edition | |
| Razer Blade 15 Base Edition 2021, i7-10750H RTX 3060 | |
| Lenovo ThinkBook 15p Gen1 4K | |
| Schenker XMG Core 15 Ampere | |
| Geekbench 5.5 / Multi-Core | |
| Durchschnitt der Klasse Multimedia (4652 - 20422, n=62, der letzten 2 Jahre) | |
| Lenovo ThinkBook 16p G2 ACH | |
| Durchschnittliche AMD Ryzen 9 5900HX (5057 - 9294, n=27) | |
| Schenker XMG Core 15 Ampere | |
| Alienware m15 R5 Ryzen Edition | |
| Lenovo ThinkBook 15p Gen1 4K | |
| Razer Blade 15 Base Edition 2021, i7-10750H RTX 3060 | |
| HWBOT x265 Benchmark v2.2 / 4k Preset | |
| Durchschnitt der Klasse Multimedia (5.26 - 36.1, n=61, der letzten 2 Jahre) | |
| Lenovo ThinkBook 16p G2 ACH | |
| Durchschnittliche AMD Ryzen 9 5900HX (8.26 - 17.1, n=29) | |
| Alienware m15 R5 Ryzen Edition | |
| Schenker XMG Core 15 Ampere | |
| Dell Inspiron 16 Plus 7610 | |
| Lenovo ThinkBook 15p Gen1 4K | |
| Razer Blade 15 Base Edition 2021, i7-10750H RTX 3060 | |
| LibreOffice / 20 Documents To PDF | |
| Schenker XMG Core 15 Ampere | |
| Alienware m15 R5 Ryzen Edition | |
| Lenovo ThinkBook 15p Gen1 4K | |
| Lenovo ThinkBook 16p G2 ACH | |
| Durchschnittliche AMD Ryzen 9 5900HX (44.1 - 87.4, n=29) | |
| Durchschnitt der Klasse Multimedia (23.9 - 146.7, n=62, der letzten 2 Jahre) | |
| Razer Blade 15 Base Edition 2021, i7-10750H RTX 3060 | |
| Dell Inspiron 16 Plus 7610 | |
| R Benchmark 2.5 / Overall mean | |
| Razer Blade 15 Base Edition 2021, i7-10750H RTX 3060 | |
| Lenovo ThinkBook 15p Gen1 4K | |
| Schenker XMG Core 15 Ampere | |
| Dell Inspiron 16 Plus 7610 | |
| Alienware m15 R5 Ryzen Edition | |
| Durchschnittliche AMD Ryzen 9 5900HX (0.48 - 0.599, n=29) | |
| Lenovo ThinkBook 16p G2 ACH | |
| Durchschnitt der Klasse Multimedia (0.3604 - 0.947, n=61, der letzten 2 Jahre) | |
* ... kleinere Werte sind besser
System Performance
| PCMark 10 / Score | |
| Durchschnitt der Klasse Multimedia (4325 - 10386, n=55, der letzten 2 Jahre) | |
| Lenovo ThinkBook 16p G2 ACH | |
| Durchschnittliche AMD Ryzen 9 5900HX, NVIDIA GeForce RTX 3060 Laptop GPU (6505 - 6725, n=2) | |
| Alienware m15 R5 Ryzen Edition | |
| Razer Blade 15 Base Edition 2021, i7-10750H RTX 3060 | |
| Dell Inspiron 16 Plus 7610 | |
| Schenker XMG Core 15 Ampere | |
| Lenovo ThinkBook 15p Gen1 4K | |
| PCMark 10 / Essentials | |
| Durchschnitt der Klasse Multimedia (8025 - 12420, n=55, der letzten 2 Jahre) | |
| Lenovo ThinkBook 16p G2 ACH | |
| Razer Blade 15 Base Edition 2021, i7-10750H RTX 3060 | |
| Durchschnittliche AMD Ryzen 9 5900HX, NVIDIA GeForce RTX 3060 Laptop GPU (9827 - 10324, n=2) | |
| Dell Inspiron 16 Plus 7610 | |
| Alienware m15 R5 Ryzen Edition | |
| Schenker XMG Core 15 Ampere | |
| Lenovo ThinkBook 15p Gen1 4K | |
| PCMark 10 / Productivity | |
| Durchschnitt der Klasse Multimedia (7323 - 16647, n=55, der letzten 2 Jahre) | |
| Lenovo ThinkBook 16p G2 ACH | |
| Durchschnittliche AMD Ryzen 9 5900HX, NVIDIA GeForce RTX 3060 Laptop GPU (8803 - 9128, n=2) | |
| Alienware m15 R5 Ryzen Edition | |
| Dell Inspiron 16 Plus 7610 | |
| Razer Blade 15 Base Edition 2021, i7-10750H RTX 3060 | |
| Schenker XMG Core 15 Ampere | |
| Lenovo ThinkBook 15p Gen1 4K | |
| PCMark 10 / Digital Content Creation | |
| Durchschnitt der Klasse Multimedia (3651 - 16240, n=55, der letzten 2 Jahre) | |
| Lenovo ThinkBook 16p G2 ACH | |
| Durchschnittliche AMD Ryzen 9 5900HX, NVIDIA GeForce RTX 3060 Laptop GPU (8634 - 8759, n=2) | |
| Alienware m15 R5 Ryzen Edition | |
| Schenker XMG Core 15 Ampere | |
| Razer Blade 15 Base Edition 2021, i7-10750H RTX 3060 | |
| Dell Inspiron 16 Plus 7610 | |
| Lenovo ThinkBook 15p Gen1 4K | |
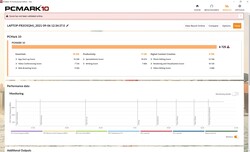
| PCMark 10 Score | 6725 Punkte | |
Hilfe | ||
DPC-Latenzen
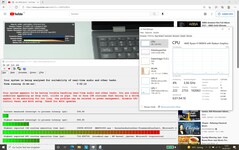
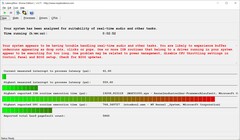
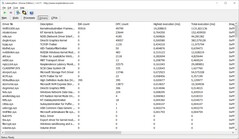
Mehrere Browsertabs bereiten dem ThinkBook keinerlei Probleme, wohl aber das Aufrufen unseres 4K/60-fps-Testvideos auf YouTube, welches es mit zwei Dropped Frames abspielt. Das Tool LatencyMon zeigt zudem an, dass es Probleme bei der Echtzeit-Audiowiedergabe gibt. Schuld ist mal wieder vor allem der Kernelmodustreiber-Frameworklaufzeit.
| DPC Latencies / LatencyMon - interrupt to process latency (max), Web, Youtube, Prime95 | |
| Dell Inspiron 16 Plus 7610 | |
| Lenovo ThinkBook 15p Gen1 4K | |
| Razer Blade 15 Base Edition 2021, i7-10750H RTX 3060 | |
| Lenovo ThinkBook 16p G2 ACH | |
| Schenker XMG Core 15 Ampere | |
| Alienware m15 R5 Ryzen Edition | |
* ... kleinere Werte sind besser
Massenspeicher
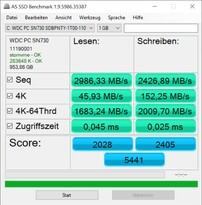
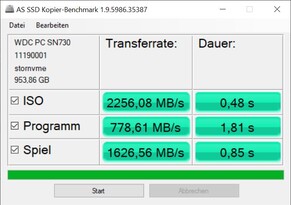
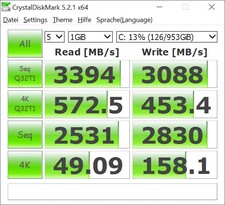
Lenovo verbaut eine 1 TB große NVMe-SSD von Western Digital, welche in unserem SSD/HDD-Ranking auf Platz 28 rangiert. Die verbaute SSD ist sogar rund 10 Prozent schneller als das gleiche Modell im ThinkBook 15p. Die meisten Konkurrenten können abgehängt werden, nur die SSD im Schenker XMG Core 15 ist minimal schneller.
| Lenovo ThinkBook 16p G2 ACH WDC PC SN730 SDBPNTY-1T00 | Lenovo ThinkBook 15p Gen1 4K WDC PC SN730 SDBPNTY-1T00 | Dell Inspiron 16 Plus 7610 Kingston OM3PDP3512B | Razer Blade 15 Base Edition 2021, i7-10750H RTX 3060 Samsung SSD PM981a MZVLB512HBJQ | Alienware m15 R5 Ryzen Edition Toshiba KBG40ZNS512G NVMe | Schenker XMG Core 15 Ampere Samsung SSD 970 EVO Plus 1TB | Durchschnittliche WDC PC SN730 SDBPNTY-1T00 | |
|---|---|---|---|---|---|---|---|
| CrystalDiskMark 5.2 / 6 | -9% | -23% | -10% | -26% | 2% | -10% | |
| Write 4K (MB/s) | 158.1 | 150.8 -5% | 176.8 12% | 123.8 -22% | 116.9 -26% | 139.1 -12% | 139.9 ? -12% |
| Read 4K (MB/s) | 49.09 | 43.01 -12% | 52.3 7% | 45.53 -7% | 44.56 -9% | 47.59 -3% | 44.5 ? -9% |
| Write Seq (MB/s) | 2830 | 2846 1% | 1170 -59% | 2132 -25% | 1552 -45% | 2917 3% | 2346 ? -17% |
| Read Seq (MB/s) | 2531 | 2366 -7% | 1557 -38% | 2067 -18% | 1682 -34% | 2586 2% | 2102 ? -17% |
| Write 4K Q32T1 (MB/s) | 453.4 | 450 -1% | 471.5 4% | 462.9 2% | 497.8 10% | 511 13% | 442 ? -3% |
| Read 4K Q32T1 (MB/s) | 573 | 295.5 -48% | 437.9 -24% | 553 -3% | 436.8 -24% | 571 0% | 460 ? -20% |
| Write Seq Q32T1 (MB/s) | 3088 | 3079 0% | 1214 -61% | 2955 -4% | 1461 -53% | 3263 6% | 3049 ? -1% |
| Read Seq Q32T1 (MB/s) | 3394 | 3433 1% | 2549 -25% | 3246 -4% | 2364 -30% | 3567 5% | 3285 ? -3% |
| AS SSD | -15% | -43% | -35% | -83% | 4% | -27% | |
| Seq Read (MB/s) | 2986 | 2852 -4% | 2077 -30% | 2401 -20% | 2082 -30% | 2829 -5% | 2606 ? -13% |
| Seq Write (MB/s) | 2426 | 2344 -3% | 778 -68% | 2087 -14% | 825 -66% | 2646 9% | 1935 ? -20% |
| 4K Read (MB/s) | 45.93 | 37.3 -19% | 49.6 8% | 49.58 8% | 42.41 -8% | 54.8 19% | 42.9 ? -7% |
| 4K Write (MB/s) | 152.3 | 79.6 -48% | 236.1 55% | 98.8 -35% | 98.3 -35% | 179.1 18% | 129.1 ? -15% |
| 4K-64 Read (MB/s) | 1683 | 1500 -11% | 801 -52% | 1601 -5% | 1255 -25% | 1734 3% | 1361 ? -19% |
| 4K-64 Write (MB/s) | 2010 | 2055 2% | 942 -53% | 1862 -7% | 738 -63% | 2396 19% | 1920 ? -4% |
| Access Time Read * (ms) | 0.045 | 0.053 -18% | 0.06 -33% | 0.06 -33% | 0.109 -142% | 0.033 27% | 0.0689 ? -53% |
| Access Time Write * (ms) | 0.025 | 0.033 -32% | 0.073 -192% | 0.11 -340% | 0.17 -580% | 0.021 16% | 0.06215 ? -149% |
| Score Read (Points) | 2028 | 1822 -10% | 1059 -48% | 1890 -7% | 1506 -26% | 2072 2% | 1664 ? -18% |
| Score Write (Points) | 2405 | 2369 -1% | 1256 -48% | 2170 -10% | 918 -62% | 2839 18% | 2242 ? -7% |
| Score Total (Points) | 5441 | 5095 -6% | 2804 -48% | 5015 -8% | 3136 -42% | 5965 10% | 4726 ? -13% |
| Copy ISO MB/s (MB/s) | 2256 | 2071 -8% | 1028 -54% | 2206 -2% | 1391 -38% | 2119 -6% | 2041 ? -10% |
| Copy Program MB/s (MB/s) | 779 | 605 -22% | 794 2% | 694 -11% | 645 -17% | 406.1 -48% | 552 ? -29% |
| Copy Game MB/s (MB/s) | 1627 | 1131 -30% | 987 -39% | 1555 -4% | 1101 -32% | 1086 -33% | 1183 ? -27% |
| Durchschnitt gesamt (Programm / Settings) | -12% /
-13% | -33% /
-36% | -23% /
-26% | -55% /
-63% | 3% /
3% | -19% /
-21% |
* ... kleinere Werte sind besser
Dauerleistung Lesen: DiskSpd Read Loop, Queue Depth 8
Grafikkarte
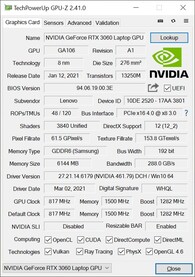
Im ThinkBook 16p kommen je nach Belastung entweder die in die CPU integrierte Radeon RX Vega 8 oder aber die deutlich potentere NVIDIA GeForce RTX 3060 Laptop GPU zum Zuge. Leider weist Lenovo auf seiner Produktseite nicht aus, mit welcher TGP die RTX 3060 läuft - ein Nogo eines Herstellers bei einem so wichtigen Leistungswert.
Andernorts ist die TGP mit 75 W angegeben, der Wert kann bei einer RTX 3060 zwischen 60 und 115 W liegen, ist im Testmodell also eher niedrig angesetzt. In den 3DMarks performt sie daher etwas unterhalb einer durchschnittlichen RTX 3060 aus unserer Datenbank. Hier zeigt die Gamer-Konkurrenz mehr Muskeln, allerdings liegt das Dell Inspiron 16 Plus 7610 mit RTX 3050 meist nochmals 20 bis 30 Prozent hinter unserem ThinkBook.
Im Akkumodus bricht die GPU-Leistung sehr stark ein. Anstelle von 24.689 Punkten messen wir im 3DMark 11 nur noch 6.900 GPU-Punkte, ein Einbruch von über 70 Prozent!
| 3DMark 11 Performance | 21986 Punkte | |
| 3DMark Cloud Gate Standard Score | 42348 Punkte | |
| 3DMark Fire Strike Score | 16883 Punkte | |
| 3DMark Time Spy Score | 7634 Punkte | |
Hilfe | ||
Gaming Performance
Beim Gaming sollte darauf geachtet werden, dass das 16:10-Seitenverhältnis bei den 16:9-Standardauflösungen wie FullHD dazu führt, dass das Bild gestreckt wird und mit ihm alle Figuren und Objekte im Game.
In Witcher 3 bestätigt sich das Ergebnis aus den 3DMarks: Je höher die Auflösung und der Detailgrad, desto größer sind die Unterschiede zur Gamerkonkurrenz. Insgesamt rechnet die RTX 3060 zwar nur minimal unter dem Erwartungsniveau, die Gaming-Laptops der Konkurrenz liegen aber meist deutlich darüber.
Hinzu kommt, dass die native Auflösung oberhalb von FullHD liegt, was der GPU so einiges abverlangt. Allerdings schafft das 16p auch in der nativen Auflösung etwa 53 fps in Witcher 3. Auch in Far Cry 5 reicht es in der nativen Auflösung noch für 67 fps bei Ultra-Settings. In Shadow of the Tomb Raider kommt man auf 58 fps.
Die Witcher-3-Framerate ist auch über eine Stunde hinweg recht stabil und sinkt nur unwesentlich ab.
Witcher 3 FPS-Diagramm
| min. | mittel | hoch | max. | |
|---|---|---|---|---|
| GTA V (2015) | 178 | 149 | 87.3 | |
| The Witcher 3 (2015) | 313 | 132 | 73 | |
| Dota 2 Reborn (2015) | 152 | 146 | 129 | 121 |
| X-Plane 11.11 (2018) | 103 | 88.6 | 74 | |
| Far Cry 5 (2018) | 114 | 98 | 95 | 90 |
| Strange Brigade (2018) | 292 | 169 | 142 | 125 |
| Shadow of the Tomb Raider (2018) | 137 | 107 | 101 | 91 |
Emissionen - Unauffälliges Lenovo ThinkBook
Geräuschemissionen
Die Geräuschentwicklung des ThinkBook 16p bewegt sich auf Erwartungsniveau. Gut ist, dass das System im Leerlauf die Lüfter meistens nicht aktiviert und somit Stille herrscht. Unter Last bleibt es leiser als die GPU-potenteren Gaming-Konkurrenten, das Dell Inspiron läuft mit schwächerer GPU auch nicht ruhiger.
Die Lüfter an sich rotieren etwas zu hochtonig für unseren Geschmack, der Störfaktor hält sich jedoch in Grenzen.
Lautstärkediagramm
| Idle |
| 23 / 23 / 23 dB(A) |
| Last |
| 35.66 / 48.13 dB(A) |
 | ||
30 dB leise 40 dB(A) deutlich hörbar 50 dB(A) störend |
||
min: | ||
| Lenovo ThinkBook 16p G2 ACH GeForce RTX 3060 Laptop GPU, R9 5900HX, WDC PC SN730 SDBPNTY-1T00 | Lenovo ThinkBook 15p Gen1 4K GeForce GTX 1650 Ti Max-Q, i7-10750H, WDC PC SN730 SDBPNTY-1T00 | Dell Inspiron 16 Plus 7610 GeForce RTX 3050 4GB Laptop GPU, i7-11800H, Kingston OM3PDP3512B | Razer Blade 15 Base Edition 2021, i7-10750H RTX 3060 GeForce RTX 3060 Laptop GPU, i7-10750H, Samsung SSD PM981a MZVLB512HBJQ | Alienware m15 R5 Ryzen Edition GeForce RTX 3060 Laptop GPU, R7 5800H, Toshiba KBG40ZNS512G NVMe | Schenker XMG Core 15 Ampere GeForce RTX 3060 Laptop GPU, R7 4800H, Samsung SSD 970 EVO Plus 1TB | |
|---|---|---|---|---|---|---|
| Geräuschentwicklung | -12% | -9% | -8% | -14% | -14% | |
| aus / Umgebung * (dB) | 23 | 28.7 -25% | 24.4 -6% | 25.3 -10% | 24 -4% | 24 -4% |
| Idle min * (dB) | 23 | 28.7 -25% | 24.4 -6% | 25.4 -10% | 24 -4% | 26 -13% |
| Idle avg * (dB) | 23 | 28.7 -25% | 24.4 -6% | 25.4 -10% | 25 -9% | 28 -22% |
| Idle max * (dB) | 23 | 28.7 -25% | 24.4 -6% | 25.4 -10% | 35 -52% | 30 -30% |
| Last avg * (dB) | 35.66 | 34.8 2% | 48.3 -35% | 42.5 -19% | 44 -23% | 42 -18% |
| Witcher 3 ultra * (dB) | 48.7 | 43.6 10% | 48.9 -0% | 42 14% | 48 1% | 50 -3% |
| Last max * (dB) | 48.13 | 45.6 5% | 48.9 -2% | 52.2 -8% | 50 -4% | 52 -8% |
* ... kleinere Werte sind besser
Temperatur
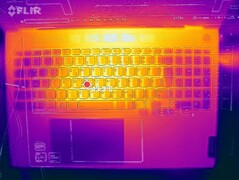
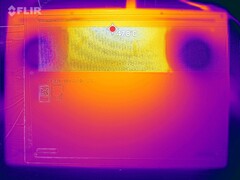
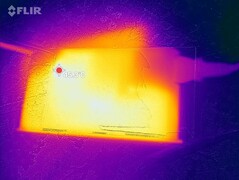
Hot-Spots gibt es zentral zum Display hin, hier können Temperaturen von 50 (oben) bis 53 °C (unten) im Stresstest oder Witcher 3 erreicht werden. Der Bereich der Handballenauflagen bleibt mit knapp über 30 °C vergleichsweise kühl, die WASD-Tasten können jedoch bis zu 45 °C warm werden. Das Razer Blade bleibt unter Last etwas kühler, das Alienware wird deutlich heißer, ansonsten liegt die Konkurrenz hier dicht beieinander.
(-) Die maximale Temperatur auf der Oberseite ist 50 °C. Im Vergleich liegt der Klassendurchschnitt bei 36.9 °C (von 21.1 bis 71 °C für die Klasse Multimedia).
(-) Auf der Unterseite messen wir eine maximalen Wert von 53 °C (im Vergleich zum Durchschnitt von 39.2 °C).
(+) Ohne Last messen wir eine durchschnittliche Temperatur von 28.1 °C auf der Oberseite. Der Klassendurchschnitt erreicht 31.3 °C.
(-) Beim längeren Spielen von The Witcher 3 erhitzt sich das Gerät durchschnittlich auf 40.6 °C. Der Durchschnitt der Klasse ist derzeit 31.3 °C.
(+) Die Handballen und der Touchpad-Bereich erreichen maximal 34 °C und damit die typische Hauttemperatur und fühlen sich daher nicht heiß an.
(-) Die durchschnittliche Handballen-Temperatur anderer getesteter Geräte war 28.7 °C (-5.3 °C).
| Lenovo ThinkBook 16p G2 ACH GeForce RTX 3060 Laptop GPU, R9 5900HX, WDC PC SN730 SDBPNTY-1T00 | Lenovo ThinkBook 15p Gen1 4K GeForce GTX 1650 Ti Max-Q, i7-10750H, WDC PC SN730 SDBPNTY-1T00 | Dell Inspiron 16 Plus 7610 GeForce RTX 3050 4GB Laptop GPU, i7-11800H, Kingston OM3PDP3512B | Razer Blade 15 Base Edition 2021, i7-10750H RTX 3060 GeForce RTX 3060 Laptop GPU, i7-10750H, Samsung SSD PM981a MZVLB512HBJQ | Alienware m15 R5 Ryzen Edition GeForce RTX 3060 Laptop GPU, R7 5800H, Toshiba KBG40ZNS512G NVMe | Schenker XMG Core 15 Ampere GeForce RTX 3060 Laptop GPU, R7 4800H, Samsung SSD 970 EVO Plus 1TB | |
|---|---|---|---|---|---|---|
| Hitze | 19% | -7% | -6% | -18% | 3% | |
| Last oben max * (°C) | 50 | 41.2 18% | 46.4 7% | 45.2 10% | 62 -24% | 48 4% |
| Last unten max * (°C) | 53 | 47 11% | 54.8 -3% | 48 9% | 61 -15% | 50 6% |
| Idle oben max * (°C) | 29 | 22.6 22% | 31.4 -8% | 34.4 -19% | 36 -24% | 28 3% |
| Idle unten max * (°C) | 30 | 23.1 23% | 36.6 -22% | 37.2 -24% | 33 -10% | 31 -3% |
* ... kleinere Werte sind besser
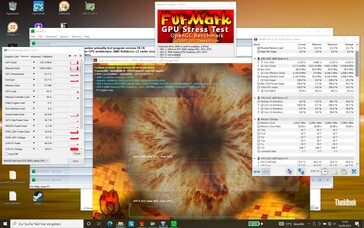
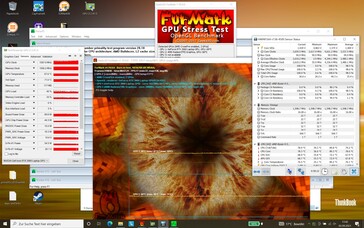
Den Stresstest starten die CPU-Kerne bei etwa 4,2 GHz. Über eine Stunde hinweg sinkt der Takt und schwankt letztlich zwischen etwa 3,4 und 4 GHz. Die Kerntemperaturen bleiben dabei stets unterhalb von 90 °C.
Der GPU-Takt schwankt über den ganzen Test zwischen rund 1,3 und 1,8 GHz. Dabei erhitzt sich die Grafikkarte auf bis zu 75 °C, ein unproblematischer Wert. Ein erneuter 3DMark-11-Durchlauf zeigt, dass sich die Hardware schnell vom Stress erholt, signifikante Leistungseinbußen sind nicht zu beobachten.
Lautsprecher
Die Lautsprecher bilden Mittel- und Hochtöne ausgeglichen ab, die Basswiedergabe ist wie so oft bestenfalls mittelprächtig. Zudem könnten die Boxen gerne noch etwas lauter aufspielen. Für externe Audiogeräte stehen an analogen Ports nur der kombinierte Kopfhörer- und Mikrofonanschluss bereit.
Lenovo ThinkBook 16p G2 ACH Audio Analyse
(±) | Mittelmäßig laut spielende Lautsprecher (74.8 dB)
Bass 100 - 315 Hz
(±) | abgesenkter Bass - 14.7% geringer als der Median
(±) | durchschnittlich lineare Bass-Wiedergabe (11.1% Delta zum Vorgänger)
Mitteltöne 400 - 2000 Hz
(+) | ausgeglichene Mitten, vom Median nur 4.2% abweichend
(+) | lineare Mitten (5.5% Delta zum Vorgänger)
Hochtöne 2 - 16 kHz
(+) | ausgeglichene Hochtöne, vom Median nur 2.7% abweichend
(+) | sehr lineare Hochtöne (6.6% Delta zum Vorgänger)
Gesamt im hörbaren Bereich 100 - 16.000 Hz
(+) | hörbarer Bereich ist sehr linear (14.9% Abstand zum Median
Im Vergleich zu allen Geräten derselben Klasse
» 33% aller getesteten Geräte dieser Klasse waren besser, 5% vergleichbar, 62% schlechter
» Das beste Gerät hat einen Delta-Wert von 5%, durchschnittlich ist 17%, das schlechteste Gerät hat 45%
Im Vergleich zu allen Geräten im Test
» 19% aller getesteten Geräte waren besser, 4% vergleichbar, 77% schlechter
» Das beste Gerät hat einen Delta-Wert von 4%, durchschnittlich ist 24%, das schlechteste Gerät hat 134%
Dell Inspiron 16 Plus 7610 Audio Analyse
(±) | Mittelmäßig laut spielende Lautsprecher (75.3 dB)
Bass 100 - 315 Hz
(±) | abgesenkter Bass - 14.4% geringer als der Median
(±) | durchschnittlich lineare Bass-Wiedergabe (8.4% Delta zum Vorgänger)
Mitteltöne 400 - 2000 Hz
(±) | zu hohe Mitten, vom Median 5.6% abweichend
(±) | Linearität der Mitten ist durchschnittlich (7.9% Delta zum Vorgänger)
Hochtöne 2 - 16 kHz
(+) | ausgeglichene Hochtöne, vom Median nur 3.9% abweichend
(±) | durchschnittlich lineare Hochtöne (7.2% Delta zum Vorgänger)
Gesamt im hörbaren Bereich 100 - 16.000 Hz
(±) | hörbarer Bereich ist durchschnittlich linear (19.3% Abstand zum Median)
Im Vergleich zu allen Geräten derselben Klasse
» 60% aller getesteten Geräte dieser Klasse waren besser, 8% vergleichbar, 31% schlechter
» Das beste Gerät hat einen Delta-Wert von 5%, durchschnittlich ist 17%, das schlechteste Gerät hat 45%
Im Vergleich zu allen Geräten im Test
» 46% aller getesteten Geräte waren besser, 8% vergleichbar, 46% schlechter
» Das beste Gerät hat einen Delta-Wert von 4%, durchschnittlich ist 24%, das schlechteste Gerät hat 134%
Energieverwaltung - Angemessener Verbrauch, gute Laufzeit
Energieaufnahme
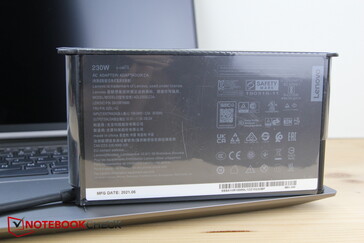
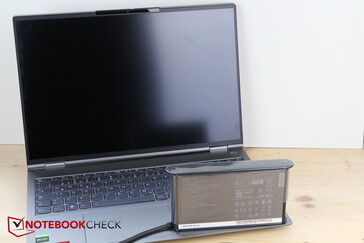
Beim Verbrauch reiht sich der Laptop zwischen dem Inspiron mit RTX 3050 und den Gamern ein. Im Idle verbraucht das System minimal mehr als die Konkurrenz, unter Last senkt die niedrige TGP der Grafikkarte den Maximalverbrauch, welcher temporär ein Maximum von 142 W erreicht. Das Netzteil bewältigt 230 W, ist also weit davon entfernt vor Probleme gestellt zu werden.
| Aus / Standby | |
| Idle | |
| Last |
|
Legende:
min: | |
| Lenovo ThinkBook 16p G2 ACH R9 5900HX, GeForce RTX 3060 Laptop GPU, WDC PC SN730 SDBPNTY-1T00, IPS, 2560x1600, 16" | Lenovo ThinkBook 15p Gen1 4K i7-10750H, GeForce GTX 1650 Ti Max-Q, WDC PC SN730 SDBPNTY-1T00, IPS, 3840x2160, 15.6" | Dell Inspiron 16 Plus 7610 i7-11800H, GeForce RTX 3050 4GB Laptop GPU, Kingston OM3PDP3512B, IPS, 3072x1920, 16" | Razer Blade 15 Base Edition 2021, i7-10750H RTX 3060 i7-10750H, GeForce RTX 3060 Laptop GPU, Samsung SSD PM981a MZVLB512HBJQ, IPS, 1920x1080, 15.6" | Alienware m15 R5 Ryzen Edition R7 5800H, GeForce RTX 3060 Laptop GPU, Toshiba KBG40ZNS512G NVMe, IPS, 1920x1080, 15.6" | Schenker XMG Core 15 Ampere R7 4800H, GeForce RTX 3060 Laptop GPU, Samsung SSD 970 EVO Plus 1TB, IPS, 2560x1440, 15.6" | Durchschnittliche NVIDIA GeForce RTX 3060 Laptop GPU | Durchschnitt der Klasse Multimedia | |
|---|---|---|---|---|---|---|---|---|
| Stromverbrauch | 22% | 15% | -19% | -25% | -18% | -12% | 32% | |
| Idle min * (Watt) | 13.2 | 4.3 67% | 7.7 42% | 11.7 11% | 11 17% | 11 17% | 10.4 ? 21% | 6 ? 55% |
| Idle avg * (Watt) | 17 | 10.8 36% | 10.7 37% | 16 6% | 14 18% | 14 18% | 14.5 ? 15% | 10.5 ? 38% |
| Idle max * (Watt) | 18.6 | 13.2 29% | 16.8 10% | 29.3 -58% | 25 -34% | 20 -8% | 21.4 ? -15% | 12.6 ? 32% |
| Last avg * (Watt) | 88.8 | 103.2 -16% | 100.39 -13% | 95.6 -8% | 123 -39% | 94 -6% | 109.3 ? -23% | 69.3 ? 22% |
| Witcher 3 ultra * (Watt) | 123 123 | 94 24% | 108 12% | 141.3 -15% | 176 -43% | 167 -36% | ||
| Last max * (Watt) | 132 | 140.2 -6% | 129 2% | 197 -49% | 226 -71% | 251 -90% | 206 ? -56% | 115.2 ? 13% |
* ... kleinere Werte sind besser
Energieaufnahme Witcher 3 / Stresstest
Akkulaufzeit
Lenovo verbaut einen Akku mit 71 Wh. Das ist deutlich größer als die 56 Wh im 15p, im Dell Inspiron oder auch dem Alienware stecken allerdings 86 Wh. Ersterer hält dann auch etwa eine Stunde länger im WLAN-Test durch, das Alienware schneidet aber trotz größerem Akku 3 Stunden schlechter ab. 8,5 Stunden Surfen und etwa 7 Stunden lang Video schauen sind für einen Laptop mit dieser Ausstattung gute Werte.
| Lenovo ThinkBook 16p G2 ACH R9 5900HX, GeForce RTX 3060 Laptop GPU, 71 Wh | Lenovo ThinkBook 15p Gen1 4K i7-10750H, GeForce GTX 1650 Ti Max-Q, 57 Wh | Dell Inspiron 16 Plus 7610 i7-11800H, GeForce RTX 3050 4GB Laptop GPU, 86 Wh | Razer Blade 15 Base Edition 2021, i7-10750H RTX 3060 i7-10750H, GeForce RTX 3060 Laptop GPU, 65 Wh | Alienware m15 R5 Ryzen Edition R7 5800H, GeForce RTX 3060 Laptop GPU, 86 Wh | Schenker XMG Core 15 Ampere R7 4800H, GeForce RTX 3060 Laptop GPU, 62 Wh | Durchschnitt der Klasse Multimedia | |
|---|---|---|---|---|---|---|---|
| Akkulaufzeit | 1% | 41% | -35% | -23% | -29% | 47% | |
| H.264 (h) | 7 | 7.3 4% | 8.8 26% | 6 -14% | 15.8 ? 126% | ||
| WLAN (h) | 8.5 | 9.8 15% | 9.9 16% | 4.8 -44% | 5.1 -40% | 5.8 -32% | 11.3 ? 33% |
| Last (h) | 2 | 1.7 -15% | 3.3 65% | 1.5 -25% | 0.9 -55% | 1.2 -40% | 1.653 ? -17% |
| Idle (h) | 20.5 | 7.8 | 14.7 | 7.8 | 23.4 ? | ||
| Witcher 3 ultra (h) | 1.6 |
Pro
Contra
Fazit - Kein Gamer, gut so
Ob man am ThinkBook 16p Gefallen findet, hängt ganz von den eigenen Ansprüchen und Erwartungen ab. Wer wegen der RTX 3060 einen auf Leistung getrimmten Gamer erwartet, könnte enttäuscht werden. Denn trotz starker Hardware versteht sich das ThinkBook eben nicht als Gamer, sondern als Arbeitstier für leistungsaffine Business-Nutzer oder gar Creators. Spielen kann man mit dem ThinkBook zwar auch problemlos, dennoch gibt es hierfür bessere Gaming-Laptops, welche noch mehr Leistung aus der RTX 3060 herauskitzeln und eine höhere Bildwiederholrate bieten.
Dafür umschifft das ThinkBook aber auch diverse Nachteile von Gaming-Laptops. Dank etwas gebremster RTX 3060 kommt es auf gute Akkulaufzeiten und wird nie störend laut oder heiß. Creators könnte der 16:10-Bildschirm durchaus gefallen, auch wenn eine zusätzliche 4K-Option wohl nicht geschadet hätte.
Kritik gibt es für das Arbeitstier allerdings für die mangelhaften Anschlussmöglichkeiten. Schnelles Internet über LAN ist mangels Anschluss nur per Adapter möglich, ein externer Monitor lässt sich ebenfalls nur über einen Adapter oder Hub anschließen, was einerseits die Mobilität einschränkt und andererseits Zusatzanschaffungen notwendig macht, schließlich legt Lenovo keinerlei Adapter bei. Ein Hub ist beim ThinkBook 16p aber beinahe Pflicht.
Das ThinkBook 16p wird zurecht nicht als Gamer, sondern als Business-Notebook oder leistungsstarker Laptop für Kreative vermarktet. Durch seine starke Hardware ist er recht universell nutzbar, auf beiden Seiten muss man jedoch Kompromisse eingehen.
Preis und Verfügbarkeit
Während des Verfassens dieses Artikels ist der Preis des ThinkBook im Shop von Lenovo auf wundersame Weise nach oben geklettert. Vor ein paar Tagen kostete unsere Testkonfiguration noch 1.909 Euro, nun liegt der Preis bei 2.414 Euro. Allerdings bekommt man ihn aktuell andernorts noch immer zum niedrigeren Preis, beispielsweise kostet der Laptop 1.809 Euro bei Lapstars, bei Cyberport wechselt er für 1.909 Euro den Besitzer.
Lenovo ThinkBook 16p G2 ACH
- 10.09.2021 v7 (old)
Christian Hintze


