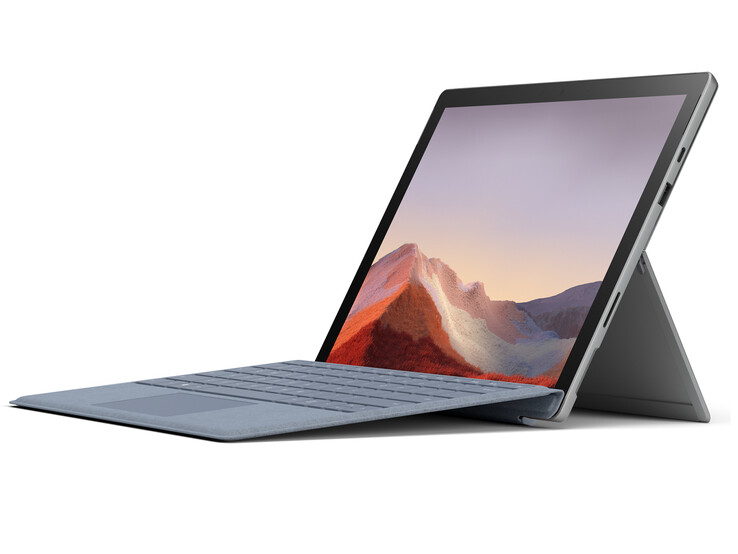
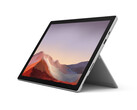
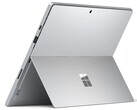
Microsoft Surface Pro 7 Plus im Test: Tiger Lake sorgt für einen Leistungsschub

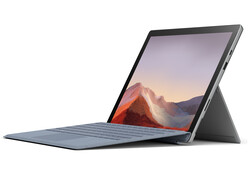
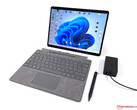
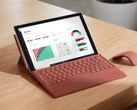
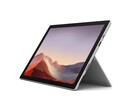
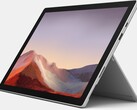
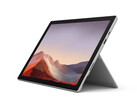
Das Surface Pro 7 ist bereits seit 2019 auf dem Markt. Daher sieht Microsoft die Zeit gekommen einige Neuerungen einzuführen. Im Inneren stecken nun Tiger-Lake- statt Ice-Lake-Prozessoren, die SSD kann getauscht werden, die Akkukapazität ist etwas gewachsen und optional ist ein LTE-Modem verfügbar - Letzteres nur in Kombination mit einem Core-i5-Prozessor. Äußerlich hat sich gegenüber den regulären Surface-Pro-7-Modellen praktisch nichts getan. Seine Konkurrenten findet das Surface Pro 7 Plus im Dell Latitude 12 7210 und im Lenovo Yoga Duet 7.
Da wir bereits zwei Surface-Pro-7-Modelle getestet haben, gehen wir in diesem Testbericht nicht weiter auf das Gehäuse, die Ausstattung, die Eingabegeräte und die Lautsprecher ein. Die entsprechenden Informationen können dem Testbericht zum Core-i5-Surface-Pro-7 entnommen werden.
mögliche Konkurrenten im Vergleich
Bew. | Datum | Modell | Gewicht | Dicke | Größe | Auflösung | Preis ab |
|---|---|---|---|---|---|---|---|
| 88.5 % v7 (old) | 03 / 2021 | Microsoft Surface Pro 7 Plus i5-1135G7, Iris Xe G7 80EUs | 796 g | 8.5 mm | 12.30" | 2736x1824 | |
| 87.1 % v7 (old) | 11 / 2020 | Lenovo Yoga Duet 7 13IML05-82AS000WGE i5-10210U, UHD Graphics 620 | 1.2 kg | 9.2 mm | 13.00" | 2160x1350 | |
| 89.5 % v7 (old) | 03 / 2021 | Dell Latitude 12 7210 2-in-1 i7-10610U, UHD Graphics 620 | 850 g | 9.35 mm | 12.30" | 1920x1280 |
Ausstattung - Jetzt mit LTE-Modem
Snapdragon X20
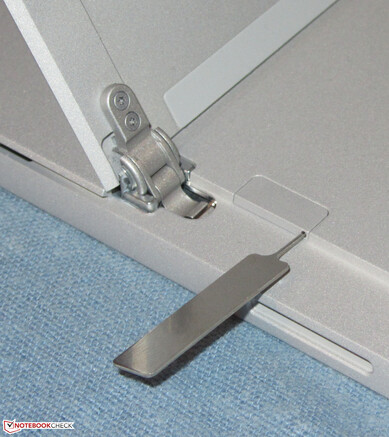
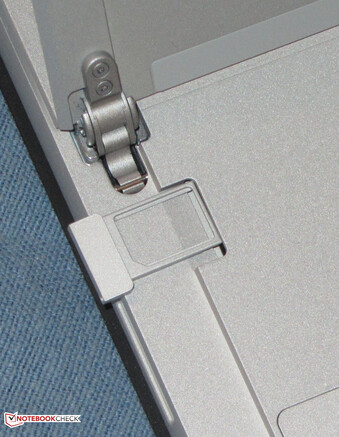
Microsoft verbaut im Surface das Qualcomm-Snapdragon-X20-Modem. Der SIM-Karten-Schlitz befindet sich hinter dem Ständer. Der Speicherkartenleser musste weichen. Das LTE-Modem ist nur in Kombination mit einem Core-i5-Prozessor zu bekommen.
Display - IPS im 3:2-Format
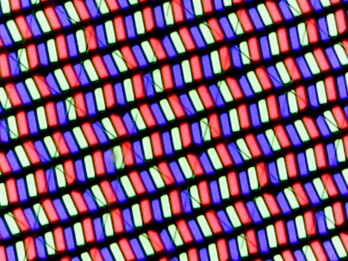
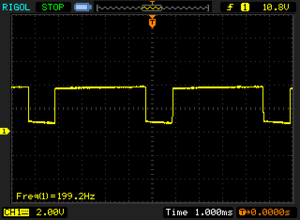
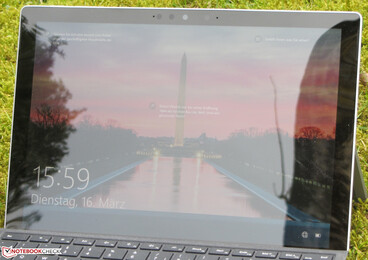
Das 12,3-Zoll-Touchscreendisplay arbeitet mit einer nativen Auflösung von 2.736 x 1.824 Bildpunkten. Helligkeit (425,4 cd/m²) und Kontrast (1.200:1) fallen gut aus. Der Bildschirm zeigt bei Helligkeitsstufen von 57 Prozent (entspricht etwa 119 cd/m²) und darunter ein Flackern mit einer Frequenz von 199,2 Hz. Aufgrund der geringen Frequenz könnten bei empfindlichen Personen Kopfschmerzen und/oder Augenprobleme auftreten.
| |||||||||||||||||||||||||
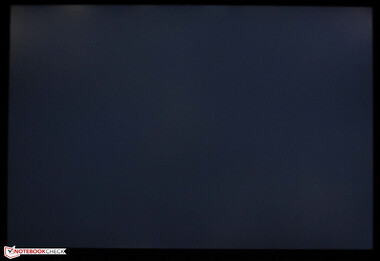
Ausleuchtung: 85 %
Helligkeit Akku: 407 cd/m²
Kontrast: 1200:1 (Schwarzwert: 0.34 cd/m²)
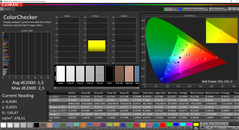
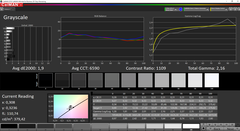
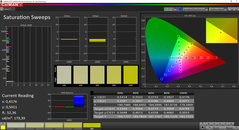
ΔE ColorChecker Calman: 1.5 | ∀{0.5-29.43 Ø4.76}
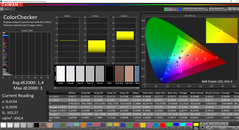
calibrated: 1.4
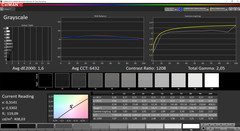
ΔE Greyscale Calman: 1.6 | ∀{0.09-98 Ø5}
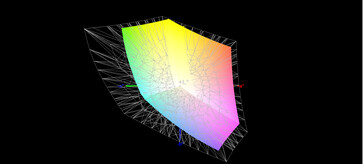
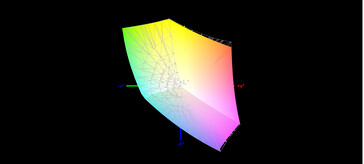
96.8% sRGB (Argyll 1.6.3 3D)
63.7% AdobeRGB 1998 (Argyll 1.6.3 3D)
69.1% AdobeRGB 1998 (Argyll 3D)
96.7% sRGB (Argyll 3D)
66.9% Display P3 (Argyll 3D)
Gamma: 2.05
CCT: 6432 K
| Microsoft Surface Pro 7 Plus LG Philips LP123WQ332684, IPS, 2736x1824, 12.3" | Lenovo Yoga Duet 7 13IML05-82AS000WGE CSOT T3 LEN8290, IPS, 2160x1350, 13" | Dell Latitude 12 7210 2-in-1 Sharp LQ123N1, IPS, 1920x1280, 12.3" | Microsoft Surface Pro 7 LG Philips LP123WQ112604, IPS, 2736x1824, 12.3" | Microsoft Surface Pro 7 Core i5-1035G4 LG Philips LP123WQ112604, IPS, 2736x1824, 12.3" | |
|---|---|---|---|---|---|
| Display | 3% | 0% | -4% | -2% | |
| Display P3 Coverage (%) | 66.9 | 68.9 3% | 67.9 1% | 63.7 -5% | 66 -1% |
| sRGB Coverage (%) | 96.7 | 98.2 2% | 96.8 0% | 95.8 -1% | 93.8 -3% |
| AdobeRGB 1998 Coverage (%) | 69.1 | 71.1 3% | 68.8 0% | 65.7 -5% | 66.9 -3% |
| Response Times | 5% | 48% | 19% | 26% | |
| Response Time Grey 50% / Grey 80% * (ms) | 50.8 ? | 58 ? -14% | 29 ? 43% | 40 ? 21% | 34.8 ? 31% |
| Response Time Black / White * (ms) | 33.6 ? | 26 ? 23% | 16 ? 52% | 28 ? 17% | 26.4 ? 21% |
| PWM Frequency (Hz) | 199.2 ? | 1250 ? | 250 ? | 21550 ? | |
| Bildschirm | -65% | -13% | -6% | -74% | |
| Helligkeit Bildmitte (cd/m²) | 408 | 450 10% | 380 -7% | 435 7% | 480.4 18% |
| Brightness (cd/m²) | 425 | 411 -3% | 378 -11% | 422 -1% | 485 14% |
| Brightness Distribution (%) | 85 | 83 -2% | 86 1% | 90 6% | 91 7% |
| Schwarzwert * (cd/m²) | 0.34 | 0.22 35% | 0.31 9% | 0.32 6% | 0.48 -41% |
| Kontrast (:1) | 1200 | 2045 70% | 1226 2% | 1359 13% | 1001 -17% |
| Delta E Colorchecker * | 1.5 | 4.15 -177% | 2.28 -52% | 1.18 21% | 5 -233% |
| Colorchecker dE 2000 max. * | 2.5 | 11.49 -360% | 3.93 -57% | 2.27 9% | 7.72 -209% |
| Colorchecker dE 2000 calibrated * | 1.4 | 1.09 22% | 0.97 31% | 3.49 -149% | 2.44 -74% |
| Delta E Graustufen * | 1.6 | 6.66 -316% | 2.56 -60% | 1.12 30% | 5.9 -269% |
| Gamma | 2.05 107% | 2.42 91% | 2.32 95% | 2.3 96% | 2.38 92% |
| CCT | 6432 101% | 6043 108% | 6130 106% | 6502 100% | 7805 83% |
| Farbraum (Prozent von AdobeRGB 1998) (%) | 63.7 | 65 2% | 63 -1% | 60 -6% | 60.3 -5% |
| Color Space (Percent of sRGB) (%) | 96.8 | 98 1% | 97 0% | 96 -1% | 93.2 -4% |
| Durchschnitt gesamt (Programm / Settings) | -19% /
-44% | 12% /
-3% | 3% /
-2% | -17% /
-48% |
* ... kleinere Werte sind besser
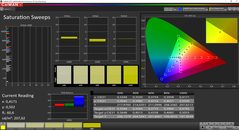
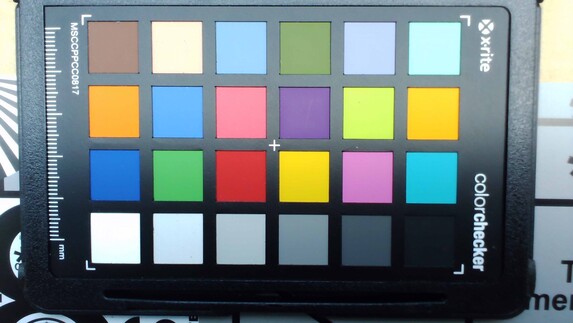
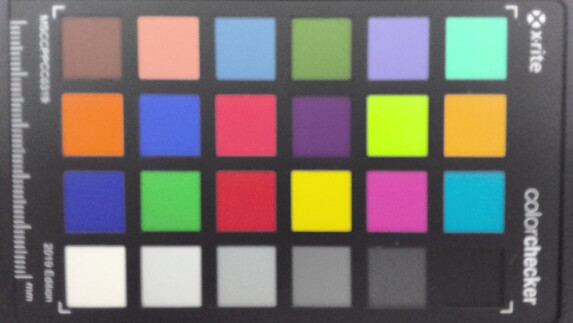
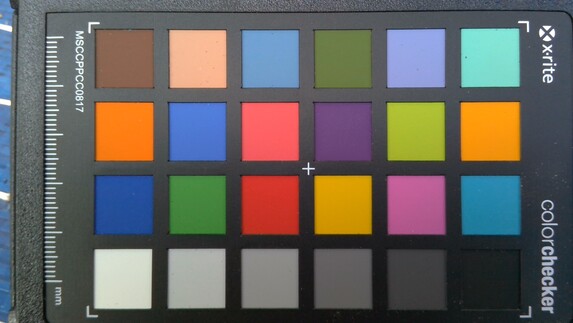
Der Bildschirm zeigt im Auslieferungszustand eine gute Farbdarstellung und erfüllt mit einer Farbabweichung von 1,5 das Soll (Delta E kleiner 3). Unter einem Blaustich leidet das Display nicht. Eine Kalibrierung sorgt für geringfügige Verbesserungen: Die Farbabweichung sinkt auf 1,4 und die Graustufen werden ausgewogener dargestellt. Die Farbräume AdobeRGB (63,7 Prozent) und sRGB (96,8 Prozent) kann das Display nicht vollständig abbilden.
Reaktionszeiten (Response Times) des Displays
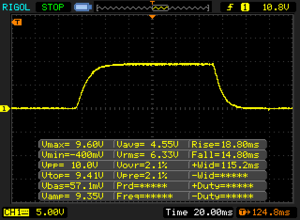
| ↔ Reaktionszeiten Schwarz zu Weiß | ||
|---|---|---|
| 33.6 ms ... steigend ↗ und fallend ↘ kombiniert | ↗ 18.8 ms steigend | |
| ↘ 14.8 ms fallend | ||
| Die gemessenen Reaktionszeiten sind langsam und dadurch für viele Spieler wahrscheinlich zu langsam. Im Vergleich rangierten die bei uns getesteten Geräte von 0.1 (Minimum) zu 240 (Maximum) ms. » 90 % aller Screens waren schneller als der getestete. Daher sind die gemessenen Reaktionszeiten schlechter als der Durchschnitt aller vermessenen Geräte (20.1 ms). | ||
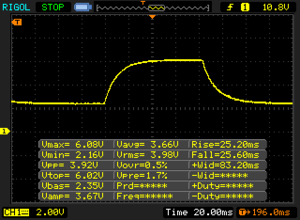
| ↔ Reaktionszeiten 50% Grau zu 80% Grau | ||
| 50.8 ms ... steigend ↗ und fallend ↘ kombiniert | ↗ 25.2 ms steigend | |
| ↘ 25.6 ms fallend | ||
| Die gemessenen Reaktionszeiten sind langsam und dadurch für viele Spieler wahrscheinlich zu langsam. Im Vergleich rangierten die bei uns getesteten Geräte von 0.165 (Minimum) zu 636 (Maximum) ms. » 87 % aller Screens waren schneller als der getestete. Daher sind die gemessenen Reaktionszeiten schlechter als der Durchschnitt aller vermessenen Geräte (31.5 ms). | ||
Bildschirm-Flackern / PWM (Pulse-Width Modulation)
| Flackern / PWM festgestellt | 199.2 Hz | ≤ 57 % Helligkeit | |
| ≤ 119 cd/m² Helligkeit | |||
Das Display flackert mit 199.2 Hz (im schlimmsten Fall, eventuell durch Pulsweitenmodulation PWM) bei einer eingestellten Helligkeit von 57 % (119 cd/m²) und darunter. Darüber sollte es zu keinem Flackern kommen. Die Frequenz von 199.2 Hz ist relativ gering und daher sollte es bei sensiblen Personen zu Problemen wie Flackern oder Augenbeschwerden führen. Die Helligkeitsschwankungen traten im Test nur bei relativ geringer Helligkeit auf, daher kann es z.B. in dunklen Innenräumen zu Problemen kommen. Im Vergleich: 53 % aller getesteten Geräte nutzten kein PWM um die Helligkeit zu reduzieren. Wenn PWM eingesetzt wurde, dann bei einer Frequenz von durchschnittlich 8075 (Minimum 5, Maximum 343500) Hz. | |||
Leistung - Mehr Leistung dank Tiger Lake
Microsoft hat mit dem Surface Pro 7 Plus ein 12,3-Zoll-2-in-1-Gerät für Unternehmen und Schulen im Sortiment, das genug Rechenleistung für Office- und Internetanwendungen bietet. Diverse Ausstattungsvarianten sind verfügbar.
Prozessor
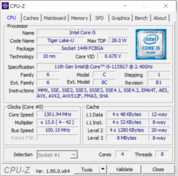
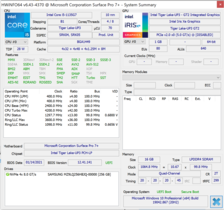
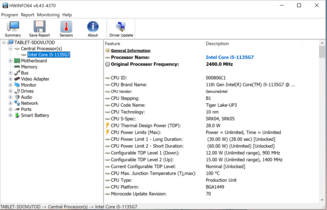
Microsoft setzt beim Plus-Modell des Surface Pro 7 auf Tiger-Lake-CPUs. In unserem Testgerät steckt ein Core-i5-1135G7-Vierkernprozessor, der mit einem Basistakt von 2,4 GHz arbeitet. Per Turbo ist eine Steigerung auf 3,8 GHz (alle Kerne) bis 4,2 GHz (ein Kern) möglich. Hyperthreading (zwei Threads pro Kern) wird unterstützt.
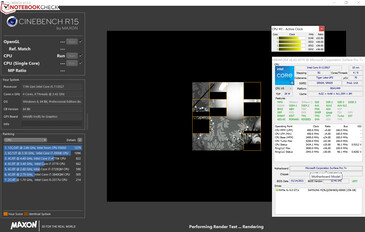
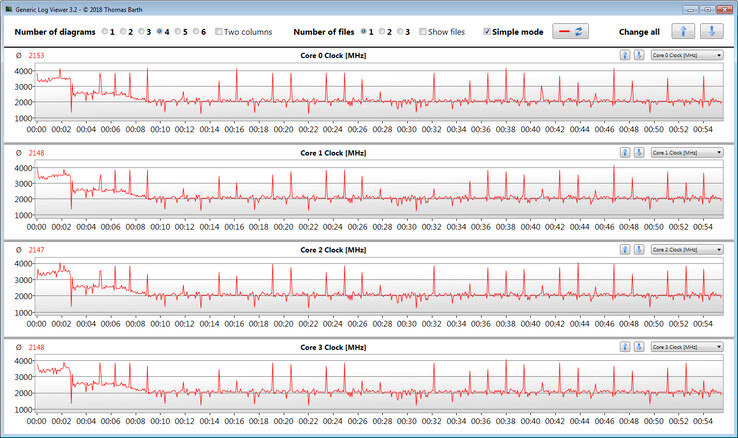
Die Multi-Thread-Tests der Cinebench-Benchmarks werden mit 3 bis 3,5 GHz, die Single-Thread-Tests mit 3,1 bis 4,1 GHz durchlaufen. Im Akkubetrieb liegen die Taktraten bei 2,4 bis 2,8 GHz (Multi-Thread) bzw. 1,5 bis 2,5 GHz (Single-Thread).
Ob der CPU-Turbo im Netzbetrieb dauerhaft genutzt wird, überprüfen wir, indem wir den Multi-Thread-Test des Cinebench-R15-Benchmarks für mindestens 30 Minuten in einer Schleife laufen lassen. Nur in den ersten drei Minuten des Tests werden Taktraten jenseits von 3 GHz erreicht. Im weiteren Verlauf muss die CPU gedrosselt werden und unterschreitet ihren Basistakt - hier macht sich die passive Kühlung bemerkbar.
Die Benchmarkresultate fallen alles in allem gut aus. Der Tiger-Lake-Prozessor quittiert kurzzeitige Lastspitzen mit viel Rechenleistung und übertrifft dabei den Ice-Lake-Core-i5-Prozessor des Surface Pro 7. Bei länger anhaltender Last geht die Leistung in die Knie.
* ... kleinere Werte sind besser
System Performance
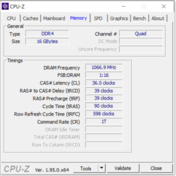
Das flott und flüssig laufende System hat keine Probleme bereitet. Es bietet mehr als genug Rechenleistung für Office- und Internetanwendungen. Dazu gesellen sich gute PC-Mark-Resultate. Der Arbeitsspeicher (16 GB, LPDDR4X, onboard) des 12,3-Zöllers läuft im Dual-Channel-Modus. Eine Erweiterung des Speichers ist nicht möglich.
| PCMark 8 Home Score Accelerated v2 | 3472 Punkte | |
| PCMark 8 Creative Score Accelerated v2 | 4157 Punkte | |
| PCMark 8 Work Score Accelerated v2 | 2473 Punkte | |
| PCMark 10 Score | 4026 Punkte | |
Hilfe | ||
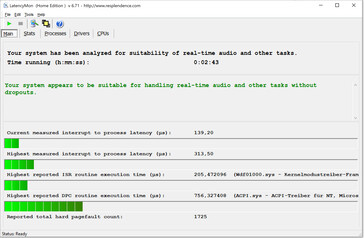
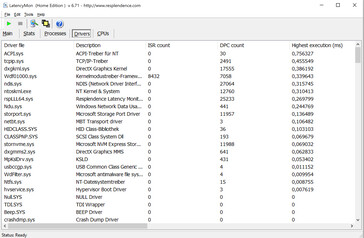
DPC-Latenzen
| DPC Latencies / LatencyMon - interrupt to process latency (max), Web, Youtube, Prime95 | |
| Lenovo Yoga Duet 7 13IML05-82AS000WGE | |
| Dell Latitude 12 7210 2-in-1 | |
| Microsoft Surface Pro 7 Plus | |
* ... kleinere Werte sind besser
Massenspeicher
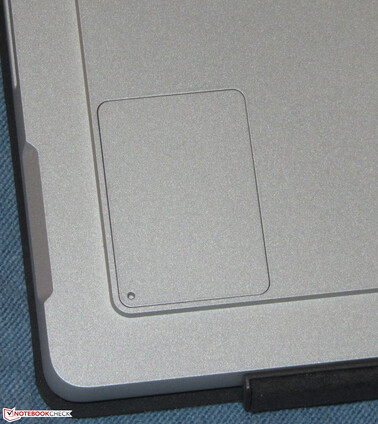
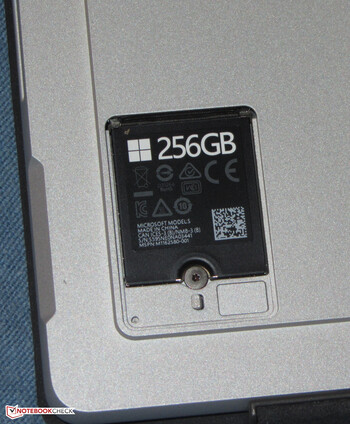
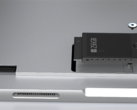
Als Systemlaufwerk dient eine 256-GB-NVMe-SSD (M.2-2230) der Firma Samsung, die gute Transferraten liefert. Zu den Spitzenmodellen unter den SSDs zählt sie nicht. Ein Tausch der SSD wäre dank einer kleinen Wartungsklappe problemlos machbar, das Angebot an SSDs im M.2-2230-Format fällt aber (noch) überschaubar aus. Die Klappe wird magnetisch gehalten und kann mittels des mitgelieferten SIM-Auswurf-Werkzeugs oder ähnlichen Hilfsmitteln geöffnet werden.
| Microsoft Surface Pro 7 Plus Samsung PM991 MZ9LQ256HBJQ | Lenovo Yoga Duet 7 13IML05-82AS000WGE Lenovo UMIS RPJTJ256MEE1OWX | Dell Latitude 12 7210 2-in-1 WDC PC SN530 SDBPTPZ-512G | Microsoft Surface Pro 7 Toshiba KBG40ZNS256G NVMe | Microsoft Surface Pro 7 Core i5-1035G4 Toshiba BG4 KBG40ZPZ256G | Durchschnittliche Samsung PM991 MZ9LQ256HBJQ | |
|---|---|---|---|---|---|---|
| CrystalDiskMark 5.2 / 6 | 11% | 25% | 29% | 16% | -10% | |
| Write 4K (MB/s) | 165.3 | 118 -29% | 182.7 11% | 131.3 -21% | 118.5 -28% | 122.1 ? -26% |
| Read 4K (MB/s) | 42.95 | 53 23% | 51.4 20% | 52.4 22% | 54.1 26% | 35.4 ? -18% |
| Write Seq (MB/s) | 955 | 1208 26% | 1303 36% | 1613 69% | 1166 22% | 849 ? -11% |
| Read Seq (MB/s) | 867 | 1625 87% | 1450 67% | 1613 86% | 1676 93% | 854 ? -1% |
| Write 4K Q32T1 (MB/s) | 423.5 | 431 2% | 342.9 -19% | 411.6 -3% | 330.5 -22% | 394 ? -7% |
| Read 4K Q32T1 (MB/s) | 479.2 | 356 -26% | 523 9% | 415.6 -13% | 393.1 -18% | 398 ? -17% |
| Write Seq Q32T1 (MB/s) | 1060 | 1278 21% | 1776 68% | 2340 121% | 1569 48% | 1059 ? 0% |
| Read Seq Q32T1 (MB/s) | 2251 | 1949 -13% | 2378 6% | 1568 -30% | 2390 6% | 2254 ? 0% |
| Write 4K Q8T8 (MB/s) | 410.9 | |||||
| Read 4K Q8T8 (MB/s) | 1033 | |||||
| AS SSD | -9% | 32% | -31% | -169% | -1% | |
| Seq Read (MB/s) | 1725 | 1629 -6% | 2185 27% | 1881 9% | 1590 -8% | 1706 ? -1% |
| Seq Write (MB/s) | 931 | 694 -25% | 1731 86% | 703 -24% | 714 -23% | 803 ? -14% |
| 4K Read (MB/s) | 50.1 | 47.87 -4% | 46.28 -8% | 52.3 4% | 50.7 1% | 45.1 ? -10% |
| 4K Write (MB/s) | 136.9 | 107 -22% | 161.6 18% | 154.1 13% | 109.4 -20% | 123.6 ? -10% |
| 4K-64 Read (MB/s) | 870 | 411 -53% | 1021 17% | 1048 20% | 924 6% | 773 ? -11% |
| 4K-64 Write (MB/s) | 762 | 377 -51% | 1125 48% | 703 -8% | 294.6 -61% | 721 ? -5% |
| Access Time Read * (ms) | 0.279 | 0.068 76% | 0.069 75% | 0.069 75% | 0.066 76% | 0.229 ? 18% |
| Access Time Write * (ms) | 0.028 | 0.035 -25% | 0.046 -64% | 0.221 -689% | 0.697 -2389% | 0.0315 ? -13% |
| Score Read (Points) | 1093 | 614 -44% | 1286 18% | 1288 18% | 1133 4% | 989 ? -10% |
| Score Write (Points) | 992 | 550 -45% | 1460 47% | 927 -7% | 475 -52% | 925 ? -7% |
| Score Total (Points) | 2616 | 1441 -45% | 3389 30% | 2826 8% | 2157 -18% | 2386 ? -9% |
| Copy ISO MB/s (MB/s) | 1174 | 1074 -9% | 1555 32% | 1160 -1% | 1177 0% | 1085 ? -8% |
| Copy Program MB/s (MB/s) | 262.8 | 532 102% | 468.5 78% | 454.7 73% | 406 54% | 389 ? 48% |
| Copy Game MB/s (MB/s) | 562 | 730 30% | 841 50% | 991 76% | 923 64% | 687 ? 22% |
| Durchschnitt gesamt (Programm / Settings) | 1% /
-1% | 29% /
30% | -1% /
-9% | -77% /
-102% | -6% /
-4% |
* ... kleinere Werte sind besser
Dauerleistung Lesen: DiskSpd Read Loop, Queue Depth 8
Grafikkarte
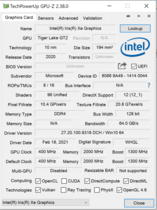
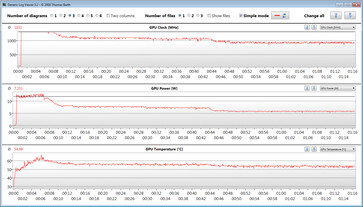
Intels integrierte Iris-Xe-Graphics-G7-80EU-GPU ist für die Grafikausgabe zuständig. Sie unterstützt DirectX 12 und erreicht einen Arbeitstakt von bis zu 1.300 MHz. Der Witcher-3-Test zeigt, dass die Tiger-Lake-GPU für etwa 7 Minuten mit voller Geschwindigkeit arbeiten kann. Dann fordert die passive Kühlung ihren Tribut.
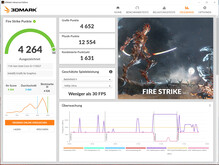
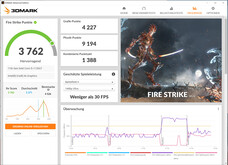
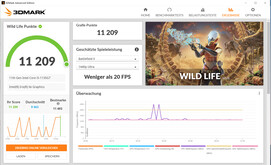
Die 3D-Mark-Resultate gehören mit zu den besten Werten, die wir bisher mit der hier verbauten GPU ermittelt haben. Gegenüber den Ice-Lake-Surface-Pro-7-Modellen ist ein deutlicher Anstieg der Grafikleistung zu verzeichnen.
| 3DMark 11 Performance | 6343 Punkte | |
| 3DMark Ice Storm Standard Score | 81444 Punkte | |
| 3DMark Cloud Gate Standard Score | 17777 Punkte | |
| 3DMark Fire Strike Score | 4264 Punkte | |
| 3DMark Time Spy Score | 1537 Punkte | |
Hilfe | ||
| GFXBench (DX / GLBenchmark) 2.7 | |
| 1920x1080 T-Rex Offscreen | |
| Durchschnitt der Klasse Convertible (83 - 495, n=3, der letzten 2 Jahre) | |
| Microsoft Surface Pro 7 Plus | |
| Durchschnittliche Intel Iris Xe Graphics G7 80EUs (220 - 257, n=3) | |
| T-Rex Onscreen | |
| Durchschnitt der Klasse Convertible (n=1der letzten 2 Jahre) | |
| Microsoft Surface Pro 7 Plus | |
| Durchschnittliche Intel Iris Xe Graphics G7 80EUs (55 - 236, n=3) | |
| GFXBench 3.0 | |
| 1920x1080 1080p Manhattan Offscreen | |
| Microsoft Surface Pro 7 Plus | |
| Durchschnitt der Klasse Convertible (48 - 290, n=3, der letzten 2 Jahre) | |
| Durchschnittliche Intel Iris Xe Graphics G7 80EUs (101.5 - 170.4, n=3) | |
| on screen Manhattan Onscreen OGL | |
| Durchschnitt der Klasse Convertible (n=1der letzten 2 Jahre) | |
| Microsoft Surface Pro 7 Plus | |
| Durchschnittliche Intel Iris Xe Graphics G7 80EUs (44 - 100.4, n=3) | |
| GFXBench 3.1 | |
| 1920x1080 Manhattan ES 3.1 Offscreen | |
| Durchschnitt der Klasse Convertible (34 - 229, n=3, der letzten 2 Jahre) | |
| Microsoft Surface Pro 7 Plus | |
| Durchschnittliche Intel Iris Xe Graphics G7 80EUs (69 - 108.6, n=3) | |
| on screen Manhattan ES 3.1 Onscreen | |
| Durchschnitt der Klasse Convertible (n=1der letzten 2 Jahre) | |
| Durchschnittliche Intel Iris Xe Graphics G7 80EUs (46.5 - 69.4, n=3) | |
| Microsoft Surface Pro 7 Plus | |
| Unigine Heaven 2.1 - 1280x1024 high, Tesselation (normal), DirectX11 AA:off AF:1x | |
| Microsoft Surface Pro 7 Plus | |
| Durchschnittliche Intel Iris Xe Graphics G7 80EUs (n=1) | |
| Unigine Heaven 3.0 | |
| 1920x1080 OpenGL, Normal Tessellation, High Shaders AA:Off AF:Off | |
| Microsoft Surface Pro 7 Plus | |
| Durchschnittliche Intel Iris Xe Graphics G7 80EUs (n=1) | |
| 1920x1080 DX 11, Normal Tessellation, High Shaders AA:Off AF:Off | |
| Microsoft Surface Pro 7 Plus | |
| Durchschnittliche Intel Iris Xe Graphics G7 80EUs (n=1) | |
| Unigine Valley 1.0 | |
| 1920x1080 Extreme HD DirectX AA:x8 | |
| Durchschnitt der Klasse Convertible (20.7 - 53.5, n=3, der letzten 2 Jahre) | |
| Microsoft Surface Pro 7 Plus | |
| Durchschnittliche Intel Iris Xe Graphics G7 80EUs (14.6 - 17.4, n=4) | |
| 1920x1080 Extreme HD Preset OpenGL AA:x8 | |
| Durchschnitt der Klasse Convertible (19.7 - 51.7, n=3, der letzten 2 Jahre) | |
| Microsoft Surface Pro 7 Plus | |
| Durchschnittliche Intel Iris Xe Graphics G7 80EUs (14.1 - 18.8, n=4) | |
Gaming Performance
Um ein Gaming-Gerät handelt es sich beim Surface Pro 7 Plus nicht. Nichtsdestotrotz: Die verbaute CPU-GPU-Kombination ist grundsätzlich fähig, viele der Spiele, die sich in unserer Datenbank befinden, flüssig auf den Bildschirm zu bringen - bei niedrigen Auflösungen und geringen Qualitätseinstellungen.
Da CPU und GPU nach wenigen Minuten gedrosselt werden, sinken in der Folge die Bildwiederholraten. Daher empfehlen sich Titel, die keine übermäßigen Anforderungen an die Hardware stellen und auch bei geringeren Taktfrequenzen noch flüssig laufen.
| The Witcher 3 - 1024x768 Low Graphics & Postprocessing | |
| Durchschnitt der Klasse Convertible (22 - 299, n=18, der letzten 2 Jahre) | |
| Microsoft Surface Pro 7 Plus | |
| Durchschnittliche Intel Iris Xe Graphics G7 80EUs (30.2 - 97.4, n=101) | |
| Microsoft Surface Pro 7 Core i5-1035G4 | |
| Lenovo Yoga Duet 7 13IML05-82AS000WGE | |
| Shadow of the Tomb Raider - 1280x720 Lowest Preset | |
| Durchschnitt der Klasse Convertible (24 - 180, n=3, der letzten 2 Jahre) | |
| Durchschnittliche Intel Iris Xe Graphics G7 80EUs (31 - 62.8, n=6) | |
| Microsoft Surface Pro 7 Plus | |
| Microsoft Surface Pro 7 | |
| Microsoft Surface Pro 7 Core i5-1035G4 | |
| F1 2020 - 1280x720 Ultra Low Preset | |
| Durchschnitt der Klasse Convertible (n=1der letzten 2 Jahre) | |
| Microsoft Surface Pro 7 Plus | |
| Durchschnittliche Intel Iris Xe Graphics G7 80EUs (45 - 76.6, n=10) | |
| Serious Sam 4 - 1280x720 Lowest (DX12) | |
| Microsoft Surface Pro 7 Plus | |
| Durchschnittliche Intel Iris Xe Graphics G7 80EUs (n=1) | |
| Hitman 3 - 1280x720 Minimum Settings | |
| Microsoft Surface Pro 7 Plus | |
| Durchschnittliche Intel Iris Xe Graphics G7 80EUs (56.3 - 82.3, n=2) | |
Um zu überprüfen, ob die Bildwiederholraten über einen längeren Zeitraum weitgehend konstant bleiben, lassen wir das Spiel "The Witcher 3" für etwa 60 Minuten mit Full-HD-Auflösung und maximalen Qualitätseinstellungen laufen. Die Spielfigur wird nicht bewegt. Der GPU-Takt wird nach ca. 7 Minuten von 1.300 MHz auf etwa 1.000 MHz gedrosselt. In der Folge sinken die Bildwiederholraten.
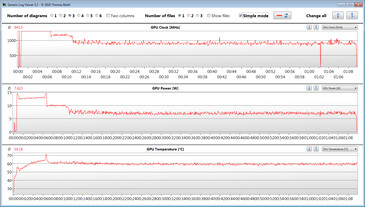
Da keine spielbaren Bildwiederholraten erreicht werden, haben wir den Witcher-3-Test mit minimalen Settings wiederholt. Es zeigt sich das gleiche Verhalten, die Bildwiederholraten bewegen sich aber auch nach der Drosselung im spielbaren Bereich.
| min. | mittel | hoch | max. | |
|---|---|---|---|---|
| The Witcher 3 (2015) | 81.9 | 55.8 | 29 | 13.5 |
| Dota 2 Reborn (2015) | 80.4 | 60.5 | 38.7 | 36.8 |
| X-Plane 11.11 (2018) | 37.4 | 29.9 | 27.7 | |
| Far Cry 5 (2018) | 54 | 23 | 21 | 19 |
| Shadow of the Tomb Raider (2018) | 37 | 17 | 14 | 9 |
| Battlefield V (2018) | 51.7 | 25.8 | 23.3 | 22.6 |
| Apex Legends (2019) | 82 | 37.7 | 28.2 | 25.3 |
| Metro Exodus (2019) | 28 | 13.7 | 10.5 | 8.7 |
| Control (2019) | 57.9 | 17.3 | 11.6 | |
| Borderlands 3 (2019) | 46.6 | 20.6 | 12.6 | 9.34 |
| Red Dead Redemption 2 (2019) | 49.2 | 22.7 | 12.9 | |
| F1 2020 (2020) | 76.6 | 38.7 | 26.8 | 17.5 |
| Death Stranding (2020) | 42.2 | 23.4 | 20.7 | 19.8 |
| Crysis Remastered (2020) | 54.9 | 24.9 | 8.49 | |
| Serious Sam 4 (2020) | 99.4 | 14.6 | 10.1 | 6.67 |
| Assassin´s Creed Valhalla (2020) | 31 | 19 | 16 | |
| Yakuza Like a Dragon (2020) | 32.5 | 16.3 | 14.6 | 12.4 |
| Immortals Fenyx Rising (2020) | 36 | 22 | 19 | 17 |
| Cyberpunk 2077 1.0 (2020) | 23.8 | 10.5 | ||
| Hitman 3 (2021) | 82.3 | 35.2 | 28.5 | 23.9 |
Emissionen - Microsofts 2-in-1-Gerät wird passiv gekühlt
Geräuschemissionen
Das Gerät bringt weder einen Lüfter noch ein mechanisches Laufwerk mit. Komplett lautlos arbeitet es aber trotzdem nicht. Aus dem Inneren ist gelegentlich ein elektronisches Spratzeln zu vernehmen.
Temperatur
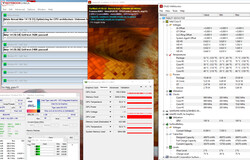
Unseren Stresstest (Prime95 und Furmark laufen für mindestens eine Stunde) durchlaufen CPU bzw. GPU in den ersten Minuten mit 900 bis 2.000 MHz bzw. 700 bis 750 MHz. Im weiteren Verlauf sinken die Geschwindigkeiten auf 900 bis 1.000 MHz (CPU) bzw. 100 MHz (GPU). Der Stresstest stellt ein Extremszenario dar. Wir überprüfen mit diesem Test, ob das System auch bei voller Auslastung stabil läuft.
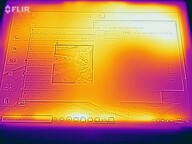
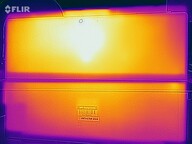
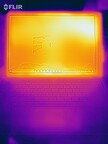
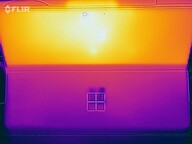
Dass sich das Surface unter Last spürbar erwärmt, überrascht nicht. Schließlich wird das Gerät passiv gekühlt. Während des Stresstests registrieren wir an mehreren Messpunkten Temperaturen im unteren bis mittleren 40-Grad-Celsius-Bereich. Im Alltagsbetrieb bewegen sich die Werte im grünen Bereich.
(±) Die maximale Temperatur auf der Oberseite ist 42.9 °C. Im Vergleich liegt der Klassendurchschnitt bei 35.3 °C (von 19.6 bis 60 °C für die Klasse Convertible).
(±) Auf der Unterseite messen wir eine maximalen Wert von 44.8 °C (im Vergleich zum Durchschnitt von 36.8 °C).
(+) Ohne Last messen wir eine durchschnittliche Temperatur von 25.3 °C auf der Oberseite. Der Klassendurchschnitt erreicht 30.3 °C.
(-) Die Handballen und der Touchpad-Bereich können sehr heiß werden mit maximal 41.1 °C.
(-) Die durchschnittliche Handballen-Temperatur anderer getesteter Geräte war 27.9 °C (-13.2 °C).
| Microsoft Surface Pro 7 Plus i5-1135G7, Iris Xe G7 80EUs | Lenovo Yoga Duet 7 13IML05-82AS000WGE i5-10210U, UHD Graphics 620 | Dell Latitude 12 7210 2-in-1 i7-10610U, UHD Graphics 620 | Microsoft Surface Pro 7 i7-1065G7, Iris Plus Graphics G7 (Ice Lake 64 EU) | Microsoft Surface Pro 7 Core i5-1035G4 i5-1035G4, Iris Plus Graphics G4 (Ice Lake 48 EU) | Durchschnittliche Intel Iris Xe Graphics G7 80EUs | Durchschnitt der Klasse Convertible | |
|---|---|---|---|---|---|---|---|
| Hitze | 16% | 12% | -2% | -12% | -0% | -0% | |
| Last oben max * (°C) | 42.9 | 33.6 22% | 37.5 13% | 40.1 7% | 43.6 -2% | 40.5 ? 6% | 40.8 ? 5% |
| Last unten max * (°C) | 44.8 | 33.9 24% | 36.2 19% | 41 8% | 47.8 -7% | 43.6 ? 3% | 43.3 ? 3% |
| Idle oben max * (°C) | 28.8 | 24.8 14% | 25.7 11% | 31.7 -10% | 32 -11% | 27.9 ? 3% | 27.9 ? 3% |
| Idle unten max * (°C) | 25.8 | 25.4 2% | 24.3 6% | 28.8 -12% | 32.4 -26% | 29.2 ? -13% | 28.8 ? -12% |
* ... kleinere Werte sind besser
Lautsprecher
Microsoft Surface Pro 7 Plus Audio Analyse
(±) | Mittelmäßig laut spielende Lautsprecher (75.2 dB)
Bass 100 - 315 Hz
(±) | abgesenkter Bass - 14.7% geringer als der Median
(±) | durchschnittlich lineare Bass-Wiedergabe (10.2% Delta zum Vorgänger)
Mitteltöne 400 - 2000 Hz
(+) | ausgeglichene Mitten, vom Median nur 4.9% abweichend
(+) | lineare Mitten (6.1% Delta zum Vorgänger)
Hochtöne 2 - 16 kHz
(+) | ausgeglichene Hochtöne, vom Median nur 4.1% abweichend
(±) | durchschnittlich lineare Hochtöne (9% Delta zum Vorgänger)
Gesamt im hörbaren Bereich 100 - 16.000 Hz
(±) | hörbarer Bereich ist durchschnittlich linear (17.4% Abstand zum Median)
Im Vergleich zu allen Geräten derselben Klasse
» 32% aller getesteten Geräte dieser Klasse waren besser, 8% vergleichbar, 60% schlechter
» Das beste Gerät hat einen Delta-Wert von 6%, durchschnittlich ist 20%, das schlechteste Gerät hat 57%
Im Vergleich zu allen Geräten im Test
» 32% aller getesteten Geräte waren besser, 8% vergleichbar, 59% schlechter
» Das beste Gerät hat einen Delta-Wert von 4%, durchschnittlich ist 24%, das schlechteste Gerät hat 134%
Energieverwaltung - Das Surface Pro Plus liefert gute Akkulaufzeiten
Energieaufnahme
Auffälligkeiten auf Seiten Energiebedarfs offenbart das Gerät nicht. Die Leistungsaufnahme bewegt sich auf einem Niveau mit den Ice-Lake-Surface-Pro-7-Modellen. Die Nennleistung des mitgelieferten Typ-C-USB-Netzteils beträgt 65 Watt.
| Aus / Standby | |
| Idle | |
| Last |
|
Legende:
min: | |
| Microsoft Surface Pro 7 Plus i5-1135G7, Iris Xe G7 80EUs | Lenovo Yoga Duet 7 13IML05-82AS000WGE i5-10210U, UHD Graphics 620 | Dell Latitude 12 7210 2-in-1 i7-10610U, UHD Graphics 620 | Microsoft Surface Pro 7 i7-1065G7, Iris Plus Graphics G7 (Ice Lake 64 EU) | Microsoft Surface Pro 7 Core i5-1035G4 i5-1035G4, Iris Plus Graphics G4 (Ice Lake 48 EU) | Durchschnittliche Intel Iris Xe Graphics G7 80EUs | Durchschnitt der Klasse Convertible | |
|---|---|---|---|---|---|---|---|
| Stromverbrauch | 42% | 32% | 5% | 4% | 12% | 5% | |
| Idle min * (Watt) | 5.5 | 3.1 44% | 3.2 42% | 4.4 20% | 4.5 18% | 4.47 ? 19% | 4.45 ? 19% |
| Idle avg * (Watt) | 9.1 | 5.7 37% | 5.3 42% | 8.7 4% | 9.2 -1% | 7.37 ? 19% | 7.49 ? 18% |
| Idle max * (Watt) | 10.8 | 8.7 19% | 8.4 22% | 9.6 11% | 9.6 11% | 9.24 ? 14% | 9.65 ? 11% |
| Last avg * (Watt) | 39.2 | 20.5 48% | 27 31% | 44 -12% | 42 -7% | 36.6 ? 7% | 45.2 ? -15% |
| Last max * (Watt) | 62.5 | 22.6 64% | 46.9 25% | 61 2% | 63.5 -2% | 61.7 ? 1% | 67.6 ? -8% |
* ... kleinere Werte sind besser
Akkulaufzeit
Microsoft verspricht eine maximale Akkulaufzeit von 15 h - wir konnten eine maximale Leerlauf-Laufzeit von 13:36 h ermitteln. Den WLAN-Test (Aufruf von Webseiten mittels eines Skripts) bzw. den Videotest (Kurzfilm Big Buck Bunny (H.264, FHD) läuft in einer Schleife) beendet der Rechner nach 8:03 h bzw. 10:50 h. Während der Tests sind die Energiesparfunktionen des Geräts deaktiviert und die Displayhelligkeit wird auf etwa 150 cd/m² geregelt. Während des Videotests werden zusätzlich die Funkmodule abgeschaltet.
| Microsoft Surface Pro 7 Plus i5-1135G7, Iris Xe G7 80EUs, 48.9 Wh | Lenovo Yoga Duet 7 13IML05-82AS000WGE i5-10210U, UHD Graphics 620, 39 Wh | Dell Latitude 12 7210 2-in-1 i7-10610U, UHD Graphics 620, 38 Wh | Microsoft Surface Pro 7 i7-1065G7, Iris Plus Graphics G7 (Ice Lake 64 EU), 45 Wh | Microsoft Surface Pro 7 Core i5-1035G4 i5-1035G4, Iris Plus Graphics G4 (Ice Lake 48 EU), 45 Wh | Durchschnitt der Klasse Convertible | |
|---|---|---|---|---|---|---|
| Akkulaufzeit | -21% | 6% | -21% | 12% | 32% | |
| Idle (h) | 13.6 | 12.8 -6% | 22.8 68% | 11.5 -15% | 22.3 64% | 26.2 ? 93% |
| H.264 (h) | 10.8 | 8.2 -24% | 11.3 5% | 6.7 -38% | 15.5 ? 44% | |
| WLAN (h) | 8.1 | 8.7 7% | 8.2 1% | 9.8 21% | 10 23% | 11.5 ? 42% |
| Last (h) | 3.9 | 1.6 -59% | 1.9 -51% | 1.9 -51% | 1.9 -51% | 1.817 ? -53% |
Pro
Contra
Fazit
Das Surface Pro 7 Plus stellt im Vergleich zum Surface Pro 7 die rundere 2-in-1-Variante dar. Die zum Einsatz kommende Tiger-Lake-Plattform bietet gegenüber Ice Lake insgesamt mehr Leistung - die GPU-Leistung steigt dabei deutlich stärker als die CPU-Leistung. Eine kleine Wartungsklappe ermöglicht den problemlosen SSD-Tausch. Verbindung mit der Außenwelt kann auch per LTE aufgenommen werden.
Ob viele Nutzer das Surface Pro 7 Plus ihr Eigen nennen werden können, steht noch in den Sternen. Vorerst wird es ausschließlich an Unternehmen und Schulen verkauft.
Die etwas gestiegene Akkukapazität (48,9 Wh vs. 45 Wh) hat keine wirklichen Auswirkungen. Das Surface Pro 7 Plus erreicht praxisnahe Laufzeiten von 8 bis 11 h und liegt damit in etwa gleichauf mit den Werten des Surface Pro 7. Der verbaute USB-C-Steckplatz (Displayport, Power Delivery) arbeitet weiterhin nach dem USB-3.2-Gen-1-Standard. Hier wurde die Gelegenheit verpasst, auf Thunderbolt 4/USB 4 aufzurüsten.
Einige Schwächen des regulären Surface wurden übernommen: Trotz passiver Kühlung geht Microsofts 2-in-1-Gerät nicht komplett lautlos zu Werke. Gelegentlich ist aus dem Inneren ein elektronisches Spratzeln zu hören. Das Touchscreendisplay zeigt bei Helligkeitsstufen von 57 Prozent (entspricht etwa 119 cd/m²) und darunter ein Flackern mit einer Frequenz von 199,2 Hz.
Obwohl sich das Surface an Unternehmen und Schulen richtet, fehlt ein Fingerabdruckleser. Hier muss bei Bedarf zu einer entsprechend ausgestatteten Tastatur (Microsoft Surface Pro Type Cover mit Fingerprint ID) gegriffen werden. Die nur einjährige Garantie ist einem Gerät der hier vorliegenden Preisklasse nicht angemessen.
Preis und Verfügbarkeit
Die uns zur Verfügung gestellte Ausstattungsvariante ist im Microsoft Store mit einem Preis von 1.849 € (Tablet + Tastaturcover) gelistet, zum Testzeitpunkt allerdings nicht verfügbar. Vorerst kann das Surface Pro 7 Plus nur von Unternehmen und Schulen erworben werden.
Microsoft Surface Pro 7 Plus
- 19.03.2021 v7 (old)
Sascha Mölck


