Test HP ProBook 450 G7 Core i7 Laptop: Besser als das Ryzen 7 ProBook 455 G7?
Anfang letzten Monats hatten wir uns die AMD-Version des HP ProBook 455 G7 und sind zu dem Schluss gekommen, dass es - vor allem in Anbetracht des Preises von ~1.000 US-Dollar (~845 Euro) - viele nützliche Ausstattungsmerkmale besitzt. Bis auf den offensichtlichen Prozessorwechsel und andere geringfügige Anpassungen ist das HP ProBook 450 G7, die Intel-Version des ProBook 455 G7, mit Letzterem identisch. Potenzielle Käufer werden sich unweigerlich fragen: Welcher Laptop ist das bessere Angebot?
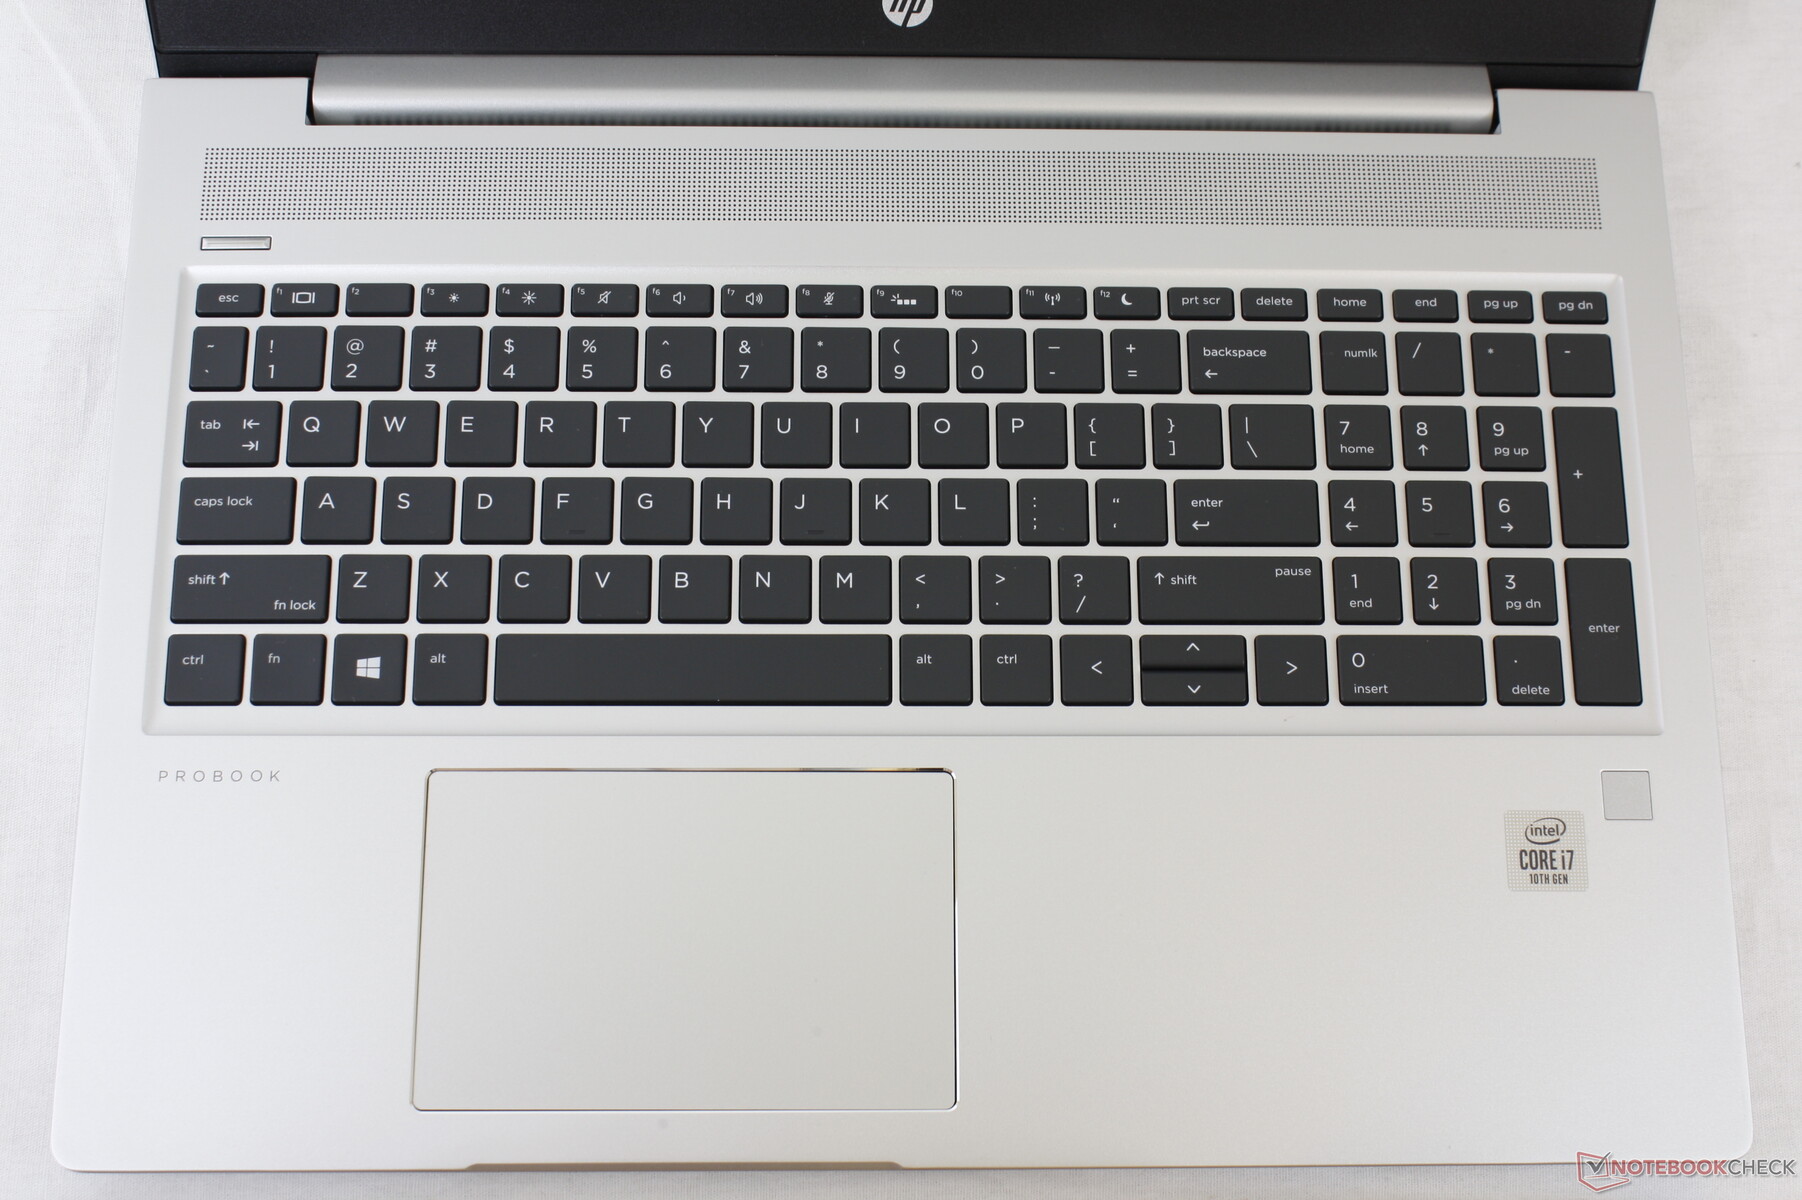
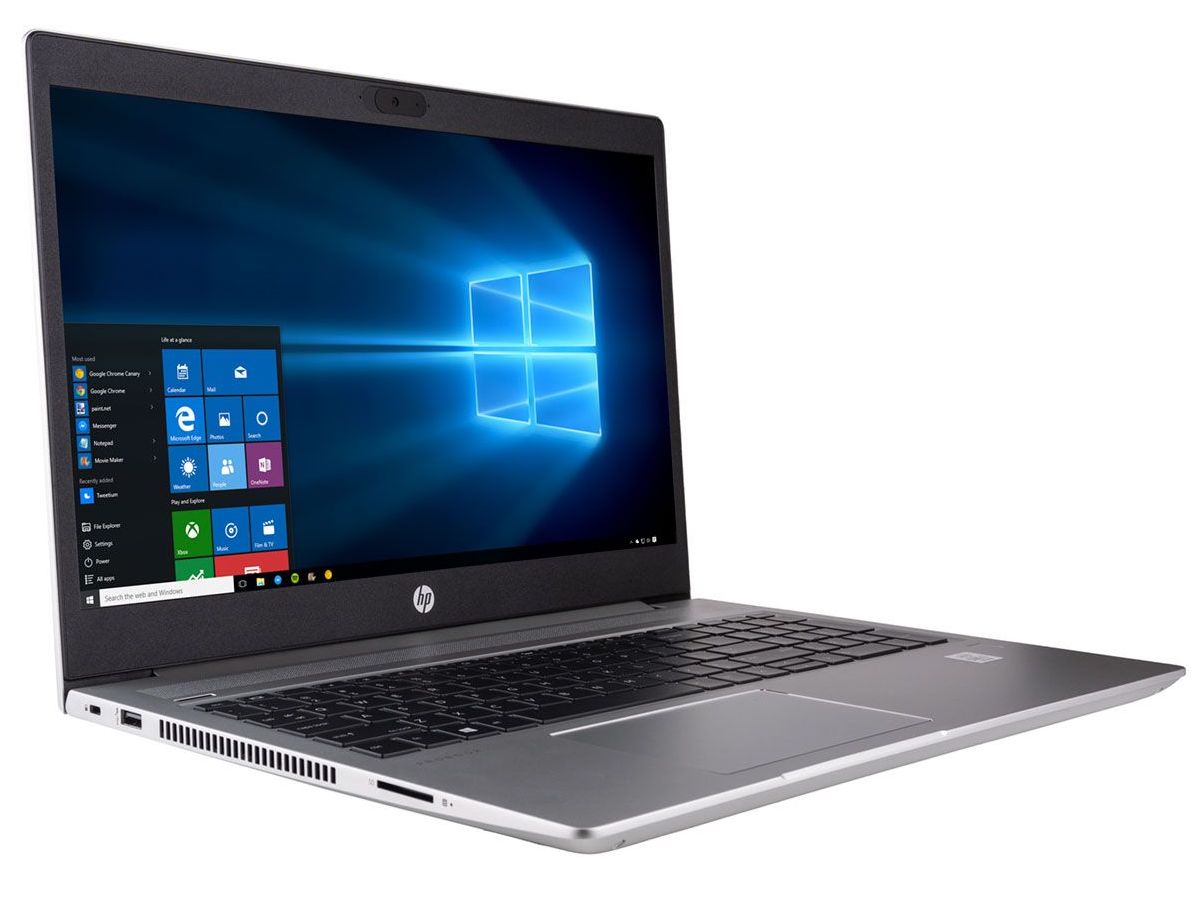
Unser heutiges ProBook-450-G7-Testgerät stammt von CUKUSA, ist mit dem Comet-Lake-U-Prozessor Core i7-10510U aus Intels 10. Prozessorgeneration sowie der GeForce-MX250-GPU ausgestattet und kostet je nach Speicher- und RAM-Konfiguration mindestens 1.100 US-Dollar (~935 Euro). Das bietet uns eine hervorragende Gelegenheit, das Intel-Modell ProBook 450 G7 mit der AMD-Variante ProBook 455 G7 zu vergleichen, um mögliche Unterschiede in wesentlichen Bereichen wie der Akkulaufzeit, dem Lüfterverhalten und der Leistung festzustellen. Da die zwei Modelle ein identisches Gehäusedesign besitzen, verweisen wir für weitere Details zur Tastatur und anderen physikalischen Eigenschaften an dieser Stelle auf unseren Test zum ProBook 455 G7.
Weitere HP-Tests:
Bew. | Datum | Modell | Gewicht | Dicke | Größe | Auflösung | Preis ab |
|---|---|---|---|---|---|---|---|
| 81.4 % v7 (old) | 08 / 2020 | HP ProBook 450 G7 8WC04UT i7-10510U, GeForce MX250 | 1.9 kg | 19 mm | 15.60" | 1920x1080 | |
| 82.6 % v7 (old) | 07 / 2020 | HP ProBook 455 G7-175W8EA R7 4700U, Vega 7 | 1.8 kg | 19 mm | 15.60" | 1920x1080 | |
| 80.1 % v7 (old) | 03 / 2020 | MSI Modern 15 A10RB i7-10510U, GeForce MX250 | 1.6 kg | 15.9 mm | 15.60" | 1920x1080 | |
| 79.6 % v6 (old) | 06 / 2019 | Dell Latitude 15 3590 i5-8250U, UHD Graphics 620 | 2.1 kg | 22 mm | 15.60" | 1920x1080 | |
| 83.2 % v7 (old) | 10 / 2019 | Lenovo ThinkPad L590-20Q70019GE i5-8265U, UHD Graphics 620 | 2 kg | 23 mm | 15.60" | 1920x1080 | |
| 82.9 % v7 (old) | 11 / 2019 | Dynabook Tecra X50-F i7-8665U, UHD Graphics 620 | 1.4 kg | 17.6 mm | 15.60" | 1920x1080 |
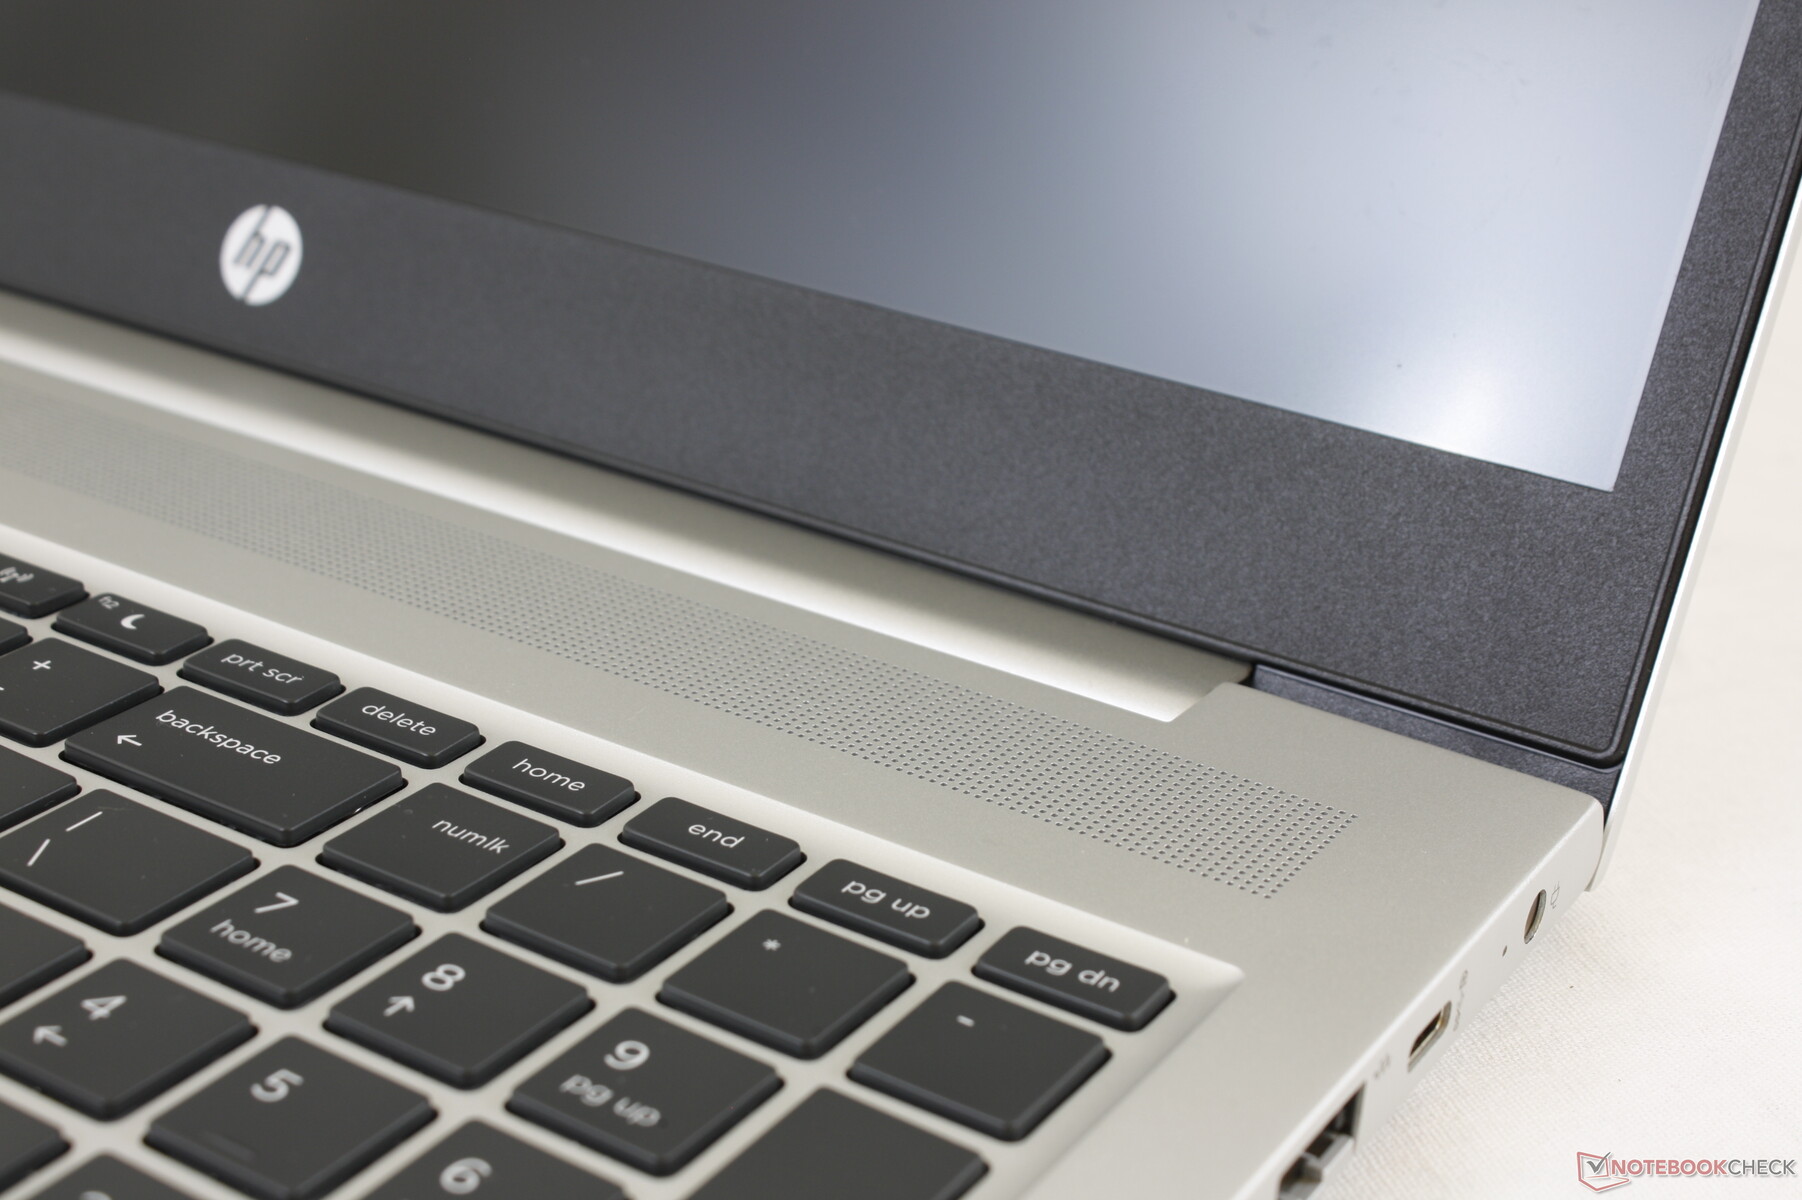
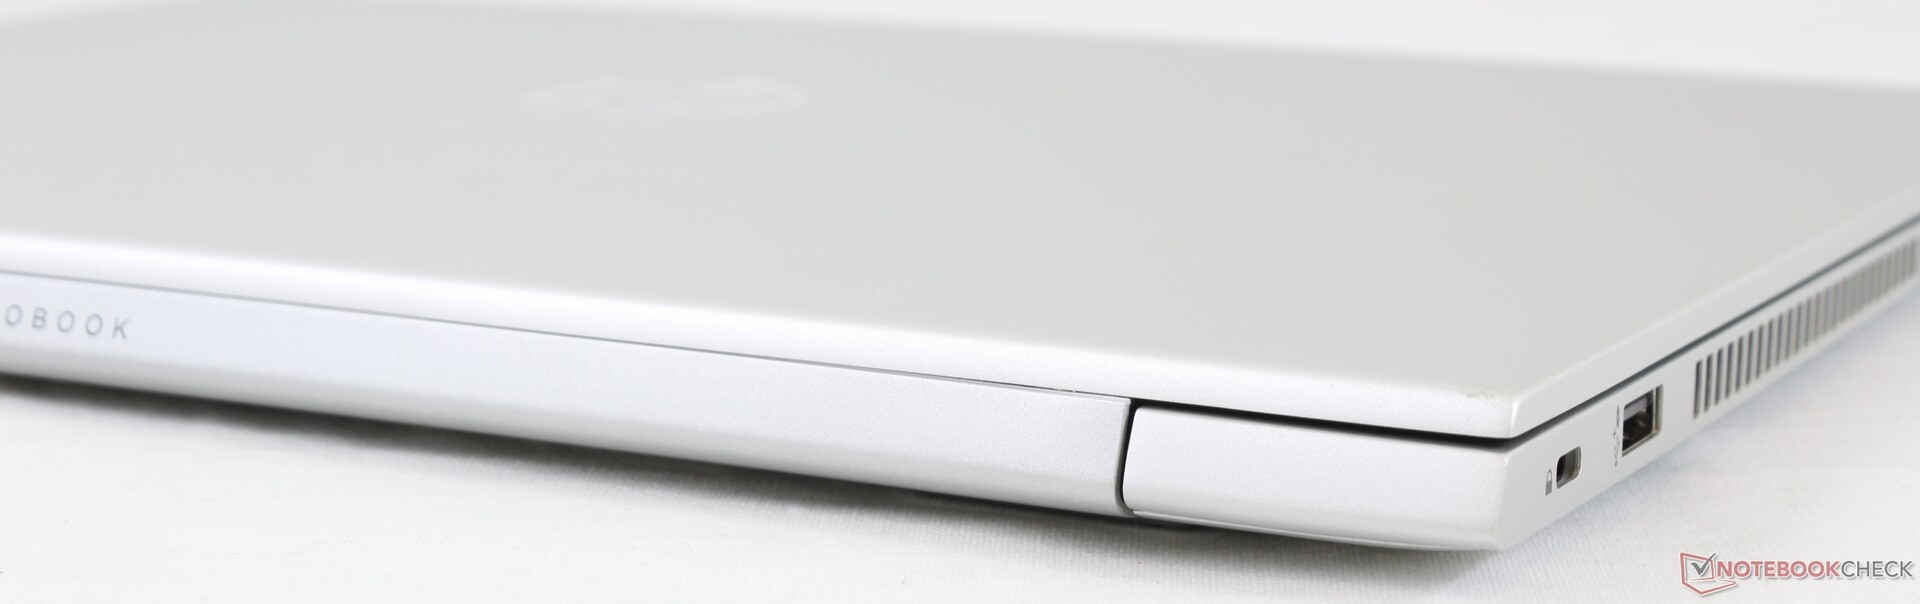
Gehäuse
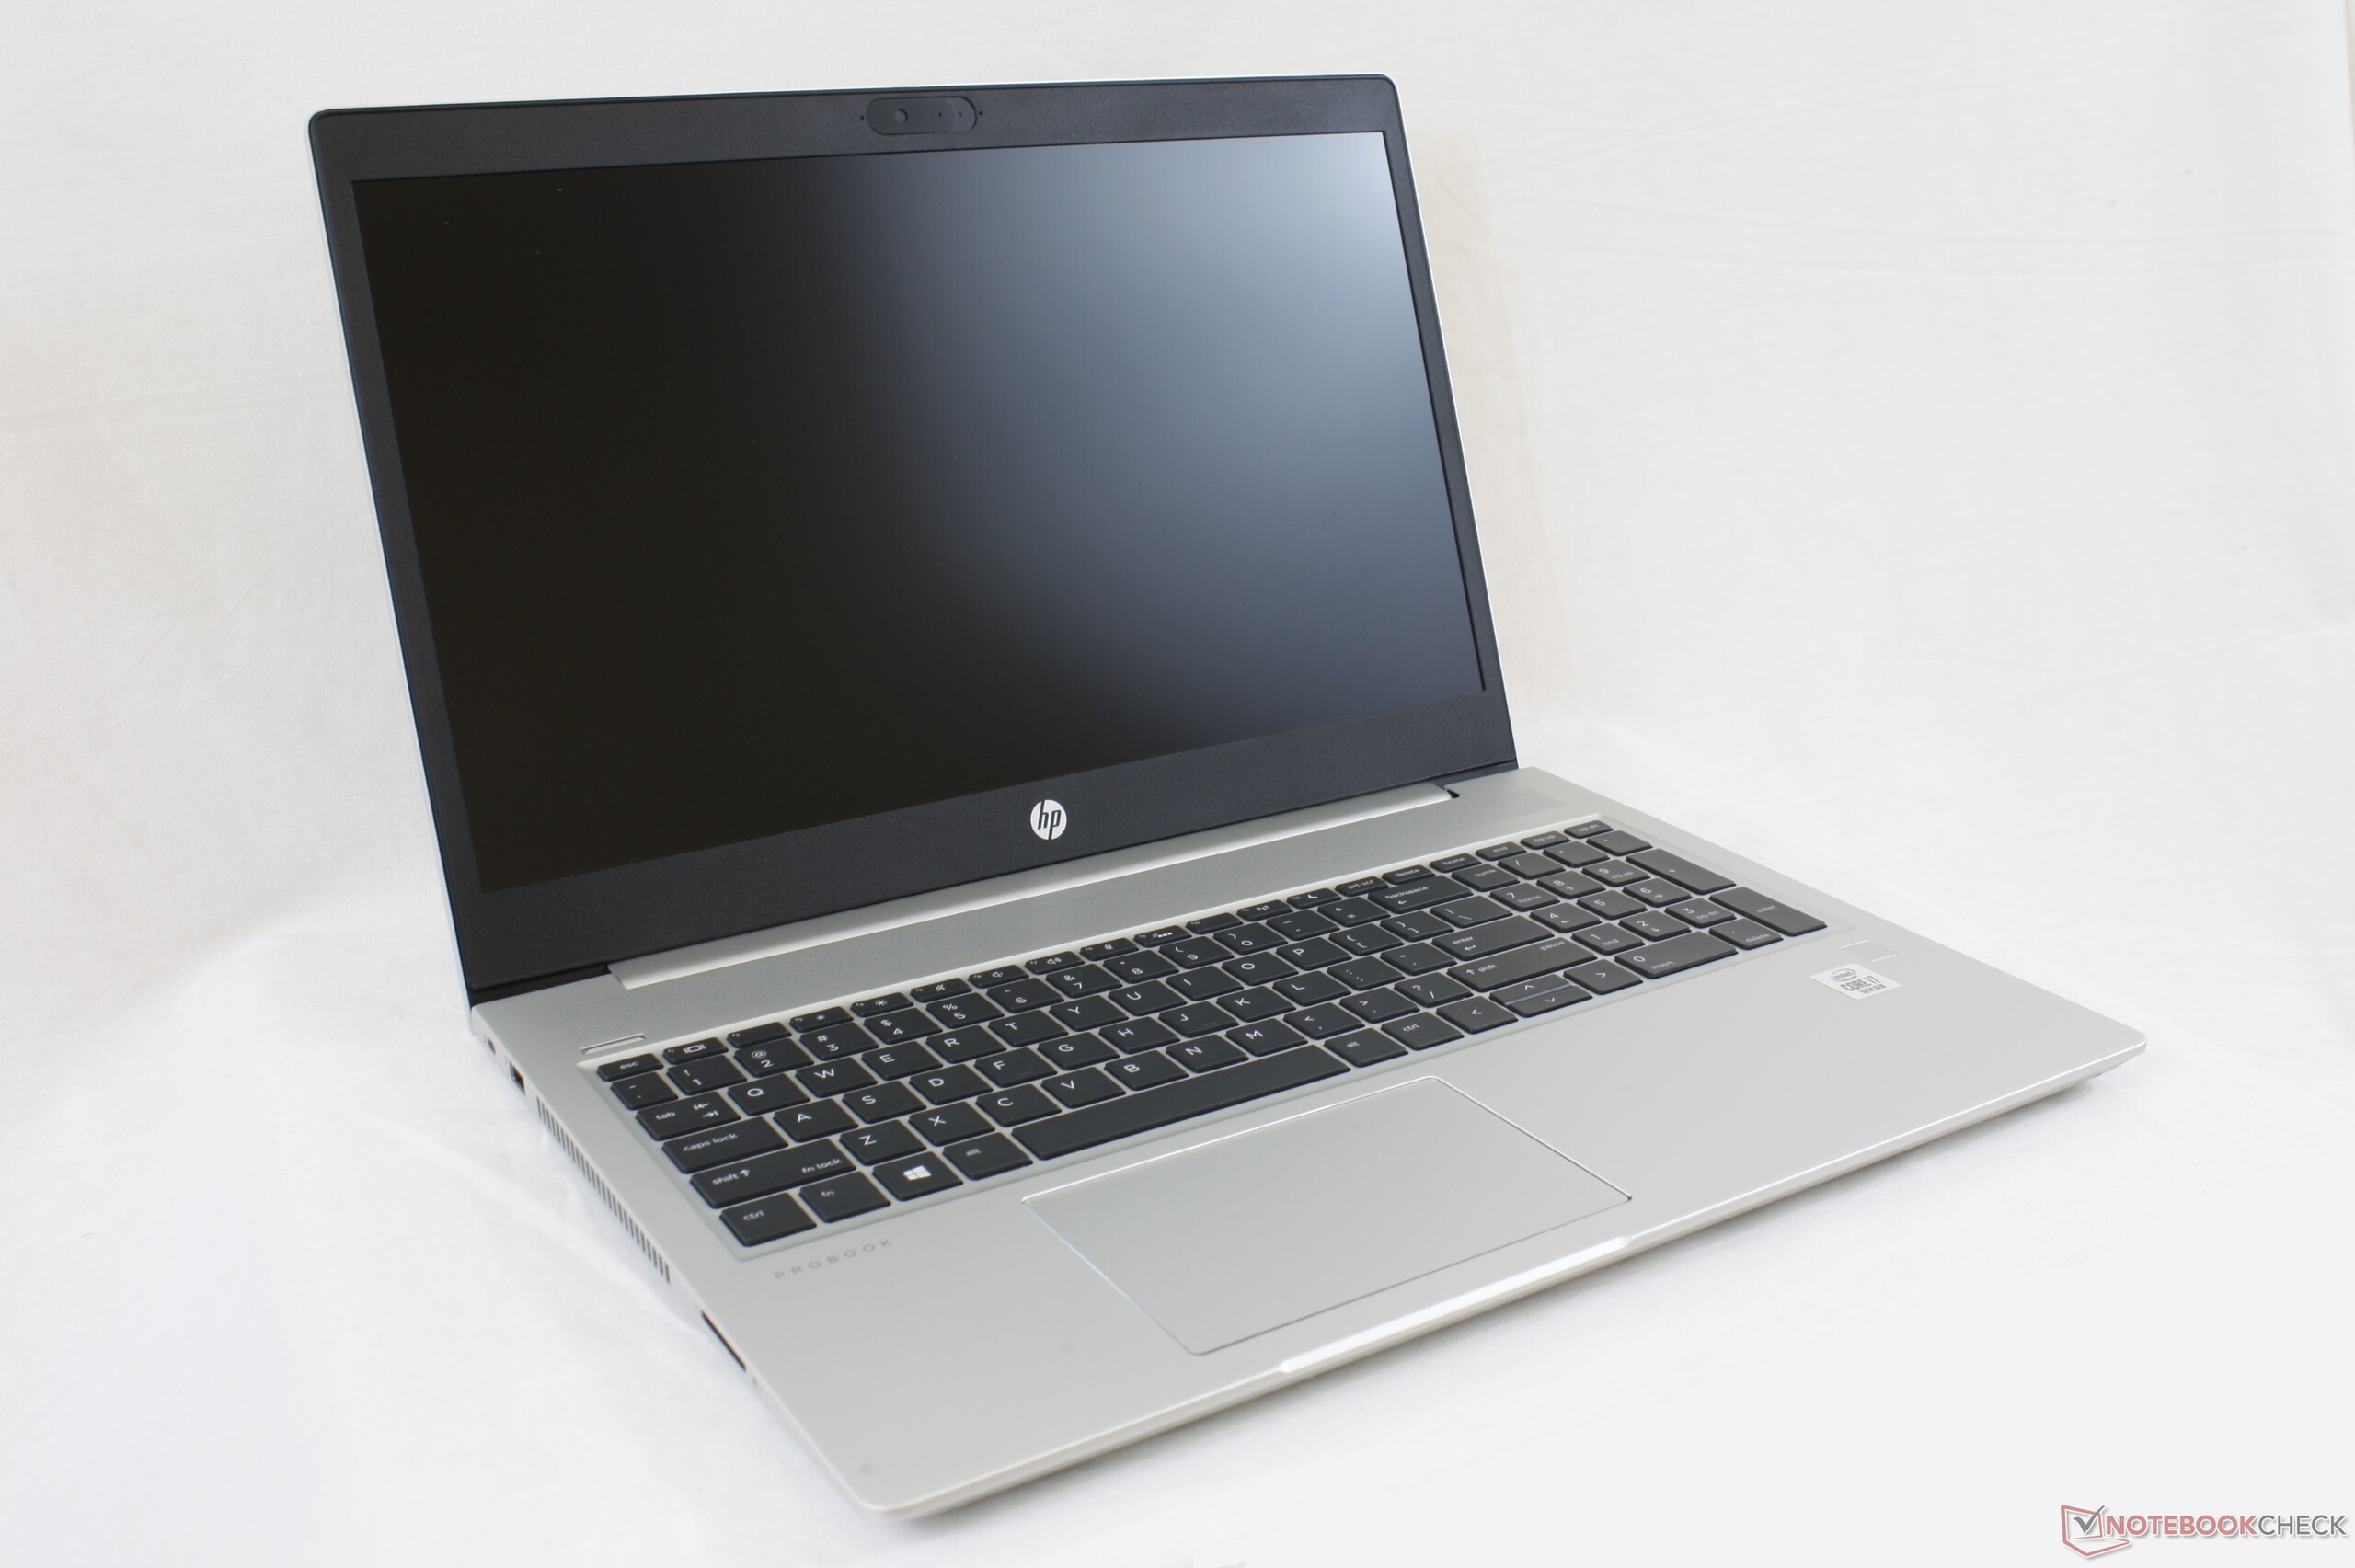
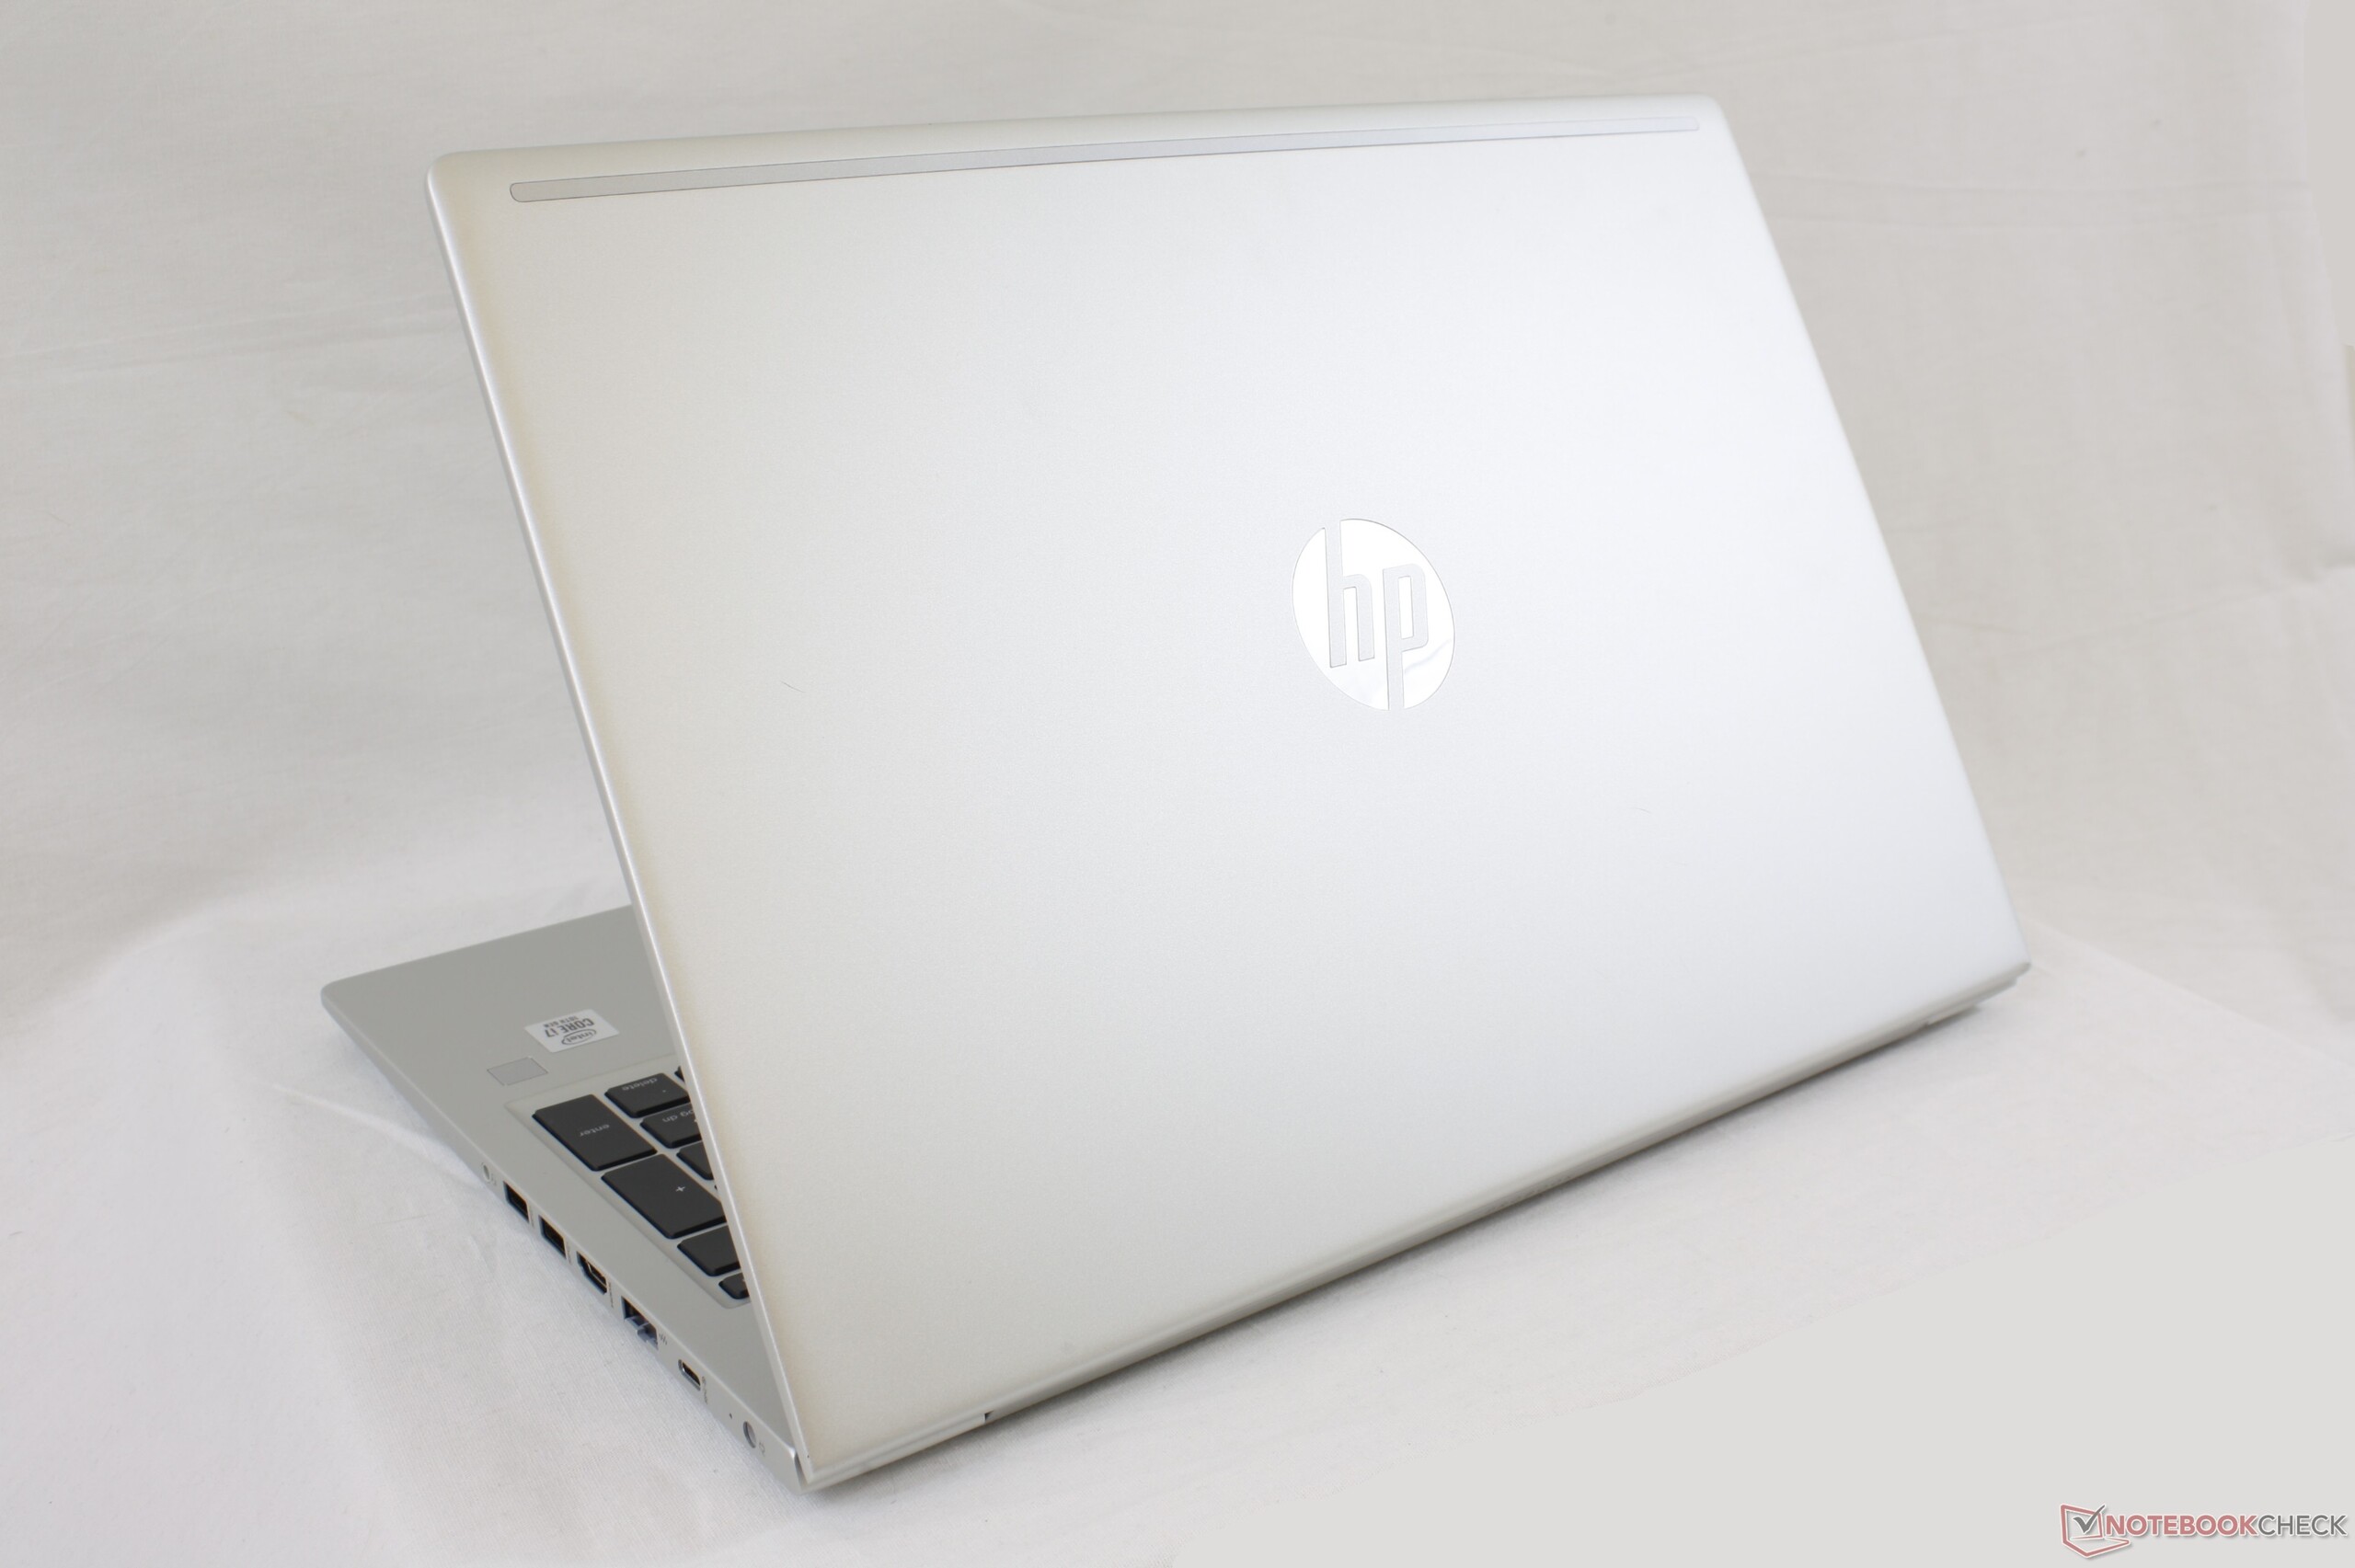
Das Gehäuse bleibt optisch mit dem des ProBook 455 G7 beziehungsweise auch dem des ProBook 450 G6 aus dem letzten Jahr identisch, HP hat das Design also seit einem Jahr nicht geändert. Da es bei den meisten Herstellern üblich ist, das gleiche Chassis zwei oder drei Jahre lang zu verwenden, bevor die Geräte ein brandneues Aussehen bekommen, muss man sich für eine vollständig überarbeitete Version wohl noch bis zum ProBook 450 G8 oder ProBook 450 G9 gedulden.
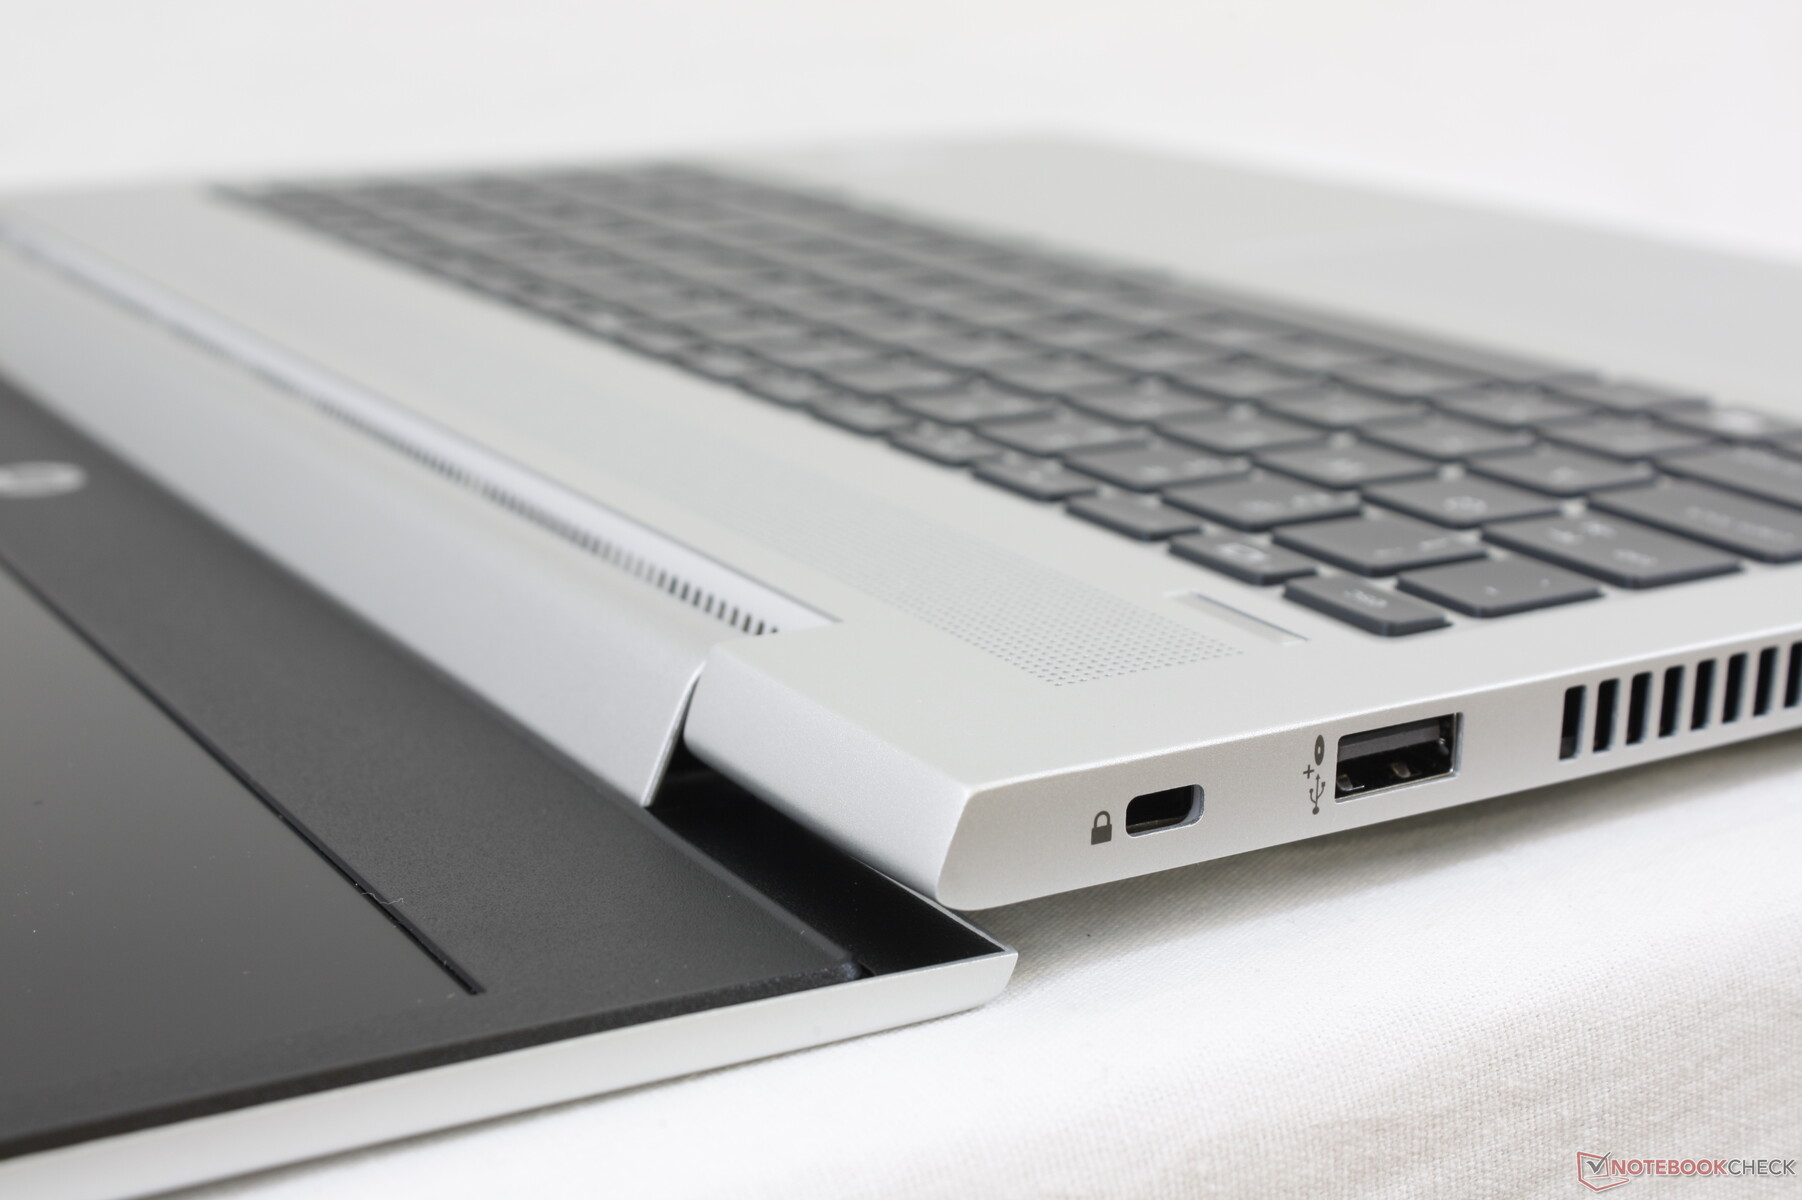
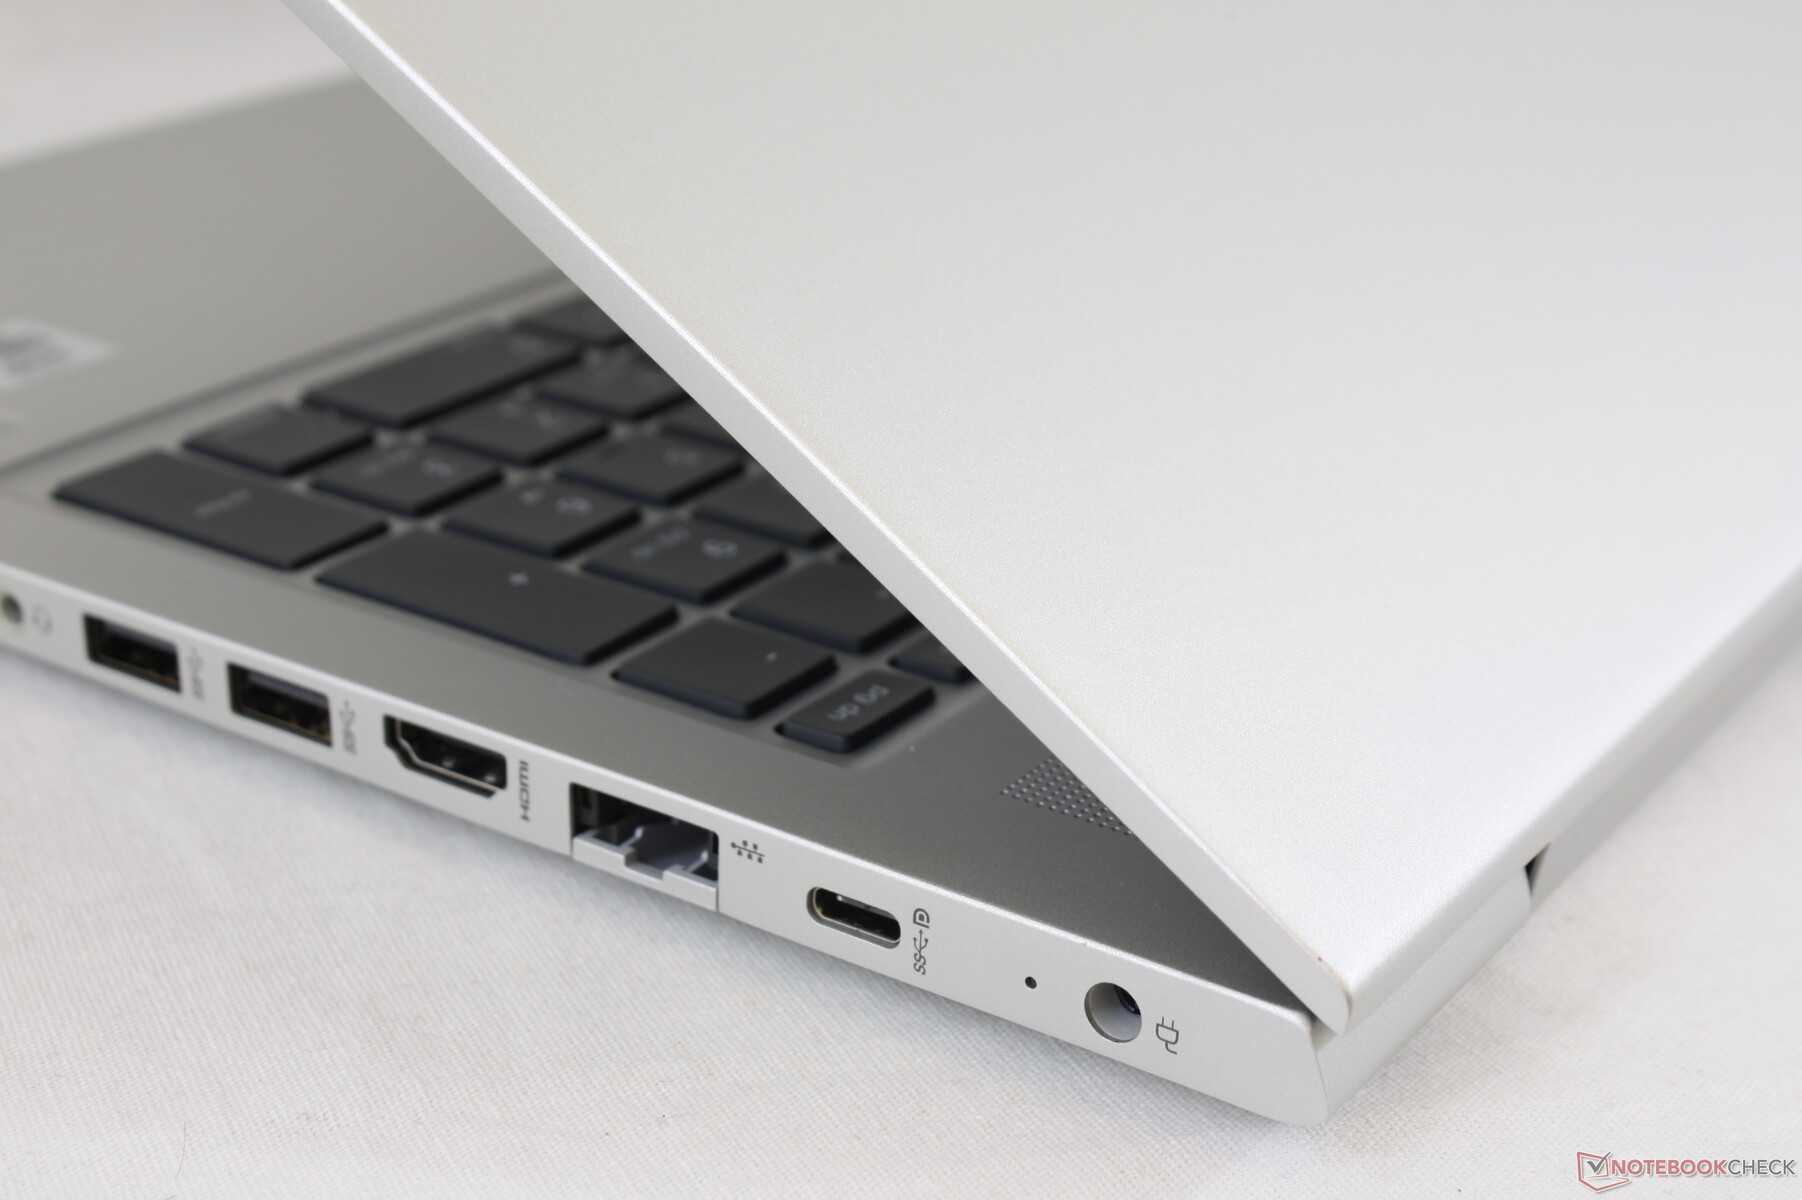
Ausstattung
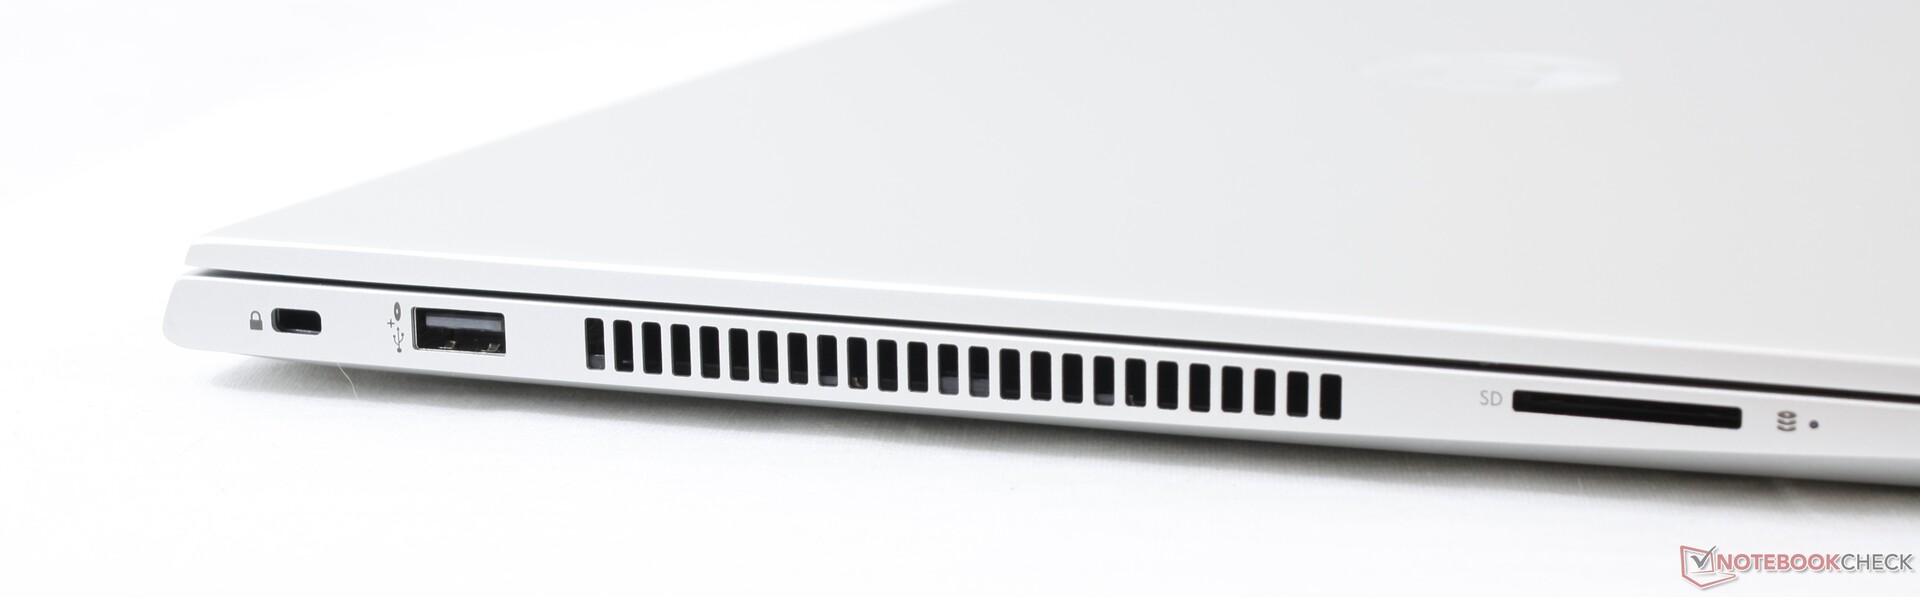
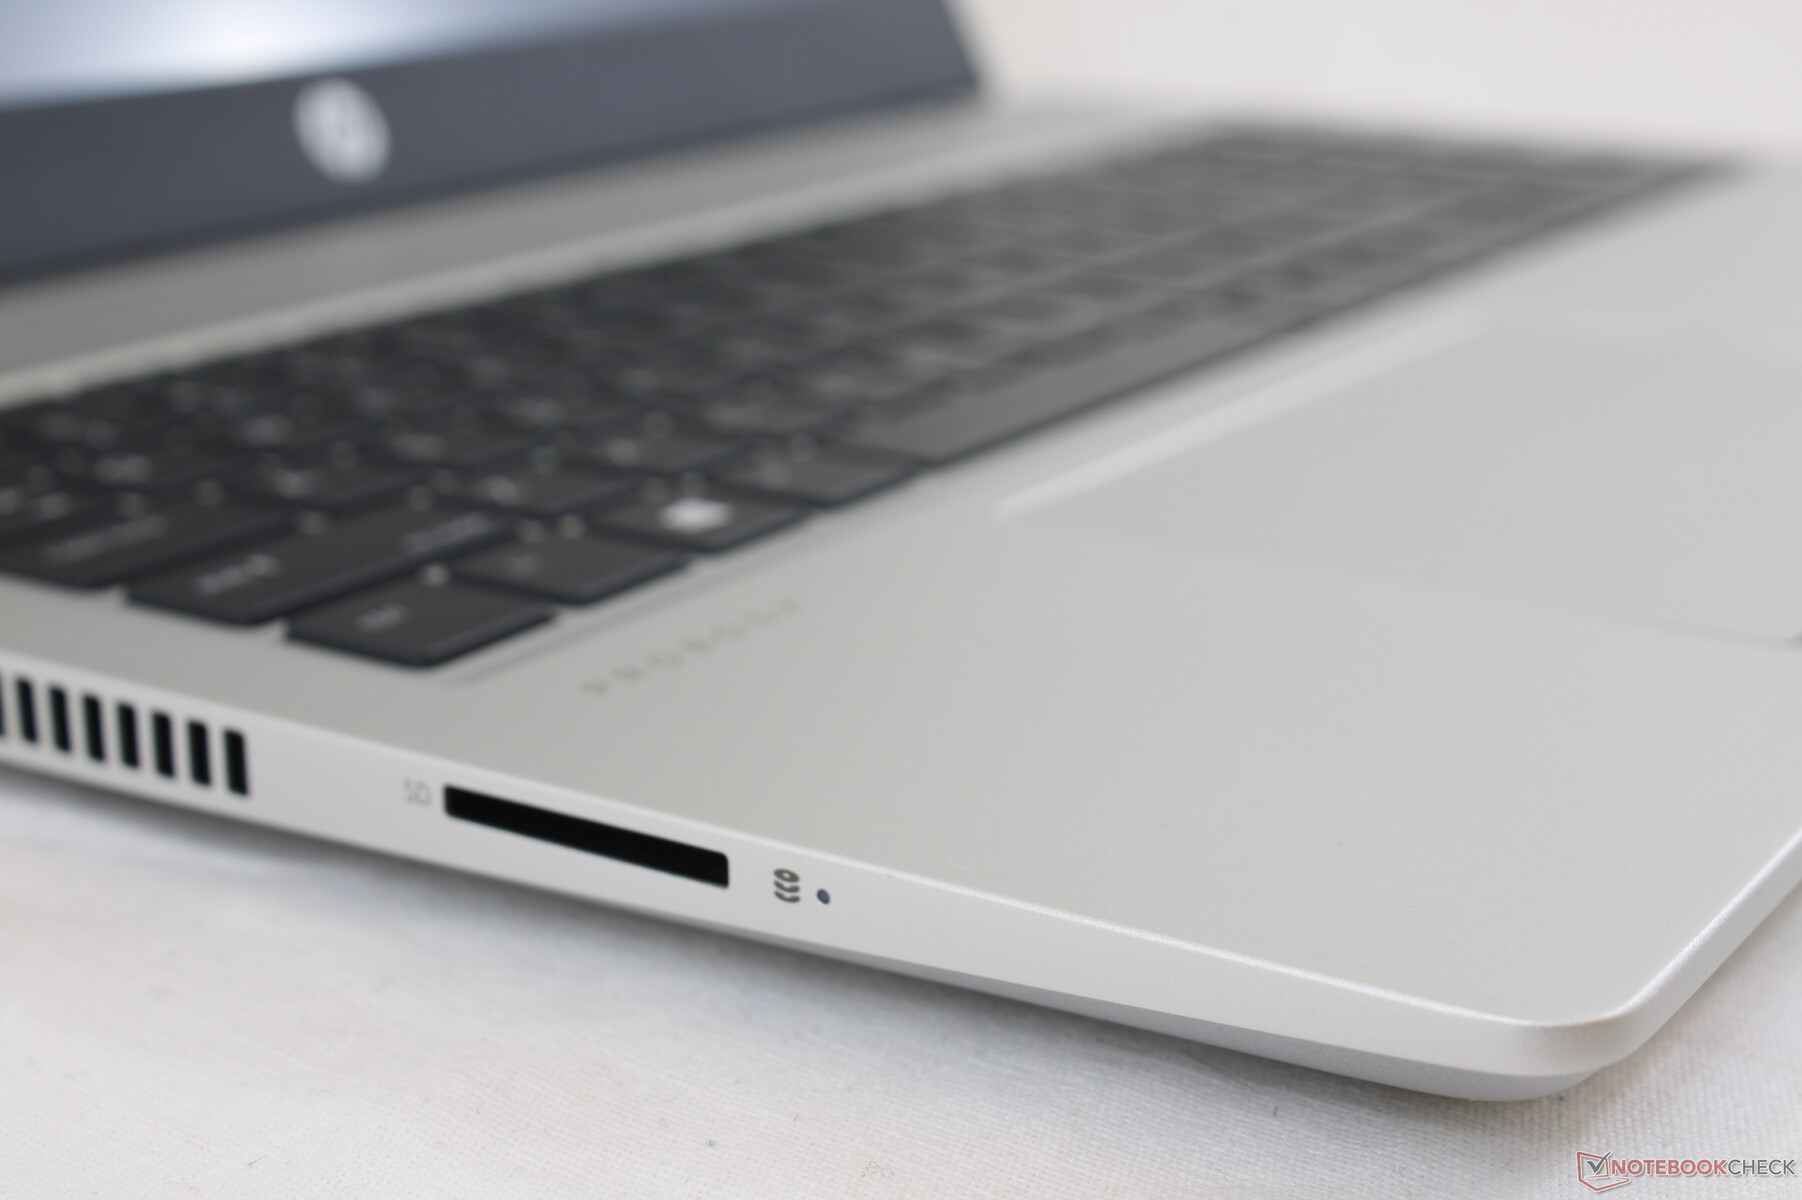
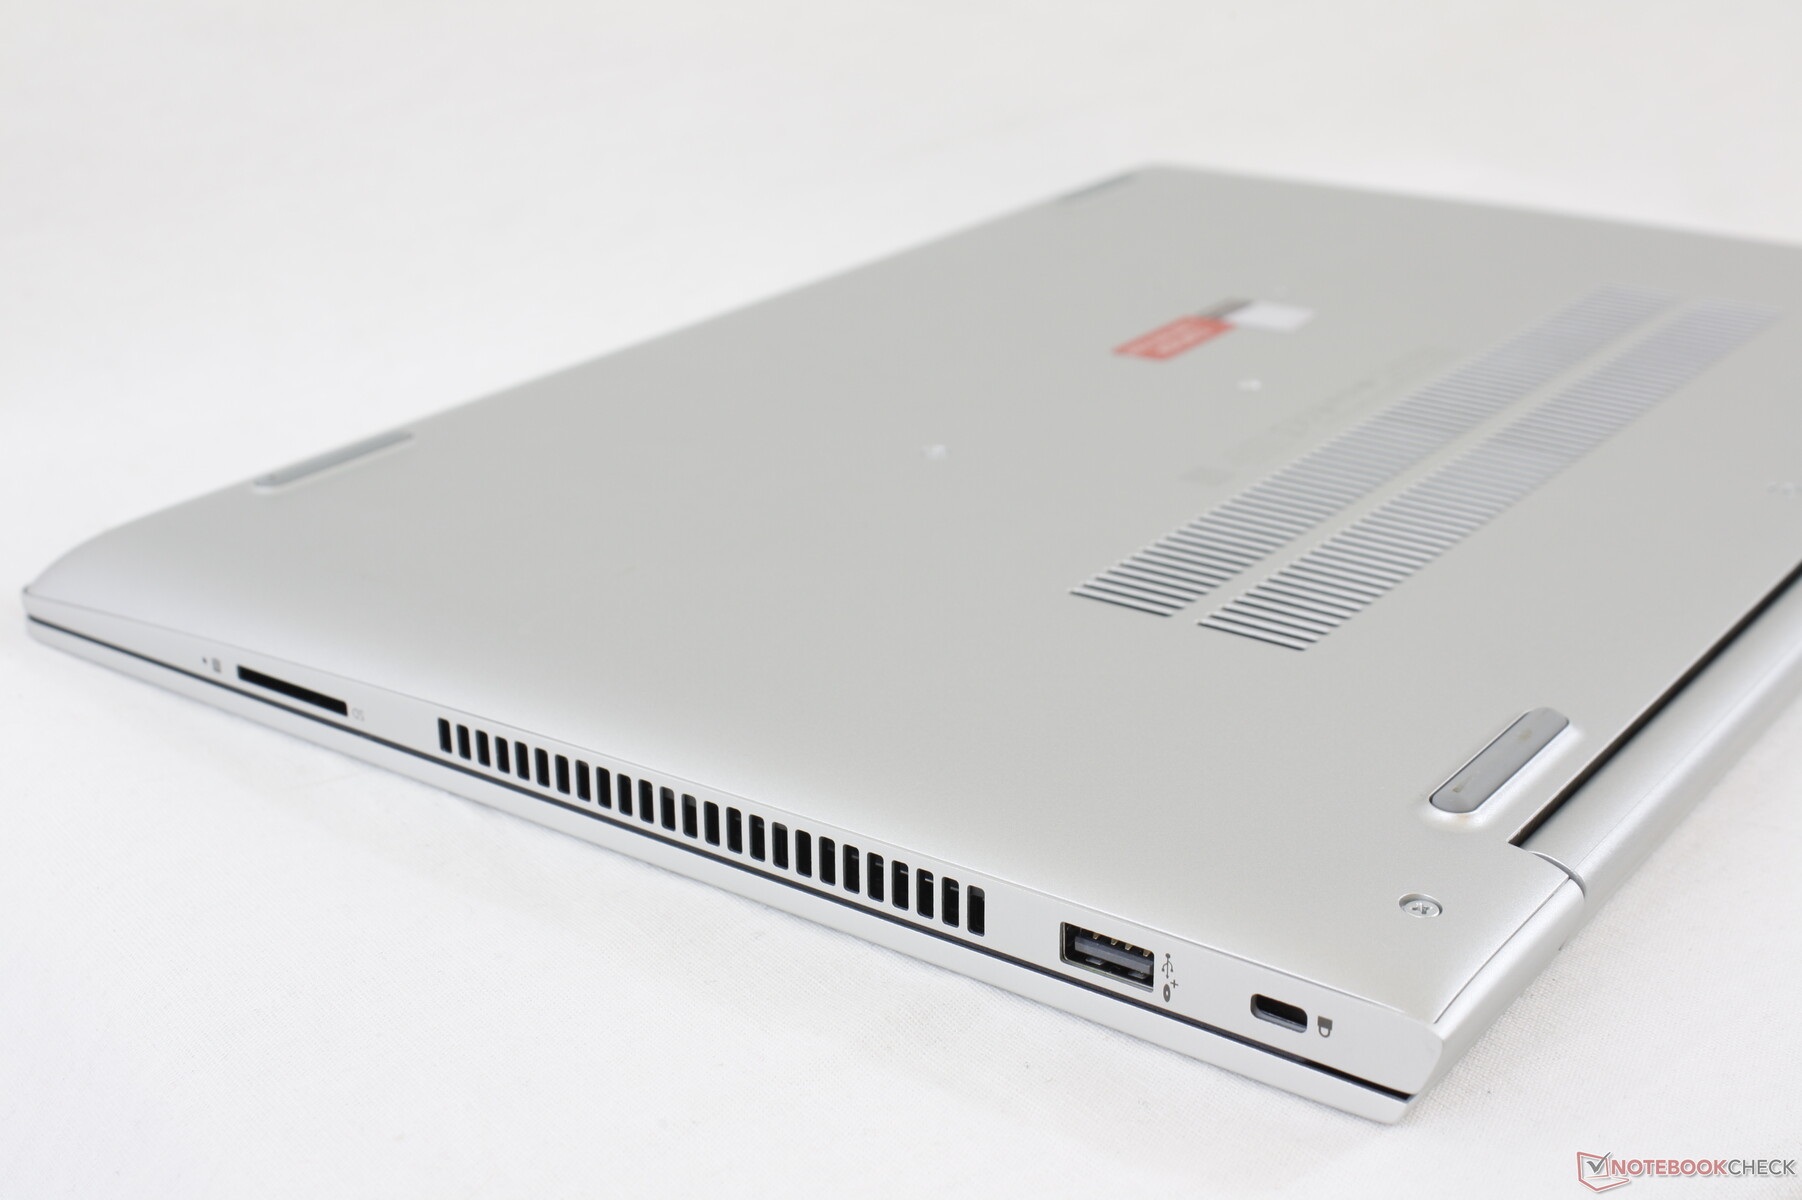
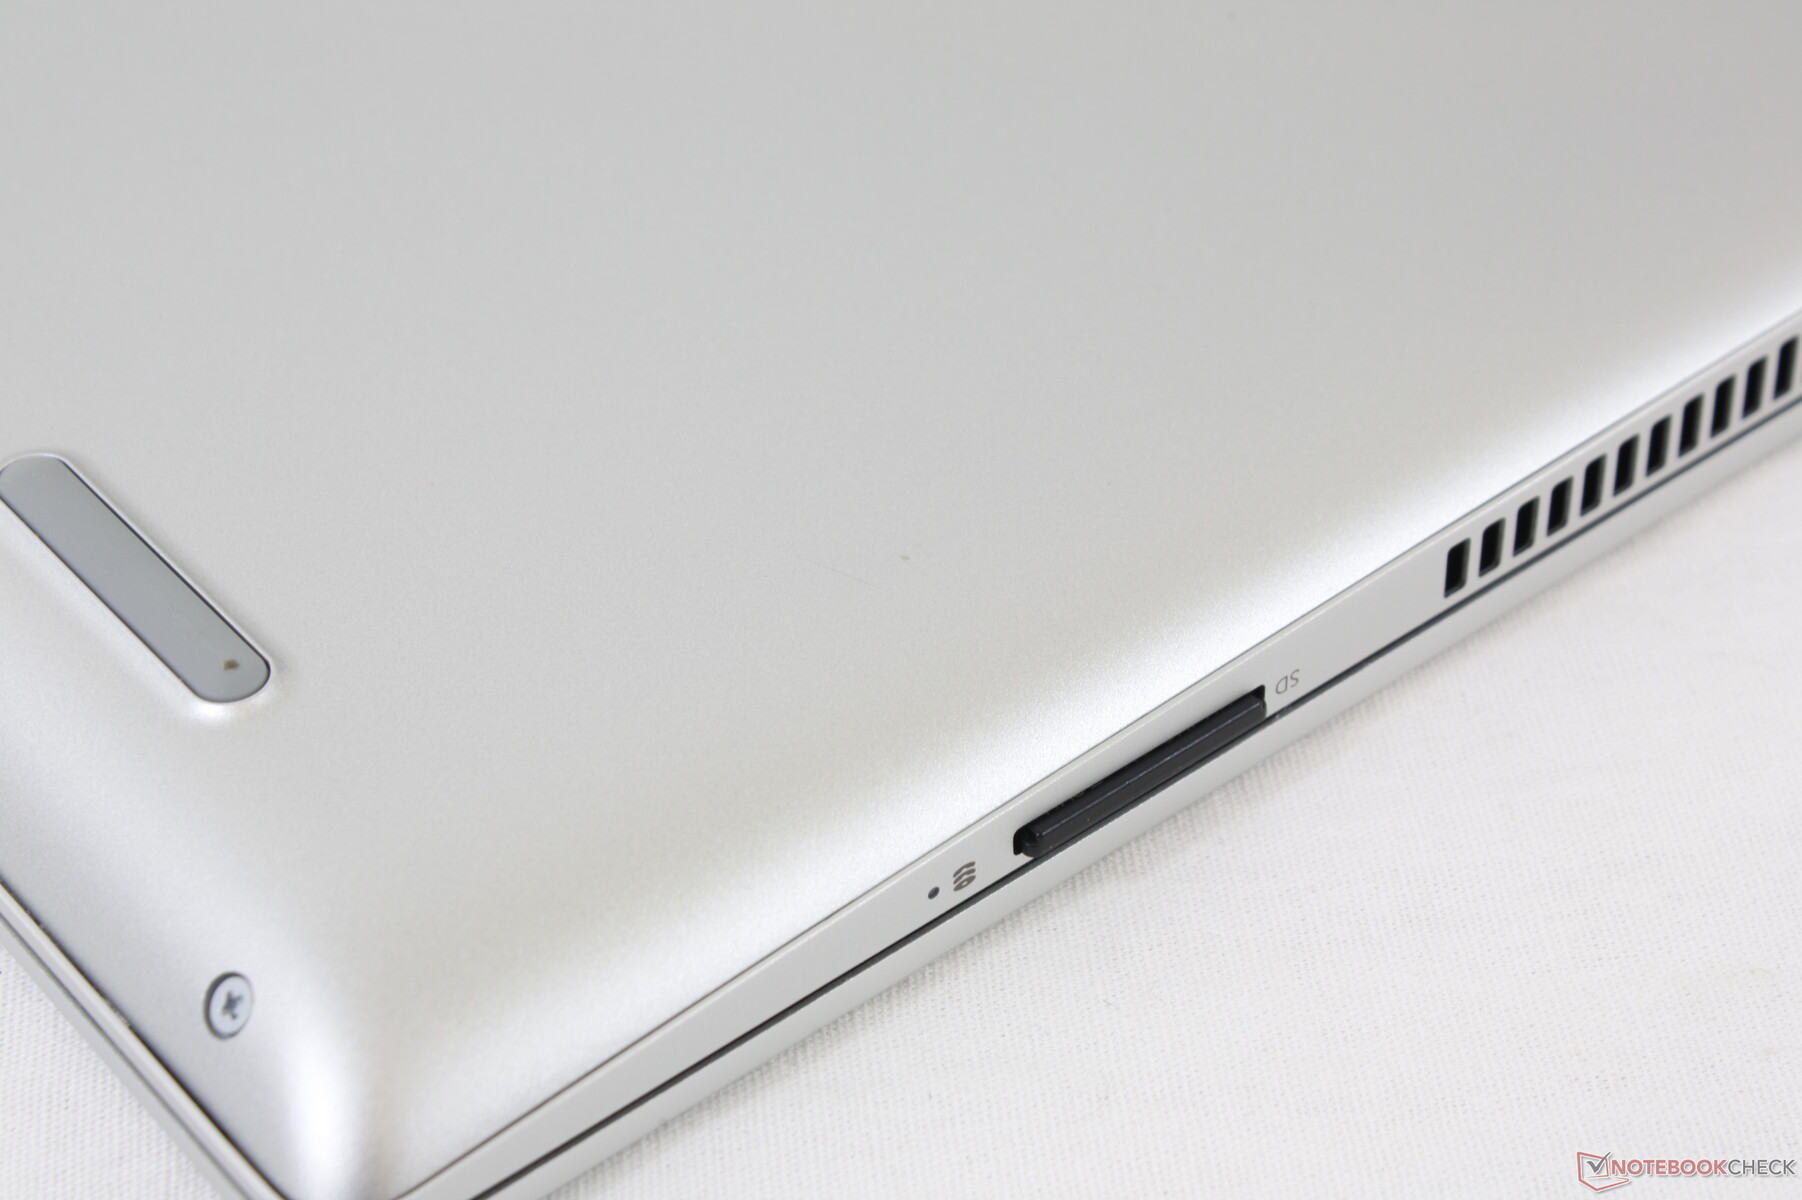
SD-Kartenleser
Mit ungefähr 80 MB/s sind die Übertragungsraten des gefederten SD-Kartenlesers durchschnittlich. Die Kartenleser der teureren HP-EliteBook-Laptops, wie zum Beispiel dem EliteBook 1050 G1, sind teilweise zwei- bis dreimal so schnell.
| SD Card Reader | |
| average JPG Copy Test (av. of 3 runs) | |
| HP EliteBook 1050 G1-4QY20EA (Toshiba Exceria Pro SDXC 64 GB UHS-II) | |
| HP ProBook 455 G7-175W8EA (Toshiba Exceria Pro SDXC 64 GB UHS-II) | |
| HP ProBook 450 G7 8WC04UT (Toshiba Exceria Pro SDXC 64 GB UHS-II) | |
| Lenovo ThinkPad L590-20Q70019GE (Toshiba Exceria Pro M501 64 GB UHS-II) | |
| MSI Modern 15 A10RB (Toshiba Exceria Pro M501 UHS-II) | |
| Dell Latitude 15 3590 (Toshiba Exceria Pro SDXC 64 GB UHS-II) | |
| maximum AS SSD Seq Read Test (1GB) | |
| HP EliteBook 1050 G1-4QY20EA (Toshiba Exceria Pro SDXC 64 GB UHS-II) | |
| HP ProBook 455 G7-175W8EA (Toshiba Exceria Pro SDXC 64 GB UHS-II) | |
| Lenovo ThinkPad L590-20Q70019GE (Toshiba Exceria Pro M501 64 GB UHS-II) | |
| HP ProBook 450 G7 8WC04UT (Toshiba Exceria Pro SDXC 64 GB UHS-II) | |
| MSI Modern 15 A10RB (Toshiba Exceria Pro M501 UHS-II) | |
| Dell Latitude 15 3590 (Toshiba Exceria Pro SDXC 64 GB UHS-II) | |
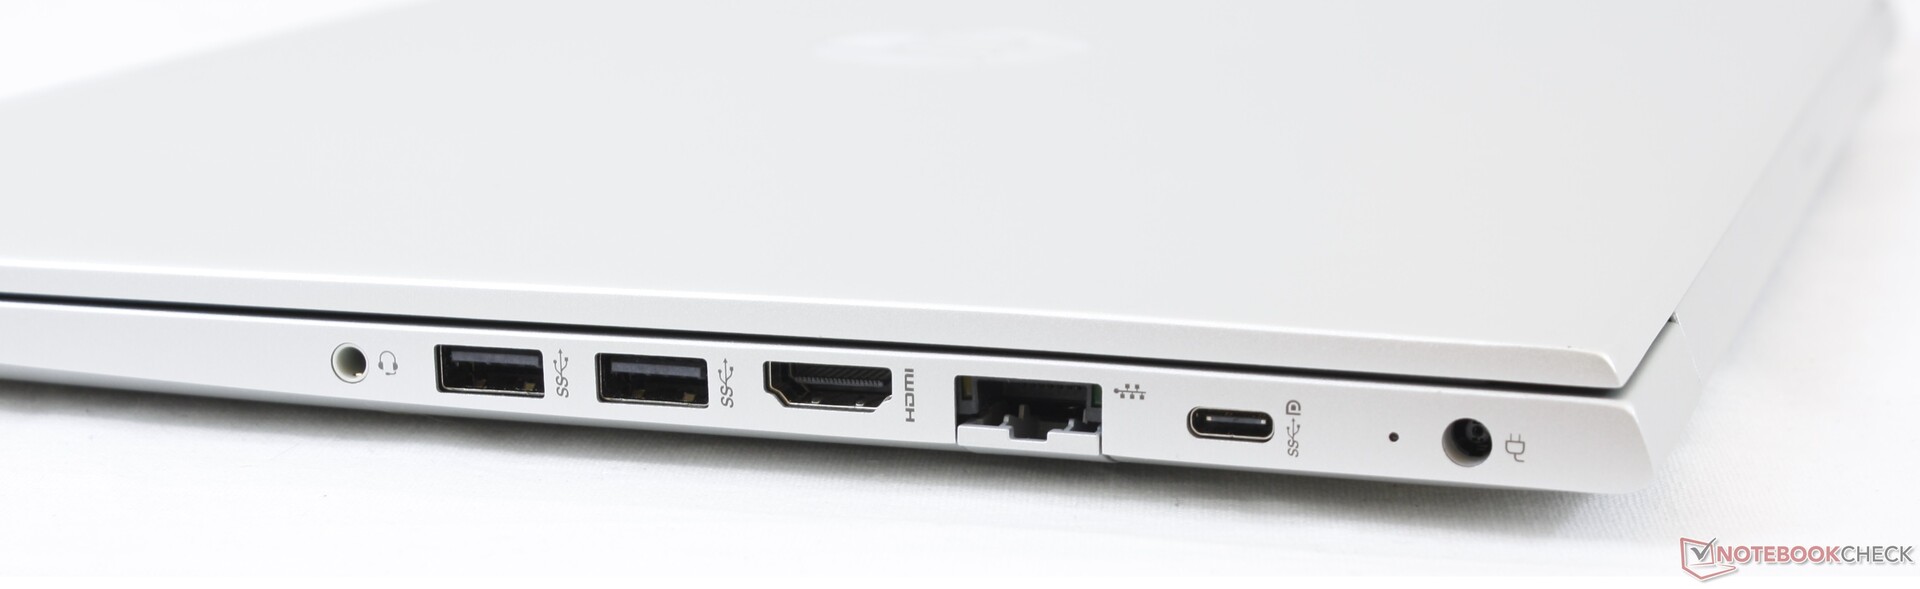
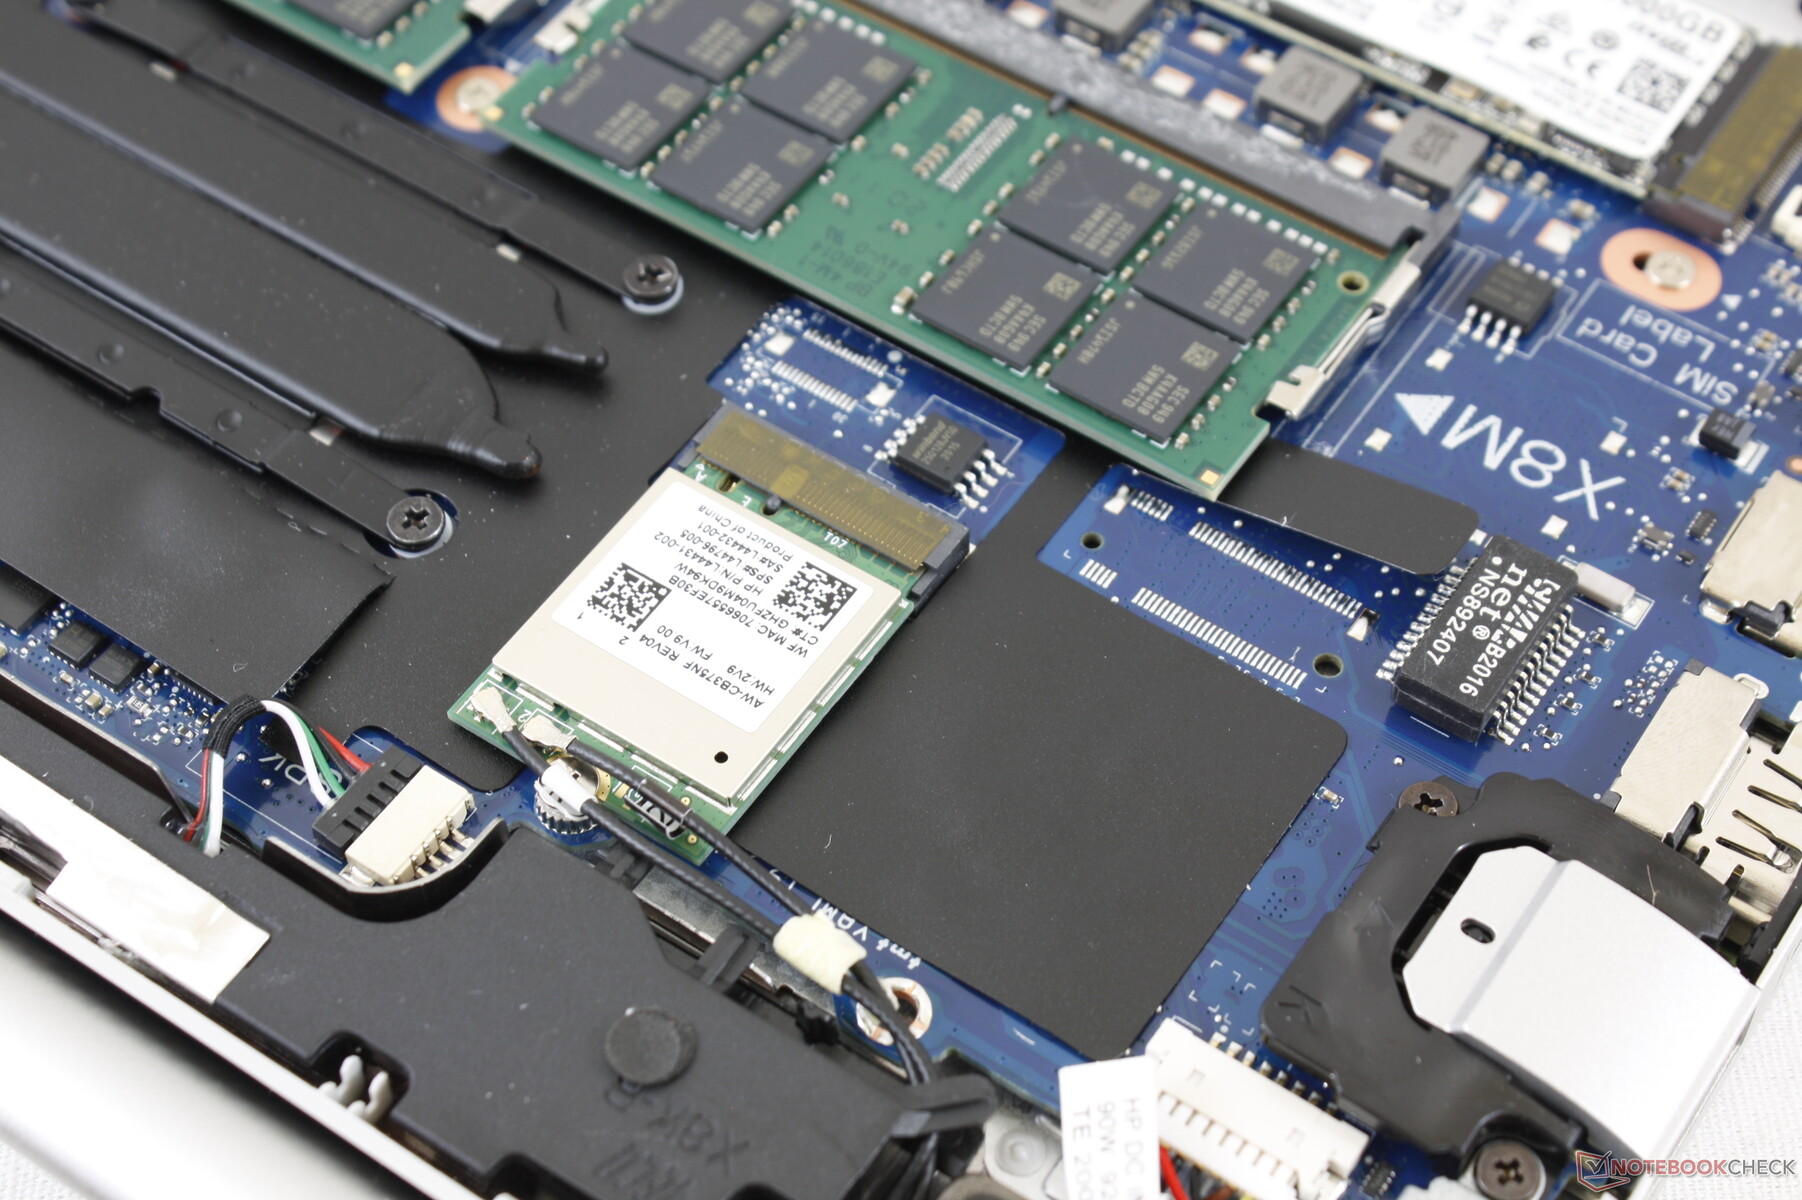
Kommunikation
Unser Testgerät ist mit dem WLAN-5-Modul Realtek 8822CE ausgestattet und verrichtete seinen Dienst im Test mit unserem Testrouter Netgear RAX200 problemlos. Alternativ können im Zuge der Konfiguration auch Intel-AX200/-201-Module ausgewählt werden.
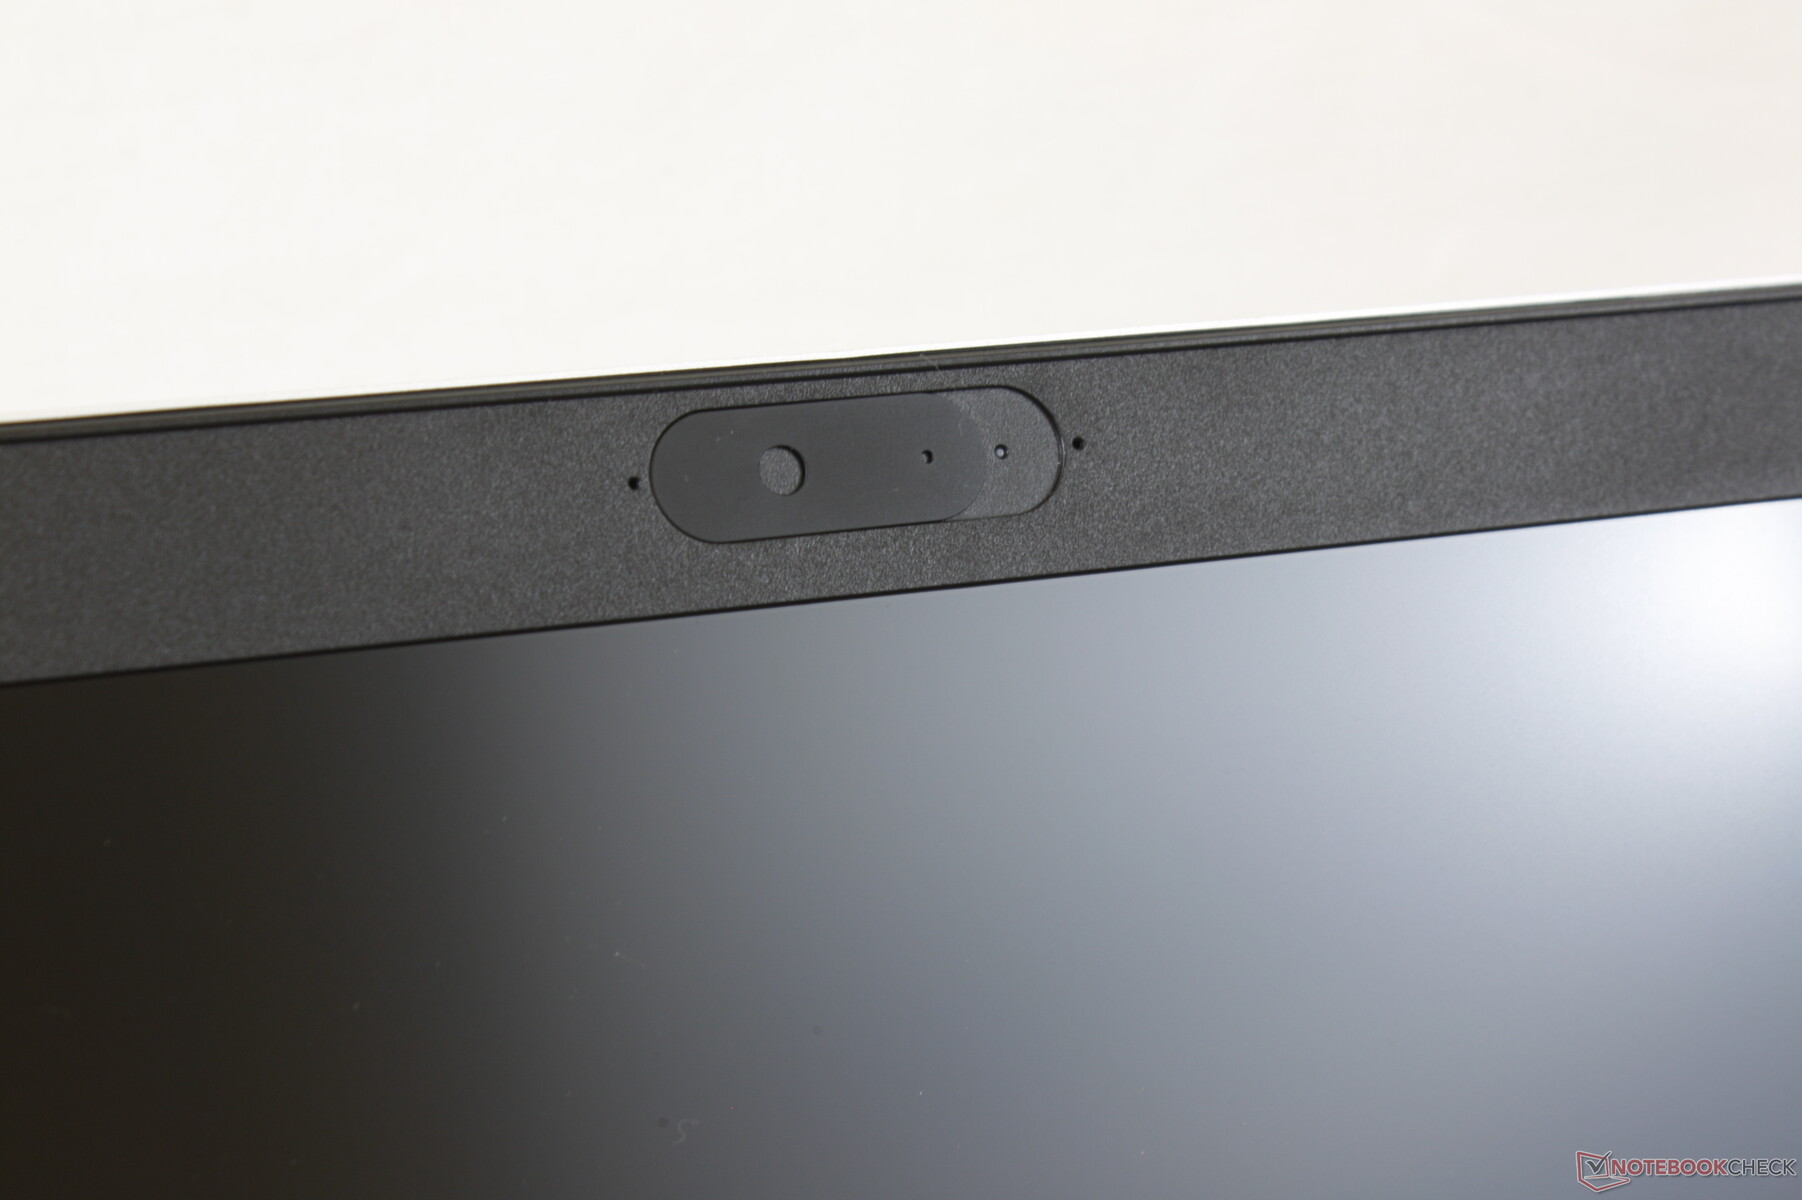
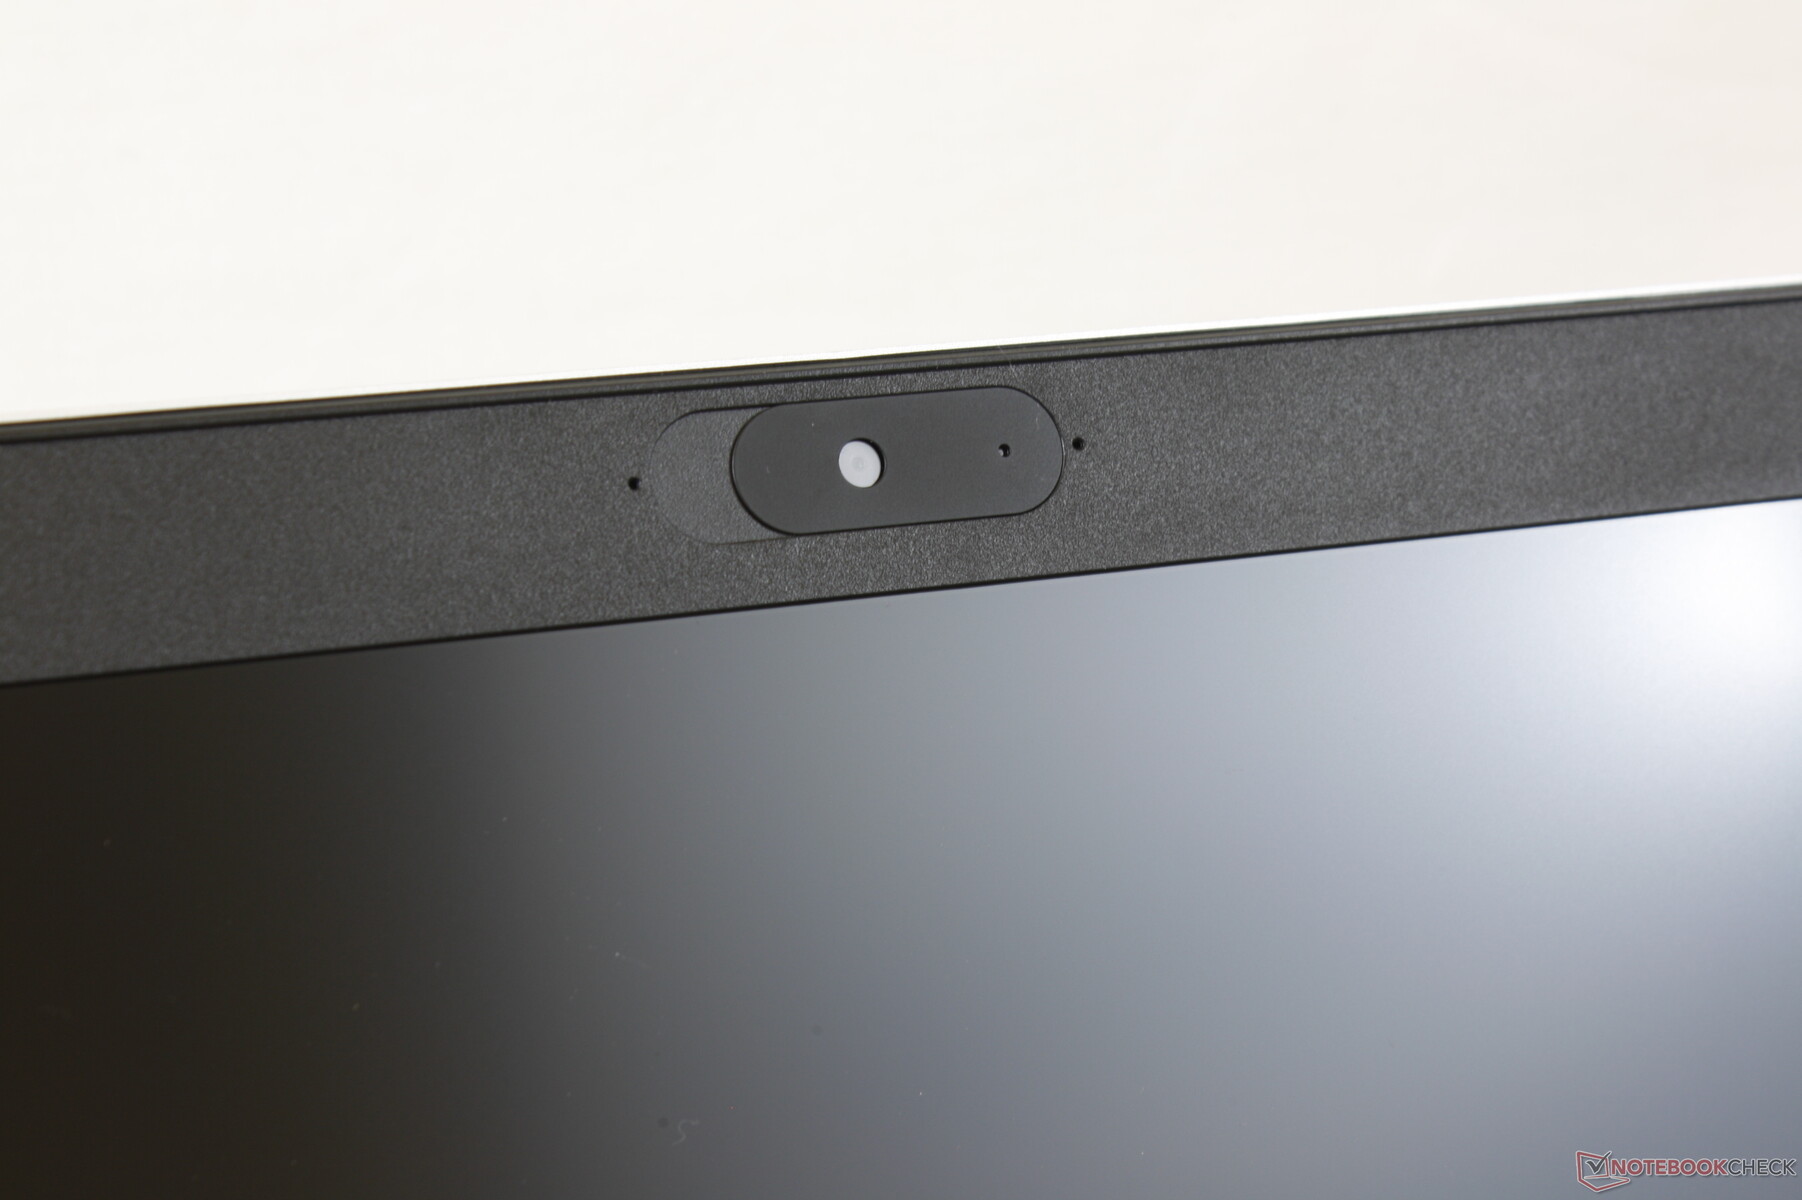
Webcam


Sicherheit
Während ein Fingerabdruckscanner, vPro, Sure View und eine IR-Kamera jeweils optional sind, ist die Webcam-Abdeckung standardmäßig mit an Bord. Ähnlich wie bei der teureren EliteBook-Reihe stehen außerdem auch fortgeschrittene HP-Software-Funktionen wie Sure Click, Sure Start, BIOSphere, Client Security und Sure Sense zur Verfügung.
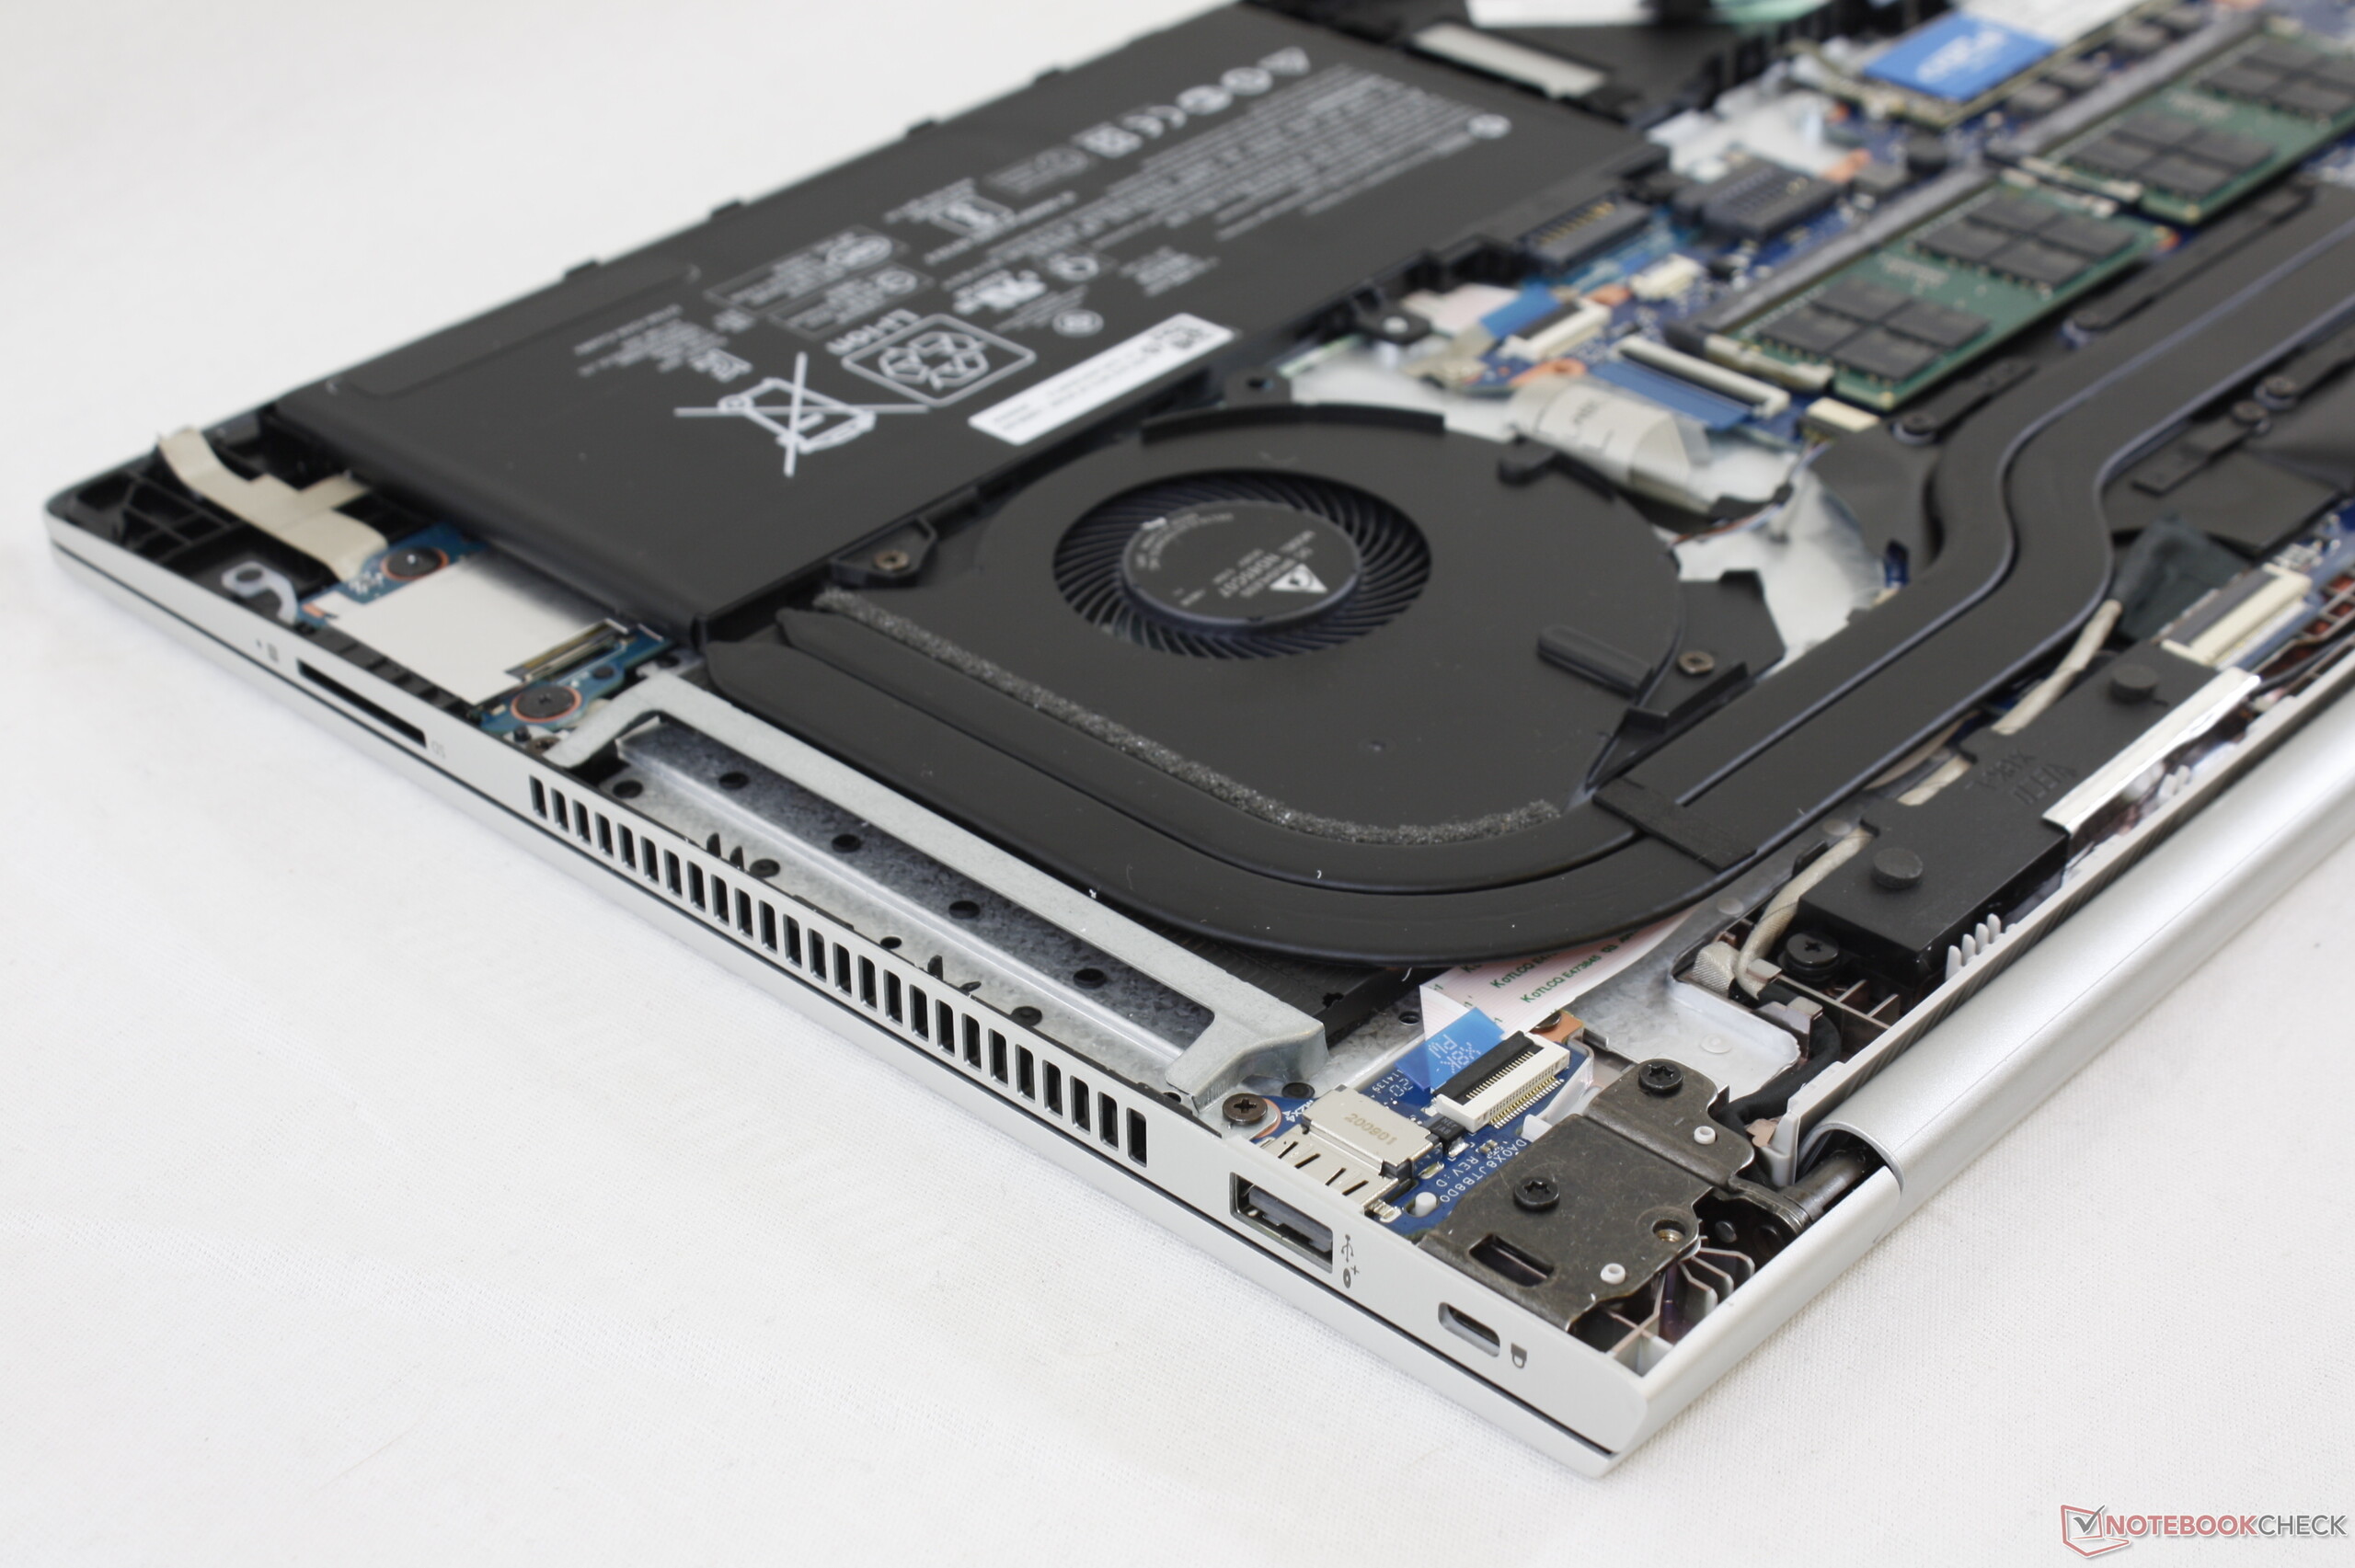
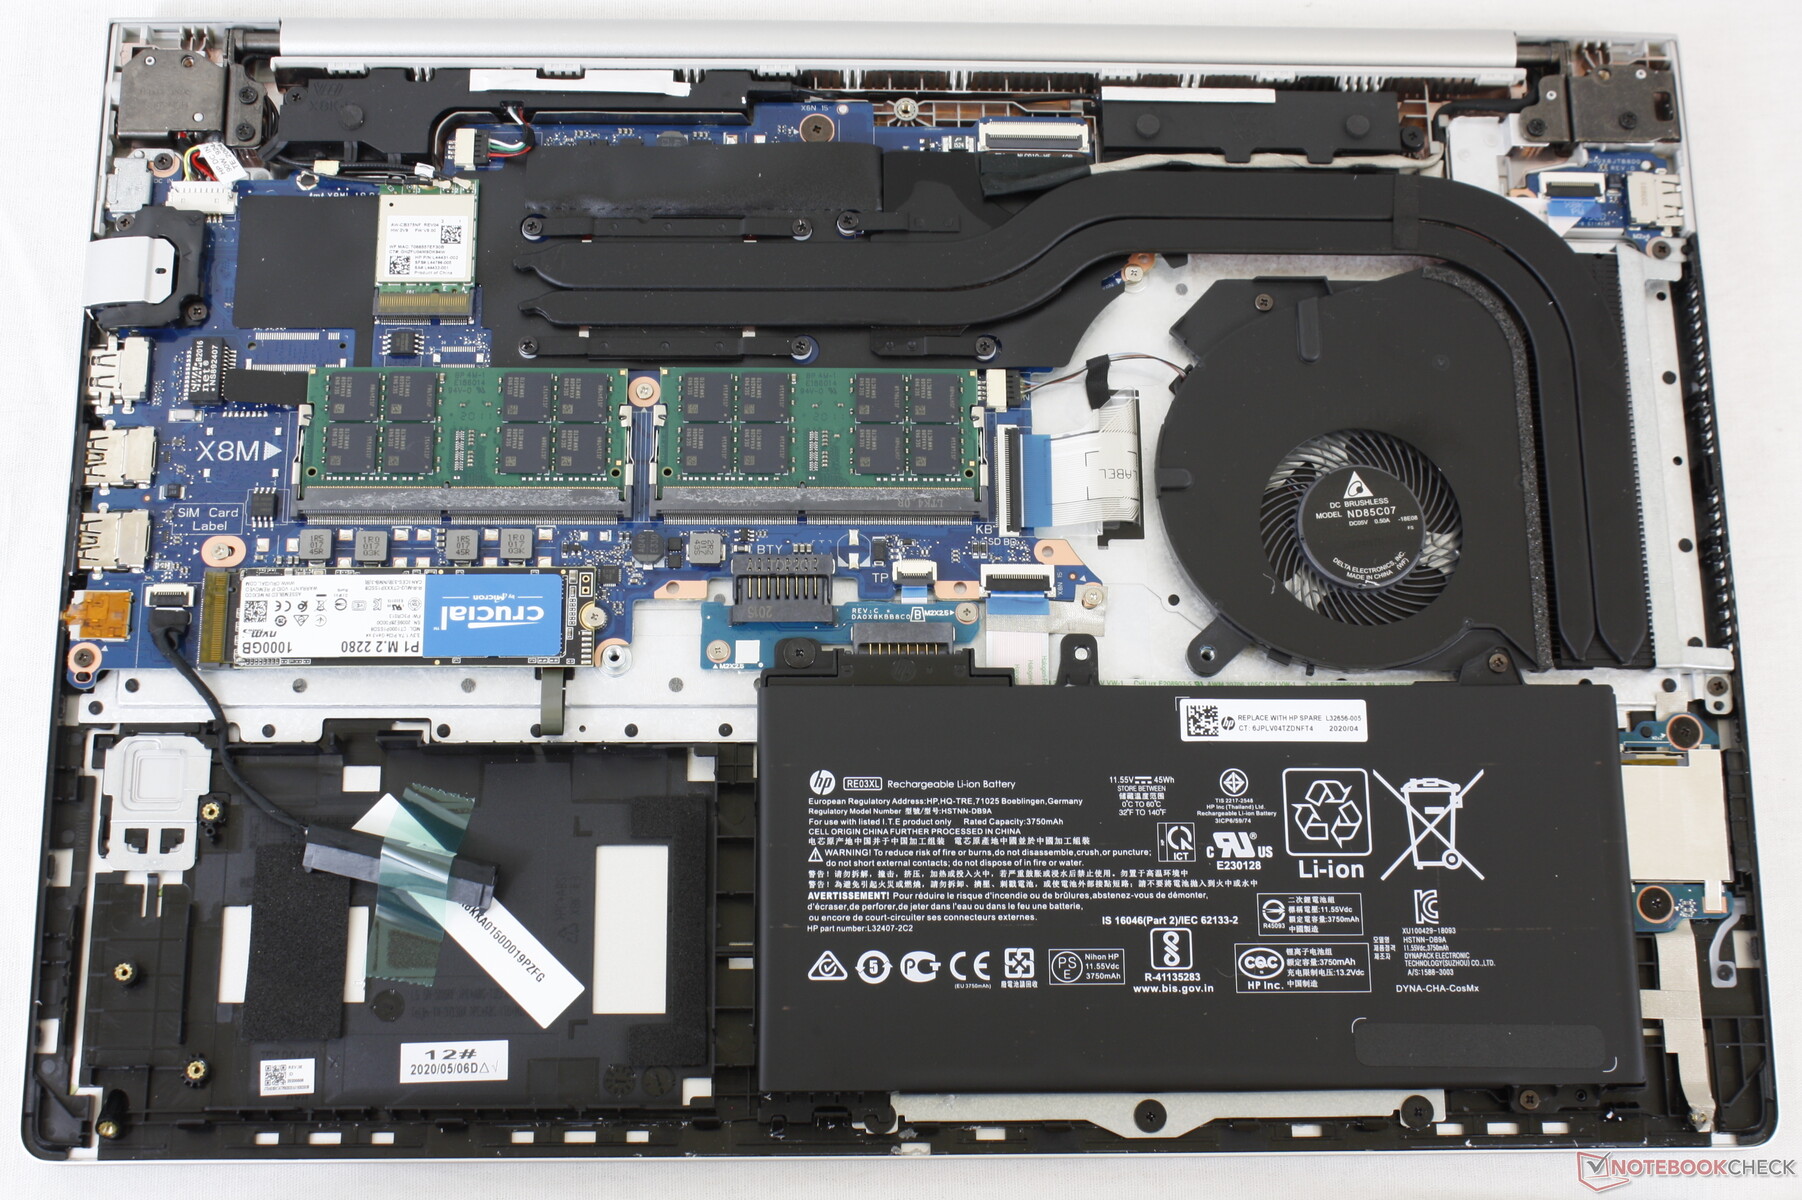
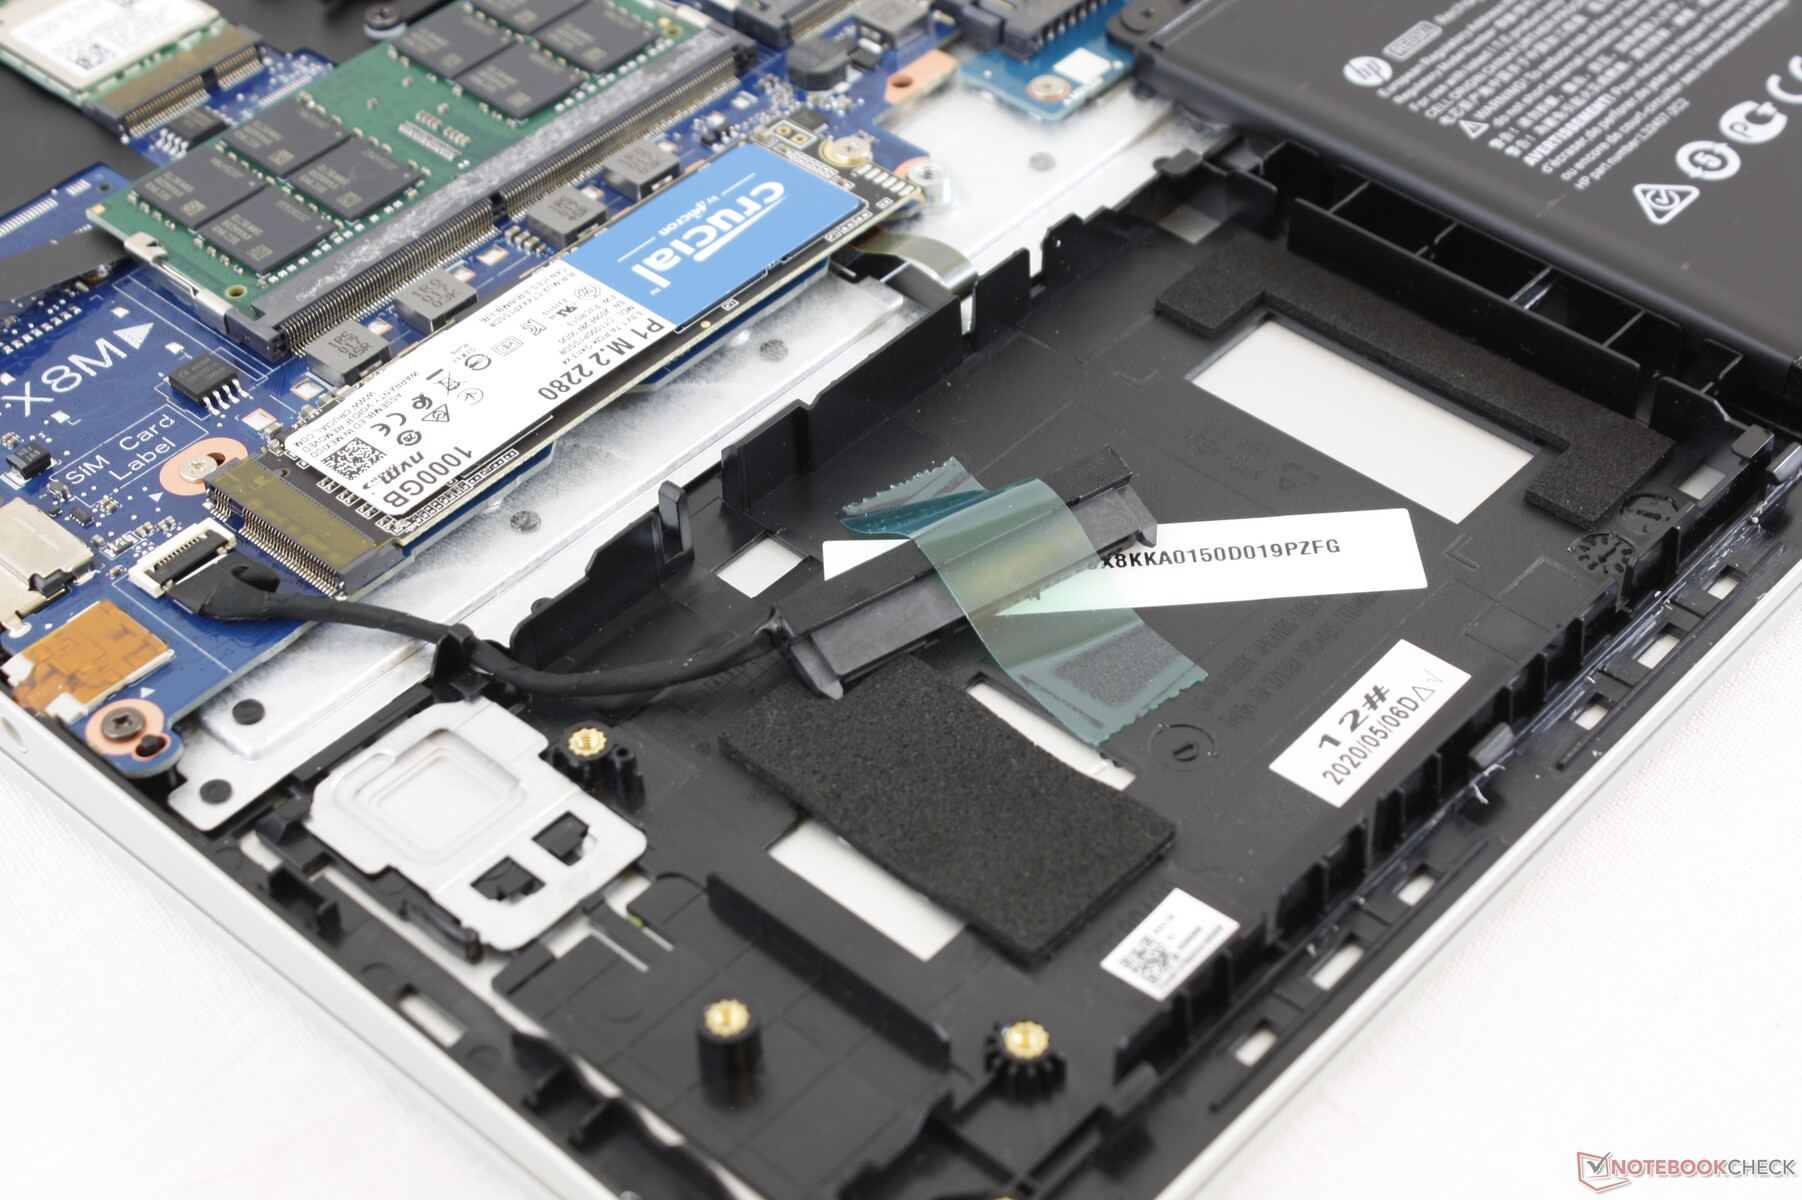
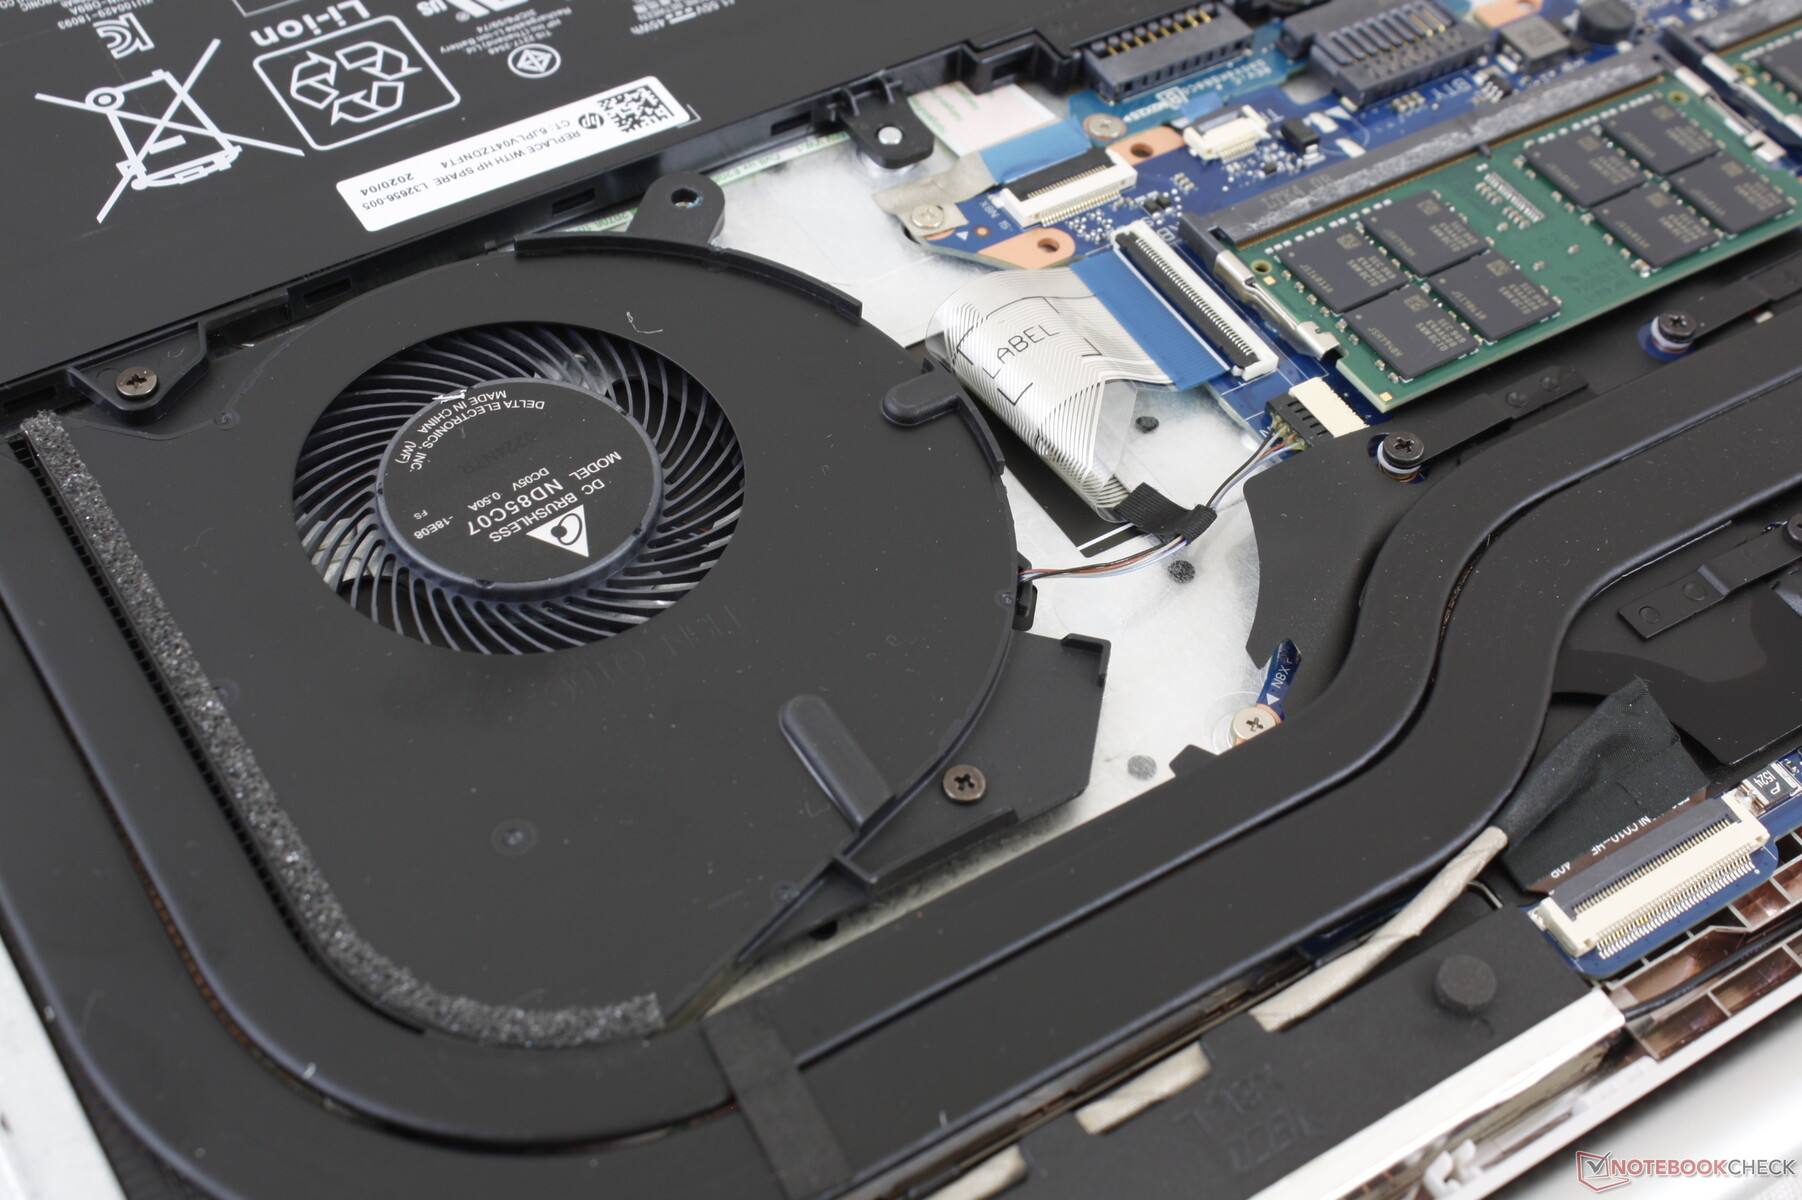
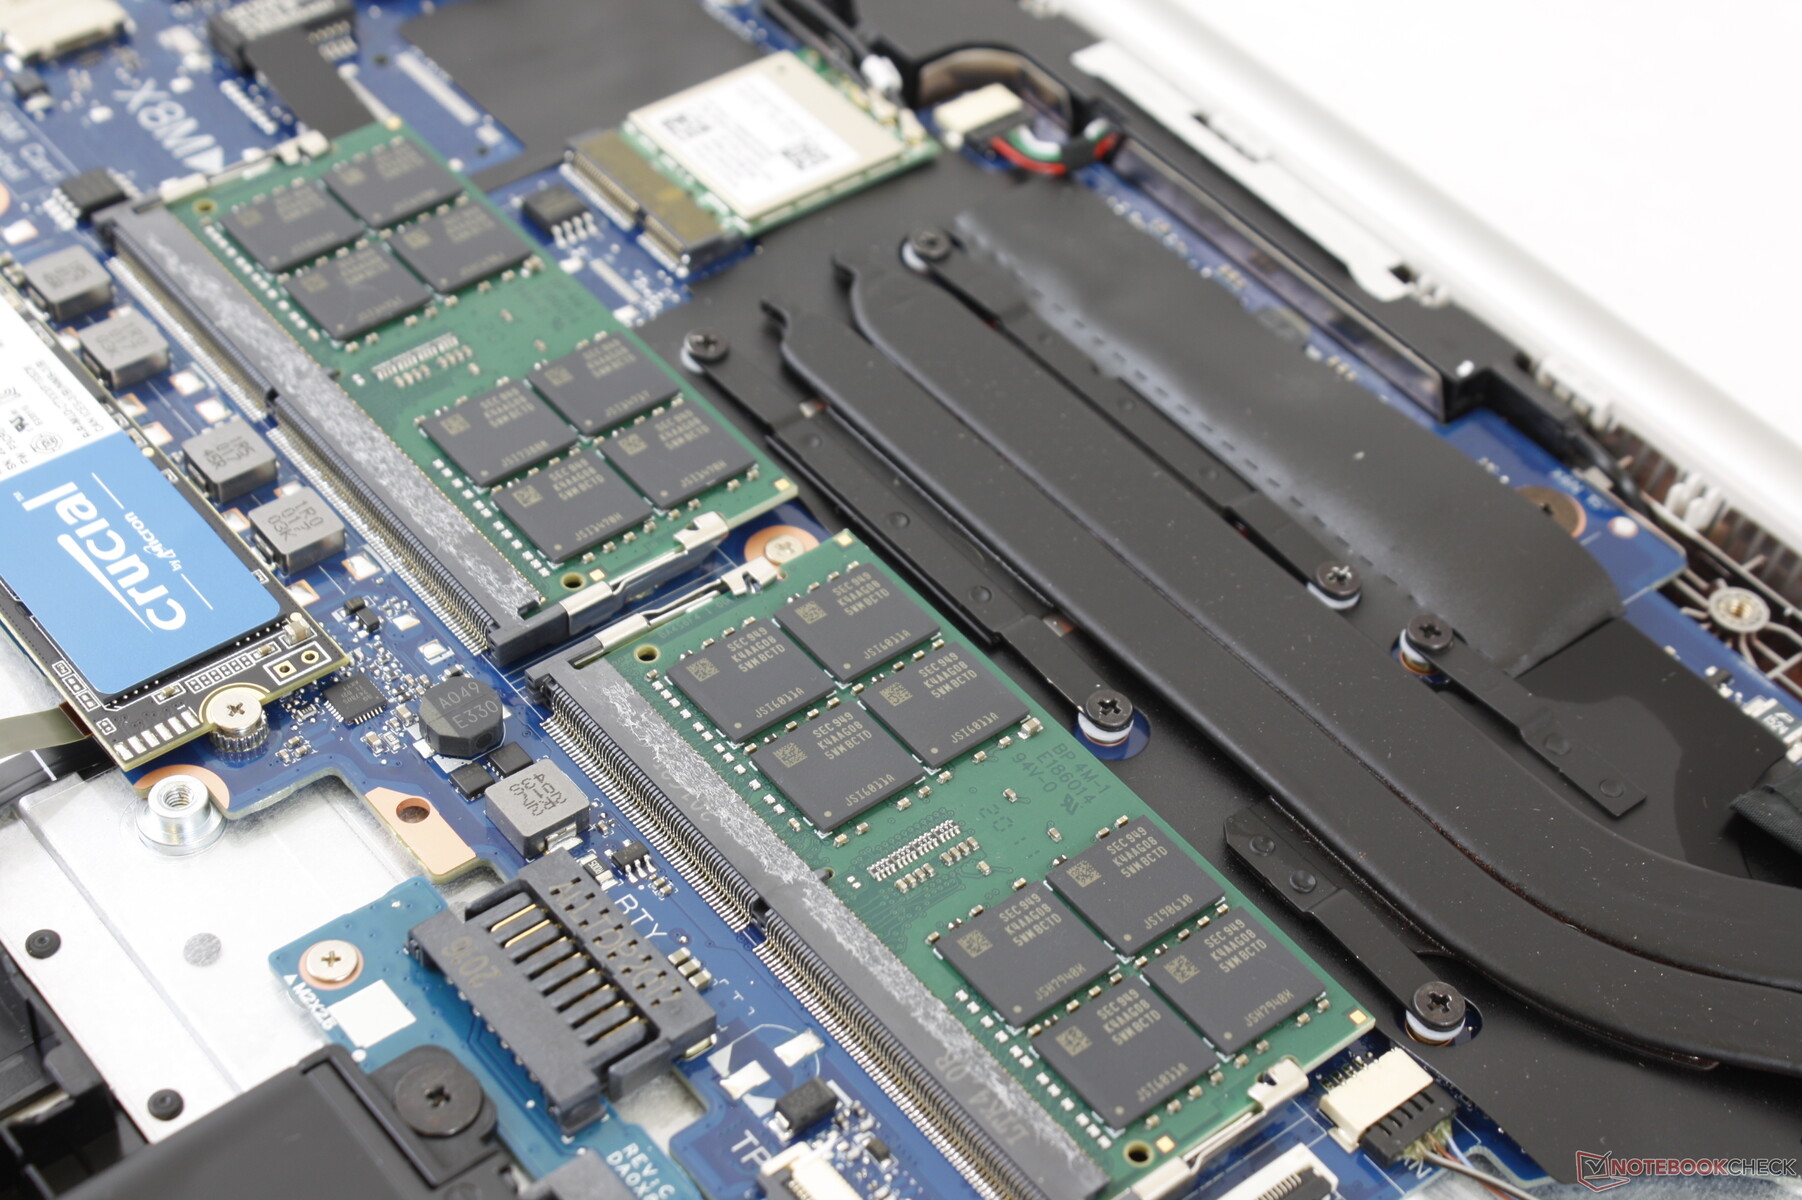
Wartung
Die Wartung erfordert einen Kreuzschraubenzieher und einen Gegenstand mit einer scharfen Kante. Da die Ecken und Kanten der Kunststoffbodenplatte sehr fest auf der Basiseinheit sitzen, erfordert das Entfernen etwas Geduld.
Garantie und Zubehör
Bis auf das Netzteil und den üblichen Papierkram befindet sich kein Zubehör im Lieferumfang. Es gilt die standardmäßige, eingeschränkte einjährige Garantie, die beim Kauf auf HP.com oder CUKUSA.com mit Optionen auf bis zu drei Jahre erweitert werden kann. Dabei deckt die Garantie von CUKUSA auch alle Komponenten ab, die vom Anbieter selbst verbaut wurden, wie beispielsweise den Arbeitsspeicher oder die Laufwerke.
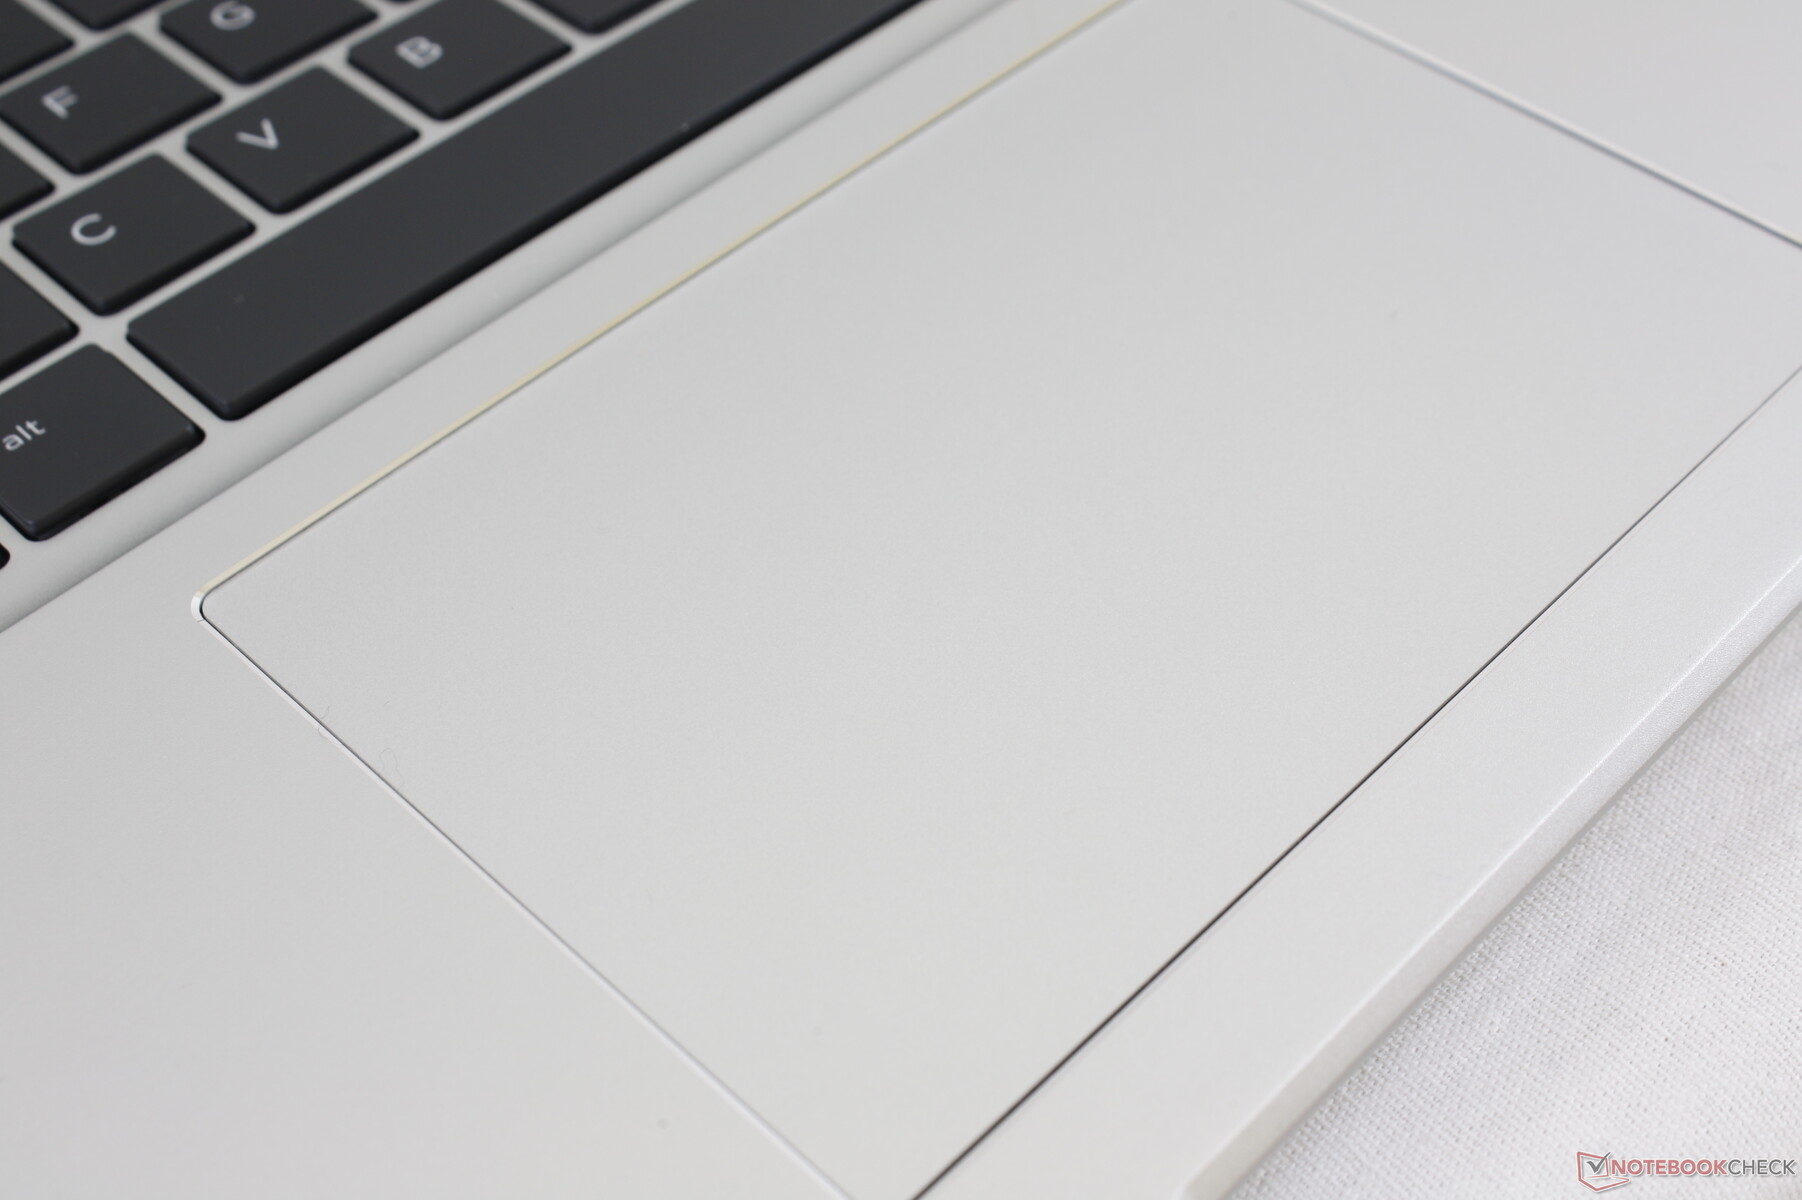
Eingabegeräte


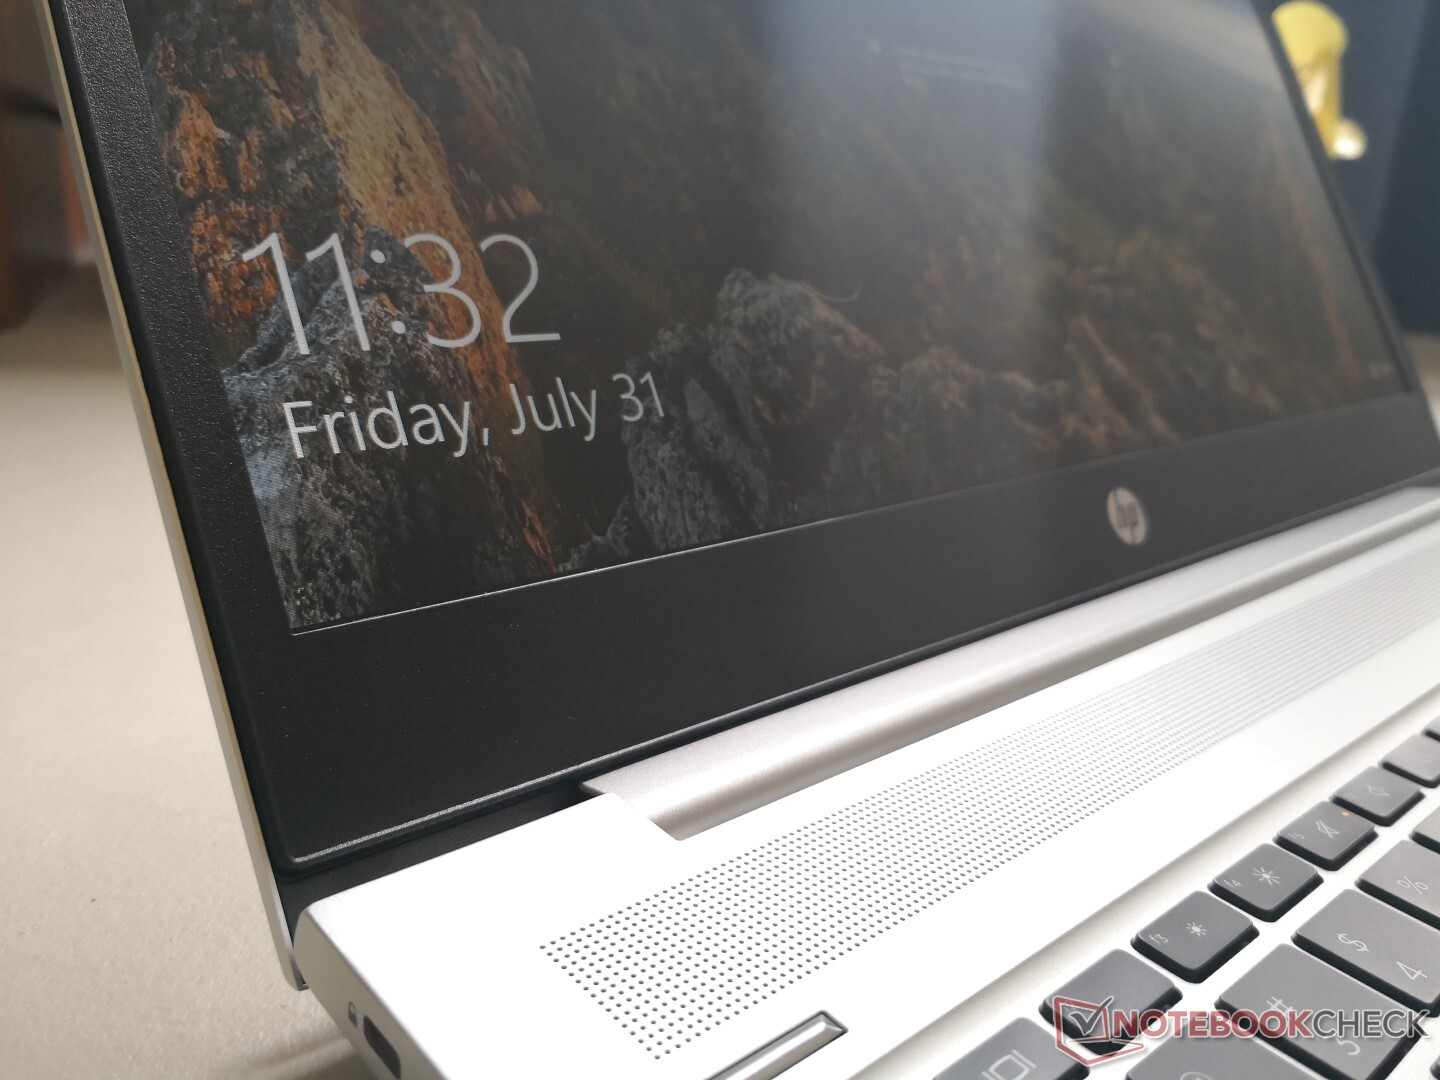
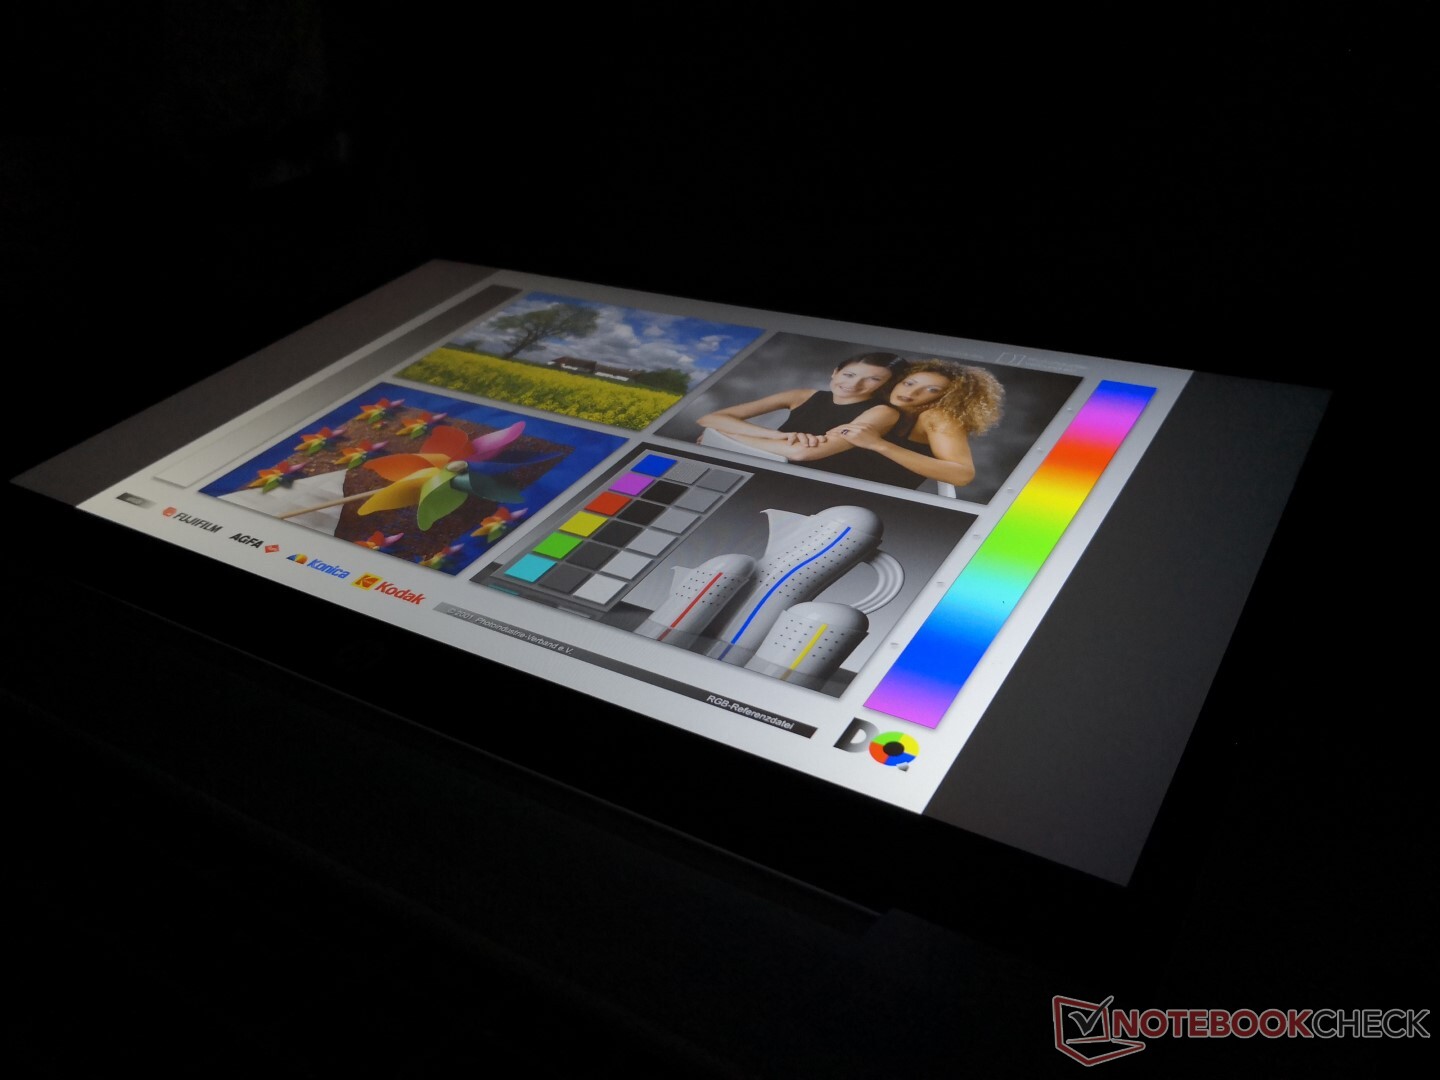
Display
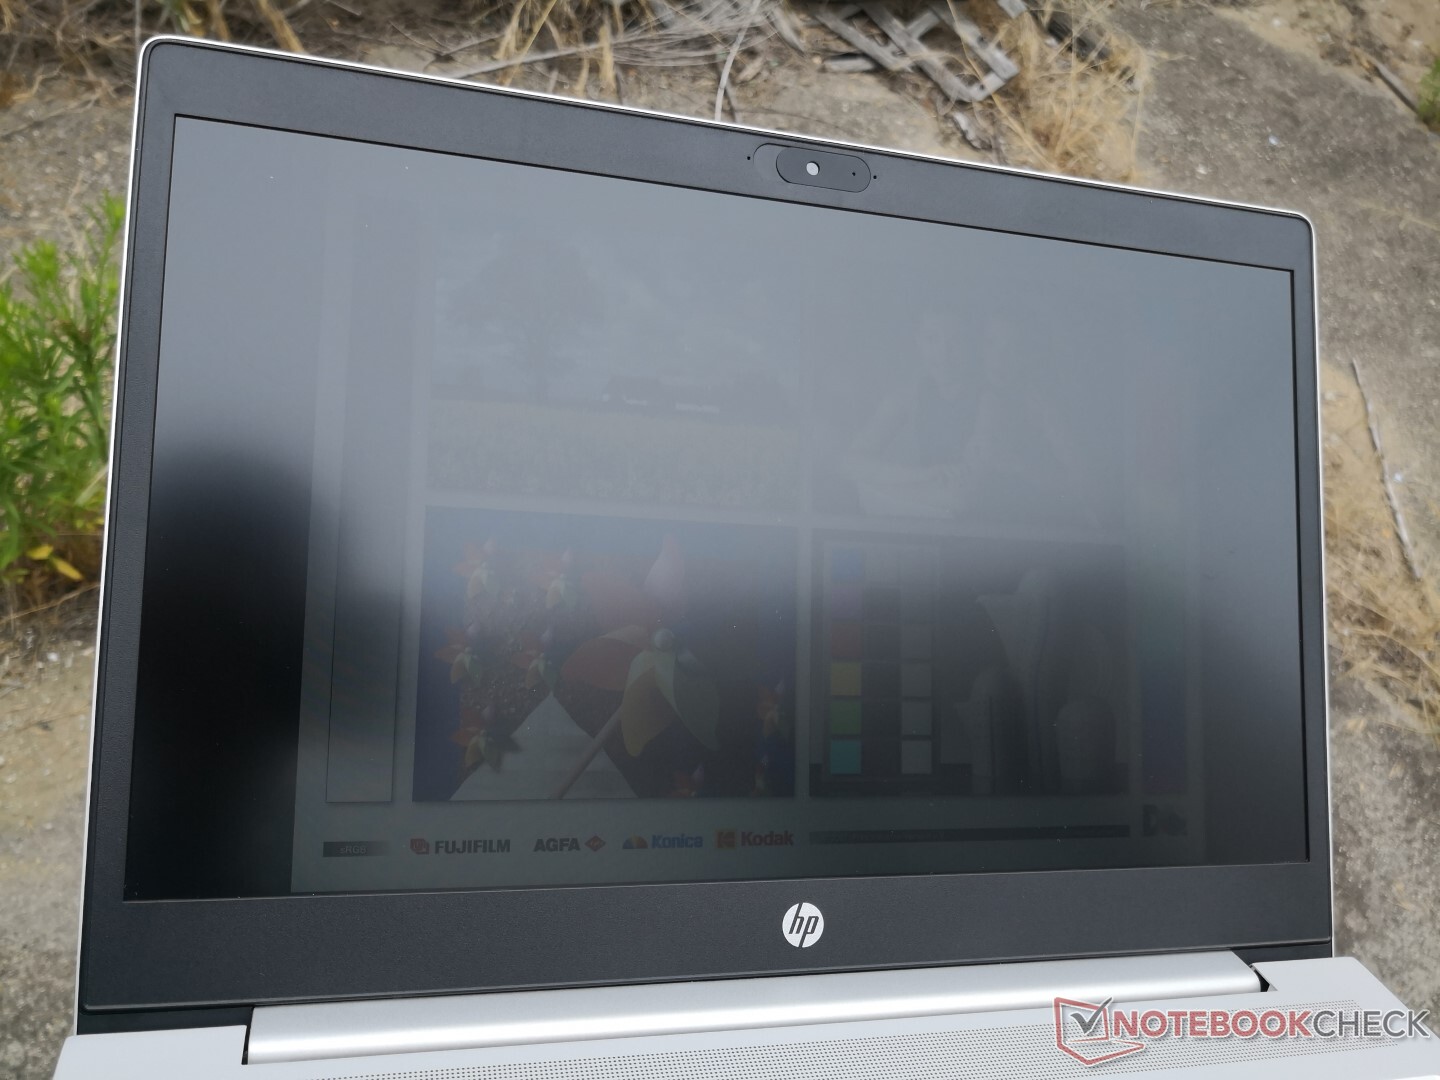
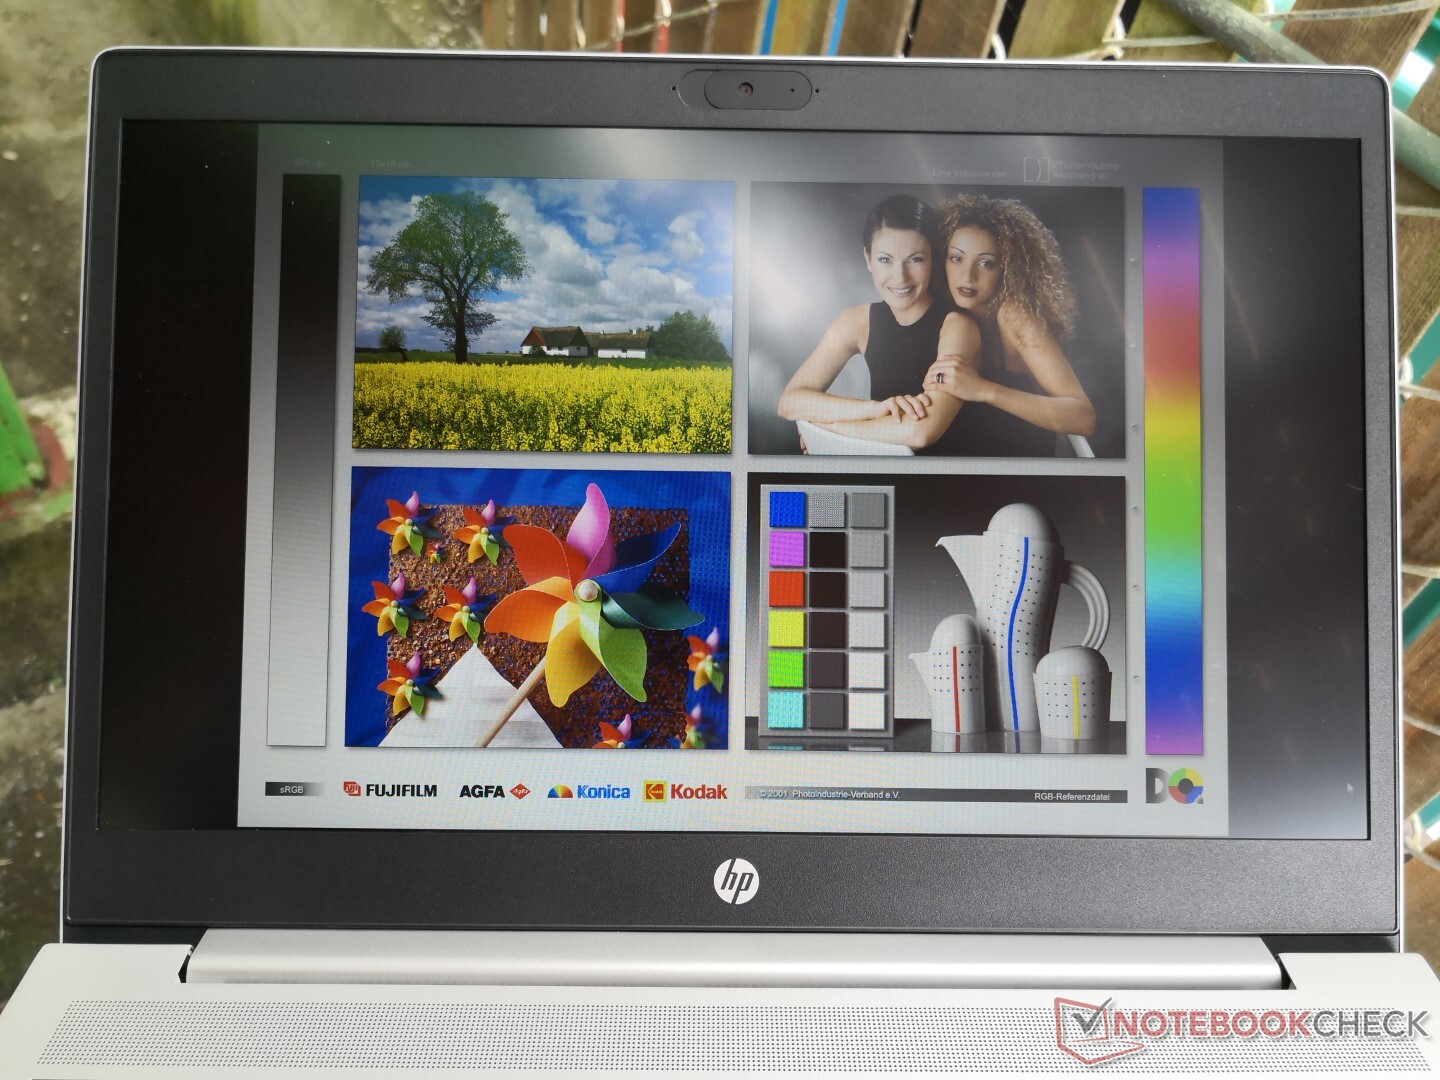
Im Gegensatz zum AU-Optronics-Panel unseres AMD-Modells ist unser Intel-ProBook mit einem LG-Philips-Panel bestückt. Der Kontrast des LG-Philips-Panels ist zwar deutlich niedriger, allerdings sind sich die zwei Panels in anderen Aspekten wie der Farbraumabdeckung, Helligkeit und den Reaktionszeiten sehr ähnlich. HP bietet darüber hinaus Displayoptionen an, die von einem schwächeren 768p-Panel bis hin zu einem 1000-cd/m²-1080p-Panel mit Sure-View-Privatsphärentechnologie, welche die Blickwinkel einschränkt, reichen.


| |||||||||||||||||||||||||
Ausleuchtung: 91 %
Helligkeit Akku: 224.3 cd/m²
Kontrast: 619:1 (Schwarzwert: 0.42 cd/m²)
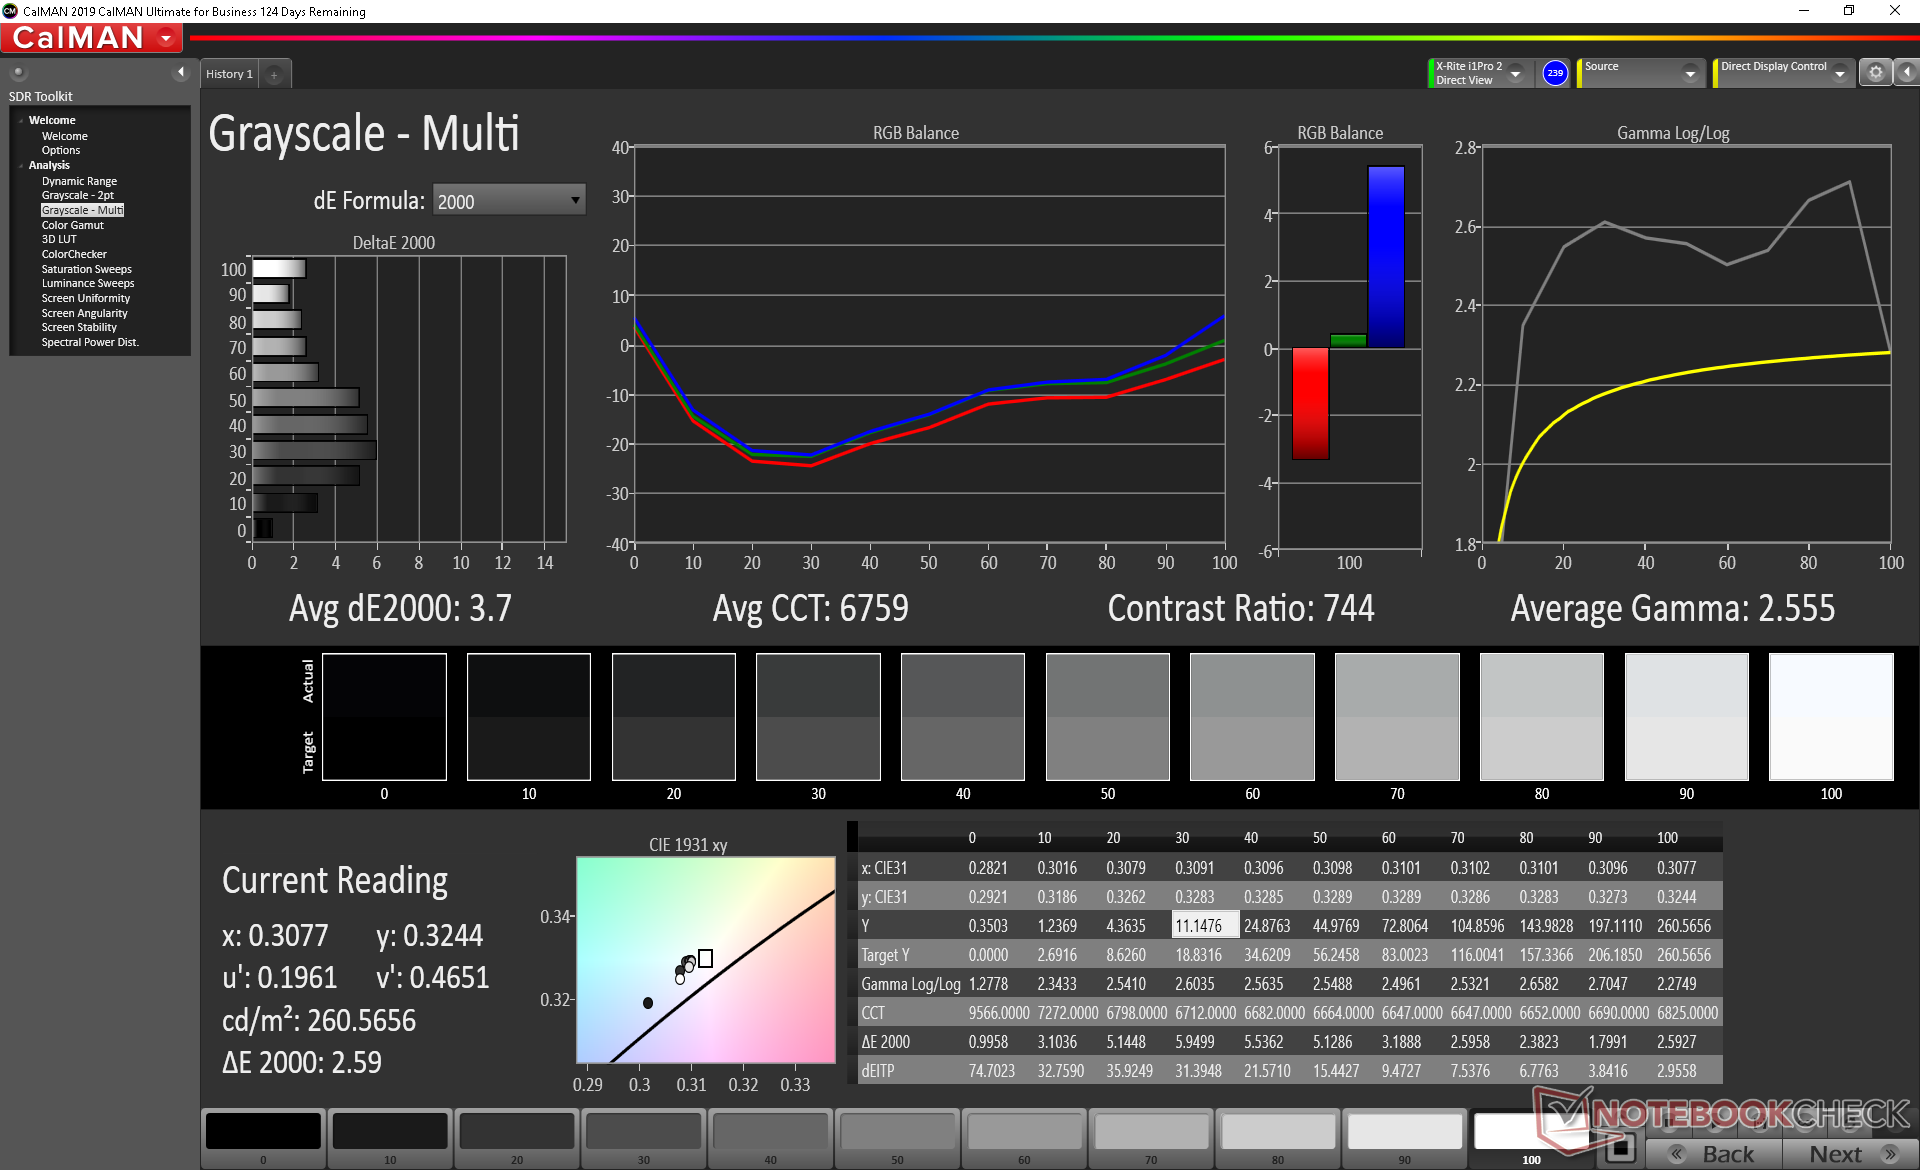
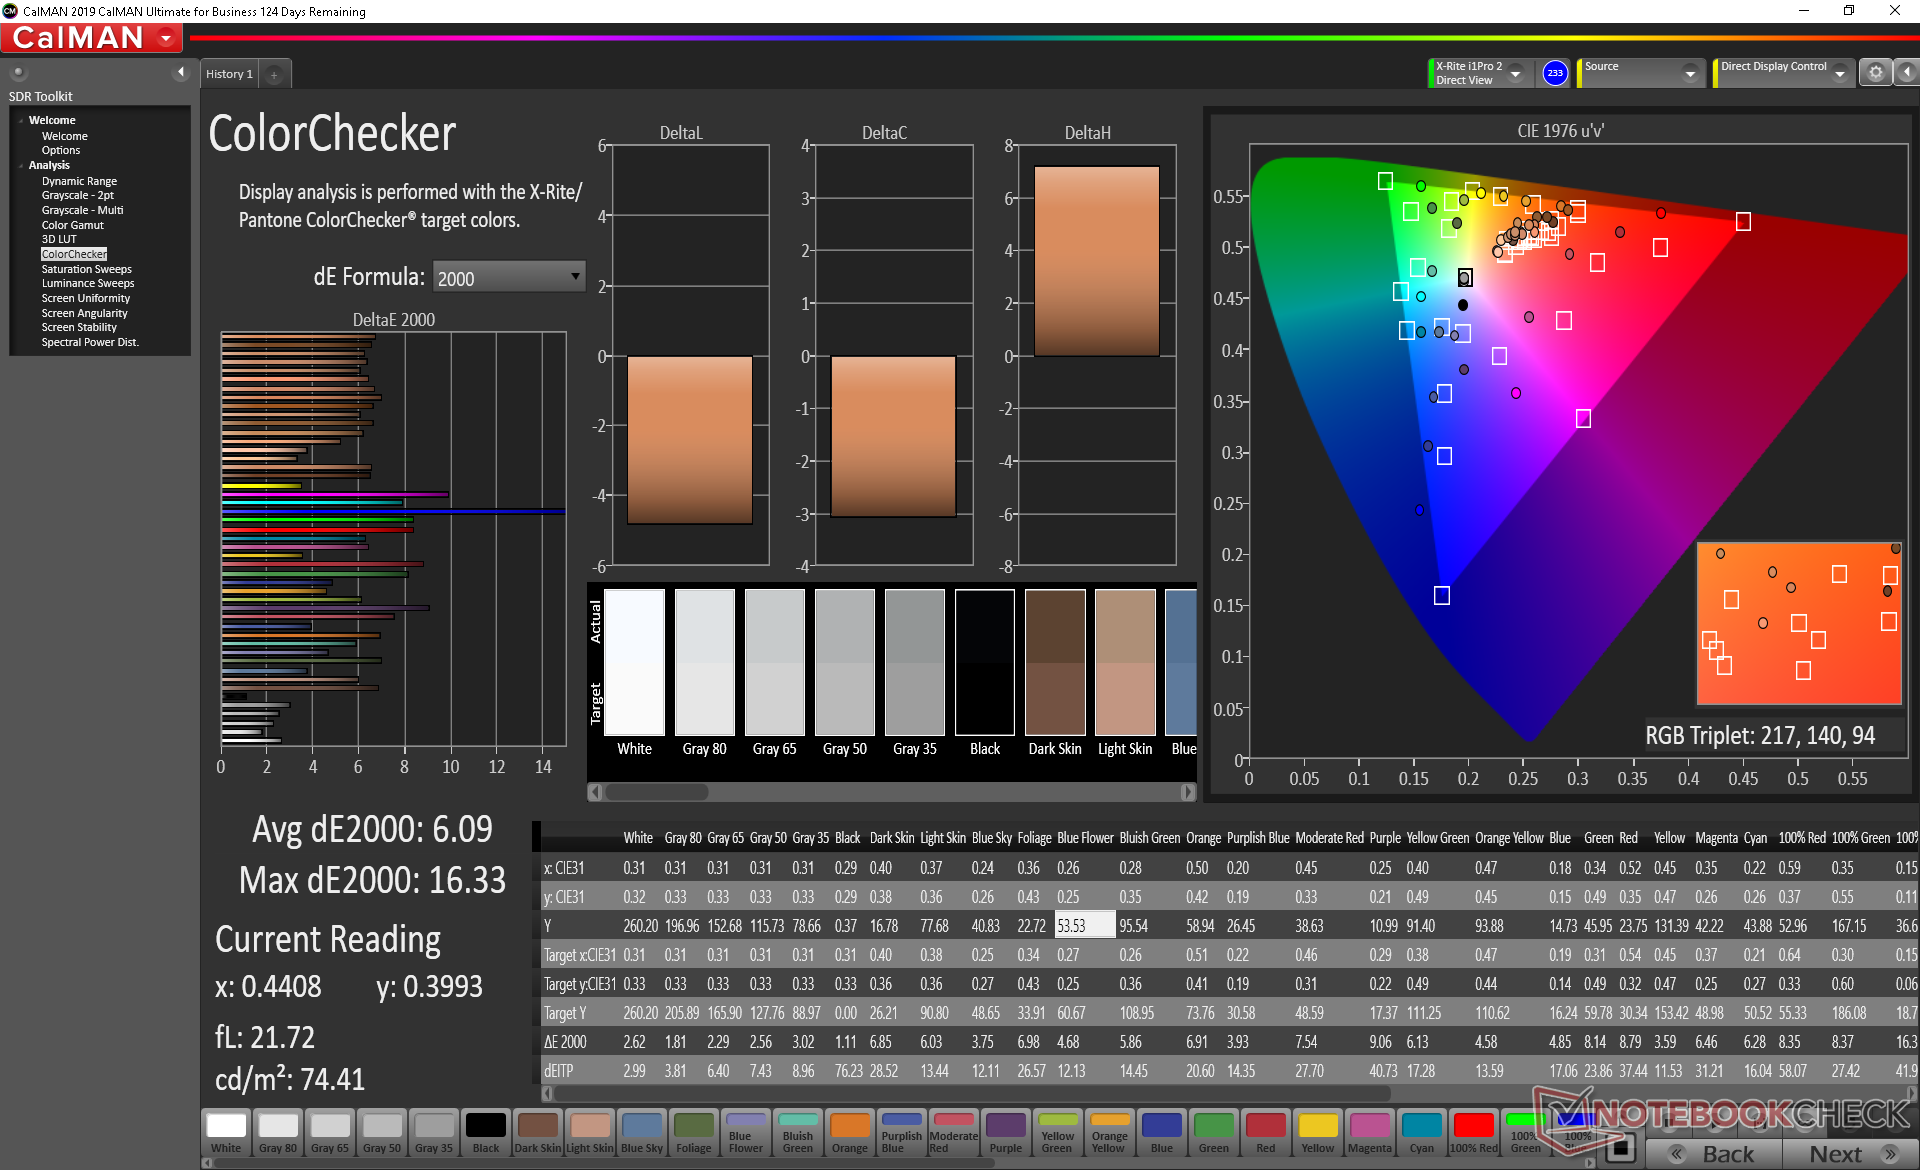
ΔE ColorChecker Calman: 6.09 | ∀{0.5-29.43 Ø4.73}
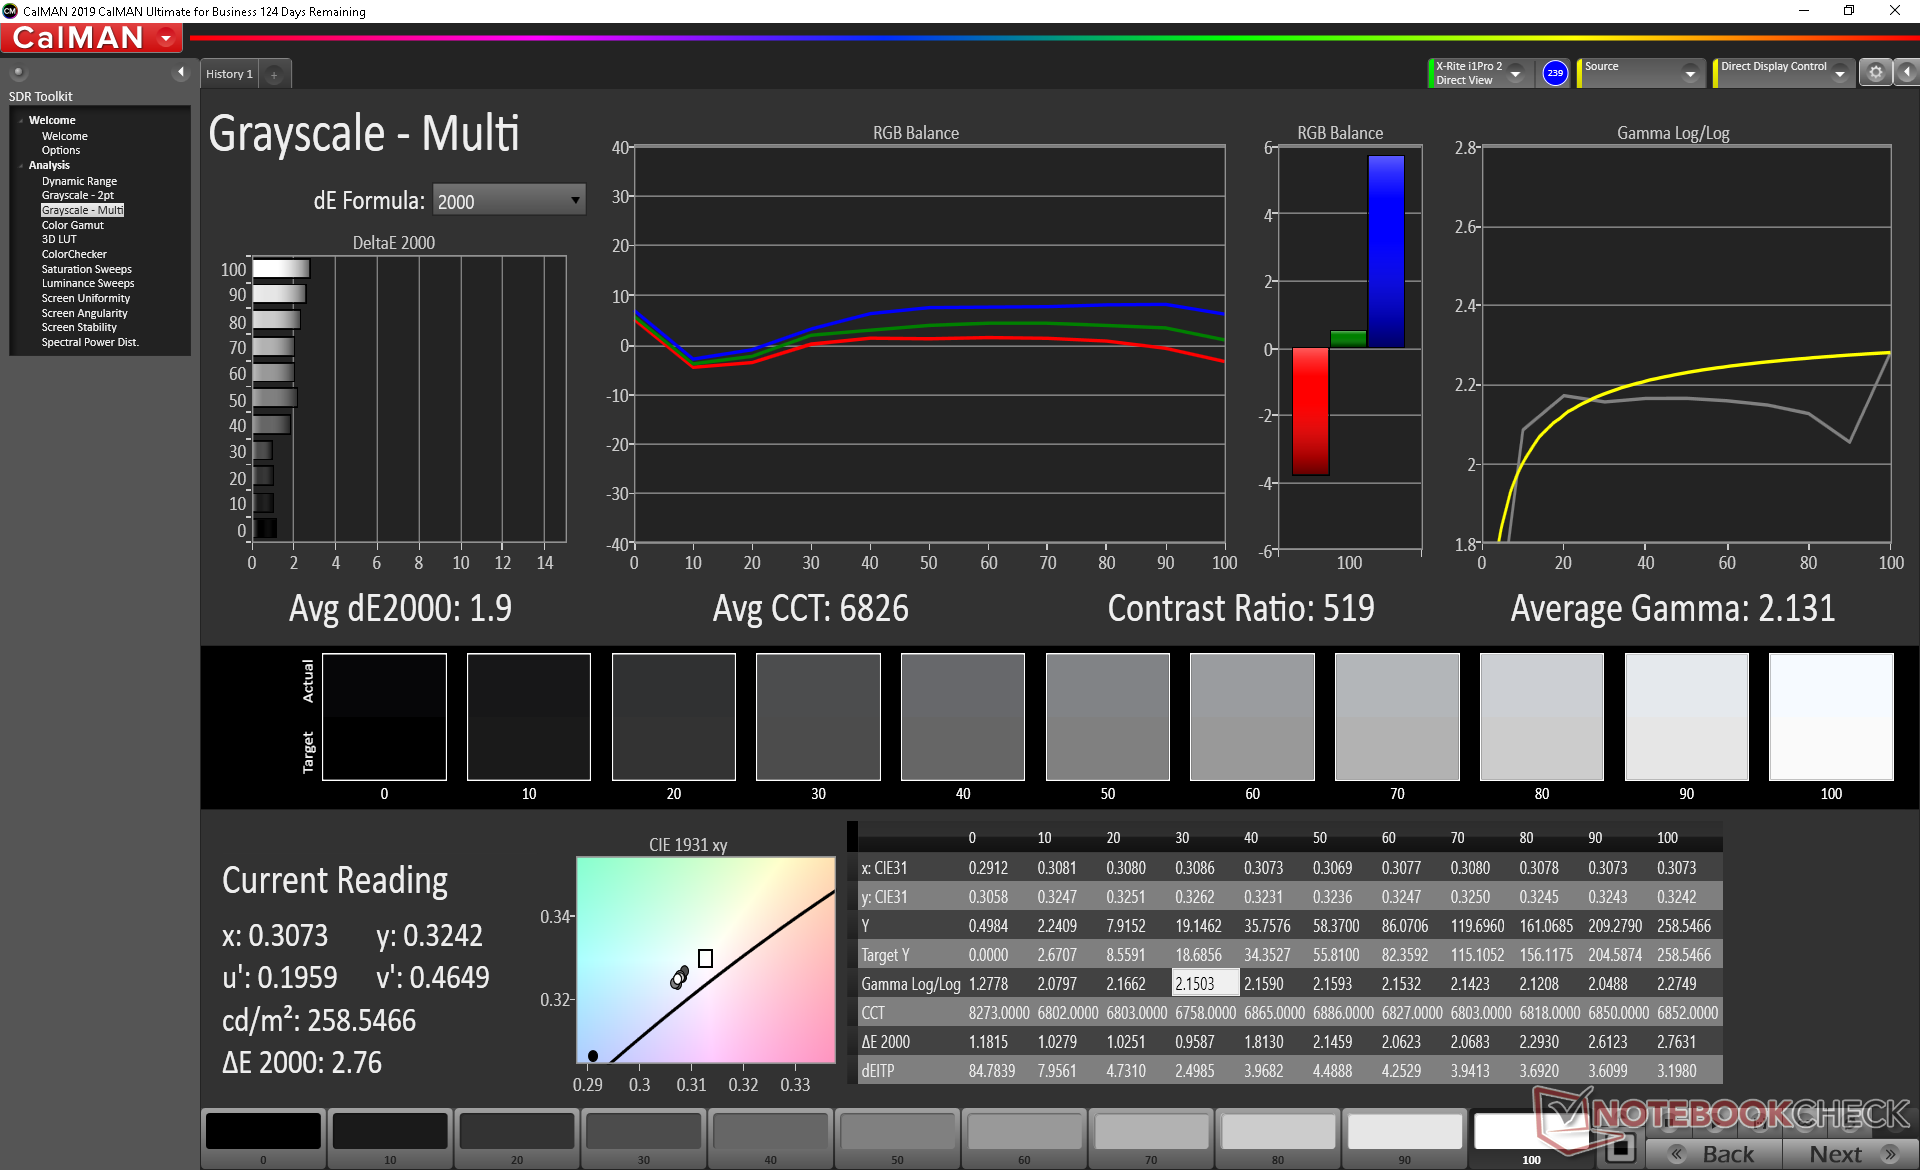
calibrated: 5.2
ΔE Greyscale Calman: 3.7 | ∀{0.09-98 Ø4.97}
56.2% sRGB (Argyll 1.6.3 3D)
35.7% AdobeRGB 1998 (Argyll 1.6.3 3D)
39.08% AdobeRGB 1998 (Argyll 3D)
56.5% sRGB (Argyll 3D)
37.9% Display P3 (Argyll 3D)
Gamma: 2.56
CCT: 6759 K
| HP ProBook 450 G7 8WC04UT LG Philips LGD062E, IPS, 15.6", 1920x1080 | HP ProBook 455 G7-175W8EA AUO, B156HW02, IPS, 15.6", 1920x1080 | MSI Modern 15 A10RB Chi Mei N156HCE-EN1, IPS, 15.6", 1920x1080 | Dell Latitude 15 3590 BOE0802 / NT15N41 / Dell: M9P74, TN LED, 15.6", 1920x1080 | Lenovo ThinkPad L590-20Q70019GE N156HCE-EAA, IPS, 15.6", 1920x1080 | Dynabook Tecra X50-F Toshiba TOS508F, IPS, 15.6", 1920x1080 | |
|---|---|---|---|---|---|---|
| Display | 0% | 69% | 5% | 14% | -3% | |
| Display P3 Coverage (%) | 37.9 | 37.92 0% | 66 74% | 39.67 5% | 43.3 14% | 36.68 -3% |
| sRGB Coverage (%) | 56.5 | 57.1 1% | 92.1 63% | 59.7 6% | 64.4 14% | 55 -3% |
| AdobeRGB 1998 Coverage (%) | 39.08 | 39.18 0% | 66.5 70% | 40.99 5% | 44.81 15% | 37.92 -3% |
| Response Times | -1% | -18% | 23% | -12% | 4% | |
| Response Time Grey 50% / Grey 80% * (ms) | 35.2 ? | 41 ? -16% | 43.2 ? -23% | 41 ? -16% | 42.8 ? -22% | 38 ? -8% |
| Response Time Black / White * (ms) | 30.4 ? | 26 ? 14% | 34.4 ? -13% | 12 ? 61% | 30.8 ? -1% | 25.6 ? 16% |
| PWM Frequency (Hz) | 26040 ? | 250 ? | 24510 ? | |||
| Bildschirm | 20% | 41% | -28% | 11% | 3% | |
| Helligkeit Bildmitte (cd/m²) | 259.8 | 282 9% | 289.4 11% | 215 -17% | 247 -5% | 295.9 14% |
| Brightness (cd/m²) | 251 | 264 5% | 273 9% | 214 -15% | 228 -9% | 270 8% |
| Brightness Distribution (%) | 91 | 88 -3% | 82 -10% | 91 0% | 81 -11% | 86 -5% |
| Schwarzwert * (cd/m²) | 0.42 | 0.19 55% | 0.27 36% | 0.385 8% | 0.18 57% | 0.3 29% |
| Kontrast (:1) | 619 | 1484 140% | 1072 73% | 558 -10% | 1372 122% | 986 59% |
| Delta E Colorchecker * | 6.09 | 5.56 9% | 2.32 62% | 10.31 -69% | 5.9 3% | 6.55 -8% |
| Colorchecker dE 2000 max. * | 16.33 | 19.07 -17% | 5.76 65% | 20.44 -25% | 22.9 -40% | 21.52 -32% |
| Colorchecker dE 2000 calibrated * | 5.2 | 4.5 13% | 2.49 52% | 3.88 25% | 4.7 10% | 5.73 -10% |
| Delta E Graustufen * | 3.7 | 3.57 4% | 3 19% | 11.84 -220% | 5.1 -38% | 4.3 -16% |
| Gamma | 2.56 86% | 2.61 84% | 2.22 99% | 2.67 82% | 2.21 100% | 2.475 89% |
| CCT | 6759 96% | 6895 94% | 6867 95% | 13398 49% | 6398 102% | 7002 93% |
| Farbraum (Prozent von AdobeRGB 1998) (%) | 35.7 | 36 1% | 59.8 68% | 39 9% | 41.2 15% | 35 -2% |
| Color Space (Percent of sRGB) (%) | 56.2 | 57 1% | 92 64% | 61 9% | 64.1 14% | 54 -4% |
| Durchschnitt gesamt (Programm / Settings) | 6% /
14% | 31% /
39% | 0% /
-15% | 4% /
9% | 1% /
2% |
* ... kleinere Werte sind besser
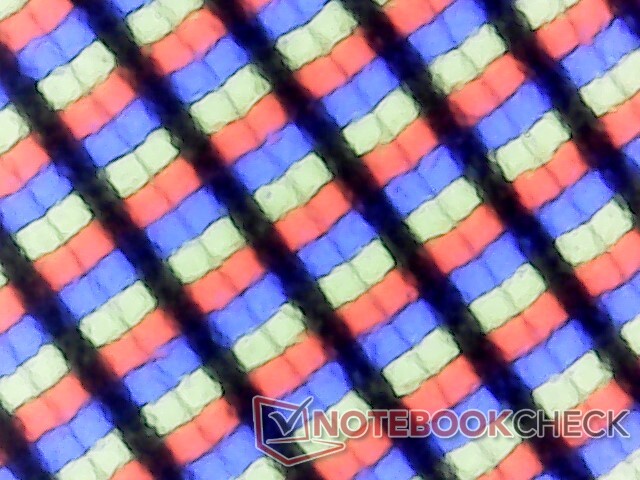
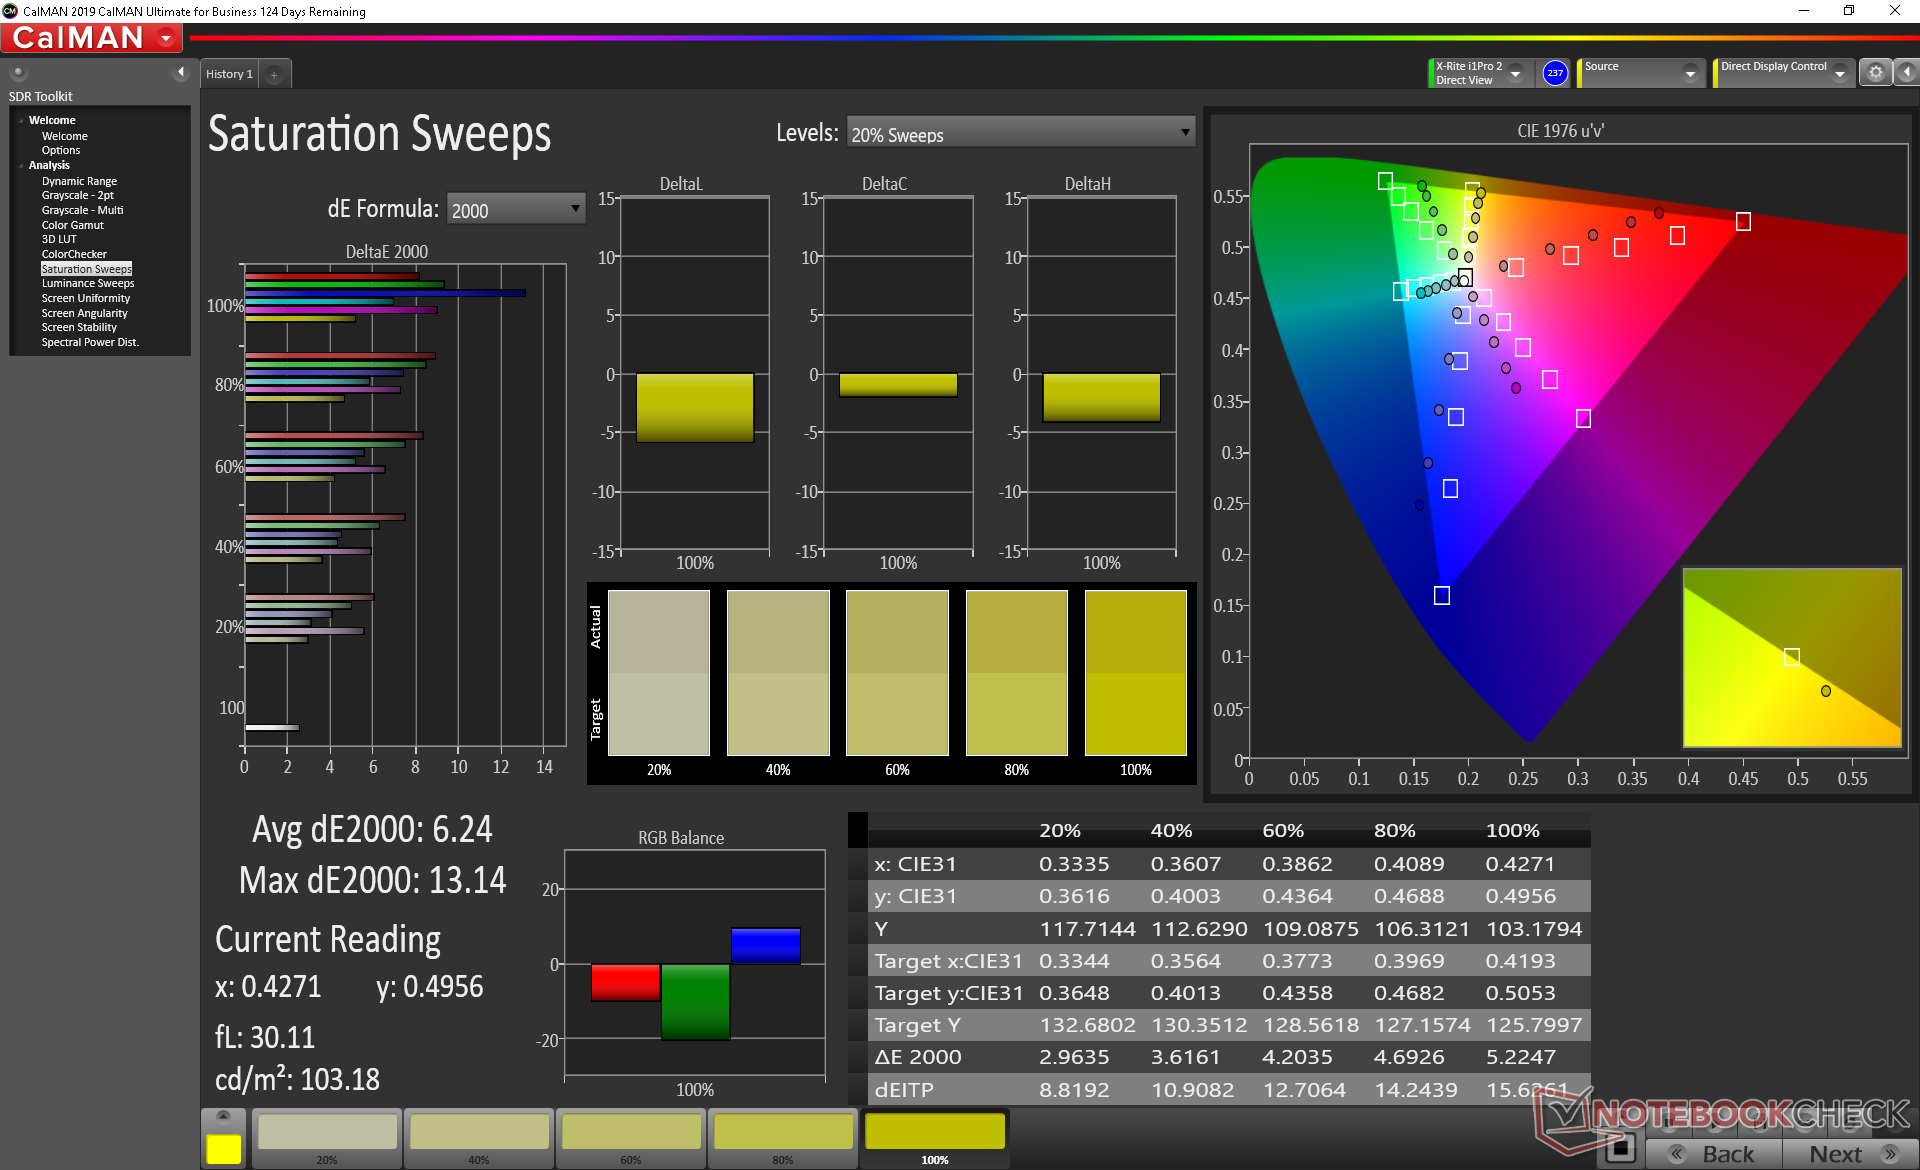
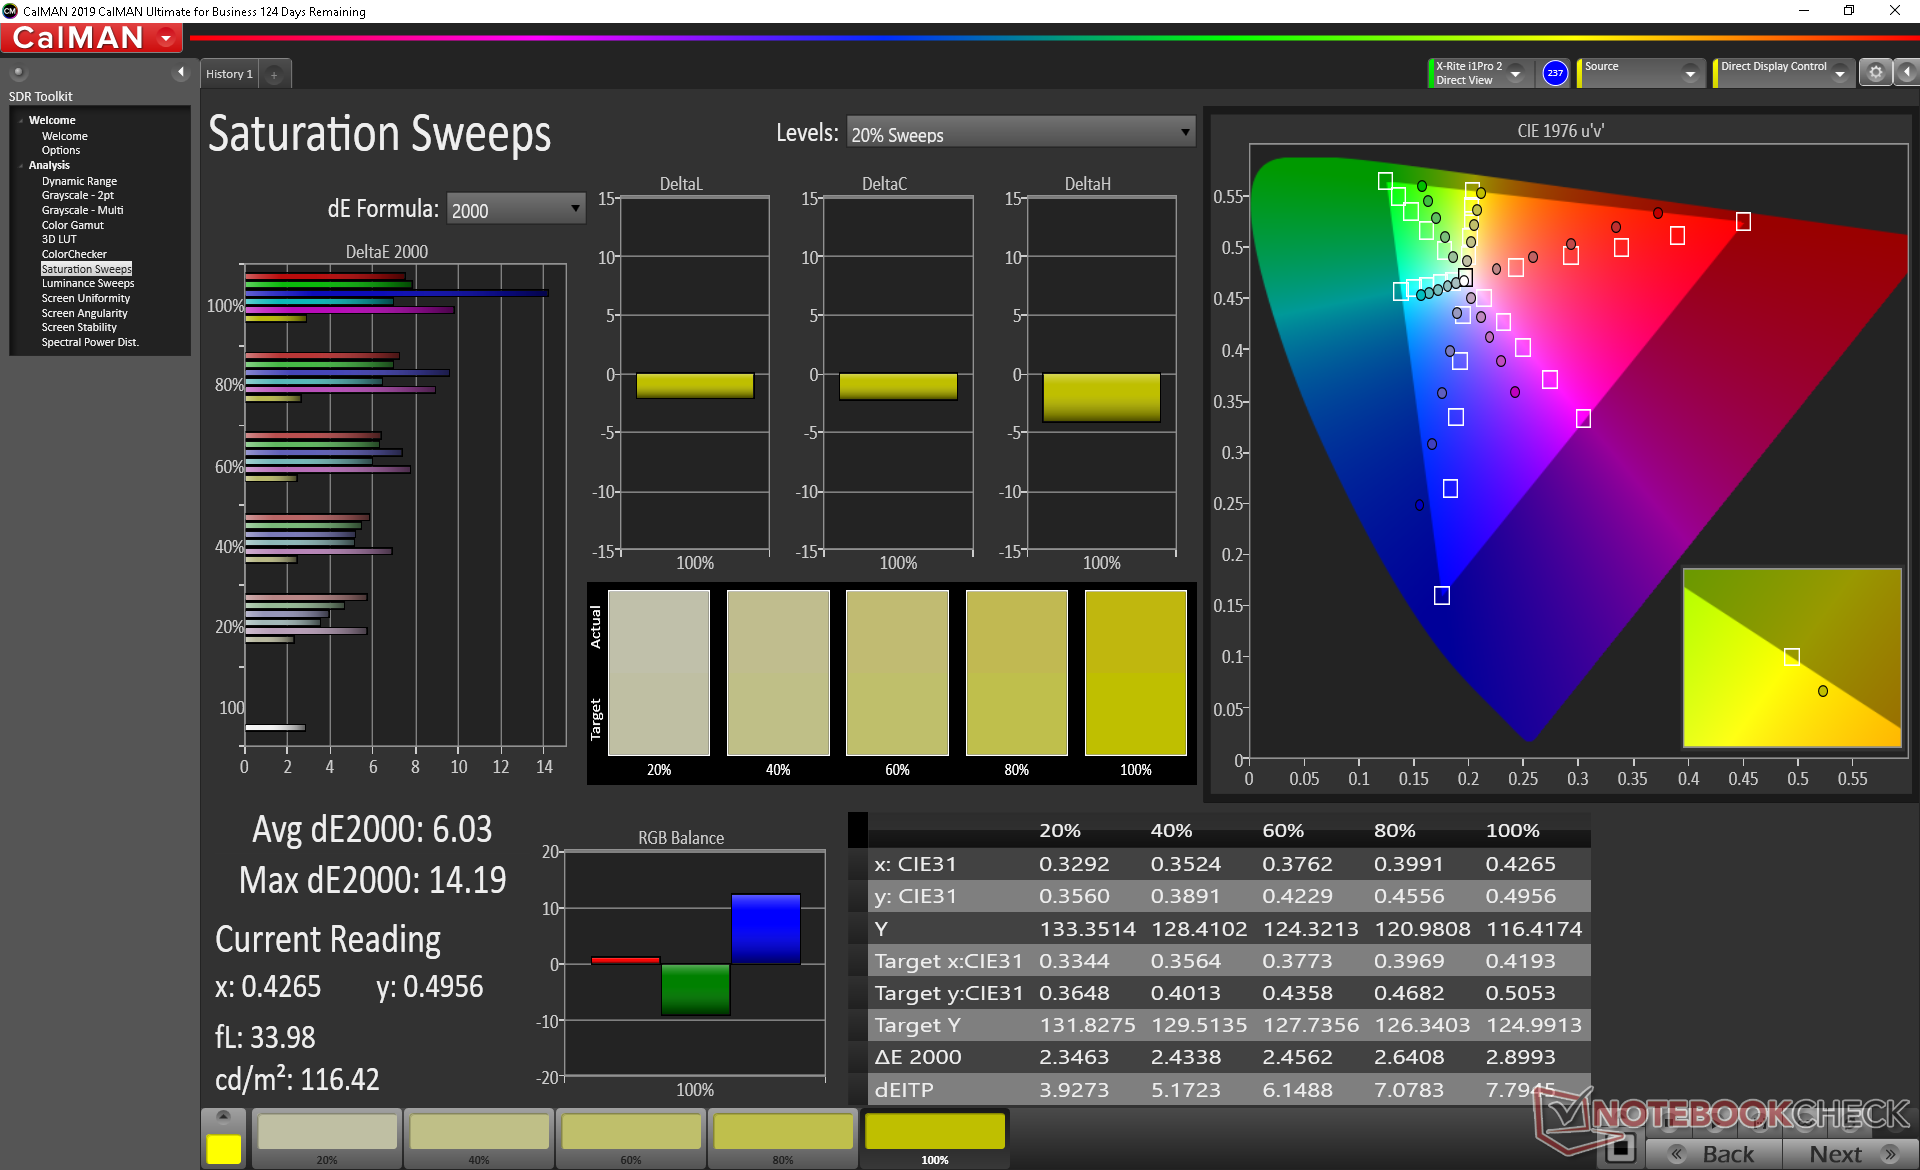
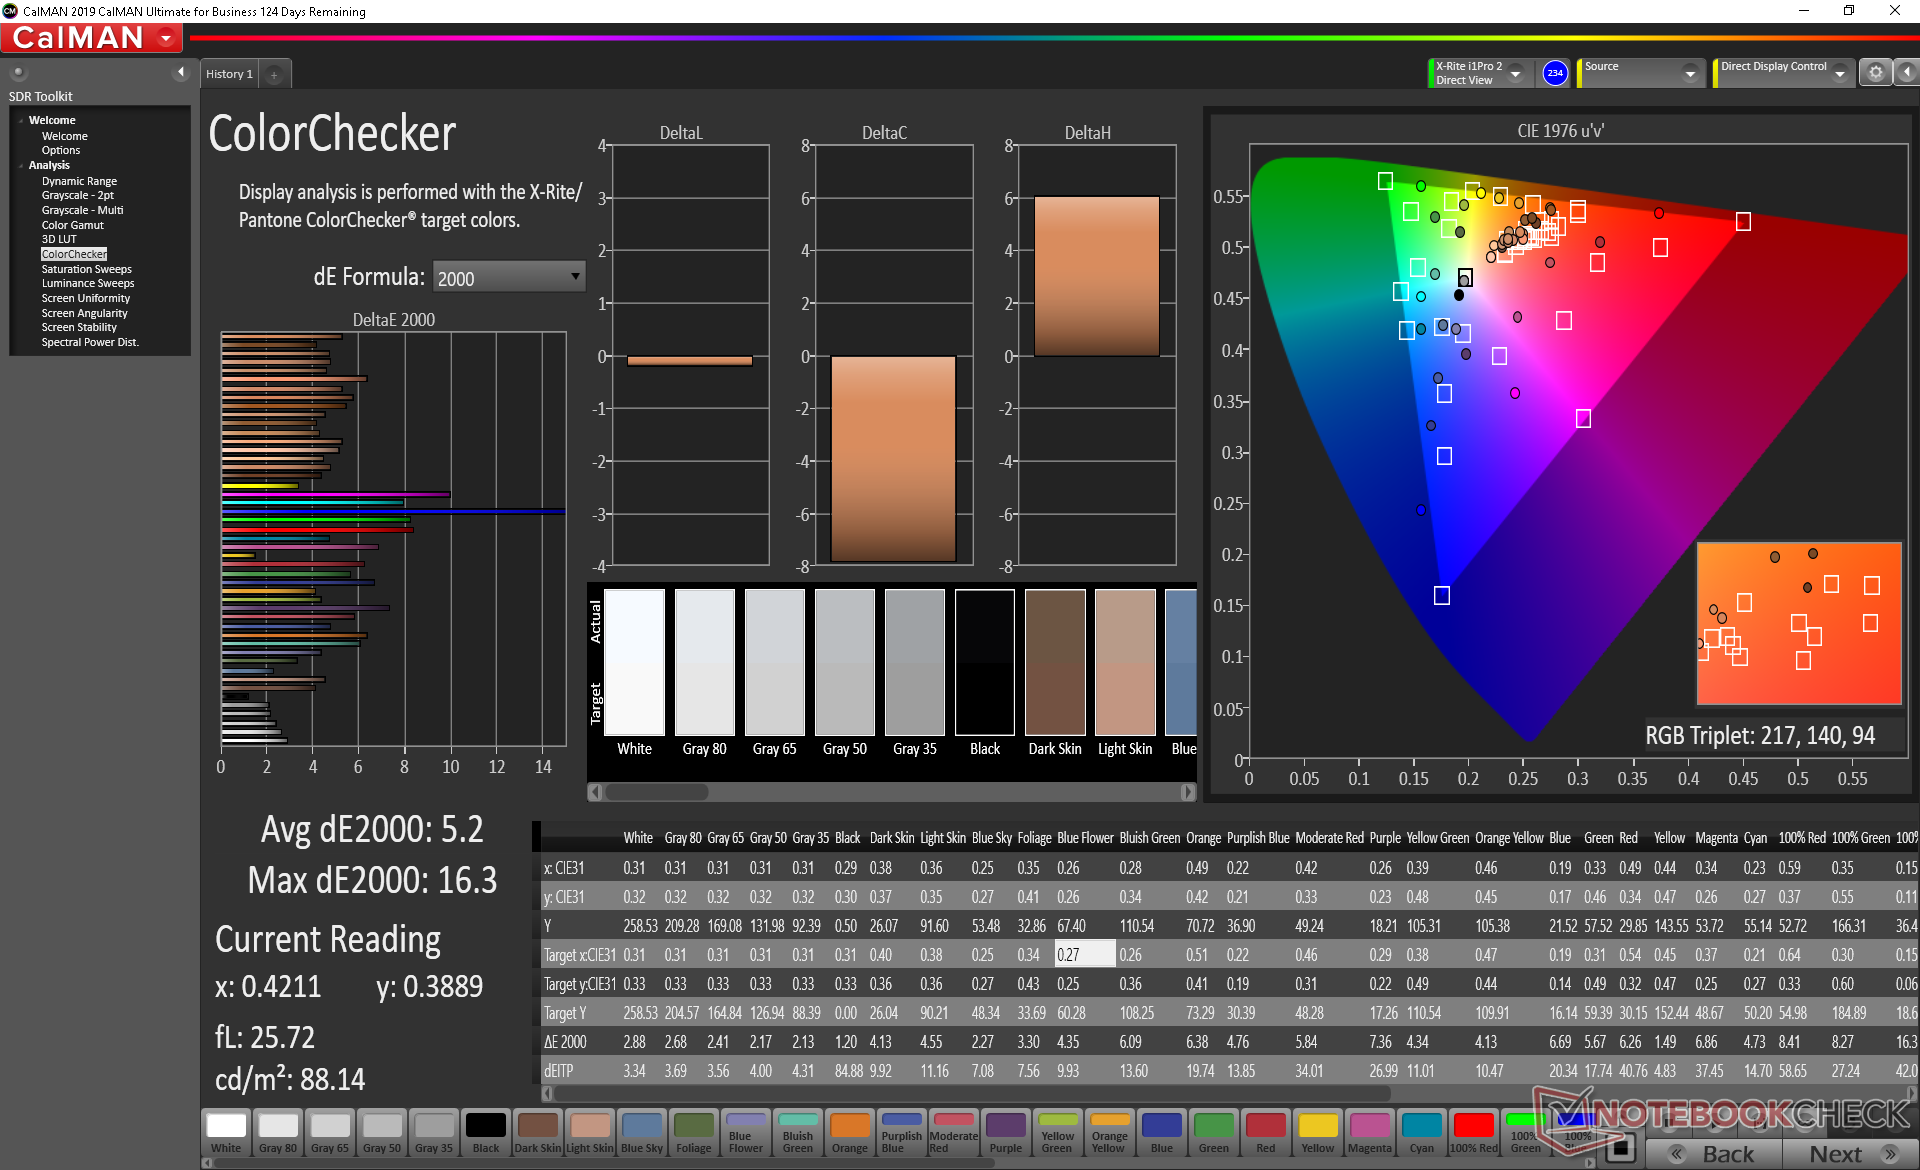
Mit nur 36 % des AdobeRGB- und 56 % des sRGB-Farbraums ist die Farbraumabdeckung gering, was für ein günstiges Panel typisch ist. Die meisten Mittelklasse-Ultrabooks bieten dagegen eine sRGB-Farbraumabdeckung von 90 % oder mehr, was in deutlich satteren und lebhafteren Farben resultiert. Solange man jedoch keine Aufgaben bearbeitet, die eine hohe Farbgenauigkeit erfordern, sollten sich daraus jedoch keine Nachteile ergeben.
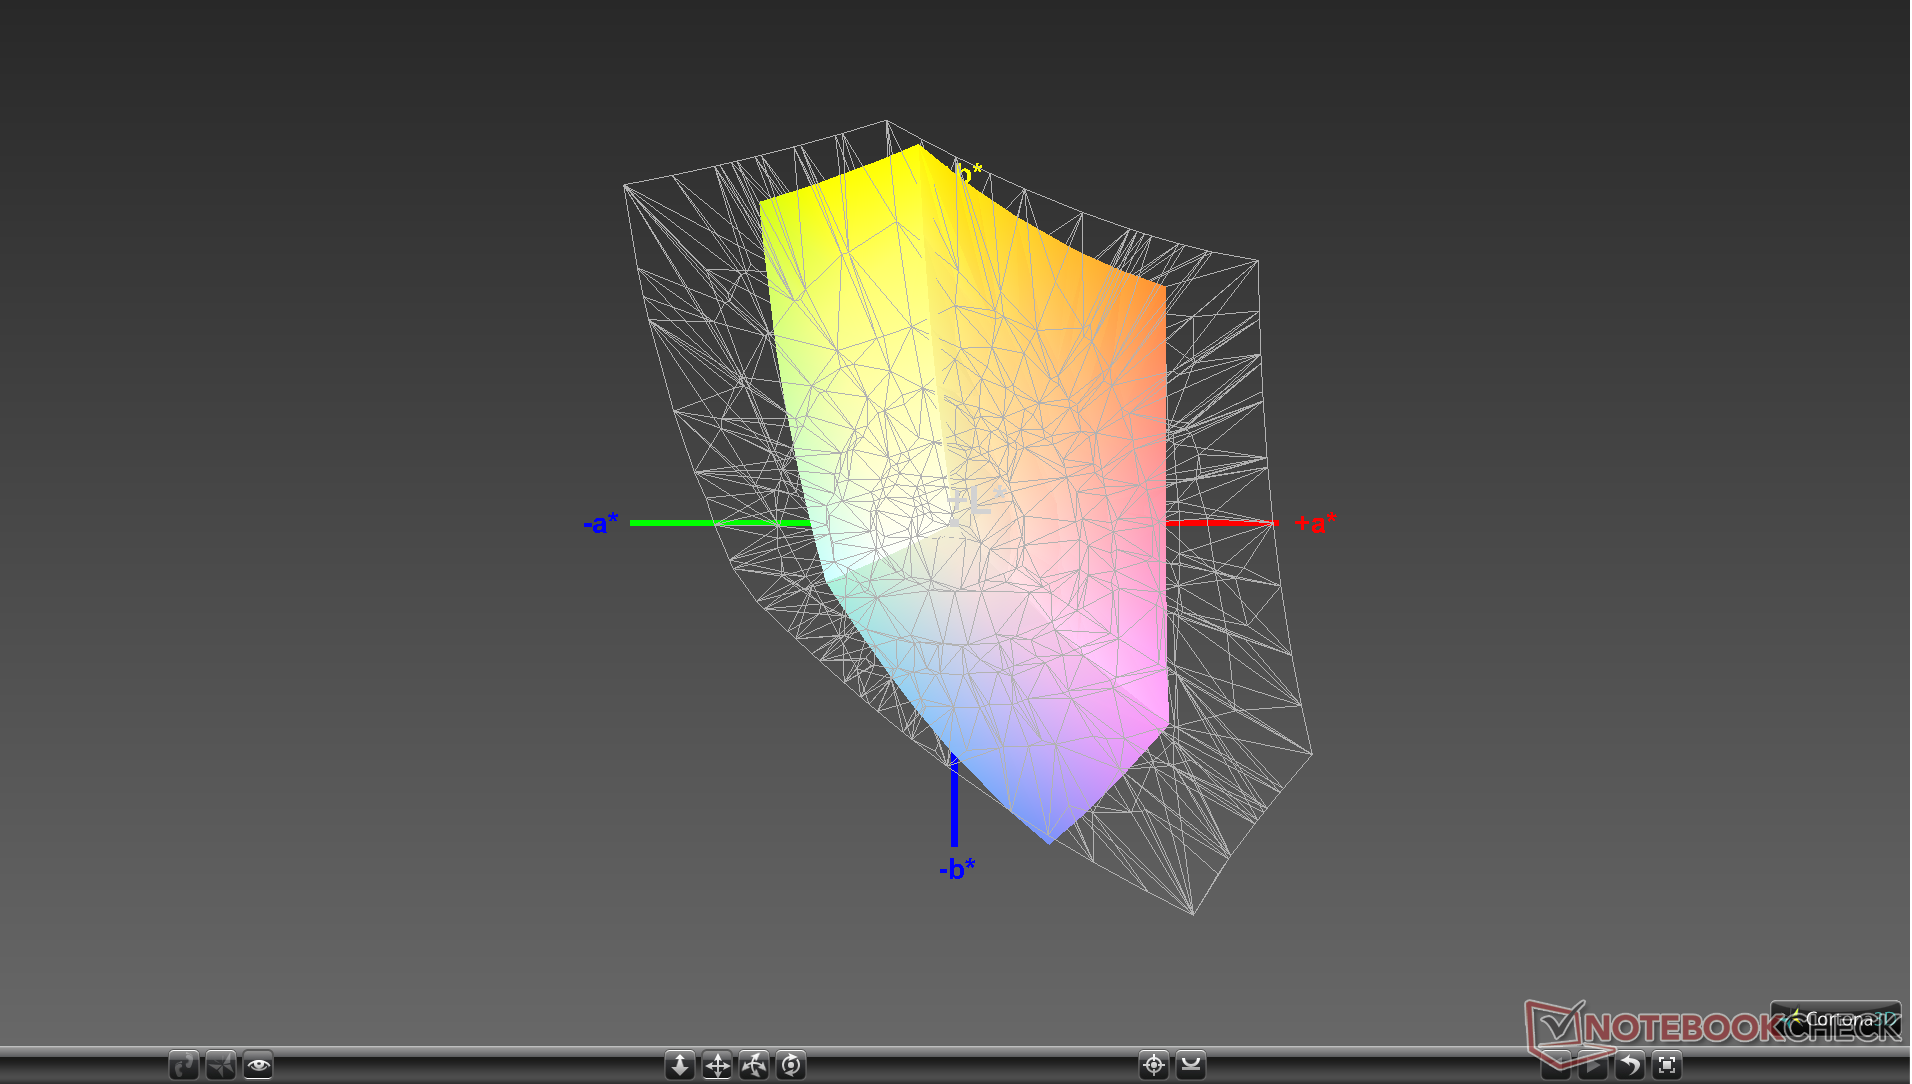

Wie unsere Messungen mit einem X-Rite-Farbmessgerät zeigen, ist das sRGB-Gleichgewicht ab Werk schlecht, allerdings konnten wir dies durch eine Kalibrierung beheben. Aufgrund des oben erwähnten eingeschränkten Farbraums werden die Farben auf höheren Sättigungsstufen aber dennoch ungenauer. Dabei werden Blautöne besonders ungenau dargestellt.
Reaktionszeiten (Response Times) des Displays
| ↔ Reaktionszeiten Schwarz zu Weiß | ||
|---|---|---|
| 30.4 ms ... steigend ↗ und fallend ↘ kombiniert | ↗ 19.6 ms steigend | 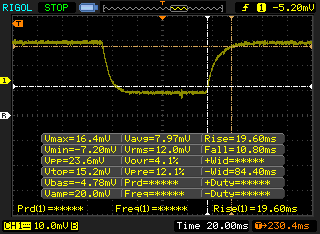 |
| ↘ 10.8 ms fallend | ||
| Die gemessenen Reaktionszeiten sind langsam und dadurch für viele Spieler wahrscheinlich zu langsam. Im Vergleich rangierten die bei uns getesteten Geräte von 0.1 (Minimum) zu 240 (Maximum) ms. » 82 % aller Screens waren schneller als der getestete. Daher sind die gemessenen Reaktionszeiten schlechter als der Durchschnitt aller vermessenen Geräte (19.9 ms). | ||
| ↔ Reaktionszeiten 50% Grau zu 80% Grau | ||
| 35.2 ms ... steigend ↗ und fallend ↘ kombiniert | ↗ 19.6 ms steigend | 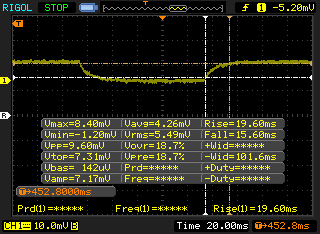 |
| ↘ 15.6 ms fallend | ||
| Die gemessenen Reaktionszeiten sind langsam und dadurch für viele Spieler wahrscheinlich zu langsam. Im Vergleich rangierten die bei uns getesteten Geräte von 0.165 (Minimum) zu 636 (Maximum) ms. » 49 % aller Screens waren schneller als der getestete. Daher sind die gemessenen Reaktionszeiten schlechter als der Durchschnitt aller vermessenen Geräte (31.1 ms). | ||
Bildschirm-Flackern / PWM (Pulse-Width Modulation)
| Flackern / PWM nicht festgestellt |  | ||
Im Vergleich: 52 % aller getesteten Geräte nutzten kein PWM um die Helligkeit zu reduzieren. Wenn PWM eingesetzt wurde, dann bei einer Frequenz von durchschnittlich 7798 (Minimum 5, Maximum 343500) Hz. | |||
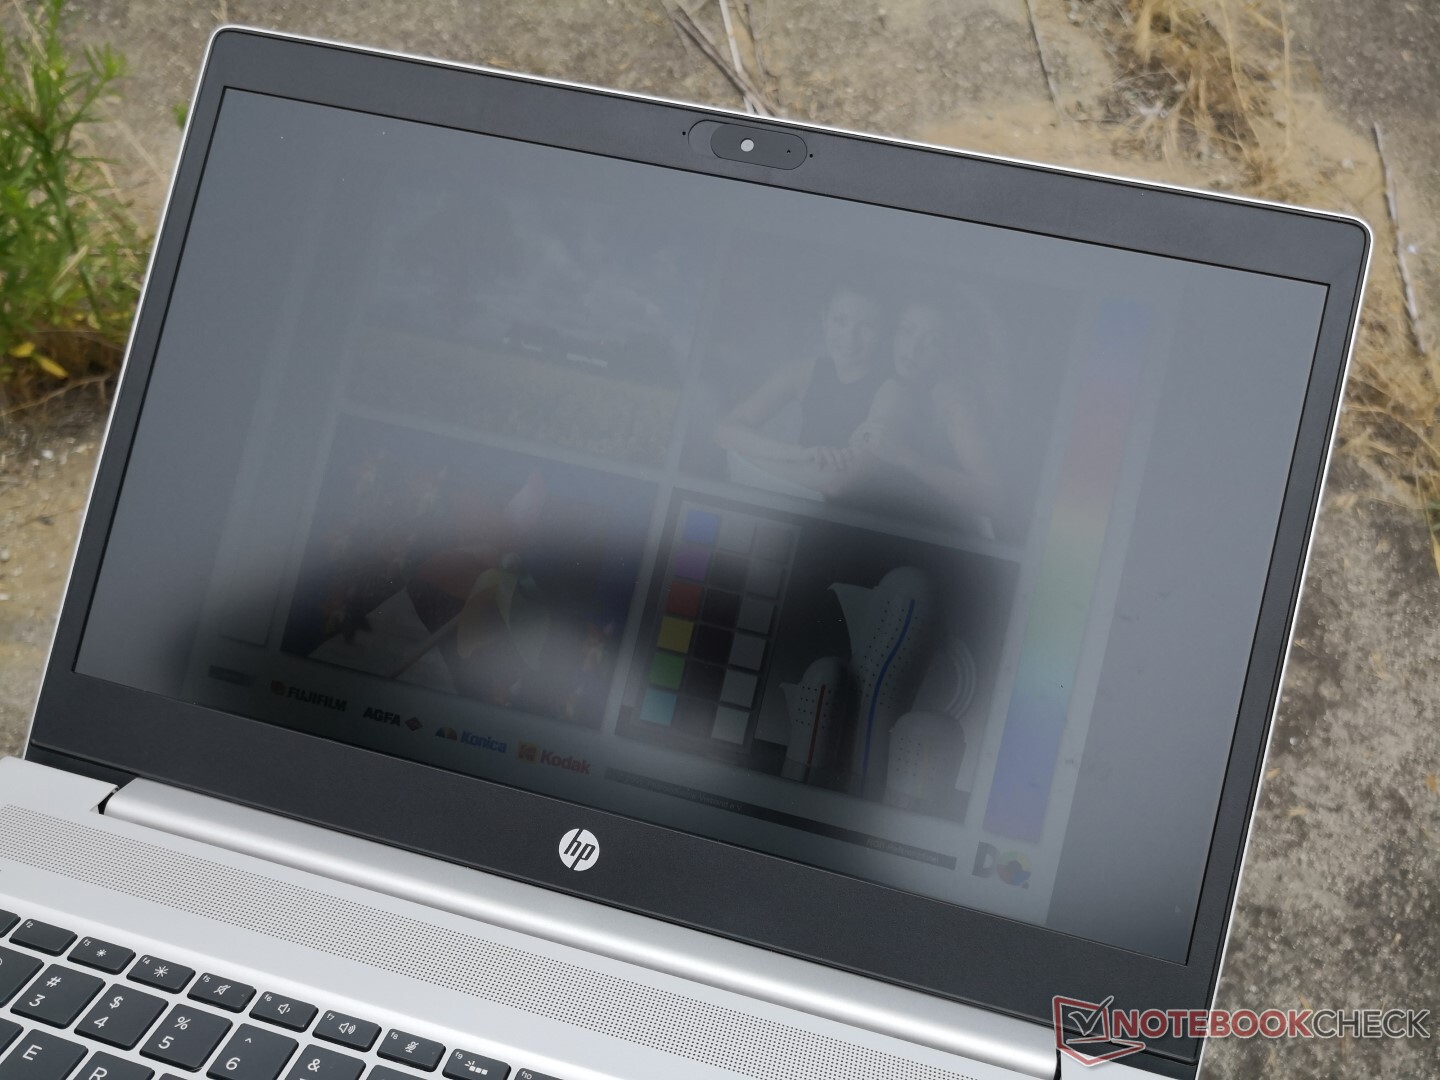
Aufgrund der niedrigen Helligkeit der Hintergrundbeleuchtung fällt die Lesbarkeit im Freien nicht besonders gut aus. Dazu kommt, dass die maximale Helligkeit im Akkumodus unabhängig von den Intel-Command-Center-Einstellungen von 259,8 cd/m² auf 224,3 cd/m² fällt. Wir raten potenziellen Käufern, die ihren Laptop häufiger im Freien benutzen möchten, zur 1000-cd/m²-Option zu greifen.

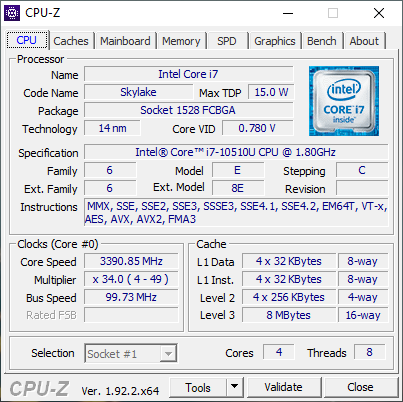
Leistung
Die CPU-Optionen reichen vom Core i3-10110U bis zum Core i7-10610U mit vPro, während man bei der GPU die Wahl zwischen der integrierten UHD Graphics 620 und der dedizierten GeForce MX130 bzw. MX250 hat. Dabei handelt es sich um normale Ultrabook-Konfigurationsmöglichkeiten, Hochleistungsmodelle wie das Lenovo ThinkPad X1 Extreme können dagegen mit Core-H-CPUs und GeForce-GTX-GPUs konfiguriert werden.
Bei Varianten mit einer GeForce GPU kommt standardmäßig Nvidias Grafikumschaltlösung Optimus zum Einsatz.
Prozessor
Mit einem Leistungsdefizit von bis zu 30 % gegenüber einem durchschnittlichen Core i7-10510U in unserer Datenbank fällt die CPU-Leistung enttäschend aus. Noch schlimmer sieht das Ergebnis aus, wenn man es mit dem des konkurrierenden Ryzen 7 4700U im ProBook 455 G7 vergleicht, da Letzterer unter Berücksichtigung von Drosseln bei beiden Systemen trotzdem eine mehr als doppelt so hohe, reine Prozessorleistung entfalten kann. Der Core i7-10510U im ProBook 450 G7 wirkt eher wie ein günstigerer Core i5. Wir haben bei unserem Testgerät vor Beginn des Tests den Hochleistungsmodus ausgewählt, die Ergebnisse haben sich dadurch jedoch nicht verbessert.
Cinebench R15: CPU Multi 64Bit | CPU Single 64Bit
Blender: v2.79 BMW27 CPU
7-Zip 18.03: 7z b 4 -mmt1 | 7z b 4
Geekbench 5.5: Single-Core | Multi-Core
HWBOT x265 Benchmark v2.2: 4k Preset
LibreOffice : 20 Documents To PDF
R Benchmark 2.5: Overall mean
| Cinebench R20 / CPU (Multi Core) | |
| HP ProBook 455 G7-175W8EA | |
| MSI Prestige 15 A10SC | |
| Microsoft Surface Laptop 3 15 i7-1065G7 | |
| Lenovo ThinkBook 15 | |
| Durchschnittliche Intel Core i7-10510U (1015 - 1897, n=38) | |
| Lenovo ThinkPad L590-20Q70019GE | |
| Lenovo ThinkPad E590-20NB0012GE | |
| HP ProBook 450 G7 8WC04UT | |
| LG Gram 15Z90N | |
| Lenovo IdeaPad 3 14IIL05 | |
| HP 17-by2437ng | |
| Cinebench R20 / CPU (Single Core) | |
| HP ProBook 455 G7-175W8EA | |
| MSI Prestige 15 A10SC | |
| Microsoft Surface Laptop 3 15 i7-1065G7 | |
| Durchschnittliche Intel Core i7-10510U (362 - 497, n=37) | |
| Lenovo ThinkPad E590-20NB0012GE | |
| Lenovo ThinkBook 15 | |
| Lenovo ThinkPad L590-20Q70019GE | |
| HP 17-by2437ng | |
| HP ProBook 450 G7 8WC04UT | |
| LG Gram 15Z90N | |
| Lenovo IdeaPad 3 14IIL05 | |
| Cinebench R15 / CPU Multi 64Bit | |
| MSI Prestige 15 A10SC | |
| HP ProBook 455 G7-175W8EA | |
| Microsoft Surface Laptop 3 15 i7-1065G7 | |
| Lenovo ThinkBook 15 | |
| Durchschnittliche Intel Core i7-10510U (482 - 856, n=45) | |
| LG Gram 15Z90N | |
| Lenovo ThinkPad E590-20NB0012GE | |
| Lenovo ThinkPad L590-20Q70019GE | |
| HP ProBook 450 G7 8WC04UT | |
| Lenovo IdeaPad 3 14IIL05 | |
| HP 17-by2437ng | |
| Cinebench R15 / CPU Single 64Bit | |
| MSI Prestige 15 A10SC | |
| Microsoft Surface Laptop 3 15 i7-1065G7 | |
| Lenovo ThinkPad E590-20NB0012GE | |
| HP ProBook 455 G7-175W8EA | |
| Durchschnittliche Intel Core i7-10510U (113 - 202, n=42) | |
| Lenovo ThinkBook 15 | |
| Lenovo ThinkPad L590-20Q70019GE | |
| HP 17-by2437ng | |
| Lenovo IdeaPad 3 14IIL05 | |
| LG Gram 15Z90N | |
| HP ProBook 450 G7 8WC04UT | |
| Blender / v2.79 BMW27 CPU | |
| HP 17-by2437ng | |
| Lenovo IdeaPad 3 14IIL05 | |
| LG Gram 15Z90N | |
| HP ProBook 450 G7 8WC04UT | |
| Lenovo ThinkPad L590-20Q70019GE | |
| Lenovo ThinkPad E590-20NB0012GE | |
| Durchschnittliche Intel Core i7-10510U (628 - 1051, n=31) | |
| Lenovo ThinkBook 15 | |
| HP ProBook 455 G7-175W8EA | |
| 7-Zip 18.03 / 7z b 4 -mmt1 | |
| Lenovo ThinkPad E590-20NB0012GE | |
| Durchschnittliche Intel Core i7-10510U (3747 - 4981, n=31) | |
| HP 17-by2437ng | |
| HP ProBook 455 G7-175W8EA | |
| Lenovo ThinkBook 15 | |
| LG Gram 15Z90N | |
| Lenovo IdeaPad 3 14IIL05 | |
| HP ProBook 450 G7 8WC04UT | |
| Lenovo ThinkPad L590-20Q70019GE | |
| 7-Zip 18.03 / 7z b 4 | |
| HP ProBook 455 G7-175W8EA | |
| Lenovo ThinkBook 15 | |
| Durchschnittliche Intel Core i7-10510U (12196 - 21298, n=31) | |
| Lenovo ThinkPad E590-20NB0012GE | |
| Lenovo ThinkPad L590-20Q70019GE | |
| LG Gram 15Z90N | |
| HP ProBook 450 G7 8WC04UT | |
| Lenovo IdeaPad 3 14IIL05 | |
| HP 17-by2437ng | |
| Geekbench 5.5 / Single-Core | |
| HP ProBook 450 G7 8WC04UT | |
| Durchschnittliche Intel Core i7-10510U (977 - 1287, n=31) | |
| LG Gram 15Z90N | |
| Lenovo IdeaPad 3 14IIL05 | |
| HP ProBook 455 G7-175W8EA | |
| HP 17-by2437ng | |
| Geekbench 5.5 / Multi-Core | |
| HP ProBook 455 G7-175W8EA | |
| Durchschnittliche Intel Core i7-10510U (2474 - 4484, n=31) | |
| HP ProBook 450 G7 8WC04UT | |
| LG Gram 15Z90N | |
| Lenovo IdeaPad 3 14IIL05 | |
| HP 17-by2437ng | |
| HWBOT x265 Benchmark v2.2 / 4k Preset | |
| HP ProBook 455 G7-175W8EA | |
| Lenovo ThinkBook 15 | |
| Durchschnittliche Intel Core i7-10510U (3.41 - 6.04, n=31) | |
| Lenovo ThinkPad E590-20NB0012GE | |
| Lenovo ThinkPad L590-20Q70019GE | |
| Lenovo IdeaPad 3 14IIL05 | |
| HP ProBook 450 G7 8WC04UT | |
| HP 17-by2437ng | |
| LibreOffice / 20 Documents To PDF | |
| HP ProBook 455 G7-175W8EA | |
| HP ProBook 450 G7 8WC04UT | |
| HP 17-by2437ng | |
| Durchschnittliche Intel Core i7-10510U (50.7 - 77.8, n=27) | |
| Lenovo IdeaPad 3 14IIL05 | |
| LG Gram 15Z90N | |
| R Benchmark 2.5 / Overall mean | |
| LG Gram 15Z90N | |
| Lenovo IdeaPad 3 14IIL05 | |
| HP ProBook 450 G7 8WC04UT | |
| HP 17-by2437ng | |
| Durchschnittliche Intel Core i7-10510U (0.637 - 0.81, n=28) | |
| HP ProBook 455 G7-175W8EA | |
* ... kleinere Werte sind besser
System Performance
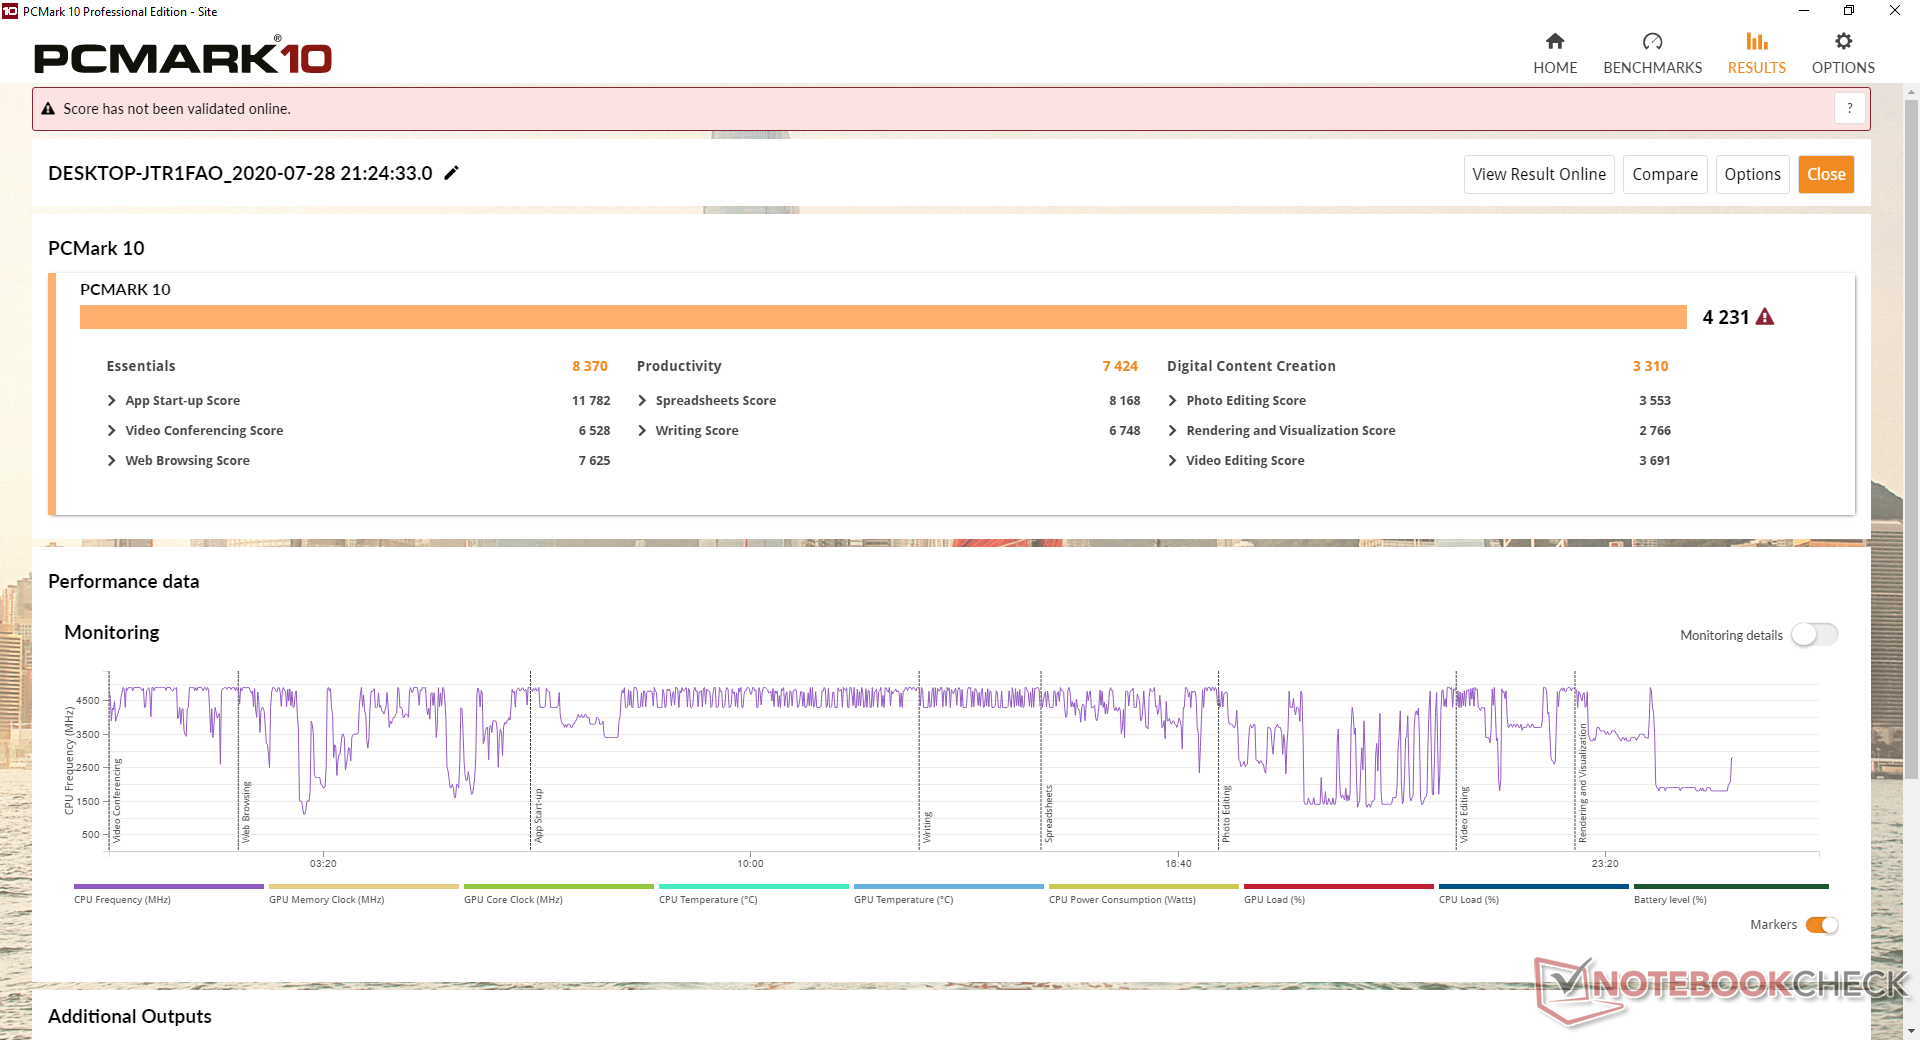
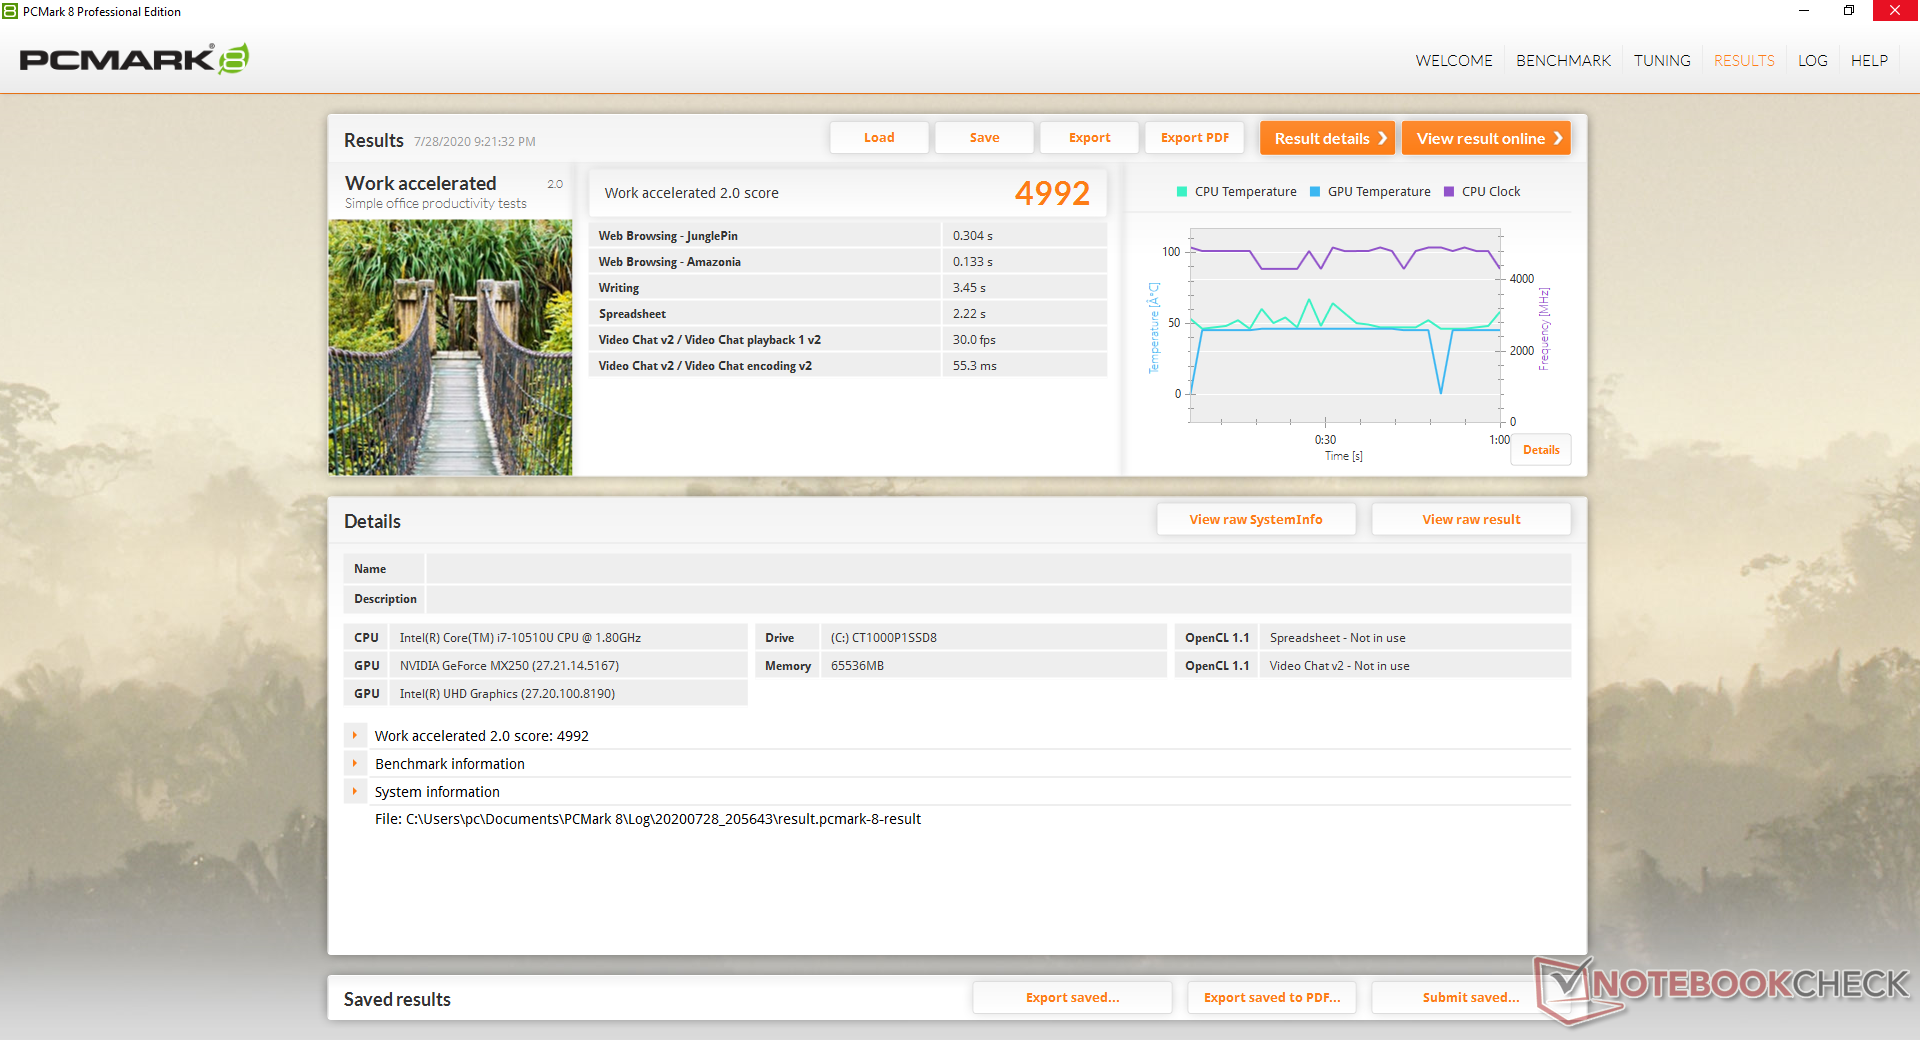
Im Vergleich zu anderen Laptops mit der gleichen Kombination aus CPU und GPU entsprechen die PCMark-Ergebnisse trotz der oben erwähnten, langsameren CPU-Leistung unseren Erwartungen. Im Digital-Content-Creation-Benchmark schlägt das ProBook 455 G7 unser Intel-Gerät, was vermutlich darauf zurückzuführen ist, dass sich PCMark bei der Beurteilung von Geräten mit dedizierten GPUs (wie dem hier getesteten GeForce-basierten ProBook) noch nie als besonders zuverlässig erwiesen hat.
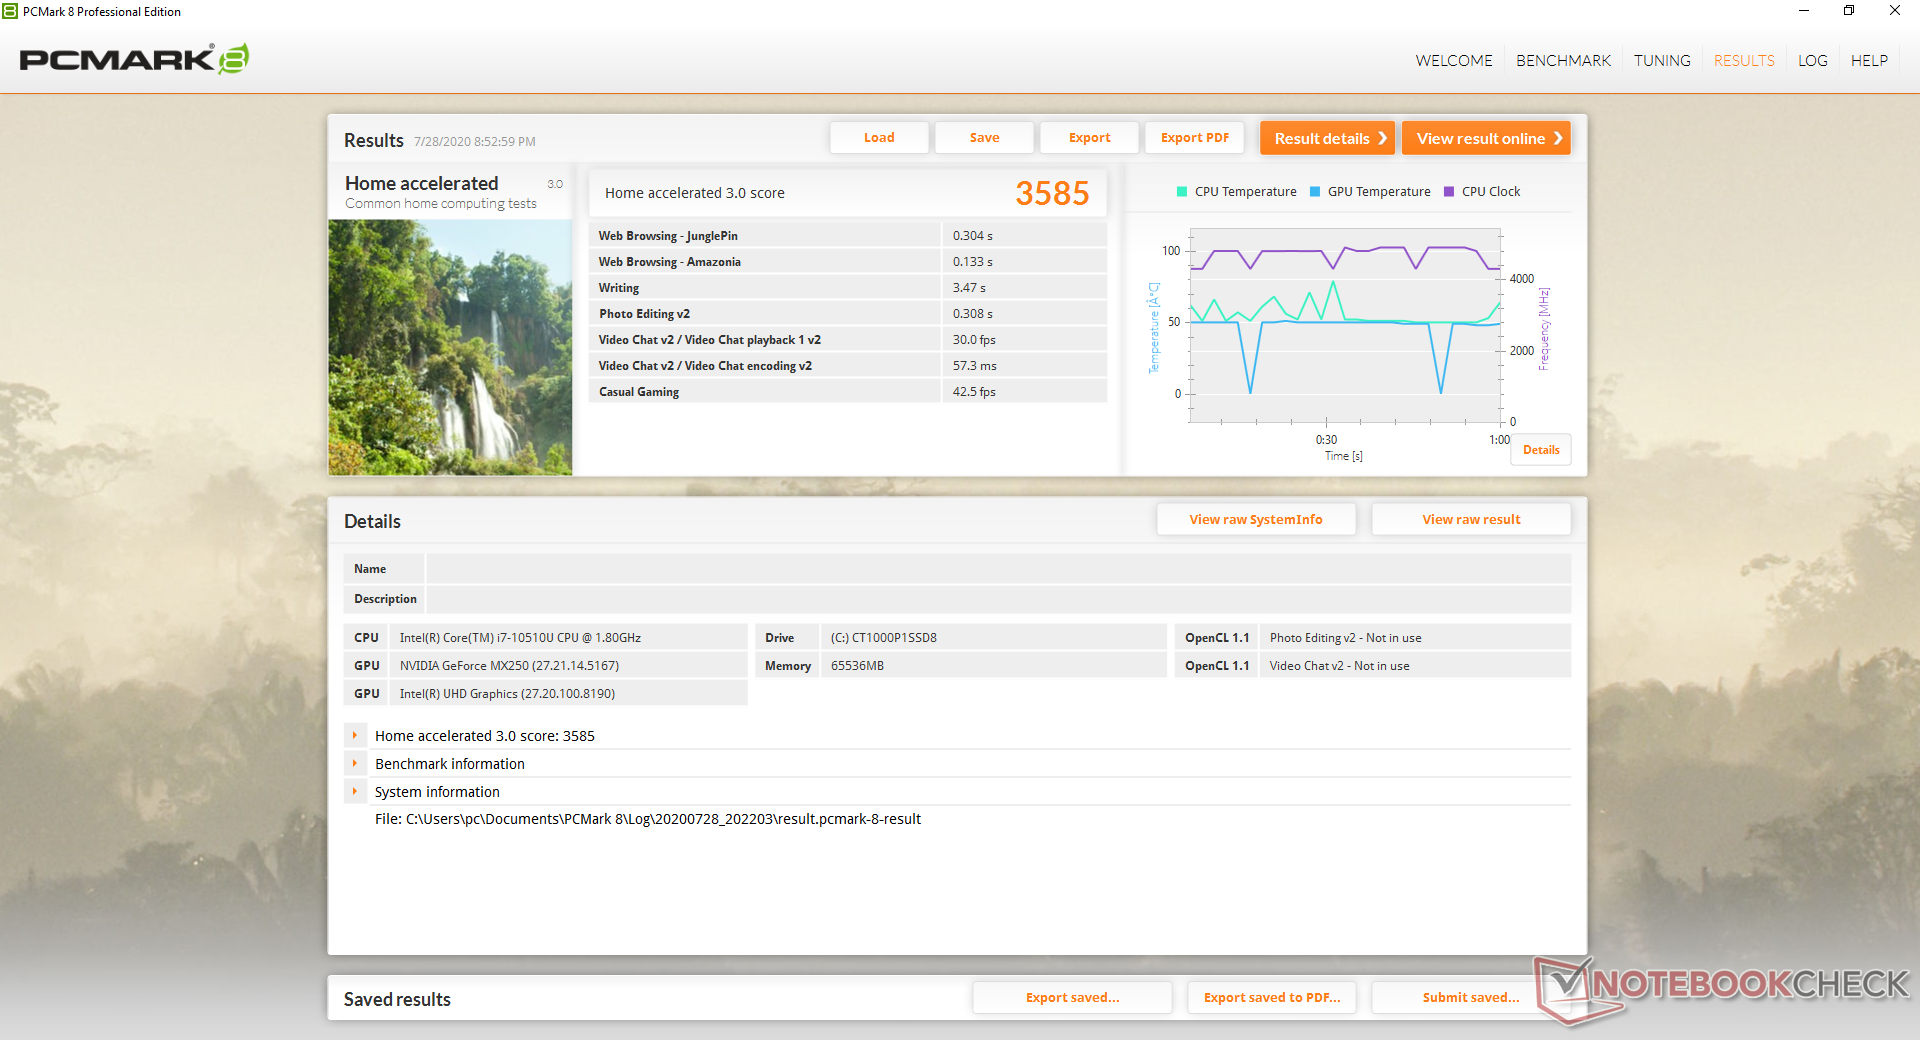
| PCMark 8 Home Score Accelerated v2 | 3585 Punkte | |
| PCMark 8 Work Score Accelerated v2 | 4992 Punkte | |
| PCMark 10 Score | 4231 Punkte | |
Hilfe | ||
DPC-Latenzen
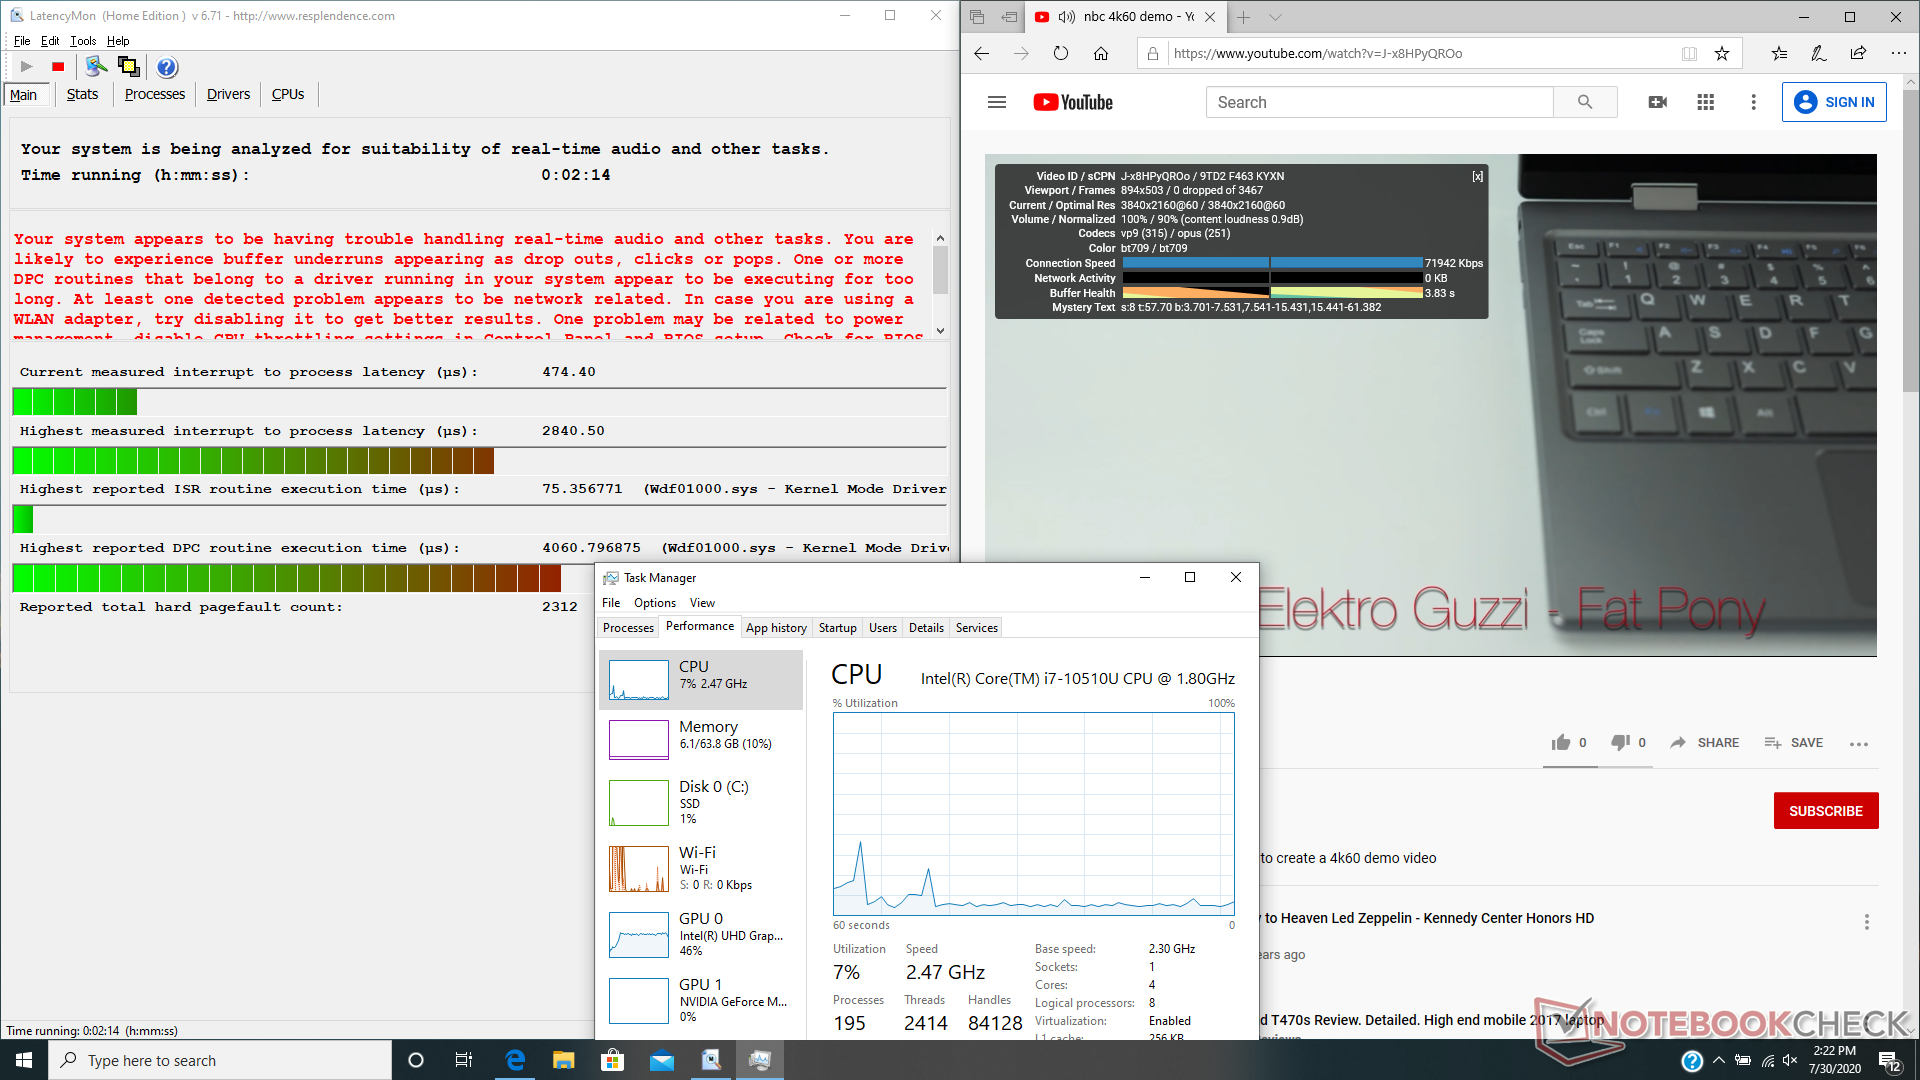
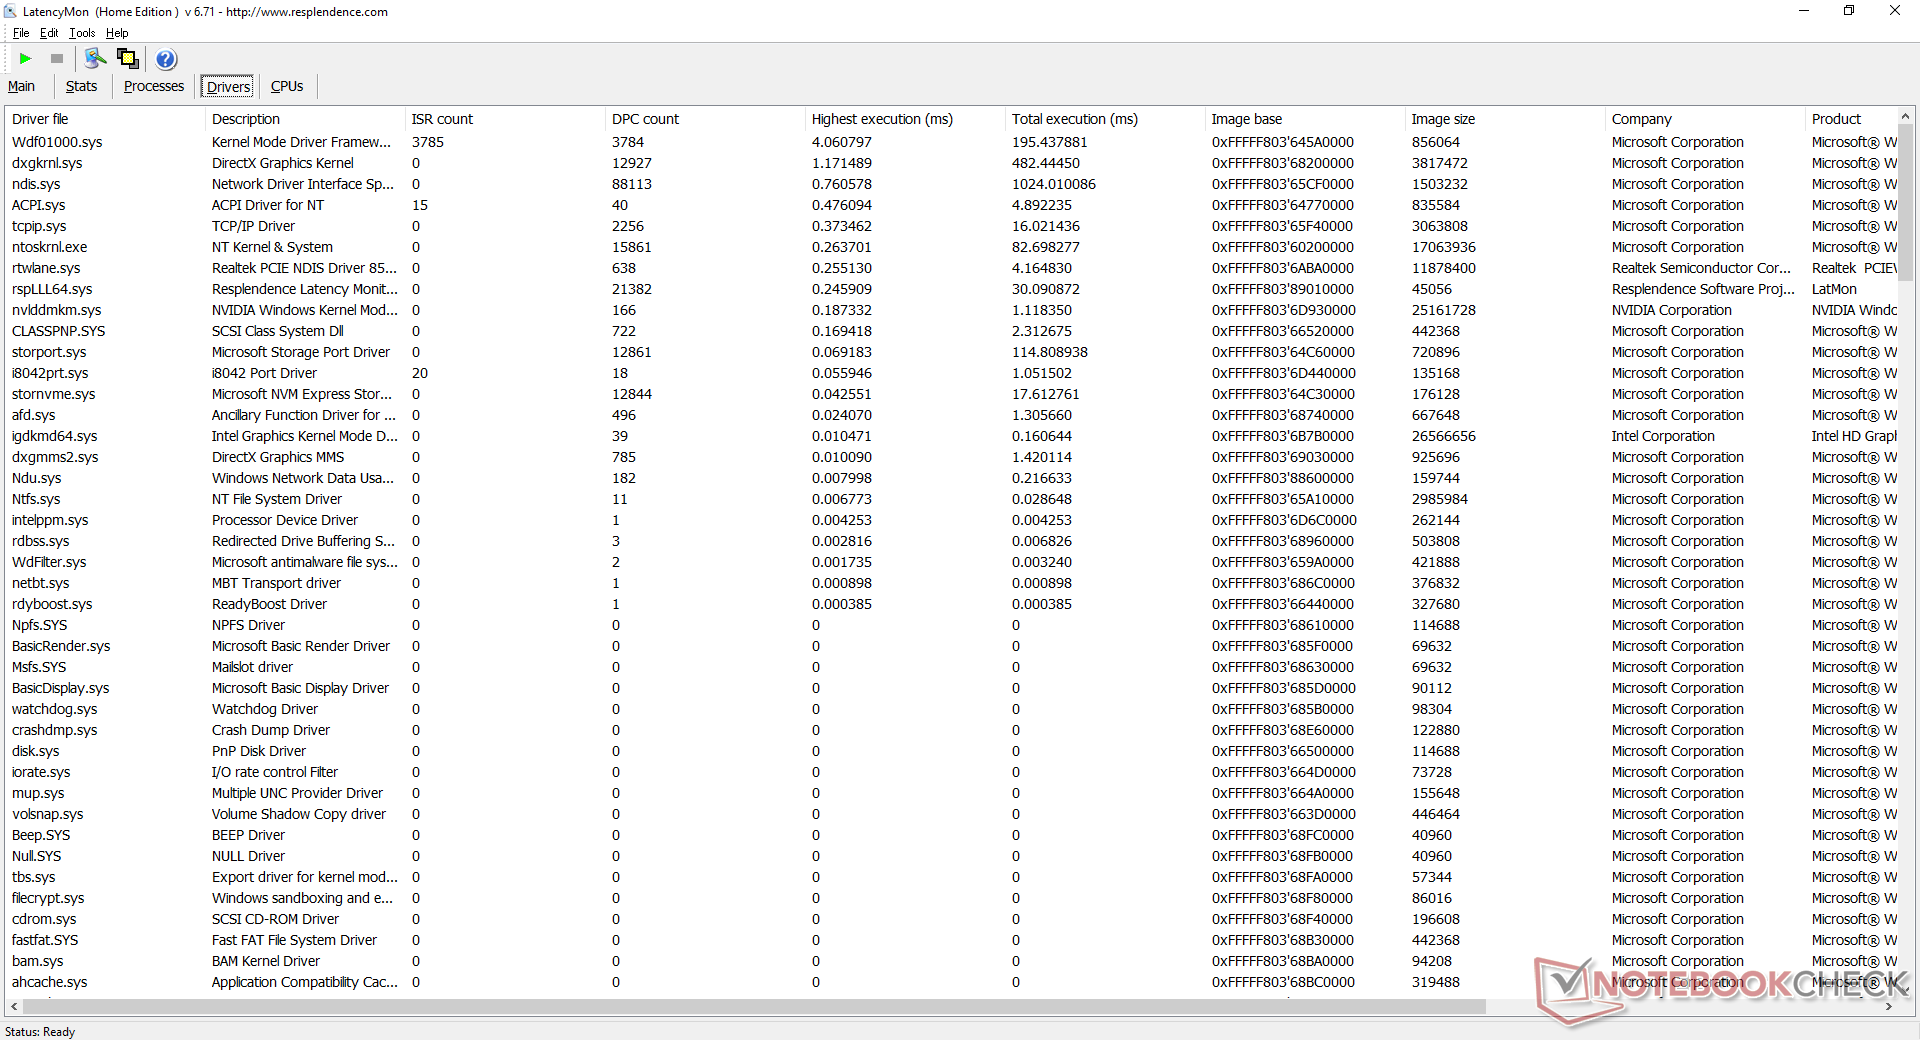
LatencyMon meldet problematische DPC-Latenzen, die von Wdf01000.sys verursacht werden. Die Wiedergabe von 4K-UHD-YouTube-Videos geht jedoch flüssig vonstatten und es gehen dabei keine Frames verloren.
| DPC Latencies / LatencyMon - interrupt to process latency (max), Web, Youtube, Prime95 | |
| LG Gram 15Z90N | |
| HP Envy x360 15-dr1679cl | |
| HP ProBook 450 G7 8WC04UT | |
| HP 17-by2437ng | |
| Asus VivoBook 17 S712FA-DS76 | |
| HP ProBook 455 G7-175W8EA | |
| Lenovo IdeaPad 3 14IIL05 | |
* ... kleinere Werte sind besser
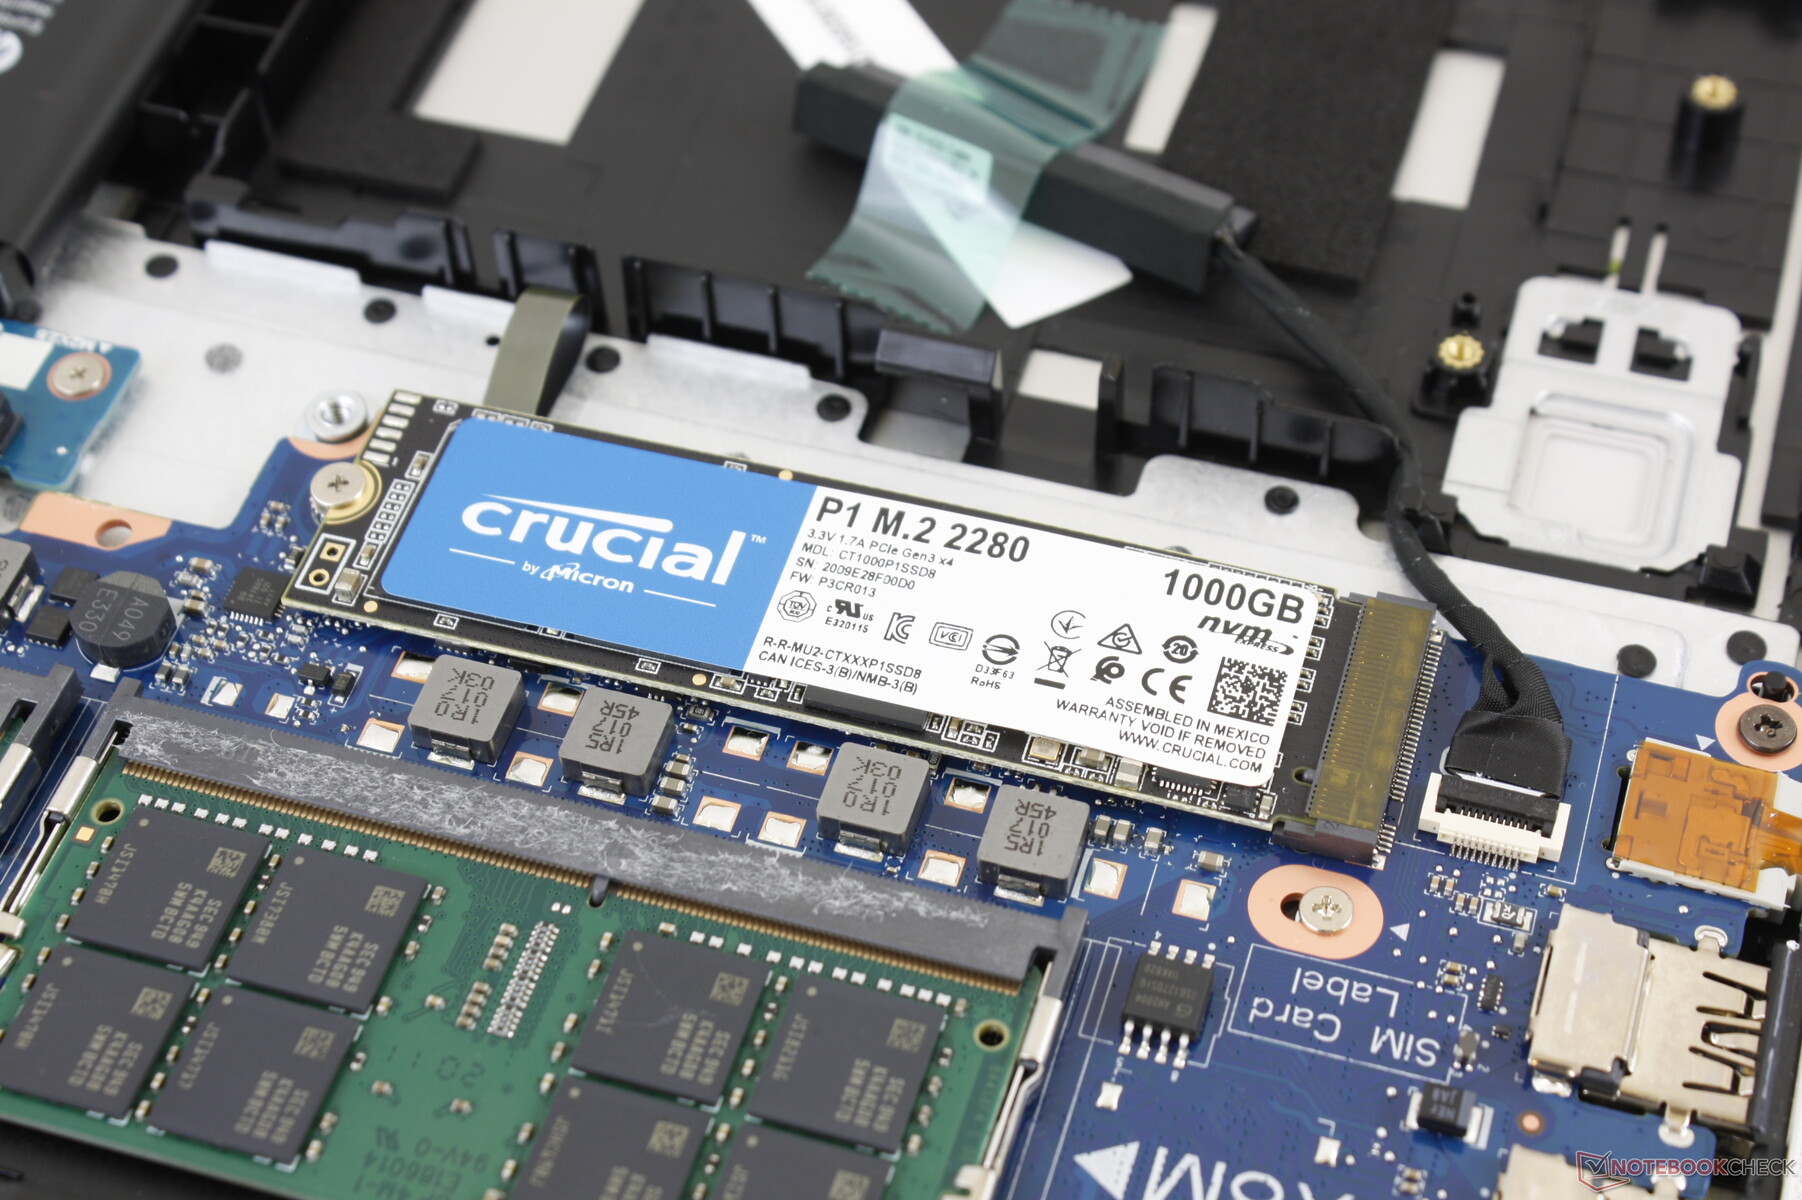
Massenspeicher
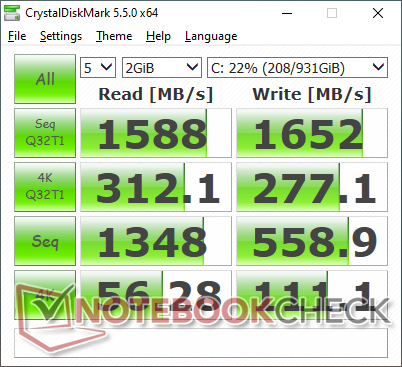
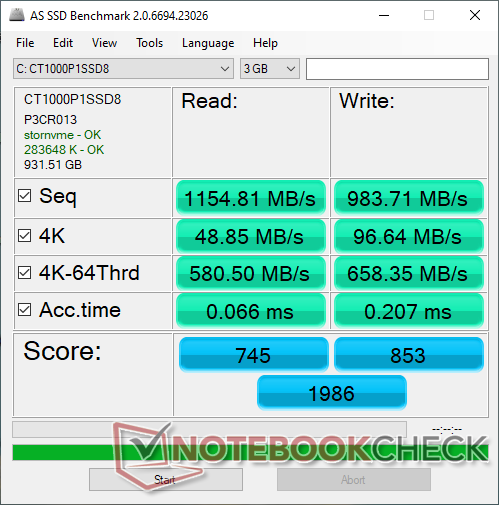
CUKUSA setzt beim Massenspeicher häufig auf die 1 TB große Crucial-SSD P1 CT1000P1SSD8, ein in der Mittelklasse angesiedeltes PCIe-x4-NVMe-Laufwerk mit theoretischen sequenziellen Lese- und Schreibraten von bis zu 2.000 MB/s bzw. 1.700 MB/s. Trotzdem erreicht unser Testgerät auch unter Optimalbedingungen nur maximal ca. 1.400 bis 1.600 MB/s.
| HP ProBook 450 G7 8WC04UT Crucial P1 SSD CT1000P1SSD8 | HP ProBook 455 G7-175W8EA Samsung PM991 MZVLQ512HALU | MSI Modern 15 A10RB WDC PC SN730 SDBPNTY-512G | Dell Latitude 15 3590 Samsung SSD PM871b MZ7LN256HAJQ | Lenovo ThinkPad L590-20Q70019GE Toshiba XG6 KXG6AZNV512G | Dynabook Tecra X50-F Samsung SSD PM981 MZVLB512HAJQ | |
|---|---|---|---|---|---|---|
| AS SSD | 19% | 113% | -29% | 67% | 31% | |
| Seq Read (MB/s) | 1155 | 1929 67% | 2084 80% | 498.7 -57% | 1383 20% | 1461 26% |
| Seq Write (MB/s) | 984 | 1199 22% | 2442 148% | 361.7 -63% | 852 -13% | 1039 6% |
| 4K Read (MB/s) | 48.85 | 43.9 -10% | 47.52 -3% | 34.65 -29% | 45.72 -6% | 45.98 -6% |
| 4K Write (MB/s) | 96.6 | 116.2 20% | 135.8 41% | 79.8 -17% | 120.2 24% | 125.5 30% |
| 4K-64 Read (MB/s) | 581 | 897 54% | 1043 80% | 372.5 -36% | 1344 131% | 560 -4% |
| 4K-64 Write (MB/s) | 658 | 801 22% | 955 45% | 247.7 -62% | 926 41% | 1162 77% |
| Access Time Read * (ms) | 0.066 | 0.069 -5% | 0.062 6% | 0.06 9% | 0.063 5% | 0.045 32% |
| Access Time Write * (ms) | 0.207 | 0.033 84% | 0.076 63% | 0.042 80% | 0.036 83% | 0.032 85% |
| Score Read (Points) | 745 | 1134 52% | 1299 74% | 457 -39% | 1528 105% | 752 1% |
| Score Write (Points) | 853 | 1037 22% | 1335 57% | 364 -57% | 1132 33% | 1391 63% |
| Score Total (Points) | 1986 | 2723 37% | 3326 67% | 1060 -47% | 3420 72% | 2521 27% |
| Copy ISO MB/s (MB/s) | 2635 | 1409 -47% | 1926 -27% | 1147 -56% | ||
| Copy Program MB/s (MB/s) | 95.1 | 70.2 -26% | 714 651% | 419.8 341% | ||
| Copy Game MB/s (MB/s) | 361.9 | 254.9 -30% | 1425 294% | 928 156% | ||
| CrystalDiskMark 5.2 / 6 | 19% | 108% | -36% | 21% | 10% | |
| Write 4K (MB/s) | 111.1 | 141.9 28% | 208.4 88% | 79.5 -28% | 115.3 4% | 100.1 -10% |
| Read 4K (MB/s) | 56.3 | 37.25 -34% | 51 -9% | 32.72 -42% | 43.34 -23% | 42.4 -25% |
| Write Seq (MB/s) | 559 | 998 79% | 2687 381% | 472.5 -15% | 1014 81% | |
| Read Seq (MB/s) | 1348 | 1233 -9% | 2168 61% | 504 -63% | 1481 10% | |
| Write 4K Q32T1 (MB/s) | 277.1 | 338.4 22% | 489.2 77% | 322.6 16% | 495.4 79% | 245.9 -11% |
| Read 4K Q32T1 (MB/s) | 312.1 | 431.1 38% | 600 92% | 249.9 -20% | 332.6 7% | 230.3 -26% |
| Write Seq Q32T1 (MB/s) | 1652 | 1367 -17% | 2699 63% | 531 -68% | 1654 0% | 1910 16% |
| Read Seq Q32T1 (MB/s) | 1588 | 2355 48% | 3374 112% | 544 -66% | 1746 10% | 3454 118% |
| Write 4K Q8T8 (MB/s) | 877 | 1033 | ||||
| Read 4K Q8T8 (MB/s) | 518 | 892 | ||||
| Durchschnitt gesamt (Programm / Settings) | 19% /
19% | 111% /
111% | -33% /
-32% | 44% /
50% | 21% /
23% |
* ... kleinere Werte sind besser

Laufwerksdrosseln: DiskSpd-Leseschleife, Warteschlangenlänge 8
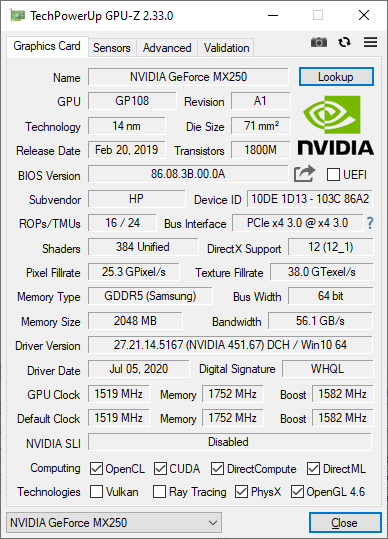
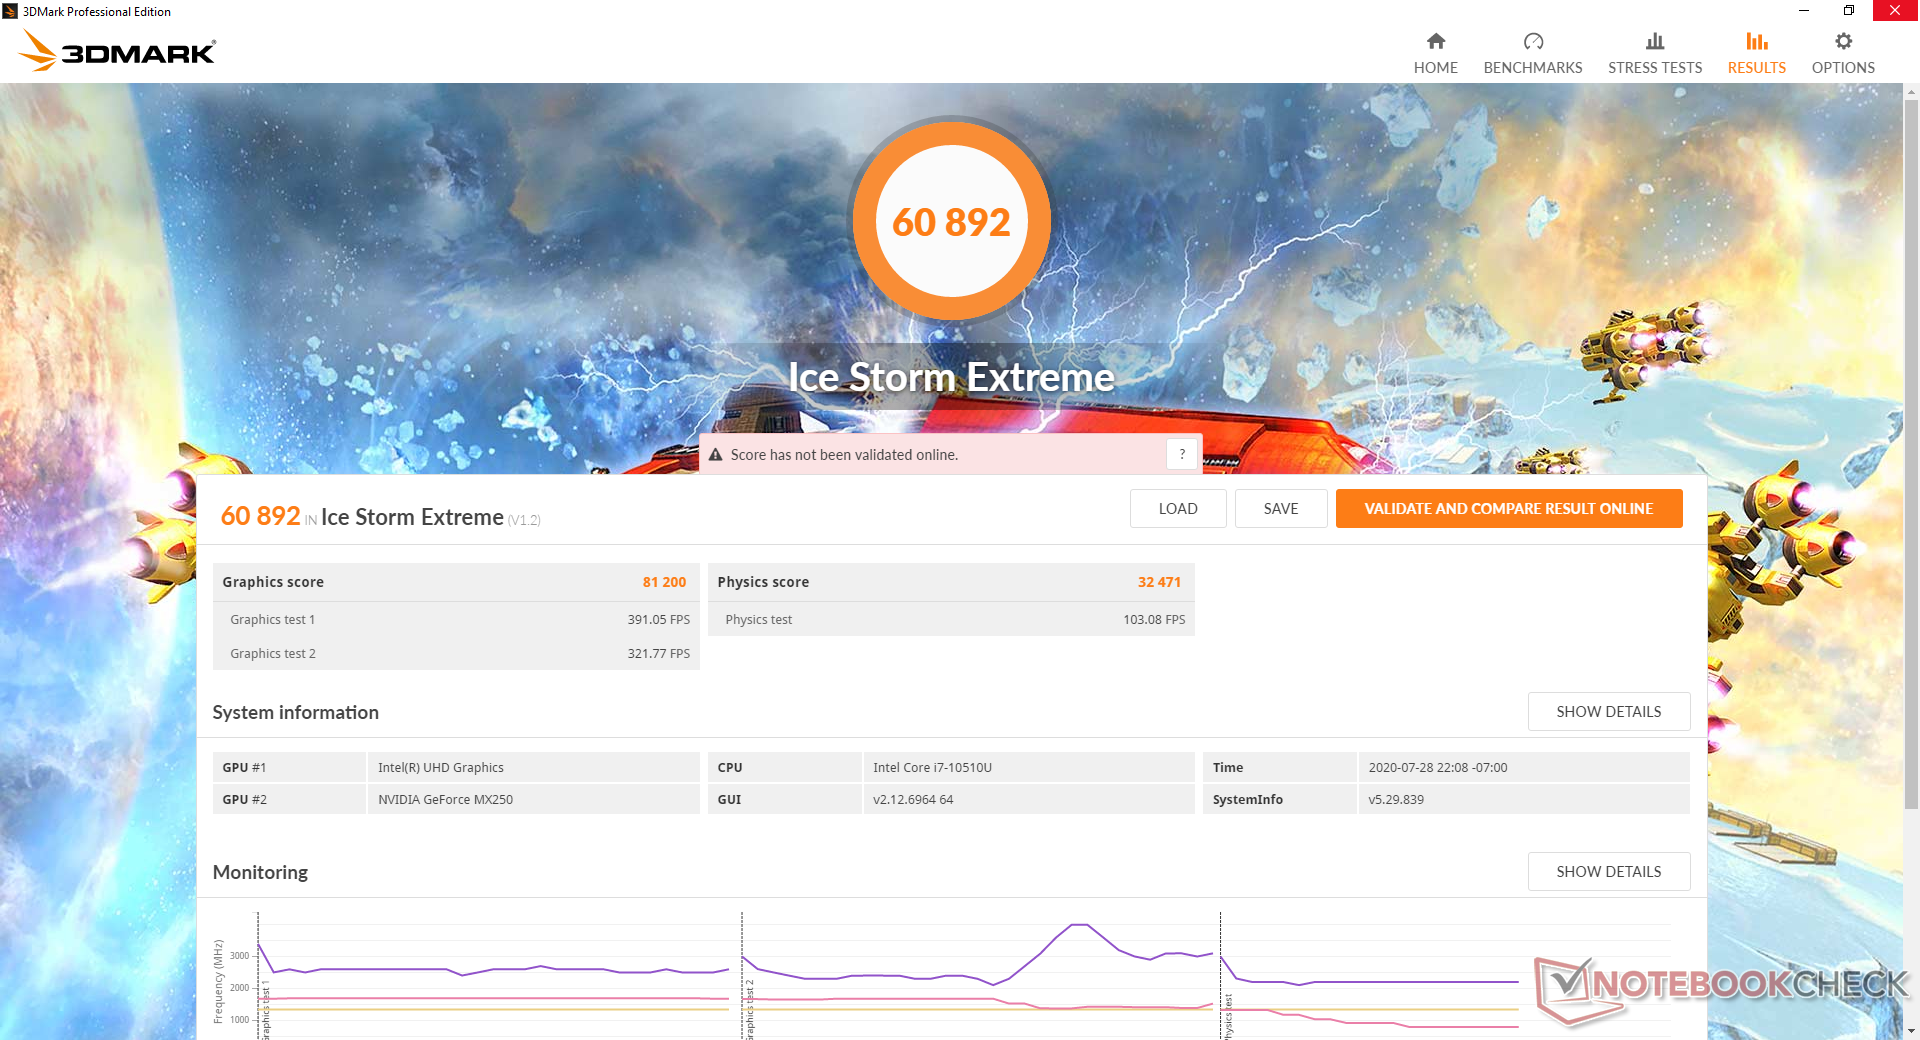
Grafikkarte
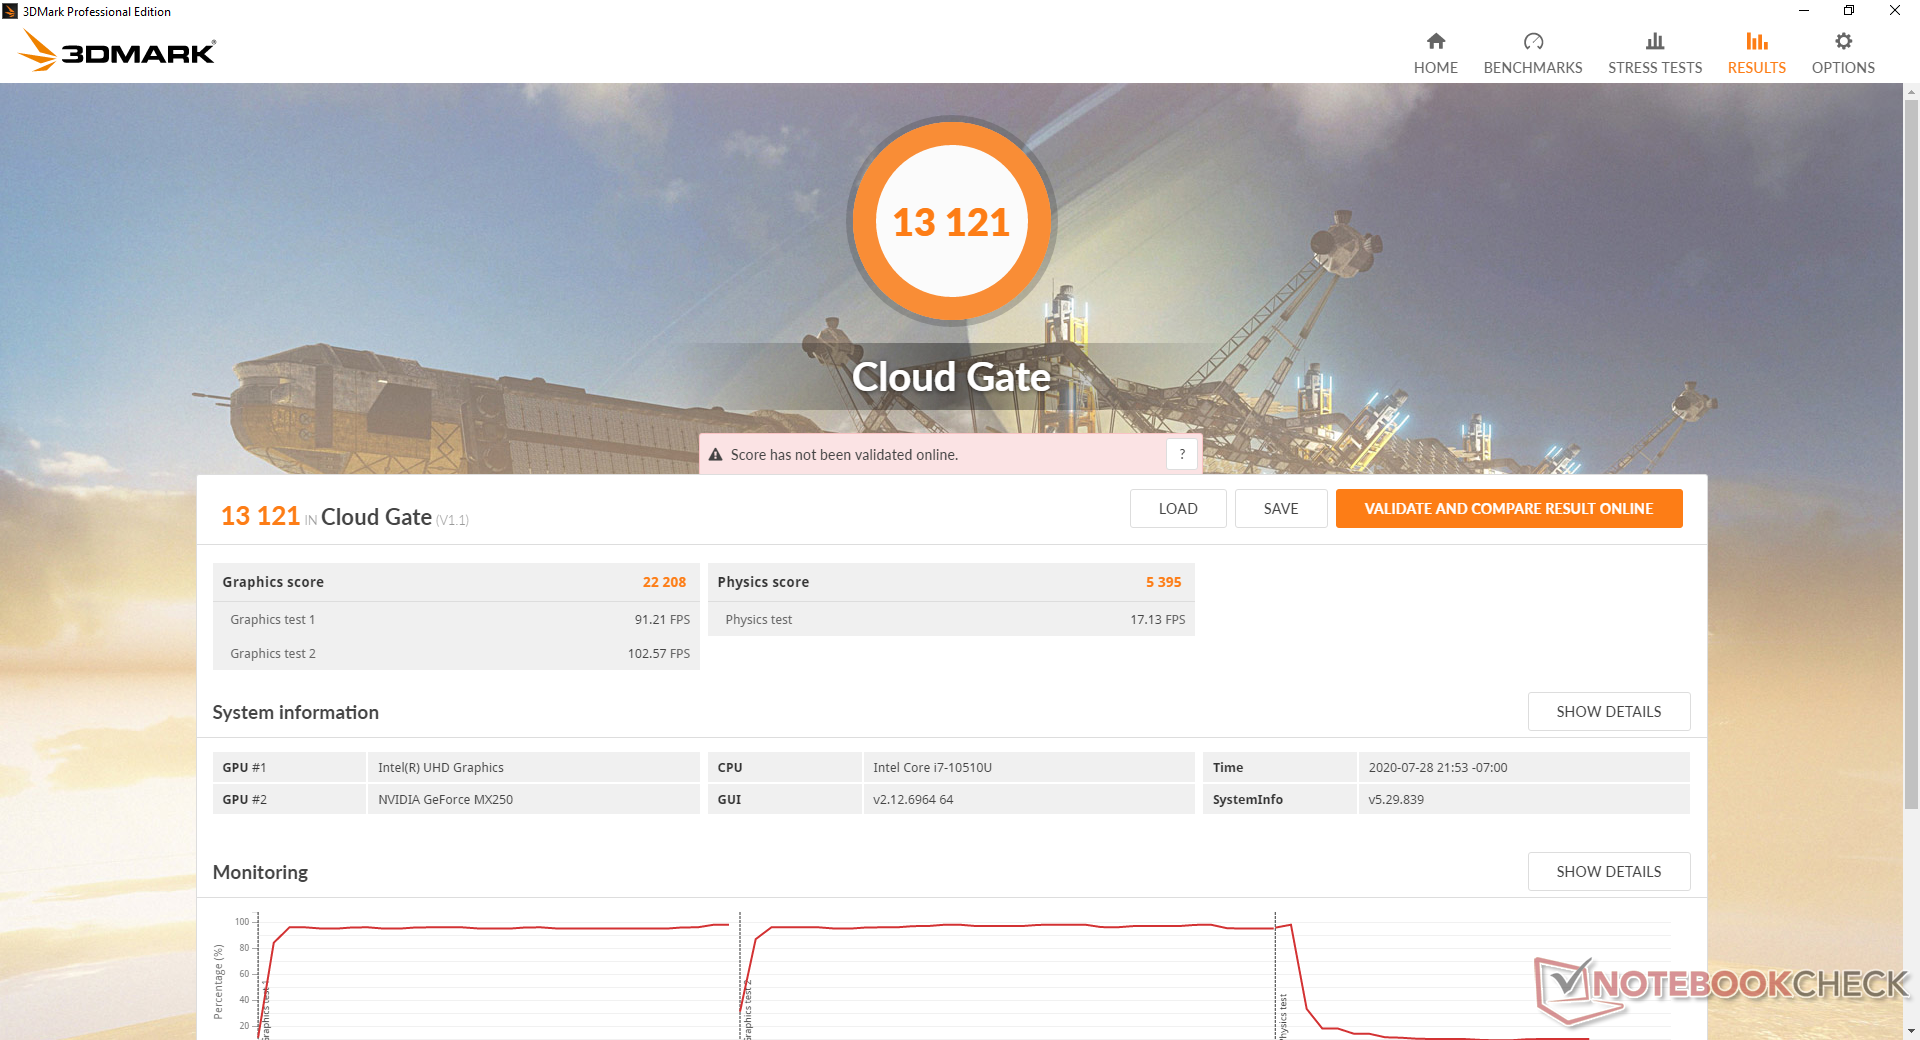
Im Vergleich zu einer durchschnittlichen GeForce MX250 in unserer Datenbank entspricht die Leistung der dedizierten Nvidia-GPU unseren Erwartungen. Die Grafikleistung ist um ca. 40 bis 50 % höher als bei der integrierten Radeon RX Vega 7 im ProBook 455 G7 und mindestens zwei- oder dreimal so schnell wie die der veralteten, integrierten UHD Graphics 620. Man muss jedoch dazusagen, dass unser ProBook 455 G7 nur mit Single-Channel-RAM ausgestattet war und die RX Vega 7 bei der Verwendung von Dual-Channel-RAM der GeForce MX250 möglicherweise deutlich näher kommt.
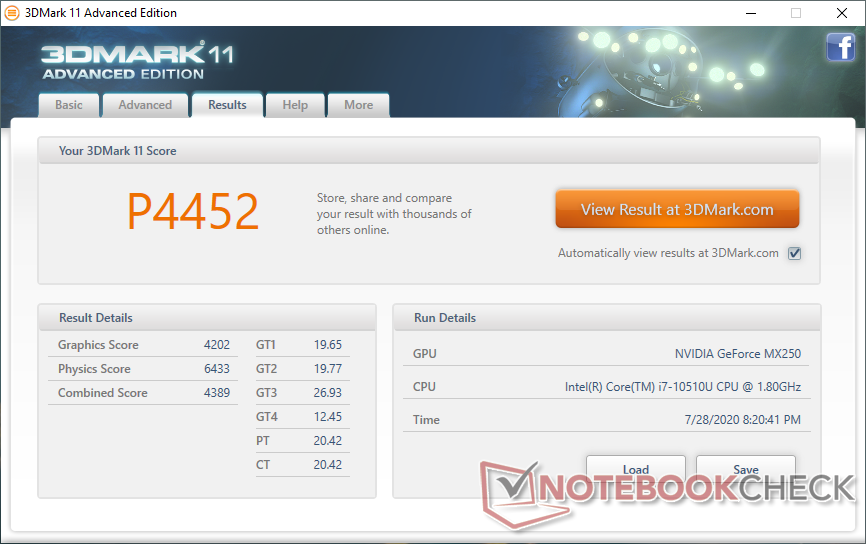
| 3DMark 11 Performance | 4452 Punkte | |
| 3DMark Cloud Gate Standard Score | 13121 Punkte | |
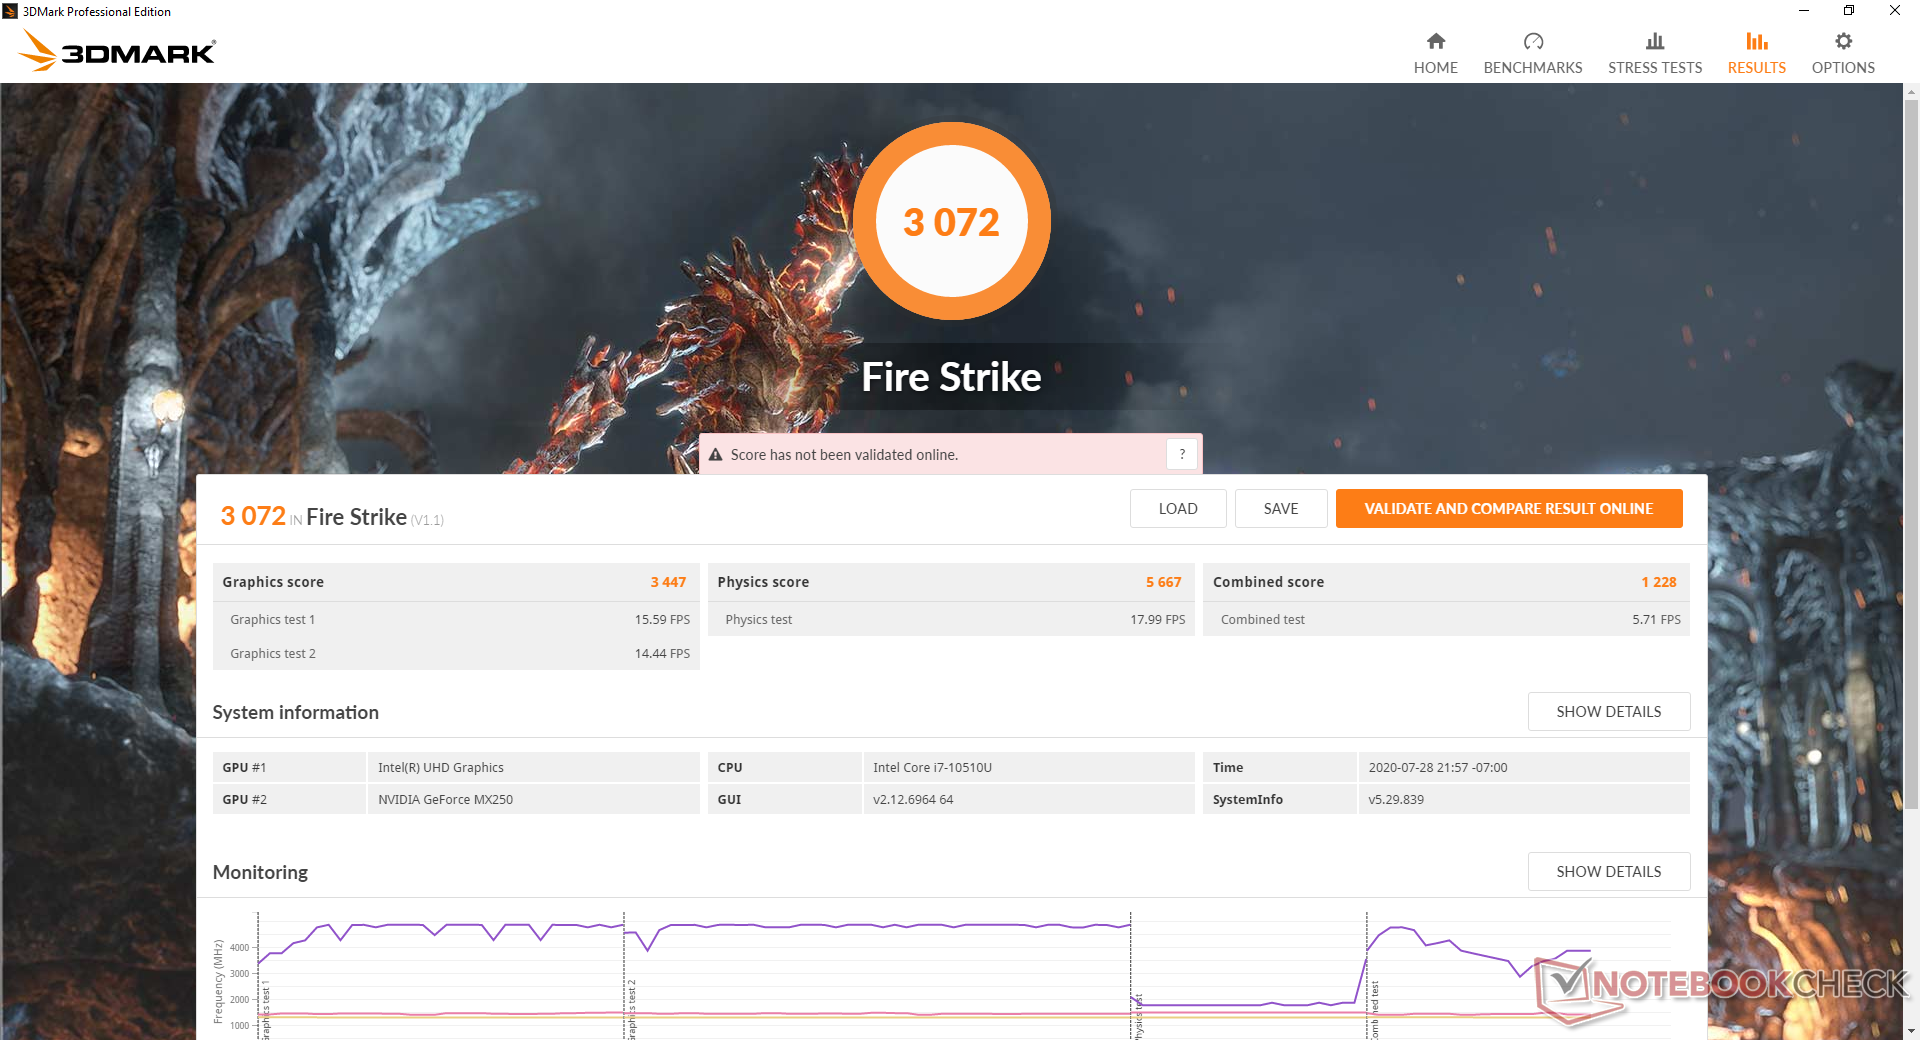
| 3DMark Fire Strike Score | 3072 Punkte | |
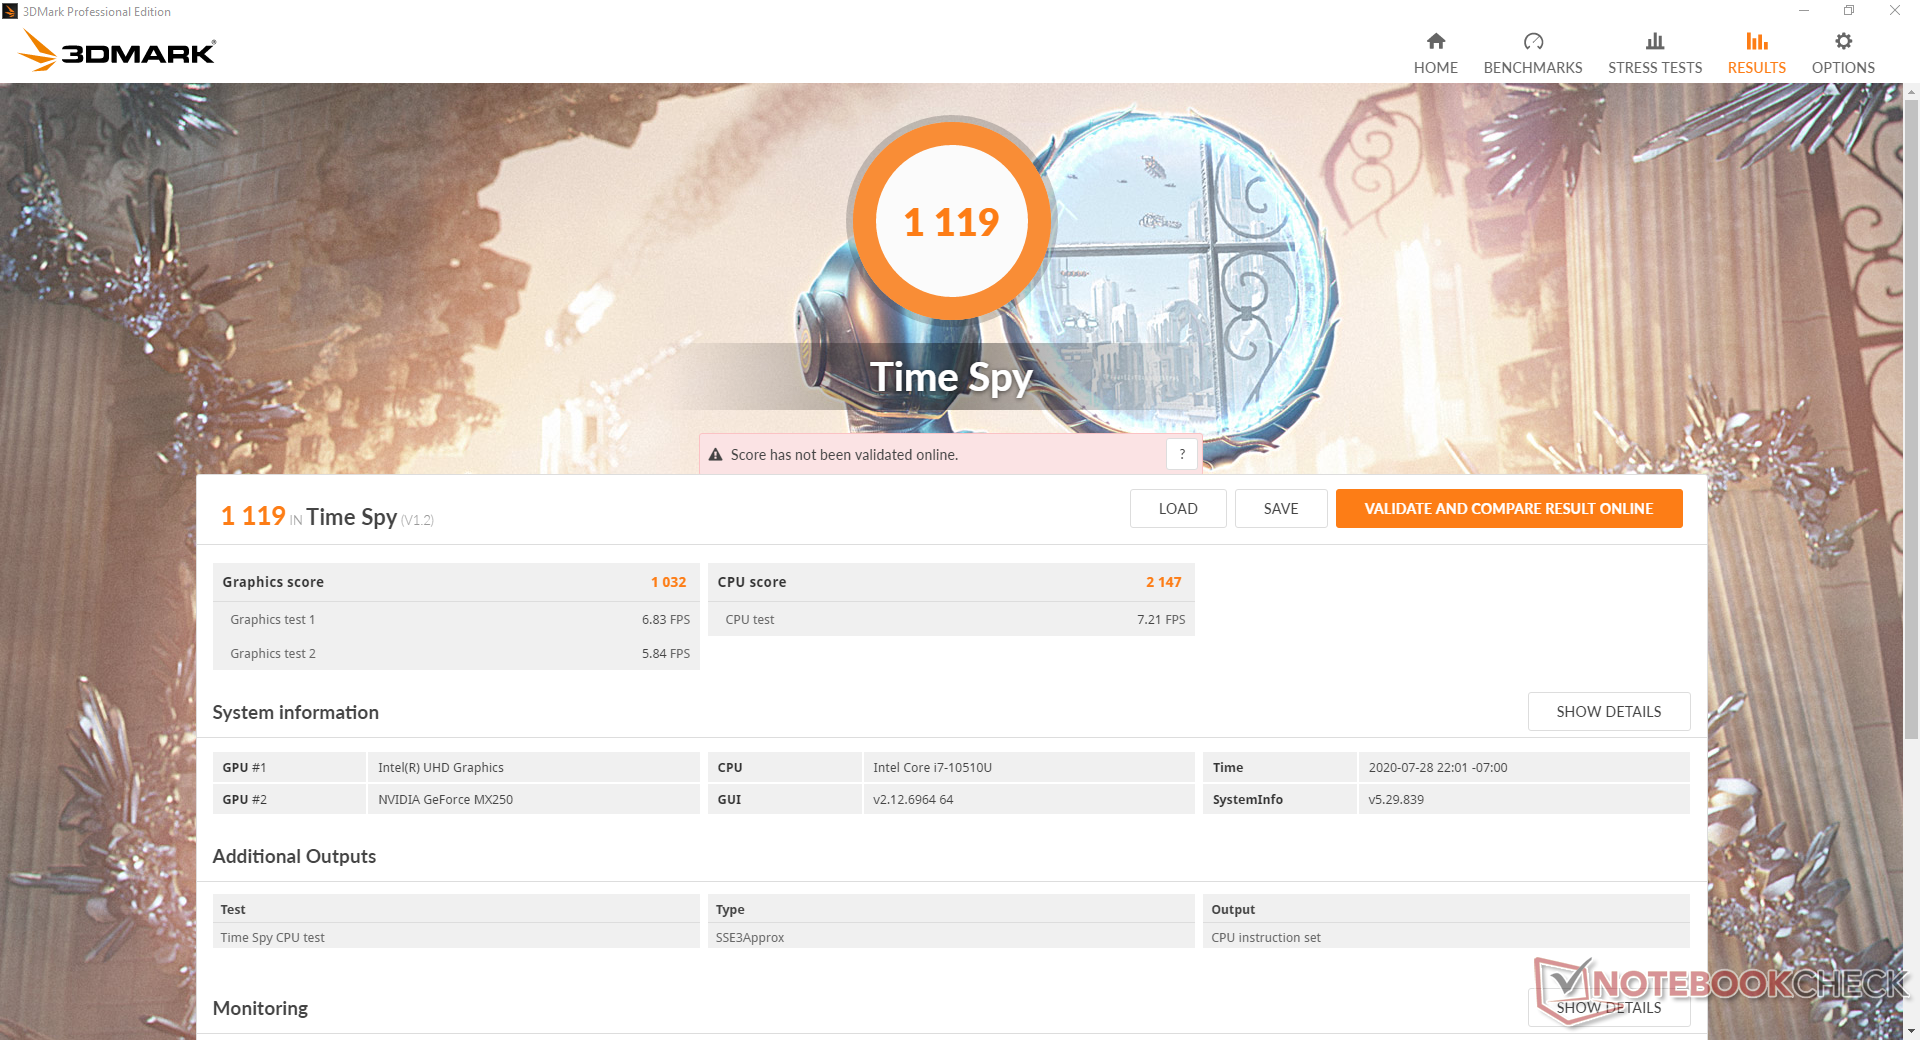
| 3DMark Time Spy Score | 1119 Punkte | |
Hilfe | ||
| min. | mittel | hoch | max. | |
|---|---|---|---|---|
| The Witcher 3 (2015) | 66.7 | 34.7 | 21 | 11.2 |
| Dota 2 Reborn (2015) | 110 | 96.2 | 68 | 60.7 |
| X-Plane 11.11 (2018) | 44.3 | 38.7 | 35.5 |
Emissionen
Geräuschemissionen
In Niederlastsituationen wie beim Surfen oder der Textverarbeitung bleibt der verbaute Lüfter meistens aus und gewährleistet so einen vollständig lautlosen Betrieb. Schlimmstenfalls springt die Lüfterlautstärke auf 31 bis 34 dB(A) und ist damit immer noch auszuhalten. Dabei pulsiert der Lüfter wenig bis gar nicht.
Unter höherer Last wie zum Beispiel im Gaming-Betrieb wird der Lüfter mit 37,5 dB(A) bzw. bei Volllast bis zu 47 dB(A) deutlich lauter. Dadurch verursacht das ProBook dann mehr Lärm als die meisten anderen Business-Laptops - das ist eben die Kehrseite der leistungsfähigeren GeForce-MX-GPU.

| HP ProBook 450 G7 8WC04UT GeForce MX250, i7-10510U, Crucial P1 SSD CT1000P1SSD8 | HP ProBook 455 G7-175W8EA Vega 7, R7 4700U, Samsung PM991 MZVLQ512HALU | MSI Modern 15 A10RB GeForce MX250, i7-10510U, WDC PC SN730 SDBPNTY-512G | Dell Latitude 15 3590 UHD Graphics 620, i5-8250U, Samsung SSD PM871b MZ7LN256HAJQ | Lenovo ThinkPad L590-20Q70019GE UHD Graphics 620, i5-8265U, Toshiba XG6 KXG6AZNV512G | Dynabook Tecra X50-F UHD Graphics 620, i7-8665U, Samsung SSD PM981 MZVLB512HAJQ | |
|---|---|---|---|---|---|---|
| Geräuschentwicklung | -6% | -11% | -11% | 1% | -5% | |
| aus / Umgebung * (dB) | 26.2 | 30.7 -17% | 28.3 -8% | 30.6 -17% | 29 -11% | 30.2 -15% |
| Idle min * (dB) | 26.2 | 30.7 -17% | 32 -22% | 30.6 -17% | 29 -11% | 30.2 -15% |
| Idle avg * (dB) | 26.2 | 30.7 -17% | 32 -22% | 31.9 -22% | 29 -11% | 30.2 -15% |
| Idle max * (dB) | 26.2 | 30.7 -17% | 32 -22% | 31.9 -22% | 29 -11% | 30.2 -15% |
| Last avg * (dB) | 38.1 | 33.9 11% | 34.5 9% | 39 -2% | 29 24% | 33.4 12% |
| Witcher 3 ultra * (dB) | 37.5 | 39.5 -5% | ||||
| Last max * (dB) | 47 | 36.8 22% | 50.9 -8% | 39.1 17% | 33.8 28% | 39 17% |
* ... kleinere Werte sind besser
Lautstärkediagramm
| Idle |
| 26.2 / 26.2 / 26.2 dB(A) |
| Last |
| 38.1 / 47 dB(A) |
 | ||
30 dB leise 40 dB(A) deutlich hörbar 50 dB(A) störend |
||
min: | ||
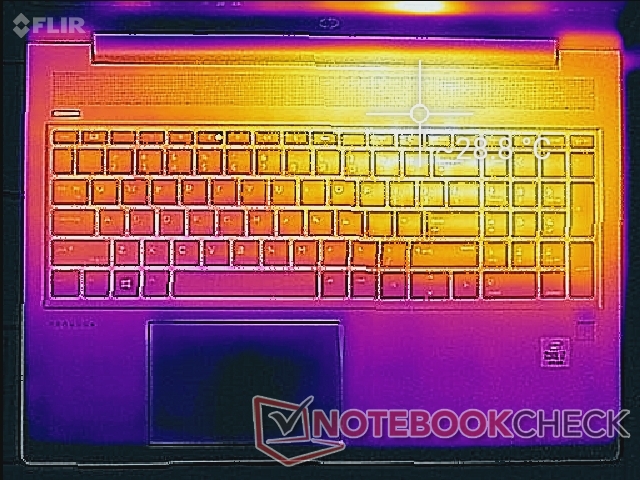
Temperatur
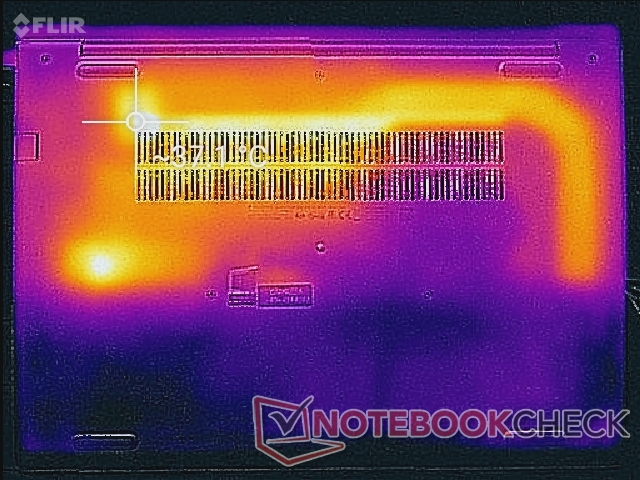
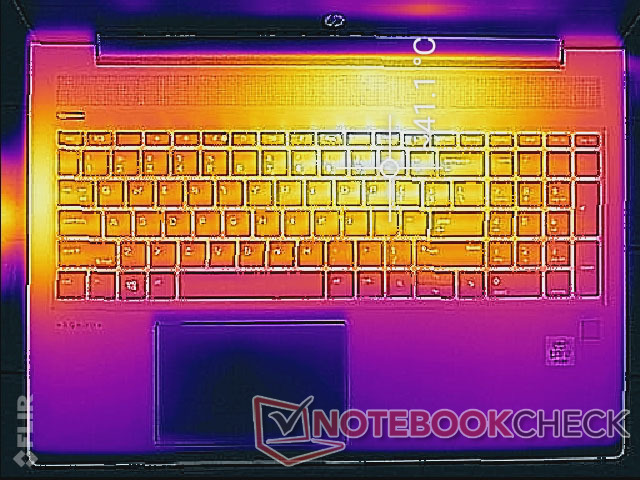
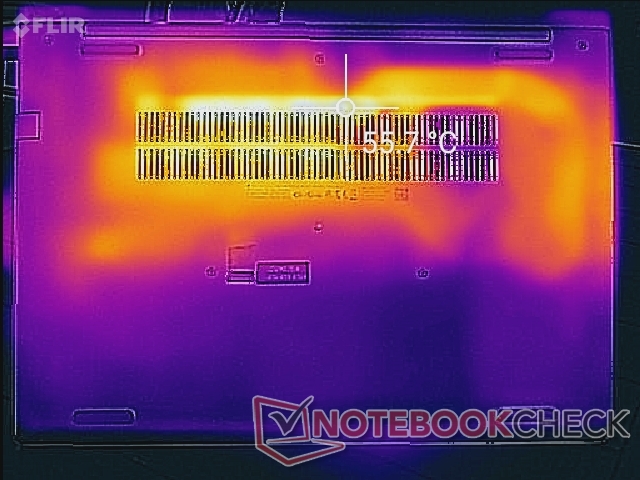
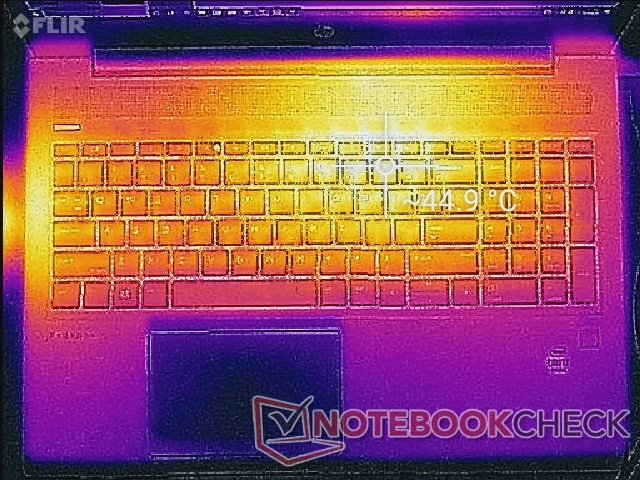
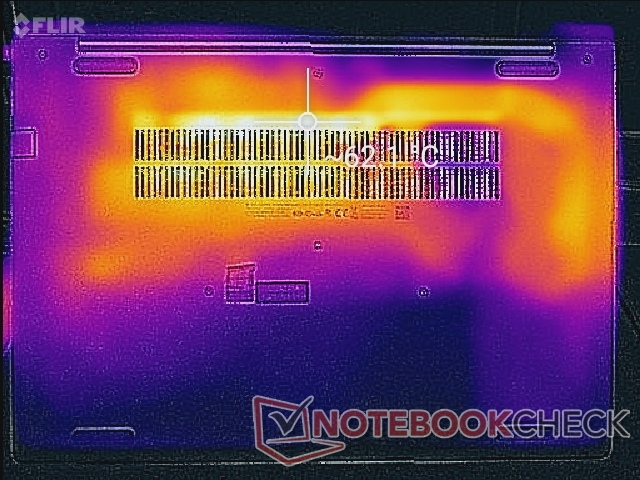
Wie unsere Wärmebilder unten zeigen, befinden sich die heißesten Stellen im hinteren Bereich des Laptops und in der Nähe des Prozessors und der zugehörigen Kupferheatpipe. Daher bleiben die Handballenauflagen und die meisten Tasten relativ kühl und die Bedienung angenehm. Trotzdem sind die wärmsten Stellen hier mit bis zu 44 °C und 62 °C auf der Ober- bzw. Unterseite unter Umständen sehr warm, während das Dell Latitude 3590 nur 41 °C erreicht.
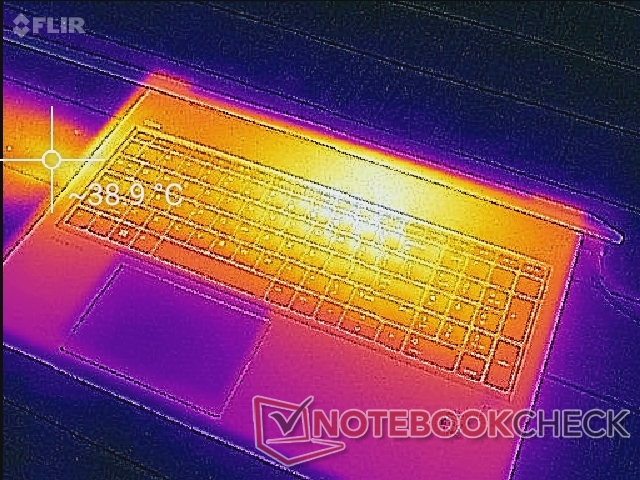
(±) Die maximale Temperatur auf der Oberseite ist 40 °C. Im Vergleich liegt der Klassendurchschnitt bei 34.3 °C (von 21.2 bis 62.5 °C für die Klasse Office).
(-) Auf der Unterseite messen wir eine maximalen Wert von 56.6 °C (im Vergleich zum Durchschnitt von 36.8 °C).
(+) Ohne Last messen wir eine durchschnittliche Temperatur von 26 °C auf der Oberseite. Der Klassendurchschnitt erreicht 29.5 °C.
(±) Beim längeren Spielen von The Witcher 3 erhitzt sich das Gerät durchschnittlich auf 35.2 °C. Der Durchschnitt der Klasse ist derzeit 29.5 °C.
(+) Die Handballen und der Touchpad-Bereich sind mit gemessenen 29.8 °C kühler als die typische Hauttemperatur und fühlen sich dadurch kühl an.
(-) Die durchschnittliche Handballen-Temperatur anderer getesteter Geräte war 27.5 °C (-2.3 °C).
Stresstest
Beim Ausführen von Prime95 steigt der CPU-Takt auf 3,1 GHz, fällt nach 20 Sekunden ab und stabilisiert sich schließlich bei 2,2 GHz; die CPU-Temperatur liegt dann bei 63 °C. Die verhältnismäßig niedrigen stabilen Taktfrequenzen relativ zu anderen Laptops mit der gleichen CPU erklären die unerwartet niedrigen Cinebench-Punktzahlen. Unter den gleichen Bedingungen stabilisiert sich das Lenovo ThinkPad T490, das mit dem Core i7-10510U ausgestattet ist, beispielsweise bei 2,9 bis 3,0 GHz. Unter hoher Last wie zum Beispiel im Gaming-Betrieb pendeln sich CPU und GPU bei 84 °C bzw. 79 °C ein, beim Ryzen-basierten ProBook 455 G7 waren es jeweils ~67 °C.
Im Akkumodus ist die Leistung nicht eingeschränkt. Ein Fire-Strike-Durchlauf liefert im Akkumodus Physik- und Grafikpunktzahlen von 5.647 bzw. 3.750 Punkten, während im Netzbetrieb 5.667 bzw. 3.447 Punkte erreicht werden.
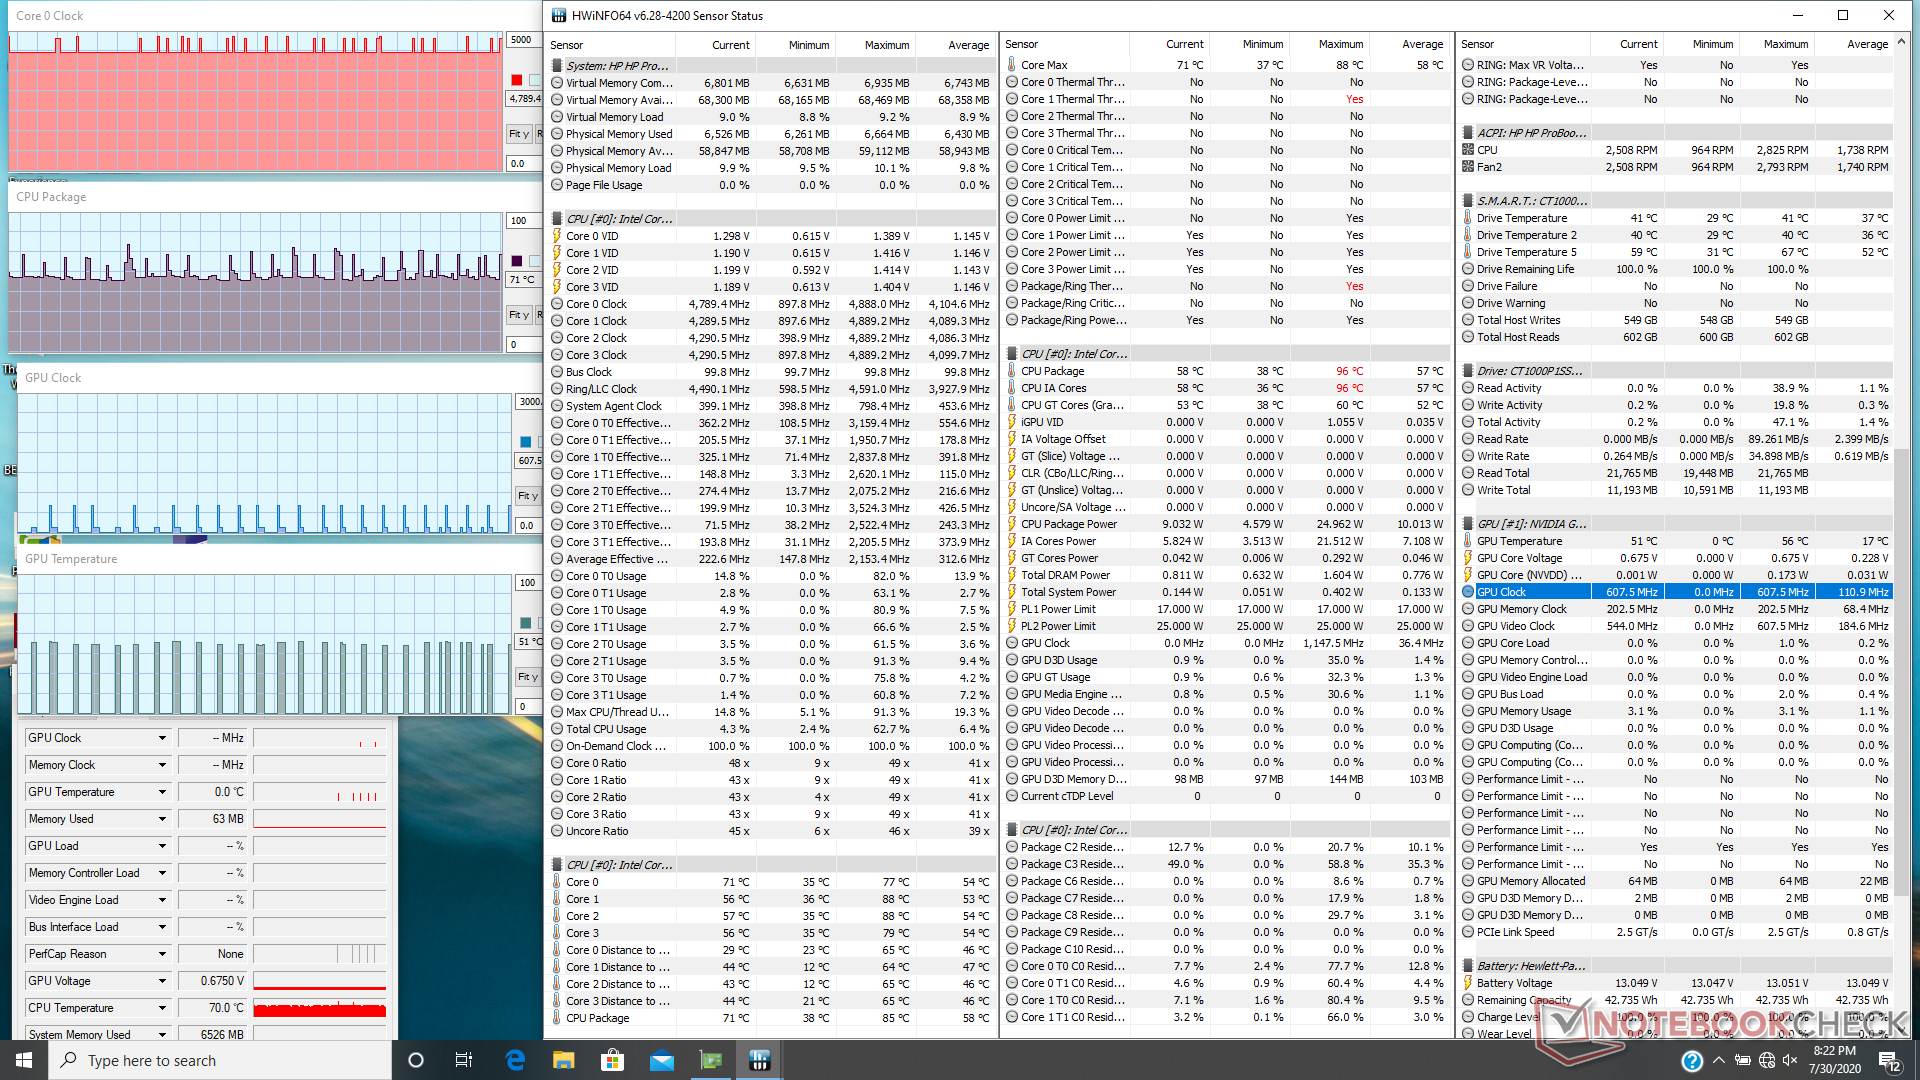
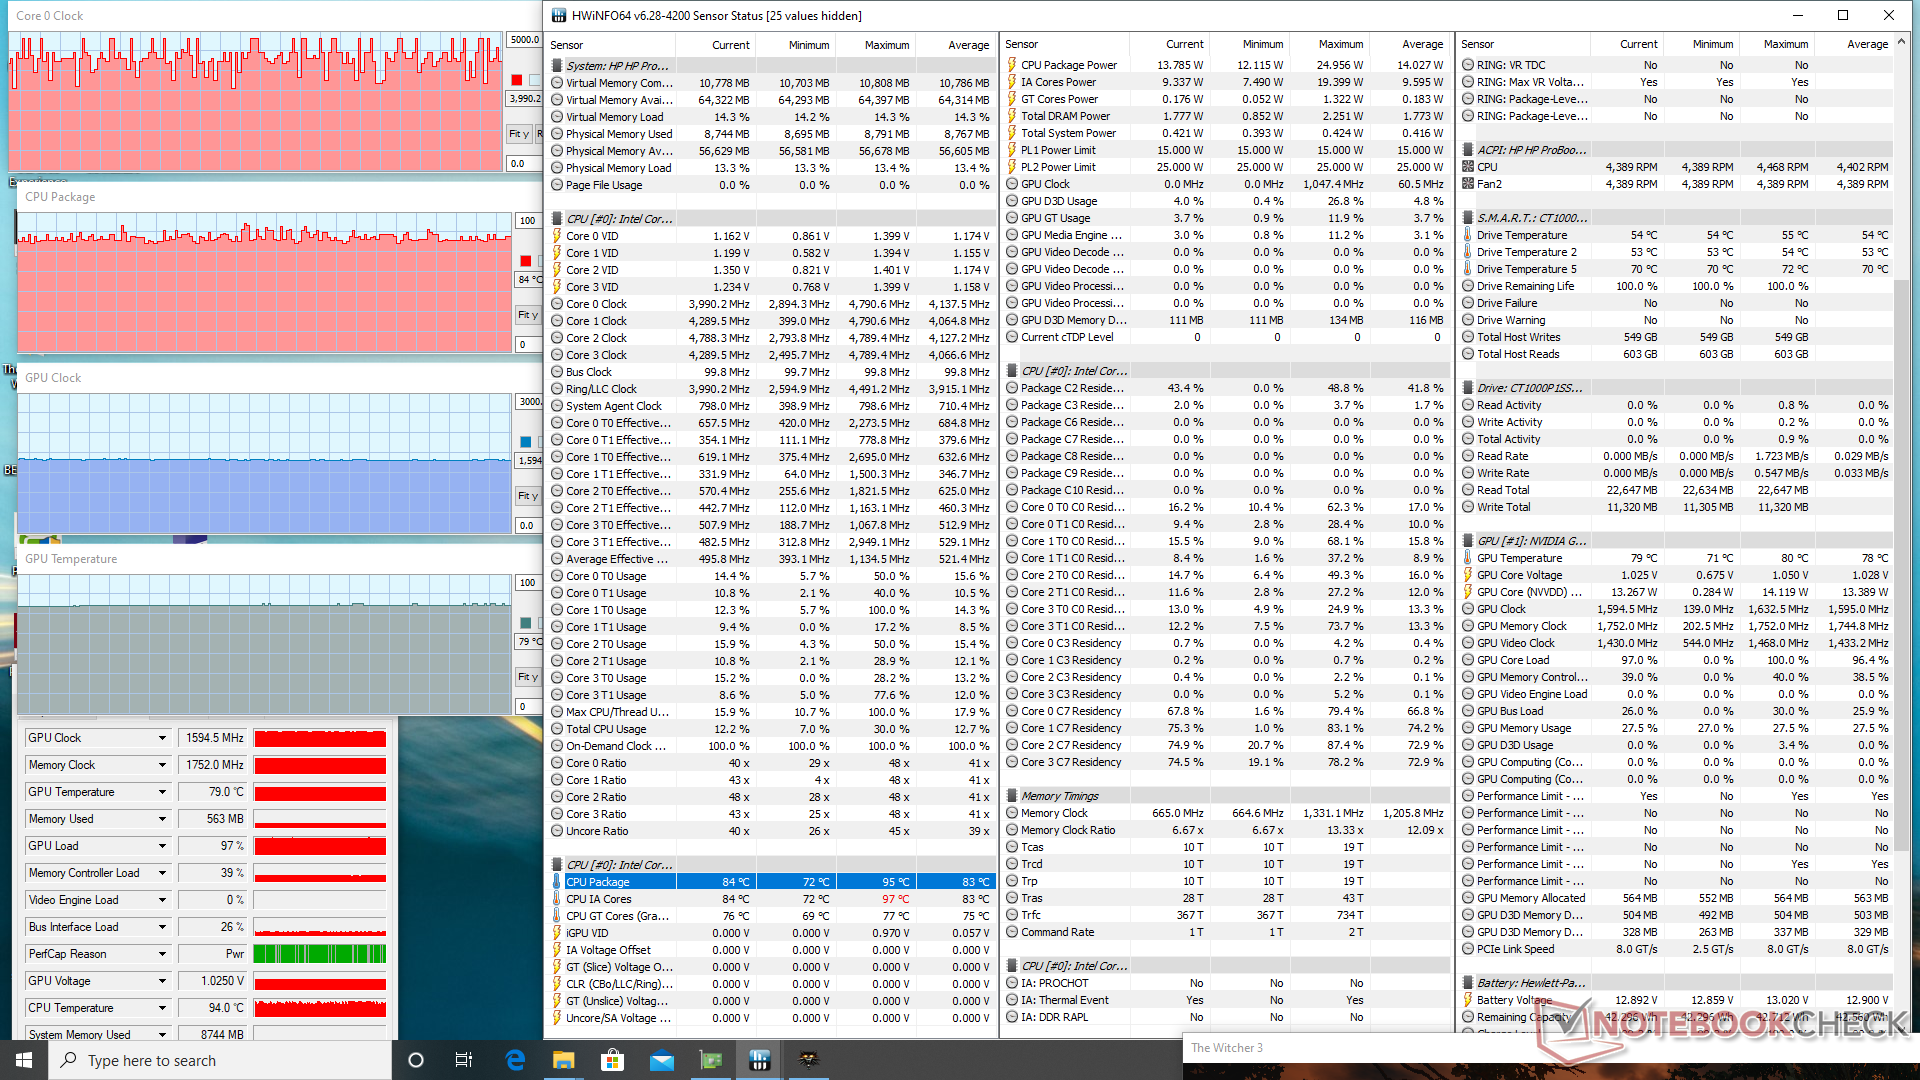
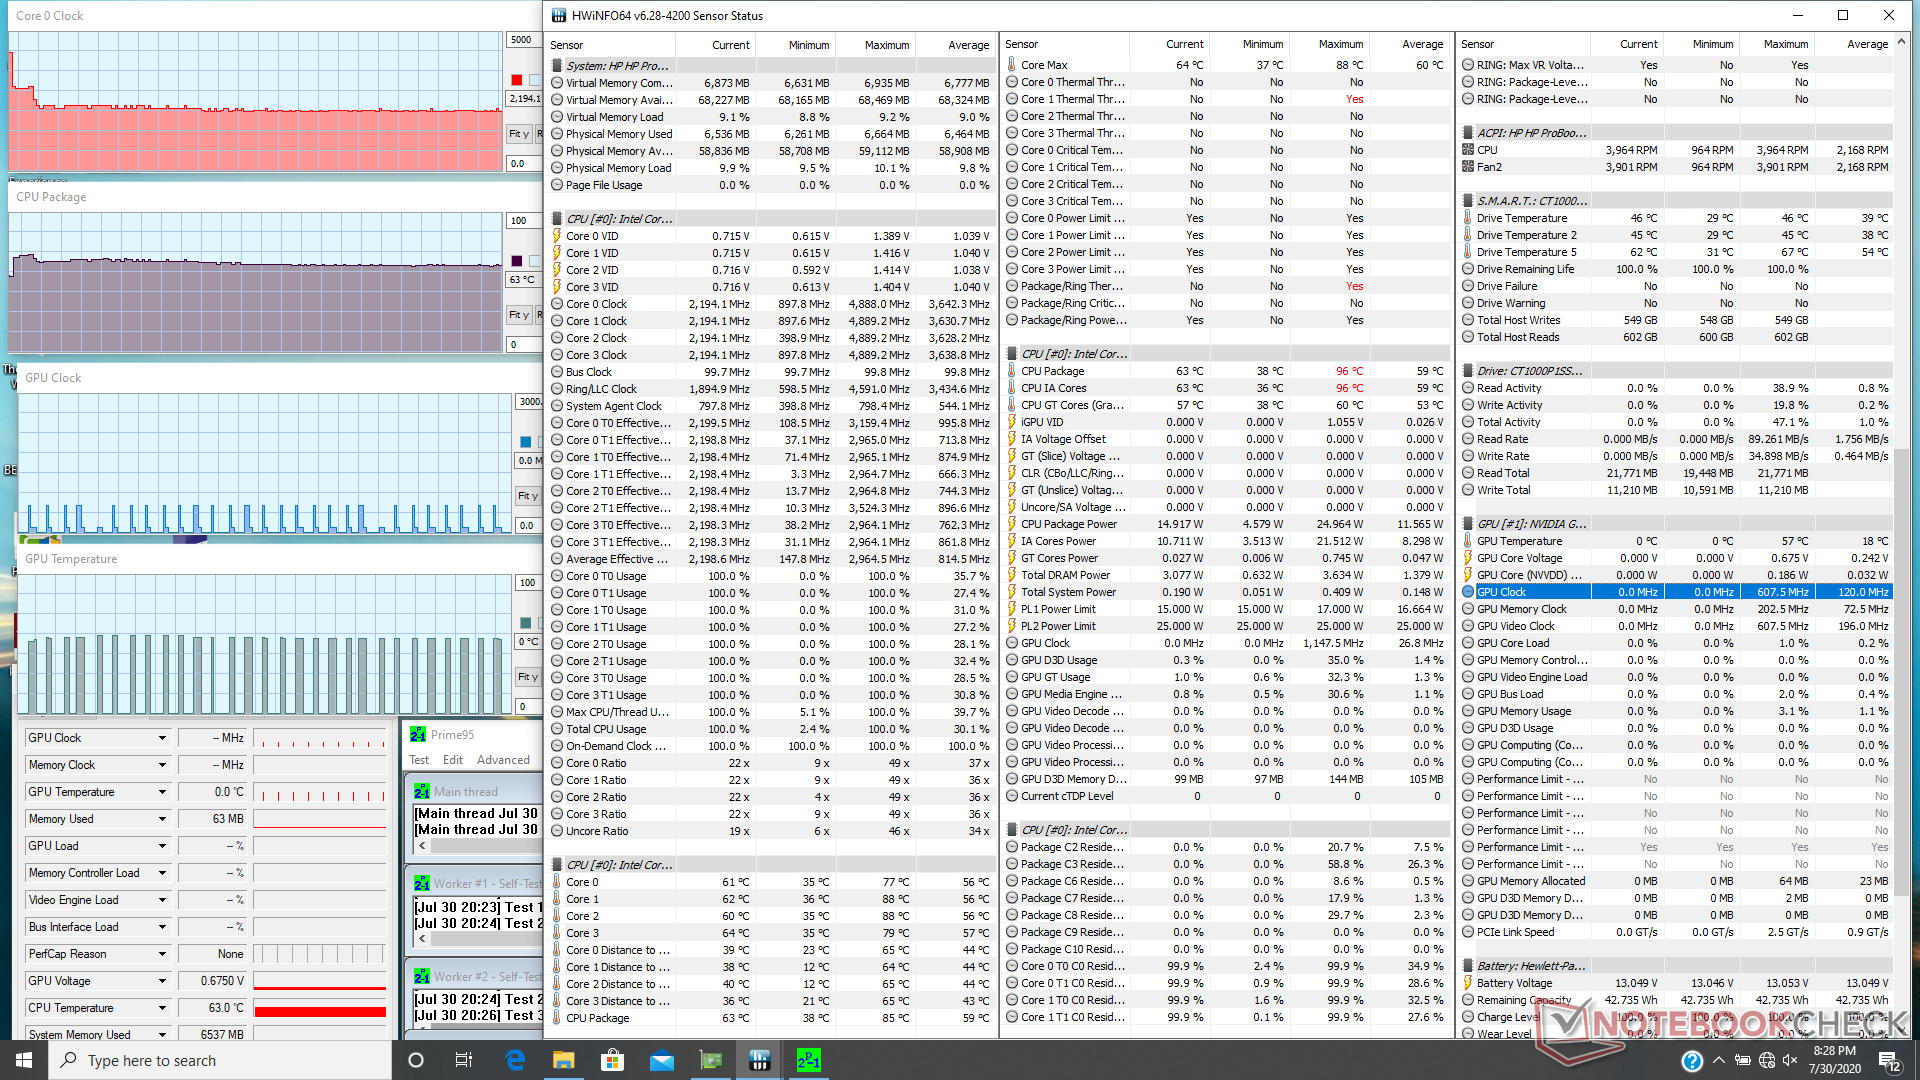
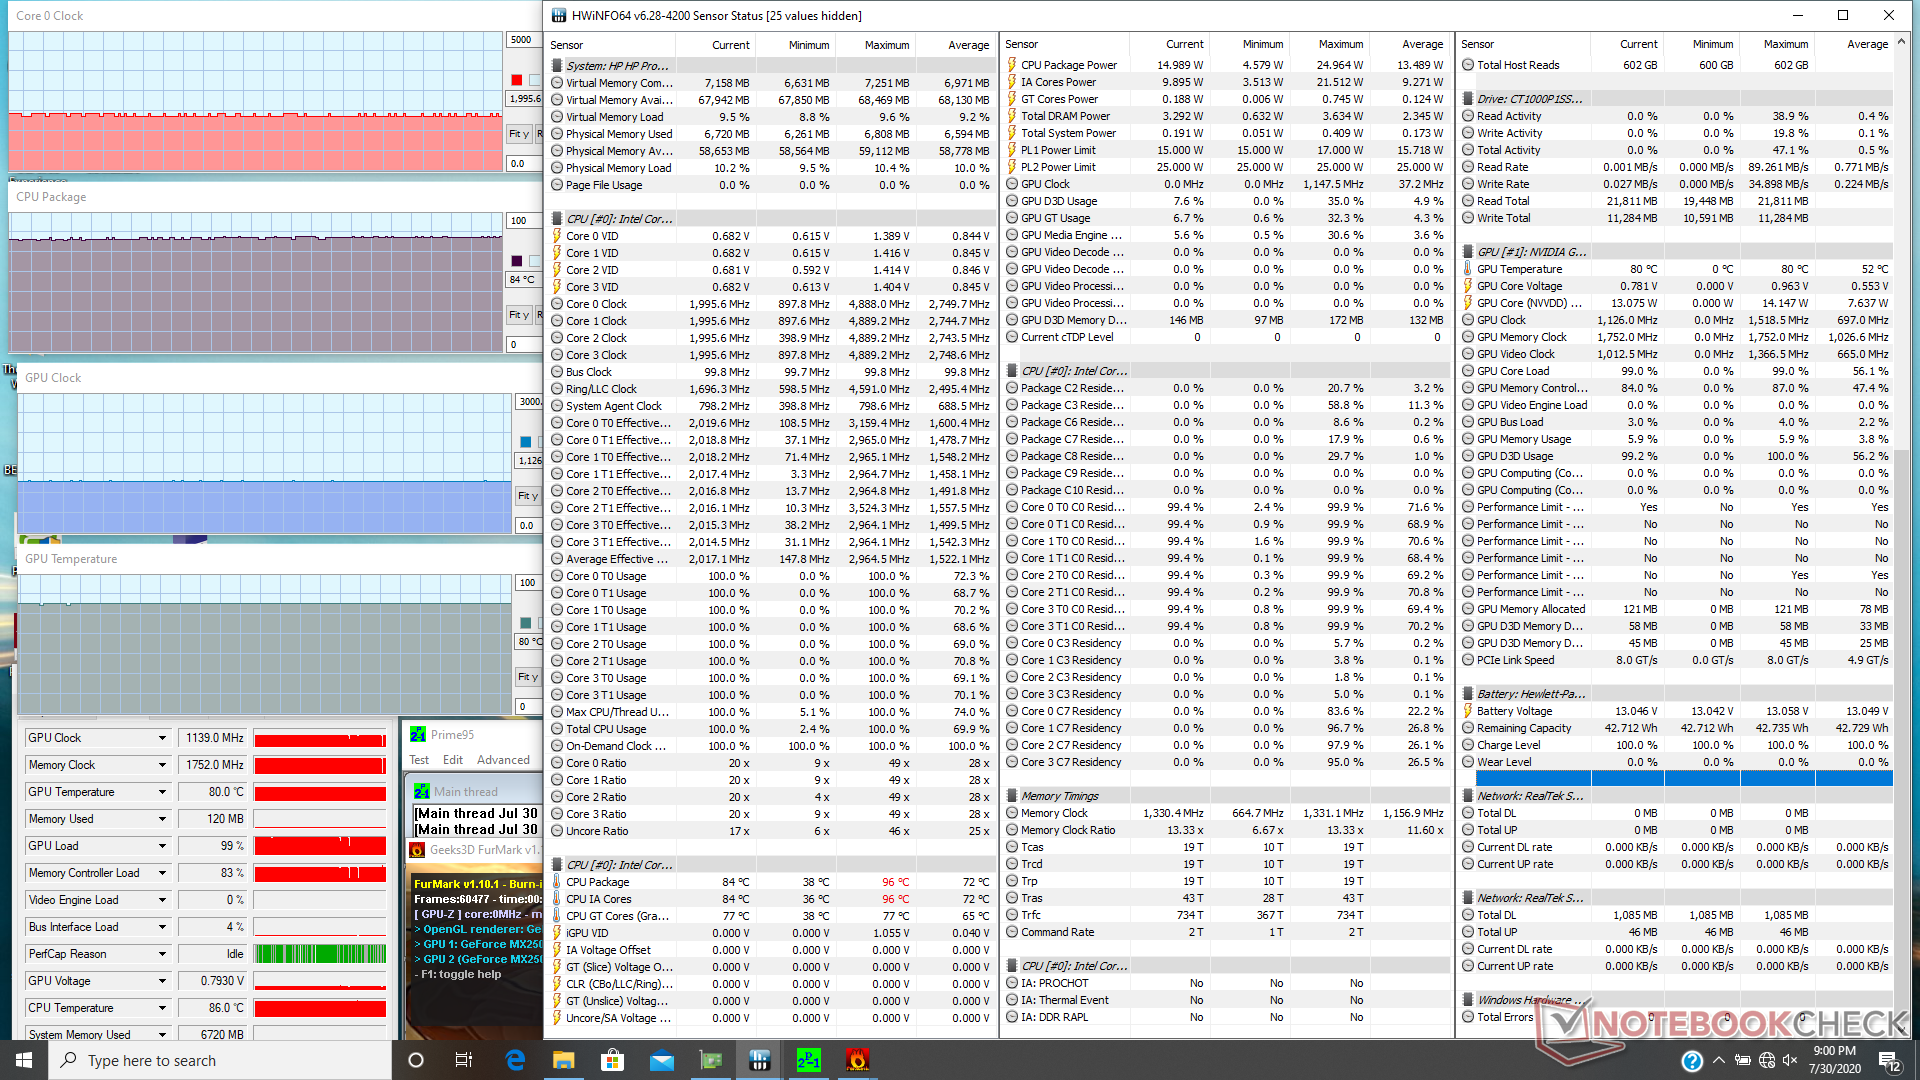
| CPU Clock (GHz) | GPU Clock (MHz) | Average CPU Temperature (°C) | Average GPU Temperature (°C) | |
| System Idle | -- | -- | 57 | 51 |
| Prime95 Stress | 2.2 | -- | 63 | 57 |
| Prime95 + FurMark Stress | 2.0 - 2.1 | 1139 | 84 | 80 |
| Witcher 3 Stress | ~4.0 | 1595 | 84 | 79 |
Lautsprecher


HP ProBook 450 G7 8WC04UT Audio Analyse
(±) | Mittelmäßig laut spielende Lautsprecher (81.8 dB)
Bass 100 - 315 Hz
(-) | kaum Bass - 18.4% niedriger als der Median
(±) | durchschnittlich lineare Bass-Wiedergabe (12.2% Delta zum Vorgänger)
Mitteltöne 400 - 2000 Hz
(+) | ausgeglichene Mitten, vom Median nur 2.9% abweichend
(+) | lineare Mitten (5.4% Delta zum Vorgänger)
Hochtöne 2 - 16 kHz
(+) | ausgeglichene Hochtöne, vom Median nur 2.8% abweichend
(+) | sehr lineare Hochtöne (5.4% Delta zum Vorgänger)
Gesamt im hörbaren Bereich 100 - 16.000 Hz
(+) | hörbarer Bereich ist sehr linear (14.5% Abstand zum Median
Im Vergleich zu allen Geräten derselben Klasse
» 12% aller getesteten Geräte dieser Klasse waren besser, 3% vergleichbar, 85% schlechter
» Das beste Gerät hat einen Delta-Wert von 7%, durchschnittlich ist 21%, das schlechteste Gerät hat 53%
Im Vergleich zu allen Geräten im Test
» 18% aller getesteten Geräte waren besser, 4% vergleichbar, 78% schlechter
» Das beste Gerät hat einen Delta-Wert von 4%, durchschnittlich ist 24%, das schlechteste Gerät hat 134%
Apple MacBook 12 (Early 2016) 1.1 GHz Audio Analyse
(+) | Die Lautsprecher können relativ laut spielen (83.6 dB)
Bass 100 - 315 Hz
(±) | abgesenkter Bass - 11.3% geringer als der Median
(±) | durchschnittlich lineare Bass-Wiedergabe (14.2% Delta zum Vorgänger)
Mitteltöne 400 - 2000 Hz
(+) | ausgeglichene Mitten, vom Median nur 2.4% abweichend
(+) | lineare Mitten (5.5% Delta zum Vorgänger)
Hochtöne 2 - 16 kHz
(+) | ausgeglichene Hochtöne, vom Median nur 2% abweichend
(+) | sehr lineare Hochtöne (4.5% Delta zum Vorgänger)
Gesamt im hörbaren Bereich 100 - 16.000 Hz
(+) | hörbarer Bereich ist sehr linear (10.2% Abstand zum Median
Im Vergleich zu allen Geräten derselben Klasse
» 7% aller getesteten Geräte dieser Klasse waren besser, 2% vergleichbar, 91% schlechter
» Das beste Gerät hat einen Delta-Wert von 5%, durchschnittlich ist 18%, das schlechteste Gerät hat 53%
Im Vergleich zu allen Geräten im Test
» 5% aller getesteten Geräte waren besser, 1% vergleichbar, 94% schlechter
» Das beste Gerät hat einen Delta-Wert von 4%, durchschnittlich ist 24%, das schlechteste Gerät hat 134%
Energiemanagement
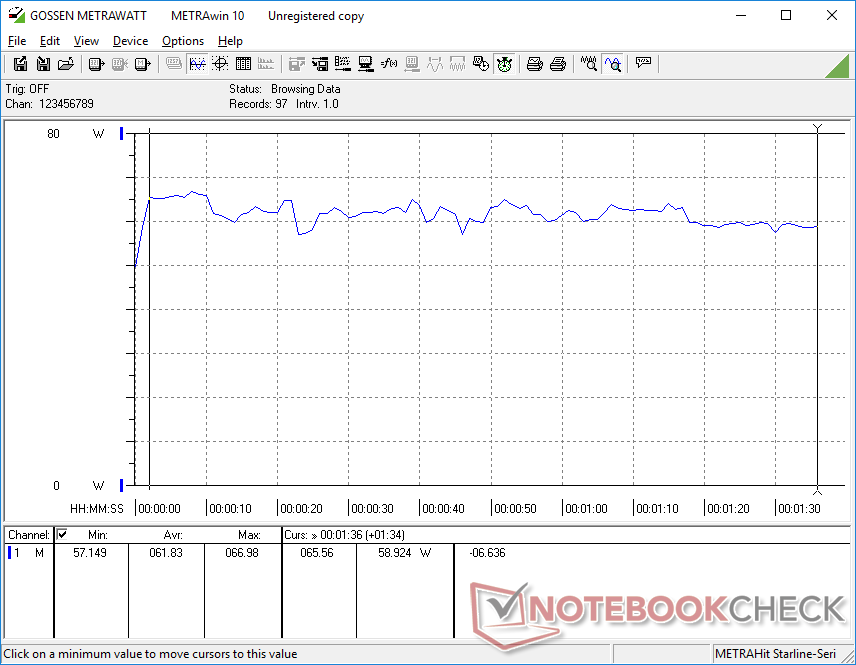
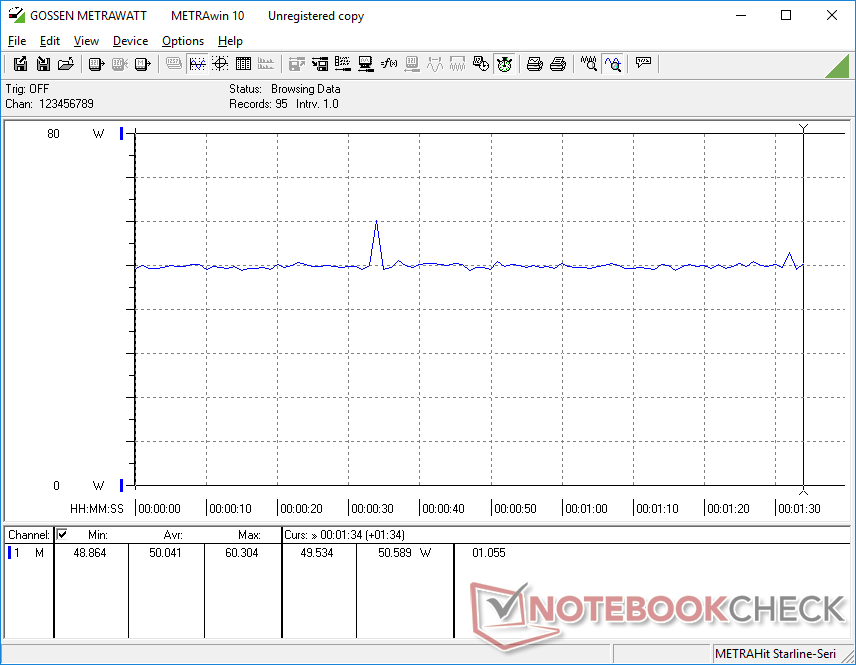
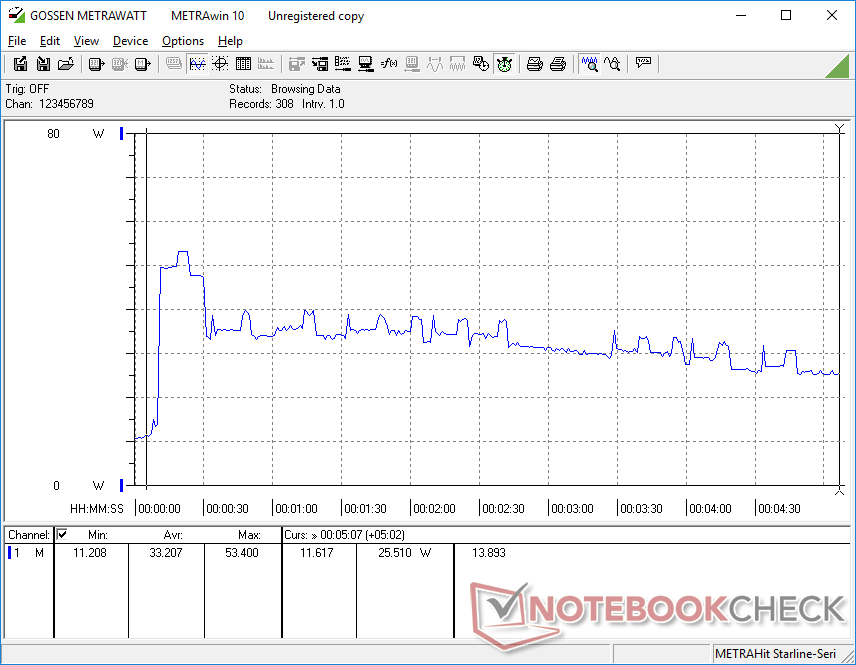
Energieaufnahme
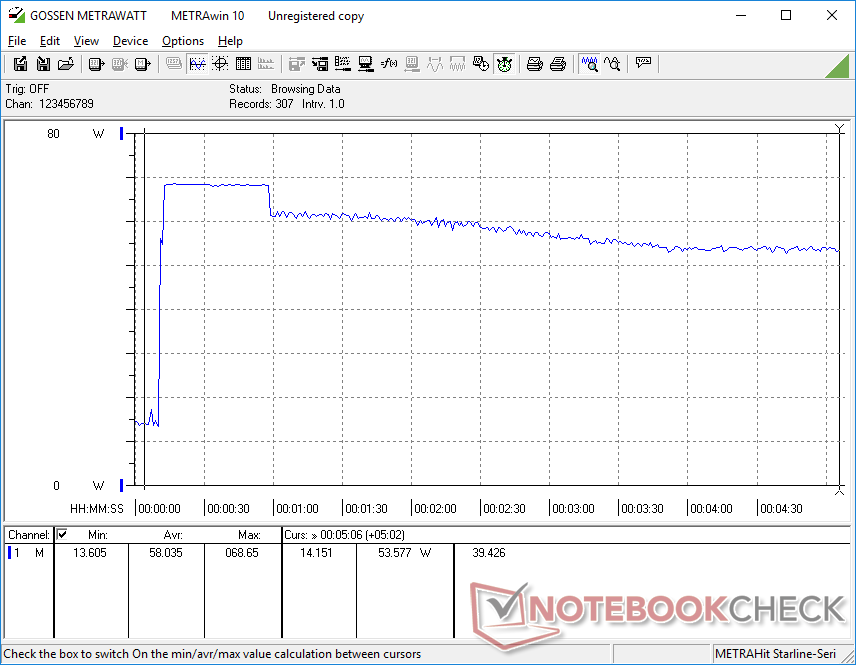
Unter hoher Last ist der Stromverbrauch des ProBook 450 G7 durch die dedizierte GeForce MX250 um ca. 50 bis 90 % höher als beim ProBook 455 G7. Die gegenüber dem Ryzen-7-Modell höhere Grafikleistung unserer Intel-Konfiguration geht also auf Kosten des Verbrauchs. Davon abgesehen ist der Verbrauch der beiden Laptops im Leerlauf auf dem Desktop und bei niedriger Systemlast nahezu identisch.
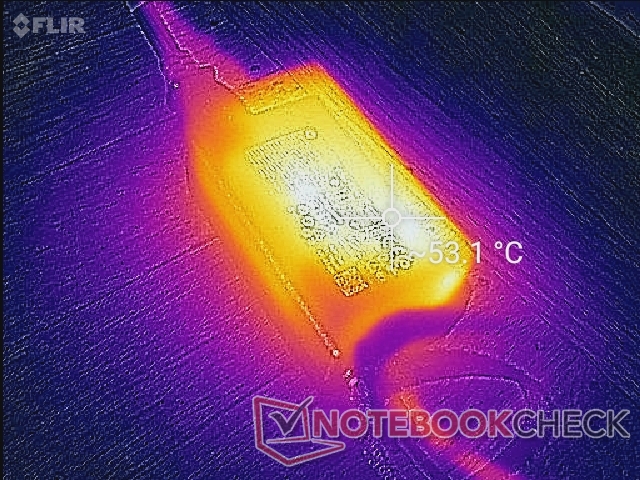
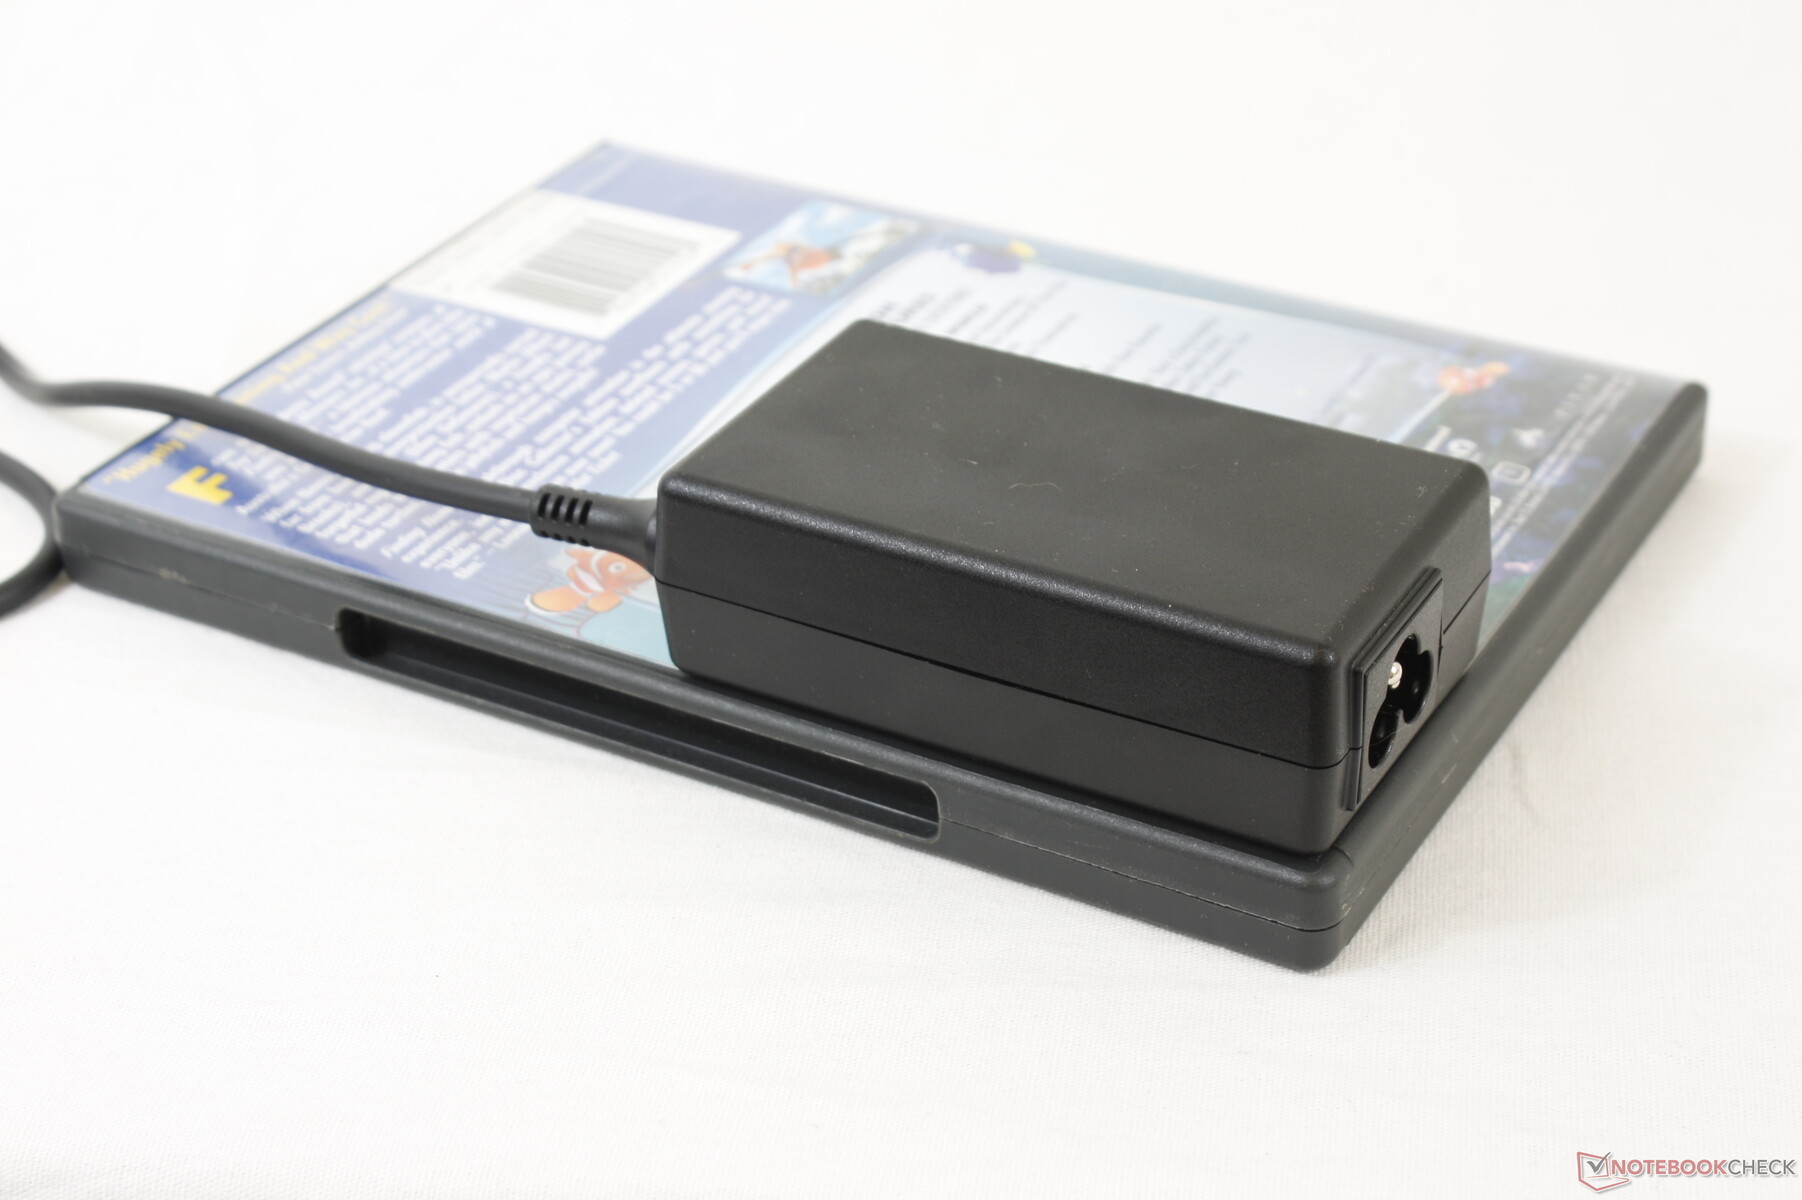
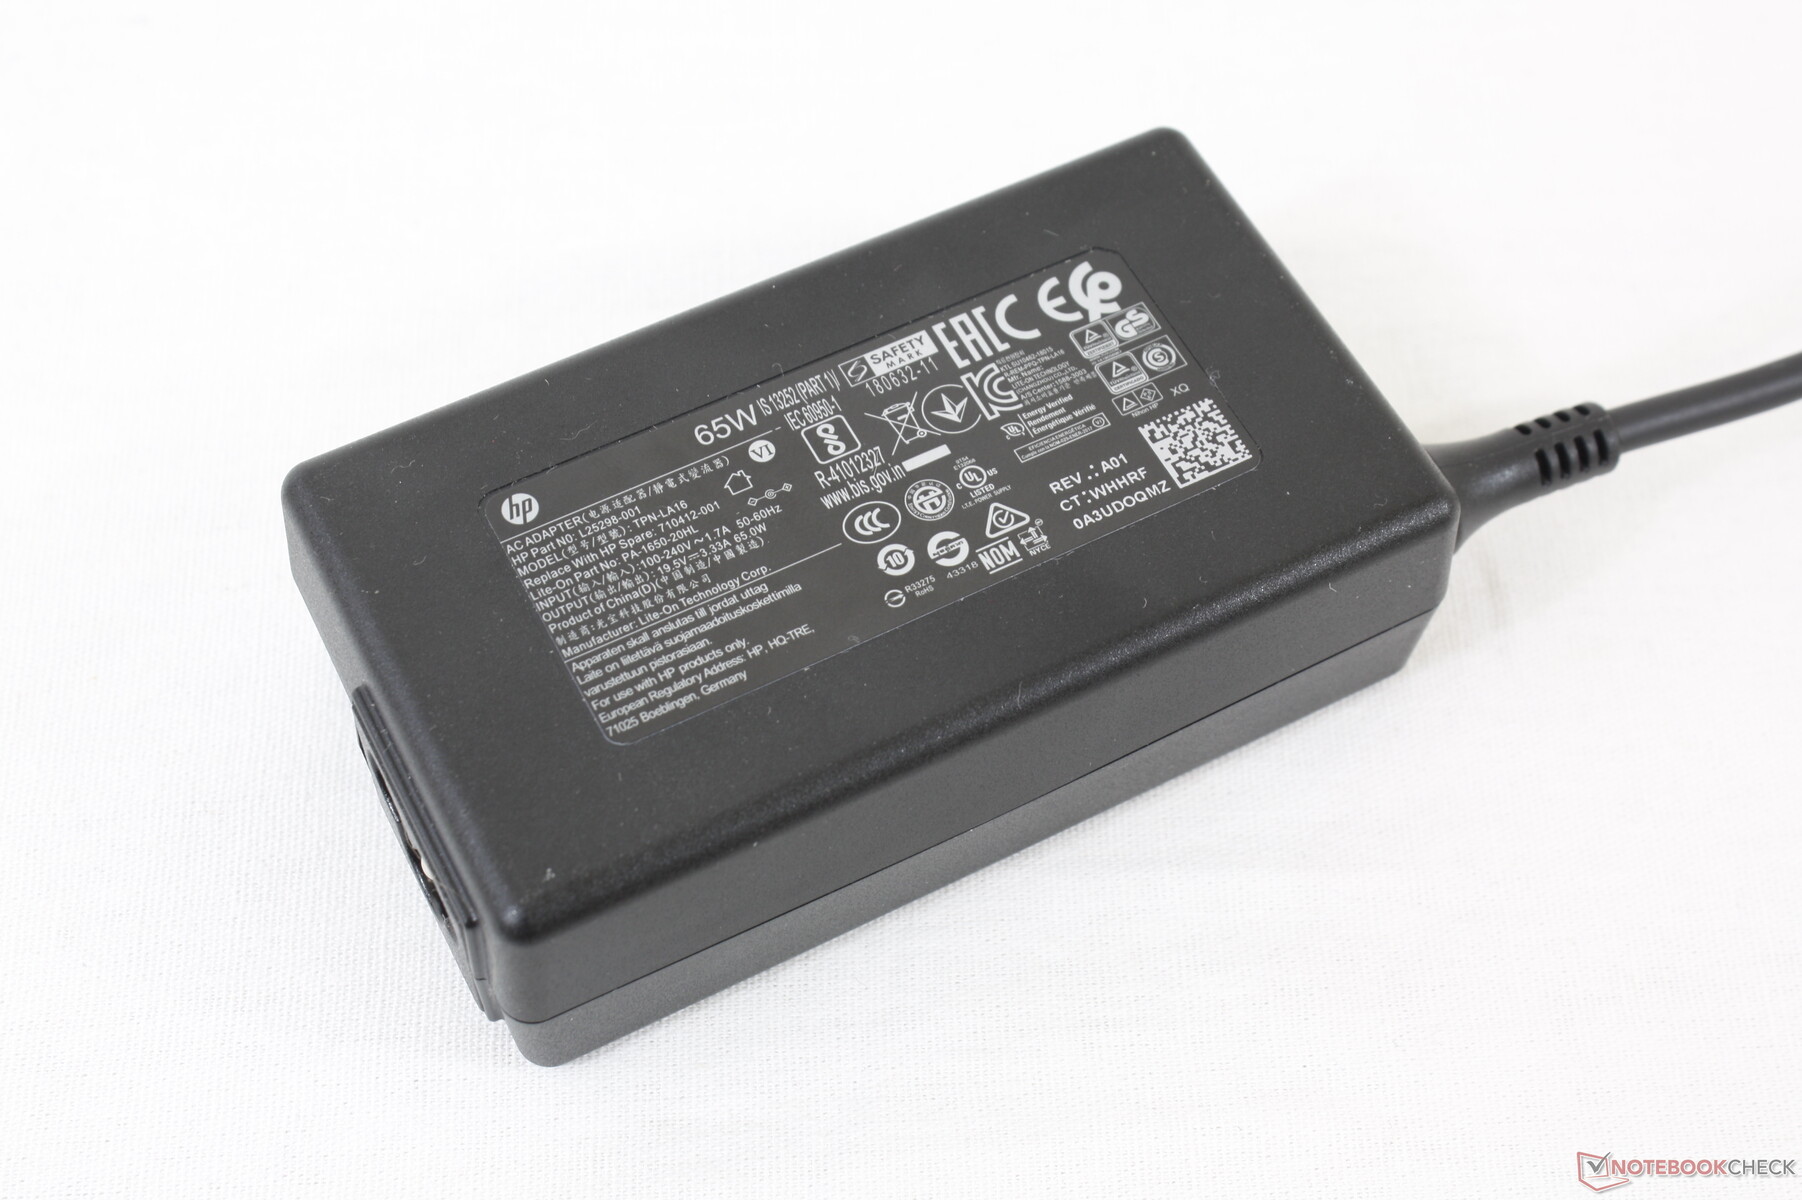
Der maximale Verbrauch, der dem kleinen (~9 x 5 x 2,8 cm) 65-W-Netzteil während der gleichzeitigen Ausführung von Prime95 und FurMark abverlangt wird, liegt bei 69 W. Dabei handelt es sich um einen temporären Spitzenverbrauch, wie die Diagramme unten zeigen.
| Aus / Standby | |
| Idle | |
| Last |
|
Legende:
min: | |
| HP ProBook 450 G7 8WC04UT i7-10510U, GeForce MX250, Crucial P1 SSD CT1000P1SSD8, IPS, 1920x1080, 15.6" | HP ProBook 455 G7-175W8EA R7 4700U, Vega 7, Samsung PM991 MZVLQ512HALU, IPS, 1920x1080, 15.6" | MSI Modern 15 A10RB i7-10510U, GeForce MX250, WDC PC SN730 SDBPNTY-512G, IPS, 1920x1080, 15.6" | Dell Latitude 15 3590 i5-8250U, UHD Graphics 620, Samsung SSD PM871b MZ7LN256HAJQ, TN LED, 1920x1080, 15.6" | Lenovo ThinkPad L590-20Q70019GE i5-8265U, UHD Graphics 620, Toshiba XG6 KXG6AZNV512G, IPS, 1920x1080, 15.6" | Dynabook Tecra X50-F i7-8665U, UHD Graphics 620, Samsung SSD PM981 MZVLB512HAJQ, IPS, 1920x1080, 15.6" | |
|---|---|---|---|---|---|---|
| Stromverbrauch | 25% | -32% | 29% | 27% | 28% | |
| Idle min * (Watt) | 4.8 | 3.8 21% | 6.6 -38% | 4.3 10% | 3.96 17% | 3.9 19% |
| Idle avg * (Watt) | 9.5 | 7.7 19% | 9.9 -4% | 7.2 24% | 6.9 27% | 7 26% |
| Idle max * (Watt) | 10.7 | 10.5 2% | 14.7 -37% | 9.8 8% | 9.8 8% | 7.3 32% |
| Last avg * (Watt) | 61.8 | 32 48% | 82.9 -34% | 38 39% | 31.4 49% | 32.7 47% |
| Witcher 3 ultra * (Watt) | 50 | 59.4 -19% | ||||
| Last max * (Watt) | 69 | 45.4 34% | 109.3 -58% | 24 65% | 45.4 34% | 57.8 16% |
* ... kleinere Werte sind besser
Akkulaufzeit
Mit rund 7 Stunden praxisnaher WLAN-Nutzung entspricht die Laufzeit unseres Testgeräts in etwa der des Ryzen-basierten ProBook 455 G7. Den leeren Akku vollständig aufzuladen dauert ungefähr 1,5 Stunden. Der Laptop kann alternativ über USB-C geladen werden.
| HP ProBook 450 G7 8WC04UT i7-10510U, GeForce MX250, 45 Wh | HP ProBook 455 G7-175W8EA R7 4700U, Vega 7, 45 Wh | MSI Modern 15 A10RB i7-10510U, GeForce MX250, 52 Wh | Dell Latitude 15 3590 i5-8250U, UHD Graphics 620, 56 Wh | Lenovo ThinkPad L590-20Q70019GE i5-8265U, UHD Graphics 620, 45 Wh | Dynabook Tecra X50-F i7-8665U, UHD Graphics 620, 48 Wh | |
|---|---|---|---|---|---|---|
| Akkulaufzeit | -6% | -7% | 24% | 19% | -37% | |
| Idle (h) | 14.8 | 12.6 -15% | 15.4 4% | 20.2 36% | 17.4 18% | 5.8 -61% |
| WLAN (h) | 7.2 | 7.6 6% | 6.5 -10% | 9.1 26% | 7.2 0% | 4.6 -36% |
| Last (h) | 2 | 1.8 -10% | 1.7 -15% | 2.2 10% | 2.8 40% | 1.7 -15% |
Pro
Contra
Fazit

Auf HP.com ist das ProBook 450 G7 ohne GeForce-GPU, mit Core-i7-CPU, 1080p-Display, 8 GB RAM und einer 500-GB-HDD für ca. 1.200 US-Dollar (~1.020 Euro) erhältlich. Mit der gleichen Ausstattung kostet die Ryzen-7-Variante hingegen nur ungefähr 800 US-Dollar (~680 Euro). Diese Preise können sich selbstverständlich in Zukunft ändern, ihre Botschaft ist aber dennoch deutlich: Das Ryzen-basierte ProBook 455 G7 ist sowohl schneller als auch günstiger, wodurch es nicht zuletzt in Sachen Preis-Leistung eine deutlich bessere Wahl ist.
Gibt es überhaupt noch einen Grund, der für das Intel-basierte ProBook G7 spricht? Da dedizierte Nvidia-GeForce-Grafikkarten, die der integrierten AMD-Lösung leistungstechnisch überlegen sind, Intel-Modellen vorbehalten sind, muss man bei entsprechenden Bedürfnissen gegebenenfalls doch zum ProBook 450 G7 greifen. Außerdem ist das ProBook 450 G7 bei CUKUSA zum Beispiel derzeit im Angebot, wodurch es durchaus ebenfalls eine attraktive Option sein kann. Davon abgesehen wird es Intel allerdings zumindest in der nahen Zukunft schwer haben, AMDs Ryzen-Alternativen das Wasser zu reichen.
Das HP ProBook 450 G7 bietet für einen günstigen Business-Laptop viele Funktionsmerkmale wie zum Beispiel die dedizierte GeForce-MX-GPU. Sollte diese jedoch nicht benötigt werden, so ist das ProBook 455 G7 in fast jeder Hinsicht die bessere Wahl.
HP ProBook 450 G7 8WC04UT
- 02.08.2020 v7 (old)
Allen Ngo
Preisvergleich

