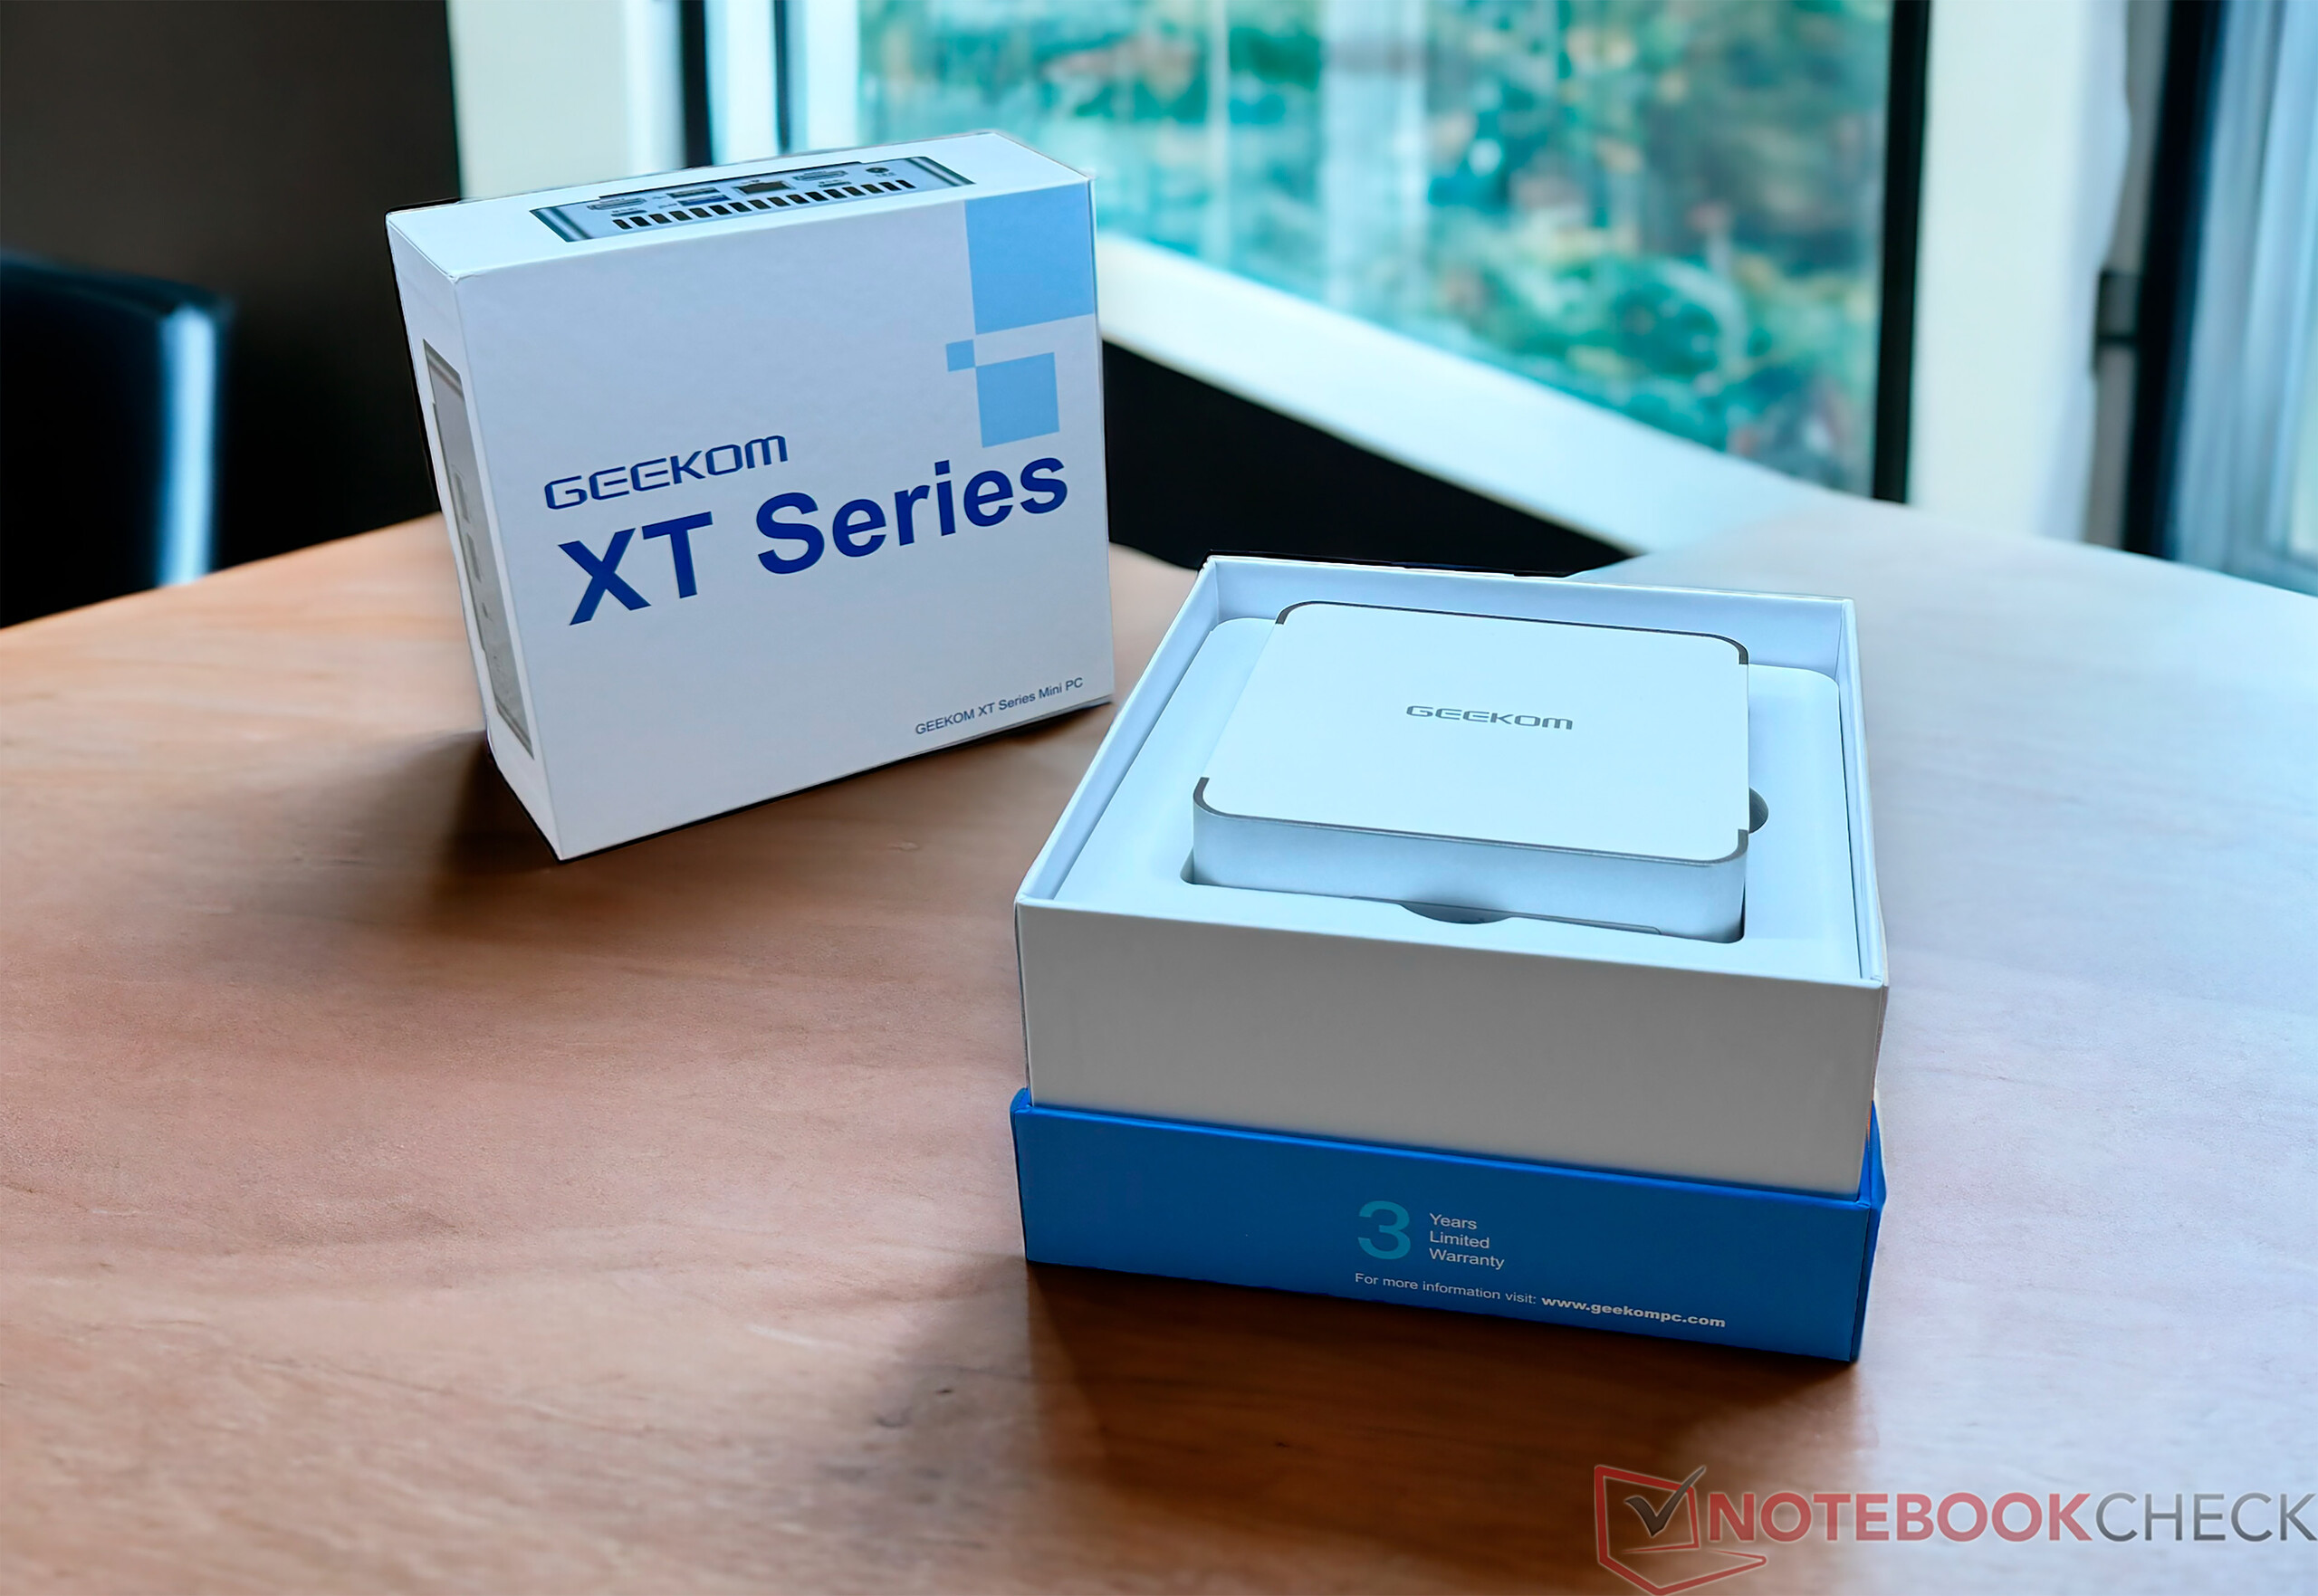
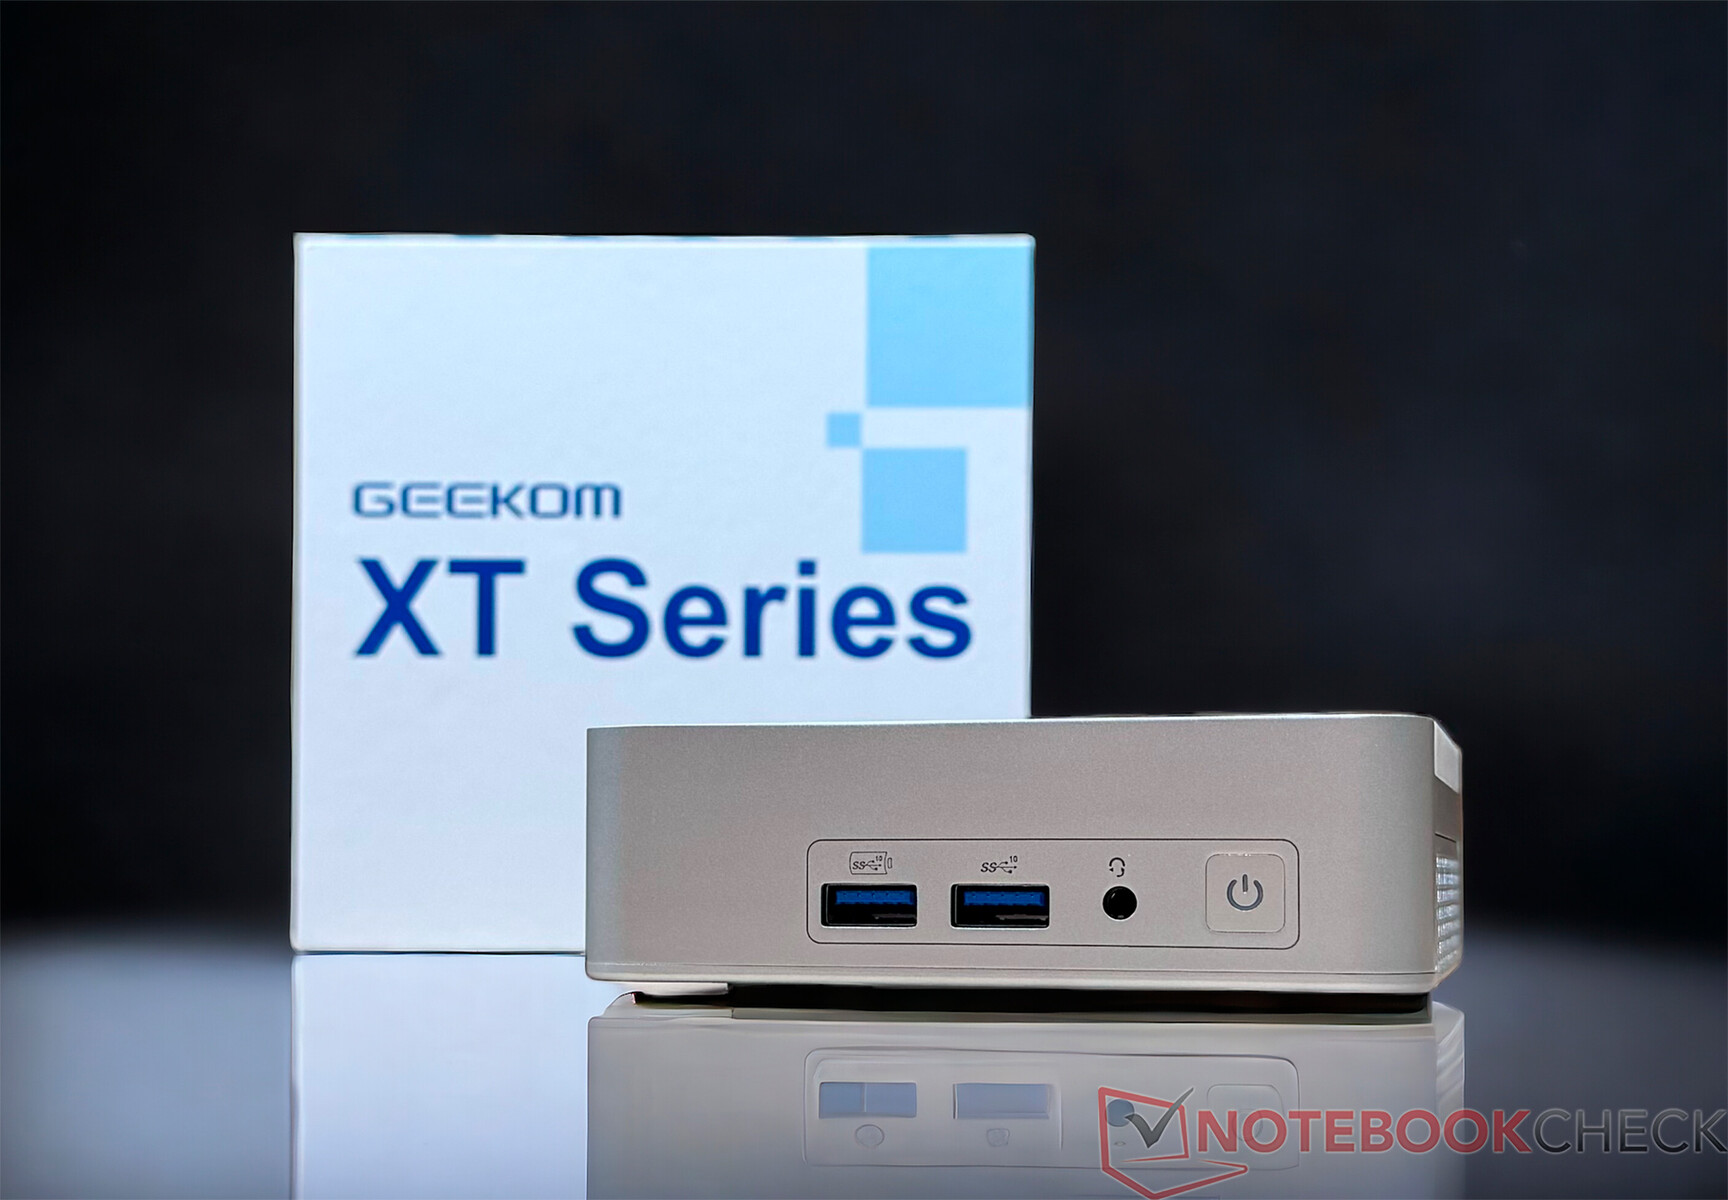
Geekom XT12 Pro im Test: Schicke NUC-Mini-PC-Alternative mit Intel Core i9-12900H, 32 GB DDR4-RAM und 1-TB-SSD
Als Geekom XT12 Pro soll der Mini-PC mit einer hervorragenden Leistung und einer guten Effizienz punkten. Dabei verbaut Geekom allerdings nur einen Intel Core i9-12900H. Das SoC gehört jedoch zur Alder-Lake-H-Serie und wurde bereits vor zwei Jahren vorgestellt. Wie sich der Prozessor im aktuellen Duell schlägt, dazu später mehr. Immerhin verbaut Geekom hier das Topmodell, wenngleich aktuell auch keine anderen Konfigurationen angeboten werden. Mit 32 GB RAM und einer 1-TB-SSD kann man das Gerät aktuell für 749 Euro bekommen. Hier ist bereits ein Rabatt eingerechnet, denn die UVP des Herstellers ist mit 899 Euro angegeben. Ob diese Preisgestaltung gerechtfertigt ist, ist eine berechtigte Frage, die wir beleuchten, nachdem wir uns einmal die Leistung im Vergleich zu den Kontrahenten angeschaut haben. Aufgrund des Preises legt sich der Hersteller die Messlatte aber schon selbst sehr hoch.
mögliche Konkurrenten im Vergleich
Bew. | Datum | Modell | Memory | Gewicht | Dicke |
|---|---|---|---|---|---|
| 84.1 % | 04 / 2024 | Geekom XT12 Pro i9-12900H, Iris Xe G7 96EUs | 32768 MB | 545 g | 37 mm |
| 87.3 % v7 (old) | 11 / 2023 | Minisforum EliteMini UM780 XTX R7 7840HS, Radeon 780M | 32768 MB | 750 g | 52.3 mm |
| 85.1 % v7 (old) | 01 / 2023 | Minisforum Neptune Series NAD9 i9-12900H, Iris Xe G7 96EUs | 16384 MB | 1.2 kg | 66 mm |
| 83.4 % v7 (old) | 04 / 2024 | Acemagic F2A Ultra 7 155H, Arc 8-Core | 32768 MB | 768 g | 57 mm |
| 83.1 % v7 (old) | 08 / 2023 | Intel NUC 13 Pro Desk Edition Kit i7-1360P, Iris Xe G7 96EUs | 32768 MB | 558 g | 37 mm |
| 82.6 % v7 (old) | 02 / 2024 | Geekom A7 R9 7940HS, Radeon 780M | 32768 MB | 417 g | 38 mm |
| 78.8 % v7 (old) | 08 / 2023 | Khadas Mind i7-1360P, Iris Xe G7 96EUs | 32768 MB | 438 g | 20 mm |
Geekom XT12 Pro im Detail

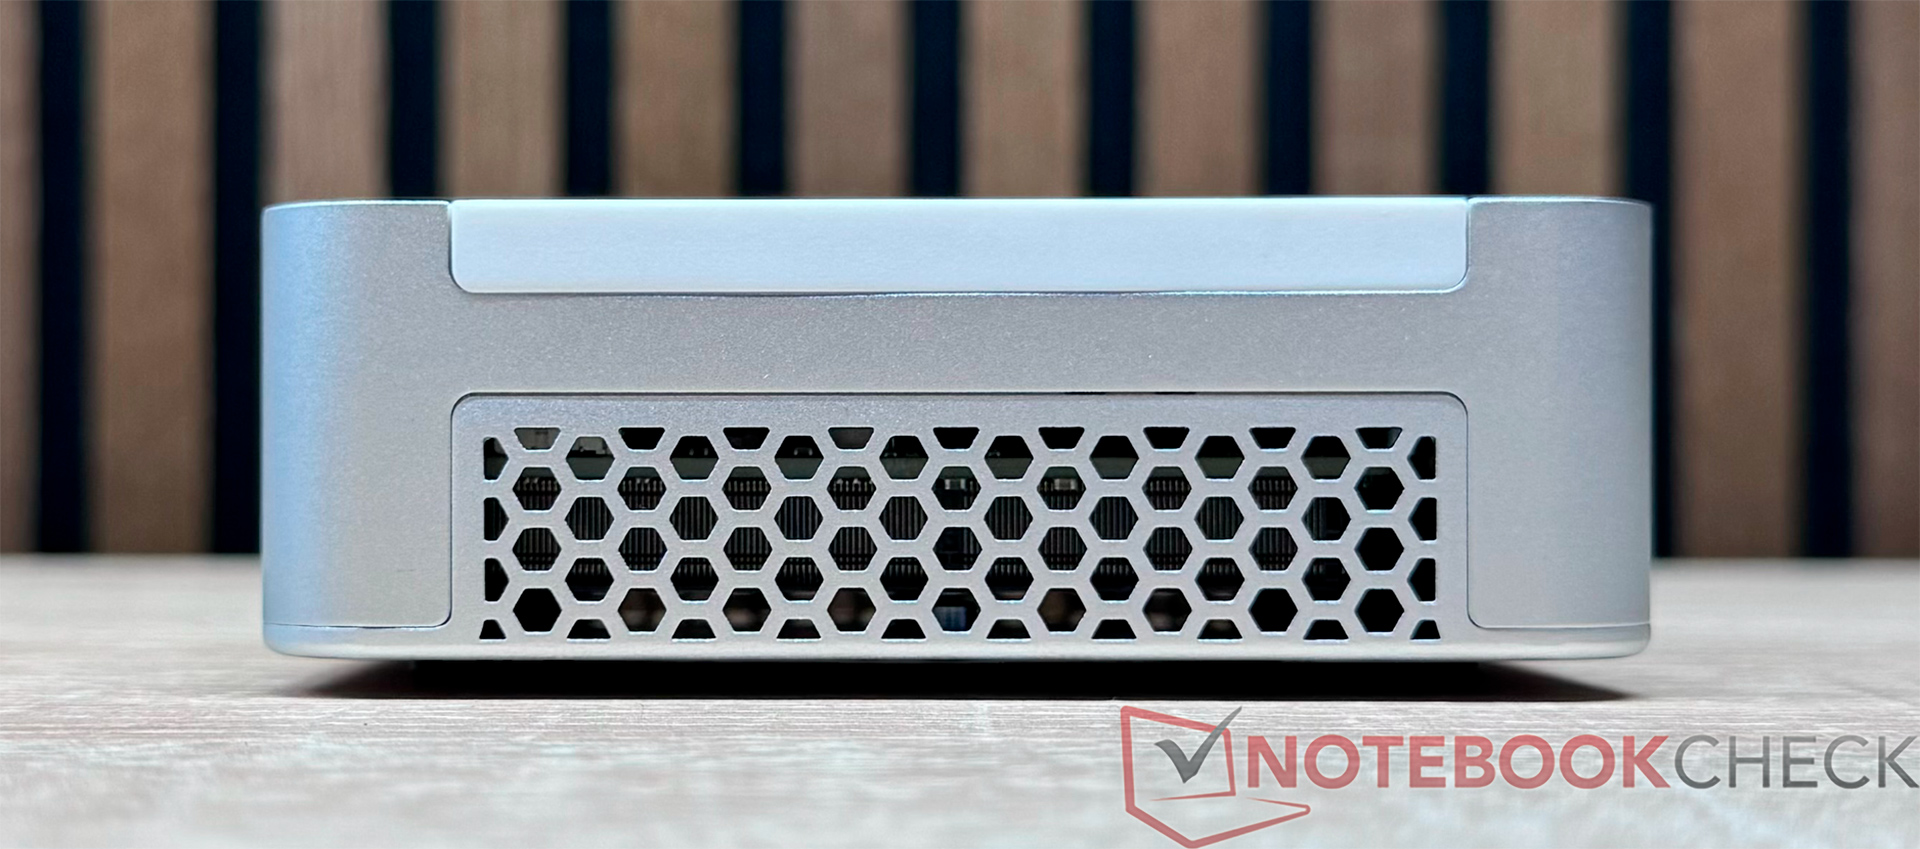


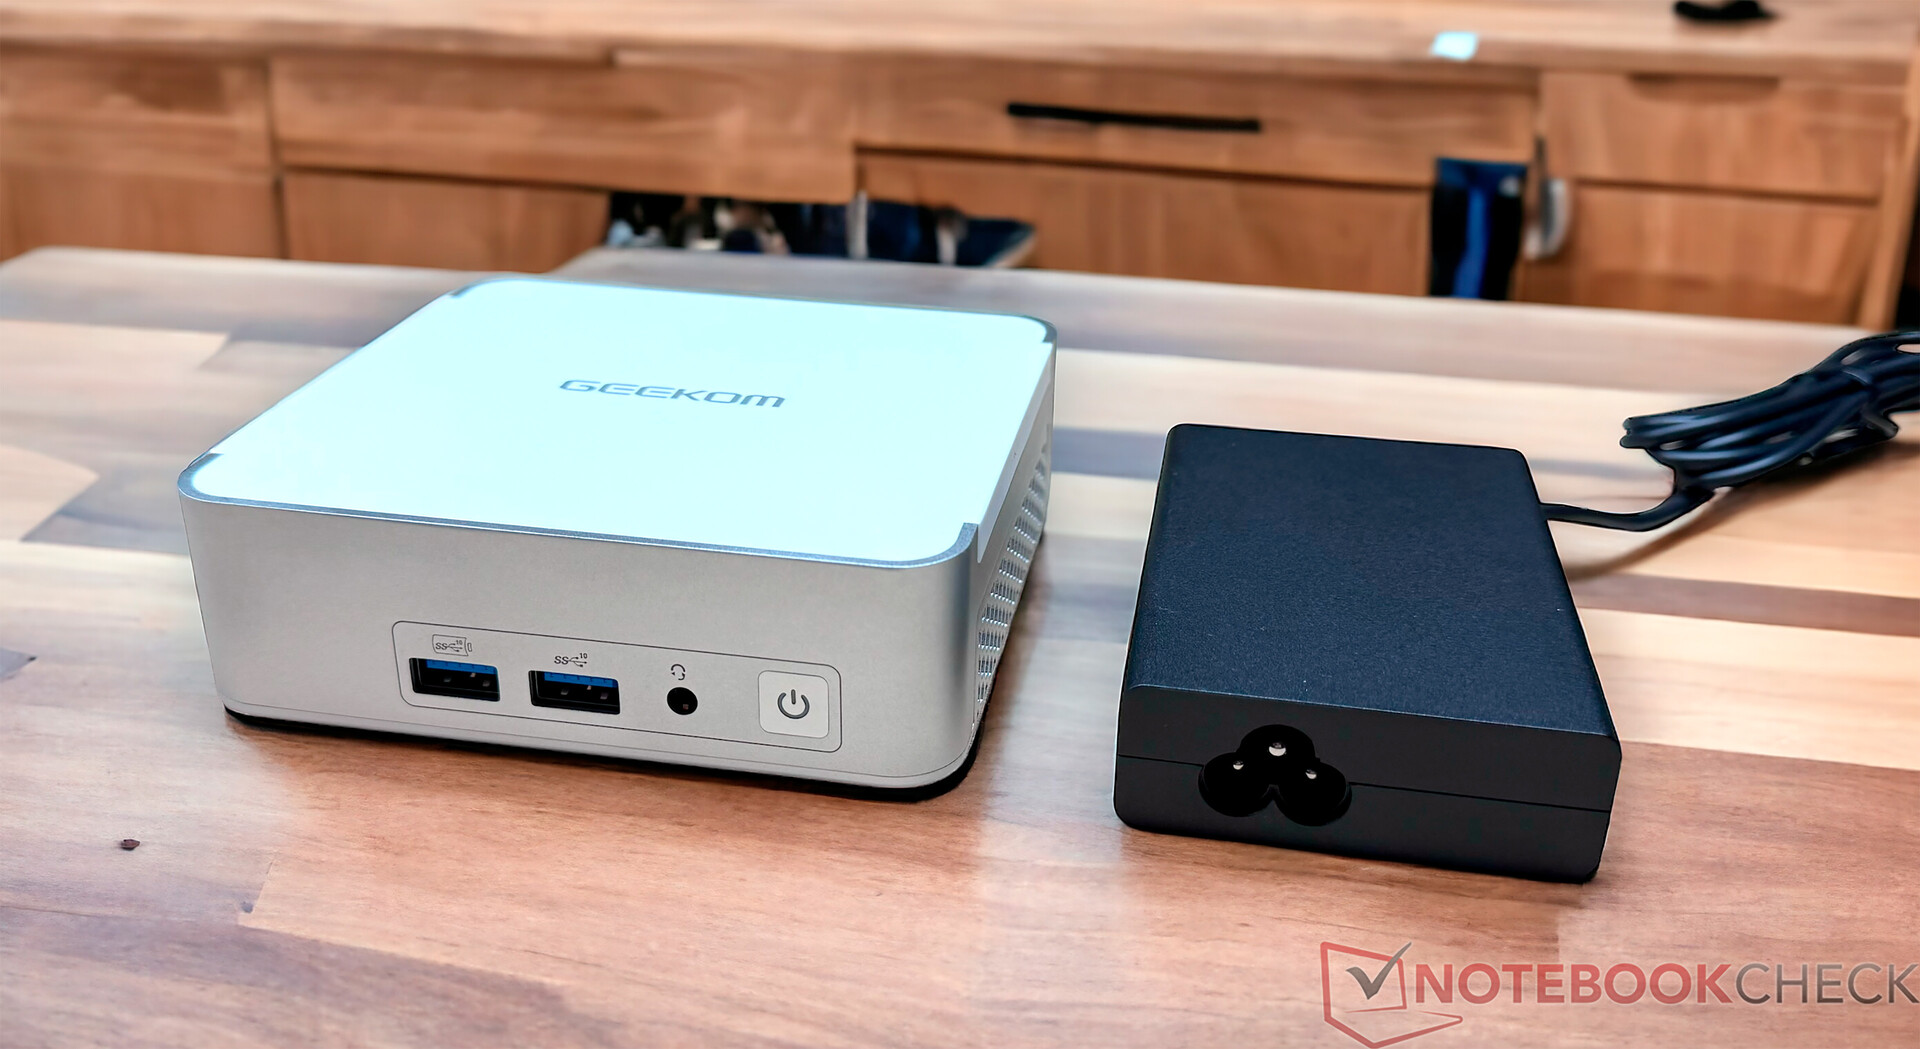
Gehäuse - Metall und Kunststoff perfekt verarbeitet
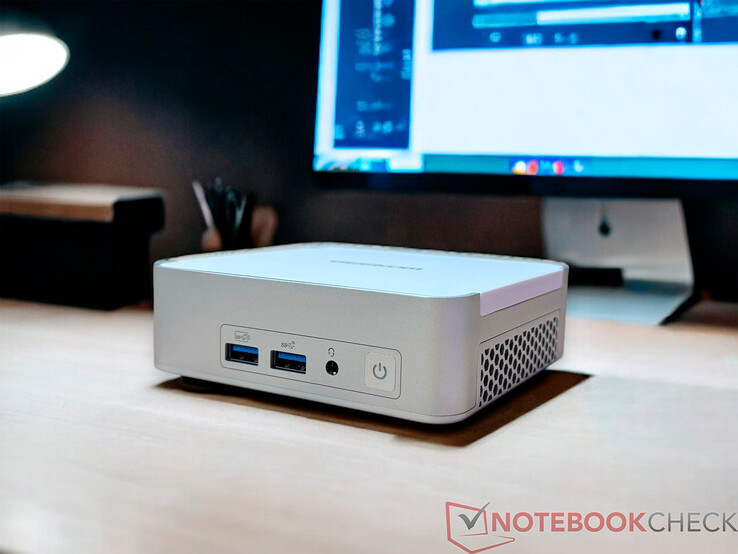
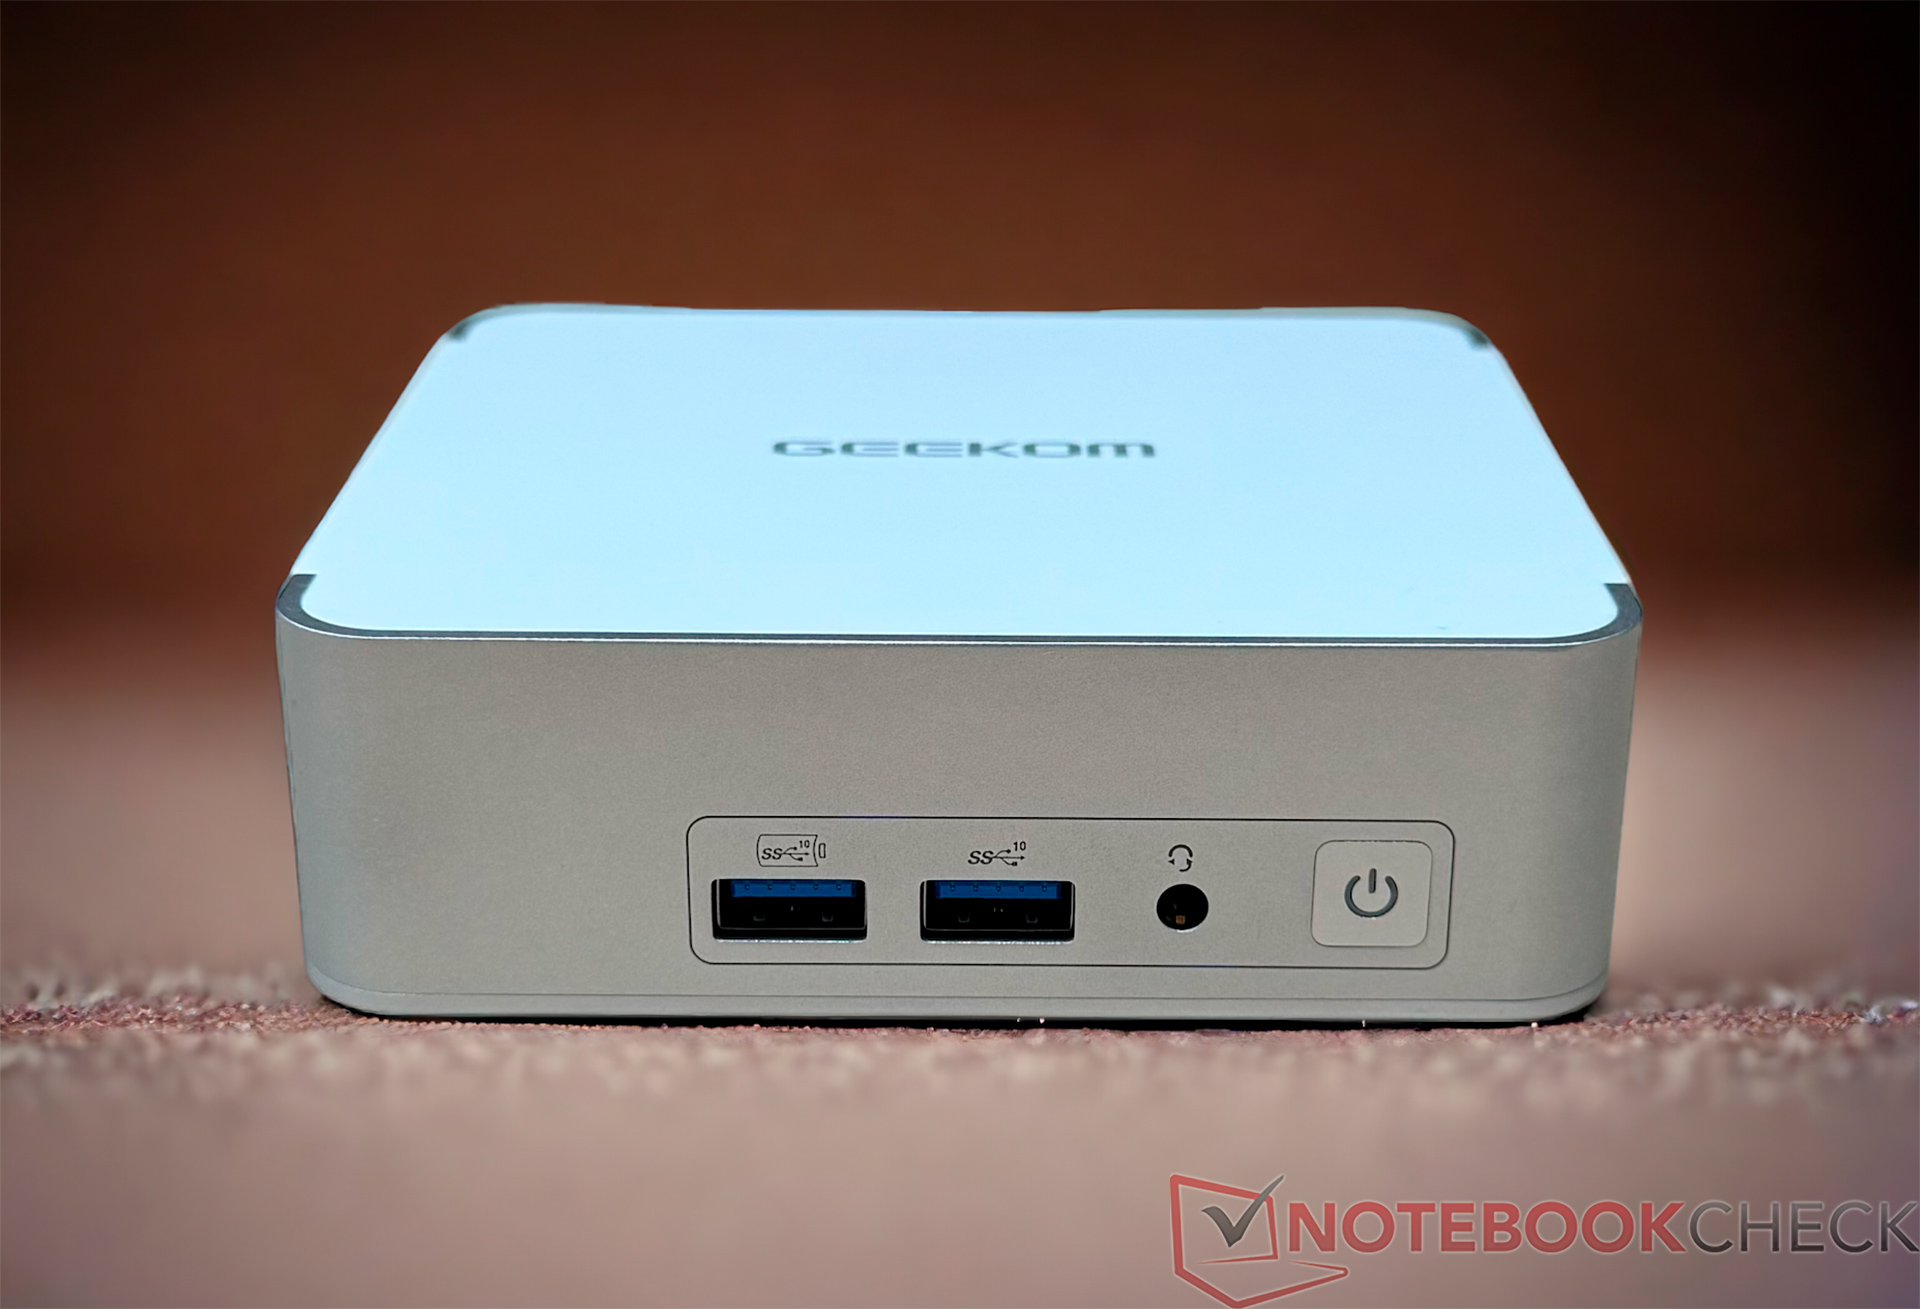
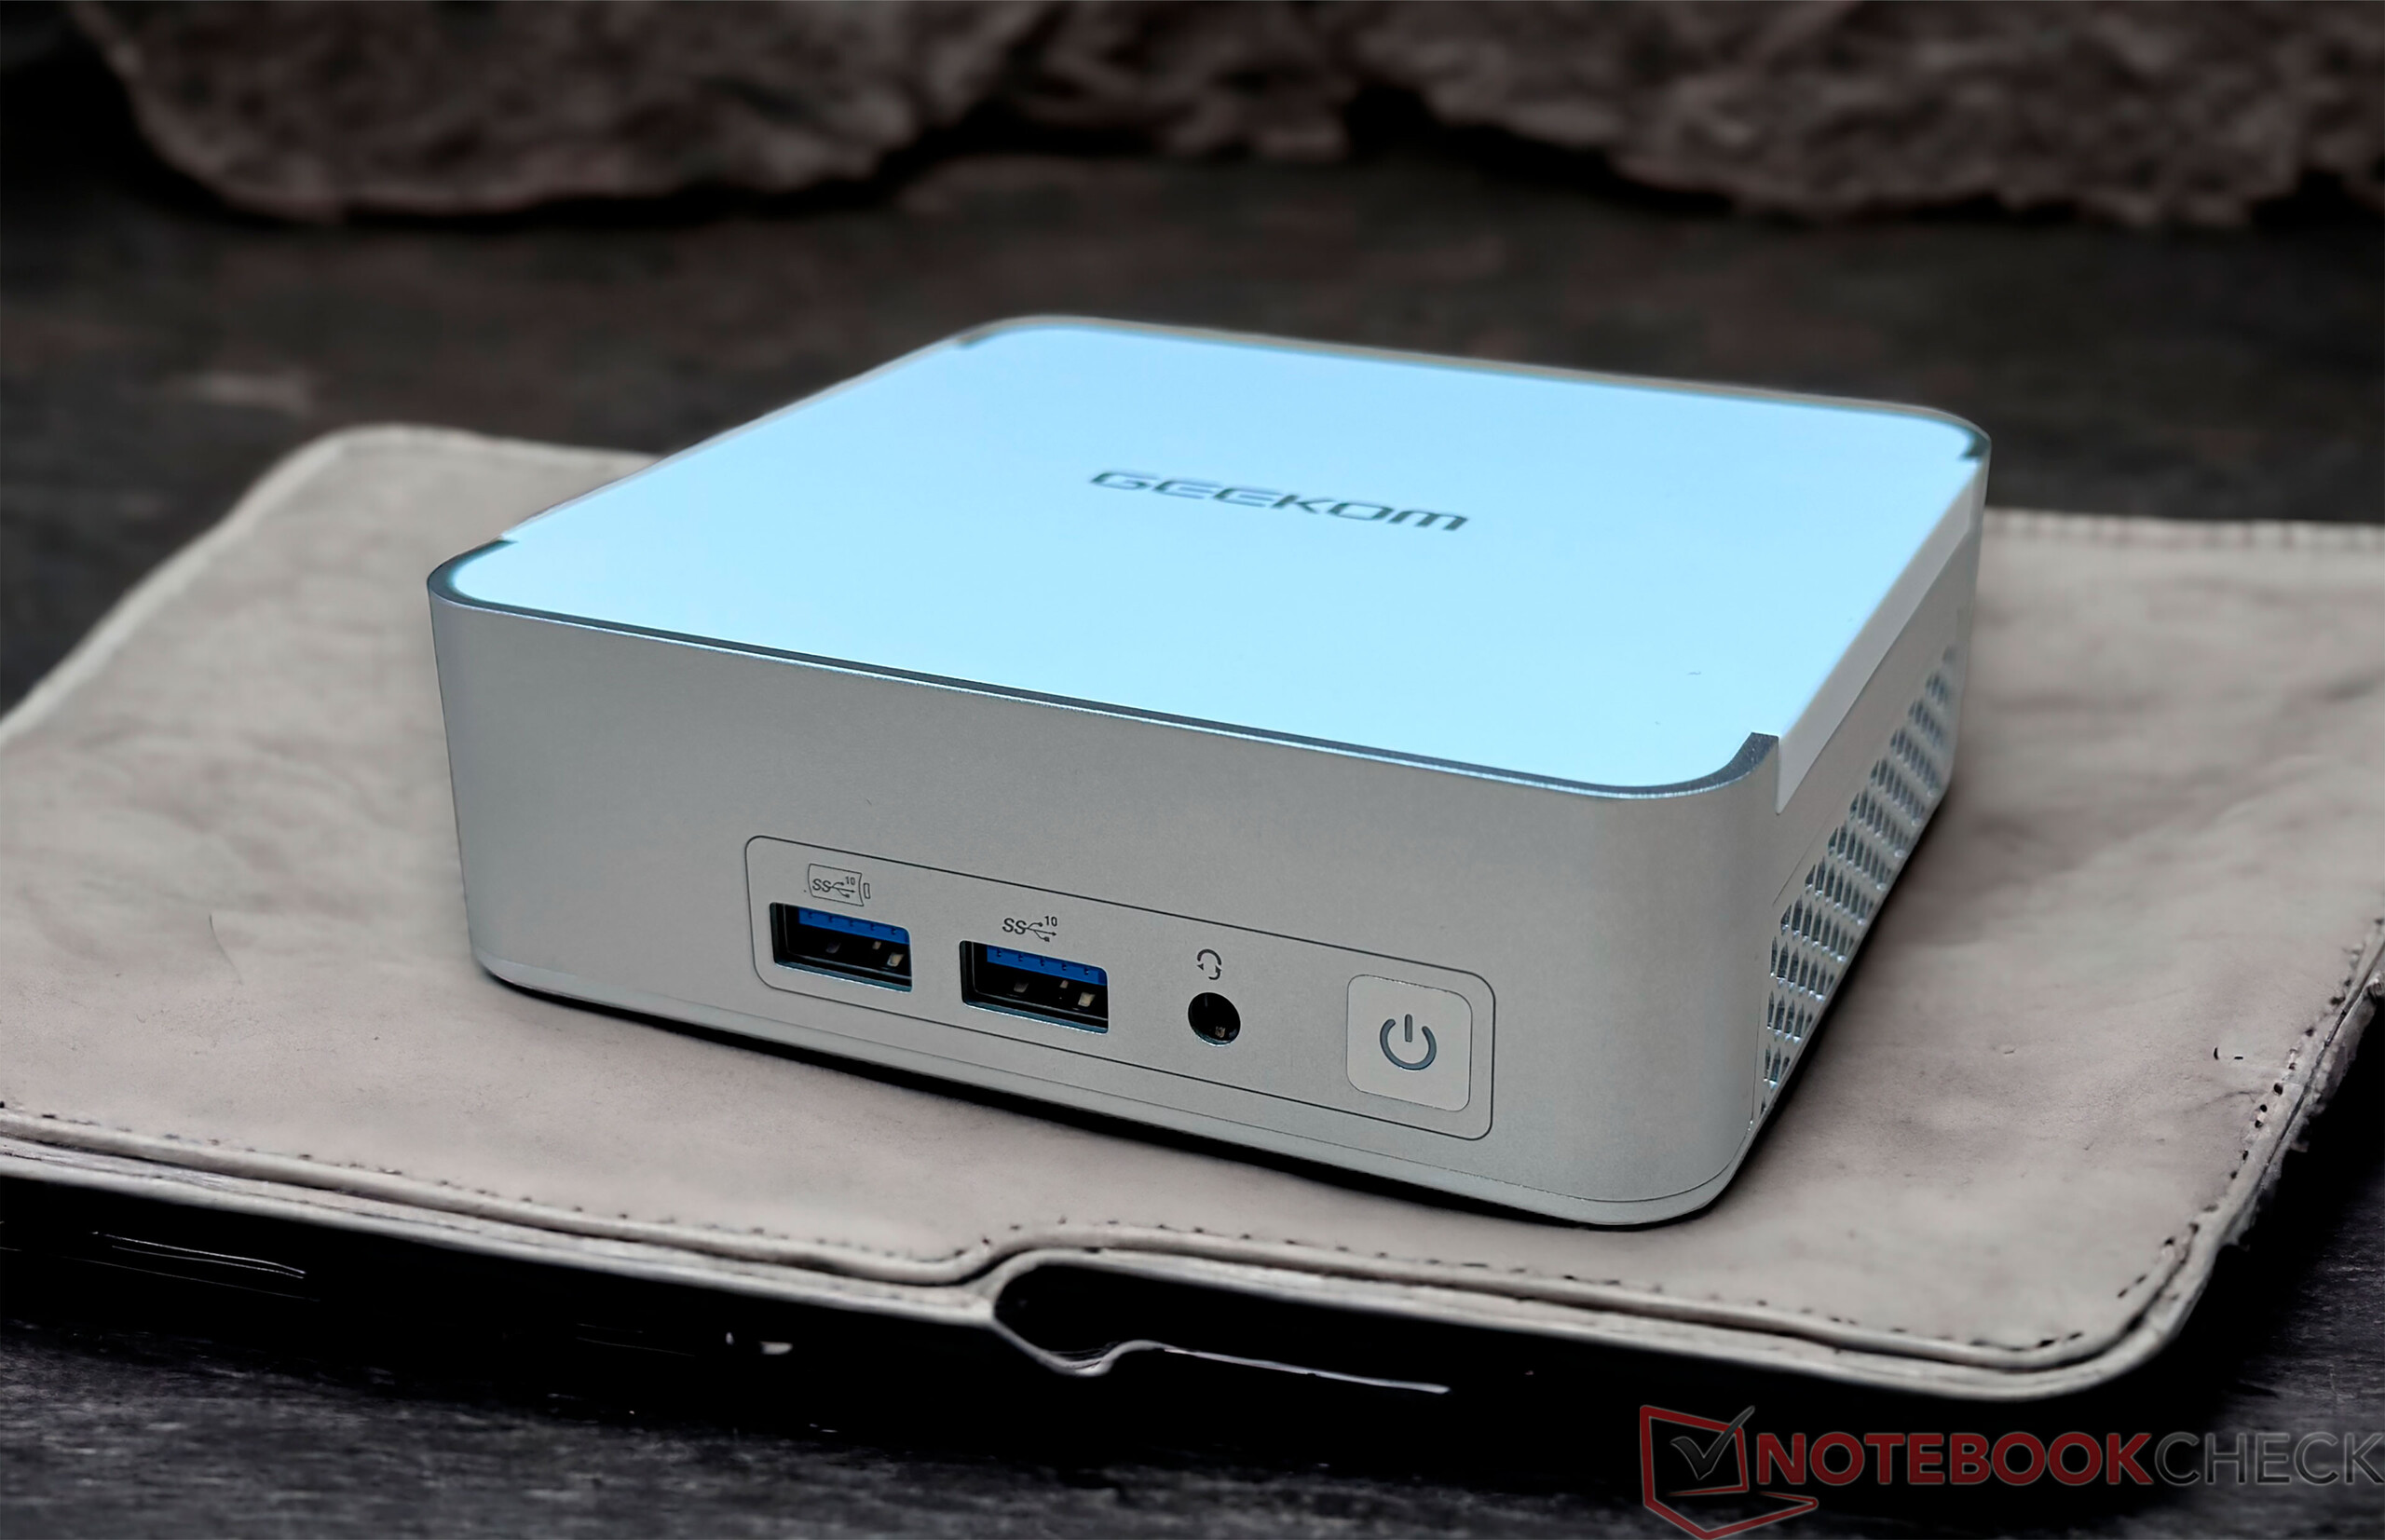
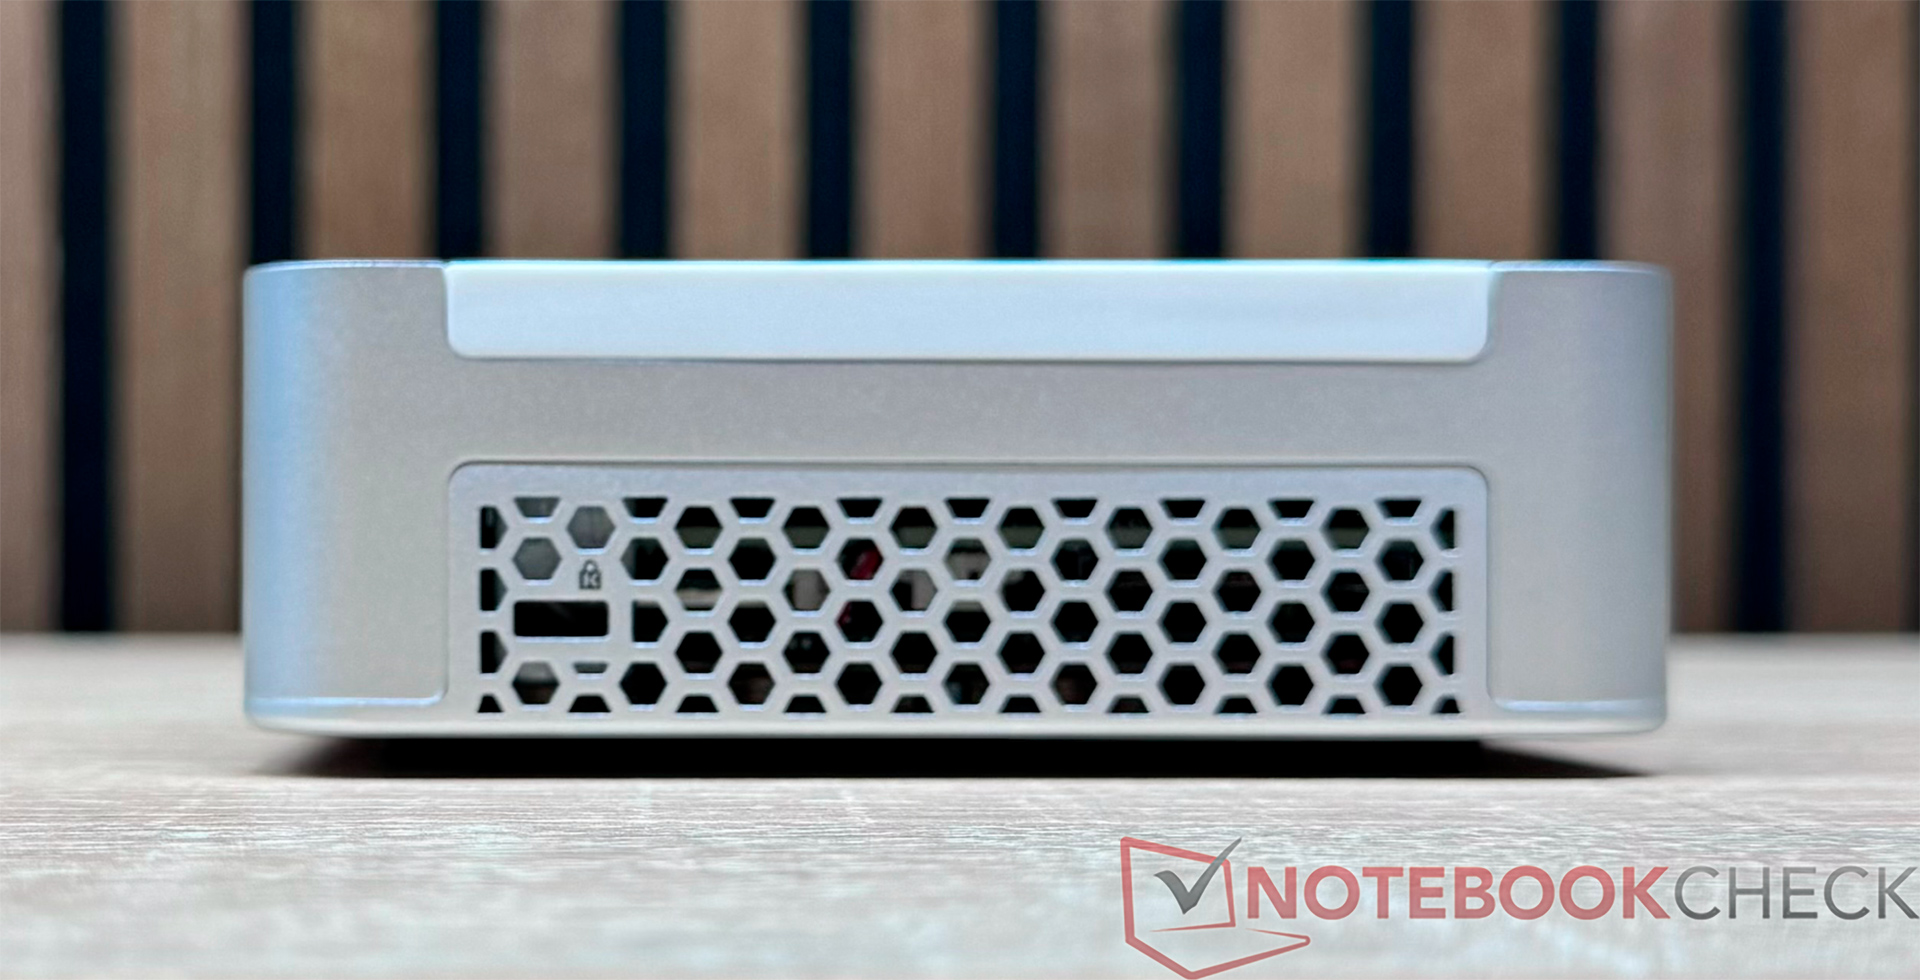
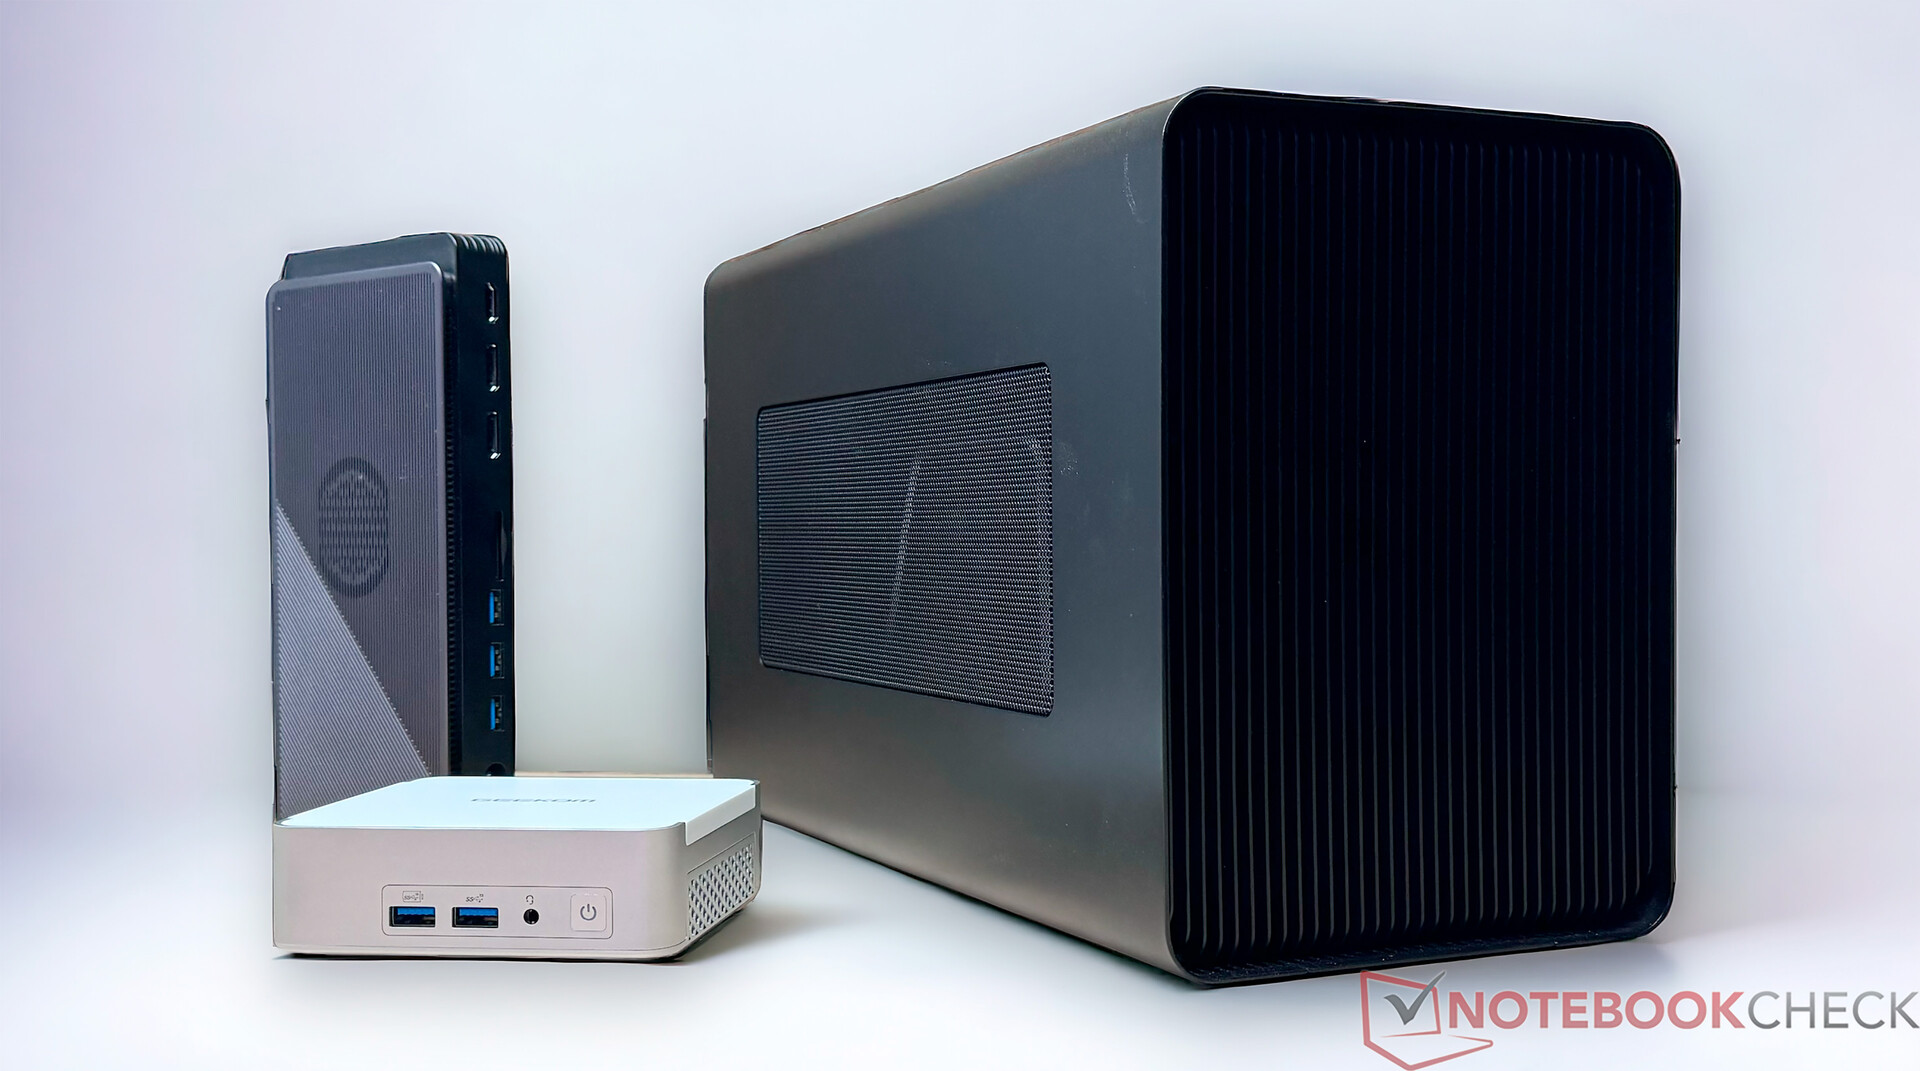
Der Geekom XT12 Pro ist extrem kompakt und vereint viel Technik auf kleinstem Raum. Nur 11,7 x 11,2 Zentimeter benötigt der XT12 Pro auf dem Schreibtisch. Bei der Materialauswahl sehen wir einen Mix aus Metall und Kunststoff. Letzterer wird für den Deckel verwendet, wenngleich die Stabilität nicht darunter leidet. Dennoch wirkte der Geekom A7 noch etwas hochwertiger. Das Metallgehäuse ist exzellent verarbeitet und lässt sich von der Unterseite her öffnen. Geekom verwendet dieses zugleich, um die Massenspeicher zu kühlen. Farblich gibt es den Geekom XT12 Pro nur in der Kombination Silber und Weiß. Zudem kann der Hersteller die Nähe zum Intel NUC 13 Pro Desk Edition Kit nicht abstreiten. Geekom selbst sagt dazu, dass die Geräte fast identisch aussehen, aber es dennoch eine Eigenkonstruktion sein soll.
Im Übrigen lässt sich der Geekom XT12 mit der mitgelieferten VESA-Halterung an einem Monitor befestigen.
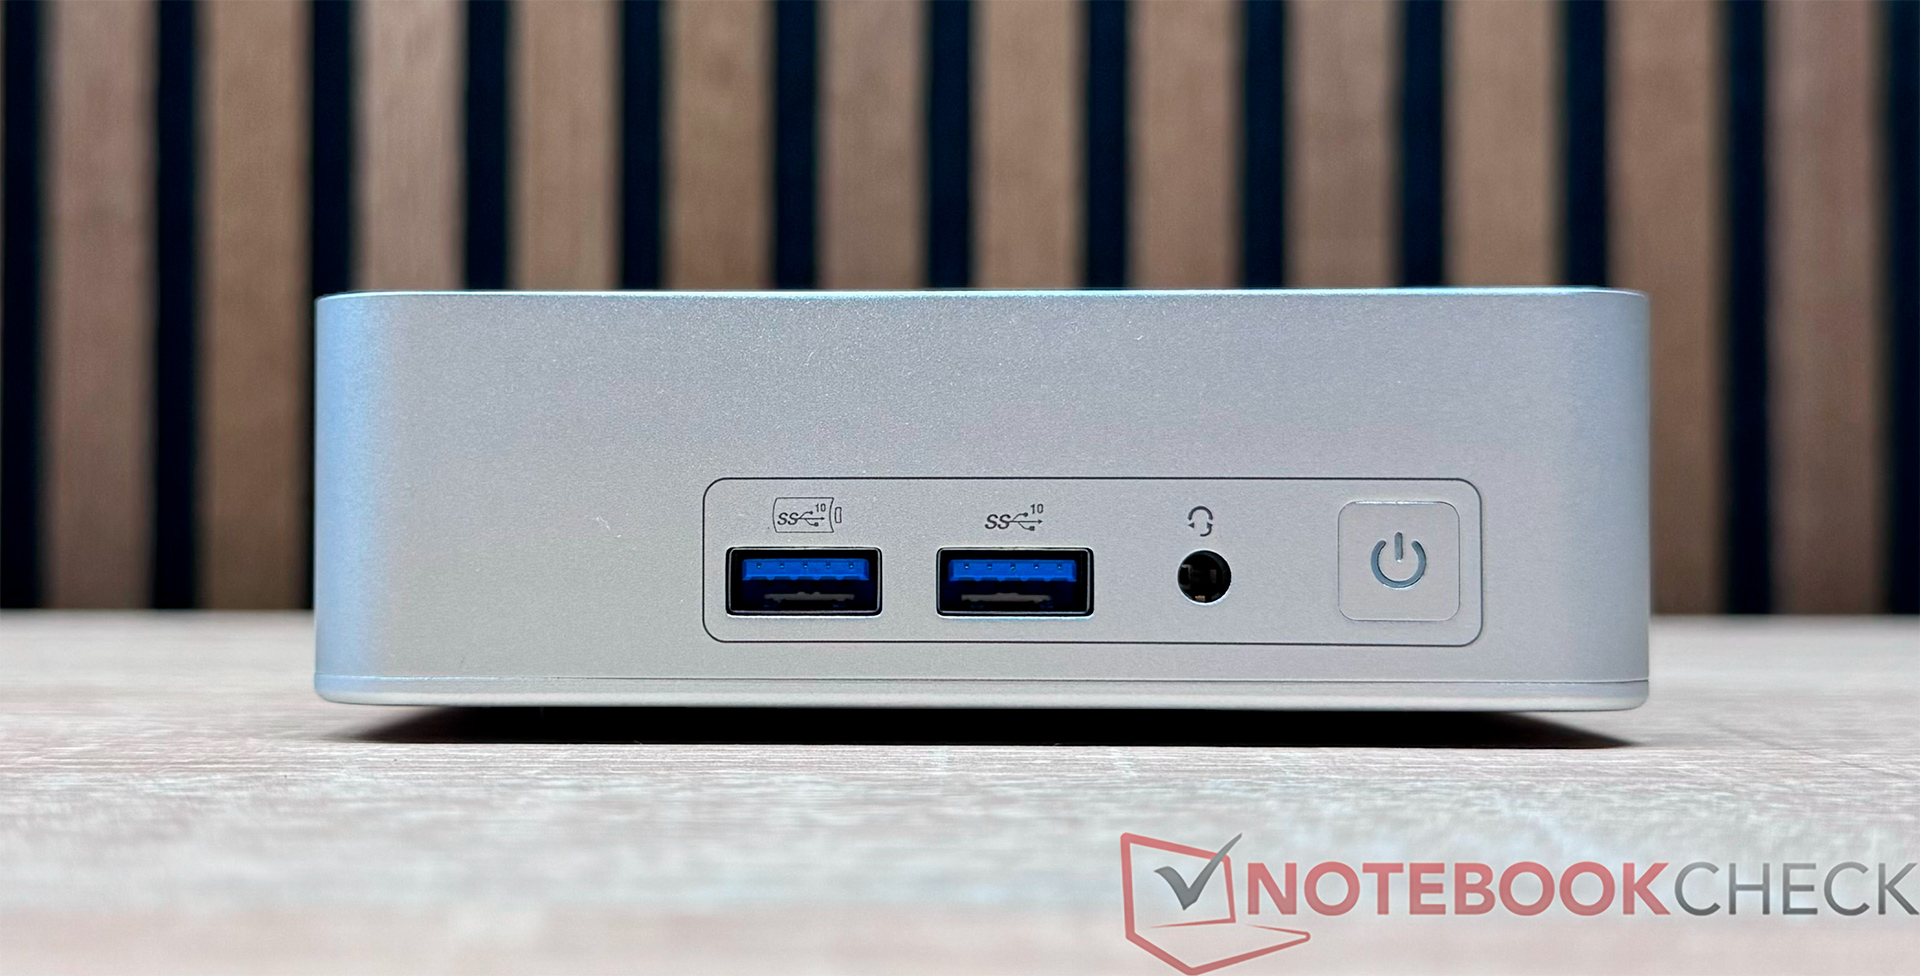
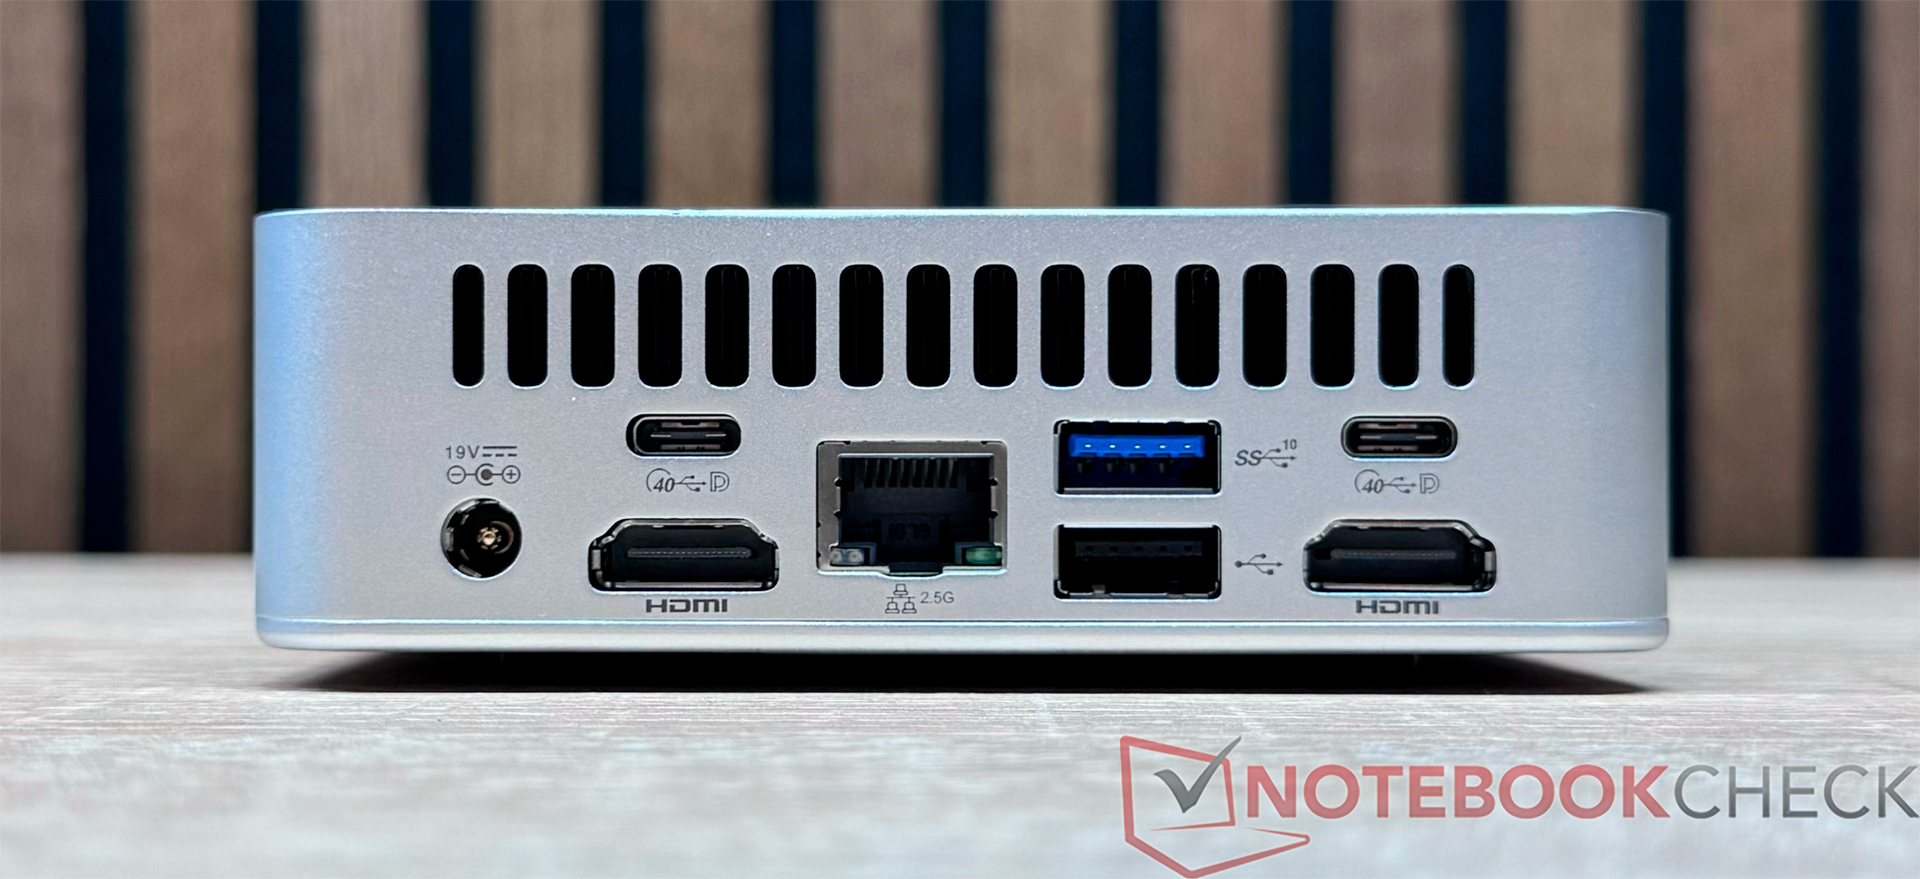
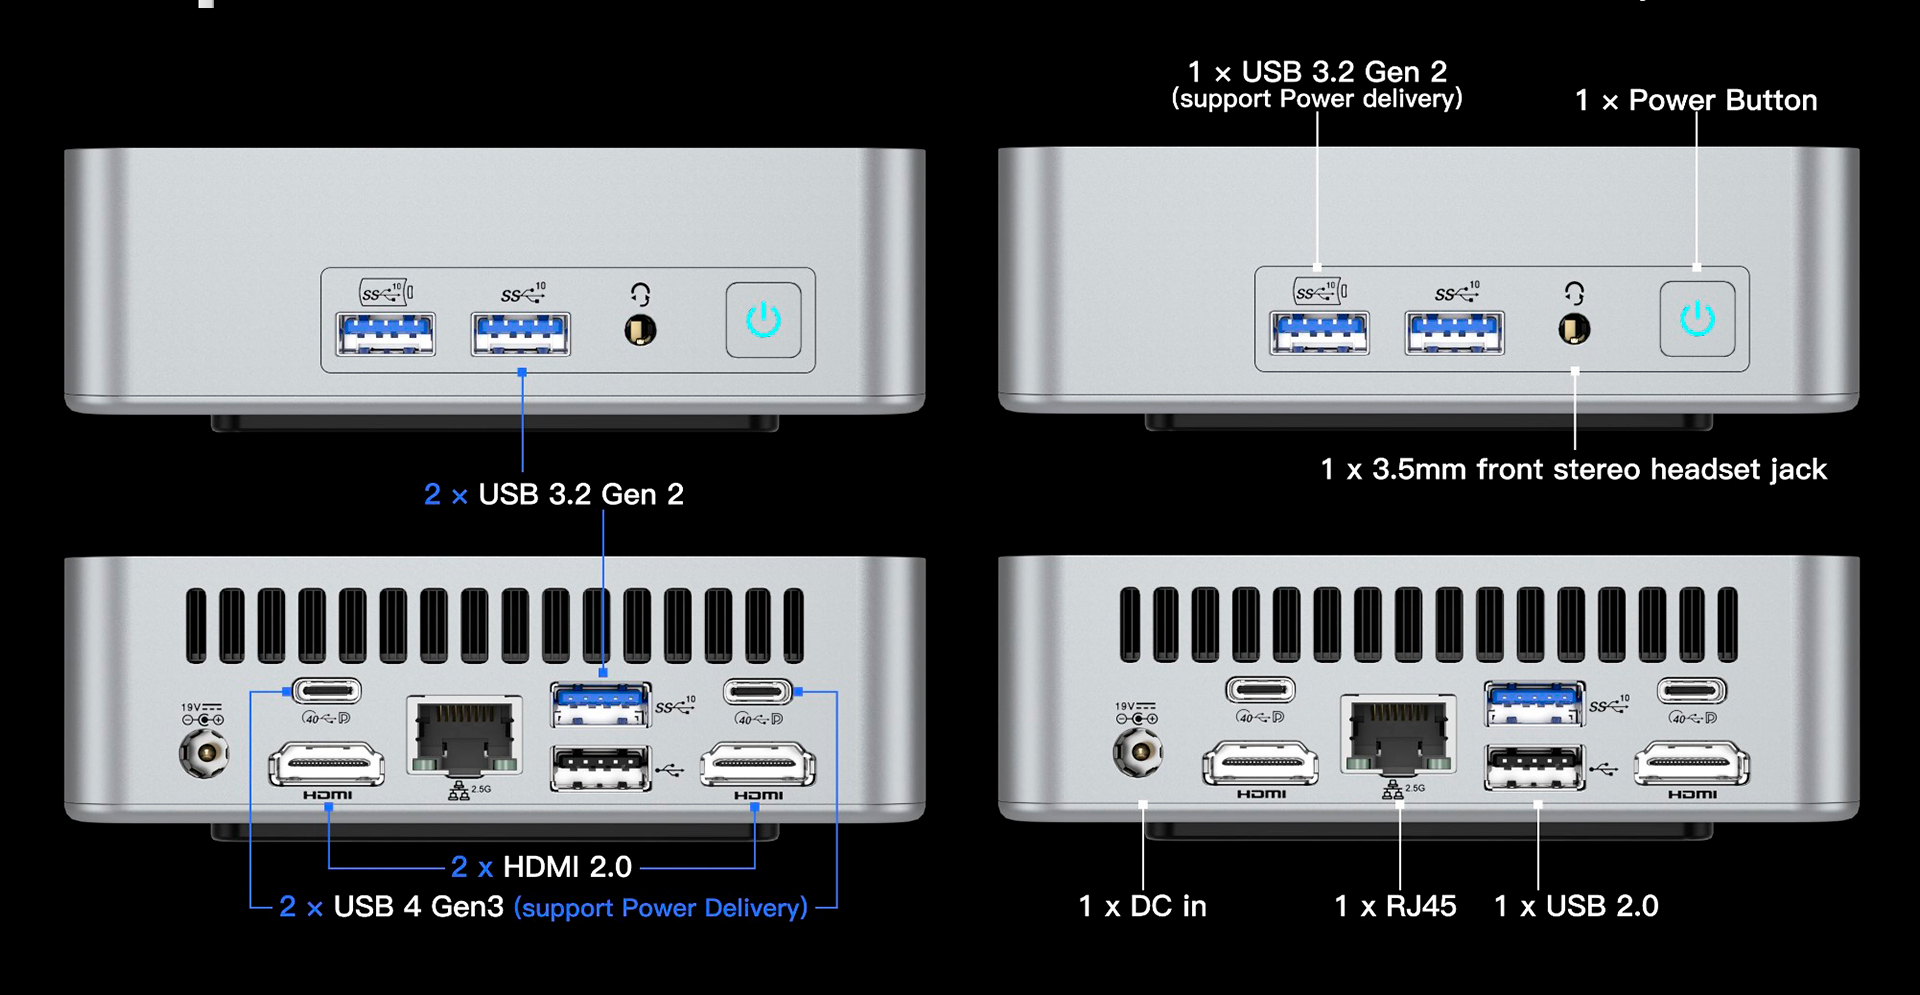
Ausstattung - Viele Optionen und 2x USB4
Bei den externen Schnittstellen spendiert Geekom dem XT12 Pro viele brauchbare Anschlüsse. Diese verteilen sich auf Vorder- und Rückseite. Viermal USB-A und zwei USB-C-Buchsen sind mehr als ausreichend und sollten alle Bedürfnisse abdecken. Bei den Typ-C-Anschlüssen handelt es sich zudem um USB4-Ports, welche die möglichen Einsatzzwecke des XT12 Pro mit dem richtigen Zubehör fast grenzenlos erweitert. Bildschirme lassen sich direkt über HDMI, aber auch über USB4 betreiben. Somit kann der Mini-PC gleichzeitig mit vier Bildschirmen betrieben werden. Auf einen Netzwerkanschluss muss ebenfalls nicht verzichtet werden.
Kommunikation
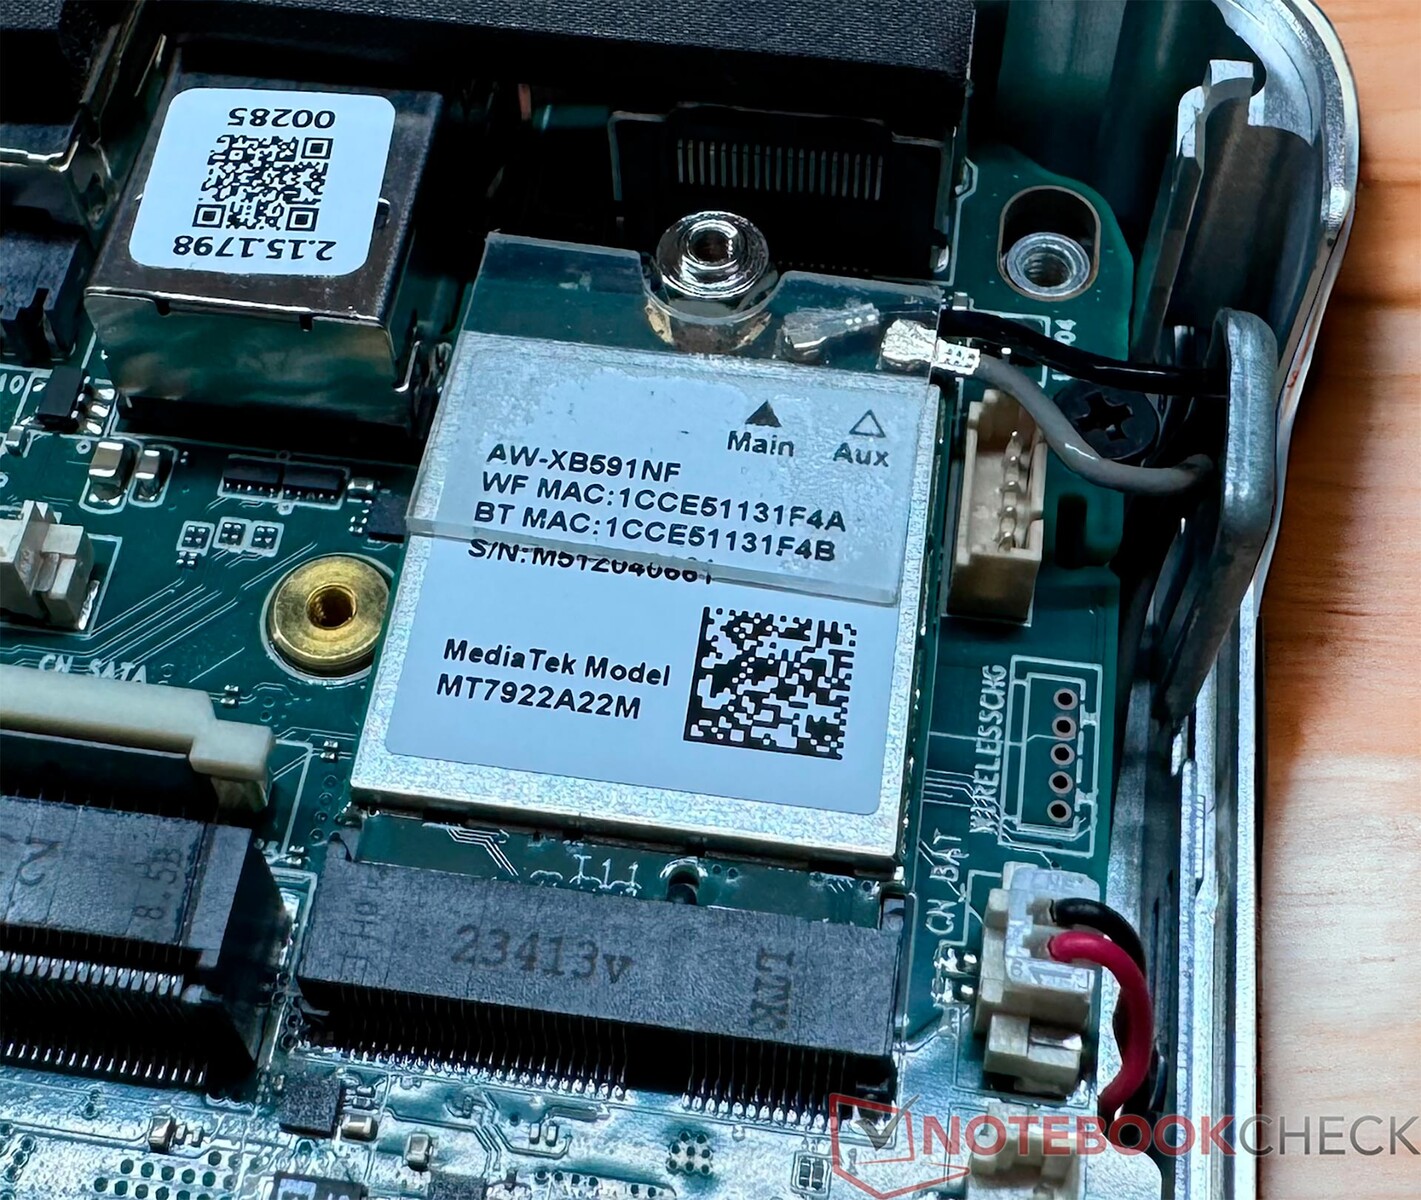
Im Geekom XT12 Pro werkelt das gleiche Funkmodul wie im Geekom A7. Das MediaTek Wi-Fi 6E MT7922 WLAN-Modul erreicht keine Bestwerte, reicht aber für Datenübertragungen bei normaler Nutzung aus. Wenn die Möglichkeit besteht, sollte vorrangig der 6-GHz-Frequenzbereich verwendet werden. Der Leistungsunterschied zum etwas langsameren 5-GHz-Frequenzbereich ist bei der Datenübertragung von vielen Daten schon spürbar. Alternativ dazu kann der Geekom XT12 Pro auch mit einer kabelgebundenen Netzwerkverbindung umgehen. Hier sind Datenraten von bis zu 2,5 GBit/s möglich.
Zubehör
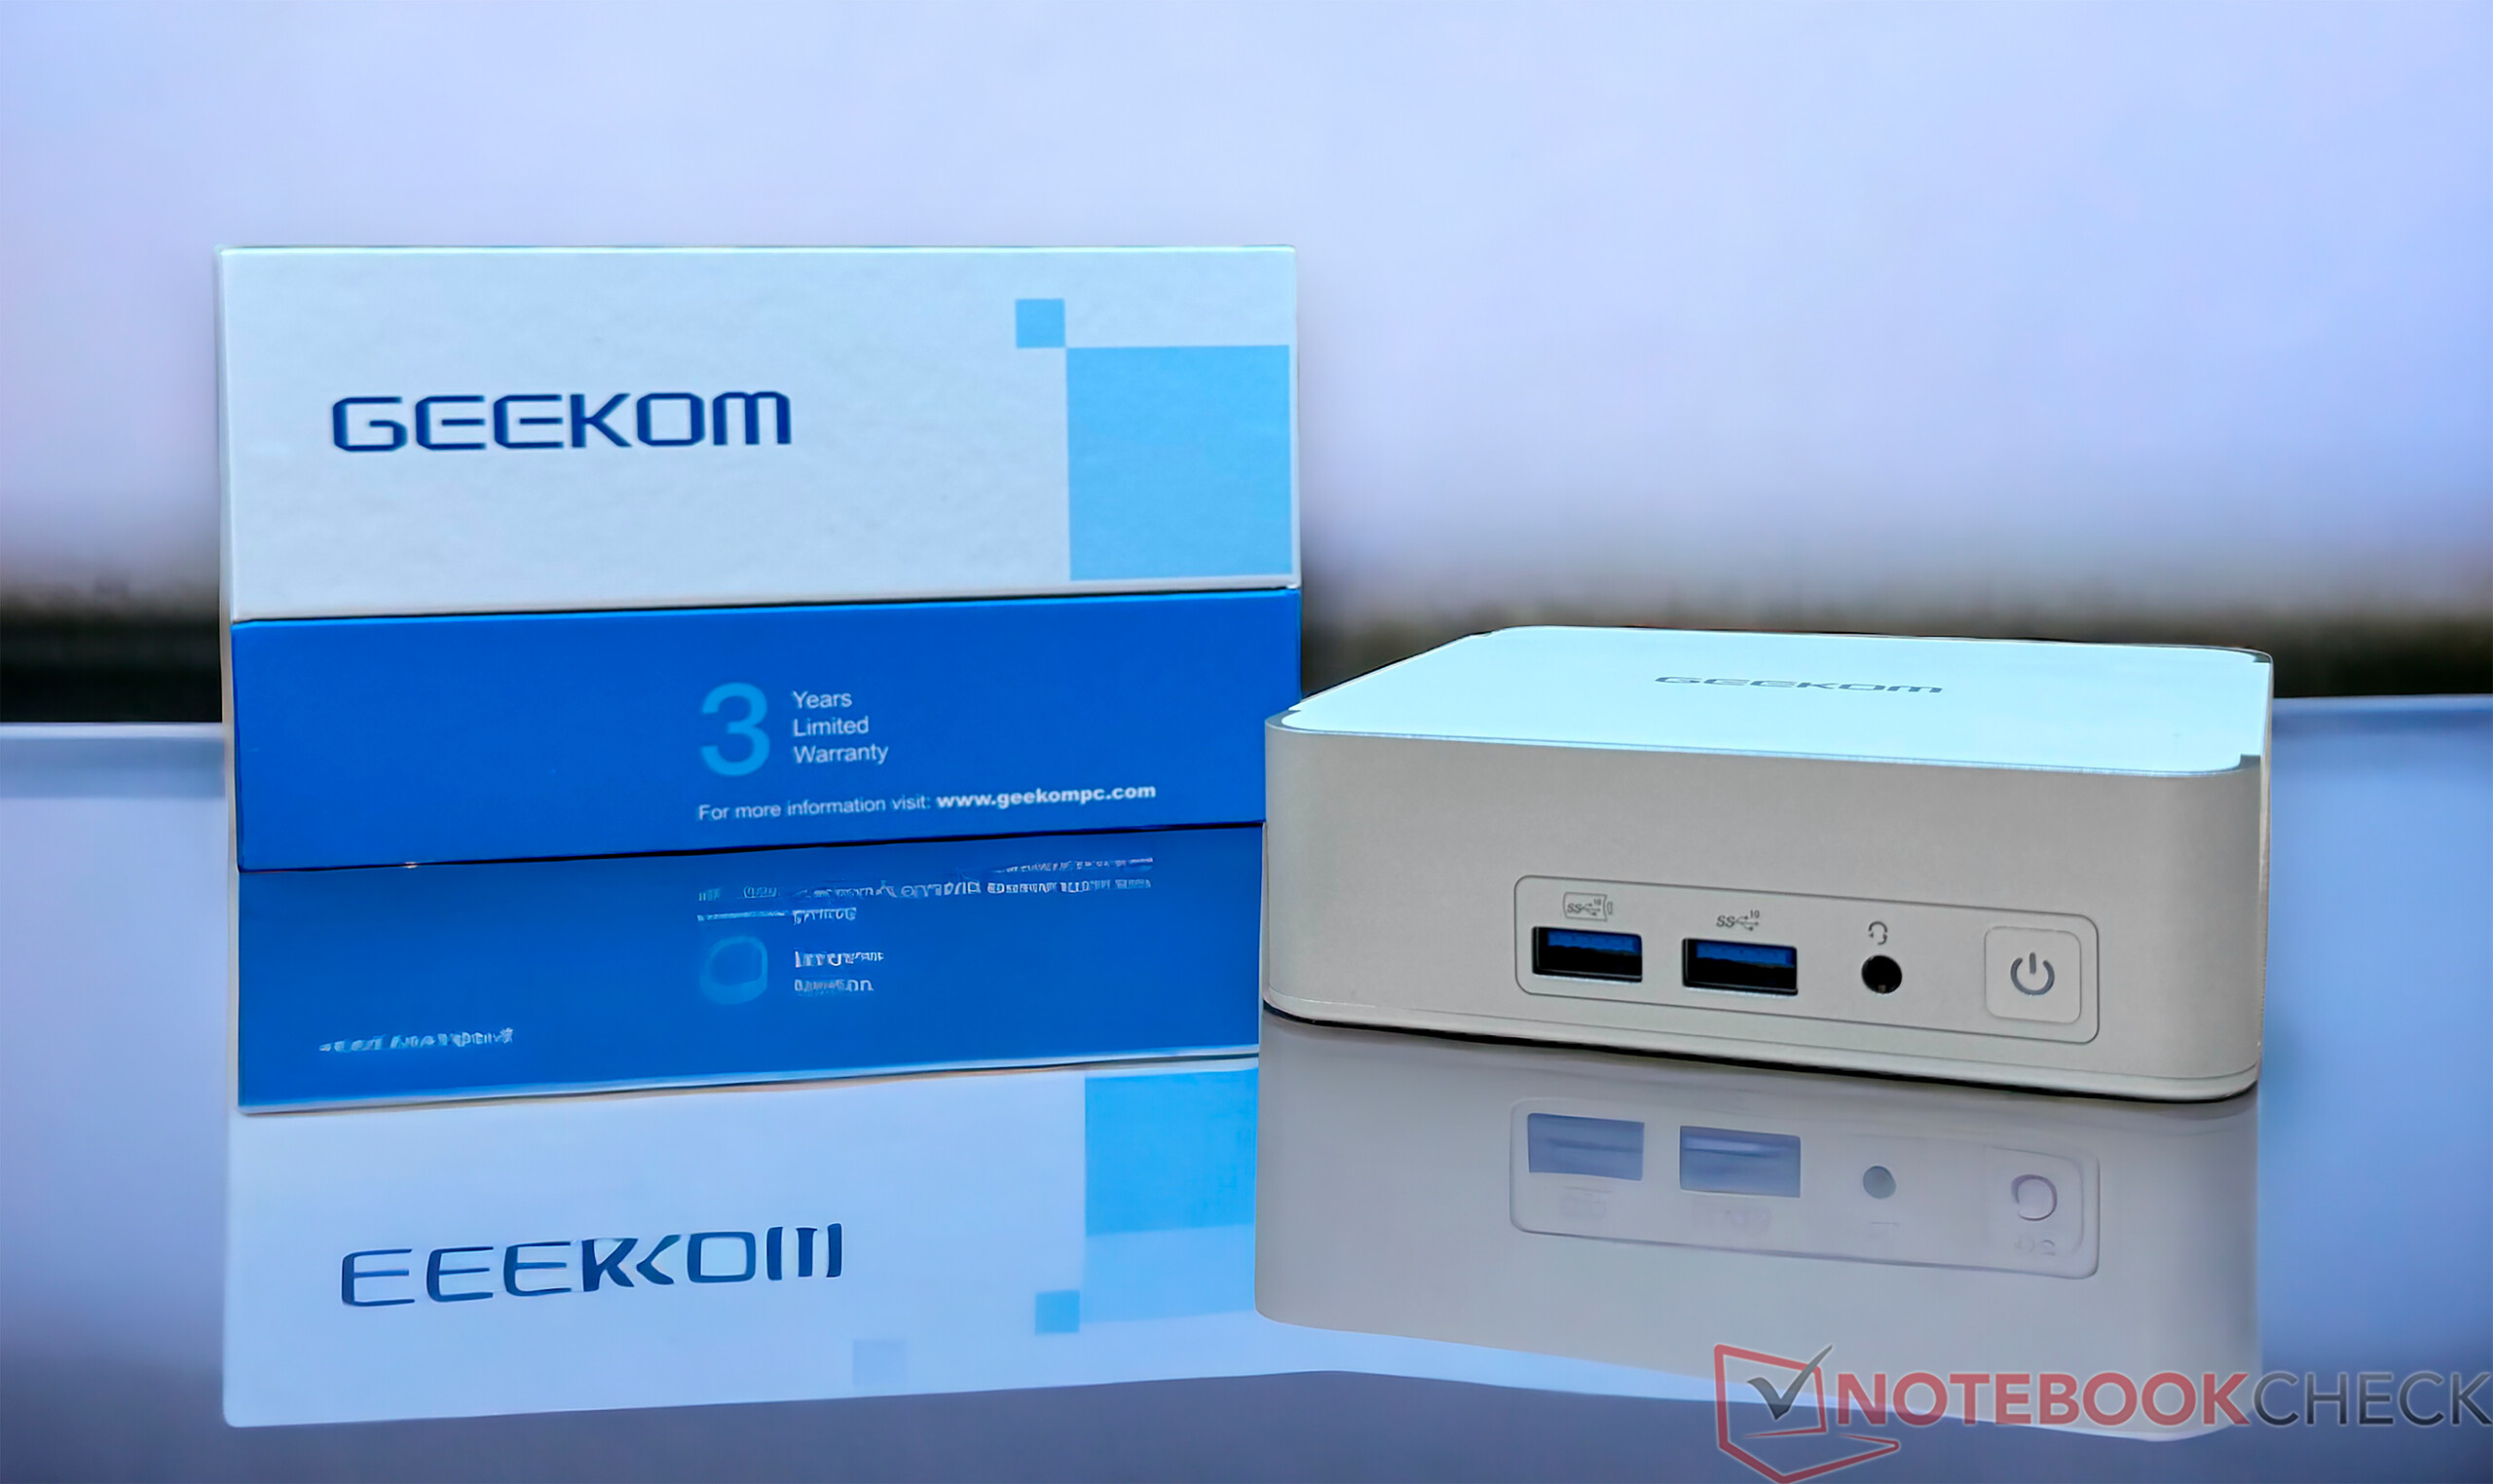
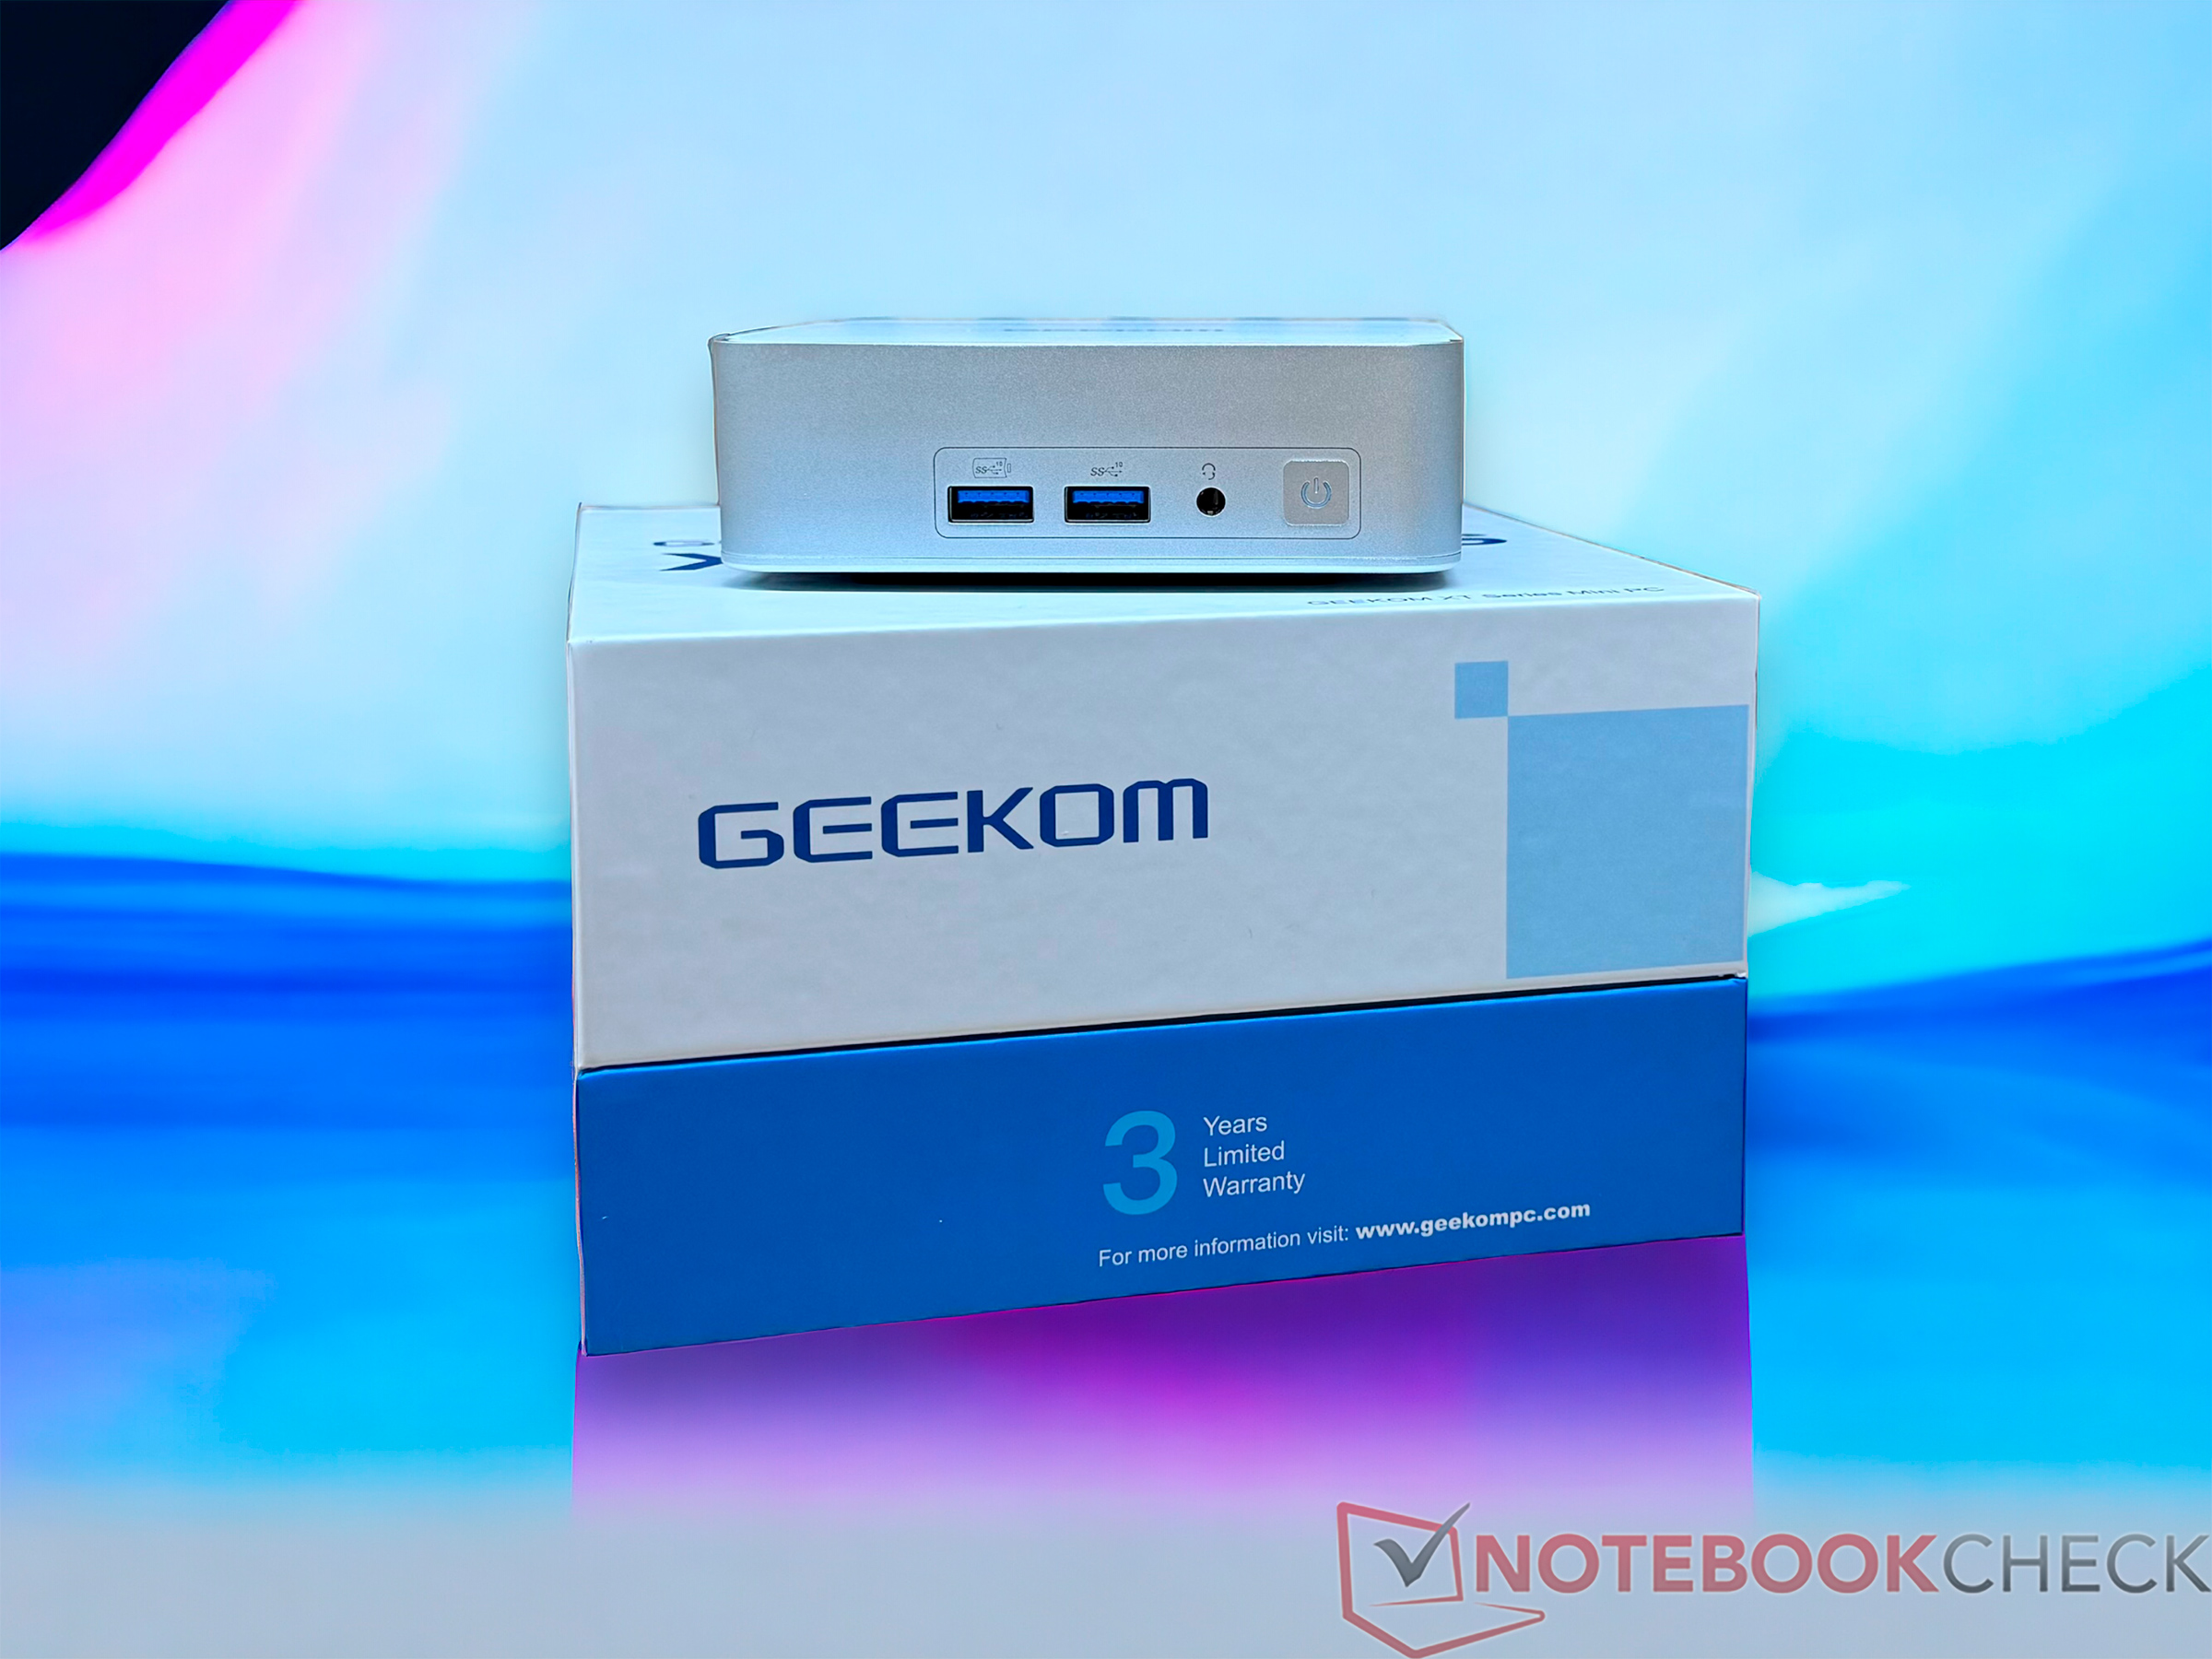
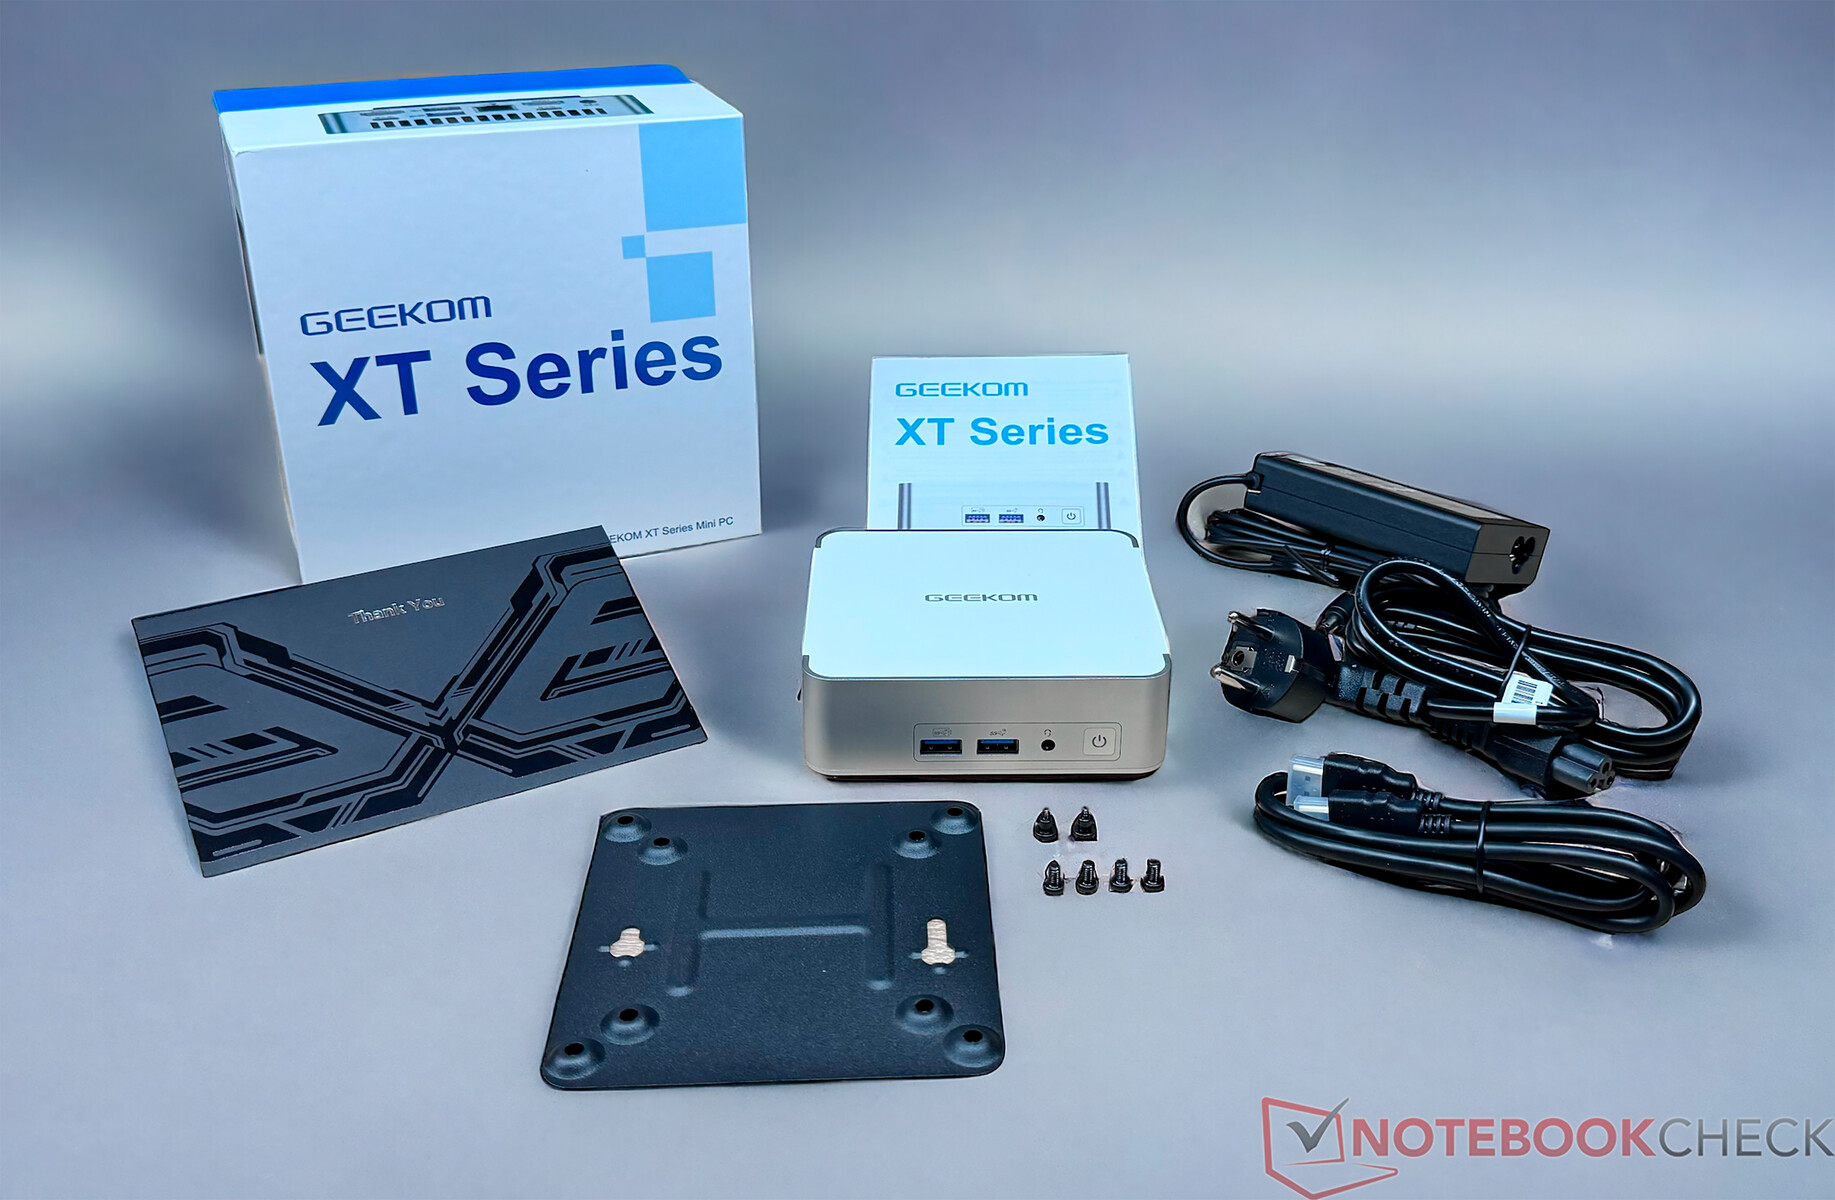
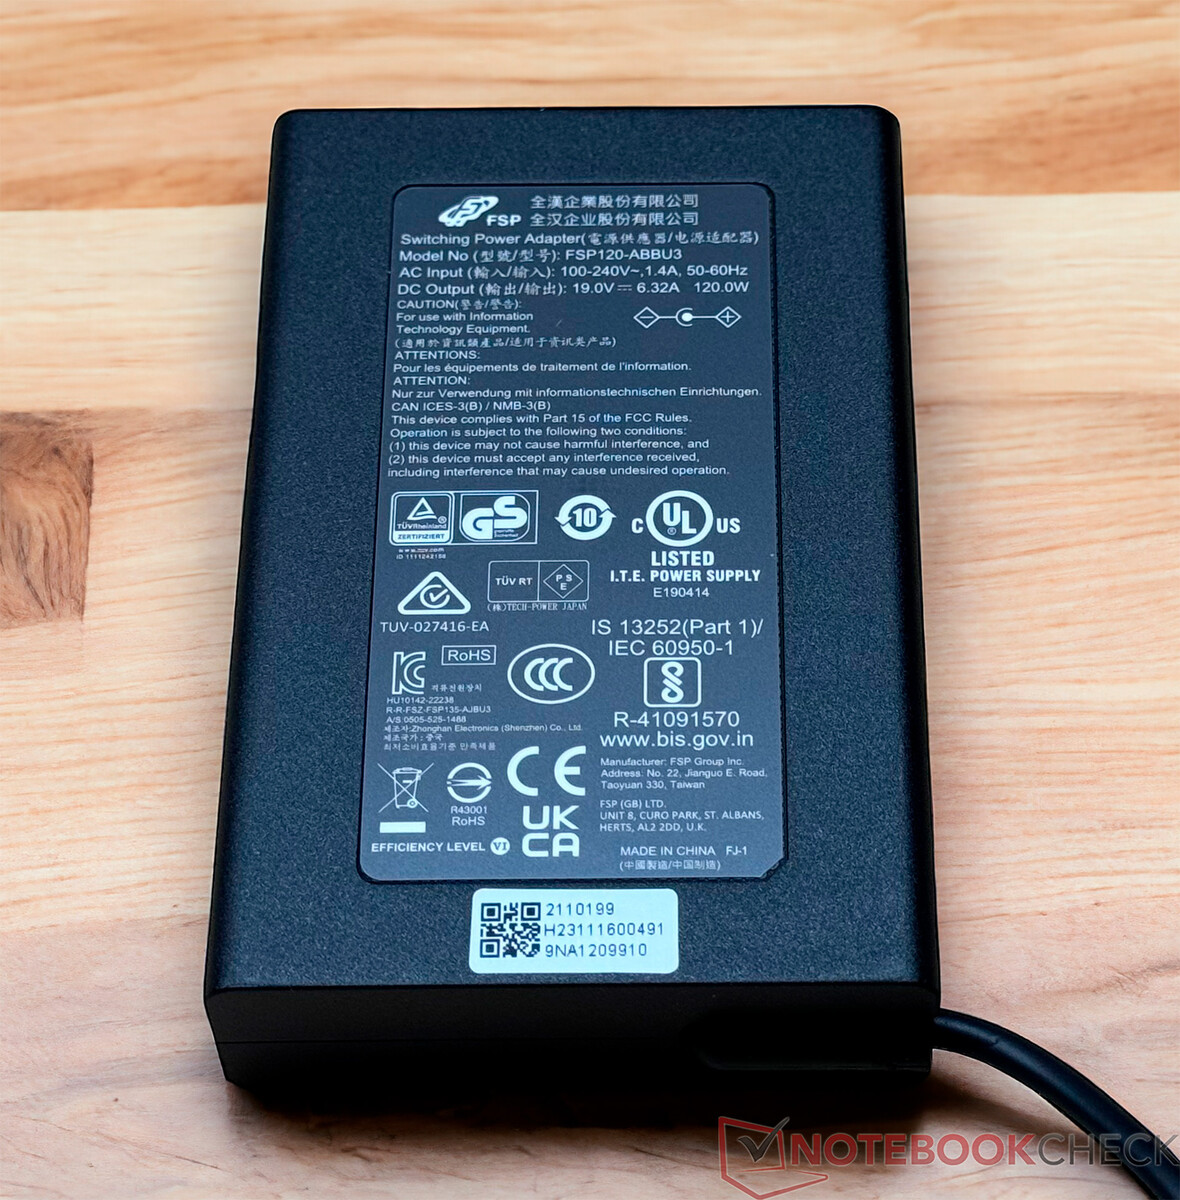
Der Lieferumfang des Geekom XT12 Pro beinhaltet alles Wichtige. Neben dem 120-Watt-Netzteil befindet sich noch eine VESA-Halterung im Karton. Ein HDMI-Kabel sowie die obligatorische Dankeskarte von Geekom sind mit dabei.
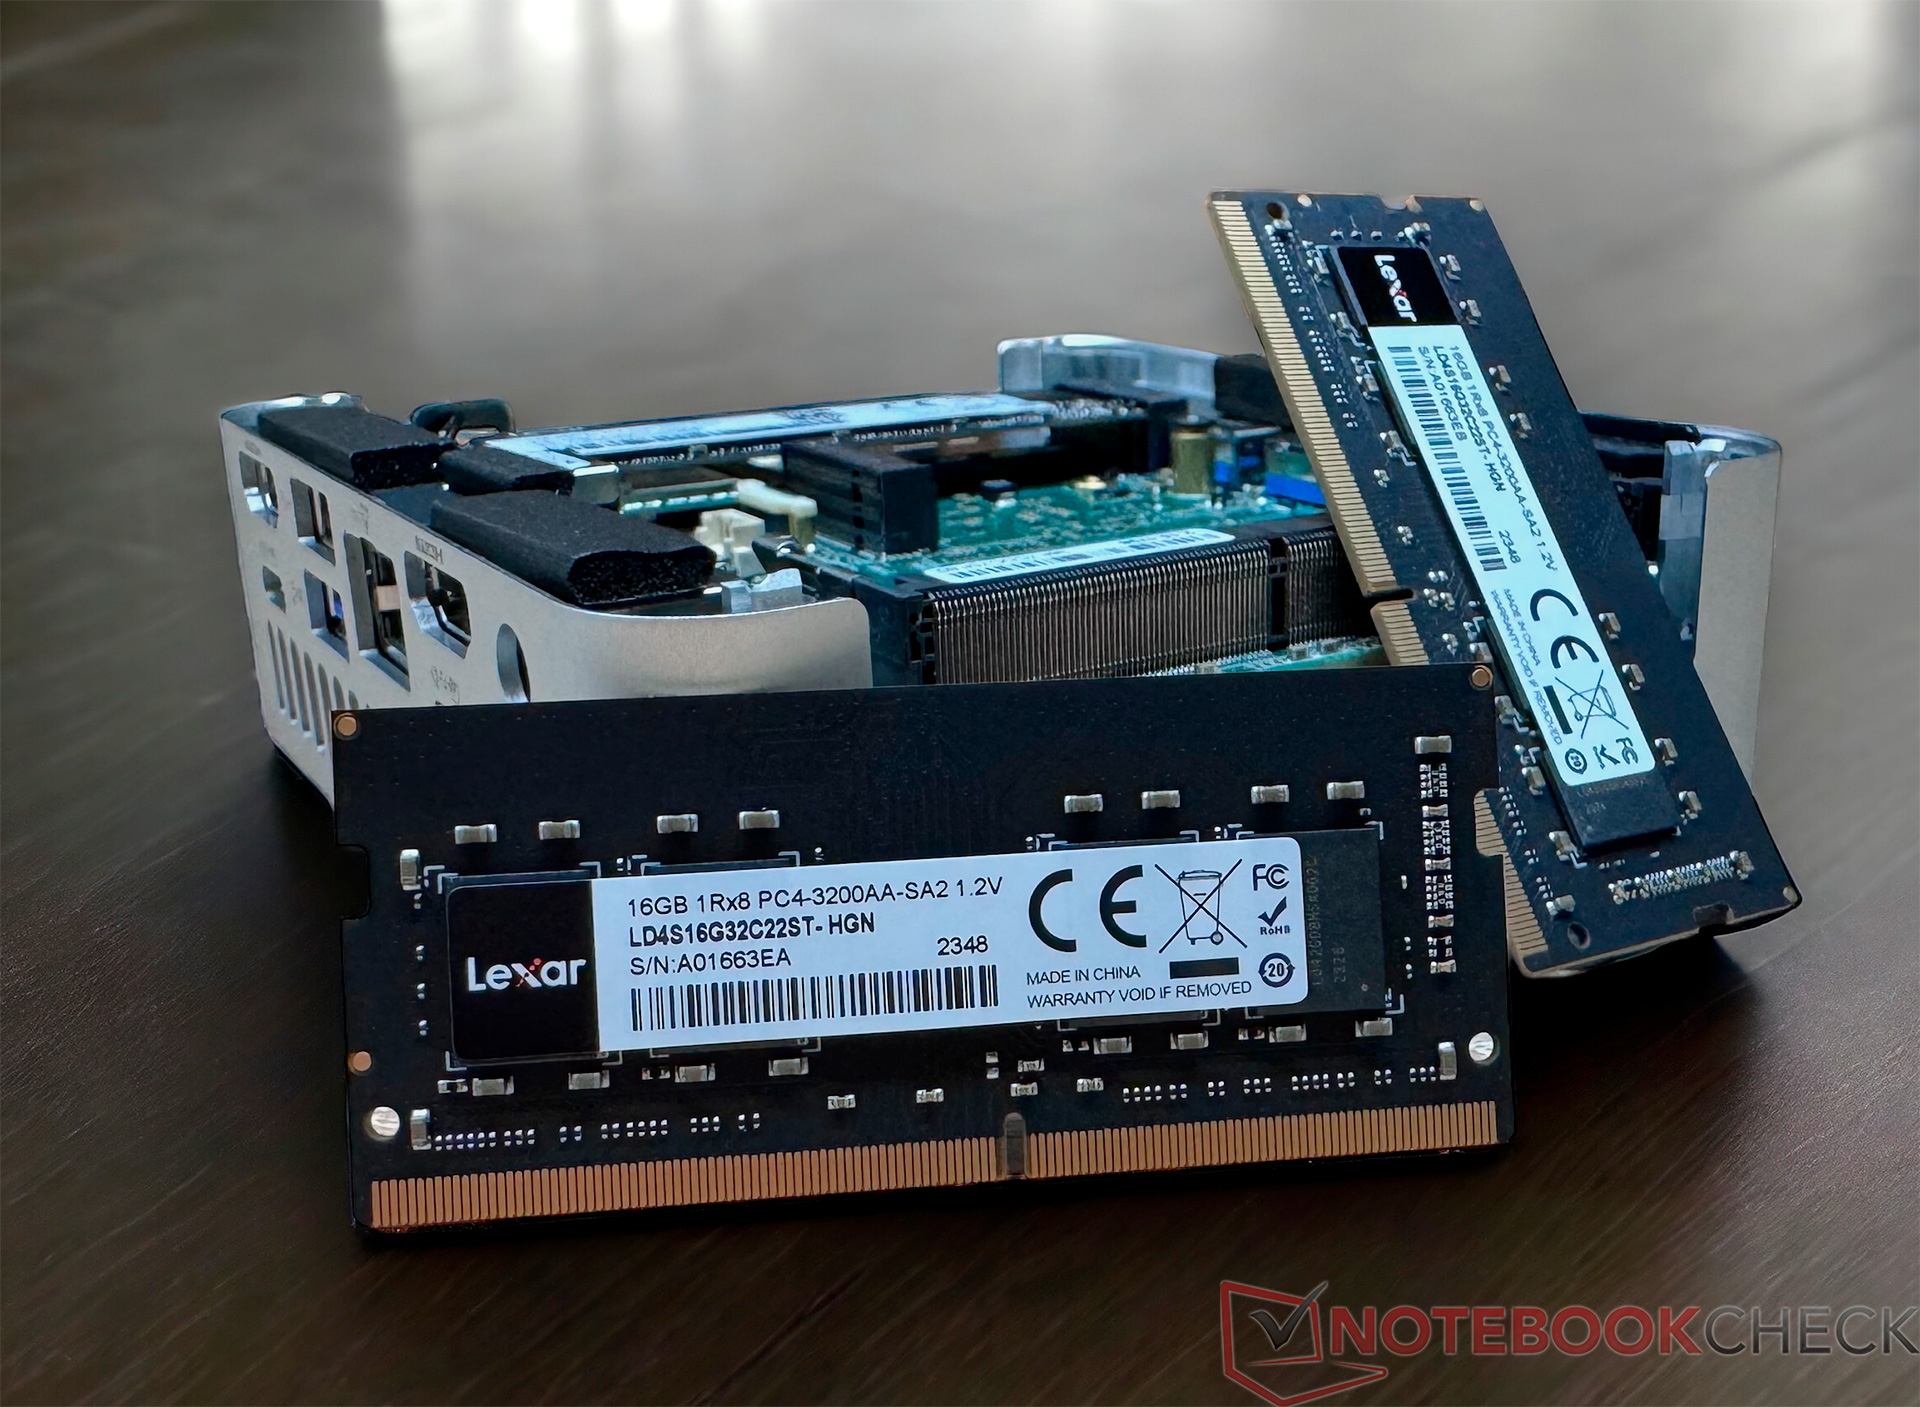
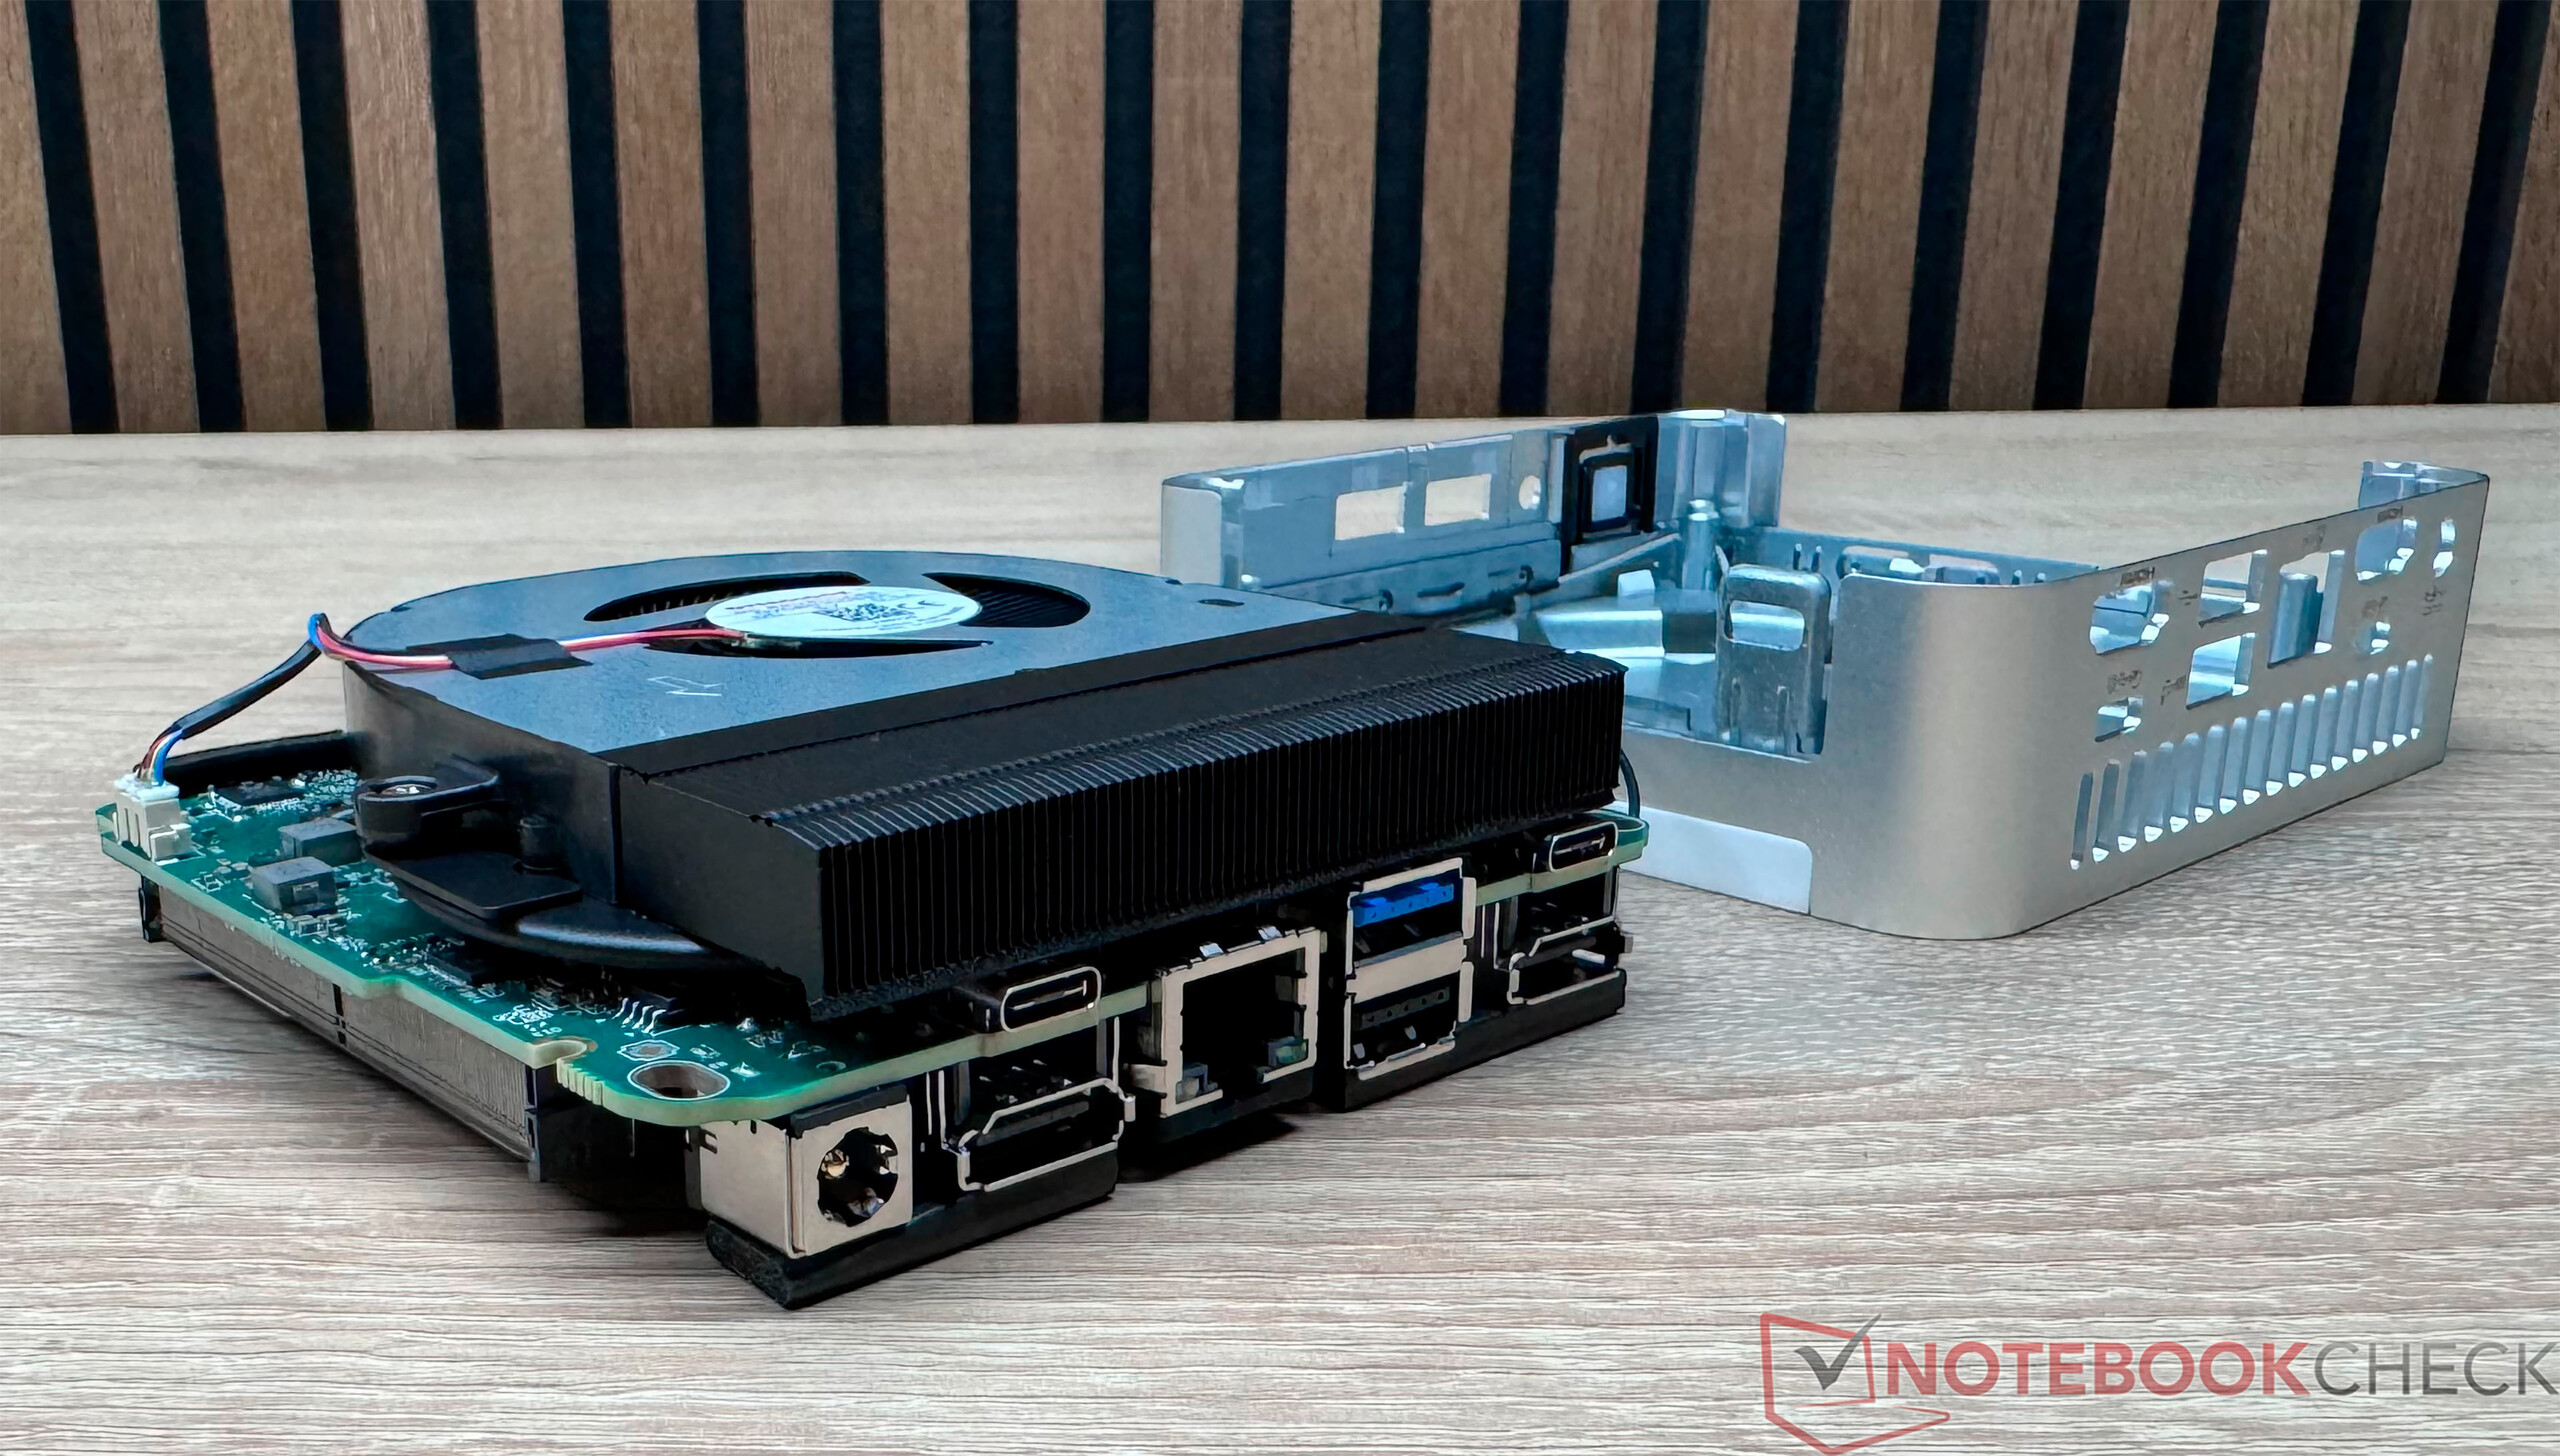
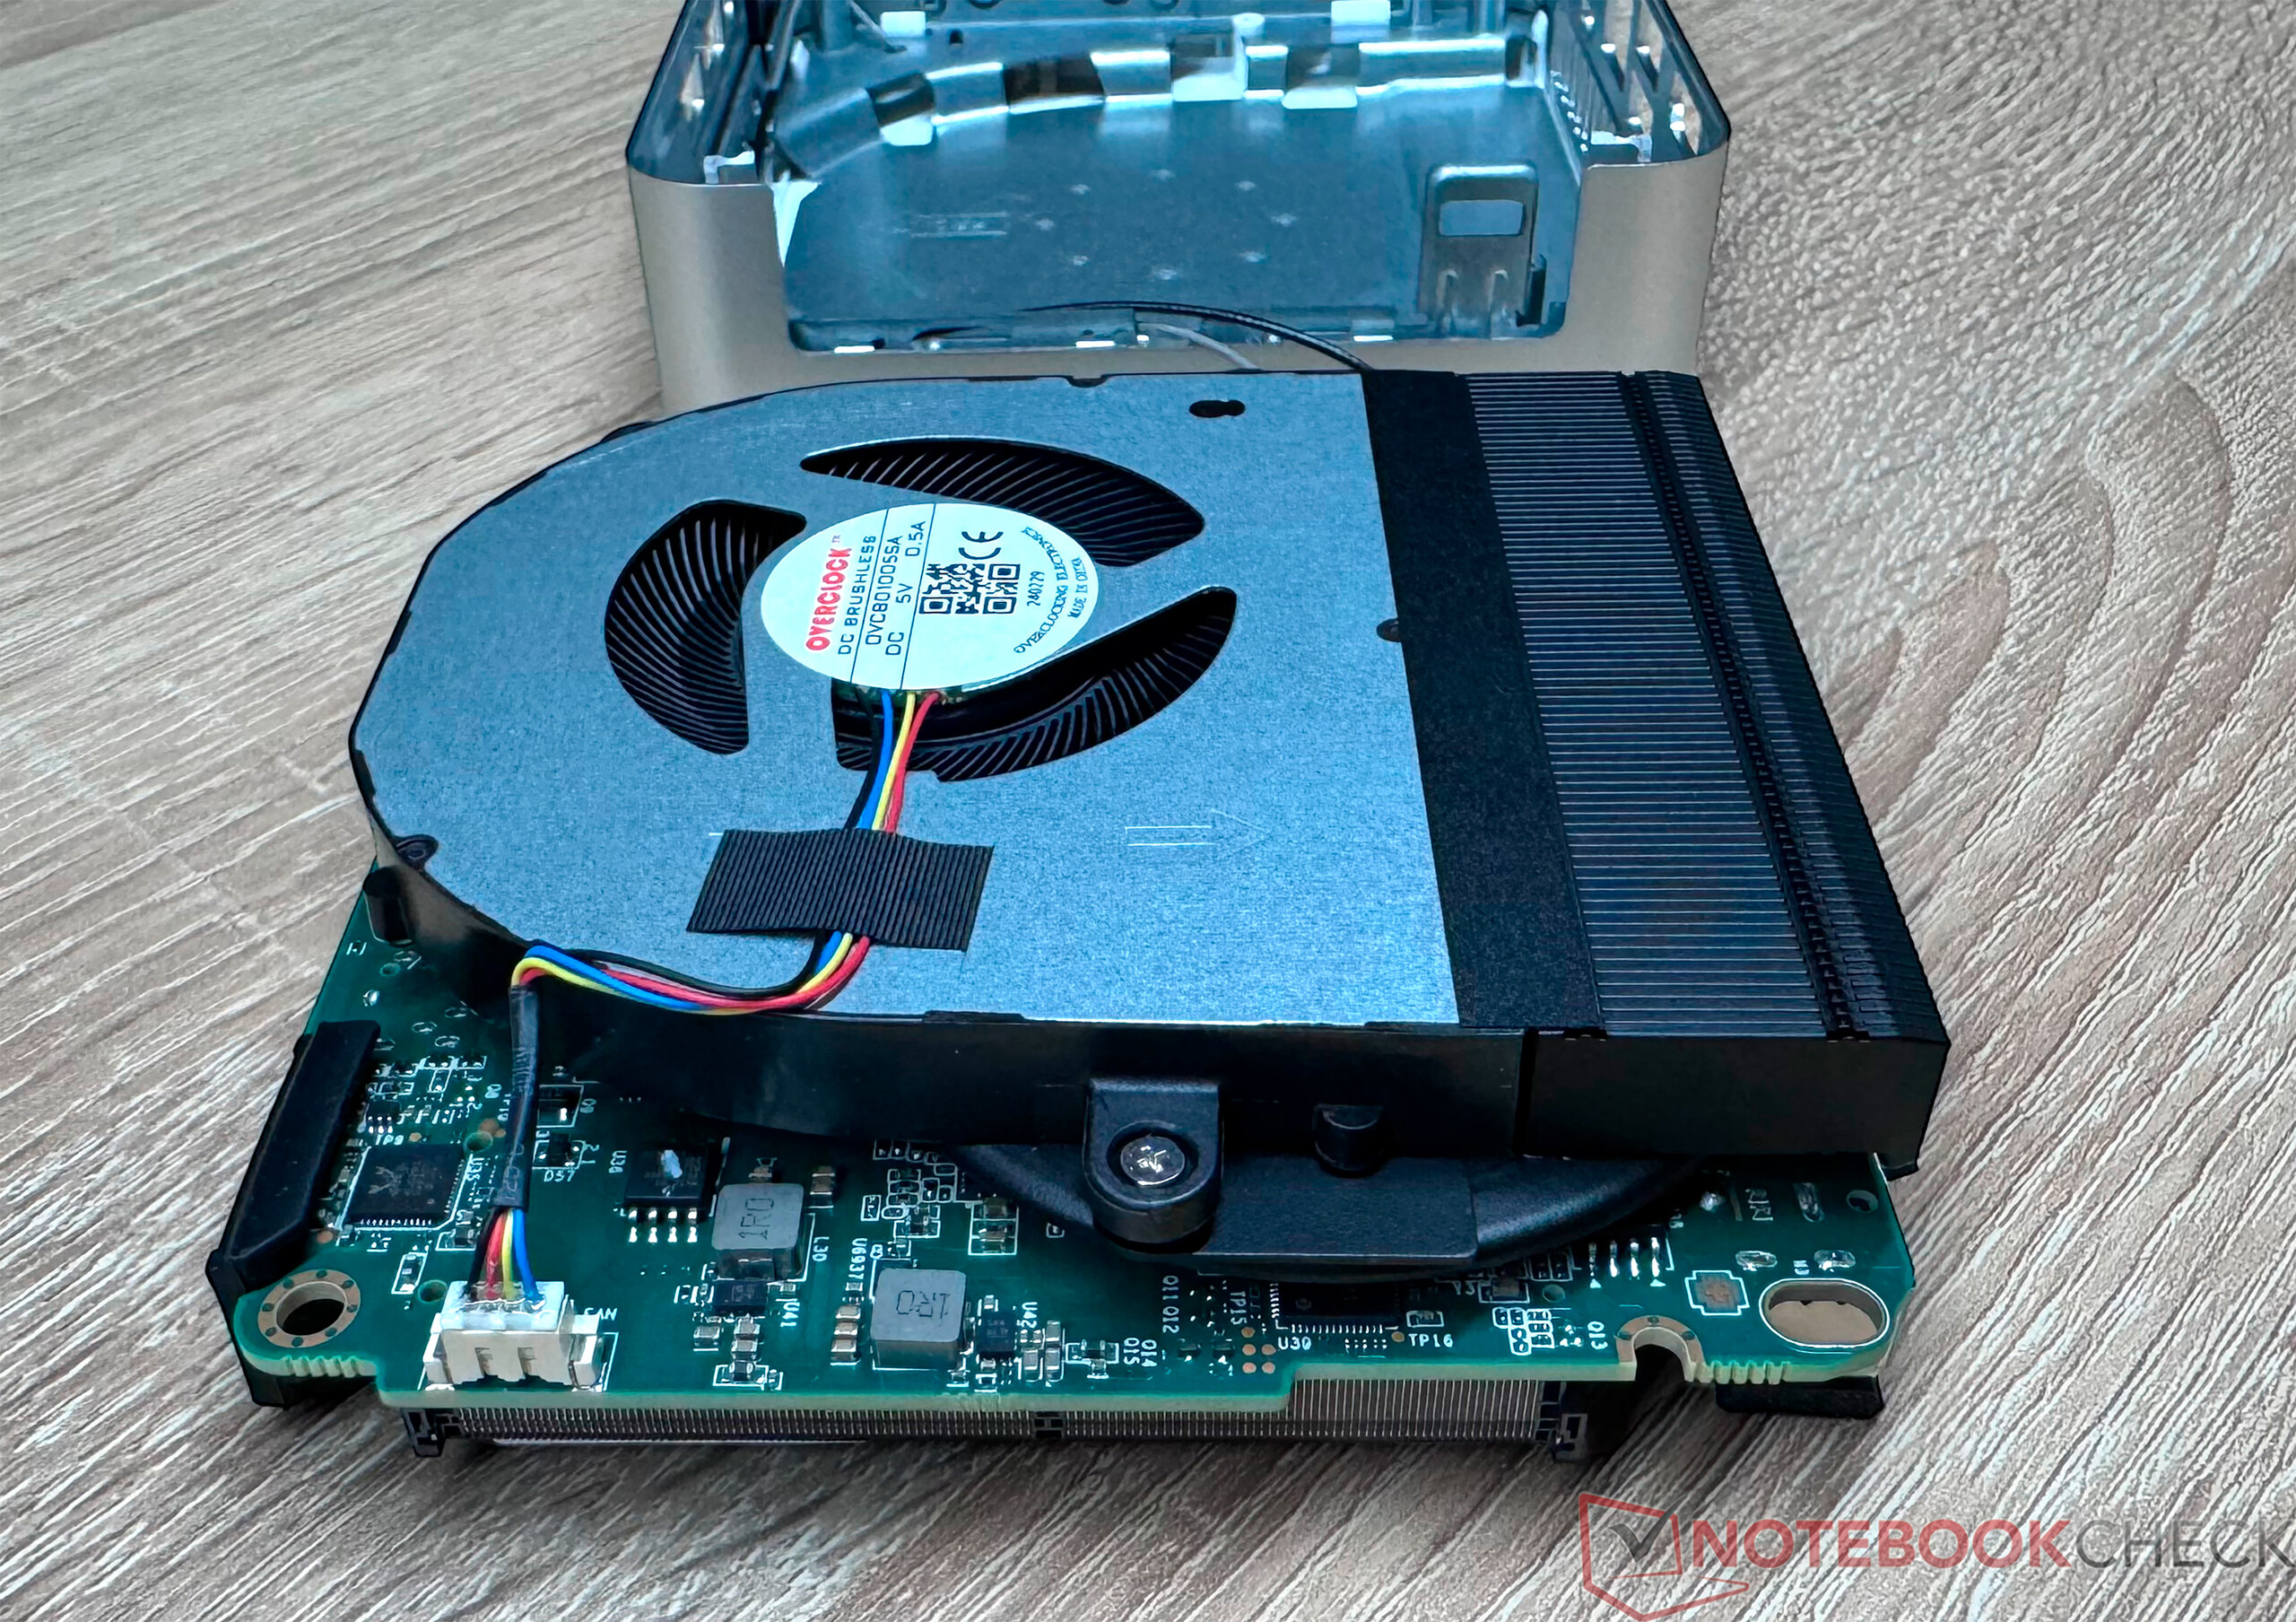
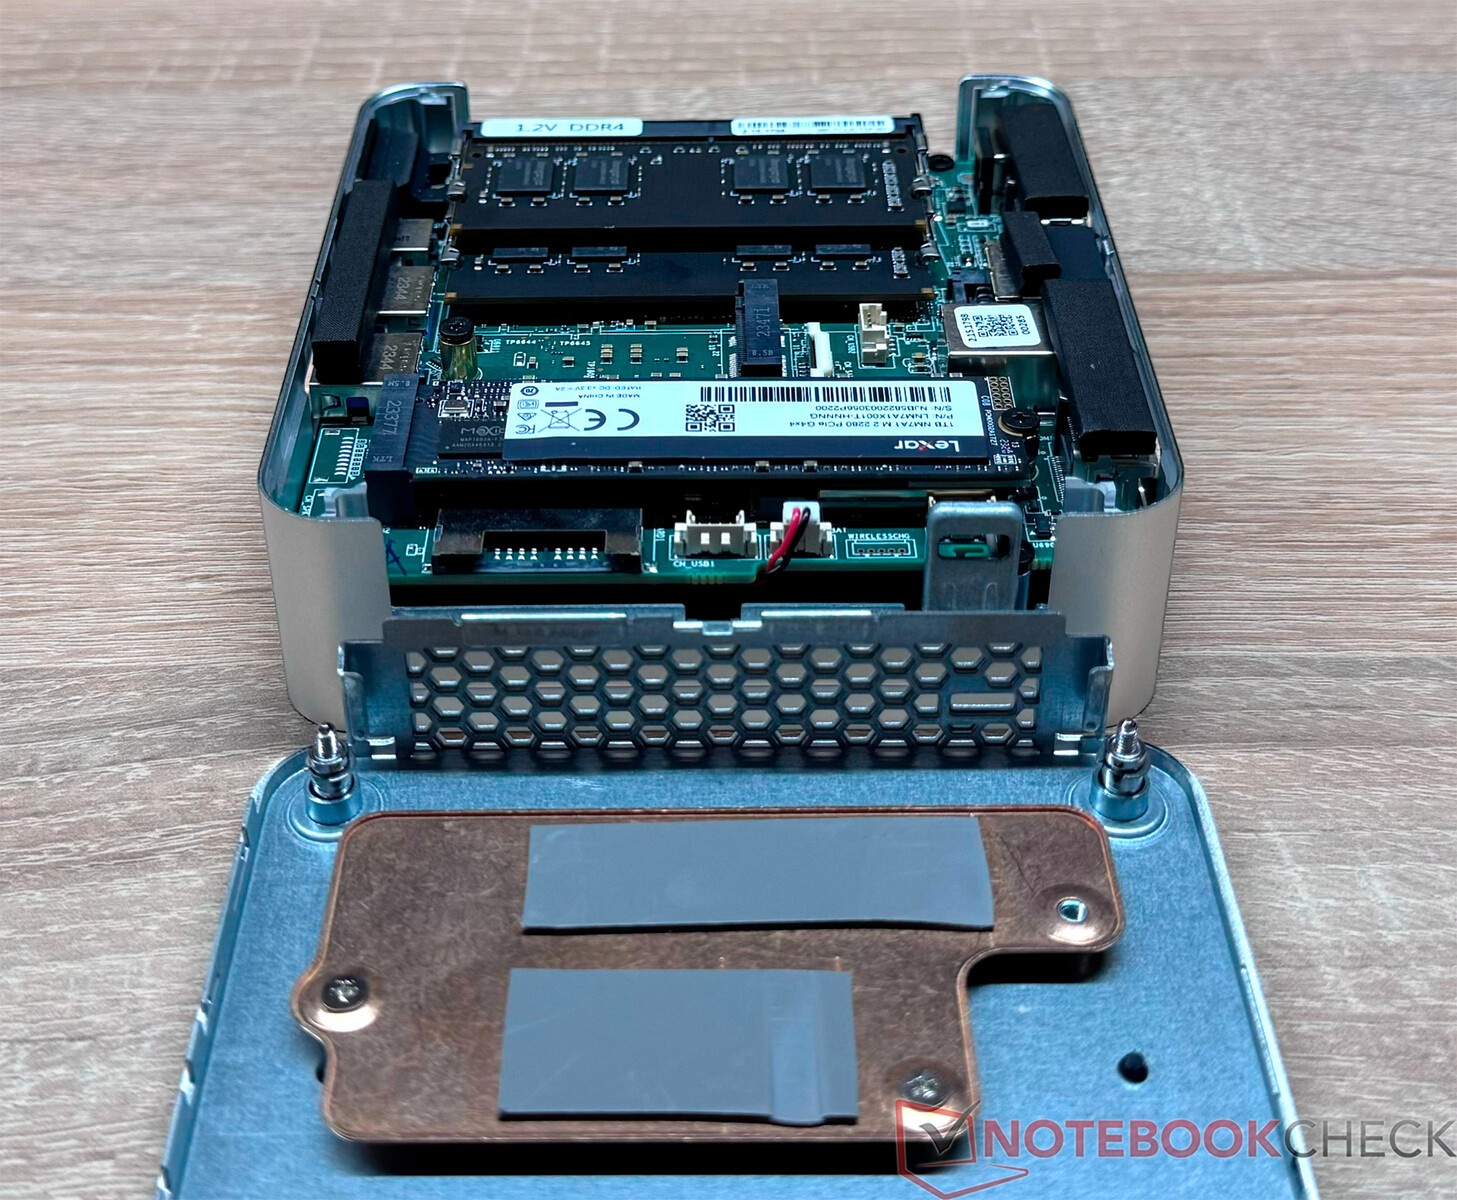
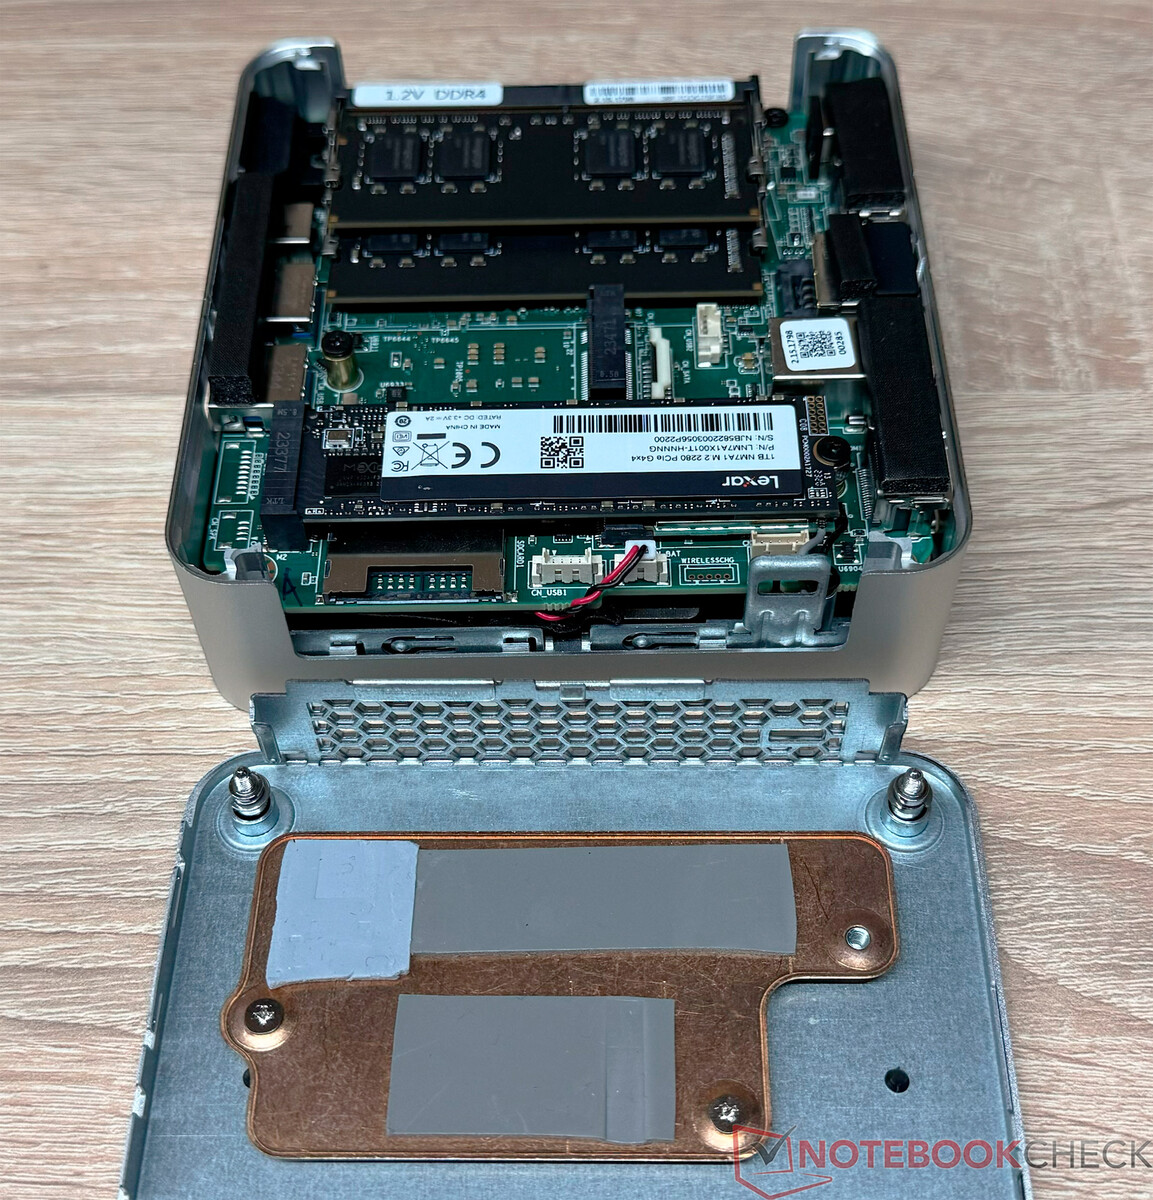
Wartung
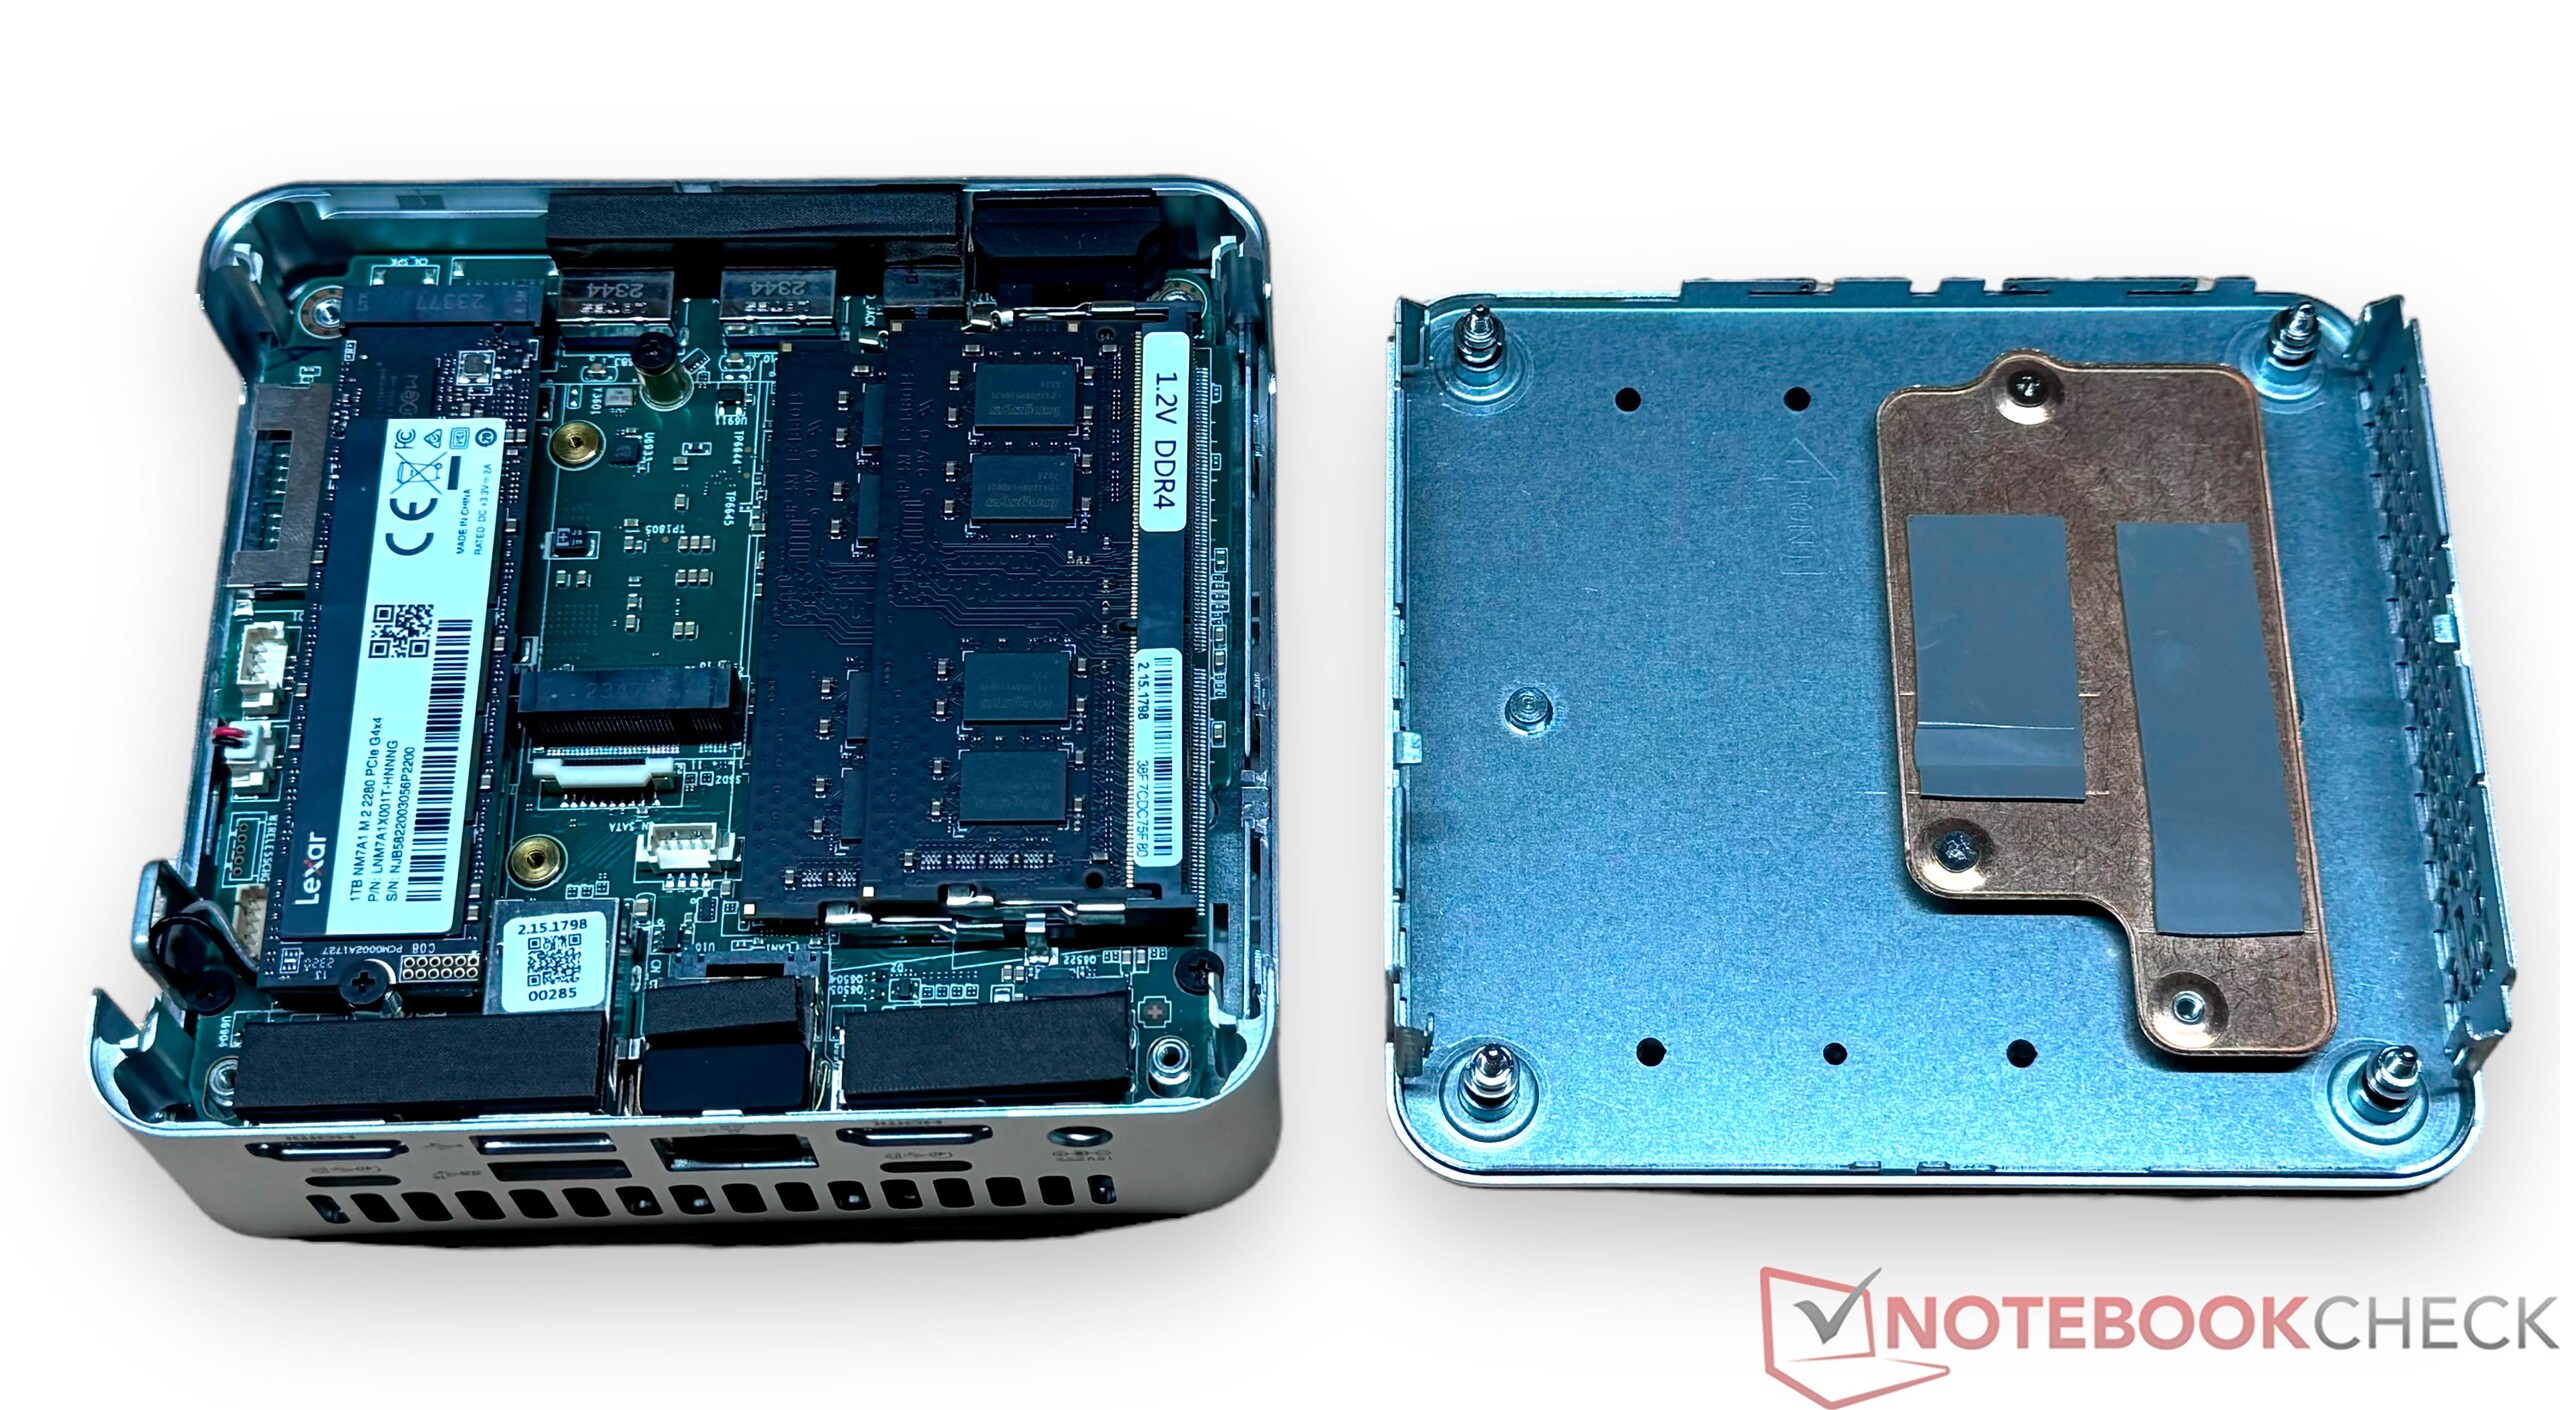
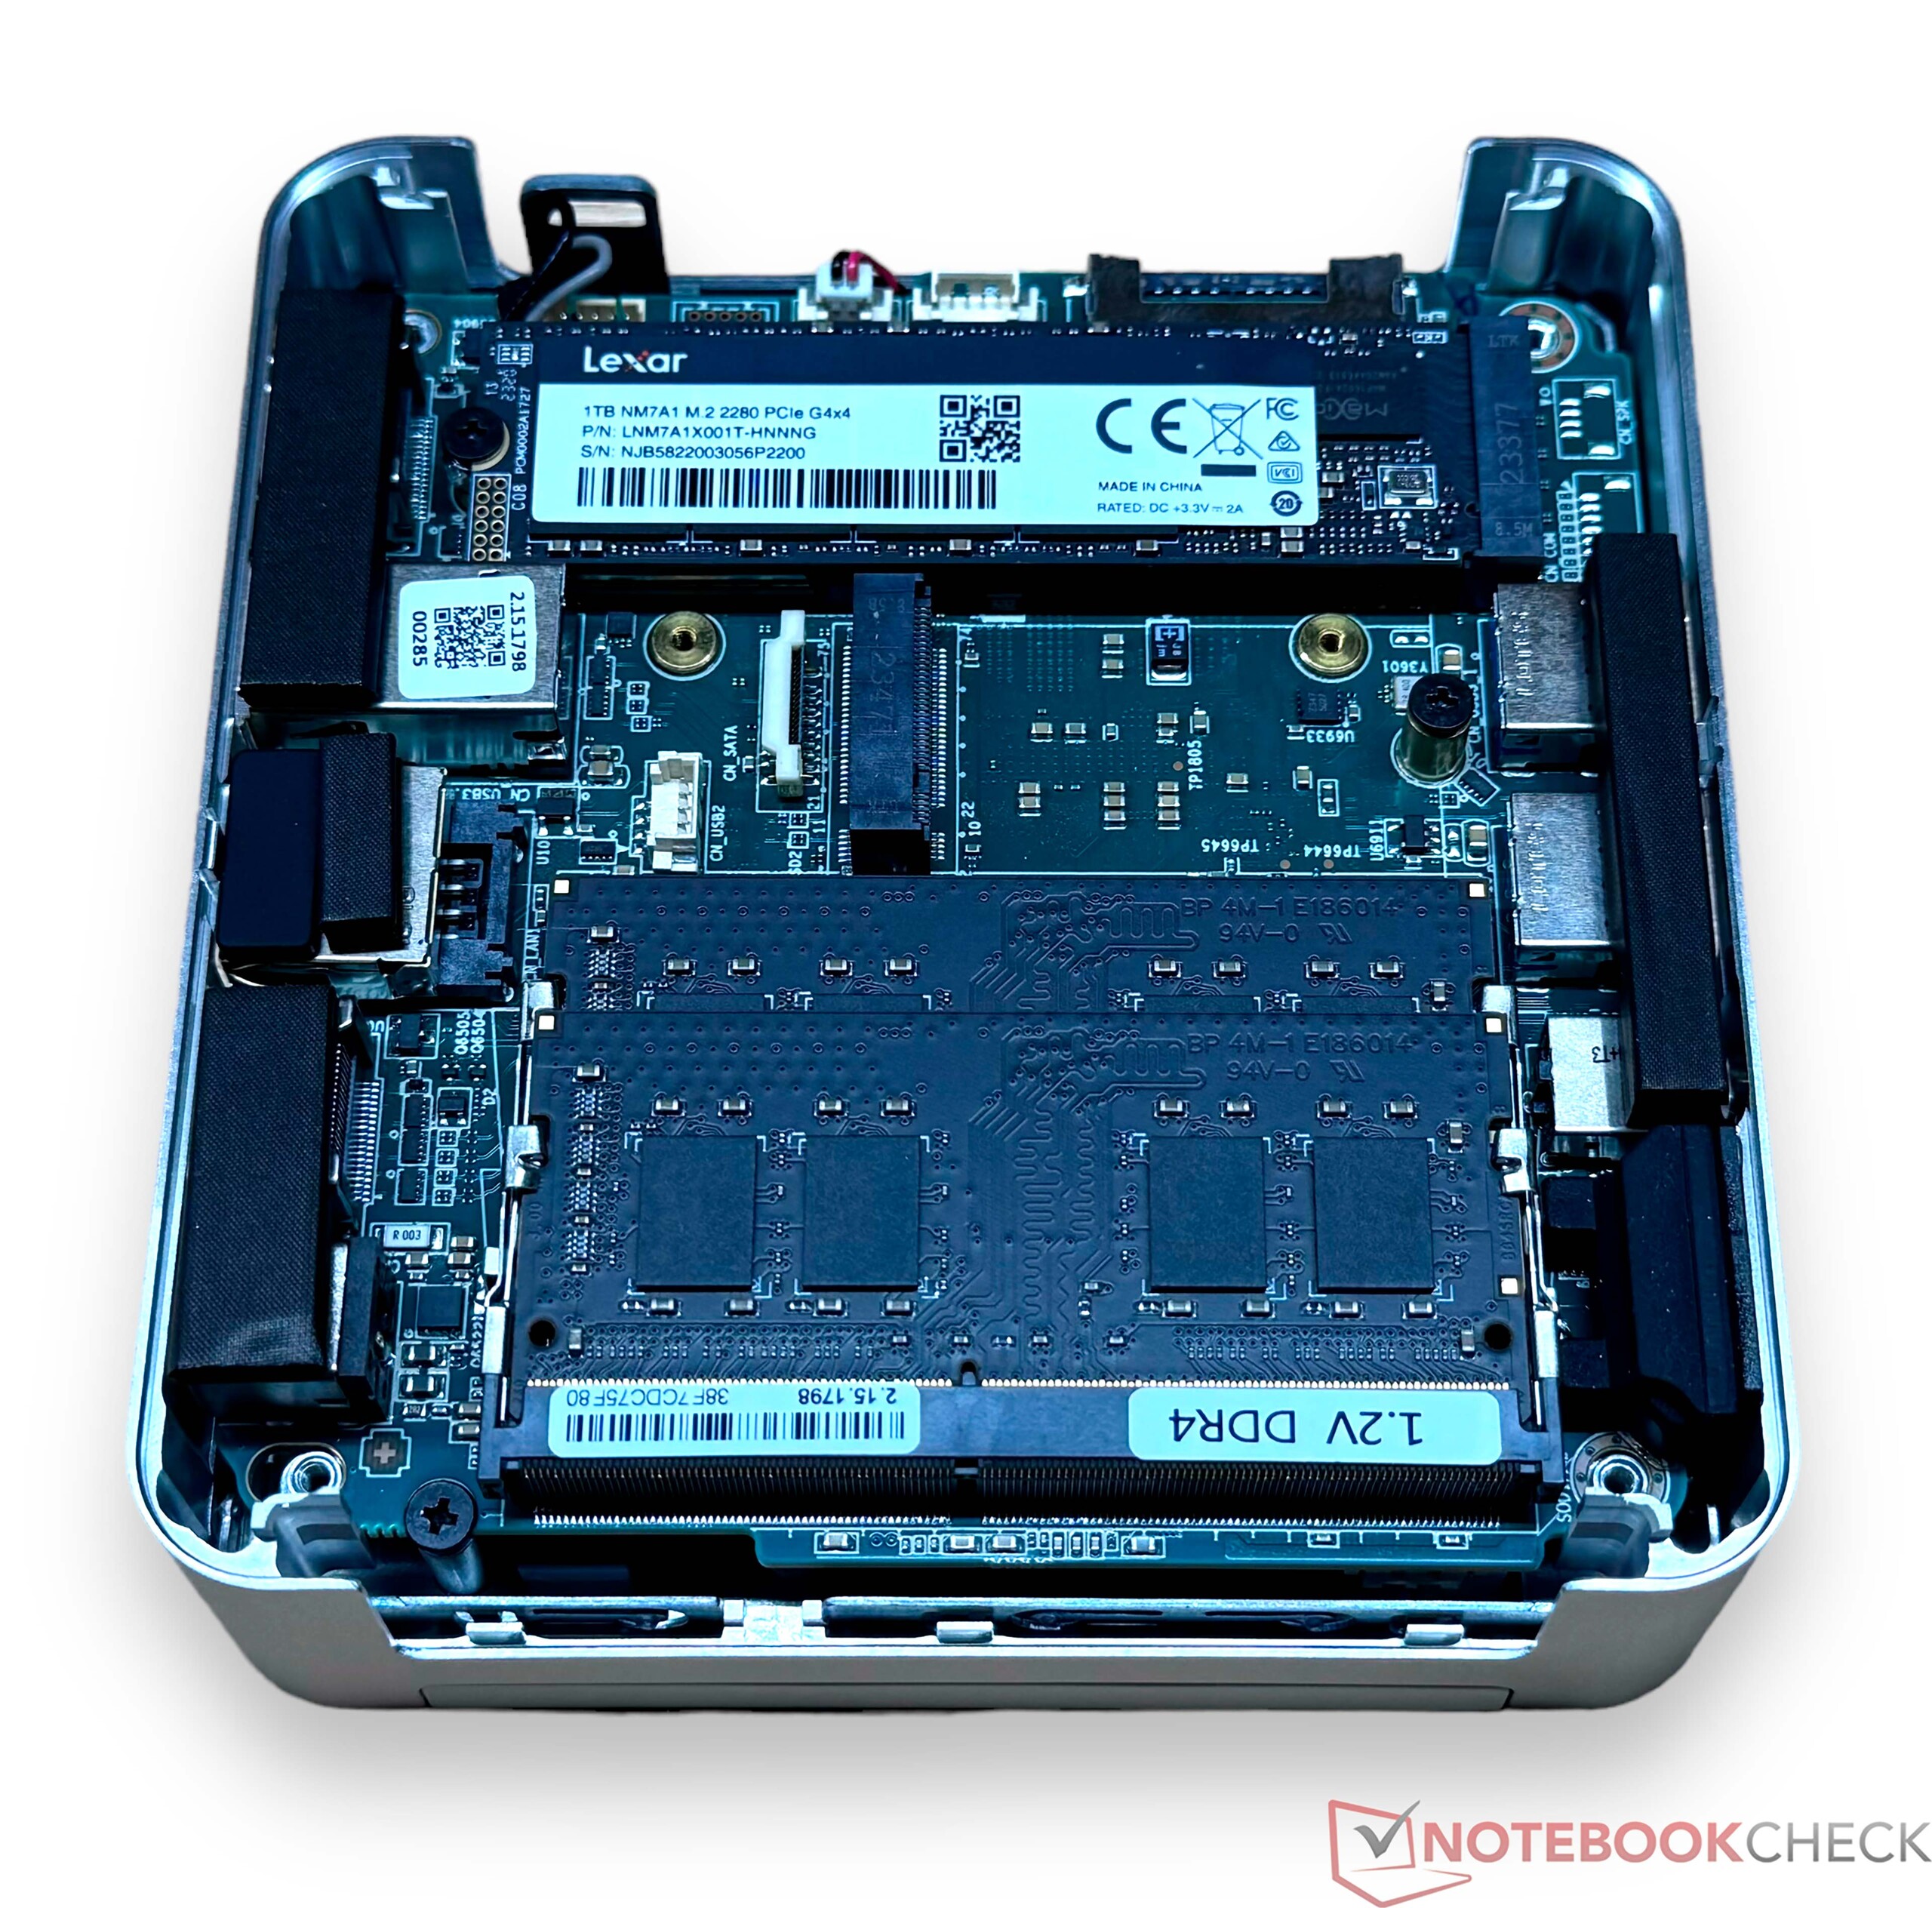
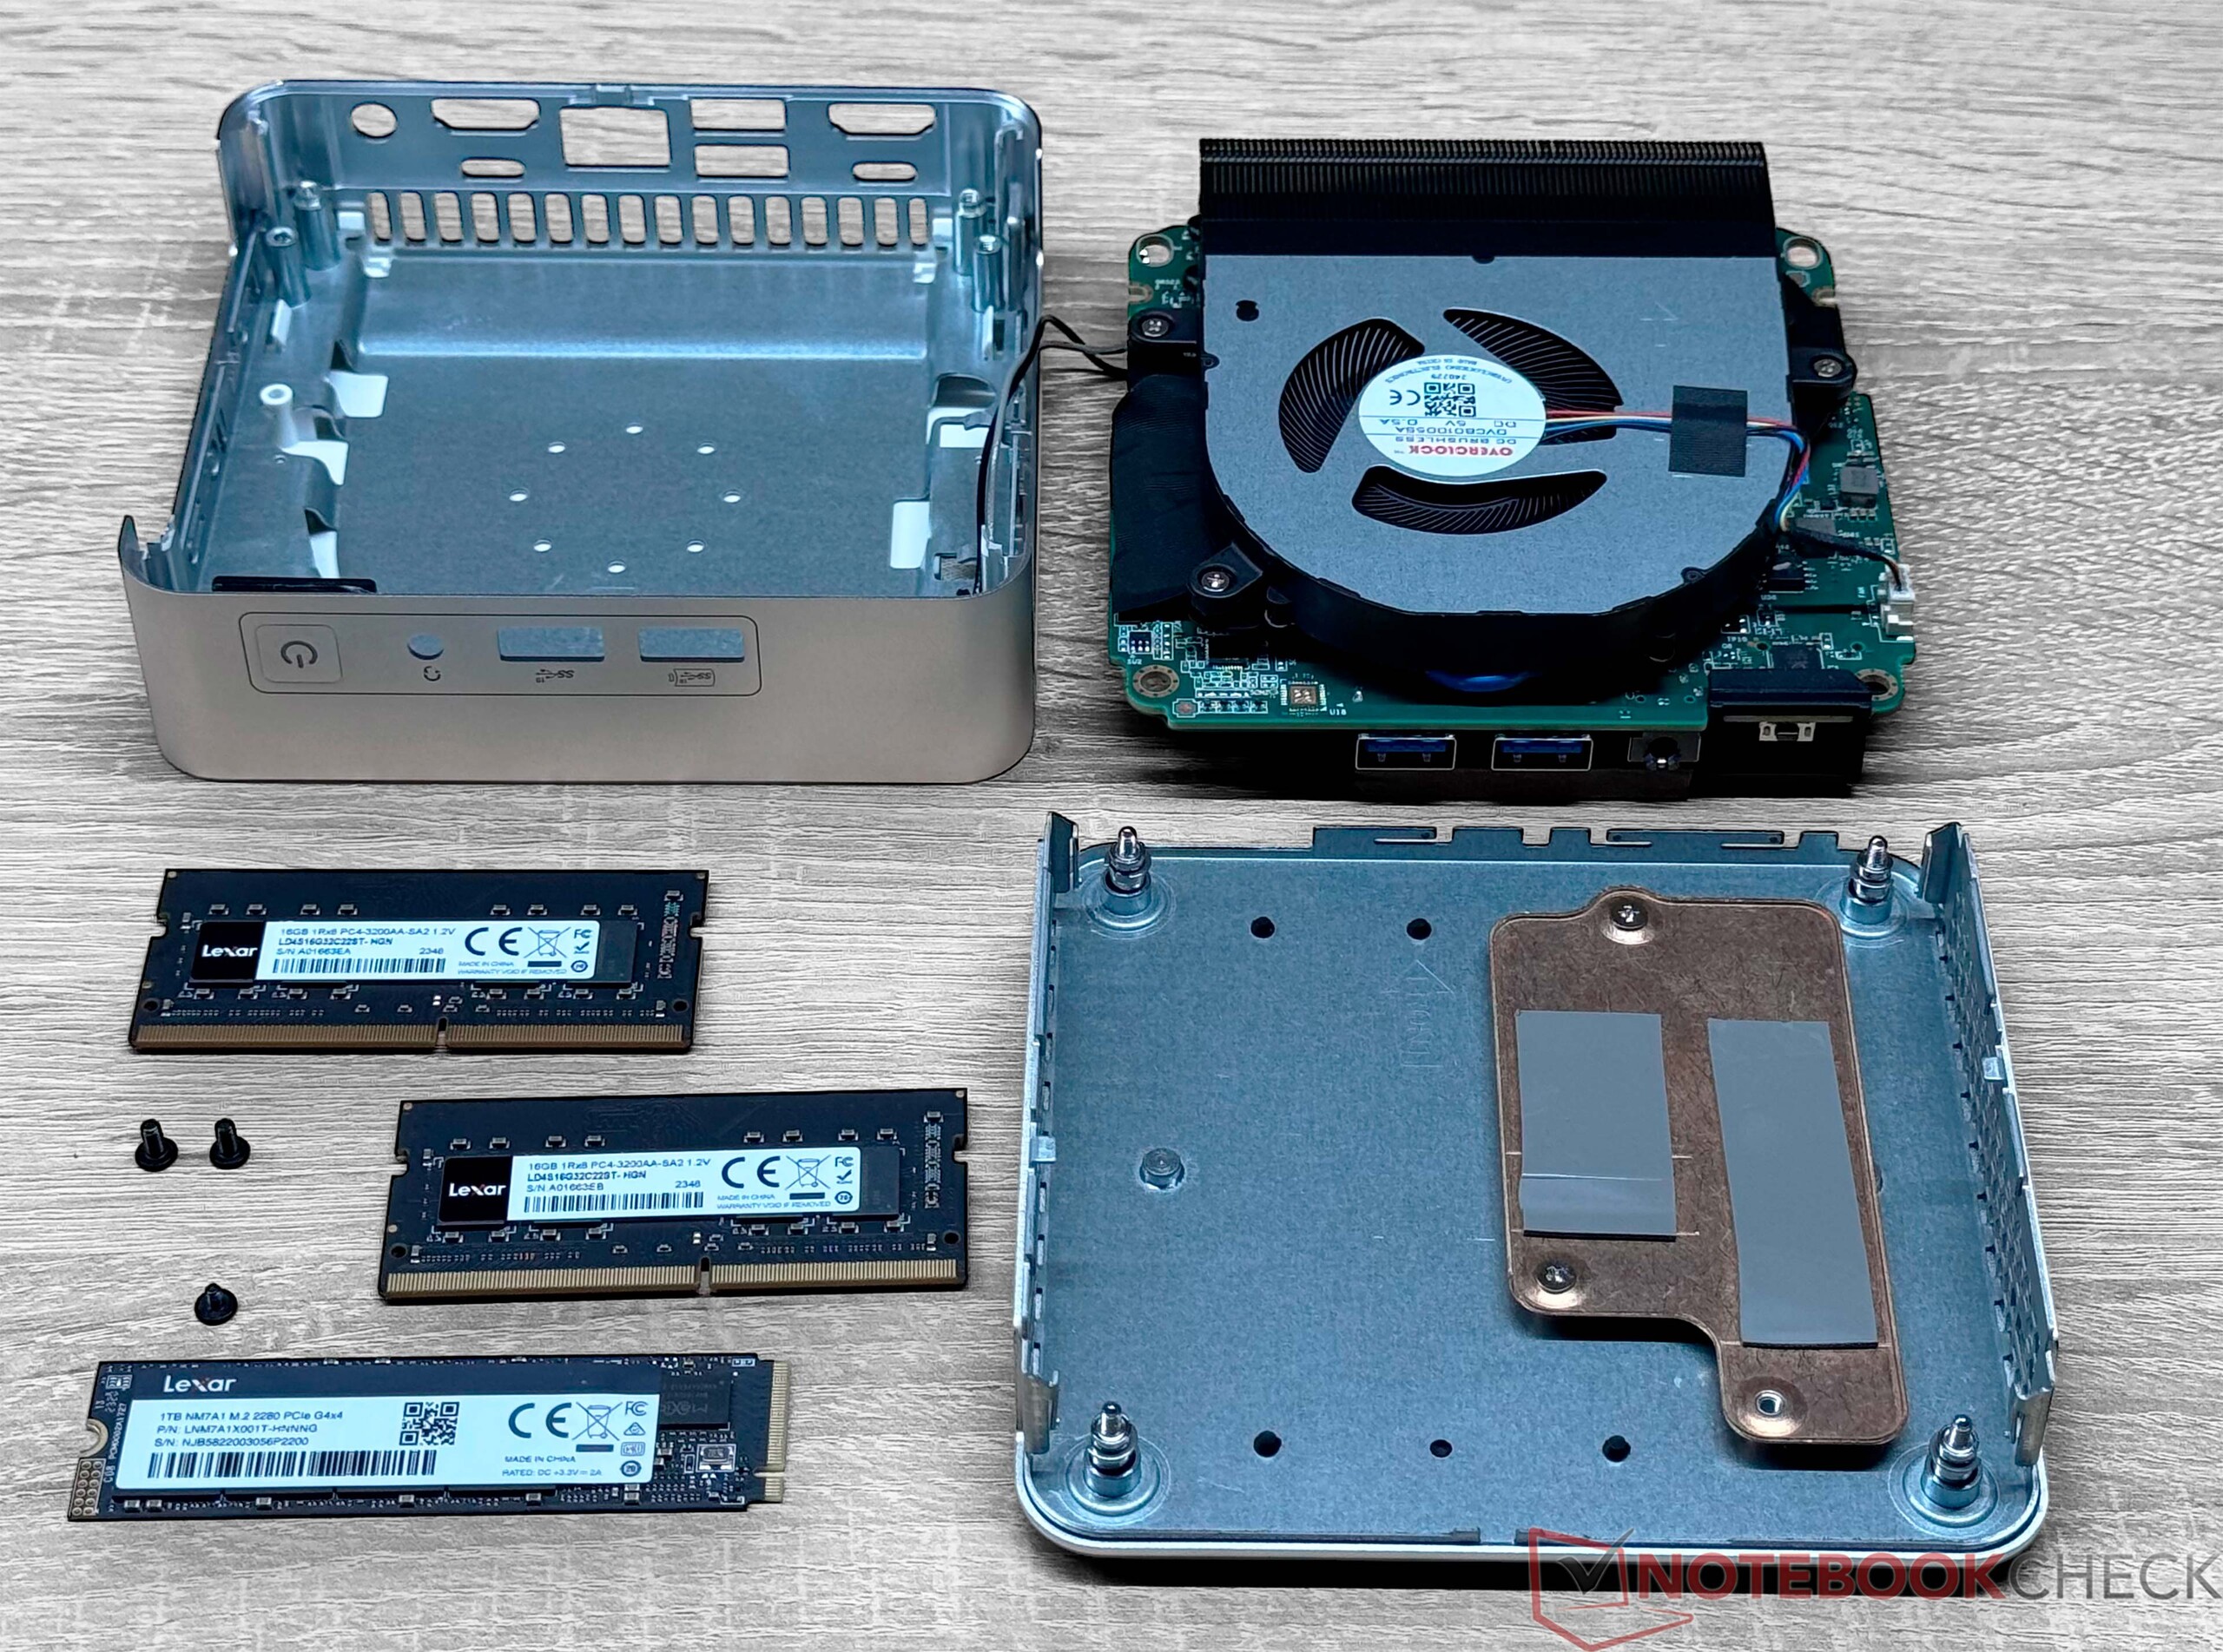
Öffnen lässt sich der Geekom XT12 Pro ohne große Probleme. Vier leicht zugängliche Schrauben fixieren die Bodenplatte am Gehäuse. Sind diese gelöst, lässt sich die Bodenplatte samt SSD-Kühler abnehmen. Aufgrund der Wärmeleitpads sollte man hier etwas vorsichtig vorgehen. Arbeitsspeicher und Massenspeicher sind dann leicht zugänglich. Im Gerät selbst lässt sich noch eine weitere SSD unterbringen. Allerdings sind hier nur SATA-SSDs mit einer Länge von 42 Millimetern installierbar.
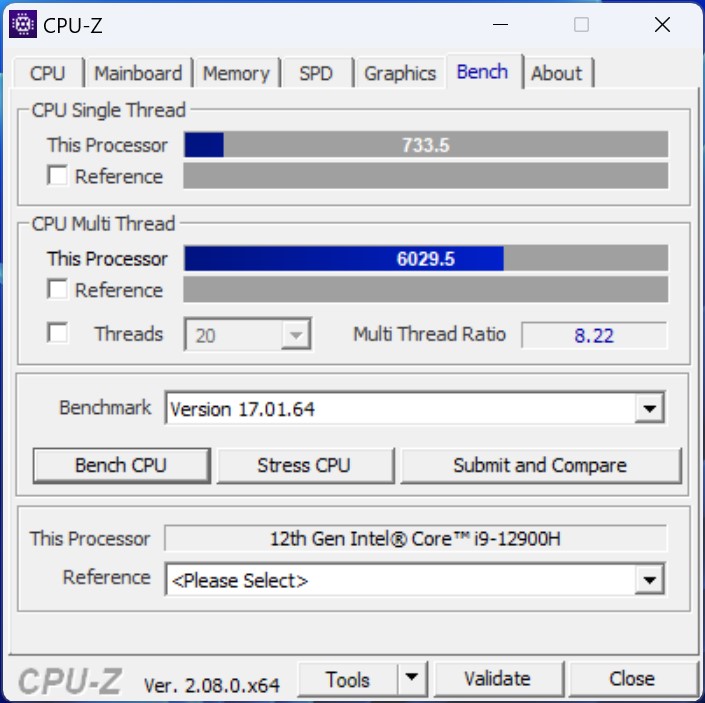
Leistung - Intel Core i9-12900H hat 14 Kerne mit 20 Threads
Den Geekom XT12 Pro gibt es ausschließlich in der von uns getesteten Version. Der Intel Core i9-12900H bietet dabei eine recht solide Grundlage, um auch leistungshungrige Aufgaben zu meistern. Zusammen mit den 32 GB Arbeitsspeicher und der 1 TB fassenden SSD ist man hier fürs Erste einmal gut ausgerüstet.
Testbedingungen
Für alle Leistungstests mit dem Geekom XT12 Pro nutzen wir das Energieprofil "Höchstleistung". Abweichungen hierzu gab es nur bei den Energie- und Lautstärkemessungen gemäß unserer Testkriterien.
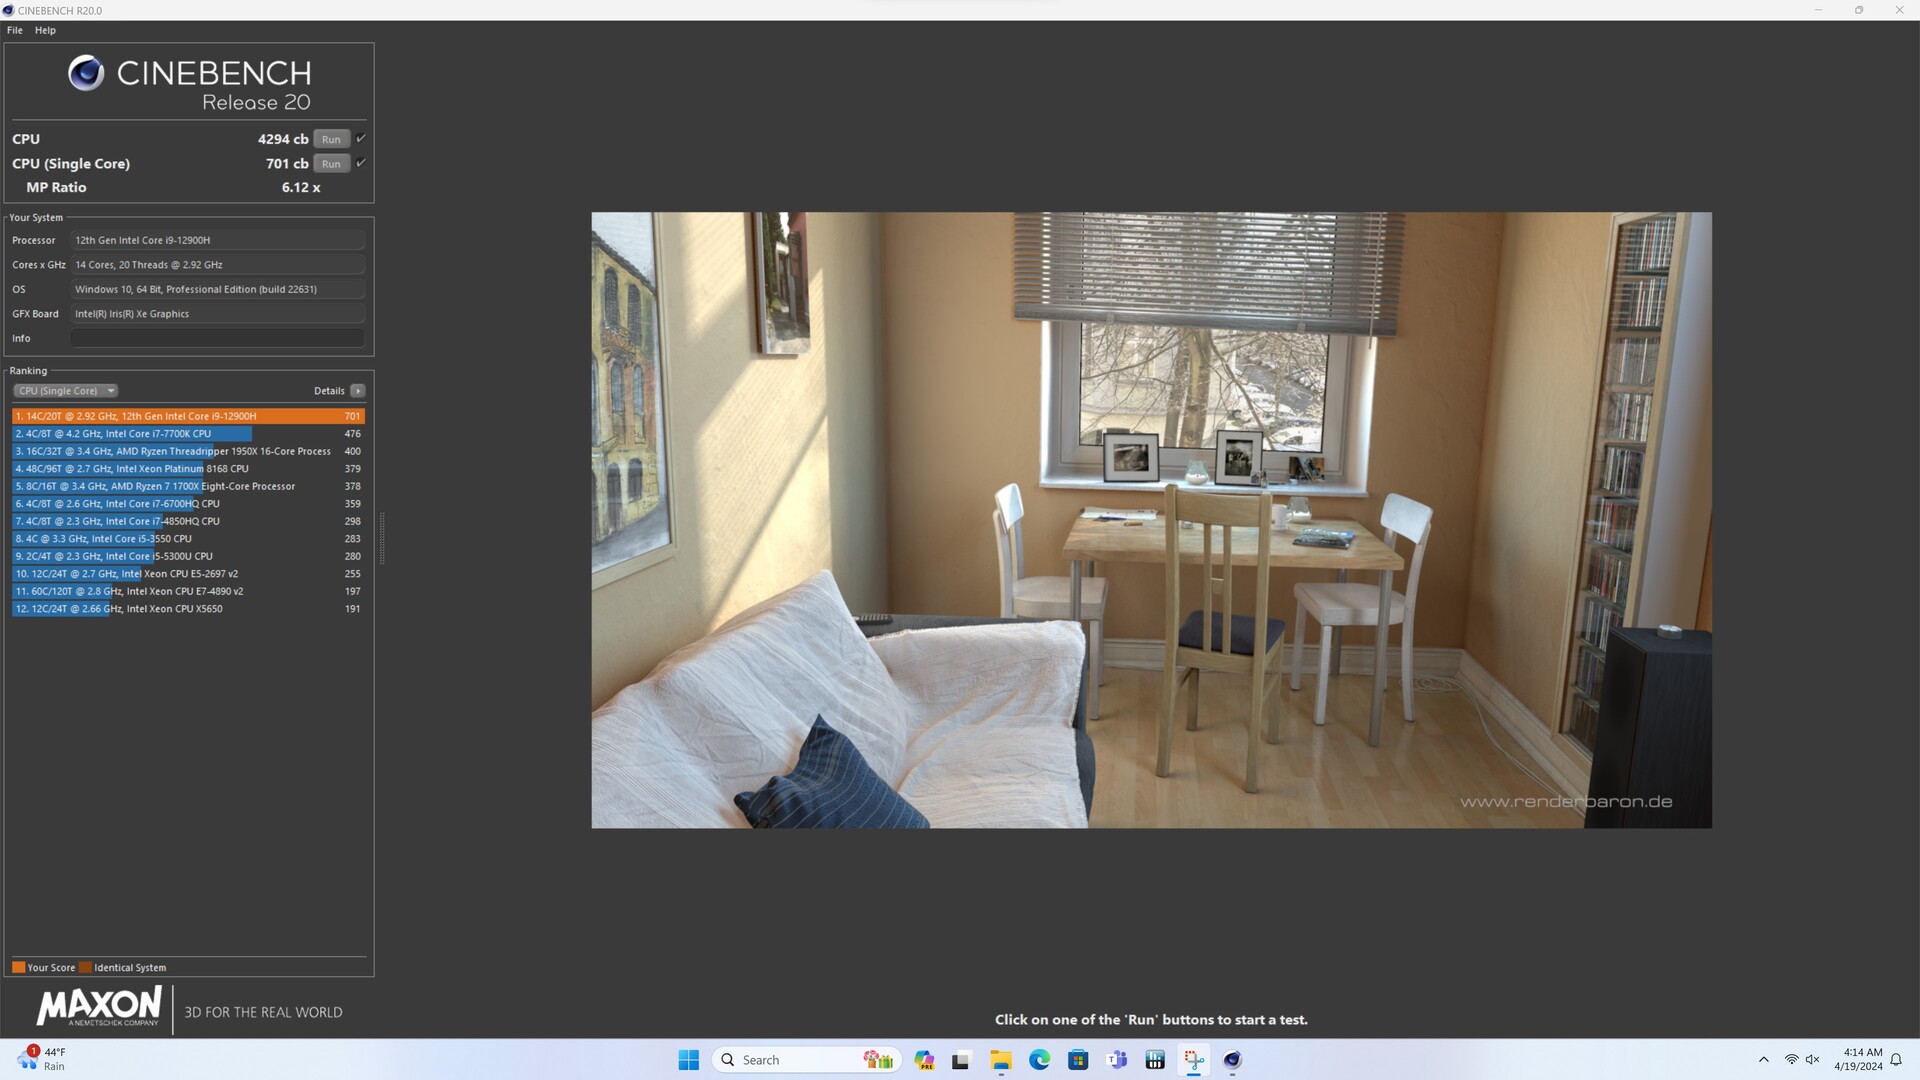
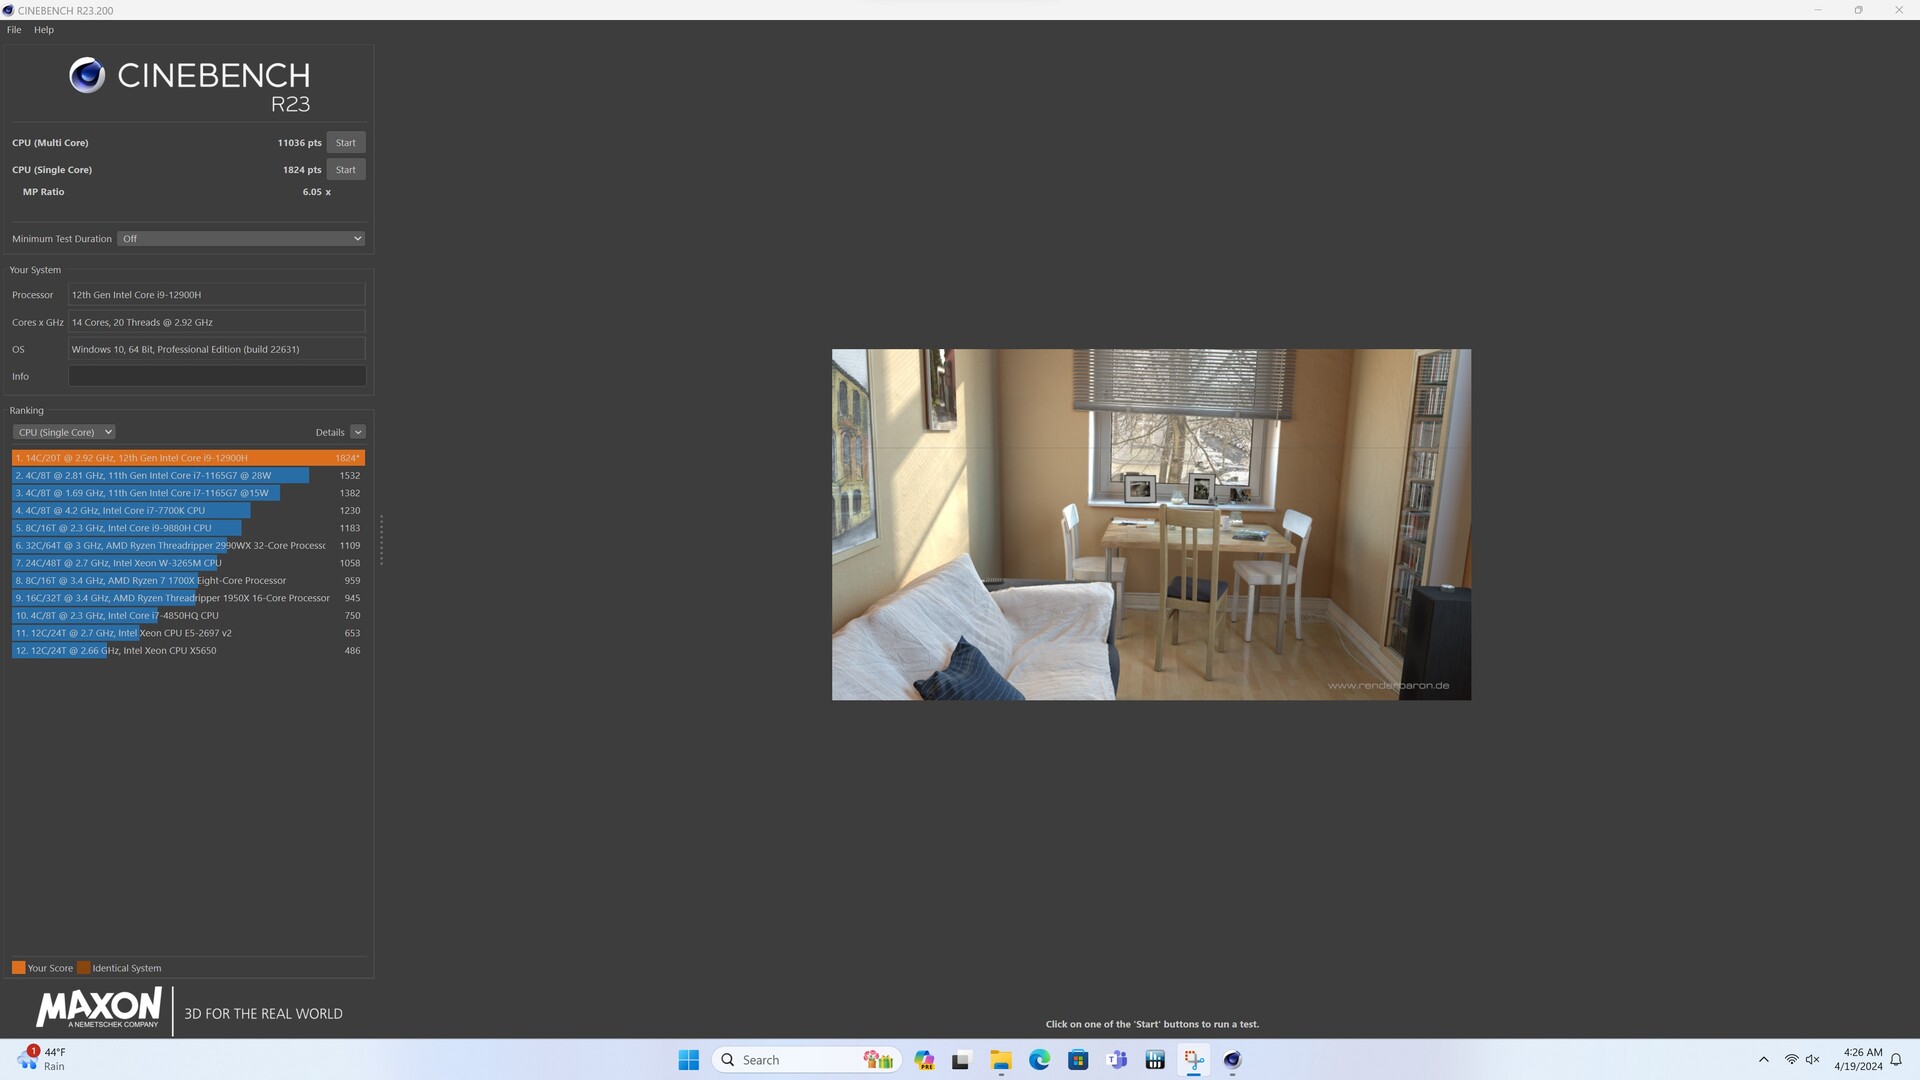
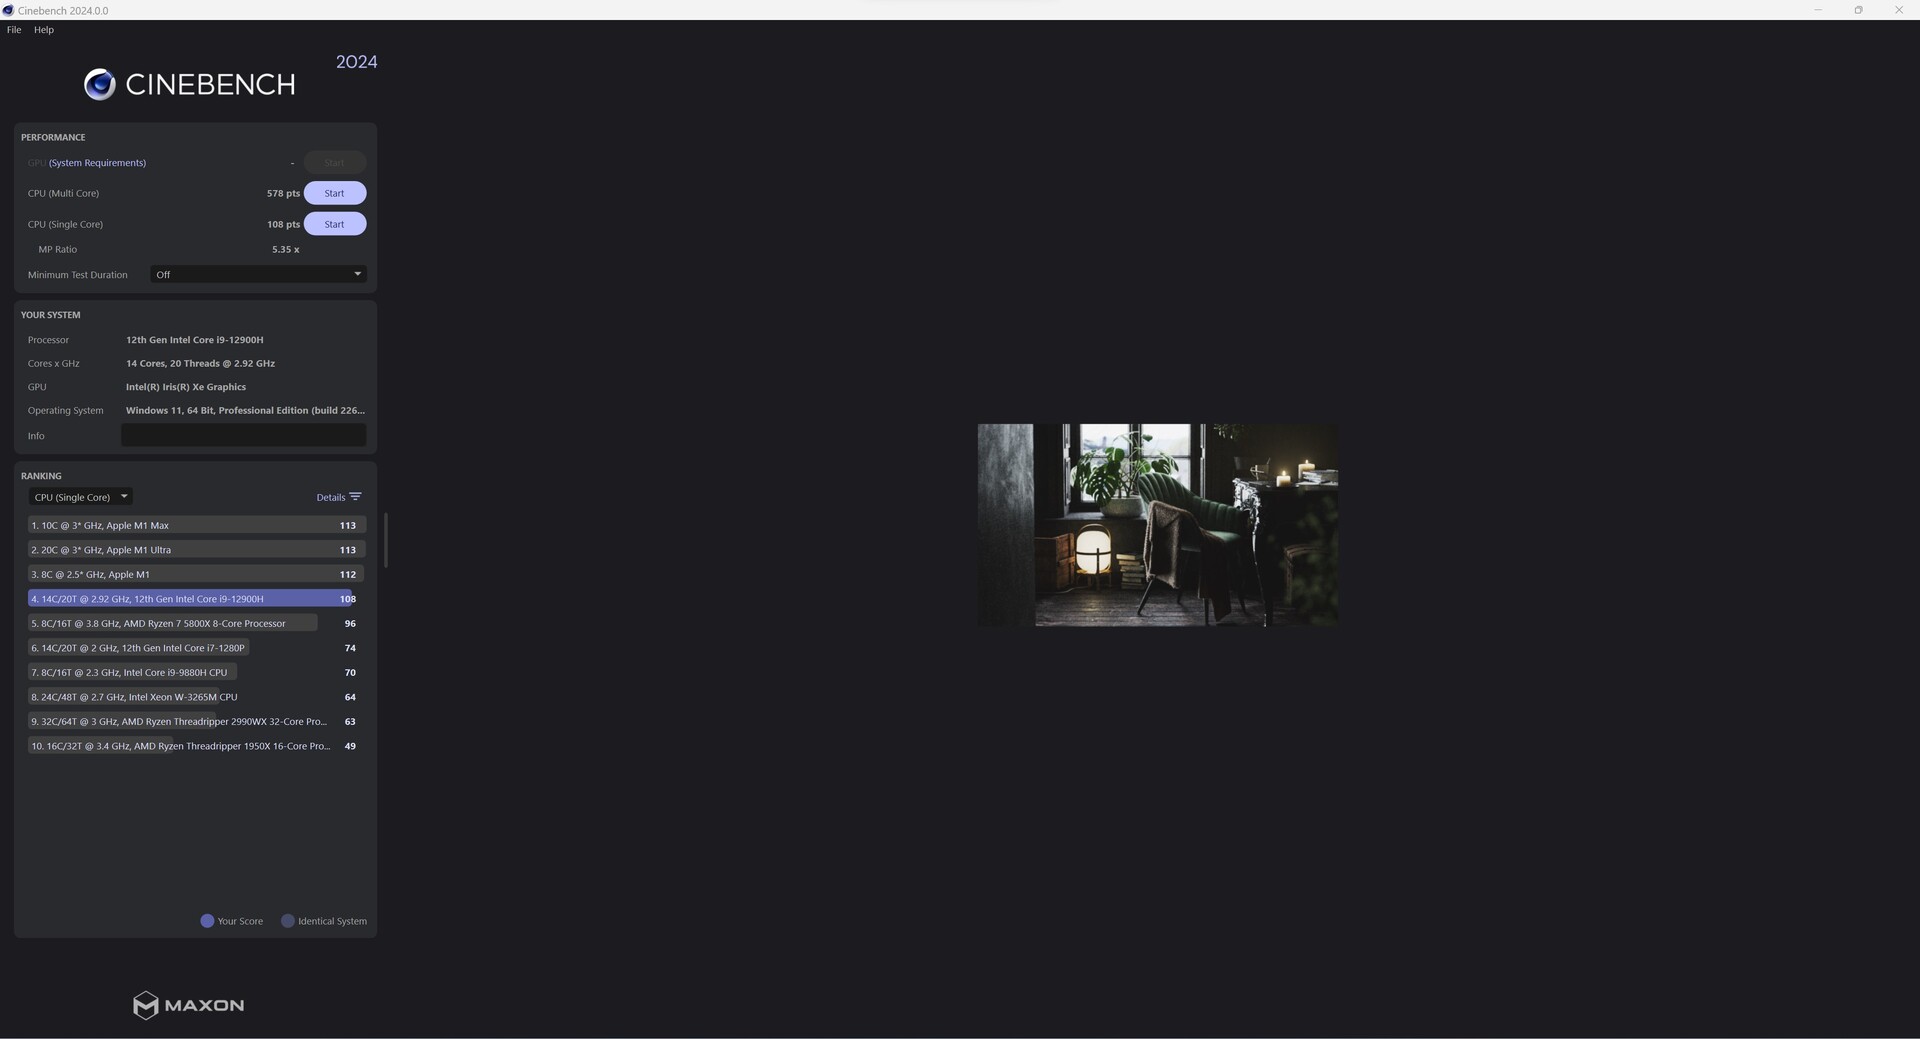
Prozessor
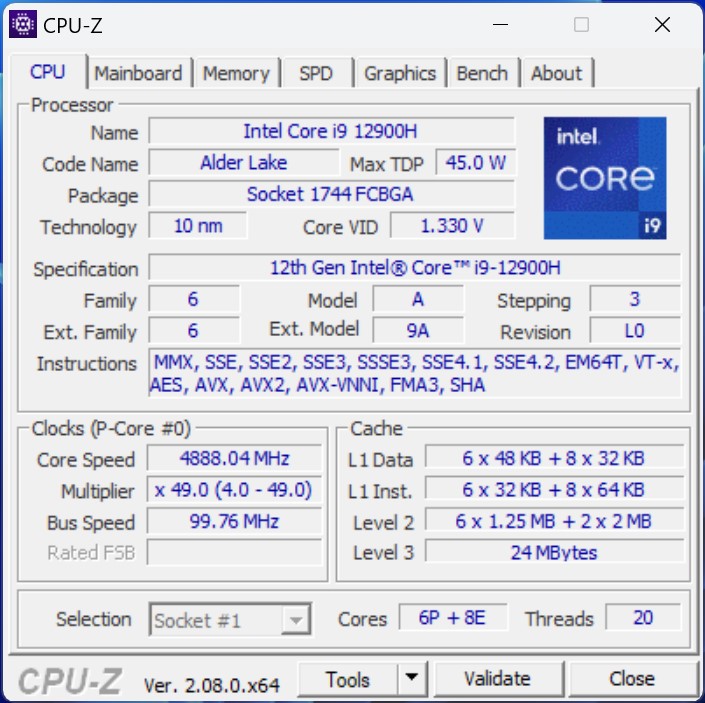
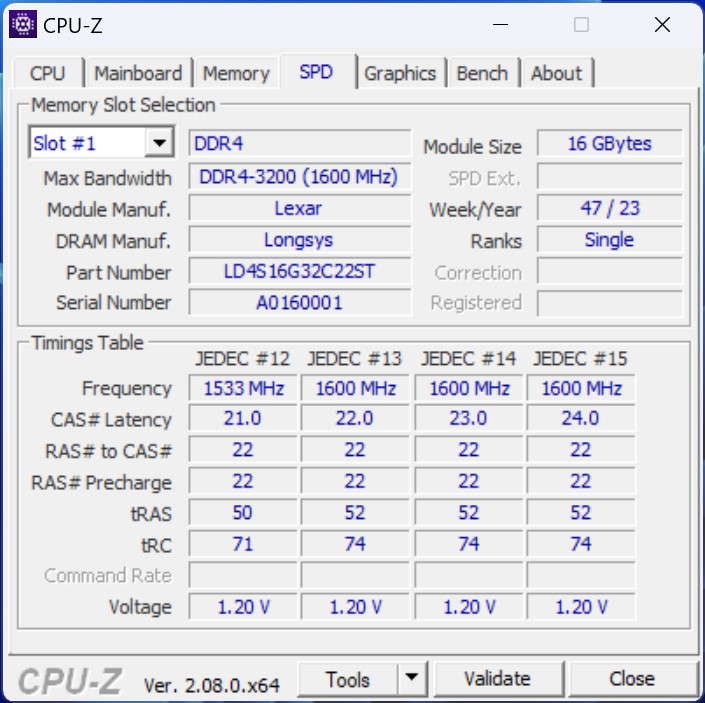
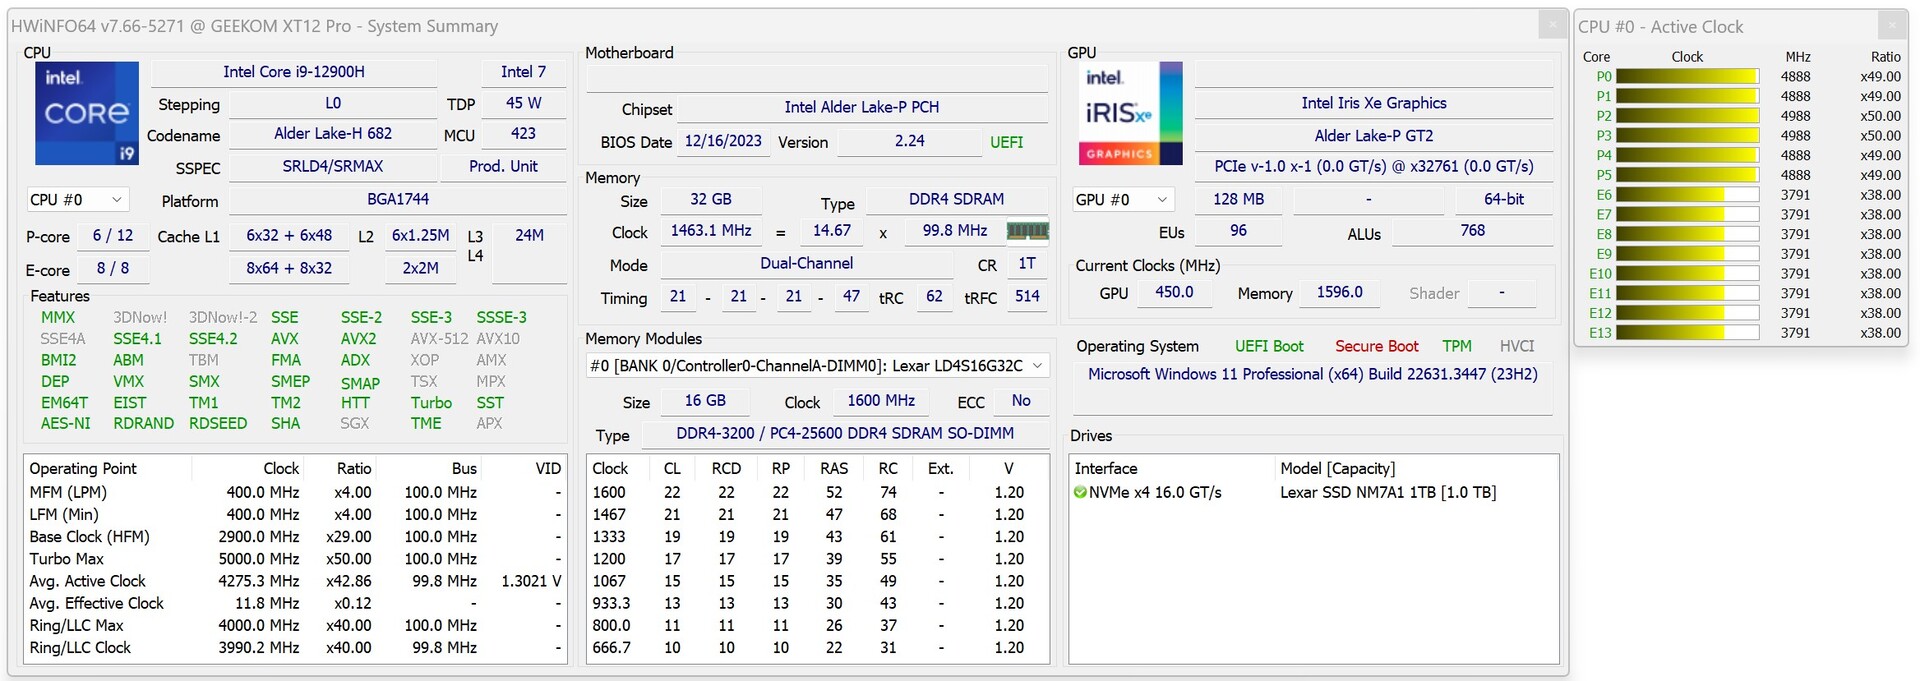
Der Intel Core i9-12900H basiert auf der Alder-Lake-Architektur und vereint 6P- und 8E-Kerne miteinander. Zusammen stehen dem Anwender damit 20 Threads zur Verfügung. Das SoC gehört auch nach über zwei Jahren bisher nicht zum alten Eisen, und im Vergleich sehen wir einen vertretbaren Rückstand gegenüber den moderneren AMD Ryzen APUs.
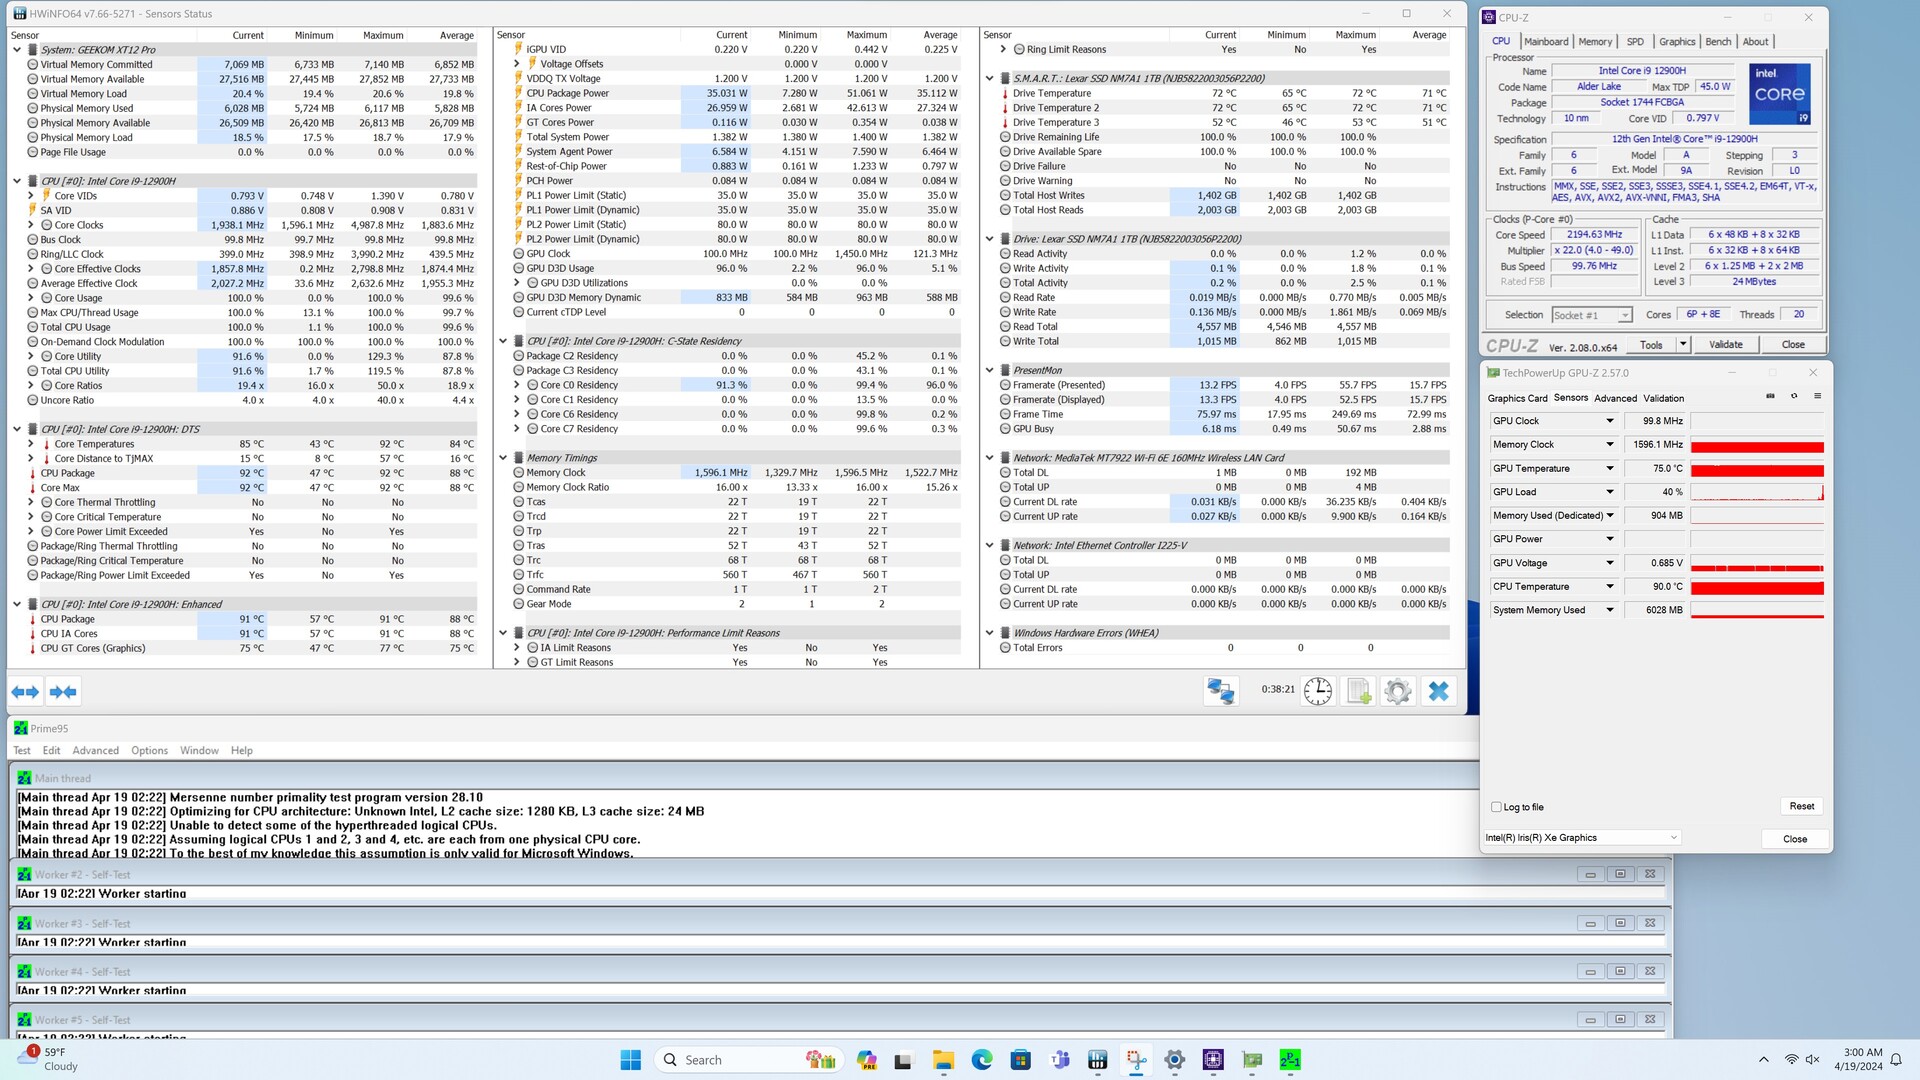
Bei den Leistungslimits begrenzt Geekom den Intel Core i9-12900H auf maximal 80 Watt, wenngleich dauerhaft 35 Watt zur Verfügung stehen. Den Maximalwert haben wir jedoch zu keiner Zeit erreicht. Das können wir an dieser Stelle schon festhalten. Im Test sehen wir oftmals nur ca. 60 Watt, womit der Hersteller hier nicht das volle Potenzial ausschöpft. Dennoch wird das SoC gemäß den Herstellerspezifikationen betrieben, denn 35 Watt sind dauerhaft möglich. Im Duell mit den Kontrahenten muss sich unser Testsample oftmals geschlagen geben. Ein gleiches Bild zeigt sich auch bei den AIDA64 Benchmarks. Hier offenbart sich der Nachteil des älteren DDR4-Arbeitsspeichers.
Weitere Benchmarks zu den Prozessoren finden Sie hier.
| Performance Rating - Percent | |
| Minisforum EliteMini UM780 XTX | |
| Geekom A7 | |
| Acemagic F2A | |
| Intel NUC 13 Pro Desk Edition Kit | |
| Minisforum Neptune Series NAD9 | |
| Geekom XT12 Pro | |
| Khadas Mind | |
| Cinebench R10 | |
| Rendering Single CPUs 64Bit | |
| Khadas Mind | |
| Intel NUC 13 Pro Desk Edition Kit | |
| Geekom A7 | |
| Minisforum EliteMini UM780 XTX | |
| Acemagic F2A | |
| Geekom XT12 Pro | |
| Minisforum Neptune Series NAD9 | |
| Rendering Multiple CPUs 64Bit | |
| Acemagic F2A | |
| Minisforum EliteMini UM780 XTX | |
| Geekom A7 | |
| Minisforum Neptune Series NAD9 | |
| Intel NUC 13 Pro Desk Edition Kit | |
| Geekom XT12 Pro | |
| Khadas Mind | |
| Blender - v2.79 BMW27 CPU | |
| Khadas Mind | |
| Geekom XT12 Pro | |
| Minisforum Neptune Series NAD9 | |
| Intel NUC 13 Pro Desk Edition Kit | |
| Geekom A7 | |
| Minisforum EliteMini UM780 XTX | |
| Acemagic F2A | |
| WinRAR - Result | |
| Geekom XT12 Pro | |
| Minisforum Neptune Series NAD9 | |
| Acemagic F2A | |
| Minisforum EliteMini UM780 XTX | |
| Geekom A7 | |
| Khadas Mind | |
| Intel NUC 13 Pro Desk Edition Kit | |
| 3DMark 11 - 1280x720 Performance Physics | |
| Minisforum EliteMini UM780 XTX | |
| Geekom A7 | |
| Acemagic F2A | |
| Intel NUC 13 Pro Desk Edition Kit | |
| Minisforum Neptune Series NAD9 | |
| Geekom XT12 Pro | |
| Khadas Mind | |
| HWBOT x265 Benchmark v2.2 - 4k Preset | |
| Minisforum EliteMini UM780 XTX | |
| Geekom A7 | |
| Acemagic F2A | |
| Minisforum Neptune Series NAD9 | |
| Intel NUC 13 Pro Desk Edition Kit | |
| Geekom XT12 Pro | |
| Khadas Mind | |
| R Benchmark 2.5 - Overall mean | |
| Acemagic F2A | |
| Minisforum Neptune Series NAD9 | |
| Geekom XT12 Pro | |
| Intel NUC 13 Pro Desk Edition Kit | |
| Khadas Mind | |
| Minisforum EliteMini UM780 XTX | |
| Geekom A7 | |
| LibreOffice - 20 Documents To PDF | |
| Geekom A7 | |
| Minisforum EliteMini UM780 XTX | |
| Intel NUC 13 Pro Desk Edition Kit | |
| Acemagic F2A | |
| Khadas Mind | |
| Geekom XT12 Pro | |
| Minisforum Neptune Series NAD9 | |
| WebXPRT 3 - Overall | |
| Geekom A7 | |
| Minisforum EliteMini UM780 XTX | |
| Khadas Mind | |
| Minisforum Neptune Series NAD9 | |
| Intel NUC 13 Pro Desk Edition Kit | |
| Geekom XT12 Pro | |
| Acemagic F2A | |
| Mozilla Kraken 1.1 - Total | |
| Minisforum Neptune Series NAD9 | |
| Acemagic F2A | |
| Minisforum EliteMini UM780 XTX | |
| Geekom XT12 Pro | |
| Geekom A7 | |
| Khadas Mind | |
| Intel NUC 13 Pro Desk Edition Kit | |
* ... kleinere Werte sind besser
| Performance Rating - Percent | |
| Geekom A7 | |
| Minisforum EliteMini UM780 XTX | |
| Acemagic F2A | |
| Intel NUC 13 Pro Desk Edition Kit | |
| Geekom XT12 Pro | |
| Khadas Mind | |
| Minisforum Neptune Series NAD9 | |
AIDA64: FP32 Ray-Trace | FPU Julia | CPU SHA3 | CPU Queen | FPU SinJulia | FPU Mandel | CPU AES | CPU ZLib | FP64 Ray-Trace | CPU PhotoWorxx
| Performance Rating | |
| Minisforum EliteMini UM780 XTX | |
| Geekom A7 | |
| Durchschnitt der Klasse Mini PC | |
| Acemagic F2A | |
| Minisforum Neptune Series NAD9 | |
| Intel NUC 13 Pro Desk Edition Kit | |
| Geekom XT12 Pro | |
| Khadas Mind | |
| AIDA64 / FP32 Ray-Trace | |
| Minisforum EliteMini UM780 XTX | |
| Geekom A7 | |
| Durchschnitt der Klasse Mini PC (974 - 82725, n=103, der letzten 2 Jahre) | |
| Acemagic F2A | |
| Intel NUC 13 Pro Desk Edition Kit | |
| Minisforum Neptune Series NAD9 | |
| Geekom XT12 Pro | |
| Khadas Mind | |
| AIDA64 / FPU Julia | |
| Minisforum EliteMini UM780 XTX | |
| Geekom A7 | |
| Durchschnitt der Klasse Mini PC (6115 - 363782, n=103, der letzten 2 Jahre) | |
| Acemagic F2A | |
| Intel NUC 13 Pro Desk Edition Kit | |
| Minisforum Neptune Series NAD9 | |
| Geekom XT12 Pro | |
| Khadas Mind | |
| AIDA64 / CPU SHA3 | |
| Minisforum EliteMini UM780 XTX | |
| Geekom A7 | |
| Durchschnitt der Klasse Mini PC (385 - 9475, n=103, der letzten 2 Jahre) | |
| Acemagic F2A | |
| Intel NUC 13 Pro Desk Edition Kit | |
| Minisforum Neptune Series NAD9 | |
| Geekom XT12 Pro | |
| Khadas Mind | |
| AIDA64 / CPU Queen | |
| Geekom A7 | |
| Minisforum EliteMini UM780 XTX | |
| Durchschnitt der Klasse Mini PC (20501 - 162855, n=86, der letzten 2 Jahre) | |
| Acemagic F2A | |
| Intel NUC 13 Pro Desk Edition Kit | |
| Minisforum Neptune Series NAD9 | |
| Geekom XT12 Pro | |
| Khadas Mind | |
| AIDA64 / FPU SinJulia | |
| Minisforum EliteMini UM780 XTX | |
| Geekom A7 | |
| Durchschnitt der Klasse Mini PC (1116 - 31931, n=103, der letzten 2 Jahre) | |
| Acemagic F2A | |
| Minisforum Neptune Series NAD9 | |
| Geekom XT12 Pro | |
| Intel NUC 13 Pro Desk Edition Kit | |
| Khadas Mind | |
| AIDA64 / FPU Mandel | |
| Minisforum EliteMini UM780 XTX | |
| Geekom A7 | |
| Durchschnitt der Klasse Mini PC (3322 - 192994, n=103, der letzten 2 Jahre) | |
| Acemagic F2A | |
| Minisforum Neptune Series NAD9 | |
| Intel NUC 13 Pro Desk Edition Kit | |
| Geekom XT12 Pro | |
| Khadas Mind | |
| AIDA64 / CPU AES | |
| Minisforum EliteMini UM780 XTX | |
| Geekom A7 | |
| Acemagic F2A | |
| Minisforum Neptune Series NAD9 | |
| Geekom XT12 Pro | |
| Durchschnitt der Klasse Mini PC (9915 - 204742, n=102, der letzten 2 Jahre) | |
| Khadas Mind | |
| Intel NUC 13 Pro Desk Edition Kit | |
| AIDA64 / CPU ZLib | |
| Acemagic F2A | |
| Durchschnitt der Klasse Mini PC (127.2 - 2431, n=103, der letzten 2 Jahre) | |
| Minisforum EliteMini UM780 XTX | |
| Geekom A7 | |
| Intel NUC 13 Pro Desk Edition Kit | |
| Geekom XT12 Pro | |
| Minisforum Neptune Series NAD9 | |
| Khadas Mind | |
| AIDA64 / FP64 Ray-Trace | |
| Minisforum EliteMini UM780 XTX | |
| Geekom A7 | |
| Durchschnitt der Klasse Mini PC (537 - 43587, n=103, der letzten 2 Jahre) | |
| Acemagic F2A | |
| Intel NUC 13 Pro Desk Edition Kit | |
| Minisforum Neptune Series NAD9 | |
| Geekom XT12 Pro | |
| Khadas Mind | |
| AIDA64 / CPU PhotoWorxx | |
| Khadas Mind | |
| Durchschnitt der Klasse Mini PC (8069 - 96843, n=103, der letzten 2 Jahre) | |
| Geekom A7 | |
| Minisforum EliteMini UM780 XTX | |
| Acemagic F2A | |
| Intel NUC 13 Pro Desk Edition Kit | |
| Geekom XT12 Pro | |
| Minisforum Neptune Series NAD9 | |
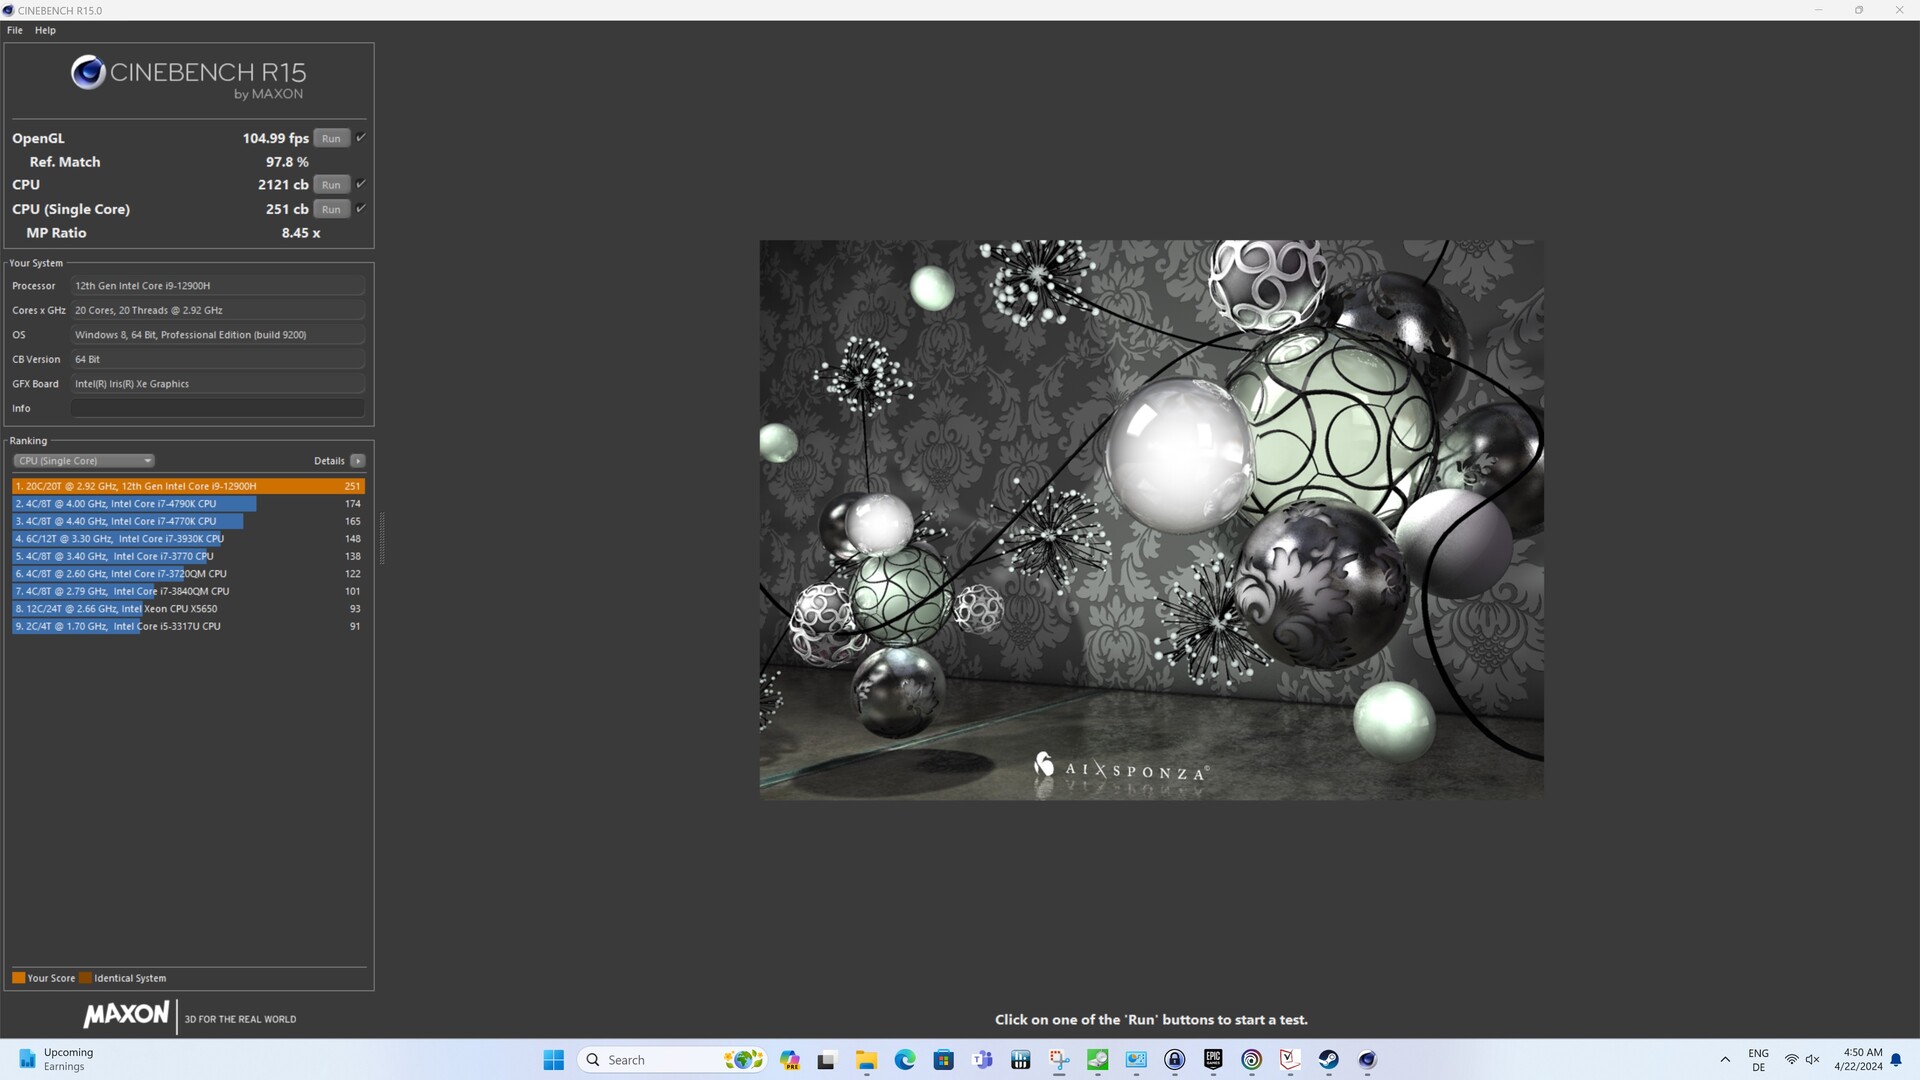
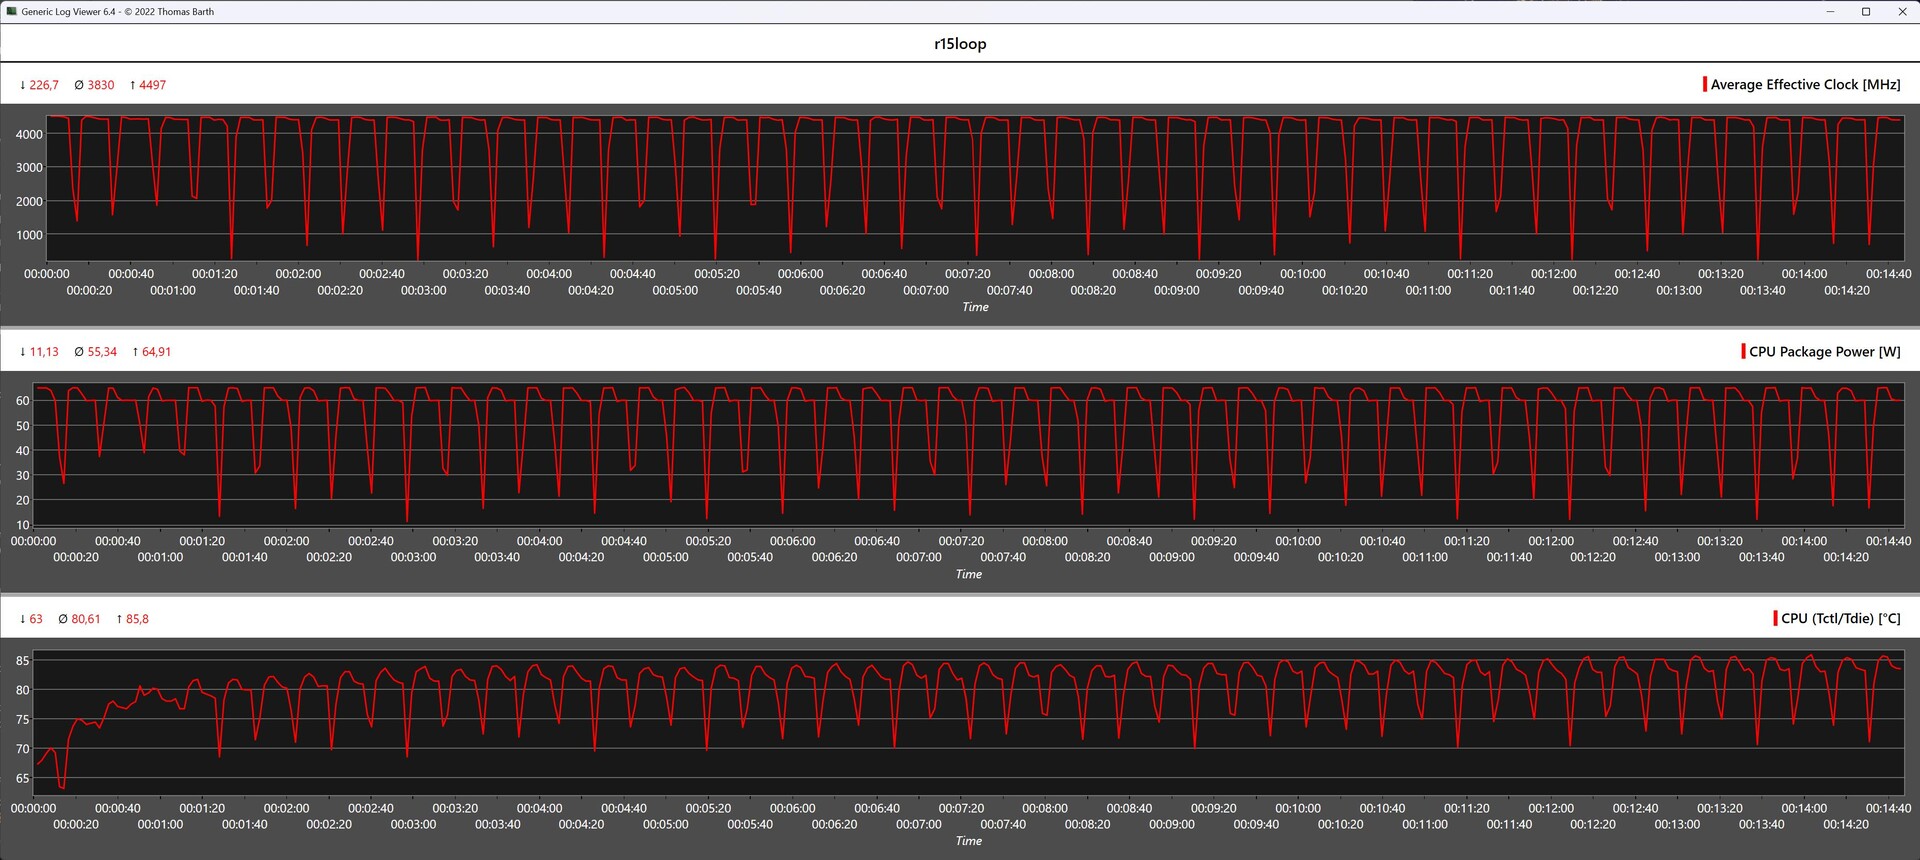
Geekom XT12 Pro bei der Cinebench-R15-Multi-Schleife
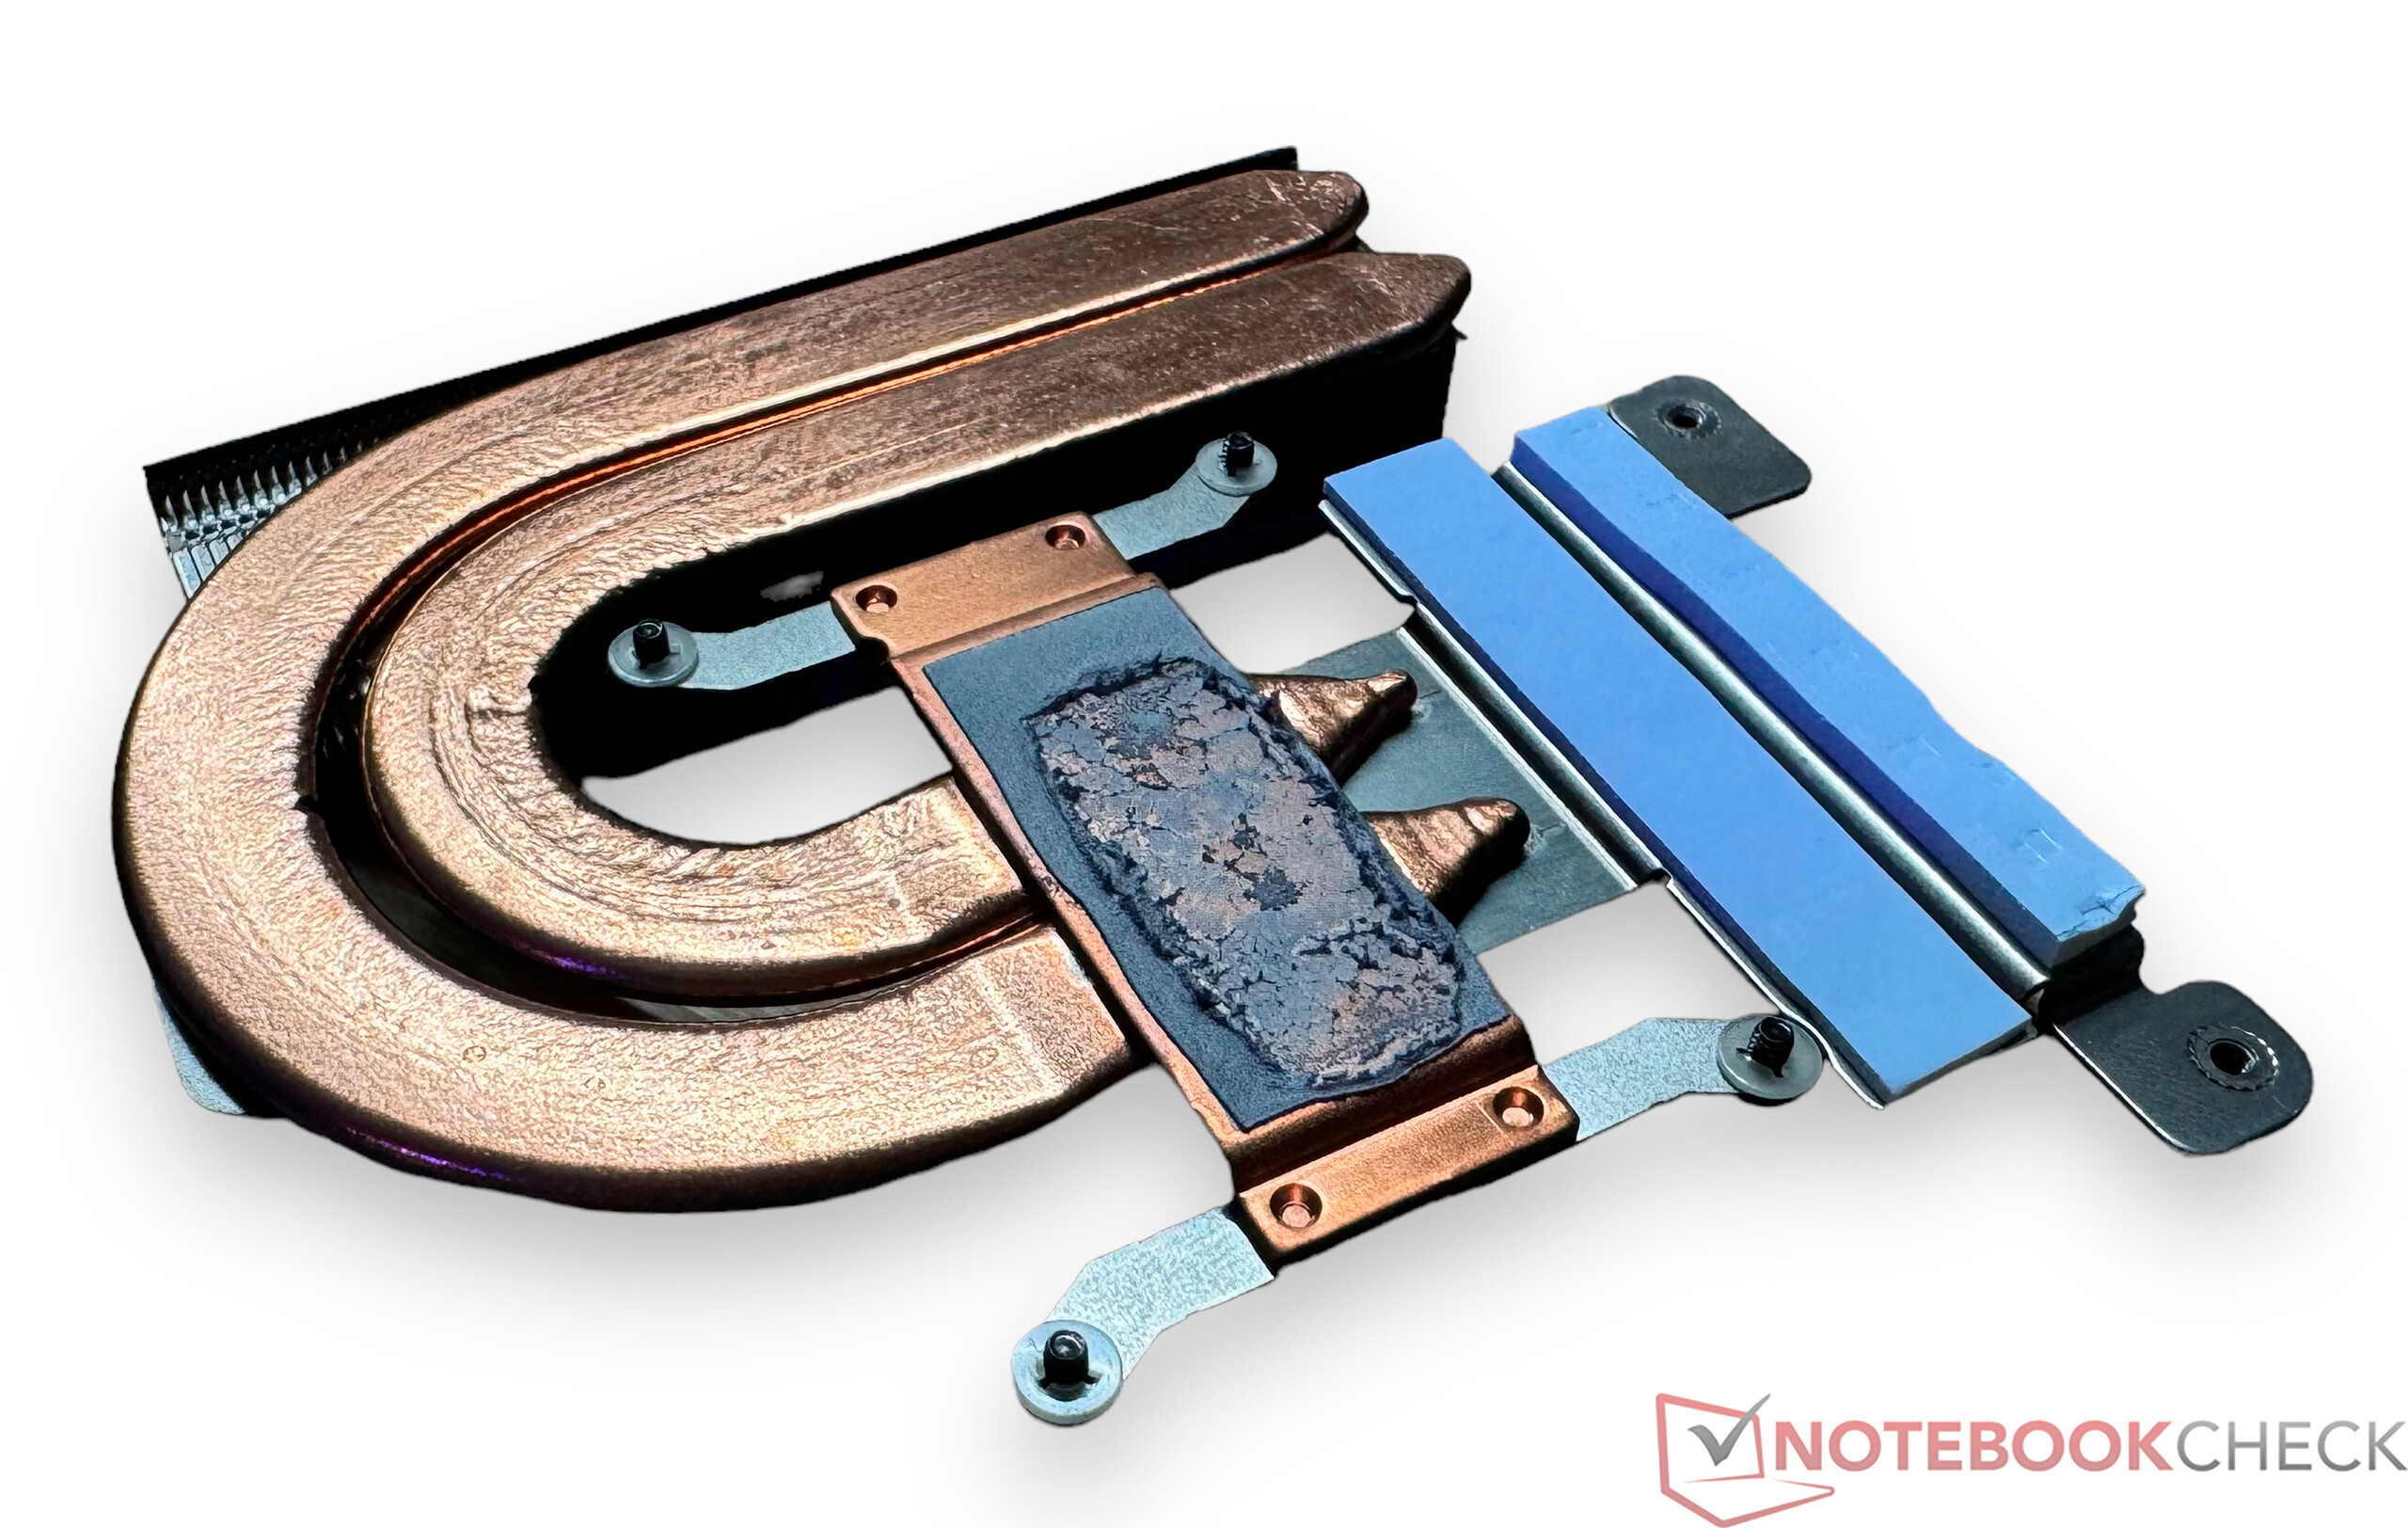
Bei der Cinebench-R15-Dauerschleife sehen wir, dass Geekom hier eine relativ leistungsschwache Kühleinheit verbaut. Nur zu Beginn kann der Intel Core i9-12900H ein deutlich besseres Ergebnis abliefern. Schon ab dem zweiten Durchlauf sinkt die Leistung deutlich, womit sich unser Testsample nur noch auf dem vorletzten Platz wiederfindet.
System Performance
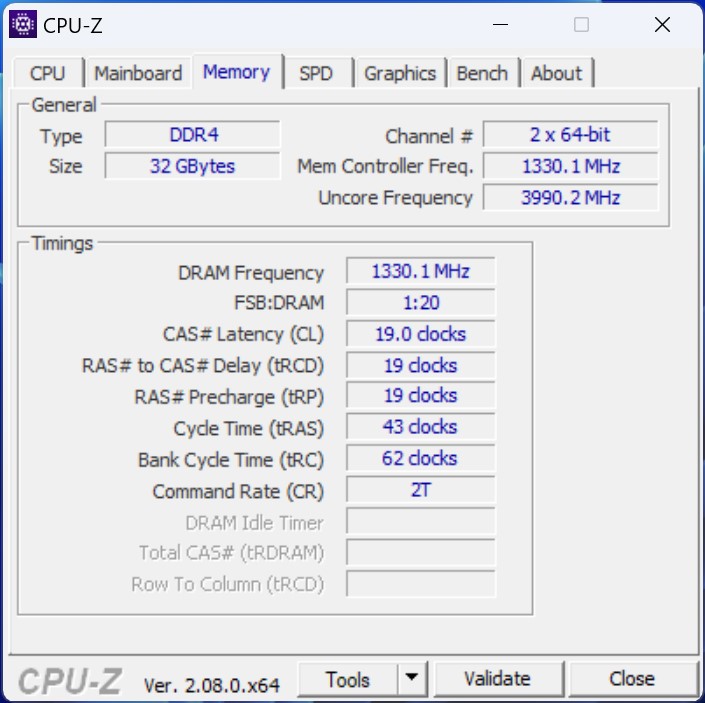
Die Tests hinsichtlich der Systemleistung meistert der Geekom XT12 Pro recht gut, und im Vergleich zu den reinen CPU-Tests sehen wir unser Testsample nun sogar im Mittelfeld. Dennoch zeigt sich hier der Nachteil, den DDR4 gegenüber DDR5 inzwischen hat: Mit einem deutlichen Abstand folgen alle DDR4 basierten Systeme den schnelleren DDR5 bestückten Mini-PCs, von denen der Geekom A7 am besten abschneiden konnte.
| AIDA64 / Memory Copy | |
| Durchschnitt der Klasse Mini PC (15933 - 163031, n=103, der letzten 2 Jahre) | |
| Geekom A7 | |
| Minisforum EliteMini UM780 XTX | |
| Khadas Mind | |
| Acemagic F2A | |
| Minisforum Neptune Series NAD9 | |
| Geekom XT12 Pro | |
| Intel NUC 13 Pro Desk Edition Kit | |
| AIDA64 / Memory Read | |
| Durchschnitt der Klasse Mini PC (14143 - 123769, n=103, der letzten 2 Jahre) | |
| Acemagic F2A | |
| Minisforum EliteMini UM780 XTX | |
| Geekom A7 | |
| Khadas Mind | |
| Minisforum Neptune Series NAD9 | |
| Geekom XT12 Pro | |
| Intel NUC 13 Pro Desk Edition Kit | |
| AIDA64 / Memory Write | |
| Geekom A7 | |
| Minisforum EliteMini UM780 XTX | |
| Durchschnitt der Klasse Mini PC (10630 - 216693, n=103, der letzten 2 Jahre) | |
| Khadas Mind | |
| Acemagic F2A | |
| Geekom XT12 Pro | |
| Minisforum Neptune Series NAD9 | |
| Intel NUC 13 Pro Desk Edition Kit | |
| AIDA64 / Memory Latency | |
| Acemagic F2A | |
| Durchschnitt der Klasse Mini PC (88.1 - 184.8, n=104, der letzten 2 Jahre) | |
| Minisforum Neptune Series NAD9 | |
| Intel NUC 13 Pro Desk Edition Kit | |
| Minisforum EliteMini UM780 XTX | |
| Khadas Mind | |
| Geekom A7 | |
| Geekom XT12 Pro | |
* ... kleinere Werte sind besser
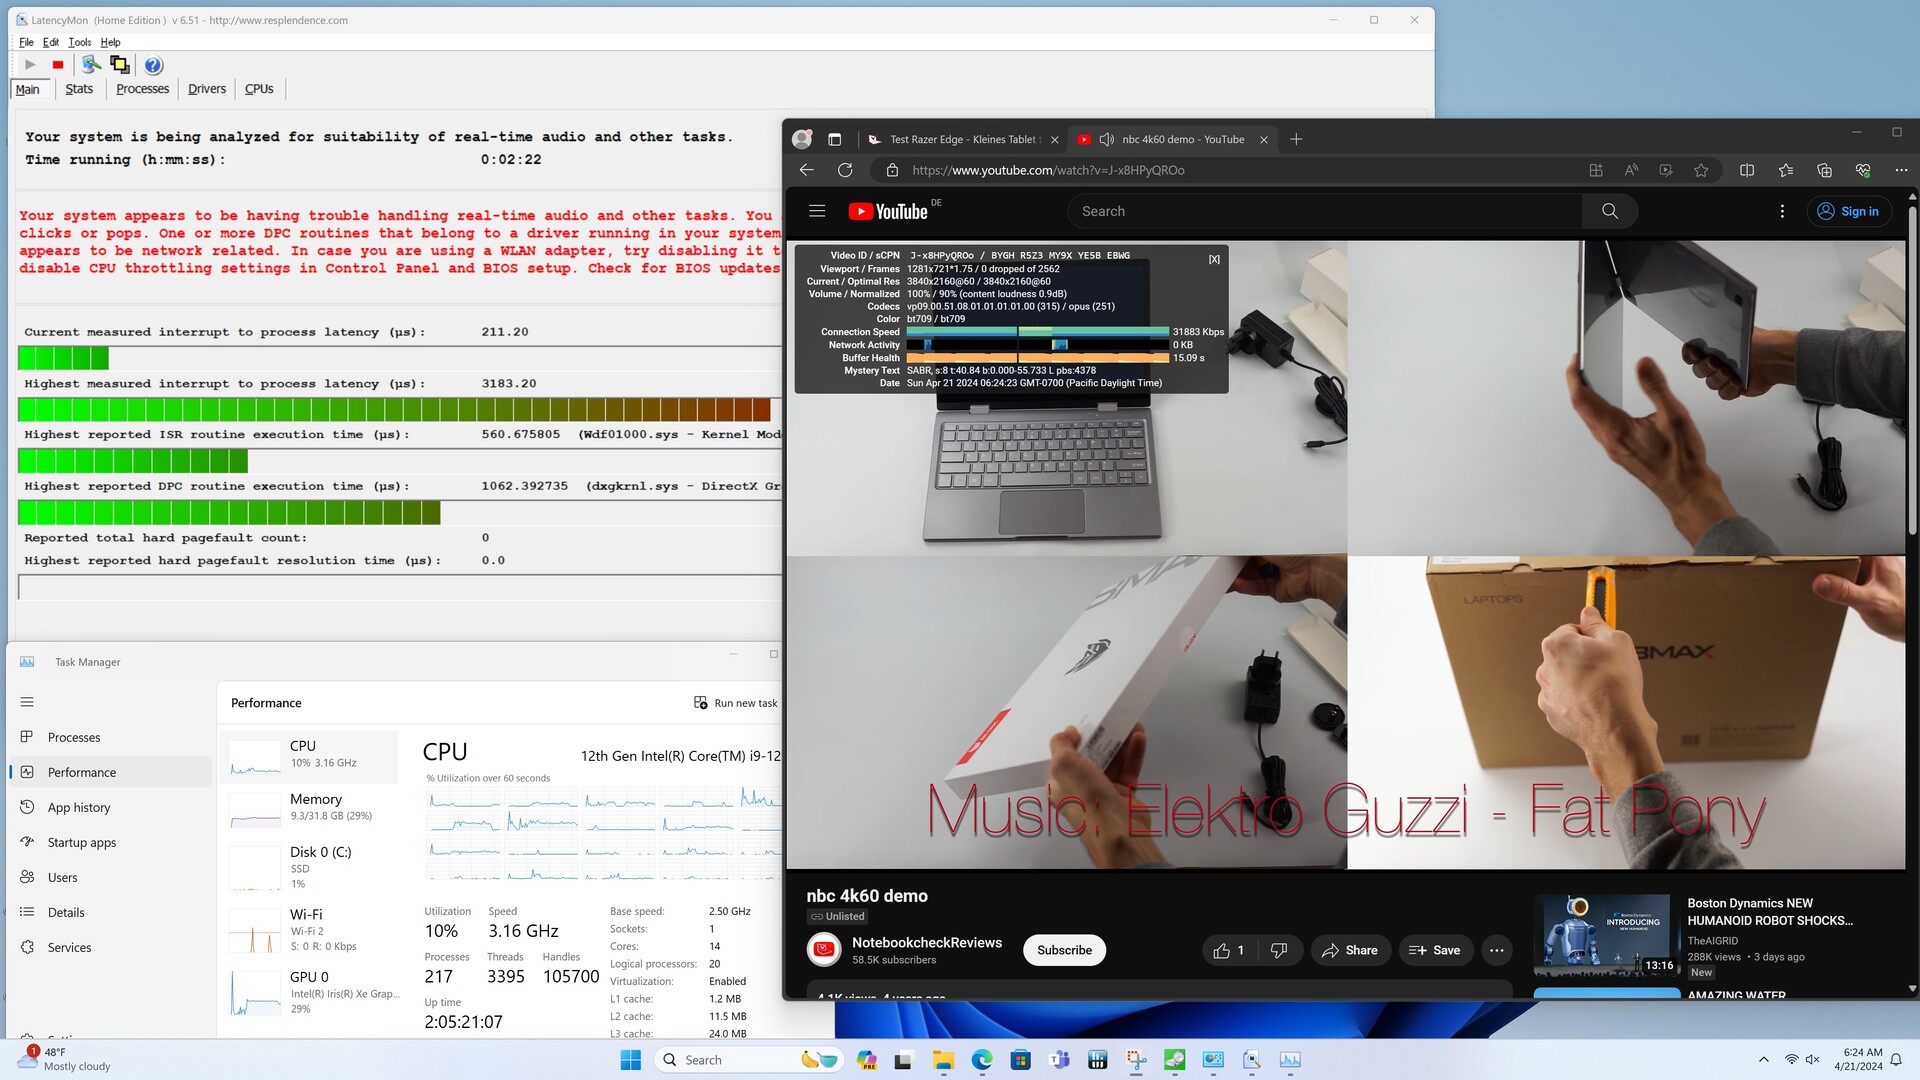
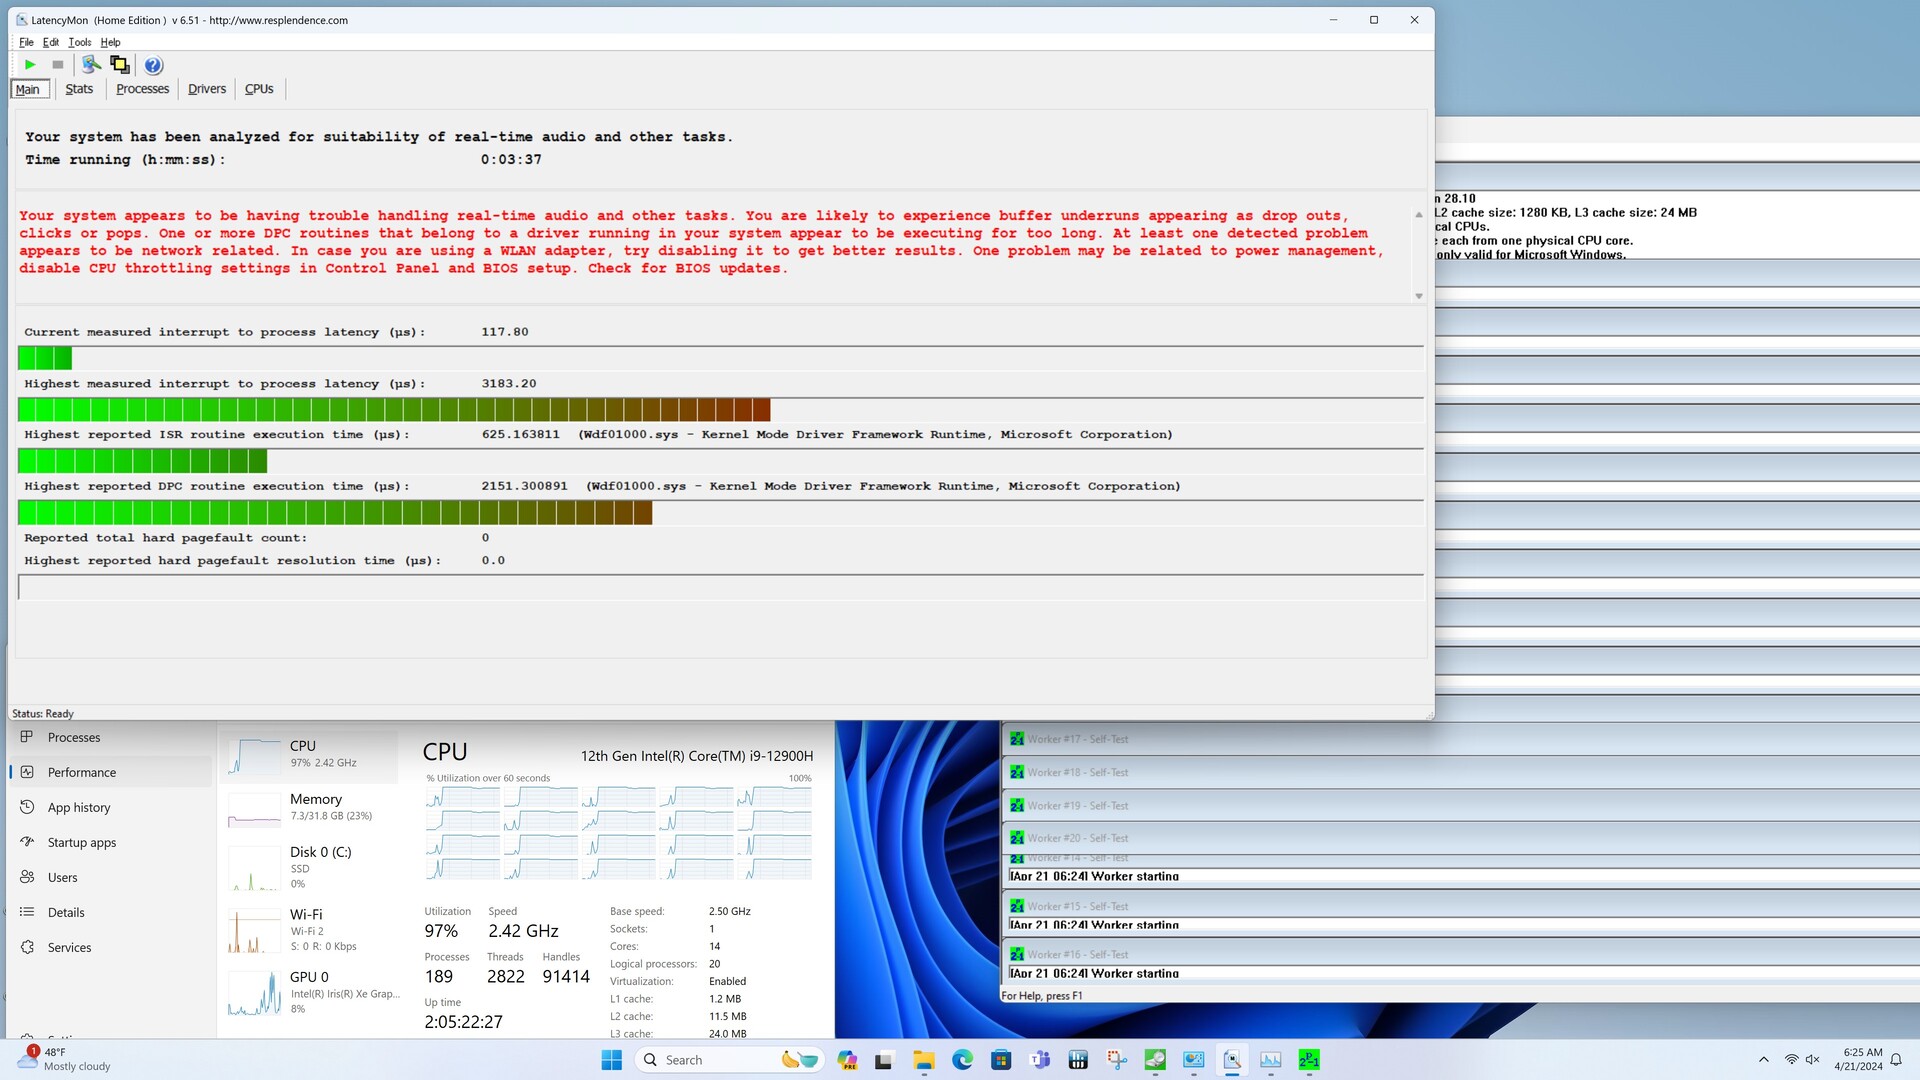
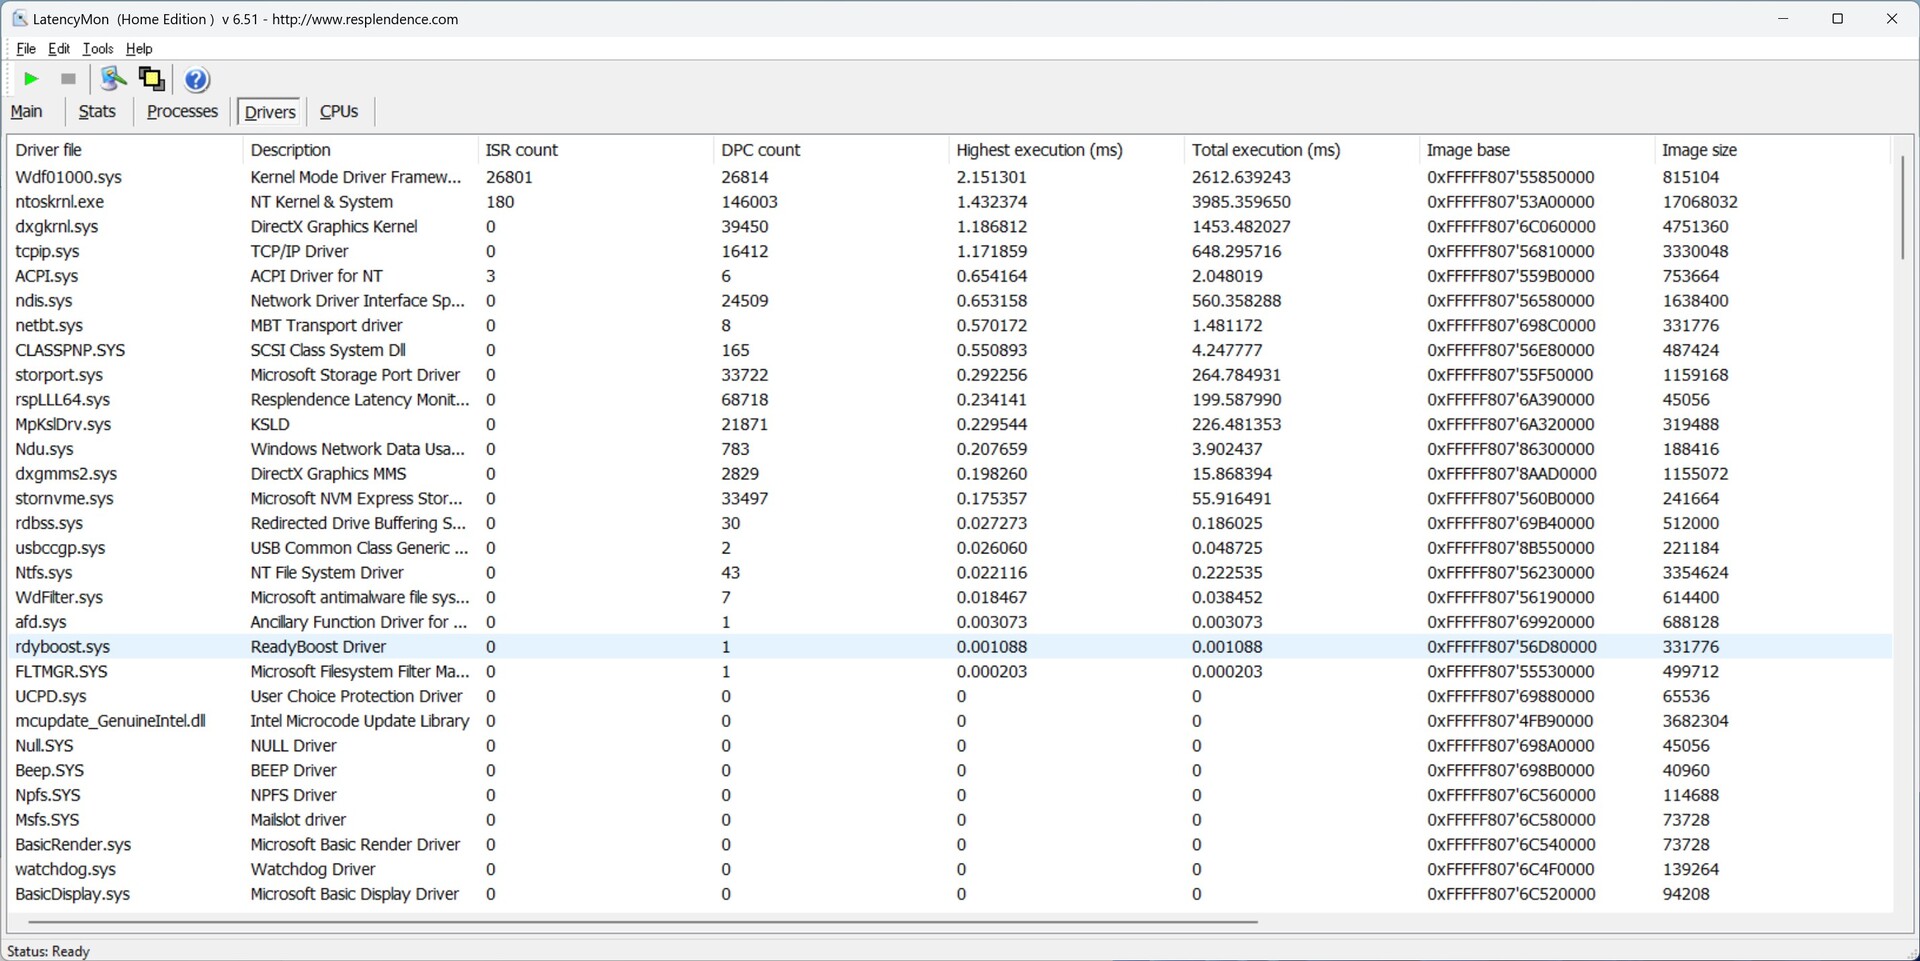
DPC-Latenzen
Beim Surfen im Internet konnten wir beim Geekom XT12 Pro noch keine erhöhten Latenzen dokumentieren. Erst beim Abspielen des 4K-Testvideos klettern die Latenzen in die Höhe. Den Maximalwert erreichte unser Testsample jedoch erst unter Vollast mit Prime95. Dennoch kann der XT12 Pro als Streaming-Client verwendet werden, denn ausgelassene Frames gab es zu keiner Zeit.
| DPC Latencies / LatencyMon - interrupt to process latency (max), Web, Youtube, Prime95 | |
| Acemagic F2A | |
| Geekom XT12 Pro | |
| Geekom A7 | |
| Minisforum EliteMini UM780 XTX | |
| Minisforum Neptune Series NAD9 | |
| Intel NUC 13 Pro Desk Edition Kit | |
| Khadas Mind | |
* ... kleinere Werte sind besser
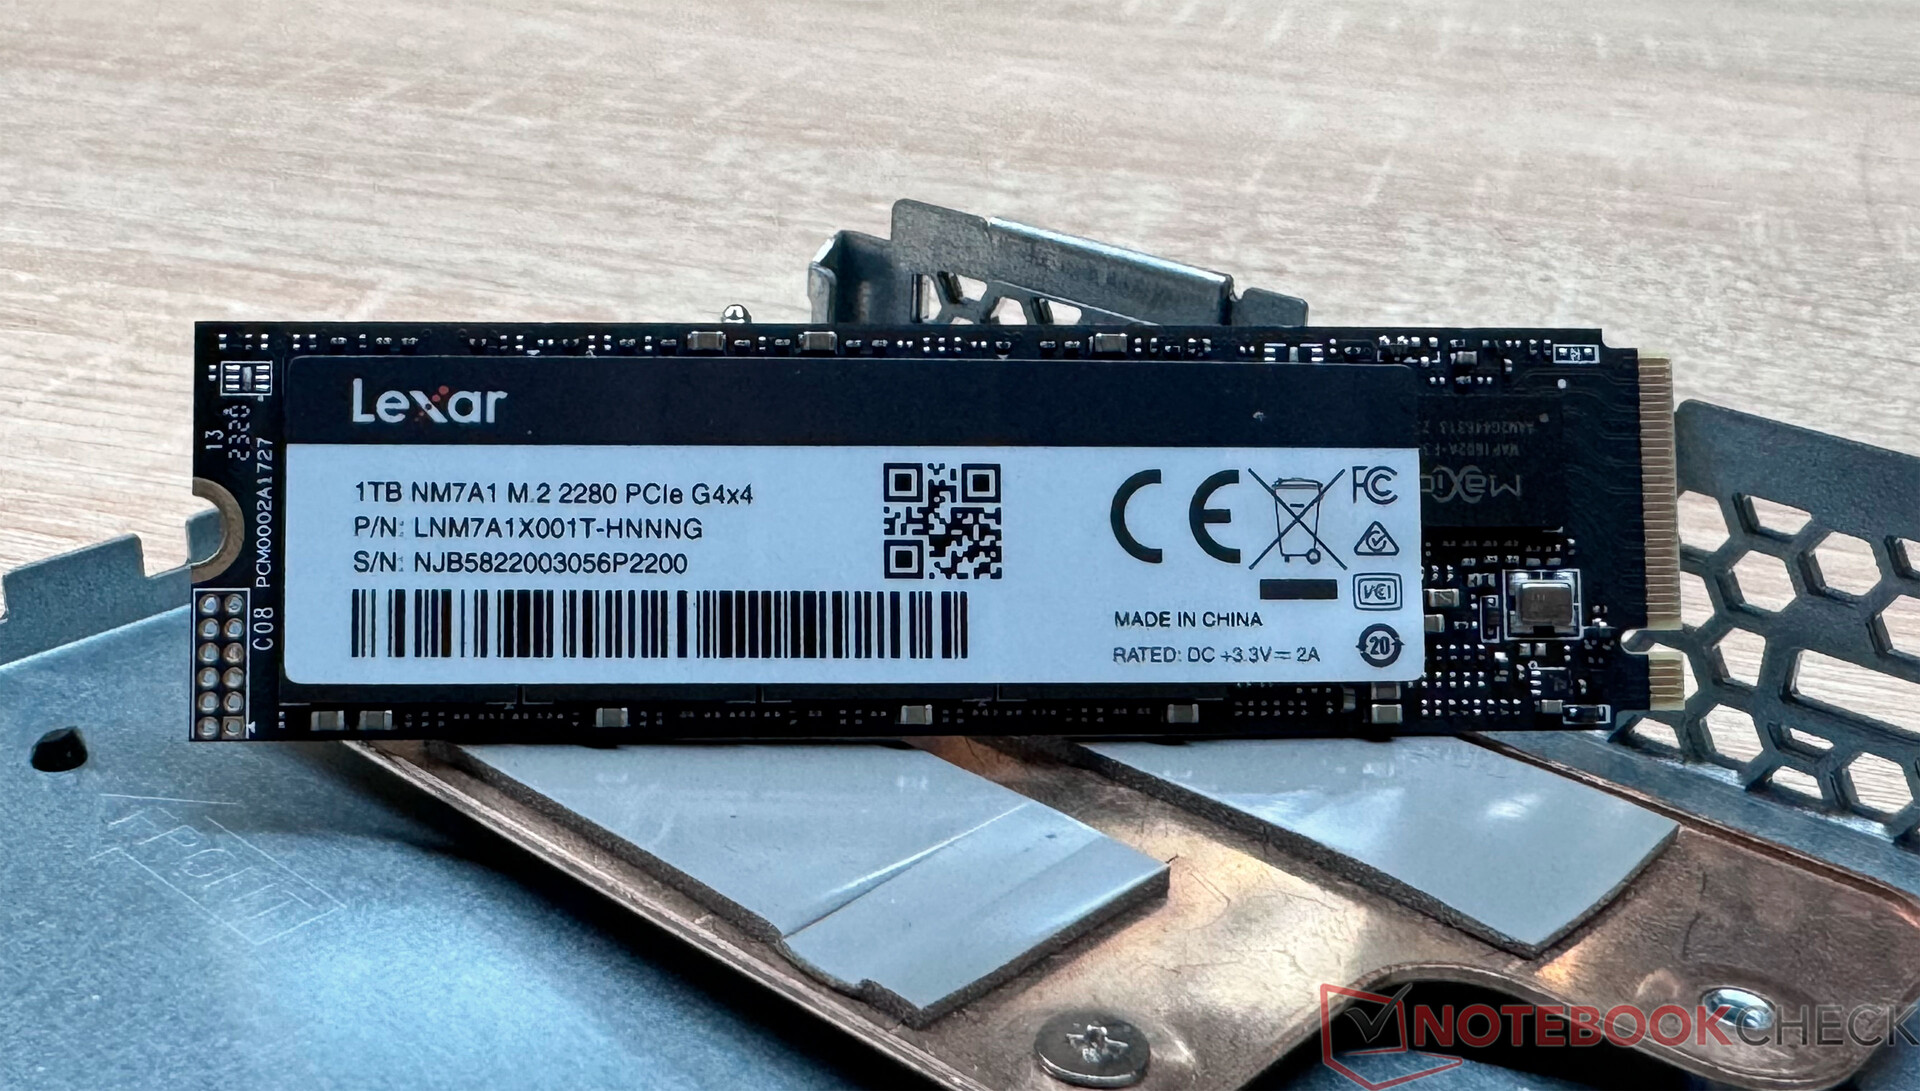
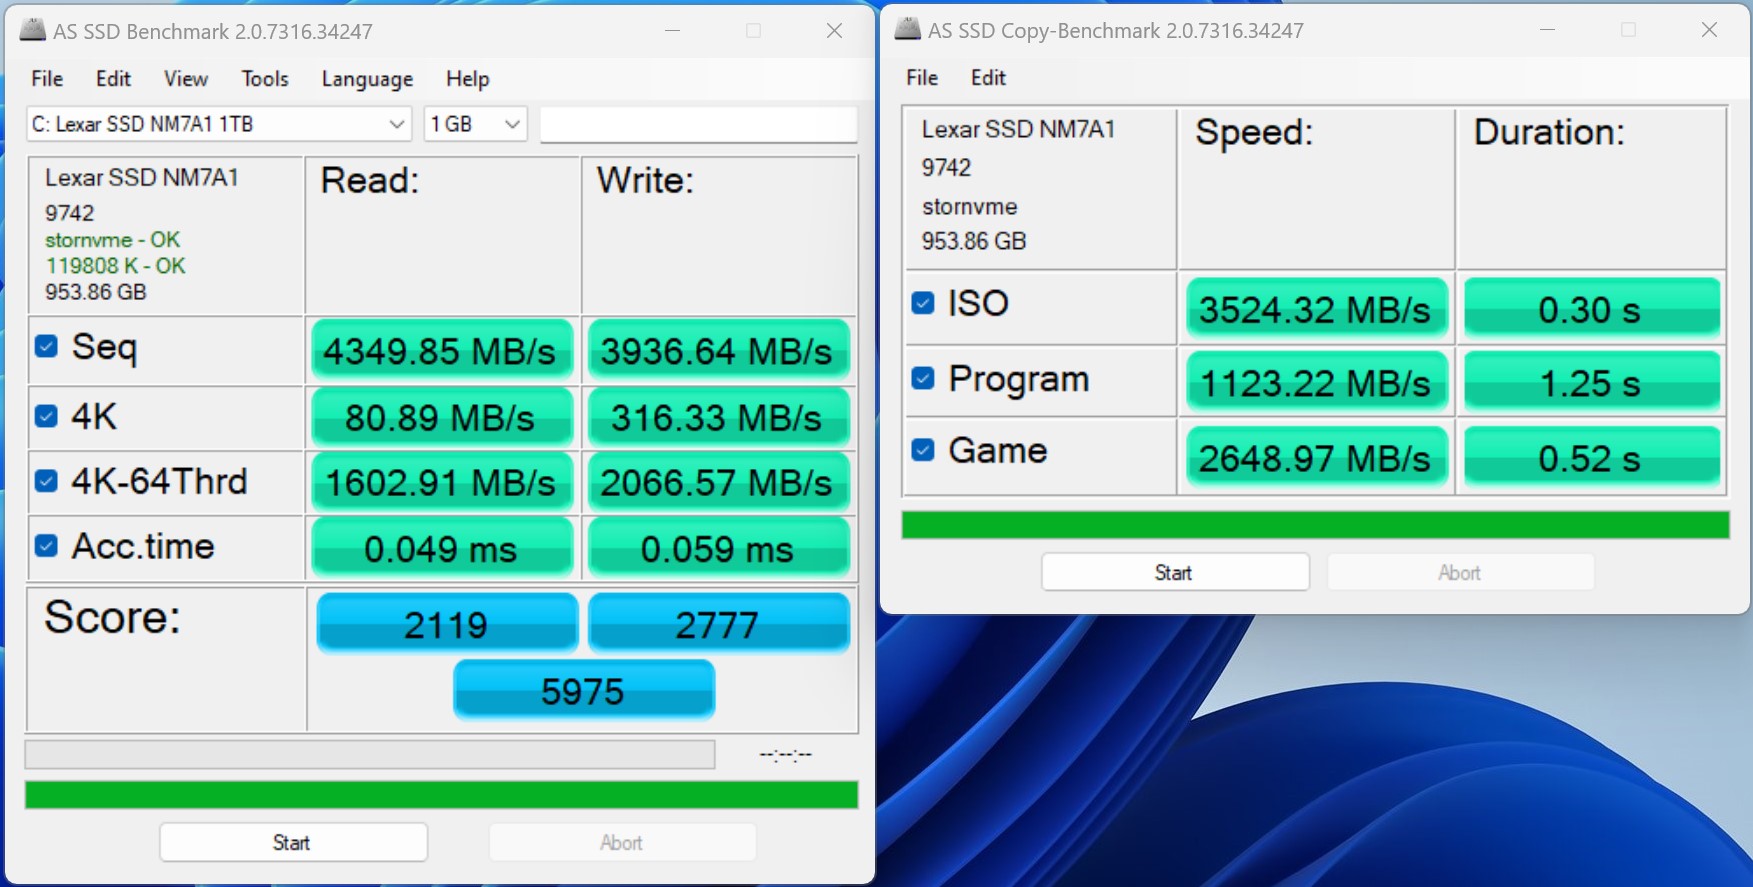
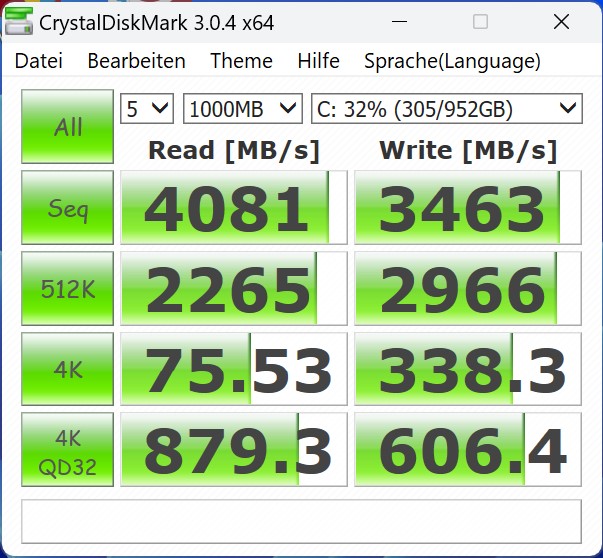
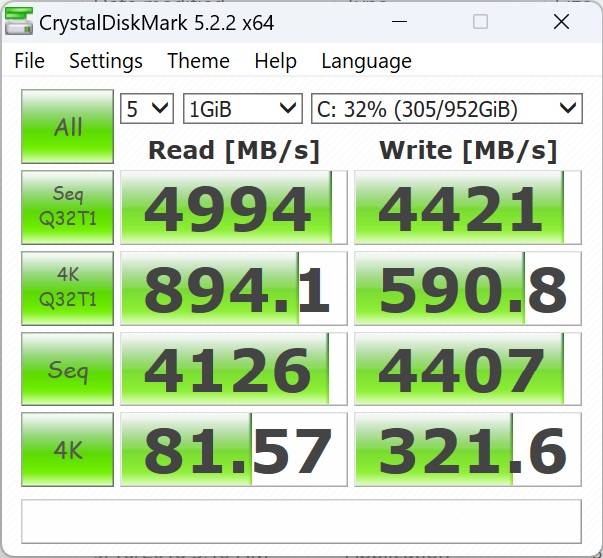
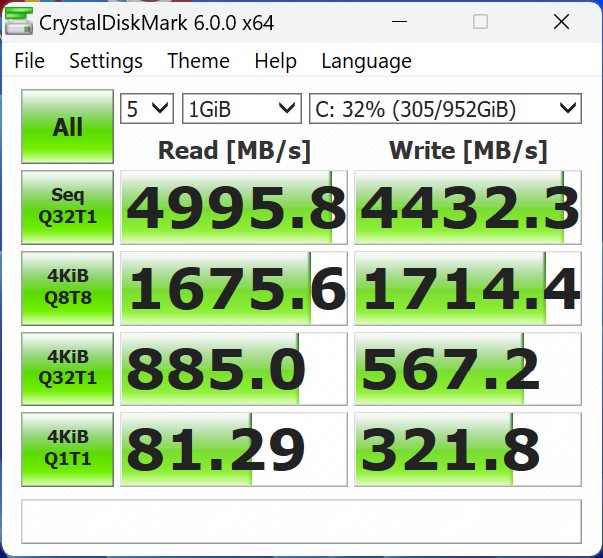
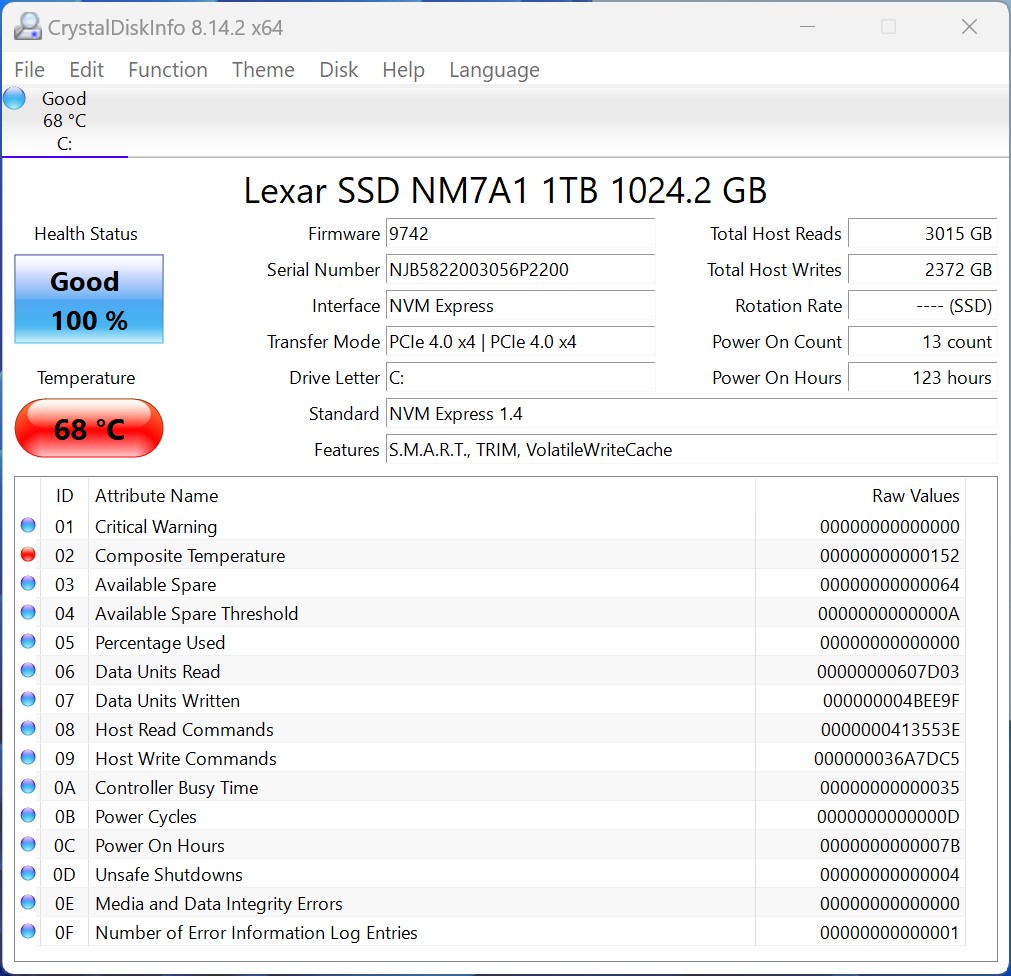
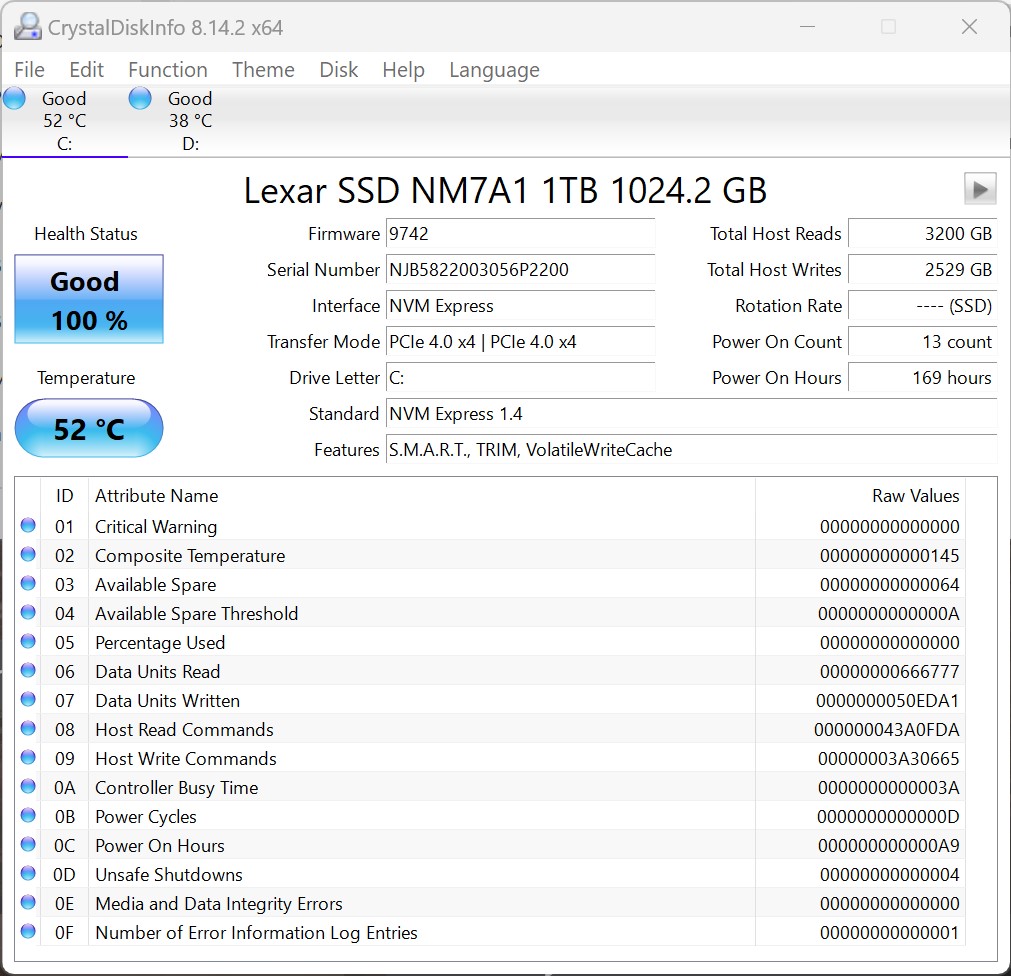
Massenspeicher
Geekom verbaut in unserem Testsample eine SSD mit 1 TB Speicherplatz von Lexar. Grundsätzlich leistet die verbaute SSD eine adäquate Leistung, sofern keine dauerhafte Last anliegt. Hier hat die Lexar SSD Probleme, welche dazu führen, dass die Leistung deutlich gedrosselt werden muss. Das Hauptproblem hierbei sind falsch angebrachte Wärmeleitpads, denn beide sind nicht dort, wo sie sein sollen. Wir haben den fehlenden Bereich mit einem gleichstarken Wärmeleitpad bestückt, und das Problem der hohen Temperaturen ist passé. Wir haben den Hersteller darüber informiert, um dieses Problem zu beseitigen. Laut Geekom nimmt man sich dieser Problematik an, und kommende Chargen sollten dann mit korrekt verbauten Wärmeleitpads bestückt sein. Nach eigener Recherche scheint dieses Problem nicht nur unser Gerät zu betreffen.
Im Geekom XT12 Pro lassen sich zwei SSDs installieren. Allerdings muss hier auf den Formfaktor geachtet werden, denn der zweite M.2-Slot unterstützt nur SATA-SSDs mit einer Länge von 42 Millimetern.
Für weitere Vergleiche und Benchmarks verweisen wir auf unsere Vergleichstabelle.

* ... kleinere Werte sind besser
Dauerleistung Lesen: DiskSpd Read Loop, Queue Depth 8
Grafikkarte
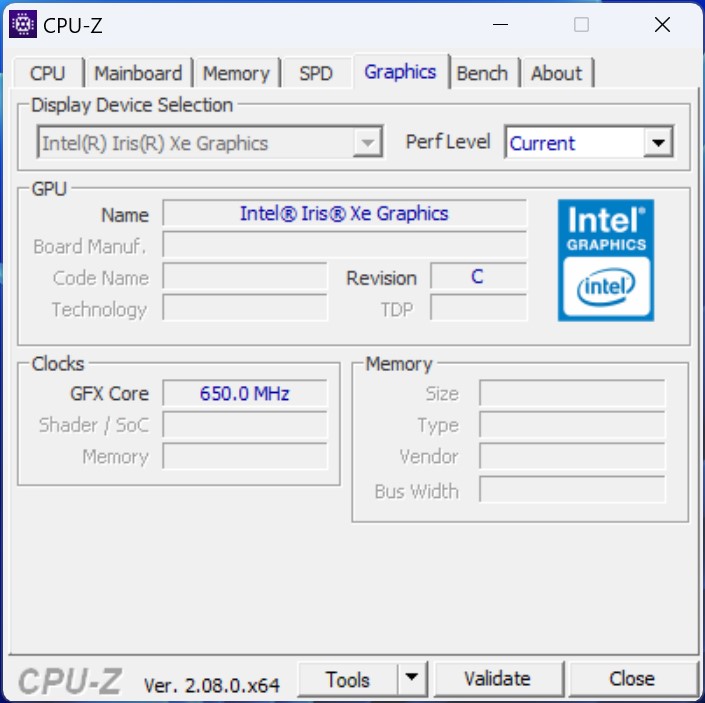
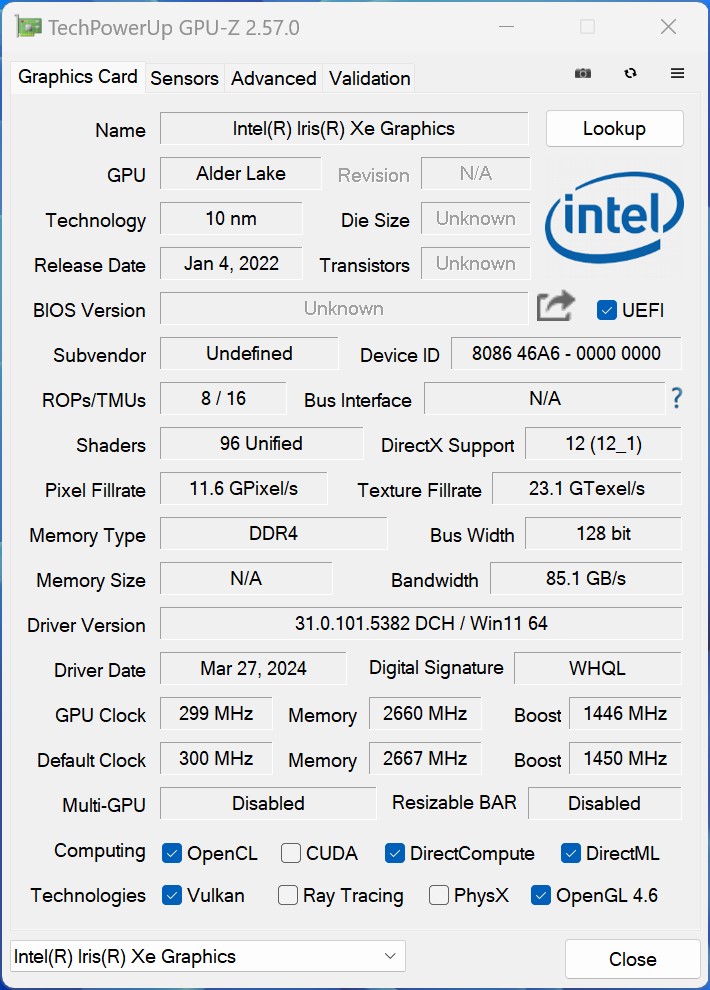
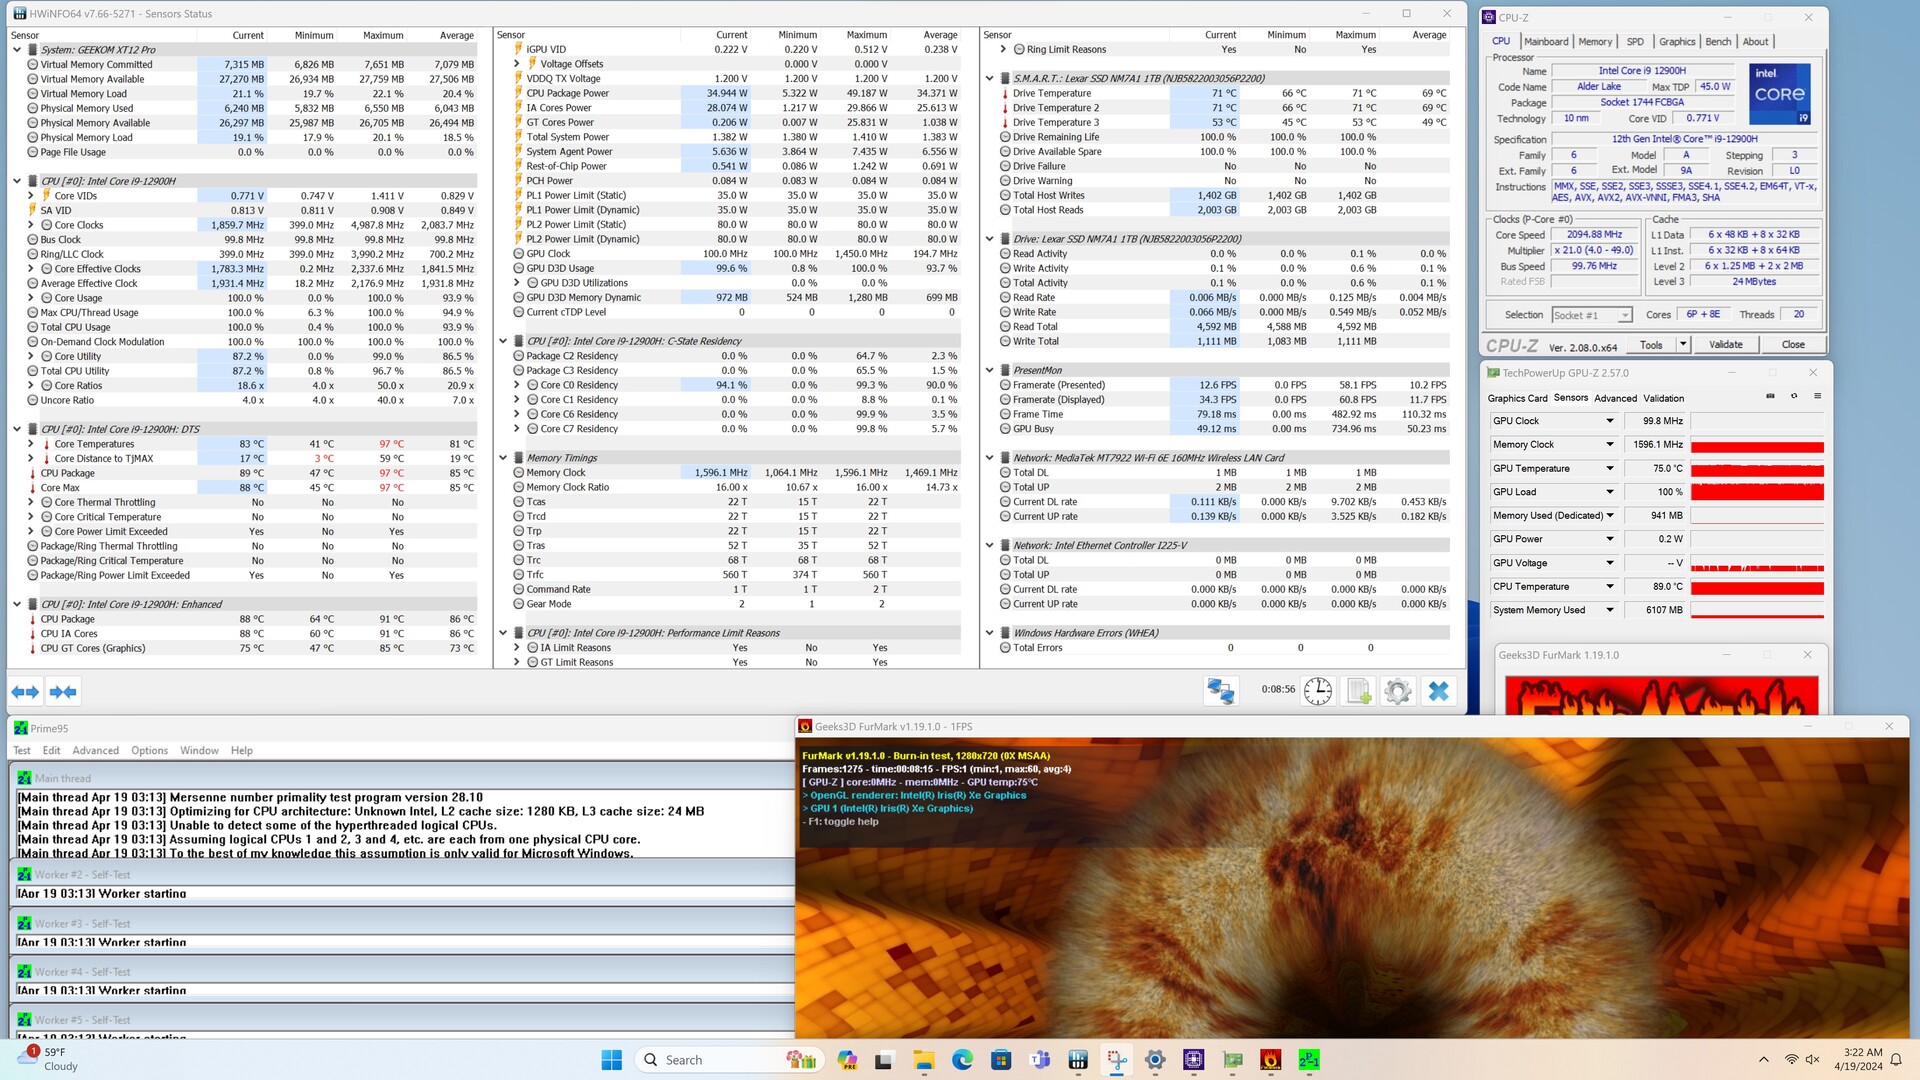
Die Intel Iris Xe Graphics G7 ist für die 3D-Berechnungen und die Bildausgabe zuständig. Mit 96 EUs handelt es sich um das schnellste Modell der Serie. Dennoch handelt es sich inzwischen um ein altes Modell, welches den Kontrahenten spürbar unterlegen ist. Erst mit den Meteor-Lake-Modellen hat Intel die Architektur seiner iGPUs auf einen neuen Stand gebracht. Als Beispiel kann man sich die Ergebnisse des Acemagic F2A anschauen. Doch auch dieser war gegenüber den leistungsstarken iGPUs aus dem Hause AMD unterlegen. Geekom selbst hat mit dem A7 ein extrem kompaktes Gerät im Portfolio, welches mit einer AMD Radeon 780M über deutlich mehr Leistung verfügt als der Geekom XT12 Pro.
Weitere Vergleiche und Benchmarks entnehmen Sie bitte unserer GPU-Vergleichstabelle.
| Affinity Photo 2 - Combined (Single / Multi GPU) | |
| Acemagic F2A | |
| Intel NUC 13 Pro Desk Edition Kit | |
| Minisforum Neptune Series NAD9 | |
| Durchschnittliche Intel Iris Xe Graphics G7 96EUs (1560 - 4958, n=16) | |
| Geekom XT12 Pro | |
| Khadas Mind | |
| Minisforum EliteMini UM780 XTX | |
| Geekom A7 | |
| Geekom XT12 Pro, Intel Iris Xe Graphics G7 96EUs i9-12900H | Minisforum EliteMini UM780 XTX, AMD Radeon 780M R7 7840HS | Minisforum Neptune Series NAD9, Intel Iris Xe Graphics G7 96EUs i9-12900H | Acemagic F2A, Intel Arc 8-Core iGPU Ultra 7 155H | Geekom A7, AMD Radeon 780M R9 7940HS | Intel NUC 13 Pro Desk Edition Kit, Intel Iris Xe Graphics G7 96EUs i7-1360P | Khadas Mind, Intel Iris Xe Graphics G7 96EUs i7-1360P | Durchschnitt der Klasse Mini PC | |
|---|---|---|---|---|---|---|---|---|
| SPECviewperf 12 | 752% | -4% | 32% | 771% | -2% | -4% | 906% | |
| 1900x1060 3ds Max (3dsmax-05) (fps) | 40.1 | 85 112% | 40.9 2% | 49.8 24% | 84.7 111% | 41 2% | 37.8 -6% | 146.2 ? 265% |
| 1900x1060 Catia (catia-04) (fps) | 37.1 | 89.8 142% | 41.2 11% | 48.2 30% | 89 140% | 35.4 -5% | 39.4 6% | 138.8 ? 274% |
| 1900x1060 Creo (creo-01) (fps) | 26.9 | 51.1 90% | 9.64 -64% | 23.1 -14% | 55.4 106% | 27.4 2% | 7.37 -73% | 68.8 ? 156% |
| 1900x1060 Energy (energy-01) (fps) | 0.4 | 20.1 4925% | 0.41 2% | 0.91 128% | 20.7 5075% | 0.32 -20% | 0.46 15% | 21.3 ? 5225% |
| 1900x1060 Maya (maya-04) (fps) | 38.3 | 73.4 92% | 39.9 4% | 54.9 43% | 69.7 82% | 39.2 2% | 41.3 8% | 125.8 ? 228% |
| 1900x1060 Medical (medical-01) (fps) | 11.8 | 61.7 423% | 12.3 4% | 16.9 43% | 60.5 413% | 11.5 -3% | 12 2% | 76.6 ? 549% |
| 1900x1060 Showcase (showcase-01) (fps) | 16.6 | 30.1 81% | 17.9 8% | 18.2 10% | 30.3 83% | 17.7 7% | 21.2 28% | 81.5 ? 391% |
| 1900x1060 Solidworks (sw-03) (fps) | 45.3 | 113 149% | 47.2 4% | 42.7 -6% | 116 156% | 46 2% | 41.6 -8% | 119.3 ? 163% |
| SPECviewperf 13 | 202% | 0% | 21% | 190% | -0% | 3% | 410% | |
| 3ds Max (3dsmax-06) (fps) | 40.1 | 86.1 115% | 40.5 1% | 46.4 16% | 83.9 109% | 40.5 1% | 39 -3% | 142.9 ? 256% |
| Catia (catia-05) (fps) | 51.3 | 132 157% | 59.4 16% | 71.6 40% | 130 153% | 49 -4% | 57.1 11% | 191.8 ? 274% |
| Creo (creo-02) (fps) | 41.1 | 93.6 128% | 38.8 -6% | 29.6 -28% | 93.4 127% | 39.5 -4% | 37.5 -9% | 160.7 ? 291% |
| Energy (energy-02) (fps) | 4.5 | 25.8 473% | 4.27 -5% | 5.69 26% | 23.8 429% | 4.32 -4% | 4.34 -4% | 38.9 ? 764% |
| Maya (maya-05) (fps) | 47.5 | 108 127% | 44.2 -7% | 59.5 25% | 107 125% | 47.2 -1% | 46.3 -3% | 199.4 ? 320% |
| Medical (medical-02) (fps) | 14.4 | 79.8 454% | 14.5 1% | 29.7 106% | 77.6 439% | 15.2 6% | 16 11% | 146.5 ? 917% |
| Showcase (showcase-02) (fps) | 17.3 | 30 73% | 17.9 3% | 18.2 5% | 25.4 47% | 18.1 5% | 21.4 24% | 77.7 ? 349% |
| Solidworks (sw-04) (fps) | 57.1 | 107 87% | 55.8 -2% | 44.8 -22% | 109 91% | 55.8 -2% | 53.7 -6% | 121.1 ? 112% |
| SPECviewperf 2020 | 295% | -2% | 31% | 286% | -3% | 2% | 546% | |
| 3840x2160 Medical (medical-03) (fps) | 3.49 | 12 244% | 2.57 -26% | 5.05 45% | 11.1 218% | 2.66 -24% | 2.67 -23% | 22.9 ? 556% |
| 3840x2160 Energy (energy-03) (fps) | 3.05 | 15.4 405% | 3.02 -1% | 4.61 51% | 14.1 362% | 3.03 -1% | 2.97 -3% | 33.7 ? 1005% |
| 3840x2160 Creo (creo-03) (fps) | 14.8 | 31.4 112% | 15.3 3% | 17.9 21% | 31.4 112% | 15.1 2% | 16.9 14% | 49.8 ? 236% |
| 3840x2160 CATIA (catia-06) (fps) | 7.78 | 24.4 214% | 8.2 5% | 10 29% | 24.8 219% | 7.87 1% | 8.82 13% | 34.8 ? 347% |
| 3840x2160 3ds Max (3dsmax-07) (fps) | 9.69 | 21 117% | 9.67 0% | 12.9 33% | 20.9 116% | 9.81 1% | 10.1 4% | 55.4 ? 472% |
| 3840x2160 Siemens NX (snx-04) (fps) | 6.29 | 61.5 878% | 6.69 6% | 5.7 -9% | 61.4 876% | 6.2 -1% | 6.01 -4% | 51.5 ? 719% |
| 3840x2160 Maya (maya-06) (fps) | 23.9 | 47.2 97% | 24 0% | 35.4 48% | 47 97% | 24.7 3% | 27.8 16% | 141.1 ? 490% |
| Durchschnitt gesamt (Programm / Settings) | 416% /
422% | -2% /
-2% | 28% /
28% | 416% /
421% | -2% /
-2% | 0% /
0% | 621% /
624% |
| 3DMark 05 Standard | 39673 Punkte | |
| 3DMark 06 Standard Score | 30775 Punkte | |
| 3DMark Vantage P Result | 25978 Punkte | |
| 3DMark 11 Performance | 7503 Punkte | |
| 3DMark Ice Storm Standard Score | 136854 Punkte | |
| 3DMark Cloud Gate Standard Score | 24758 Punkte | |
| 3DMark Fire Strike Score | 5036 Punkte | |
| 3DMark Fire Strike Extreme Score | 2405 Punkte | |
| 3DMark Time Spy Score | 1797 Punkte | |
Hilfe | ||
Gaming Performance
Mit den meisten Spielen ist die Intel Iris Xe iGPU oftmals überfordert. Spielbare Frame-Raten erreicht der Geekom XT12 Pro oftmals nur in geringen Auflösungen und dem geringsten Preset. Im Leistungsvergleich mit den Kontrahenten sehen wir ebenfalls, dass die Leistung der iGPU im Geekom XT12 Pro mit dem Khadas Mind und dem Minisforum NAD9 vergleichbar ist. Um dennoch etwas mehr 3D-Leistung zu erhalten, bleibt nur der Umweg über eine externe Grafikkarte, die via USB4 angeschlossen werden kann.
| The Witcher 3 | |
| 1024x768 Low Graphics & Postprocessing | |
| Geekom A7 | |
| Minisforum EliteMini UM780 XTX | |
| Acemagic F2A | |
| Intel NUC 13 Pro Desk Edition Kit | |
| Minisforum Neptune Series NAD9 | |
| Geekom XT12 Pro | |
| Khadas Mind | |
| 1920x1080 High Graphics & Postprocessing (Nvidia HairWorks Off) | |
| Geekom A7 | |
| Minisforum EliteMini UM780 XTX | |
| Acemagic F2A | |
| Intel NUC 13 Pro Desk Edition Kit | |
| Khadas Mind | |
| Minisforum Neptune Series NAD9 | |
| Geekom XT12 Pro | |
| Borderlands 3 | |
| 1280x720 Very Low Overall Quality (DX11) | |
| Geekom A7 | |
| Minisforum EliteMini UM780 XTX | |
| Acemagic F2A | |
| Minisforum Neptune Series NAD9 | |
| Intel NUC 13 Pro Desk Edition Kit | |
| Khadas Mind | |
| Geekom XT12 Pro | |
| 1920x1080 High Overall Quality (DX11) | |
| Minisforum EliteMini UM780 XTX | |
| Acemagic F2A | |
| Geekom A7 | |
| Minisforum Neptune Series NAD9 | |
| Intel NUC 13 Pro Desk Edition Kit | |
| Khadas Mind | |
| Geekom XT12 Pro | |
| GTA V | |
| 1024x768 Lowest Settings possible | |
| Geekom A7 | |
| Minisforum EliteMini UM780 XTX | |
| Acemagic F2A | |
| Minisforum Neptune Series NAD9 | |
| Intel NUC 13 Pro Desk Edition Kit | |
| Khadas Mind | |
| 1920x1080 High/On (Advanced Graphics Off) AA:2xMSAA + FX AF:8x | |
| Minisforum EliteMini UM780 XTX | |
| Geekom A7 | |
| Acemagic F2A | |
| Khadas Mind | |
| Minisforum Neptune Series NAD9 | |
| Intel NUC 13 Pro Desk Edition Kit | |
| GRID Legends | |
| 1280x720 Low Preset | |
| Minisforum EliteMini UM780 XTX | |
| Geekom A7 | |
| Acemagic F2A | |
| Khadas Mind | |
| 1920x1080 High Preset | |
| Minisforum EliteMini UM780 XTX | |
| Geekom A7 | |
| Acemagic F2A | |
| Khadas Mind | |
| Shadow of the Tomb Raider | |
| 1280x720 Lowest Preset | |
| Acemagic F2A | |
| Minisforum EliteMini UM780 XTX | |
| Geekom A7 | |
| Intel NUC 13 Pro Desk Edition Kit | |
| Khadas Mind | |
| Geekom XT12 Pro | |
| 1920x1080 High Preset AA:SM | |
| Acemagic F2A | |
| Minisforum EliteMini UM780 XTX | |
| Geekom A7 | |
| Intel NUC 13 Pro Desk Edition Kit | |
| Khadas Mind | |
| Geekom XT12 Pro | |
| F1 2021 | |
| 1280x720 Ultra Low Preset | |
| Geekom A7 | |
| Minisforum EliteMini UM780 XTX | |
| Acemagic F2A | |
| Minisforum Neptune Series NAD9 | |
| Geekom XT12 Pro | |
| 1920x1080 High Preset AA:T AF:16x | |
| Minisforum EliteMini UM780 XTX | |
| Geekom A7 | |
| Acemagic F2A | |
| Minisforum Neptune Series NAD9 | |
| Geekom XT12 Pro | |
| Tiny Tina's Wonderlands | |
| 1280x720 Lowest Preset (DX12) | |
| Minisforum EliteMini UM780 XTX | |
| Geekom A7 | |
| Acemagic F2A | |
| Intel NUC 13 Pro Desk Edition Kit | |
| Minisforum Neptune Series NAD9 | |
| Geekom XT12 Pro | |
| 1920x1080 High Preset (DX12) | |
| Minisforum EliteMini UM780 XTX | |
| Geekom A7 | |
| Acemagic F2A | |
| Intel NUC 13 Pro Desk Edition Kit | |
| Minisforum Neptune Series NAD9 | |
| Geekom XT12 Pro | |
Witcher-3-fps-Diagramm
| min. | mittel | hoch | max. | |
|---|---|---|---|---|
| The Witcher 3 (2015) | 87.7 | 58.9 | 31.4 | 15.6 |
| Dota 2 Reborn (2015) | 106.3 | 76.3 | 61.3 | 54.2 |
| Final Fantasy XV Benchmark (2018) | 42.2 | 22.7 | 16.4 | |
| X-Plane 11.11 (2018) | 55.5 | 42.2 | 36 | |
| Far Cry 5 (2018) | 50 | 26 | 23 | 22 |
| Strange Brigade (2018) | 81.7 | 37.9 | 30.9 | 24.8 |
| Shadow of the Tomb Raider (2018) | 39.6 | 21.7 | 18.8 | 18 |
| Far Cry New Dawn (2019) | 47 | 25 | 24 | 22 |
| Metro Exodus (2019) | 35.2 | 17.7 | 10.9 | |
| Borderlands 3 (2019) | 49.2 | 23.7 | 14.9 | 11.3 |
| F1 2020 (2020) | 84.5 | 43.7 | 34.2 | 22.5 |
| F1 2021 (2021) | 94.8 | 46.9 | 36.4 | 26.3 |
| Tiny Tina's Wonderlands (2022) | 28.8 | 22 | 14.4 | 11.2 |
| F1 22 (2022) | 42.5 | 38.4 | 28.7 | |
| F1 23 (2023) | 38.7 | 35.1 | 25.2 | |
| Cyberpunk 2077 (2023) | 16.4 | 13.1 | 11.5 | |
| Prince of Persia The Lost Crown (2024) | 120 | 81.3 | 73.1 |
Der Geekom XT12 Pro mit zwei eGPUs im Leistungs-Check
Wer den Geekom XT12 Pro mit einer eGPU bestückt, kann sich über einen massiven 3D-Leistungszuwachs freuen. Wir haben uns einmal den XT12 Pro in Kombination mit der GPD G1 sowie dem Razer Core X und einer Nvidia GeForce RTX 3060 Ti genauer angeschaut. Verglichen mit den Kontrahenten zeigt unser Testsample hier eine recht gute Leistung. Die Kombination aus den beiden eGPUs und dem Intel Prozessor liefert durchweg eine bessere Leistung als mit den Prozessoren von AMD.
Bei diesen Tests handelt es sich ausschließlich um eine Darstellung einer möglichen Leistung mit eGPUs. Eine Einflussnahme auf die Gesamtwertung in diesem Test haben diese Ergebnisse nicht.
Geekom XT12 Pro mit GPD G1 (AMD Radeon RX 7600M XT)
| Performance Rating - Percent | |
| Geekom XT12 Pro (GPD G1 Radeon RX 7600M XT @USB4) | |
| Geekom A7 (GPD G1 Radeon RX 7600M XT @USB4) | |
| Acemagic AM18 (GPD G1 Radeon RX 7600M XT @USB4) | |
| Aoostar GOD77 (GPD G1 Radeon RX 7600M XT @USB4) | |
| 3DMark 11 - 1280x720 Performance GPU | |
| Acemagic AM18 (GPD G1 Radeon RX 7600M XT @USB4) | |
| Geekom A7 (GPD G1 Radeon RX 7600M XT @USB4) | |
| Geekom XT12 Pro (GPD G1 Radeon RX 7600M XT @USB4) | |
| Aoostar GOD77 (GPD G1 Radeon RX 7600M XT @USB4) | |
| 3DMark | |
| 2560x1440 Time Spy Graphics | |
| Geekom A7 (GPD G1 Radeon RX 7600M XT @USB4) | |
| Acemagic AM18 (GPD G1 Radeon RX 7600M XT @USB4) | |
| Geekom XT12 Pro (GPD G1 Radeon RX 7600M XT @USB4) | |
| Aoostar GOD77 (GPD G1 Radeon RX 7600M XT @USB4) | |
| 1920x1080 Fire Strike Graphics | |
| Aoostar GOD77 (GPD G1 Radeon RX 7600M XT @USB4) | |
| Geekom A7 (GPD G1 Radeon RX 7600M XT @USB4) | |
| Acemagic AM18 (GPD G1 Radeon RX 7600M XT @USB4) | |
| Geekom XT12 Pro (GPD G1 Radeon RX 7600M XT @USB4) | |
| 3840x2160 Fire Strike Ultra Graphics | |
| Acemagic AM18 (GPD G1 Radeon RX 7600M XT @USB4) | |
| Aoostar GOD77 (GPD G1 Radeon RX 7600M XT @USB4) | |
| Geekom A7 (GPD G1 Radeon RX 7600M XT @USB4) | |
| Geekom XT12 Pro (GPD G1 Radeon RX 7600M XT @USB4) | |
| Unigine Superposition | |
| 1280x720 720p Low | |
| Geekom XT12 Pro (GPD G1 Radeon RX 7600M XT @USB4) | |
| Geekom A7 (GPD G1 Radeon RX 7600M XT @USB4) | |
| Acemagic AM18 (GPD G1 Radeon RX 7600M XT @USB4) | |
| Aoostar GOD77 (GPD G1 Radeon RX 7600M XT @USB4) | |
| 1920x1080 1080p High | |
| Geekom XT12 Pro (GPD G1 Radeon RX 7600M XT @USB4) | |
| Geekom A7 (GPD G1 Radeon RX 7600M XT @USB4) | |
| Acemagic AM18 (GPD G1 Radeon RX 7600M XT @USB4) | |
| Aoostar GOD77 (GPD G1 Radeon RX 7600M XT @USB4) | |
| 1920x1080 1080p Extreme | |
| Geekom XT12 Pro (GPD G1 Radeon RX 7600M XT @USB4) | |
| Geekom A7 (GPD G1 Radeon RX 7600M XT @USB4) | |
| Acemagic AM18 (GPD G1 Radeon RX 7600M XT @USB4) | |
| Aoostar GOD77 (GPD G1 Radeon RX 7600M XT @USB4) | |
| 3840x2160 4k Optimized | |
| Geekom XT12 Pro (GPD G1 Radeon RX 7600M XT @USB4) | |
| Geekom A7 (GPD G1 Radeon RX 7600M XT @USB4) | |
| Acemagic AM18 (GPD G1 Radeon RX 7600M XT @USB4) | |
| Aoostar GOD77 (GPD G1 Radeon RX 7600M XT @USB4) | |
| 7680x4320 8k Optimized | |
| Aoostar GOD77 (GPD G1 Radeon RX 7600M XT @USB4) | |
| Geekom A7 (GPD G1 Radeon RX 7600M XT @USB4) | |
| Acemagic AM18 (GPD G1 Radeon RX 7600M XT @USB4) | |
| Geekom XT12 Pro (GPD G1 Radeon RX 7600M XT @USB4) | |
| Unigine Valley 1.0 | |
| 1920x1080 Extreme HD DirectX AA:x8 | |
| Geekom A7 (GPD G1 Radeon RX 7600M XT @USB4) | |
| Acemagic AM18 (GPD G1 Radeon RX 7600M XT @USB4) | |
| Aoostar GOD77 (GPD G1 Radeon RX 7600M XT @USB4) | |
| Geekom XT12 Pro (GPD G1 Radeon RX 7600M XT @USB4) | |
| 1920x1080 Extreme HD Preset OpenGL AA:x8 | |
| Geekom A7 (GPD G1 Radeon RX 7600M XT @USB4) | |
| Geekom XT12 Pro (GPD G1 Radeon RX 7600M XT @USB4) | |
| Acemagic AM18 (GPD G1 Radeon RX 7600M XT @USB4) | |
| Aoostar GOD77 (GPD G1 Radeon RX 7600M XT @USB4) | |
| Unigine Heaven 4.0 | |
| Extreme Preset OpenGL | |
| Geekom A7 (GPD G1 Radeon RX 7600M XT @USB4) | |
| Geekom XT12 Pro (GPD G1 Radeon RX 7600M XT @USB4) | |
| Aoostar GOD77 (GPD G1 Radeon RX 7600M XT @USB4) | |
| Acemagic AM18 (GPD G1 Radeon RX 7600M XT @USB4) | |
| Extreme Preset DX11 | |
| Geekom A7 (GPD G1 Radeon RX 7600M XT @USB4) | |
| Acemagic AM18 (GPD G1 Radeon RX 7600M XT @USB4) | |
| Aoostar GOD77 (GPD G1 Radeon RX 7600M XT @USB4) | |
| Geekom XT12 Pro (GPD G1 Radeon RX 7600M XT @USB4) | |
| ComputeMark v2.1 | |
| 1024x600 Normal, Score | |
| Aoostar GOD77 (GPD G1 Radeon RX 7600M XT @USB4) | |
| Geekom A7 (GPD G1 Radeon RX 7600M XT @USB4) | |
| Acemagic AM18 (GPD G1 Radeon RX 7600M XT @USB4) | |
| Geekom XT12 Pro (GPD G1 Radeon RX 7600M XT @USB4) | |
| 1024x600 Normal, Fluid 3DTex | |
| Acemagic AM18 (GPD G1 Radeon RX 7600M XT @USB4) | |
| Geekom XT12 Pro (GPD G1 Radeon RX 7600M XT @USB4) | |
| Geekom A7 (GPD G1 Radeon RX 7600M XT @USB4) | |
| Aoostar GOD77 (GPD G1 Radeon RX 7600M XT @USB4) | |
| 1024x600 Normal, Fluid 2DTexArr | |
| Geekom XT12 Pro (GPD G1 Radeon RX 7600M XT @USB4) | |
| Geekom A7 (GPD G1 Radeon RX 7600M XT @USB4) | |
| Aoostar GOD77 (GPD G1 Radeon RX 7600M XT @USB4) | |
| Acemagic AM18 (GPD G1 Radeon RX 7600M XT @USB4) | |
| 1024x600 Normal, Mandel Vector | |
| Geekom A7 (GPD G1 Radeon RX 7600M XT @USB4) | |
| Aoostar GOD77 (GPD G1 Radeon RX 7600M XT @USB4) | |
| Acemagic AM18 (GPD G1 Radeon RX 7600M XT @USB4) | |
| Geekom XT12 Pro (GPD G1 Radeon RX 7600M XT @USB4) | |
| 1024x600 Normal, Mandel Scalar | |
| Geekom A7 (GPD G1 Radeon RX 7600M XT @USB4) | |
| Aoostar GOD77 (GPD G1 Radeon RX 7600M XT @USB4) | |
| Acemagic AM18 (GPD G1 Radeon RX 7600M XT @USB4) | |
| Geekom XT12 Pro (GPD G1 Radeon RX 7600M XT @USB4) | |
| 1024x600 Normal, QJuliaRayTrace | |
| Aoostar GOD77 (GPD G1 Radeon RX 7600M XT @USB4) | |
| Geekom XT12 Pro (GPD G1 Radeon RX 7600M XT @USB4) | |
| Acemagic AM18 (GPD G1 Radeon RX 7600M XT @USB4) | |
| Geekom A7 (GPD G1 Radeon RX 7600M XT @USB4) | |
| min. | mittel | hoch | max. | QHD | 4K | |
|---|---|---|---|---|---|---|
| GTA V (2015) | 159.3 | 148.4 | 118.5 | 74 | 60.7 | 69.4 |
| The Witcher 3 (2015) | 254 | 184.3 | 125.4 | 70.5 | 55.6 | 47.3 |
| Dota 2 Reborn (2015) | 102.2 | 89.1 | 78.3 | 76.9 | 65 | |
| Final Fantasy XV Benchmark (2018) | 162.9 | 106.4 | 71.2 | 55.4 | 32.9 | |
| X-Plane 11.11 (2018) | 65.1 | 46 | 33.6 | 25.3 | ||
| Far Cry 5 (2018) | 142 | 123 | 115 | 107 | 82 | 45 |
| Strange Brigade (2018) | 204 | 154.6 | 149.6 | 138.5 | 108.1 | 62.1 |
| Shadow of the Tomb Raider (2018) | 125.4 | 89.9 | 86.4 | 79.8 | 61.7 | 34.5 |
| Far Cry New Dawn (2019) | 126 | 110 | 106 | 93 | 84 | 49 |
| Metro Exodus (2019) | 77.1 | 62.6 | 55.2 | 45.4 | 38.4 | 26.1 |
| Borderlands 3 (2019) | 138.5 | 98.6 | 73.8 | 60.5 | 46 | 27.1 |
| F1 2020 (2020) | 255 | 184.1 | 156.8 | 108.3 | 86.7 | 54.9 |
| F1 2021 (2021) | 239 | 203 | 131.8 | 81.5 | 63.3 | 31.4 |
| God of War (2022) | 93.9 | 84.4 | 70 | 52.1 | 43.3 | 30.2 |
| GRID Legends (2022) | 96.5 | 82.3 | 67.3 | 60.2 | 55.7 | 44 |
| Tiny Tina's Wonderlands (2022) | 164.8 | 127.1 | 85.2 | 68.5 | 51.1 | 22.1 |
| F1 22 (2022) | 101.6 | 96.9 | 76.4 | 39.9 | 27.8 | 13.5 |
| F1 23 (2023) | 120.1 | 126.7 | 106.1 | 32.7 | 13.1 | 6.6 |
| Cyberpunk 2077 (2023) | 87.3 | 74.5 | 64.9 | 59.1 | 39.9 | 18.5 |
| Assassin's Creed Mirage (2023) | 75 | 68 | 63 | 46 | 37 | 23 |
| Total War Pharaoh (2023) | 280.6 | 158 | 93.4 | 46.7 | 45.9 | 32.1 |
| Avatar Frontiers of Pandora (2023) | 46 | 44 | 36 | 30 | 20 | 9.5 |
Geekom XT12 Pro mit Razer Core X und Nvidia GeForce RTX 3060 Ti
| Performance Rating - Percent | |
| Geekom A7 (Nvidia GeForce RTX 3060 Ti FE) | |
| Intel NUC 13 Pro Kit NUC13ANK (Nvidia GeForce RTX 3060 Ti FE TB3) | |
| Acemagic AM18 (Nvidia GeForce RTX 3060 Ti FE) | |
| Geekom XT12 Pro (Nvidia GeForce RTX 3060 Ti FE) | |
| Minisforum Venus Series UM790 Pro (Nvidia GeForce RTX 3060 Ti FE TB3) | |
| Ace Magician AM08Pro (Nvidia GeForce RTX 3060 Ti FE TB3) | |
| 3DMark 11 - 1280x720 Performance GPU | |
| Geekom A7 (Nvidia GeForce RTX 3060 Ti FE) | |
| Intel NUC 13 Pro Kit NUC13ANK (Nvidia GeForce RTX 3060 Ti FE TB3) | |
| Minisforum Venus Series UM790 Pro (Nvidia GeForce RTX 3060 Ti FE TB3) | |
| Acemagic AM18 (Nvidia GeForce RTX 3060 Ti FE) | |
| Ace Magician AM08Pro (Nvidia GeForce RTX 3060 Ti FE TB3) | |
| Geekom XT12 Pro (Nvidia GeForce RTX 3060 Ti FE) | |
| 3DMark | |
| 2560x1440 Time Spy Graphics | |
| Geekom A7 (Nvidia GeForce RTX 3060 Ti FE) | |
| Geekom XT12 Pro (Nvidia GeForce RTX 3060 Ti FE) | |
| Intel NUC 13 Pro Kit NUC13ANK (Nvidia GeForce RTX 3060 Ti FE TB3) | |
| Acemagic AM18 (Nvidia GeForce RTX 3060 Ti FE) | |
| Minisforum Venus Series UM790 Pro (Nvidia GeForce RTX 3060 Ti FE TB3) | |
| Ace Magician AM08Pro (Nvidia GeForce RTX 3060 Ti FE TB3) | |
| 1920x1080 Fire Strike Graphics | |
| Geekom A7 (Nvidia GeForce RTX 3060 Ti FE) | |
| Intel NUC 13 Pro Kit NUC13ANK (Nvidia GeForce RTX 3060 Ti FE TB3) | |
| Acemagic AM18 (Nvidia GeForce RTX 3060 Ti FE) | |
| Geekom XT12 Pro (Nvidia GeForce RTX 3060 Ti FE) | |
| Ace Magician AM08Pro (Nvidia GeForce RTX 3060 Ti FE TB3) | |
| Minisforum Venus Series UM790 Pro (Nvidia GeForce RTX 3060 Ti FE TB3) | |
| 3840x2160 Fire Strike Ultra Graphics | |
| Acemagic AM18 (Nvidia GeForce RTX 3060 Ti FE) | |
| Geekom A7 (Nvidia GeForce RTX 3060 Ti FE) | |
| Geekom XT12 Pro (Nvidia GeForce RTX 3060 Ti FE) | |
| Intel NUC 13 Pro Kit NUC13ANK (Nvidia GeForce RTX 3060 Ti FE TB3) | |
| Minisforum Venus Series UM790 Pro (Nvidia GeForce RTX 3060 Ti FE TB3) | |
| Ace Magician AM08Pro (Nvidia GeForce RTX 3060 Ti FE TB3) | |
| Unigine Superposition | |
| 1280x720 720p Low | |
| Geekom A7 (Nvidia GeForce RTX 3060 Ti FE) | |
| Minisforum Venus Series UM790 Pro (Nvidia GeForce RTX 3060 Ti FE TB3) | |
| Acemagic AM18 (Nvidia GeForce RTX 3060 Ti FE) | |
| Geekom XT12 Pro (Nvidia GeForce RTX 3060 Ti FE) | |
| Intel NUC 13 Pro Kit NUC13ANK (Nvidia GeForce RTX 3060 Ti FE TB3) | |
| Ace Magician AM08Pro (Nvidia GeForce RTX 3060 Ti FE TB3) | |
| 1920x1080 1080p High | |
| Intel NUC 13 Pro Kit NUC13ANK (Nvidia GeForce RTX 3060 Ti FE TB3) | |
| Geekom A7 (Nvidia GeForce RTX 3060 Ti FE) | |
| Acemagic AM18 (Nvidia GeForce RTX 3060 Ti FE) | |
| Geekom XT12 Pro (Nvidia GeForce RTX 3060 Ti FE) | |
| Ace Magician AM08Pro (Nvidia GeForce RTX 3060 Ti FE TB3) | |
| Minisforum Venus Series UM790 Pro (Nvidia GeForce RTX 3060 Ti FE TB3) | |
| 1920x1080 1080p Extreme | |
| Intel NUC 13 Pro Kit NUC13ANK (Nvidia GeForce RTX 3060 Ti FE TB3) | |
| Geekom XT12 Pro (Nvidia GeForce RTX 3060 Ti FE) | |
| Acemagic AM18 (Nvidia GeForce RTX 3060 Ti FE) | |
| Geekom A7 (Nvidia GeForce RTX 3060 Ti FE) | |
| Ace Magician AM08Pro (Nvidia GeForce RTX 3060 Ti FE TB3) | |
| Minisforum Venus Series UM790 Pro (Nvidia GeForce RTX 3060 Ti FE TB3) | |
| 3840x2160 4k Optimized | |
| Intel NUC 13 Pro Kit NUC13ANK (Nvidia GeForce RTX 3060 Ti FE TB3) | |
| Geekom XT12 Pro (Nvidia GeForce RTX 3060 Ti FE) | |
| Geekom A7 (Nvidia GeForce RTX 3060 Ti FE) | |
| Acemagic AM18 (Nvidia GeForce RTX 3060 Ti FE) | |
| Ace Magician AM08Pro (Nvidia GeForce RTX 3060 Ti FE TB3) | |
| Minisforum Venus Series UM790 Pro (Nvidia GeForce RTX 3060 Ti FE TB3) | |
| 7680x4320 8k Optimized | |
| Geekom XT12 Pro (Nvidia GeForce RTX 3060 Ti FE) | |
| Intel NUC 13 Pro Kit NUC13ANK (Nvidia GeForce RTX 3060 Ti FE TB3) | |
| Acemagic AM18 (Nvidia GeForce RTX 3060 Ti FE) | |
| Geekom A7 (Nvidia GeForce RTX 3060 Ti FE) | |
| Ace Magician AM08Pro (Nvidia GeForce RTX 3060 Ti FE TB3) | |
| Minisforum Venus Series UM790 Pro (Nvidia GeForce RTX 3060 Ti FE TB3) | |
| Unigine Valley 1.0 | |
| 1920x1080 Extreme HD DirectX AA:x8 | |
| Geekom XT12 Pro (Nvidia GeForce RTX 3060 Ti FE) | |
| Intel NUC 13 Pro Kit NUC13ANK (Nvidia GeForce RTX 3060 Ti FE TB3) | |
| Geekom A7 (Nvidia GeForce RTX 3060 Ti FE) | |
| Acemagic AM18 (Nvidia GeForce RTX 3060 Ti FE) | |
| Minisforum Venus Series UM790 Pro (Nvidia GeForce RTX 3060 Ti FE TB3) | |
| Ace Magician AM08Pro (Nvidia GeForce RTX 3060 Ti FE TB3) | |
| 1920x1080 Extreme HD Preset OpenGL AA:x8 | |
| Geekom XT12 Pro (Nvidia GeForce RTX 3060 Ti FE) | |
| Geekom A7 (Nvidia GeForce RTX 3060 Ti FE) | |
| Acemagic AM18 (Nvidia GeForce RTX 3060 Ti FE) | |
| Intel NUC 13 Pro Kit NUC13ANK (Nvidia GeForce RTX 3060 Ti FE TB3) | |
| Ace Magician AM08Pro (Nvidia GeForce RTX 3060 Ti FE TB3) | |
| Minisforum Venus Series UM790 Pro (Nvidia GeForce RTX 3060 Ti FE TB3) | |
| Unigine Heaven 4.0 | |
| Extreme Preset OpenGL | |
| Geekom A7 (Nvidia GeForce RTX 3060 Ti FE) | |
| Acemagic AM18 (Nvidia GeForce RTX 3060 Ti FE) | |
| Geekom XT12 Pro (Nvidia GeForce RTX 3060 Ti FE) | |
| Intel NUC 13 Pro Kit NUC13ANK (Nvidia GeForce RTX 3060 Ti FE TB3) | |
| Ace Magician AM08Pro (Nvidia GeForce RTX 3060 Ti FE TB3) | |
| Minisforum Venus Series UM790 Pro (Nvidia GeForce RTX 3060 Ti FE TB3) | |
| Extreme Preset DX11 | |
| Geekom A7 (Nvidia GeForce RTX 3060 Ti FE) | |
| Intel NUC 13 Pro Kit NUC13ANK (Nvidia GeForce RTX 3060 Ti FE TB3) | |
| Geekom XT12 Pro (Nvidia GeForce RTX 3060 Ti FE) | |
| Acemagic AM18 (Nvidia GeForce RTX 3060 Ti FE) | |
| Ace Magician AM08Pro (Nvidia GeForce RTX 3060 Ti FE TB3) | |
| Minisforum Venus Series UM790 Pro (Nvidia GeForce RTX 3060 Ti FE TB3) | |
| ComputeMark v2.1 | |
| 1024x600 Normal, Score | |
| Geekom A7 (Nvidia GeForce RTX 3060 Ti FE) | |
| Acemagic AM18 (Nvidia GeForce RTX 3060 Ti FE) | |
| Minisforum Venus Series UM790 Pro (Nvidia GeForce RTX 3060 Ti FE TB3) | |
| Intel NUC 13 Pro Kit NUC13ANK (Nvidia GeForce RTX 3060 Ti FE TB3) | |
| Ace Magician AM08Pro (Nvidia GeForce RTX 3060 Ti FE TB3) | |
| Geekom XT12 Pro (Nvidia GeForce RTX 3060 Ti FE) | |
| 1024x600 Normal, Fluid 3DTex | |
| Geekom A7 (Nvidia GeForce RTX 3060 Ti FE) | |
| Intel NUC 13 Pro Kit NUC13ANK (Nvidia GeForce RTX 3060 Ti FE TB3) | |
| Minisforum Venus Series UM790 Pro (Nvidia GeForce RTX 3060 Ti FE TB3) | |
| Acemagic AM18 (Nvidia GeForce RTX 3060 Ti FE) | |
| Ace Magician AM08Pro (Nvidia GeForce RTX 3060 Ti FE TB3) | |
| Geekom XT12 Pro (Nvidia GeForce RTX 3060 Ti FE) | |
| 1024x600 Normal, Fluid 2DTexArr | |
| Geekom A7 (Nvidia GeForce RTX 3060 Ti FE) | |
| Intel NUC 13 Pro Kit NUC13ANK (Nvidia GeForce RTX 3060 Ti FE TB3) | |
| Minisforum Venus Series UM790 Pro (Nvidia GeForce RTX 3060 Ti FE TB3) | |
| Acemagic AM18 (Nvidia GeForce RTX 3060 Ti FE) | |
| Ace Magician AM08Pro (Nvidia GeForce RTX 3060 Ti FE TB3) | |
| Geekom XT12 Pro (Nvidia GeForce RTX 3060 Ti FE) | |
| 1024x600 Normal, Mandel Vector | |
| Geekom A7 (Nvidia GeForce RTX 3060 Ti FE) | |
| Acemagic AM18 (Nvidia GeForce RTX 3060 Ti FE) | |
| Minisforum Venus Series UM790 Pro (Nvidia GeForce RTX 3060 Ti FE TB3) | |
| Intel NUC 13 Pro Kit NUC13ANK (Nvidia GeForce RTX 3060 Ti FE TB3) | |
| Ace Magician AM08Pro (Nvidia GeForce RTX 3060 Ti FE TB3) | |
| Geekom XT12 Pro (Nvidia GeForce RTX 3060 Ti FE) | |
| 1024x600 Normal, Mandel Scalar | |
| Geekom A7 (Nvidia GeForce RTX 3060 Ti FE) | |
| Acemagic AM18 (Nvidia GeForce RTX 3060 Ti FE) | |
| Minisforum Venus Series UM790 Pro (Nvidia GeForce RTX 3060 Ti FE TB3) | |
| Intel NUC 13 Pro Kit NUC13ANK (Nvidia GeForce RTX 3060 Ti FE TB3) | |
| Ace Magician AM08Pro (Nvidia GeForce RTX 3060 Ti FE TB3) | |
| Geekom XT12 Pro (Nvidia GeForce RTX 3060 Ti FE) | |
| 1024x600 Normal, QJuliaRayTrace | |
| Acemagic AM18 (Nvidia GeForce RTX 3060 Ti FE) | |
| Geekom A7 (Nvidia GeForce RTX 3060 Ti FE) | |
| Intel NUC 13 Pro Kit NUC13ANK (Nvidia GeForce RTX 3060 Ti FE TB3) | |
| Minisforum Venus Series UM790 Pro (Nvidia GeForce RTX 3060 Ti FE TB3) | |
| Ace Magician AM08Pro (Nvidia GeForce RTX 3060 Ti FE TB3) | |
| Geekom XT12 Pro (Nvidia GeForce RTX 3060 Ti FE) | |
| min. | mittel | hoch | max. | QHD | 4K | |
|---|---|---|---|---|---|---|
| GTA V (2015) | 177.3 | 173.2 | 164.2 | 98.5 | 89.8 | 103.3 |
| The Witcher 3 (2015) | 304 | 208 | 150.6 | 72.9 | 62.5 | 71.8 |
| Dota 2 Reborn (2015) | 153.2 | 134.5 | 121.1 | 109.9 | 70.4 | |
| Final Fantasy XV Benchmark (2018) | 159.7 | 116.9 | 80.2 | 49.3 | 31.6 | |
| X-Plane 11.11 (2018) | 126.2 | 107.4 | 84.1 | 71.3 | ||
| Far Cry 5 (2018) | 154 | 131 | 125 | 119 | 99 | 58 |
| Strange Brigade (2018) | 205 | 155.9 | 153 | 149.1 | 128.3 | 84.1 |
| Shadow of the Tomb Raider (2018) | 150.3 | 103.1 | 99.4 | 94 | 77.2 | 47.8 |
| Far Cry New Dawn (2019) | 130 | 114 | 111 | 99 | 91 | 59 |
| Metro Exodus (2019) | 142.2 | 90.4 | 68.4 | 51.7 | 45.4 | 33.5 |
| Borderlands 3 (2019) | 149.6 | 127 | 101.8 | 83.3 | 64.7 | 38.5 |
| F1 2020 (2020) | 209 | 122.3 | 123.5 | 101.8 | 88.5 | 59.9 |
| F1 2021 (2021) | 141.2 | 108.3 | 68.7 | 51.5 | 48.5 | 40.4 |
| God of War (2022) | 109.9 | 96.4 | 81.2 | 62 | 55.8 | 39.7 |
| GRID Legends (2022) | 115.6 | 98.6 | 82.3 | 70.4 | 63.7 | 50.7 |
| Tiny Tina's Wonderlands (2022) | 171.2 | 136.3 | 101 | 79.7 | 60.9 | 34 |
| F1 22 (2022) | 60 | 55.2 | 42.8 | 27.2 | 26.6 | 19.5 |
| F1 23 (2023) | 66 | 64.2 | 53 | 33.5 | 31.2 | 13.4 |
| Baldur's Gate 3 (2023) | 113.3 | 90.1 | 78.5 | 78.2 | 61.2 | 36.7 |
| Cyberpunk 2077 (2023) | 83.8 | 78.9 | 70.1 | 63.3 | 44.5 | 22 |
| Assassin's Creed Mirage (2023) | 86 | 82 | 77 | 62 | 52 | 37 |
| Total War Pharaoh (2023) | 303.7 | 170.9 | 101.8 | 76.5 | 62.2 | 38.9 |
| Avatar Frontiers of Pandora (2023) | 63 | 62 | 62 | 50 | 43 | 31 |
| F1 24 (2024) | 75 | 74.1 | 60.4 | 41.8 | 36 | 18.6 |
Emissionen - Nicht sehr leise, aber dafür recht sparsam
Geräuschemissionen
Zu den leisesten Geräten zählt der Geekom XT12 Pro leider nicht. Nur im Leerlauf arbeitet das Gerät mit wenig Geräusch, und nur ein leises Lüfterrauschen ist hörbar. Das ändert sich unter Last, denn mit bis zu 44,2 dB(A) ist der Mini-PC deutlich hörbar. Beim Spielen haben wir zwischenzeitlich sogar bis zu 47,2 dB(A) messen können. Einen dauerhaft hohen Schalldruckpegel konnten wir beim Spielen jedoch nicht feststellen. Hier schwankte das Ergebnis zwischen 39 und 47,2 dB(A).
Lautstärkediagramm
| Idle |
| 28 / 28.1 / 28.5 dB(A) |
| Last |
| 39.6 / 44.2 dB(A) |
 | ||
30 dB leise 40 dB(A) deutlich hörbar 50 dB(A) störend |
||
min: | ||
| Geekom XT12 Pro i9-12900H, Iris Xe G7 96EUs | Minisforum EliteMini UM780 XTX R7 7840HS, Radeon 780M | Minisforum Neptune Series NAD9 i9-12900H, Iris Xe G7 96EUs | Acemagic F2A Ultra 7 155H, Arc 8-Core | Geekom A7 R9 7940HS, Radeon 780M | Intel NUC 13 Pro Desk Edition Kit i7-1360P, Iris Xe G7 96EUs | Khadas Mind i7-1360P, Iris Xe G7 96EUs | |
|---|---|---|---|---|---|---|---|
| Geräuschentwicklung | 8% | 2% | 0% | -8% | 0% | -14% | |
| aus / Umgebung * (dB) | 25.4 | 24.8 2% | 30.2 -19% | 24.9 2% | 25.4 -0% | 25.2 1% | 25.2 1% |
| Idle min * (dB) | 28 | 28.5 -2% | 30.5 -9% | 25.4 9% | 33.3 -19% | 28.1 -0% | 34.4 -23% |
| Idle avg * (dB) | 28.1 | 28.5 -1% | 30.5 -9% | 25.7 9% | 33.6 -20% | 28.2 -0% | 34.4 -22% |
| Idle max * (dB) | 28.5 | 28.7 -1% | 30.5 -7% | 25.7 10% | 33.7 -18% | 28.3 1% | 34.5 -21% |
| Last avg * (dB) | 39.6 | 32.4 18% | 30.5 23% | 47.8 -21% | 43.3 -9% | 42 -6% | 44.7 -13% |
| Witcher 3 ultra * (dB) | 47.2 | 32.7 31% | 45.23 4% | 43.2 8% | 49 -4% | ||
| Last max * (dB) | 44.2 | 39.6 10% | 30.5 31% | 49 -11% | 43.3 2% | 42.1 5% | 50.4 -14% |
* ... kleinere Werte sind besser
Temperatur
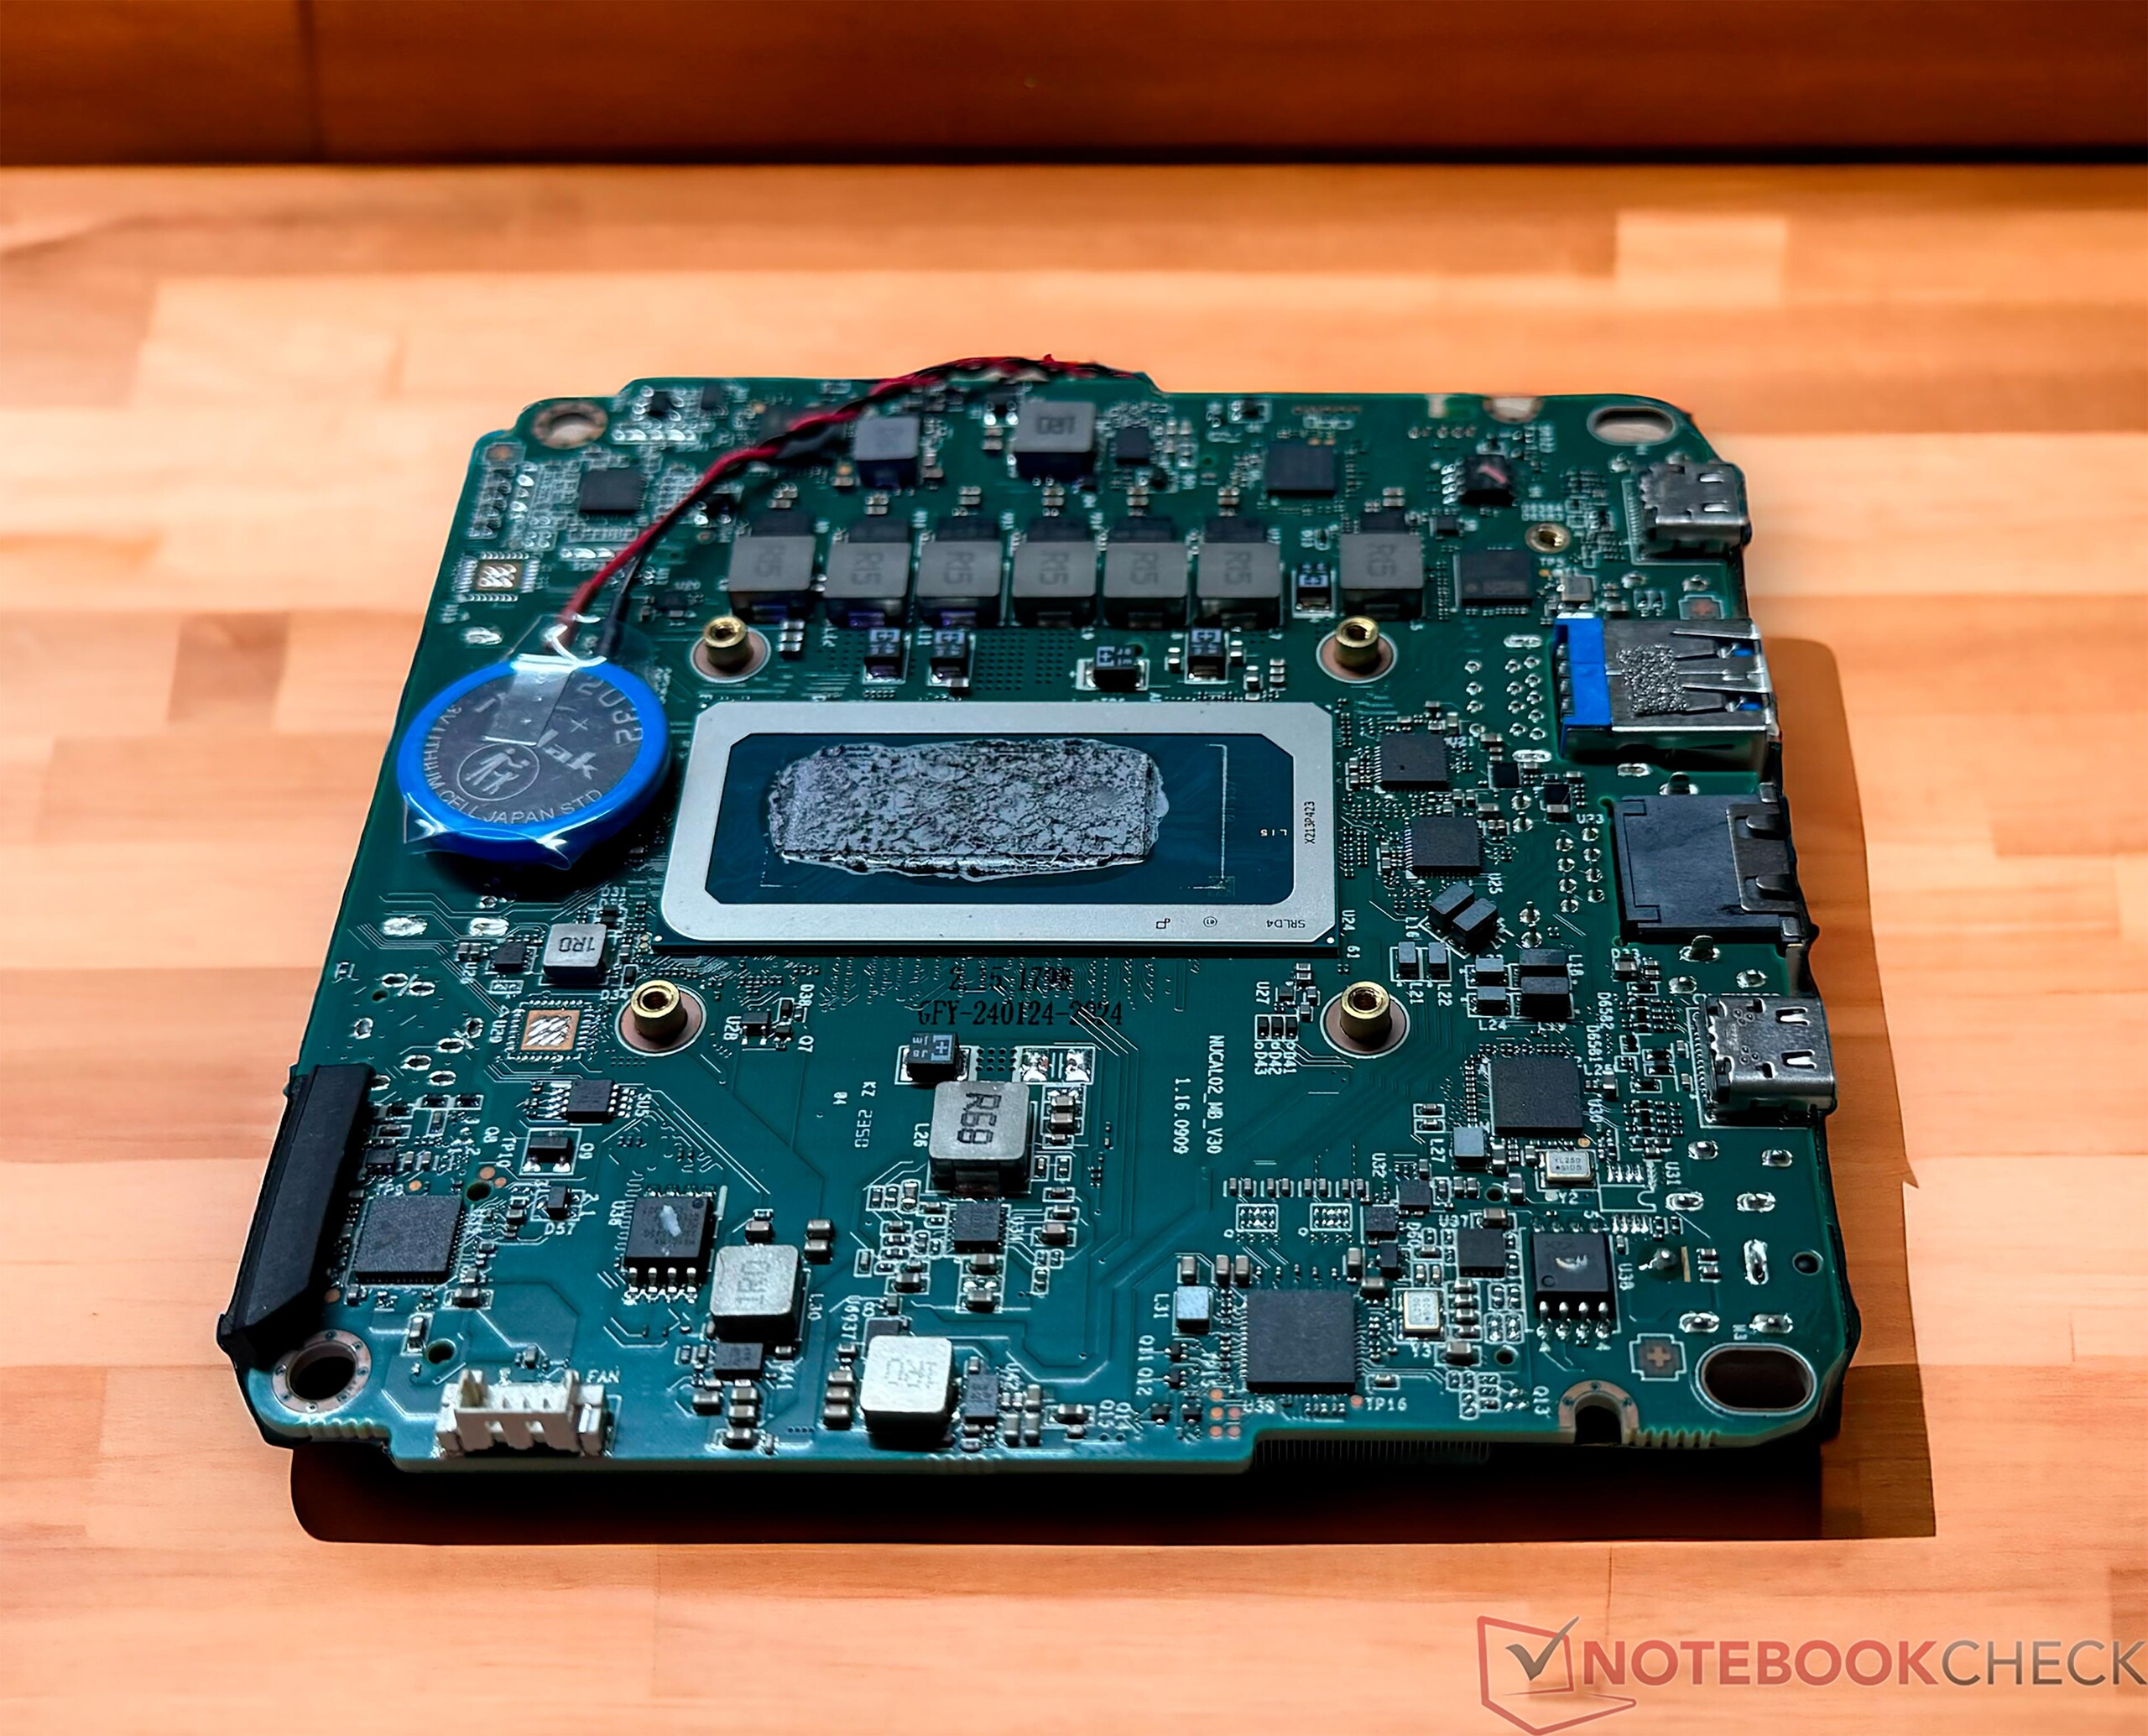
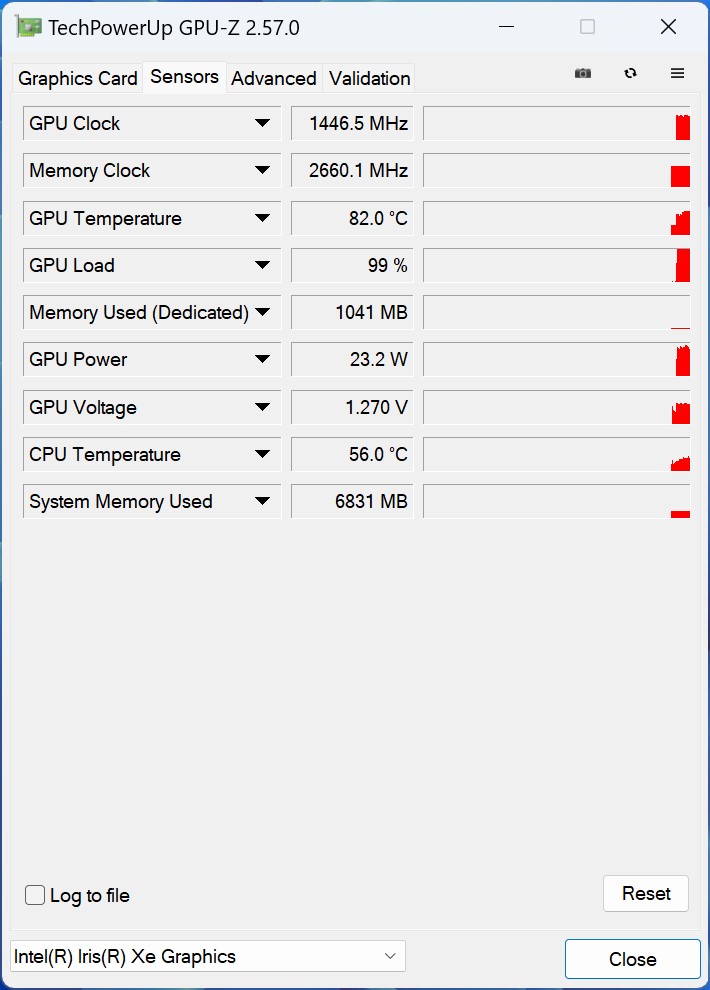
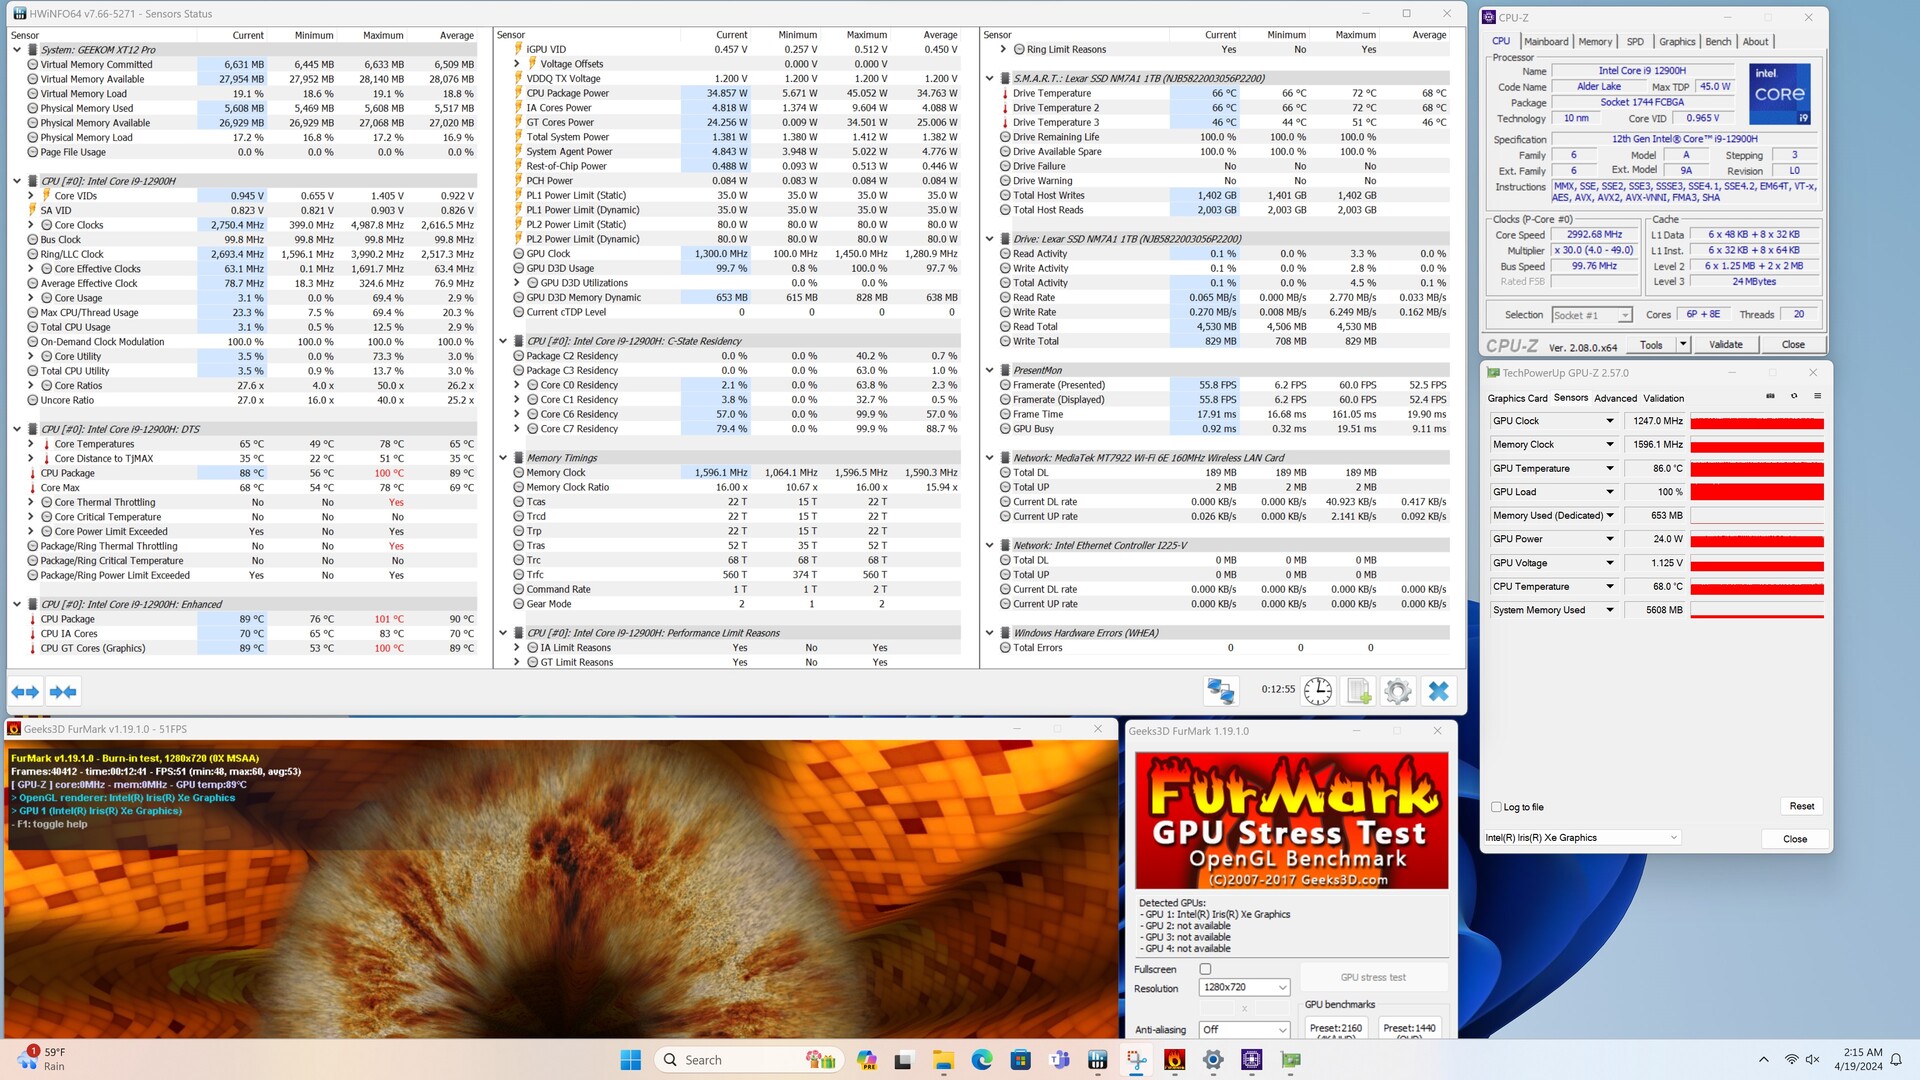
Der Geekom XT12 Pro erwärmt sich unter Last spürbar. Dabei erhitzt sich die Oberseite deutlich mehr als die Unterseite des Mini-PCs. Die dokumentierten Temperaturen liegen alle in einem vertretbaren Rahmen und geben keinen Grund zur Sorge. Etwas anders sieht es beim Intel Core i9-12900H selbst aus. Diese hohen Werte erreicht der XT12 Pro jedoch nur kurzfristig. Unter Dauerlast sinkt die Leistungsaufnahme des SoC auf 35 Watt, wodurch sich die Temperatur des Prozessors im Durchschnitt bei etwas mehr als 80 °C einpendelt. Somit arbeitet das SoC innerhalb Vorgaben seitens Intel, wenngleich die Turboausnutzung aufgrund der kleinen Kühleinheit sehr gering ausfällt.
Um der hohen Temperatur auf den Grund zu gehen, haben wir im Nachgang zu den Tests einmal den Kühler demontiert, um ein Problem mit der Wärmeleitpaste auszuschließen. Hier konnten wir tatsächlich kein Problem ausfindig machen, und auch neue Wärmeleitpaste konnte hier nicht für geringere Hot-Spot-Temperaturen unter Last sorgen.
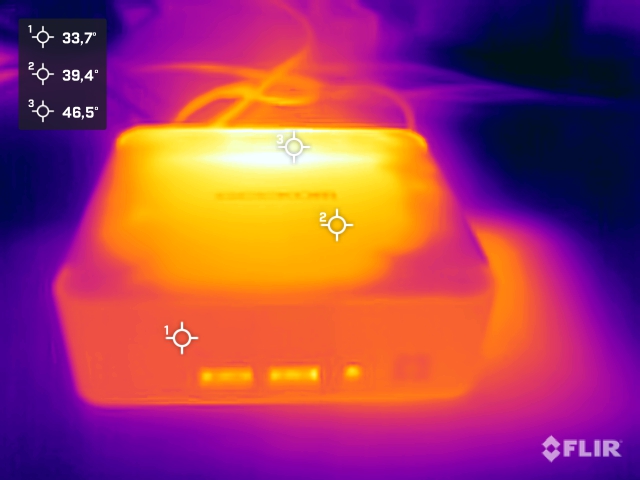

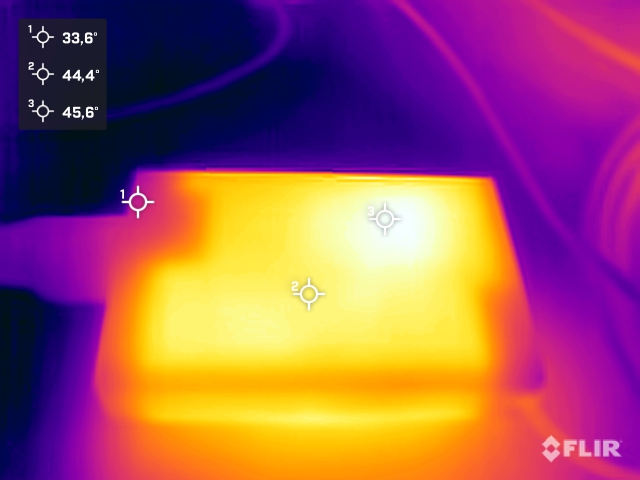
(-) Die maximale Temperatur auf der Oberseite ist 47.5 °C. Im Vergleich liegt der Klassendurchschnitt bei 35.4 °C (von 20.6 bis 69.5 °C für die Klasse Mini PC).
(+) Auf der Unterseite messen wir eine maximalen Wert von 39.9 °C (im Vergleich zum Durchschnitt von 36.1 °C).
(+) Ohne Last messen wir eine durchschnittliche Temperatur von 30.7 °C auf der Oberseite. Der Klassendurchschnitt erreicht 32.1 °C.
Energieaufnahme
Geekom selbst spricht beim XT12 Pro von einem sehr effizienten und sparsamen Mini-PC. Zum größten Teil können wir diesem tatsächlich zustimmen, wenngleich der Energiebedarf im Leerlauf nicht ganz zu der These passt. Fast identische Werte erreichte auch der Intel NUC 13 in unserem Test. Andererseits zeigt Geekom, dass es auch anders gehen kann, wenn wir uns hier einmal den Vergleich zu dem A7 anschauen. In der Spitze sehen wir jedoch nur verhaltene 87,8 Watt, womit unser Testsample recht sparsam ist. Bei durchschnittlicher Last sinkt der Energiebedarf auf ca. 53 Watt, was ebenfalls ein gutes Ergebnis ist. Die Energieversorgung übernimmt ein kleines Netzteil mit 120 Watt. Die Leistung des Netzteils ist etwas überdimensioniert, grundsätzlich hätte hier auch ein 90-Watt-Netzteil ausgereicht.
| Aus / Standby | |
| Idle | |
| Last |
|
Legende:
min: | |
| Geekom XT12 Pro i9-12900H, Iris Xe G7 96EUs | Minisforum EliteMini UM780 XTX R7 7840HS, Radeon 780M | Minisforum Neptune Series NAD9 i9-12900H, Iris Xe G7 96EUs | Acemagic F2A Ultra 7 155H, Arc 8-Core | Geekom A7 R9 7940HS, Radeon 780M | Intel NUC 13 Pro Desk Edition Kit i7-1360P, Iris Xe G7 96EUs | Khadas Mind i7-1360P, Iris Xe G7 96EUs | Durchschnittliche Intel Iris Xe Graphics G7 96EUs | Durchschnitt der Klasse Mini PC | |
|---|---|---|---|---|---|---|---|---|---|
| Stromverbrauch | -15% | -44% | -17% | 20% | 3% | 3% | 17% | -20% | |
| Idle min * (Watt) | 5.7 | 8.5 -49% | 12.1 -112% | 9.1 -60% | 3.8 33% | 7 -23% | 7.8 -37% | 5.51 ? 3% | 8.65 ? -52% |
| Idle avg * (Watt) | 9.5 | 10.5 -11% | 13 -37% | 10.3 -8% | 4.8 49% | 9.2 3% | 10.9 -15% | 8.66 ? 9% | 10.8 ? -14% |
| Idle max * (Watt) | 16.5 | 12.9 22% | 18.2 -10% | 14.4 13% | 6.5 61% | 11.8 28% | 11.8 28% | 10.9 ? 34% | 13.7 ? 17% |
| Last avg * (Watt) | 53.3 | 67.2 -26% | 70.6 -32% | 54.9 -3% | 71.9 -35% | 45 16% | 39.2 26% | 45.6 ? 14% | 64.4 ? -21% |
| Last max * (Watt) | 87.8 | 97.2 -11% | 113 -29% | 110.4 -26% | 94.7 -8% | 97.2 -11% | 76.4 13% | 67.8 ? 23% | 112.2 ? -28% |
* ... kleinere Werte sind besser
Energieaufnahme mit externem Monitor
Energieaufnahme mit externem Monitor
Pro
Contra
Fazit - Premiumpreis, aber nur solide Leistung
Der Geekom XT12 Pro ist zweifelsohne ein leistungsstarker Mini-PC. Der Intel Core i9-12900H gehört inzwischen nicht mehr zu den aktuellen Modellen, kann aber trotzdem in puncto CPU-Leistung mit den moderneren Kontrahenten mithalten. Den größten Nachteil, den der Geekom XT12 Pro derzeit hat, ist die 3D-Performance. Neuere Modelle auf Basis der Meteor-Lake-Serie kann dank überarbeiteter iGPU deutlich mehr Leistung abliefern. Gleiches gilt auch für AMDs Radeon 780M. Wer darauf nicht angewiesen ist, kann darüber sicherlich leicht hinwegsehen. Bei der Verarbeitung leistet Geekom einen hervorragenden Job. Auch bei der Materialauswahl gibt es nichts auszusetzen.
Der Geekom XT12 Pro ist ein leistungsfähiger Mini-PC und überzeugt mit einer tollen Ausstattung. Das Preis-Leistungs-Verhältnis zählt allerdings nicht zur Stärke des Geekom XT12 Pro.
Überzeugen kann der Geekom XT12 Pro vor allem mit der guten Auswahl an externen Schnittstellen. Gleich zwei USB4-Buchsen sind mehr als das, was die meisten Kontrahenten anbieten. Immerhin lässt sich die geringe 3D-Leistung mit dem richtigen Zubehör spürbar erhöhen. Die restliche Ausstattung, welche noch 32 GB DDR4-RAM und eine 1-TB-SSD umfasst, sind gut und runden das Gesamtpaket ordentlich ab. Beim Thema Effizienz kann man geteilter Meinung sein, denn im Leerlauf sehen wir bei unserem Testsample vergleichsweise hohe Werte, welche das Gesamtbild etwas trüben. Immerhin wirbt der Hersteller hier mit einem besonders effizienten Gerät. Ganz absprechen möchten wir dem Geekom XT12 Pro dieses nicht, denn unter Last zeigt der Mini-PC sehr wohl, dass er sparsam sein kann. Ob das jetzt so gewollt ist oder ein Resultat der kleinen Kühleinheit, lassen wir jetzt einmal so im Raum stehen.
Zum Schluss wollen wir uns auch noch einmal dem Kaufpreis widmen: Geekom gibt für den XT12 Pro eine UVP von 899 Euro an, welche aber oftmals kaum zum Tragen kommt, da es immer wieder spezielle Angebote gibt. Somit muss man derzeit 749 Euro für den Geekom XT12 Pro in unserer Testausstattung hinblättern. In Relation zu anderen Mini-PCs ist der aktuelle Kaufpreis recht hoch. Für den gleichen Preis bekommt man auch den Geekom A7 mit AMD Ryzen 7 7840HS, der sicherlich eine bessere Leistung abliefert als der XT12 Pro aus diesem Review. Hier steht sich Geekom selbst ein wenig im Weg und macht den XT12 Pro unattraktiv. Verglichen mit dem Geekom A7 sollte der Geekom XT12 Pro also deutlich günstiger in der Anschaffung sein, um das Kaufinteresse zu wecken.
Preise und Verfügbarkeit
Den Geekom XT12 Pro gibt es momentan nur in unserer Testausstattung, er kann bei Geekom oder Amazon geordert werden. Preislich werden hier jeweils 749 Euro fällig. Fünf Prozent Rabatt gibt es aktuell noch bei Verwendung der Codes: Geekom-Shop: ntcpr5
, Amazon: ntcpr5XT12
Geekom XT12 Pro
- 30.07.2024 v8
Sebastian Bade
Transparenz
Die Auswahl der zu testenden Geräte erfolgt innerhalb der Redaktion. Das vorliegende Testmuster wurde dem Autor vom Hersteller unentgeltlich zu Testzwecken überlassen. Eine Einflussnahme auf den Testbericht gab es nicht, der Hersteller erhielt keine Version des Reviews vor der Veröffentlichung. Es bestand keine Verpflichtung zur Publikation. Als eigenständiges, unabhängiges Unternehmen unterliegt Notebookcheck keiner Diktion von Herstellern, Shops und Verlagen.
So testet Notebookcheck
Pro Jahr werden von Notebookcheck hunderte Laptops und Smartphones unabhängig in von uns standardisierten technischen Verfahren getestet, um eine Vergleichbarkeit aller Testergebnisse zu gewährleisten. Seit rund 20 Jahren entwickeln wir diese Testmethoden kontinuierlich weiter und setzen damit Branchenstandards. In unseren Testlaboren kommt ausschließlich hochwertiges Messequipment in die Hände erfahrener Techniker und Redakteure. Die Tests unterliegen einer mehrstufigen Kontrolle. Unsere komplexe Gesamtbewertung basiert auf hunderten fundierten Messergebnissen und Benchmarks, womit Ihnen Objektivität garantiert ist. Weitere Informationen zu unseren Testmethoden gibt es hier.
