Fazit - MSIs bisher schlankster und professionellster Laptop
Ähnlich wie bei der Transformation des 2025 Dell 16 Premium zum 2026 XPS 16 ist das 2026 Prestige 16 ein schlankeres, eleganteres und effizienteres Gerät als das 2025 Prestige 16. Ein Großteil davon ist auf den Wechsel zu Intel Panther Lake X7 zurückzuführen, der im Vergleich zur Vorgängergeneration eine deutliche Steigerung der Leistung pro Watt bietet. Insbesondere die GPU-Leistung ist beeindruckend, wenn man bedenkt, dass das MSI dünner ist als die meisten anderen 16-Zoll-Notebooks mit ähnlichen Prozessoroptionen.
Abgesehen von der CPU hat MSI in diesem Jahr bedeutende Änderungen eingeführt, die von den Anschlüssen bis hin zum Display reichen. Die meisten davon sind ein Sprung nach vorne, einschließlich des 120-Hz-OLED-Panels und der professionelleren Ästhetik, aber die weggefallenen Anschlüsse und der kleinere Akku bedeuten Licht und Schatten. Die Kerntemperatur ist höher als bei den Konkurrenten, und das 65-W-USB-C-Netzteil bremst unter bestimmten Bedingungen sowohl die Turbo-Boost-Leistung als auch die Ladegeschwindigkeit.
Nutzer, denen ein etwas dickeres und schwereres System nichts ausmacht, finden im XPS 16 eine starke Alternative, da es einen noch höher auflösenden Touchscreen und eine Webcam bietet, allerdings mit weniger Anschlussmöglichkeiten und einer kürzeren Akkulaufzeit. In der Zwischenzeit ist das AMD betriebene Asus Zenbook S16 sogar noch leichter und kleiner, hat eine ähnliche CPU-Leistung und Panel-Optionen, aber seine Lüfter sind lauter, und die Grafikleistung ist schlechter. Je nach den spezifischen Anforderungen des Nutzers kann das eine Modell besser sein als das andere.
Pro
Contra
Preis und Verfügbarkeit
Das MSI Prestige 16 AI+ C3MTG im klassischen Klapp-Design ist zum Zeitpunkt der Veröffentlichung noch nicht im Handel erhältlich. Allerdings ist das Prestige 16 Flip AI+ C3MTG jetzt zu einem Preis von 1.949 Euro bei notebooksbilliger erhältlich.
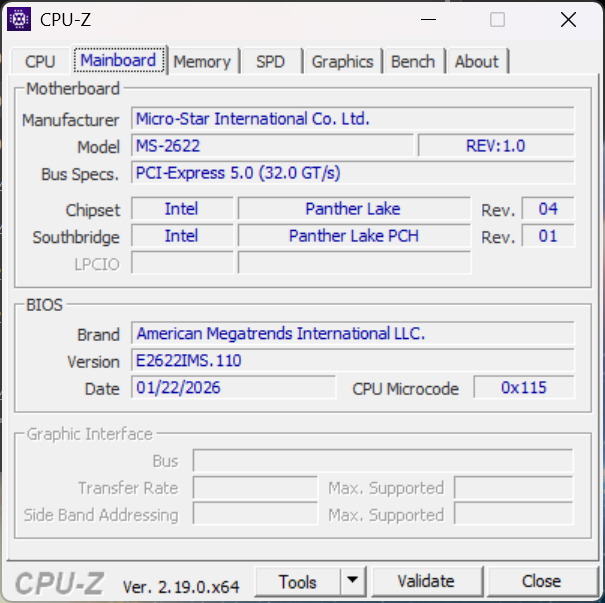
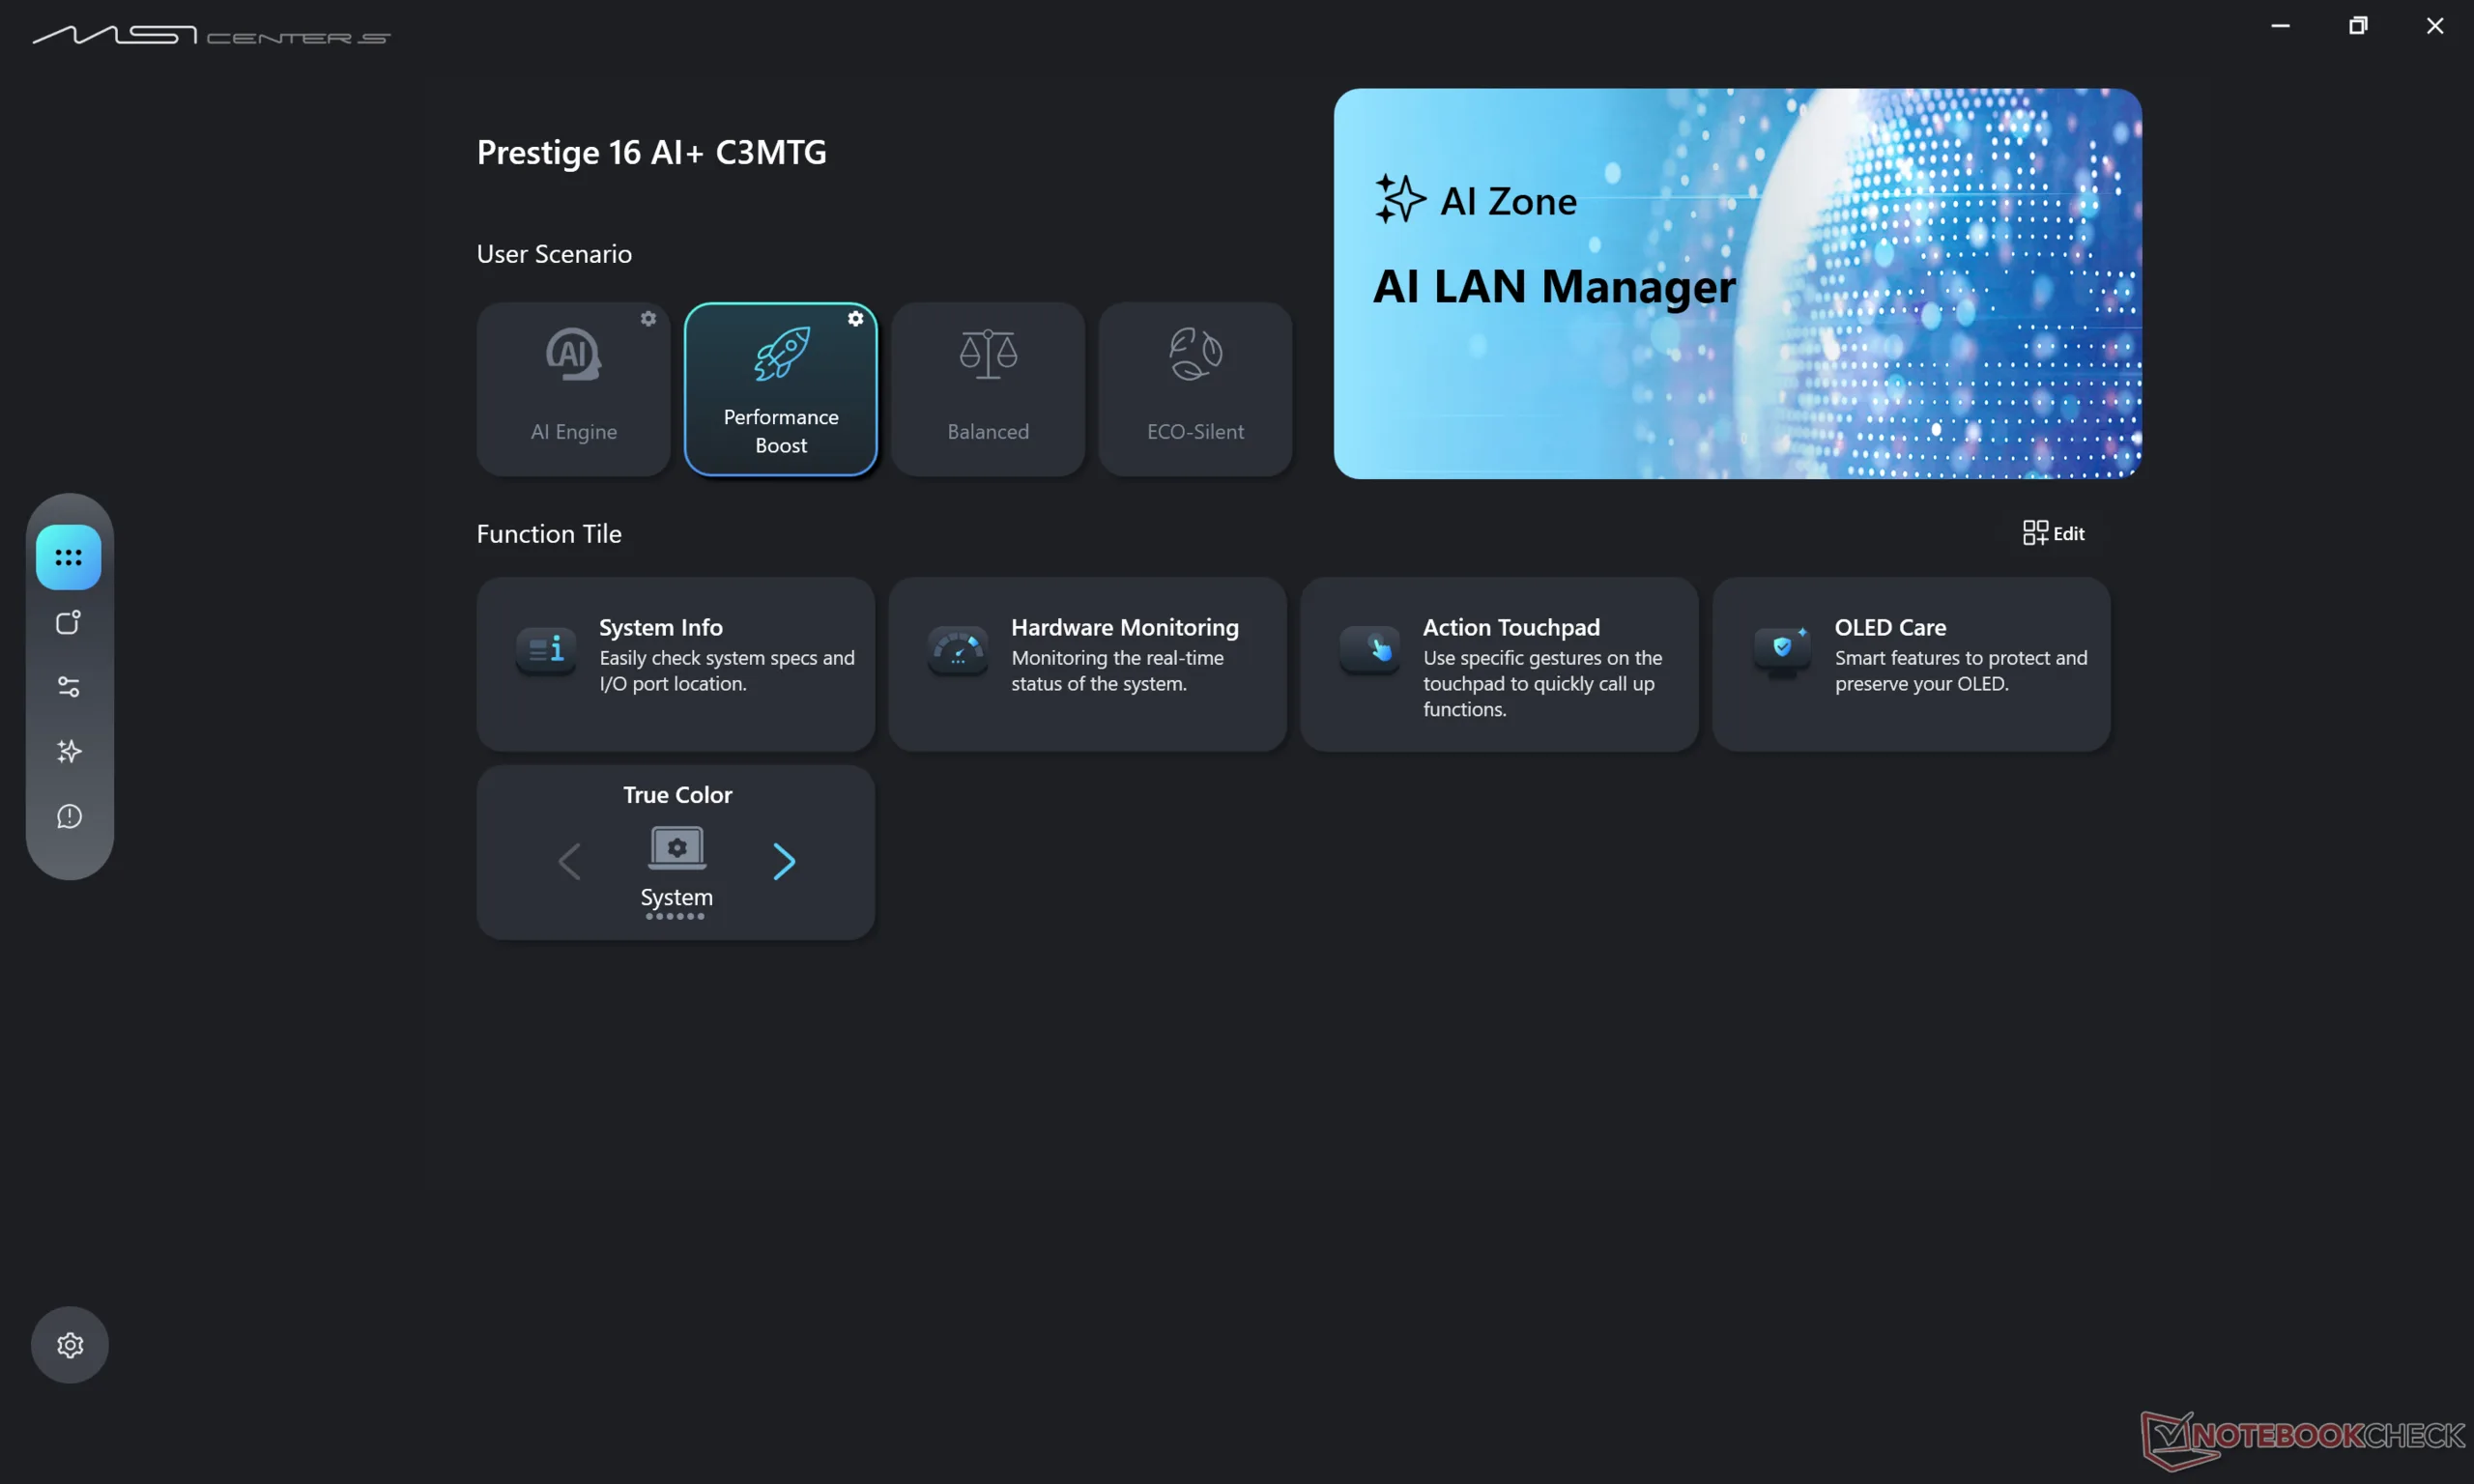
Das Prestige 16 AI+ C3MG Clamshell wurde auf der CES 2026 zusammen mit einer Reihe anderer Prestige-Modelle vorgestellt, die alle mit Intel-Panther-Lake-CPUs ausgestattet sind. Dieses neueste Prestige 16 wurde im Vergleich zum letztjährigen Modell mit Arrow-Lake-Prozessor vollständig überarbeitet und bietet ein frisches Benutzererlebnis.
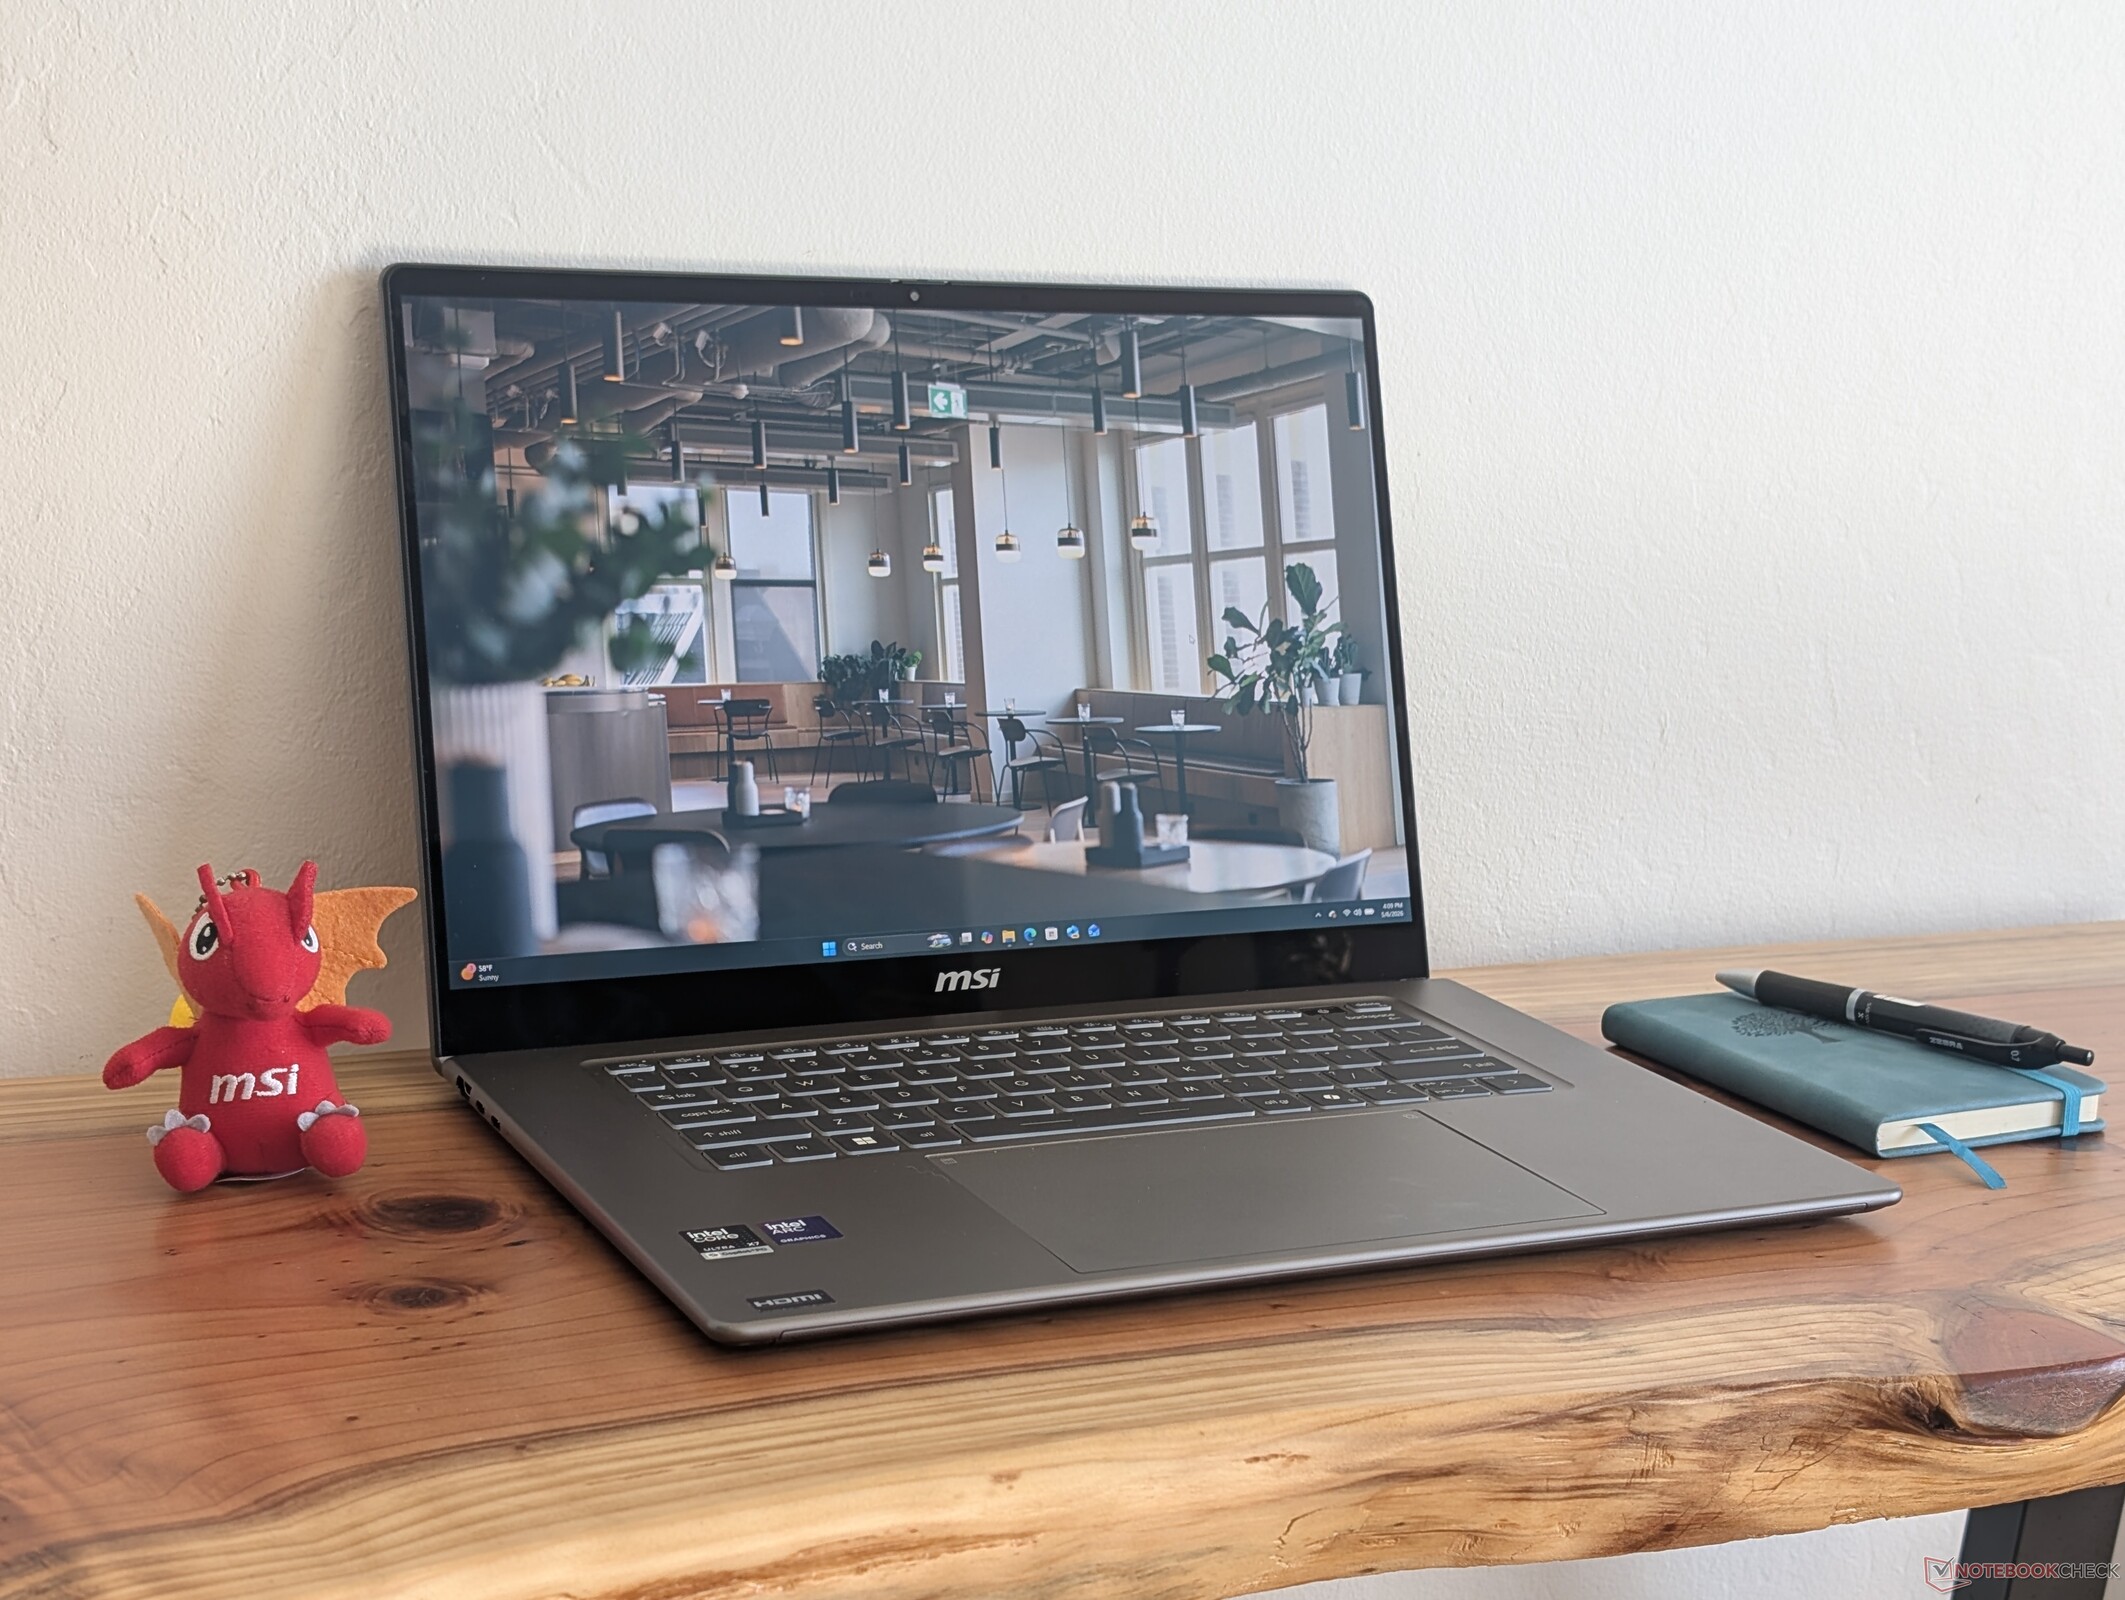
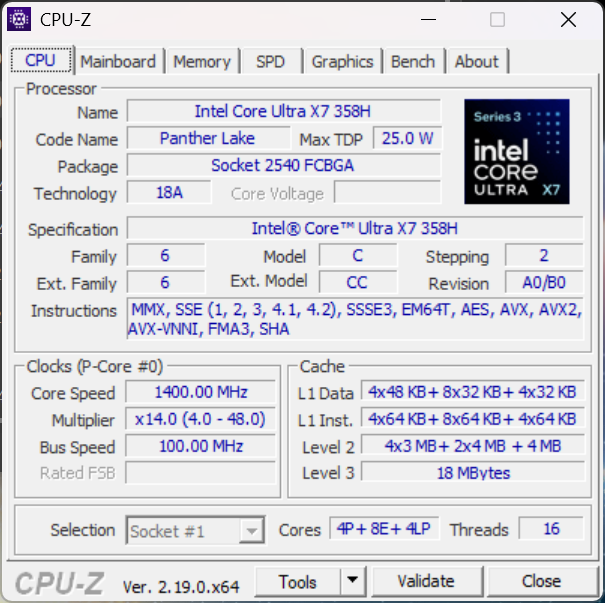
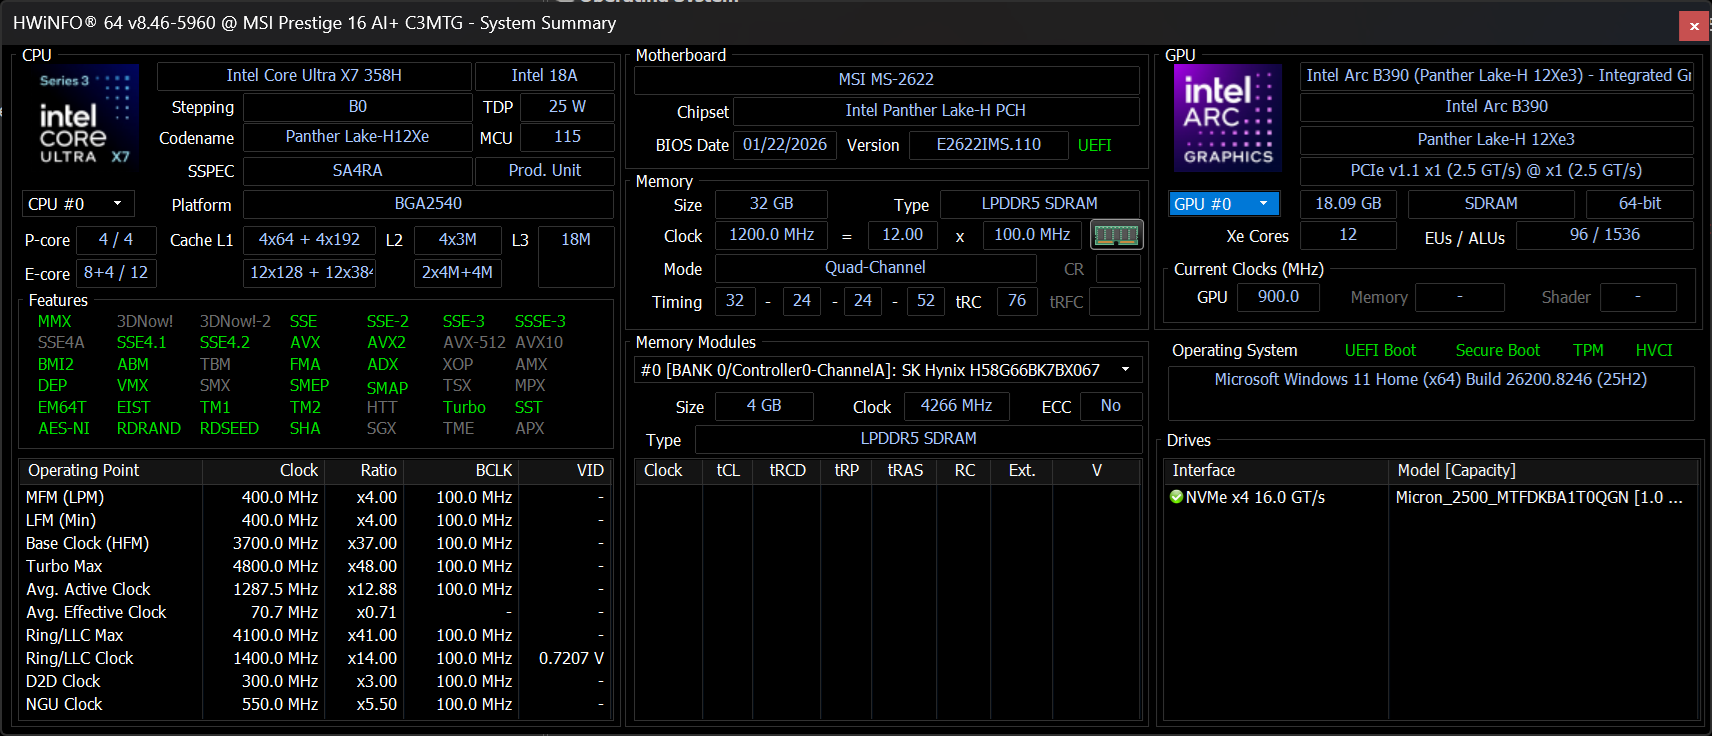
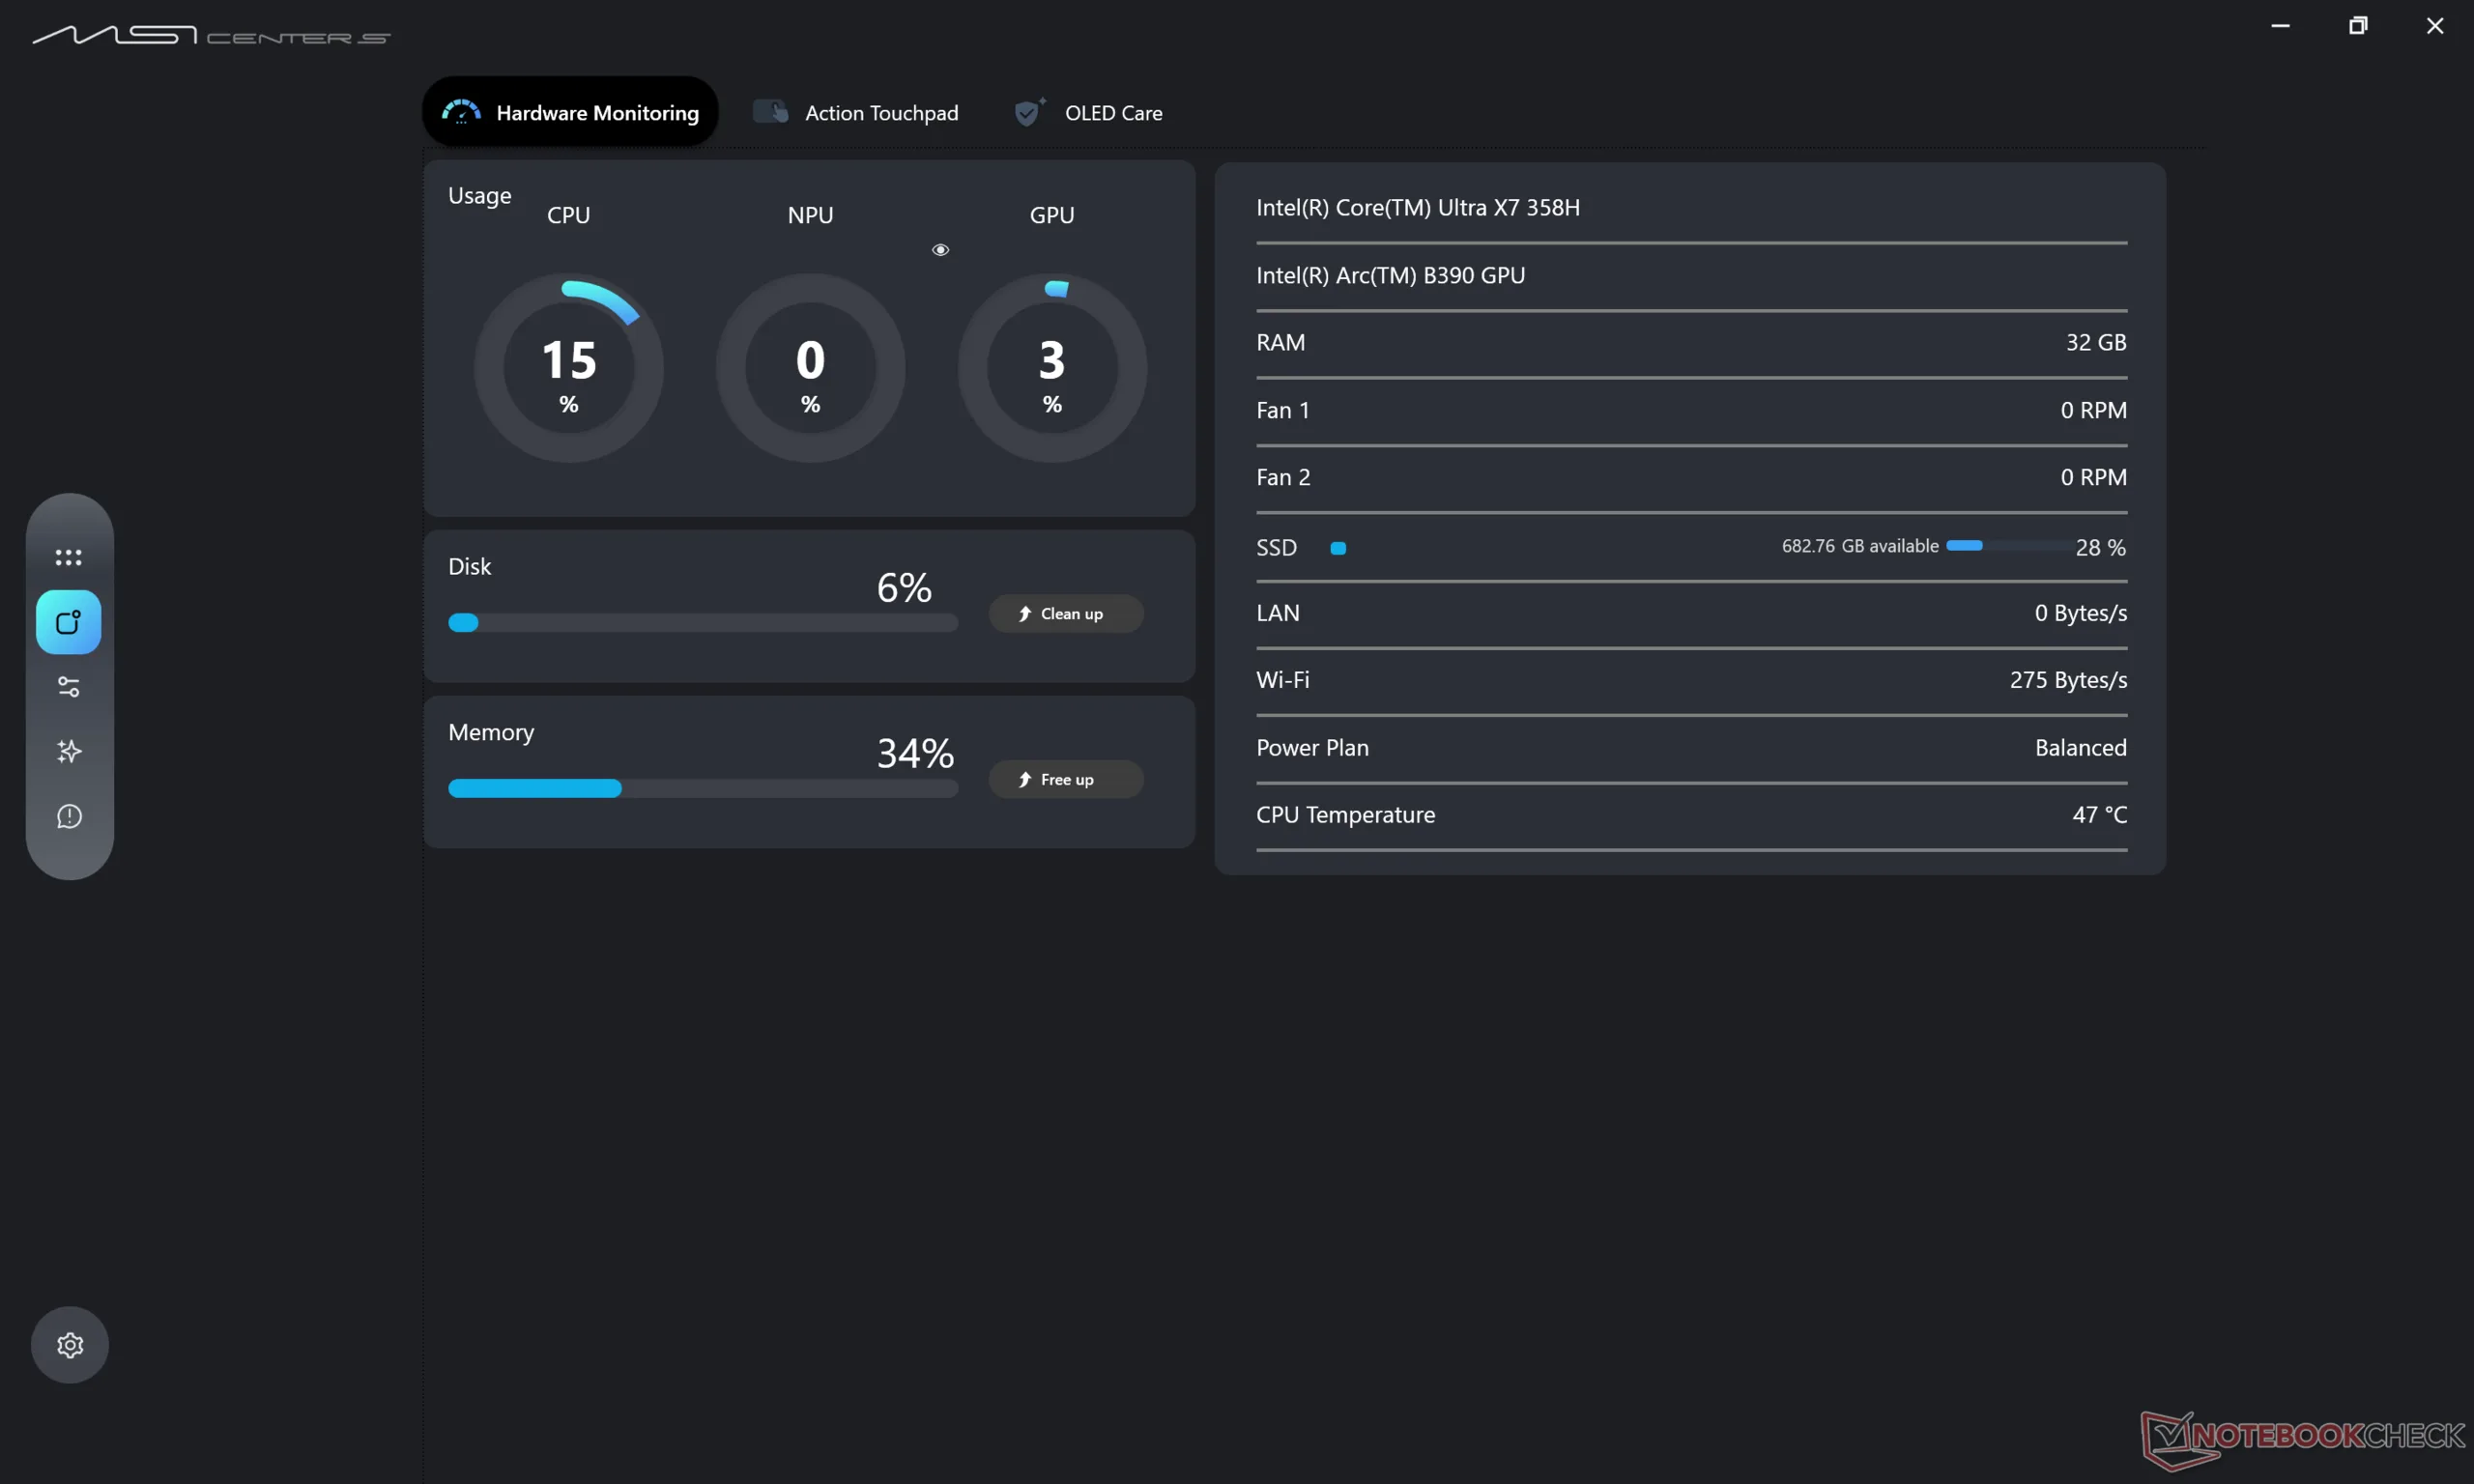
Unser Testgerät ist mit der Core Ultra X7 358H CPU, 32 GB RAM und einem 1.800p-OLED-Touchscreen ausgestattet und kostet etwa 2.100 US-Dollar. Andere SKUs können stattdessen mit dem Core Ultra X9 388H ausgeliefert werden, aber das 1.800p-OLED und die Arc-B390-GPU bleiben konstant.
Zu den konkurrierenden Modellen gehören andere High-End-Prosumer-Notebooks wie das Dell XPS 16, das Lenovo Pro 9i 16 Aura oder die Asus-ZenBook-S16-Serie. Eine Convertible Version mit 360-Grad-Scharnieren ist ebenfalls erhältlich: das Prestige 16 Flip AI+ C3MG.
Weitere MSI Testberichte:
Spezifikationen
Preisvergleich
Gehäuse
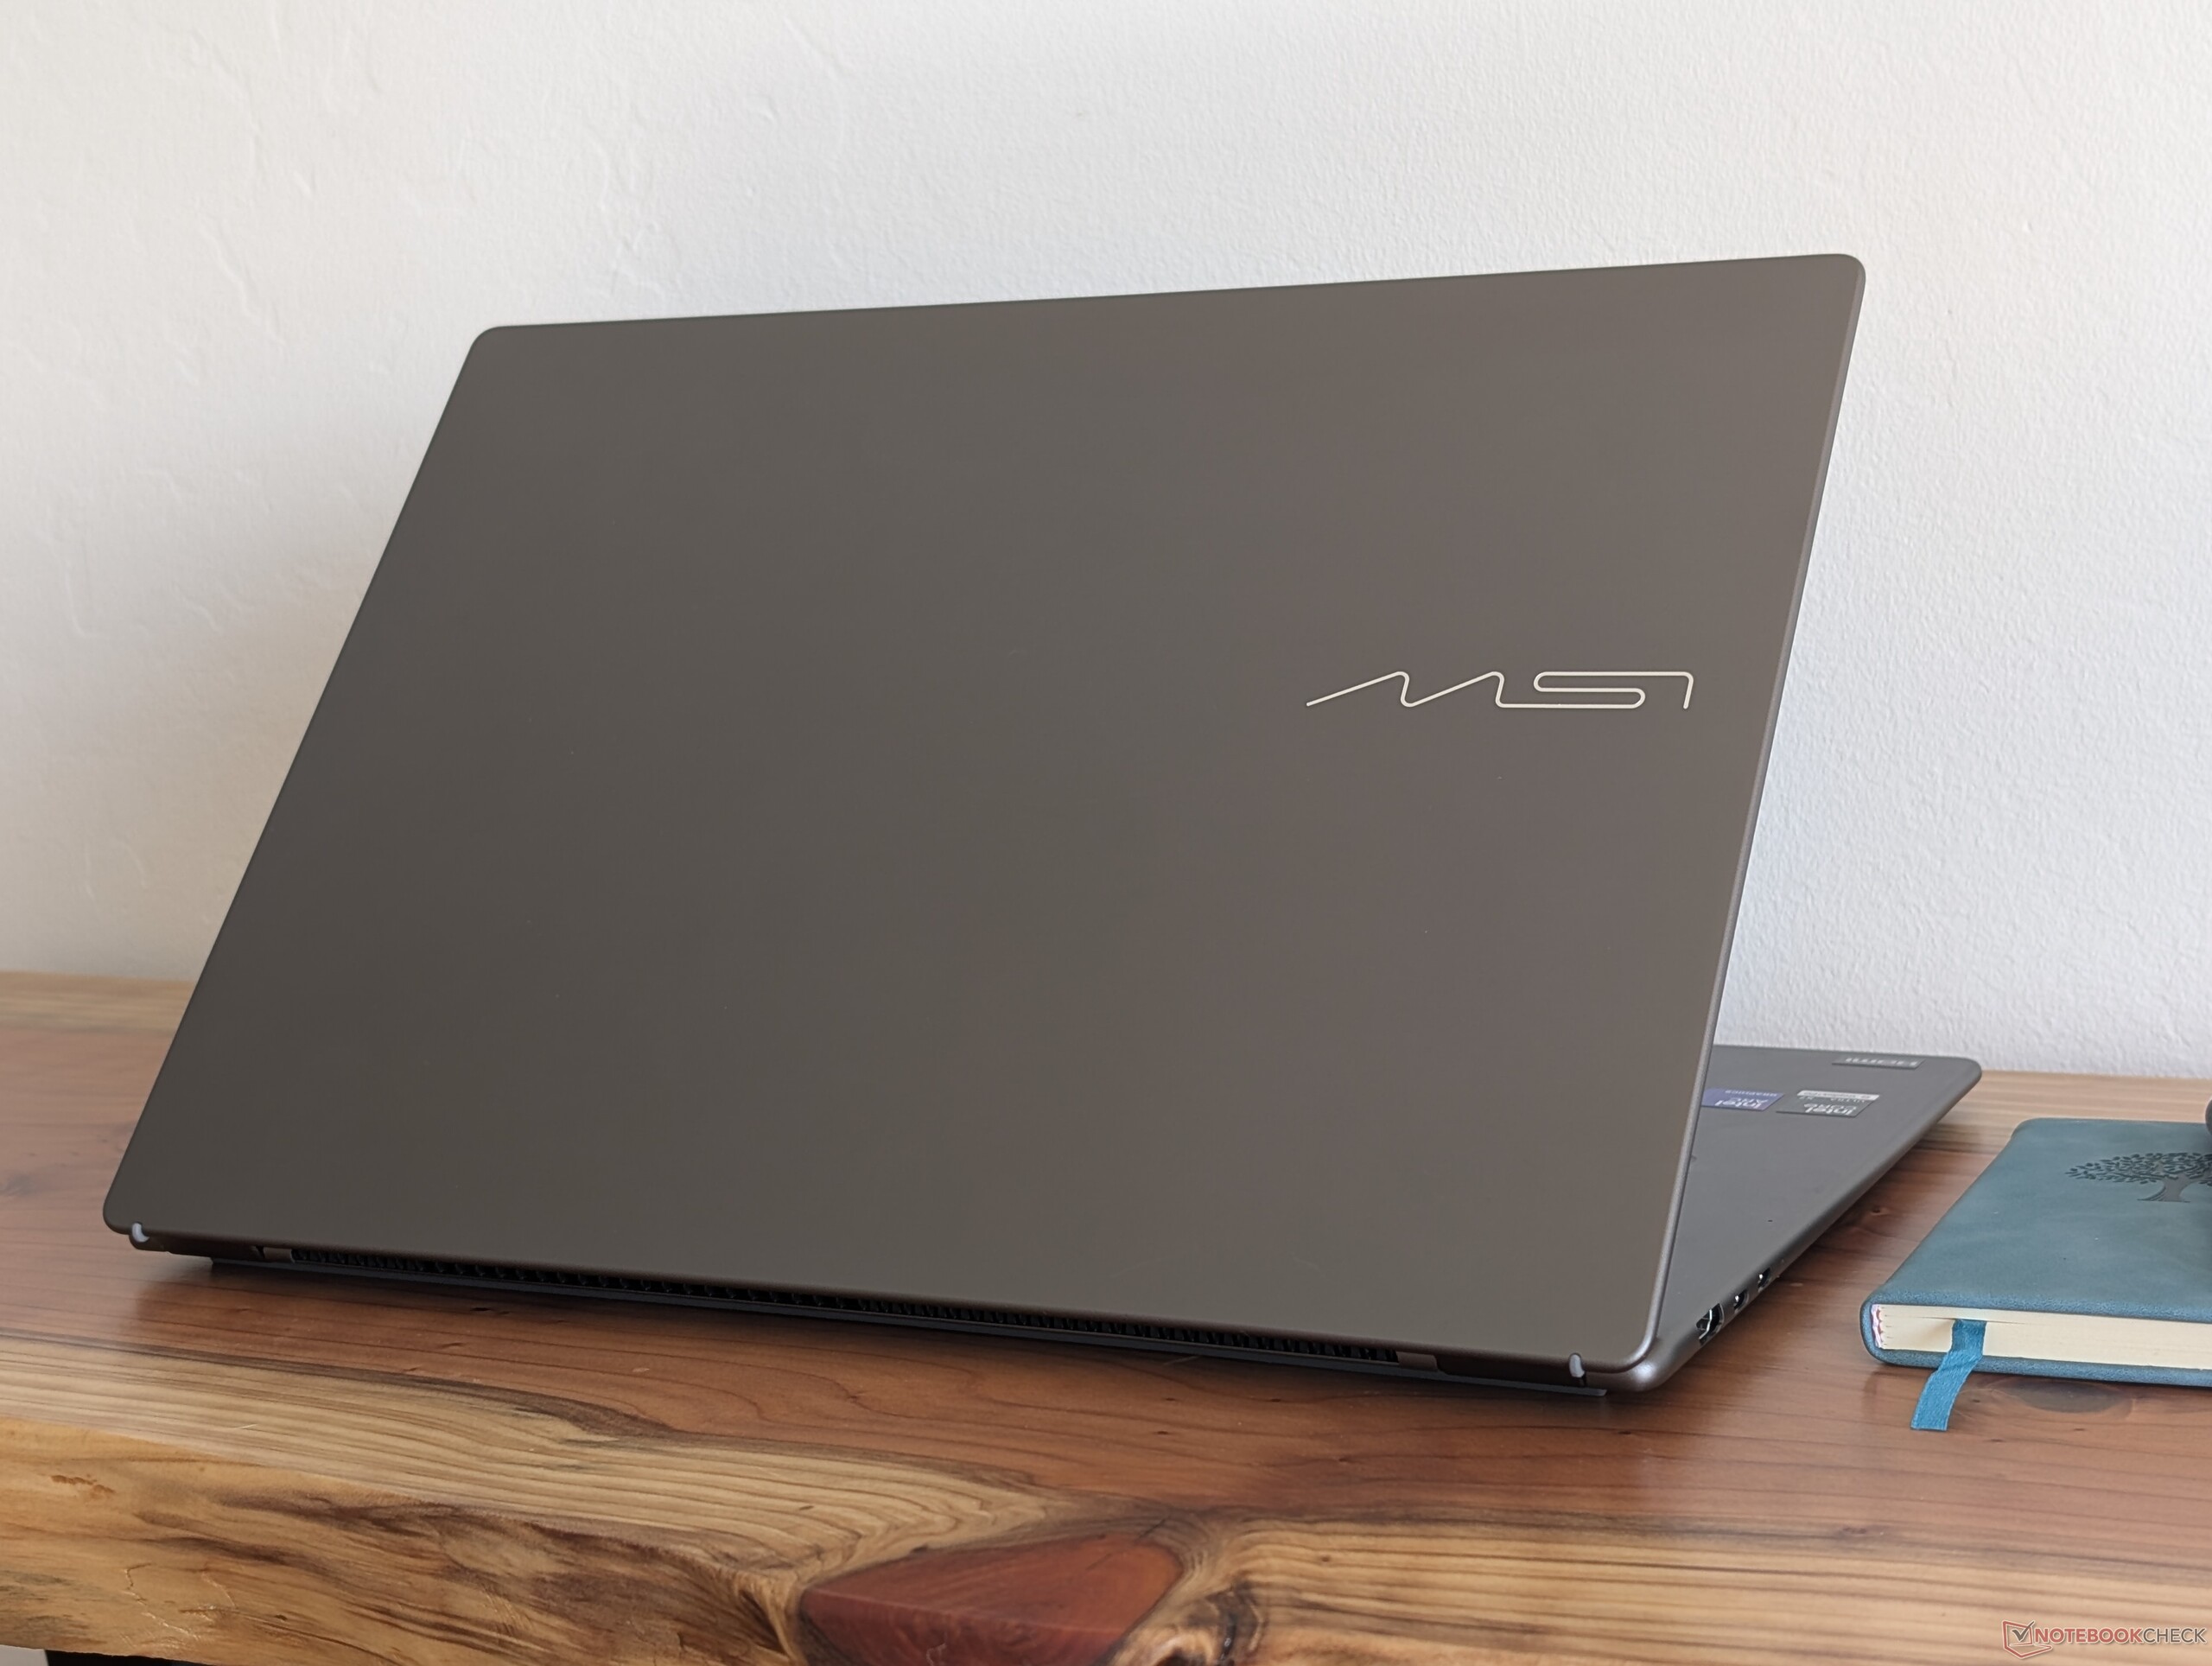
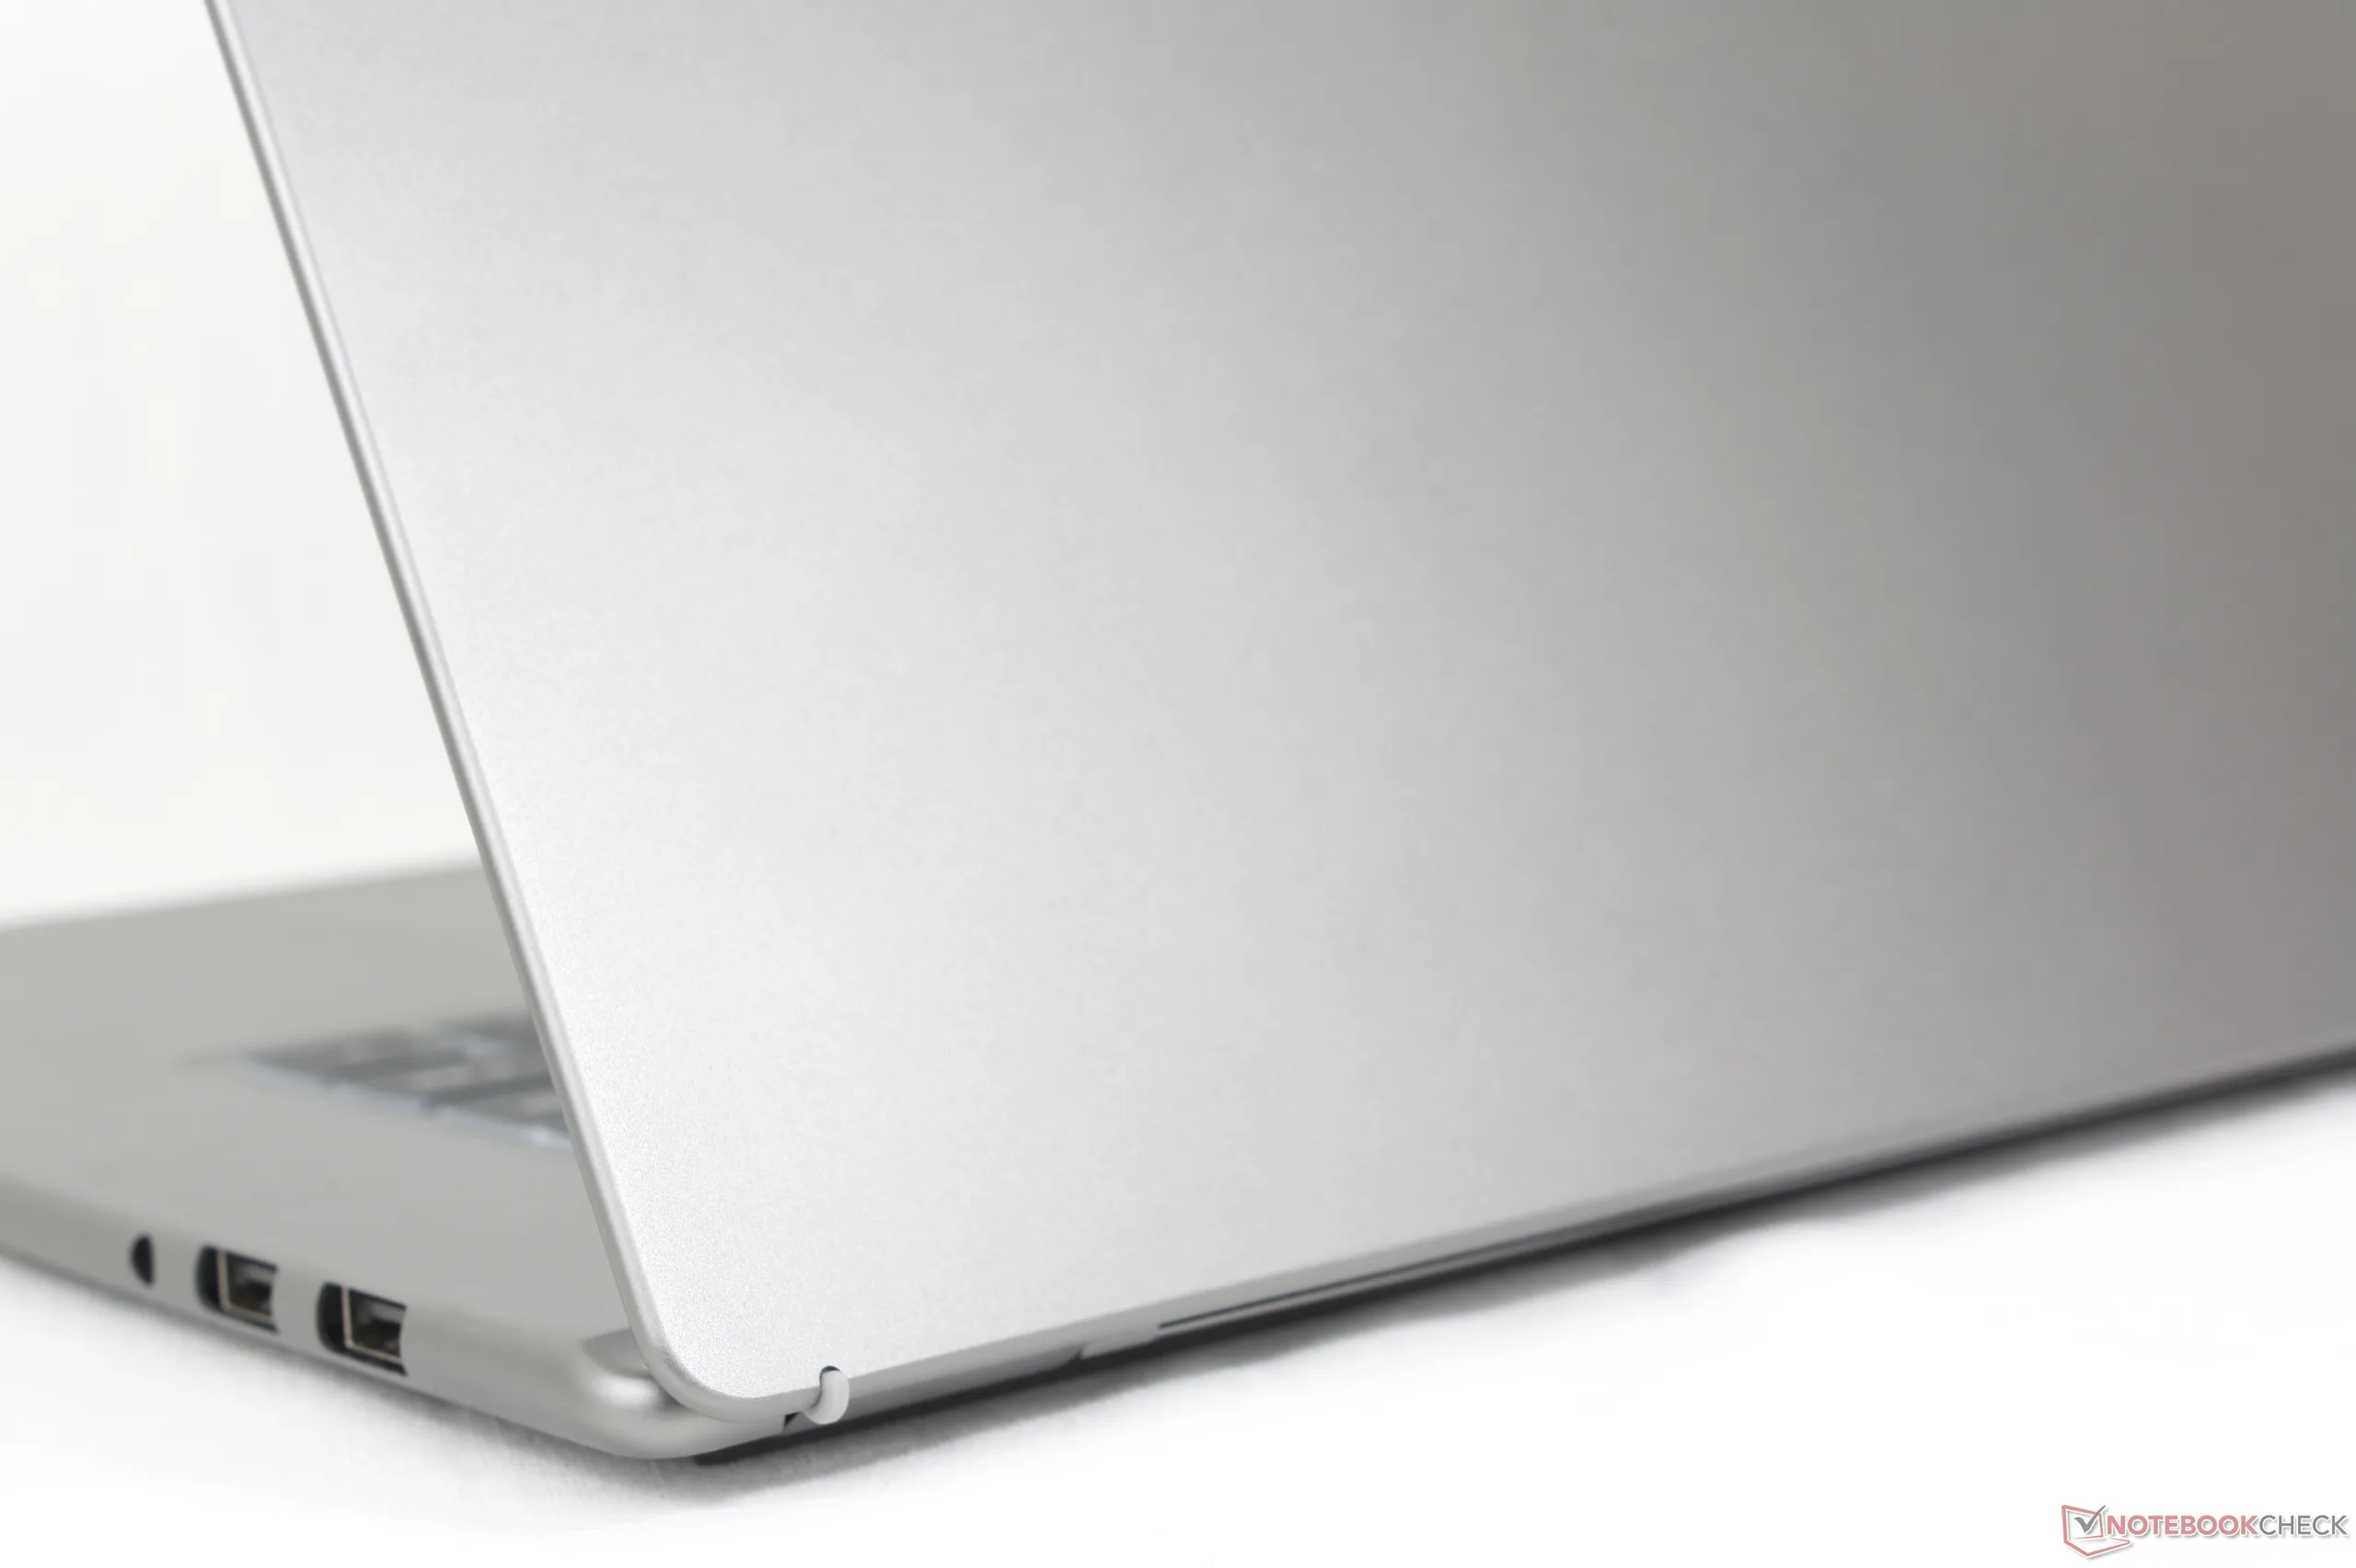
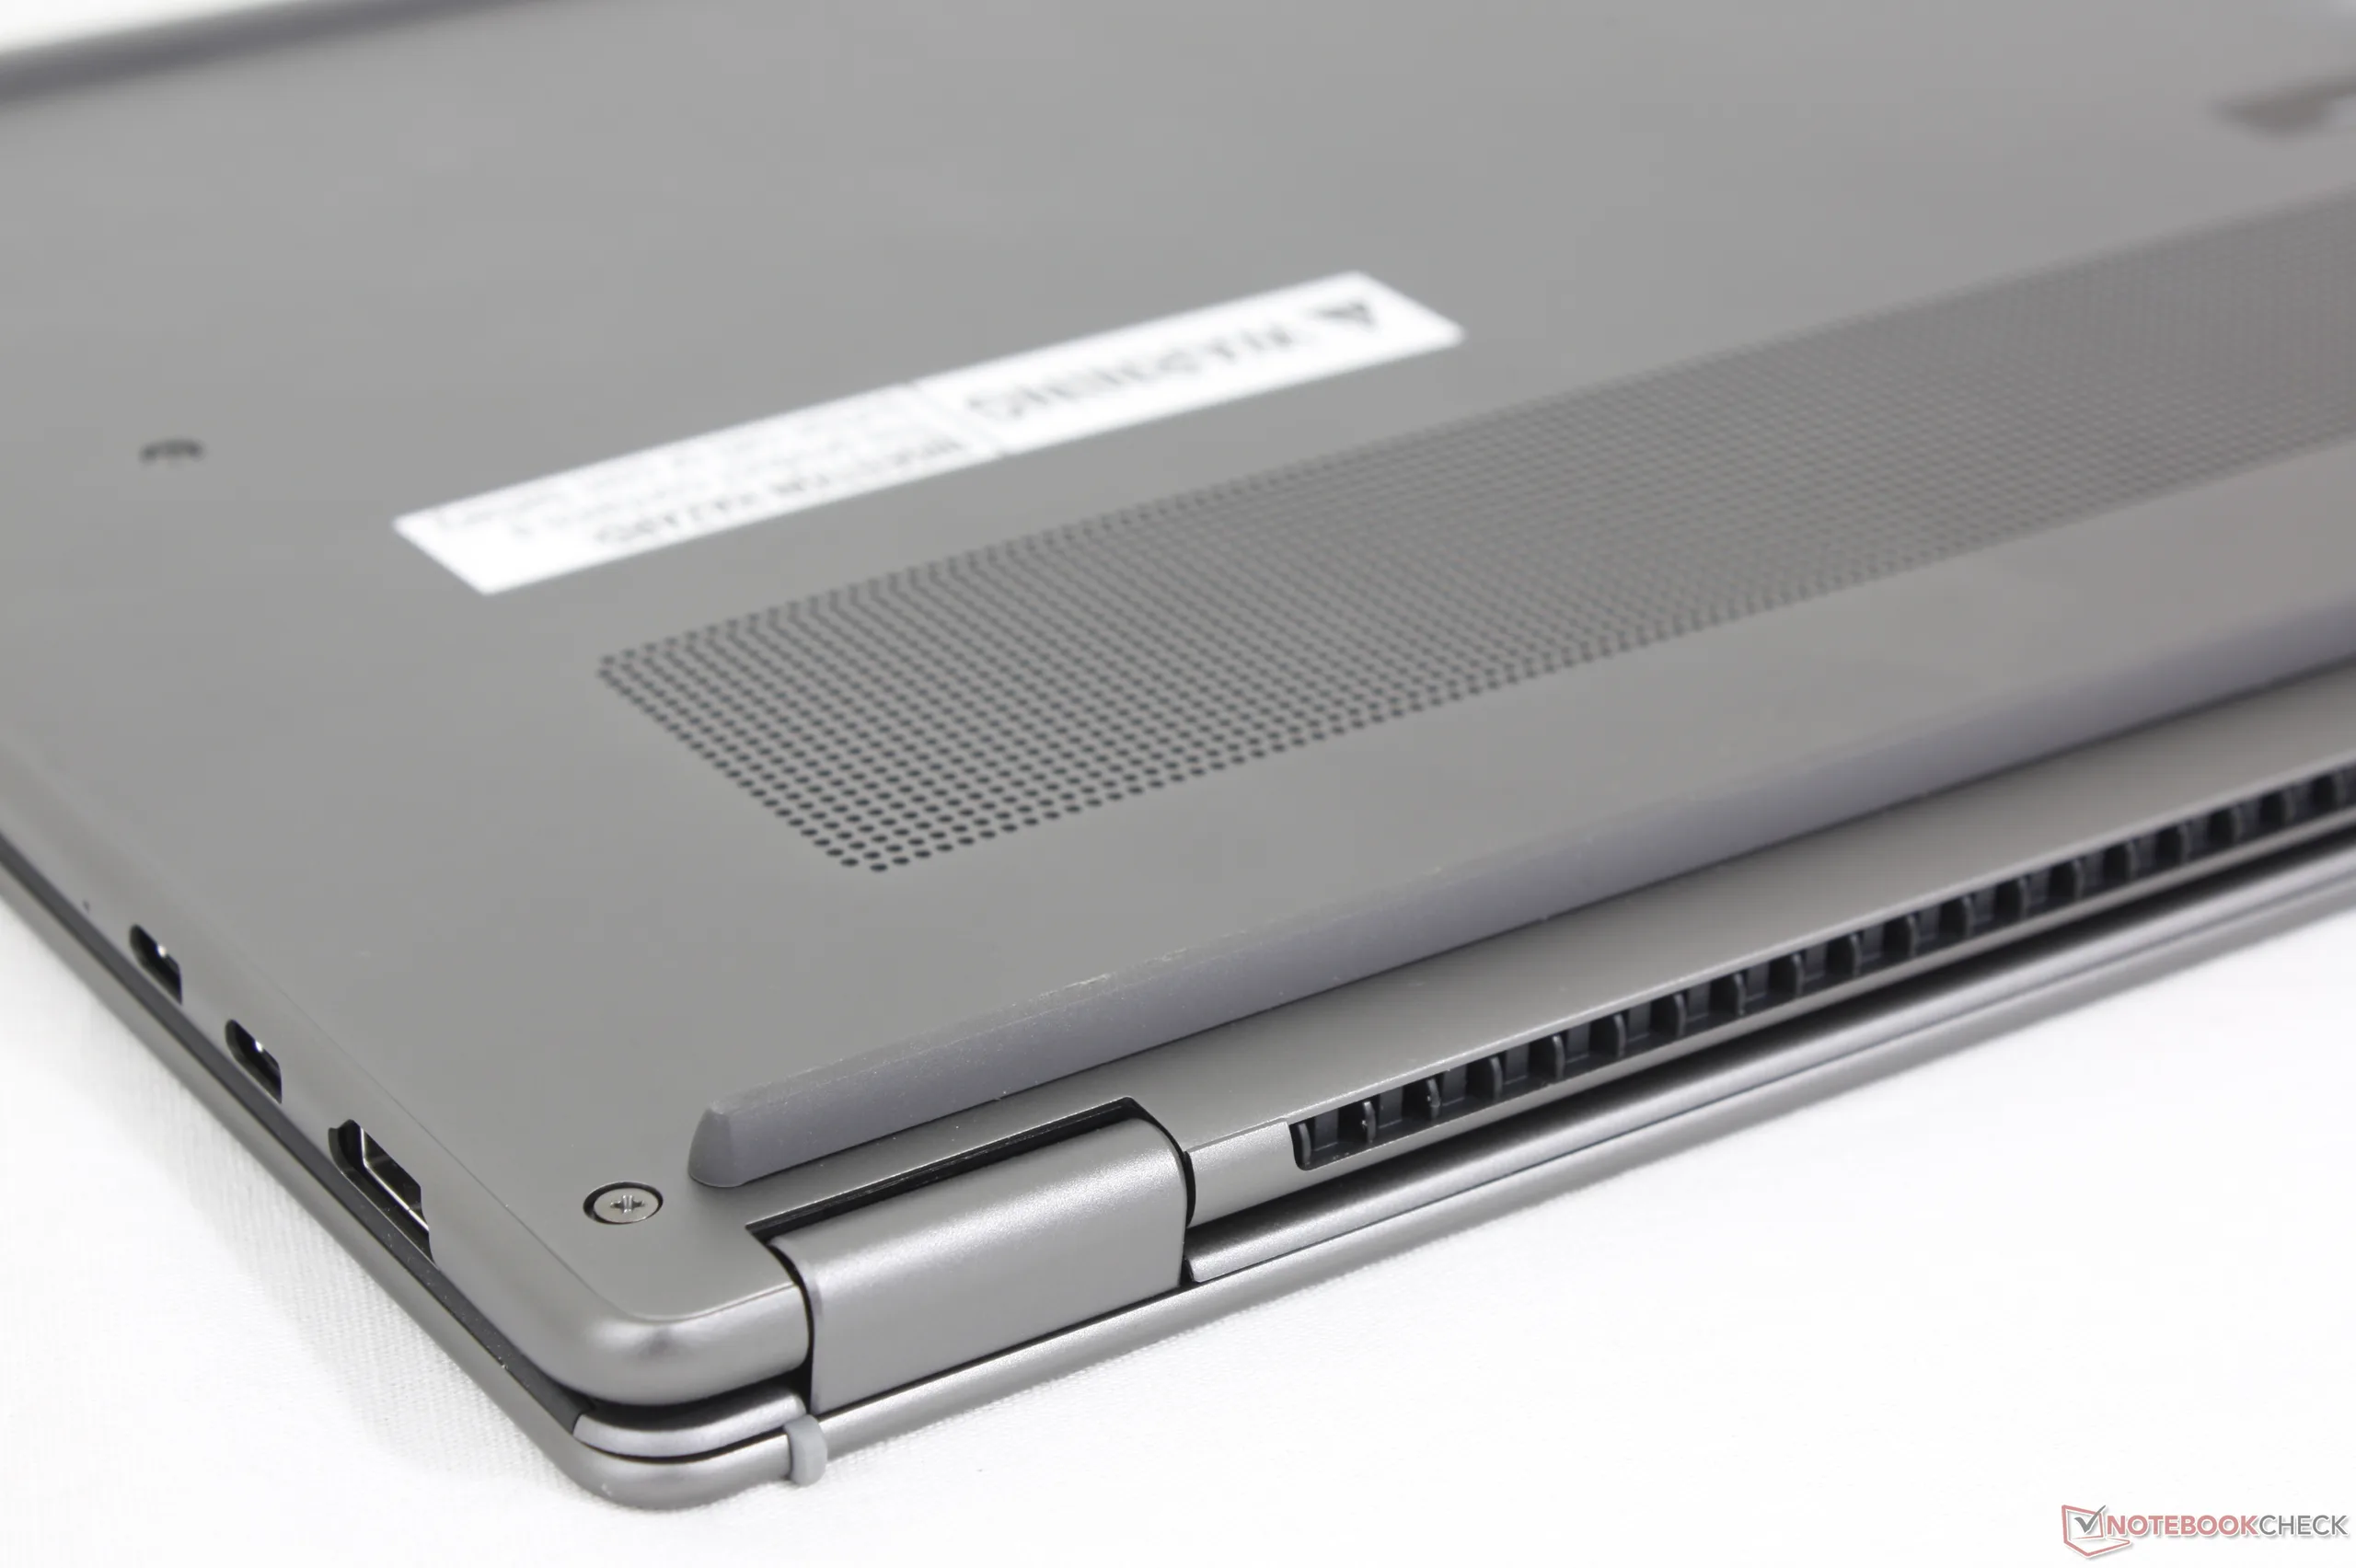
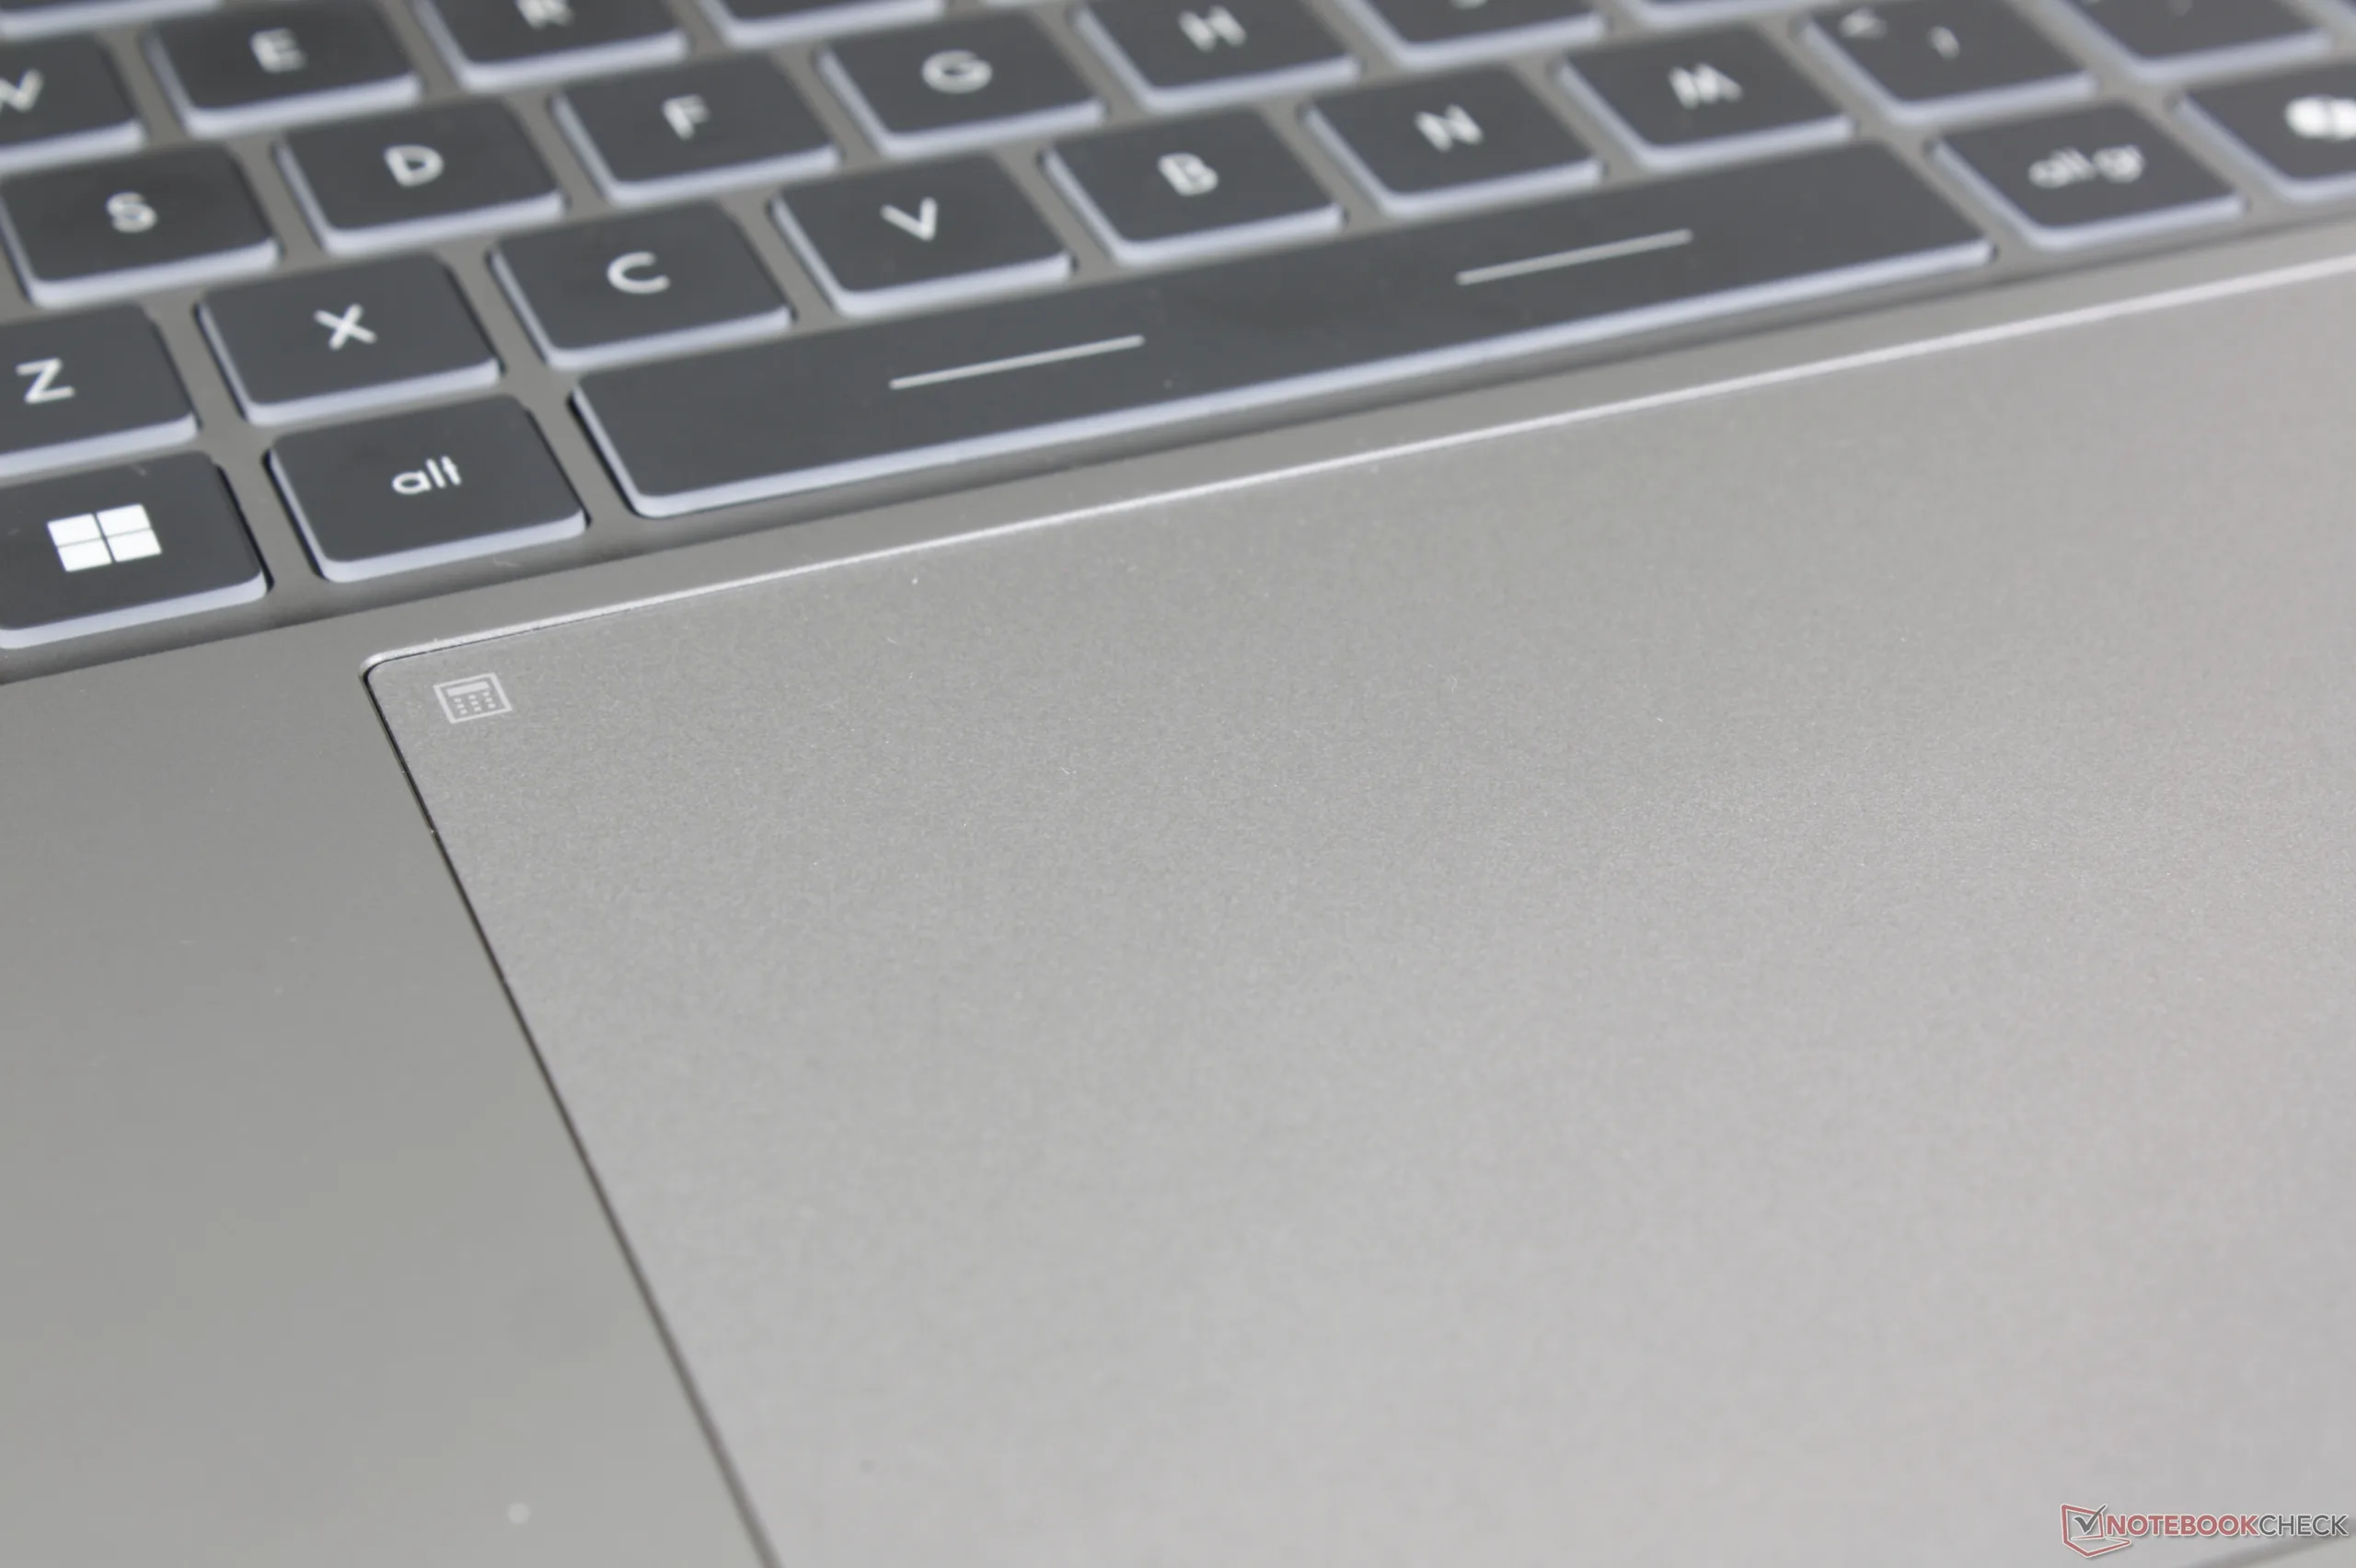
Das Gehäuse aus Aluminiumlegierung ist nun dünner und kommt mit weniger Kanten und Zierlinien aus, was professioneller wirkt. Im Vergleich zum Vorgängermodell ist das 2026 Prestige 16 in der Tat eleganter, ohne zu langweilig oder zu minimalistisch zu wirken.
Die Gehäusesteifigkeit ist hoch, auch wenn es sich etwas mehr biegt als das dickere XPS 16 oder das Lenovo Pro 9i 16 Aura.
MSI führt in diesem Jahr auch ein aktualisiertes Logo auf der Außenseite des Displaydeckels, beginnend mit dem 2026 Prestige Lineup. Nach Angaben des Herstellers könnte die schicke Lasergravur in naher Zukunft auf weiteren Premium-Business-Modellen erscheinen, um sie besser von MSIs Gaming-zentrierten Lösungen zu unterscheiden.
Das System ist spürbar dünner als das letztjährige Design, aber bei fast unverändertem Gewicht fühlt es sich dichter an. In Bezug auf das Gewicht liegt es bequem zwischen dem XPS 16 und dem ZenBook S16, während es in Bezug auf die Stellfläche etwas größer ist als beide.

Anschlussausstattung
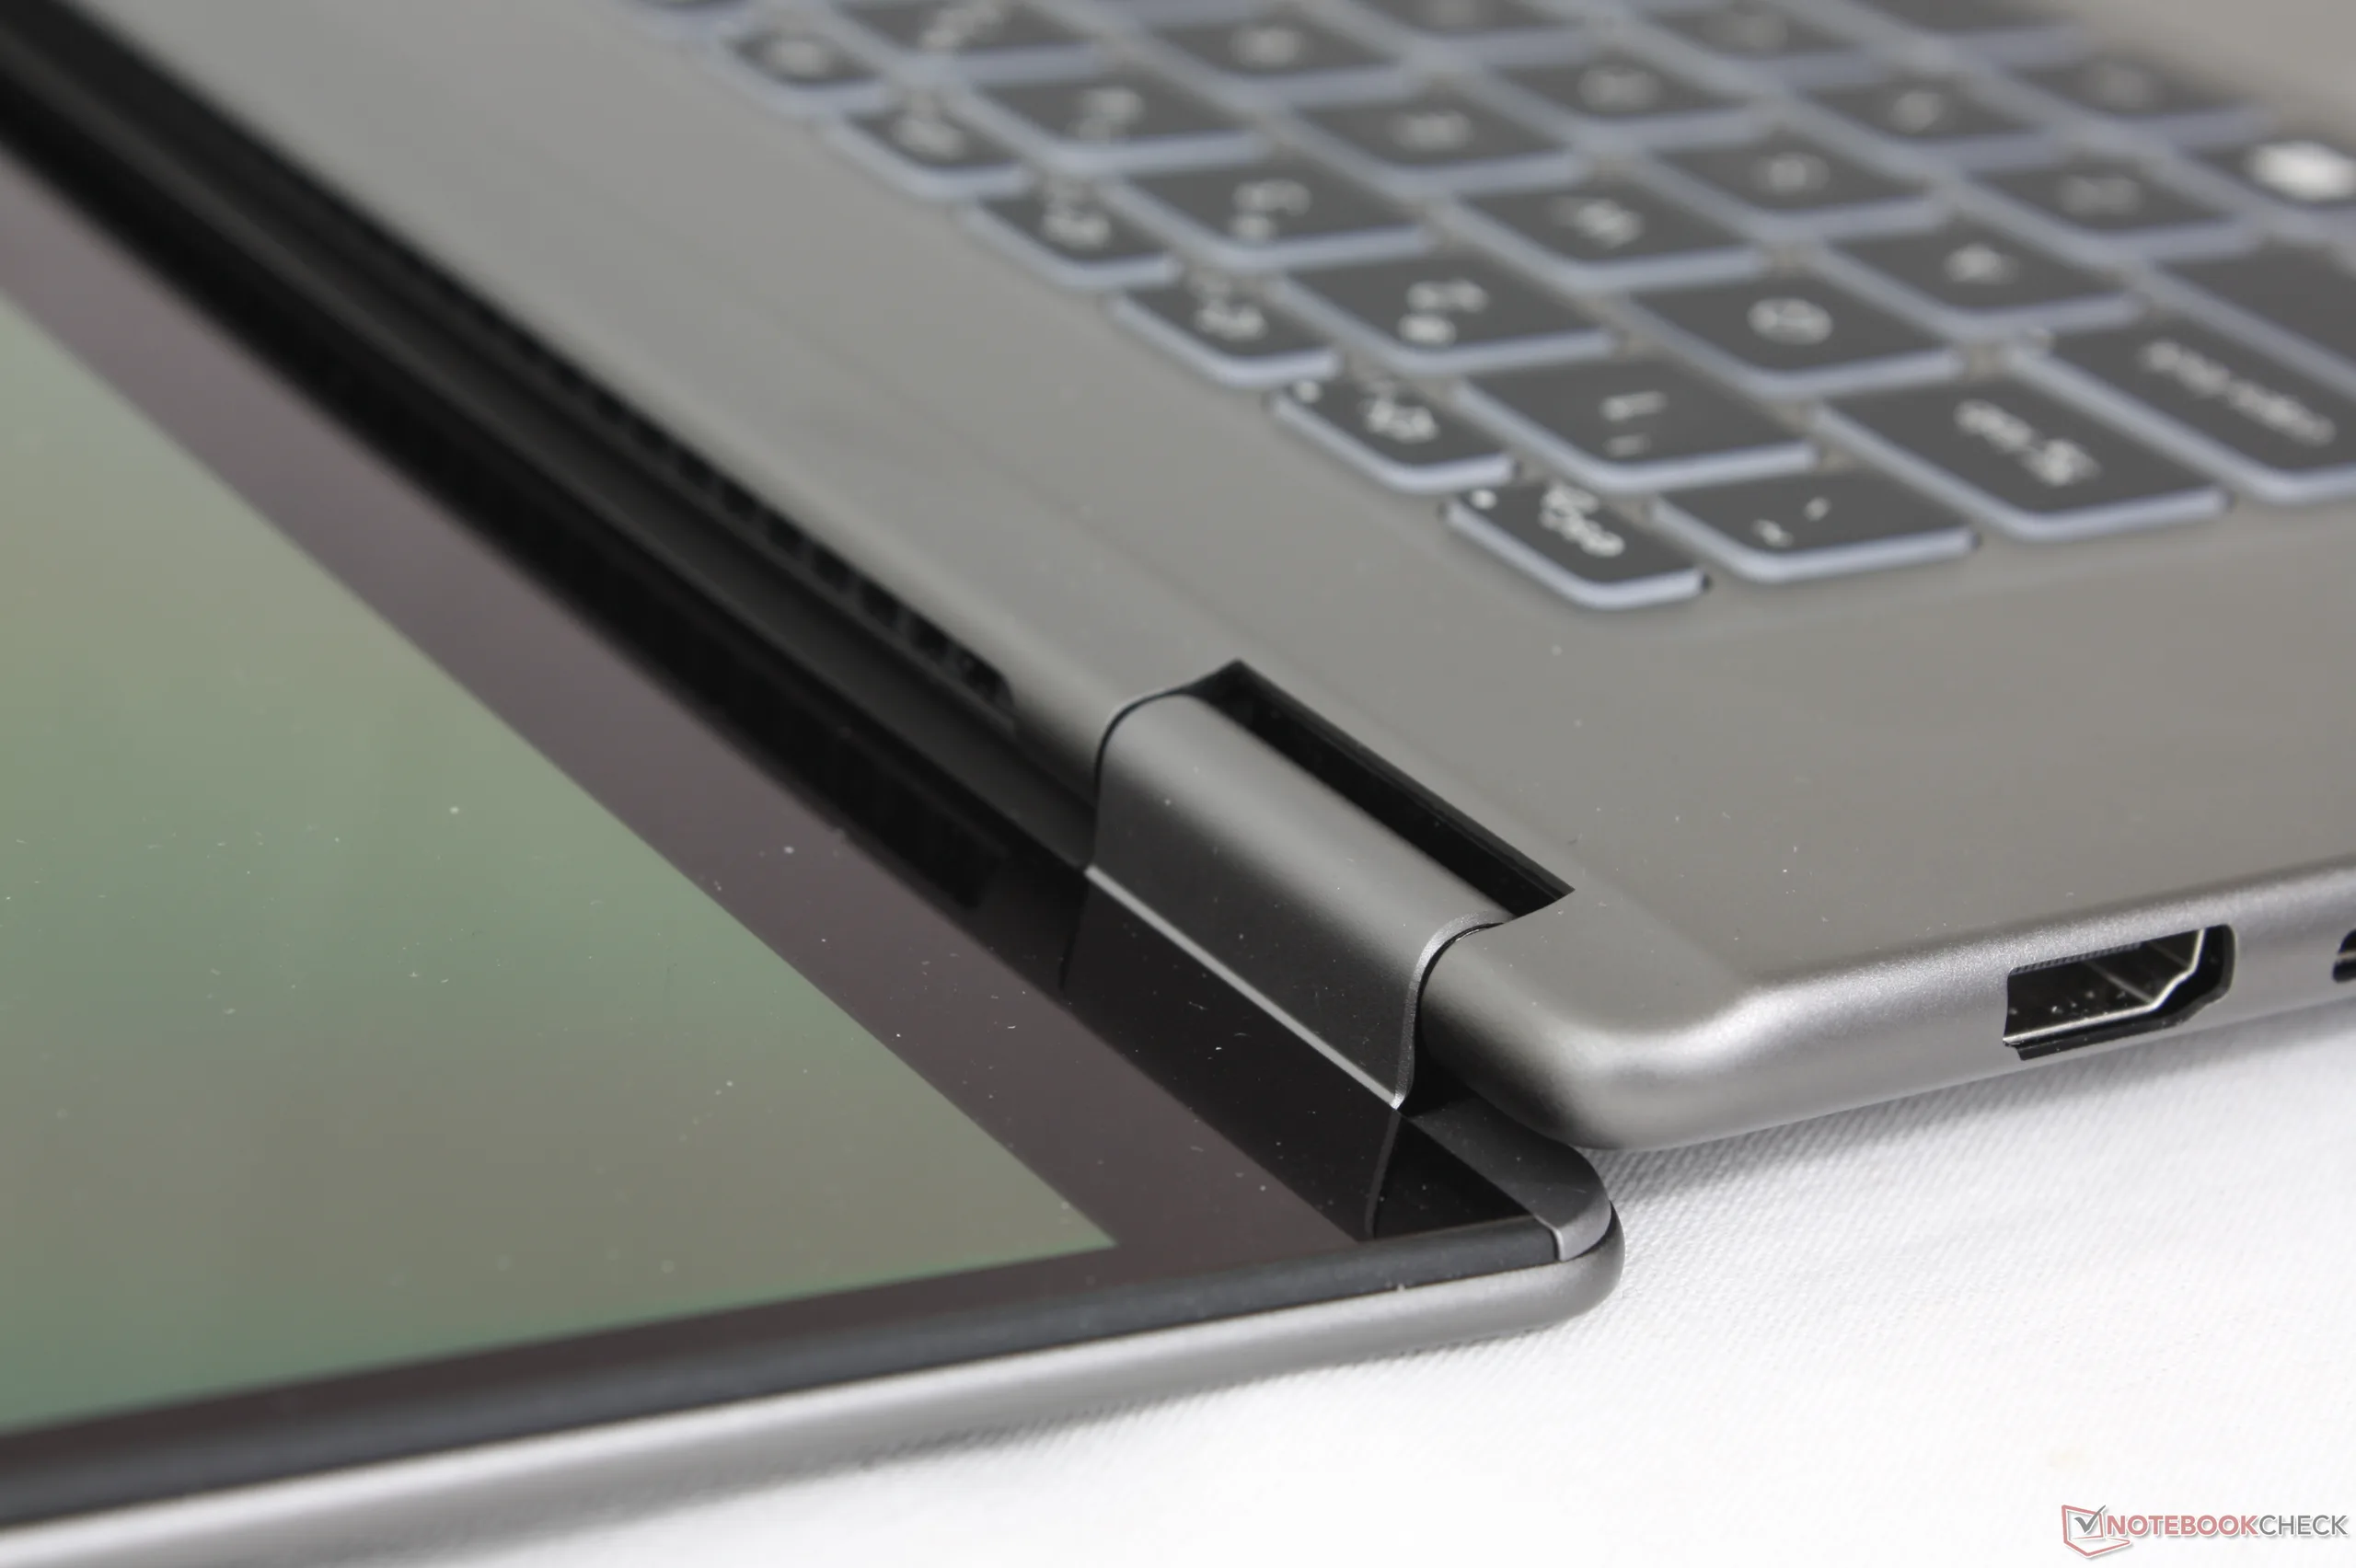
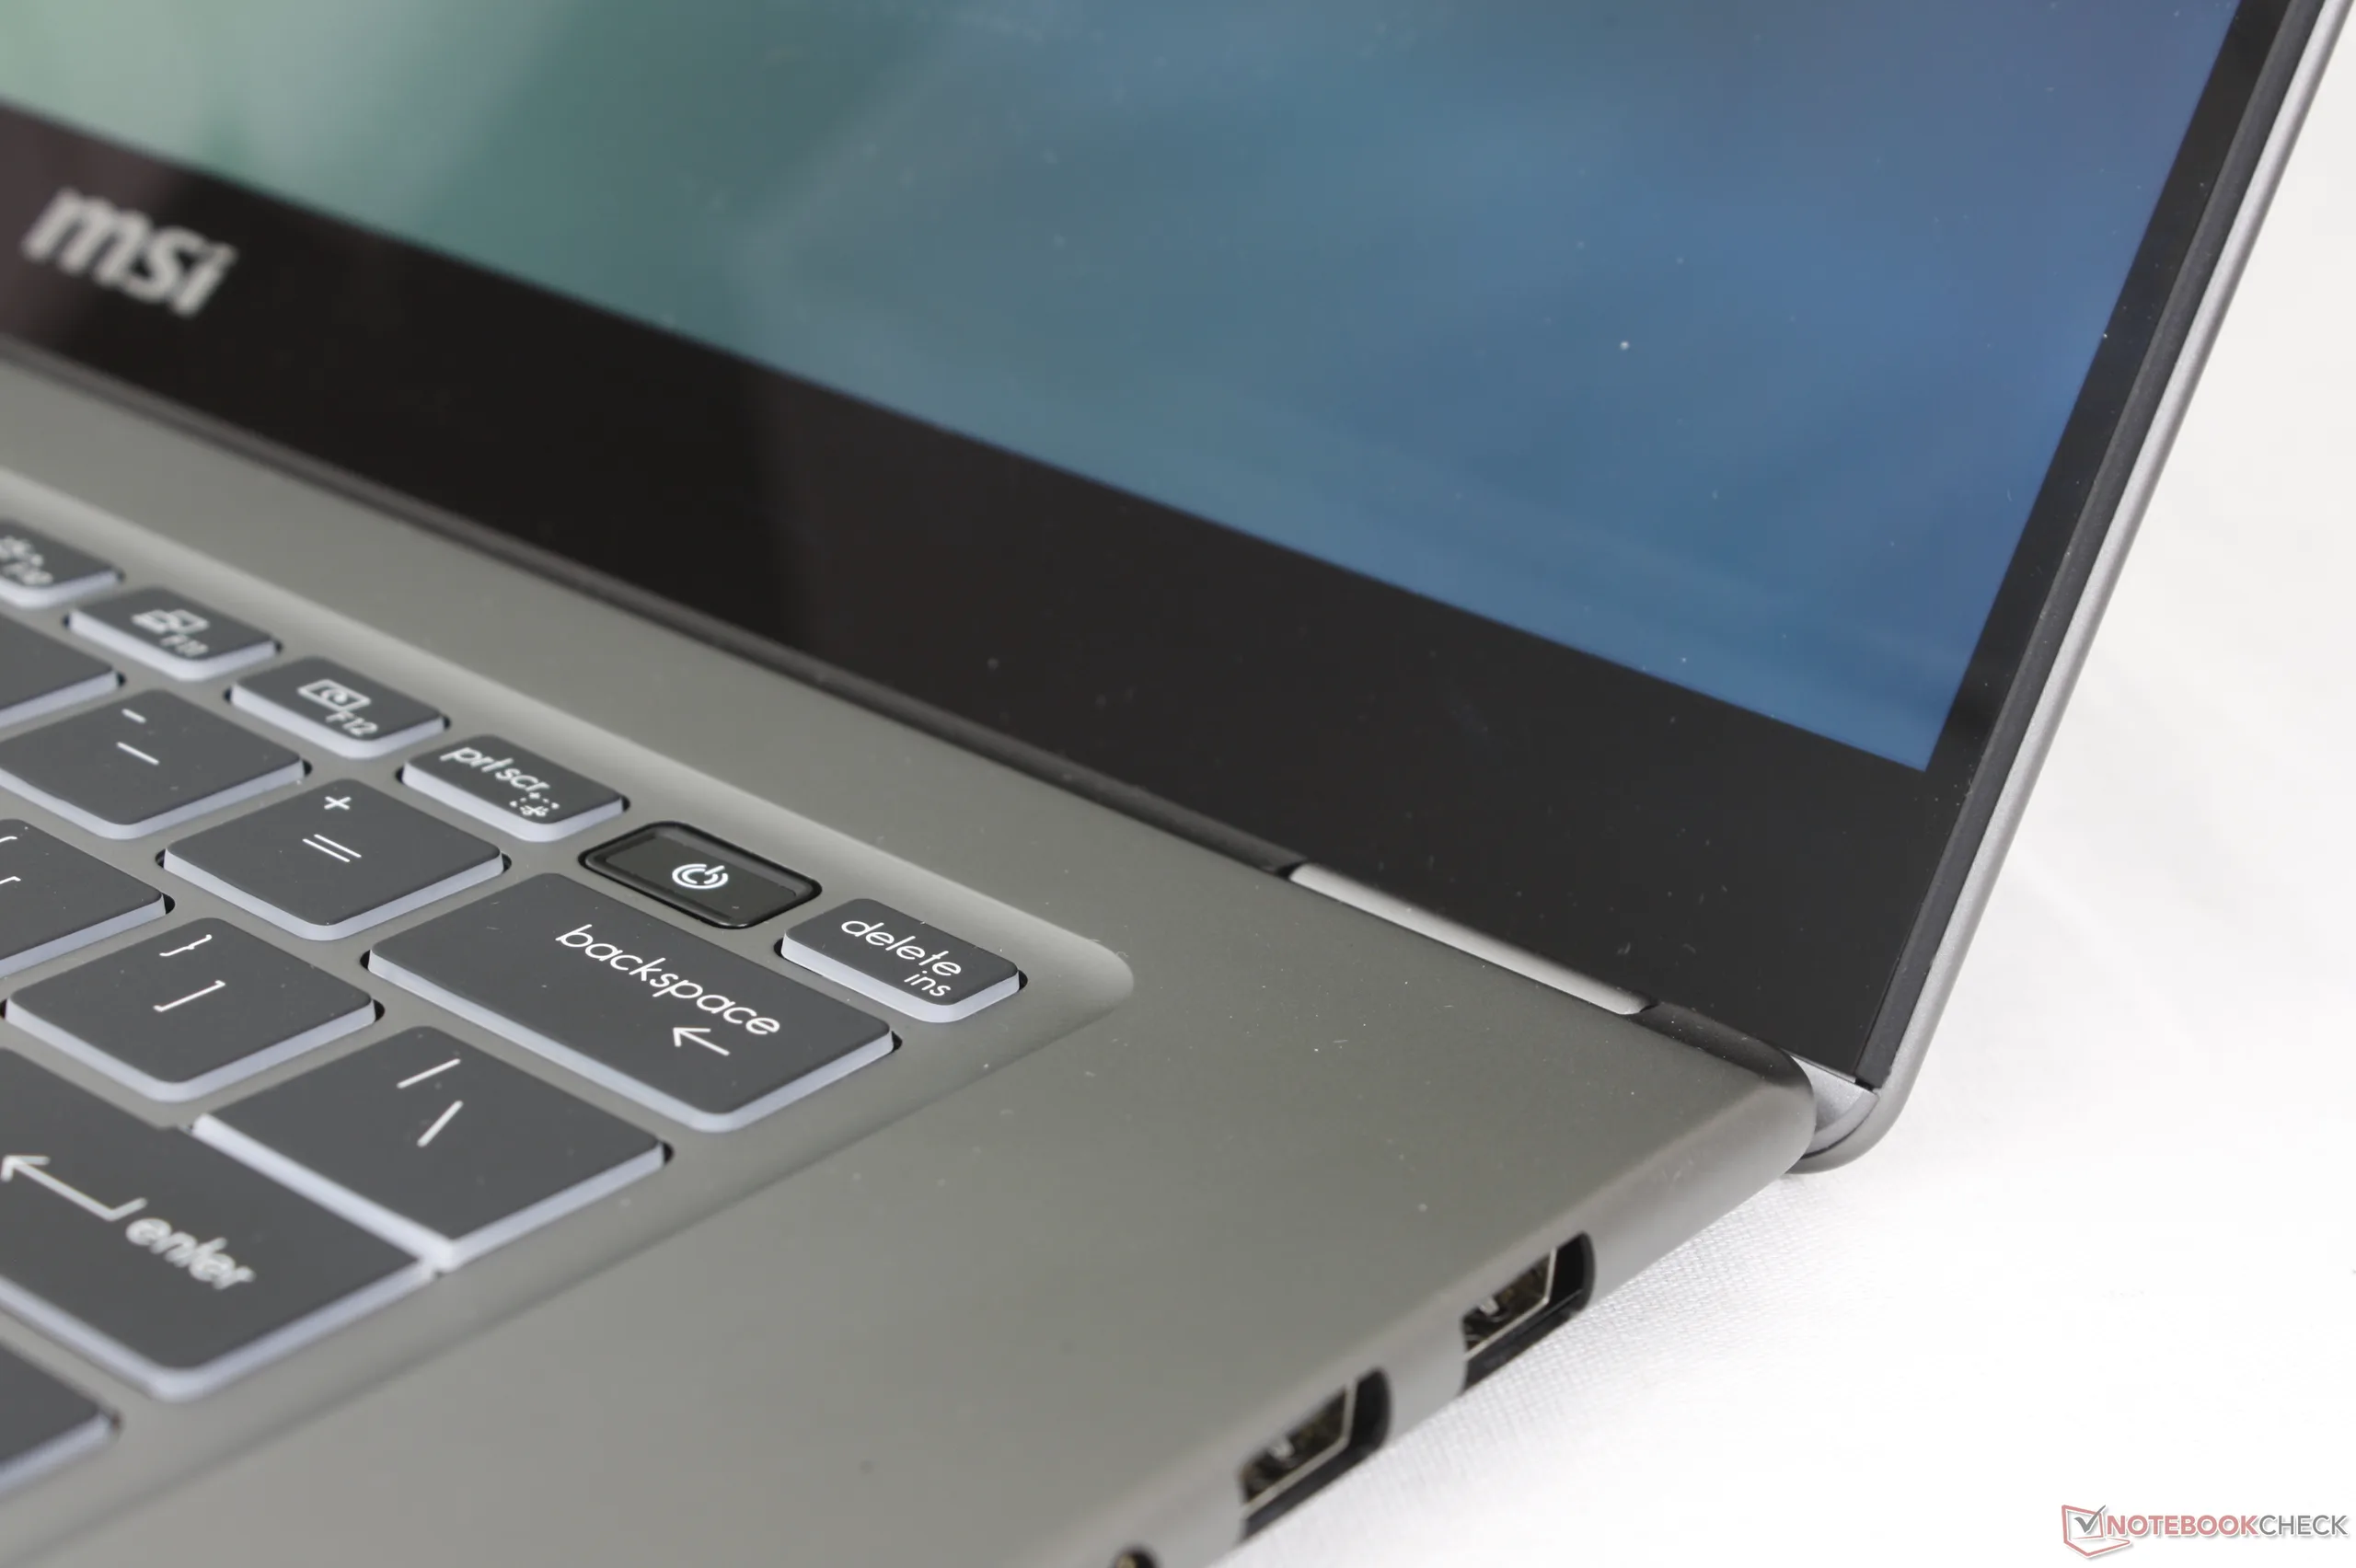
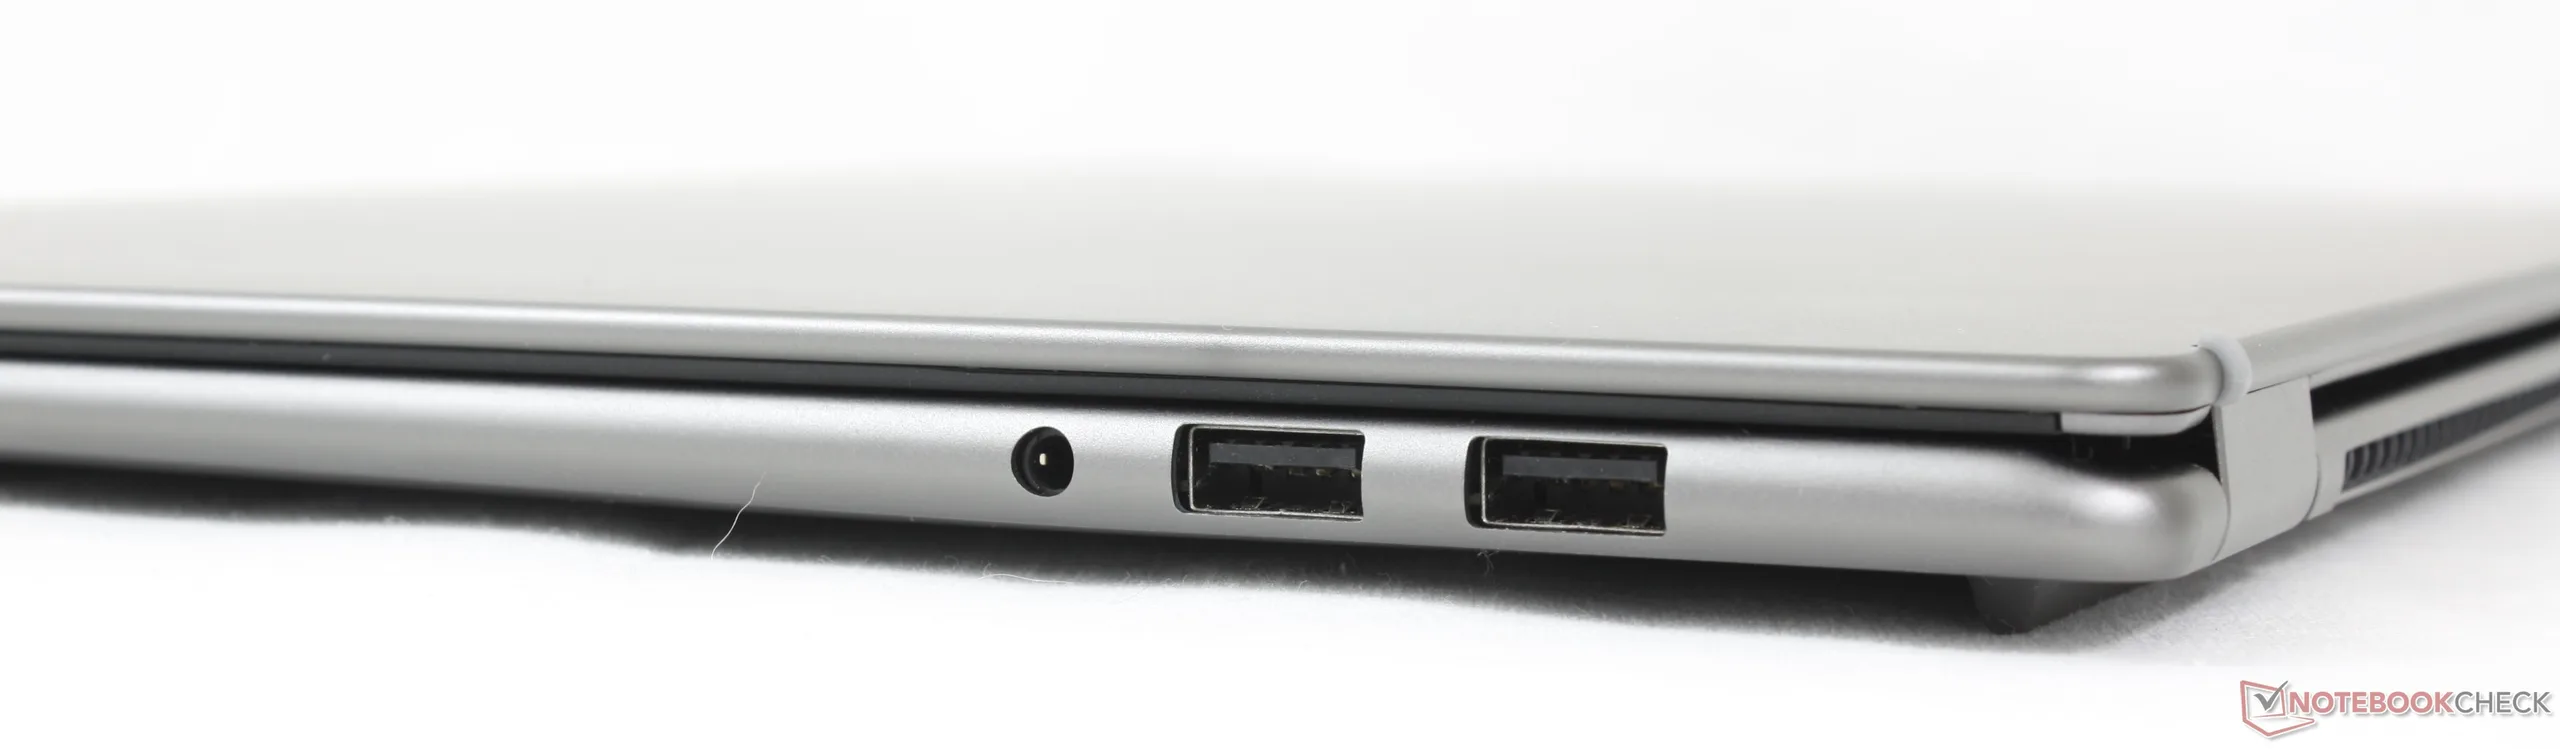
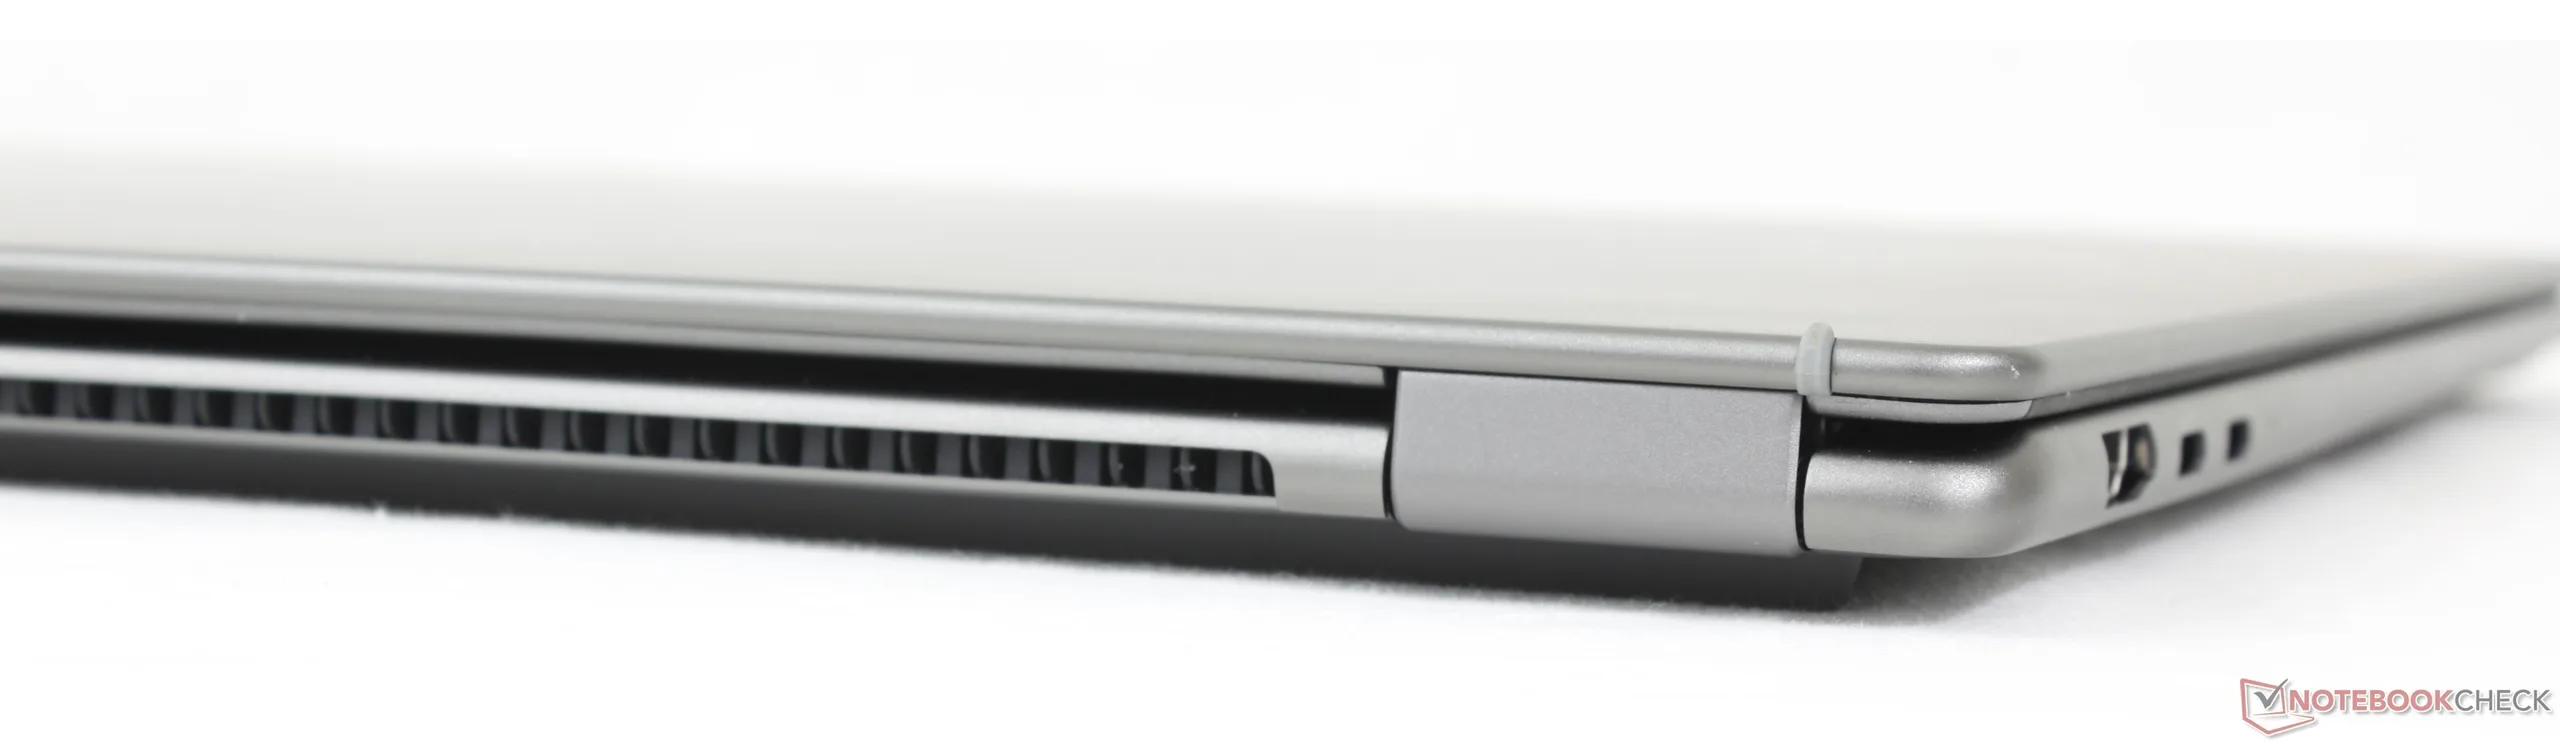
Die Anschlussoptionen haben sich gegenüber dem 2025er Modell geändert: MSI hat den RJ-45-Anschluss, den SD-Kartenleser und das Kensington Schloss weggelassen und dafür einen zweiten USB-A-Anschluss hinzugefügt. Die Änderungen sind je nach persönlichen Vorlieben unterschiedlich zu bewerten.
Auch die Positionierung der Anschlüsse hätte besser sein können; das Laden per USB-C ist nur links möglich.


Kommunikation
Webcam
Die standardmäßige 2-Megapixel-Webcam verfügt sowohl über IR-Unterstützung als auch eine physische Webcam-Abdeckung.


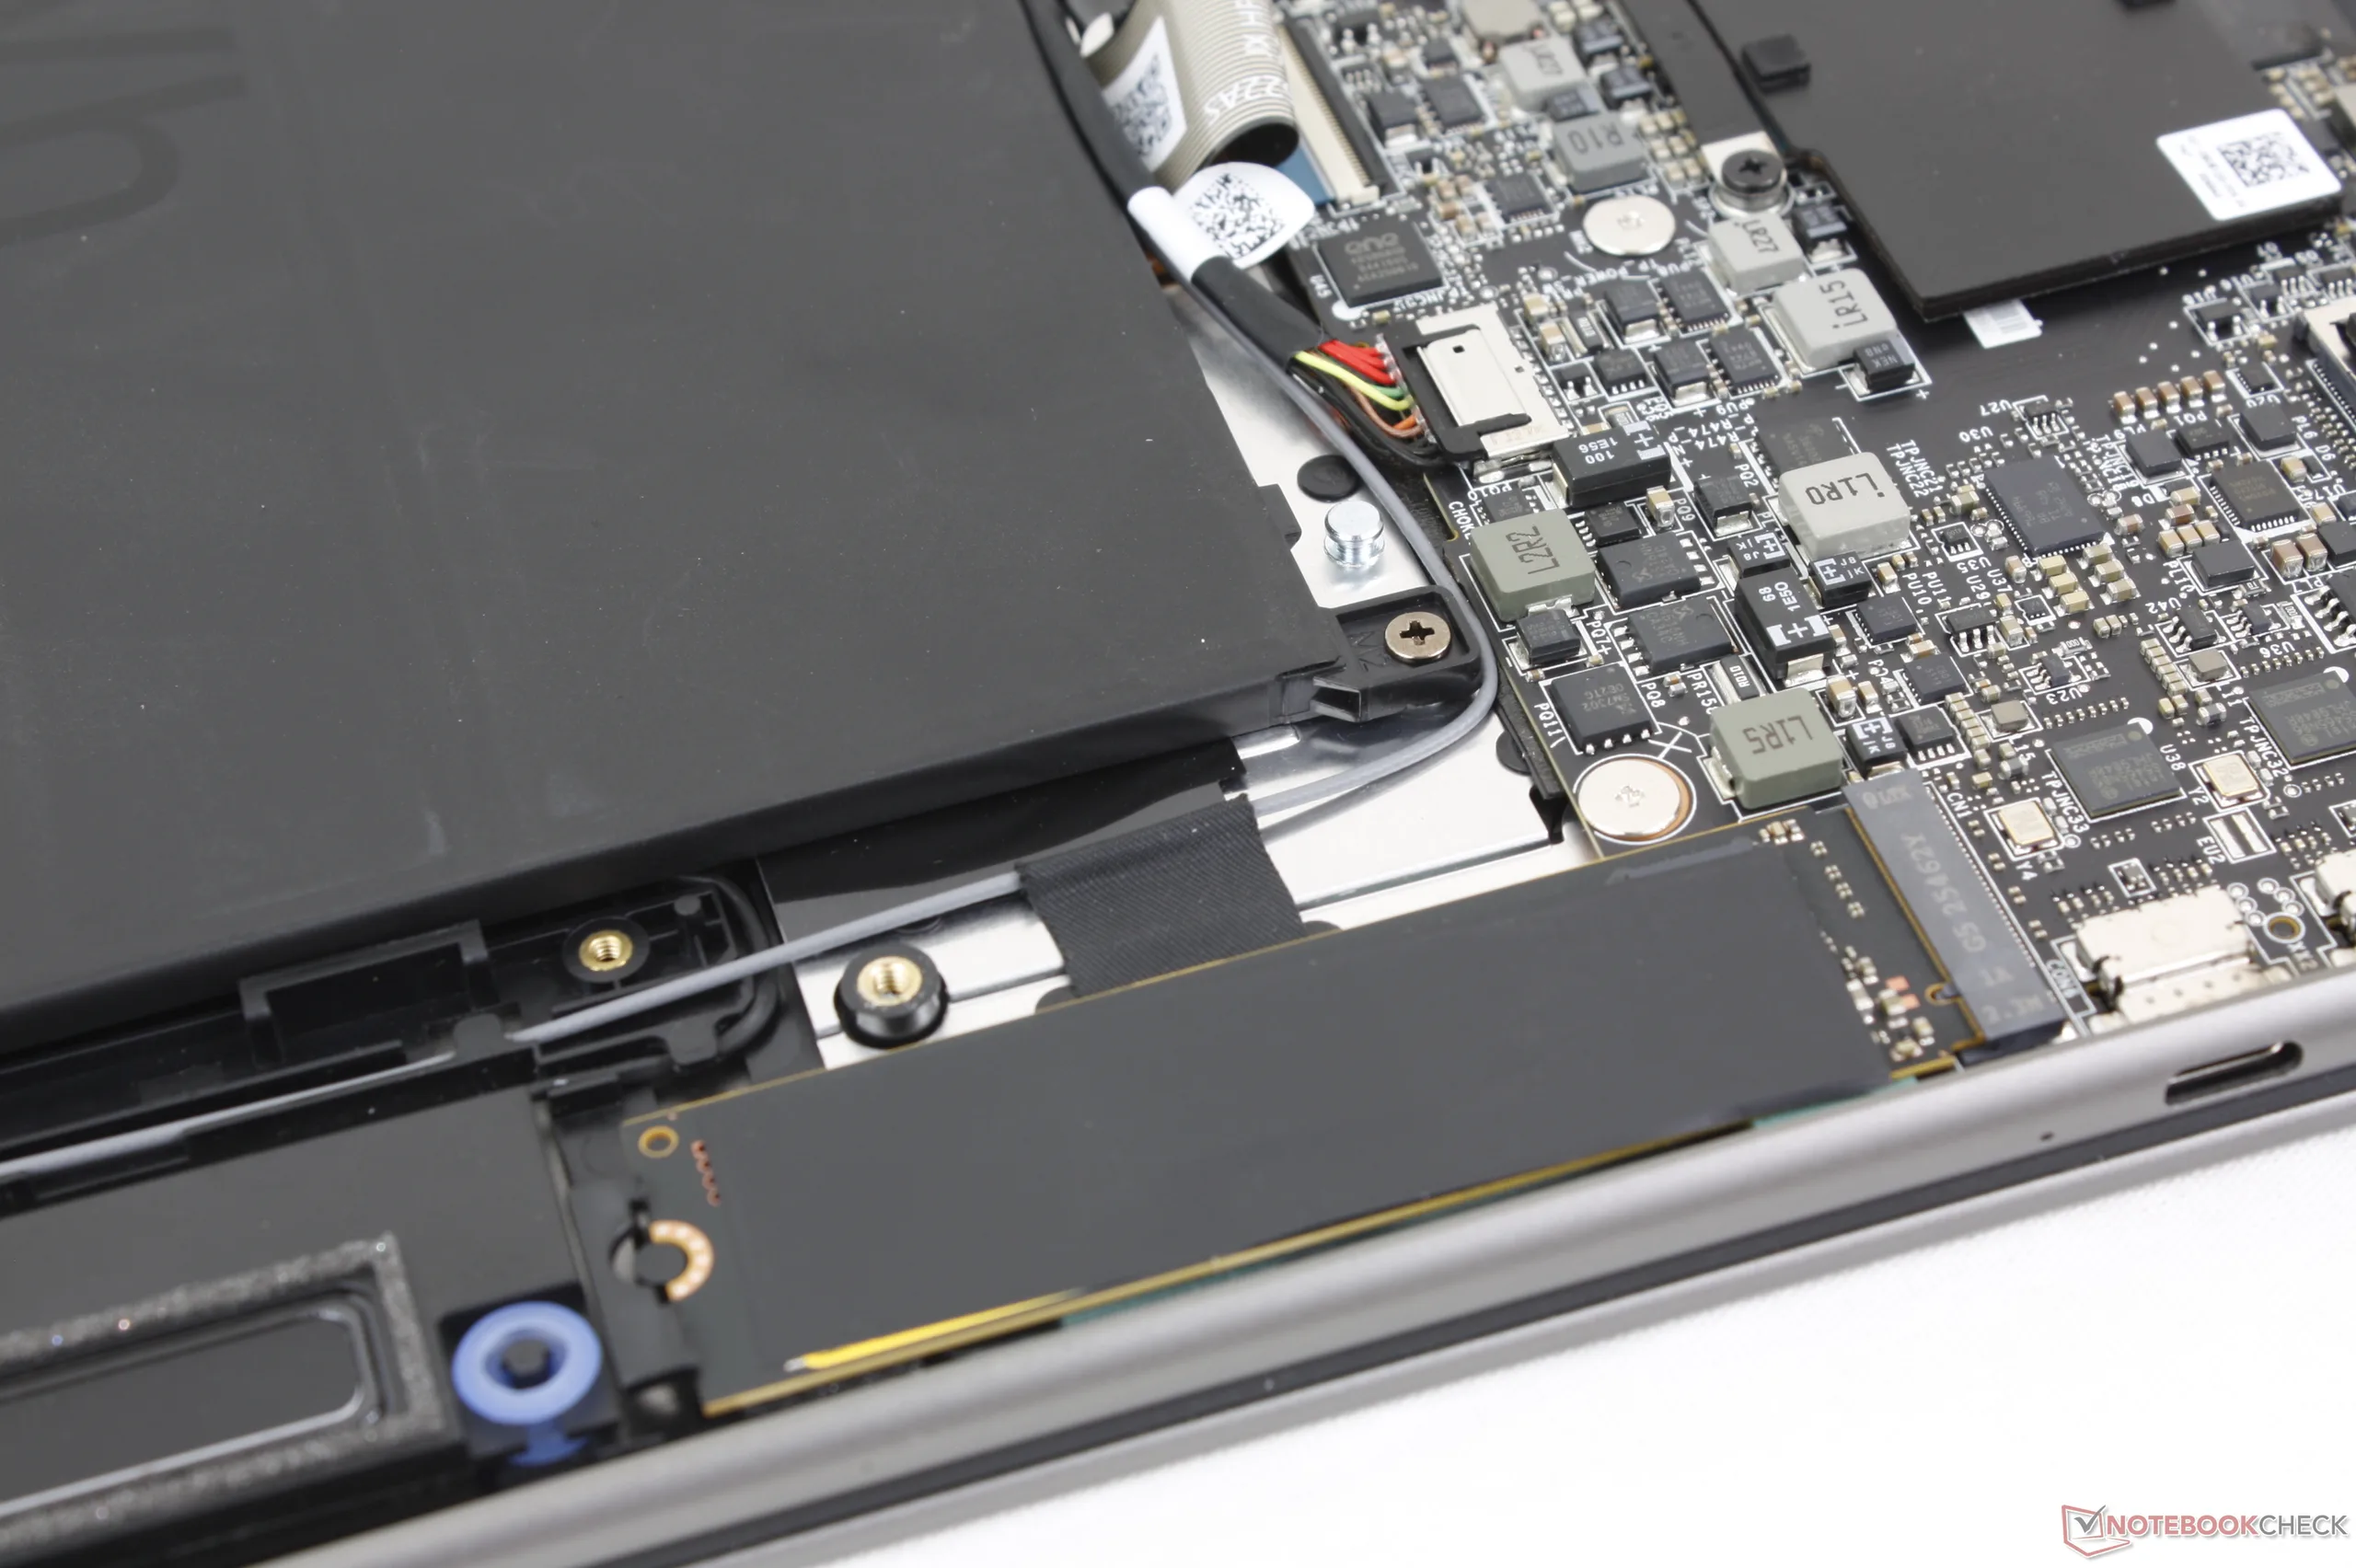
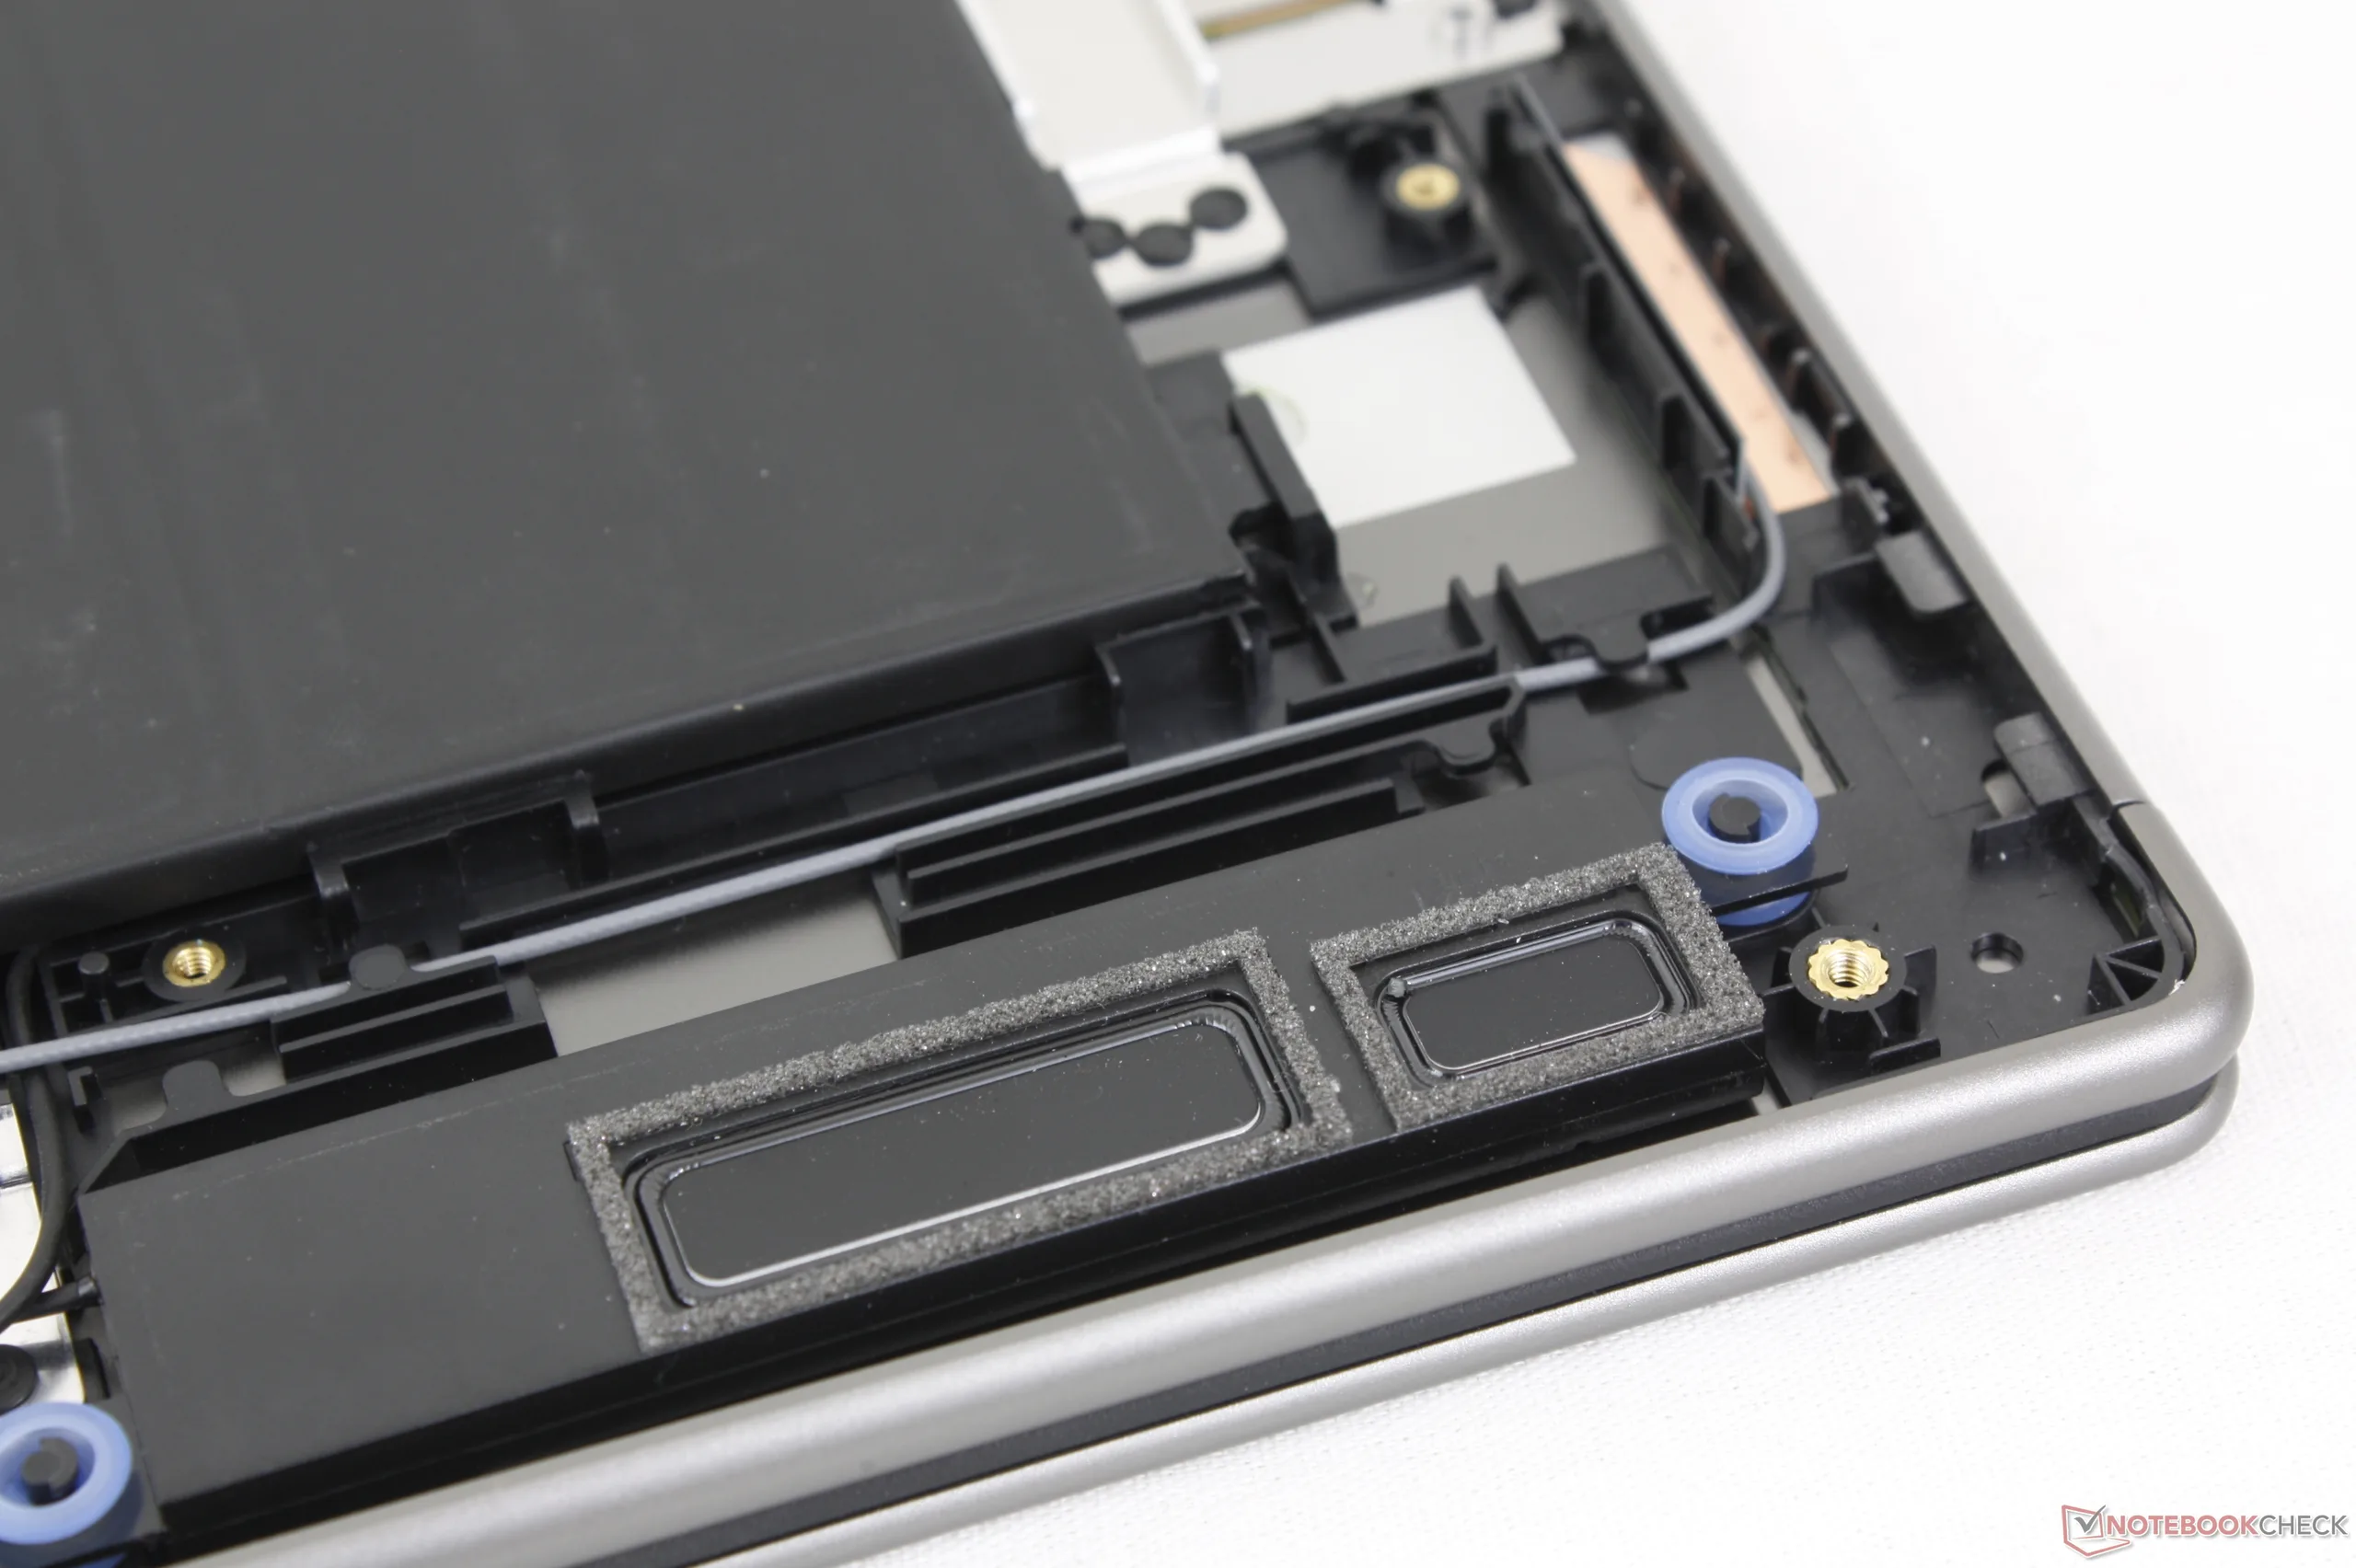
Wartung
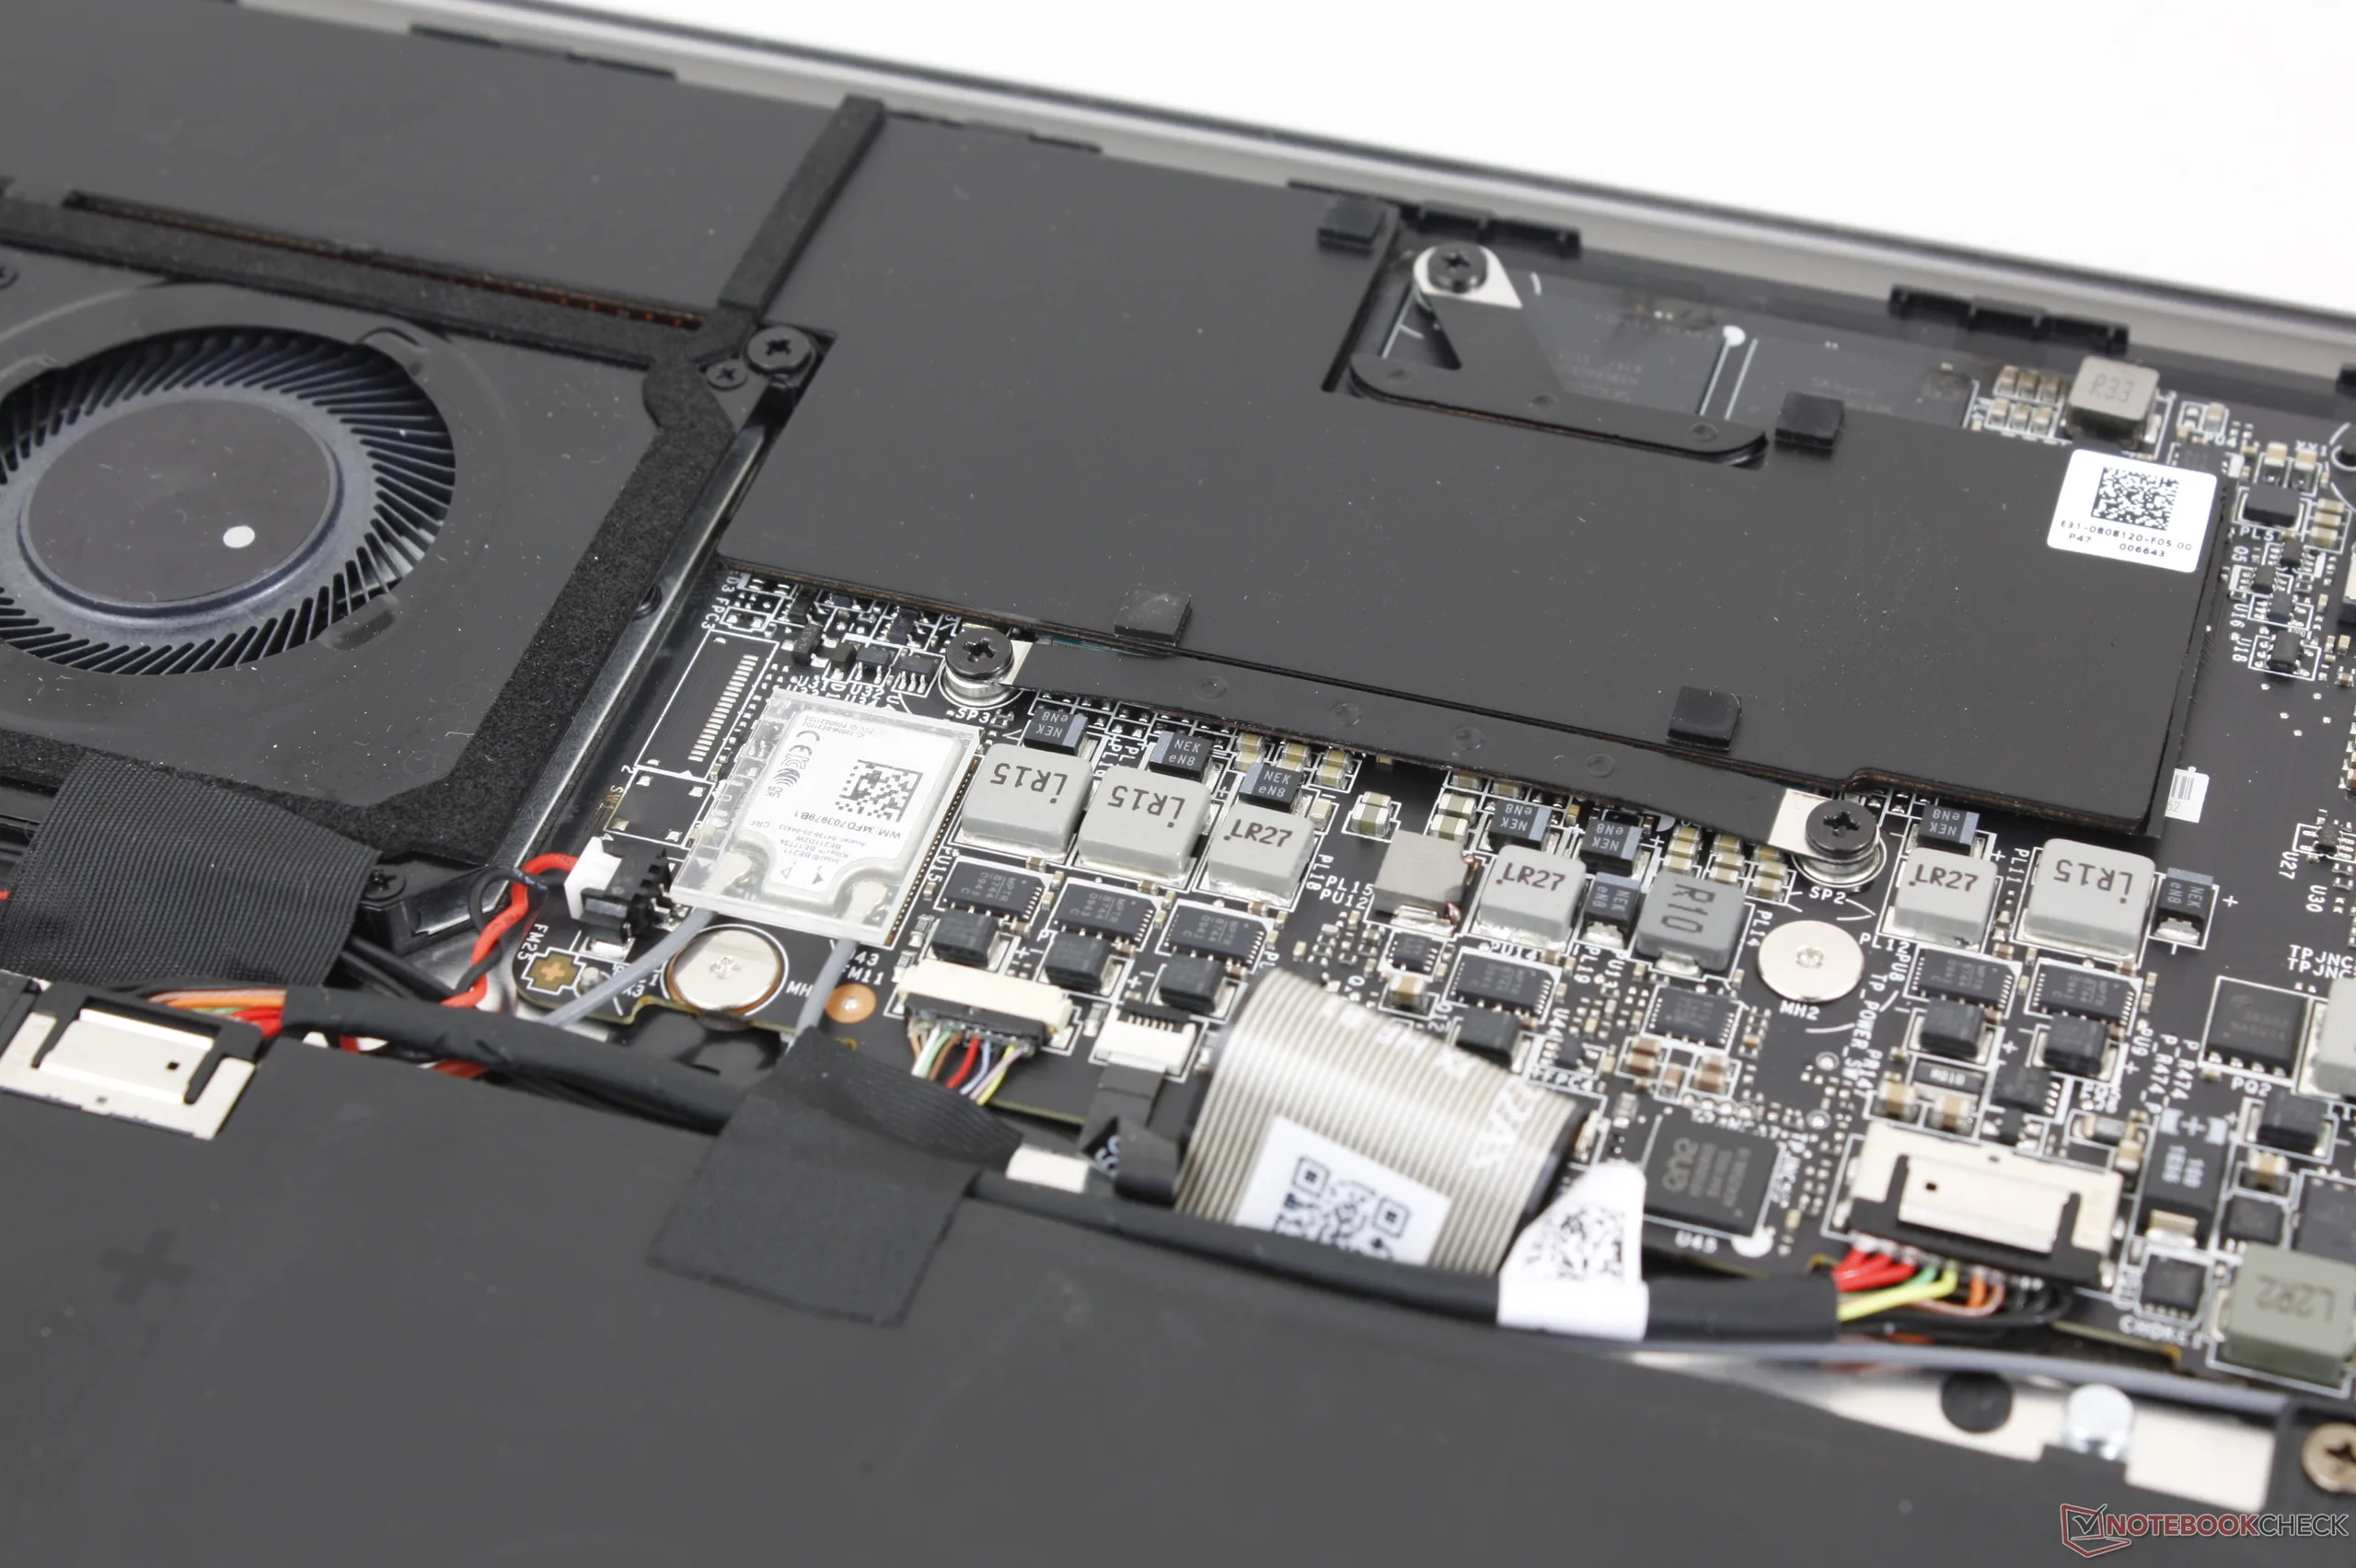
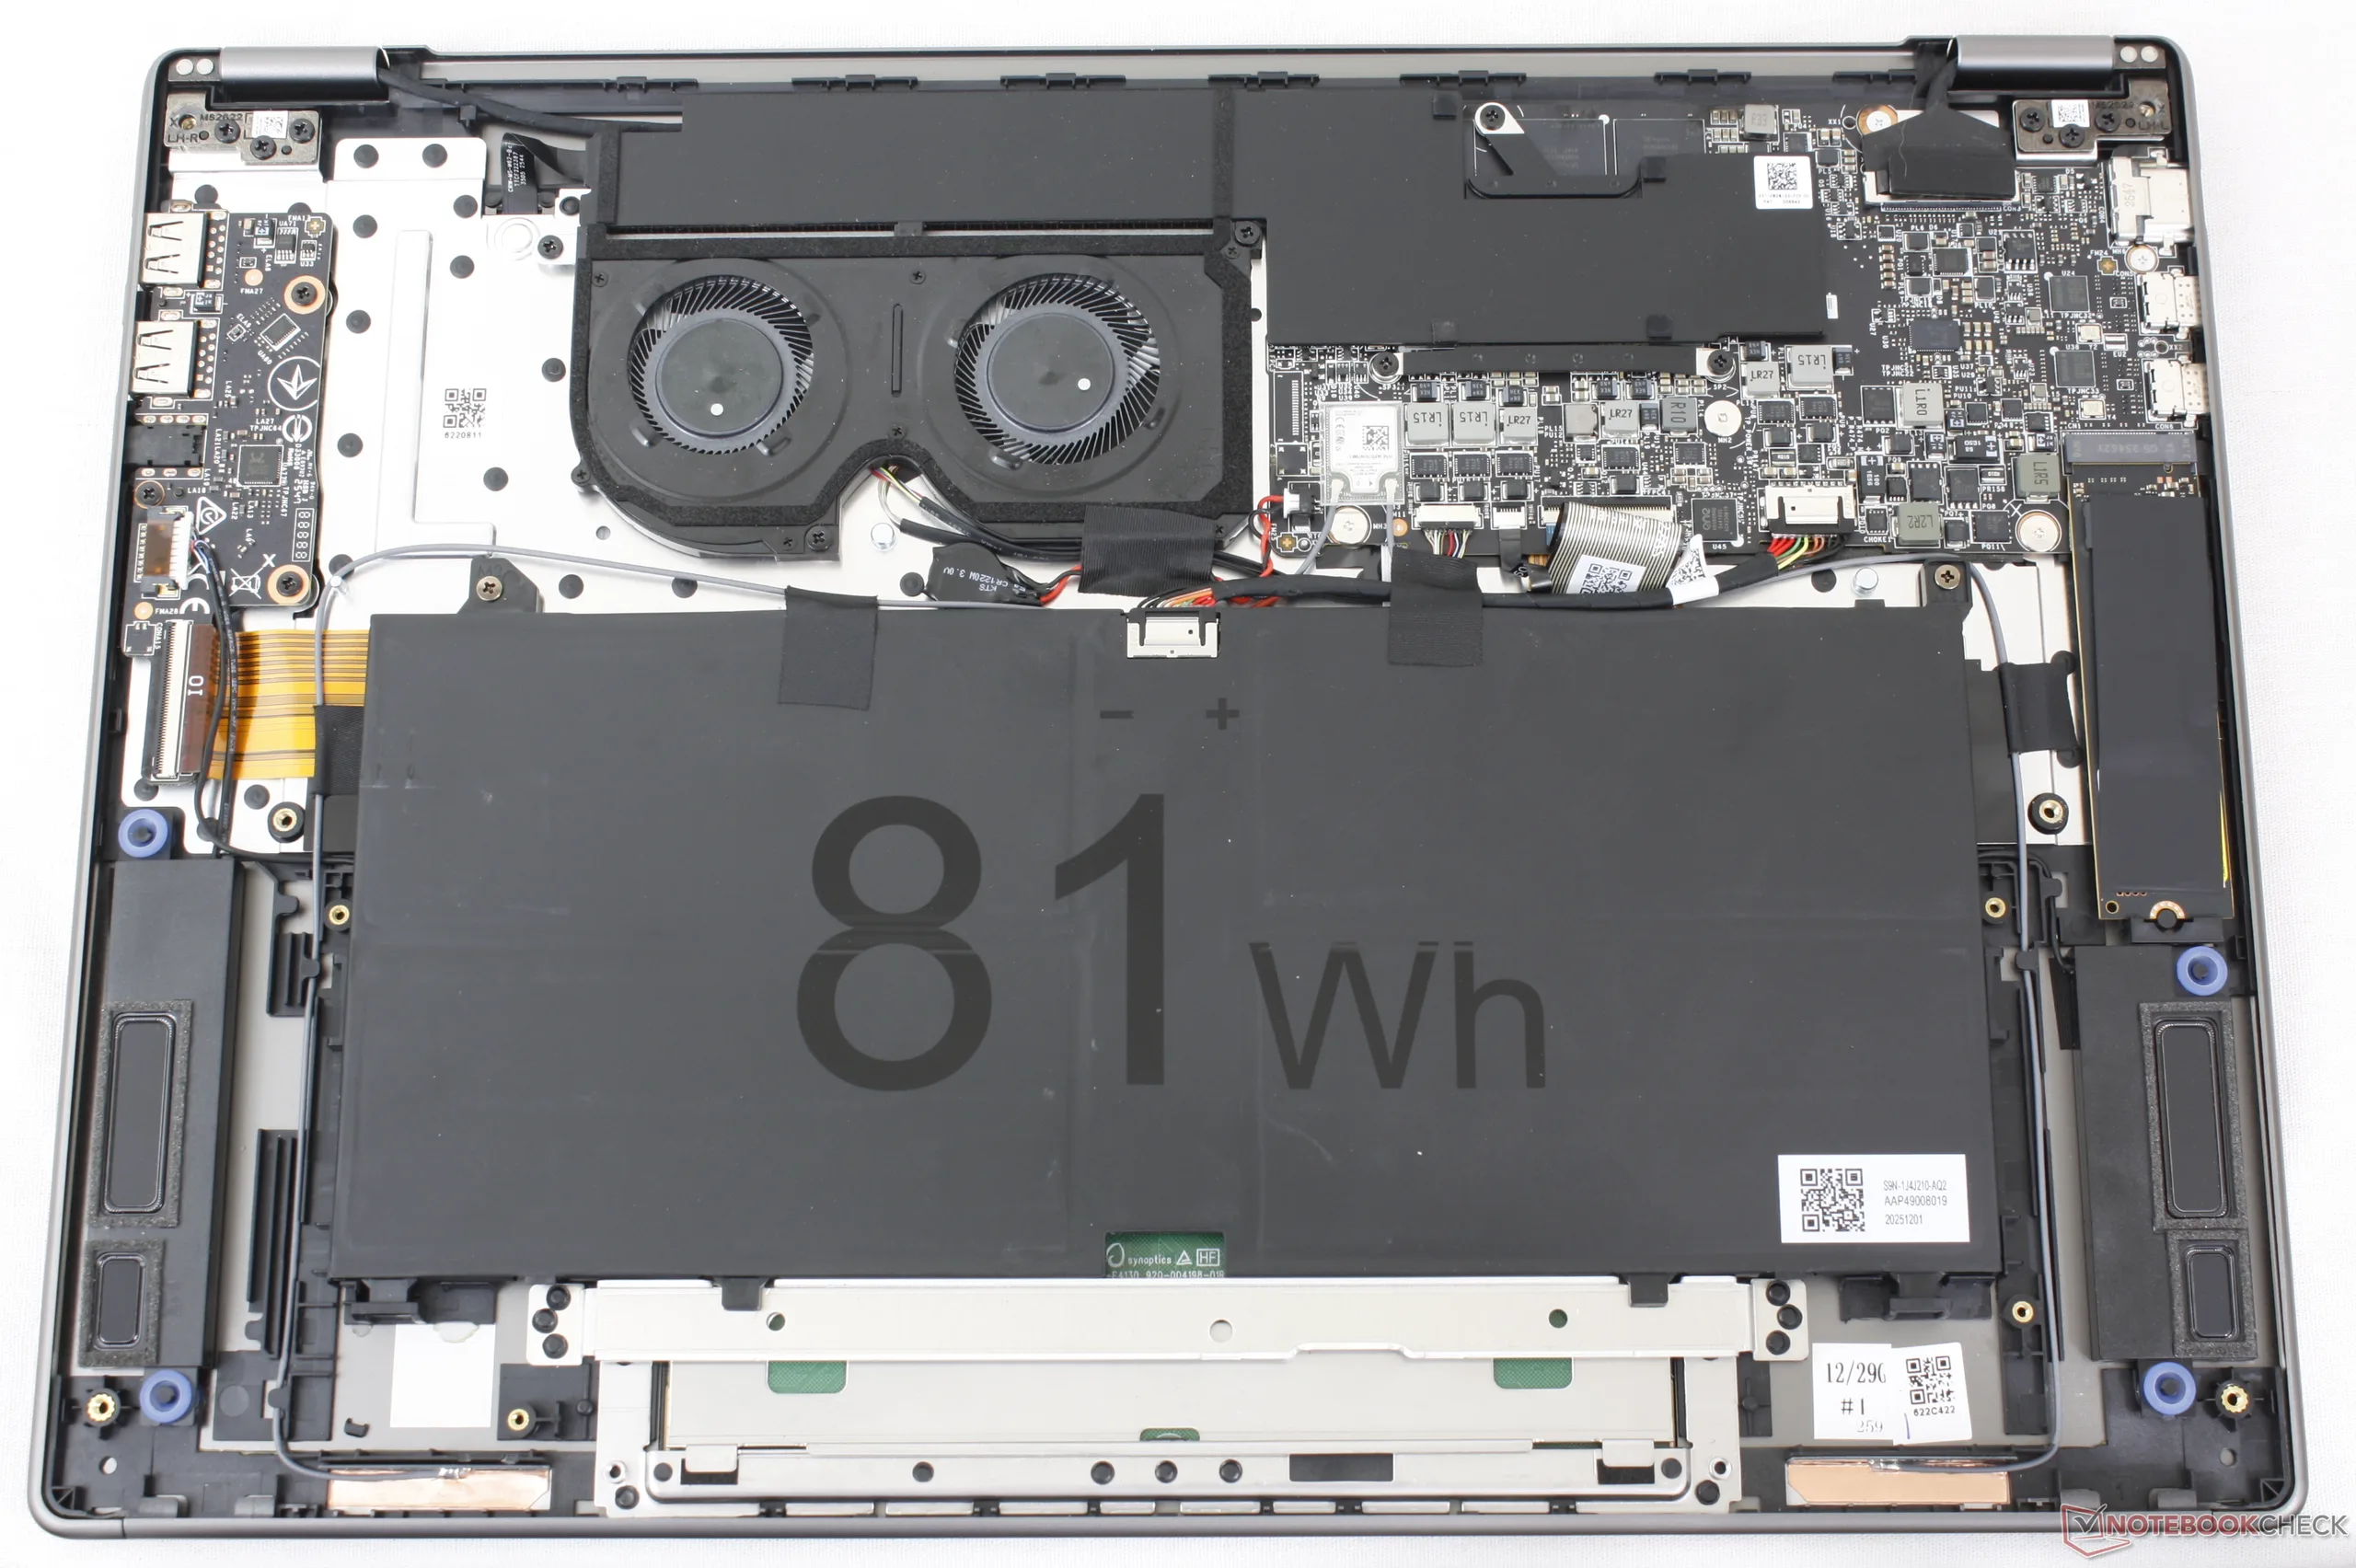
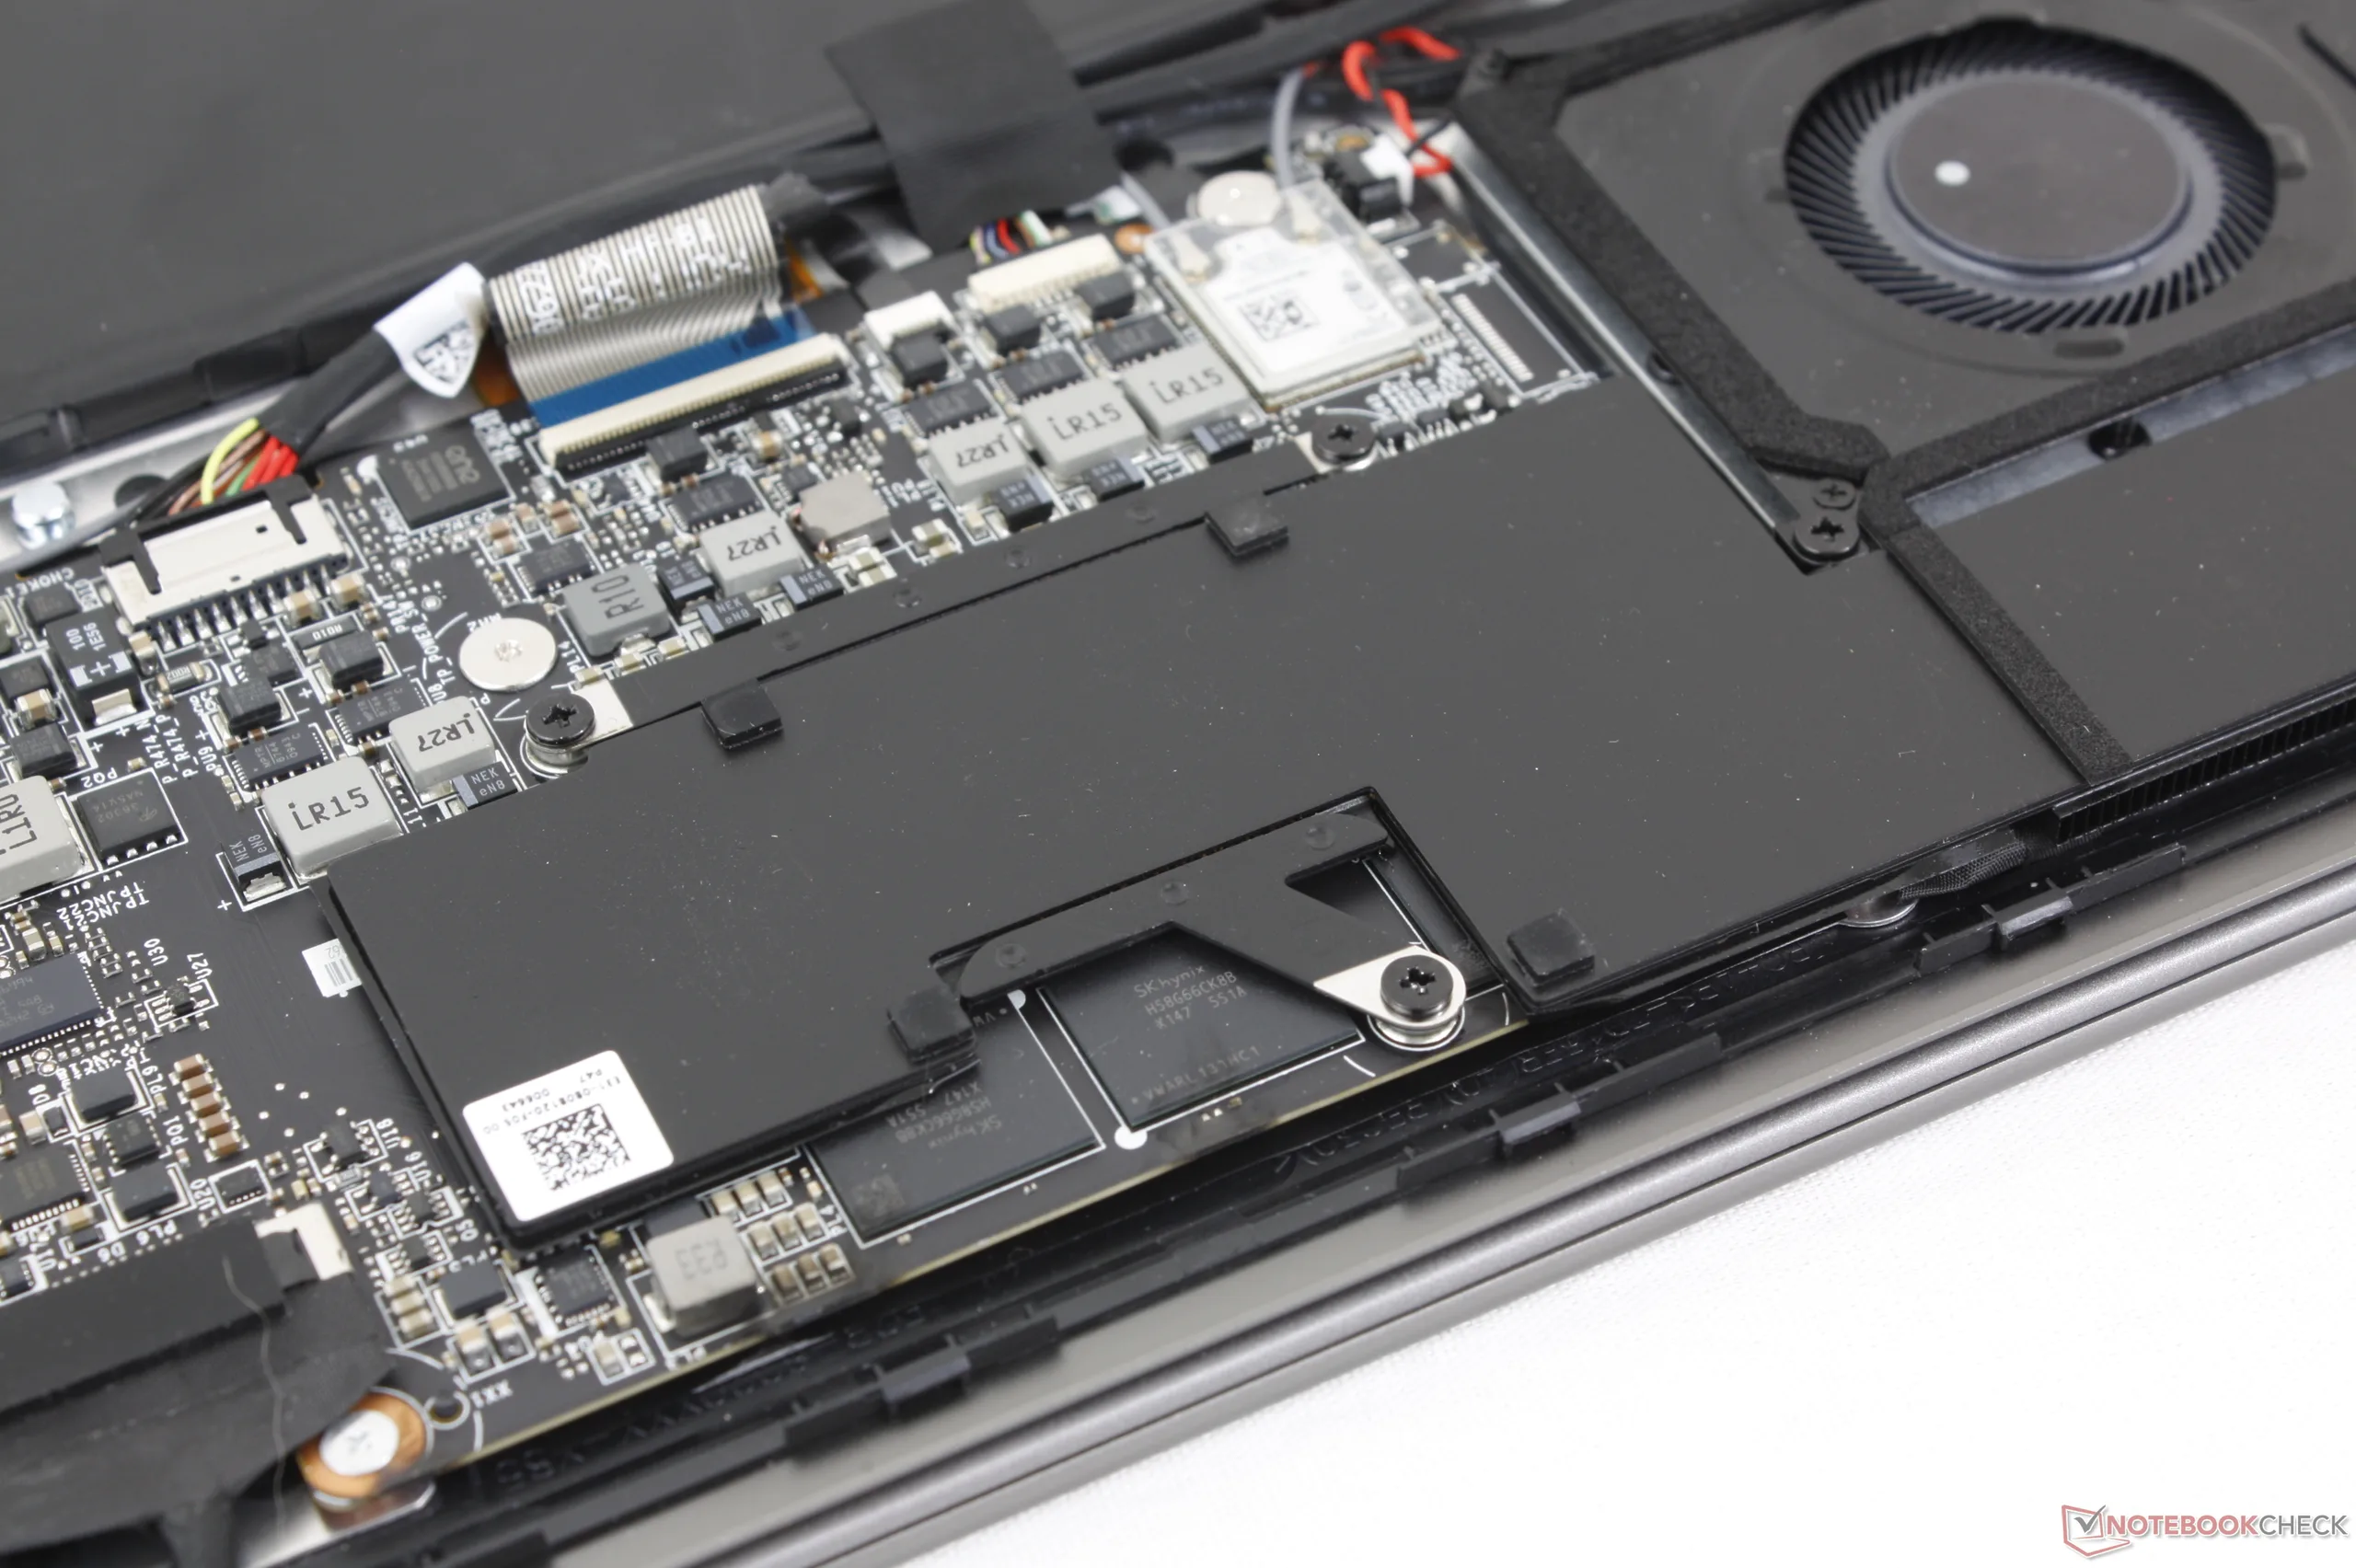
Die Bodenplatte lässt sich mit einem Kreuzschlitzschraubendreher und einem dünnen Hebelwerkzeug leicht entfernen. Die Hauptplatine wurde gegenüber dem 2025er Modell komplett überarbeitet (siehe unten). Vor allem unterstützt das Modell jetzt nur noch eine M.2-SSD anstelle von zwei, während die Akkukapazität gesunken ist, wahrscheinlich um Gewicht zu sparen.

Nachhaltigkeit
Die Verwendung von recycelten Materialien bei der Herstellung wird vom Hersteller nicht ausdrücklich angegeben. Die Verpackung ist FSC-zertifiziert und besteht sowohl aus Papier als auch aus Kunststoff.
Zubehör und Garantie
In der Verpackung befinden sich außer dem Netzadapter und den Unterlagen keine weiteren Extras. Wenn man das Gerät in den USA kauft, gilt die übliche einjährige Herstellergarantie.
Eingabegeräte
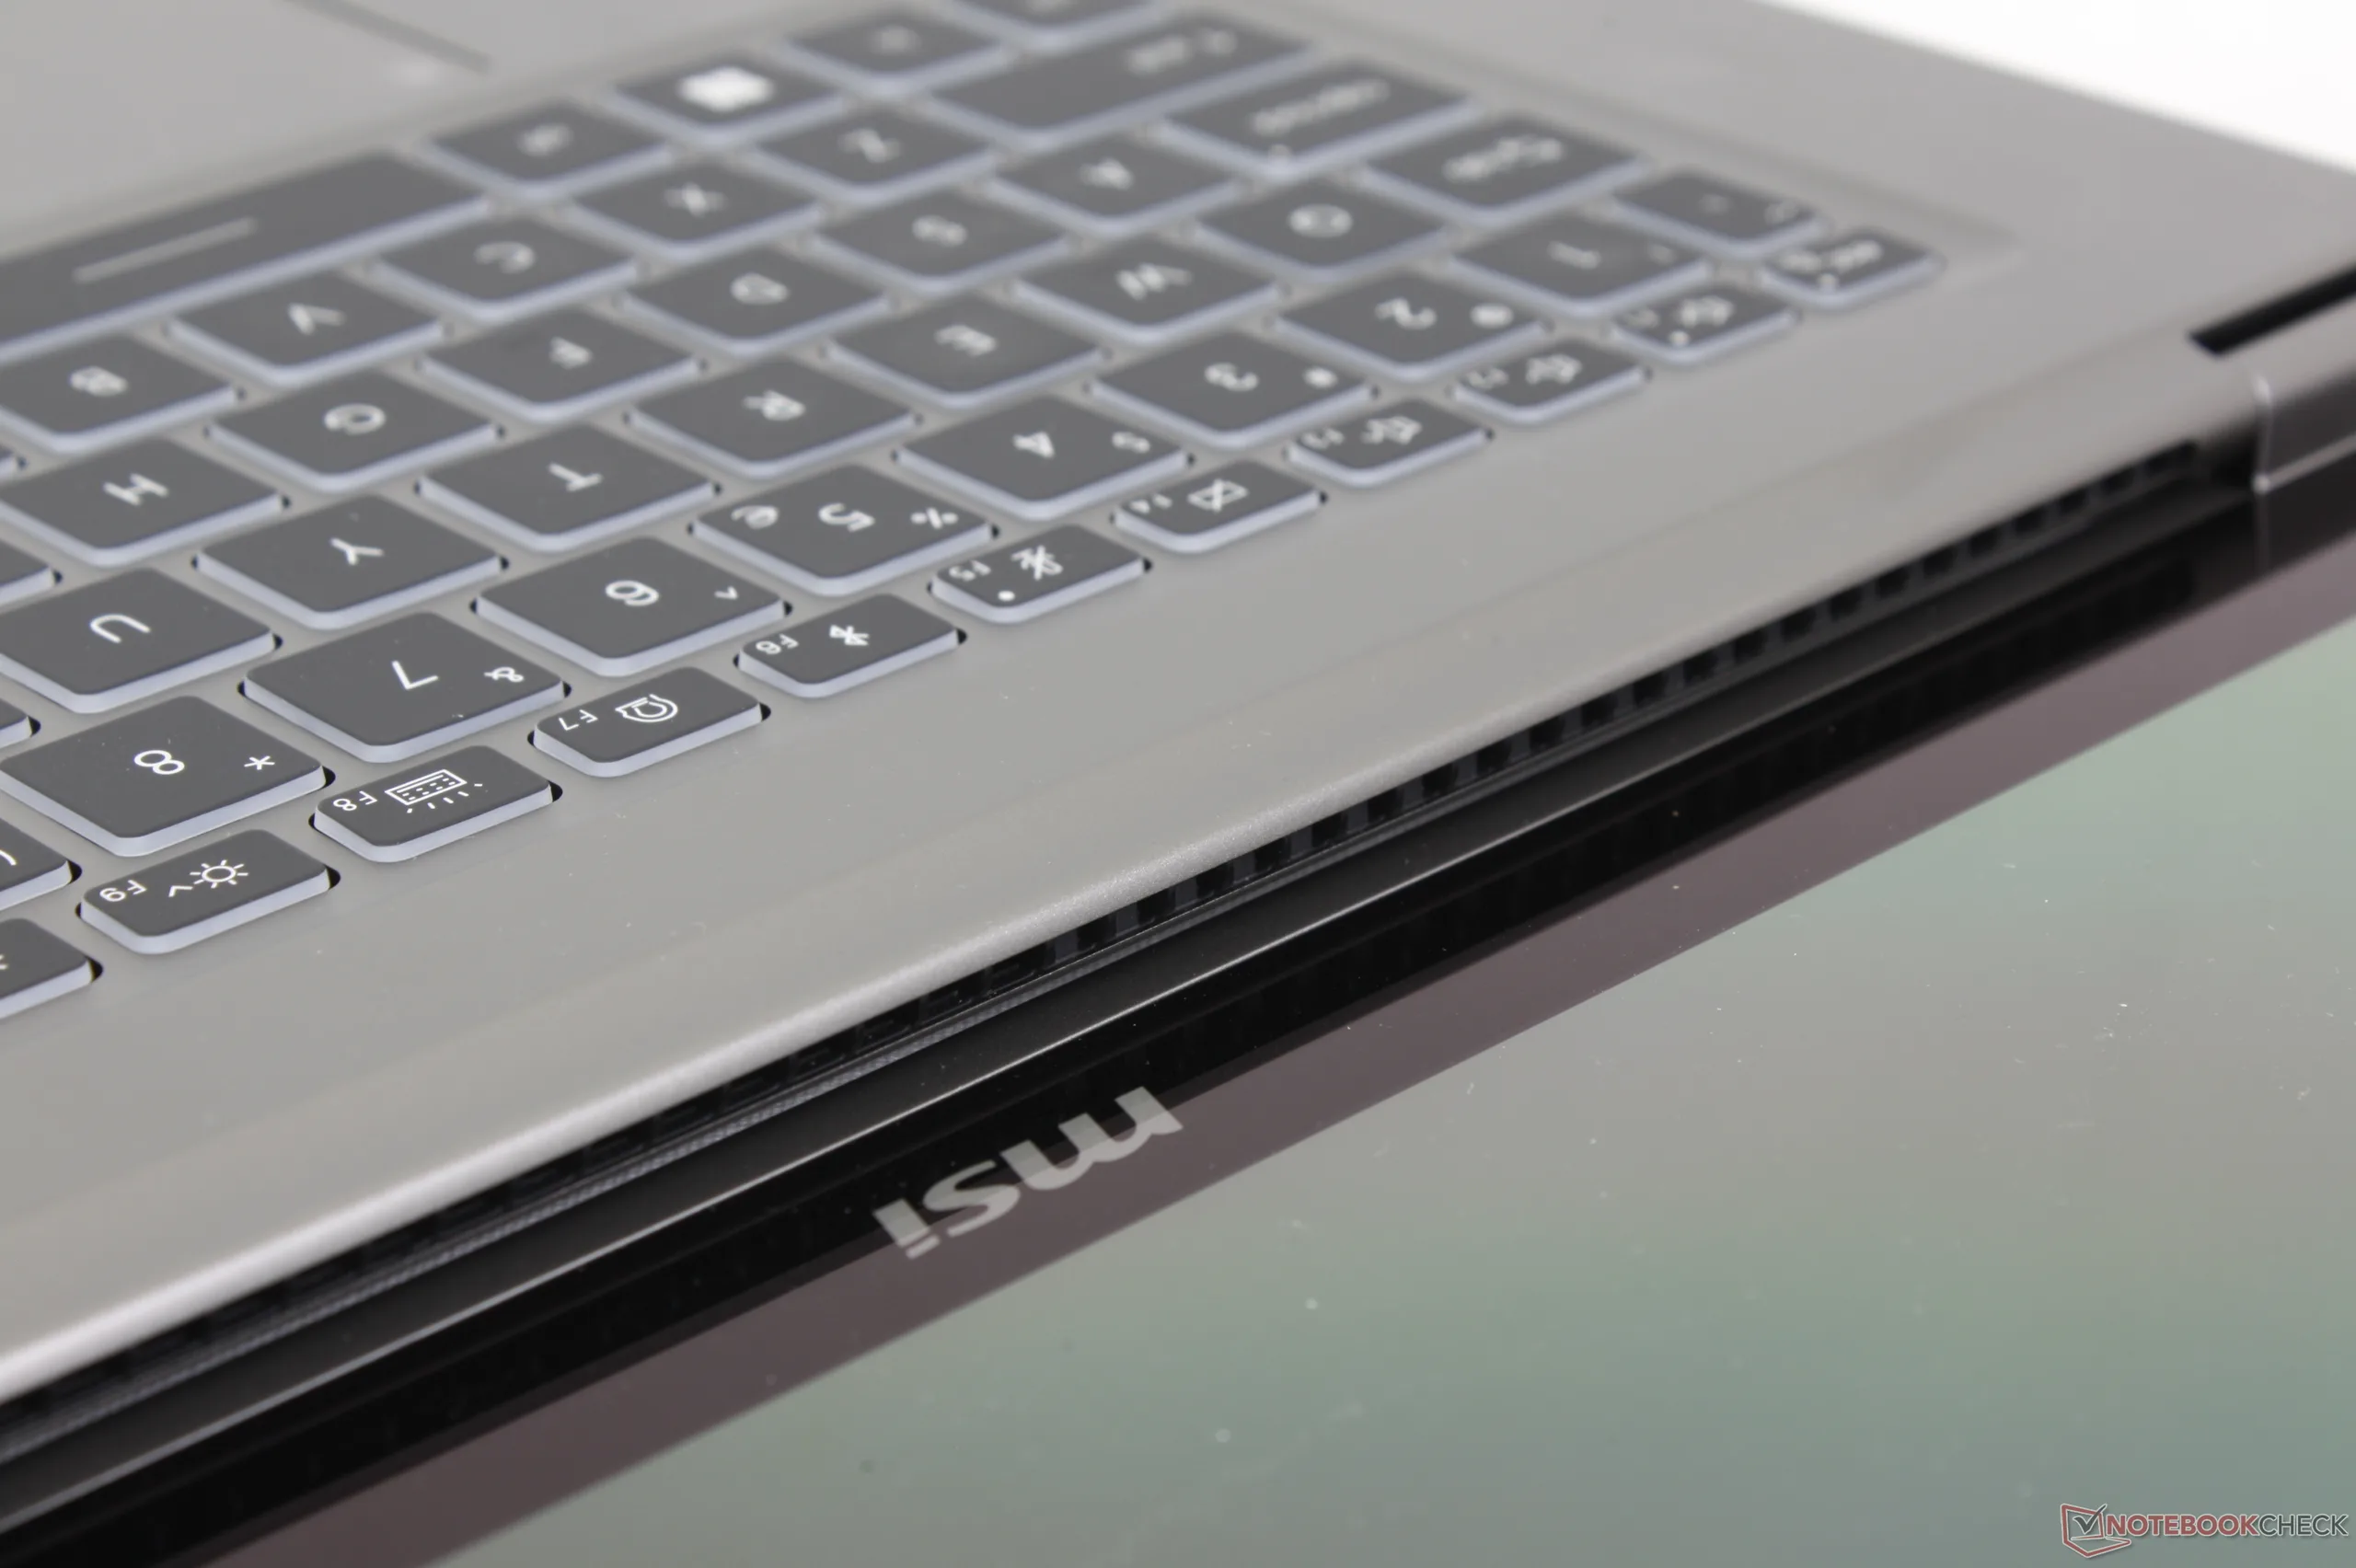
Tastatur
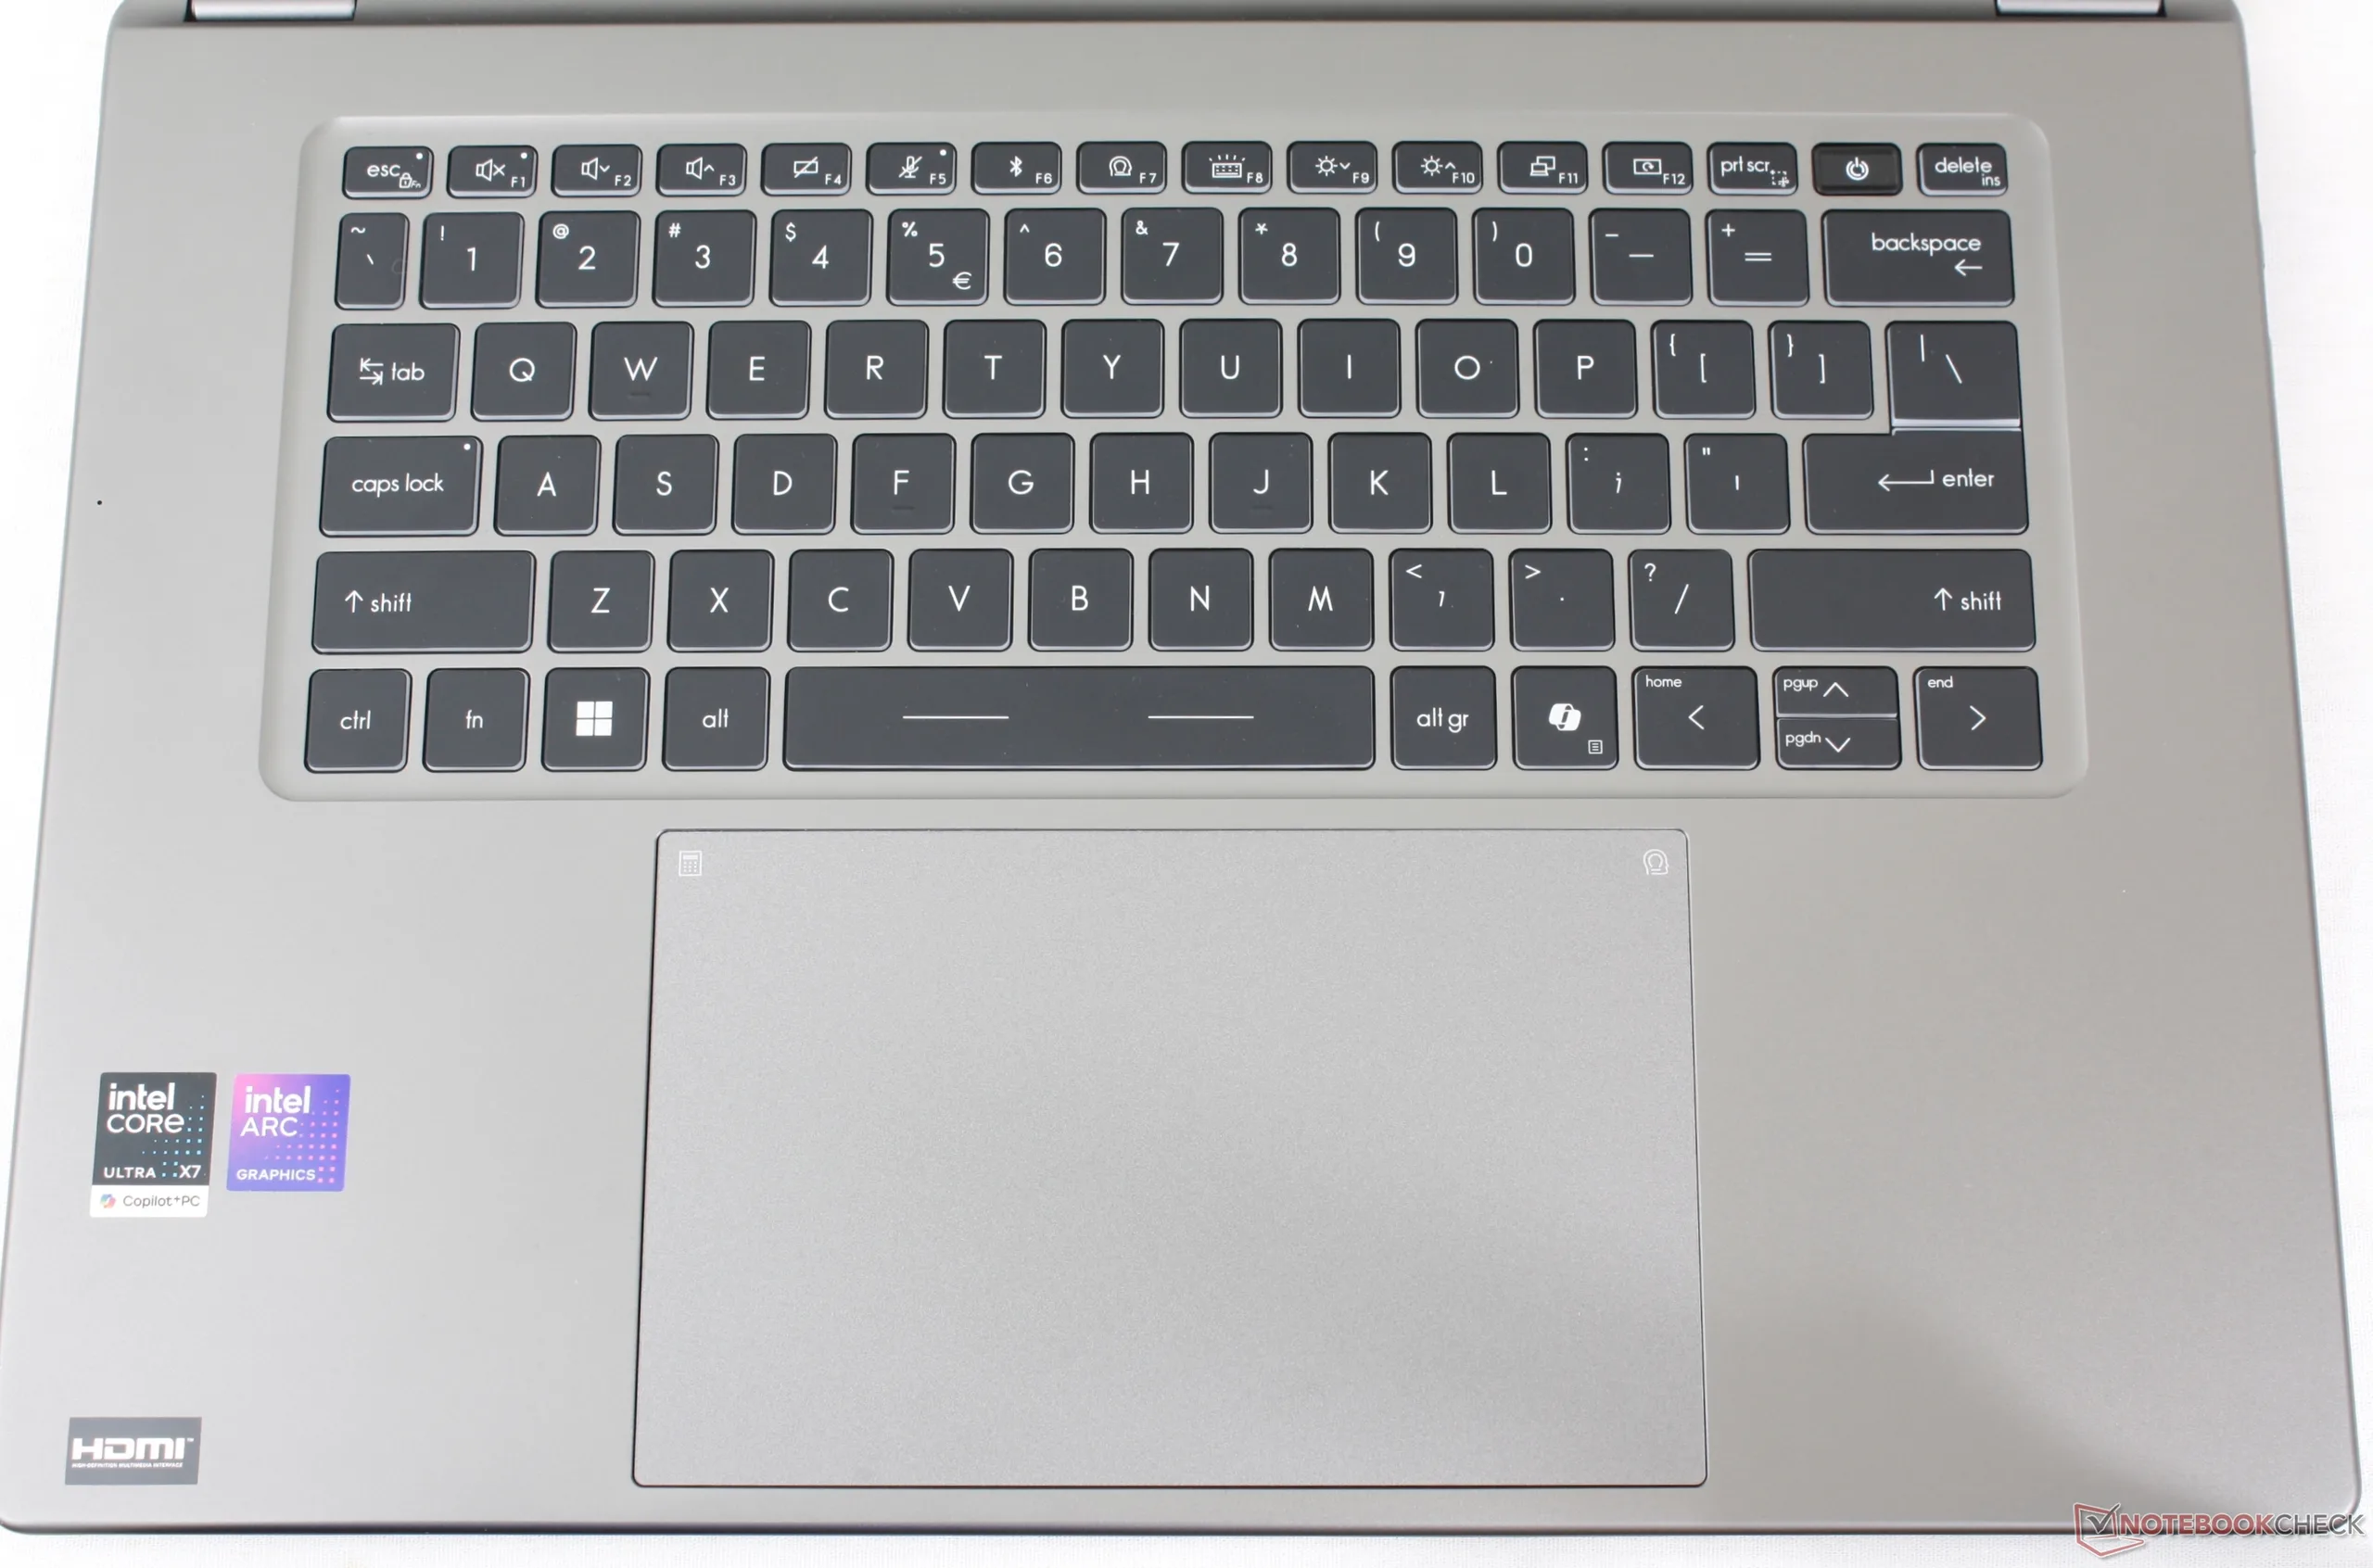
Der Ziffernblock ist nun wohl oder übel verschwunden. Ansonsten fühlt sich das Tippen leichter und flacher an als bei klassischen Office-Laptops der Thinkpad-T-Serie oder der EliteBook Serie. Das Tippen auf dem viel günstigeren Venture 16, zum Beispiel, fühlt sich ungefähr so an wie auf der Prestige Reihe. Während MSI das Gesamtdesign des neuen Prestige Gehäuses perfektioniert hat, kann die Tastatur nicht mithalten.
Touchpad
Das Clickpad ist noch größer als zuvor, von 15 x 9 cm auf 16 x 10 cm beim neueren Modell. Das Gleitverhalten ist unabhängig von der Geschwindigkeit gleichmäßig und präzise, aber das Feedback beim Klicken bleibt relativ schwach. Das Klicken ist auch nur in den unteren beiden Ecken angenehm, wo die Oberfläche des Clickpads deutlich leichter nachgibt.


Display

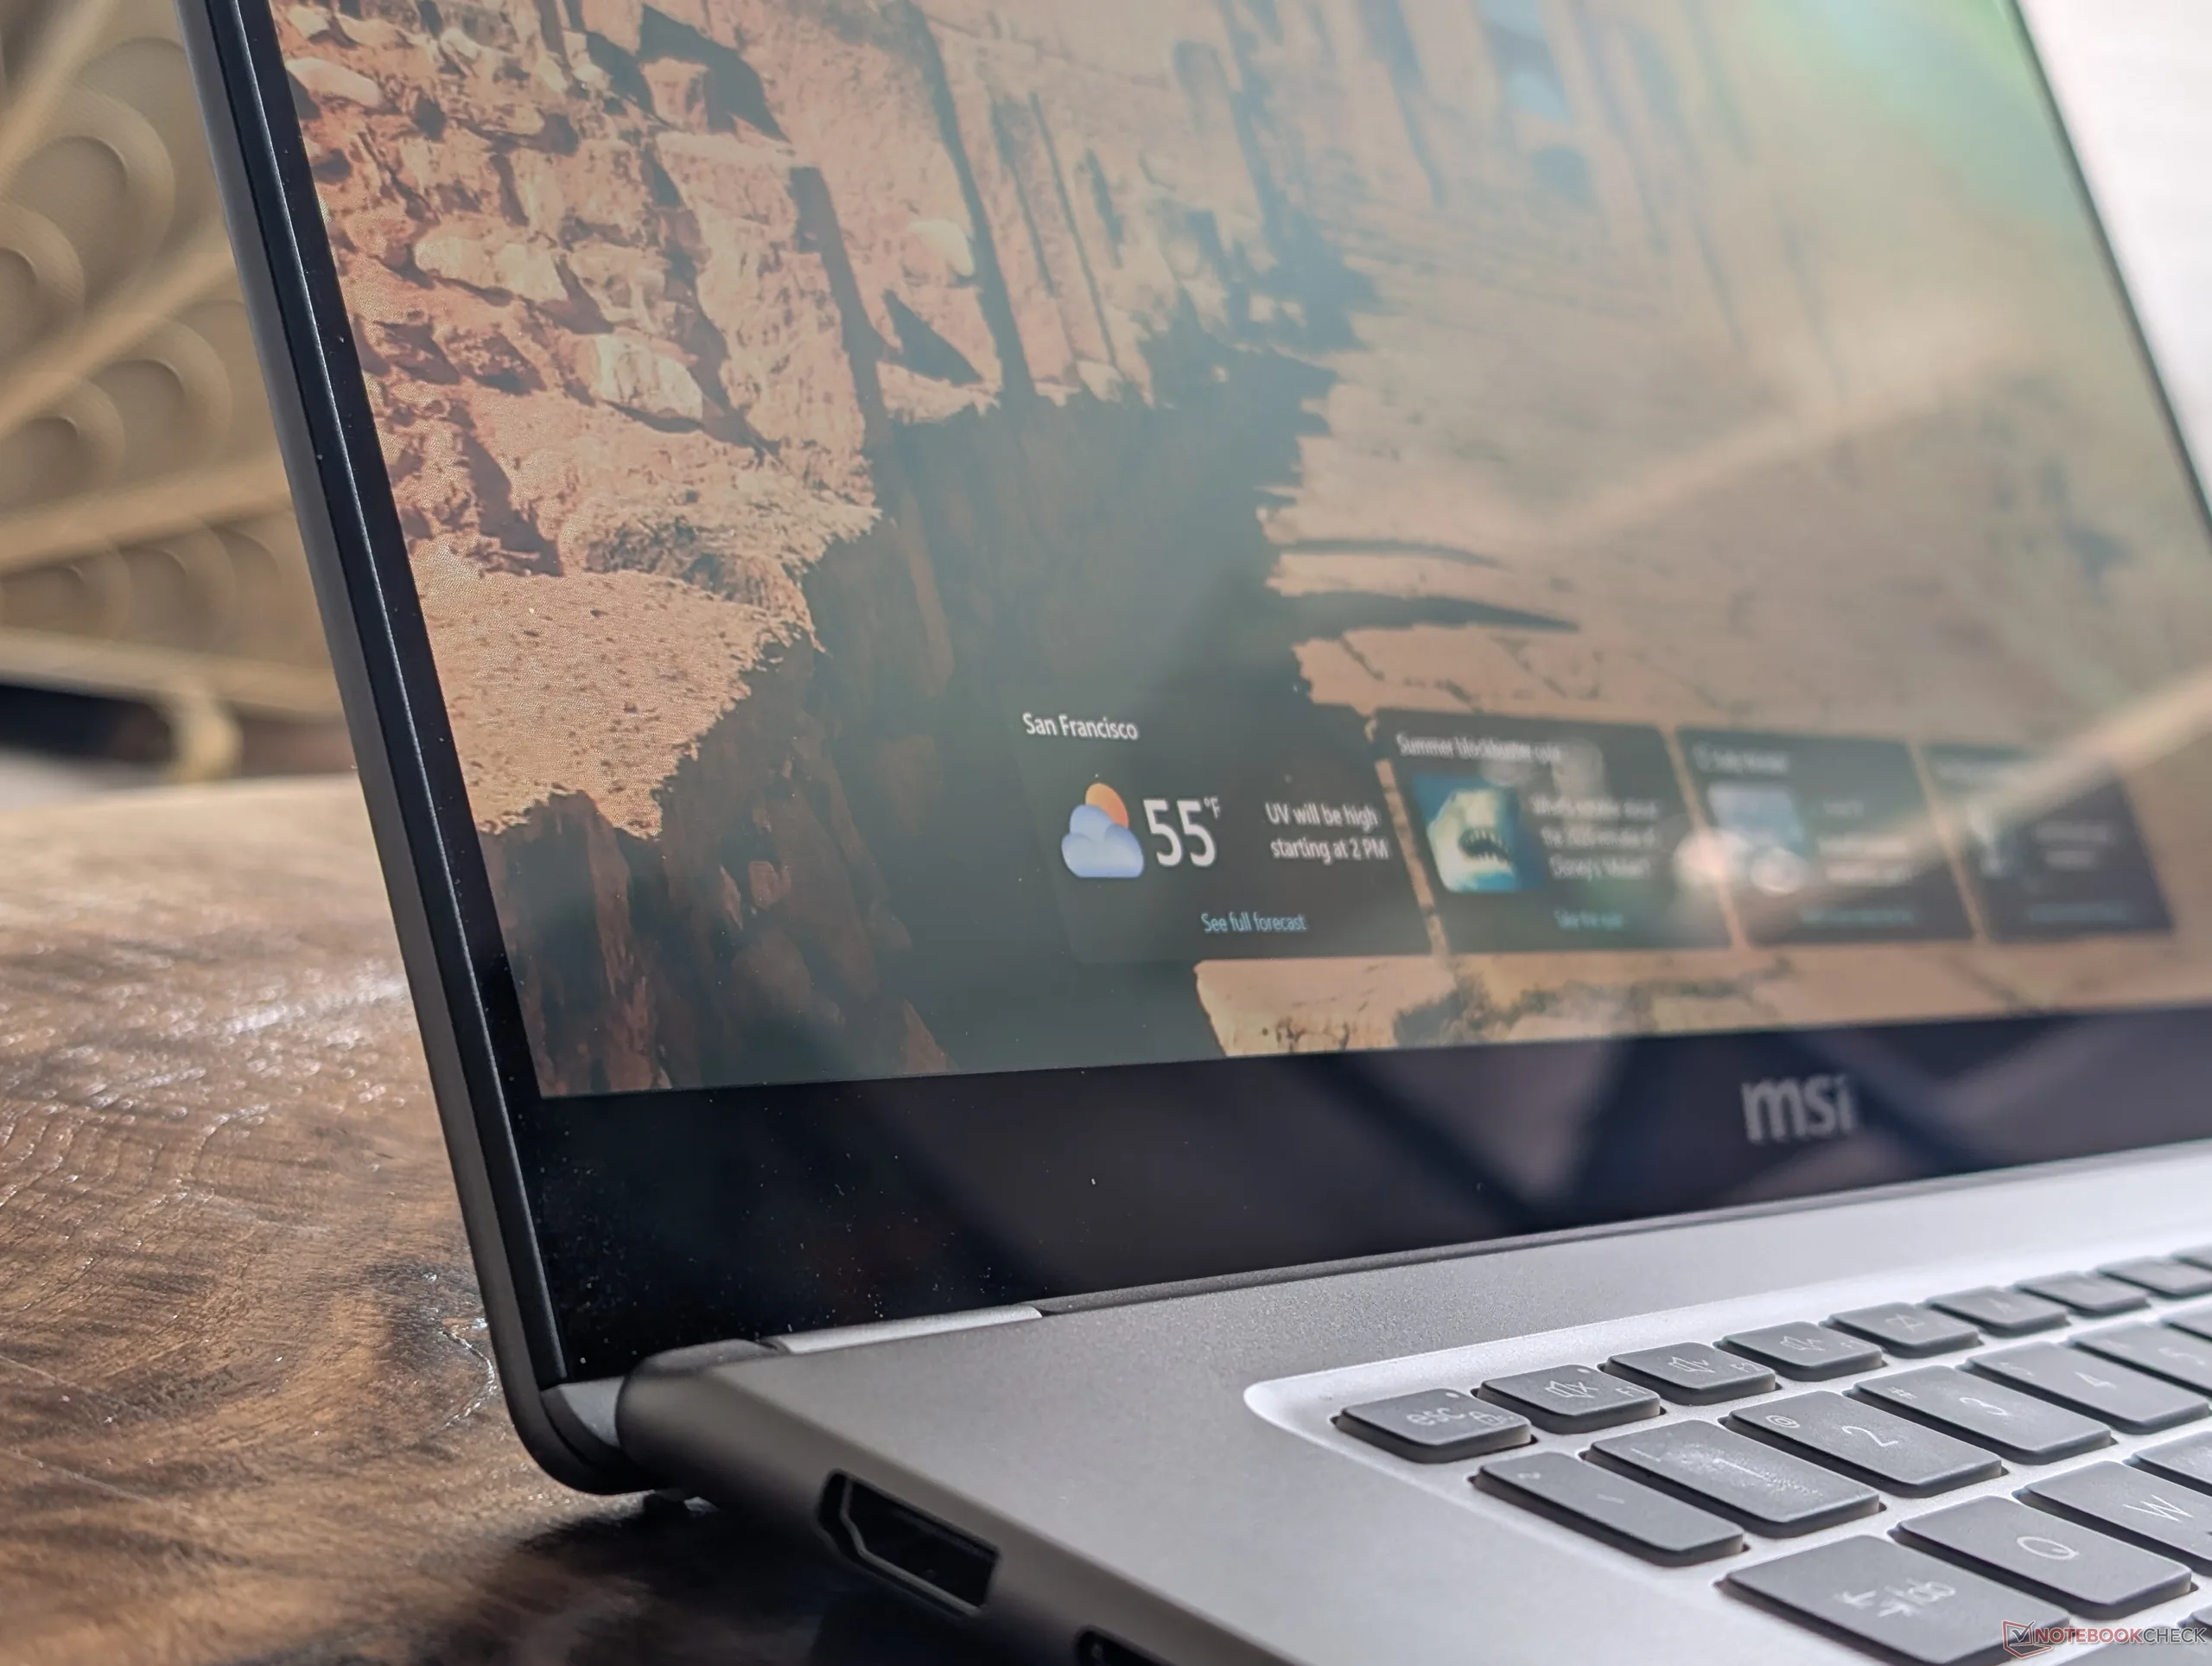
Das Samsung-ATNA60CL11-0-OLED-Panel ist dem ATNA60CL10-0 Panel sehr ähnlich, das im ZenBook S16 anzutreffen ist. Die Bildwiederholfrequenz von 120 Hz und die native Auflösung von 1.800p sind eine Verbesserung gegenüber dem IPS-Panel des letztjährigen Modells. Tatsächlich gibt es keine erwähnenswerten IPS-Optionen mehr, wodurch die Prestige-16-Serie klar in die Enthusiasten-Klasse rückt.
Die Helligkeit ist zwar immer noch hervorragend, aber schwächer als beim IPS-Display des 2025 Prestige 16. Unsere Tests zeigen eine maximale Helligkeit von nur 383 nits und 422 nits im SDR-Modus bzw. HDR-Modus, verglichen mit 471 nits beim Vorjahresmodell. Bestimmte Konfigurationen unterstützen DisplayHDR1000 für hellere Maximalwerte, falls sie verfügbar sind, aber unser Testgerät gehört nicht dazu.
| |||||||||||||||||||||||||
Ausleuchtung: 98 %
Helligkeit Akku: 375 cd/m²
Kontrast: ∞:1 (Schwarzwert: 0 cd/m²)
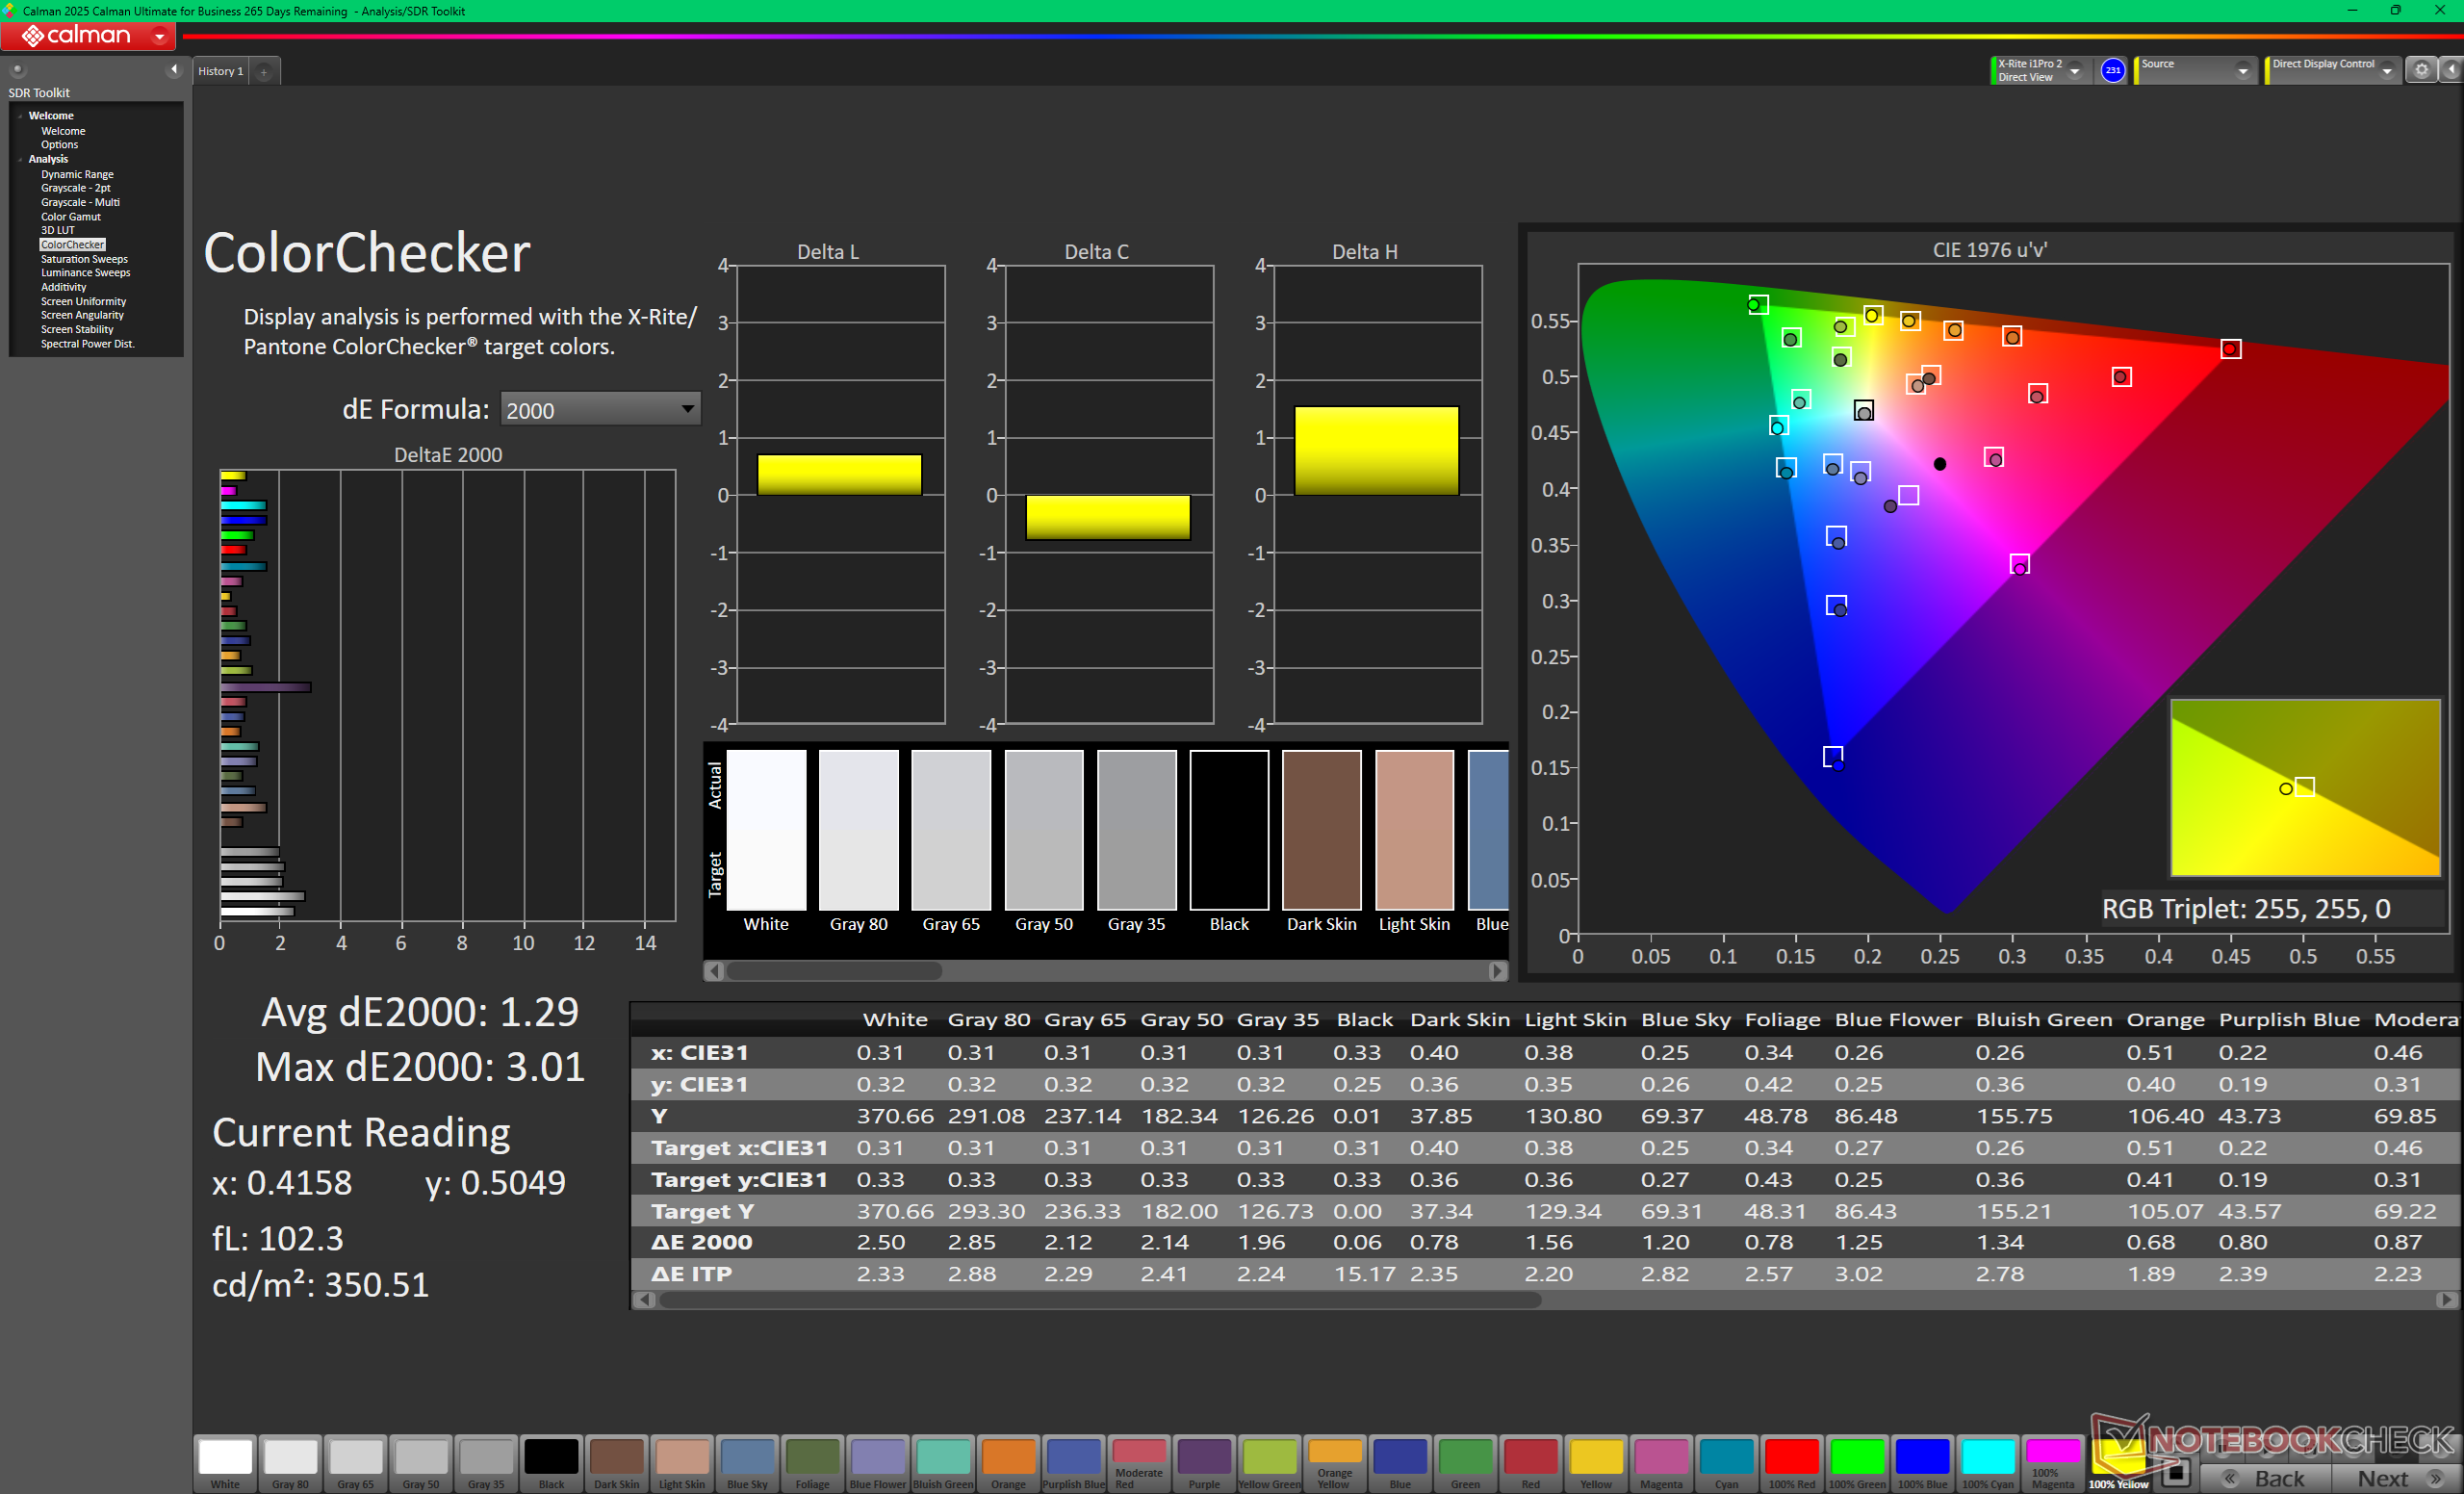
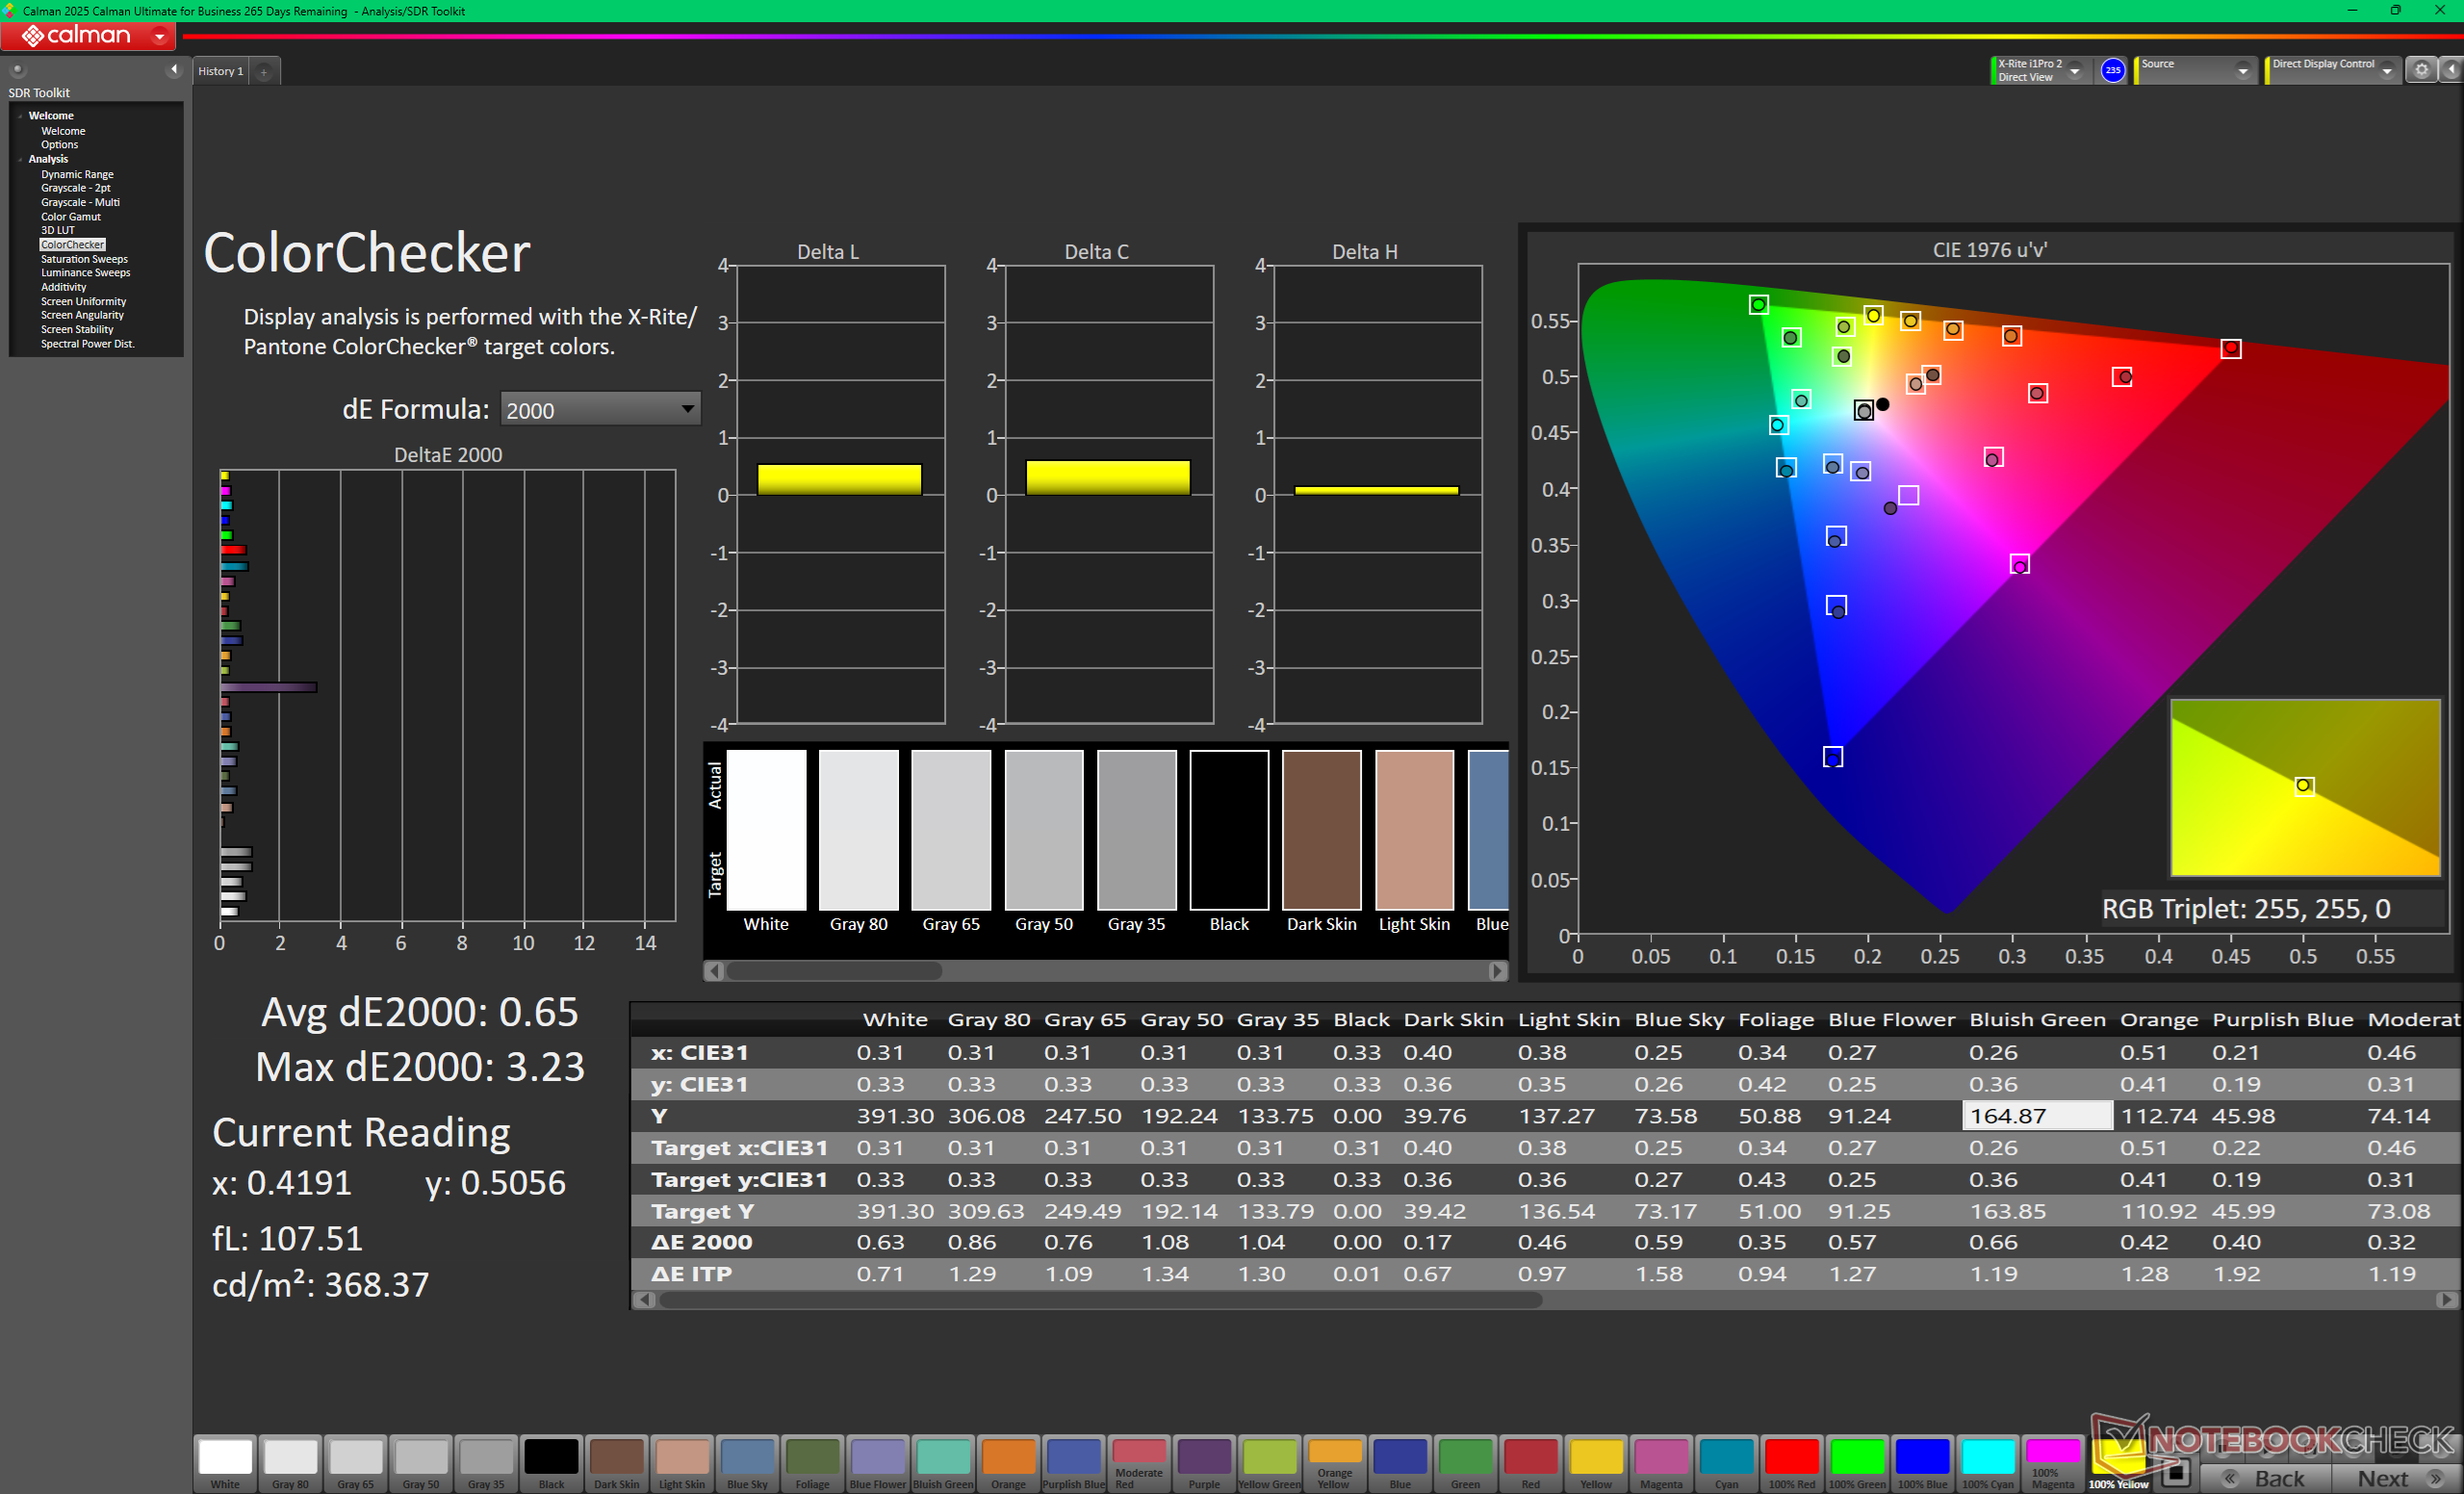
ΔE ColorChecker Calman: 1.29 | ∀{0.5-29.43 Ø4.73}
calibrated: 0.65
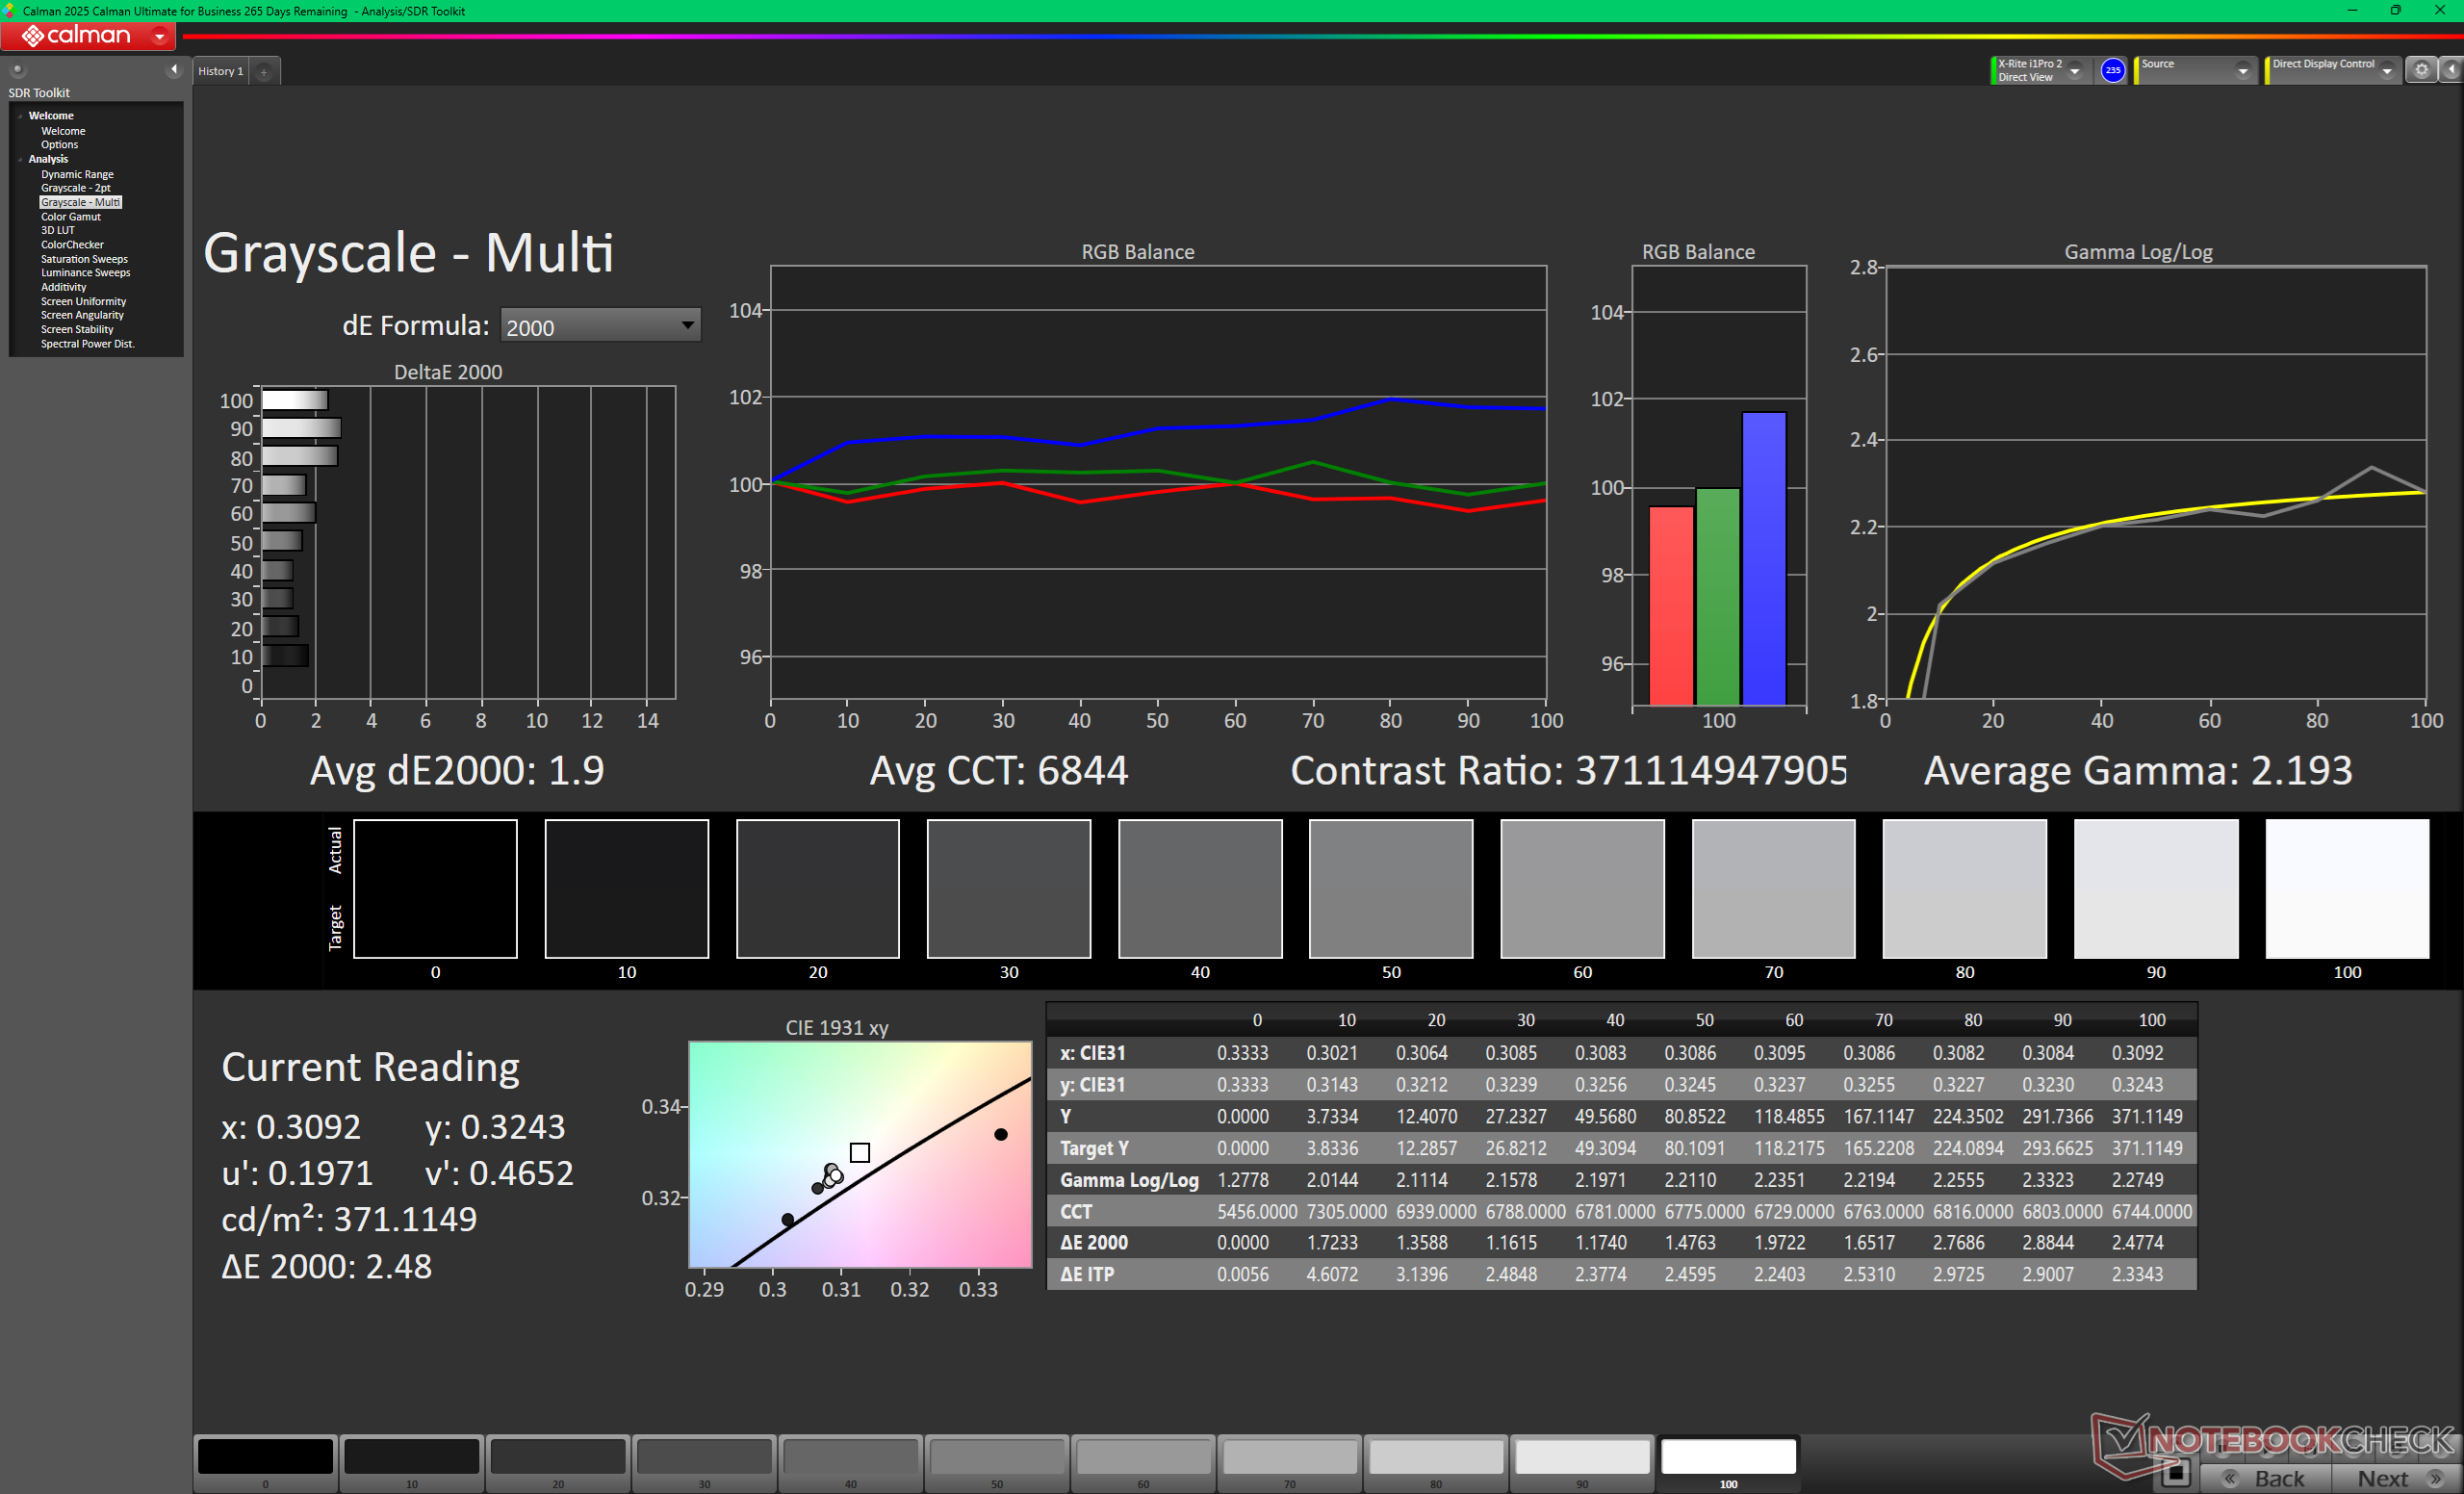
ΔE Greyscale Calman: 1.9 | ∀{0.09-98 Ø4.97}
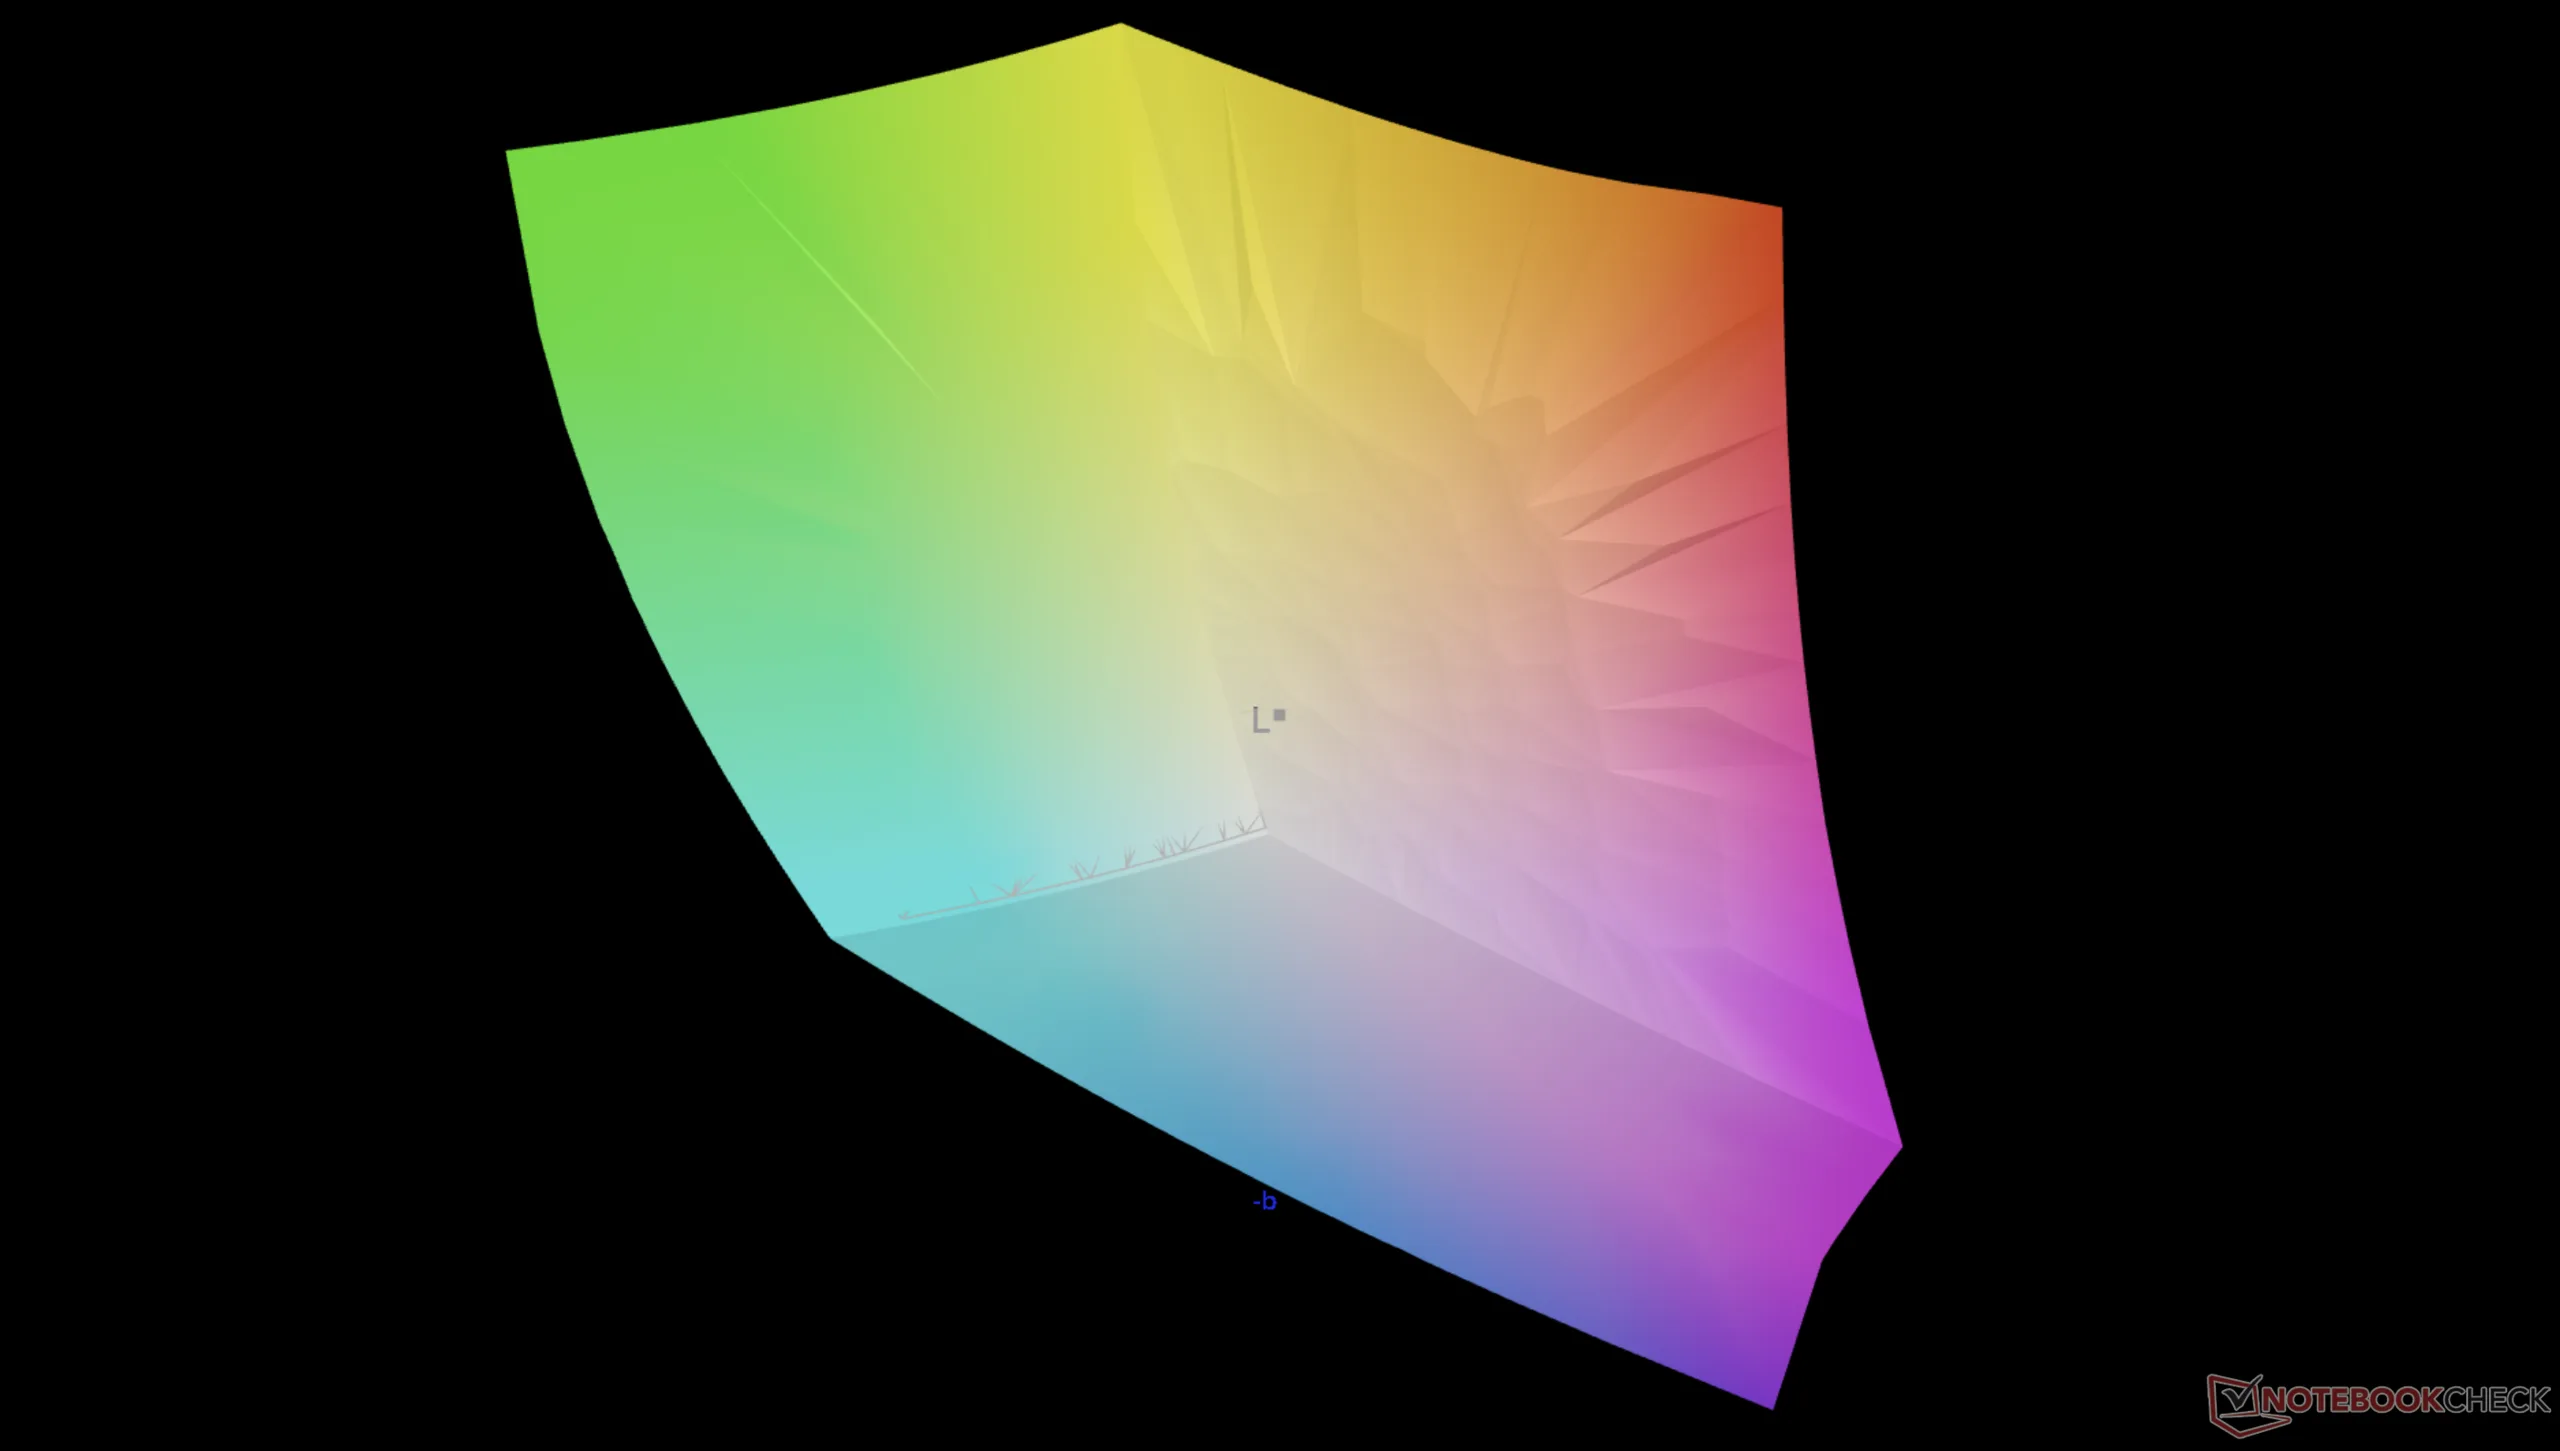
98% AdobeRGB 1998 (Argyll 3D)
100% sRGB (Argyll 3D)
99.8% Display P3 (Argyll 3D)
Gamma: 2.19
CCT: 6844 K
| MSI Prestige 16 AI C3MTG Samsung ATNA60CL11-0, OLED, 2880x1800, 16", 120 Hz | MSI Prestige 16 AI Evo B2HMG B160QAN03_R, IPS, 2560x1600, 16", 60 Hz | Dell XPS 16 Core Ultra X7 358H LG Philips 160WV1, OLED, 3200x2000, 16", 120 Hz | Asus ZenBook S16 UM5606GA ATNA60HR07-0, OLED, 2880x1800, 16", 120 Hz | Lenovo ThinkBook 16 G7+ AMD LEN160-3.2K, IPS, 3200x2000, 16", 165 Hz | HP Envy x360 2-in-1 16-ad0097nr Samsung SDC41A6, OLED, 2880x1800, 16", 120 Hz | |
|---|---|---|---|---|---|---|
| Display | -6% | -1% | -1% | -5% | -1% | |
| Display P3 Coverage (%) | 99.8 | 96.4 -3% | 99.5 0% | 99.8 0% | 96.3 -4% | 99.6 0% |
| sRGB Coverage (%) | 100 | 99.7 0% | 100 0% | 100 0% | 100 0% | 100 0% |
| AdobeRGB 1998 Coverage (%) | 98 | 84.3 -14% | 96.5 -2% | 94 -4% | 86.9 -11% | 96.5 -2% |
| Response Times | -4924% | -21% | -80% | -1241% | -8% | |
| Response Time Grey 50% / Grey 80% * (ms) | 0.71 ? | 51.5 ? -7154% | 0.65 ? 8% | 1.27 ? -79% | 13.9 ? -1858% | 0.8 ? -13% |
| Response Time Black / White * (ms) | 0.87 ? | 24.3 ? -2693% | 0.87 ? -0% | 0.43 ? 51% | 6.3 ? -624% | 0.89 ? -2% |
| PWM Frequency (Hz) | 460.46 ? | 240.2 ? | 960 ? | 491.8 ? | ||
| PWM Amplitude * (%) | 18 | 31 -72% | 56 -211% | |||
| Bildschirm | -153% | -50% | 12% | -9% | -48% | |
| Helligkeit Bildmitte (cd/m²) | 375 | 471 26% | 395.4 5% | 465 24% | 422 13% | 399.4 7% |
| Brightness (cd/m²) | 380 | 455 20% | 392 3% | 466 23% | 403 6% | 405 7% |
| Brightness Distribution (%) | 98 | 92 -6% | 95 -3% | 99 1% | 93 -5% | 98 0% |
| Schwarzwert * (cd/m²) | 0.2 | 0.3 | ||||
| Delta E Colorchecker * | 1.29 | 5.8 -350% | 3.69 -186% | 1 22% | 1.7 -32% | 4.05 -214% |
| Colorchecker dE 2000 max. * | 3.01 | 10.8 -259% | 7.94 -164% | 3 -0% | 3.4 -13% | 6.69 -122% |
| Colorchecker dE 2000 calibrated * | 0.65 | 1.9 -192% | 0.68 -5% | 0.7 -8% | 1.02 -57% | |
| Delta E Graustufen * | 1.9 | 7.8 -311% | 1.9 -0% | 1.9 -0% | 2.4 -26% | 1.1 42% |
| Gamma | 2.19 100% | 2.07 106% | 2.28 96% | 2.19 100% | 2.19 100% | 2.27 97% |
| CCT | 6844 95% | 7262 90% | 6274 104% | 6458 101% | 6989 93% | 6419 101% |
| Kontrast (:1) | 2355 | 1407 | ||||
| Durchschnitt gesamt (Programm / Settings) | -1694% /
-911% | -24% /
-32% | -23% /
-14% | -418% /
-214% | -19% /
-30% |
* ... kleinere Werte sind besser
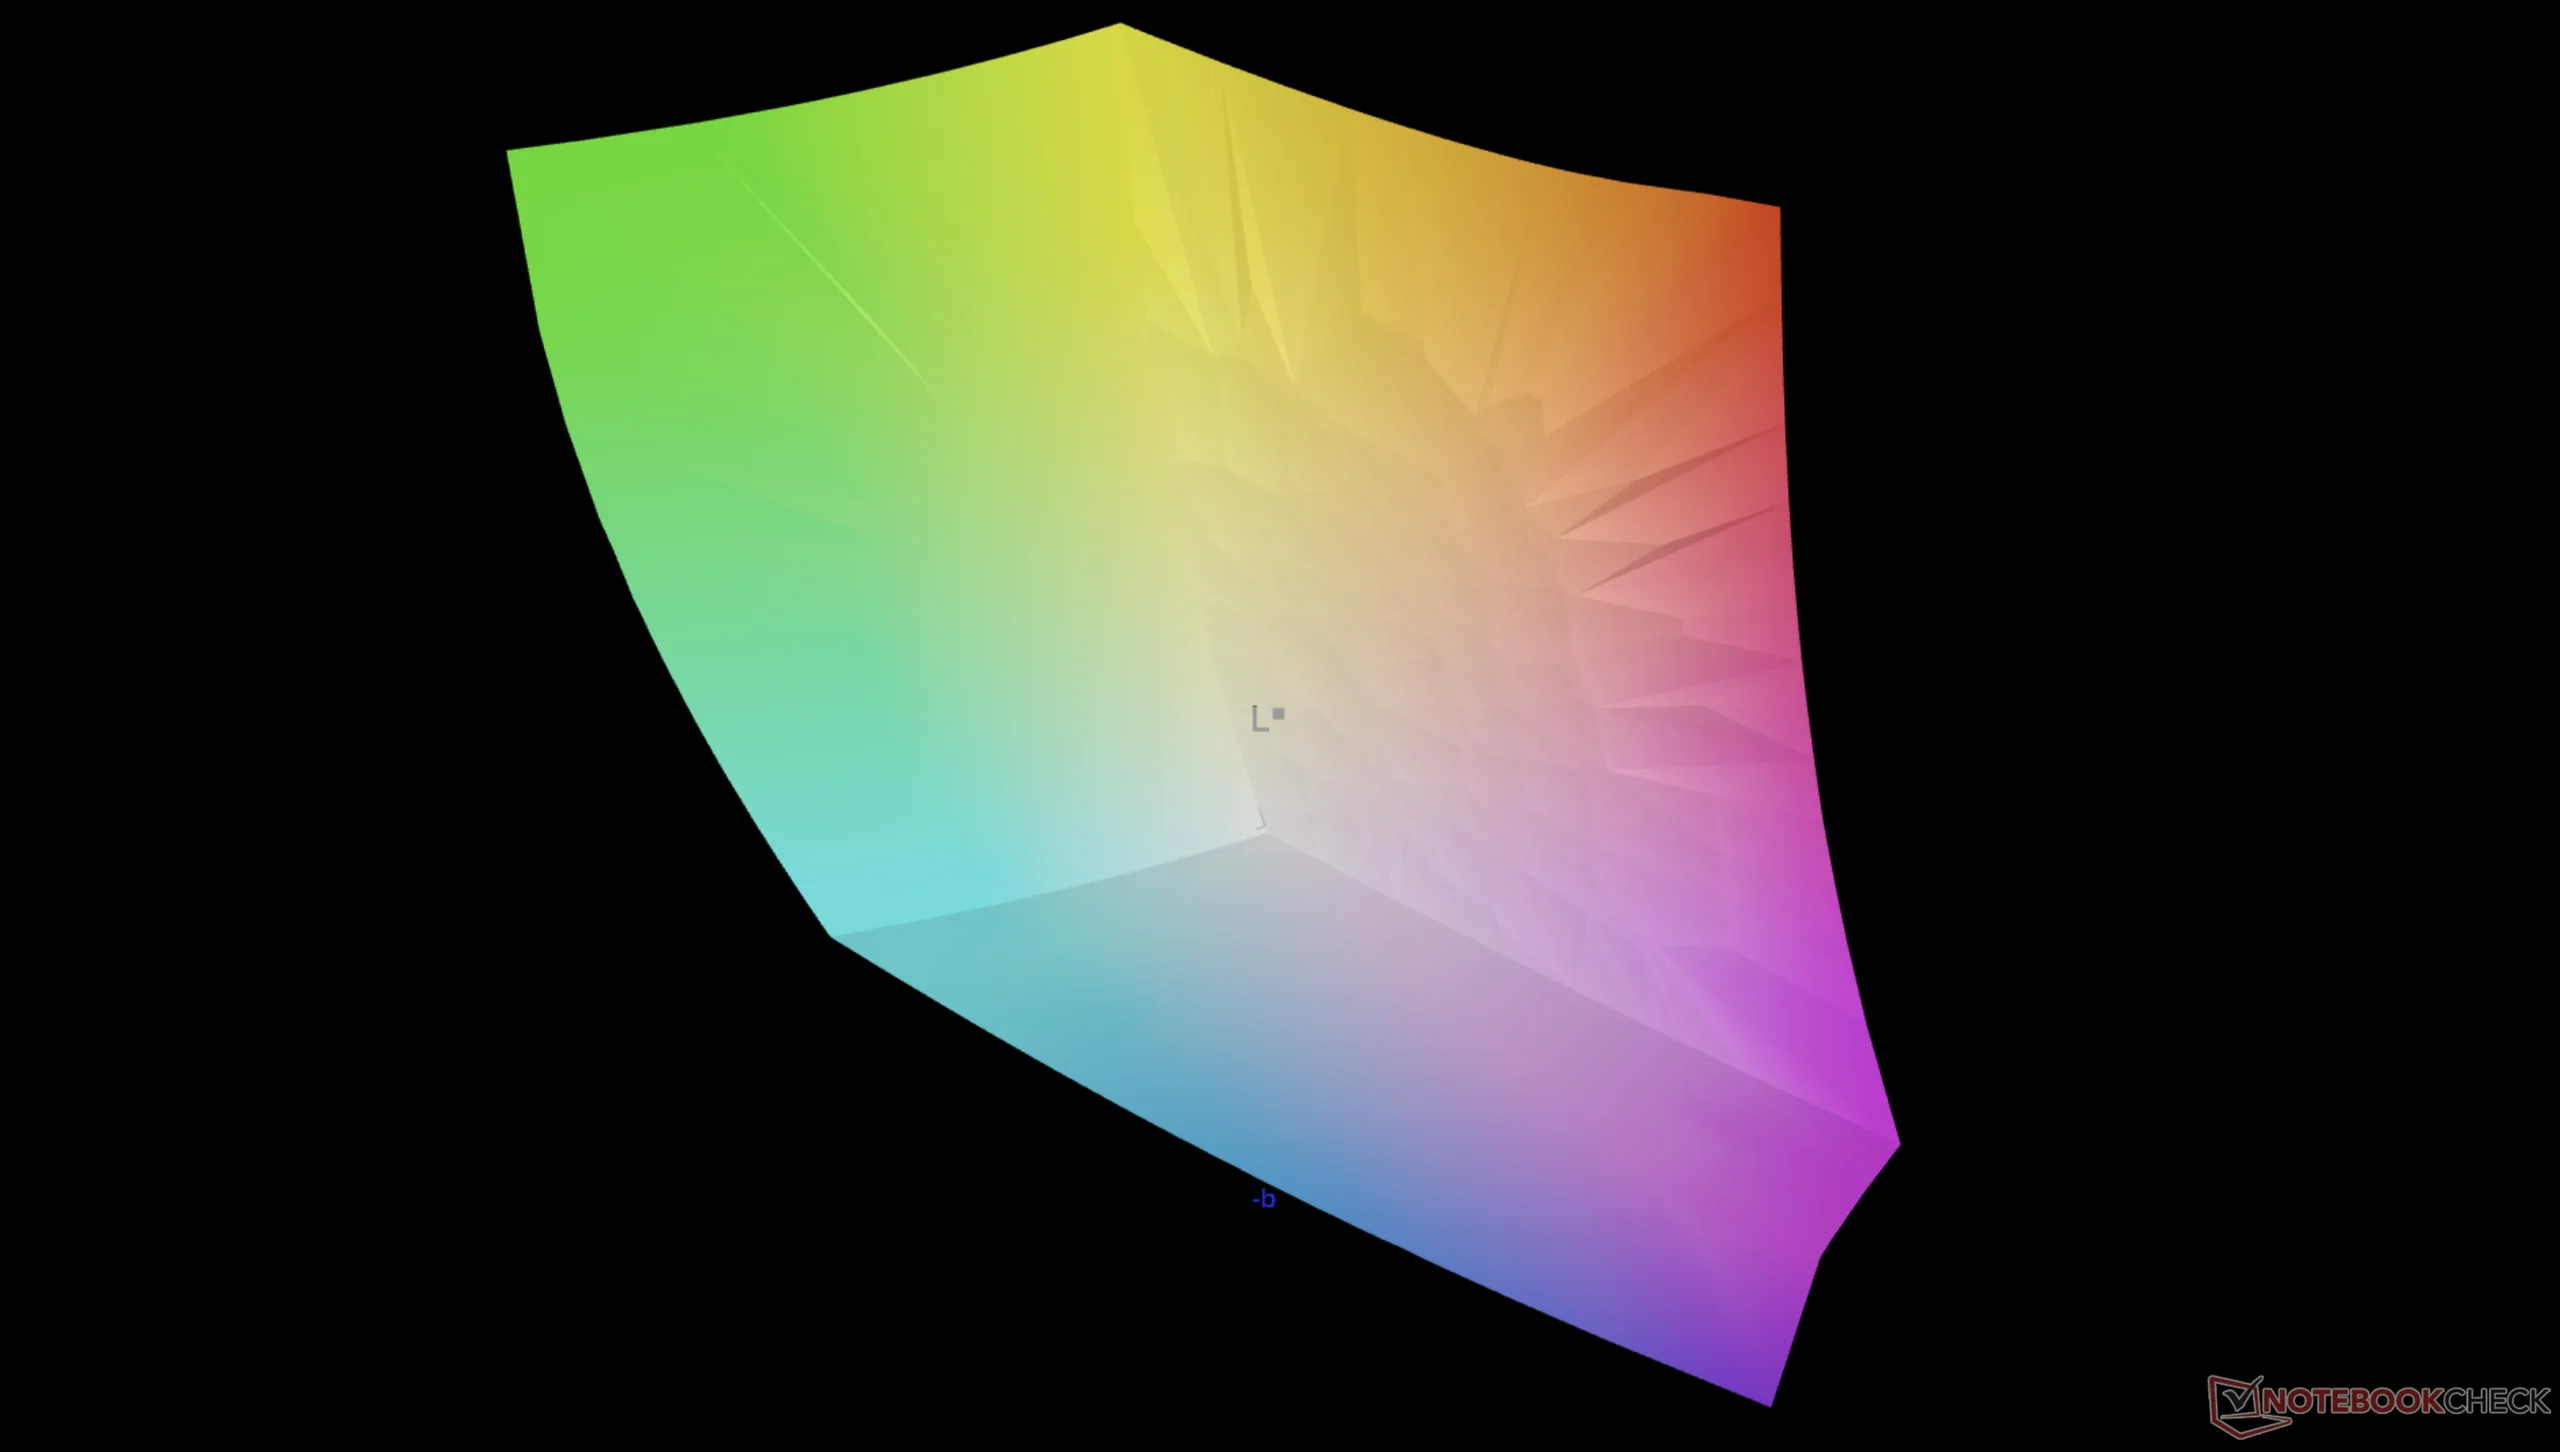
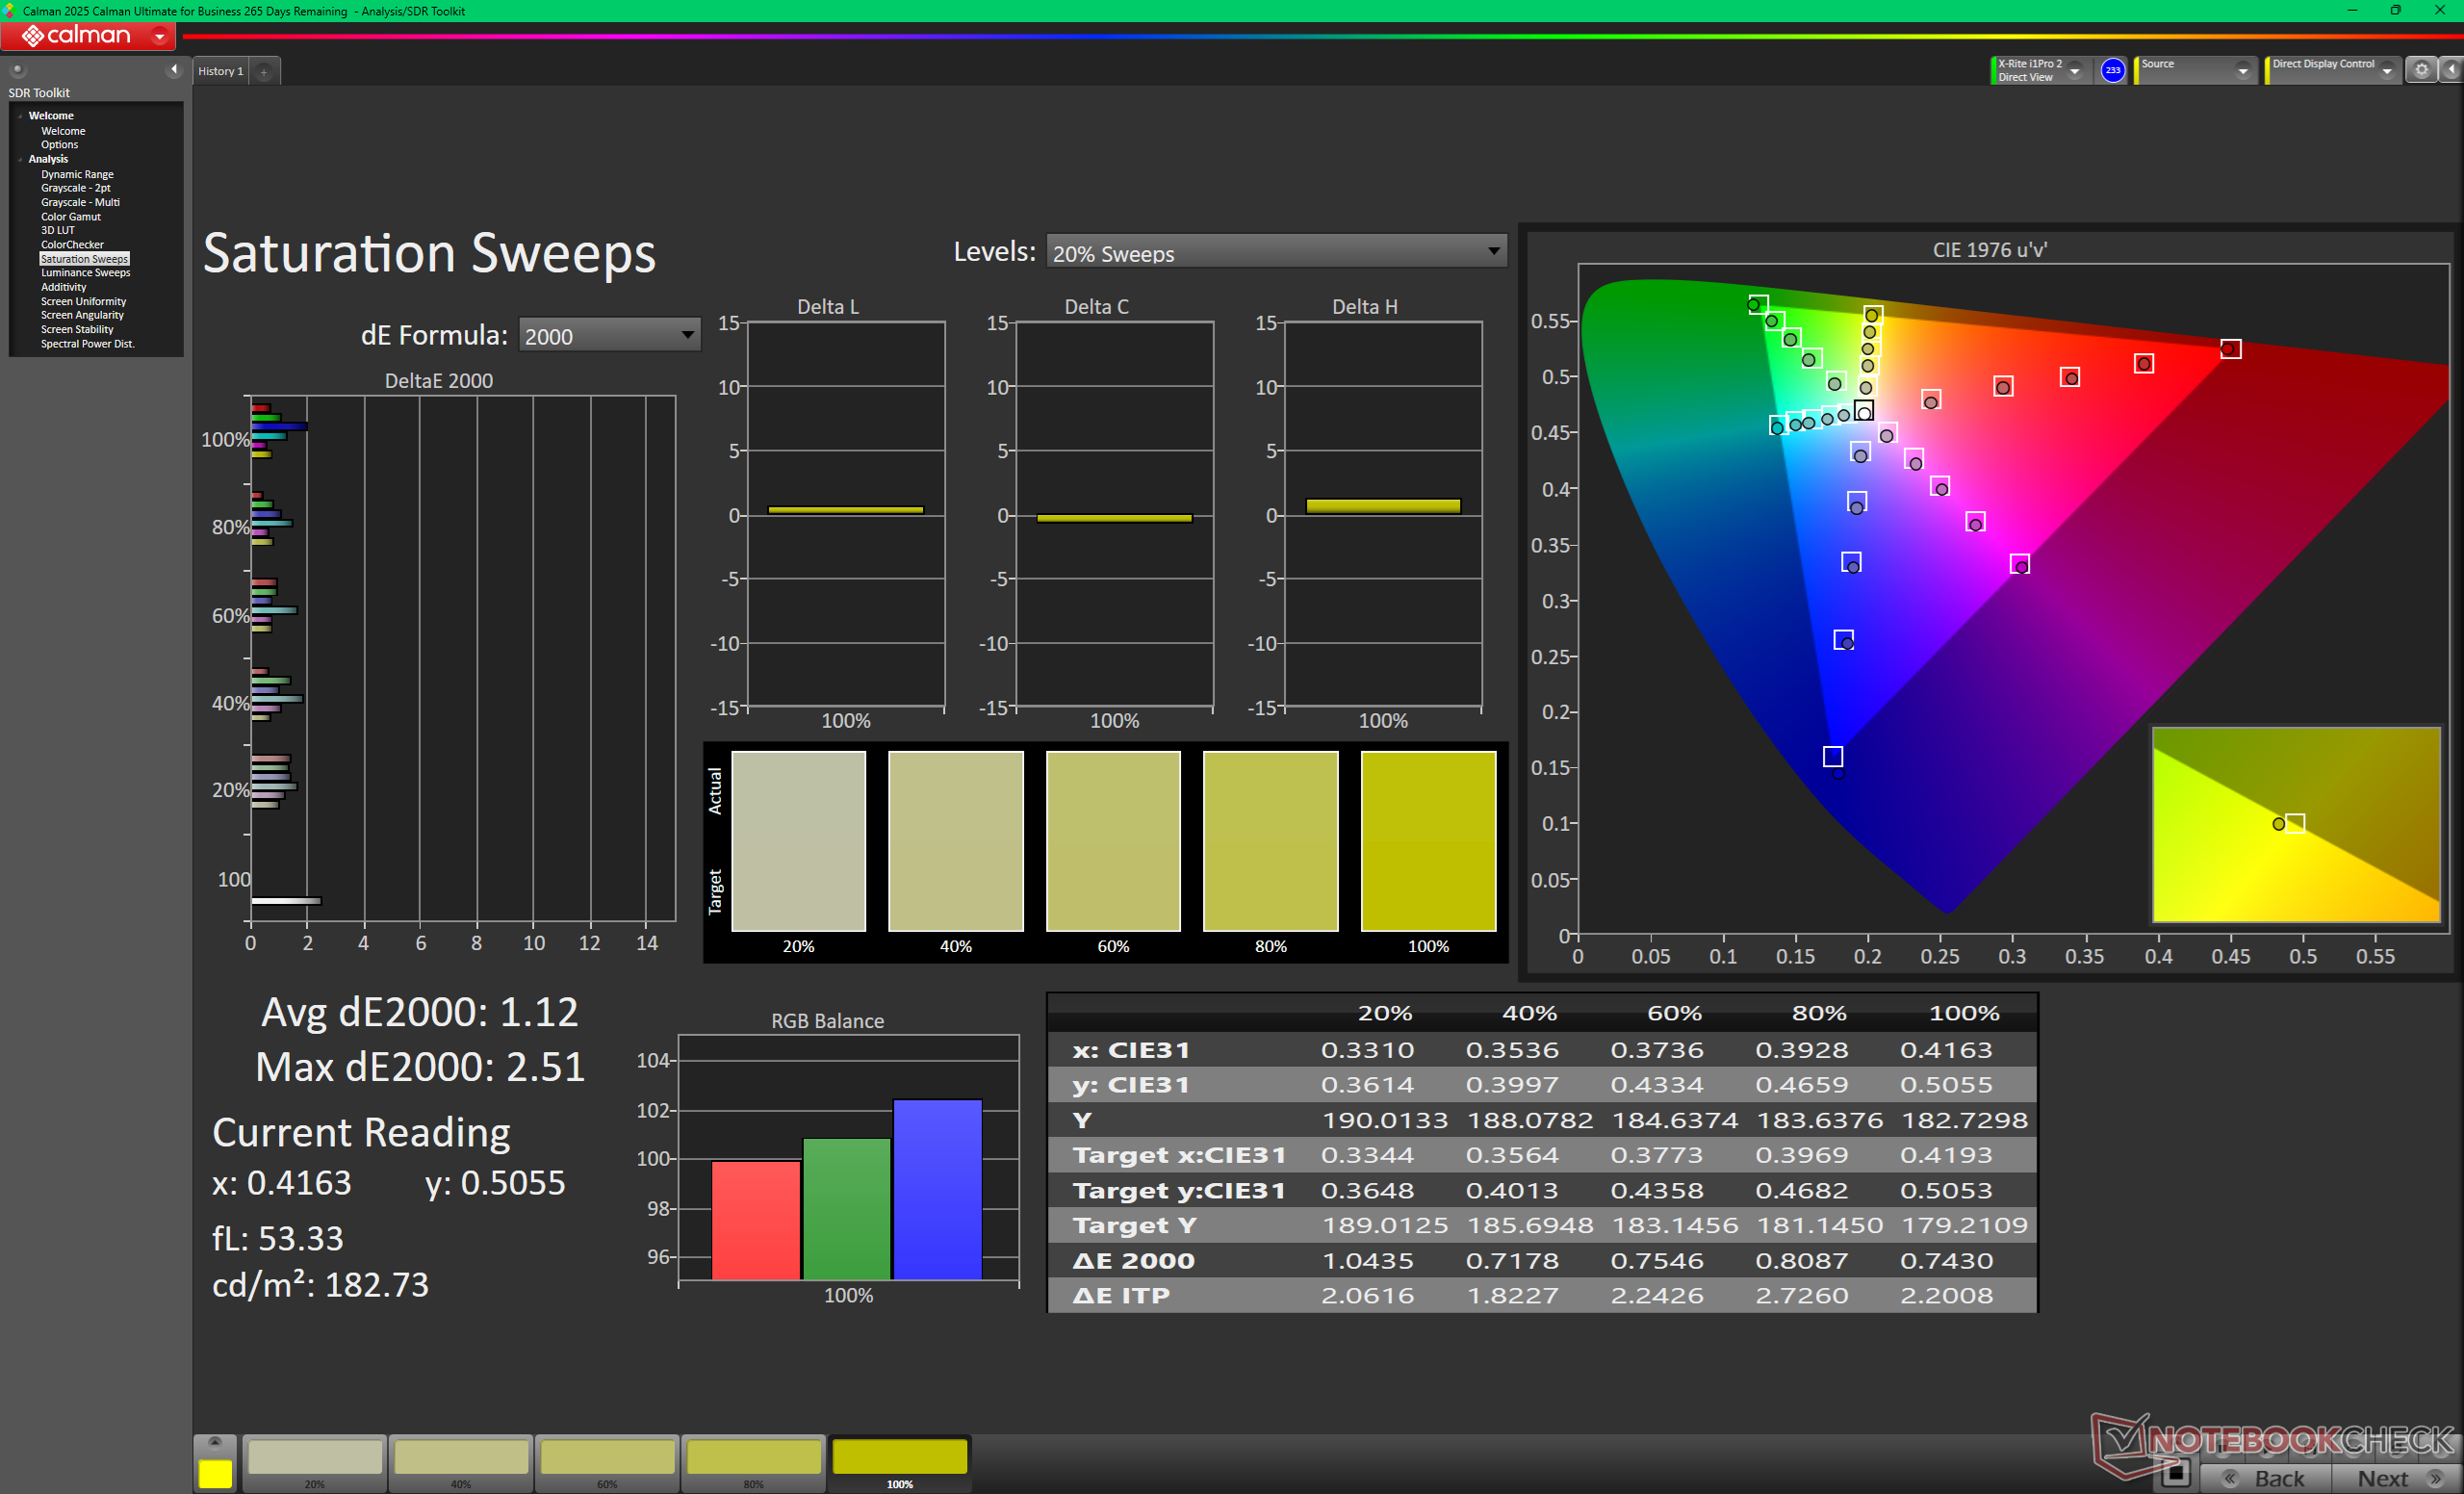
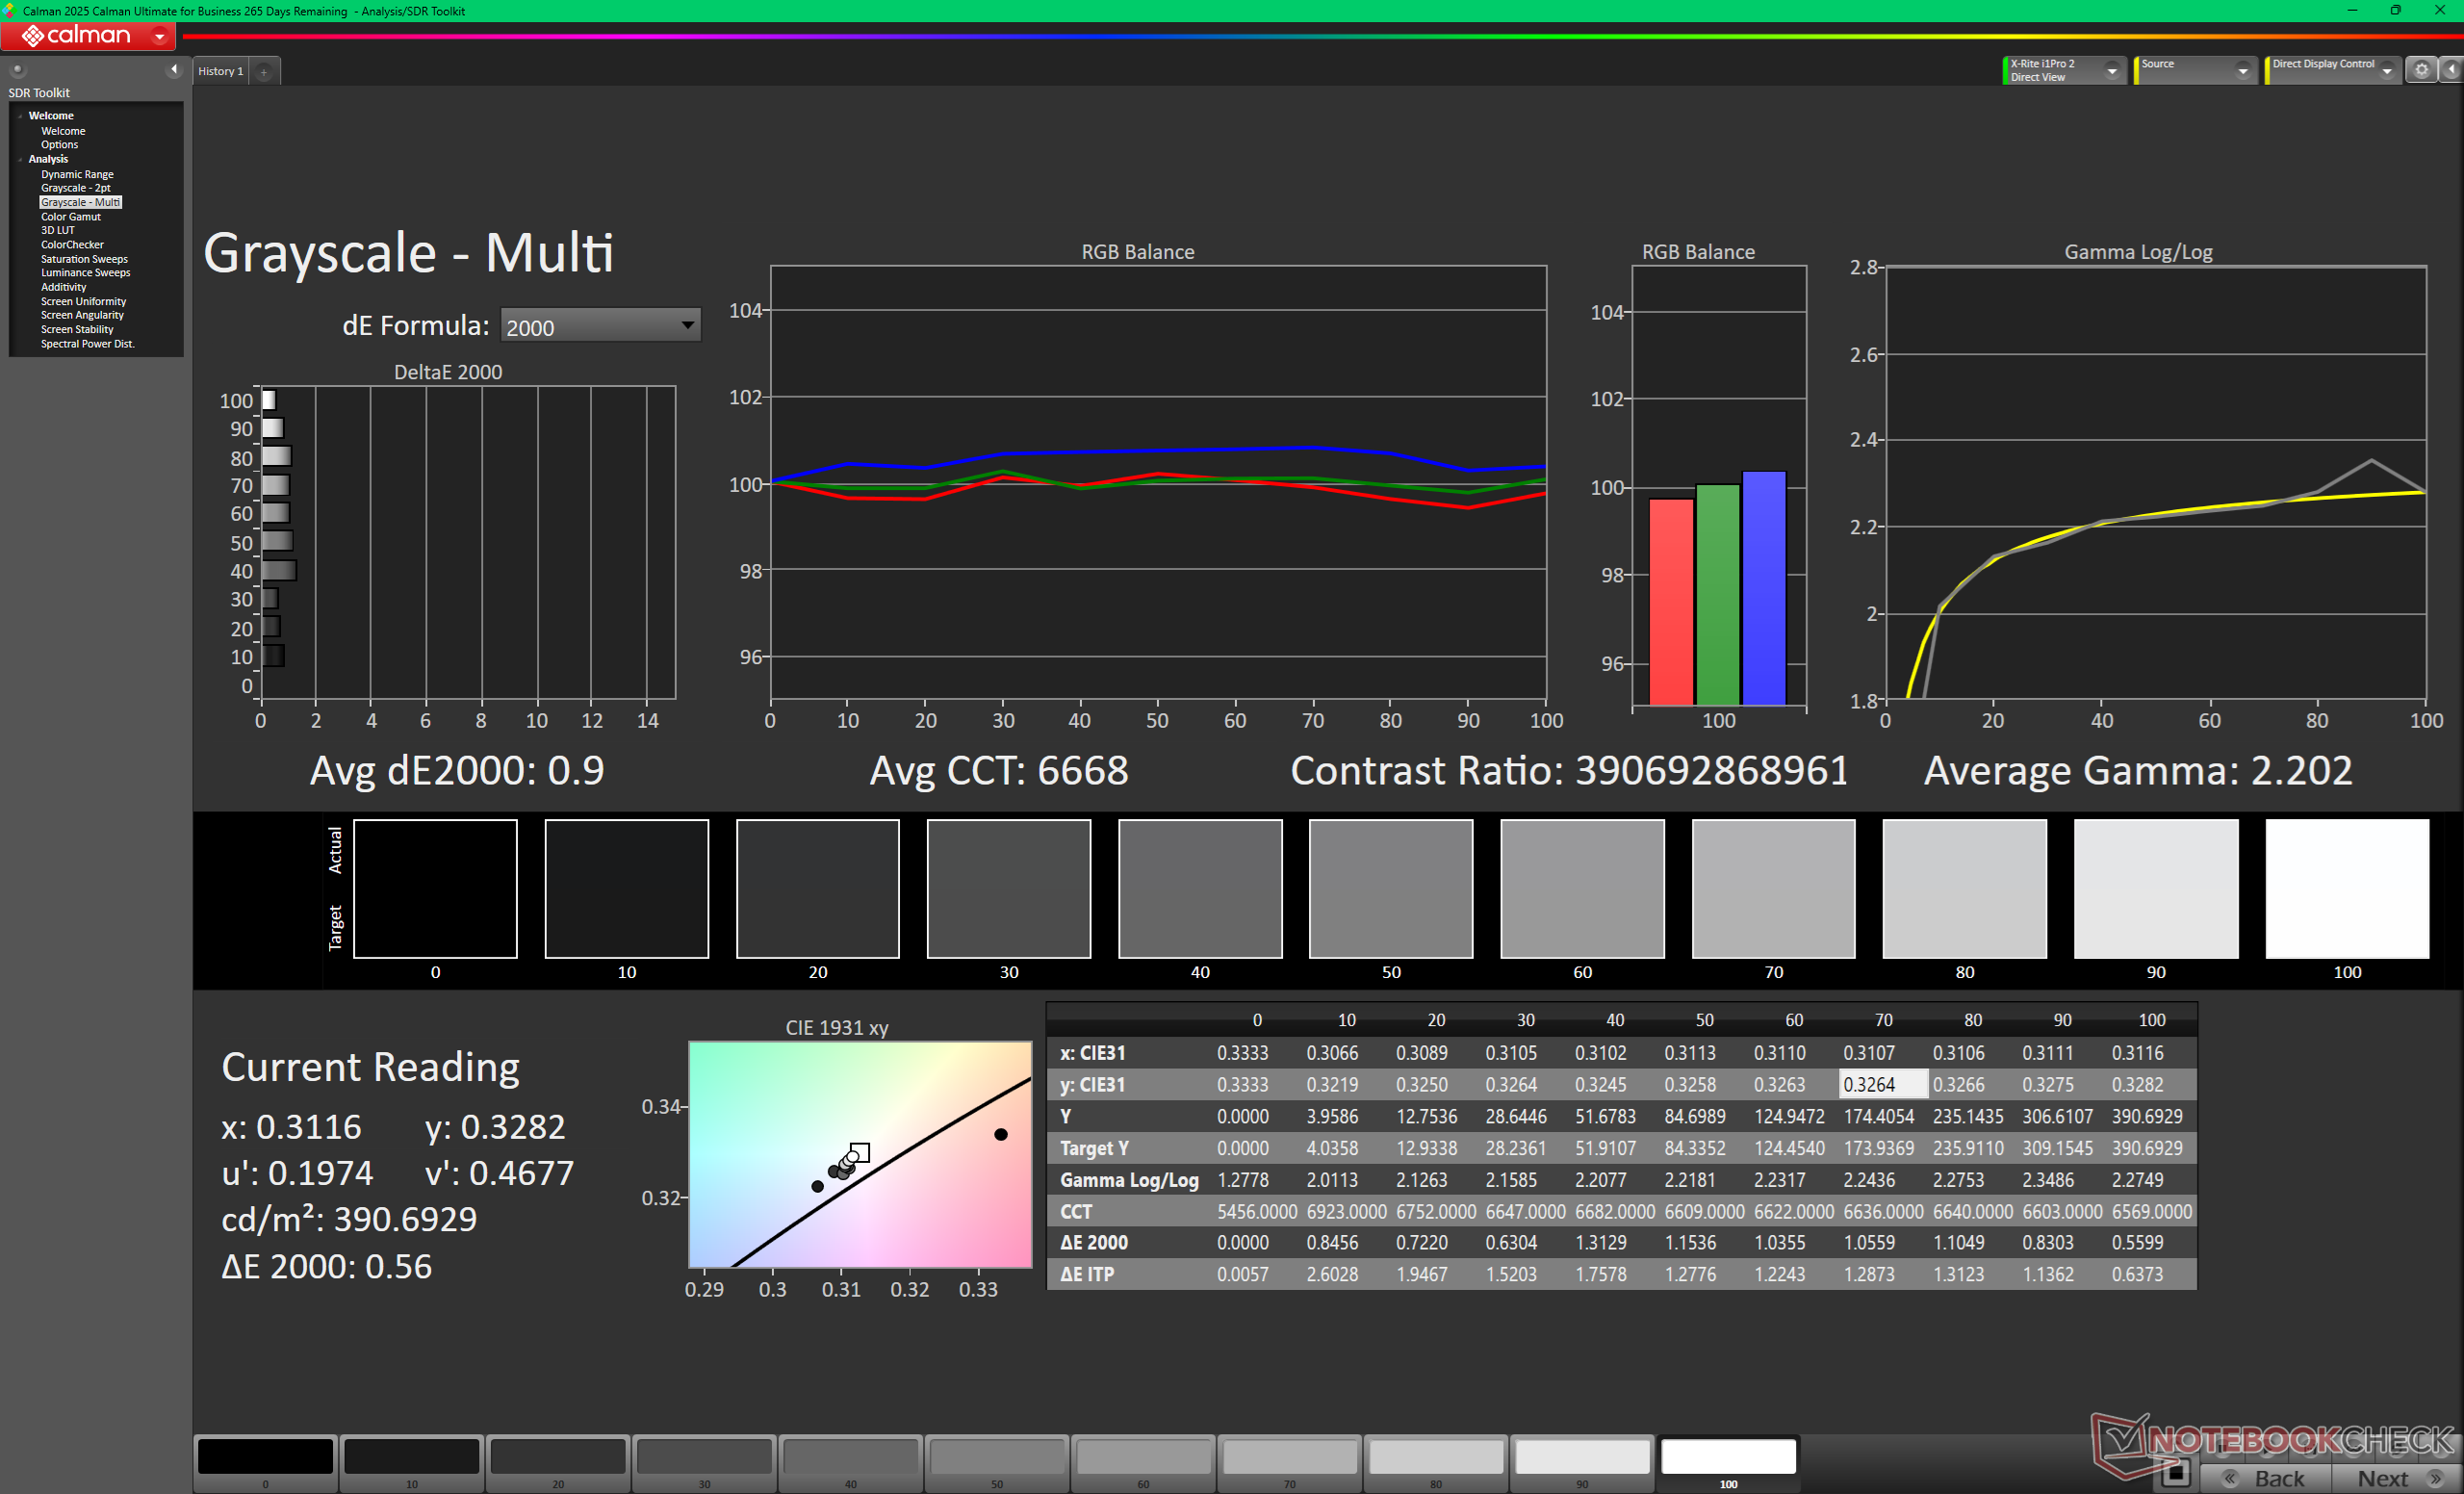
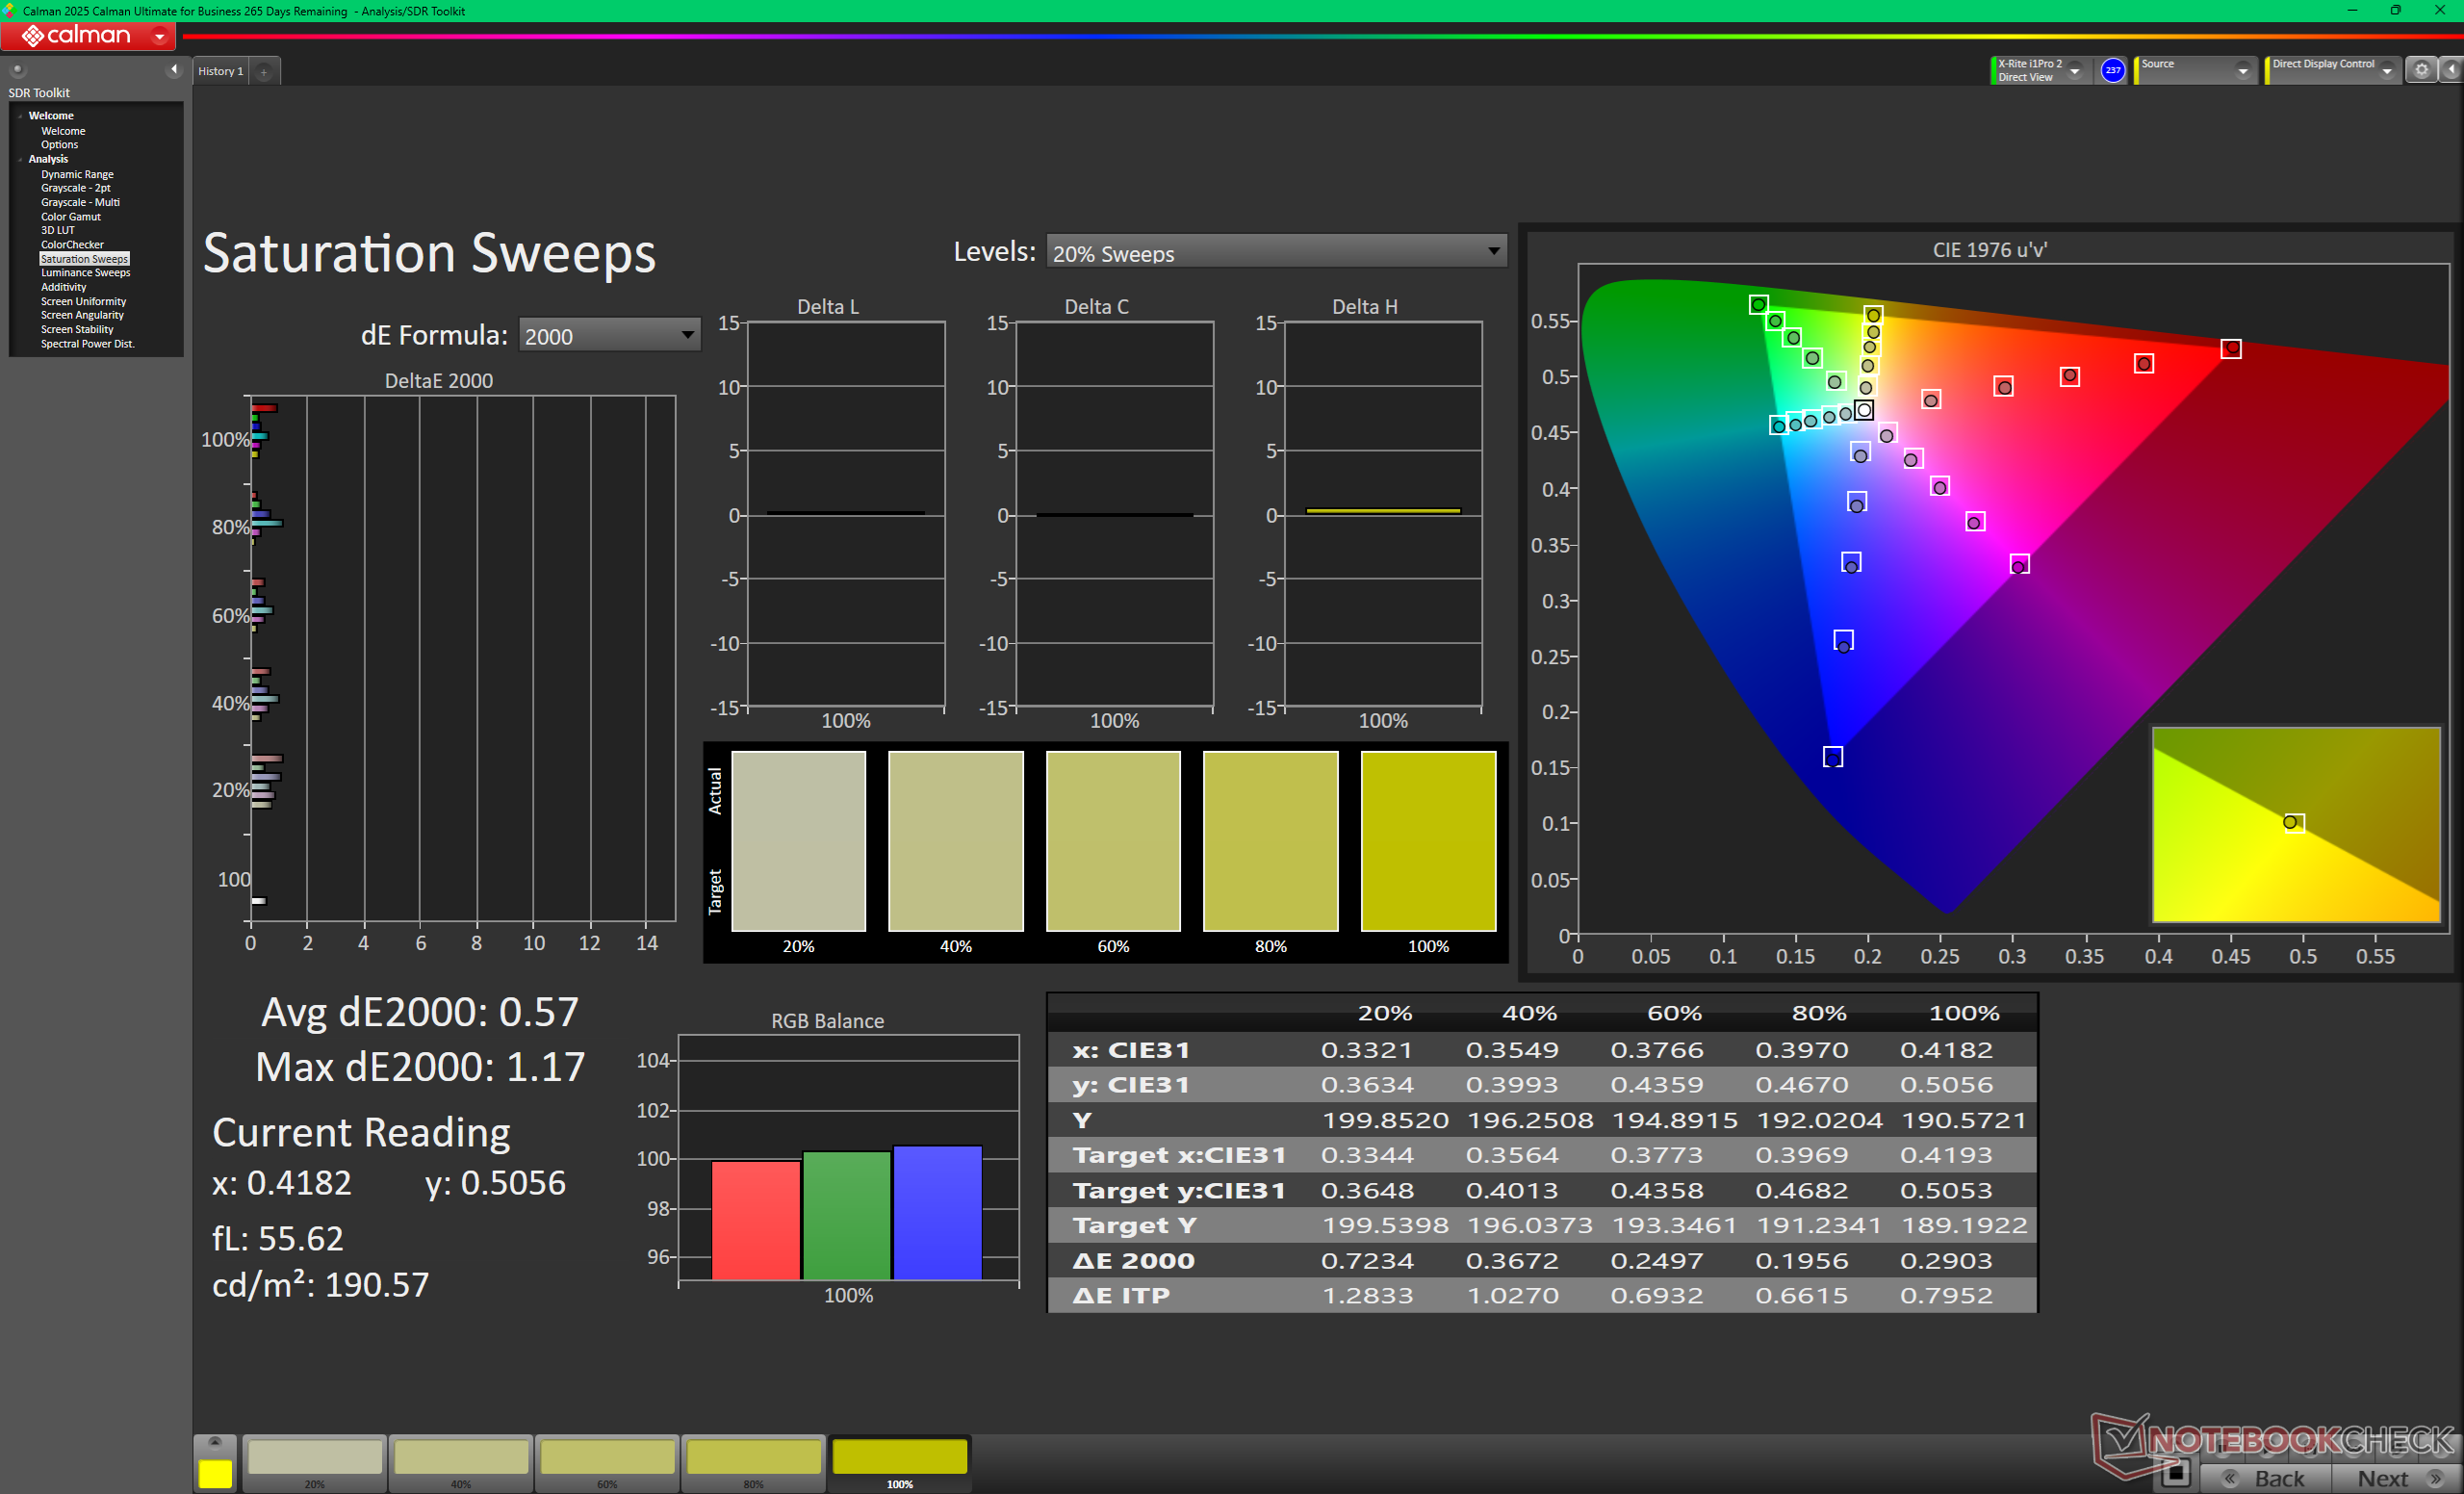
Das System ist auf sRGB voreingestellt und vorkalibriert, obwohl das OLED-Display volle P3-Farben unterstützt. Die durchschnittlichen Graustufen- und Farb-DeltaE-Werte sind bereits vor der Kalibrierung mit nur 1,9 bzw. 1,29 sehr genau.
Reaktionszeiten (Response Times) des Displays
| ↔ Reaktionszeiten Schwarz zu Weiß | ||
|---|---|---|
| 0.87 ms ... steigend ↗ und fallend ↘ kombiniert | ↗ 0.41 ms steigend | 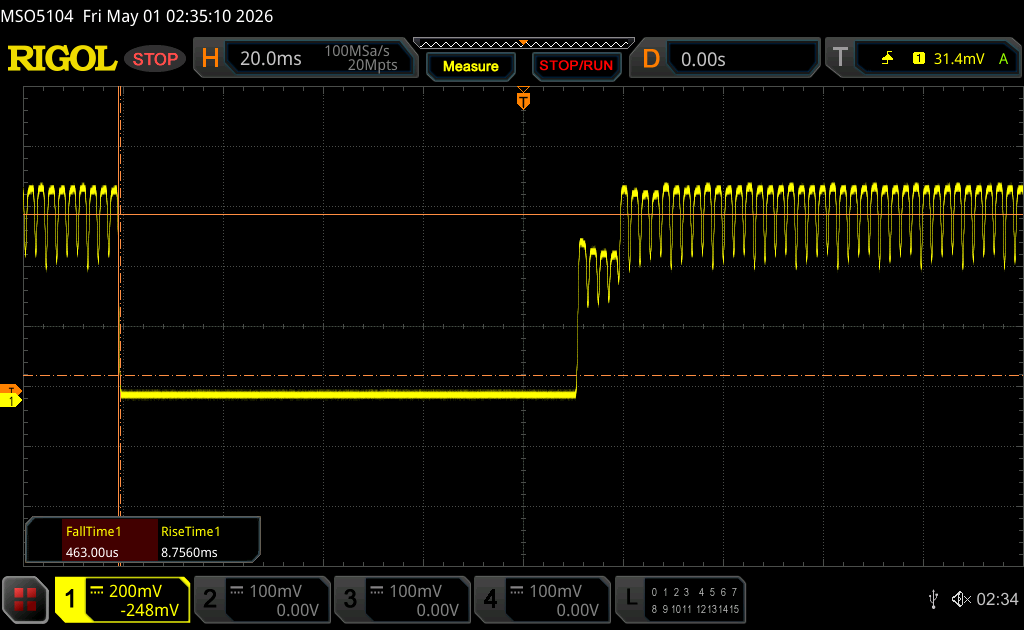 |
| ↘ 0.46 ms fallend | ||
| Die gemessenen Reaktionszeiten sind sehr kurz, wodurch sich der Bildschirm auch für schnelle 3D Spiele eignen sollte. Im Vergleich rangierten die bei uns getesteten Geräte von 0.1 (Minimum) zu 240 (Maximum) ms. » 3 % aller Screens waren schneller als der getestete. Daher sind die gemessenen Reaktionszeiten besser als der Durchschnitt aller vermessenen Geräte (19.9 ms). | ||
| ↔ Reaktionszeiten 50% Grau zu 80% Grau | ||
| 0.71 ms ... steigend ↗ und fallend ↘ kombiniert | ↗ 0.38 ms steigend | 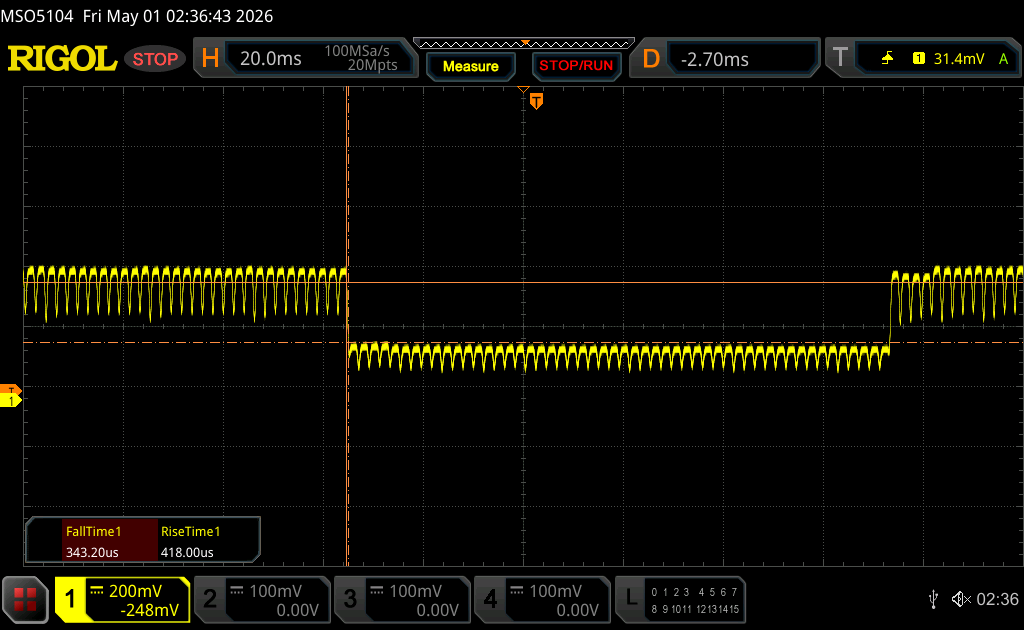 |
| ↘ 0.33 ms fallend | ||
| Die gemessenen Reaktionszeiten sind sehr kurz, wodurch sich der Bildschirm auch für schnelle 3D Spiele eignen sollte. Im Vergleich rangierten die bei uns getesteten Geräte von 0.165 (Minimum) zu 636 (Maximum) ms. » 2 % aller Screens waren schneller als der getestete. Daher sind die gemessenen Reaktionszeiten besser als der Durchschnitt aller vermessenen Geräte (31.1 ms). | ||
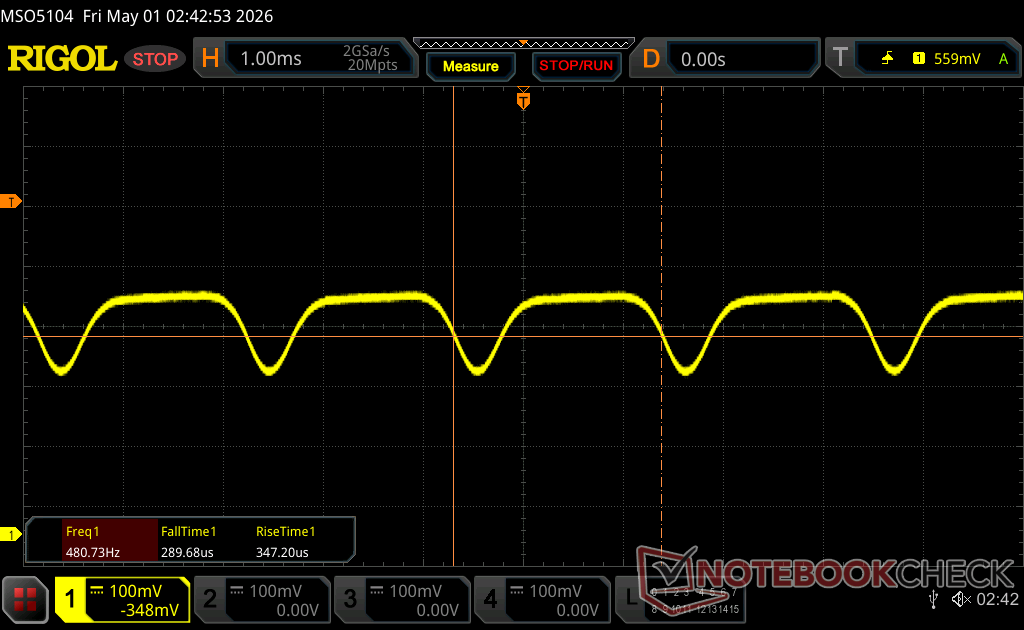
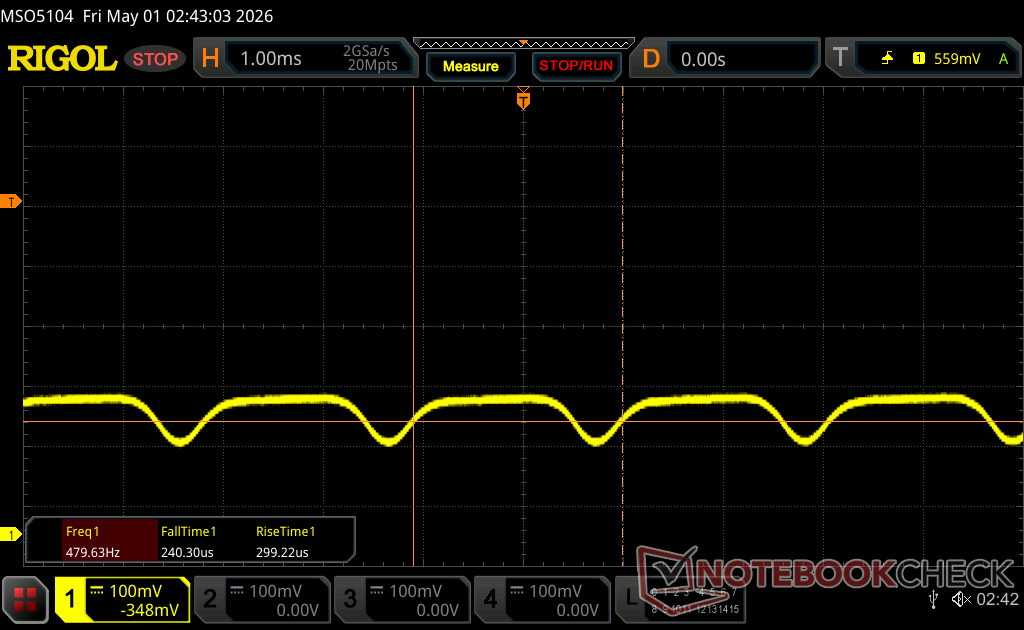
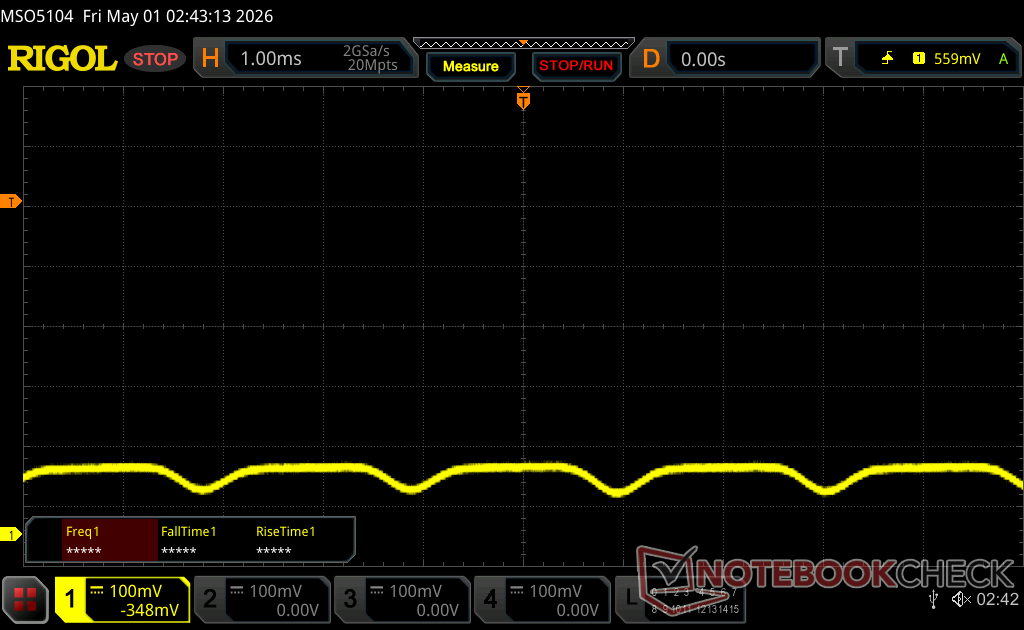
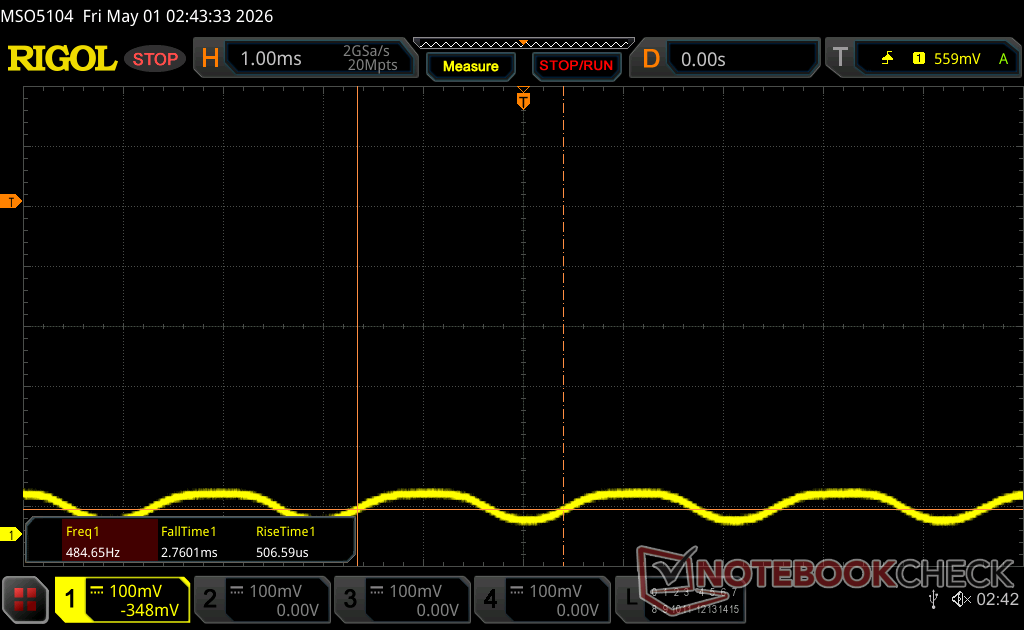
Bildschirm-Flackern / PWM (Pulse-Width Modulation)
| Flackern / PWM festgestellt | 460.46 Hz Amplitude: 18 % | ≤ 100 % Helligkeit | 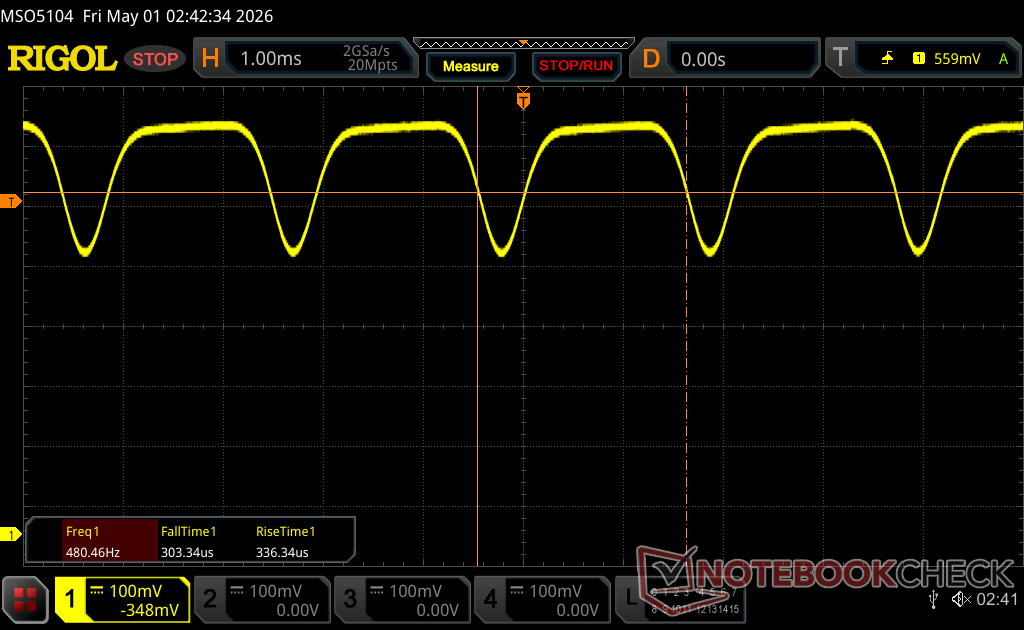 |
Das Display flackert mit 460.46 Hz (im schlimmsten Fall, eventuell durch Pulsweitenmodulation PWM) bei einer eingestellten Helligkeit von 100 % und darunter. Darüber sollte es zu keinem Flackern kommen. Die Frequenz von 460.46 Hz ist relativ hoch und sollte daher auch bei den meisten Personen zu keinen Problemen führen. Empfindliche User sollen laut Berichten aber sogar noch bei 500 Hz und darüber ein Flackern wahrnehmen. Im Vergleich: 52 % aller getesteten Geräte nutzten kein PWM um die Helligkeit zu reduzieren. Wenn PWM eingesetzt wurde, dann bei einer Frequenz von durchschnittlich 7798 (Minimum 5, Maximum 343500) Hz. | |||


Leistung
Testbedingungen
Wir haben MSI Center S und Windows auf den Modus Performance eingestellt, bevor wir die folgenden Benchmarks durchführten.
Prozessor
Der Core Ultra X7 358H bietet eine konstantere Leistung als der Core Ultra 9 285H im 2025 Prestige 16. Während Letzterer bis zu zehn Prozent schneller sein kann, wenn der Turbo Boost am effektivsten ist, ist das Gegenteil der Fall nach der anfänglichen Turbo-Boost-Phase. Dies wird deutlich, wenn man den CineBench R15 xT in einer Schleife laufen lässt. Der 2025 Prestige 16 ist nur während der ersten Minute oder so der schnellere Rechner, bevor unser 2026 Prestige 16 ihn danach überholt.
Die Aufrüstung auf den Core Ultra X9 388H dürfte die Multi-Thread-Leistung um bis zu zehn Prozent steigern, wie wir während unseres Tests des Asus ZenBook Duo UX8407AA festgestellt haben.
Cinebench R15 Mehrfachschleife
Cinebench R23: Multi Core | Single Core
Cinebench R20: CPU (Multi Core) | CPU (Single Core)
Cinebench R15: CPU Multi 64Bit | CPU Single 64Bit
Blender: v2.79 BMW27 CPU
7-Zip 18.03: 7z b 4 | 7z b 4 -mmt1
Geekbench 6.7: Multi-Core | Single-Core
Geekbench 5.5: Multi-Core | Single-Core
HWBOT x265 Benchmark v2.2: 4k Preset
LibreOffice : 20 Documents To PDF
R Benchmark 2.5: Overall mean
| Cinebench R20 / CPU (Multi Core) | |
| Dell 16 Premium DA16250 | |
| Lenovo Pro 9 16IPH11 | |
| MSI Prestige 16 AI Evo B2HMG | |
| Asus ZenBook Duo UX8407AA | |
| Durchschnittliche Intel Core Ultra X7 358H (6848 - 7749, n=8) | |
| Lenovo ThinkBook 16 G7+ AMD | |
| Dell XPS 16 Core Ultra X7 358H | |
| MSI Prestige 16 AI C3MTG | |
| Asus ZenBook S16 UM5606GA | |
| HP Envy x360 2-in-1 16-ad0097nr | |
| Acer TravelMate P4 TMP416-51-55KN | |
| Samsung Galaxy Book5 Pro 360 | |
| Cinebench R20 / CPU (Single Core) | |
| Asus ZenBook Duo UX8407AA | |
| MSI Prestige 16 AI Evo B2HMG | |
| Lenovo ThinkBook 16 G7+ AMD | |
| Lenovo Pro 9 16IPH11 | |
| MSI Prestige 16 AI C3MTG | |
| Durchschnittliche Intel Core Ultra X7 358H (767 - 792, n=8) | |
| Asus ZenBook S16 UM5606GA | |
| Dell XPS 16 Core Ultra X7 358H | |
| Dell 16 Premium DA16250 | |
| Samsung Galaxy Book5 Pro 360 | |
| HP Envy x360 2-in-1 16-ad0097nr | |
| Acer TravelMate P4 TMP416-51-55KN | |
| Cinebench R15 / CPU Single 64Bit | |
| MSI Prestige 16 AI Evo B2HMG | |
| Lenovo Pro 9 16IPH11 | |
| Lenovo ThinkBook 16 G7+ AMD | |
| Asus ZenBook Duo UX8407AA | |
| Dell XPS 16 Core Ultra X7 358H | |
| Durchschnittliche Intel Core Ultra X7 358H (286 - 312, n=8) | |
| Dell 16 Premium DA16250 | |
| MSI Prestige 16 AI C3MTG | |
| Samsung Galaxy Book5 Pro 360 | |
| HP Envy x360 2-in-1 16-ad0097nr | |
| Acer TravelMate P4 TMP416-51-55KN | |
| Asus ZenBook S16 UM5606GA | |
| Geekbench 6.7 / Multi-Core | |
| Asus ZenBook Duo UX8407AA | |
| Dell 16 Premium DA16250 | |
| MSI Prestige 16 AI Evo B2HMG | |
| Dell XPS 16 Core Ultra X7 358H | |
| Lenovo Pro 9 16IPH11 | |
| MSI Prestige 16 AI C3MTG | |
| Durchschnittliche Intel Core Ultra X7 358H (15698 - 17121, n=9) | |
| Asus ZenBook S16 UM5606GA | |
| Lenovo ThinkBook 16 G7+ AMD | |
| HP Envy x360 2-in-1 16-ad0097nr | |
| Samsung Galaxy Book5 Pro 360 | |
| Geekbench 6.7 / Single-Core | |
| Asus ZenBook Duo UX8407AA | |
| MSI Prestige 16 AI Evo B2HMG | |
| Dell XPS 16 Core Ultra X7 358H | |
| Lenovo Pro 9 16IPH11 | |
| Durchschnittliche Intel Core Ultra X7 358H (2818 - 2927, n=9) | |
| MSI Prestige 16 AI C3MTG | |
| Asus ZenBook S16 UM5606GA | |
| Dell 16 Premium DA16250 | |
| Lenovo ThinkBook 16 G7+ AMD | |
| Samsung Galaxy Book5 Pro 360 | |
| HP Envy x360 2-in-1 16-ad0097nr | |
| HWBOT x265 Benchmark v2.2 / 4k Preset | |
| Lenovo Pro 9 16IPH11 | |
| Asus ZenBook Duo UX8407AA | |
| MSI Prestige 16 AI Evo B2HMG | |
| Dell 16 Premium DA16250 | |
| Lenovo ThinkBook 16 G7+ AMD | |
| Durchschnittliche Intel Core Ultra X7 358H (19.5 - 23.1, n=8) | |
| Asus ZenBook S16 UM5606GA | |
| Dell XPS 16 Core Ultra X7 358H | |
| MSI Prestige 16 AI C3MTG | |
| HP Envy x360 2-in-1 16-ad0097nr | |
| Samsung Galaxy Book5 Pro 360 | |
| Acer TravelMate P4 TMP416-51-55KN | |
| LibreOffice / 20 Documents To PDF | |
| Asus ZenBook S16 UM5606GA | |
| Lenovo ThinkBook 16 G7+ AMD | |
| Acer TravelMate P4 TMP416-51-55KN | |
| HP Envy x360 2-in-1 16-ad0097nr | |
| Dell XPS 16 Core Ultra X7 358H | |
| Durchschnittliche Intel Core Ultra X7 358H (38.5 - 56.9, n=8) | |
| MSI Prestige 16 AI C3MTG | |
| Samsung Galaxy Book5 Pro 360 | |
| MSI Prestige 16 AI Evo B2HMG | |
| Asus ZenBook Duo UX8407AA | |
| Dell 16 Premium DA16250 | |
| Lenovo Pro 9 16IPH11 | |
* ... kleinere Werte sind besser
AIDA64: FP32 Ray-Trace | FPU Julia | CPU SHA3 | CPU Queen | FPU SinJulia | FPU Mandel | CPU AES | CPU ZLib | FP64 Ray-Trace | CPU PhotoWorxx | CPU CheckMate
| Performance Rating | |
| Asus ZenBook S16 UM5606GA -1! | |
| Lenovo ThinkBook 16 G7+ AMD -1! | |
| Dell XPS 16 Core Ultra X7 358H -1! | |
| HP Envy x360 2-in-1 16-ad0097nr -1! | |
| MSI Prestige 16 AI C3MTG -1! | |
| MSI Prestige 16 AI Evo B2HMG -1! | |
| Durchschnittliche Intel Core Ultra X7 358H | |
| AIDA64 / FP32 Ray-Trace | |
| Lenovo ThinkBook 16 G7+ AMD (v6.92.6600) | |
| Asus ZenBook S16 UM5606GA (v6.92.6600) | |
| HP Envy x360 2-in-1 16-ad0097nr (v6.92.6600) | |
| MSI Prestige 16 AI Evo B2HMG (v6.92.6600) | |
| MSI Prestige 16 AI C3MTG (v8.20.8100) | |
| Dell XPS 16 Core Ultra X7 358H (v8.20.8100) | |
| Durchschnittliche Intel Core Ultra X7 358H (12221 - 17932, n=8) | |
| AIDA64 / FPU Julia | |
| Lenovo ThinkBook 16 G7+ AMD (v6.92.6600) | |
| Asus ZenBook S16 UM5606GA (v6.92.6600) | |
| MSI Prestige 16 AI Evo B2HMG (v6.92.6600) | |
| HP Envy x360 2-in-1 16-ad0097nr (v6.92.6600) | |
| MSI Prestige 16 AI C3MTG (v8.20.8100) | |
| Dell XPS 16 Core Ultra X7 358H (v8.20.8100) | |
| Durchschnittliche Intel Core Ultra X7 358H (29930 - 95525, n=8) | |
| AIDA64 / CPU SHA3 | |
| Lenovo ThinkBook 16 G7+ AMD (v6.92.6600) | |
| Asus ZenBook S16 UM5606GA (v6.92.6600) | |
| Durchschnittliche Intel Core Ultra X7 358H (3910 - 4911, n=8) | |
| MSI Prestige 16 AI Evo B2HMG (v6.92.6600) | |
| Dell XPS 16 Core Ultra X7 358H (v8.20.8100) | |
| MSI Prestige 16 AI C3MTG (v8.20.8100) | |
| HP Envy x360 2-in-1 16-ad0097nr (v6.92.6600) | |
| AIDA64 / CPU Queen | |
| HP Envy x360 2-in-1 16-ad0097nr (v6.92.6600) | |
| Asus ZenBook S16 UM5606GA (v6.92.6600) | |
| Lenovo ThinkBook 16 G7+ AMD (v6.92.6600) | |
| MSI Prestige 16 AI Evo B2HMG (v6.92.6600) | |
| Durchschnittliche Intel Core Ultra X7 358H (63425 - 63827, n=2) | |
| AIDA64 / FPU SinJulia | |
| Lenovo ThinkBook 16 G7+ AMD (v6.92.6600) | |
| Asus ZenBook S16 UM5606GA (v6.92.6600) | |
| HP Envy x360 2-in-1 16-ad0097nr (v6.92.6600) | |
| MSI Prestige 16 AI Evo B2HMG (v6.92.6600) | |
| Dell XPS 16 Core Ultra X7 358H (v8.20.8100) | |
| MSI Prestige 16 AI C3MTG (v8.20.8100) | |
| Durchschnittliche Intel Core Ultra X7 358H (4735 - 7038, n=8) | |
| AIDA64 / FPU Mandel | |
| Lenovo ThinkBook 16 G7+ AMD (v6.92.6600) | |
| Asus ZenBook S16 UM5606GA (v6.92.6600) | |
| MSI Prestige 16 AI Evo B2HMG (v6.92.6600) | |
| HP Envy x360 2-in-1 16-ad0097nr (v6.92.6600) | |
| Dell XPS 16 Core Ultra X7 358H (v8.20.8100) | |
| MSI Prestige 16 AI C3MTG (v8.20.8100) | |
| Durchschnittliche Intel Core Ultra X7 358H (14716 - 50734, n=8) | |
| AIDA64 / CPU AES | |
| Asus ZenBook S16 UM5606GA (v6.92.6600) | |
| HP Envy x360 2-in-1 16-ad0097nr (v6.92.6600) | |
| Lenovo ThinkBook 16 G7+ AMD (v6.92.6600) | |
| MSI Prestige 16 AI Evo B2HMG (v6.92.6600) | |
| MSI Prestige 16 AI C3MTG (v8.20.8100) | |
| Dell XPS 16 Core Ultra X7 358H (v8.20.8100) | |
| Durchschnittliche Intel Core Ultra X7 358H (5127 - 67510, n=8) | |
| AIDA64 / CPU ZLib | |
| Lenovo ThinkBook 16 G7+ AMD (v6.92.6600) | |
| Asus ZenBook S16 UM5606GA (v6.92.6600) | |
| Durchschnittliche Intel Core Ultra X7 358H (932 - 1179, n=8) | |
| MSI Prestige 16 AI Evo B2HMG (v6.92.6600) | |
| MSI Prestige 16 AI C3MTG (v8.20.8100) | |
| Dell XPS 16 Core Ultra X7 358H (v8.20.8100) | |
| HP Envy x360 2-in-1 16-ad0097nr (v6.92.6600) | |
| AIDA64 / FP64 Ray-Trace | |
| Lenovo ThinkBook 16 G7+ AMD (v6.92.6600) | |
| Asus ZenBook S16 UM5606GA (v6.92.6600) | |
| HP Envy x360 2-in-1 16-ad0097nr (v6.92.6600) | |
| MSI Prestige 16 AI Evo B2HMG (v6.92.6600) | |
| MSI Prestige 16 AI C3MTG (v8.20.8100) | |
| Dell XPS 16 Core Ultra X7 358H (v8.20.8100) | |
| Durchschnittliche Intel Core Ultra X7 358H (6506 - 9447, n=8) | |
| AIDA64 / CPU PhotoWorxx | |
| Dell XPS 16 Core Ultra X7 358H (v8.20.8100) | |
| MSI Prestige 16 AI C3MTG (v8.20.8100) | |
| Durchschnittliche Intel Core Ultra X7 358H (30538 - 88154, n=8) | |
| MSI Prestige 16 AI Evo B2HMG (v6.92.6600) | |
| Asus ZenBook S16 UM5606GA (v6.92.6600) | |
| Lenovo ThinkBook 16 G7+ AMD (v6.92.6600) | |
| HP Envy x360 2-in-1 16-ad0097nr (v6.92.6600) | |
| AIDA64 / CPU CheckMate | |
| Durchschnittliche Intel Core Ultra X7 358H (4187 - 4475, n=7) | |
| Dell XPS 16 Core Ultra X7 358H (v8.20.8100) | |
| MSI Prestige 16 AI C3MTG (v8.20.8100) | |
Systemleistung
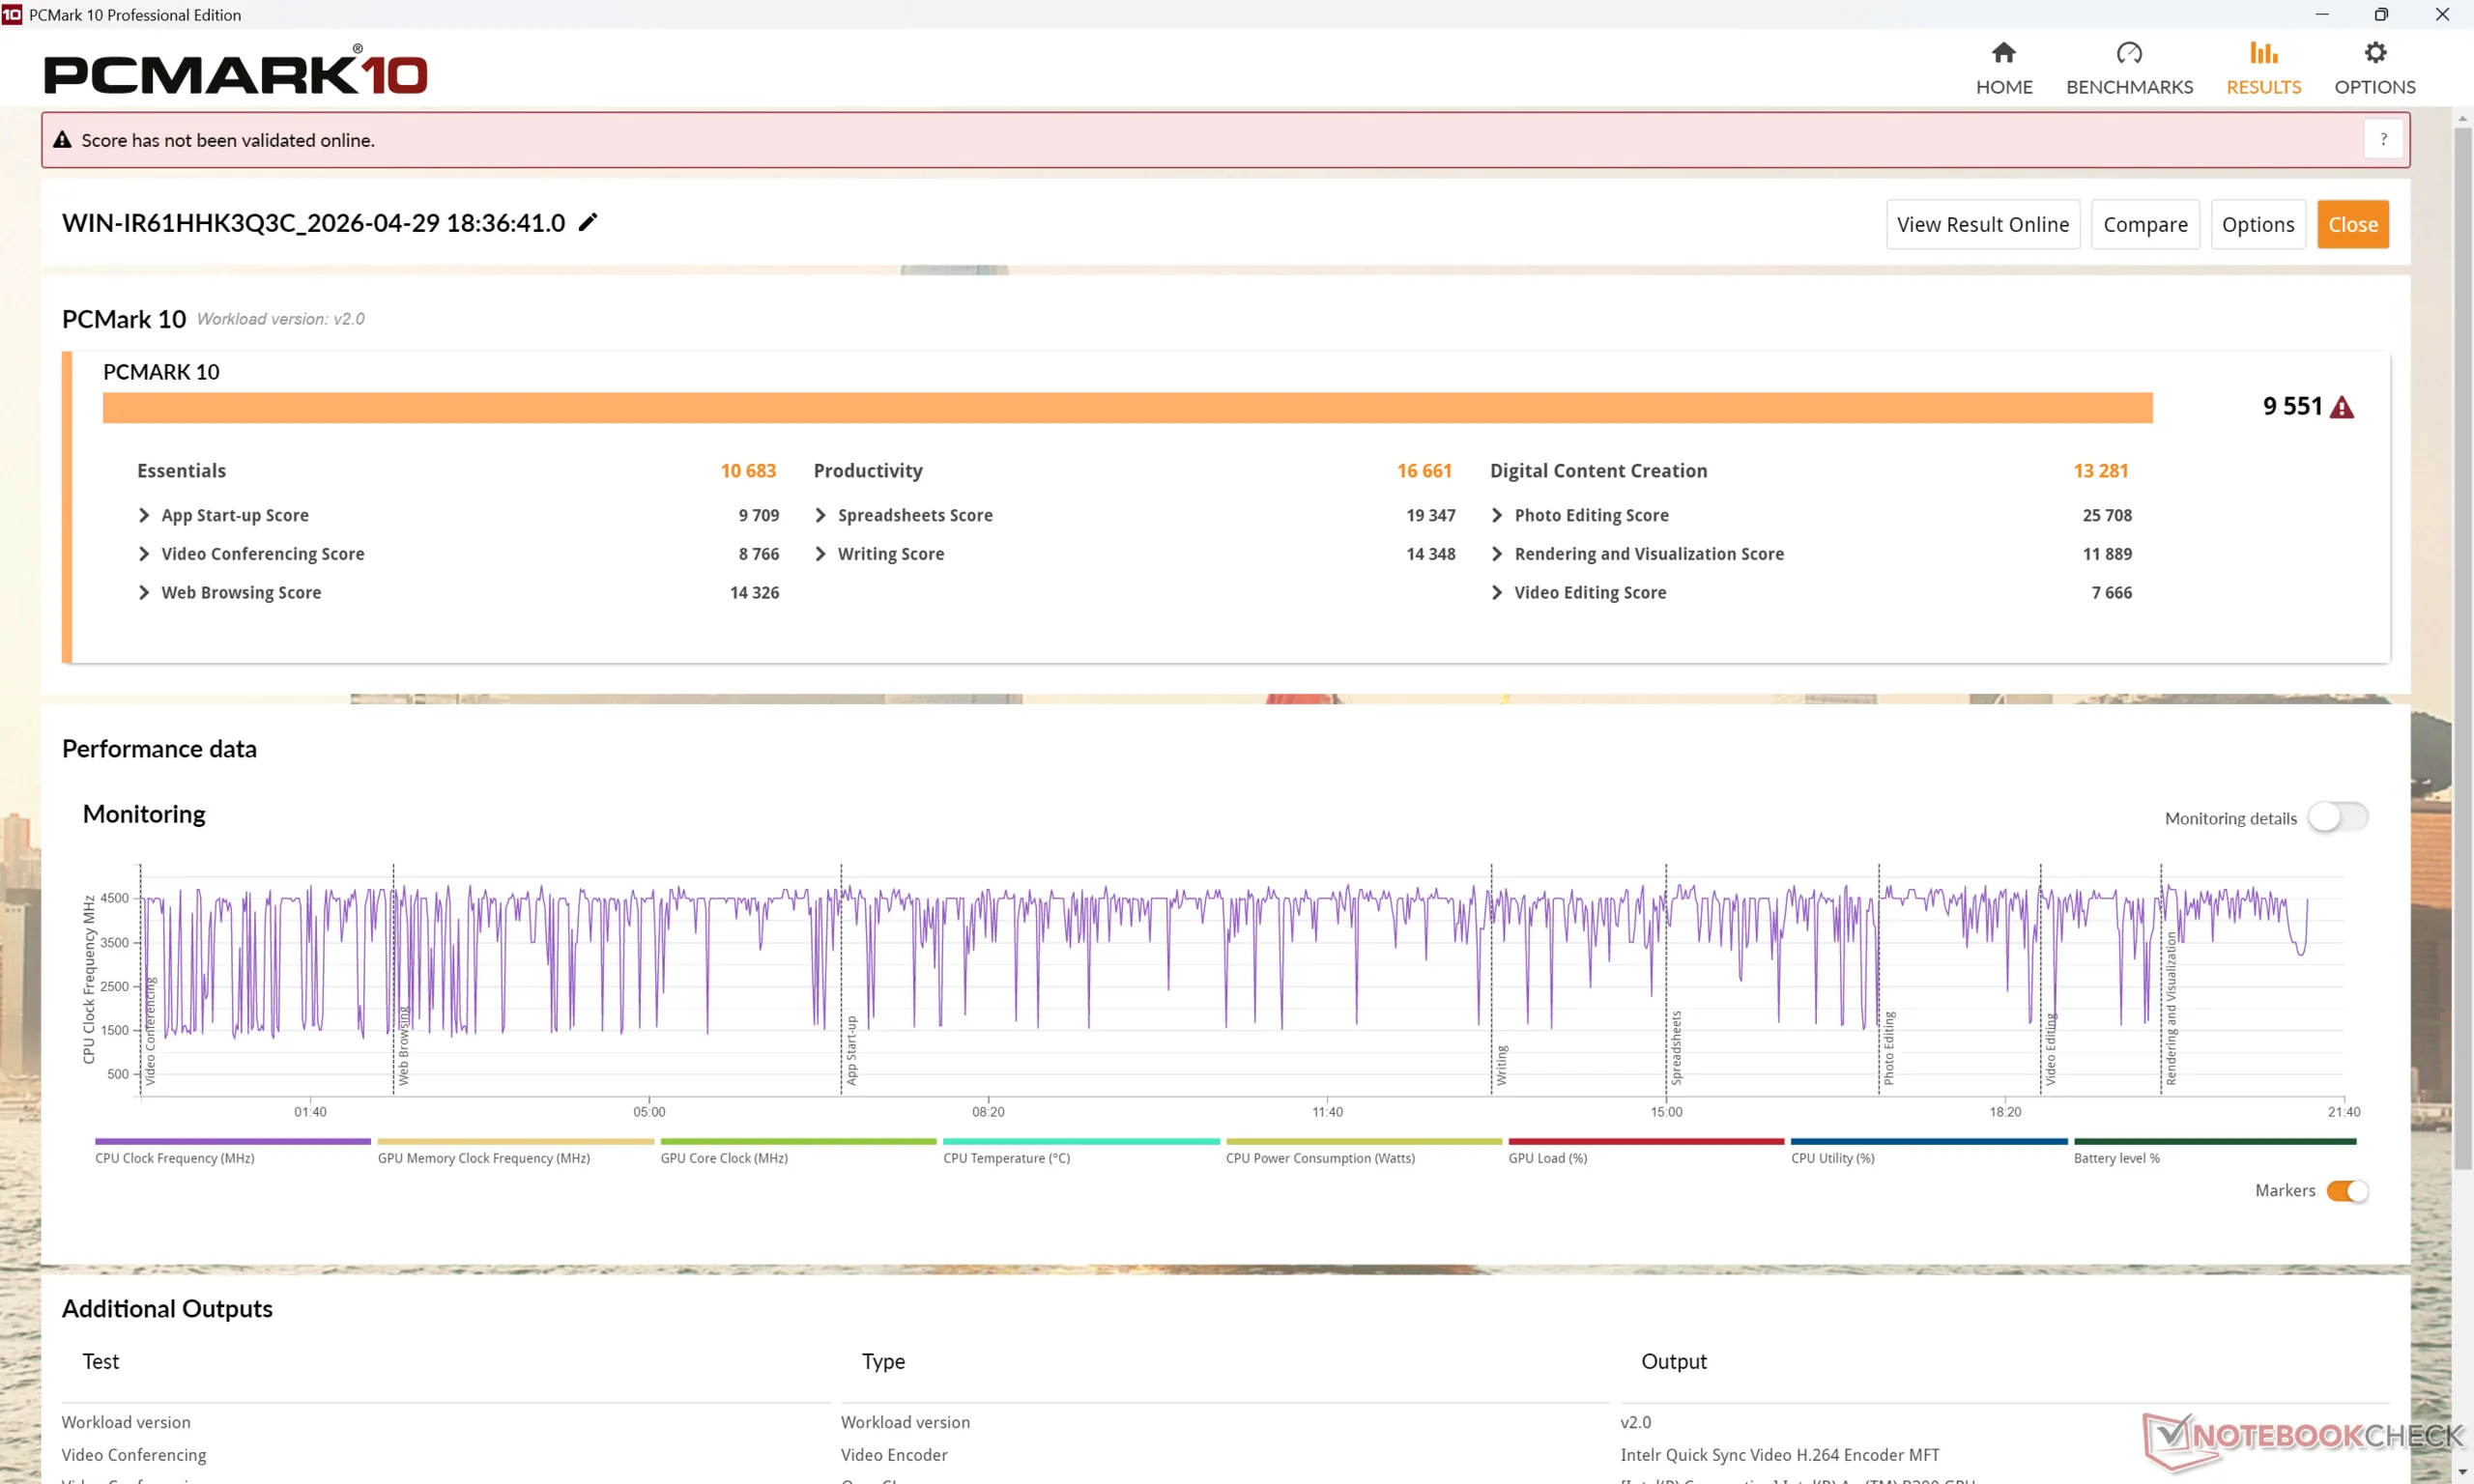
PCMark 10: Score | Essentials | Productivity | Digital Content Creation
CrossMark: Overall | Productivity | Creativity | Responsiveness
WebXPRT 3: Overall
WebXPRT 4: Overall
Mozilla Kraken 1.1: Total
Geekbench AI: Quantized GPU 1.7 | Half Precision GPU 1.7 | Single Precision GPU 1.7
| Performance Rating | |
| Dell XPS 16 Core Ultra X7 358H | |
| MSI Prestige 16 AI C3MTG | |
| Durchschnittliche Intel Core Ultra X7 358H, Intel Arc B390 12 Xe3 Panther Lake iGPU | |
| MSI Prestige 16 AI Evo B2HMG -3! | |
| Asus ZenBook S16 UM5606GA -3! | |
| Lenovo ThinkBook 16 G7+ AMD -3! | |
| HP Envy x360 2-in-1 16-ad0097nr -3! | |
| PCMark 10 / Score | |
| Dell XPS 16 Core Ultra X7 358H | |
| MSI Prestige 16 AI C3MTG | |
| Durchschnittliche Intel Core Ultra X7 358H, Intel Arc B390 12 Xe3 Panther Lake iGPU (8834 - 9880, n=8) | |
| Asus ZenBook S16 UM5606GA | |
| MSI Prestige 16 AI Evo B2HMG | |
| Lenovo ThinkBook 16 G7+ AMD | |
| HP Envy x360 2-in-1 16-ad0097nr | |
| PCMark 10 / Essentials | |
| MSI Prestige 16 AI Evo B2HMG | |
| Dell XPS 16 Core Ultra X7 358H | |
| Durchschnittliche Intel Core Ultra X7 358H, Intel Arc B390 12 Xe3 Panther Lake iGPU (10282 - 11263, n=7) | |
| MSI Prestige 16 AI C3MTG | |
| Lenovo ThinkBook 16 G7+ AMD | |
| HP Envy x360 2-in-1 16-ad0097nr | |
| Asus ZenBook S16 UM5606GA | |
| PCMark 10 / Productivity | |
| MSI Prestige 16 AI C3MTG | |
| Dell XPS 16 Core Ultra X7 358H | |
| Asus ZenBook S16 UM5606GA | |
| Durchschnittliche Intel Core Ultra X7 358H, Intel Arc B390 12 Xe3 Panther Lake iGPU (13908 - 16780, n=7) | |
| Lenovo ThinkBook 16 G7+ AMD | |
| HP Envy x360 2-in-1 16-ad0097nr | |
| MSI Prestige 16 AI Evo B2HMG | |
| PCMark 10 / Digital Content Creation | |
| Dell XPS 16 Core Ultra X7 358H | |
| Durchschnittliche Intel Core Ultra X7 358H, Intel Arc B390 12 Xe3 Panther Lake iGPU (13082 - 13893, n=7) | |
| MSI Prestige 16 AI C3MTG | |
| MSI Prestige 16 AI Evo B2HMG | |
| Lenovo ThinkBook 16 G7+ AMD | |
| Asus ZenBook S16 UM5606GA | |
| HP Envy x360 2-in-1 16-ad0097nr | |
| CrossMark / Overall | |
| MSI Prestige 16 AI Evo B2HMG | |
| Dell XPS 16 Core Ultra X7 358H | |
| MSI Prestige 16 AI C3MTG | |
| Durchschnittliche Intel Core Ultra X7 358H, Intel Arc B390 12 Xe3 Panther Lake iGPU (1884 - 2119, n=8) | |
| Lenovo ThinkBook 16 G7+ AMD | |
| Asus ZenBook S16 UM5606GA | |
| HP Envy x360 2-in-1 16-ad0097nr | |
| CrossMark / Productivity | |
| MSI Prestige 16 AI Evo B2HMG | |
| Dell XPS 16 Core Ultra X7 358H | |
| MSI Prestige 16 AI C3MTG | |
| Durchschnittliche Intel Core Ultra X7 358H, Intel Arc B390 12 Xe3 Panther Lake iGPU (1678 - 1928, n=8) | |
| Asus ZenBook S16 UM5606GA | |
| HP Envy x360 2-in-1 16-ad0097nr | |
| Lenovo ThinkBook 16 G7+ AMD | |
| CrossMark / Creativity | |
| Dell XPS 16 Core Ultra X7 358H | |
| MSI Prestige 16 AI C3MTG | |
| Durchschnittliche Intel Core Ultra X7 358H, Intel Arc B390 12 Xe3 Panther Lake iGPU (2241 - 2529, n=8) | |
| MSI Prestige 16 AI Evo B2HMG | |
| Lenovo ThinkBook 16 G7+ AMD | |
| Asus ZenBook S16 UM5606GA | |
| HP Envy x360 2-in-1 16-ad0097nr | |
| CrossMark / Responsiveness | |
| MSI Prestige 16 AI Evo B2HMG | |
| Dell XPS 16 Core Ultra X7 358H | |
| Durchschnittliche Intel Core Ultra X7 358H, Intel Arc B390 12 Xe3 Panther Lake iGPU (1560 - 1837, n=8) | |
| MSI Prestige 16 AI C3MTG | |
| HP Envy x360 2-in-1 16-ad0097nr | |
| Lenovo ThinkBook 16 G7+ AMD | |
| Asus ZenBook S16 UM5606GA | |
| WebXPRT 3 / Overall | |
| MSI Prestige 16 AI Evo B2HMG | |
| MSI Prestige 16 AI C3MTG | |
| Durchschnittliche Intel Core Ultra X7 358H, Intel Arc B390 12 Xe3 Panther Lake iGPU (293 - 338, n=8) | |
| Lenovo ThinkBook 16 G7+ AMD | |
| Dell XPS 16 Core Ultra X7 358H | |
| HP Envy x360 2-in-1 16-ad0097nr | |
| Asus ZenBook S16 UM5606GA | |
| WebXPRT 4 / Overall | |
| MSI Prestige 16 AI Evo B2HMG | |
| MSI Prestige 16 AI C3MTG | |
| Dell XPS 16 Core Ultra X7 358H | |
| Durchschnittliche Intel Core Ultra X7 358H, Intel Arc B390 12 Xe3 Panther Lake iGPU (278 - 305, n=7) | |
| Lenovo ThinkBook 16 G7+ AMD | |
| HP Envy x360 2-in-1 16-ad0097nr | |
| Asus ZenBook S16 UM5606GA | |
| Mozilla Kraken 1.1 / Total | |
| HP Envy x360 2-in-1 16-ad0097nr | |
| Asus ZenBook S16 UM5606GA | |
| MSI Prestige 16 AI C3MTG | |
| Durchschnittliche Intel Core Ultra X7 358H, Intel Arc B390 12 Xe3 Panther Lake iGPU (445 - 460, n=8) | |
| Dell XPS 16 Core Ultra X7 358H | |
| Lenovo ThinkBook 16 G7+ AMD | |
| MSI Prestige 16 AI Evo B2HMG | |
| Geekbench AI / Quantized GPU 1.7 | |
| Dell XPS 16 Core Ultra X7 358H | |
| MSI Prestige 16 AI C3MTG | |
| Durchschnittliche Intel Core Ultra X7 358H, Intel Arc B390 12 Xe3 Panther Lake iGPU (6908 - 8011, n=6) | |
| Geekbench AI / Half Precision GPU 1.7 | |
| MSI Prestige 16 AI C3MTG | |
| Dell XPS 16 Core Ultra X7 358H | |
| Durchschnittliche Intel Core Ultra X7 358H, Intel Arc B390 12 Xe3 Panther Lake iGPU (16188 - 21963, n=6) | |
| Geekbench AI / Single Precision GPU 1.7 | |
| MSI Prestige 16 AI C3MTG | |
| Dell XPS 16 Core Ultra X7 358H | |
| Durchschnittliche Intel Core Ultra X7 358H, Intel Arc B390 12 Xe3 Panther Lake iGPU (9783 - 12255, n=6) | |
* ... kleinere Werte sind besser
| PCMark 10 Score | 9551 Punkte | |
Hilfe | ||
| AIDA64 / Memory Copy | |
| Dell XPS 16 Core Ultra X7 358H | |
| MSI Prestige 16 AI C3MTG | |
| Durchschnittliche Intel Core Ultra X7 358H (102745 - 132135, n=7) | |
| MSI Prestige 16 AI Evo B2HMG | |
| Asus ZenBook S16 UM5606GA | |
| Lenovo ThinkBook 16 G7+ AMD | |
| HP Envy x360 2-in-1 16-ad0097nr | |
| AIDA64 / Memory Read | |
| Dell XPS 16 Core Ultra X7 358H | |
| Durchschnittliche Intel Core Ultra X7 358H (97755 - 118888, n=8) | |
| MSI Prestige 16 AI C3MTG | |
| Asus ZenBook S16 UM5606GA | |
| Lenovo ThinkBook 16 G7+ AMD | |
| MSI Prestige 16 AI Evo B2HMG | |
| HP Envy x360 2-in-1 16-ad0097nr | |
| AIDA64 / Memory Write | |
| Dell XPS 16 Core Ultra X7 358H | |
| Durchschnittliche Intel Core Ultra X7 358H (105984 - 134998, n=8) | |
| MSI Prestige 16 AI C3MTG | |
| Asus ZenBook S16 UM5606GA | |
| Lenovo ThinkBook 16 G7+ AMD | |
| HP Envy x360 2-in-1 16-ad0097nr | |
| MSI Prestige 16 AI Evo B2HMG | |
| AIDA64 / Memory Latency | |
| MSI Prestige 16 AI Evo B2HMG | |
| HP Envy x360 2-in-1 16-ad0097nr | |
| Lenovo ThinkBook 16 G7+ AMD | |
| Asus ZenBook S16 UM5606GA | |
| MSI Prestige 16 AI C3MTG | |
| Dell XPS 16 Core Ultra X7 358H | |
| Durchschnittliche Intel Core Ultra X7 358H (84.6 - 101.9, n=8) | |
* ... kleinere Werte sind besser
DPC-Latenzzeit
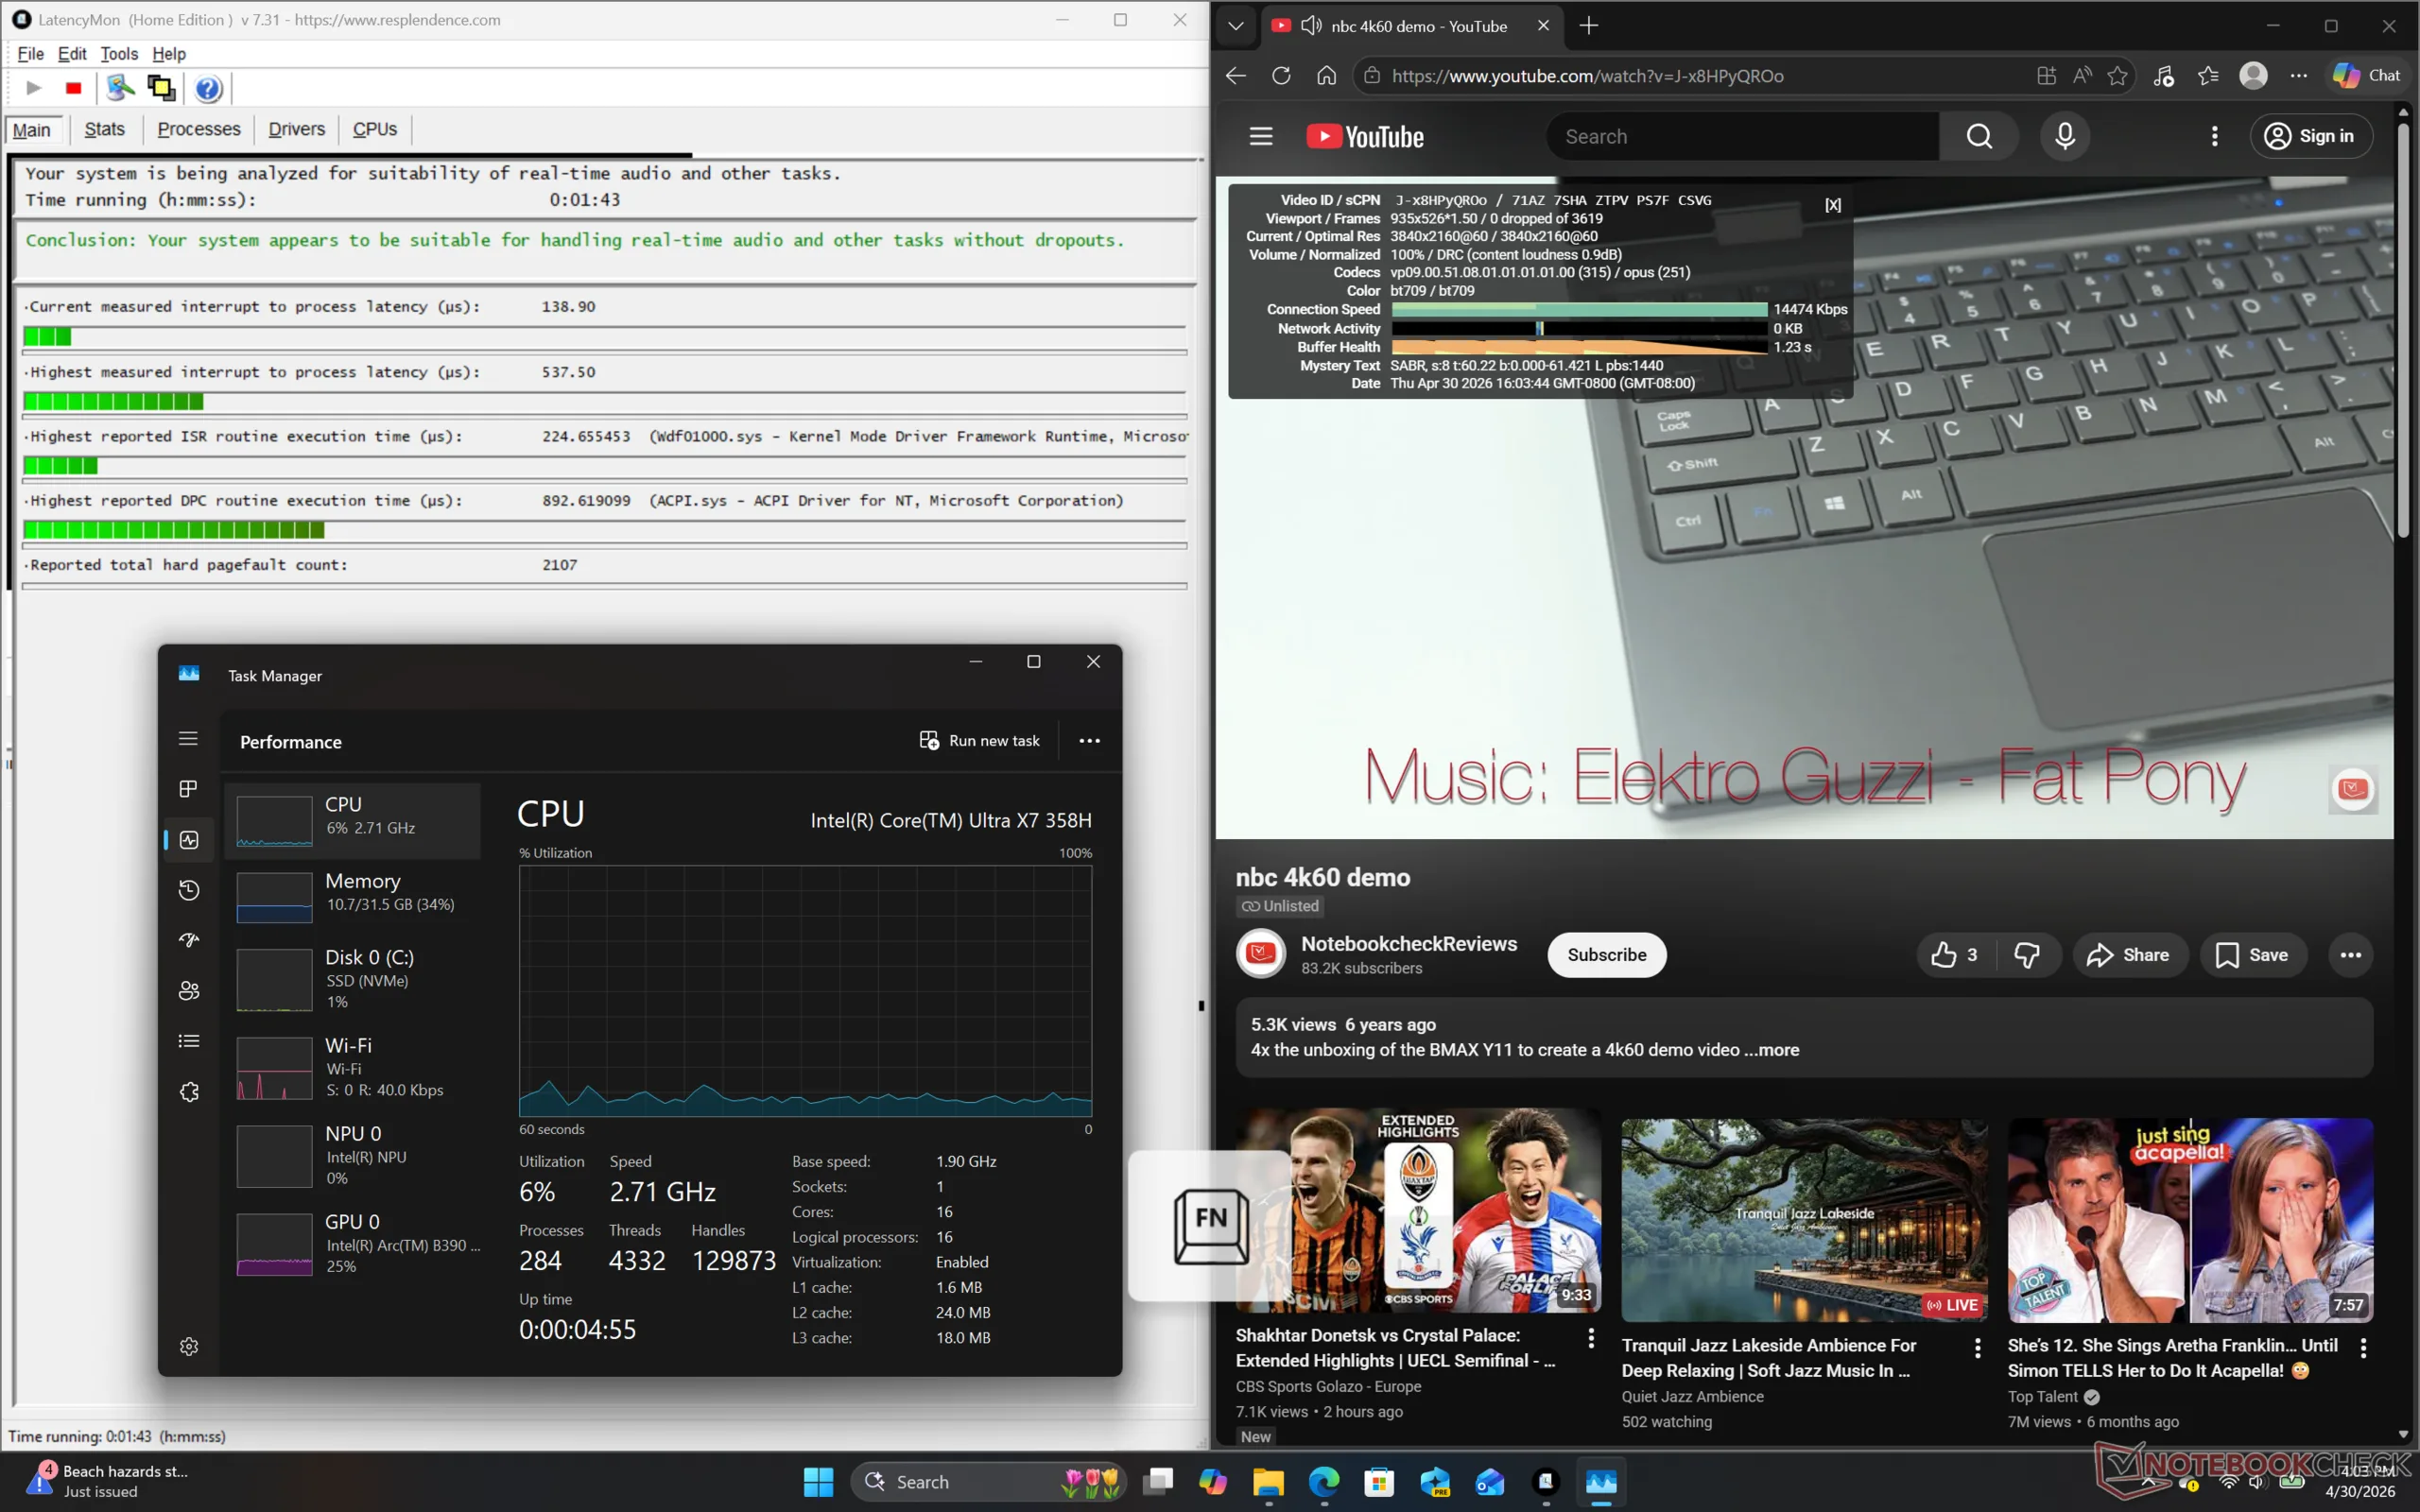
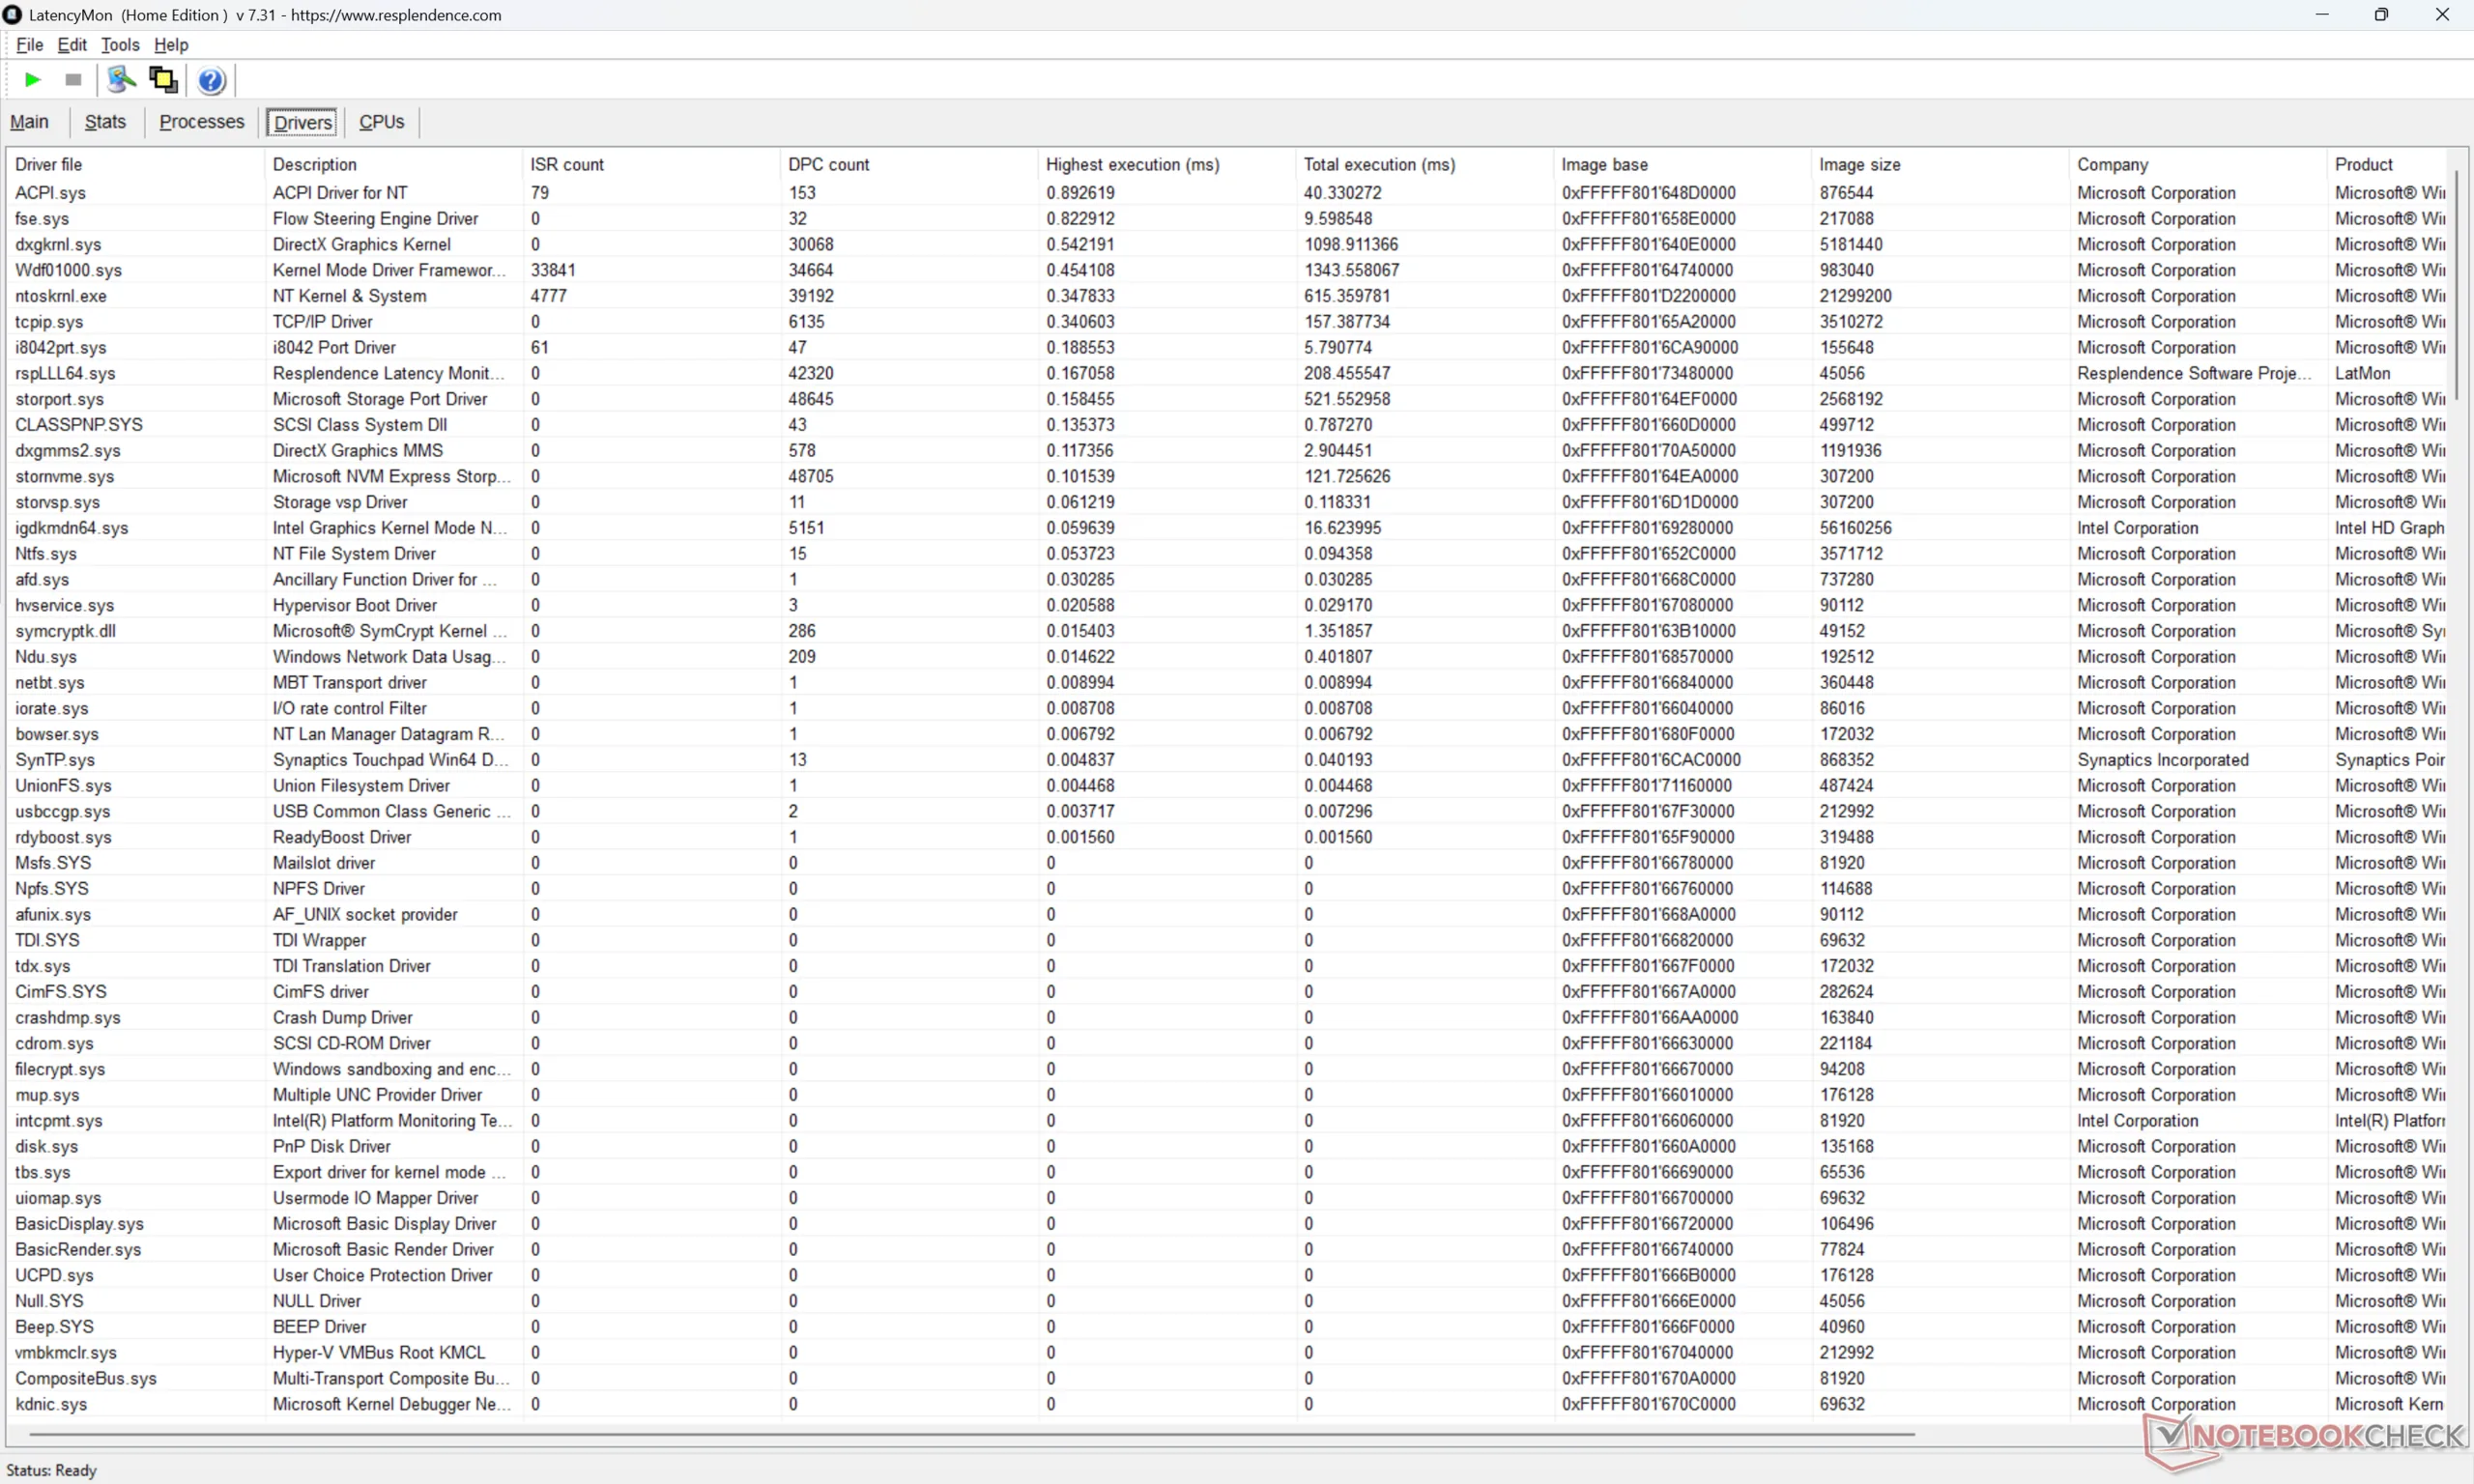
| DPC Latencies / LatencyMon - interrupt to process latency (max), Web, Youtube, Prime95 | |
| MSI Prestige 16 AI Evo B2HMG | |
| HP Envy x360 2-in-1 16-ad0097nr | |
| Lenovo ThinkBook 16 G7+ AMD | |
| Asus ZenBook S16 UM5606GA | |
| MSI Prestige 16 AI C3MTG | |
| Dell XPS 16 Core Ultra X7 358H | |
* ... kleinere Werte sind besser
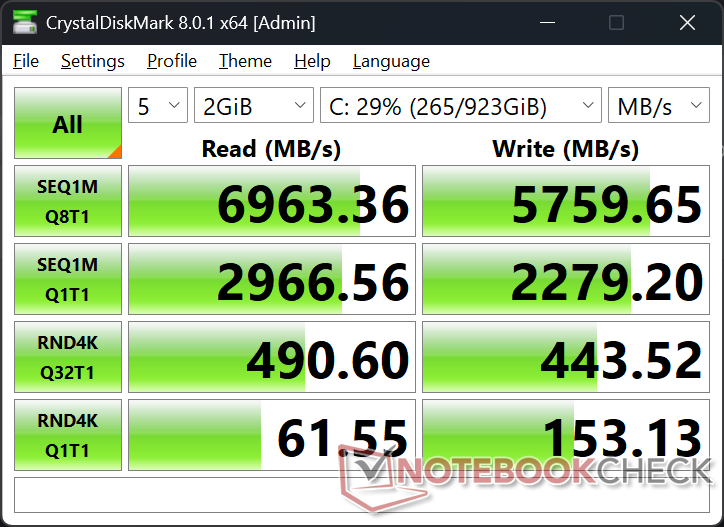
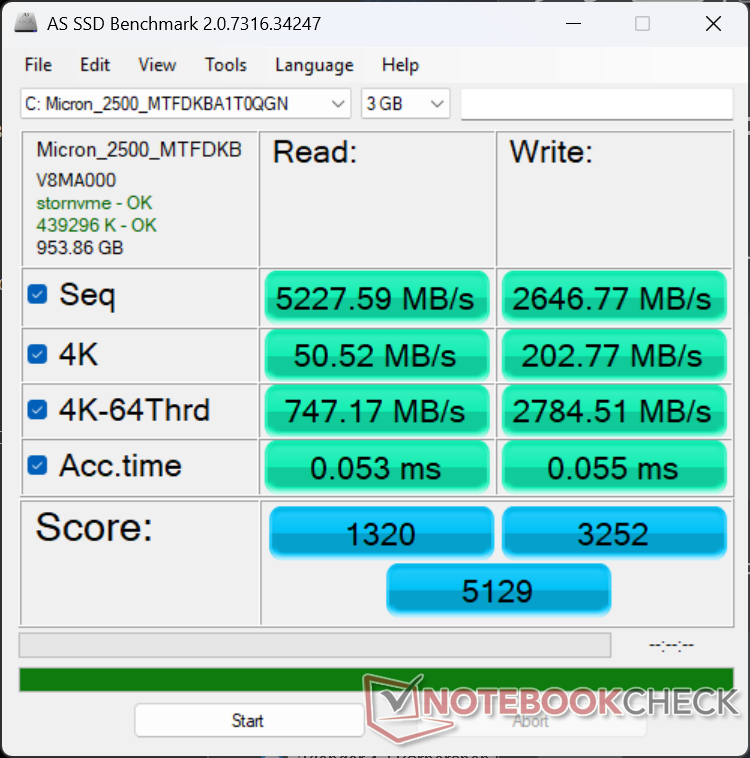
Speichergeräte
Unser Testgerät ist mit der gleichen 1 TB Micron 2500 PCIe4 x4 NVMe SSD wie das letztjährige Modell ausgestattet und zeigt ähnliche Leistungswerte und kein nennenswertes Throttling-Verhalten. Es gibt keine Unterstützung mehr für sekundäre M.2-SSDs, was bei neueren 16-Zoll-Notebooks wie dem XPS 16 oder dem Asus Zenbook S16 ein Trend zu sein scheint.

* ... kleinere Werte sind besser
Disk Throttling: DiskSpd Read Loop, Queue Depth 8
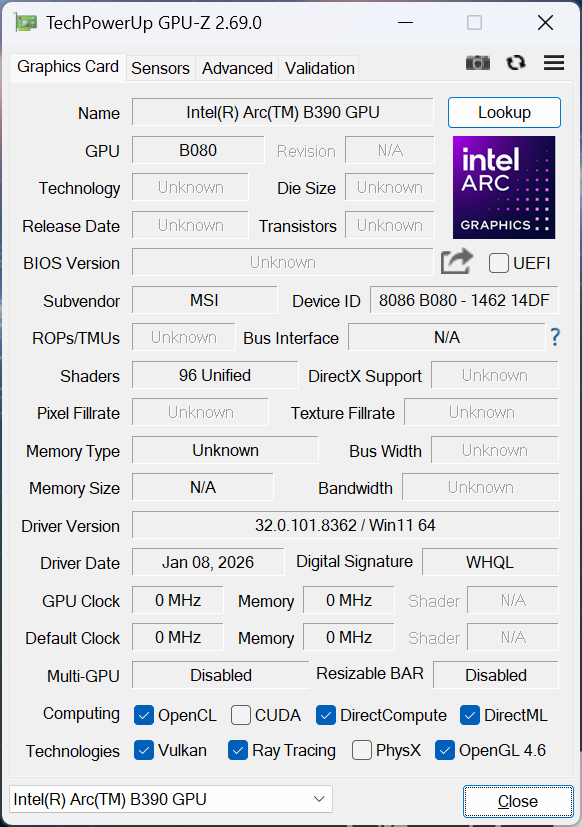
GPU-Leistung
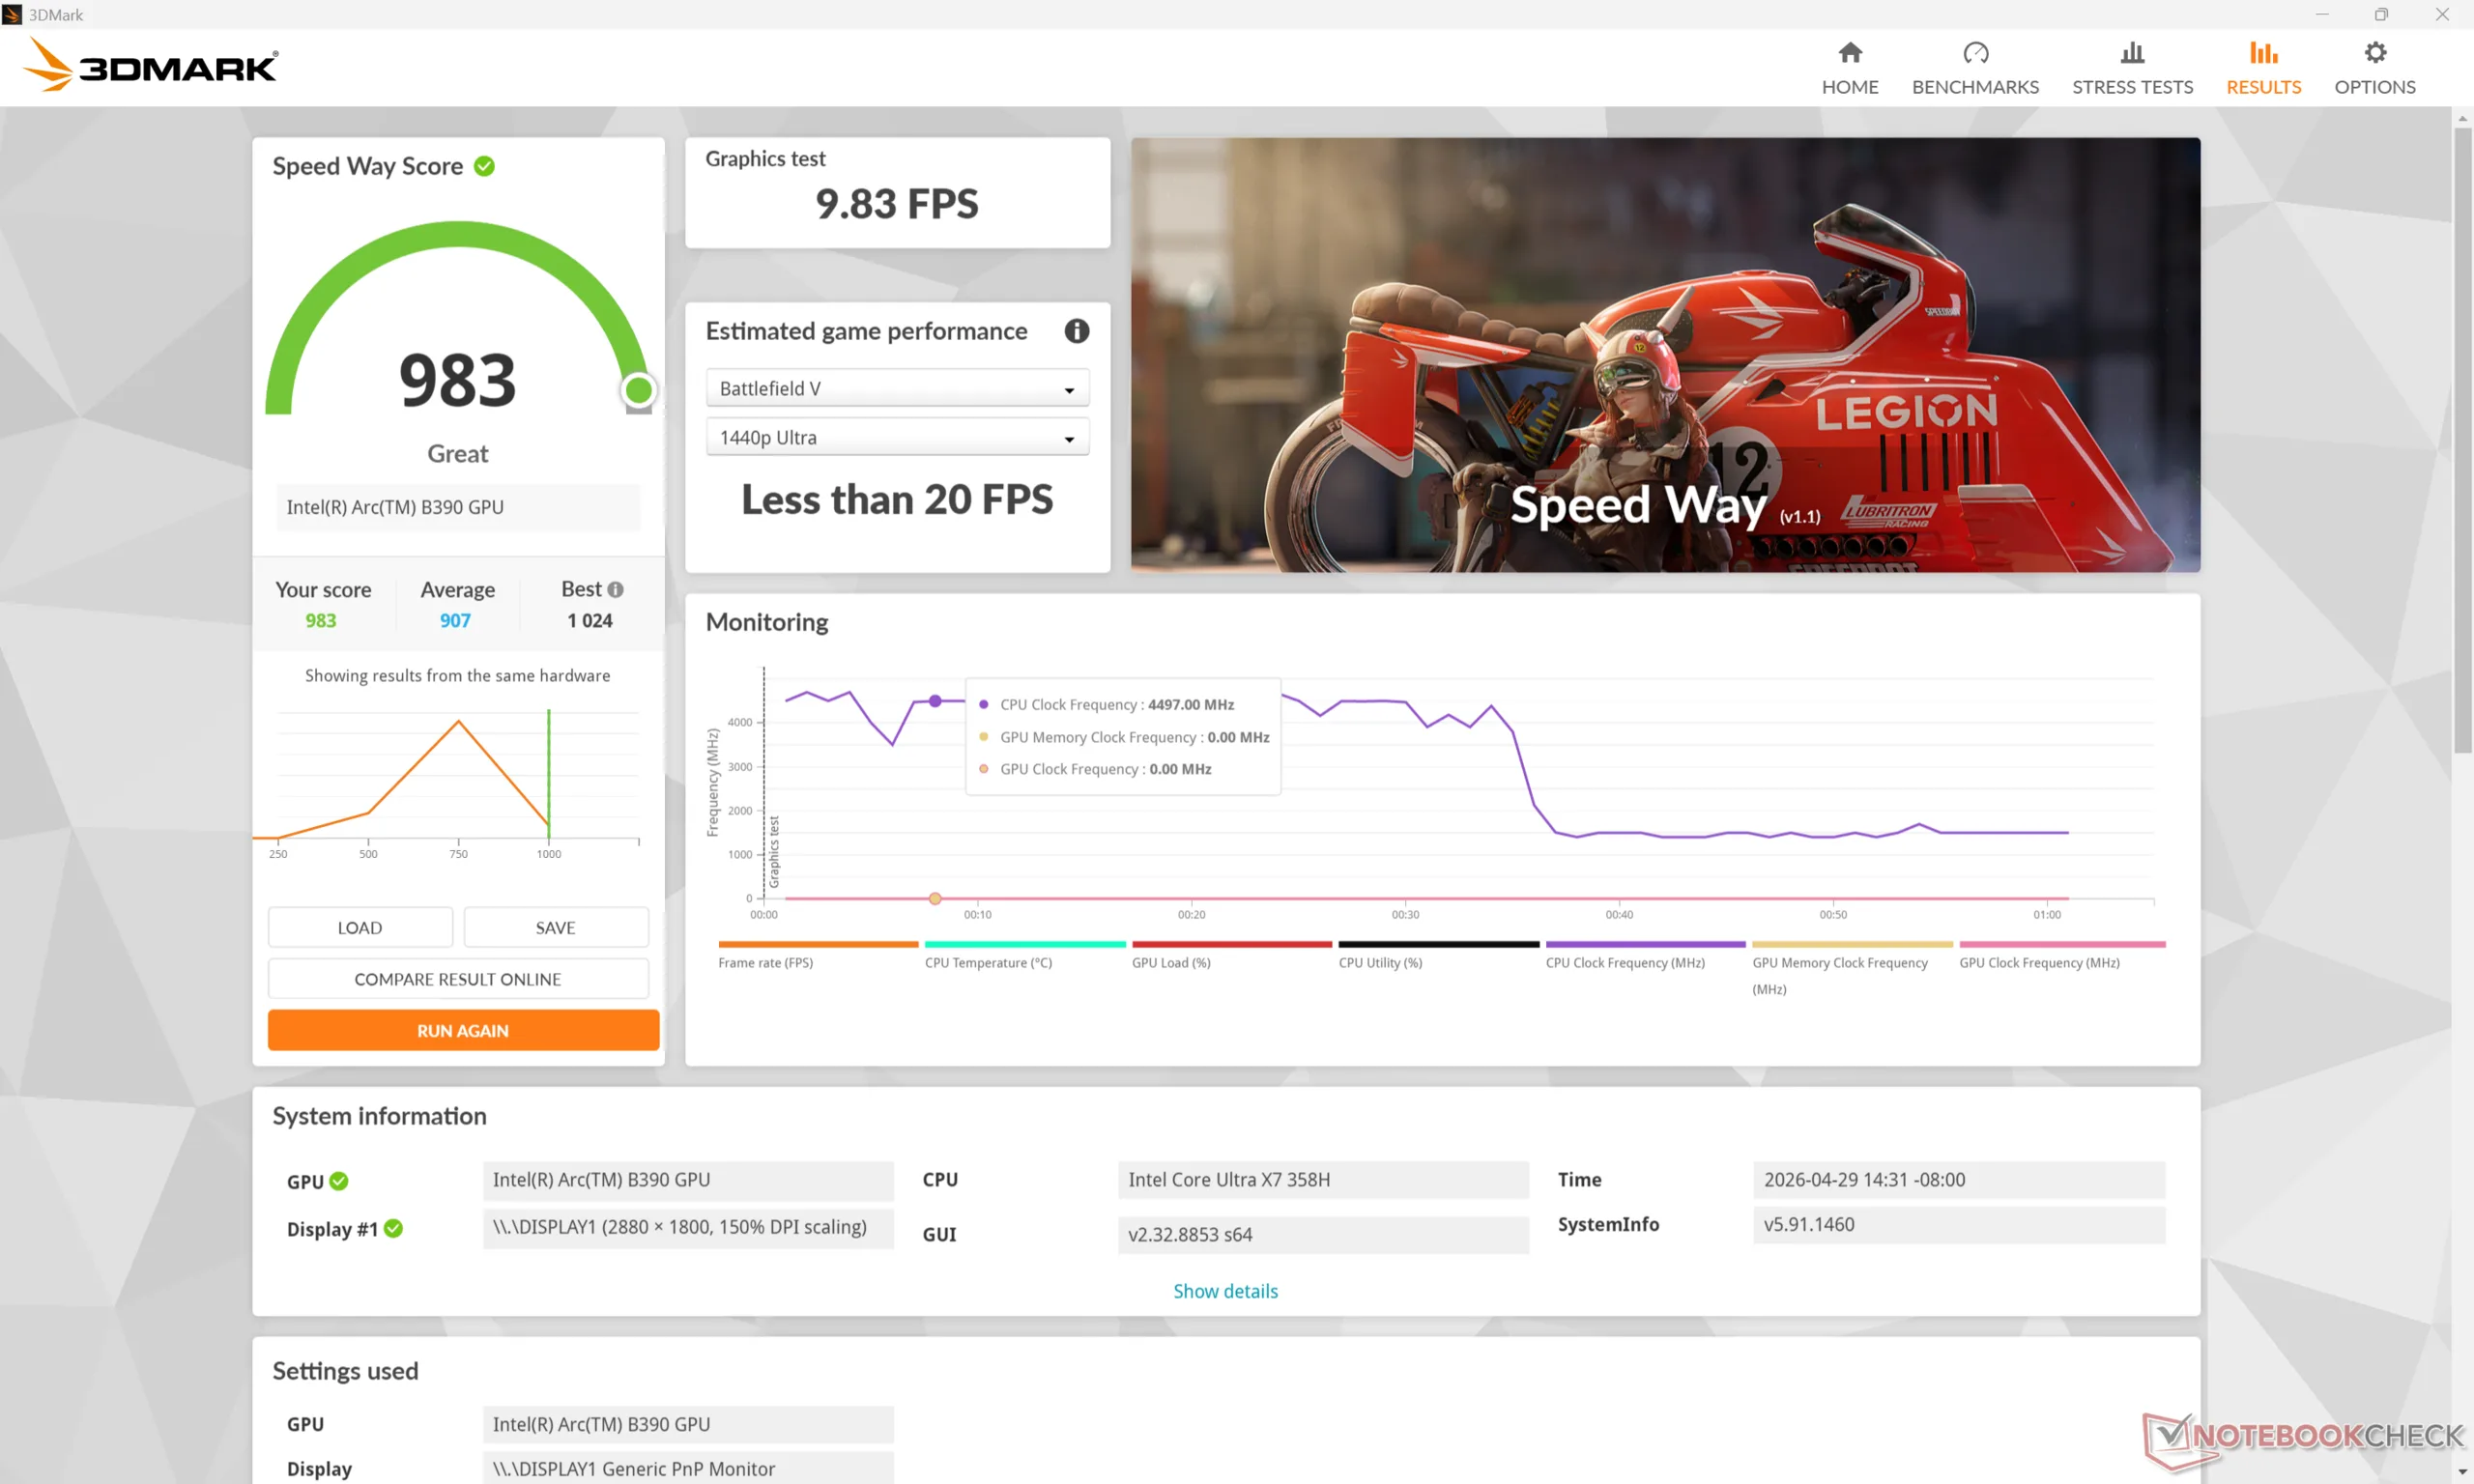
Die Grafikleistung ist dort, wo wir sie erwarten, wenn wir sie mit anderen PCs mit der gleichen Arc-B390-GPU vergleichen, wenn nicht sogar um ein paar Prozentpunkte langsamer. Der Arc B390 ist deutlich schneller als die Arc 140T des letztjährigen Prestige 16 um bis zu 50 bis 80 Prozent und ist einer der wichtigsten Gründe für ein Upgrade auf Panther Lake.
Der Betrieb im Balanced- statt im Performance-Modus beeinträchtigt die Leistung um bis zu 25 Prozent stärker als erwartet, wie unsere Fire-Strike-Ergebnistabelle unten zeigt. Dies würde sich in der Folge auf das Lüftergeräusch und die Gaming Performance auswirken, wie unsere Abschnitte weiter unten zeigen werden.
| Leistungsprofil | Graphics-Ergebnis | Physics-Ergebnis | Kombinierte Punktzahl |
| Performance-Modus | 16.244 | 26.048 | 4.331 |
| Balanced Modus | 15.684 (-3 %) | 19.912 (-24 %) | 4.476 (-0 %) |
| Akku-Leistung | 16.481 (-0 %) | 20.729 (-20 %) | 4.794 (-0 %) |
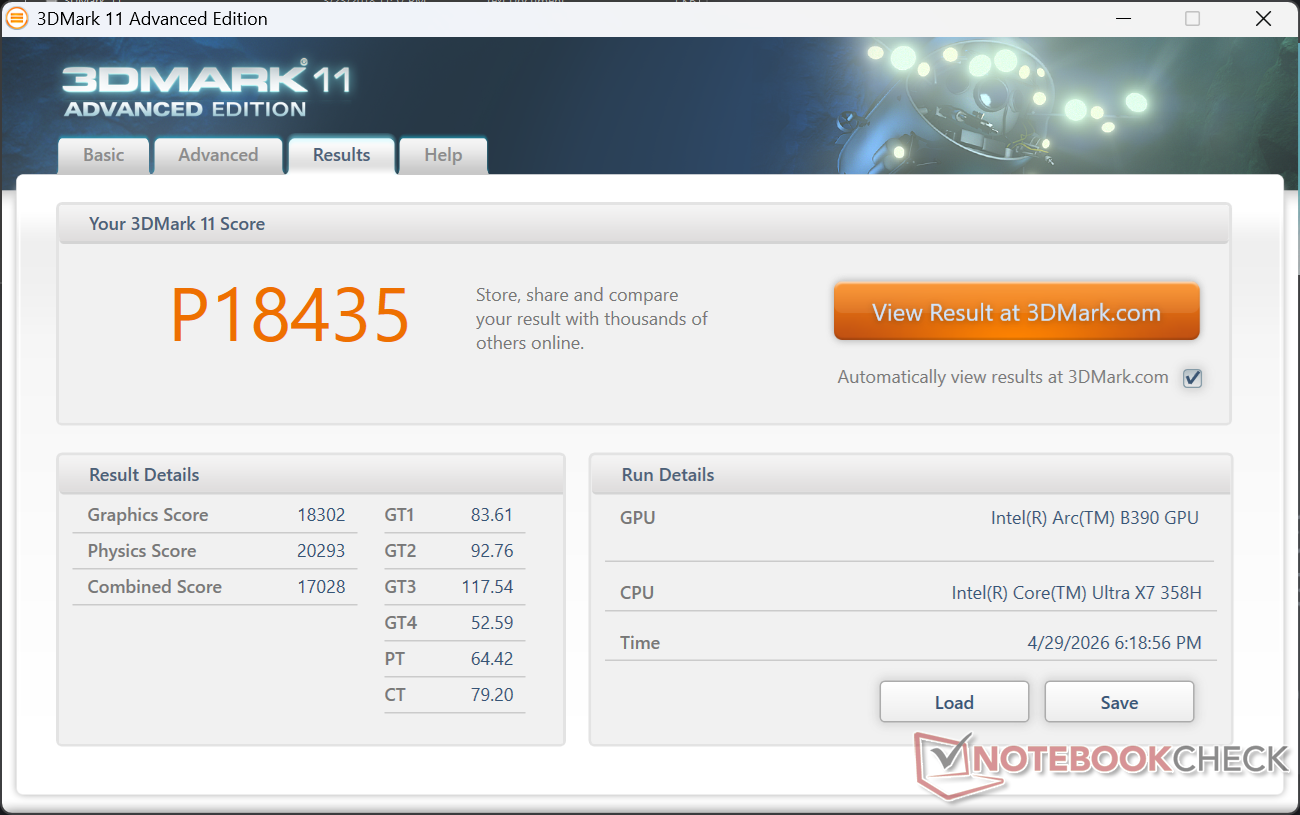
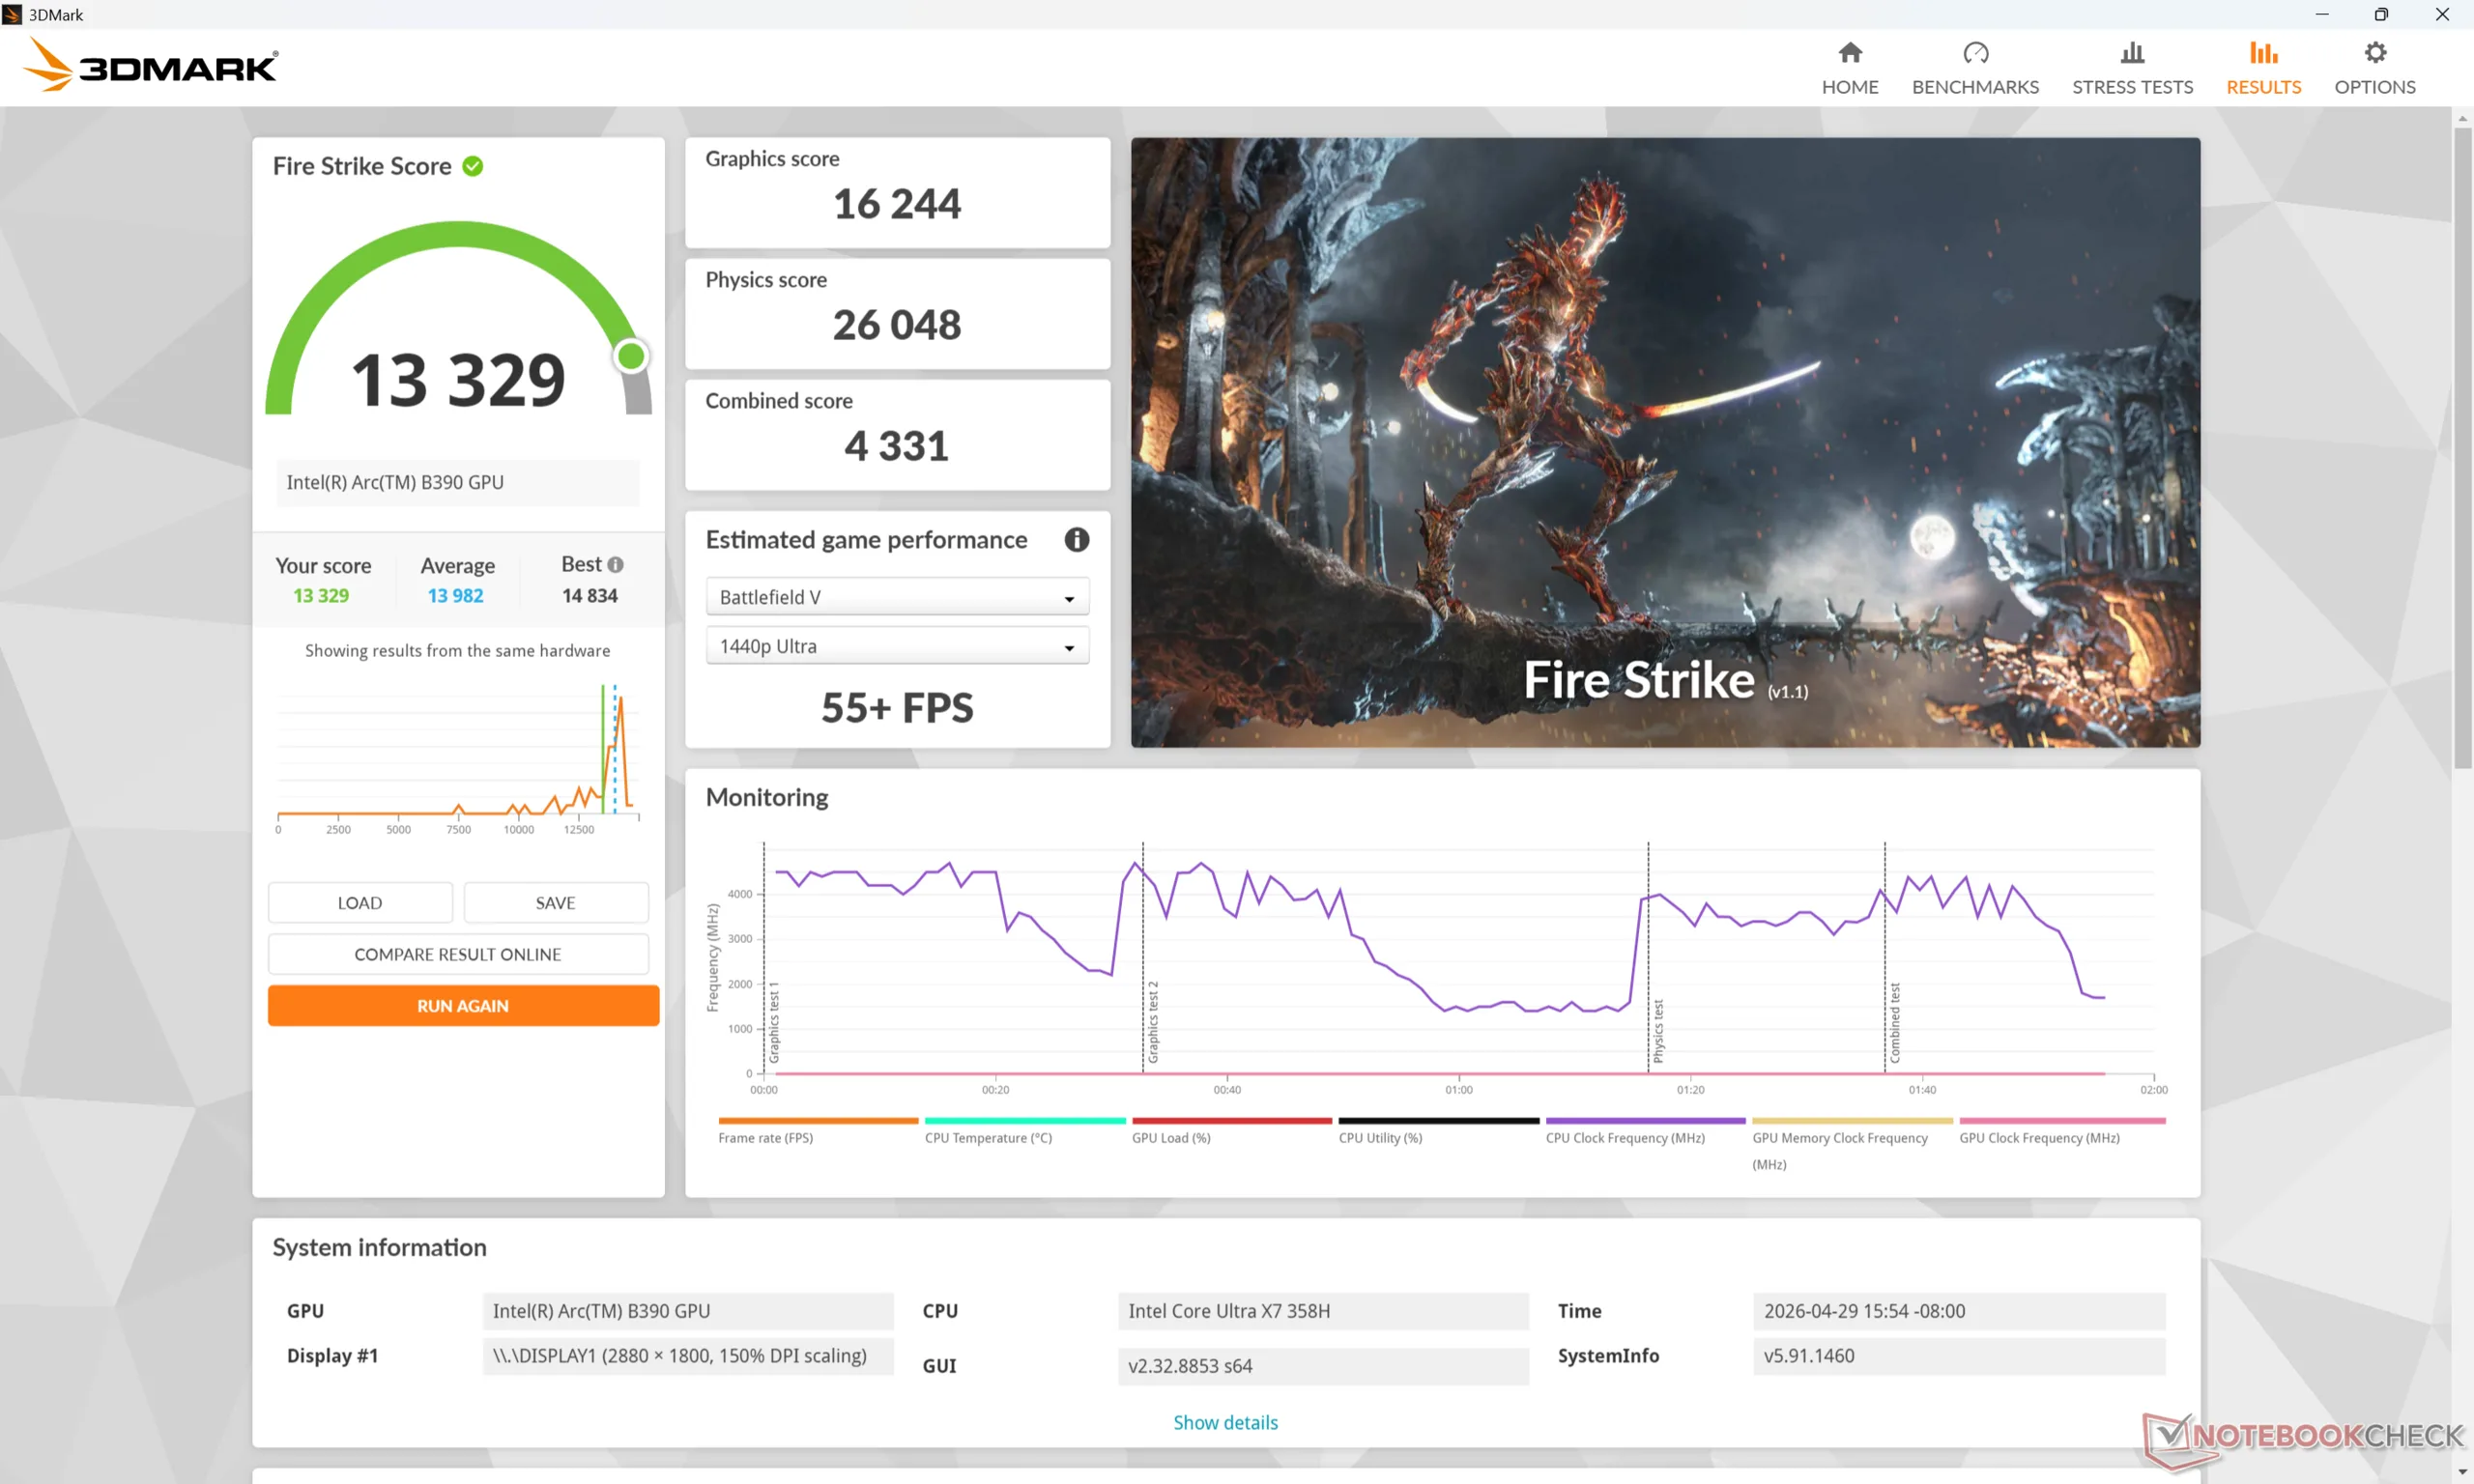
| 3DMark 11 Performance | 18435 Punkte | |
| 3DMark Cloud Gate Standard Score | 35193 Punkte | |
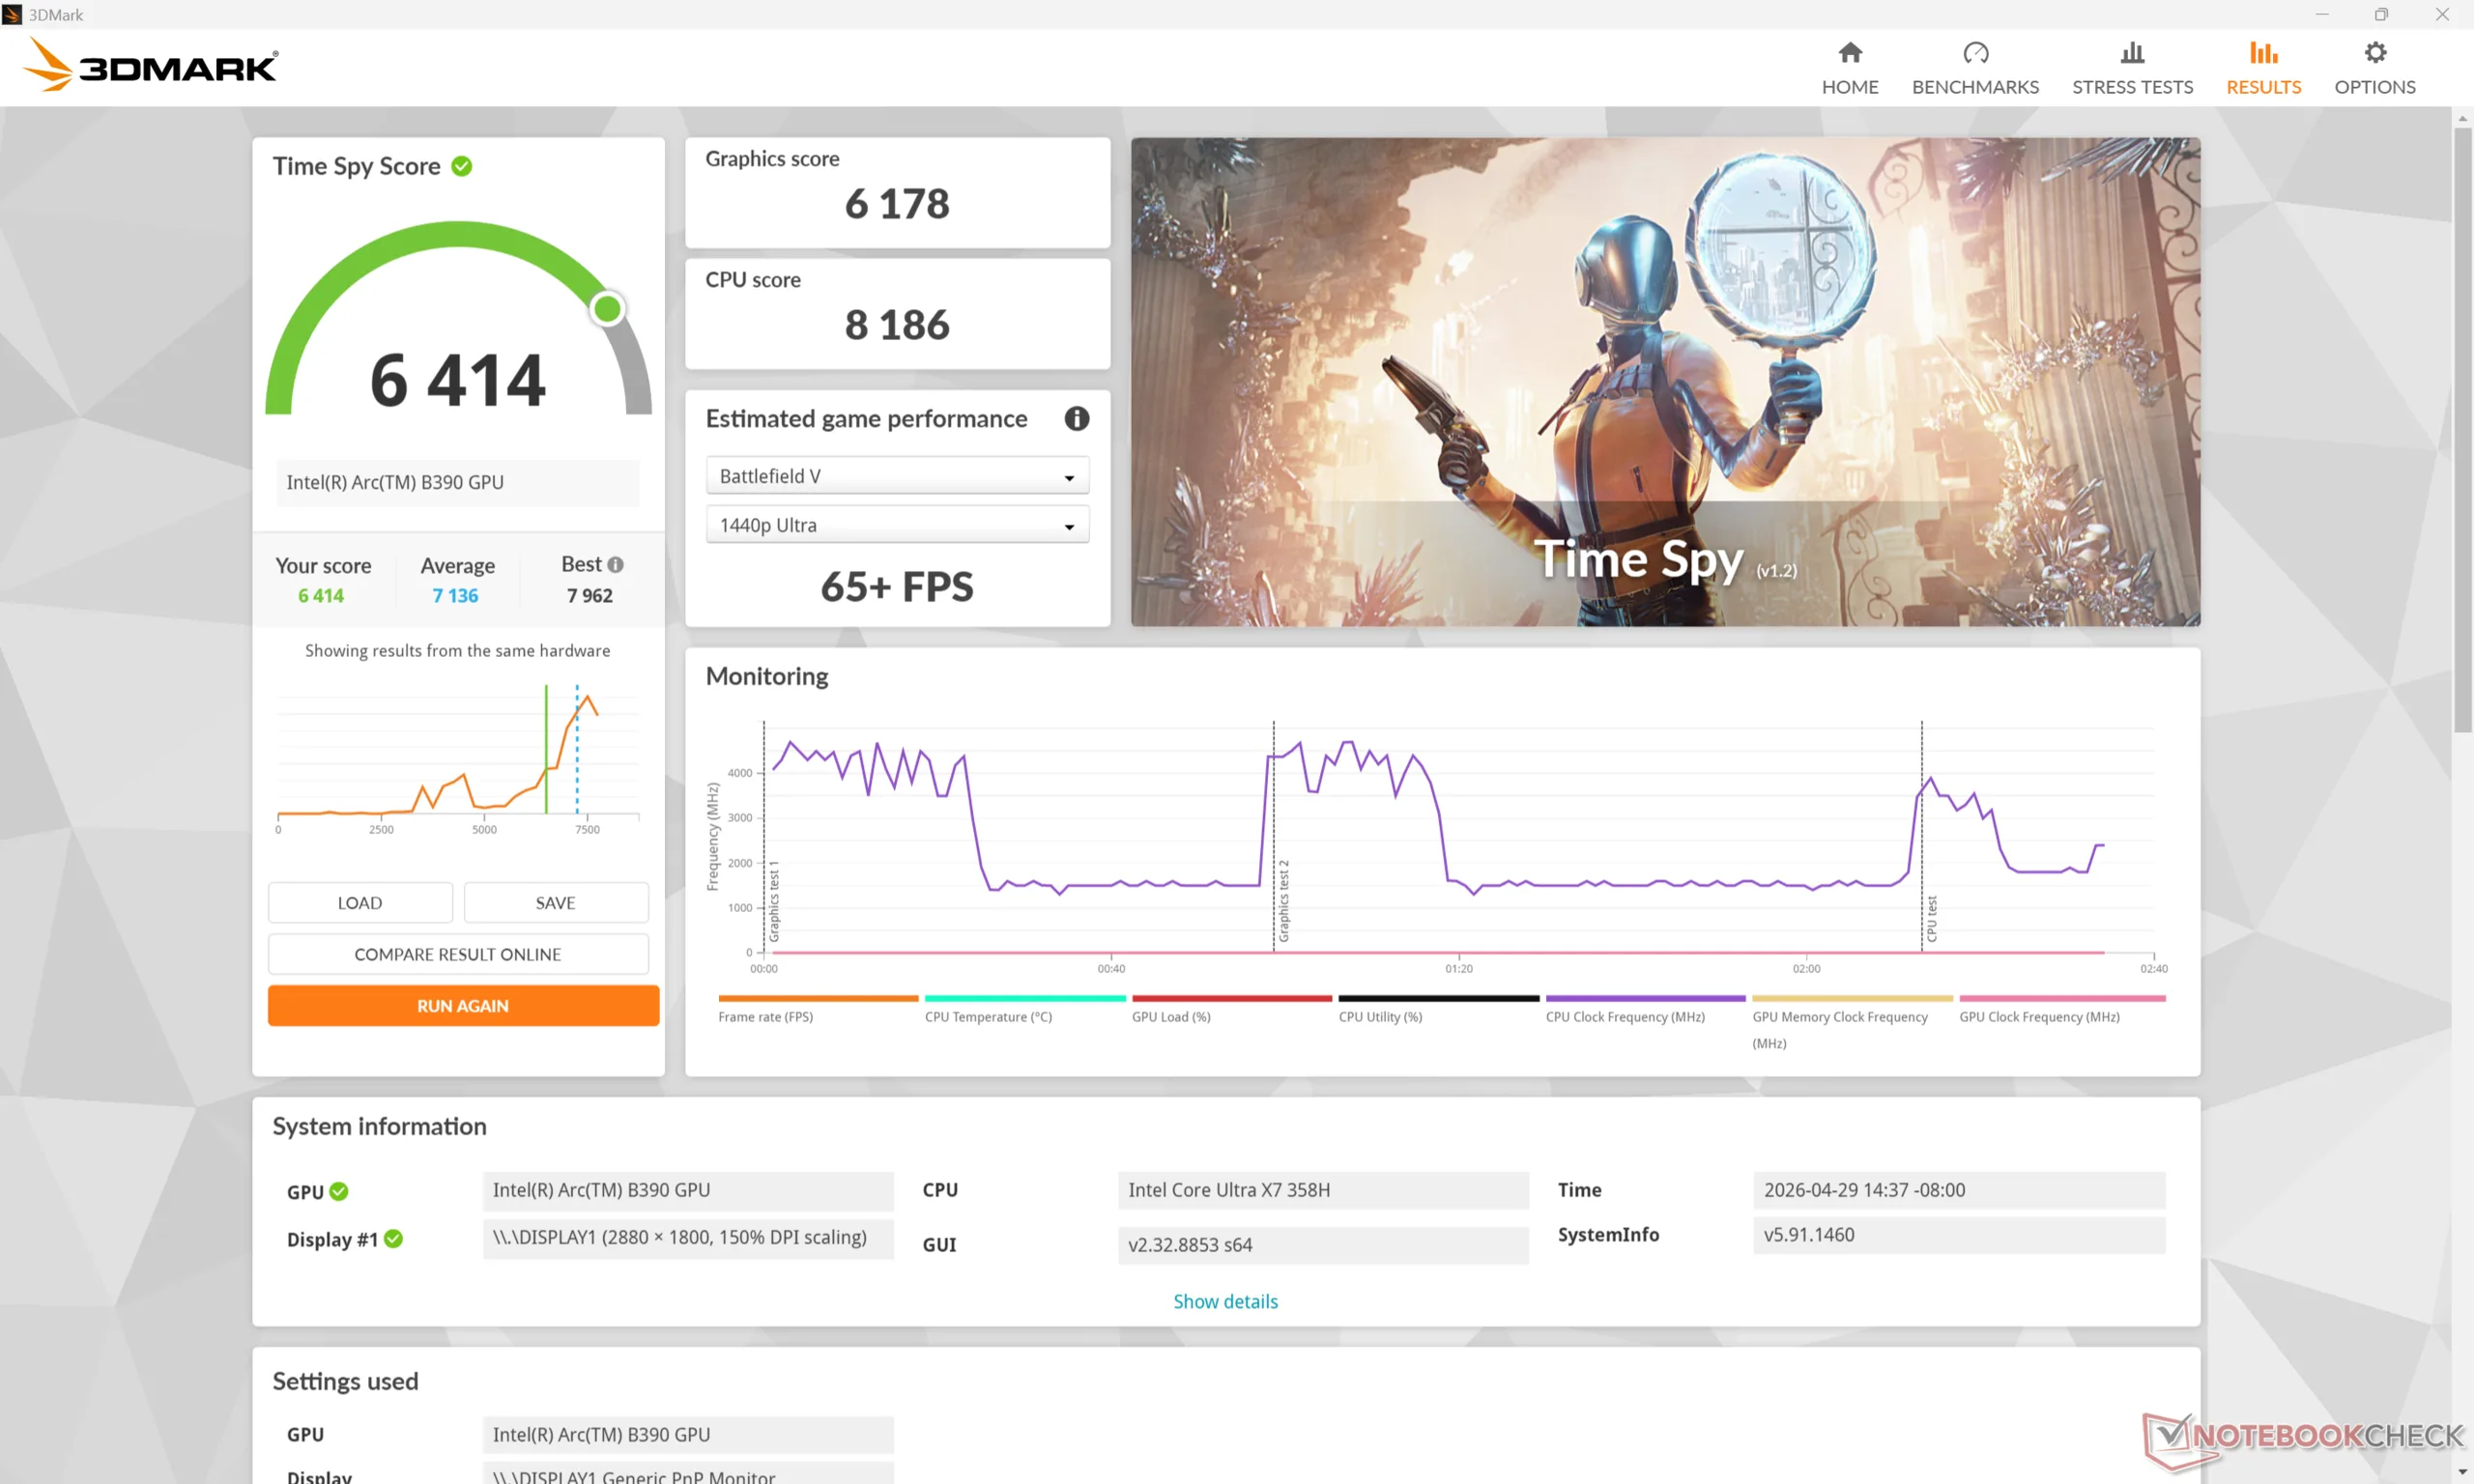
| 3DMark Fire Strike Score | 13329 Punkte | |
| 3DMark Time Spy Score | 6414 Punkte | |
Hilfe | ||
* ... kleinere Werte sind besser
Gaming-Leistung
Auch wenn es sich nicht in erster Linie um einen Spielecomputer handelt, sind Laptops mit dem Arc B390 durchaus in der Lage, selbst die anspruchsvollsten Titel mit anständigen 1.080p-Einstellungen und Bildraten auszuführen. Cyberpunk 2077 zum Beispiel erreicht bei 1.080p-Ultra-Einstellungen durchschnittlich 45 fps, bevor ein XeSS-Upscaling durchgeführt wird.
G-Sync wird auf dem internen Display nicht unterstützt.
| Performance Rating - Percent | |
| MSI Prestige 16 AI C3MTG | |
| Dell XPS 16 Core Ultra X7 358H | |
| Lenovo ThinkBook 16 G7+ AMD | |
| Asus ZenBook S16 UM5606GA | |
| MSI Prestige 16 AI Evo B2HMG | |
| HP Envy x360 2-in-1 16-ad0097nr -1! | |
| Cyberpunk 2077 - 1920x1080 Ultra Preset (FSR off) | |
| Dell XPS 16 Core Ultra X7 358H | |
| MSI Prestige 16 AI C3MTG | |
| MSI Prestige 16 AI Evo B2HMG | |
| Lenovo ThinkBook 16 G7+ AMD | |
| Asus ZenBook S16 UM5606GA | |
| HP Envy x360 2-in-1 16-ad0097nr | |
| Baldur's Gate 3 - 1920x1080 Ultra Preset AA:T | |
| Dell XPS 16 Core Ultra X7 358H | |
| MSI Prestige 16 AI C3MTG | |
| Lenovo ThinkBook 16 G7+ AMD | |
| Asus ZenBook S16 UM5606GA | |
| MSI Prestige 16 AI Evo B2HMG | |
| HP Envy x360 2-in-1 16-ad0097nr | |
| GTA V - 1920x1080 Highest AA:4xMSAA + FX AF:16x | |
| Dell XPS 16 Core Ultra X7 358H | |
| MSI Prestige 16 AI C3MTG | |
| Lenovo ThinkBook 16 G7+ AMD | |
| Asus ZenBook S16 UM5606GA | |
| MSI Prestige 16 AI Evo B2HMG | |
| Final Fantasy XV Benchmark - 1920x1080 High Quality | |
| Dell XPS 16 Core Ultra X7 358H | |
| MSI Prestige 16 AI C3MTG | |
| Lenovo ThinkBook 16 G7+ AMD | |
| MSI Prestige 16 AI Evo B2HMG | |
| Asus ZenBook S16 UM5606GA | |
| HP Envy x360 2-in-1 16-ad0097nr | |
| Strange Brigade - 1920x1080 ultra AA:ultra AF:16 | |
| Dell XPS 16 Core Ultra X7 358H | |
| MSI Prestige 16 AI C3MTG | |
| MSI Prestige 16 AI Evo B2HMG | |
| Lenovo ThinkBook 16 G7+ AMD | |
| Asus ZenBook S16 UM5606GA | |
| HP Envy x360 2-in-1 16-ad0097nr | |
| Dota 2 Reborn - 1920x1080 ultra (3/3) best looking | |
| MSI Prestige 16 AI C3MTG | |
| Dell XPS 16 Core Ultra X7 358H | |
| Lenovo ThinkBook 16 G7+ AMD | |
| Asus ZenBook S16 UM5606GA | |
| MSI Prestige 16 AI Evo B2HMG | |
| HP Envy x360 2-in-1 16-ad0097nr | |
| X-Plane 11.11 - 1920x1080 high (fps_test=3) | |
| Lenovo ThinkBook 16 G7+ AMD | |
| Asus ZenBook S16 UM5606GA | |
| MSI Prestige 16 AI C3MTG | |
| Dell XPS 16 Core Ultra X7 358H | |
| MSI Prestige 16 AI Evo B2HMG | |
| HP Envy x360 2-in-1 16-ad0097nr | |
Cyberpunk 2077 ultra FPS Grafik
| min. | mittel | hoch | max. | |
|---|---|---|---|---|
| GTA V (2015) | 174.7 | 164.7 | 97.9 | 43 |
| Dota 2 Reborn (2015) | 122.1 | 98.4 | 104.3 | 111.8 |
| Final Fantasy XV Benchmark (2018) | 124.3 | 73.9 | 53.4 | |
| X-Plane 11.11 (2018) | 61.7 | 52.4 | 44.5 | |
| Strange Brigade (2018) | 304 | 118.7 | 98.5 | 88.5 |
| Baldur's Gate 3 (2023) | 69.4 | 58.5 | 52.6 | 51.7 |
| Cyberpunk 2077 (2023) | 77.2 | 62.3 | 53.8 | 44.8 |
| F1 24 (2024) | 144.9 | 135.3 | 104.3 | 37.4 |
Emissionen
Systemgeräusche
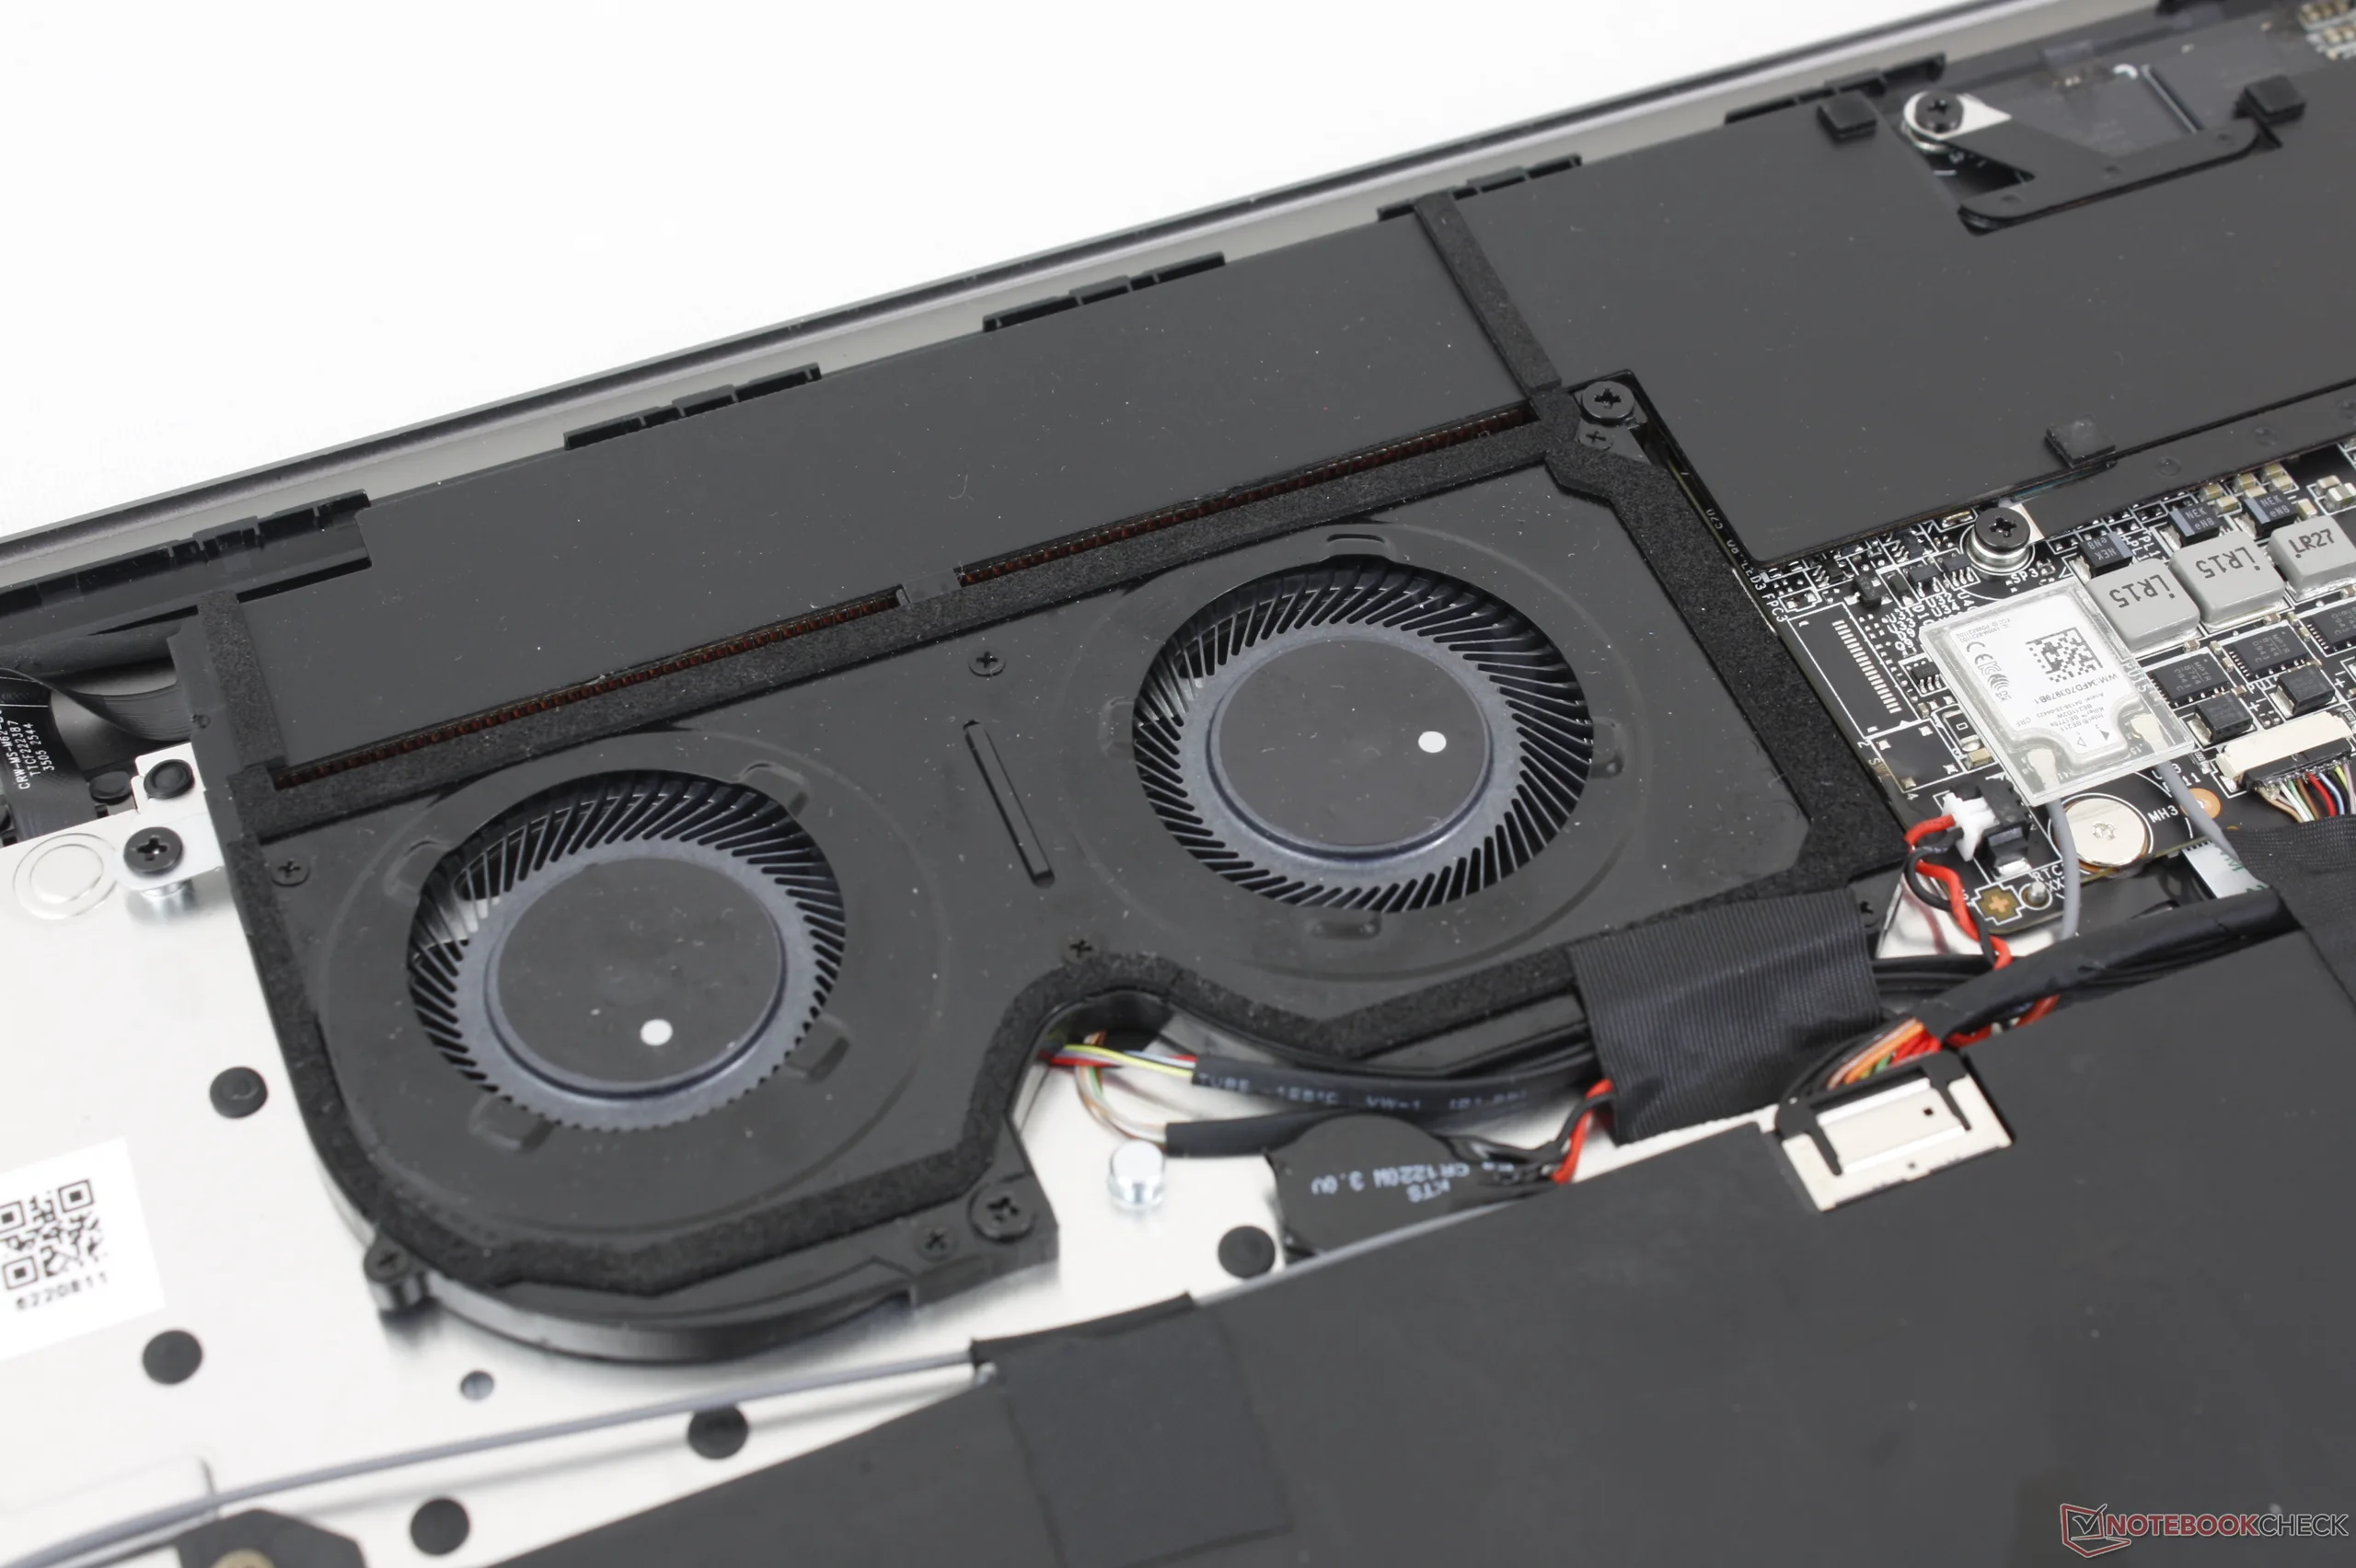
Die Kühllösung ist viel kleiner als die des XPS 16, was zu den bemerkenswerten Unterschieden in der Kerntemperatur zwischen den beiden Modellen beiträgt. Während die Lüfter des MSI länger leise bleiben können, bevor sie hochgefahren werden müssen, pendeln sie sich nach einiger Zeit auf ähnliche Maximalwerte ein. Wenn man Cyberpunk 2077 im Modus Performance spielt, stabilisiert sich das Lüftergeräusch beispielsweise bei 41 dB(A) im Vergleich zu 42 dB(A) beim Dell.
Zu beachten ist, dass das Lüftergeräusch deutlich abnimmt, wenn man im Balanced- statt im Performance-Modus spielt. In diesem Fall erreichen die Lüfter einen Spitzenwert von knapp 30 dB(A), was das oben erwähnte Leistungsdefizit von 20 Prozent je nach Benutzerpräferenz rechtfertigen könnte.
Lautstärkediagramm
| Idle |
| 23.3 / 23.3 / 25.9 dB(A) |
| Last |
| 30.1 / 44.7 dB(A) |
 | ||
30 dB leise 40 dB(A) deutlich hörbar 50 dB(A) störend |
||
min: | ||
| MSI Prestige 16 AI C3MTG Ultra X7 358H, Arc B390 Panther Lake iGPU | MSI Prestige 16 AI Evo B2HMG Ultra 9 285H, Arc 140T | Dell XPS 16 Core Ultra X7 358H Ultra X7 358H, Arc B390 Panther Lake iGPU | Asus ZenBook S16 UM5606GA Ryzen AI 9 465, Radeon 880M | Lenovo ThinkBook 16 G7+ AMD Ryzen AI 9 365, Radeon 880M | HP Envy x360 2-in-1 16-ad0097nr R7 8840HS, Radeon 780M | |
|---|---|---|---|---|---|---|
| Geräuschentwicklung | -4% | -4% | -15% | -3% | 6% | |
| aus / Umgebung * (dB) | 23.1 | 23.6 -2% | 23.3 -1% | 24.9 -8% | 24.5 -6% | 22.9 1% |
| Idle min * (dB) | 23.3 | 23.6 -1% | 23.4 -0% | 24.9 -7% | 24.5 -5% | 23 1% |
| Idle avg * (dB) | 23.3 | 23.6 -1% | 23.4 -0% | 24.9 -7% | 24.5 -5% | 23 1% |
| Idle max * (dB) | 25.9 | 26.2 -1% | 25.8 -0% | 24.9 4% | 25.9 -0% | 23 11% |
| Last avg * (dB) | 30.1 | 37.1 -23% | 38 -26% | 45.7 -52% | 36.2 -20% | 23.8 21% |
| Cyberpunk 2077 ultra * (dB) | 40.8 | 42.1 -3% | 38.1 7% | 49 -20% | 40.1 2% | |
| Last max * (dB) | 44.7 | 42.1 6% | 48.6 -9% | 50.4 -13% | 40.1 10% | 43.8 2% |
| Witcher 3 ultra * (dB) | 43.8 |
* ... kleinere Werte sind besser
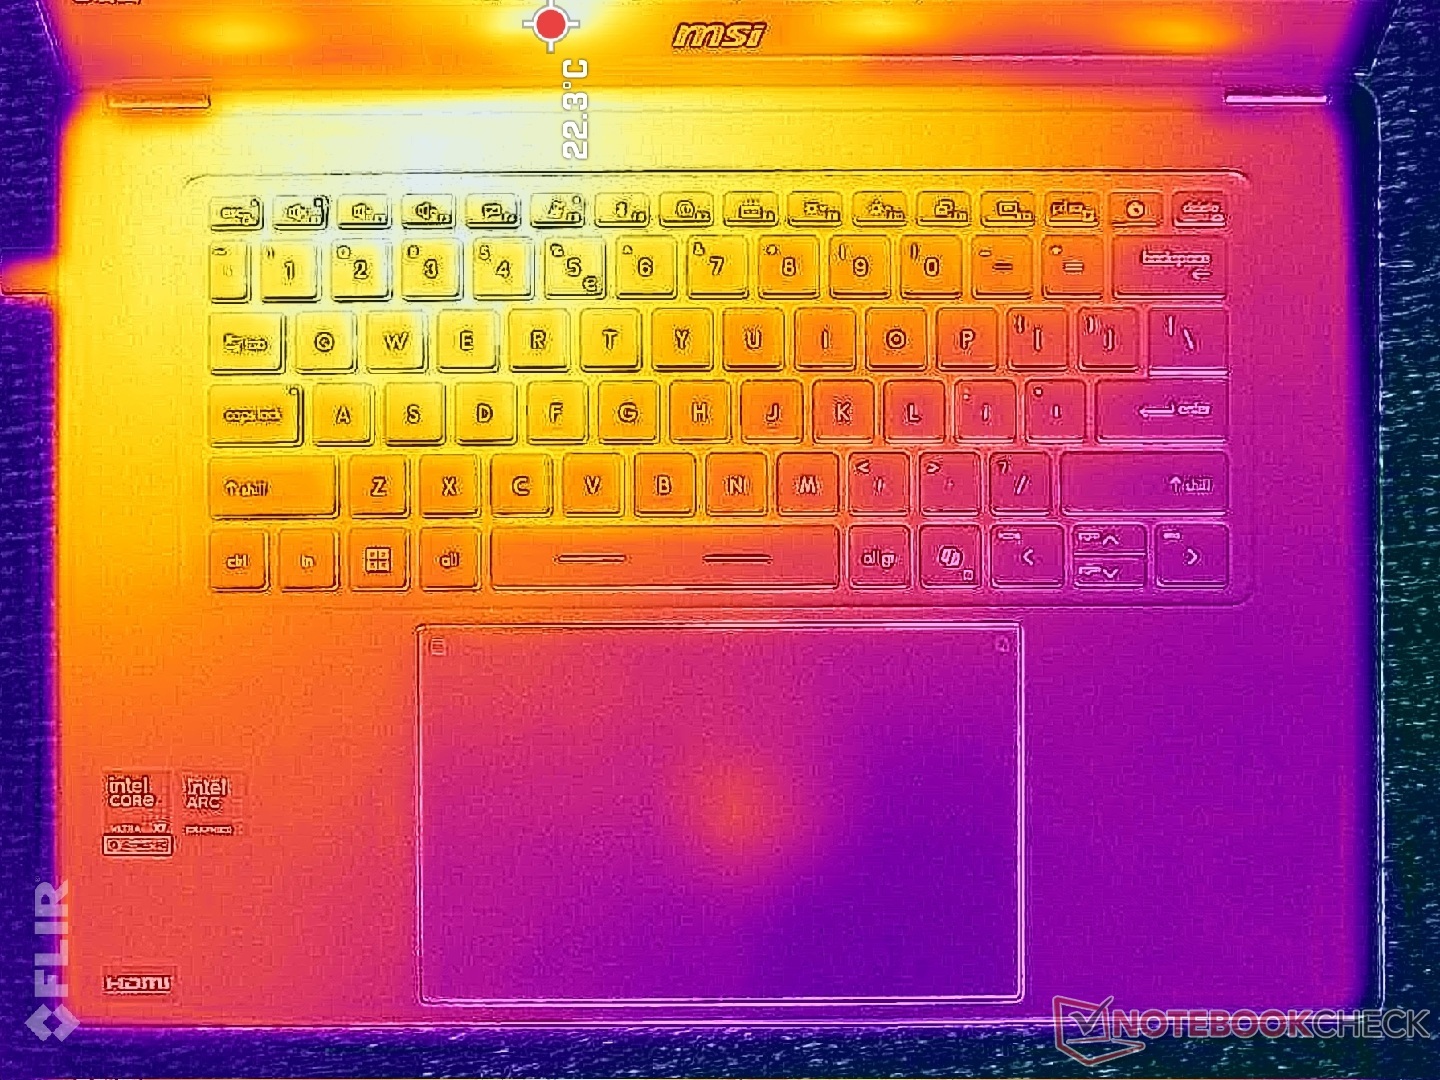
Temperatur
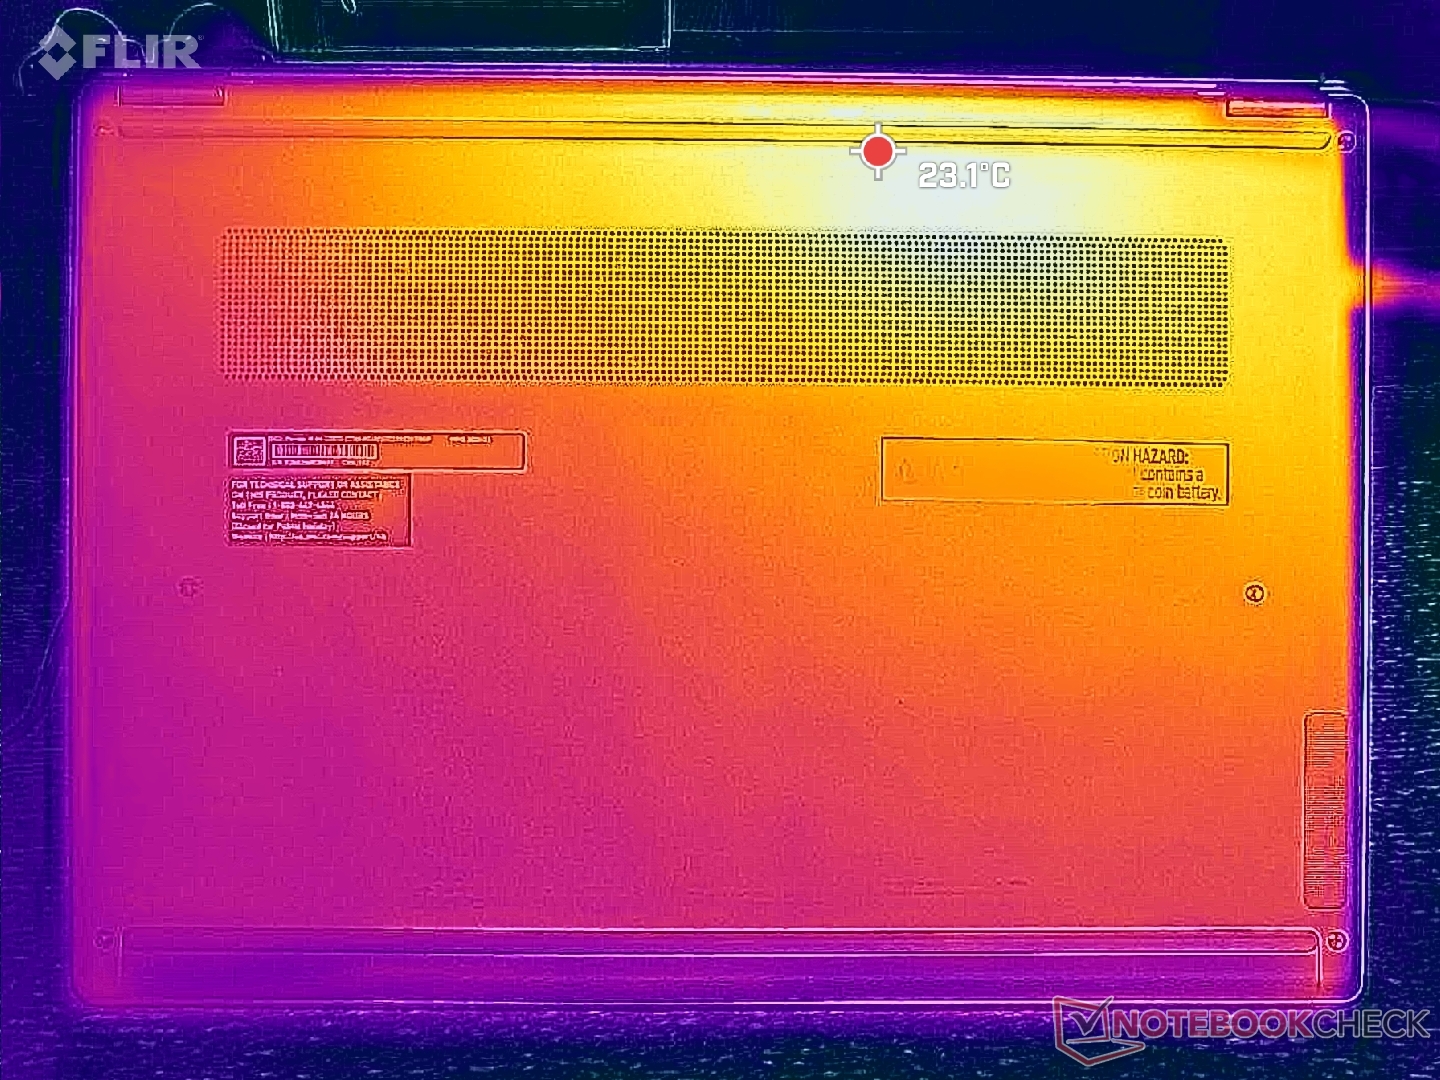
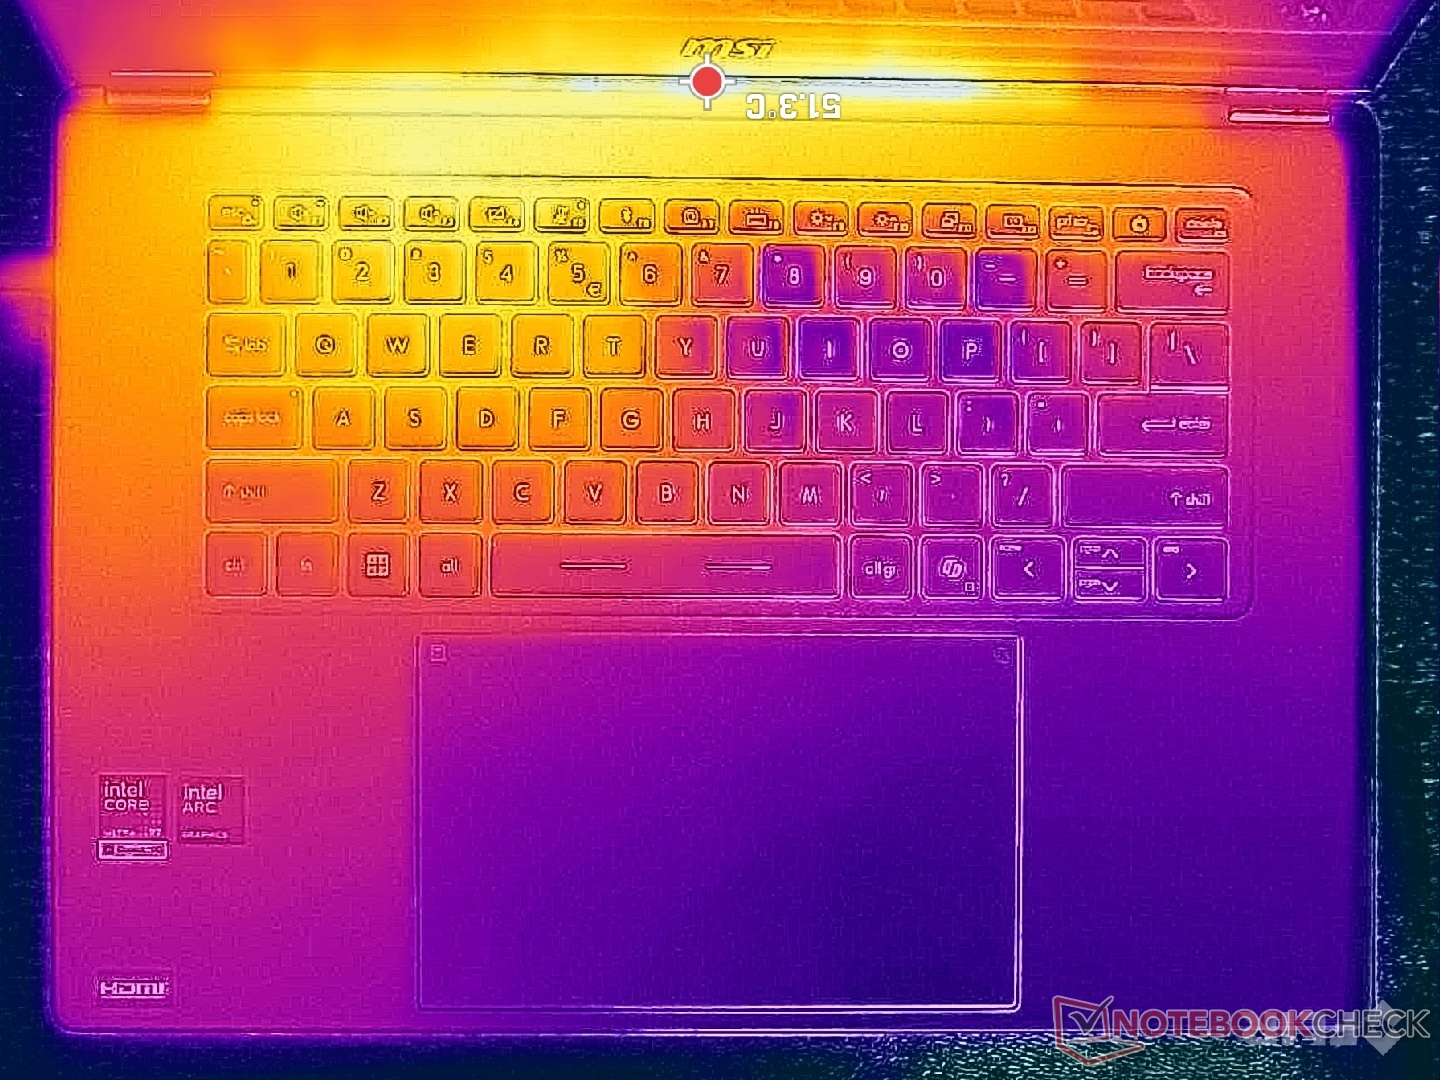
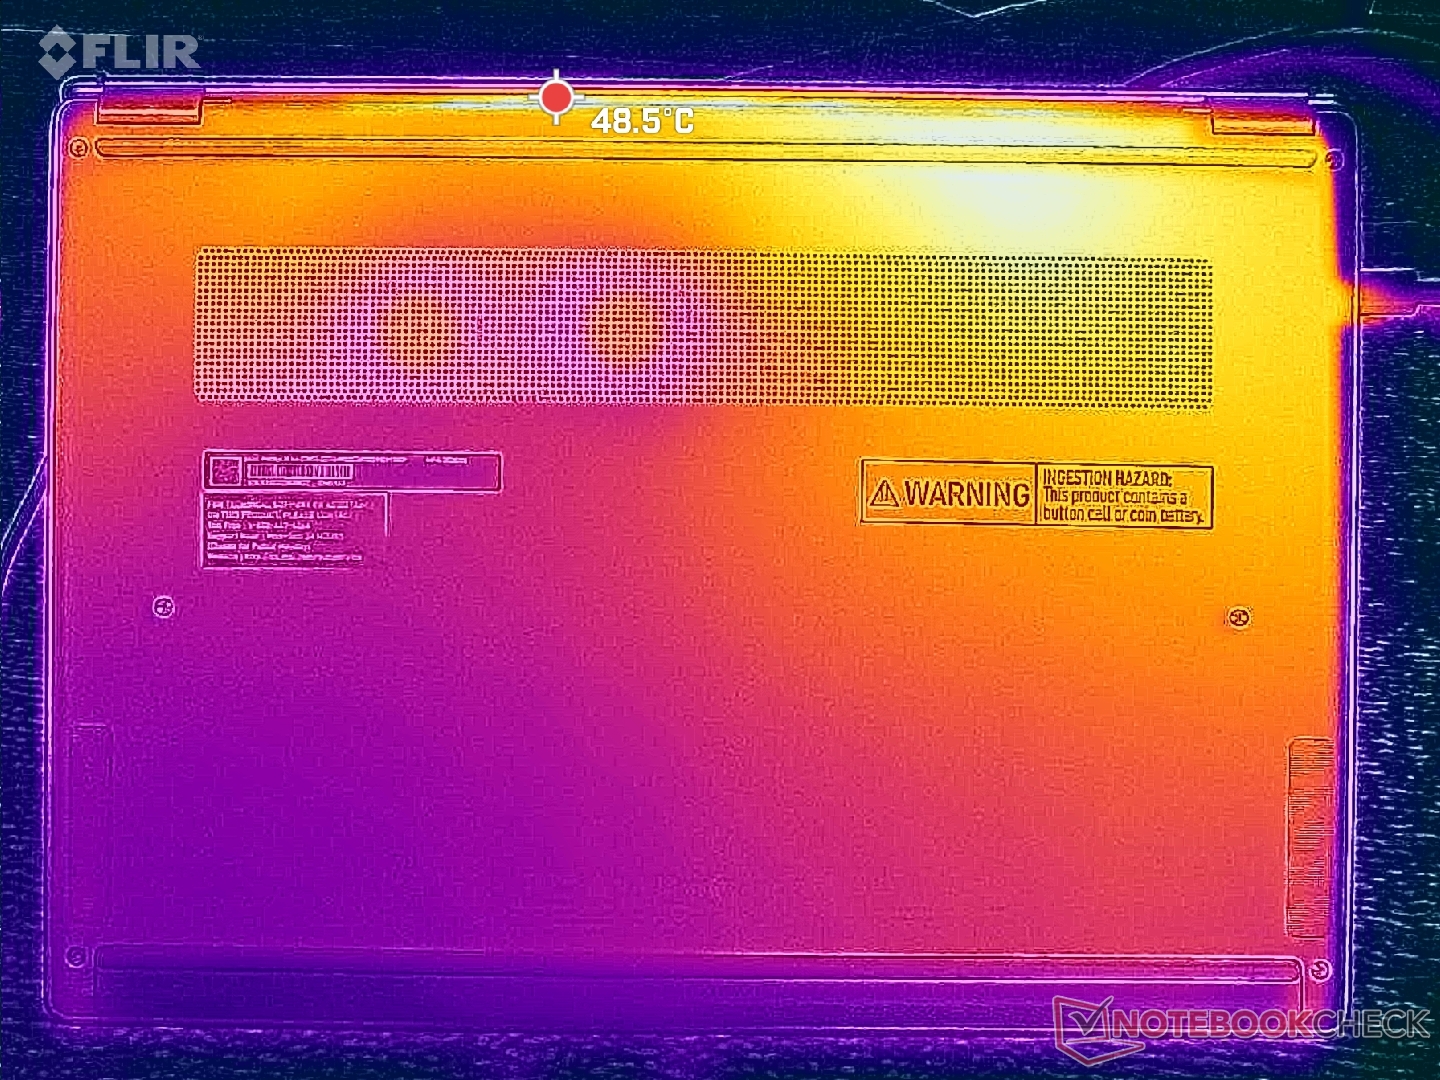
Die Oberflächentemperaturen sind eine Verbesserung gegenüber der vorherigen Generation. Während das Prestige 16 aus dem Jahr 2025 Temperaturen von 47 bis 52 Grad Celsius erreichte, liegt die Höchsttemperatur des neueren Modells bei 40 bis 47 Grad Celsius. Die heißen Stellen befinden sich in der Nähe der hinteren Ecke des Gehäuses, wo der Hautkontakt minimiert ist.
Trotzdem sind die Oberflächentemperaturen immer noch wärmer als beim konkurrierenden XPS 16, bei dem die Hotspots unabhängig von der Seite nur 41 °C erreichen, was einen kühleren Durchschnitt ergibt.
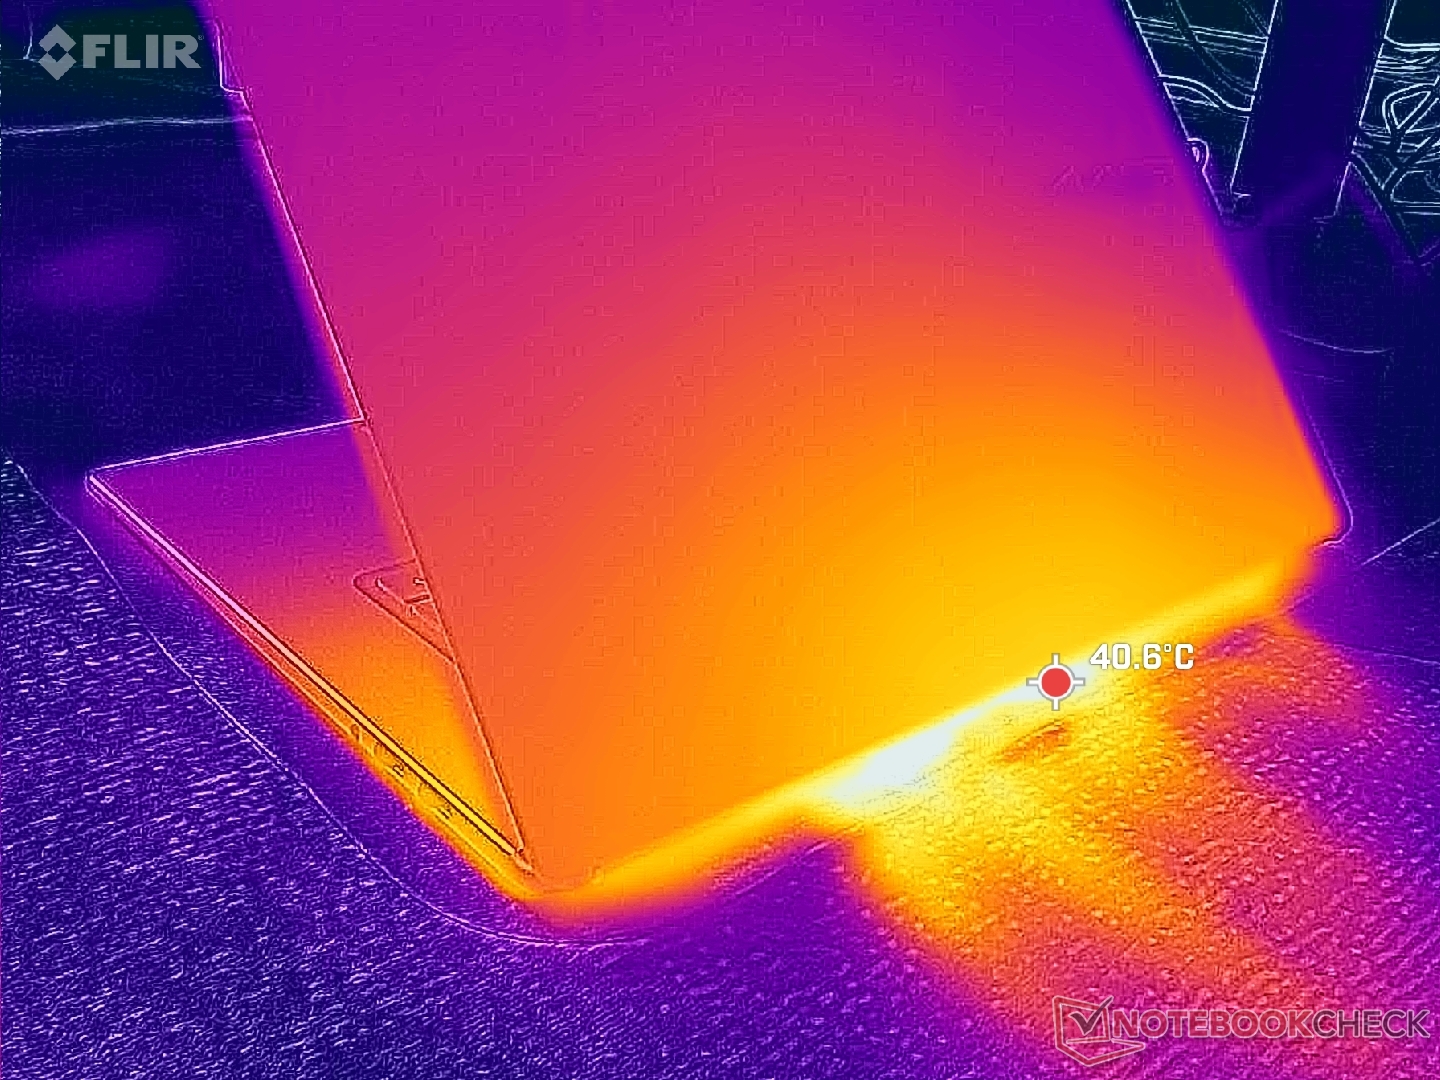
(-) Die maximale Temperatur auf der Oberseite ist 47 °C. Im Vergleich liegt der Klassendurchschnitt bei 36.8 °C (von 21 bis 71 °C für die Klasse Multimedia).
(±) Auf der Unterseite messen wir eine maximalen Wert von 40 °C (im Vergleich zum Durchschnitt von 39.1 °C).
(+) Ohne Last messen wir eine durchschnittliche Temperatur von 24.8 °C auf der Oberseite. Der Klassendurchschnitt erreicht 31.3 °C.
(+) Die Handballen und der Touchpad-Bereich sind mit gemessenen 30.4 °C kühler als die typische Hauttemperatur und fühlen sich dadurch kühl an.
(±) Die durchschnittliche Handballen-Temperatur anderer getesteter Geräte war 28.7 °C (-1.7 °C).
| MSI Prestige 16 AI C3MTG Ultra X7 358H, Arc B390 Panther Lake iGPU | MSI Prestige 16 AI Evo B2HMG Ultra 9 285H, Arc 140T | Dell XPS 16 Core Ultra X7 358H Ultra X7 358H, Arc B390 Panther Lake iGPU | Asus ZenBook S16 UM5606GA Ryzen AI 9 465, Radeon 880M | Lenovo ThinkBook 16 G7+ AMD Ryzen AI 9 365, Radeon 880M | HP Envy x360 2-in-1 16-ad0097nr R7 8840HS, Radeon 780M | |
|---|---|---|---|---|---|---|
| Hitze | -5% | 11% | -1% | 9% | -3% | |
| Last oben max * (°C) | 47 | 48.1 -2% | 40.6 14% | 43.4 8% | 38.2 19% | 42.6 9% |
| Last unten max * (°C) | 40 | 51.6 -29% | 39.8 1% | 46.2 -16% | 37.9 5% | 47.8 -19% |
| Idle oben max * (°C) | 27.4 | 25.9 5% | 23.2 15% | 26.5 3% | 25.4 7% | 27.4 -0% |
| Idle unten max * (°C) | 27.4 | 25.2 8% | 23.8 13% | 27 1% | 25.7 6% | 27.8 -1% |
* ... kleinere Werte sind besser
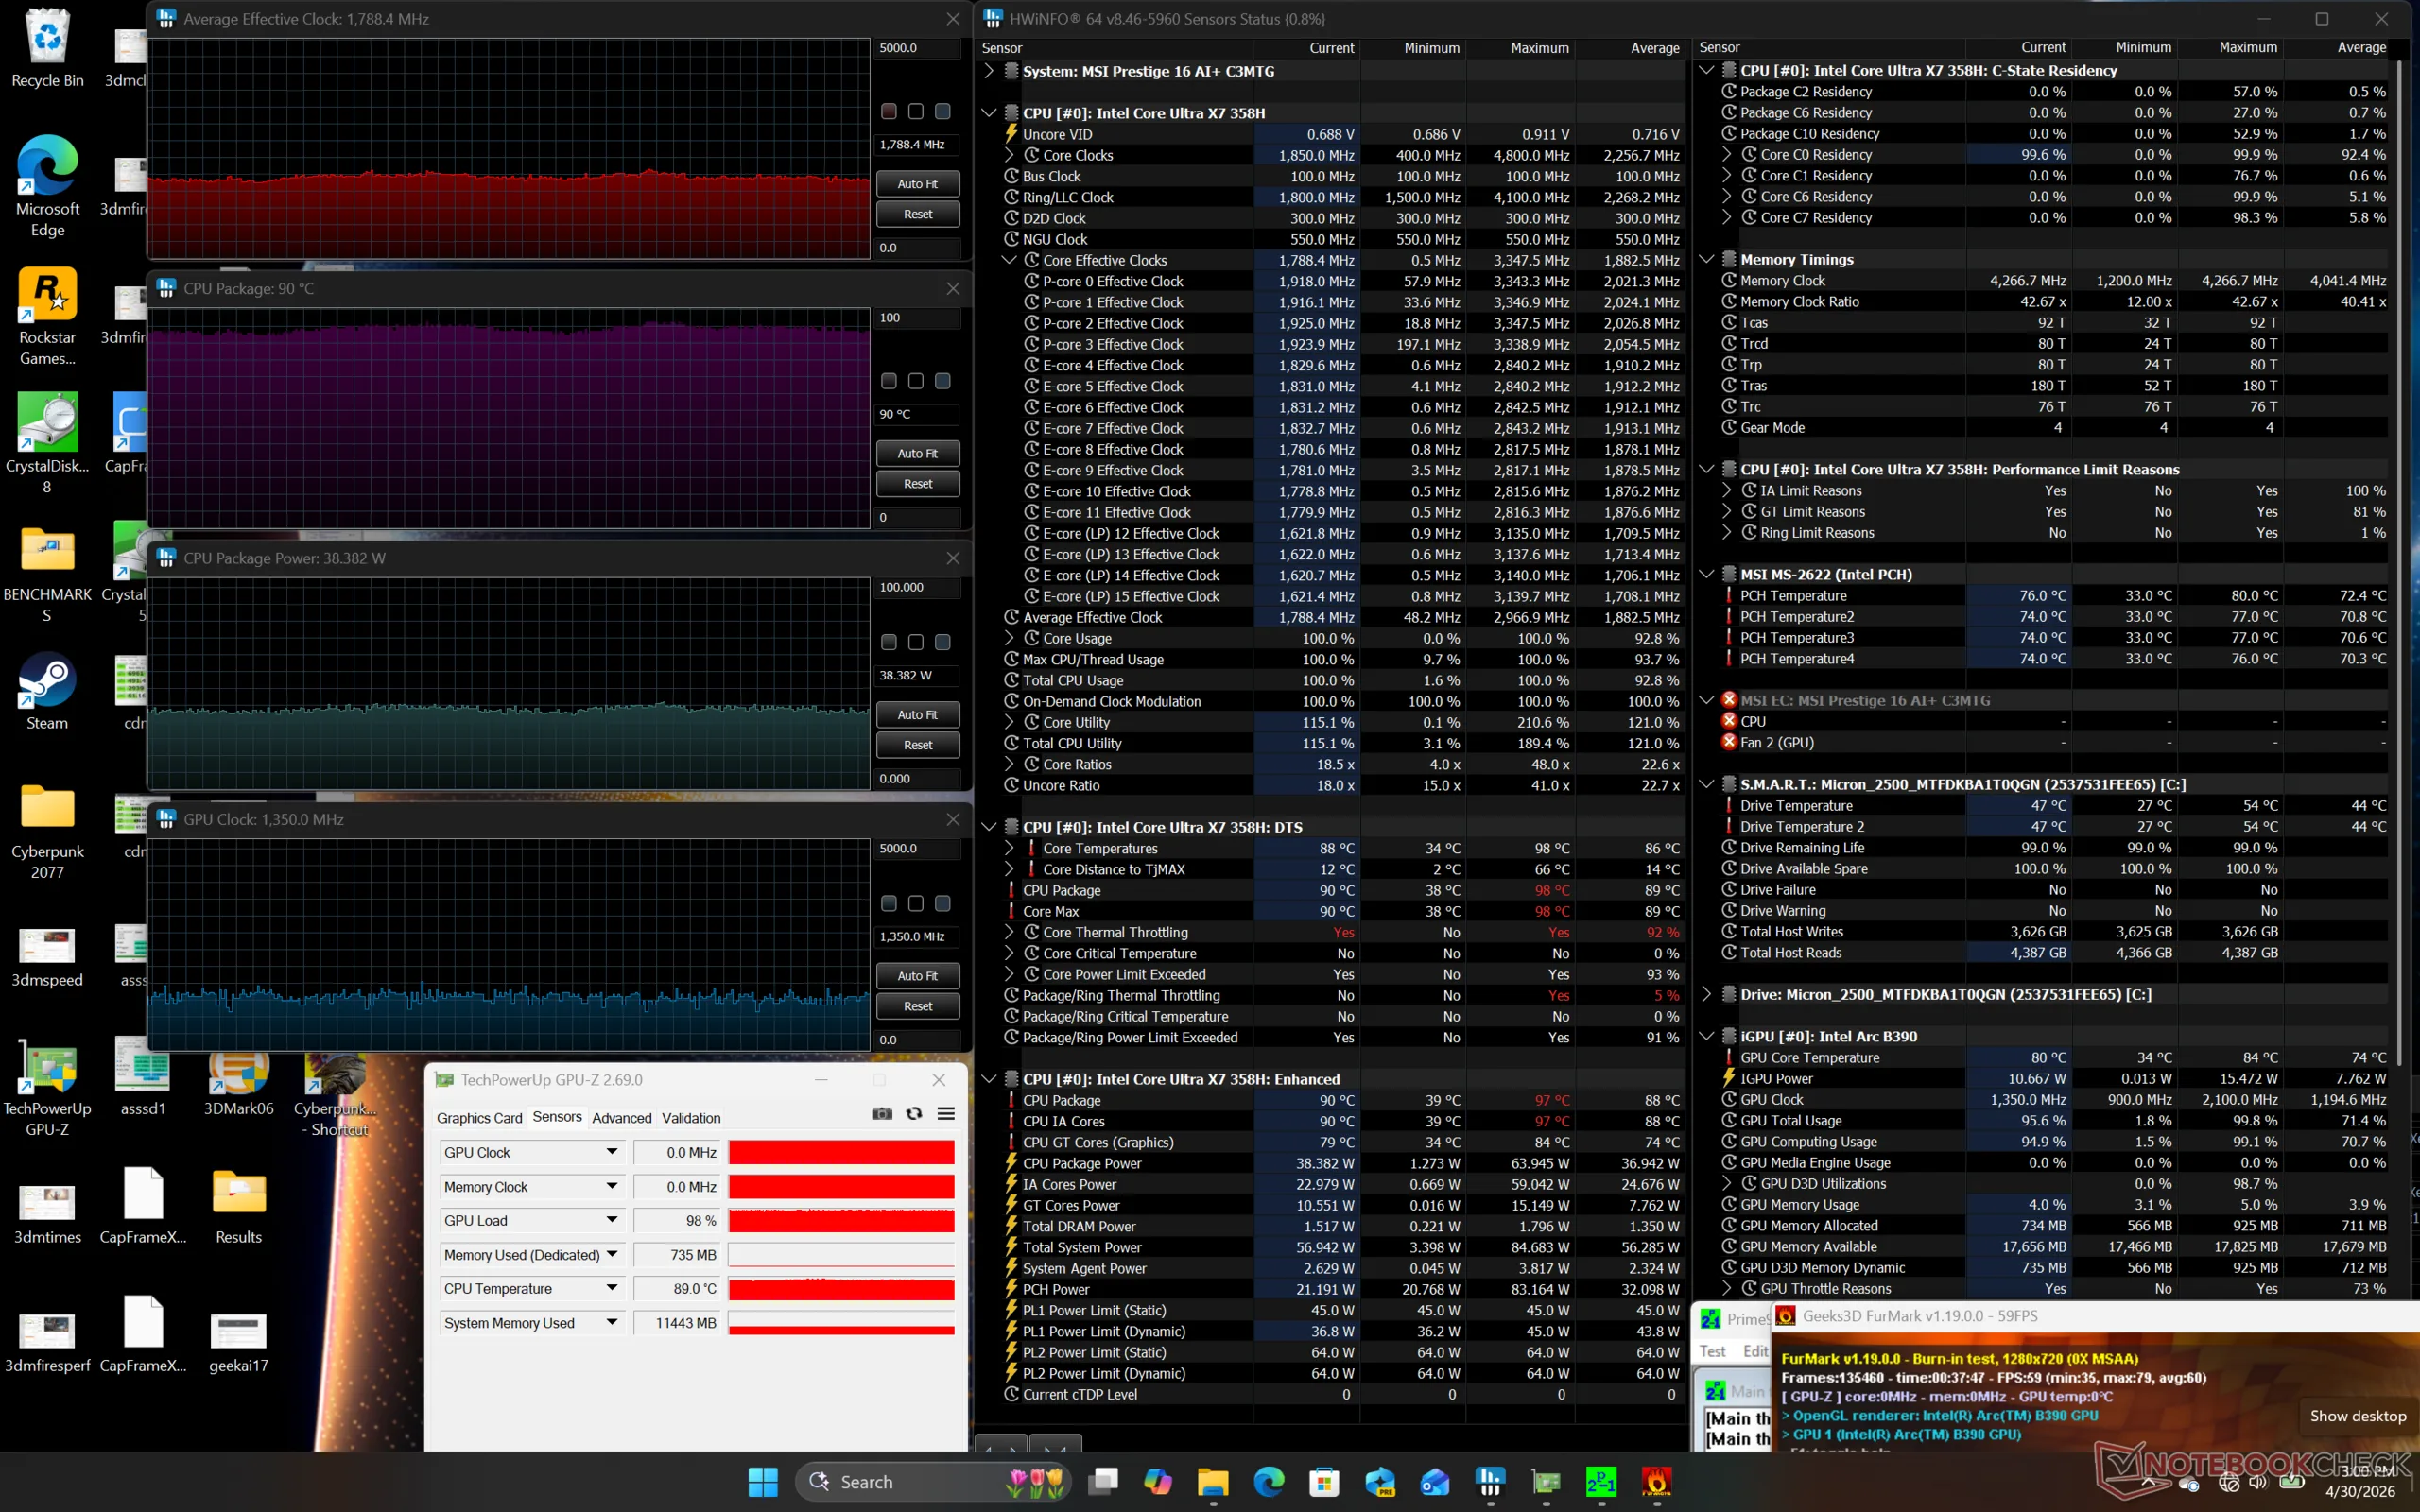
Stresstest
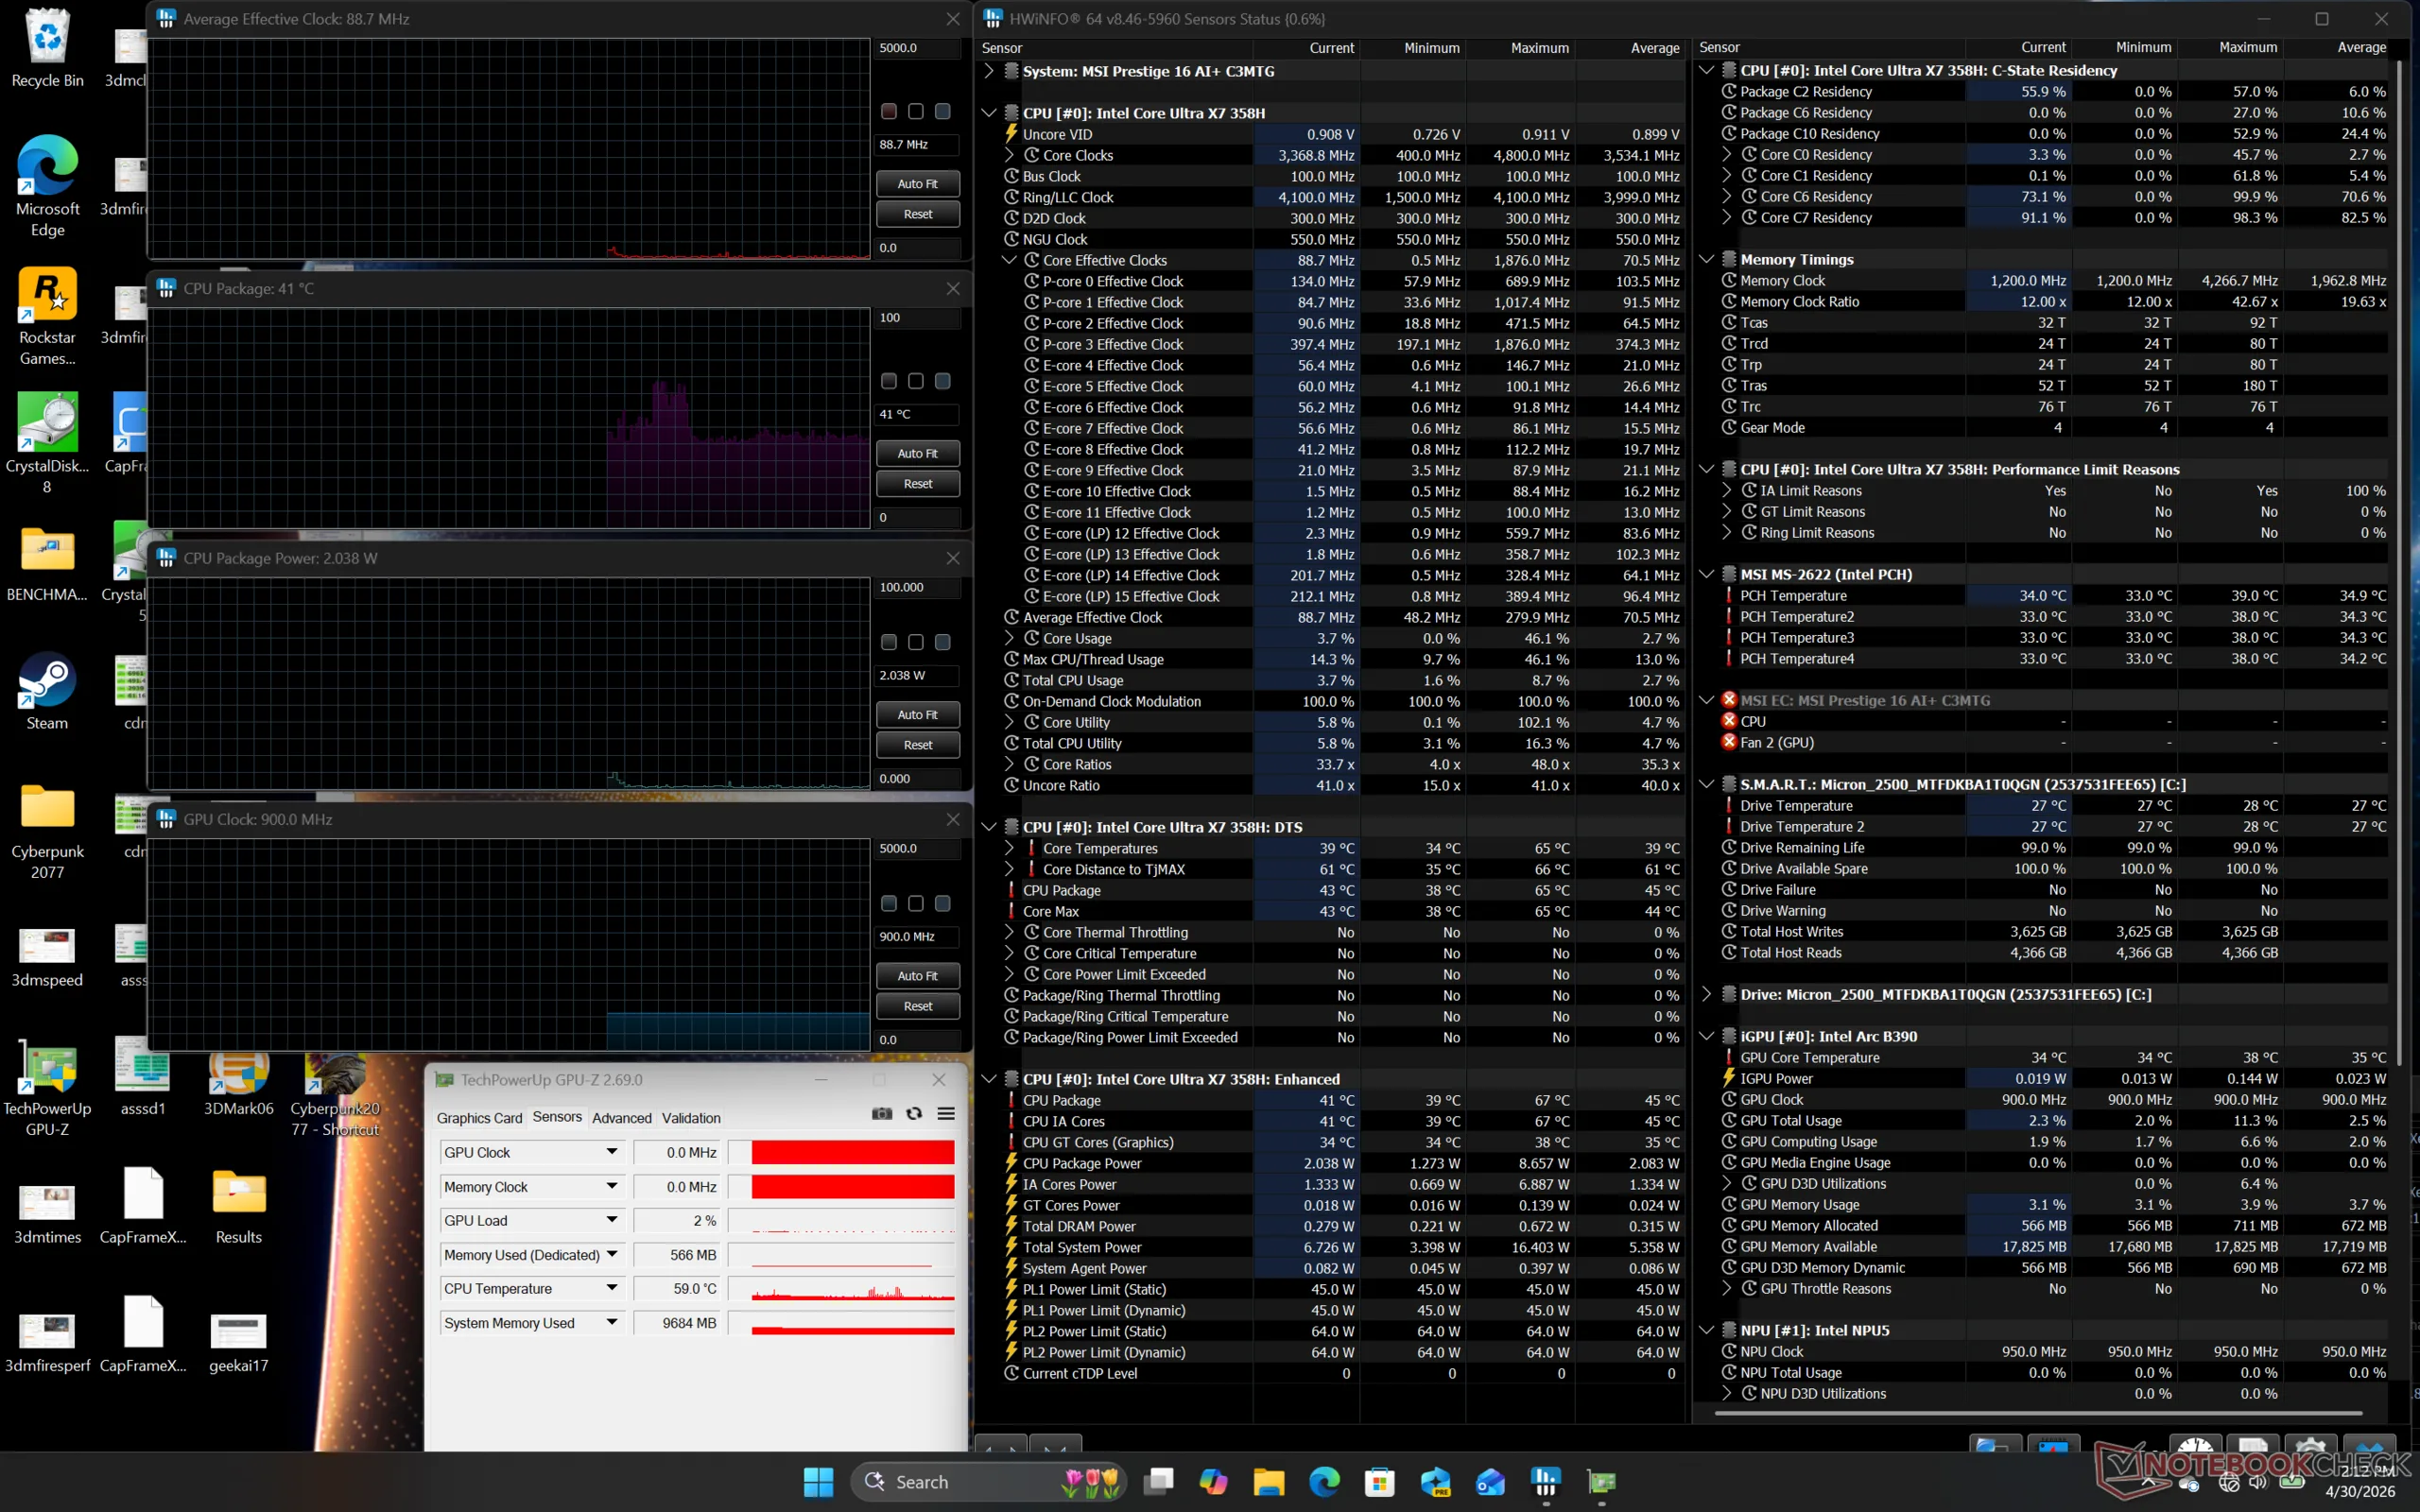
Unter Prime95-Stress boostet die CPU zunächst auf 3 GHz, 64 W und 97 °C, bevor sie schnell auf 2,3 GHz und 39 W fällt, um eine stabile Kerntemperatur von 90 °C aufrechtzuerhalten. Die Ergebnisse sind wärmer als die, die wir auf dem XPS 16 mit genau der gleichen CPU aufgezeichnet haben, wo sich die Kerntemperatur im Vergleich dazu bei nur 78 °C stabilisiert hat.
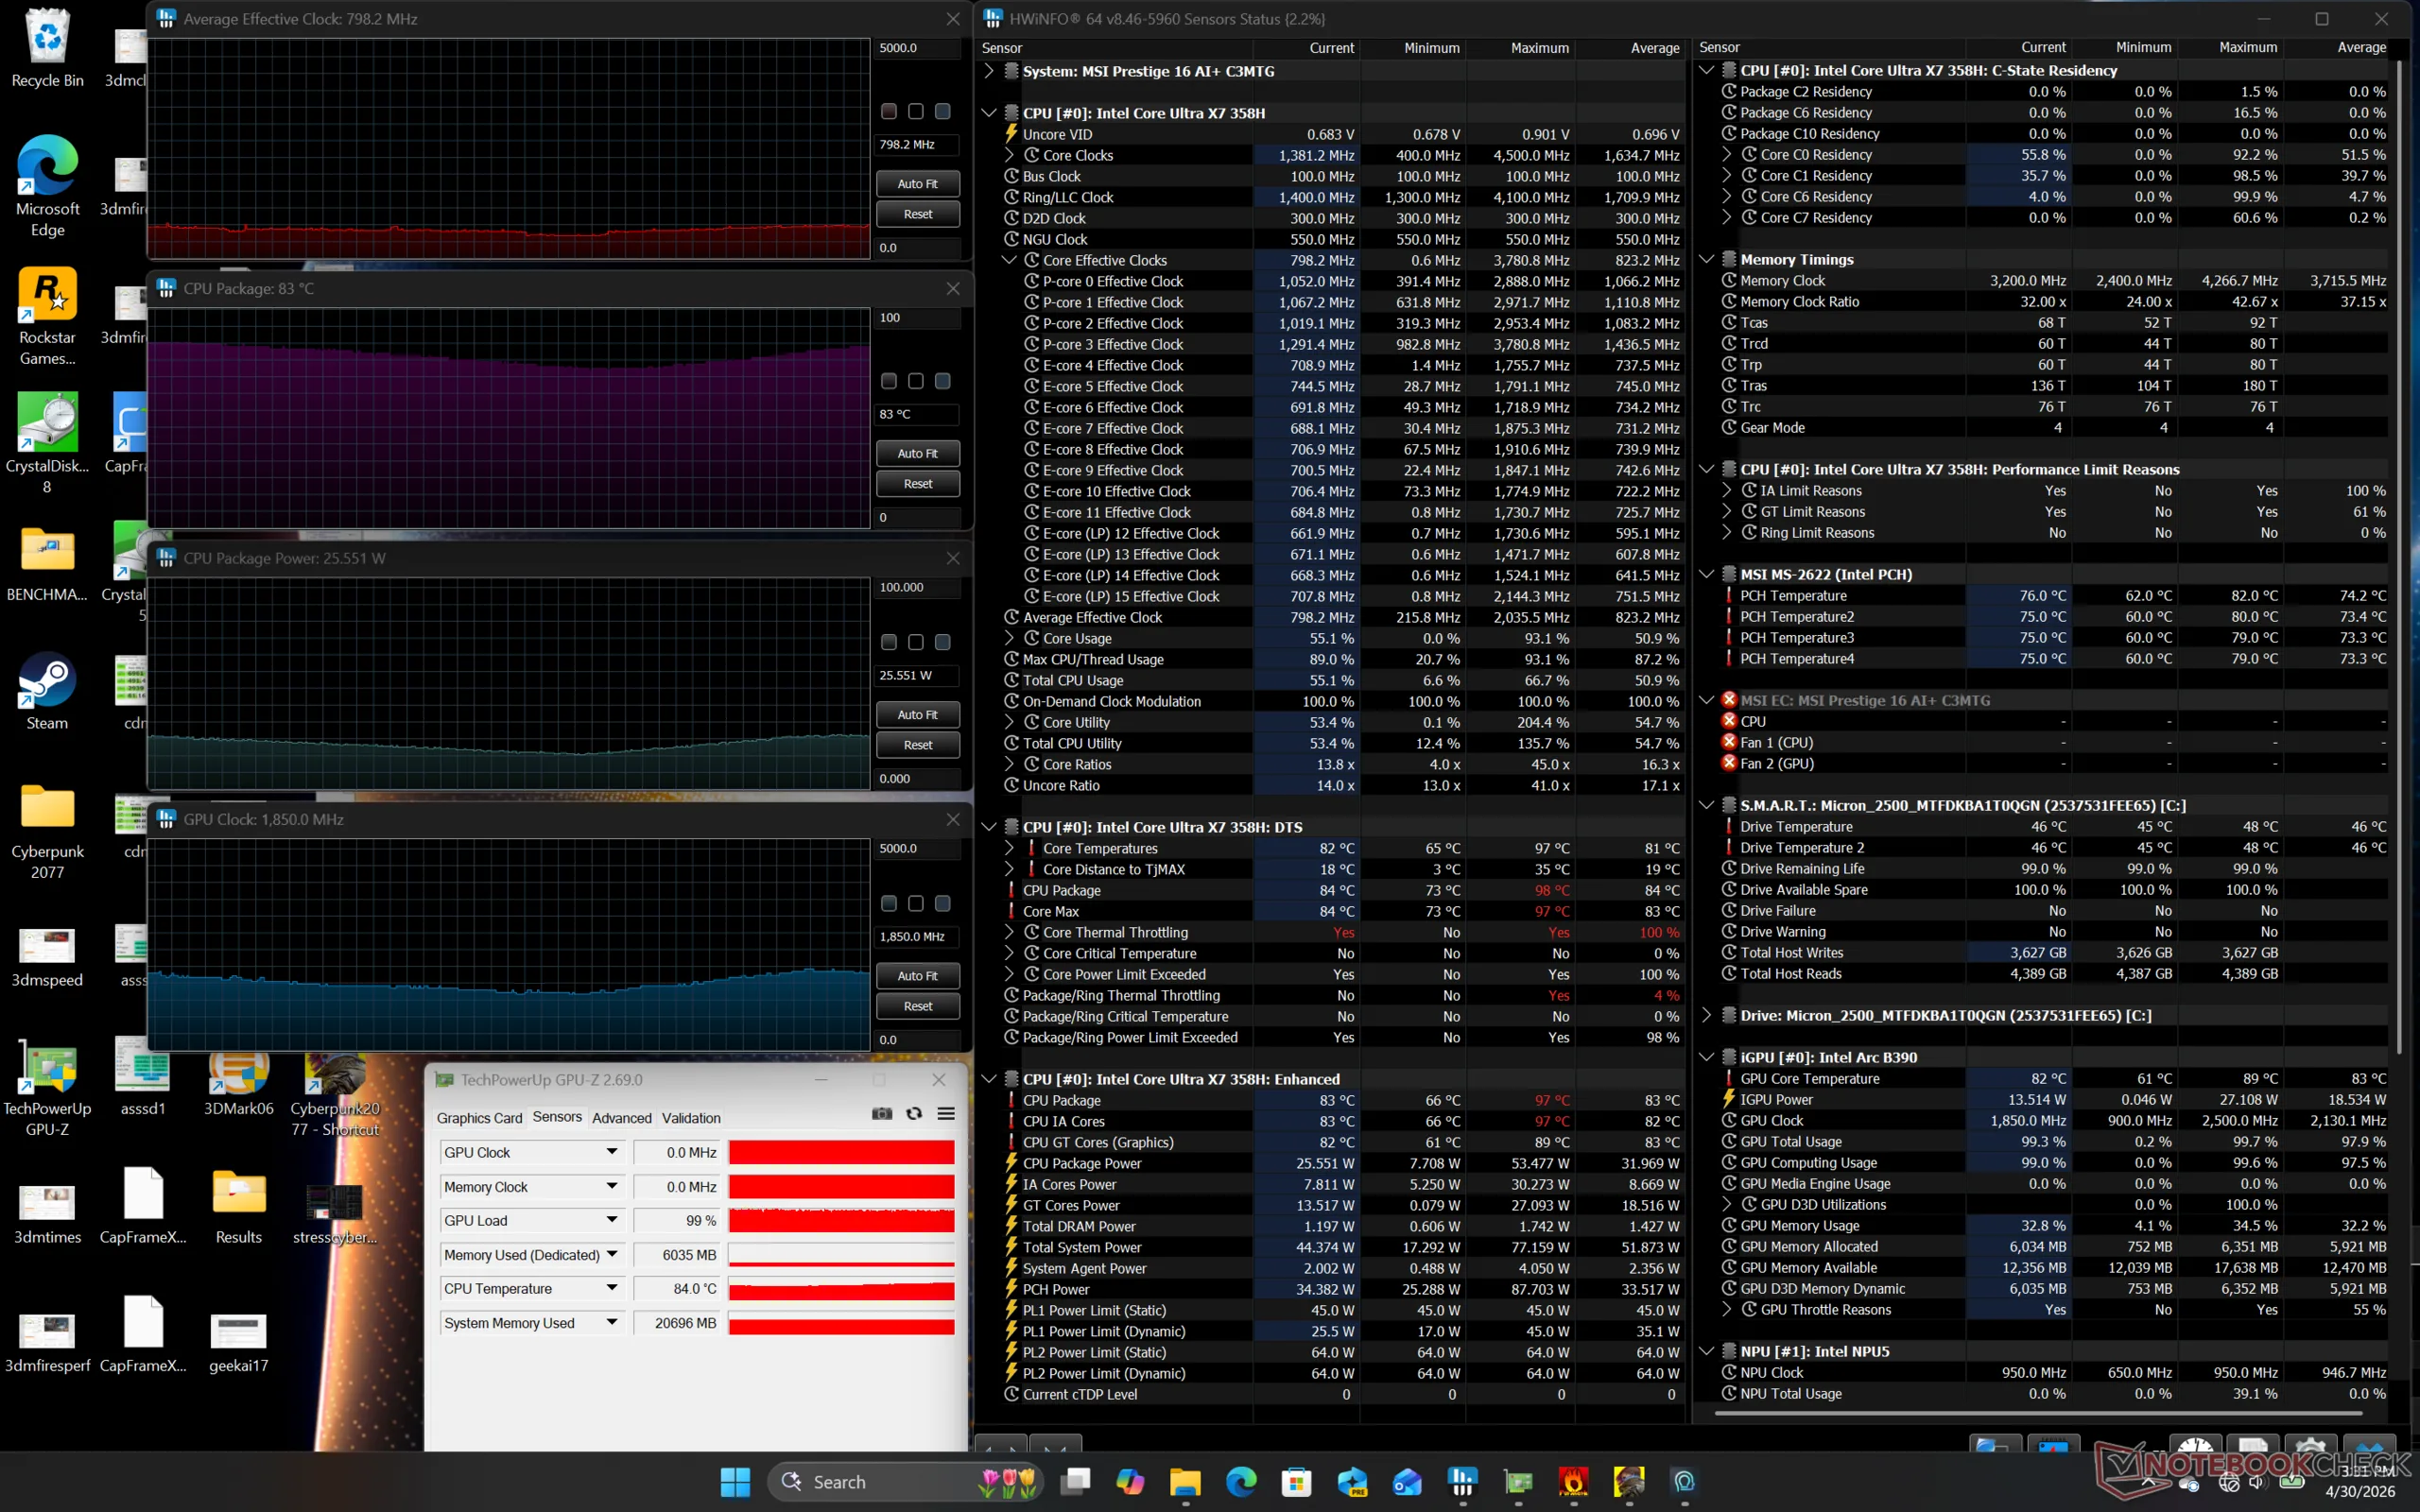
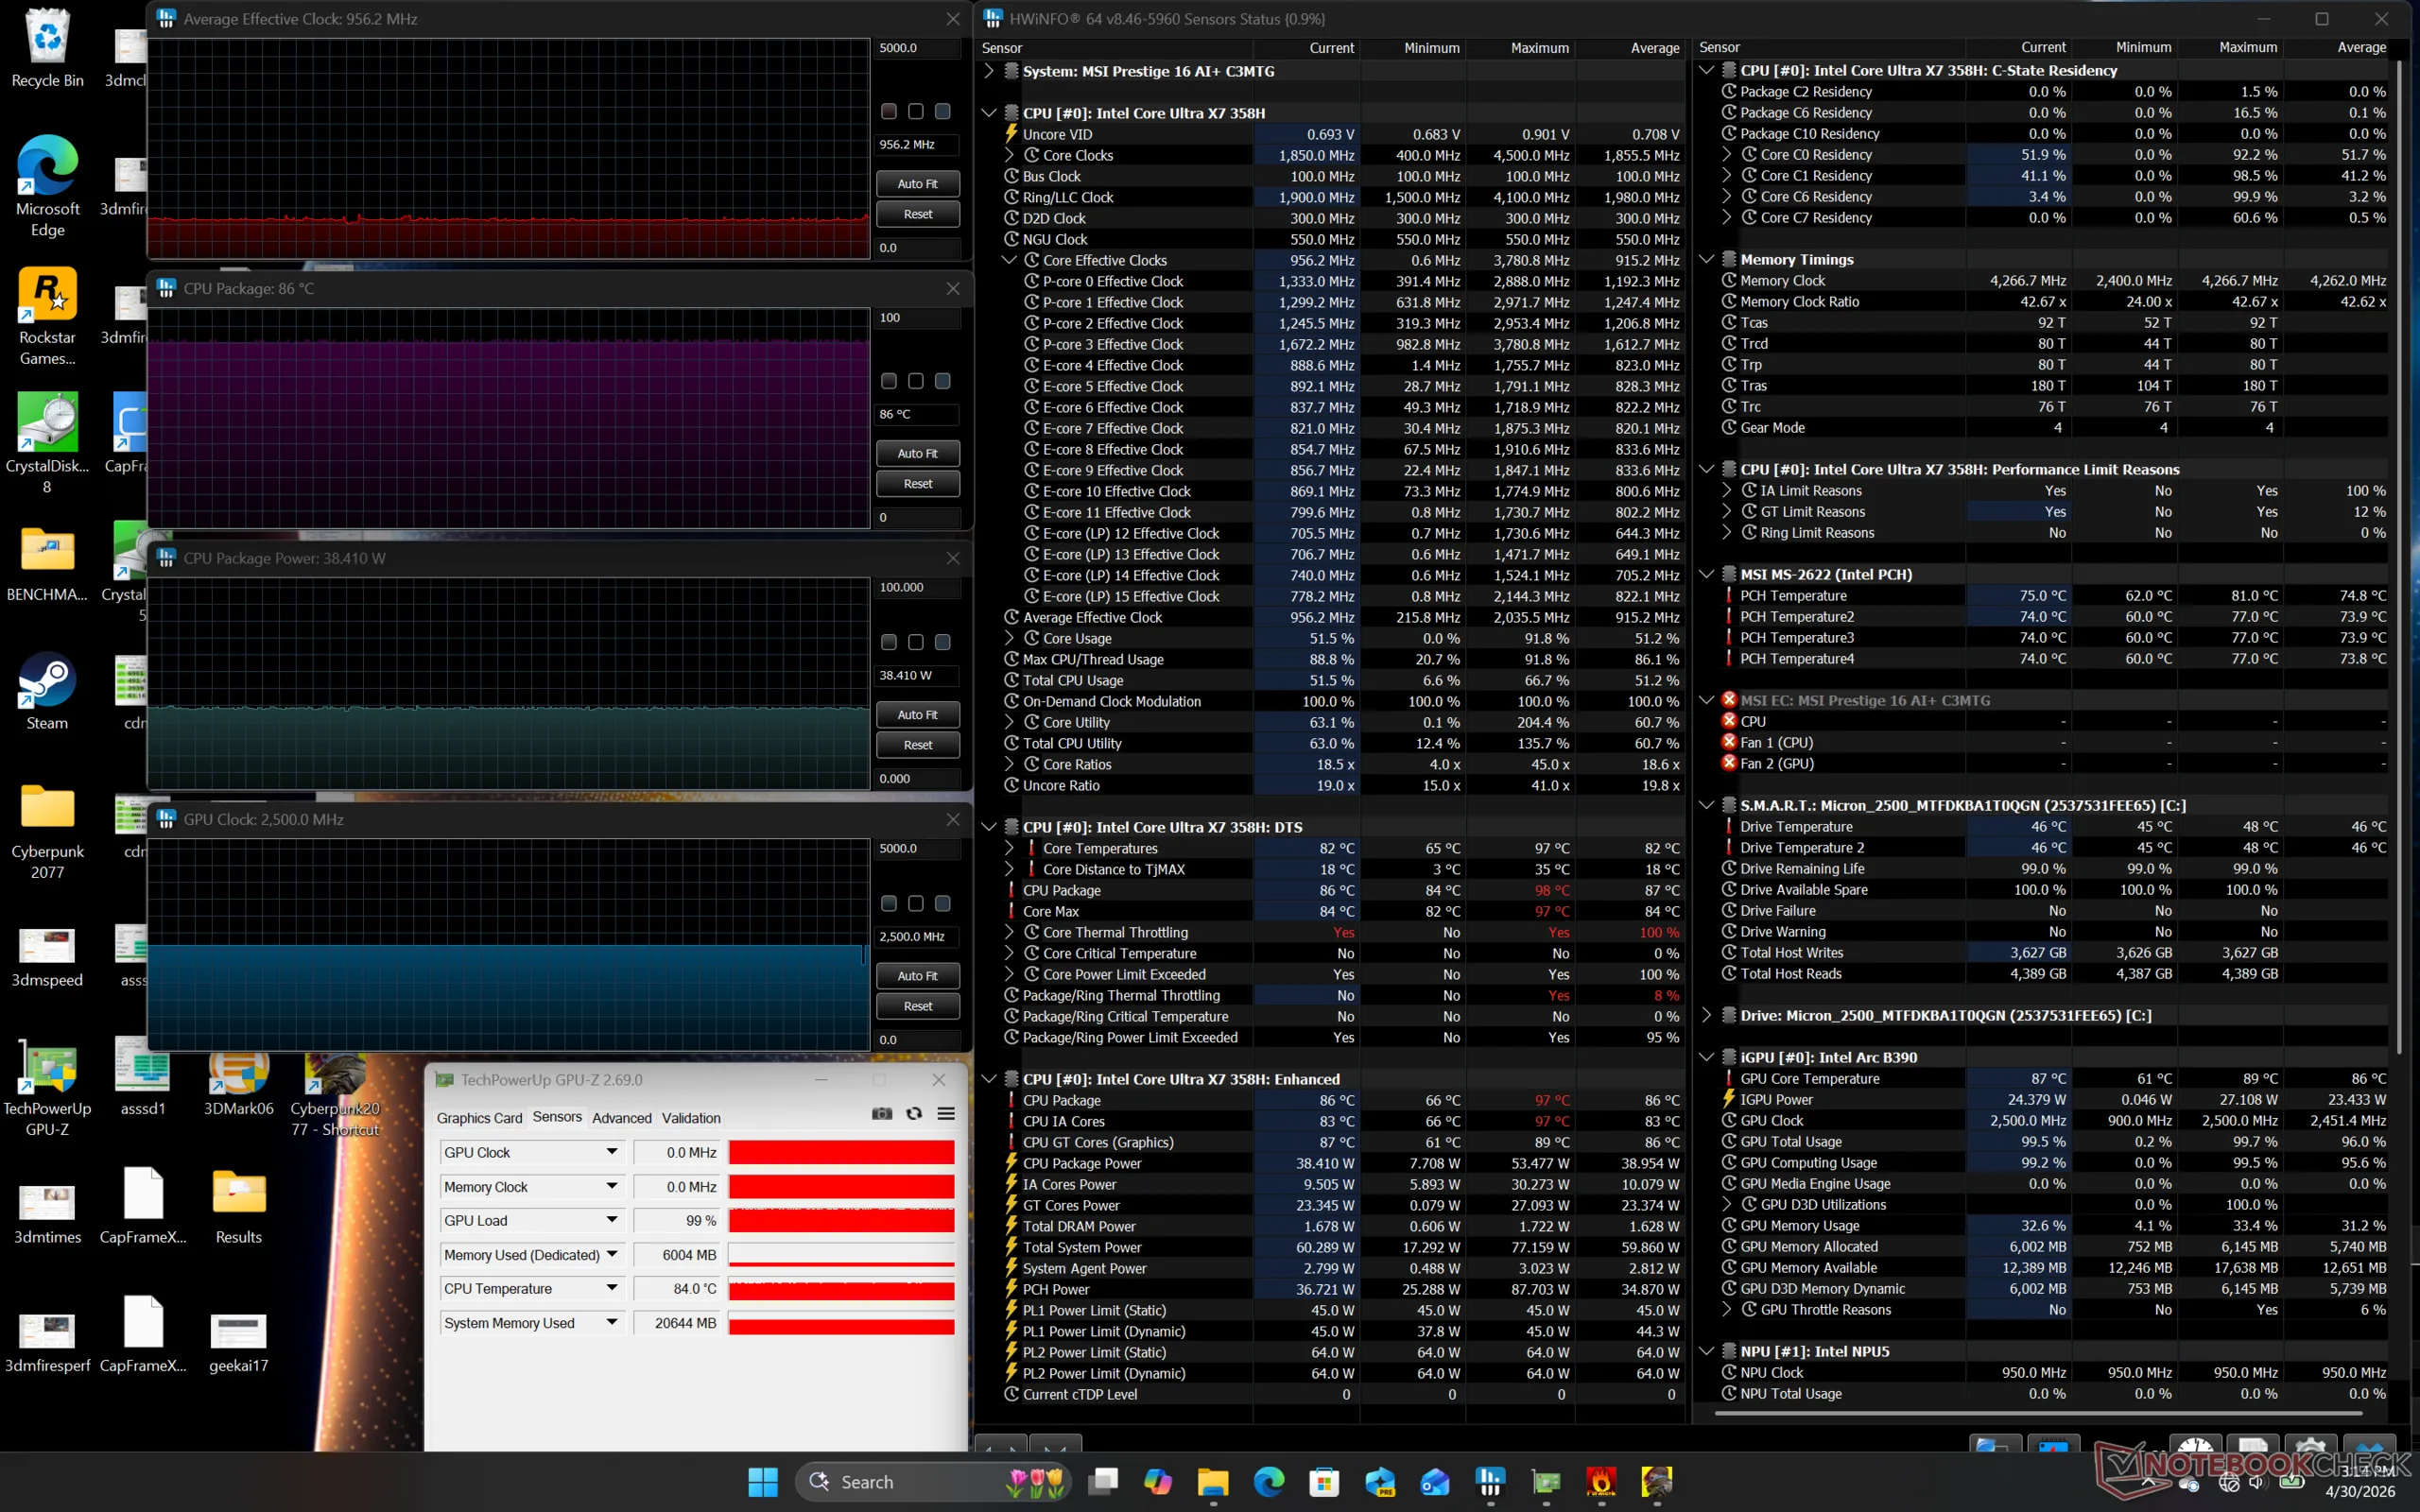
Beim Spielen von Cyberpunk 2077 im Performance-Modus zur Simulation von Gaming-Belastung stabilisierte sich die GPU bei 2.500 MHz, 38 W und 86 °C – wieder deutlich wärmer als das erwähnte Dell um über 20 °C. Im Balanced-Modus schwankte die GPU zwischen 1.220 und 1.850 MHz sowie 16 und 26 W, was mit der oben genannten langsameren Grafikleistung und dem leiseren Lüftergeräusch übereinstimmt.
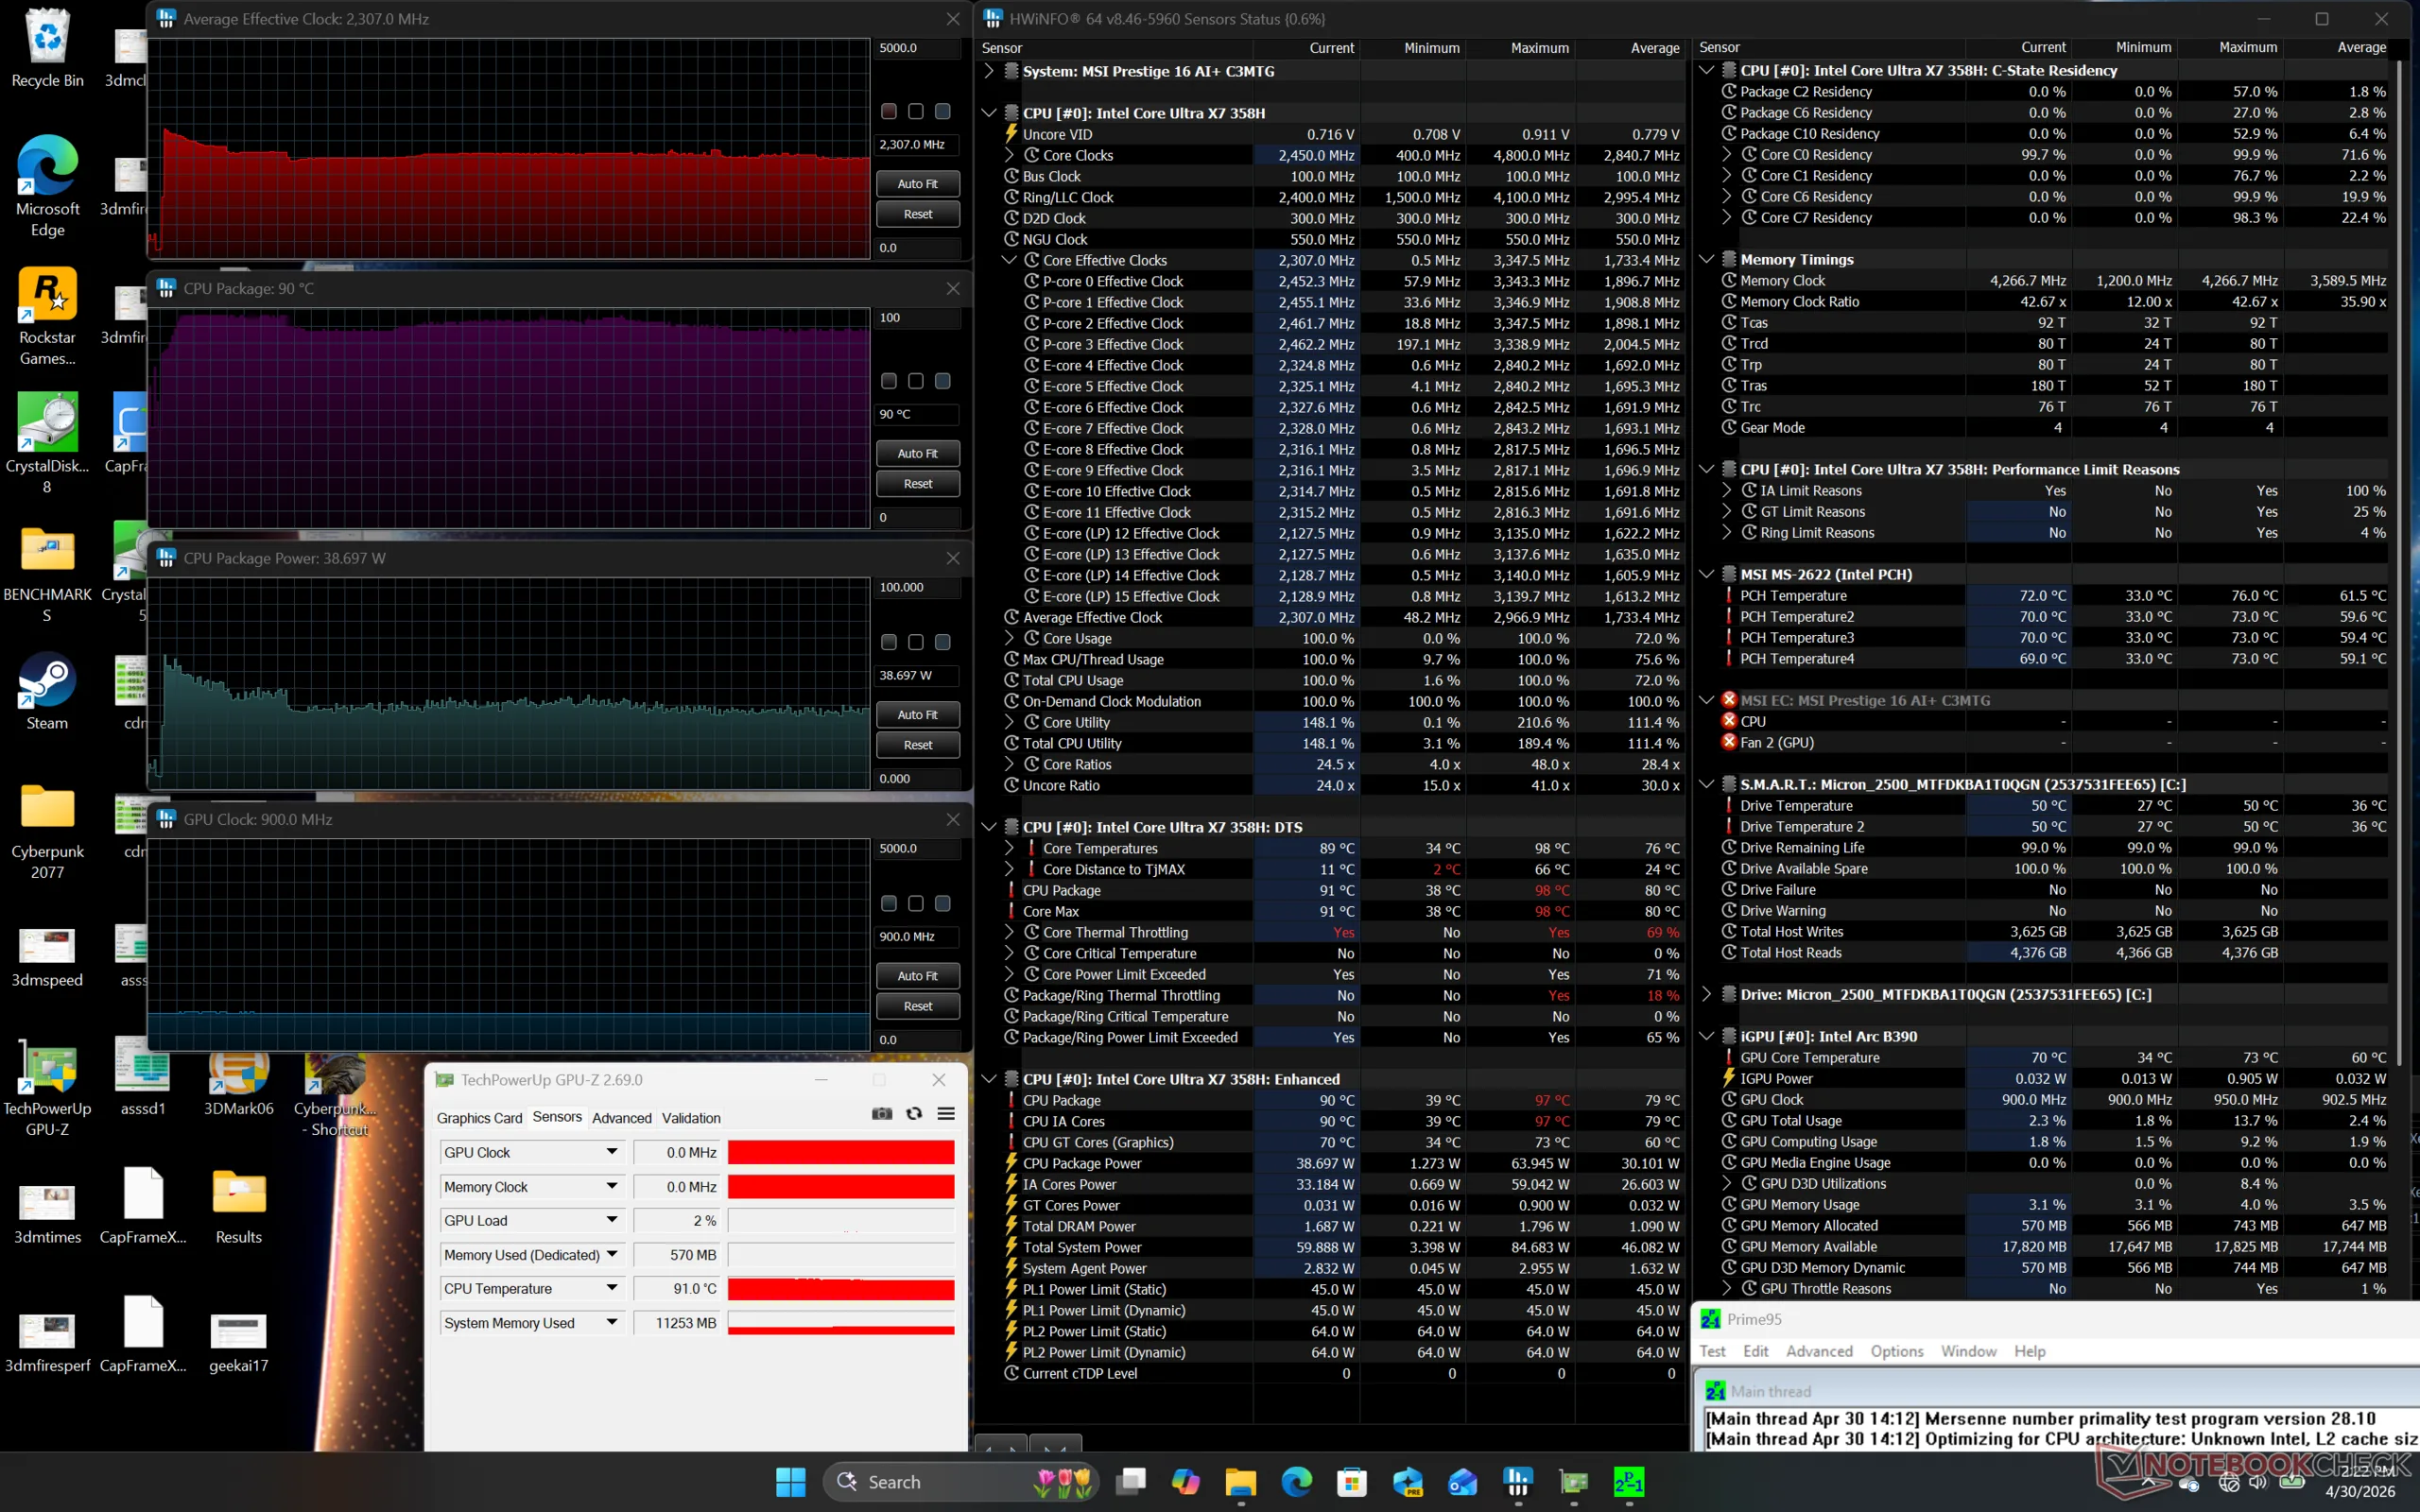
| durchschnittlicher CPU-Takt (GHz) | GPU-Takt (MHz) | durchschnittliche CPU-Temperatur (°C) | |
| System Leerlauf | -- | 900 | 41 |
| Prime95 Stress | 2,3 | -- | 90 |
| Prime95 + FurMark Stress | 1,8 | ~1.350 | 90 |
| Cyberpunk 2077 Stress (Balanced-Modus) | 0,8 | 1.220-1.850 | 83 |
| Cyberpunk 2077 Stress (Performance-Modus) | 1,0 | 2.500 | 86 |
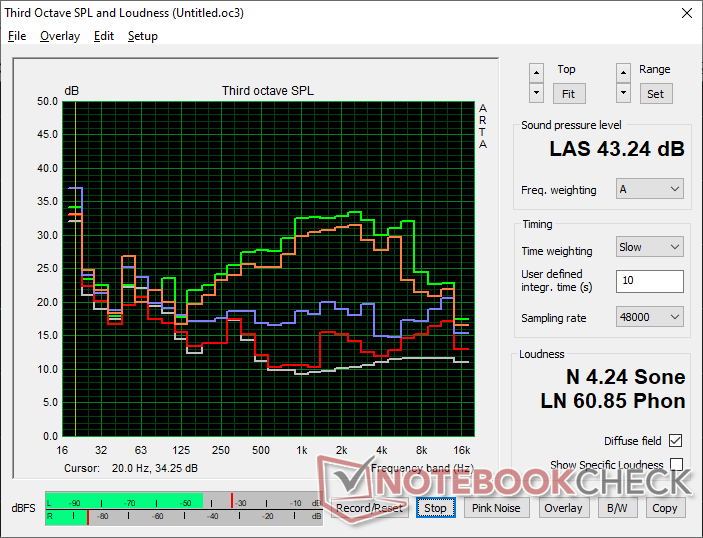
Lautsprecher
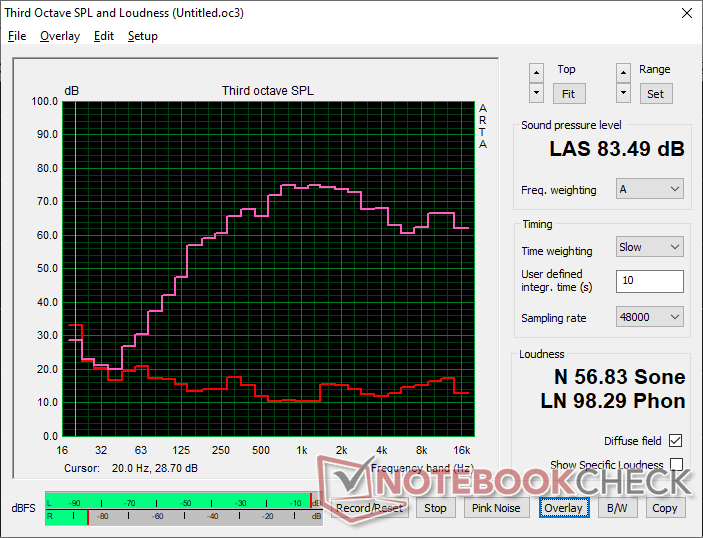
MSI Prestige 16 AI C3MTG Audio Analyse
(+) | Die Lautsprecher können relativ laut spielen (83.5 dB)
Bass 100 - 315 Hz
(±) | abgesenkter Bass - 11.2% geringer als der Median
(±) | durchschnittlich lineare Bass-Wiedergabe (9% Delta zum Vorgänger)
Mitteltöne 400 - 2000 Hz
(±) | zu hohe Mitten, vom Median 5.9% abweichend
(+) | lineare Mitten (4% Delta zum Vorgänger)
Hochtöne 2 - 16 kHz
(+) | ausgeglichene Hochtöne, vom Median nur 3.3% abweichend
(+) | sehr lineare Hochtöne (5.4% Delta zum Vorgänger)
Gesamt im hörbaren Bereich 100 - 16.000 Hz
(+) | hörbarer Bereich ist sehr linear (12.8% Abstand zum Median
Im Vergleich zu allen Geräten derselben Klasse
» 24% aller getesteten Geräte dieser Klasse waren besser, 5% vergleichbar, 71% schlechter
» Das beste Gerät hat einen Delta-Wert von 5%, durchschnittlich ist 17%, das schlechteste Gerät hat 45%
Im Vergleich zu allen Geräten im Test
» 12% aller getesteten Geräte waren besser, 3% vergleichbar, 85% schlechter
» Das beste Gerät hat einen Delta-Wert von 4%, durchschnittlich ist 24%, das schlechteste Gerät hat 134%
Apple MacBook Pro 16 2021 M1 Pro Audio Analyse
(+) | Die Lautsprecher können relativ laut spielen (84.7 dB)
Bass 100 - 315 Hz
(+) | guter Bass - nur 3.8% Abweichung vom Median
(+) | lineare Bass-Wiedergabe (5.2% Delta zum Vorgänger)
Mitteltöne 400 - 2000 Hz
(+) | ausgeglichene Mitten, vom Median nur 1.3% abweichend
(+) | lineare Mitten (2.1% Delta zum Vorgänger)
Hochtöne 2 - 16 kHz
(+) | ausgeglichene Hochtöne, vom Median nur 1.9% abweichend
(+) | sehr lineare Hochtöne (2.7% Delta zum Vorgänger)
Gesamt im hörbaren Bereich 100 - 16.000 Hz
(+) | hörbarer Bereich ist sehr linear (4.6% Abstand zum Median
Im Vergleich zu allen Geräten derselben Klasse
» 0% aller getesteten Geräte dieser Klasse waren besser, 0% vergleichbar, 100% schlechter
» Das beste Gerät hat einen Delta-Wert von 5%, durchschnittlich ist 17%, das schlechteste Gerät hat 45%
Im Vergleich zu allen Geräten im Test
» 0% aller getesteten Geräte waren besser, 0% vergleichbar, 100% schlechter
» Das beste Gerät hat einen Delta-Wert von 4%, durchschnittlich ist 24%, das schlechteste Gerät hat 134%
Energieverwaltung
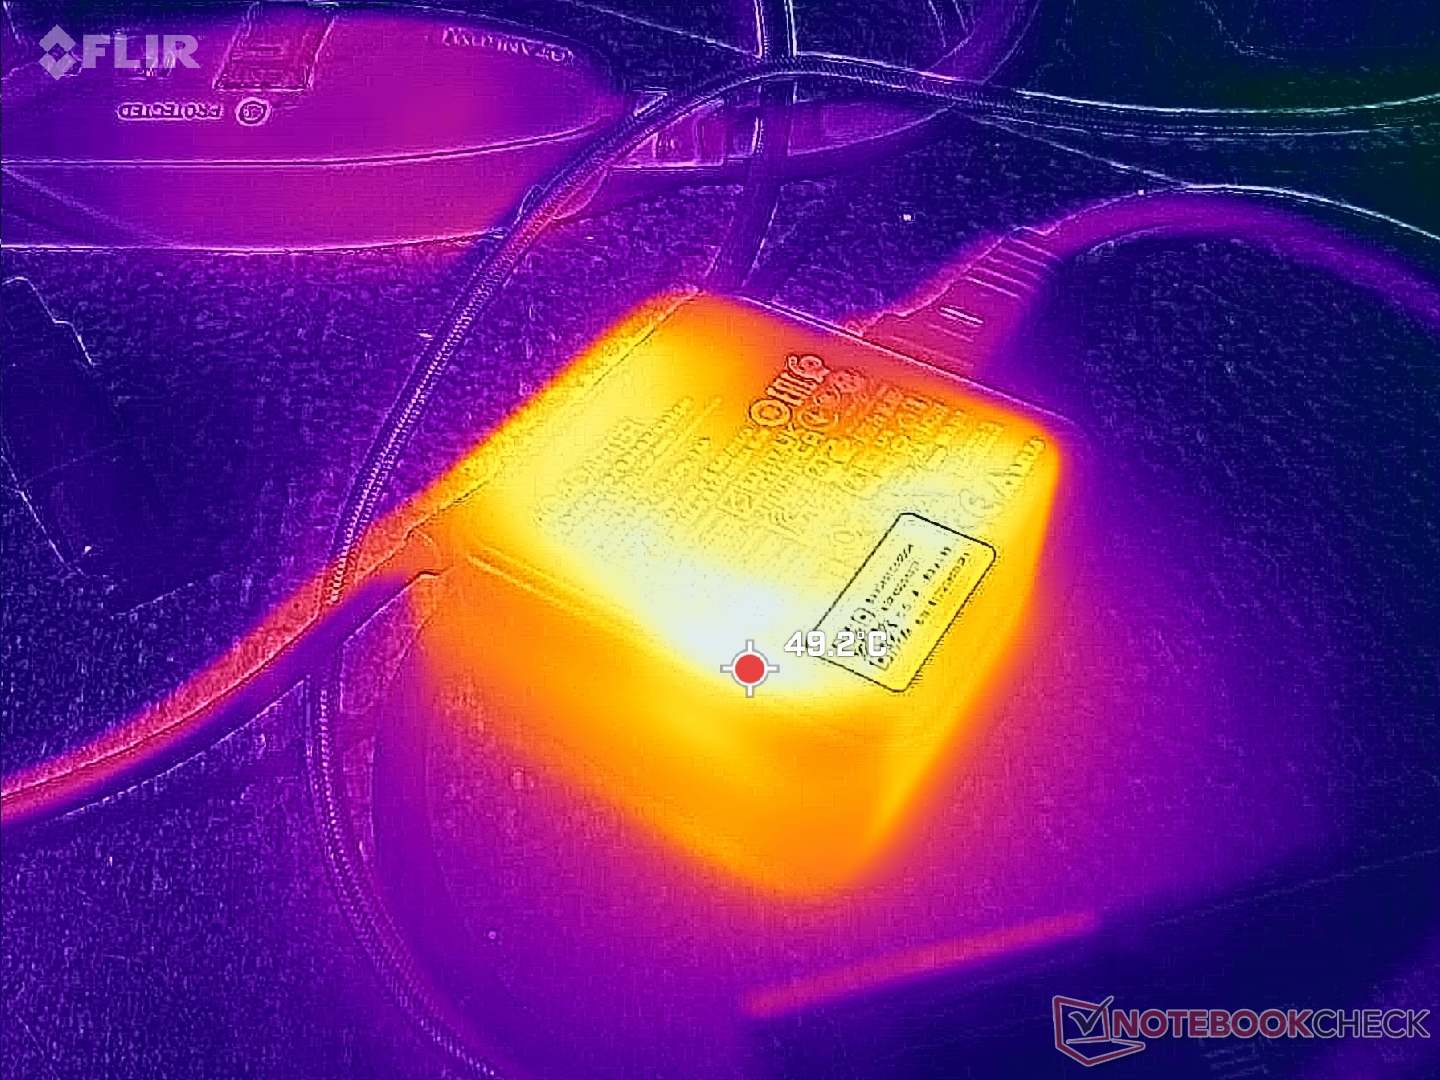
Stromverbrauch
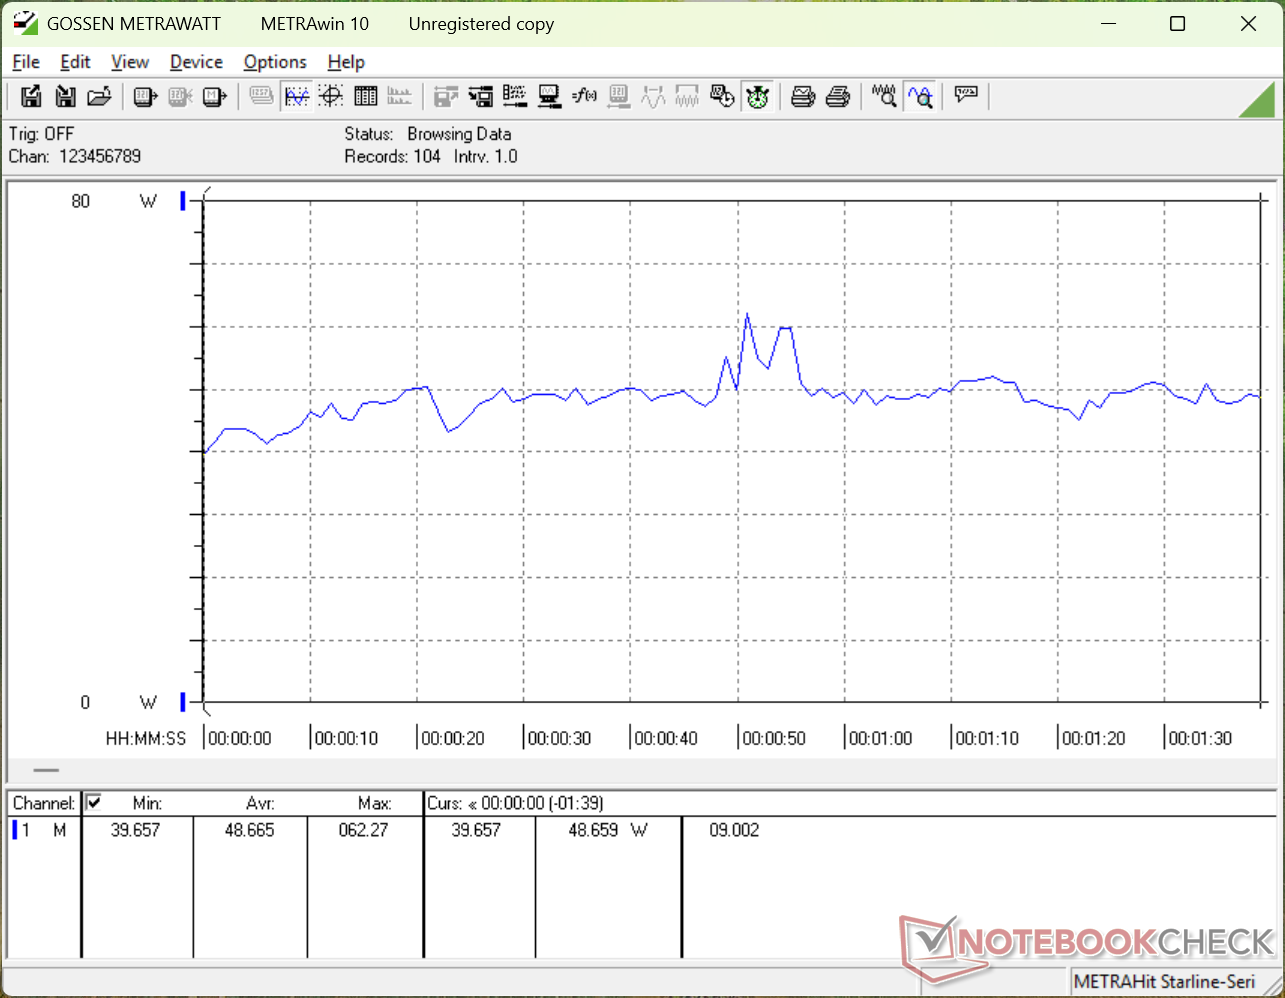
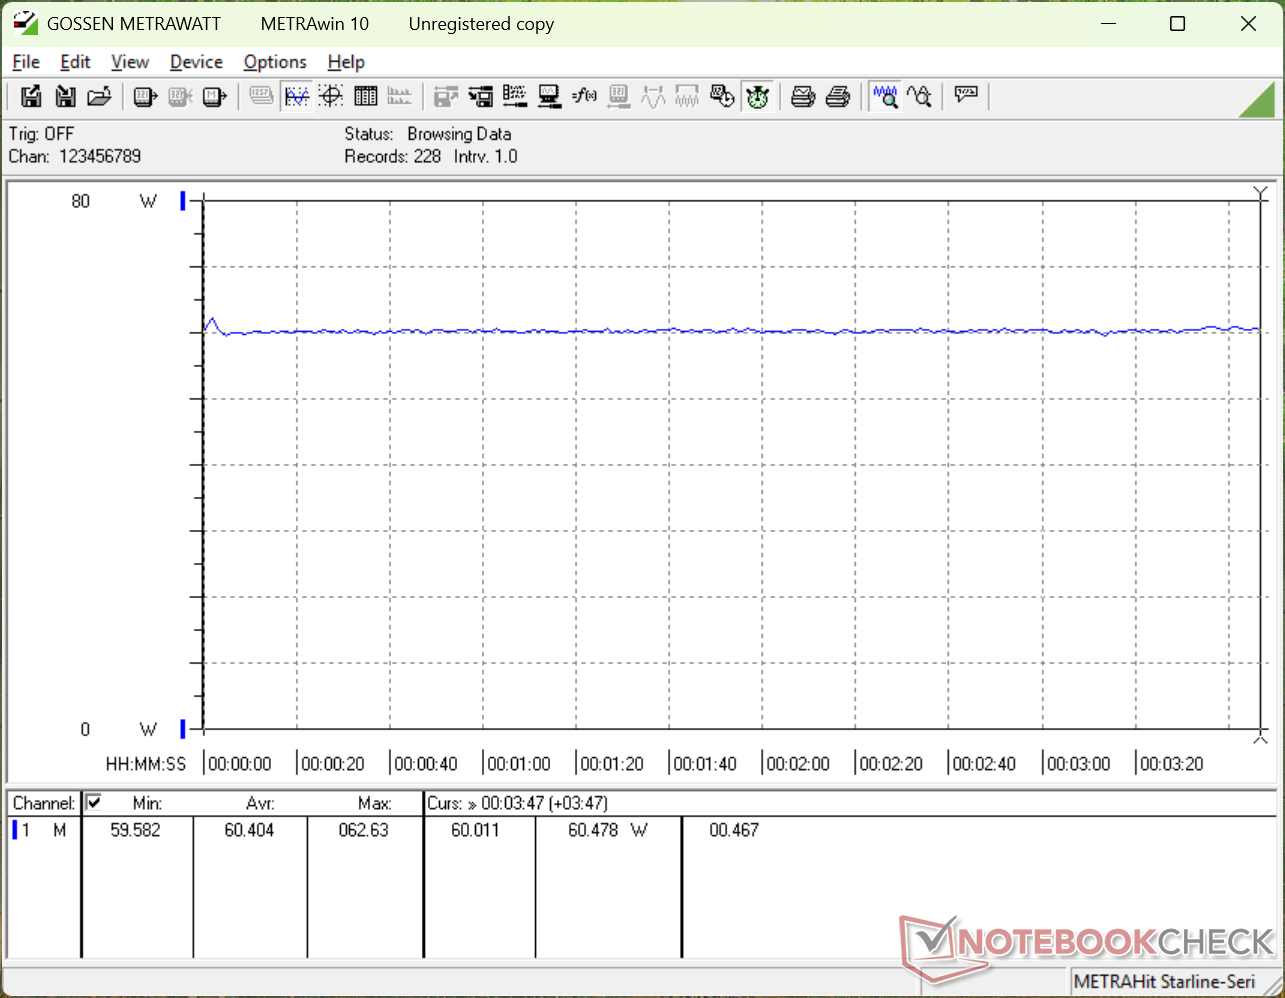
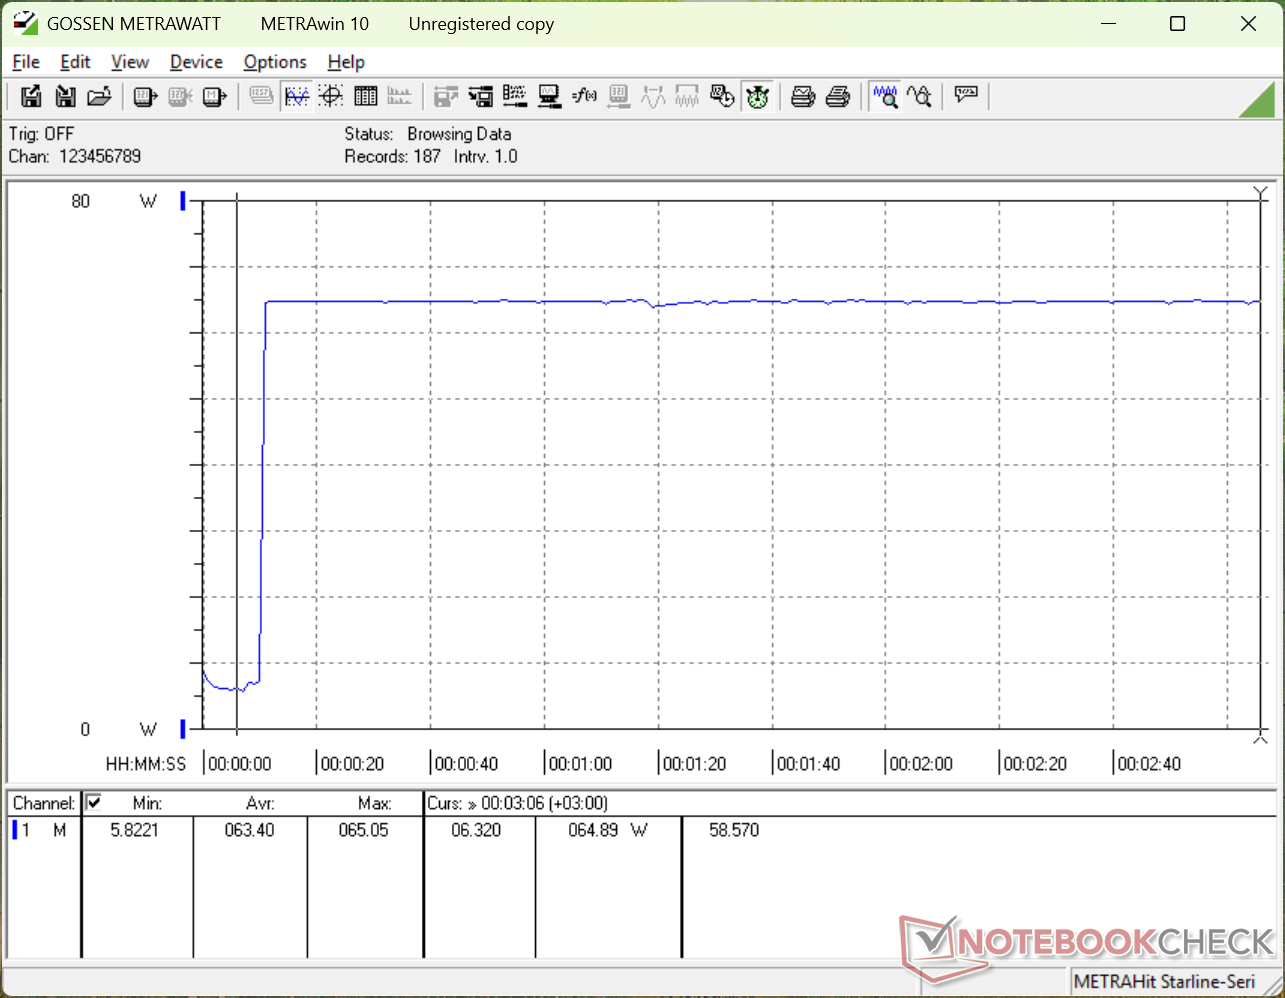
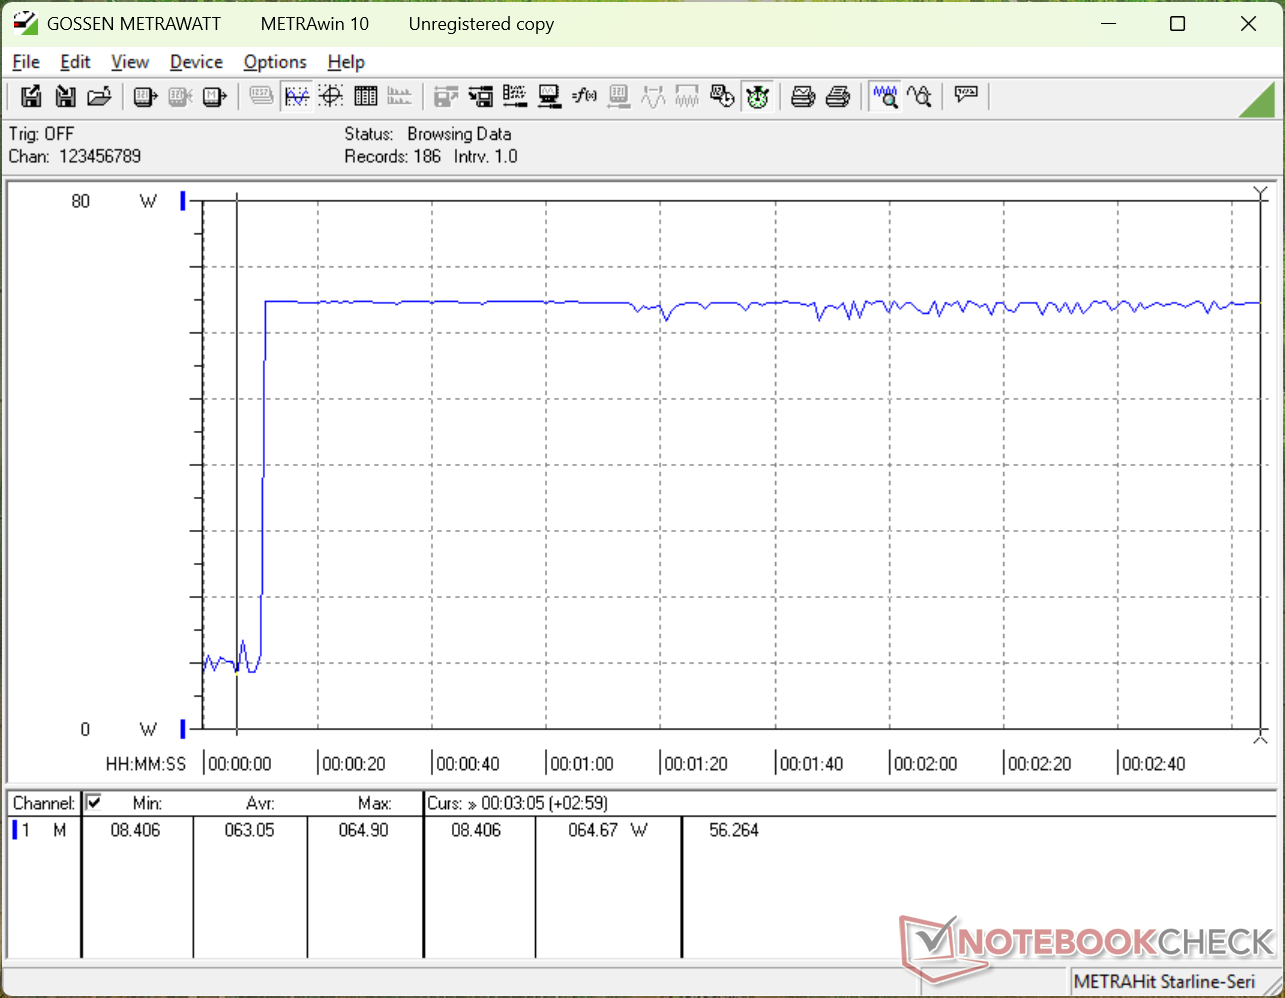
Das Modell wird mit einem kleineren 65-W-USB-C-Netzteil (~6,5 x 6,5 x 3,0 cm) anstelle des 100-W-Netzteils geliefert, das dem Modell von 2025 beilag. Trotzdem ist der Gesamtverbrauch der beiden Modelle recht ähnlich, wie die Grafiken unten zeigen. Die Grafikleistung pro Watt hat sich deutlich verbessert: Das neue Prestige 16 ist bis zu 80 Prozent schneller und verbraucht dabei nahezu die gleiche Leistung.
Eine Folge des kleineren 65-W-Netzteils ist die geringere Turbo-Boost-Leistung. Bei der Ausführung von Prime95 Stress konnte das 2025 Prestige 16 vorübergehend bis zu 103 W verbrauchen, während es bei unserem 2026 Prestige 16 nur 66 W waren. Das ältere Modell konnte daher in den ersten etwa 60 Sekunden des Belastungstests das neuere Modell bei der reinen CPU-Leistung leicht übertreffen, solange der Turbo Boost am effektivsten war.
Zu bedenken ist, dass sich die Ladegeschwindigkeit deutlich verlangsamt, wenn gleichzeitig anspruchsvolle Lasten ausgeführt werden, da das 65-Watt-Netzteil wohl zu schwach ist; allein die Ausführung von Cyberpunk 2077 benötigt mehr als 60 Watt.
| Aus / Standby | |
| Idle | |
| Last |
|
Legende:
min: | |
| MSI Prestige 16 AI C3MTG Ultra X7 358H, Arc B390 Panther Lake iGPU, Micron 2500 1TB MTFDKBA1T0QGN, OLED, 2880x1800, 16" | MSI Prestige 16 AI Evo B2HMG Ultra 9 285H, Arc 140T, Micron 2500 1TB MTFDKBA1T0QGN, IPS, 2560x1600, 16" | Dell XPS 16 Core Ultra X7 358H Ultra X7 358H, Arc B390 Panther Lake iGPU, , OLED, 3200x2000, 16" | Asus ZenBook S16 UM5606GA Ryzen AI 9 465, Radeon 880M, SanDisk PC SN5100S, OLED, 2880x1800, 16" | Lenovo ThinkBook 16 G7+ AMD Ryzen AI 9 365, Radeon 880M, Samsung PM9C1a MZAL81T0HDLB, IPS, 3200x2000, 16" | HP Envy x360 2-in-1 16-ad0097nr R7 8840HS, Radeon 780M, KIOXIA BG5 KBG50ZNV1T02, OLED, 2880x1800, 16" | |
|---|---|---|---|---|---|---|
| Stromverbrauch | -22% | -0% | -2% | -55% | -10% | |
| Idle min * (Watt) | 3.3 | 4.4 -33% | 4 -21% | 3.7 -12% | 6.4 -94% | 5 -52% |
| Idle avg * (Watt) | 7.4 | 9.2 -24% | 4.4 41% | 7.4 -0% | 14.1 -91% | 6.2 16% |
| Idle max * (Watt) | 13 | 9.5 27% | 10.2 22% | 9.5 27% | 14.3 -10% | 14.7 -13% |
| Last avg * (Watt) | 48.7 | 66.9 -37% | 44.2 9% | 57.9 -19% | 83.4 -71% | 49.9 -2% |
| Cyberpunk 2077 ultra * (Watt) | 60.4 | 68.8 -14% | 62.6 -4% | 58.5 3% | 79.8 -32% | |
| Cyberpunk 2077 ultra external monitor * (Watt) | 60.4 | 67.4 -12% | 62.4 -3% | 57 6% | 77.5 -28% | |
| Last max * (Watt) | 64.8 | 102.9 -59% | 94.6 -46% | 76.9 -19% | 102.9 -59% | 65 -0% |
| Witcher 3 ultra * (Watt) | 54.5 |
* ... kleinere Werte sind besser
Stromverbrauch Cyberpunk/Stresstest
Stromverbrauch externer Monitor
Akkulaufzeit
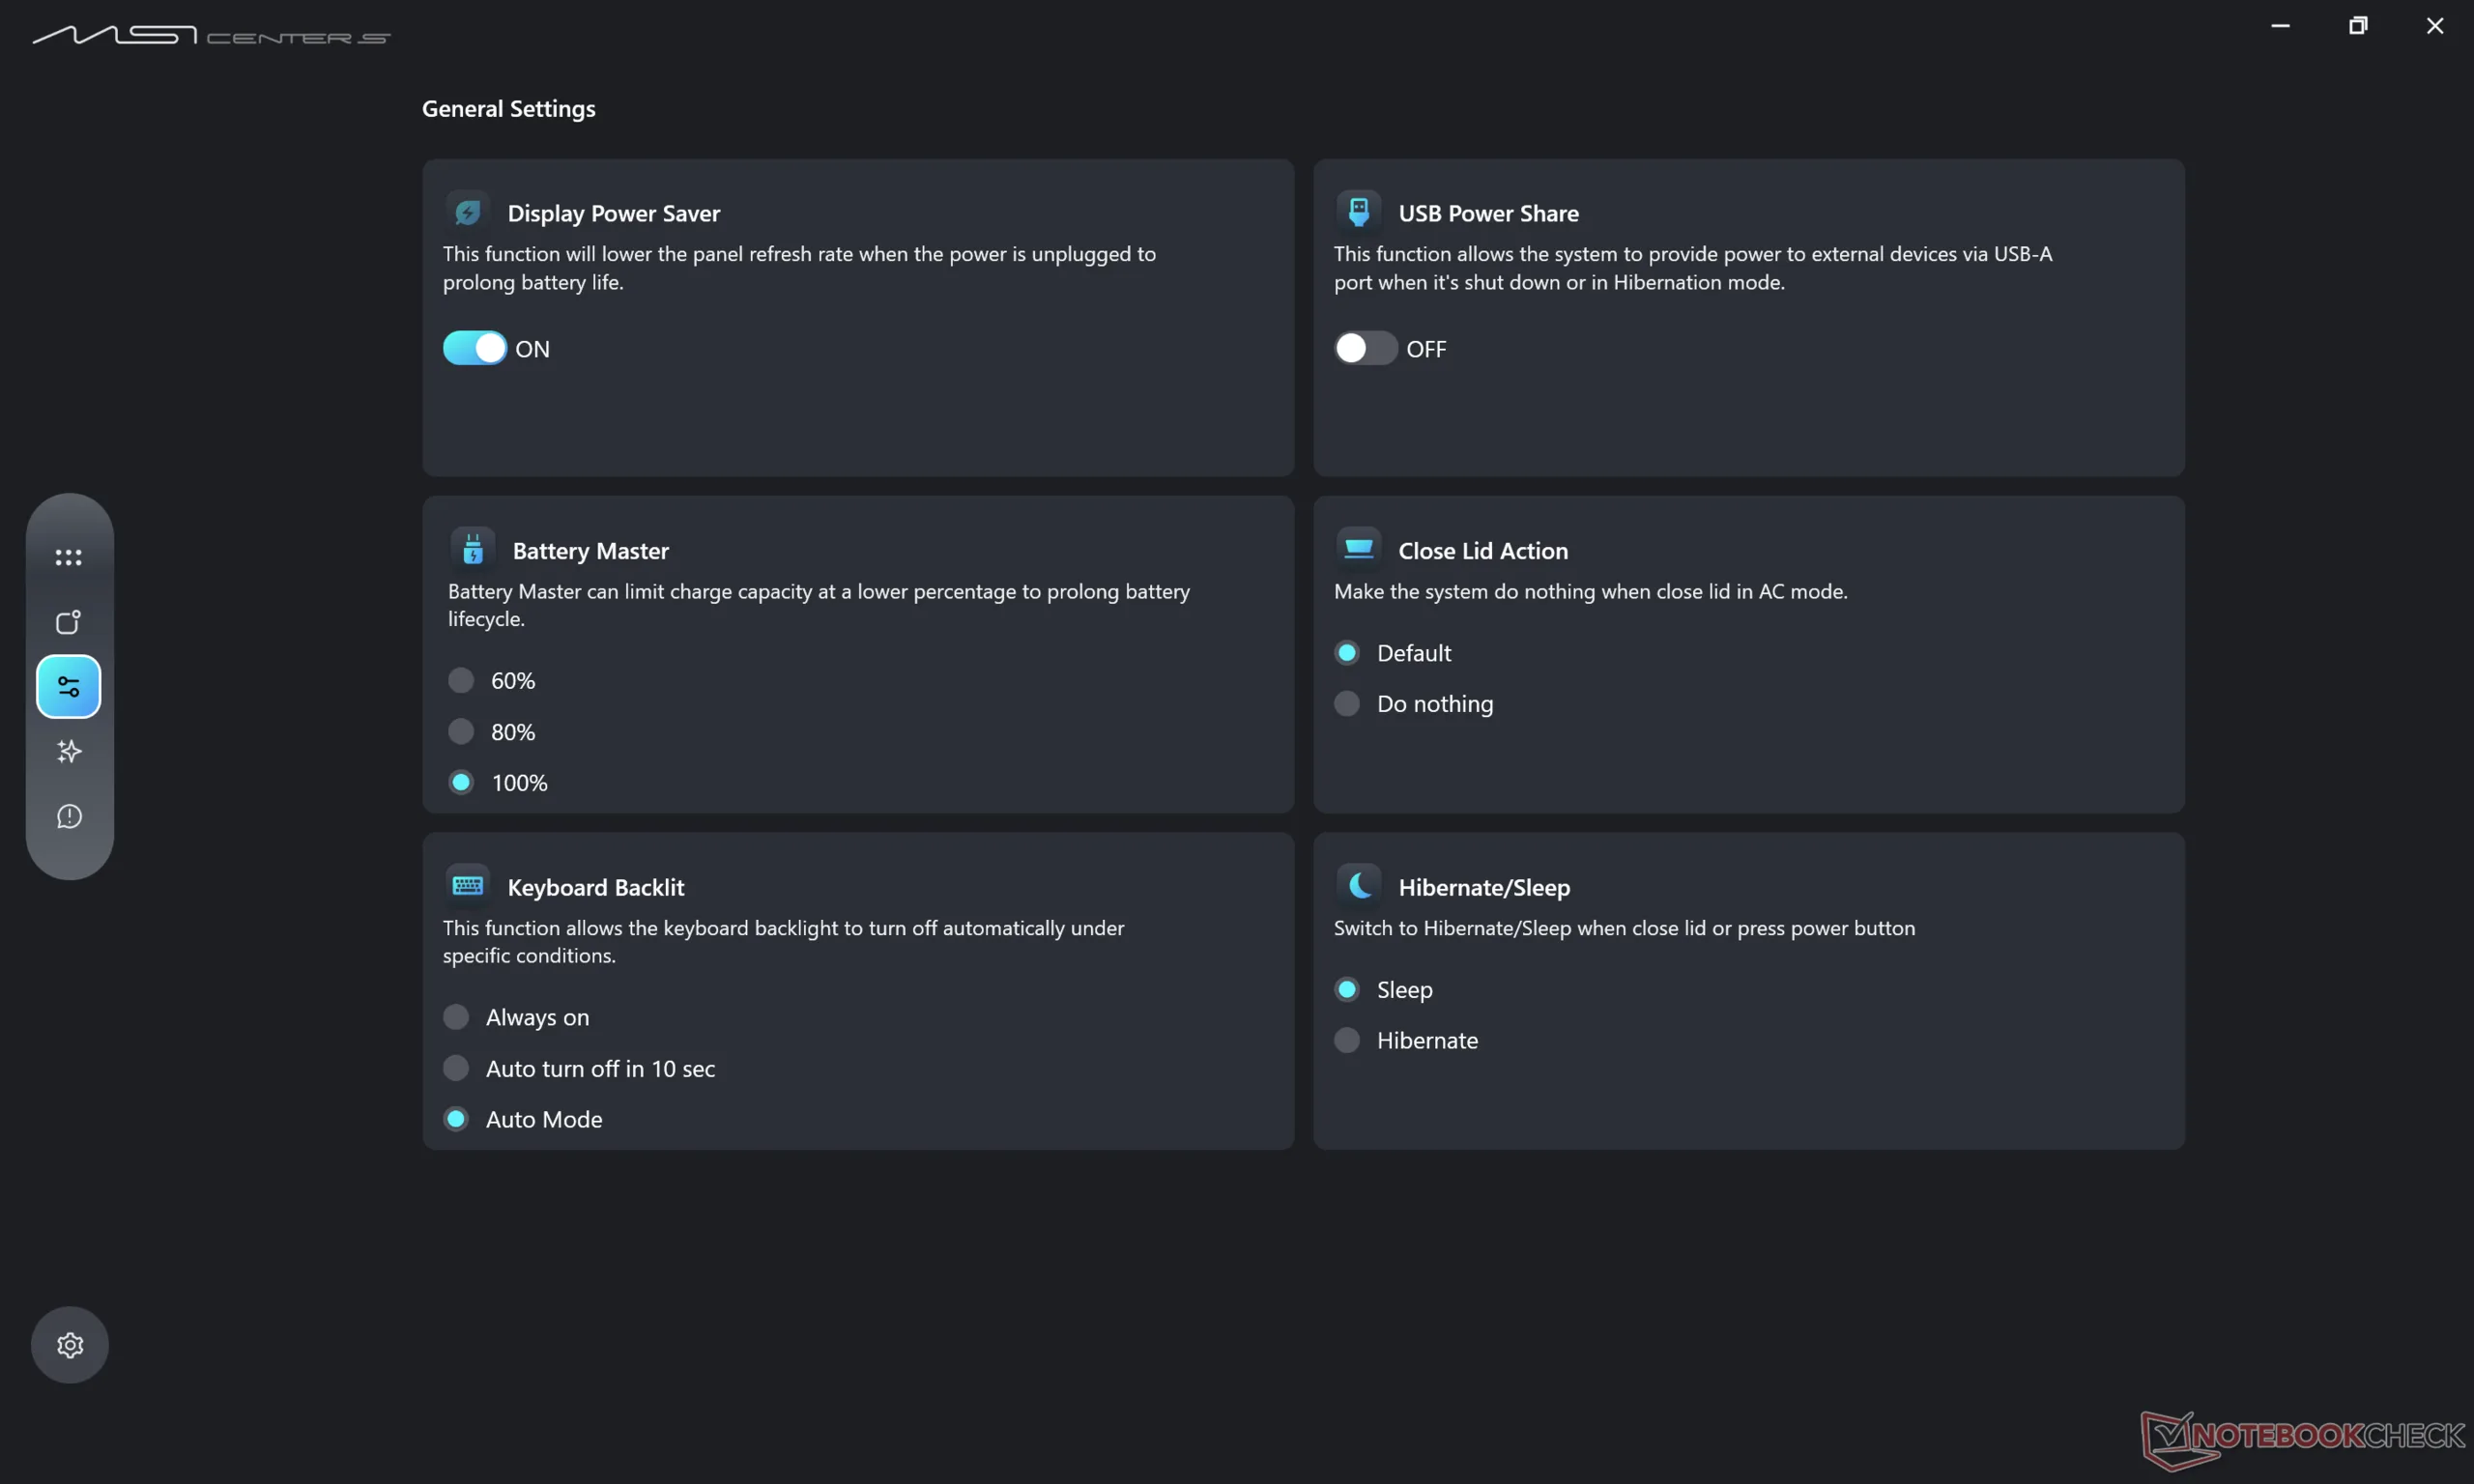
Die Laufzeiten sind in diesem Jahr kürzer, was teilweise auf den kleineren Akku (81 Wh statt 99 Wh) und den Wechsel von IPS zu OLED zurückzuführen ist. Die Auswirkungen werden jedoch durch die Effizienzgewinne an anderen Stellen des Systems leicht ausgeglichen. Wir können eine WLAN-Laufzeit von fast 13 Stunden verzeichnen, die 3 bis 4 Stunden kürzer ist als beim 2025er Modell.
| MSI Prestige 16 AI C3MTG Ultra X7 358H, Arc B390 Panther Lake iGPU, 81 Wh | MSI Prestige 16 AI Evo B2HMG Ultra 9 285H, Arc 140T, 99.9 Wh | Dell XPS 16 Core Ultra X7 358H Ultra X7 358H, Arc B390 Panther Lake iGPU, 70 Wh | Asus ZenBook S16 UM5606GA Ryzen AI 9 465, Radeon 880M, 83 Wh | Lenovo ThinkBook 16 G7+ AMD Ryzen AI 9 365, Radeon 880M, 85 Wh | HP Envy x360 2-in-1 16-ad0097nr R7 8840HS, Radeon 780M, 68 Wh | |
|---|---|---|---|---|---|---|
| Akkulaufzeit | 31% | -18% | 4% | -14% | -39% | |
| WLAN (h) | 12.6 | 16.5 31% | 10.3 -18% | 13.1 4% | 10.8 -14% | 7.7 -39% |
| H.264 (h) | 20.8 | 13.9 | ||||
| Last (h) | 2.4 | 1.9 | ||||
| Idle (h) | 15.6 |
Notebookcheck Bewertung
Das MSI Prestige 16 2026 ist eines der dünnsten Prosumer-Notebooks mit Intel Panther Lake, aber die Konkurrenz ist hart, wenn es um Webcam-Auflösung, Display-Optionen und integrierte Ports geht.
MSI Prestige 16 AI C3MTG
- 07.05.2026 v8
Allen Ngo
 Total Sustainability Score:
 Potenzielle Wettbewerber im Vergleich
Bild | Modell / Test | Preis ab | Gewicht | Dicke | Display |
|---|---|---|---|---|---|
1. 86.4%  | MSI Prestige 16 AI C3MTG Intel Core Ultra X7 358H ⎘ Intel Arc B390 12 Xe3 Panther Lake iGPU ⎘ 32 GB RAM, 1024 GB SSD | Amazon: 1.605,99 € Bestpreis 1895€ voelkner.de 2. 1949€ Media Markt.at 3. 1949€ nullprozentshop.de | 1.6 kg | 13.9 mm | 16.00" 2880x1800 212 PPI OLED |
2. 82.8%  | MSI Prestige 16 AI Evo B2HMG Intel Core Ultra 9 285H ⎘ Intel Arc Graphics 140T ⎘ 32 GB RAM, 1024 GB SSD | Amazon: 1. 1.533,60 € MSI Prestige 16 AI+ Evo B2VM... 2. 1.131,33 € MSI Prestige 13 AI Evo Busin... 3. 1.168,56 € MSI Prestige 14 AI Studio C1... | 1.6 kg | 18.95 mm | 16.00" 2560x1600 189 PPI IPS |
3. 87.2%  | Dell XPS 16 Core Ultra X7 358H Intel Core Ultra X7 358H ⎘ Intel Arc B390 12 Xe3 Panther Lake iGPU ⎘ 32 GB RAM | Amazon: 1. 1.699,00 € Dell XPS 14 9440 Laptop 14.5... 2. 2.549,00 € Dell XPS 16 9640 Laptop 16.3... 3. 1.012,91 € Dell XPS 13 (9340) Laptop 13... Geizhals Suche | 1.7 kg | 14.62 mm | 16.00" 3200x2000 236 PPI OLED |
4. 86.6%  | Asus ZenBook S16 UM5606GA AMD Ryzen AI 9 465 ⎘ AMD Radeon 880M ⎘ 32 GB RAM, 1024 GB SSD | Amazon: 2.059,00 € Bestpreis 1735€ TechnikLaden 2. 1753.85€ haym.infotec 3. 1797€ ARLT Computer | 1.5 kg | 12.9 mm | 16.00" 2880x1800 212 PPI OLED |
5. 86.6%  | Lenovo ThinkBook 16 G7+ AMD AMD Ryzen AI 9 365 ⎘ AMD Radeon 880M ⎘ 32 GB RAM, 1024 GB SSD | Amazon: 1. 799,00 € Lenovo ThinkBook 16 G7 ARP B... 2. 769,00 € Lenovo Notebook ThinkBook 16... 3. 1.281,06 € Lenovo ThinkBook 16 G7 IML C... Listenpreis: 1399€ | 1.9 kg | 16.9 mm | 16.00" 3200x2000 236 PPI IPS |
6. 87.2% v7 (old)  | HP Envy x360 2-in-1 16-ad0097nr AMD Ryzen 7 8840HS ⎘ AMD Radeon 780M ⎘ 16 GB RAM, 1024 GB SSD | Amazon: 1. 917,18 € HP Spectre x360 2-in-1 Conve... 2. 1.398,99 € HP OmniBook X Flip 2-in-1 La... 3. 647,30 € HP Pavilion x360 2-in-1 Conv... Listenpreis: 1300 USD | 1.8 kg | 18.3 mm | 16.00" 2880x1800 212 PPI OLED |
Transparenz
Die Auswahl der zu testenden Geräte erfolgt innerhalb der Redaktion. Das vorliegende Testmuster wurde dem Autor vom Hersteller oder einem Shop zu Testzwecken leihweise zur Verfügung gestellt. Eine Einflussnahme des Leihstellers auf den Testbericht gab es nicht, der Hersteller erhielt keine Version des Reviews vor der Veröffentlichung. Es bestand keine Verpflichtung zur Publikation. Als eigenständiges, unabhängiges Unternehmen unterliegt Notebookcheck keiner Diktion von Herstellern, Shops und Verlagen.
So testet Notebookcheck
Pro Jahr werden von Notebookcheck hunderte Laptops und Smartphones unabhängig in von uns standardisierten technischen Verfahren getestet, um eine Vergleichbarkeit aller Testergebnisse zu gewährleisten. Seit rund 20 Jahren entwickeln wir diese Testmethoden kontinuierlich weiter und setzen damit Branchenstandards. In unseren Testlaboren kommt ausschließlich hochwertiges Messequipment in die Hände erfahrener Techniker und Redakteure. Die Tests unterliegen einer mehrstufigen Kontrolle. Unsere komplexe Gesamtbewertung basiert auf hunderten fundierten Messergebnissen und Benchmarks, womit Ihnen Objektivität garantiert ist. Weitere Informationen zu unseren Testmethoden gibt es hier.

