Beelink GTI13 Ultra Mini-PC Test: Eine Mini-Alternative zum Mac mit Intel Core i9
Vollgepackt mit Funktionen.
Für 600 US-Dollar bietet das GTI13 Ultra ein unglaubliches Preis-Leistungs-Verhältnis, da es standardmäßig mit 32 GB RAM, 1-TB-SSD, Intel-13. Gen-CPU, integriertem Mikrofon, Lautsprecher und mehr ausgestattet ist, was den meisten Mini-PCs in dieser Preisklasse fehlt.Allen Ngo, 👁 Allen Ngo, ✓ Stefanie Voigt (übersetzt von DeepL / Ninh Duy) Veröffentlicht am 🇺🇸 🇫🇷 ...
Fazit - Ausgezeichnete Funktionen und Verarbeitungsqualität für den Preis
Das GTI13 Ultra ist sehr überzeugend, vor allem nach dem jüngsten Redesign. Er verfügt über eine ganze Reihe von Funktionen, die Sie bei anderen Mini-PCs zu ähnlichen Preisen nicht finden, wie z. B. die integrierten Lautsprecher, das integrierte Netzteil, das integrierte Mikrofon und die Unterstützung für eGPUs über einen direkten PCIe-x8-Anschluss. Der von Apple inspirierte Look ist zudem deutlich professioneller als das weitgehend aus Plastik bestehende Design anderer Mini-PCs wie der NucBox K11.
Es gibt ein paar wichtige Vorbehalte, die Sie beachten sollten: Erstens ist der Core-i9-13900HK-Prozessor nur unwesentlich schneller als der letztjährige Core i9-12900HK im GTI12 Ultra bestenfalls. Nutzer mit einem geringeren Budget sollten daher vielleicht lieber das Vorjahresmodell in Betracht ziehen, da die Auswirkungen auf die Leistung nur minimal sind. Zweitens ist die integrierte Grafikleistung nach heutigen Maßstäben dürftig, da selbst günstigere AMD Optionen der Mittelklasse wie das Beelink GTR7 mit den Iris-Xe-96-EUs mithalten können. Aufgrund des schwachen integrierten Intel Grafikprozessors wird man für ernsthafte Grafikaufgaben sicherlich die optionale EX-Dockingstation nutzen wollen. Dennoch begrüßen wir den erschwinglichen Einstiegspreis von 600 US-Dollar angesichts des enthaltenen RAMs, der SSD, des Windows-11-Pro-Betriebssystems und anderer wünschenswerter integrierter Funktionen.
Pro
Contra
Preis und Verfügbarkeit
Amazon.de liefert jetzt das GTI13 Ultra (nur!) mit 64 GB RAM und 1 TB SSD für 1.079 Euro aus. Beim Hersteller direkt kann der Mini-PC ab 599 US-Dollar (mit 32 GB RAM) bezogen werden.
Mögliche Konkurrenten im Vergleich
Bild | Modell / Test | Preis ab | Gewicht | Dicke | Display |
|---|---|---|---|---|---|
1. 79.9%  | Beelink GTI13 Ultra Intel Core i9-13900HK ⎘ Intel Iris Xe Graphics G7 96EUs ⎘ 32 GB RAM, 1024 GB SSD | Amazon: Listenpreis: 600 USD | 1.3 kg | 55.8 mm | x |
2. 77.1%  | Beelink SER9 AMD Ryzen AI 9 HX 370 ⎘ AMD Radeon 890M ⎘ 32 GB RAM, 1024 GB SSD | Amazon: Listenpreis: 1000 USD | 814 g | 44.7 mm | x |
3. 86.3% v7 (old)  | Beelink GTR7 7840HS AMD Ryzen 7 7840HS ⎘ AMD Radeon 780M ⎘ 32 GB RAM, 1024 GB SSD | Amazon: 1. 612,47 € Beelink EQR7 Mini PC, AMD Ry... 2. 819,00 € Beelink Mini PC SER8, AMD Ry... 3. 499,00 € Beelink Mini PC SER5 MAX Min... Listenpreis: 790 USD | 890 g | 48.8 mm | x |
4. 72% 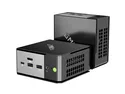 | GMK EVO-X1 AMD Ryzen AI 9 HX 370 ⎘ AMD Radeon 890M ⎘ 32 GB RAM, 1024 GB SSD | Amazon: 1.199,96 € Listenpreis: 900 USD | 595 g | 63.2 mm | x |
5. 77.2%  | Minisforum EliteMini AI370 AMD Ryzen AI 9 HX 370 ⎘ AMD Radeon 890M ⎘ 32 GB RAM, 1024 GB SSD | Amazon: Listenpreis: 1499 EUR | 472 g | 46.9 mm | x |
6. 67.3%  | GMK NucBox K9 Intel Core Ultra 5 125H ⎘ Intel Arc 7-Core iGPU ⎘ 32 GB RAM, 1024 GB SSD | Amazon: Geizhals Suche | 528 g | 47 mm | x |
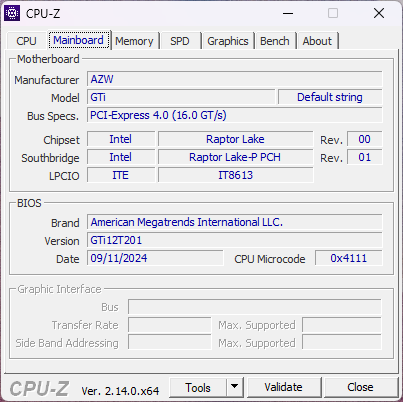
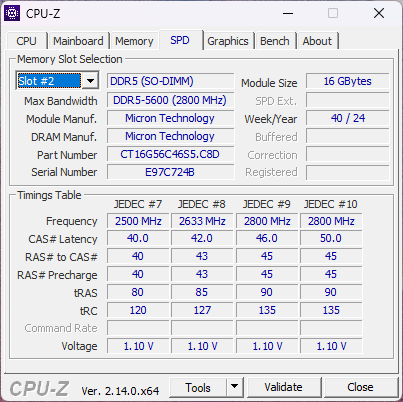
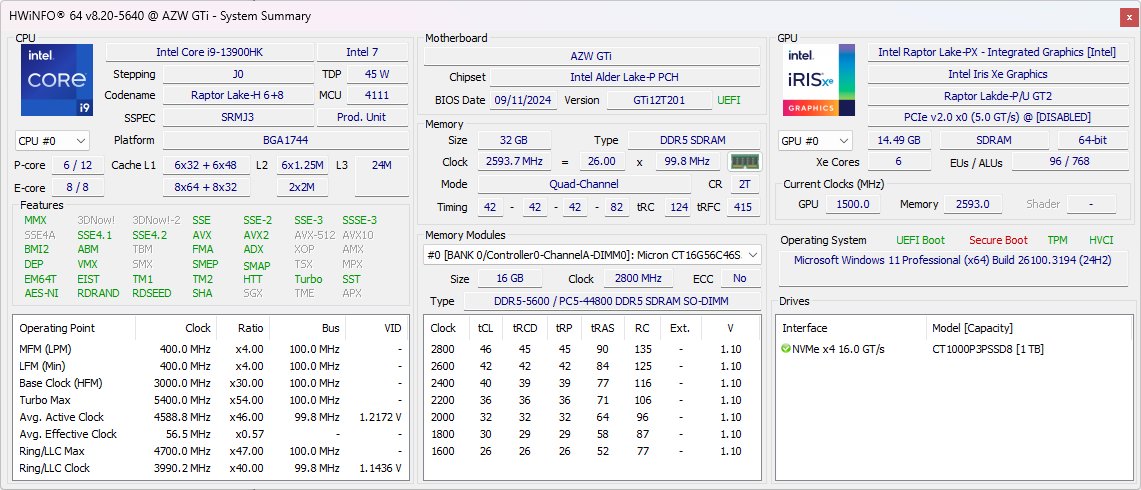
Der GTI13 Ultra tauscht den Alder-Lake-Core-i9-12900HK-Prozessor der 12. Generation im GTI12 Ultra gegen den Raptor Lake Core i9-13900HK der 13. Generation aus. Das Gehäusedesign und die Funktionen sind ansonsten identisch, und der einzige wesentliche Unterschied zwischen den beiden Modellen ist die aktualisierte CPU. Wir empfehlen Ihnen, sich unseren Test zum GTI12 Ultra anzuschauen, um mehr über die physischen Eigenschaften des Systems zu erfahren.
Bei unserem Testgerät handelt es sich um eine Einstiegskonfiguration mit 32 GB RAM und 1-TB-SSD für ca. 600 US-Dollar. Alle Konfigurationen sind entweder in den Farben Silber oder Grau mit dem gleichen Core-i9-Prozessor erhältlich. Es stehen keine Barebones-SKUs zur Auswahl.
Der GTI14 Ultra ist derzeit auch mit dem Intel 1. Gen (oder informell 14. Gen) Meteor Lake Core Ultra 9 185H Prozessor erhältlich.
Zu den Alternativen zum GTI13 Ultra gehören andere leistungsstarke Mini-PCs wie der Minisforum EliteMini AI370, GMK EVO-X1 oder der Asus ROG NUC 14. Die GTI-Ultra-Serie zeichnet sich durch eine PCIe-x8-Schnittstelle in voller Länge aus, die externe Grafikkarten über die EX-Dockingstation unterstützt.
Weitere Beelink Testberichte:
Spezifikationen
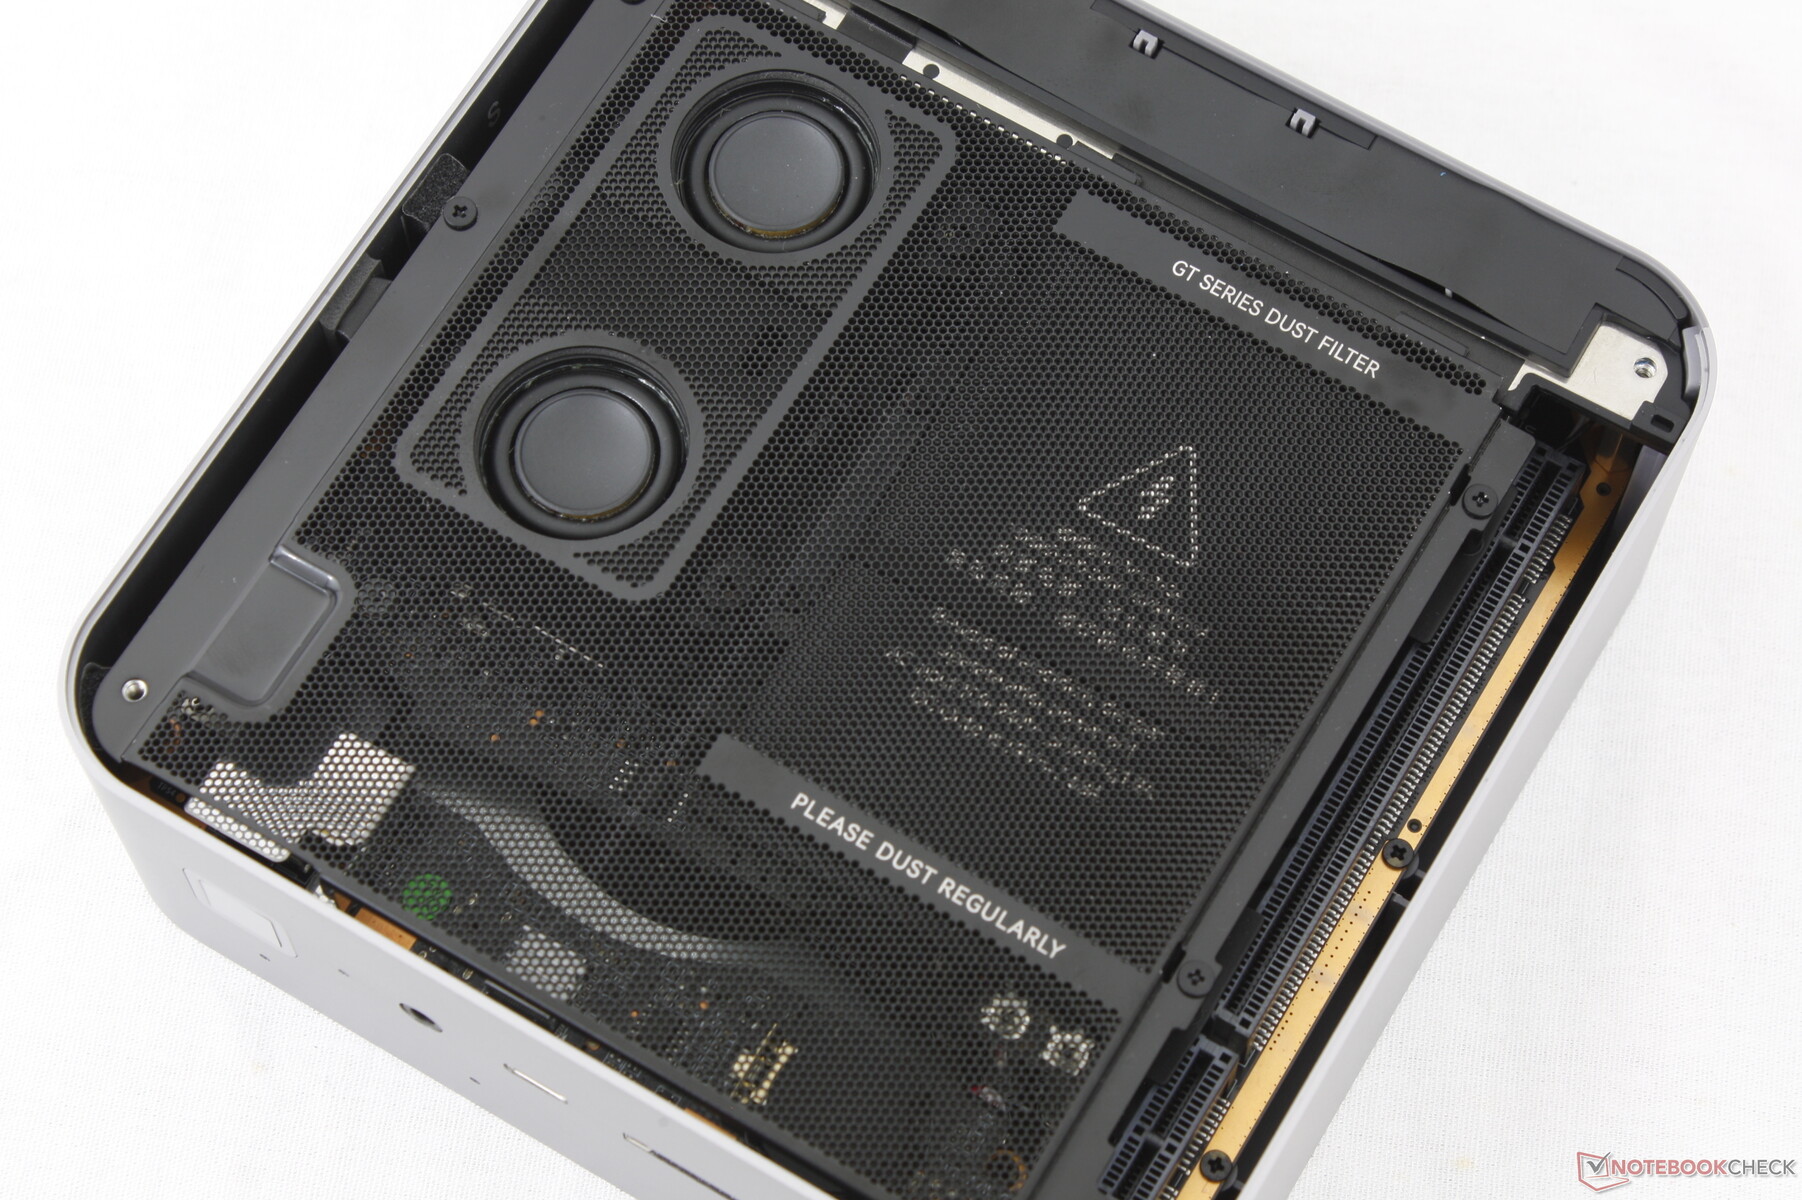
Gehäuse - Solide und dicht gepackt
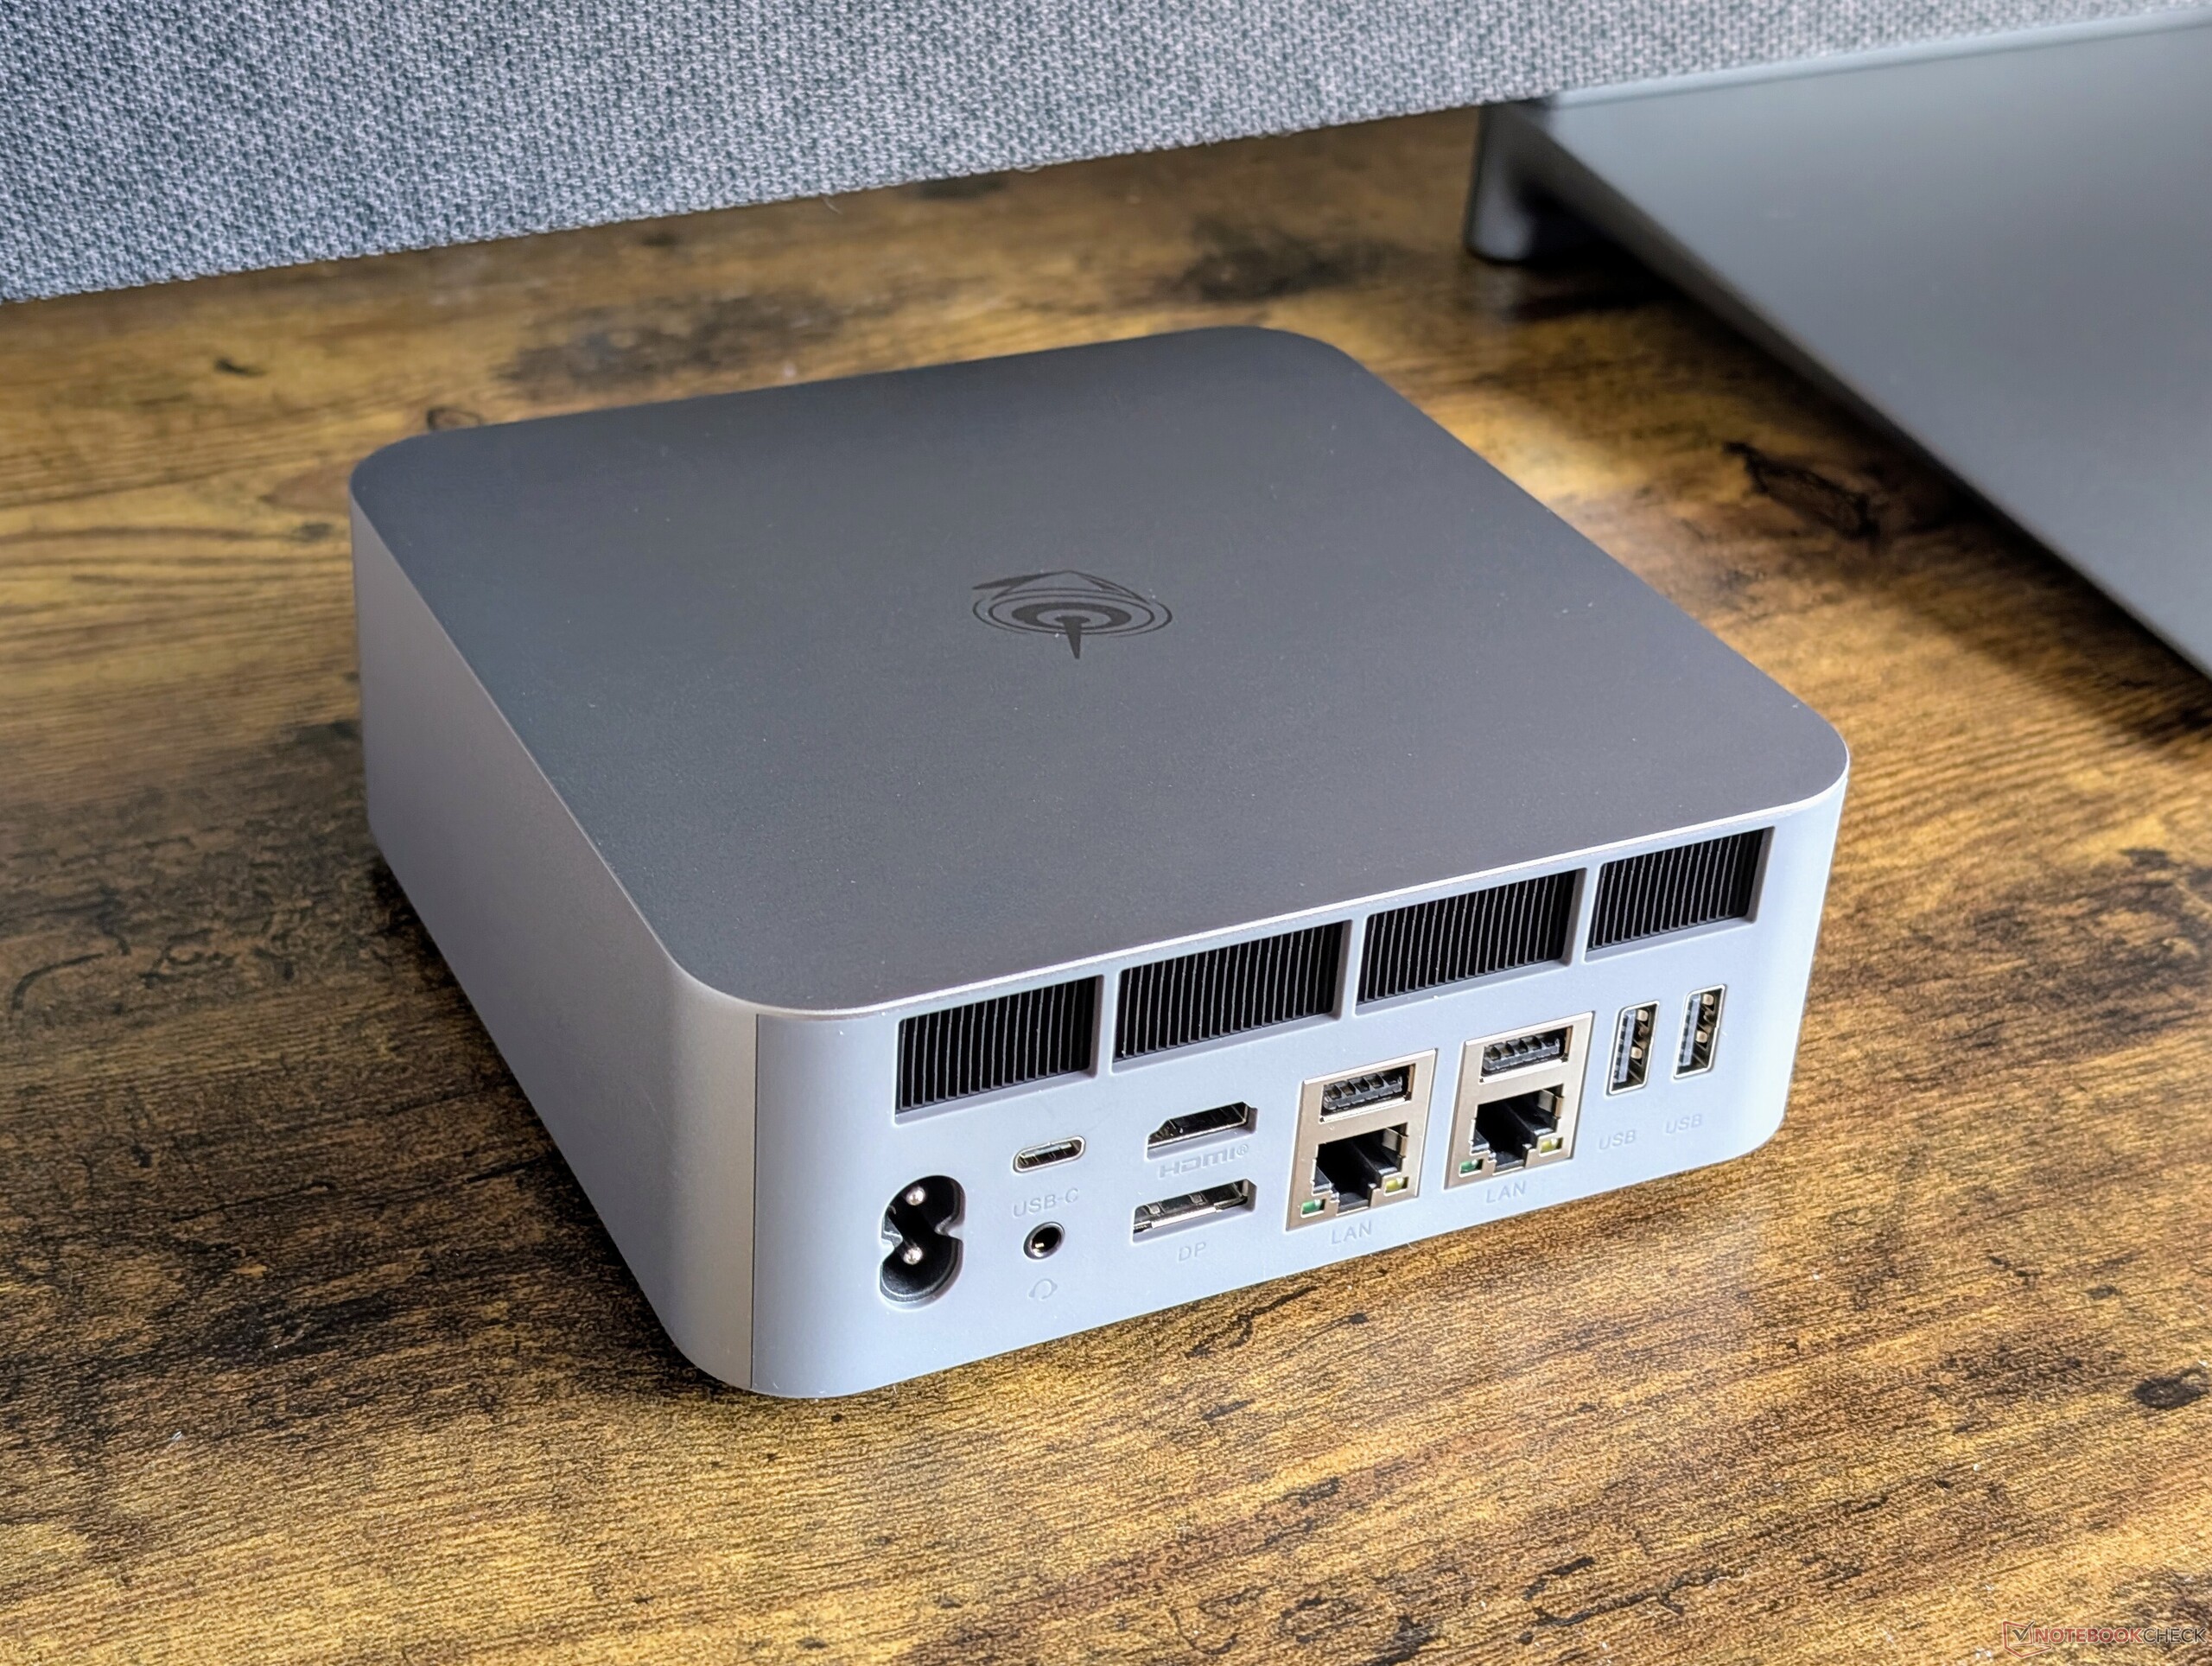
Zu den besonderen Merkmalen des Designs gehören das integrierte 145-W-Netzteil, die eingebauten Stereo-Lautsprecher, das integrierte Mikrofon und ein PCIe-x8-Erweiterungssteckplatz in voller Größe an der Unterseite des Geräts für den Anschluss an die EX-Dockingstation, die wir hier getestet haben. Letztere wurde dieses Jahr leicht verbessert, um größere 3fach- oder Triple-Slot-Grafikkarten zu unterstützen. Wenn Sie eine eGPU auf diese Weise anschließen, umgehen Sie die Bandbreitenbeschränkungen von Thunderbolt 4 und Oculink und erreichen ein Leistungsniveau, das dem einer Standard-Desktop-GPU-Konfiguration näherkommt.
SD-Kartenleser
| SD Card Reader | |
| average JPG Copy Test (av. of 3 runs) | |
| Beelink GTI13 Ultra (Toshiba Exceria Pro SDXC 64 GB UHS-II) | |
| maximum AS SSD Seq Read Test (1GB) | |
| Beelink GTI13 Ultra (Toshiba Exceria Pro SDXC 64 GB UHS-II) | |
Kommunikation
| Networking | |
| iperf3 transmit AXE11000 | |
| Beelink GTR7 7840HS | |
| GMK EVO-X1 | |
| GMK NucBox K9 | |
| Beelink GTI13 Ultra | |
| Minisforum EliteMini AI370 | |
| Beelink SER9 | |
| iperf3 receive AXE11000 | |
| Beelink GTR7 7840HS | |
| GMK EVO-X1 | |
| Minisforum EliteMini AI370 | |
| Beelink GTI13 Ultra | |
| Beelink SER9 | |
| GMK NucBox K9 | |
| iperf3 transmit AXE11000 6GHz | |
| Minisforum EliteMini AI370 | |
| iperf3 receive AXE11000 6GHz | |
| Minisforum EliteMini AI370 | |
Wartung
Da das System Lautsprecher und ein Netzteil beherbergt, müssen diese Teile zunächst entfernt werden, um an die aufrüstbaren Komponenten 2x SODIMM RAM und 2x M.2-2280-SSD zu gelangen. Die Wartung ist daher aufwendiger als bei den meisten anderen Mini-PCs.
Nachhaltigkeit
Beelink gibt an, dass bei der Herstellung keine nachhaltigen Maßnahmen ergriffen wurden. Die Verpackung selbst besteht größtenteils aus Pappe und Papier mit minimaler Plastikverpackung.
Zubehör und Garantie
In der Verkaufsverpackung befinden sich außer dem Papierkram, dem HDMI-Kabel und dem Netzkabel keine weiteren Extras.
Wird das Gerät in den USA gekauft, gilt die einjährige Herstellergarantie.
Performance
Testbedingungen
Wir haben Windows in den Modus-Performance versetzt, bevor wir die folgenden Benchmarks durchgeführt haben.
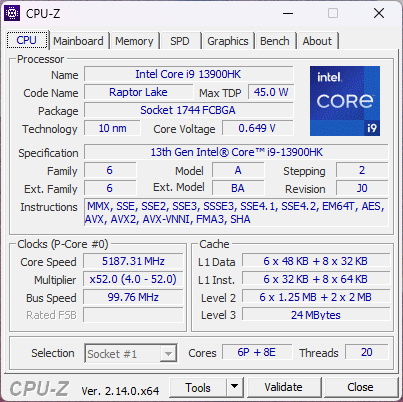
Prozessor
Der Raptor Lake Core i9-13900HK bietet nur minimale Leistungsvorteile gegenüber dem Alder Lake Core i9-12900HK, wie er im GTI12 Ultra des letzten Jahres zu finden war.
Cinebench R15 Multi Loop
Cinebench R23: Multi Core | Single Core
Cinebench R20: CPU (Multi Core) | CPU (Single Core)
Cinebench R15: CPU Multi 64Bit | CPU Single 64Bit
Blender: v2.79 BMW27 CPU
7-Zip 18.03: 7z b 4 | 7z b 4 -mmt1
Geekbench 6.7: Multi-Core | Single-Core
Geekbench 5.5: Multi-Core | Single-Core
HWBOT x265 Benchmark v2.2: 4k Preset
LibreOffice : 20 Documents To PDF
R Benchmark 2.5: Overall mean
| CPU Performance Rating | |
| Lenovo ThinkCentre Neo Ultra | |
| Minisforum AtomMan G7 Ti | |
| Beelink SER9 | |
| Beelink GTI13 Ultra | |
| Asus ROG NUC 14-90AS0051 | |
| BOSGAME M2 | |
| Beelink GTI12 Ultra EX Docking Station | |
| Beelink GTR7 7840HS -2! | |
| Minisforum Venus Series NAB9 | |
| Durchschnittliche Intel Core i9-13900HK | |
| GMK NucBox K9 -1! | |
| Khadas Mind 2 | |
| GMK NucBox K2 | |
| Cinebench R23 / Multi Core | |
| Lenovo ThinkCentre Neo Ultra | |
| Minisforum AtomMan G7 Ti | |
| Beelink SER9 | |
| Asus ROG NUC 14-90AS0051 | |
| Beelink GTR7 7840HS | |
| Beelink GTI13 Ultra | |
| Beelink GTI12 Ultra EX Docking Station | |
| BOSGAME M2 | |
| Durchschnittliche Intel Core i9-13900HK (12799 - 19704, n=4) | |
| Minisforum Venus Series NAB9 | |
| Khadas Mind 2 | |
| GMK NucBox K9 | |
| GMK NucBox K2 | |
| Cinebench R23 / Single Core | |
| Beelink GTI13 Ultra | |
| Lenovo ThinkCentre Neo Ultra | |
| Minisforum AtomMan G7 Ti | |
| Beelink SER9 | |
| Beelink GTI12 Ultra EX Docking Station | |
| Minisforum Venus Series NAB9 | |
| Asus ROG NUC 14-90AS0051 | |
| Beelink GTR7 7840HS | |
| Durchschnittliche Intel Core i9-13900HK (1426 - 2089, n=4) | |
| BOSGAME M2 | |
| GMK NucBox K9 | |
| Khadas Mind 2 | |
| GMK NucBox K2 | |
| Cinebench R20 / CPU (Multi Core) | |
| Lenovo ThinkCentre Neo Ultra | |
| Minisforum AtomMan G7 Ti | |
| Beelink SER9 | |
| Asus ROG NUC 14-90AS0051 | |
| Beelink GTR7 7840HS | |
| BOSGAME M2 | |
| Beelink GTI12 Ultra EX Docking Station | |
| Beelink GTI13 Ultra | |
| Durchschnittliche Intel Core i9-13900HK (4968 - 7542, n=4) | |
| Minisforum Venus Series NAB9 | |
| Khadas Mind 2 | |
| GMK NucBox K9 | |
| GMK NucBox K2 | |
| Cinebench R20 / CPU (Single Core) | |
| Lenovo ThinkCentre Neo Ultra | |
| Beelink GTI13 Ultra | |
| Beelink SER9 | |
| Minisforum AtomMan G7 Ti | |
| Minisforum Venus Series NAB9 | |
| Beelink GTI12 Ultra EX Docking Station | |
| Beelink GTR7 7840HS | |
| Asus ROG NUC 14-90AS0051 | |
| Durchschnittliche Intel Core i9-13900HK (549 - 798, n=4) | |
| BOSGAME M2 | |
| GMK NucBox K9 | |
| Khadas Mind 2 | |
| GMK NucBox K2 | |
| Cinebench R15 / CPU Multi 64Bit | |
| Minisforum AtomMan G7 Ti | |
| Lenovo ThinkCentre Neo Ultra | |
| Beelink SER9 | |
| Asus ROG NUC 14-90AS0051 | |
| Beelink GTR7 7840HS | |
| BOSGAME M2 | |
| Durchschnittliche Intel Core i9-13900HK (2004 - 2950, n=4) | |
| Beelink GTI12 Ultra EX Docking Station | |
| Beelink GTI13 Ultra | |
| Khadas Mind 2 | |
| Minisforum Venus Series NAB9 | |
| GMK NucBox K2 | |
| GMK NucBox K9 | |
| Cinebench R15 / CPU Single 64Bit | |
| Beelink SER9 | |
| Lenovo ThinkCentre Neo Ultra | |
| Beelink GTI13 Ultra | |
| Minisforum AtomMan G7 Ti | |
| Beelink GTR7 7840HS | |
| Beelink GTI12 Ultra EX Docking Station | |
| Minisforum Venus Series NAB9 | |
| Asus ROG NUC 14-90AS0051 | |
| BOSGAME M2 | |
| Durchschnittliche Intel Core i9-13900HK (204 - 296, n=4) | |
| GMK NucBox K9 | |
| GMK NucBox K2 | |
| Khadas Mind 2 | |
| Blender / v2.79 BMW27 CPU | |
| GMK NucBox K2 | |
| GMK NucBox K9 | |
| Khadas Mind 2 | |
| Minisforum Venus Series NAB9 | |
| Beelink GTR7 7840HS | |
| Durchschnittliche Intel Core i9-13900HK (197 - 253, n=3) | |
| BOSGAME M2 | |
| Beelink GTI13 Ultra | |
| Beelink GTI12 Ultra EX Docking Station | |
| Asus ROG NUC 14-90AS0051 | |
| Beelink SER9 | |
| Minisforum AtomMan G7 Ti | |
| Lenovo ThinkCentre Neo Ultra | |
| 7-Zip 18.03 / 7z b 4 | |
| Minisforum AtomMan G7 Ti | |
| Lenovo ThinkCentre Neo Ultra | |
| Beelink SER9 | |
| Asus ROG NUC 14-90AS0051 | |
| BOSGAME M2 | |
| Beelink GTI13 Ultra | |
| Beelink GTR7 7840HS | |
| Beelink GTI12 Ultra EX Docking Station | |
| Durchschnittliche Intel Core i9-13900HK (50278 - 77190, n=4) | |
| GMK NucBox K2 | |
| Minisforum Venus Series NAB9 | |
| Khadas Mind 2 | |
| 7-Zip 18.03 / 7z b 4 -mmt1 | |
| Minisforum AtomMan G7 Ti | |
| Lenovo ThinkCentre Neo Ultra | |
| Beelink GTR7 7840HS | |
| Beelink GTI13 Ultra | |
| BOSGAME M2 | |
| Beelink SER9 | |
| Minisforum Venus Series NAB9 | |
| GMK NucBox K2 | |
| Beelink GTI12 Ultra EX Docking Station | |
| Durchschnittliche Intel Core i9-13900HK (4461 - 6516, n=4) | |
| Asus ROG NUC 14-90AS0051 | |
| GMK NucBox K9 | |
| Khadas Mind 2 | |
| Geekbench 6.7 / Multi-Core | |
| Minisforum AtomMan G7 Ti | |
| Beelink SER9 | |
| Lenovo ThinkCentre Neo Ultra | |
| BOSGAME M2 | |
| Beelink GTI13 Ultra | |
| Asus ROG NUC 14-90AS0051 | |
| Beelink GTI12 Ultra EX Docking Station | |
| Khadas Mind 2 | |
| GMK NucBox K9 | |
| Minisforum Venus Series NAB9 | |
| GMK NucBox K2 | |
| Durchschnittliche Intel Core i9-13900HK (7103 - 13309, n=4) | |
| Geekbench 6.7 / Single-Core | |
| Minisforum AtomMan G7 Ti | |
| Beelink GTI13 Ultra | |
| Lenovo ThinkCentre Neo Ultra | |
| Beelink SER9 | |
| BOSGAME M2 | |
| Beelink GTI12 Ultra EX Docking Station | |
| Minisforum Venus Series NAB9 | |
| Asus ROG NUC 14-90AS0051 | |
| Durchschnittliche Intel Core i9-13900HK (1849 - 2883, n=4) | |
| GMK NucBox K9 | |
| Khadas Mind 2 | |
| GMK NucBox K2 | |
| Geekbench 5.5 / Multi-Core | |
| Minisforum AtomMan G7 Ti | |
| Lenovo ThinkCentre Neo Ultra | |
| Beelink SER9 | |
| Asus ROG NUC 14-90AS0051 | |
| Beelink GTI13 Ultra | |
| BOSGAME M2 | |
| Beelink GTI12 Ultra EX Docking Station | |
| Khadas Mind 2 | |
| Durchschnittliche Intel Core i9-13900HK (7927 - 14985, n=5) | |
| Beelink GTR7 7840HS | |
| Minisforum Venus Series NAB9 | |
| GMK NucBox K9 | |
| GMK NucBox K2 | |
| Geekbench 5.5 / Single-Core | |
| Minisforum AtomMan G7 Ti | |
| Lenovo ThinkCentre Neo Ultra | |
| Beelink GTR7 7840HS | |
| Beelink GTI13 Ultra | |
| BOSGAME M2 | |
| Beelink SER9 | |
| Beelink GTI12 Ultra EX Docking Station | |
| Minisforum Venus Series NAB9 | |
| Asus ROG NUC 14-90AS0051 | |
| Durchschnittliche Intel Core i9-13900HK (1315 - 1996, n=5) | |
| GMK NucBox K9 | |
| Khadas Mind 2 | |
| GMK NucBox K2 | |
| HWBOT x265 Benchmark v2.2 / 4k Preset | |
| Lenovo ThinkCentre Neo Ultra | |
| Beelink SER9 | |
| Minisforum AtomMan G7 Ti | |
| Asus ROG NUC 14-90AS0051 | |
| BOSGAME M2 | |
| Beelink GTI13 Ultra | |
| Beelink GTI12 Ultra EX Docking Station | |
| Durchschnittliche Intel Core i9-13900HK (14.2 - 21.9, n=4) | |
| Minisforum Venus Series NAB9 | |
| Khadas Mind 2 | |
| GMK NucBox K2 | |
| GMK NucBox K9 | |
| Beelink GTR7 7840HS | |
| LibreOffice / 20 Documents To PDF | |
| Khadas Mind 2 | |
| Asus ROG NUC 14-90AS0051 | |
| Beelink SER9 | |
| Durchschnittliche Intel Core i9-13900HK (37.3 - 56, n=4) | |
| Minisforum AtomMan G7 Ti | |
| GMK NucBox K2 | |
| GMK NucBox K9 | |
| BOSGAME M2 | |
| Beelink GTI12 Ultra EX Docking Station | |
| Beelink GTR7 7840HS | |
| Beelink GTI13 Ultra | |
| Minisforum Venus Series NAB9 | |
| Lenovo ThinkCentre Neo Ultra | |
| R Benchmark 2.5 / Overall mean | |
| Khadas Mind 2 | |
| Durchschnittliche Intel Core i9-13900HK (0.4119 - 0.653, n=4) | |
| GMK NucBox K2 | |
| GMK NucBox K9 | |
| Asus ROG NUC 14-90AS0051 | |
| Beelink GTI12 Ultra EX Docking Station | |
| Minisforum Venus Series NAB9 | |
| BOSGAME M2 | |
| Beelink GTR7 7840HS | |
| Beelink GTI13 Ultra | |
| Beelink SER9 | |
| Minisforum AtomMan G7 Ti | |
| Lenovo ThinkCentre Neo Ultra | |
Cinebench R23: Multi Core | Single Core
Cinebench R20: CPU (Multi Core) | CPU (Single Core)
Cinebench R15: CPU Multi 64Bit | CPU Single 64Bit
Blender: v2.79 BMW27 CPU
7-Zip 18.03: 7z b 4 | 7z b 4 -mmt1
Geekbench 6.7: Multi-Core | Single-Core
Geekbench 5.5: Multi-Core | Single-Core
HWBOT x265 Benchmark v2.2: 4k Preset
LibreOffice : 20 Documents To PDF
R Benchmark 2.5: Overall mean
* ... kleinere Werte sind besser
AIDA64: FP32 Ray-Trace | FPU Julia | CPU SHA3 | CPU Queen | FPU SinJulia | FPU Mandel | CPU AES | CPU ZLib | FP64 Ray-Trace | CPU PhotoWorxx
| Performance Rating | |
| Beelink SER9 | |
| Minisforum EliteMini AI370 | |
| Beelink GTR7 7840HS | |
| GMK EVO-X1 | |
| Beelink GTI13 Ultra | |
| Durchschnittliche Intel Core i9-13900HK | |
| GMK NucBox K9 | |
| AIDA64 / FP32 Ray-Trace | |
| Beelink SER9 | |
| Minisforum EliteMini AI370 | |
| GMK EVO-X1 | |
| Beelink GTR7 7840HS | |
| Durchschnittliche Intel Core i9-13900HK (12351 - 18326, n=4) | |
| Beelink GTI13 Ultra | |
| GMK NucBox K9 | |
| AIDA64 / FPU Julia | |
| Beelink SER9 | |
| Minisforum EliteMini AI370 | |
| GMK EVO-X1 | |
| Beelink GTR7 7840HS | |
| Beelink GTI13 Ultra | |
| Durchschnittliche Intel Core i9-13900HK (61409 - 92925, n=4) | |
| GMK NucBox K9 | |
| AIDA64 / CPU SHA3 | |
| Beelink SER9 | |
| Minisforum EliteMini AI370 | |
| GMK EVO-X1 | |
| Beelink GTR7 7840HS | |
| Durchschnittliche Intel Core i9-13900HK (2923 - 4190, n=4) | |
| Beelink GTI13 Ultra | |
| GMK NucBox K9 | |
| AIDA64 / CPU Queen | |
| Beelink GTR7 7840HS | |
| Beelink GTI13 Ultra | |
| Minisforum EliteMini AI370 | |
| Beelink SER9 | |
| Durchschnittliche Intel Core i9-13900HK (75615 - 118166, n=4) | |
| GMK NucBox K9 | |
| GMK EVO-X1 | |
| AIDA64 / FPU SinJulia | |
| Beelink SER9 | |
| GMK EVO-X1 | |
| Minisforum EliteMini AI370 | |
| Beelink GTR7 7840HS | |
| Beelink GTI13 Ultra | |
| Durchschnittliche Intel Core i9-13900HK (7427 - 11249, n=4) | |
| GMK NucBox K9 | |
| AIDA64 / FPU Mandel | |
| Beelink SER9 | |
| Minisforum EliteMini AI370 | |
| GMK EVO-X1 | |
| Beelink GTR7 7840HS | |
| Beelink GTI13 Ultra | |
| Durchschnittliche Intel Core i9-13900HK (30549 - 45616, n=4) | |
| GMK NucBox K9 | |
| AIDA64 / CPU AES | |
| Beelink GTR7 7840HS | |
| GMK NucBox K9 | |
| Beelink SER9 | |
| Durchschnittliche Intel Core i9-13900HK (68508 - 100891, n=4) | |
| Minisforum EliteMini AI370 | |
| GMK EVO-X1 | |
| Beelink GTI13 Ultra | |
| AIDA64 / CPU ZLib | |
| Beelink SER9 | |
| Minisforum EliteMini AI370 | |
| GMK EVO-X1 | |
| Beelink GTR7 7840HS | |
| Beelink GTI13 Ultra | |
| Durchschnittliche Intel Core i9-13900HK (797 - 1249, n=4) | |
| GMK NucBox K9 | |
| AIDA64 / FP64 Ray-Trace | |
| Beelink SER9 | |
| Minisforum EliteMini AI370 | |
| GMK EVO-X1 | |
| Beelink GTR7 7840HS | |
| Durchschnittliche Intel Core i9-13900HK (6839 - 10018, n=4) | |
| Beelink GTI13 Ultra | |
| GMK NucBox K9 | |
| AIDA64 / CPU PhotoWorxx | |
| Minisforum EliteMini AI370 | |
| GMK EVO-X1 | |
| Beelink SER9 | |
| GMK NucBox K9 | |
| Beelink GTI13 Ultra | |
| Beelink GTR7 7840HS | |
| Durchschnittliche Intel Core i9-13900HK (15421 - 49539, n=4) | |
Stresstest
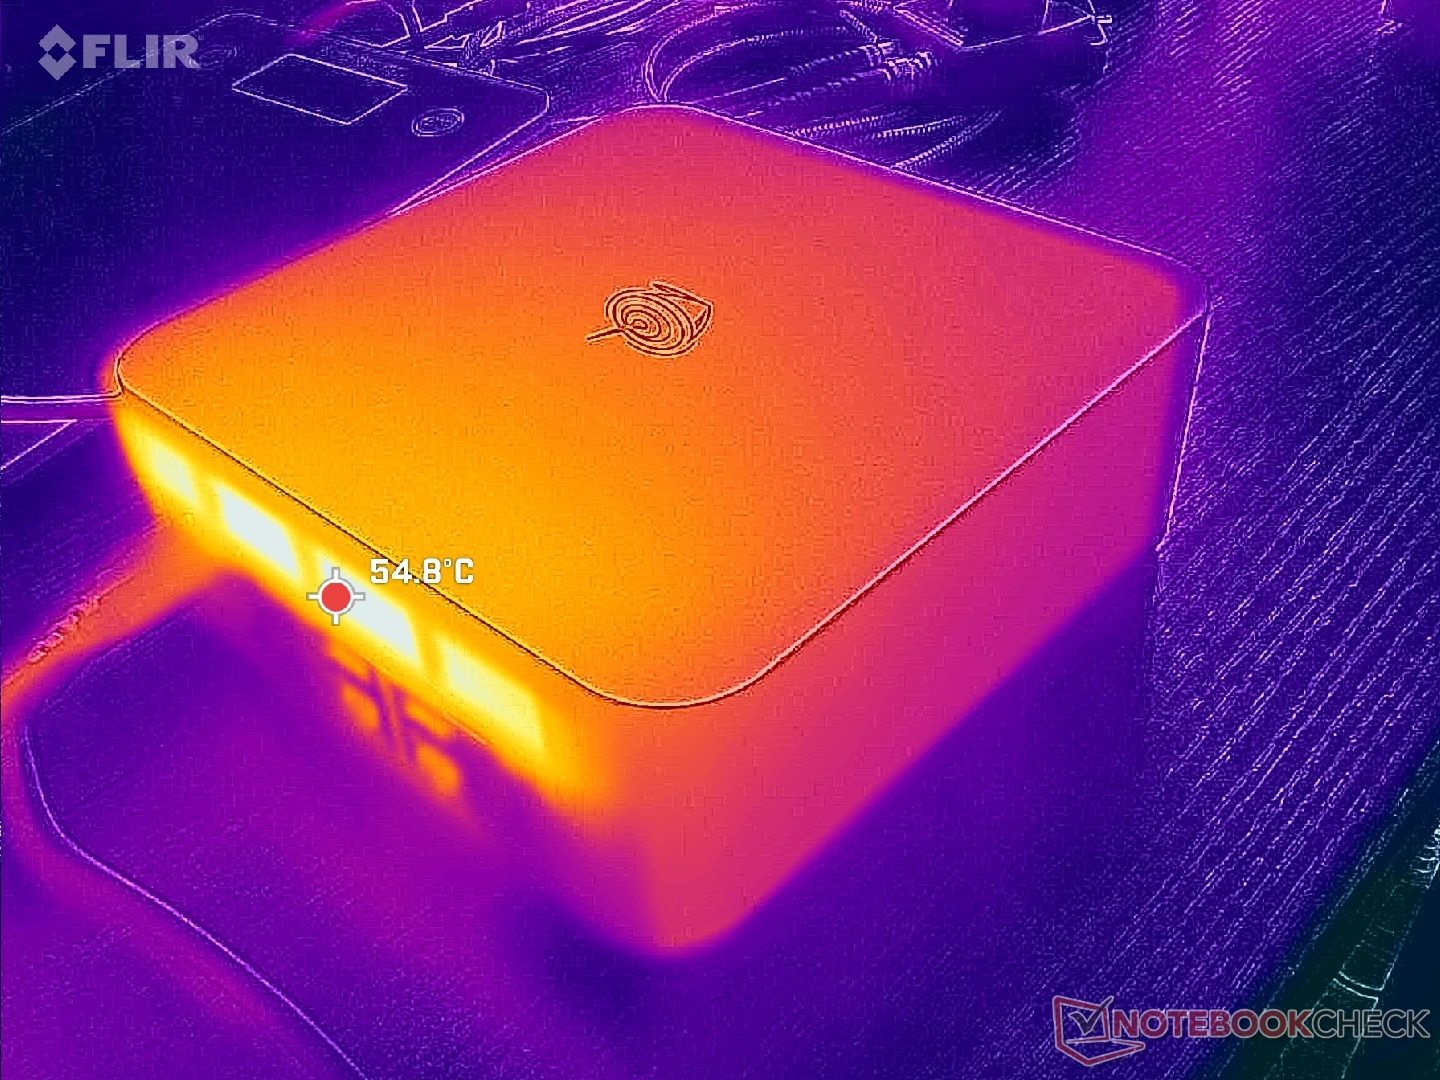
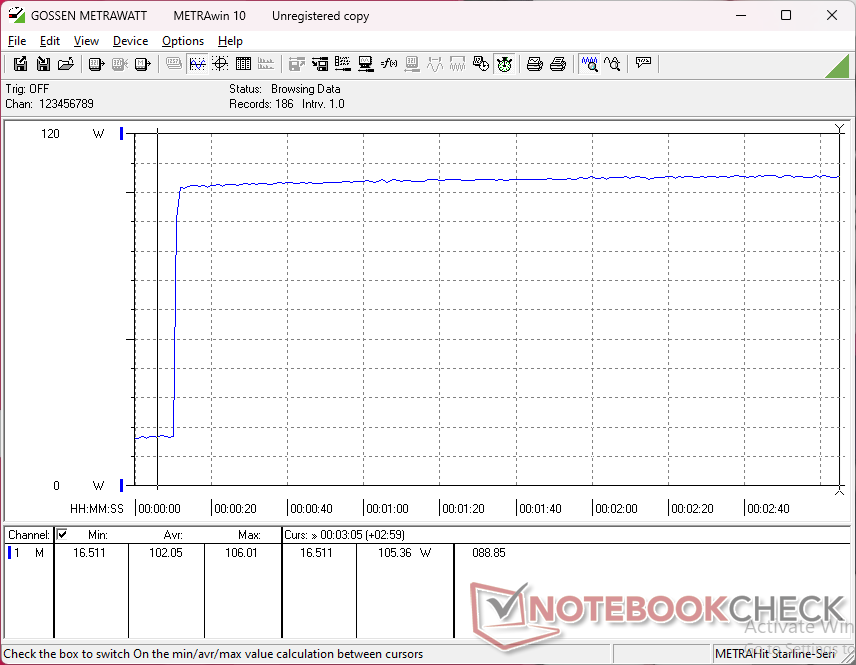
Die Kerntemperatur stabilisiert sich bei anspruchsvollen Lasten wie Spielen bei bis zu 77 °C, verglichen mit 68 °C bei den schnelleren AMD-getriebenen SER9.
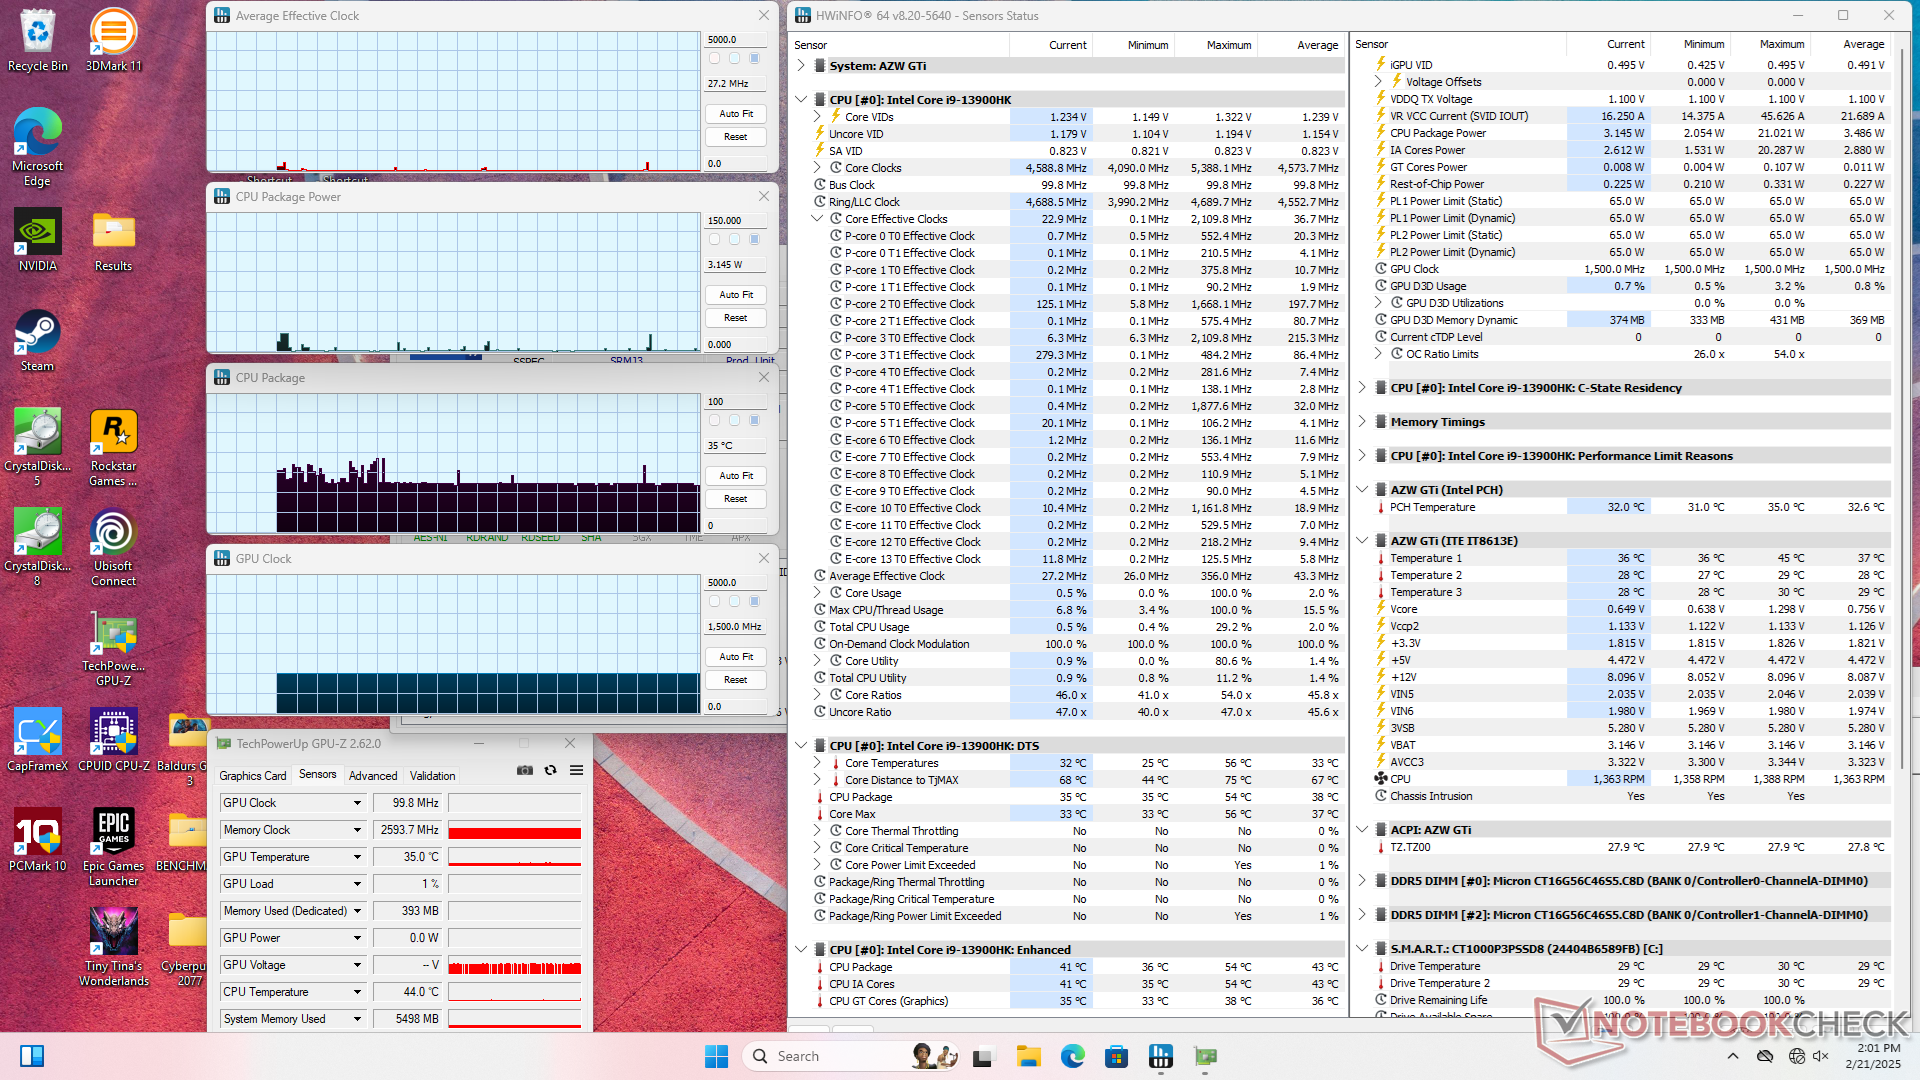
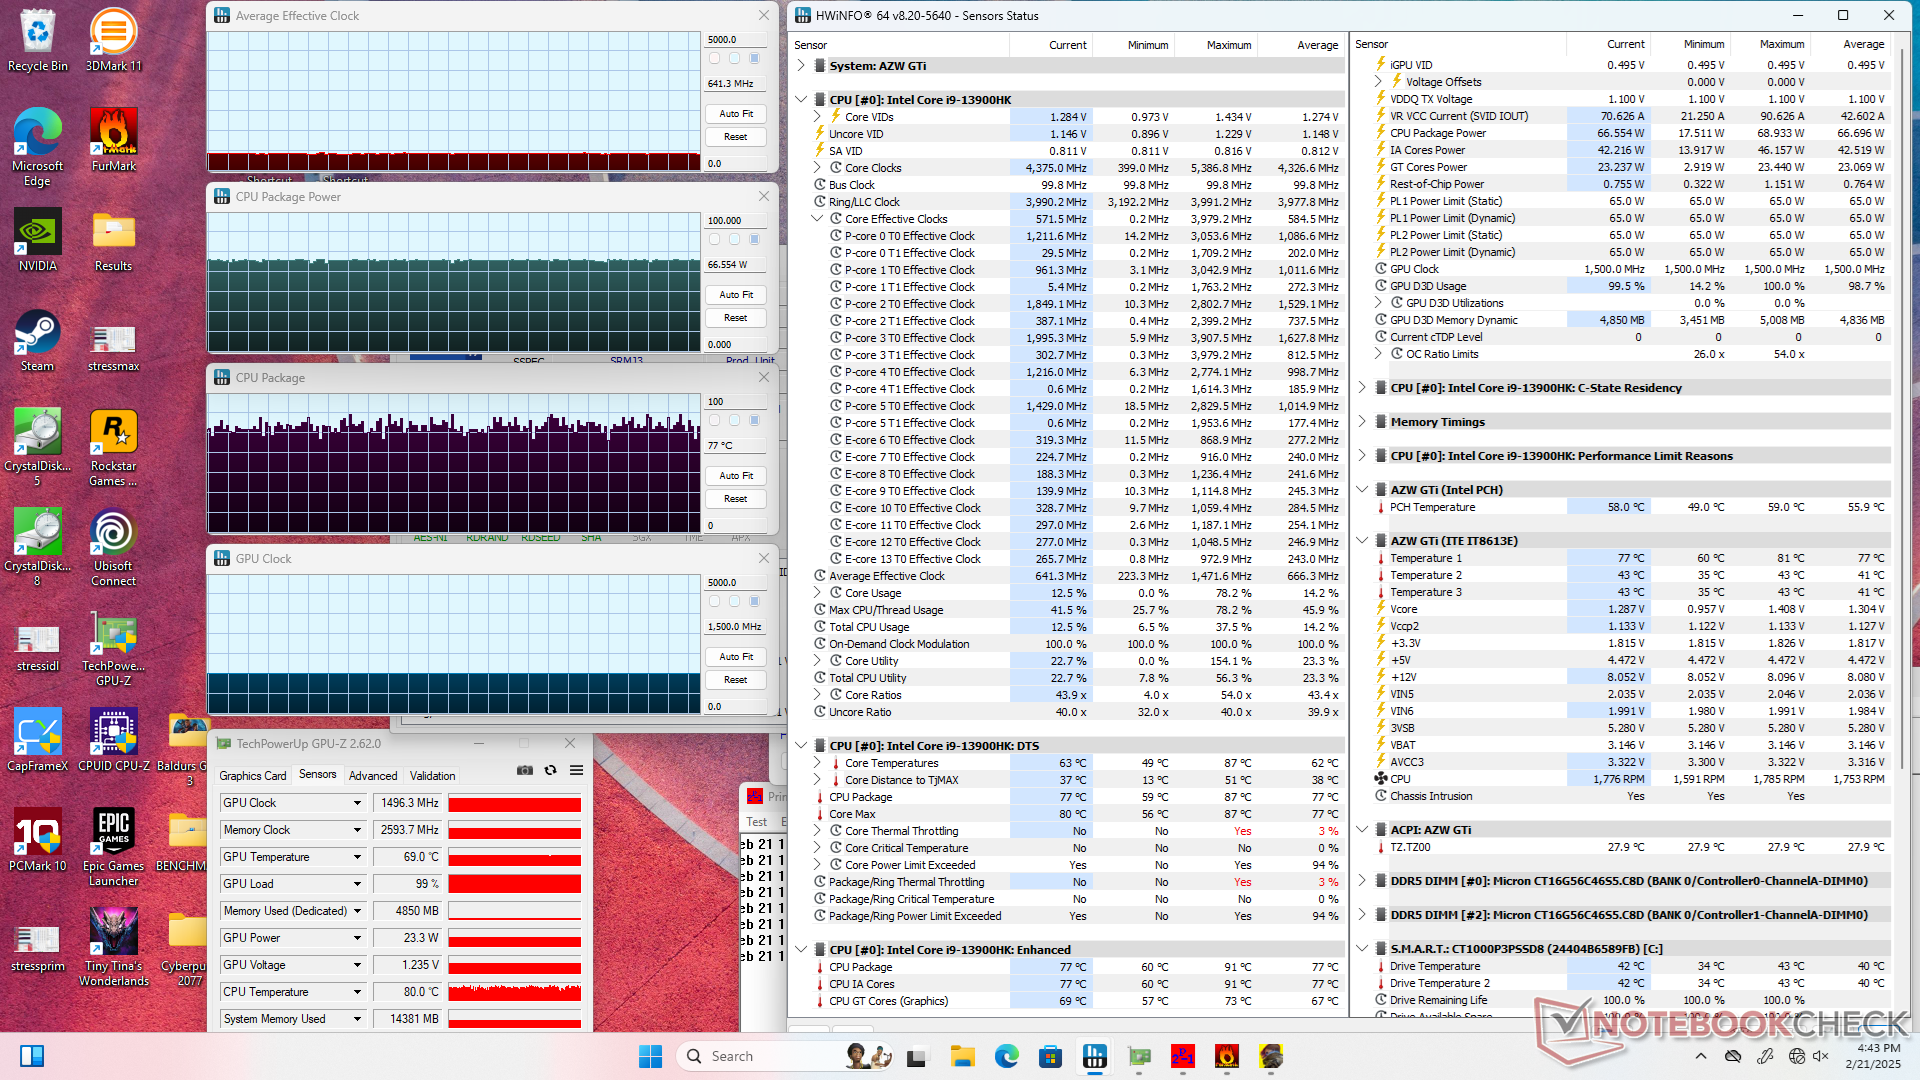
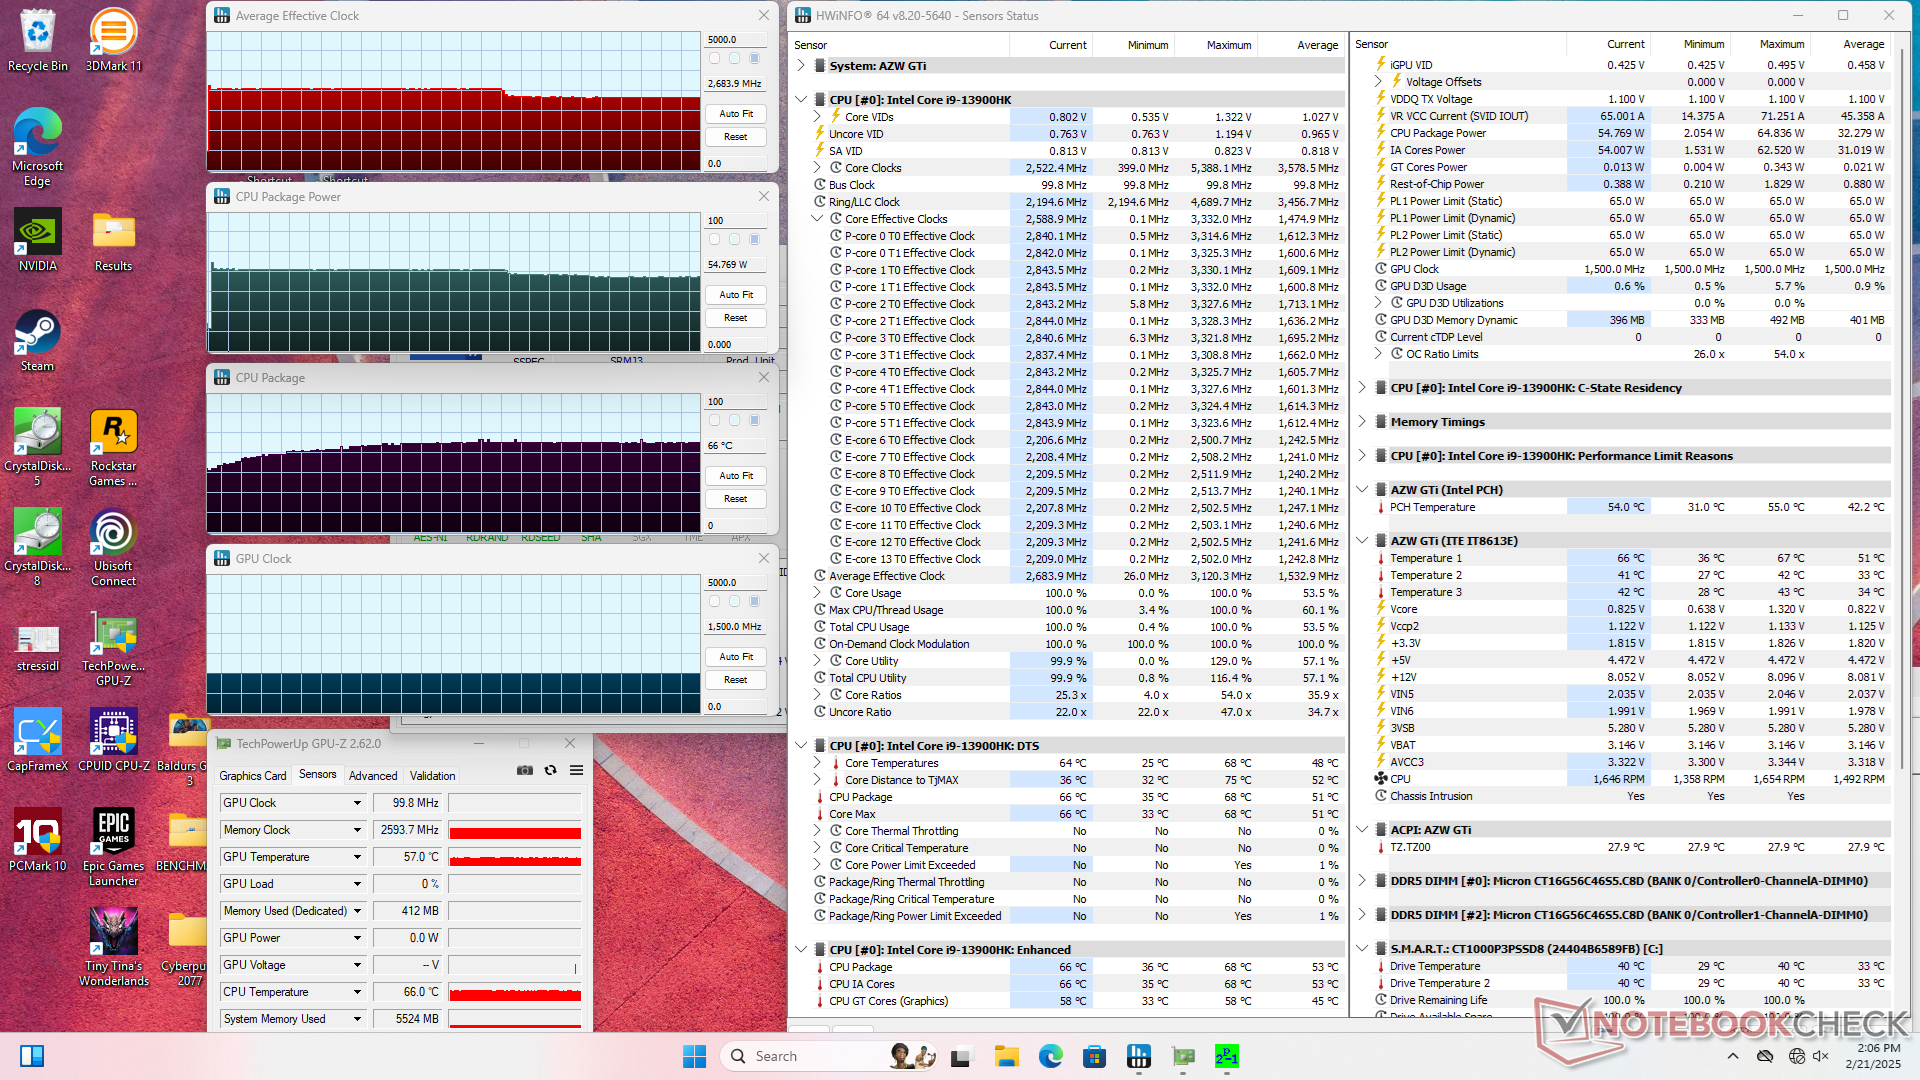

| durchschnittlicher CPU-Takt (GHz) | GPU-Takt (MHz) | durchschnittliche CPU-Temperatur (°C) | |
| System Leerlauf | -- | -- | 35 |
| Prime95 Stress | 2,7 | -- | 66 |
| Prime95 + FurMark Stress | 2.3 | 1.250 | 73 |
| Cyberpunk 2077 Stress | 0,6 | 1.500 | 77 |
System Performance
CrossMark: Overall | Productivity | Creativity | Responsiveness
WebXPRT 3: Overall
WebXPRT 4: Overall
Mozilla Kraken 1.1: Total
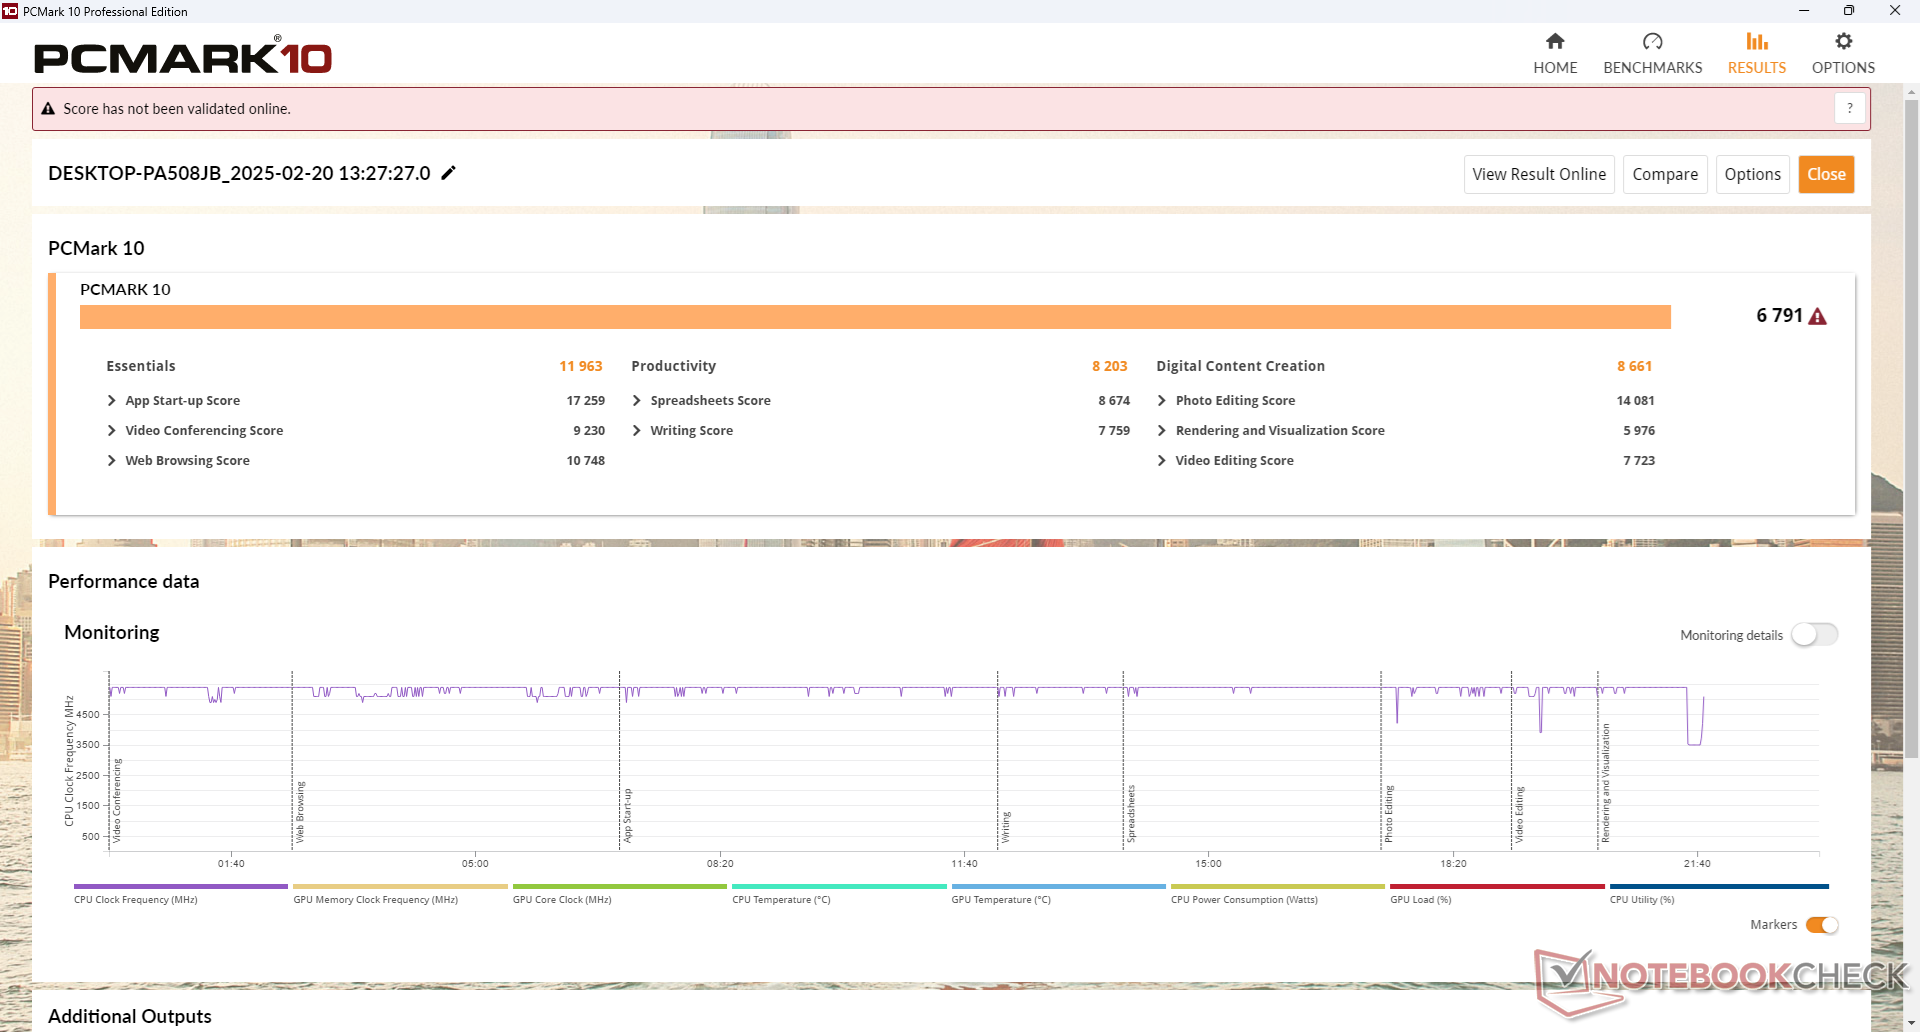
| PCMark 10 / Score | |
| Beelink SER9 | |
| Beelink GTR7 7840HS | |
| GMK EVO-X1 | |
| Minisforum EliteMini AI370 | |
| Beelink GTI13 Ultra | |
| GMK NucBox K9 | |
| Durchschnittliche Intel Core i9-13900HK, Intel Iris Xe Graphics G7 96EUs (5730 - 6791, n=2) | |
| PCMark 10 / Essentials | |
| Beelink GTI13 Ultra | |
| Beelink GTR7 7840HS | |
| GMK EVO-X1 | |
| Durchschnittliche Intel Core i9-13900HK, Intel Iris Xe Graphics G7 96EUs (9629 - 11963, n=2) | |
| GMK NucBox K9 | |
| Beelink SER9 | |
| Minisforum EliteMini AI370 | |
| PCMark 10 / Productivity | |
| Beelink GTR7 7840HS | |
| Beelink SER9 | |
| Minisforum EliteMini AI370 | |
| GMK EVO-X1 | |
| Beelink GTI13 Ultra | |
| Durchschnittliche Intel Core i9-13900HK, Intel Iris Xe Graphics G7 96EUs (7426 - 8203, n=2) | |
| GMK NucBox K9 | |
| PCMark 10 / Digital Content Creation | |
| Beelink SER9 | |
| Minisforum EliteMini AI370 | |
| GMK EVO-X1 | |
| Beelink GTR7 7840HS | |
| GMK NucBox K9 | |
| Beelink GTI13 Ultra | |
| Durchschnittliche Intel Core i9-13900HK, Intel Iris Xe Graphics G7 96EUs (7142 - 8661, n=2) | |
| CrossMark / Overall | |
| Beelink GTI13 Ultra | |
| Minisforum EliteMini AI370 | |
| Durchschnittliche Intel Core i9-13900HK, Intel Iris Xe Graphics G7 96EUs (1476 - 2099, n=3) | |
| Beelink SER9 | |
| GMK EVO-X1 | |
| GMK NucBox K9 | |
| Beelink GTR7 7840HS | |
| CrossMark / Productivity | |
| Beelink GTI13 Ultra | |
| Durchschnittliche Intel Core i9-13900HK, Intel Iris Xe Graphics G7 96EUs (1436 - 2012, n=3) | |
| Minisforum EliteMini AI370 | |
| GMK EVO-X1 | |
| GMK NucBox K9 | |
| Beelink SER9 | |
| Beelink GTR7 7840HS | |
| CrossMark / Creativity | |
| Beelink GTI13 Ultra | |
| Minisforum EliteMini AI370 | |
| Beelink SER9 | |
| GMK EVO-X1 | |
| Durchschnittliche Intel Core i9-13900HK, Intel Iris Xe Graphics G7 96EUs (1495 - 2192, n=3) | |
| GMK NucBox K9 | |
| Beelink GTR7 7840HS | |
| CrossMark / Responsiveness | |
| Beelink GTI13 Ultra | |
| Durchschnittliche Intel Core i9-13900HK, Intel Iris Xe Graphics G7 96EUs (1542 - 2097, n=3) | |
| Beelink GTR7 7840HS | |
| GMK EVO-X1 | |
| GMK NucBox K9 | |
| Beelink SER9 | |
| Minisforum EliteMini AI370 | |
| WebXPRT 3 / Overall | |
| Beelink GTI13 Ultra | |
| Beelink GTR7 7840HS | |
| GMK EVO-X1 | |
| Beelink SER9 | |
| Durchschnittliche Intel Core i9-13900HK, Intel Iris Xe Graphics G7 96EUs (215 - 353, n=3) | |
| Minisforum EliteMini AI370 | |
| GMK NucBox K9 | |
| WebXPRT 4 / Overall | |
| Beelink GTI13 Ultra | |
| Beelink GTR7 7840HS | |
| GMK EVO-X1 | |
| Durchschnittliche Intel Core i9-13900HK, Intel Iris Xe Graphics G7 96EUs (195.4 - 298, n=3) | |
| GMK NucBox K9 | |
| Beelink SER9 | |
| Minisforum EliteMini AI370 | |
| Mozilla Kraken 1.1 / Total | |
| GMK NucBox K9 | |
| Durchschnittliche Intel Core i9-13900HK, Intel Iris Xe Graphics G7 96EUs (461 - 684, n=3) | |
| Minisforum EliteMini AI370 | |
| Beelink GTR7 7840HS | |
| Beelink GTI13 Ultra | |
| Beelink SER9 | |
| GMK EVO-X1 | |
* ... kleinere Werte sind besser
| PCMark 10 Score | 6791 Punkte | |
Hilfe | ||
| AIDA64 / Memory Copy | |
| Beelink SER9 | |
| GMK EVO-X1 | |
| Minisforum EliteMini AI370 | |
| Beelink GTI13 Ultra | |
| Beelink GTR7 7840HS | |
| GMK NucBox K9 | |
| Durchschnittliche Intel Core i9-13900HK (45935 - 74460, n=4) | |
| AIDA64 / Memory Read | |
| GMK EVO-X1 | |
| Minisforum EliteMini AI370 | |
| Beelink SER9 | |
| Beelink GTI13 Ultra | |
| GMK NucBox K9 | |
| Beelink GTR7 7840HS | |
| Durchschnittliche Intel Core i9-13900HK (34298 - 74896, n=4) | |
| AIDA64 / Memory Write | |
| GMK EVO-X1 | |
| Beelink SER9 | |
| Minisforum EliteMini AI370 | |
| Beelink GTR7 7840HS | |
| Beelink GTI13 Ultra | |
| GMK NucBox K9 | |
| Durchschnittliche Intel Core i9-13900HK (47347 - 85917, n=4) | |
| AIDA64 / Memory Latency | |
| GMK NucBox K9 | |
| Beelink SER9 | |
| GMK EVO-X1 | |
| Minisforum EliteMini AI370 | |
| Durchschnittliche Intel Core i9-13900HK (83 - 115.3, n=4) | |
| Beelink GTR7 7840HS | |
| Beelink GTI13 Ultra | |
* ... kleinere Werte sind besser
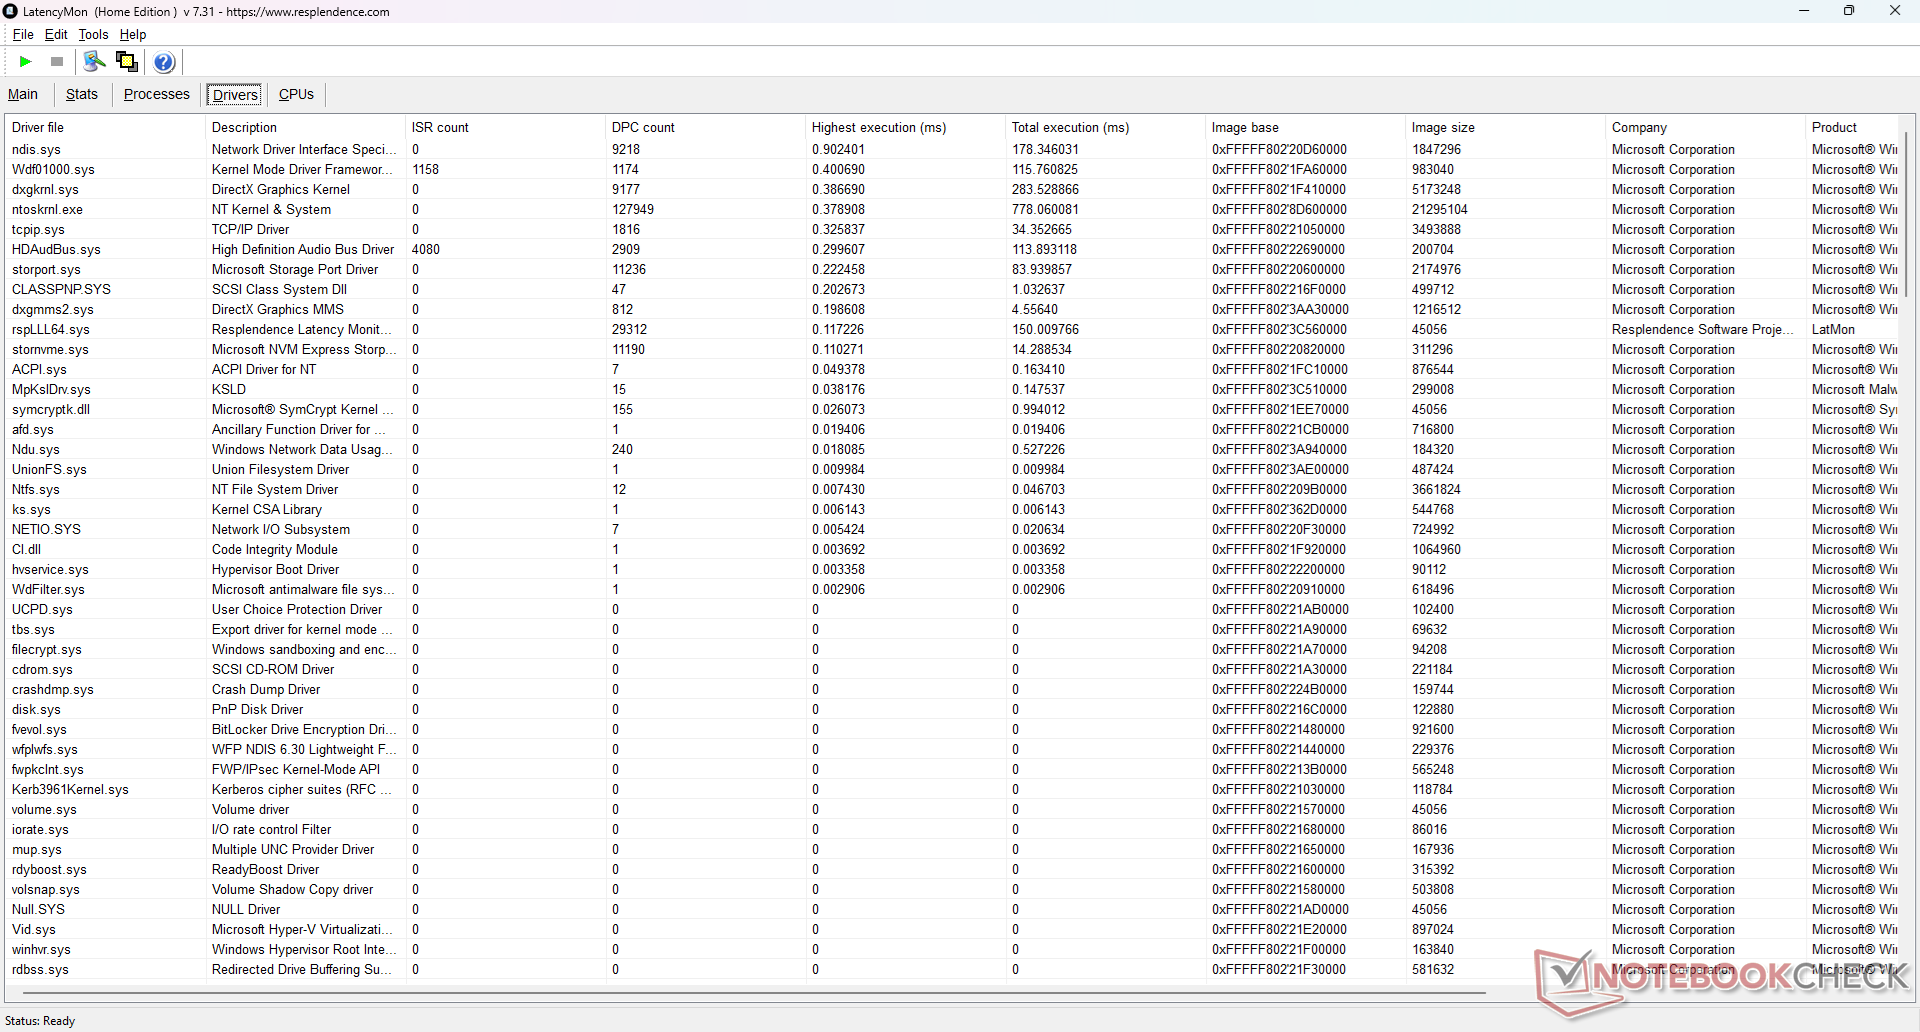
DPC-Latenzzeit
LatencyMon zeigt keine größeren DPC-Probleme beim Öffnen mehrerer Browser Tabs unserer Homepage. Die 4K60-Videowiedergabe ist perfekt. Nur ein einziger Frame wurde zu Beginn des Tests abgebrochen.
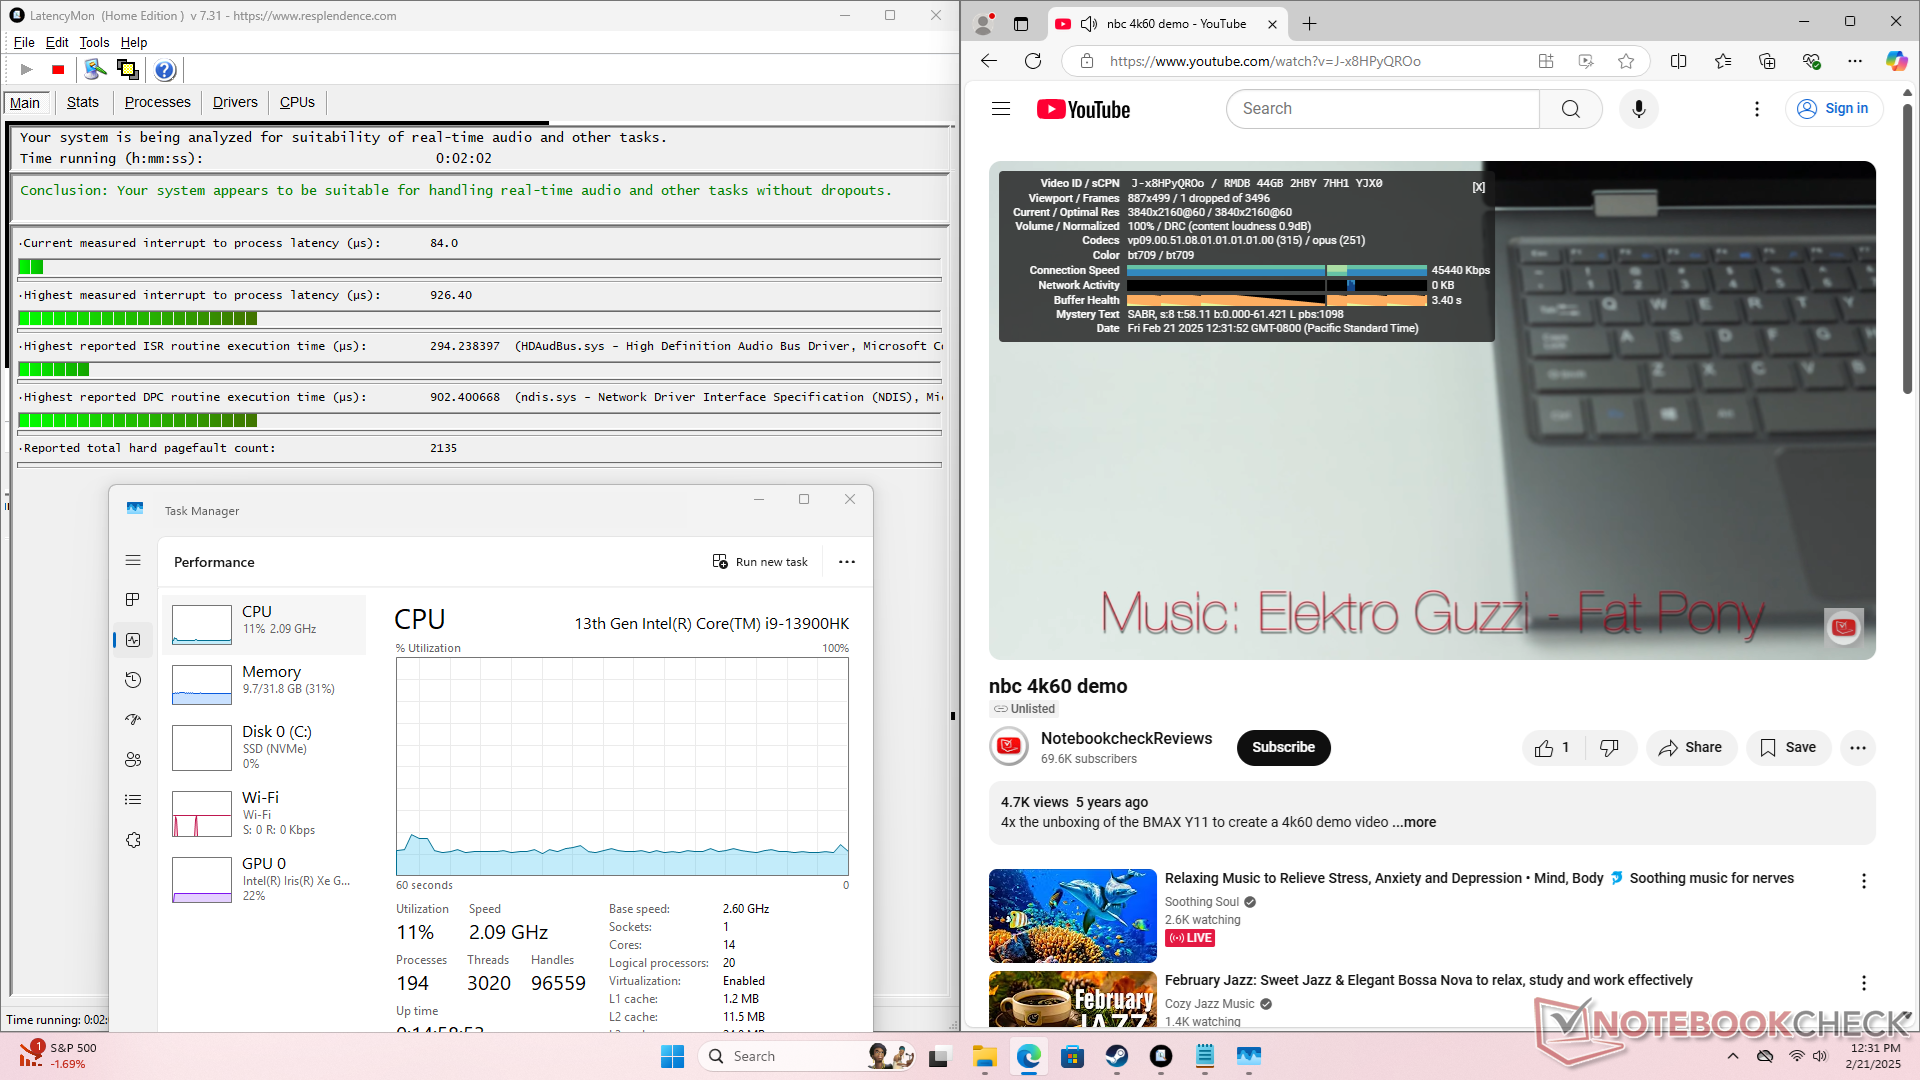
| DPC Latencies / LatencyMon - interrupt to process latency (max), Web, Youtube, Prime95 | |
| GMK NucBox K9 | |
| Minisforum EliteMini AI370 | |
| Beelink GTI13 Ultra | |
| GMK EVO-X1 | |
| Beelink GTR7 7840HS | |
* ... kleinere Werte sind besser
Speichergeräte
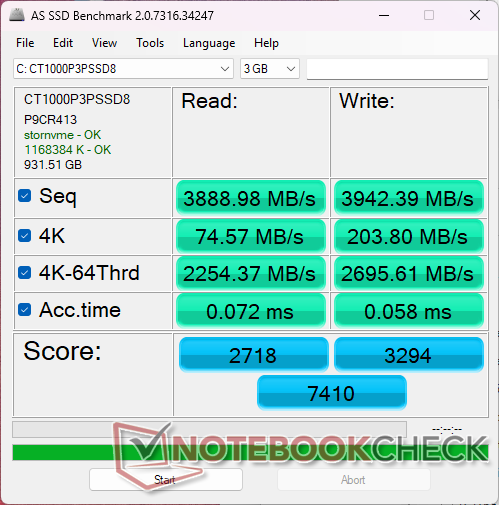
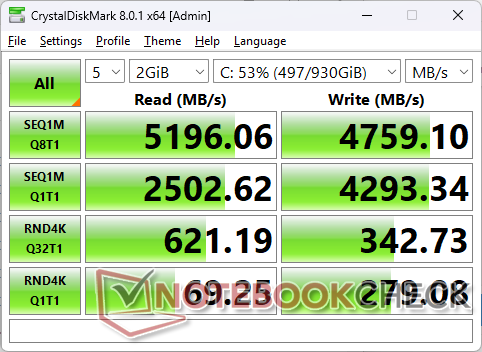

| Drive Performance Rating - Percent | |
| Beelink GTI13 Ultra | |
| GMK NucBox K9 | |
| Beelink GTR7 7840HS | |
| Minisforum EliteMini AI370 | |
| Beelink SER9 | |
| GMK EVO-X1 | |
* ... kleinere Werte sind besser
Disk Throttling: DiskSpd Read Loop, Queue Depth 8
GPU Performance
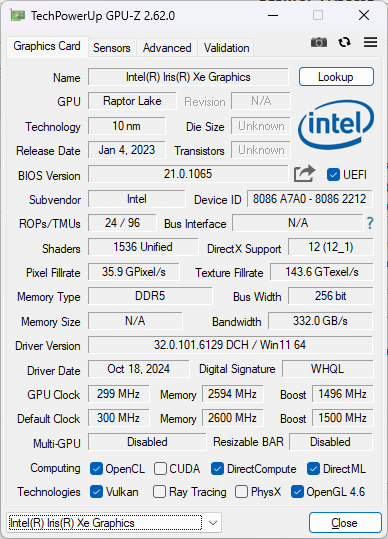
Die alternde Iris Xe Grafik G7 96EUs liegt jetzt zwei bis drei Generationen hinter der neuesten Radeon 890M oder Intel Arc 140, was zu einer bis zu 50 Prozent geringeren Leistung führt. Anspruchsvolle Titel wie Cyberpunk 2077 laufen auf diesem Mini-PC unabhängig von den Einstellungen nur schwer.
X-Plane 11.11 lässt sich ungeachtet der Einstellungen nicht starten.
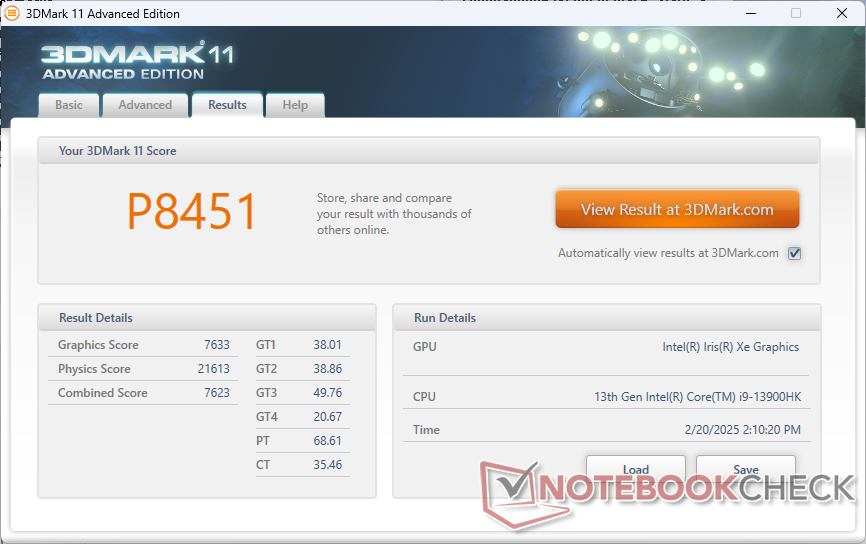
| 3DMark 11 Performance | 8451 Punkte | |
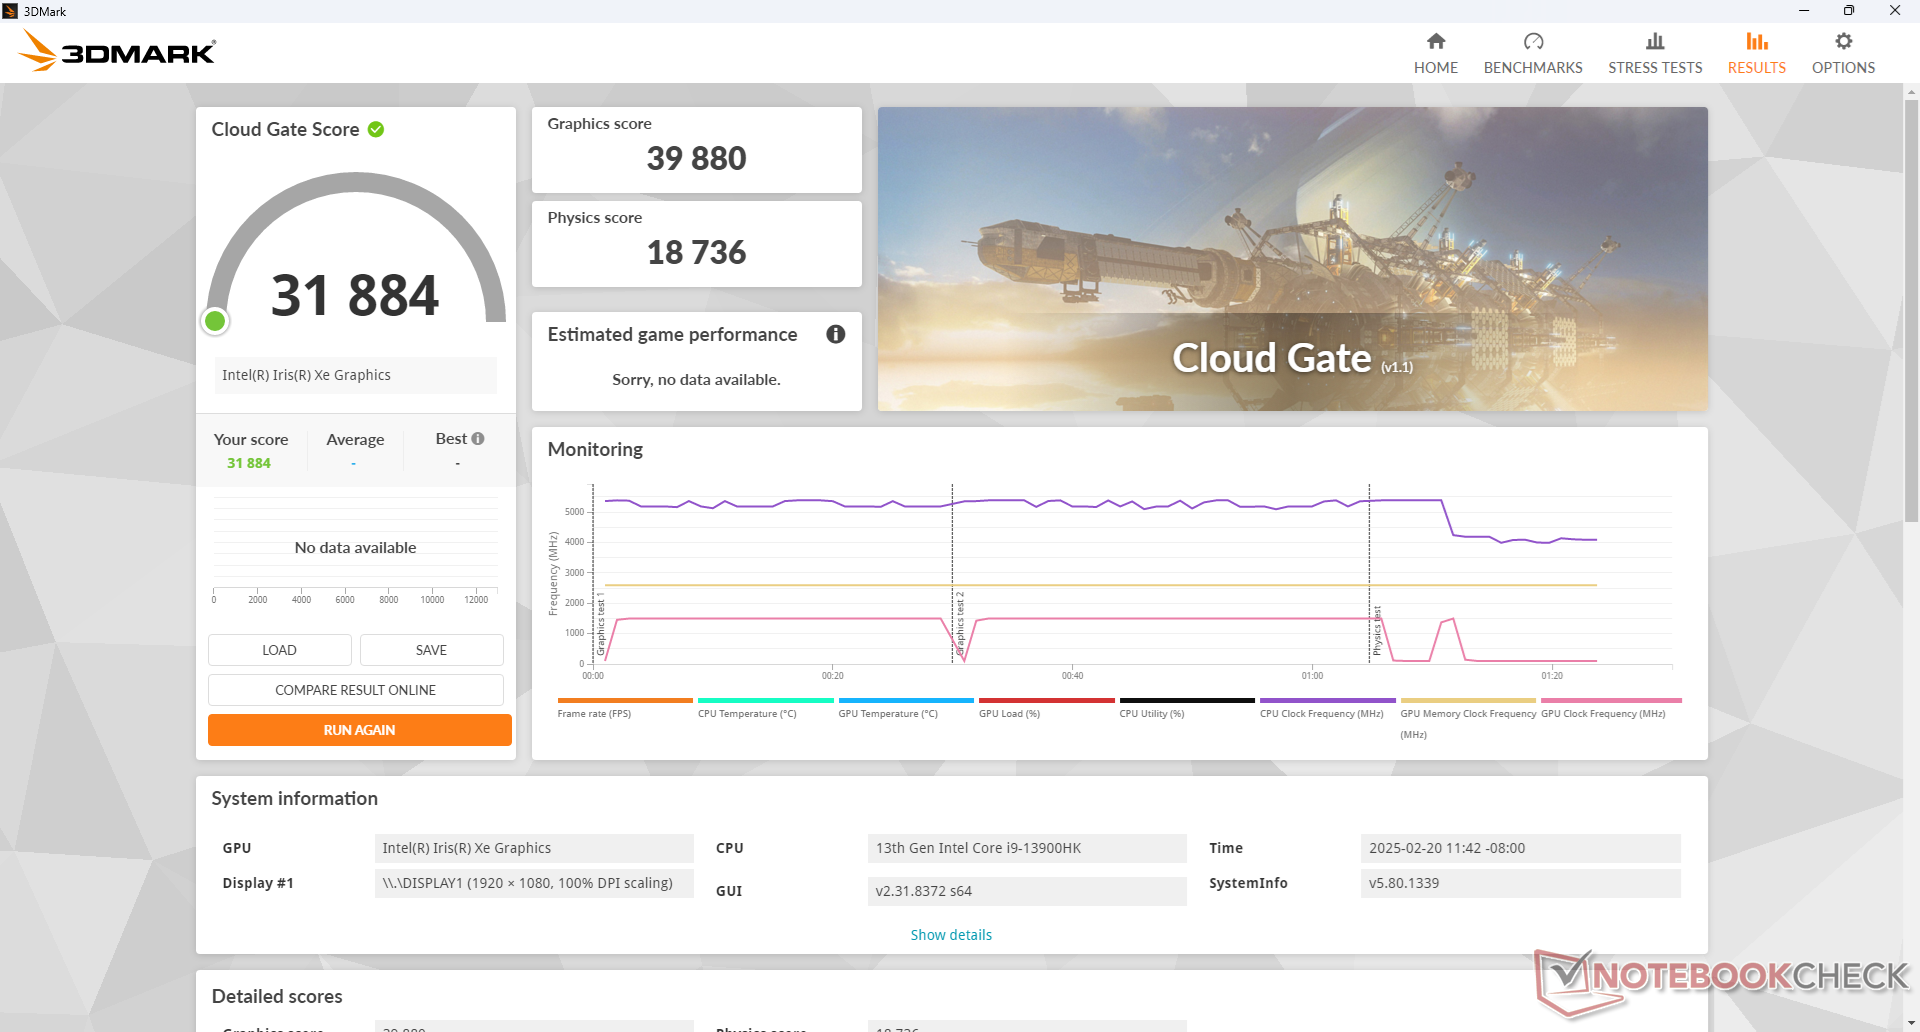
| 3DMark Cloud Gate Standard Score | 31884 Punkte | |
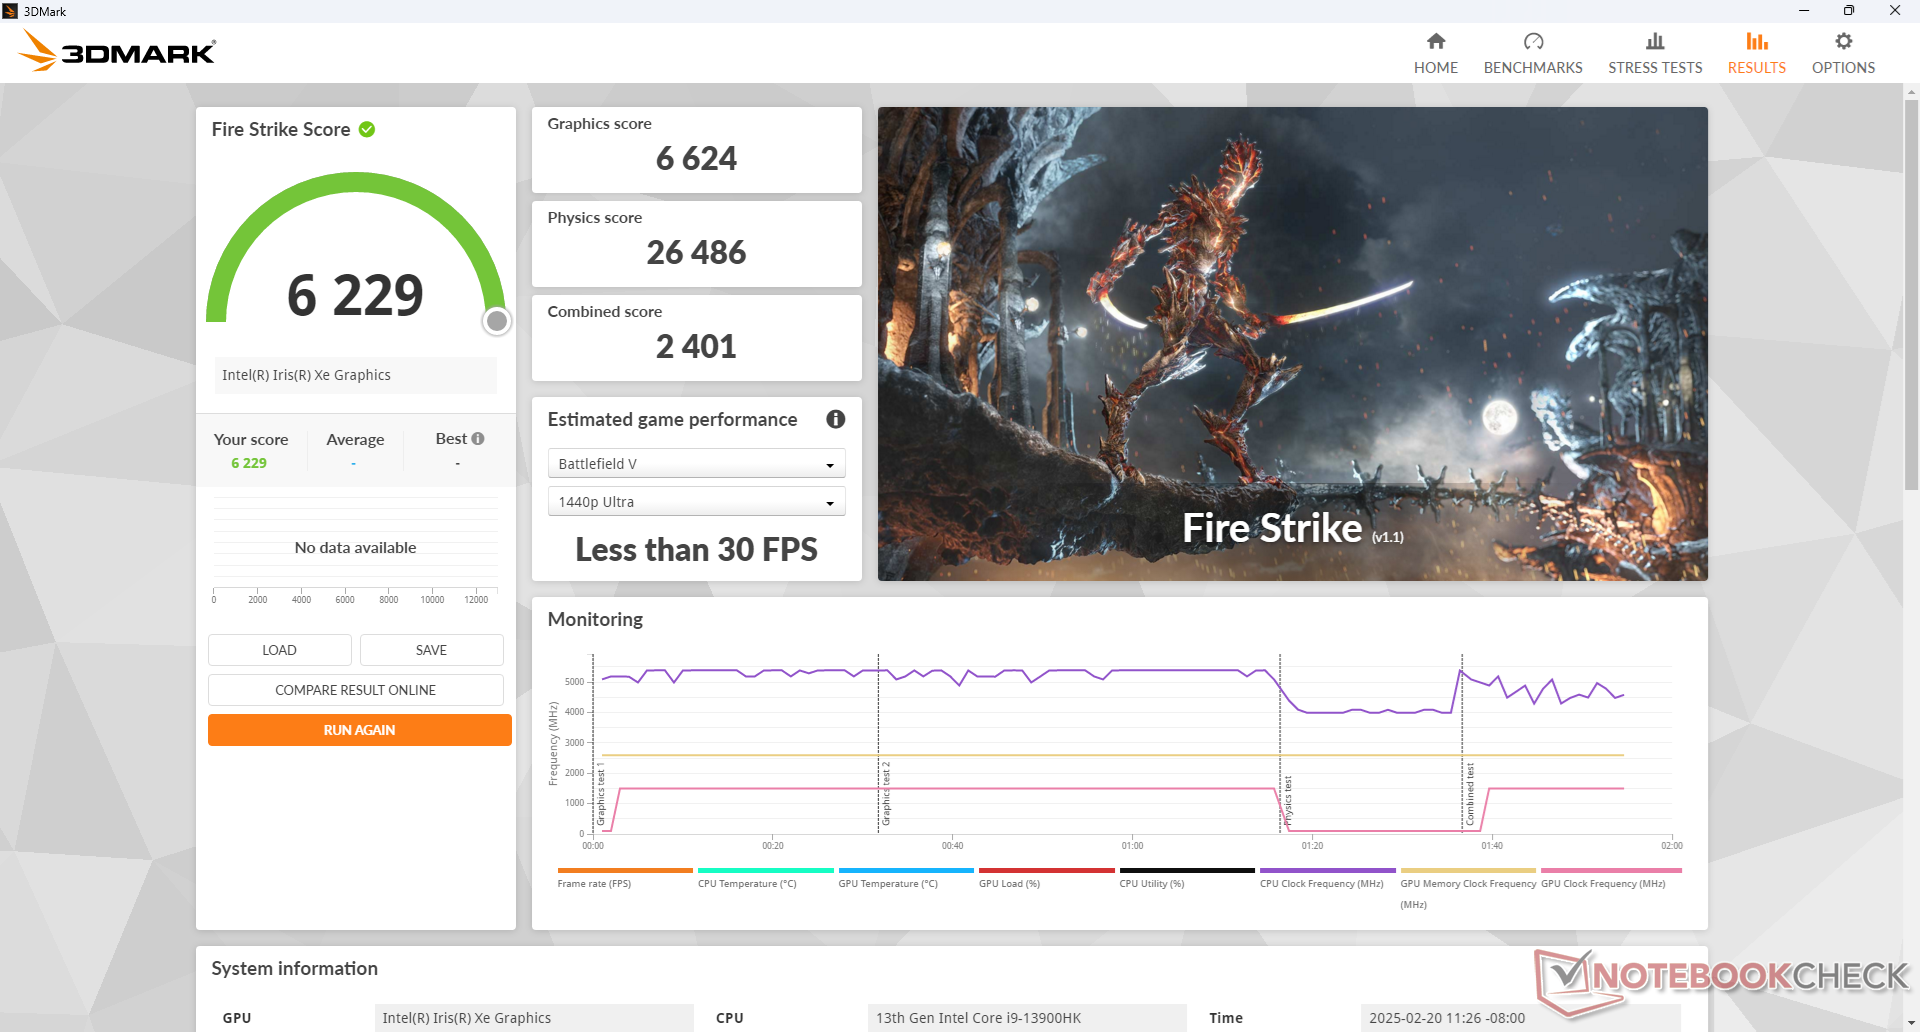
| 3DMark Fire Strike Score | 6229 Punkte | |
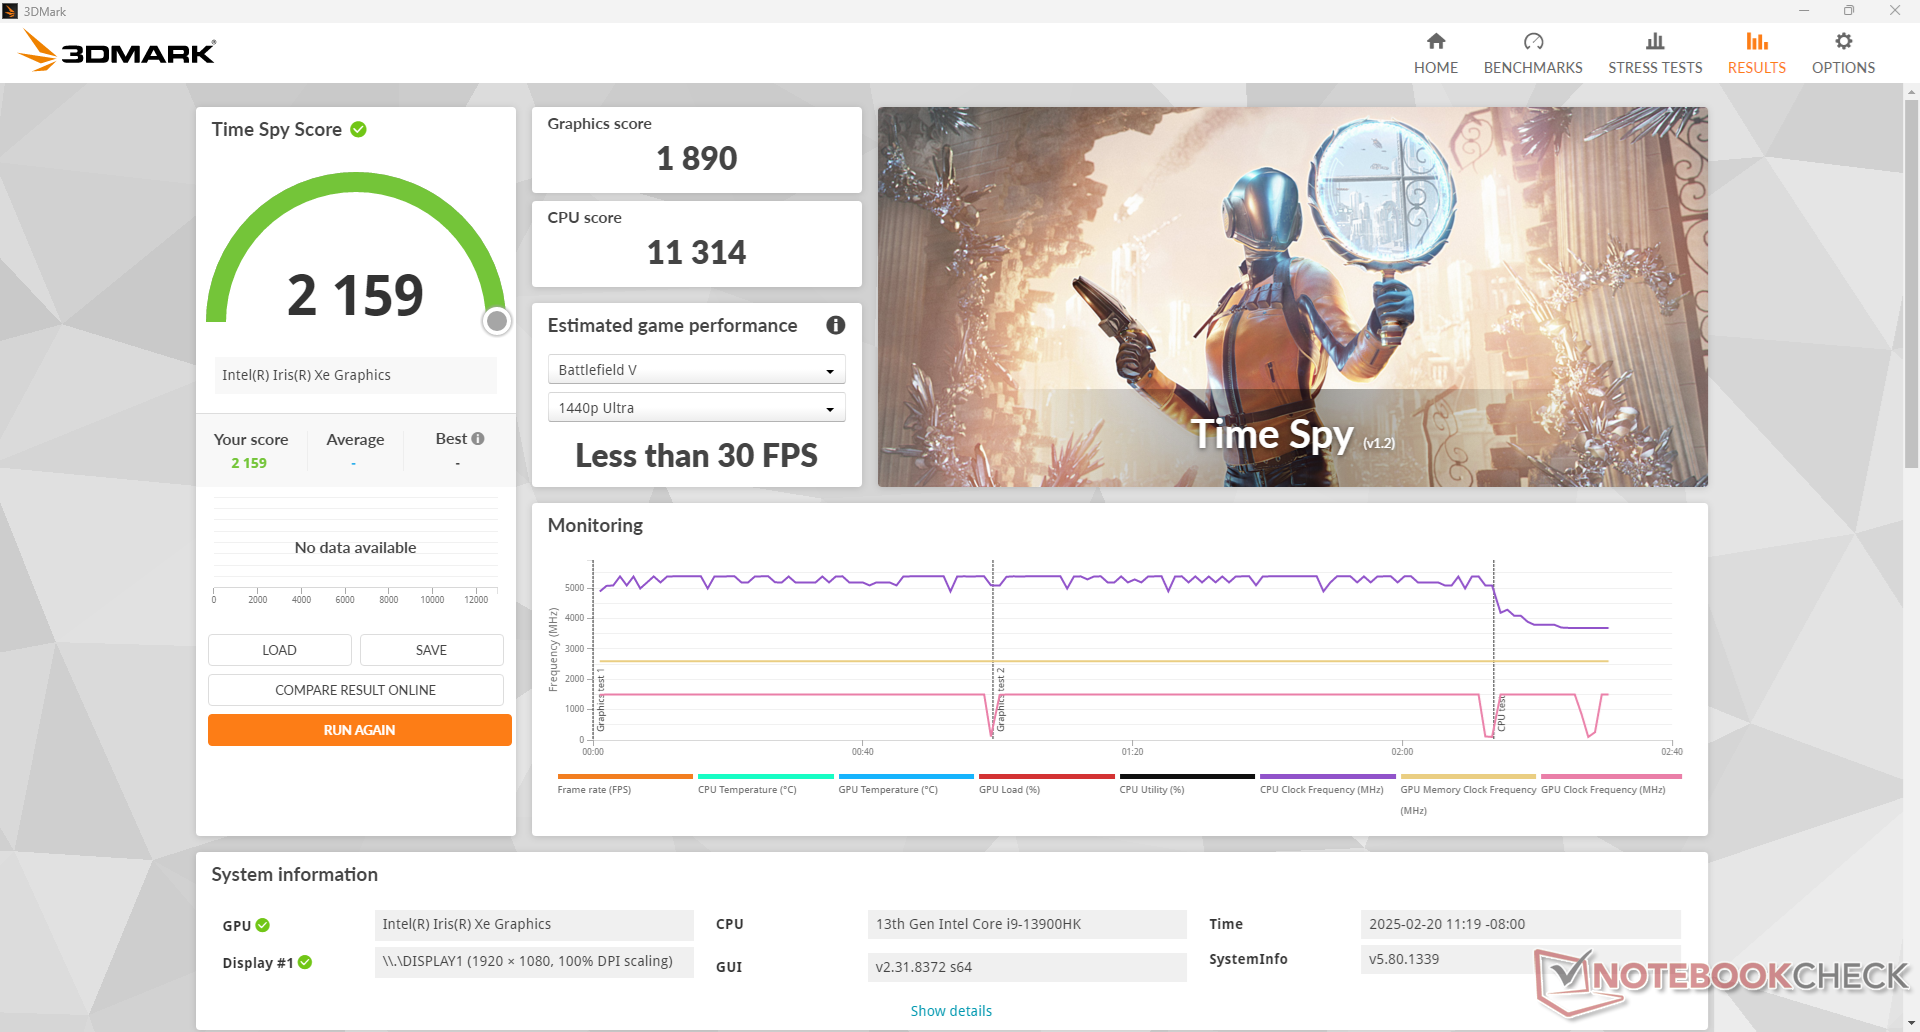
| 3DMark Time Spy Score | 2159 Punkte | |
Hilfe | ||
| Blender | |
| v3.3 Classroom HIP/AMD | |
| GMK NucBox K2 | |
| v3.3 Classroom OPTIX/RTX | |
| Beelink GTI12 Ultra EX Docking Station | |
| Asus ROG NUC 14-90AS0051 | |
| v3.3 Classroom CUDA | |
| Beelink GTI12 Ultra EX Docking Station | |
| v3.3 Classroom CPU | |
| Durchschnittliche Intel Iris Xe Graphics G7 96EUs (336 - 1259, n=109) | |
| Beelink GTR7 7840HS | |
| Khadas Mind 2 | |
| GMK NucBox K2 | |
| GMK NucBox K9 | |
| Minisforum Venus Series NAB9 | |
| Beelink GTI13 Ultra | |
| Beelink GTI12 Ultra EX Docking Station | |
| BOSGAME M2 | |
| Asus ROG NUC 14-90AS0051 | |
| Beelink SER9 | |
| v3.3 Classroom oneAPI/Intel | |
| GMK NucBox K9 | |
| Asus ROG NUC 14-90AS0051 | |
| Khadas Mind 2 | |
* ... kleinere Werte sind besser
| Far Cry 5 | |
| 1280x720 Low Preset AA:T | |
| Beelink GTI12 Ultra EX Docking Station | |
| Beelink SER9 | |
| BOSGAME M2 | |
| Beelink GTI13 Ultra | |
| GMK NucBox K9 | |
| GMK NucBox K2 | |
| Durchschnittliche Intel Iris Xe Graphics G7 96EUs (23 - 75, n=93) | |
| 1920x1080 Medium Preset AA:T | |
| Beelink GTI12 Ultra EX Docking Station | |
| Beelink SER9 | |
| BOSGAME M2 | |
| GMK NucBox K2 | |
| GMK NucBox K9 | |
| Beelink GTI13 Ultra | |
| Durchschnittliche Intel Iris Xe Graphics G7 96EUs (14 - 39, n=91) | |
| 1920x1080 High Preset AA:T | |
| Beelink GTI12 Ultra EX Docking Station | |
| Beelink SER9 | |
| BOSGAME M2 | |
| GMK NucBox K2 | |
| GMK NucBox K9 | |
| Beelink GTI13 Ultra | |
| Durchschnittliche Intel Iris Xe Graphics G7 96EUs (10 - 35, n=89) | |
| 1920x1080 Ultra Preset AA:T | |
| Beelink GTI12 Ultra EX Docking Station | |
| Beelink SER9 | |
| BOSGAME M2 | |
| GMK NucBox K2 | |
| GMK NucBox K9 | |
| Beelink GTI13 Ultra | |
| Durchschnittliche Intel Iris Xe Graphics G7 96EUs (11 - 33, n=75) | |
| Baldur's Gate 3 | |
| 1280x720 Low Preset AA:SM | |
| Beelink GTI12 Ultra EX Docking Station | |
| Beelink GTI13 Ultra | |
| BOSGAME M2 | |
| Beelink SER9 | |
| GMK NucBox K9 | |
| Khadas Mind 2 | |
| Durchschnittliche Intel Iris Xe Graphics G7 96EUs (14.5 - 66.1, n=13) | |
| 1920x1080 Low Preset AA:SM | |
| Beelink GTI12 Ultra EX Docking Station | |
| BOSGAME M2 | |
| Beelink SER9 | |
| GMK NucBox K9 | |
| Khadas Mind 2 | |
| Beelink GTI13 Ultra | |
| Durchschnittliche Intel Iris Xe Graphics G7 96EUs (9.4 - 29.3, n=13) | |
| 1920x1080 Medium Preset AA:T | |
| Beelink GTI12 Ultra EX Docking Station | |
| BOSGAME M2 | |
| Beelink SER9 | |
| GMK NucBox K9 | |
| Khadas Mind 2 | |
| Beelink GTI13 Ultra | |
| Durchschnittliche Intel Iris Xe Graphics G7 96EUs (10.7 - 18.2, n=10) | |
| 1920x1080 High Preset AA:T | |
| Beelink GTI12 Ultra EX Docking Station | |
| BOSGAME M2 | |
| Beelink SER9 | |
| GMK NucBox K9 | |
| Khadas Mind 2 | |
| Beelink GTI13 Ultra | |
| Durchschnittliche Intel Iris Xe Graphics G7 96EUs (9.2 - 14.1, n=10) | |
| 1920x1080 Ultra Preset AA:T | |
| Beelink GTI12 Ultra EX Docking Station | |
| BOSGAME M2 | |
| GMK NucBox K9 | |
| Khadas Mind 2 | |
| Durchschnittliche Intel Iris Xe Graphics G7 96EUs (9.2 - 13.1, n=9) | |
Cyberpunk 2077 Ultra fps-Chart
| min. | mittel | hoch | max. | |
|---|---|---|---|---|
| GTA V (2015) | 164.6 | 152.7 | 30.9 | 12.5 |
| Dota 2 Reborn (2015) | 124.3 | 99.4 | 84.8 | 77.4 |
| Final Fantasy XV Benchmark (2018) | 56.1 | 31.1 | 21.2 | |
| Far Cry 5 (2018) | 74 | 38 | 35 | 33 |
| Strange Brigade (2018) | 112.9 | 50.2 | 39.2 | 31.4 |
| Tiny Tina's Wonderlands (2022) | 37.2 | 29.3 | 18.2 | 14.1 |
| F1 22 (2022) | 56.9 | 51.7 | 37 | 28.2 |
| Baldur's Gate 3 (2023) | 29.3 | 18.2 | 14.1 | |
| Cyberpunk 2077 (2023) | 22.2 | 17.6 | 14.8 | 12.9 |
Emissionen
Systemrauschen
Das Lüftergeräusch ist sicherlich leiser als bei vielen anderen Mini-PCs, insbesondere bei denen, die mit AMD Prozessoren ausgestattet sind. Allerdings sind diese AMD Alternativen auch viel schneller, wenn es um die Grafikleistung geht, wie unsere Vergleichstabellen oben zeigen.
Lautstärkediagramm
| Idle |
| 26.5 / 26.7 / 28.5 dB(A) |
| Last |
| 30.6 / 30.8 dB(A) |
 | ||
30 dB leise 40 dB(A) deutlich hörbar 50 dB(A) störend |
||
min: | ||
| Beelink GTI13 Ultra Iris Xe G7 96EUs, i9-13900HK, Crucial P5 Plus 1TB CT1000P5PSSD8 | Beelink SER9 Radeon 890M, Ryzen AI 9 HX 370, Crucial P3 Plus CT1000P3PSSD8 | Beelink GTR7 7840HS Radeon 780M, R7 7840HS, Crucial P3 Plus CT1000P3PSSD8 | GMK EVO-X1 Radeon 890M, Ryzen AI 9 HX 370, Crucial P3 Plus CT1000P3PSSD8 | Minisforum EliteMini AI370 Radeon 890M, Ryzen AI 9 HX 370, Crucial P3 Plus CT1000P3PSSD8 | GMK NucBox K9 Arc 7-Core, Ultra 5 125H, MasonSemi 1TB MC7000 | |
|---|---|---|---|---|---|---|
| Geräuschentwicklung | -3% | -12% | -22% | -20% | -26% | |
| aus / Umgebung * (dB) | 23.4 | 23.2 1% | 25.6 -9% | 23.3 -0% | 24.8 -6% | 23 2% |
| Idle min * (dB) | 26.5 | 26.6 -0% | 28.1 -6% | 27.8 -5% | 25 6% | 29.8 -12% |
| Idle avg * (dB) | 26.7 | 26.8 -0% | 28.1 -5% | 30.3 -13% | 25.1 6% | 35.7 -34% |
| Idle max * (dB) | 28.5 | 26.8 6% | 28.1 1% | 30.4 -7% | 29.1 -2% | 35.7 -25% |
| Last avg * (dB) | 30.6 | 33.4 -9% | 34.9 -14% | 44.6 -46% | 47 -54% | 41.9 -37% |
| Cyberpunk 2077 ultra * (dB) | 32.5 | 34.6 -6% | 44.2 -36% | 44 -35% | 43.8 -35% | |
| Last max * (dB) | 30.8 | 33.8 -10% | 42.4 -38% | 46.1 -50% | 47.1 -53% | 44 -43% |
| Witcher 3 ultra * (dB) | 36.4 |
* ... kleinere Werte sind besser
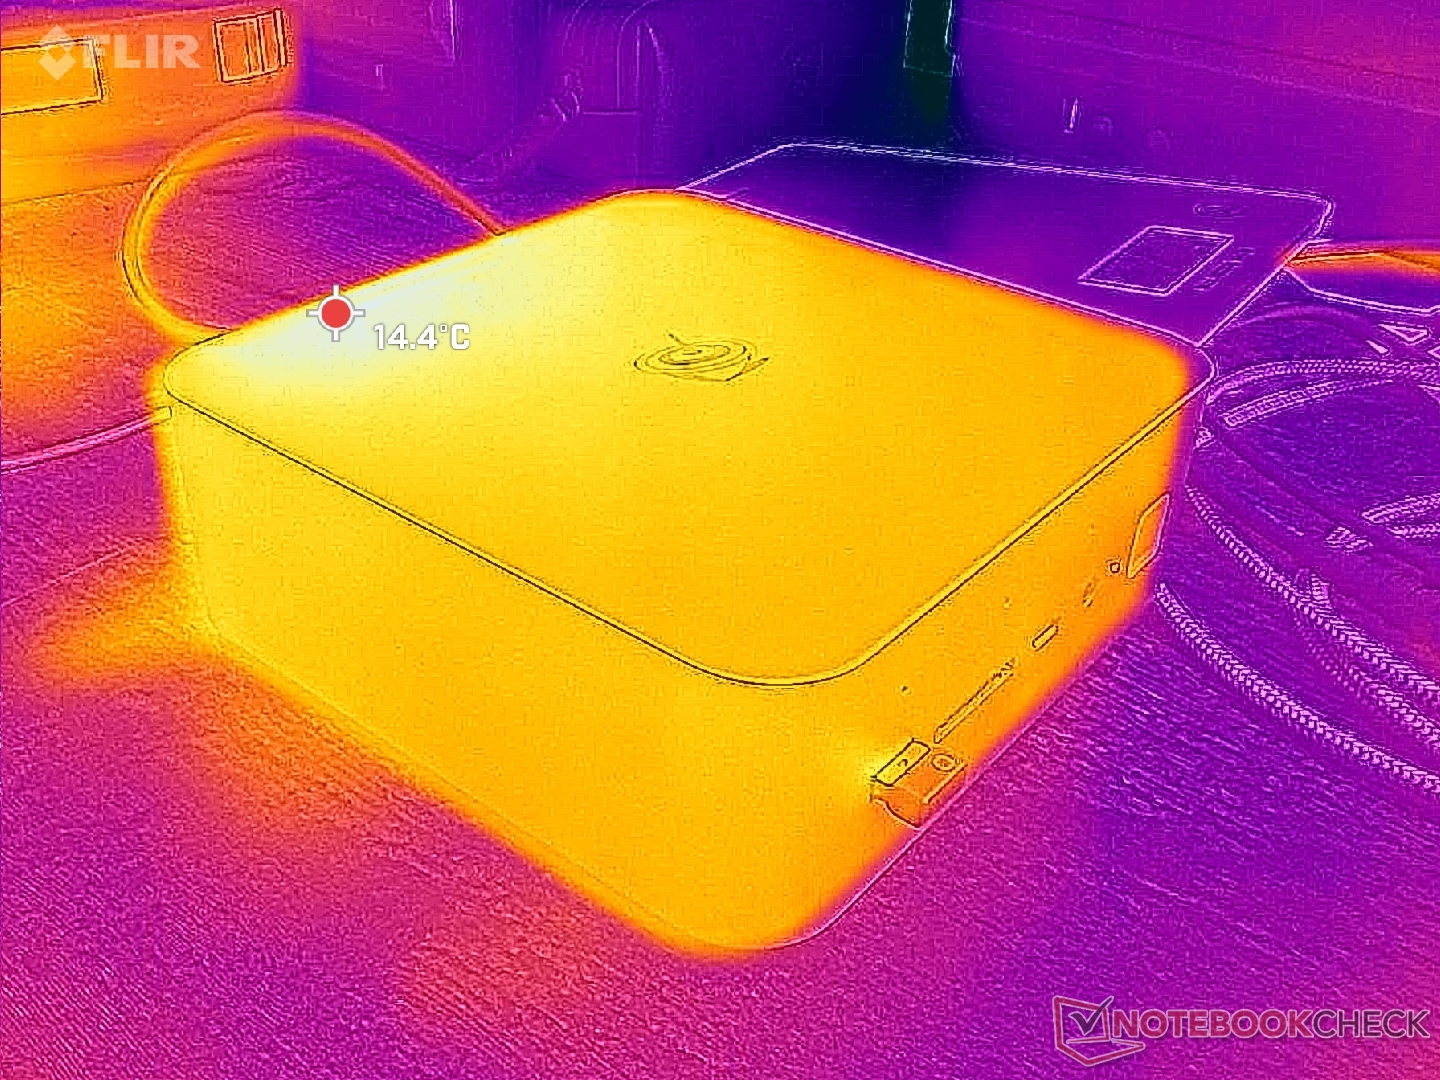
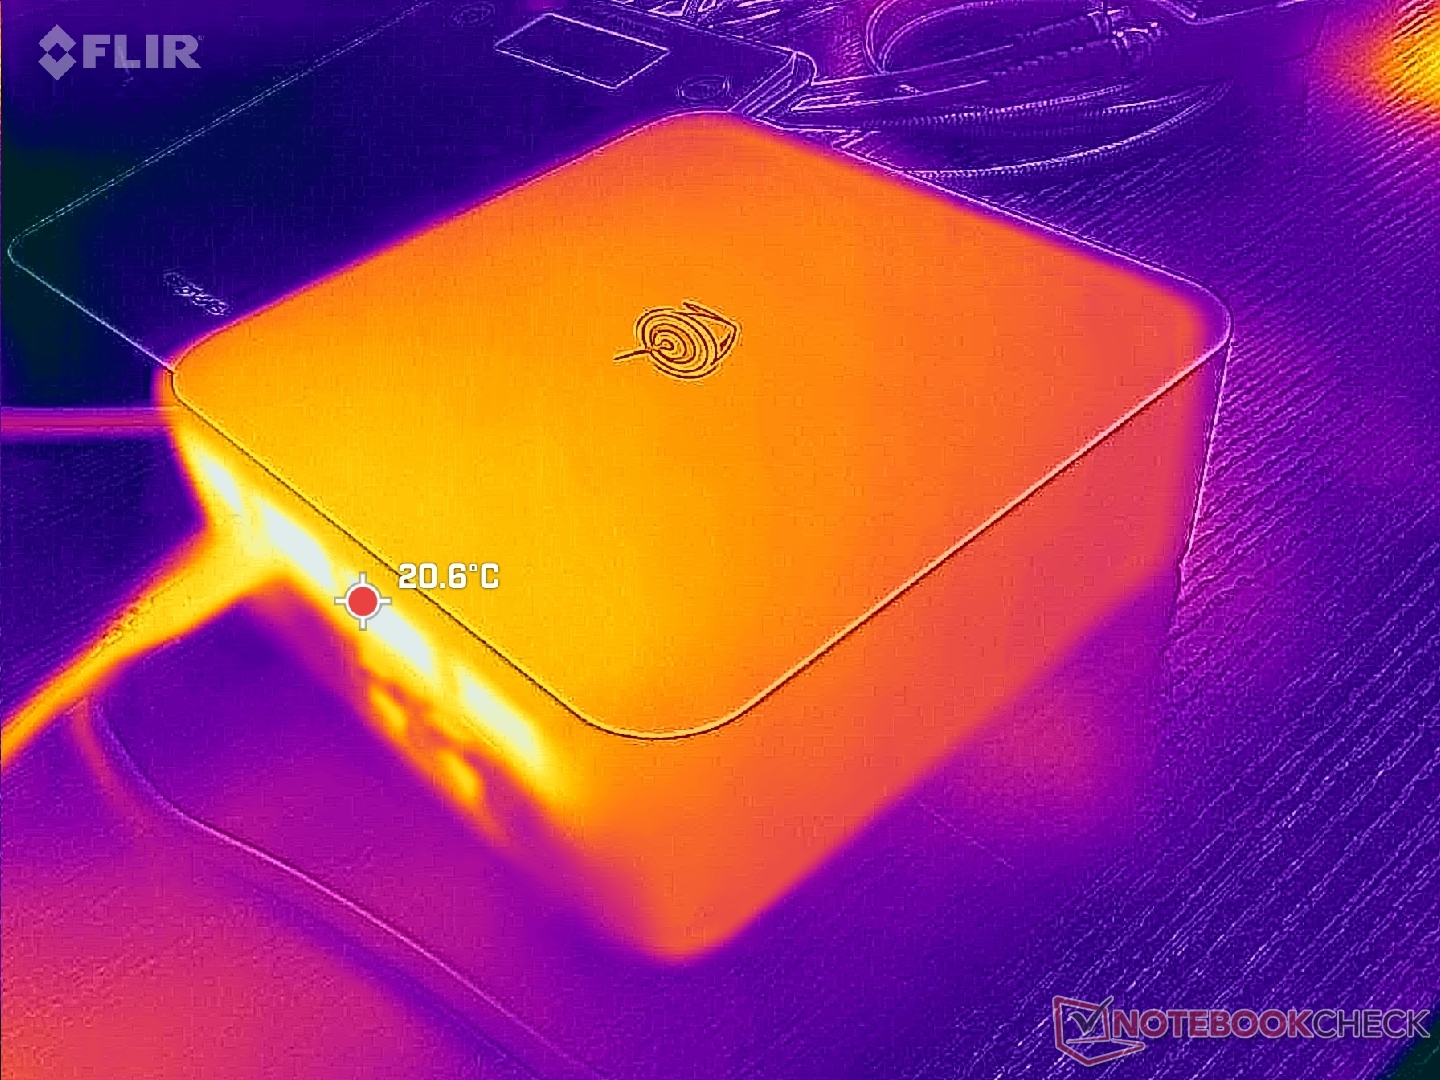
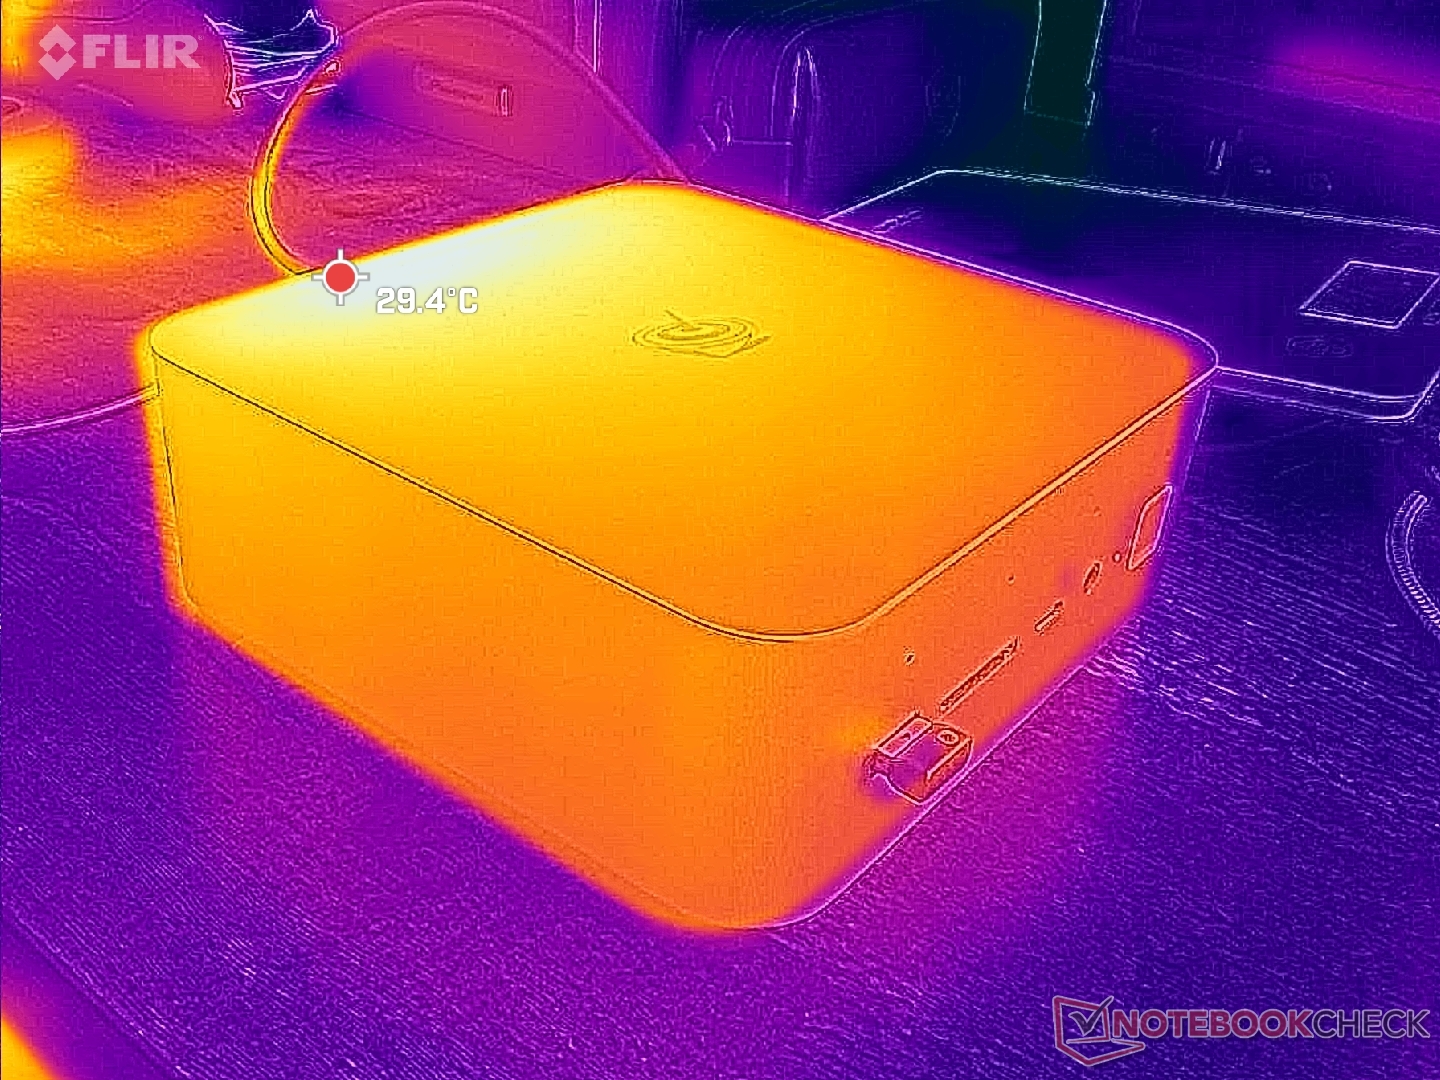
Temperatur
Lautsprecher
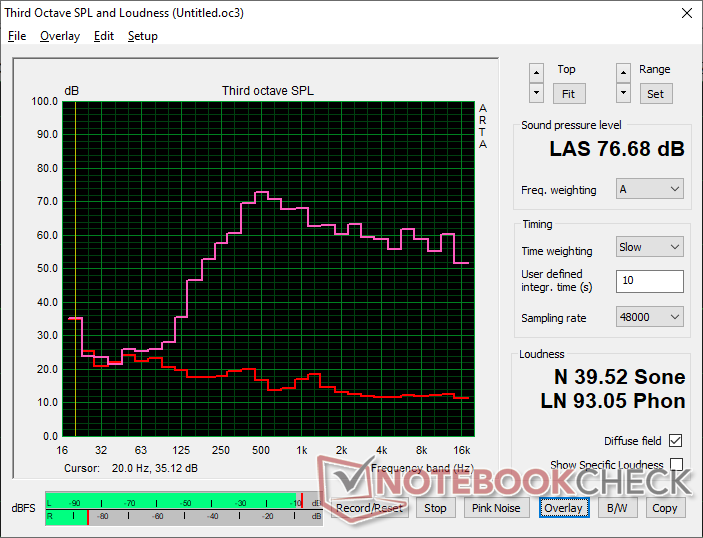
Beelink GTI13 Ultra Audio Analyse
(±) | Mittelmäßig laut spielende Lautsprecher (76.7 dB)
Bass 100 - 315 Hz
(±) | abgesenkter Bass - 13.4% geringer als der Median
(±) | durchschnittlich lineare Bass-Wiedergabe (12.6% Delta zum Vorgänger)
Mitteltöne 400 - 2000 Hz
(±) | zu hohe Mitten, vom Median 6.7% abweichend
(±) | Linearität der Mitten ist durchschnittlich (7.2% Delta zum Vorgänger)
Hochtöne 2 - 16 kHz
(+) | ausgeglichene Hochtöne, vom Median nur 2.5% abweichend
(±) | durchschnittlich lineare Hochtöne (7.1% Delta zum Vorgänger)
Gesamt im hörbaren Bereich 100 - 16.000 Hz
(±) | hörbarer Bereich ist durchschnittlich linear (17.2% Abstand zum Median)
Im Vergleich zu allen Geräten derselben Klasse
» 14% aller getesteten Geräte dieser Klasse waren besser, 7% vergleichbar, 79% schlechter
» Das beste Gerät hat einen Delta-Wert von 13%, durchschnittlich ist 24%, das schlechteste Gerät hat 64%
Im Vergleich zu allen Geräten im Test
» 32% aller getesteten Geräte waren besser, 8% vergleichbar, 60% schlechter
» Das beste Gerät hat einen Delta-Wert von 4%, durchschnittlich ist 23%, das schlechteste Gerät hat 134%
Apple MacBook Pro 16 2021 M1 Pro Audio Analyse
(+) | Die Lautsprecher können relativ laut spielen (84.7 dB)
Bass 100 - 315 Hz
(+) | guter Bass - nur 3.8% Abweichung vom Median
(+) | lineare Bass-Wiedergabe (5.2% Delta zum Vorgänger)
Mitteltöne 400 - 2000 Hz
(+) | ausgeglichene Mitten, vom Median nur 1.3% abweichend
(+) | lineare Mitten (2.1% Delta zum Vorgänger)
Hochtöne 2 - 16 kHz
(+) | ausgeglichene Hochtöne, vom Median nur 1.9% abweichend
(+) | sehr lineare Hochtöne (2.7% Delta zum Vorgänger)
Gesamt im hörbaren Bereich 100 - 16.000 Hz
(+) | hörbarer Bereich ist sehr linear (4.6% Abstand zum Median
Im Vergleich zu allen Geräten derselben Klasse
» 0% aller getesteten Geräte dieser Klasse waren besser, 0% vergleichbar, 100% schlechter
» Das beste Gerät hat einen Delta-Wert von 5%, durchschnittlich ist 17%, das schlechteste Gerät hat 45%
Im Vergleich zu allen Geräten im Test
» 0% aller getesteten Geräte waren besser, 0% vergleichbar, 100% schlechter
» Das beste Gerät hat einen Delta-Wert von 4%, durchschnittlich ist 23%, das schlechteste Gerät hat 134%
Energieverwaltung
Stromverbrauch
Unser Intel System ist in der Regel anspruchsvoller als konkurrierende AMD Alternativen, obwohl unser Prozessor und die Grafikleistung bei geringerer Leistung pro Watt langsamer sind. Zu beachten ist, dass der GTI13 Ultra im Gegensatz zu den meisten Mini-PCs kein externes Netzteil benötigt.
| Aus / Standby | |
| Idle | |
| Last |
|
Legende:
min: | |
| Beelink GTI13 Ultra i9-13900HK, Iris Xe G7 96EUs, Crucial P5 Plus 1TB CT1000P5PSSD8, , x, | Beelink SER9 Ryzen AI 9 HX 370, Radeon 890M, Crucial P3 Plus CT1000P3PSSD8, , x, | Beelink GTR7 7840HS R7 7840HS, Radeon 780M, Crucial P3 Plus CT1000P3PSSD8, , x, | GMK EVO-X1 Ryzen AI 9 HX 370, Radeon 890M, Crucial P3 Plus CT1000P3PSSD8, , x, | Minisforum EliteMini AI370 Ryzen AI 9 HX 370, Radeon 890M, Crucial P3 Plus CT1000P3PSSD8, , x, | GMK NucBox K9 Ultra 5 125H, Arc 7-Core, MasonSemi 1TB MC7000, , x, | |
|---|---|---|---|---|---|---|
| Stromverbrauch | 40% | 37% | 42% | 43% | 33% | |
| Idle min * (Watt) | 15.7 | 5.7 64% | 5.5 65% | 5.4 66% | 3.4 78% | 10.9 31% |
| Idle avg * (Watt) | 16.5 | 5.9 64% | 5.8 65% | 5.8 65% | 4.9 70% | 11 33% |
| Idle max * (Watt) | 16.5 | 6 64% | 7.7 53% | 5.8 65% | 7.4 55% | 11.4 31% |
| Last avg * (Watt) | 77.3 | 68.7 11% | 70.6 9% | 72.1 7% | 70.7 9% | 52.8 32% |
| Cyberpunk 2077 ultra external monitor * (Watt) | 91.9 | 78.2 15% | 72.5 21% | 69.6 24% | 57.1 38% | |
| Last max * (Watt) | 106 | 82 23% | 111.8 -5% | 76.1 28% | 82.6 22% | 72.2 32% |
| Witcher 3 ultra * (Watt) | 79.8 |
* ... kleinere Werte sind besser
Power Consumption Cyberpunk / Stress Test
Power Consumption external Monitor
Notebookcheck Bewertung
Beelink GTI13 Ultra
- 26.02.2025 v8
Allen Ngo
 Total Sustainability Score:
 Transparenz
Die Auswahl der zu testenden Geräte erfolgt innerhalb der Redaktion. Das vorliegende Testmuster wurde dem Autor vom Hersteller oder einem Shop zu Testzwecken leihweise zur Verfügung gestellt. Eine Einflussnahme des Leihstellers auf den Testbericht gab es nicht, der Hersteller erhielt keine Version des Reviews vor der Veröffentlichung. Es bestand keine Verpflichtung zur Publikation. Als eigenständiges, unabhängiges Unternehmen unterliegt Notebookcheck keiner Diktion von Herstellern, Shops und Verlagen.
So testet Notebookcheck
Pro Jahr werden von Notebookcheck hunderte Laptops und Smartphones unabhängig in von uns standardisierten technischen Verfahren getestet, um eine Vergleichbarkeit aller Testergebnisse zu gewährleisten. Seit rund 20 Jahren entwickeln wir diese Testmethoden kontinuierlich weiter und setzen damit Branchenstandards. In unseren Testlaboren kommt ausschließlich hochwertiges Messequipment in die Hände erfahrener Techniker und Redakteure. Die Tests unterliegen einer mehrstufigen Kontrolle. Unsere komplexe Gesamtbewertung basiert auf hunderten fundierten Messergebnissen und Benchmarks, womit Ihnen Objektivität garantiert ist. Weitere Informationen zu unseren Testmethoden gibt es hier.

