Notebookcheck Logo

Apple S5 vs Mediatek MT8766B vs Rockchip RK3066 1.5 GHz

Apple S5

► remove from comparison Apple S5

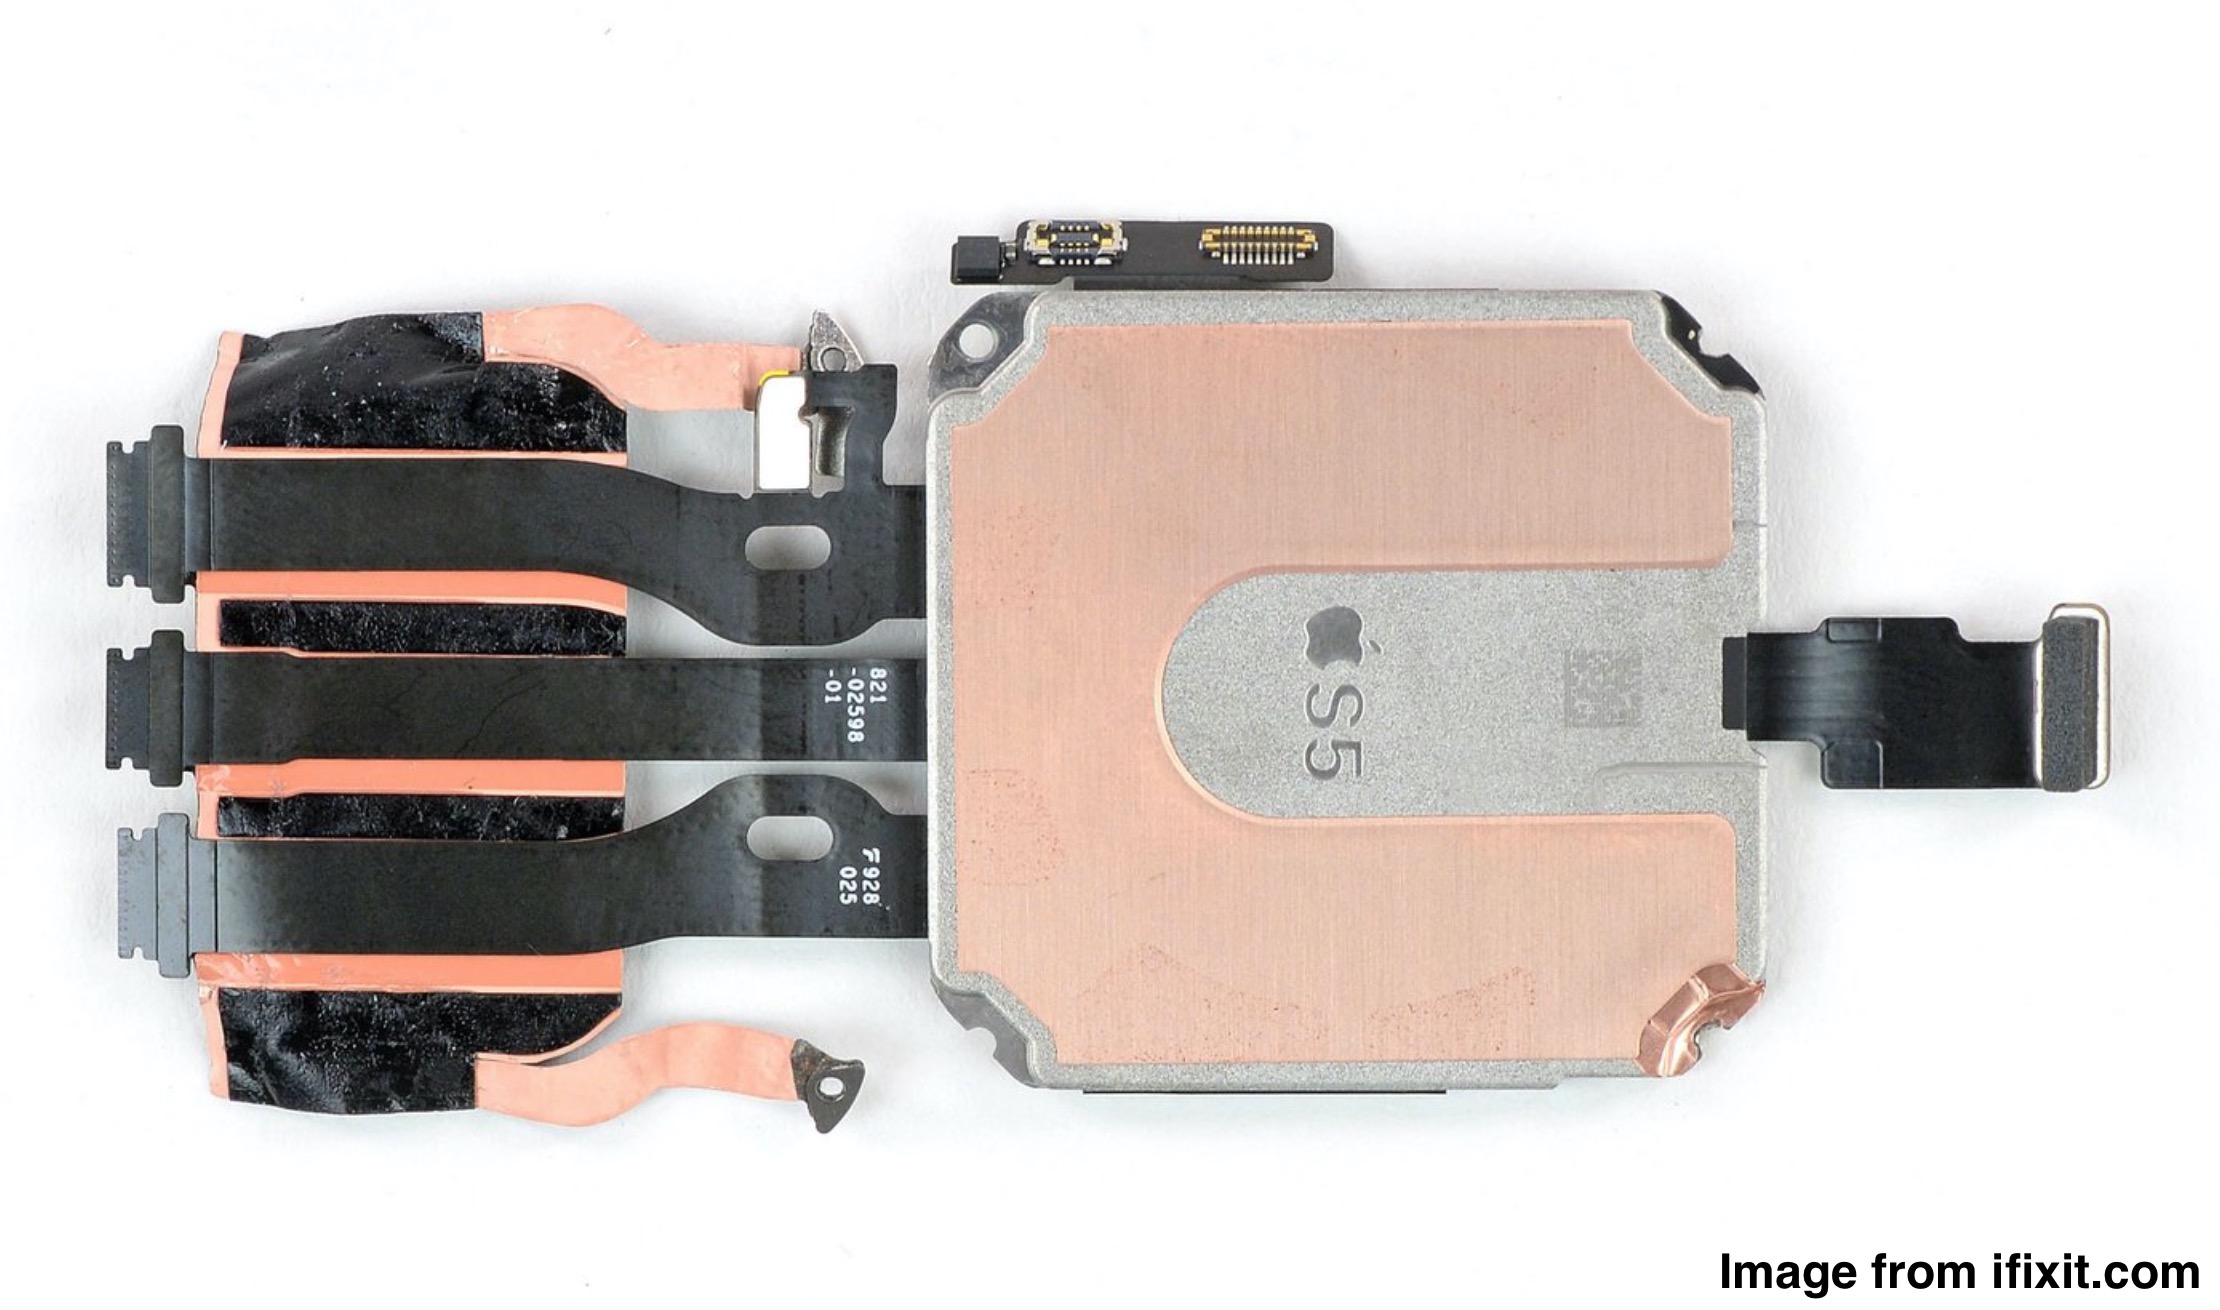
Der Apple S5 ist ein 64-Bit-Prozessor mit zwei Kernen der in der Apple Watch Series 5 (40 und 44 mm) eingesetzt wird. Er integriert 32 GB Speicher, Bluetooth 5.0, 1 GB RAM, 802.11 b/g/n 2.4 GHz WLAN und Satelliten Positionierung (GPS, GLONASS, Galileo, QZSS).

Mediatek MT8766B

► remove from comparison  Helio MT8766B

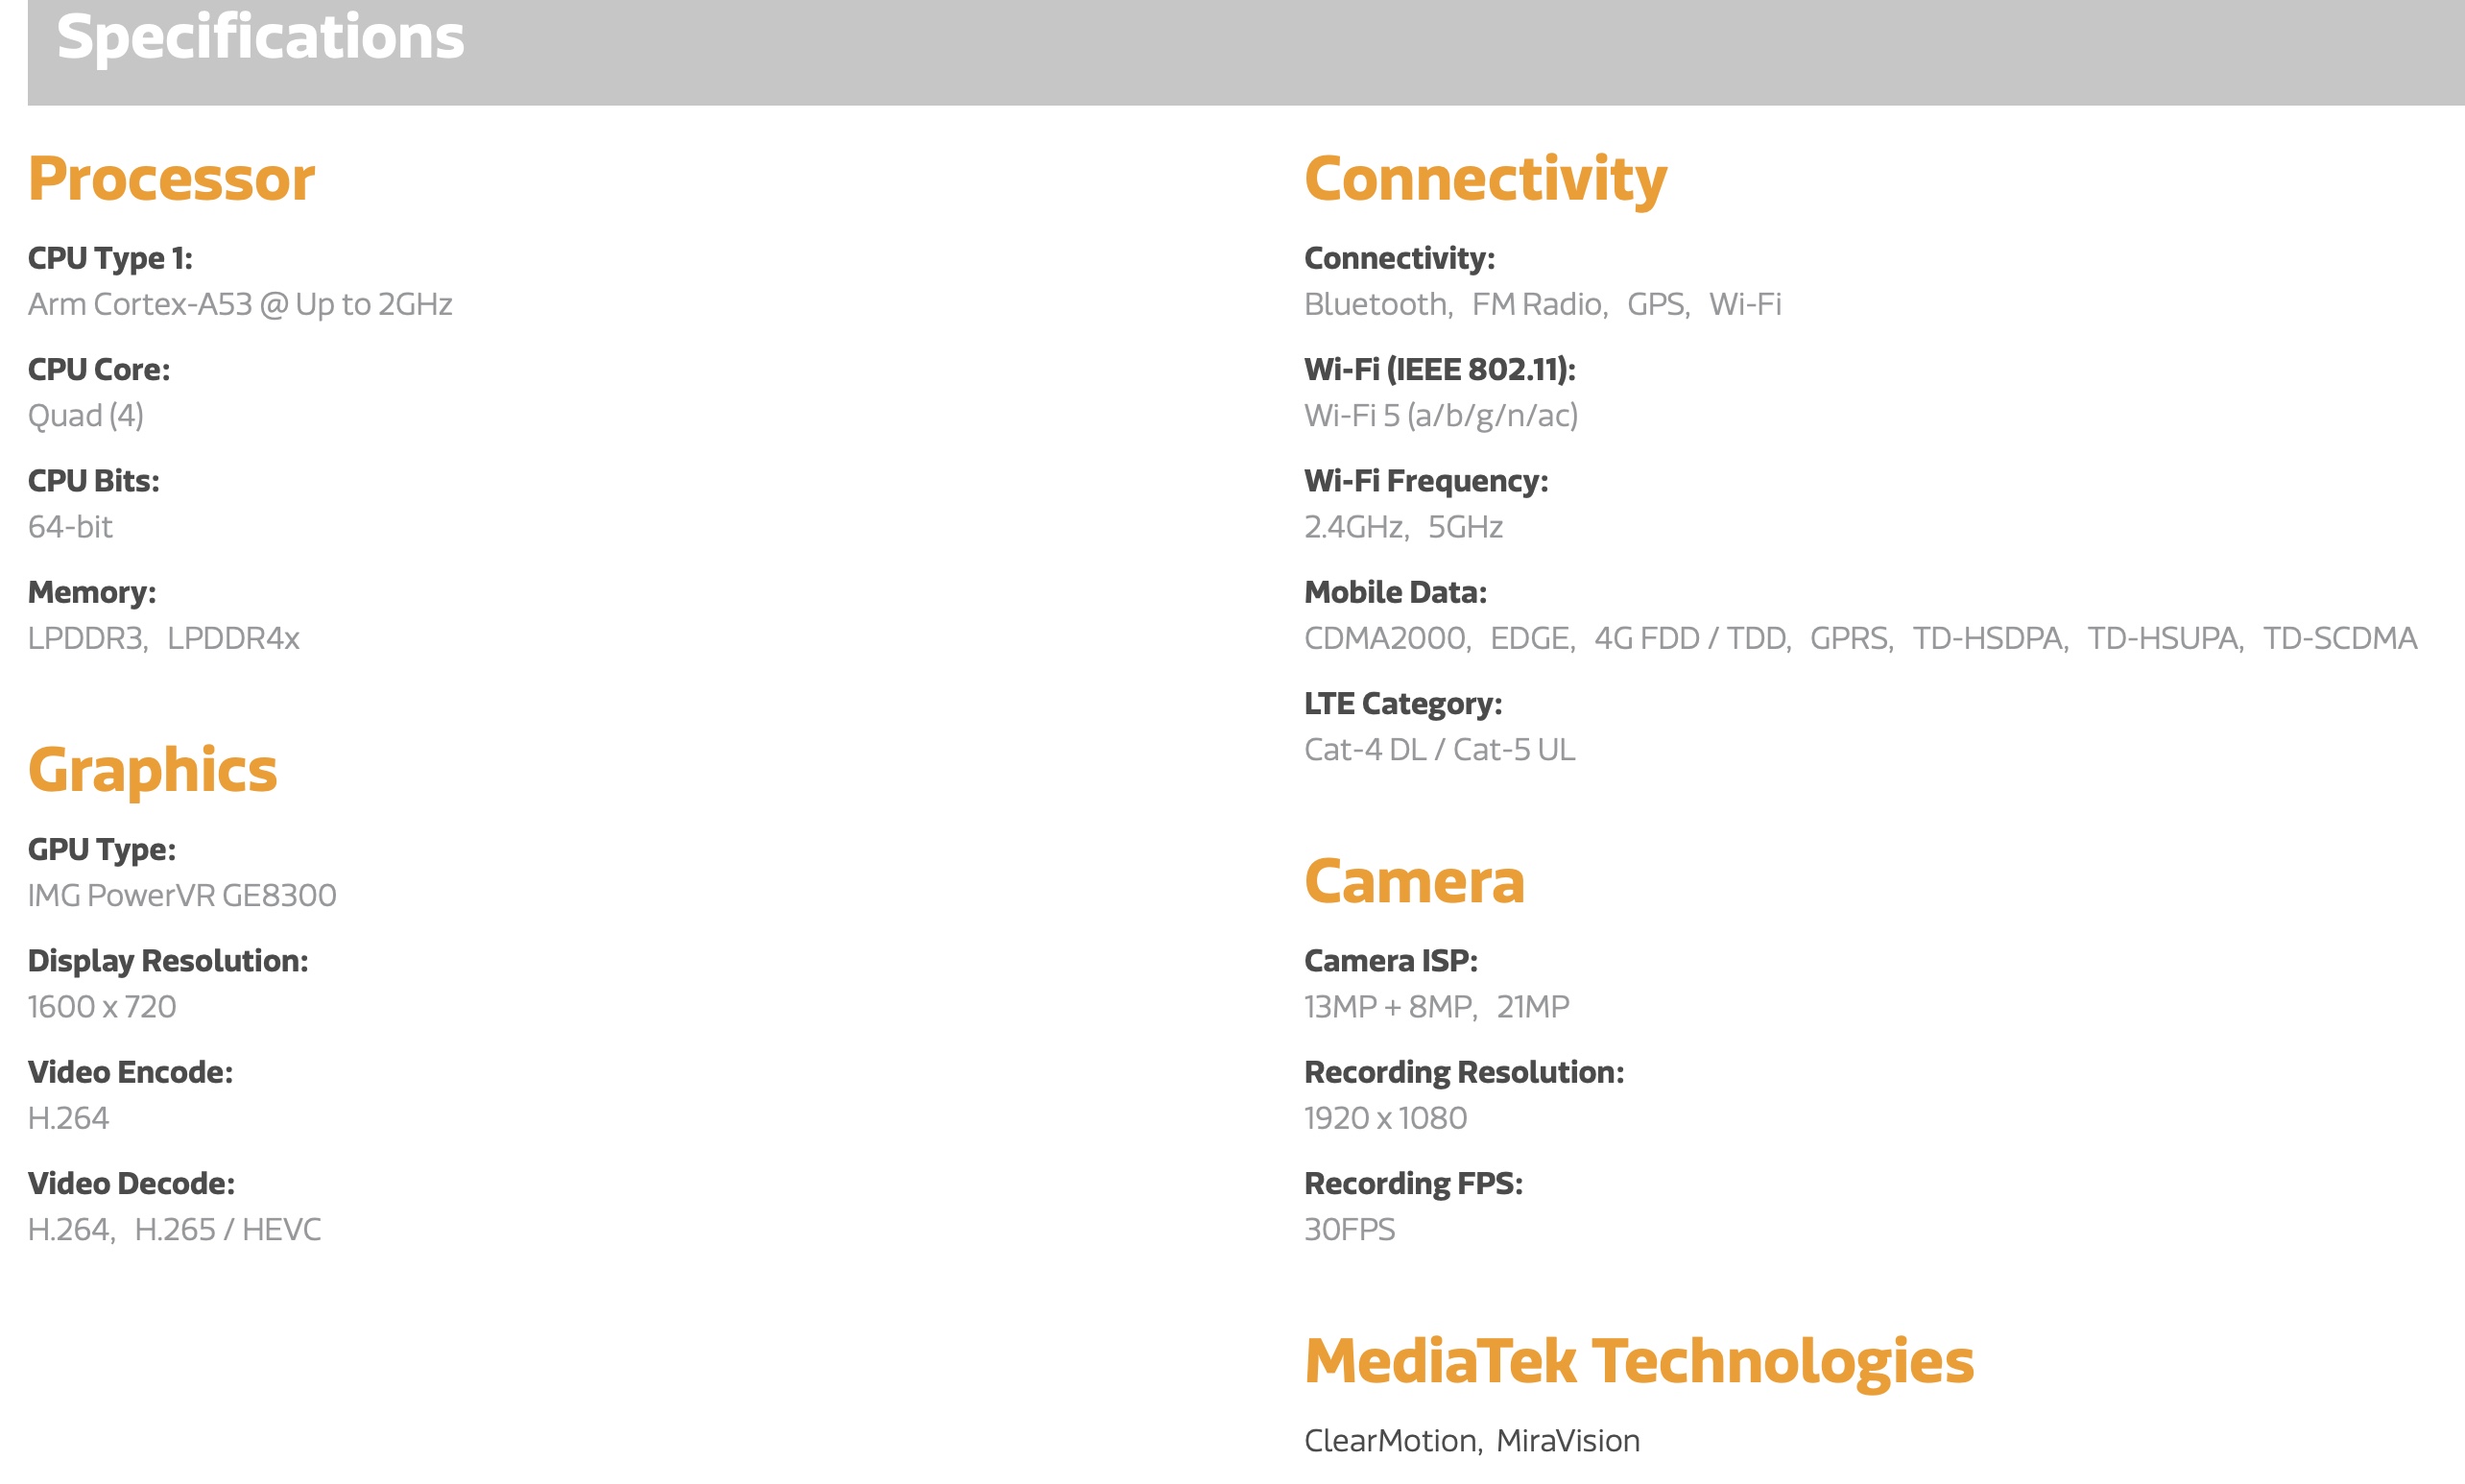
Der MediaTek MT8766B Helio A20 ist eine ARM-SoC für günstige Android-Smartphones und -tablets der Einsteiger-Klasse. Das SoC besitzt 4 Cortex-A53-Kerne mit bis zu 2 GHz Takt und ähnelt daher dem Helios A20 (1.8 GHz).

Als Grafikchip kommt ein PowerVR GE8300 zum Einsatz (max. 1600x720 Pixel), der Speichercontroller unterstützt LPDDR3/LPDDR4X.

Das integrierte LTE-Modem unterstützt 4G mit bis zu 150 Mbps Download (Cat-4) und 75 Mbps Upload (Cat-5). Bluetooth 5.0 (?) und die WLAN-Standards bis Wi-Fi 5 werden unterstützt.

Das SoC wird wahrscheinlich wie der A20 im 12nm-FinFET-Herstellungsverfahrens produziert.

Rockchip RK3066 1.5 GHz

► remove from comparison  RK3066

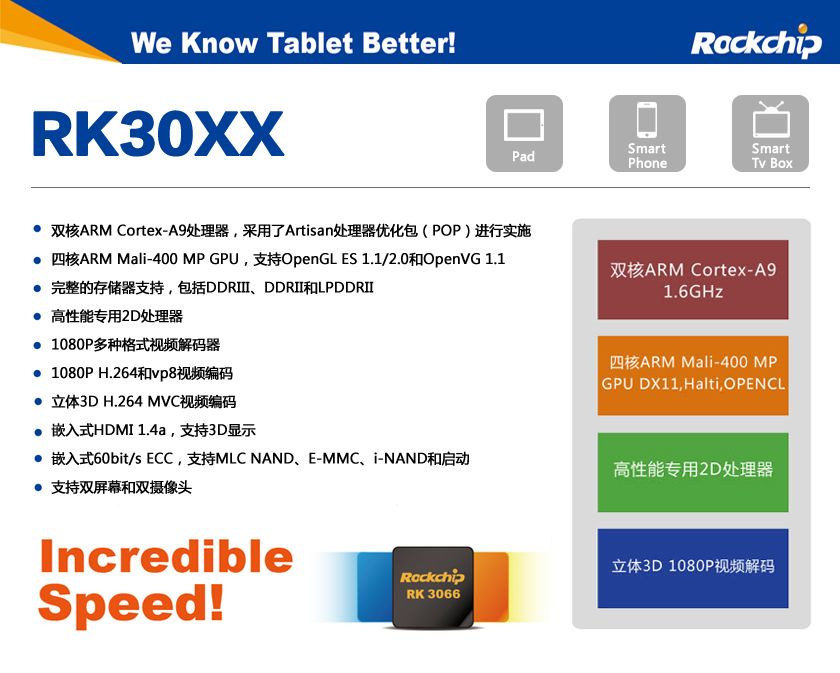
Der Rockchip RK3066 ist ein günstiger SoC für Tablets und Smartphones. Er bietet zwei ARM Cortex-A9 CPU Kerne mit NEON Erweiterungen, eine ARM Mali 400MP4 (Quad-Core mit 250 MHz getaktet) Grafikkarte und einen Video De- und Encoder. Der integrierte Speicherkontroller unterstützt maximal 2 GB DDR1-3.

Weitere Features lt Wikipedia

  • VPU (Video Processing Unit) Multi-Media Processor supporting 1080p image and video decoding
  • HDMI 1.4 Interface
  • 2-channels TFT LCD Interface with 5 layers and 3D Display (1920×1080 Maximum Display Size)
  • USB 2.0 Interface
  • SD/MMC Interface

ModelApple S5Mediatek MT8766BRockchip RK3066 1.5 GHz
SeriesApple Mediatek MT8
Serie:
newitem cores
HiSilicon Kirin 9000W1.53 - 2.49 GHz12 / 12 cores
UNISOC Tiger T3101.8 - 2 GHz4 / 4 cores
Rockchip RK32881.8 GHz4 / 4 cores
Apple A6x1.4 GHzcores
Apple A61 GHzcores
Apple S5 « 2 / 2 cores
HiSilicon k3v2 Hi36201.2 GHz4 / 4 cores
Rockchip RK3066 1.5 GHz1.5 GHz2 / 2 cores
Amlogic AML8726-MX1.5 GHz2 / 2 cores
Rockchip RK31681.2 GHz2 / 2 cores
Rockchip RK2918 1.2 GHz1.2 GHz1 / 1 cores
ARM Cortex A8 1.2 GHz1.2 GHz1 / 1 cores
Telechips TCC8803 1GHz1 GHz1 / 1 cores
Loongson 2F 900MHz0.9 GHz1 / 1 cores
CSR86700.08 GHzcores
ARM Cortex-M4 cores
HiSilicon Hi6262 cores
DK3.5+STcores
unknown cores
Mediatek MT87681.5 - 2 GHz8 / 8 cores Cortex-A53
MediaTek MT81682 GHz4 / 4 cores Cortex-A53
Mediatek MT8766B « 2 GHz4 / 4 cores Cortex-A53
newitem cores
HiSilicon Kirin 9000W1.53 - 2.49 GHz12 / 12 cores
UNISOC Tiger T3101.8 - 2 GHz4 / 4 cores
Rockchip RK32881.8 GHz4 / 4 cores
Apple A6x1.4 GHzcores
Apple A61 GHzcores
Apple S52 / 2 cores
HiSilicon k3v2 Hi36201.2 GHz4 / 4 cores
Rockchip RK3066 1.5 GHz « 1.5 GHz2 / 2 cores
Amlogic AML8726-MX1.5 GHz2 / 2 cores
Rockchip RK31681.2 GHz2 / 2 cores
Rockchip RK2918 1.2 GHz1.2 GHz1 / 1 cores
ARM Cortex A8 1.2 GHz1.2 GHz1 / 1 cores
Telechips TCC8803 1GHz1 GHz1 / 1 cores
Loongson 2F 900MHz0.9 GHz1 / 1 cores
CSR86700.08 GHzcores
ARM Cortex-M4 cores
HiSilicon Hi6262 cores
DK3.5+STcores
unknown cores
Cores / Threads2 / 24 / 42 / 2
Announced
CodenameCortex-A53
Clock2000 MHz1500 MHz
Technology12 nm40 nm
FeaturesPowerVR GE8300, Dual-Channel LPDDR3 / LPDDR4X, Wi-Fi 5, Bluetooth, LTE Cat-4 DL / Cat-5 UL, H.264 Encode, H.265 DecodeMali-400 MP4, Single Channel DDR3 Memory Controller
iGPUPowerVR GE8300ARM Mali-400 MP4 (250 MHz)
ArchitectureARMARM
Manufacturerwww.mediatek.comwww.rock-chips.com
L2 Cache512 KB

Benchmarks

Performance Rating - Geekbench 5.5, PCM Work, Sling Shot Physics, Antutu v8 CPU - Helio MT8766B
0.2 pt (13%)
3DMark - 3DMark Ice Storm Physics
100%
1 RK3066 +
min: 4687     avg: 4990     median: 5059 (4%)     max: 5161 Points
3DMark - 3DMark Ice Storm Extreme Physics
100%
1 RK3066 +
4890 Points (4%)
3DMark - 3DMark Ice Storm Unlimited Physics
13779 Points (12%)
3DMark - 3DMark Sling Shot Extreme (ES 3.1) Unlimited Physics
853 Points (10%)
3DMark - 3DMark Sling Shot (ES 3.0) Unlimited Physics
860 Points (10%)
Geekbench 5.5 - Geekbench 5.1 - 5.4 64 Bit Single-Core
133 Points (6%)
Geekbench 5.5 - Geekbench 5.1 - 5.4 64 Bit Multi-Core
455 Points (1%)
Geekbench 4.4 - Geekbench 4.1 - 4.4 64 Bit Single-Core
783 Points (8%)
Geekbench 4.4 - Geekbench 4.1 - 4.4 64 Bit Multi-Core
2217 Points (2%)
Geekbench 4.0 - Geekbench 4.0 64 Bit Single-Core
741 Points (10%)
Geekbench 4.0 - Geekbench 4.0 64 Bit Multi-Core
2043 Points (5%)
Geekbench 3 - Geekbench 3 64 Bit Multi-Core
2112 Points (3%)
Geekbench 3 - Geekbench 3 64 Bit Single-Core
722 Points (11%)
Geekbench 2 - 32 Bit - Geekbench Stream
725 Points (6%)
Geekbench 2 - 32 Bit - Geekbench Memory
1727 Points (16%)
Geekbench 2 - 32 Bit - Geekbench Floating Point
3305 Points (6%)
Geekbench 2 - 32 Bit - Geekbench Integer
1865 Points (4%)
Geekbench 2 - 32 Bit - Geekbench Total Score
2227 Points (6%)
Mozilla Kraken 1.1 - Kraken 1.1 Total Score *
11505 ms (13%)
Sunspider - Sunspider 1.0 Total Score *
100%
S5 +
min: 2014     avg: 2022     median: 2022 (22%)     max: 2030 ms
1609 ms (18%)
1959 ms (21%)
Octane V2 - Octane V2 Total Score
3920 Points (4%)
WebXPRT 3 - WebXPRT 3 Score
27 Points (6%)
Quadrant Standard Edition 2.0 - Quadrant Standard 2.0 Total Score
100%
1 RK3066 +
min: 3105     avg: 3862     median: 3974 (9%)     max: 4257 points
AnTuTu v8 - AnTuTu v8 UX
15424 Points (13%)
AnTuTu v8 - AnTuTu v8 MEM
24878 Points (20%)
AnTuTu v8 - AnTuTu v8 GPU
4722 Points (1%)
AnTuTu v8 - AnTuTu v8 CPU
30304 Points (11%)
AnTuTu v8 - AnTuTu v8 Total Score
75328 Points (7%)
PassMark PerformanceTest Mobile V1 - PerformanceTest Mobile V1 CPU Tests
100%
1 RK3066 +
5852 Points (1%)
PCMark for Android - PCM f. Android Computer Vision
2761 Points (15%)
PCMark for Android - PCM f. Android Storage
6844 Points (15%)
PCMark for Android - PCM f. Android Work Score 2.0
4808 Points (31%)
PCMark for Android - PCM f. Android Work Score
6431 Points (32%)

Average Benchmarks Apple S5 → 100% n=1

Average Benchmarks Mediatek MT8766B → 106% n=1

Average Benchmarks Rockchip RK3066 1.5 GHz → 101% n=1

- Bereich der Benchmarkergebnisse für diese Grafikkarte
- Durchschnittliche Benchmarkergebnisse für diese Grafikkarte
* Smaller numbers mean a higher performance
1 This benchmark is not used for the average calculation

v1.26
log 02. 09:17:53

#0 checking url part for id 11530 +0s ... 0s

#1 checking url part for id 13125 +0s ... 0s

#2 checking url part for id 3576 +0s ... 0s

#3 not redirecting to Ajax server +0s ... 0s

#4 did not recreate cache, as it is less than 5 days old! Created at Sat, 01 Jun 2024 05:37:57 +0200 +0.001s ... 0.001s

#5 composed specs +0.108s ... 0.109s

#6 did output specs +0s ... 0.11s

#7 getting avg benchmarks for device 11530 +0.003s ... 0.113s

#8 got single benchmarks 11530 +0.008s ... 0.12s

#9 getting avg benchmarks for device 13125 +0.013s ... 0.134s

#10 got single benchmarks 13125 +0.012s ... 0.145s

#11 getting avg benchmarks for device 3576 +0.003s ... 0.148s

#12 got single benchmarks 3576 +0.025s ... 0.173s

#13 got avg benchmarks for devices +0s ... 0.173s

#14 min, max, avg, median took s +0.136s ... 0.309s

#15 return log +0s ... 0.309s

Teilen Sie diesen Artikel, um uns zu unterstützen. Jeder Link hilft!
> Notebook Test, Laptop Test und News > Benchmarks / Technik > Benchmarks / Technik > Prozessor Vergleich - Head 2 Head
Autor: Klaus Hinum,  8.09.2017 (Update:  1.07.2023)