Notebookcheck Logo

MediaTek MT8163 V/B 1.3 GHz vs Broadcom BCM21664T vs Marvell PXA986

MediaTek MT8163 V/B 1.3 GHz

► remove from comparison

Der MediaTek MT8163 V/B ist ein ARM basierender SoC für (Android) Tablets. Er bietet vier ARM Cortex-A53 Prozessorkerne mit bis zu 1.3 GHz, eine ARM Mali-T720 MP2 Grafikkarte mit 520 MHz (Benchmarks) und einen DDR3x32 1600Mbps Speicherkontroller. An drahtlosen Schnittstellen bietet der SoC Bluetooth 4.0, Dual Band 802.11 b/g/n WLAN, FM und GPS.

Im Vergleich zum schnelleren MediaTek MT8163 V/A taktet die CPU niedriger (1,3 versus 1,5 GHz) und auch die GPU (520 versus 600 MHz).

Die vier 64 Bit Cortex-A53 Kerne positionieren den SoC im Einstiegs-Mittelklasse Bereich in 2015.

Broadcom BCM21664T

► remove from comparison Broadcom BCM21664T

Der Broadcom BCM21664T ist ein ARM basierter Einstiegs-SoC für Smartphones. Er integriert zwei Cortex-A9 CPU Kerne mit bis zu 1.2 GHz, ein HSPA+ Modem mit Unterstützung für 21 Mbps HSDPA und 5,8 Mbps HSUPA, einen H.264 1080p Videodecoder und einen 720p Encoder. Weiters ist eine VideoCore-IV Grafikkarte verbaut und Dual-SIM wird unterstützt.

Marvell PXA986

► remove from comparison Marvell Technology Group PXA986

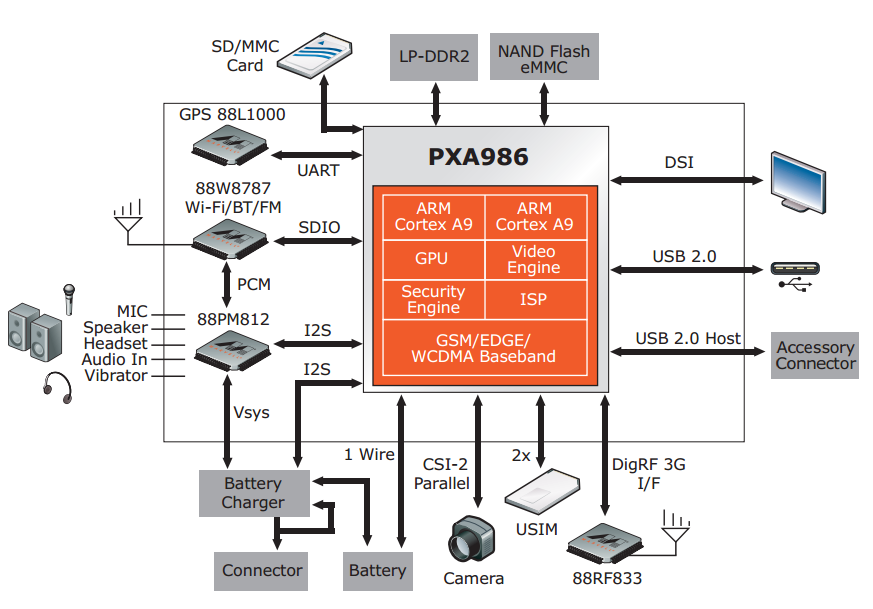
Der Marvell PXA986 ist ein ARM basierter Dual-Core SoC für Smartphones und Tablets. Er bietet zwei Cortex-A9 Kerne mit meist 1.2 GHz Takt, eine Vivante GC1000 Grafikkarte, einen Video-Prozessor für 720p30 Wiedergabe von H.263, H.264 BP und MPEG4- SP und ein WCDMA+HSDPA Modem.

ModelMediaTek MT8163 V/B 1.3 GHzBroadcom BCM21664TMarvell PXA986
SeriesMediatek Broadcom Marvell Technology Group
CodenameCortex-A53Cortex-A9Cortex-A9
Serie: Cortex-A9
JLQ JR5101.5 - 2 GHz8 / 8 cores Cortex-A53
HiSilicon Kirin 9352.2 GHz8 / 8 cores Cortex-A53
HiSilicon Kirin 6592.36 GHz8 / 8 cores Cortex-A53
HiSilicon Kirin 6582.35 GHz8 / 8 cores Cortex-A53
HiSilicon Kirin 6552.1 GHz8 / 8 cores Cortex-A53
HiSilicon Kirin 6502 GHz8 / 8 cores Cortex-A53
HiSilicon Kirin 9302 GHz8 / 8 cores Cortex-A53
HiSilicon Kirin 6201.2 GHz8 / 8 cores Cortex-A53
MediaTek MT8163 V/A 1.5 GHz1.5 GHz4 / 4 cores Cortex-A53
MediaTek MT8163 V/B 1.3 GHz « 1.3 GHz4 / 4 cores Cortex-A53
MediaTek MT81611.3 GHz4 / 4 cores Cortex-A53
Marvell Armada PXA19081.2 GHz4 / 4 cores Cortex-A53
HiSilicon Kirin 910T1.8 GHz4 / 4 cores Cortex-A9
Rockchip RK31881.8 GHz4 / 4 cores Cortex-A9
HiSilicon Kirin 9101.6 GHz4 / 4 cores Cortex-A9
Renesas MP52321.5 GHz2 / 2 cores Cortex-A9
Broadcom BCM21664T « 1.2 GHz2 / 2 cores Cortex-A9
Marvell PXA9861.2 GHz2 / 2 cores Cortex-A9
NXP i.MX 6SLL1 GHz1 / 1 cores Cortex-A9
WonderMedia PRIZM WM89501 GHz1 / 1 cores Cortex-A9
HiSilicon Kirin 910T1.8 GHz4 / 4 cores Cortex-A9
Rockchip RK31881.8 GHz4 / 4 cores Cortex-A9
HiSilicon Kirin 9101.6 GHz4 / 4 cores Cortex-A9
Renesas MP52321.5 GHz2 / 2 cores Cortex-A9
Broadcom BCM21664T1.2 GHz2 / 2 cores Cortex-A9
Marvell PXA986 « 1.2 GHz2 / 2 cores Cortex-A9
NXP i.MX 6SLL1 GHz1 / 1 cores Cortex-A9
WonderMedia PRIZM WM89501 GHz1 / 1 cores Cortex-A9
Clock1300 MHz1200 MHz1200 MHz
Cores / Threads4 / 42 / 22 / 2
Technology28 nm45 nm
FeaturesDDR3x32 memory controller 1600Mbps, T720 MP2@520MHz, internal Display up to 1366x768, HMID up to 1080p, H.265 1080p video decode, 13MP image signal processor, WiFi 802.11 a/b/g/n, embedded GPS module, Bluetooth 4.0, FM radio support, ARM TrustZoneHSPA+ modem, H.264 1080p decoder, 720p encoder
iGPUARM Mali-T720 MP2 (520 MHz)
ArchitectureARMARMARM
Announced
Manufacturerwww.marvell.com

Benchmarks

3DMark - 3DMark Ice Storm Physics
3801 Points (3%)
72%
1 PXA986 +
min: 2623     avg: 2874     median: 2740 (2%)     max: 3258 Points
3DMark - 3DMark Ice Storm Extreme Physics
3846 Points (3%)
78%
1 PXA986 +
min: 2709     avg: 2985     median: 2985 (2%)     max: 3261 Points
36%
1 PXA986 +
3675 Points (3%)
Geekbench 4.4 - Geekbench 4.1 - 4.4 64 Bit Single-Core
min: 628     avg: 639     median: 640 (6%)     max: 648 Points
Geekbench 4.4 - Geekbench 4.1 - 4.4 64 Bit Multi-Core
min: 1683     avg: 1754     median: 1767 (2%)     max: 1797 Points
Geekbench 4.0 - Geekbench 4.0 64 Bit Single-Core
601 Points (8%)
Geekbench 4.0 - Geekbench 4.0 64 Bit Multi-Core
1583 Points (4%)
Geekbench 3 - Geekbench 3 64 Bit Multi-Core
min: 1888     avg: 1930     median: 1930 (3%)     max: 1972 Points
Geekbench 3 - Geekbench 3 64 Bit Single-Core
min: 617     avg: 638     median: 638 (10%)     max: 659 Points
Geekbench 3 - Geekbench 3 32 Bit Multi-Core
658 Points (1%)
98%
1 PXA986 +
min: 631     avg: 647     median: 646.5 (1%)     max: 662 Points
Geekbench 3 - Geekbench 3 32 Bit Single-Core
353 Points (7%)
108%
1 PXA986 +
min: 376     avg: 379.5     median: 379.5 (7%)     max: 383 Points
Geekbench 2 - 32 Bit - Geekbench Stream
100%
1 PXA986 +
min: 437     avg: 439.5     median: 439.5 (4%)     max: 442 Points
Geekbench 2 - 32 Bit - Geekbench Memory
100%
1 PXA986 +
min: 1337     avg: 1448     median: 1448 (13%)     max: 1559 Points
Geekbench 2 - 32 Bit - Geekbench Floating Point
100%
1 PXA986 +
min: 1275     avg: 1284     median: 1284 (3%)     max: 1293 Points
Geekbench 2 - 32 Bit - Geekbench Integer
100%
1 PXA986 +
min: 709     avg: 720     median: 720 (1%)     max: 731 Points
Geekbench 2 - 32 Bit - Geekbench Total Score
100%
1 PXA986 +
min: 1005     avg: 1035     median: 1034.5 (3%)     max: 1064 Points
Linpack Android / IOS - Linpack Multi Thread
75.7 MFLOPS (3%)
98%
1 PXA986 +
min: 73.7     avg: 74.3     median: 74 (3%)     max: 75.3 MFLOPS
Linpack Android / IOS - Linpack Single Thread
15.8 MFLOPS (2%)
263%
1 PXA986 +
min: 39.83     avg: 41.6     median: 41.4 (4%)     max: 43.69 MFLOPS
Mozilla Kraken 1.1 - Kraken 1.1 Total Score *
min: 11818     avg: 13133     median: 13321.5 (16%)     max: 14321 ms
16763 ms (20%)
min: 23941     avg: 25315     median: 25315 (30%)     max: 26689 ms
Sunspider - Sunspider 1.0 Total Score *
1316 ms (14%)
96%
1 PXA986 +
min: 1428     avg: 1608     median: 1624 (18%)     max: 1771 ms
Sunspider - Sunspider 0.9.1 Total Score *
1348 ms (13%)
98%
1 PXA986 +
min: 1453     avg: 1531     median: 1530.5 (15%)     max: 1608 ms
Octane V2 - Octane V2 Total Score
min: 2821     avg: 2929     median: 2853.5 (3%)     max: 3320 Points
2121 Points (2%)
1448 Points (1%)
WebXPRT 3 - WebXPRT 3 Score
min: 23     avg: 23.7     median: 23 (5%)     max: 25 Points
Quadrant Standard Edition 2.0 - Quadrant Standard 2.0 Total Score
3490 points (8%)
101%
1 PXA986 +
min: 3257     avg: 3515     median: 3514.5 (8%)     max: 3772 points
AnTuTu v3 - AnTuTu v3 CPU
100%
1 PXA986 +
2945 Points (19%)
AnTuTu v4 - AnTuTu v4 Total Score
12059 Points (28%)
94%
1 PXA986 +
min: 11051     avg: 11392     median: 11392 (26%)     max: 11733 Points
AndEBench - AndEBench Java
180 Iter./s (6%)
88%
1 PXA986 +
min: 137     avg: 160     median: 159 (5%)     max: 184 Iter./s
AndEBench - AndEBench Native
4041 Iter./s (13%)
106%
1 PXA986 +
min: 4077     avg: 4208     median: 4266 (14%)     max: 4281 Iter./s
PassMark PerformanceTest Mobile V1 - PerformanceTest Mobile V1 CPU Tests
4230 Points (1%)
94%
1 PXA986 +
min: 3273     avg: 3820     median: 3976 (1%)     max: 4210 Points
PCMark for Android - PCM f. Android Work Score 2.0
min: 2907     avg: 3177     median: 3219.5 (21%)     max: 3361 Points

Average Benchmarks MediaTek MT8163 V/B 1.3 GHz → 100% n=2

Average Benchmarks Broadcom BCM21664T → 85% n=2

Average Benchmarks Marvell PXA986 → 67% n=2

- Bereich der Benchmarkergebnisse für diese Grafikkarte
- Durchschnittliche Benchmarkergebnisse für diese Grafikkarte
* Smaller numbers mean a higher performance
1 This benchmark is not used for the average calculation

v1.26
log 02. 15:54:52

#0 checking url part for id 8108 +0s ... 0s

#1 checking url part for id 5948 +0s ... 0s

#2 checking url part for id 4461 +0s ... 0s

#3 not redirecting to Ajax server +0s ... 0s

#4 did not recreate cache, as it is less than 5 days old! Created at Sat, 01 Jun 2024 05:37:57 +0200 +0.001s ... 0.001s

#5 composed specs +0.115s ... 0.116s

#6 did output specs +0s ... 0.116s

#7 getting avg benchmarks for device 8108 +0.003s ... 0.119s

#8 got single benchmarks 8108 +0.021s ... 0.14s

#9 getting avg benchmarks for device 5948 +0.002s ... 0.142s

#10 got single benchmarks 5948 +0.006s ... 0.148s

#11 getting avg benchmarks for device 4461 +0.002s ... 0.15s

#12 got single benchmarks 4461 +0.009s ... 0.158s

#13 got avg benchmarks for devices +0s ... 0.158s

#14 min, max, avg, median took s +0.132s ... 0.29s

#15 return log +0s ... 0.29s

Teilen Sie diesen Artikel, um uns zu unterstützen. Jeder Link hilft!
> Notebook Test, Laptop Test und News > Benchmarks / Technik > Benchmarks / Technik > Prozessor Vergleich - Head 2 Head
Autor: Klaus Hinum,  8.09.2017 (Update:  1.07.2023)