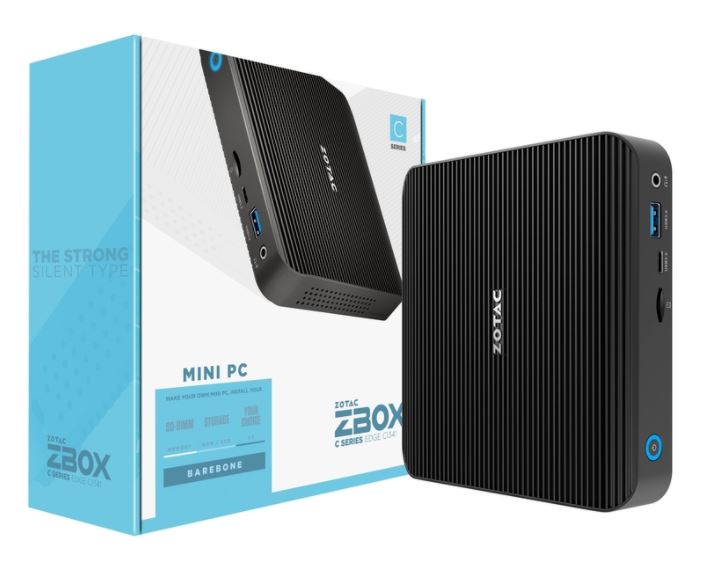
Preiswerter Mini-PC Zotac ZBOX edge im Test
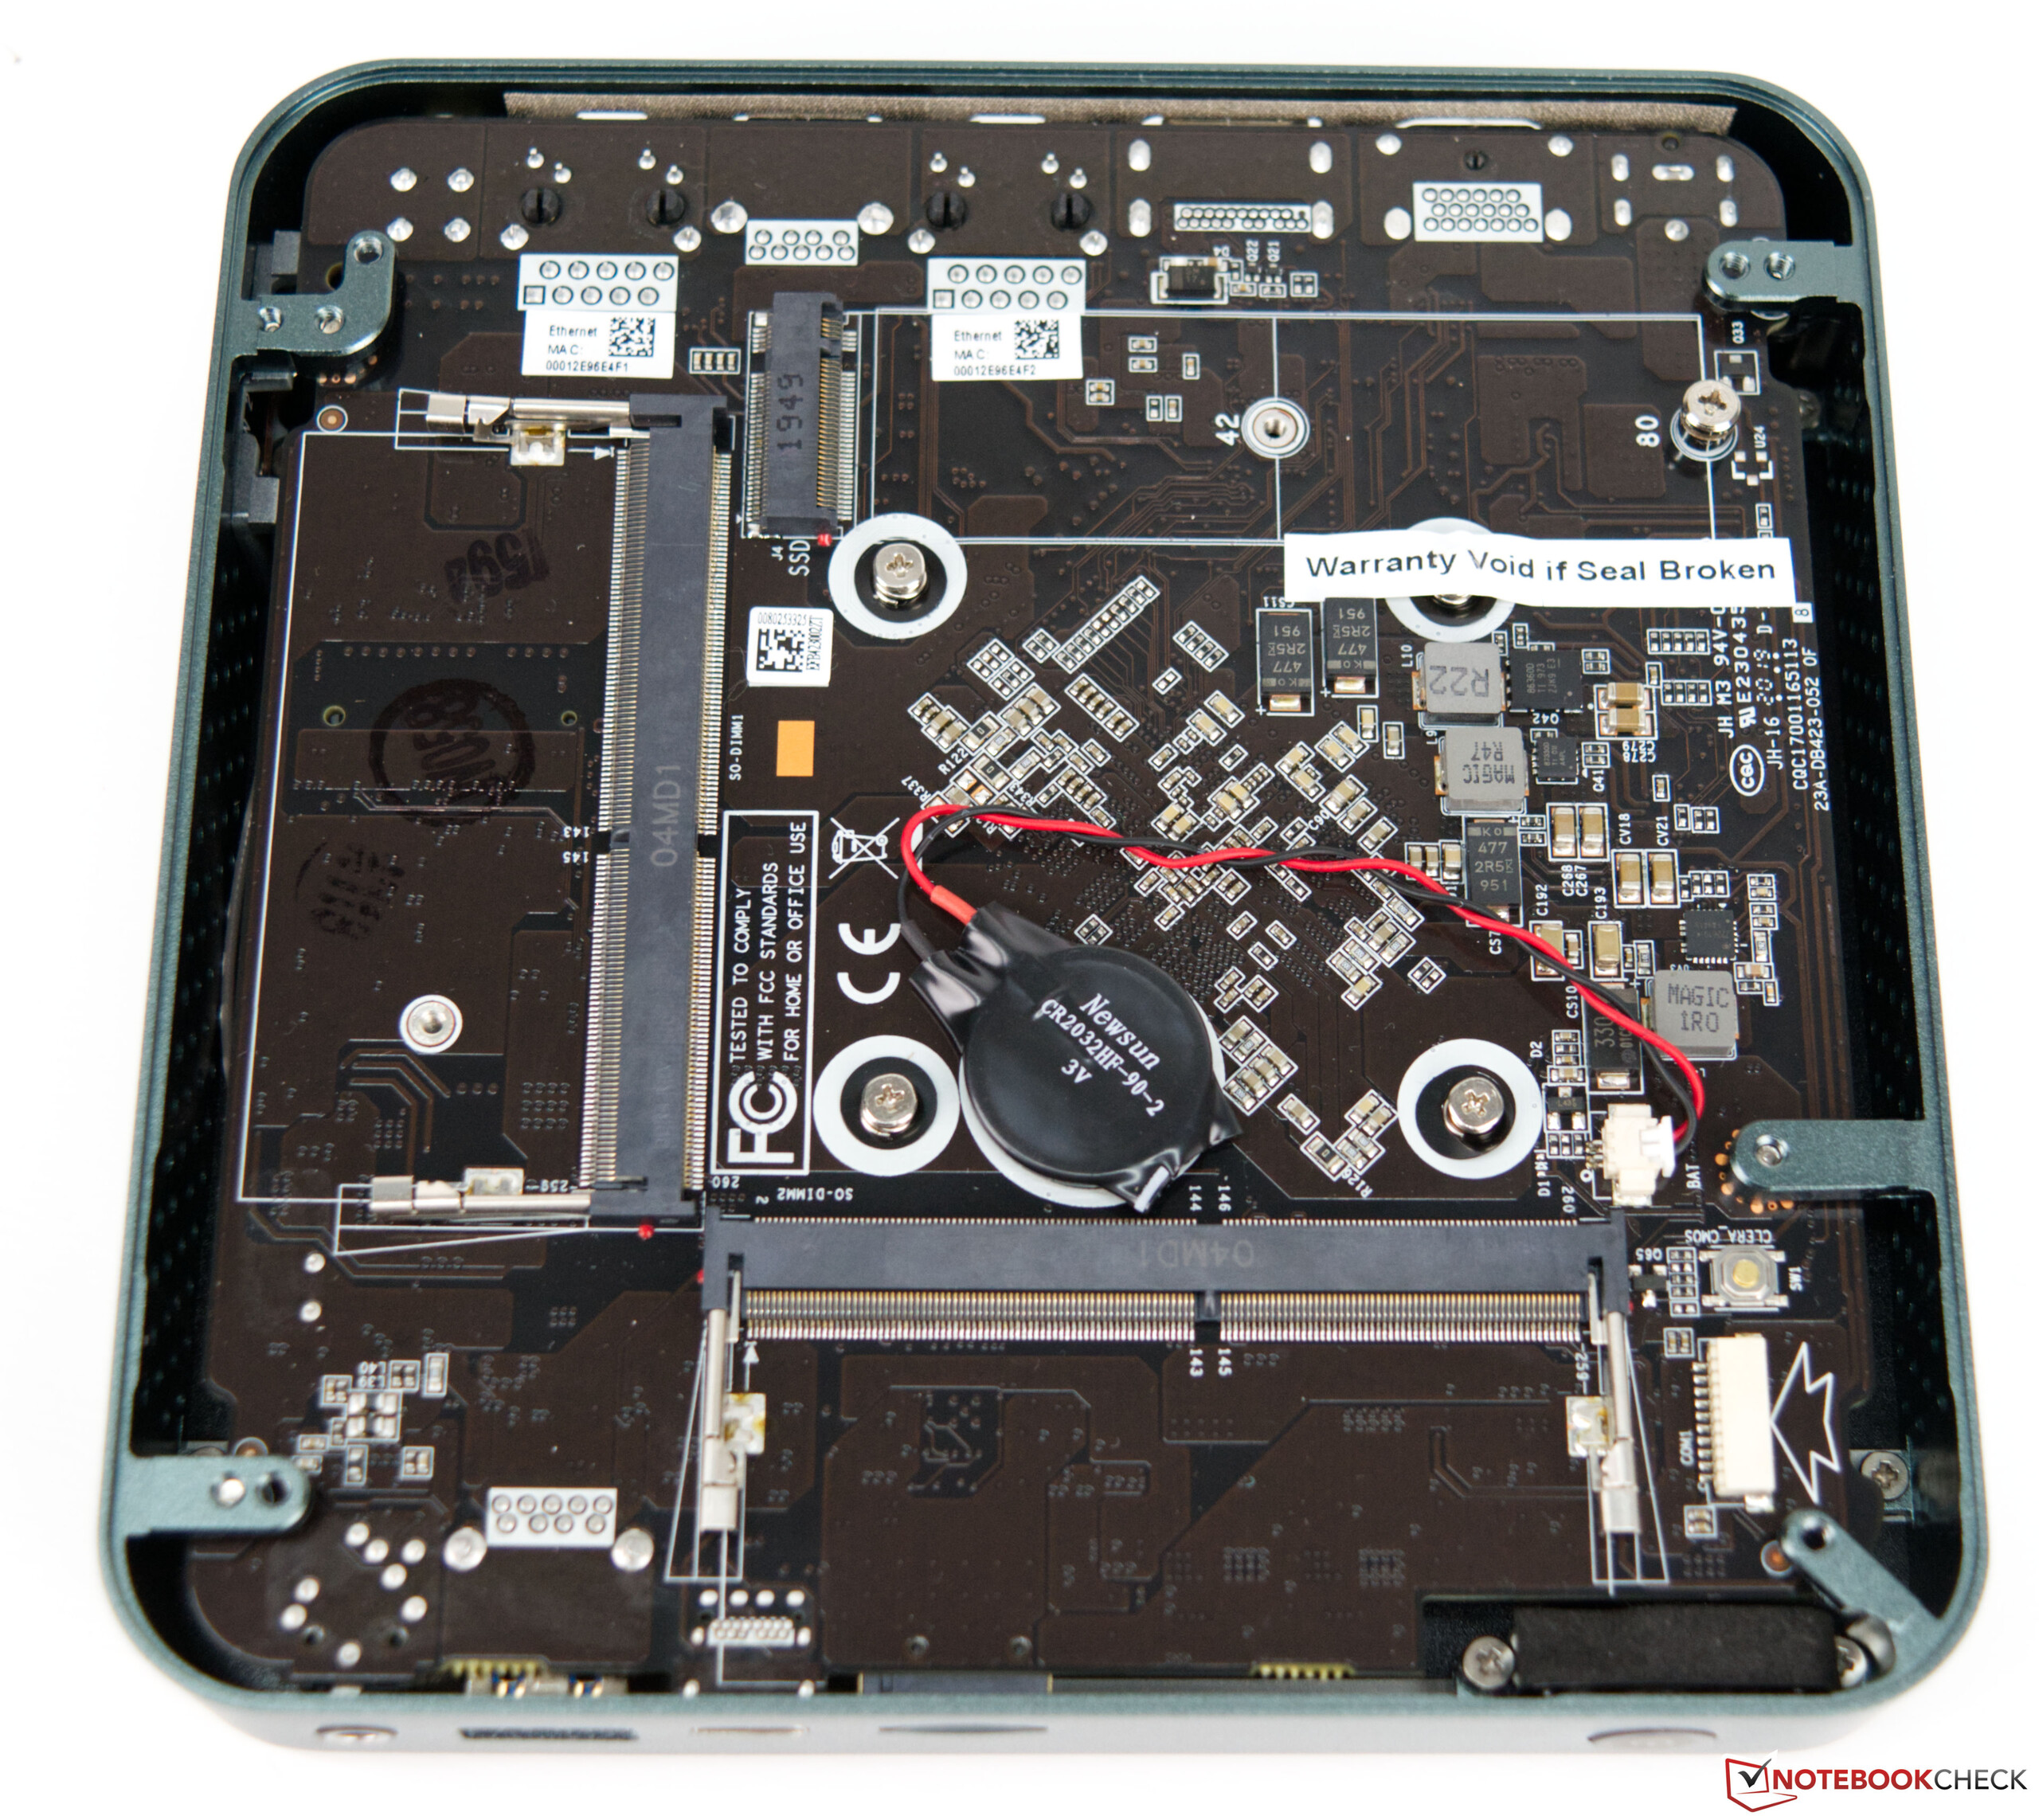
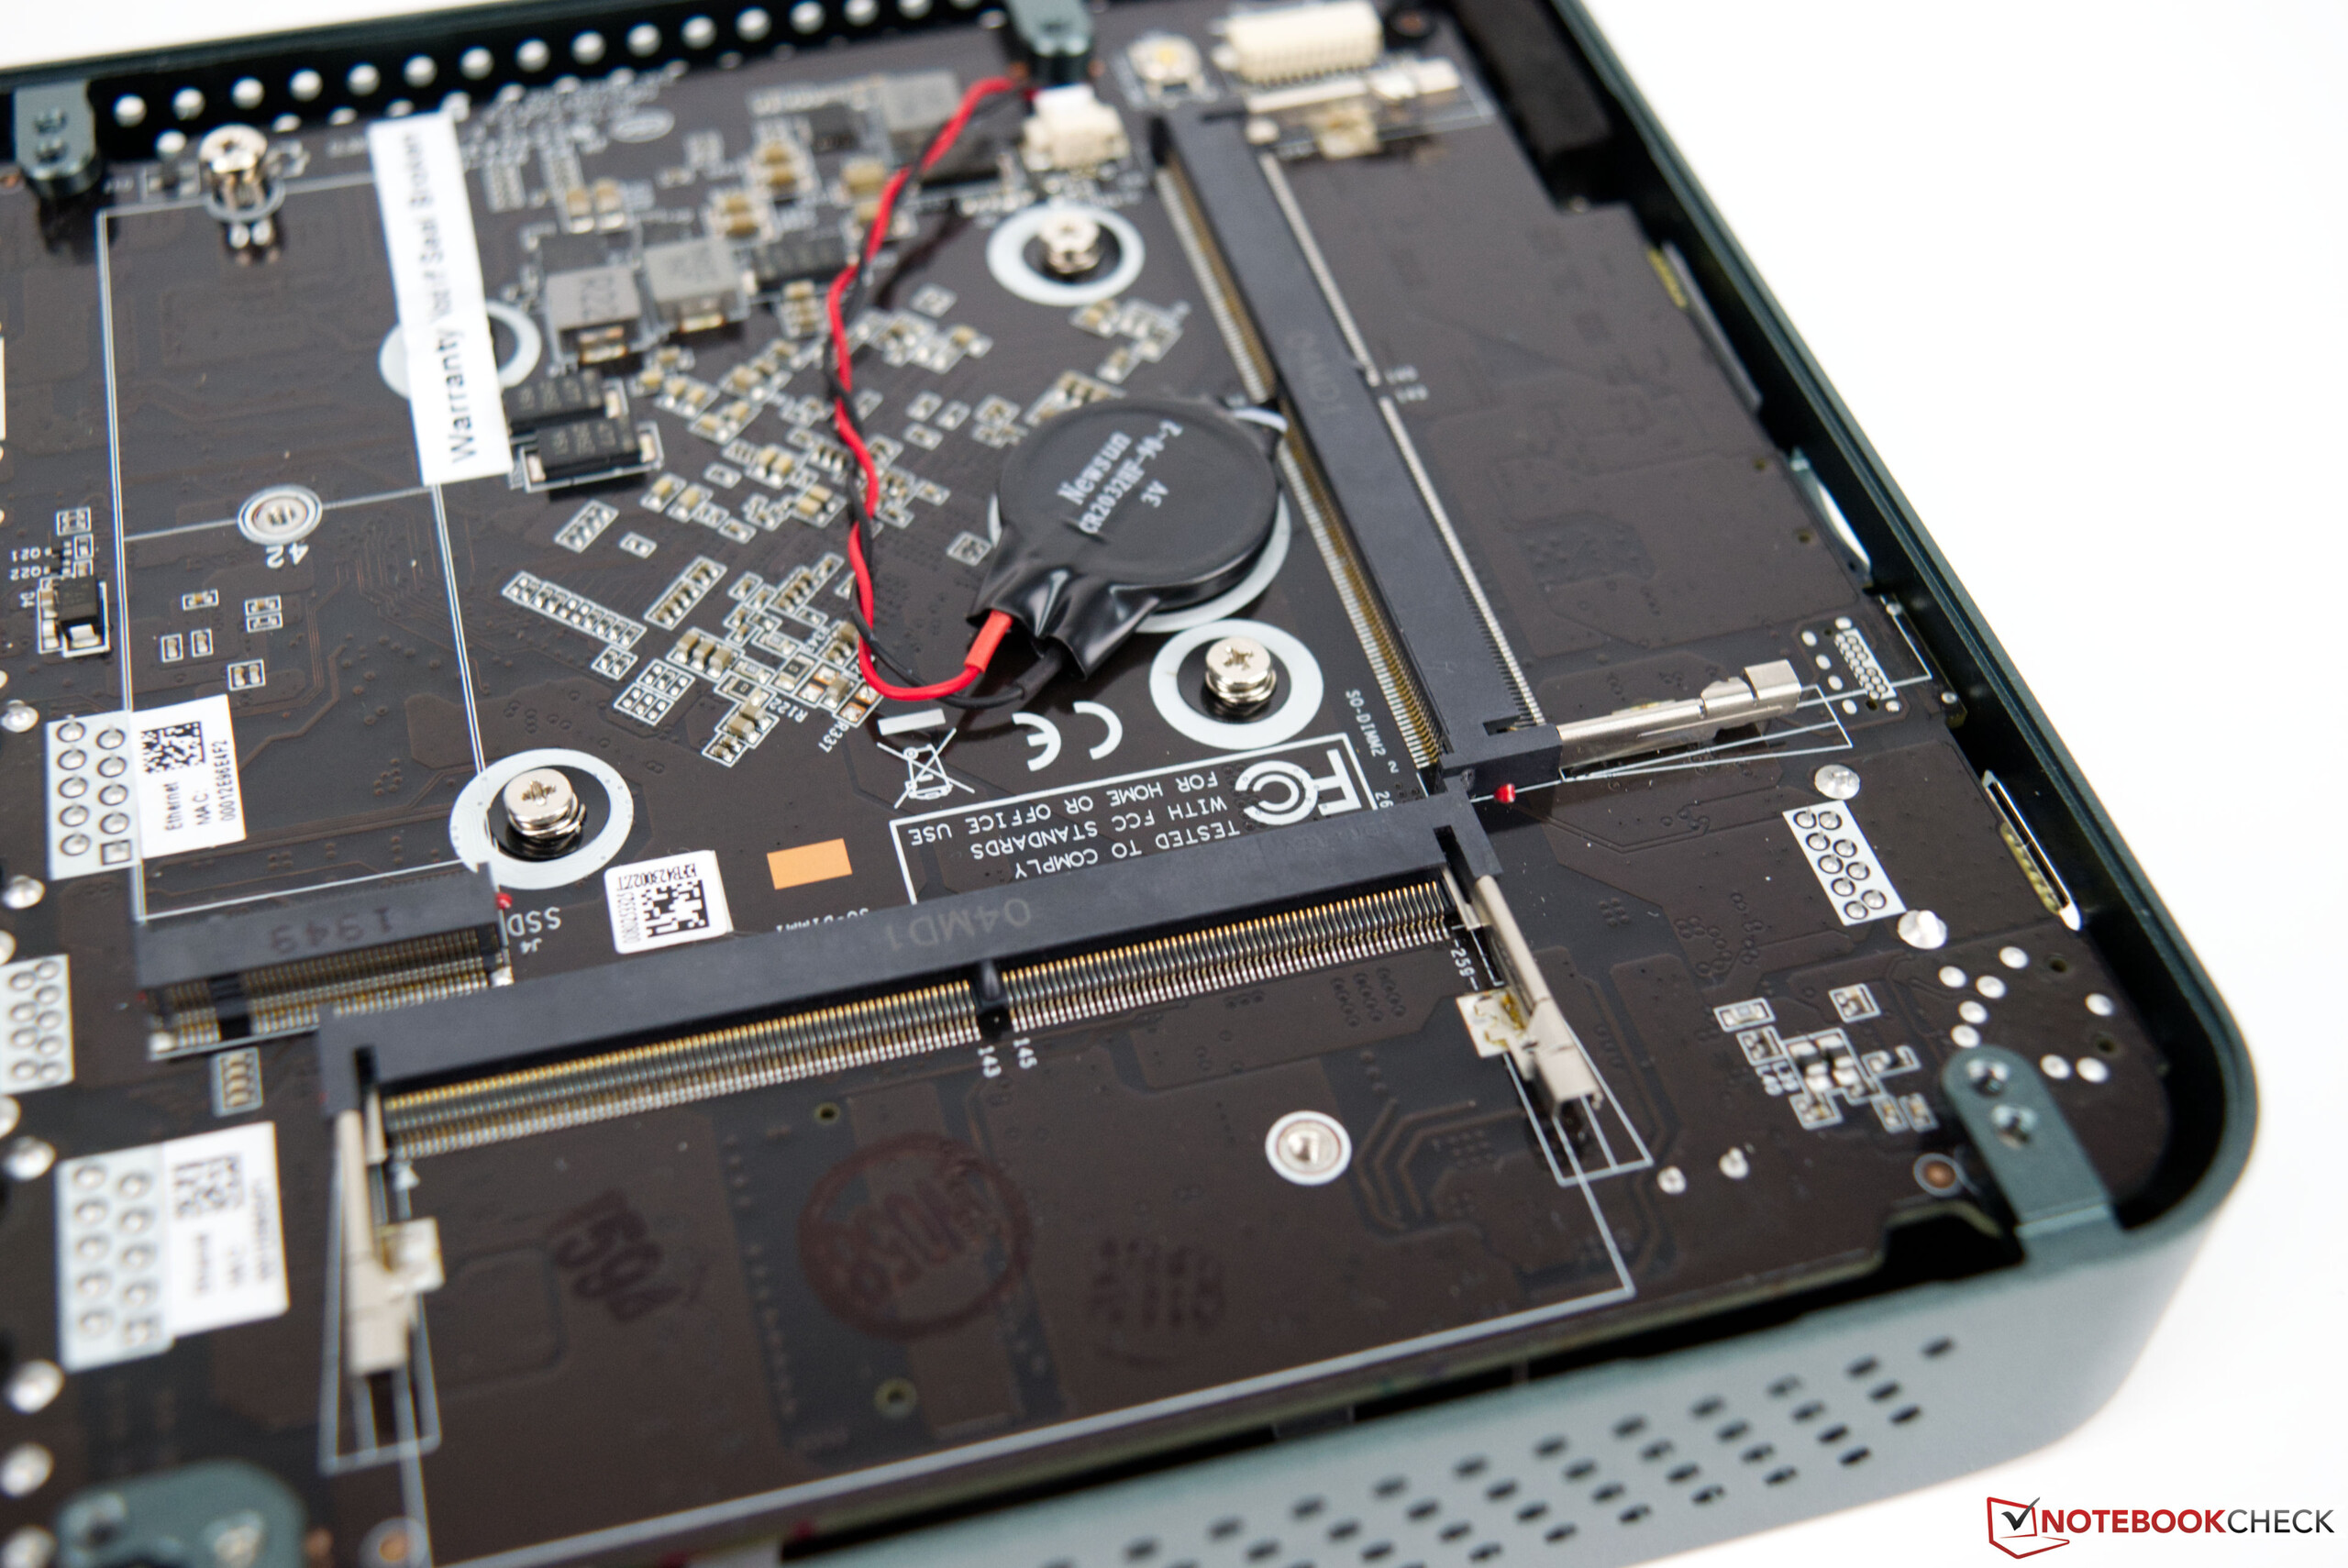
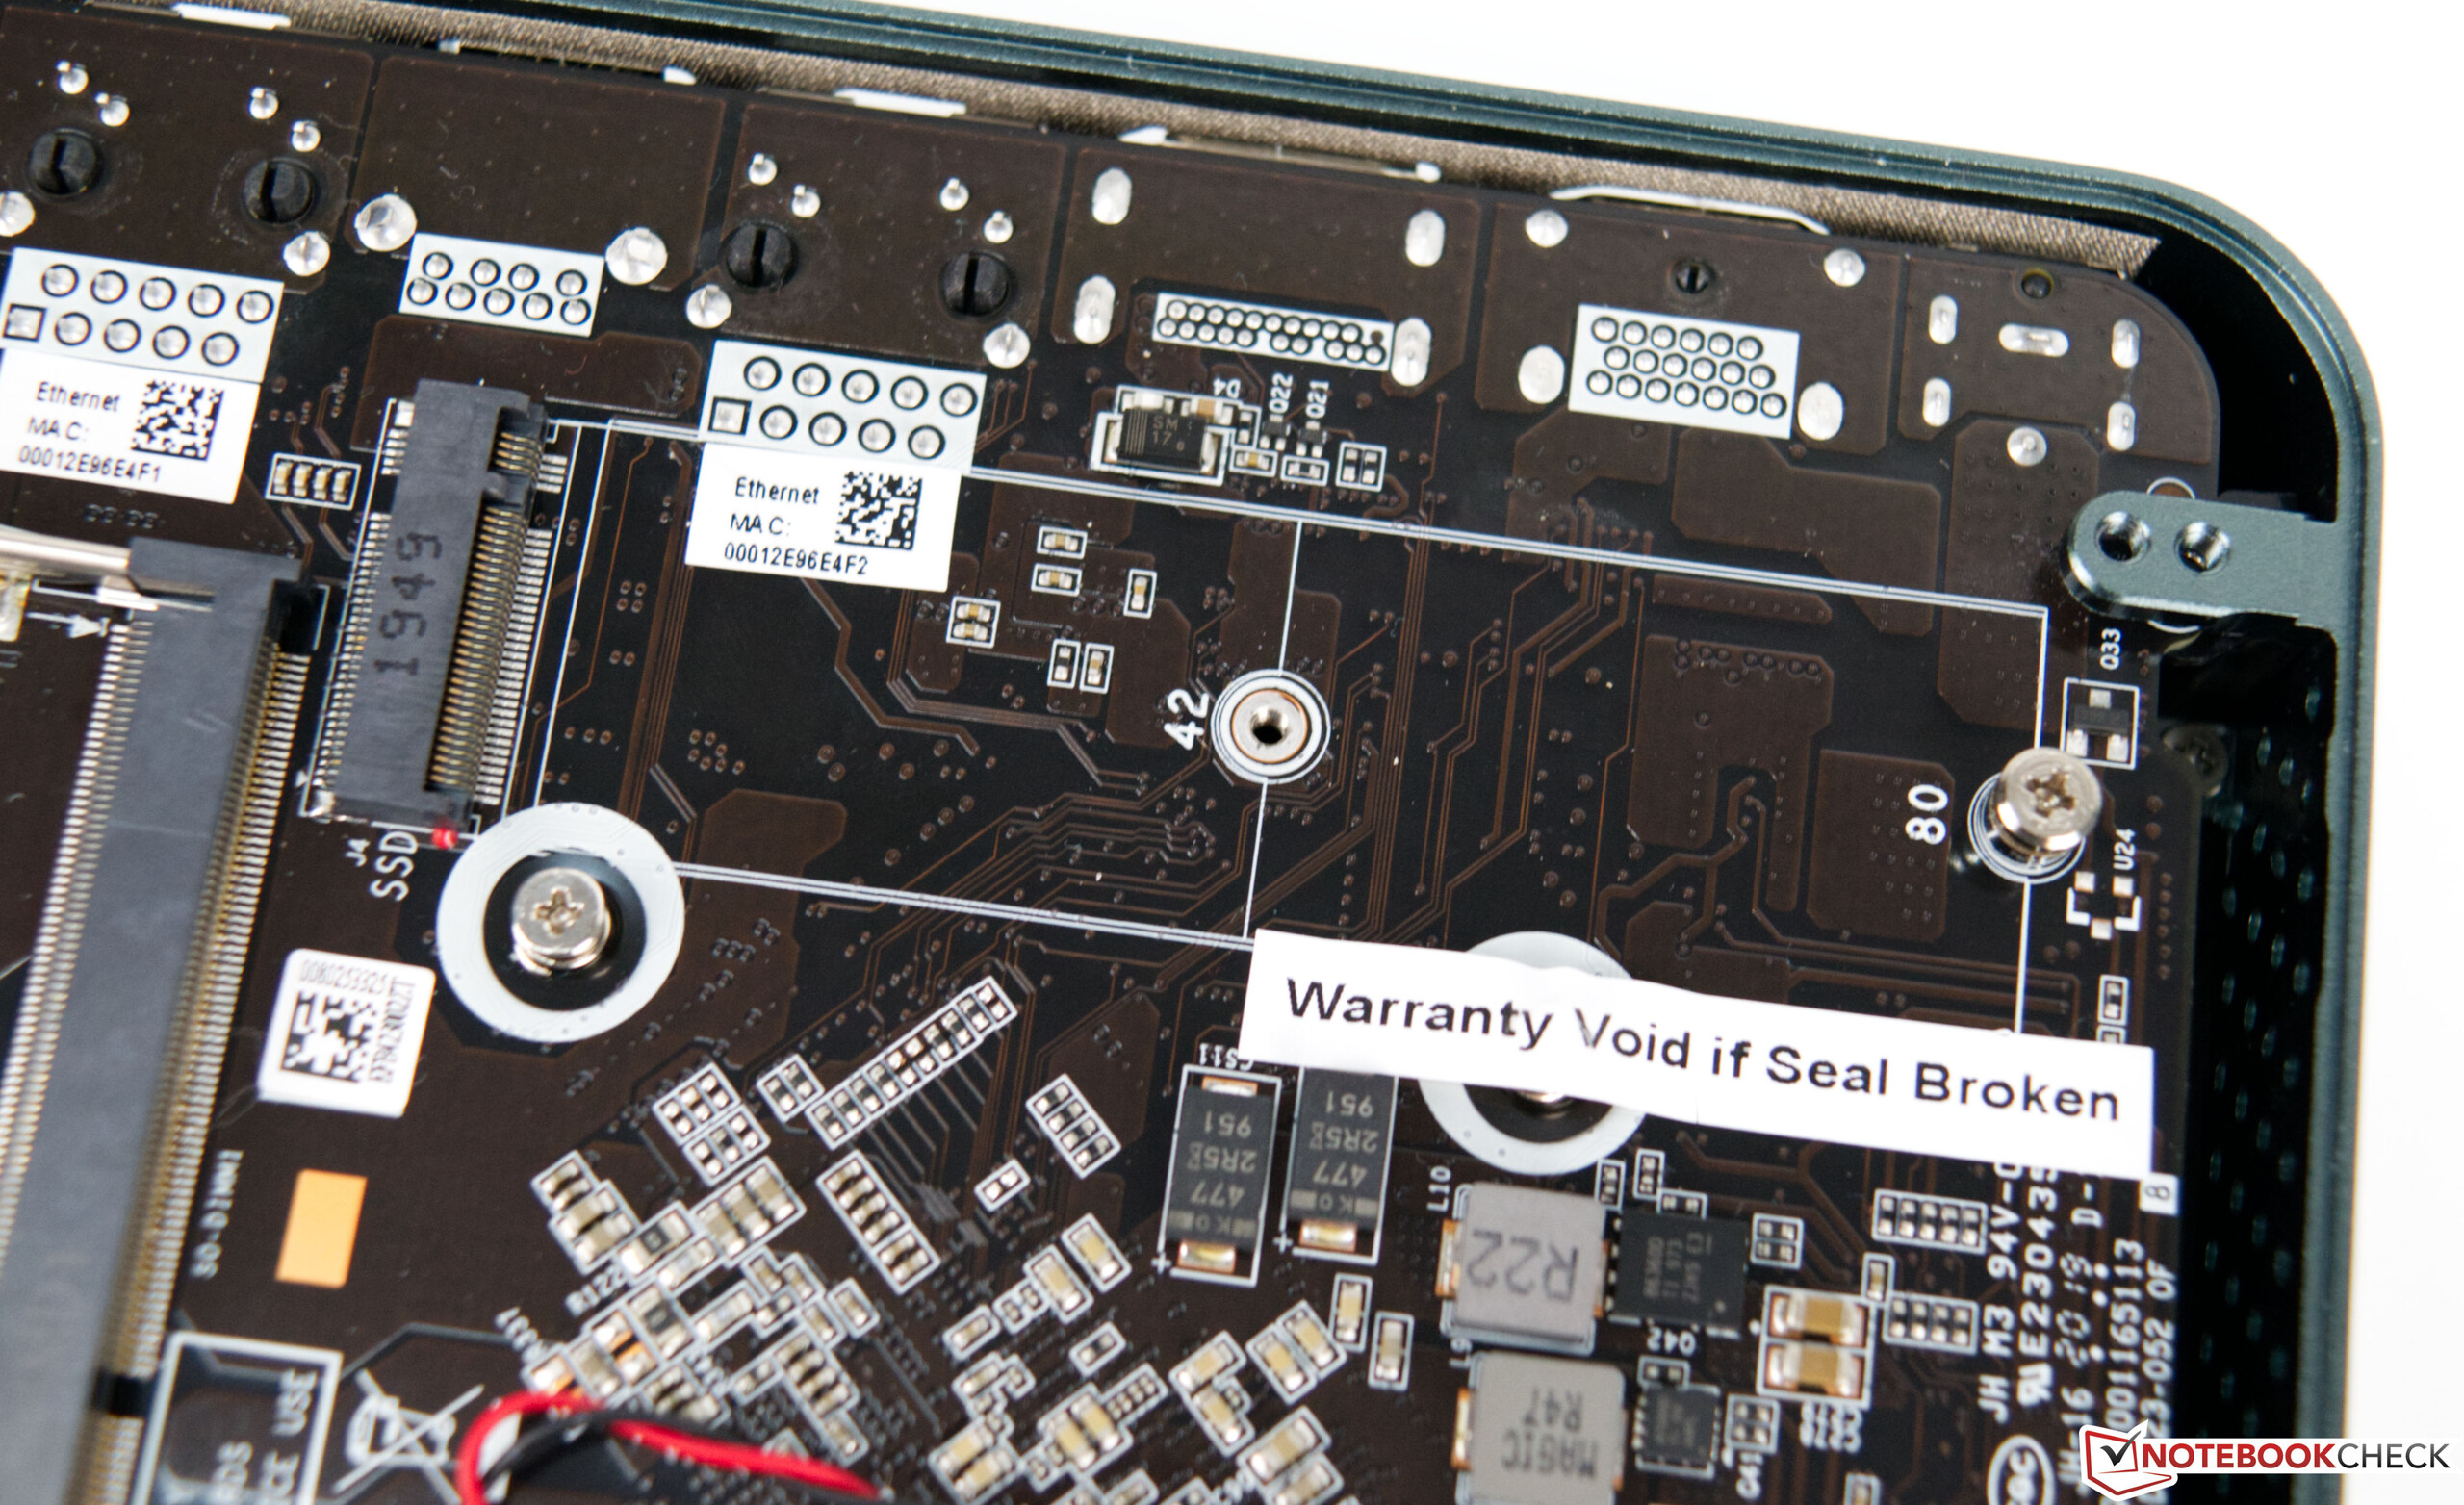
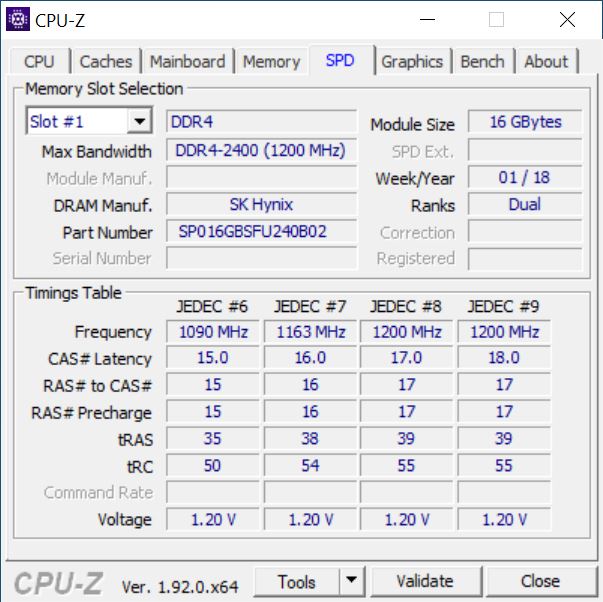
Die edge der Zotac-C-Serie basiert auf einem Intel-Gemini-Lake-SoC mit einer sehr geringen TDP von nur 6 Watt, was eine passive Kühlung ermöglicht. Der Intel Celeron N4100 taktet mit 1,1 GHz in der Basis und erreicht unter Last bis zu 2,4 GHz. Für einfache Office-Aufgaben reicht der Quad-Core-Prozessor aus. Trotz der passiven Kühlung ist der Mini-PC mit nur 32 Millimetern sehr flach. Im Umkehrschluss bedeutet dies auch, dass im Inneren kein Platz für ein 2,5-Zoll-Laufwert ist. Stattdessen muss auf ein M.2-Massenspeicher zurückgegriffen werden, was aber auch kein Problem sein sollte. Beim Arbeitsspeicher haben die Nutzer die Möglichkeit das Barebone mit zwei SO-Dimm-Modulen zu bestücken.
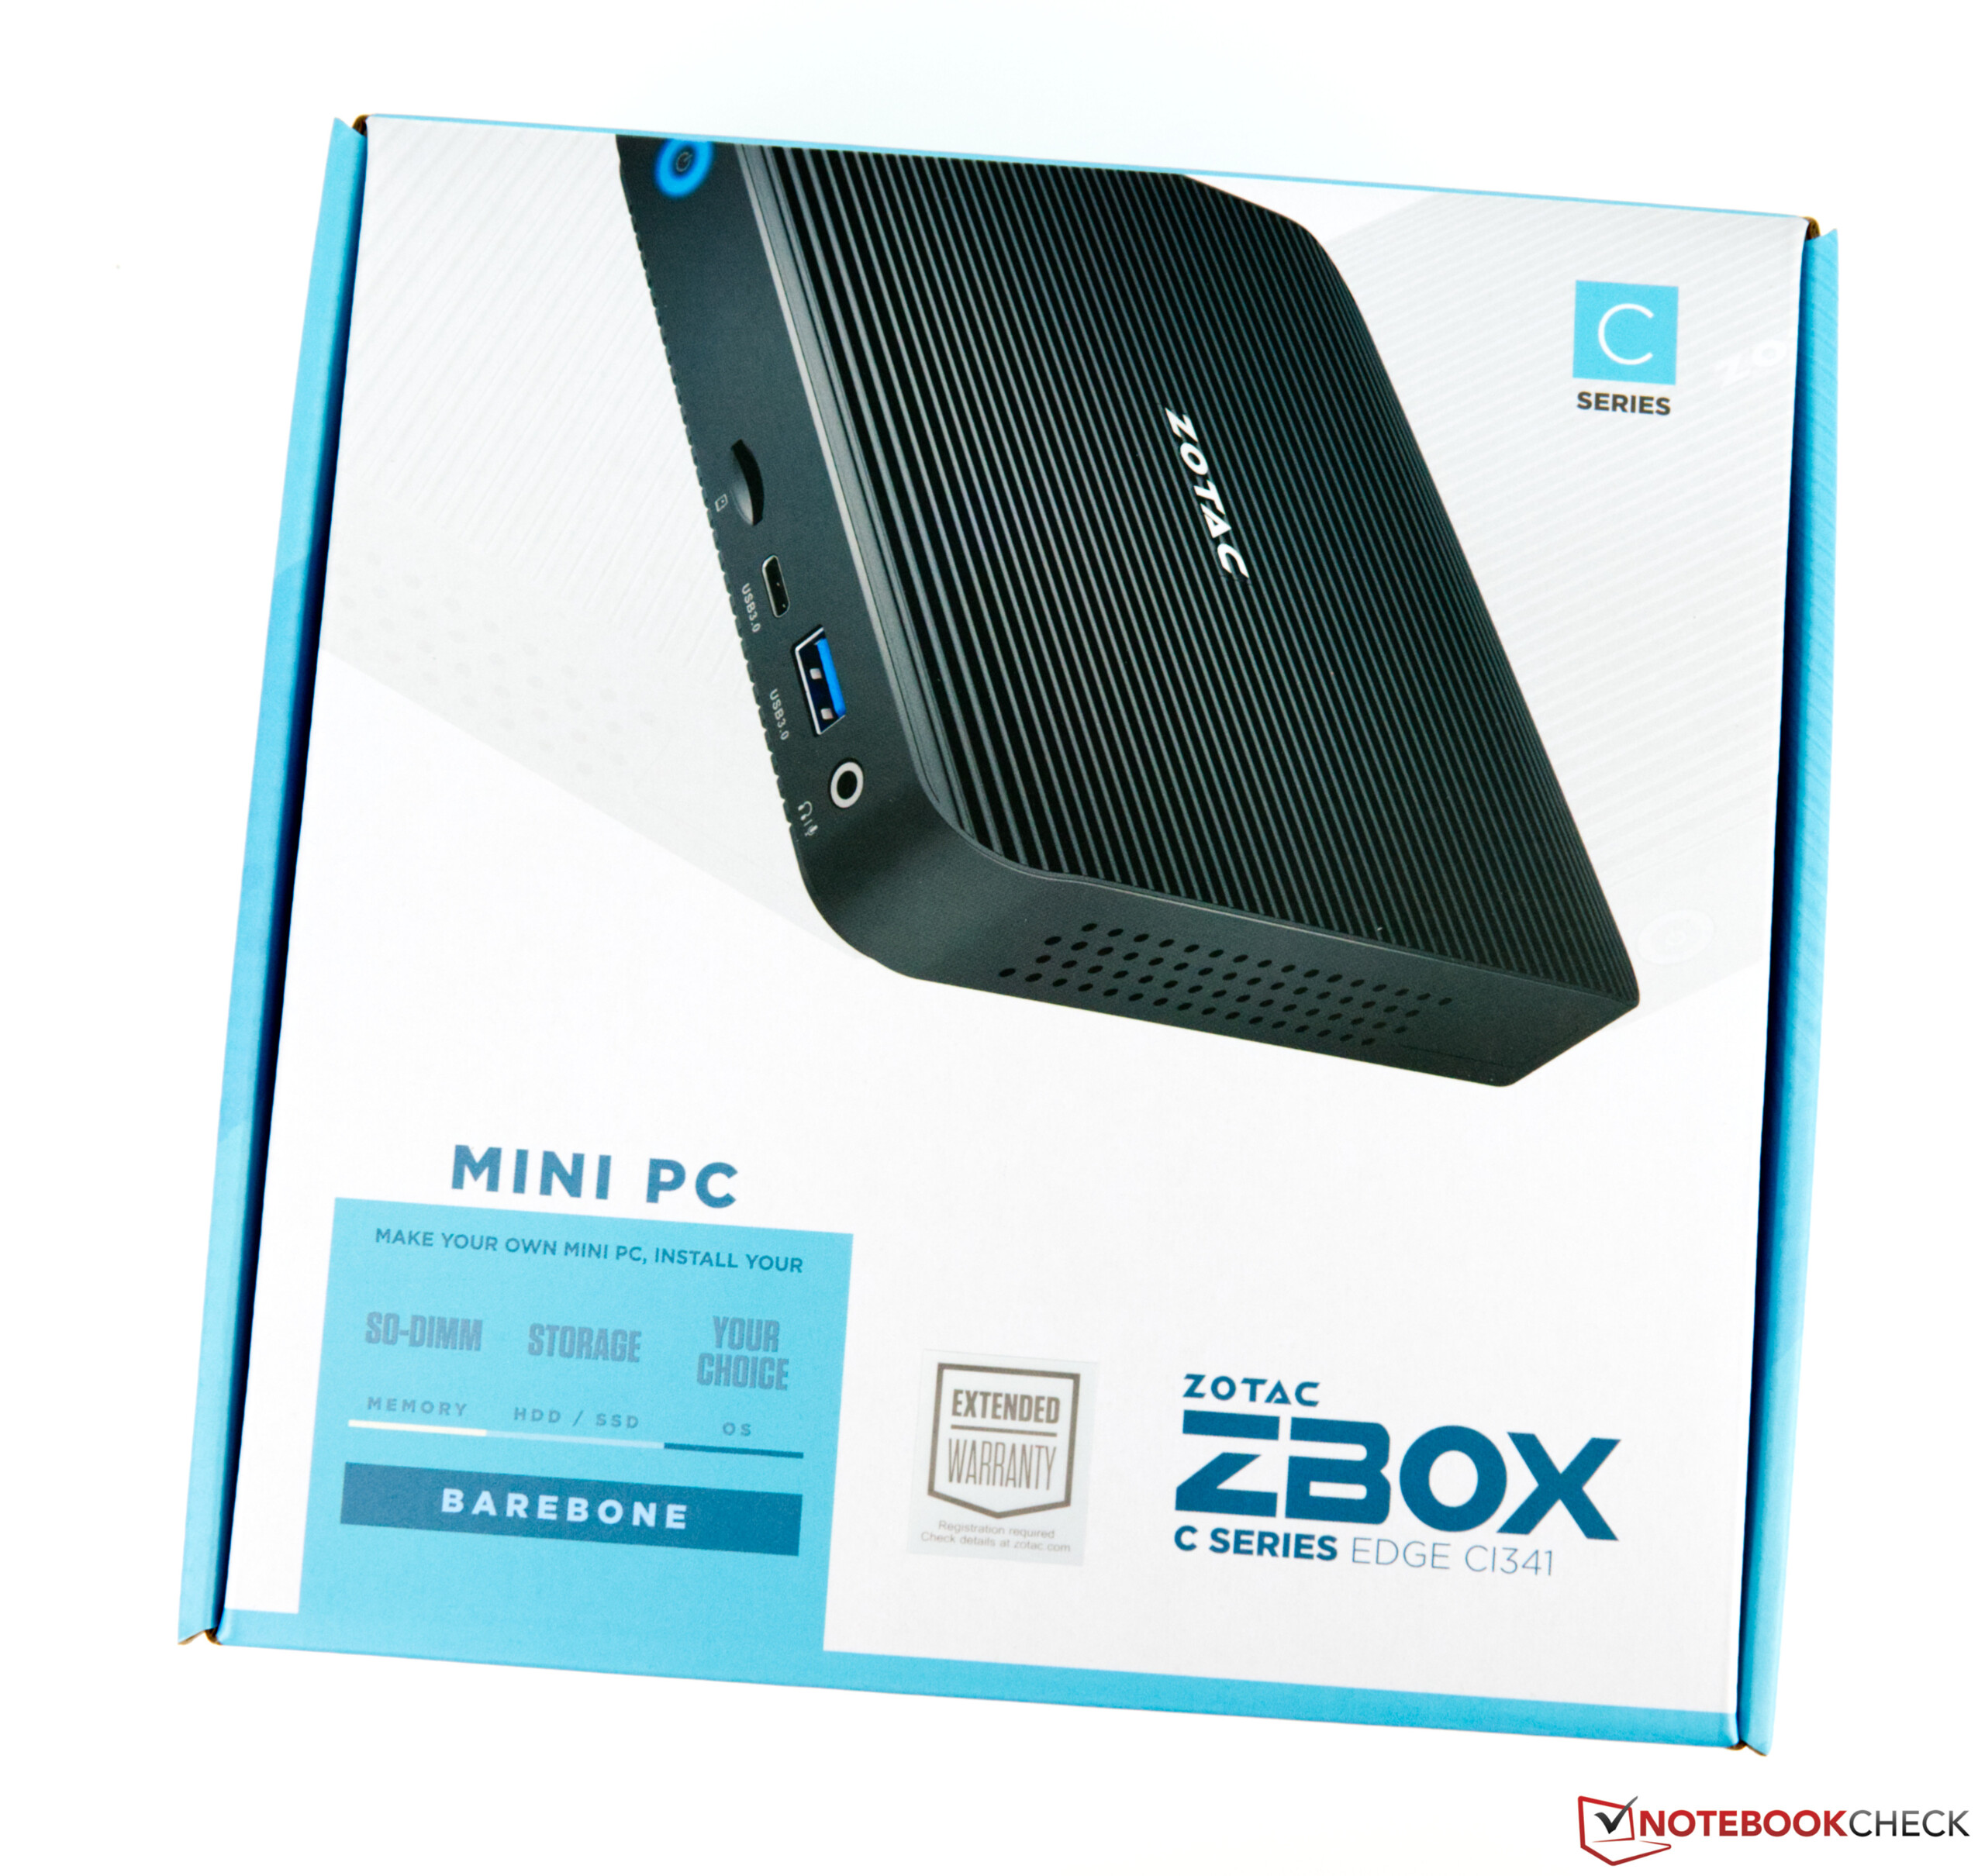
Für knapp 200 Euro steht die Zotac ZBOX edge in den Regalen diverser Onlineshops. Dabei muss aber bedacht werden, dass es sich hierbei um ein Barebone-System handelt. Also Massenspeicher und Arbeitsspeicher sowie eine Lizenz für das Betriebssystem müssen separat erworben werden.
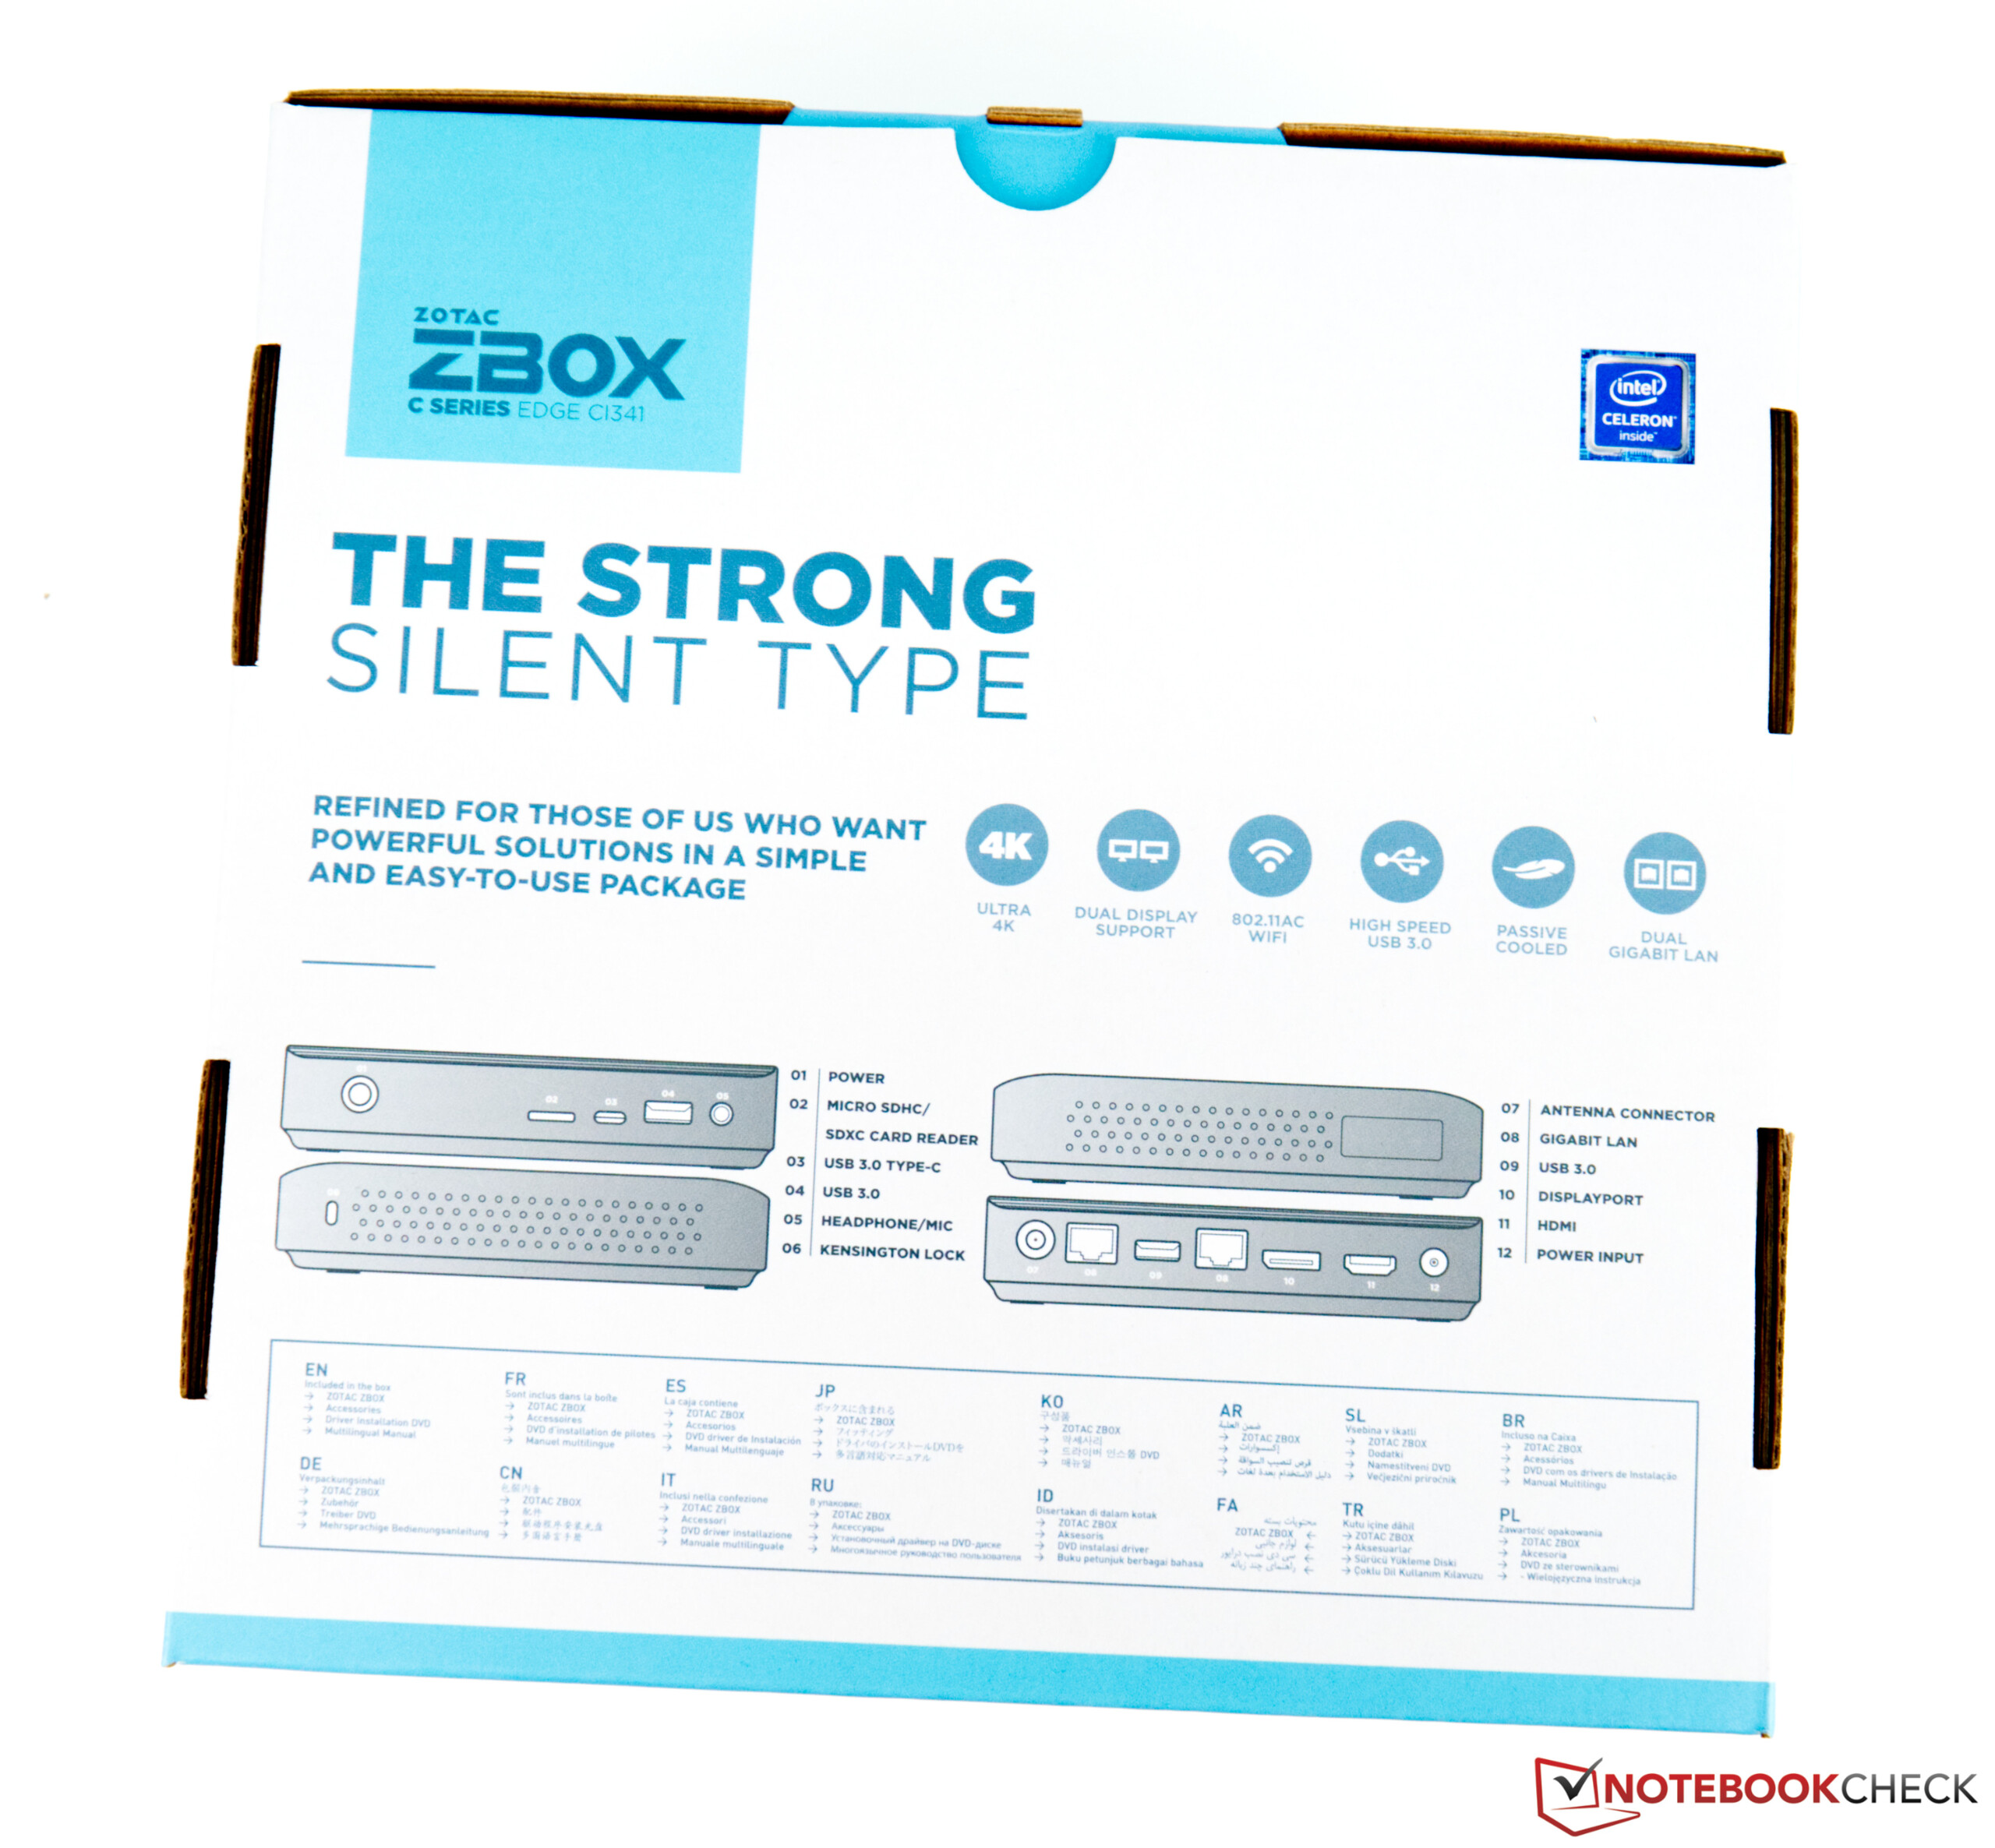
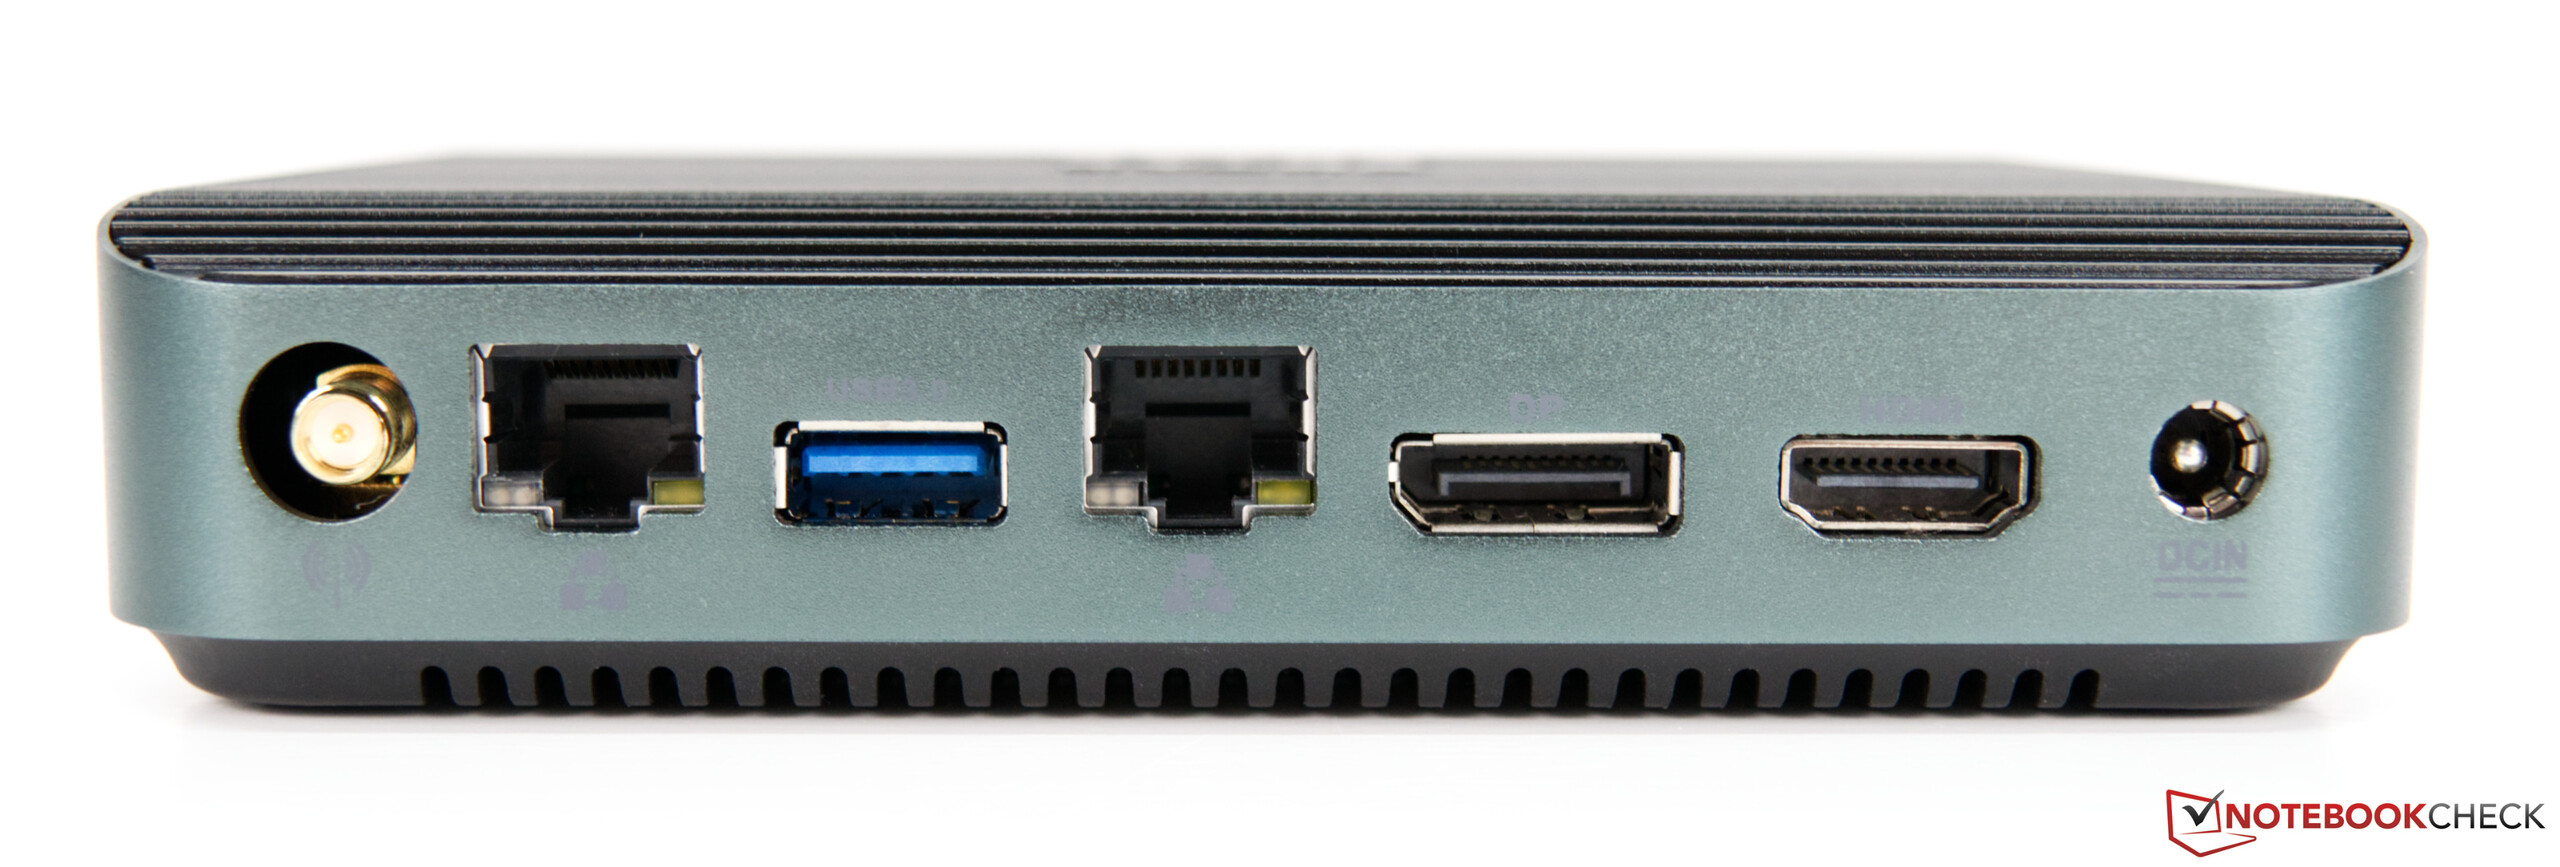
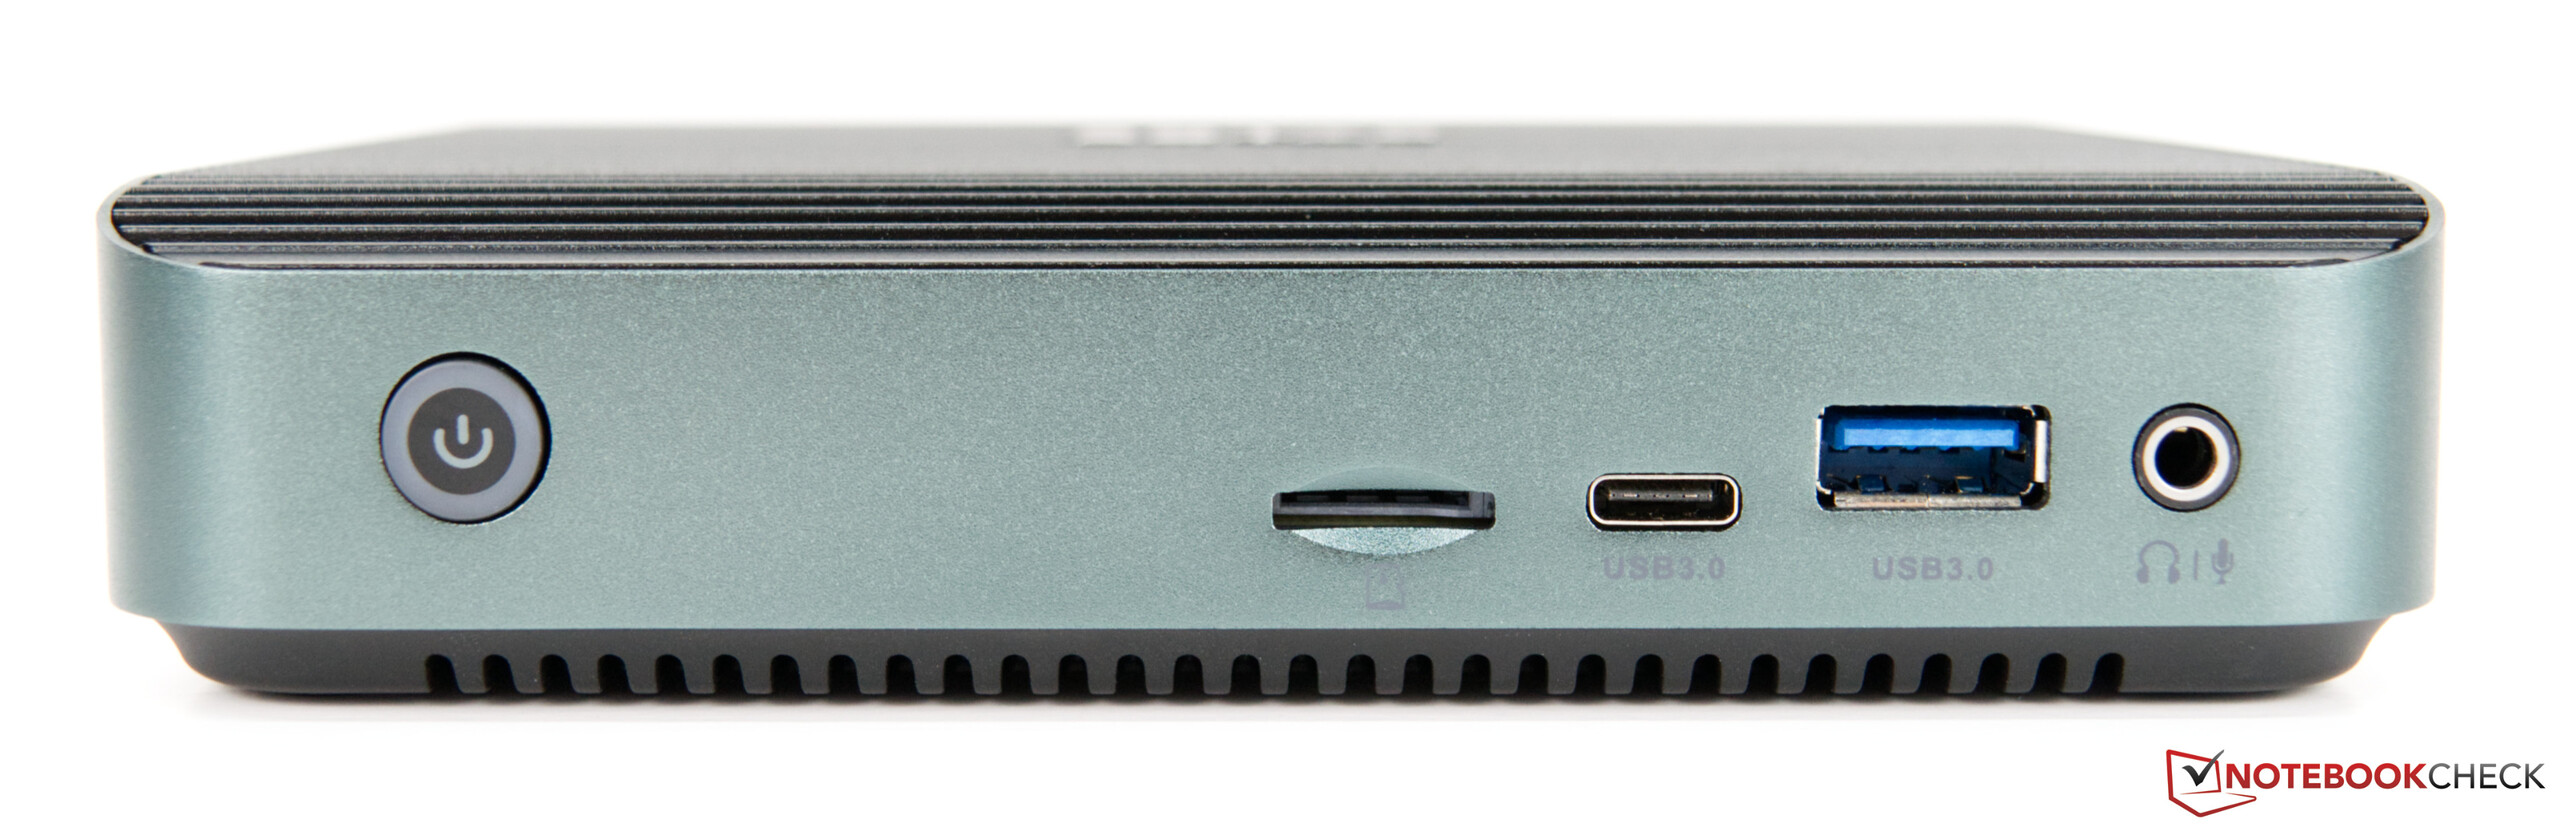
Bei den Anschlüssen bietet der Mini-PC eine solide Grundlage. Mit insgesamt drei USB-Ports lassen sich diverse externe Geräte verbinden. Allerdings ist einer davon als Typ-C-Anschluss verbaut, was die Nutzung von gängigen USB-Geräten etwas einschränkt, wenn bereits eine Maus und eine Tastatur angeschlossen sind. Weiterhin gibt es Dual-GBit-LAN und einen SD-Kartenleser. Außerdem lassen sich Displays über HDMI oder DisplayPort ansteuern. Für die drahtlose Netzwerkverbindung gibt es ein Wi-Fi 5 Modul, welches auch gleichzeitig Bluetooth 4.2 unterstützt. Zum Lieferumfang gehört auch ein kleines 40-Watt-Netzteil.
Gehäuse & Ausstattung
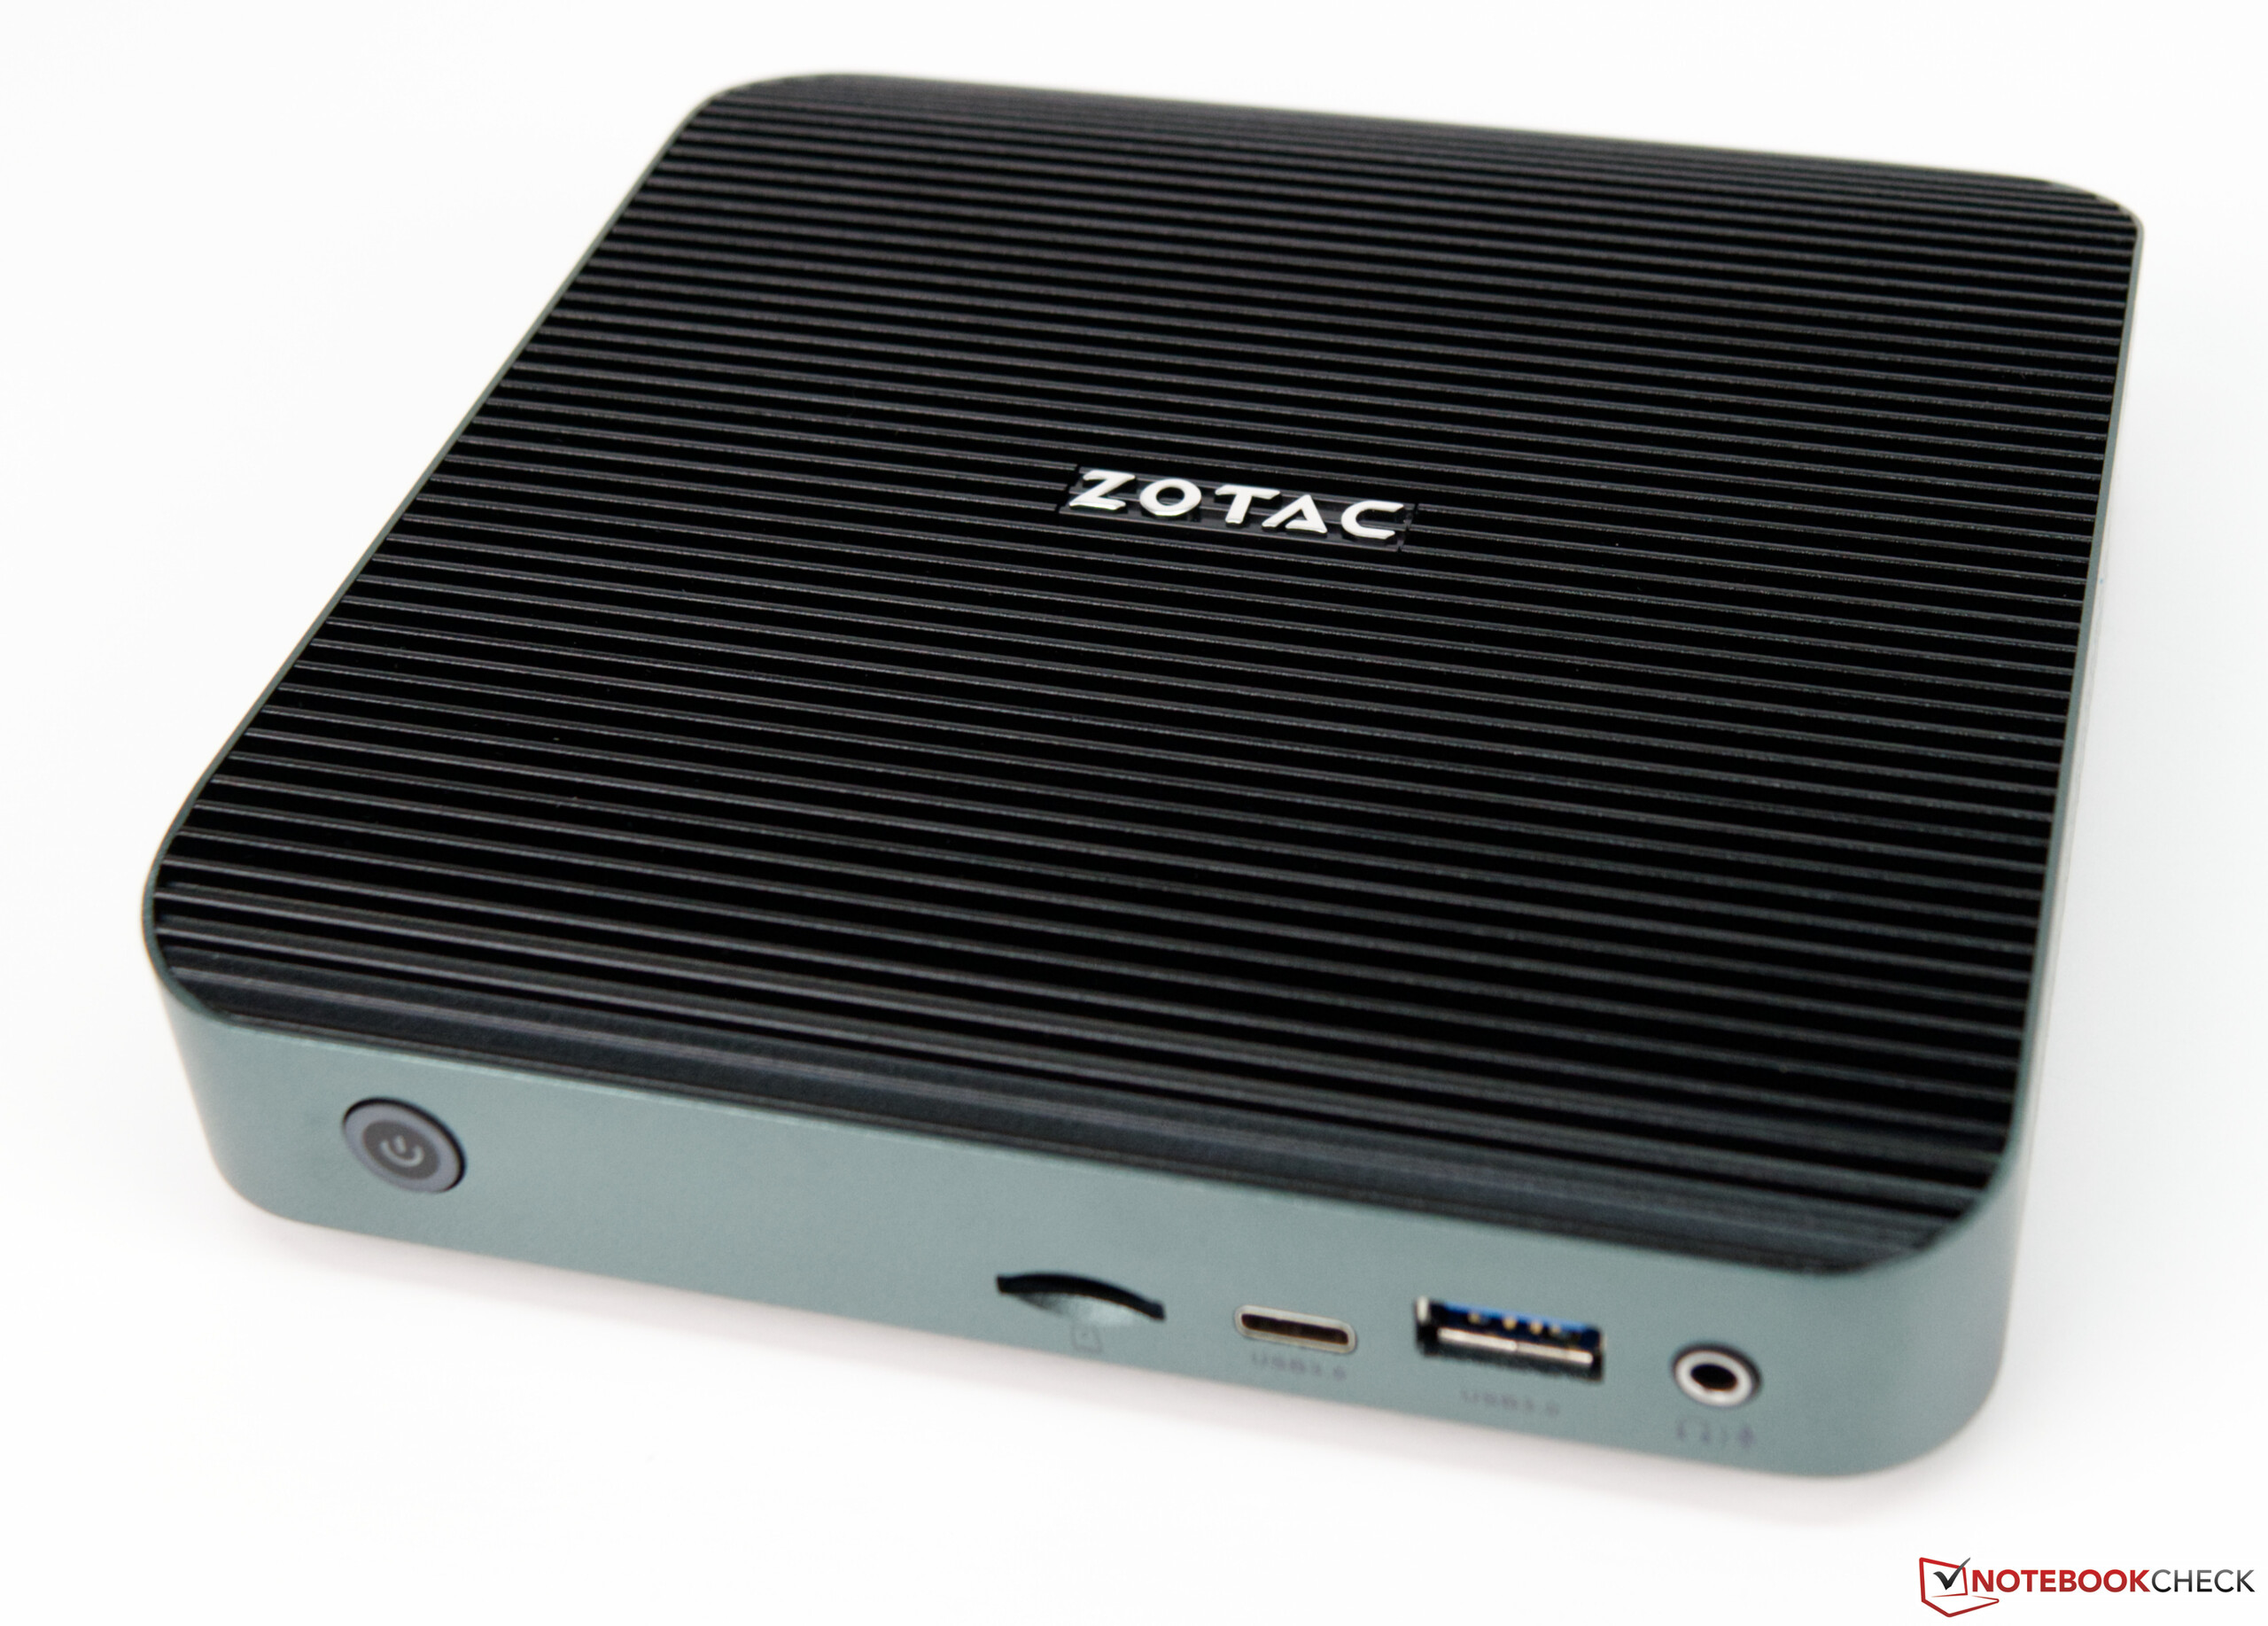
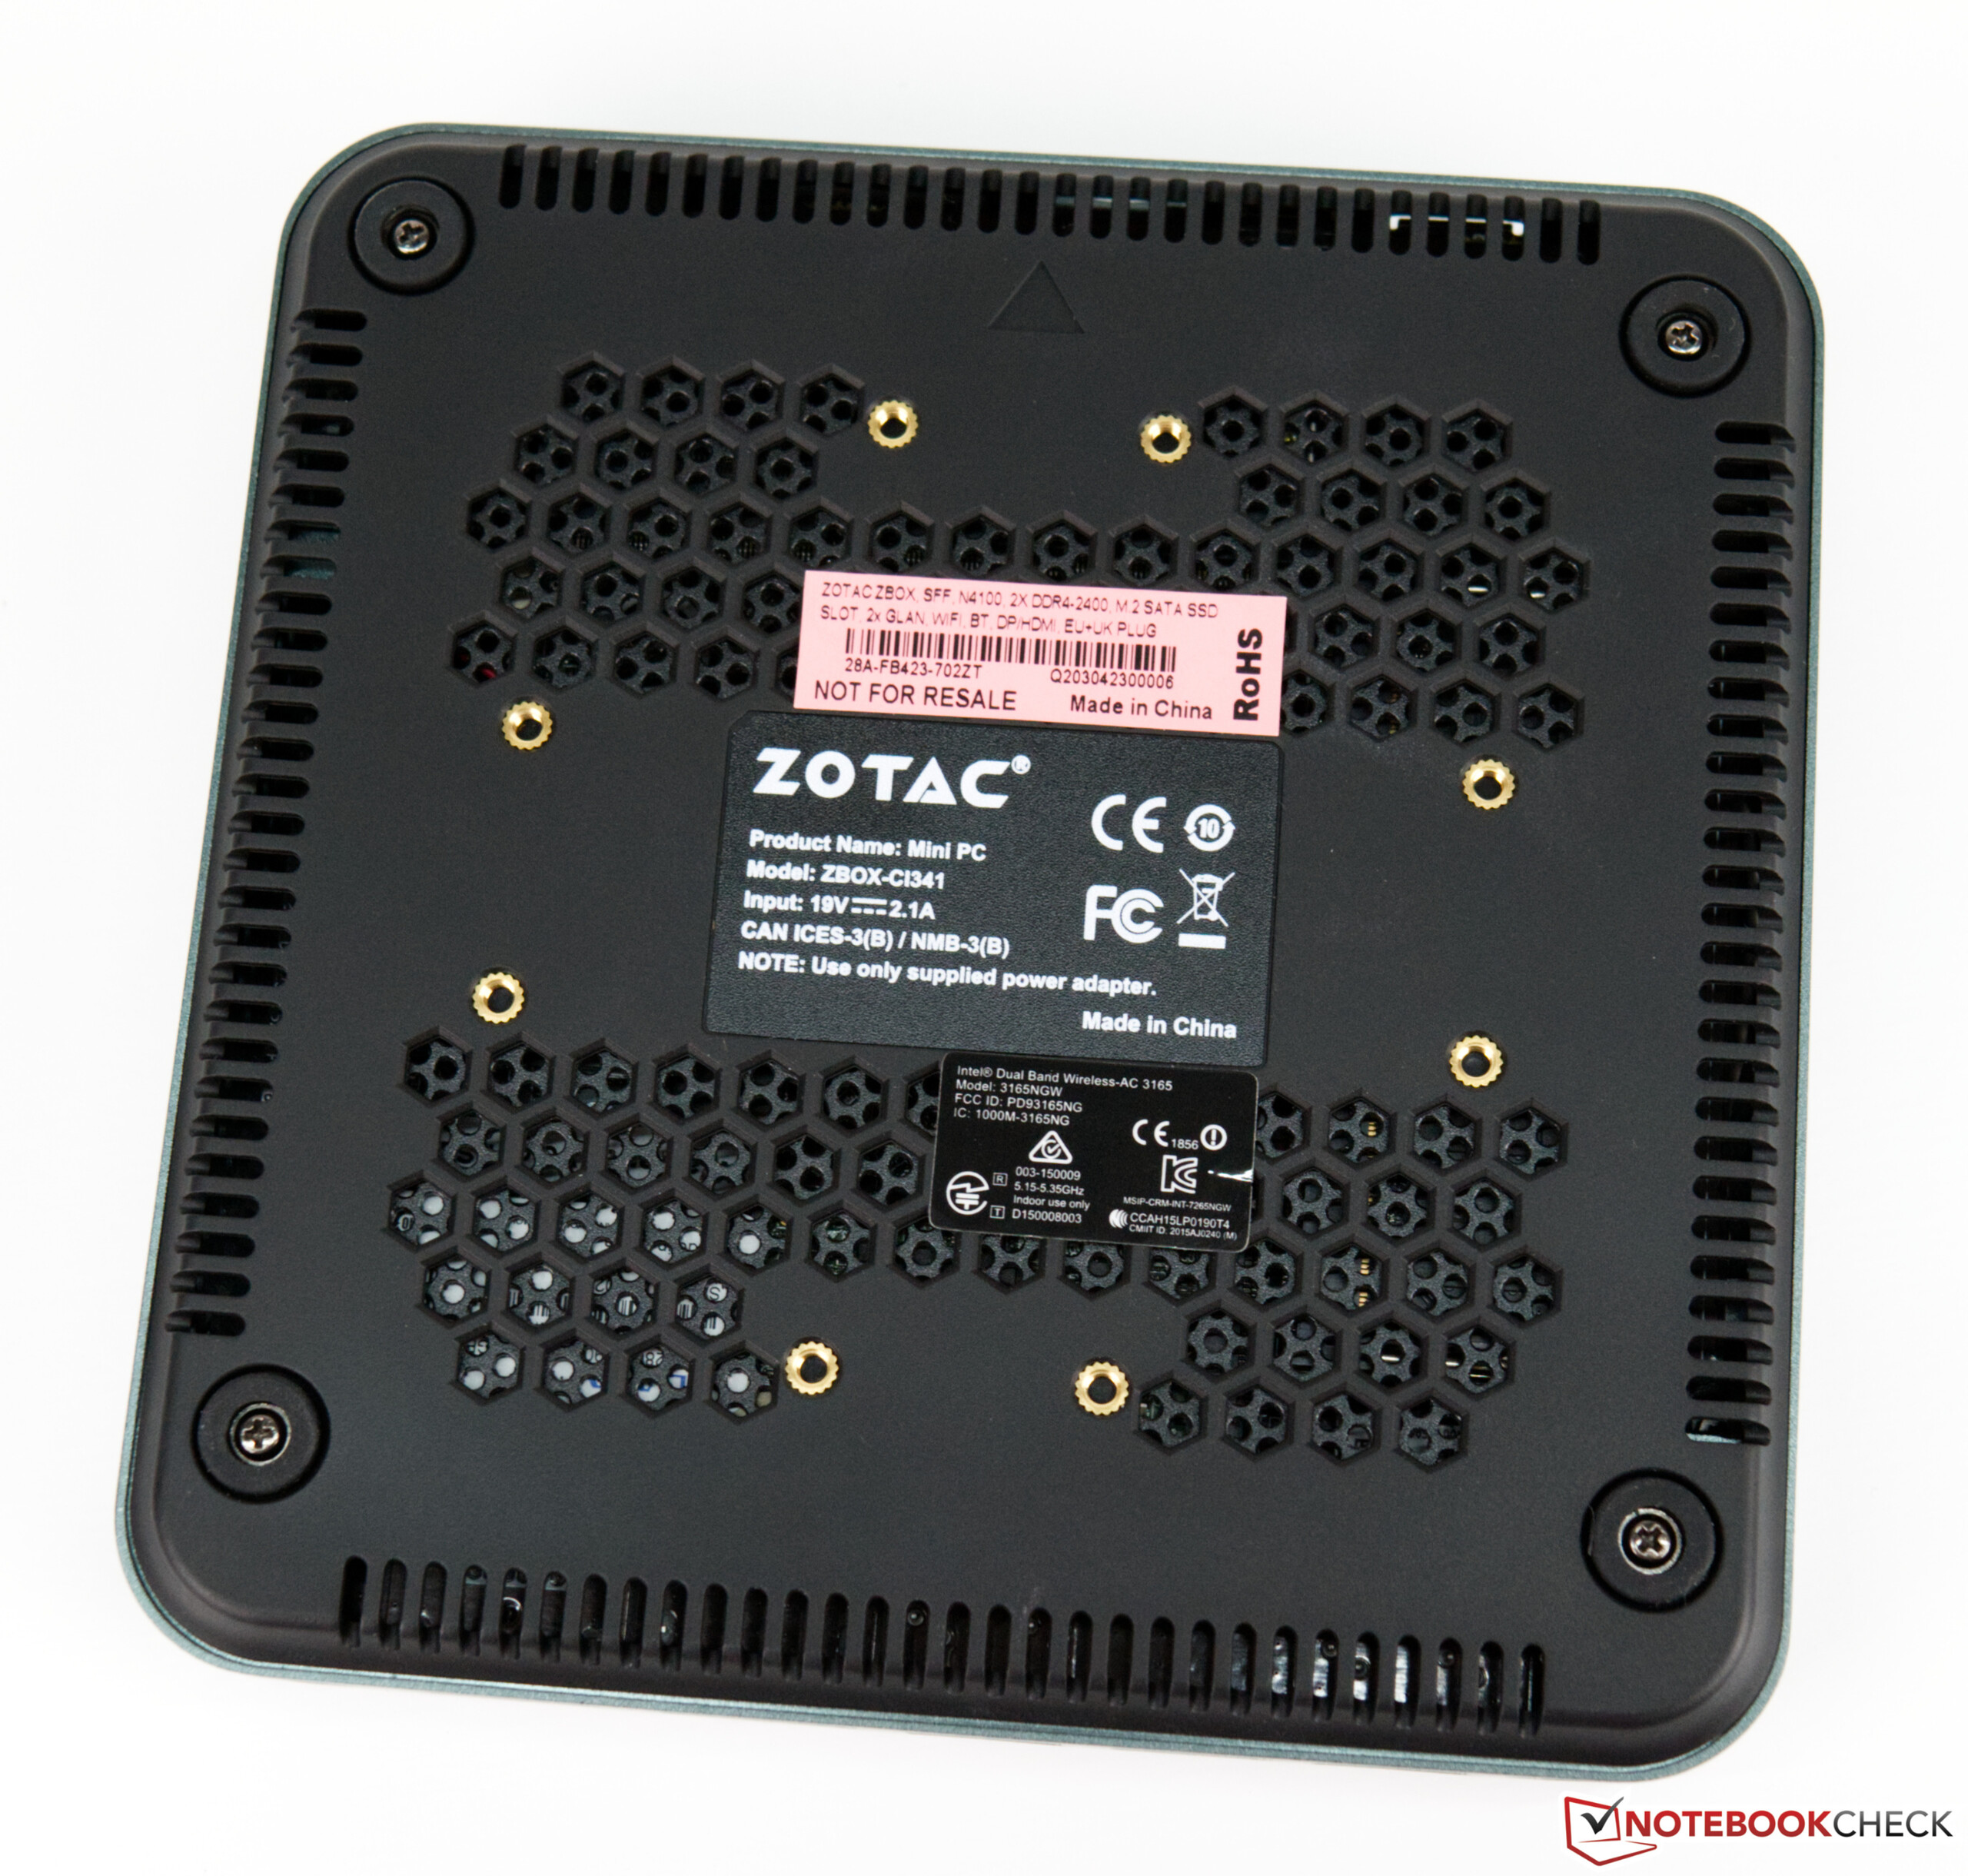
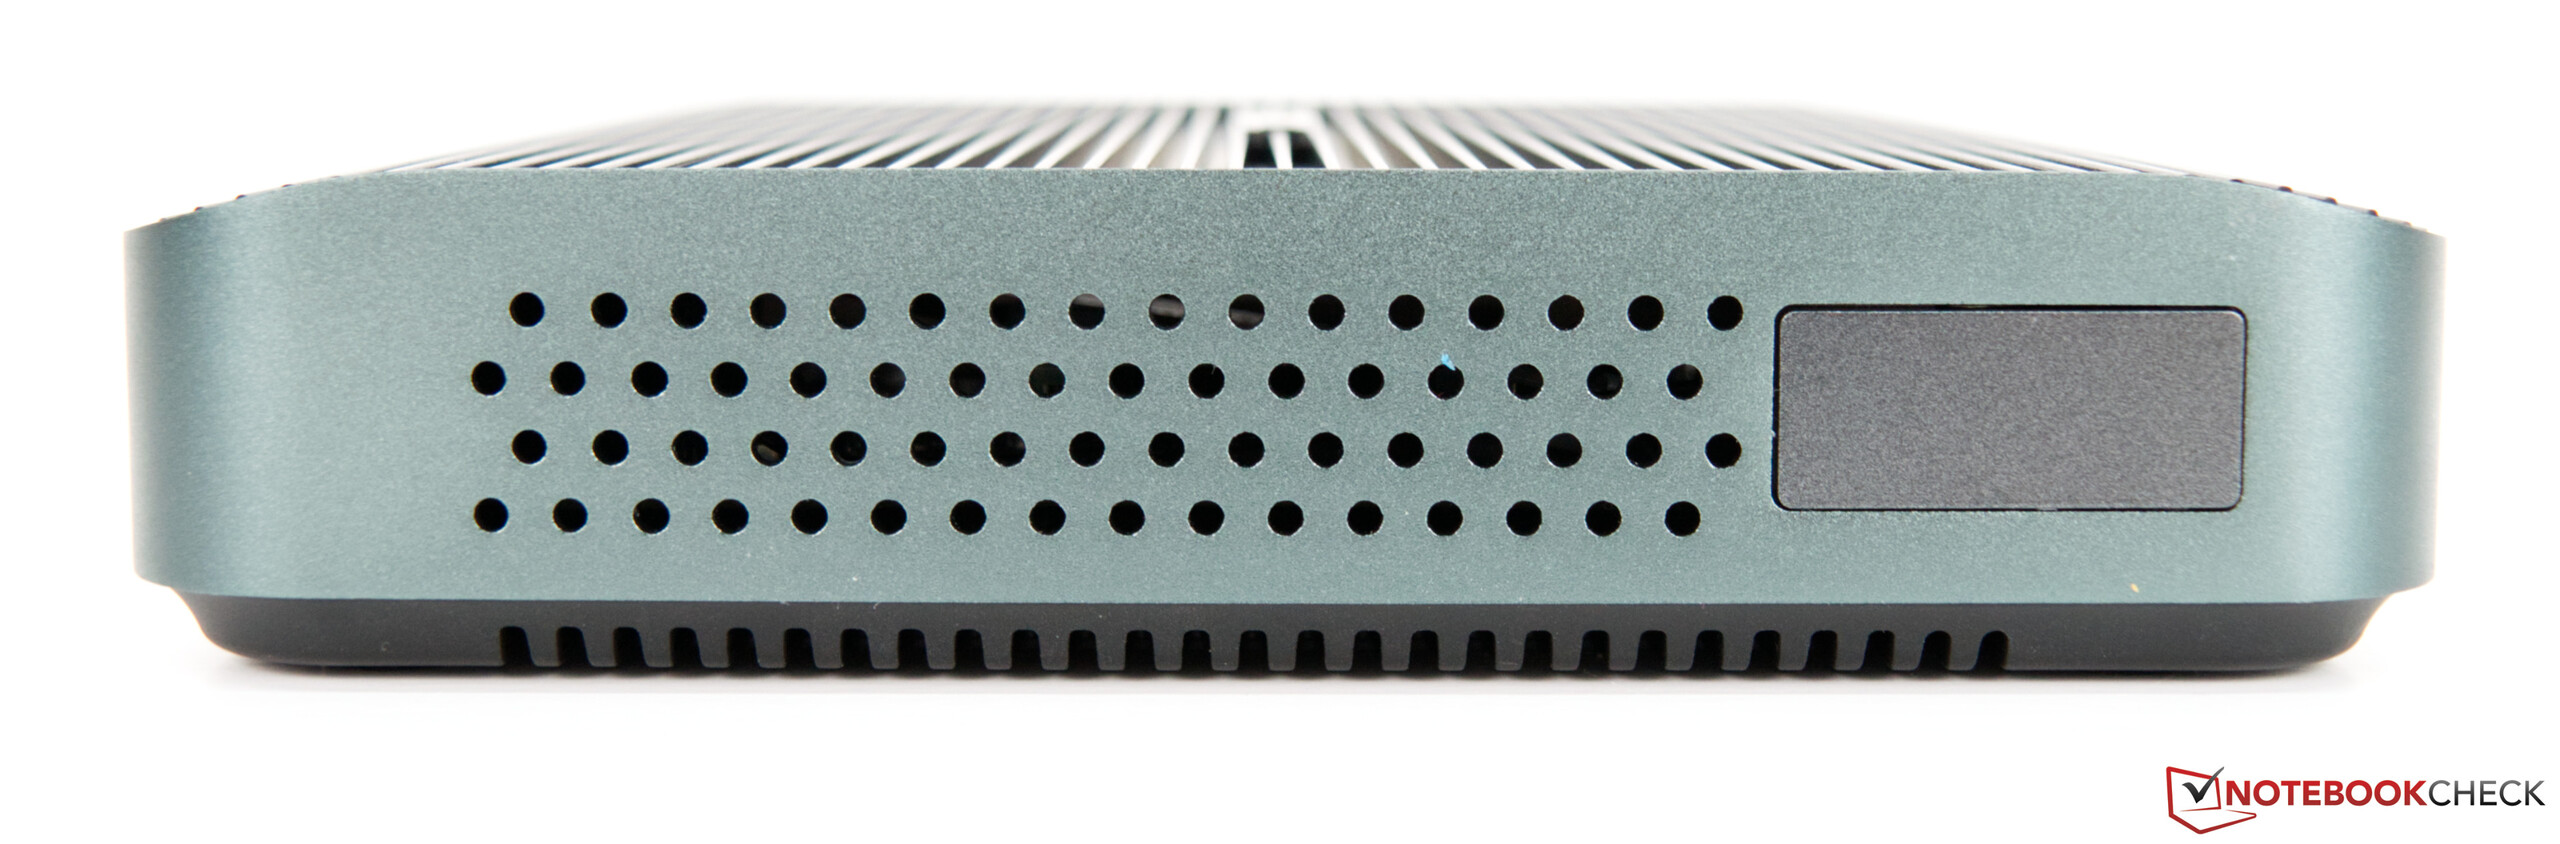
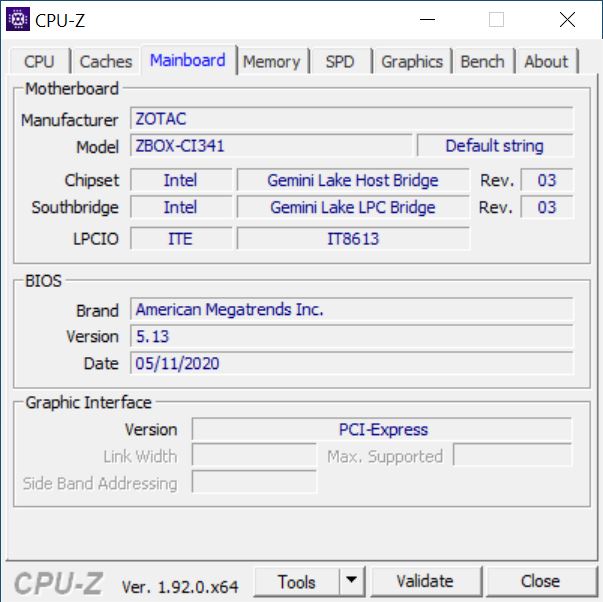
Beim Gehäuse der Zotac ZBOX edge kommt überwiegend Kunststoff und Aluminium zum Einsatz. Optisch und auch haptisch hinterlässt das Gerät einen hochwertigen Eindruck. Wer das Barebone komplettieren möchte, muss die Unterseite demontieren, was eine Leichtigkeit ist. RAM und SSD sind schnell eingebaut und das Gerät ist nach der Installation des Betriebssystems einsatzbereit.
Leistung - Für den Alltag ausreichend
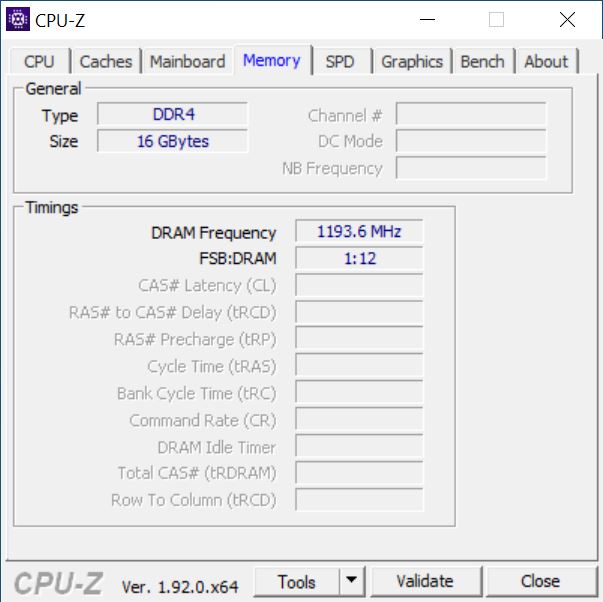
Bei der Zotac ZBOX edge handelt es sich um ein sehr sparendes Office-System. Der Intel Celeron N4100 ist mit einer TDP von nur 6 Watt spezifiziert und kommt somit ohne eine aktive Kühleinheit aus. Das Quad-Core-SoC reicht für einfache Office-Aufgaben. Für den Test haben wir den Mini-PC mit 16 GB Arbeitsspeicher und einer 256 GB großen SSD bestückt. Zu beachten gibt es jedoch, dass nur SATA-SSDs unterstützt werden. Schnellere NVMe-SSDs können leider nicht verwendet werden.
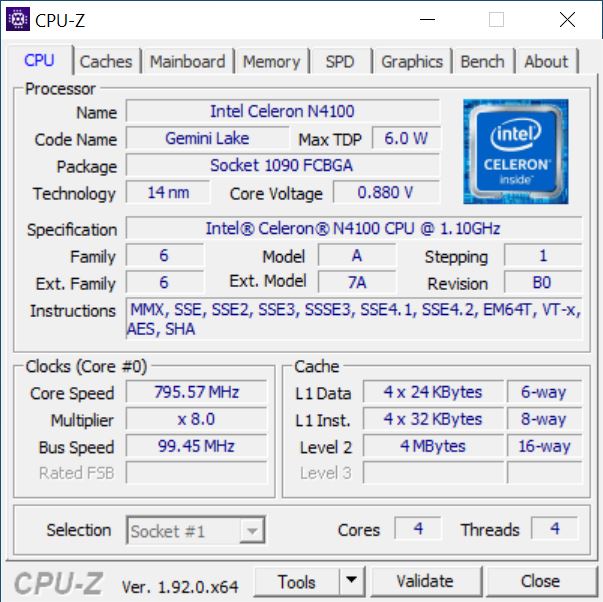
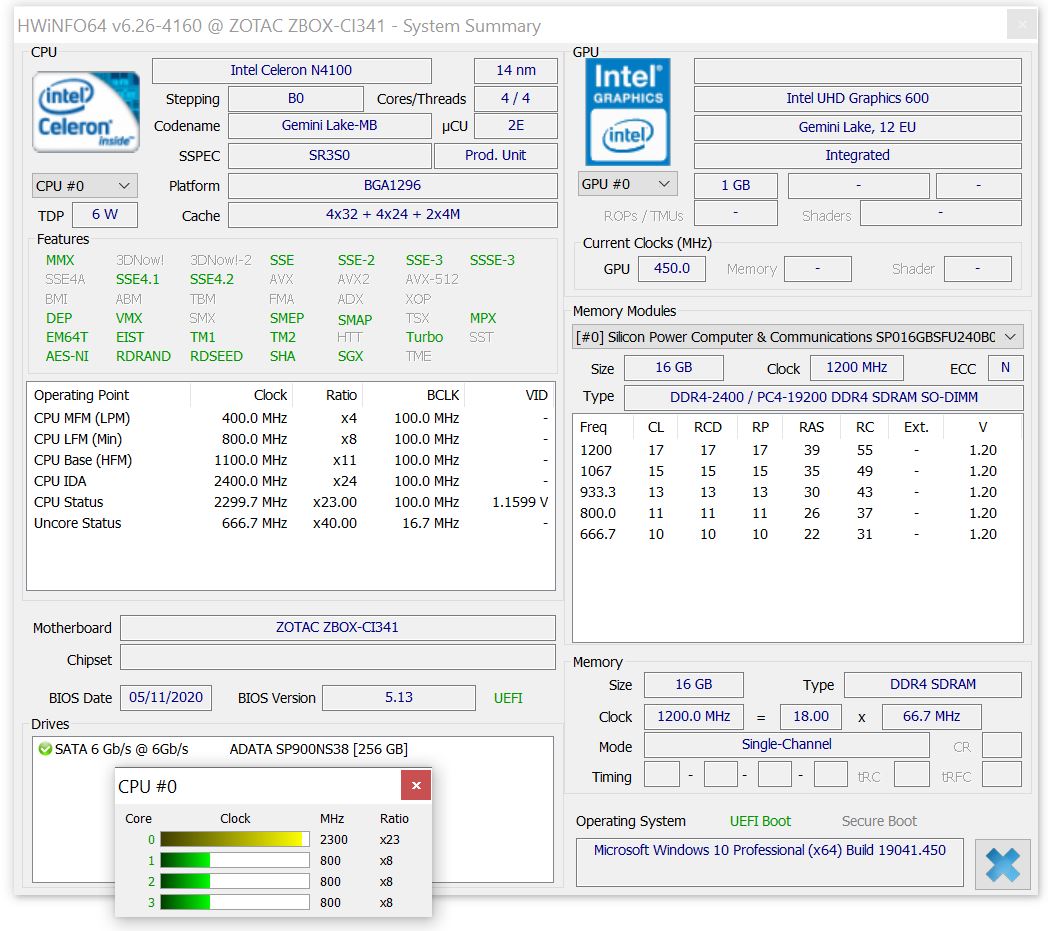
Prozessor
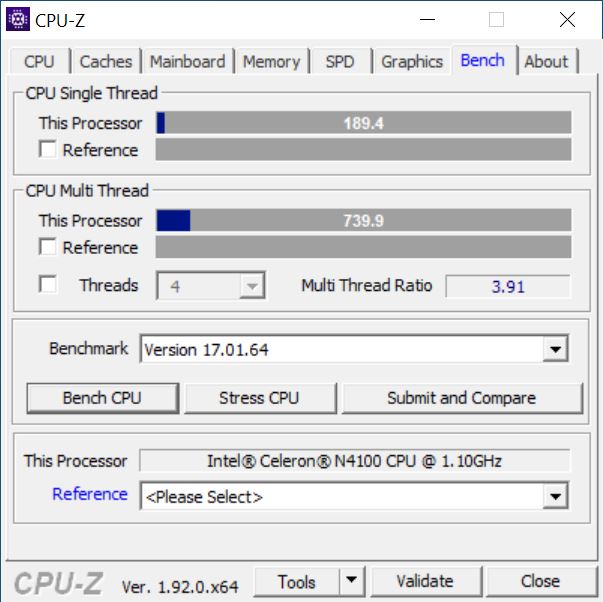
Als Prozessor dient ein mobiles SoC mit 4 Atom-basierten Kernen und 4 Threads. Damit ist der kleine PC für Multi-Thread-Anwendungen für den täglichen Office-Einsatz bestens geeignet. Der Basistakt des Intel Celeron N4100 beträgt 1,1 GHz und erreicht im Turbo bis zu 2,4 GHz.
Im Test konnte das sparsame SoC eine ausreichende Leistung erzielen und ein besseres Durchschnittsergebnis erreichen. Im Vergleich zu den leistungsstärkeren Core i5 SoCs muss sich unser Testsample aber deutlich geschlagen geben. Aufgrund der geringen TDP von nur 6 Watt kann das SoC nicht mehr Leistung bereitstellen. Eine höhere Leistungsaufnahme des Intel Celeron N4100 konnten wir unter Last haben bei unserem Testgerät nicht feststellen.
* ... kleinere Werte sind besser
Cinebench-R15-Multi-Schleife
Beim Lasttest mit der Cinebench-R15-Multi-Schleife zeigt sich, dass das Kühlsystem mit der geringen TDP des 6 Kerners kein Problem hat. Das erste Ergebnis zeigt hier den Durchlauf mit der bestmöglichen Nutzung des Turbos, welcher aber nur kurzzeitig anliegt. Nach dem ersten Durchlauf pendelt sich das Ergebnis auf einem stabilen Niveau ein.
System Performance
Die synthetischen Benchmarks absolviert der kleine Mini-PC von Zotac gut. Allerdings variiert die Performance aufgrund der verbauten Komponenten, sodass hier unter Umständen mit RAM der im Dual-Channel-Modus arbeitet bessere Ergebnisse erwartet werden können. Das subjektive Empfinden spiegelt sich im Testergebnis wider. So sollten die Anwender der ZBOX edge nicht zu viel zumuten, da es sonst zu kurzen Wartezeiten kommen kann.
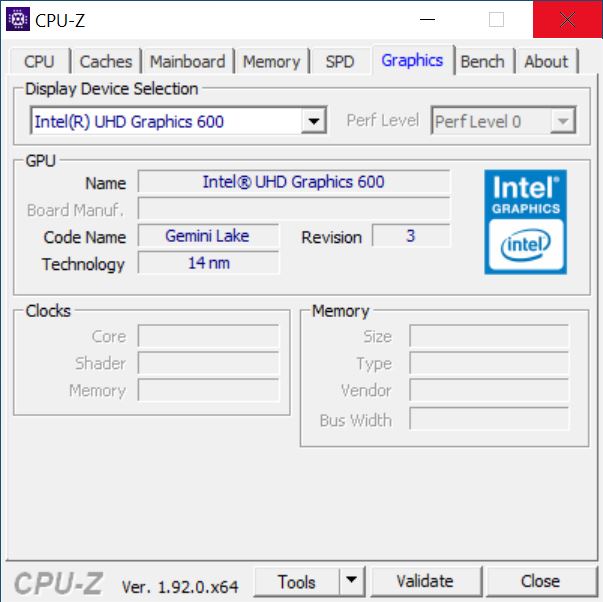
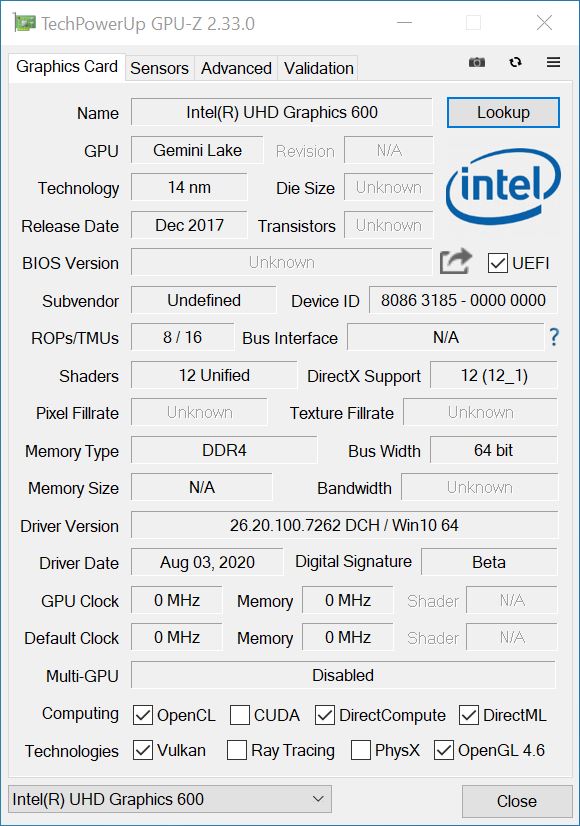
Grafikkarte
Von einer reinen Grafikkarte kann man nicht reden. Vielmehr handelt es sich hierbei um eine iGPU welche auf den Namen Intel UHD Graphics 600 hört. 4K-Displays lassen sich über die beiden externen Schnittstellen mit 60 Hz ansteuern, was für den Büroeinsatz ausreichend ist. Die 3D-Performace ist allerdings nicht wirklich vorhanden, was sich auch in den durchgeführten Benchmarks zeigt. Für 3D-Spiele ist das System also nicht geeignet. Das ein oder andere Causal- oder Browser-Game sollte aber auch mit der ZBOX edge machbar sein.
| 3DMark 11 Performance | 673 Punkte | |
Hilfe | ||
| min. | mittel | hoch | max. | QHD | |
|---|---|---|---|---|---|
| Dota 2 Reborn (2015) | 40.2 | 17.4 | 7.3 | 6.9 | |
| Final Fantasy XV Benchmark (2018) | 4.52 | 2.16 | 1.55 | 1.12 | |
| X-Plane 11.11 (2018) | 6.47 | 4.88 | 4.44 | ||
| Strange Brigade (2018) | 9.5 | 6.1 | 5.8 | 3.6 |
Emissionen & Energie
Temperatur
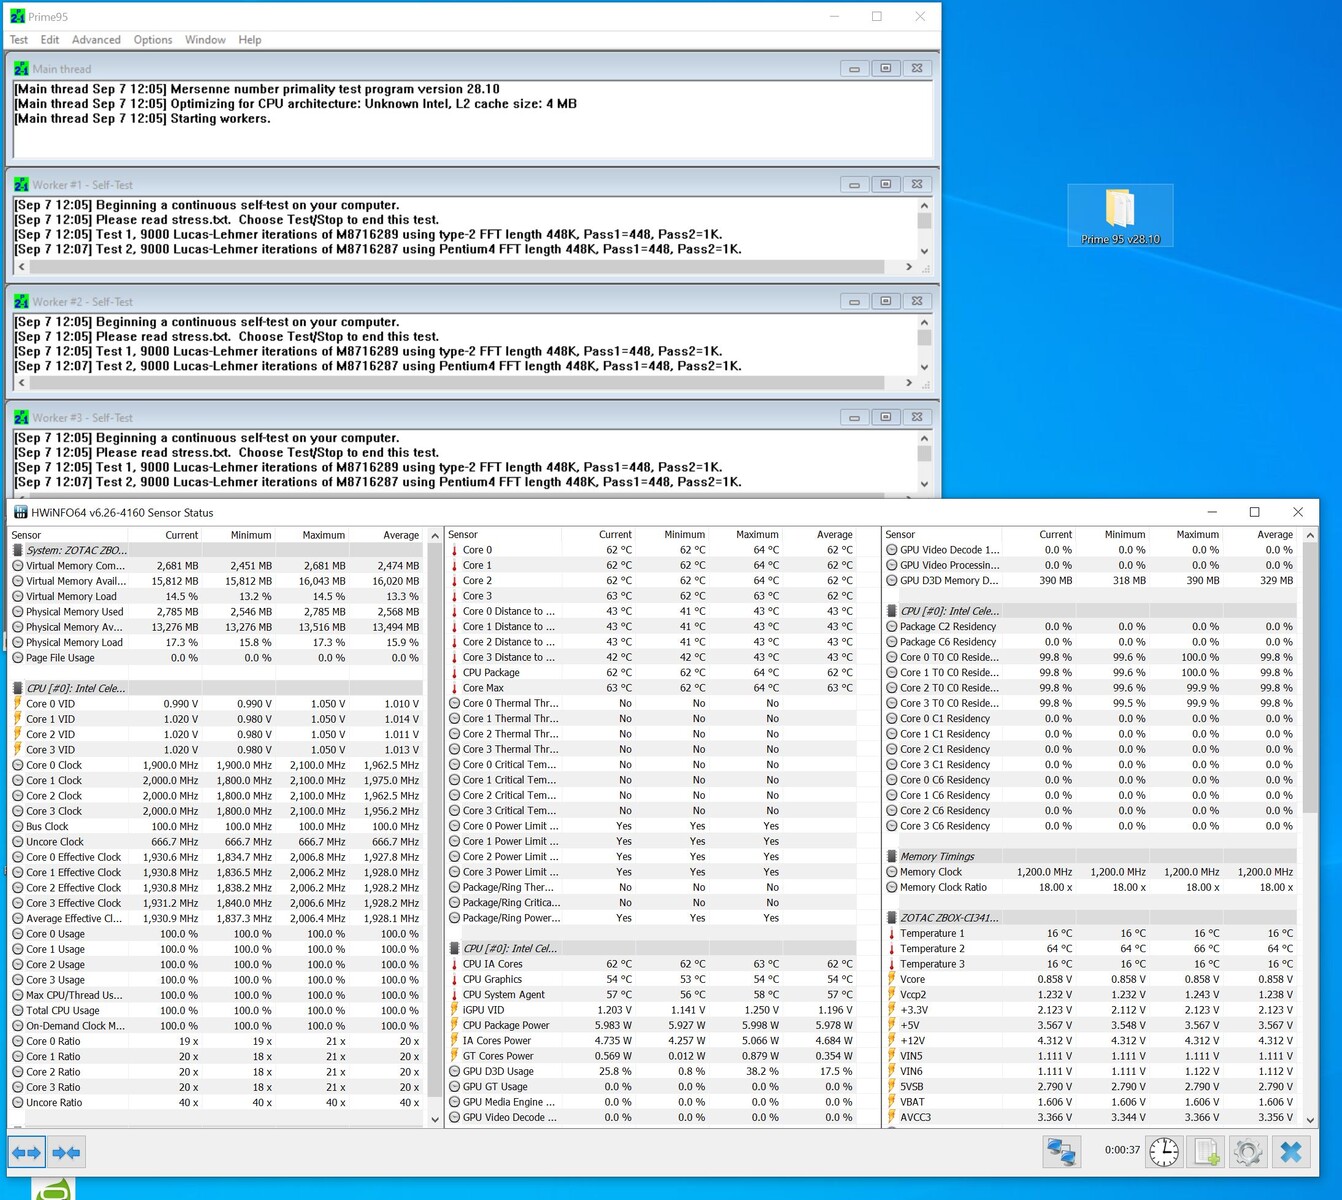
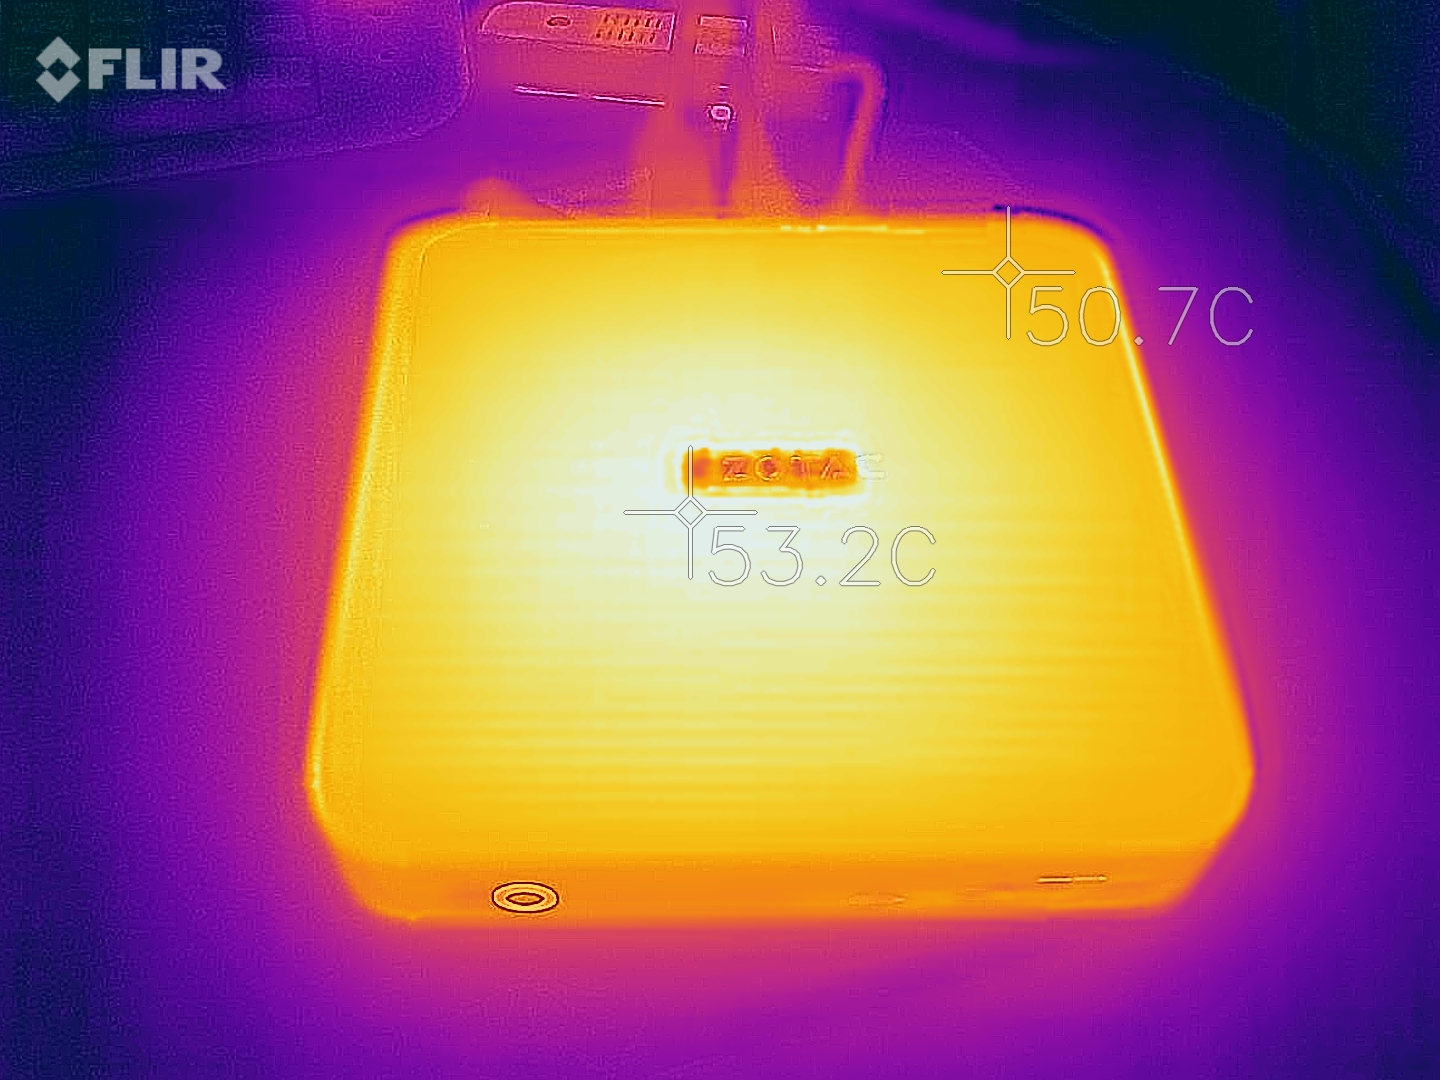
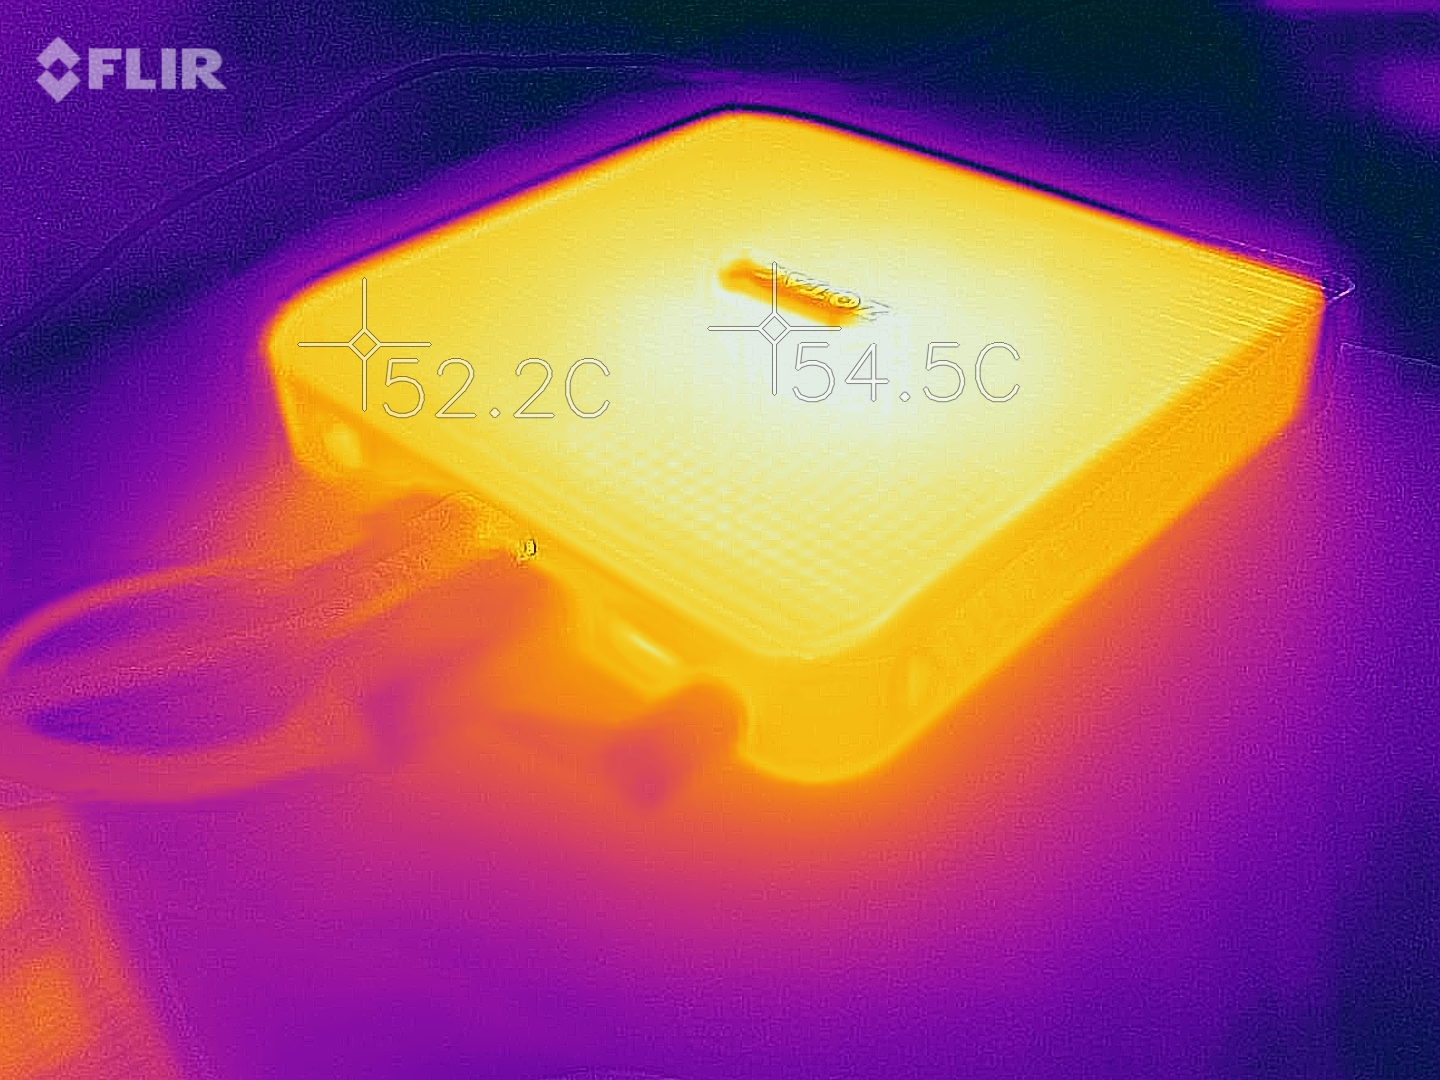
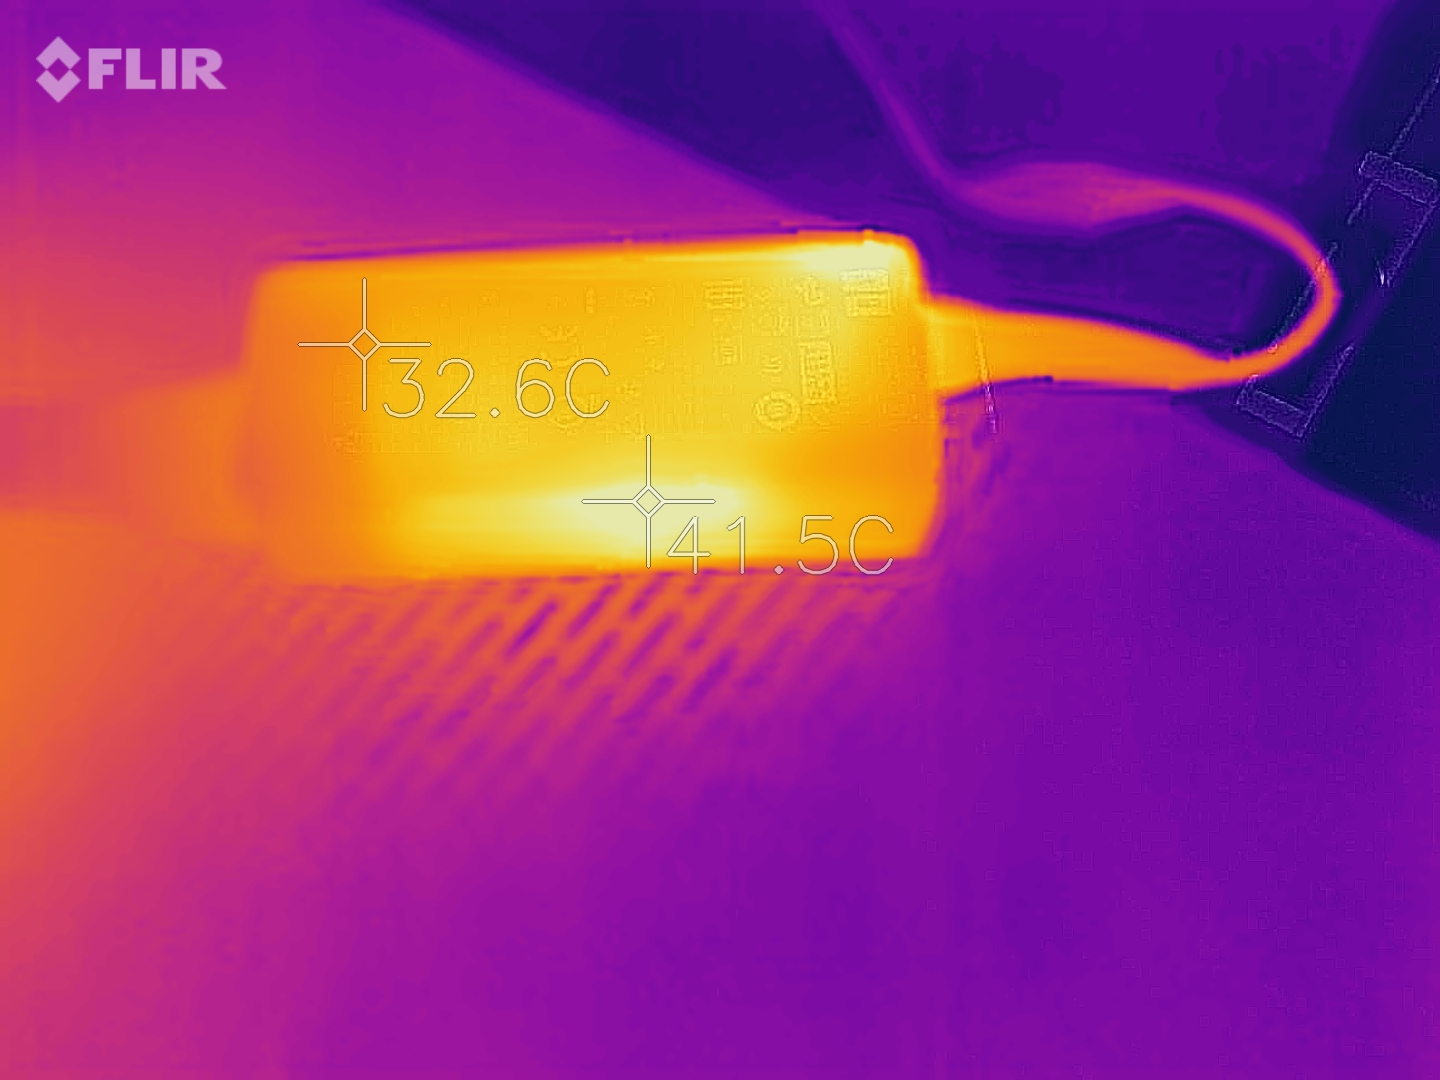
Die Temperaturen der Zotac ZBOX edge sind auch unter Last immer im unkritischen Bereich. Die Oberfläche des Gehäuses erwärm sich aufgrund der passiven Kühlung etwas mehr als gewöhnlich, ist mit gut 54 °C aber noch vertretbar. Beim SoC notieren wir beim Lasttest eine Temperatur von 64 °C, was auch ein normaler Wert ist. Beim Netzteil haben wir unter Belastung mit 41 °C ebenfalls einen guten Wert messen können.
Geräuschemissionen
Emissionen durch aktive Kühlkomponenten gibt es bei der ZBOX edge von Zotac nicht. Das macht einen lautlosen Einsatz im Büro möglich. Auch unter Last beim Stresstest oder beim Datenzugriff auf die verbaute SSD haben wir keine elektronischen Geräusche oder Spulenfiepen feststellen können.
Energieaufnahme
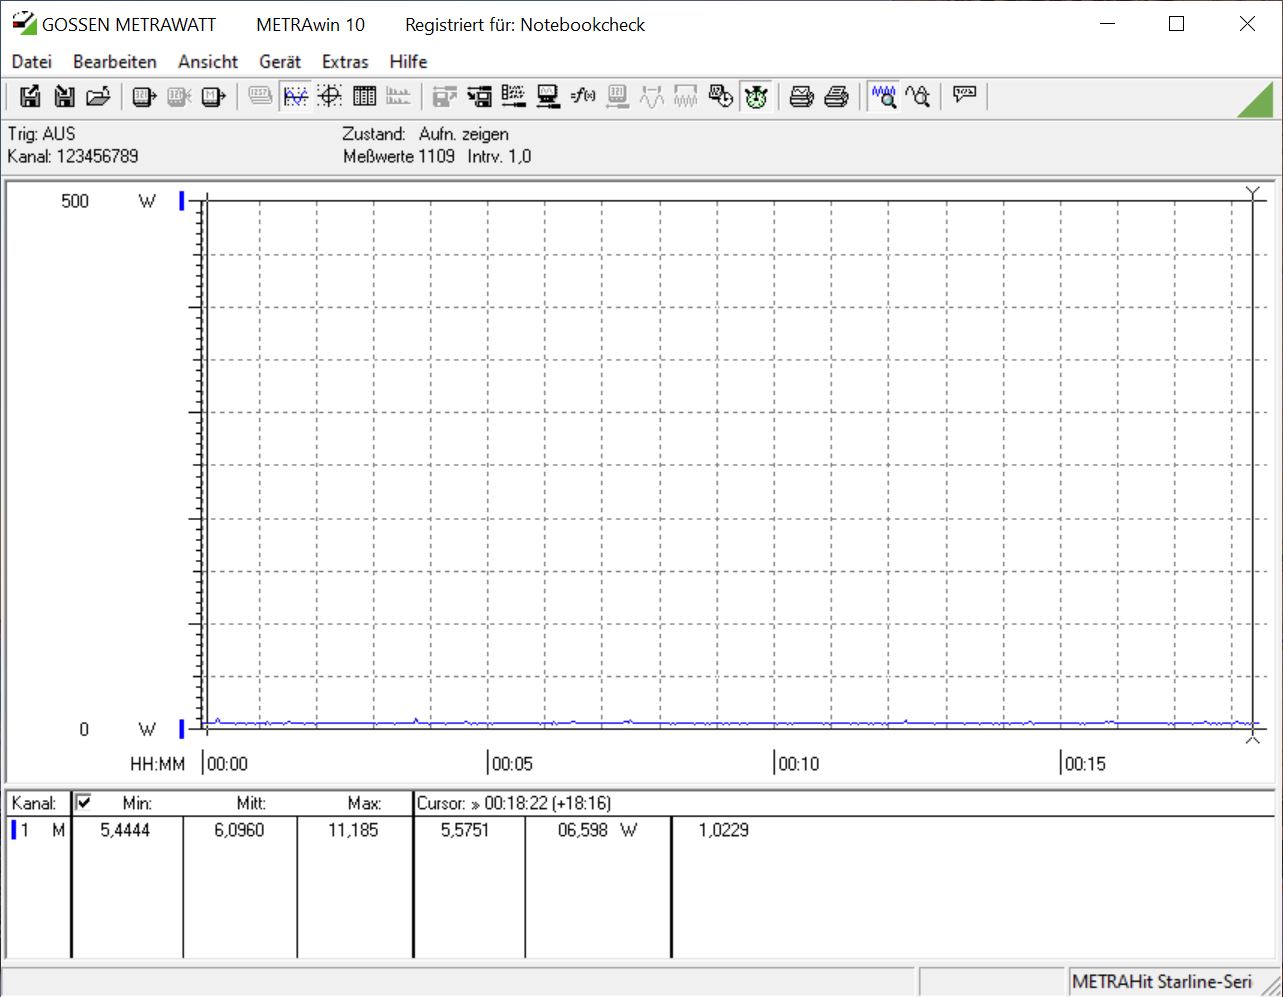
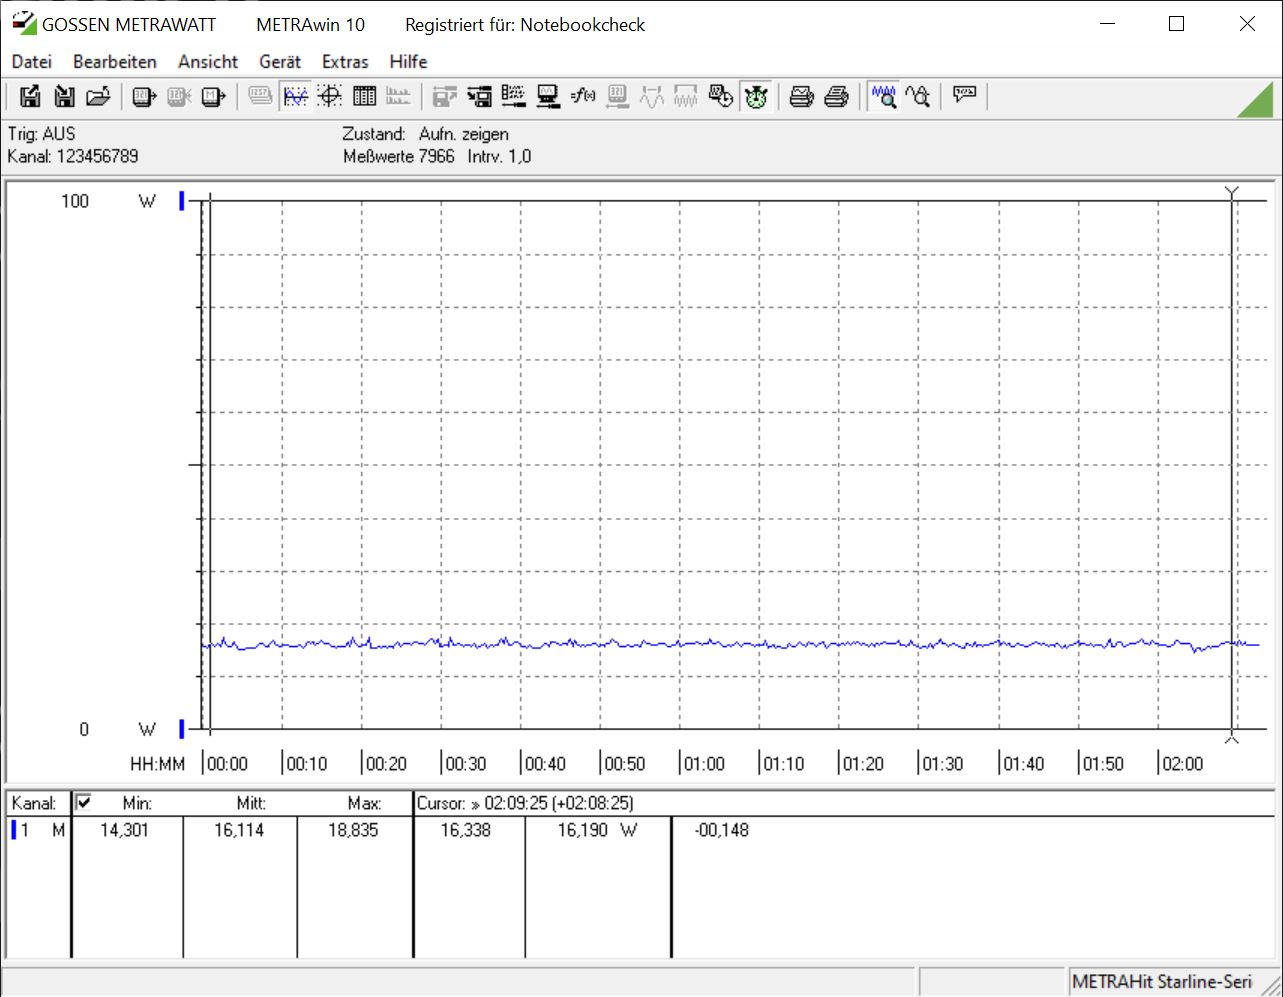
Beim Energiebedarf kann Zotac mit der ZBOX edge ordentlich punkten, denn das sehr sparsame SoC benötigt nur maximal 6 Watt unter Last. Sicherlich benötigen auch die restlichen Komponenten etwas Energie, sodass wir beim Stresstest durchschnittlich 16 Watt dokumentierten. Im Leerlauf begnügt sich das kompakte System mit durchschnittlich 6 Watt. Das mitgelieferte 40-Watt-Netzteil ist somit völlig ausreichend.
Pro
Contra
Fazit - Ein sparsamer Office-PC
Der Zotac ZBOX edge Mini-PC ist ein durchaus interessantes Gerät, wenn es um lautloses und sehr sparsames Arbeiten geht. Der Intel Celeron N4100 gehört zur Gemini-Lake-Familie und konnte im Test eine solide Leistung abliefern, die über dem Durchschnitt unser bereits dokumentierten Benchmark-Werte liegt. Für die alltäglichen Arbeiten im Büro ist der sparsame 4-Kerner aber ausreichend, wenn man ihn nicht mit zu vielen Aufgaben gleichzeitig füttert.
Mit der ZBOX edge bietet Zotac ein sehr preiswertes und dennoch ein hochwertig verarbeitetes Barebone-System für den Office-Betrieb an.
Wer sich das System nun kaufen möchte, muss aber bedenken, dass es sich um ein Barebone-System handelt. Hier muss also noch Arbeitsspeicher, ein Massenspeicher, sowie das Betriebssystem installiert werden. Somit relativiert sich der günstige Kaufpreis, welcher beim rund 200 Euro liegt, etwas. Bei dem Massenspeicher gibt es allerdings die Besonderheit, dass nur SATA-SSDs unterstützt werden.
Die Optik ist schlicht und bei der Verarbeitungsqualität gibt es keine Mängel. Die vorhandenen Anschlüsse bieten eine solide Basis, wenngleich wir einen dritten USB-TypA-Anschluss als Sinnvoll erachtet hätten. Die Möglichkeit zwei Displays anzuschließen ist gut, wie auch der vorhandene SD-Kartenleser.
