Notebookcheck Logo

Intel Atom E3805 vs Intel Core i7-7700K

Intel Atom E3805

► remove from comparison Intel E3805

Der Intel Atom E3805 ist ein sparsamer low-end Dual-Core-SoC für eingebettete Systeme. Mögliche Einsatzgebiete sind unter anderem PKWs und Nutzfahrzeuge, Industrieanlagen, Netzwerkanwendungen oder militärische Systeme. Er taktet mit 1,33 GHz und gehört der Bay-Trail-Plattform an. Dank eines speziell für Low-Power-Chips optimierten 22-Nanometer-Prozesses (P1271) mit Tri-Gate-Transistoren konnte die Performance sowie die Energieeffizienz gegenüber früheren Atom-Prozessoren deutlich gesteigert werden.

Im Gegensatz zu den meisten anderen Modellen der E3800er-Serie integriert der E3805 keine Grafikeinheit und verfügt deshalb über eine besonders niedrigen Leistungsaufnahme.
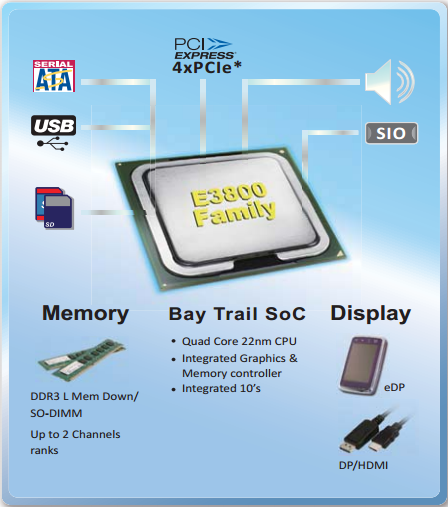
Architektur

Die Prozessorkerne basieren auf der Silvermont-Architektur, welche erstmals bei einem Atom-Prozessor als out-of-order-Design ausgeführt wurde. Die dadurch erhöhte Auslastung der Pipeline sowie viele weitere Detailverbesserungen (optimierte Sprungvorhersage, vergrößerte Buffer, verbesserte Decoder) steigern die Pro-MHz-Leistung um etwa 50 Prozent. Gleichzeitig entfällt allerdings das Hyper-Threading-Feature der Vorgängermodelle. Weitere wichtige Änderungen umfassen die Unterstützung neuer Befehlssatzerweiterungen wie SSE 4.1 und 4.2 sowie AES-NI (modellabhängig).

Performance

Dank der verbesserten Mikroarchitektur übertrifft die Performance trotz der niedrigen Taktrate viele ältere Atom-Modelle und ist in etwa mit AMDs C-50 APU vergleichbar. Für einfache Anwendungen und Steuerungs-Aufgaben bestehen ausreichende Leistungsreserven, nicht jedoch für anspruchsvollere Software.

Leistungsaufnahme

Der gesamte SoC wird von Intel mit einer TDP von 3 Watt spezifiziert, sodass der Chip auch in sehr kompakten Geräten eingesetzt werden kann und keiner aktiven Kühlung bedarf.

Intel Core i7-7700K

► remove from comparison Intel i7-7700K

Der Intel Core i7-7700K ist ein High-End Quad-Core Desktop-Prozessor auf Basis der Kaby-Lake-Architektur, der im August 2015 vorgestellt wurde. Die in einem verbesserten 14-Nanometer-Prozess gefertigte CPU taktet mit 4,2 bis 4,5 GHz und kann dank Hyper-Threading bis zu 8 Threads parallel bearbeiten. Als sogenanntes "K"-Modell verfügt der Core i7-7700K über einen freien Multiplikator und lässt sich so besonders einfach übertakten.

Performance

Dank 200 (Basis) bzw 300 MHz (Boost) höherer Taktfrequenz, kann sich der i7-7700K einige Prozent vor dem alten Core i7-6700K (4 - 4,2 GHz) und auch dem i7-4790K positionieren. Die Leistung pro Takt ist jedoch identisch zum Skylake Modell. Auch anspruchsvollste Programme und Spiele werden von der High-End-CPU problemlos bewältigt.

Grafikeinheit

Für Grafikberechnungen zeigt sich die im Prozessor integrierte Intel HD Graphics 630 mit 24 EUs (Execution Units) verantwortlich, die mit 350 - 1150 MHz taktet. Die Leistung ist vergleichbar mit der alten Intel HD Graphics 530 und siedelt sich daher im absoluten Low-End-Bereich an, sodass aktuelle Spiele allenfalls in niedrigen Einstellungen flüssig dargestellt werden.

Leistungsaufnahme

Der TDP ist weiterhin bei 91 Watt festgelegt, Intel spricht jedoch von einer leicht verbesserten Effizienz bei Kaby Lake.


ModelIntel Atom E3805Intel Core i7-7700K
SeriesIntel AtomIntel Kaby Lake
CodenameBay TrailKaby Lake
Serie: Kaby Lake Kaby Lake
Intel Atom E3845 compare1.91 GHz4 / 4 cores
Intel Atom E3827 compare1.75 GHz2 / 2 cores
Intel Atom E3826 compare1.46 GHz2 / 2 cores
Intel Atom E3825 compare1.33 GHz2 / 2 cores
Intel Atom E3805 « 1.33 GHz2 / 2 cores
Intel Atom E3815 compare1.46 GHz1 / 1 cores
Intel Core i7-7700K « 4.2 - 4.5 GHz4 / 8 cores8 MB L3
Intel Core i7-7700 compare3.6 - 4.2 GHz4 / 8 cores8 MB L3
Intel Xeon E3-1535M v6 compare3.1 - 4.2 GHz4 / 8 cores8 MB L3
Intel Core i7-7920HQ compare3.1 - 4.1 GHz4 / 8 cores8 MB L3
Intel Core i7-7700T compare2.9 - 3.8 GHz4 / 8 cores8 MB L3
Intel Core i5-7600K compare3.8 - 4.2 GHz4 / 4 cores8 MB L3
Intel Xeon E3-1505M v6 compare3 - 4 GHz4 / 8 cores8 MB L3
Intel Core i7-7820HQ compare2.9 - 3.9 GHz4 / 8 cores8 MB L3
Intel Core i7-7820HK compare2.9 - 3.9 GHz4 / 8 cores8 MB L3
Intel Core i7-7700HQ compare2.8 - 3.8 GHz4 / 8 cores6 MB L3
Intel Core i5-7500 compare3.4 - 3.8 GHz4 / 4 cores6 MB L3
Intel Core i5-7440HQ compare2.8 - 3.8 GHz4 / 4 cores6 MB L3
Intel Core i7-7567U compare3.5 - 4 GHz2 / 4 cores4 MB L3
Intel Core i7-7660U compare2.5 - 4 GHz2 / 4 cores4 MB L3
Intel Core i7-7600U compare2.8 - 3.9 GHz2 / 4 cores4 MB L3
Intel Core i5-7300HQ compare2.5 - 3.5 GHz4 / 4 cores6 MB L3
Intel Core i5-7500T compare2.7 - 3.3 GHz4 / 4 cores6 MB L3
Intel Core i5-7287U compare3.3 - 3.7 GHz2 / 4 cores4 MB L3
Intel Core i7-7560U compare2.4 - 3.8 GHz2 / 4 cores4 MB L3
Intel Core i5-7267U compare3.1 - 3.5 GHz2 / 4 cores4 MB L3
Intel Core i5-7360U compare2.3 - 3.6 GHz2 / 4 cores4 MB L3
Intel Core i7-7500U compare2.7 - 3.5 GHz2 / 4 cores4 MB L3
Intel Core i5-7300U compare2.6 - 3.5 GHz2 / 4 cores3 MB L3
Intel Core i5-7260U compare2.2 - 3.4 GHz2 / 4 cores4 MB L3
Intel Core i5-7200U compare2.5 - 3.1 GHz2 / 4 cores3 MB L3
Intel Core i3-7100H compare3 GHz2 / 4 cores3 MB L3
Intel Core i3-7167U compare2.8 GHz2 / 4 cores3 MB L3
Intel Core i7-7Y75 compare1.3 - 3.6 GHz2 / 4 cores4 MB L3
Intel Core i5-7Y57 compare1.2 - 3.3 GHz2 / 4 cores4 MB L3
Intel Core i5-7Y54 compare1.2 - 3.2 GHz2 / 4 cores4 MB L3
Intel Core i3-7100U compare2.4 GHz2 / 4 cores3 MB L3
Intel Core m3-7Y32 compare1 - 3 GHz2 / 4 cores4 MB L3
Intel Pentium Gold 4415U compare2.3 GHz2 / 4 cores2 MB L3
Intel Core m3-7Y30 compare1 - 2.6 GHz2 / 4 cores4 MB L3
Intel Celeron 3965U compare2.2 GHz2 / 2 cores2 MB L3
Intel Core i3-7020U compare2.3 GHz2 / 4 cores3 MB L3
Intel Celeron 3867U compare1.8 GHz2 / 2 cores2 MB L3
Intel Celeron 3865U compare1.8 GHz2 / 2 cores2 MB L3
Intel Pentium Gold 4425Y compare1.7 GHz2 / 4 cores2 MB L3
Intel Pentium Gold 4415Y compare1.6 GHz2 / 4 cores2 MB L3
Intel Pentium Gold 4410Y compare1.5 GHz2 / 4 cores2 MB L3
Intel Celeron 3965Y compare1.5 GHz2 / 2 cores2 MB L3
Clock1330 MHz4200 - 4500 MHz
L1 Cache112 KB256 KB
L2 Cache1 MB1 MB
Cores / Threads2 / 24 / 8
TDP3 Watt91 Watt
Technology22 nm14 nm
max. Temp.-40 °C - 110 °C
SocketFCBGA1170FCLGA1151
FeaturesSingle-Channel DDR3L-1067 (max. 8 GB, optional ECC), AES-NI, 4x PCIe 2.0DDR3(L)-1600/DDR4-2400 Memory Controller, HyperThreading, AVX, AVX2, AES-NI, TSX-NI, Quick Sync, Virtualization, vPro
Architecturex86x86
$31 U.S.$339 U.S.
Announced
Manufacturerark.intel.com
L3 Cache8 MB
iGPUIntel HD Graphics 630 (350 - 1150 MHz)

Benchmarks

Cinebench R20 - Cinebench R20 CPU (Single Core)
465 Points (52%)
Cinebench R20 - Cinebench R20 CPU (Multi Core)
2200 Points (5%)
Cinebench R15 - Cinebench R15 CPU Multi 64 Bit
min: 897     avg: 940     median: 938.5 (6%)     max: 984 Points
Cinebench R15 - Cinebench R15 CPU Single 64 Bit
min: 190     avg: 192.3     median: 192.5 (58%)     max: 194 Points
Cinebench R11.5 - Cinebench R11.5 CPU Multi 64 Bit
min: 9.78     avg: 10.4     median: 10.4 (13%)     max: 10.91 Points
Cinebench R11.5 - Cinebench R11.5 CPU Single 64 Bit
min: 2.18     avg: 2.2     median: 2.2 (54%)     max: 2.2 Points
Cinebench R10 - Cinebench R10 Rend. Single (32bit)
min: 7222     avg: 7305     median: 7304.5 (44%)     max: 7387 Points
Cinebench R10 - Cinebench R10 Rend. Multi (32bit)
min: 28189     avg: 28903     median: 28903 (21%)     max: 29617 Points
wPrime 2.10 - wPrime 2.0 1024m *
min: 169.8     avg: 173.1     median: 173.1 (2%)     max: 176.3 s
wPrime 2.10 - wPrime 2.0 32m *
min: 5.5     avg: 5.6     median: 5.6 (1%)     max: 5.615 s
WinRAR - WinRAR 4.0
5823 Points (9%)
X264 HD Benchmark 4.0 - x264 Pass 2
61.6 fps (22%)
X264 HD Benchmark 4.0 - x264 Pass 1
230 fps (53%)
TrueCrypt - TrueCrypt Serpent
min: 0.54     avg: 0.5     median: 0.5 (0%)     max: 0.554 GB/s
TrueCrypt - TrueCrypt Twofish
min: 0.919     avg: 0.9     median: 0.9 (16%)     max: 0.939 GB/s
TrueCrypt - TrueCrypt AES
min: 5.4     avg: 5.5     median: 5.5 (14%)     max: 5.5 GB/s
3DMark 06 - CPU - 3DMark 06 - CPU
10156 Points (22%)
Super Pi mod 1.5 XS 1M - Super Pi mod 1.5 XS 1M *
min: 8.11     avg: 8.2     median: 8.2 (2%)     max: 8.22 s
Super Pi mod 1.5 XS 2M - Super Pi mod 1.5 XS 2M *
min: 18.3     avg: 18.4     median: 18.4 (1%)     max: 18.41 s
Super Pi Mod 1.5 XS 32M - Super Pi mod 1.5 XS 32M *
440 s (2%)
3DMark 11 - 3DM11 Performance Physics
min: 9975     avg: 11450     median: 11813 (32%)     max: 12026 Points
3DMark - 3DMark Ice Storm Physics
min: 64424     avg: 65351     median: 65408 (53%)     max: 66220 Points
3DMark - 3DMark Ice Storm Extreme Physics
66177 Points (54%)
3DMark - 3DMark Ice Storm Unlimited Physics
67714 Points (57%)
3DMark - 3DMark Cloud Gate Physics
min: 9230     avg: 9587     median: 9558 (24%)     max: 9974 Points
3DMark - 3DMark Fire Strike Standard Physics
min: 13137     avg: 13702     median: 13672.5 (24%)     max: 14325 Points
3DMark - 3DMark Time Spy CPU
min: 5276     avg: 5383     median: 5383 (23%)     max: 5490 Points
Geekbench 4.0 - Geekbench 4.0 64 Bit Single-Core
5480 Points (75%)
Geekbench 4.0 - Geekbench 4.0 64 Bit Multi-Core
17800 Points (43%)
Geekbench 3 - Geekbench 3 64 Bit Multi-Core
18800 Points (29%)
Geekbench 3 - Geekbench 3 64 Bit Single-Core
4700 Points (70%)
Geekbench 2 - 32 Bit - Geekbench Stream
12169 Points (98%)
Geekbench 2 - 32 Bit - Geekbench Memory
10472 Points (95%)
Geekbench 2 - 32 Bit - Geekbench Floating Point
17576 Points (34%)
Geekbench 2 - 32 Bit - Geekbench Integer
17183 Points (35%)
Geekbench 2 - 32 Bit - Geekbench Total Score
15476 Points (40%)
Mozilla Kraken 1.1 - Kraken 1.1 Total Score *
769 ms (1%)
Sunspider - Sunspider 1.0 Total Score *
52 ms (1%)
Power Consumption - Prime95 Power Consumption - external Monitor *
145 Watt (25%)
Power Consumption - Cinebench R15 Multi Power Consumption - external Monitor *
127 Watt (23%)
Power Consumption - Cinebench R15 Multi Power Efficiency - external Monitor
7.8 Points per Watt (6%)

Average Benchmarks Intel Core i7-7700K → 0% n=

- Bereich der Benchmarkergebnisse für diese Grafikkarte
- Durchschnittliche Benchmarkergebnisse für diese Grafikkarte
* Smaller numbers mean a higher performance
1 This benchmark is not used for the average calculation

Add one or more devices and compare

In the following list you can select (and also search for) devices that should be added to the comparison. You can select more than one device.

restrict list:

show all (including archived), 2024, 2023
v1.26
log 02. 08:46:12

#0 checking url part for id 6455 +0s ... 0s

#1 checking url part for id 8421 +0s ... 0s

#2 not redirecting to Ajax server +0s ... 0s

#3 did not recreate cache, as it is less than 5 days old! Created at Sat, 01 Jun 2024 05:37:57 +0200 +0.001s ... 0.001s

#4 composed specs +0.03s ... 0.031s

#5 did output specs +0s ... 0.031s

#6 getting avg benchmarks for device 6455 +0.003s ... 0.035s

#7 got single benchmarks 6455 +0s ... 0.035s

#8 getting avg benchmarks for device 8421 +0.003s ... 0.038s

#9 got single benchmarks 8421 +0.021s ... 0.06s

#10 got avg benchmarks for devices +0s ... 0.06s

#11 min, max, avg, median took s +0.168s ... 0.228s

#12 return log +0.035s ... 0.263s

Teilen Sie diesen Artikel, um uns zu unterstützen. Jeder Link hilft!
> Notebook Test, Laptop Test und News > Benchmarks / Technik > Benchmarks / Technik > Prozessor Vergleich - Head 2 Head
Autor: Klaus Hinum,  8.09.2017 (Update:  1.07.2023)