Notebookcheck Logo

Mediatek MT8766B vs Mediatek MT6739WW

Mediatek MT8766B

► remove from comparison  Helio MT8766B

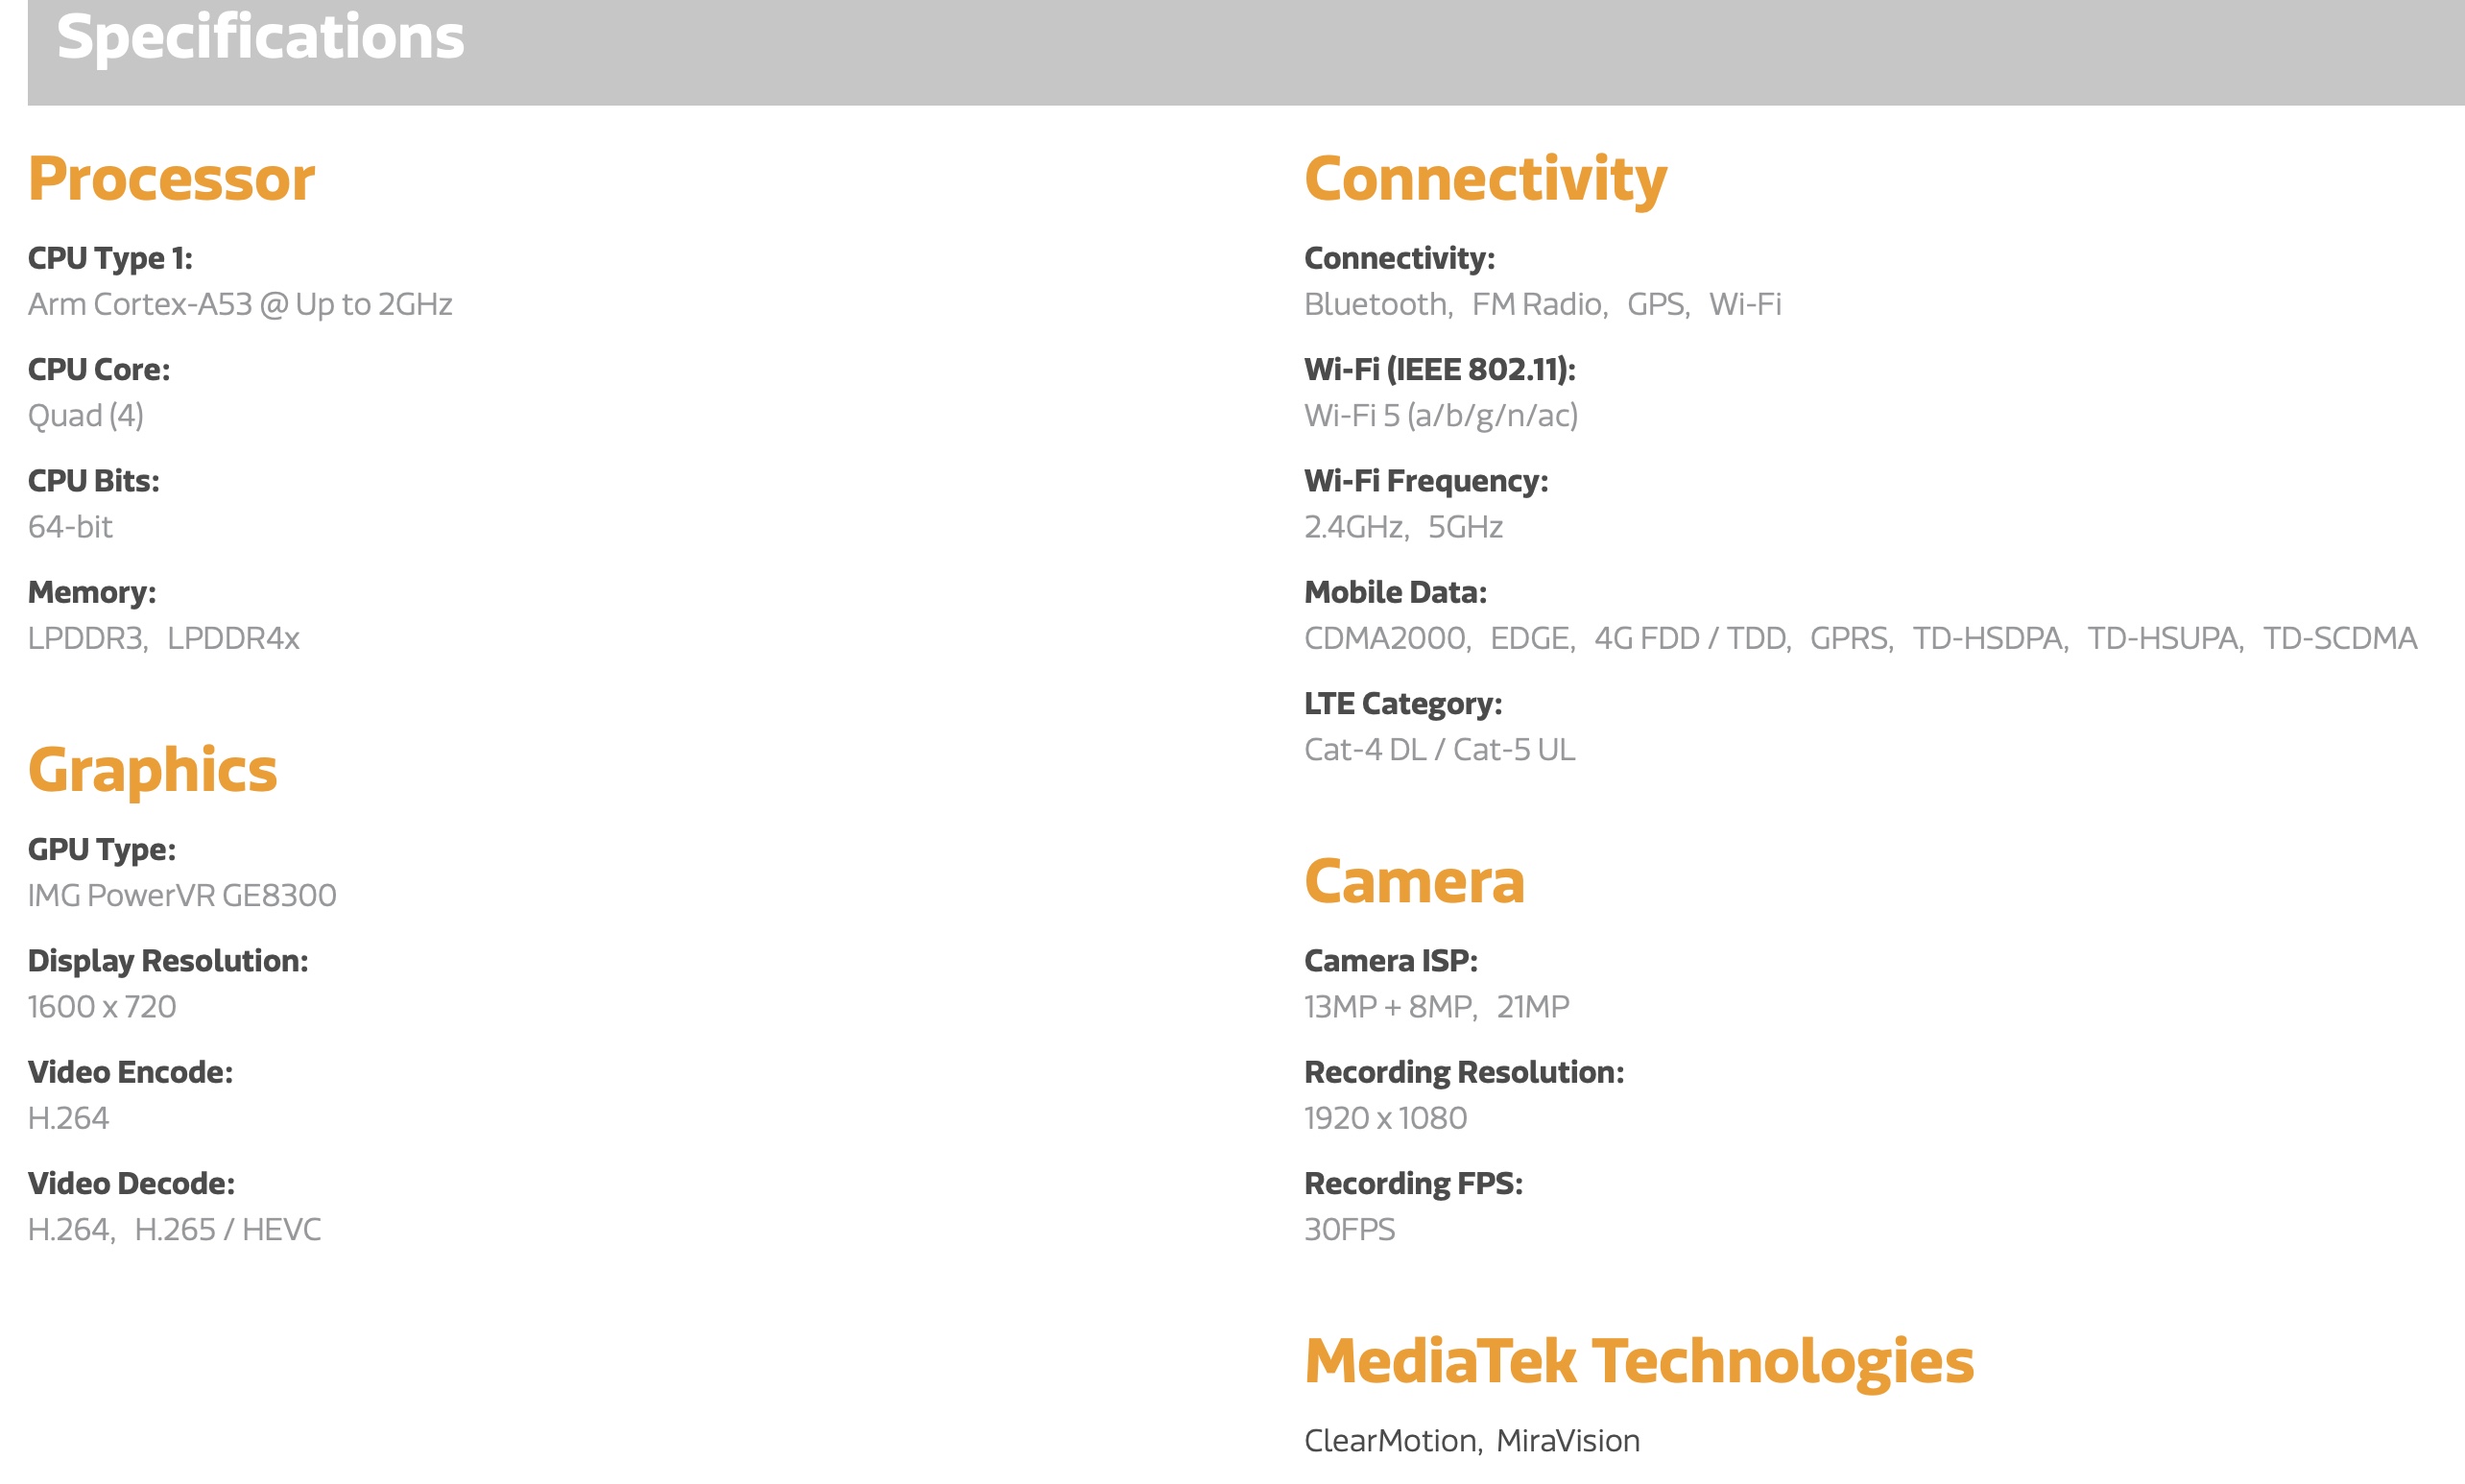
Der MediaTek MT8766B Helio A20 ist eine ARM-SoC für günstige Android-Smartphones und -tablets der Einsteiger-Klasse. Das SoC besitzt 4 Cortex-A53-Kerne mit bis zu 2 GHz Takt und ähnelt daher dem Helios A20 (1.8 GHz).

Als Grafikchip kommt ein PowerVR GE8300 zum Einsatz (max. 1600x720 Pixel), der Speichercontroller unterstützt LPDDR3/LPDDR4X.

Das integrierte LTE-Modem unterstützt 4G mit bis zu 150 Mbps Download (Cat-4) und 75 Mbps Upload (Cat-5). Bluetooth 5.0 (?) und die WLAN-Standards bis Wi-Fi 5 werden unterstützt.

Das SoC wird wahrscheinlich wie der A20 im 12nm-FinFET-Herstellungsverfahrens produziert.

Mediatek MT6739WW

► remove from comparison  MT6739WW

Der Mediatek MT6739WW ist ein 2017 vorgestellter ARM-SoC (System-on-a-Chip) der Einstiegsklasse, der primär in Smartphones (hauptsächlich Android) zu finden ist. Er verfügt über vier CPU-Kerne auf Basis der 64-Bit-fähigen Cortex-A53-Architektur, die mit maximal 1,5 GHz takten. Als Grafikeinheit kommt eine PowerVR GE8100 mit maximal 570 MHz Taktrate zum Einsatz. Weiterhin integriert sind unter anderem ein LTE-Modem (Cat. 4 DL / Cat 5 UL), WLAN 802.11 a/b/g/n sowie ein Videodecoder mit Ultra-HD- und H.265-Unterstützung. Der Unterschied zum normalen Mediatek MT6739 ist nicht bekannt, die Leistung ist vergleichbar.

ModelMediatek MT8766BMediatek MT6739WW
Series Mediatek MT8 Mediatek
CodenameCortex-A53Cortex-A53
Serie: Mediatek Cortex-A53
Mediatek MT8768 compare1.5 - 2 GHz8 / 8 cores Cortex-A53
MediaTek MT8168 compare2 GHz4 / 4 cores Cortex-A53
Mediatek MT8766B « 2 GHz4 / 4 cores Cortex-A53
Mediatek Helio X10 MT6795 compare2.2 GHz8 / 8 cores Cortex-A53
Mediatek Helio P35 MT6765 compare1.8 - 2.3 GHz8 / 8 cores Cortex-A53
Mediatek Helio P22T MT8768T compare2.3 GHz8 / 8 cores Cortex-A53
Mediatek Helio P10 MT6755 compare2 GHz8 / 8 cores Cortex-A53
Mediatek MT8752 compare1.7 GHz8 / 8 cores Cortex-A53
Mediatek MT6752 compare1.7 GHz8 / 8 cores Cortex-A53
Mediatek MT6753 compare1.5 GHz8 / 8 cores Cortex-A53
Mediatek MT6750S compare1.5 GHz8 / 8 cores Cortex-A53
Mediatek MT6750N compare1.5 GHz8 / 8 cores Cortex-A53
Mediatek MT6750 compare1.5 GHz8 / 8 cores Cortex-A53
Mediatek MT6750T compare1.5 GHz8 / 8 cores Cortex-A53
Mediatek MT8732 compare1.5 GHz4 / 4 cores Cortex-A53
Mediatek MT8165 compare1.5 GHz4 / 4 cores Cortex-A53
Mediatek MT6739 compare1.5 GHz4 / 4 cores Cortex-A53
Mediatek MT6739WW « 1.5 GHz4 / 4 cores Cortex-A53
Mediatek MT6732 compare1.5 GHz4 / 4 cores Cortex-A53
Mediatek MT6735 compare1.5 GHz4 / 4 cores Cortex-A53
Mediatek MT8735 compare1.3 GHz4 / 4 cores Cortex-A53
Mediatek MT6737T compare1.5 GHz4 / 4 cores Cortex-A53
Mediatek MT6737 compare1.25 GHz4 / 4 cores Cortex-A53
Mediatek MT6735P compare1 GHz4 / 4 cores Cortex-A53
Mediatek MT6735M compare1 GHz4 / 4 cores Cortex-A53
Clock2000 MHz1500 MHz
Cores / Threads4 / 44 / 4
Technology12 nm28 nm
FeaturesPowerVR GE8300, Dual-Channel LPDDR3 / LPDDR4X, Wi-Fi 5, Bluetooth, LTE Cat-4 DL / Cat-5 UL, H.264 Encode, H.265 Decode4G LTE (Cat. 4), HSPA+, TD-SCDMA, EDGE, WLAN (2,4 + 5 GHz), Bluetooth, GPS, FM receiver, H.265 Decoder, ARM Mali-T760 MP2 GPU
iGPUPowerVR GE8300PowerVR GE8100 ( - 570 MHz)
ArchitectureARMARM
Announced
Manufacturerwww.mediatek.comwww.mediatek.com

Benchmarks

Performance Rating - Geekbench 5.5, PCM Work, Sling Shot Physics, Antutu v8 CPU - Helio MT8766B
0.2 pt (13%)
3DMark - 3DMark Ice Storm Unlimited Physics
13779 Points (12%)
10230 Points (9%)
3DMark - 3DMark Sling Shot Extreme (ES 3.1) Unlimited Physics
853 Points (10%)
655 Points (8%)
3DMark - 3DMark Sling Shot (ES 3.0) Unlimited Physics
860 Points (10%)
669 Points (8%)
Geekbench 5.5 - Geekbench 5.1 - 5.4 64 Bit Single-Core
133 Points (6%)
Geekbench 5.5 - Geekbench 5.1 - 5.4 64 Bit Multi-Core
455 Points (1%)
Geekbench 4.4 - Geekbench 4.1 - 4.4 64 Bit Single-Core
783 Points (8%)
589 Points (6%)
Geekbench 4.4 - Geekbench 4.1 - 4.4 64 Bit Multi-Core
2217 Points (2%)
1718 Points (2%)
Geekbench 4.0 - Geekbench 4.0 64 Bit Single-Core
741 Points (10%)
614 Points (8%)
Geekbench 4.0 - Geekbench 4.0 64 Bit Multi-Core
2043 Points (5%)
1681 Points (4%)
Geekbench 3 - Geekbench 3 64 Bit Multi-Core
2112 Points (3%)
1525 Points (2%)
Geekbench 3 - Geekbench 3 64 Bit Single-Core
722 Points (11%)
549 Points (8%)
Geekbench 2 - 32 Bit - Geekbench Stream
725 Points (6%)
653 Points (5%)
Geekbench 2 - 32 Bit - Geekbench Memory
1727 Points (16%)
1791 Points (16%)
Geekbench 2 - 32 Bit - Geekbench Floating Point
3305 Points (6%)
2544 Points (5%)
Geekbench 2 - 32 Bit - Geekbench Integer
1865 Points (4%)
1355 Points (3%)
Geekbench 2 - 32 Bit - Geekbench Total Score
2227 Points (6%)
1788 Points (5%)
Mozilla Kraken 1.1 - Kraken 1.1 Total Score *
11505 ms (13%)
16008 ms (19%)
Sunspider - Sunspider 1.0 Total Score *
1609 ms (18%)
Octane V2 - Octane V2 Total Score
3920 Points (4%)
3213 Points (3%)
WebXPRT 3 - WebXPRT 3 Score
27 Points (6%)
27 Points (6%)
AnTuTu v7 - AnTuTu v7 MEM
3565 Points (11%)
AnTuTu v7 - AnTuTu v7 UX
14593 Points (18%)
AnTuTu v7 - AnTuTu v7 GPU
3084 Points (1%)
AnTuTu v7 - AnTuTu v7 CPU
22448 Points (14%)
AnTuTu v7 - AnTuTu v7 Total Score
43690 Points (8%)
AnTuTu v8 - AnTuTu v8 UX
15424 Points (13%)
AnTuTu v8 - AnTuTu v8 MEM
24878 Points (20%)
AnTuTu v8 - AnTuTu v8 GPU
4722 Points (1%)
AnTuTu v8 - AnTuTu v8 CPU
30304 Points (11%)
AnTuTu v8 - AnTuTu v8 Total Score
75328 Points (7%)
PassMark PerformanceTest Mobile V1 - PerformanceTest Mobile V1 CPU Tests
49040 Points (6%)
PCMark for Android - PCM f. Android Computer Vision
2761 Points (15%)
2260 Points (12%)
PCMark for Android - PCM f. Android Storage
6844 Points (15%)
1839 Points (4%)
PCMark for Android - PCM f. Android Work Score 2.0
4808 Points (31%)
0 Points (0%)
PCMark for Android - PCM f. Android Work Score
6431 Points (32%)
4408 Points (22%)

Average Benchmarks Mediatek MT8766B → 100% n=21

Average Benchmarks Mediatek MT6739WW → 75% n=21

- Bereich der Benchmarkergebnisse für diese Grafikkarte
- Durchschnittliche Benchmarkergebnisse für diese Grafikkarte
* Smaller numbers mean a higher performance
1 This benchmark is not used for the average calculation

Add one or more devices and compare

In the following list you can select (and also search for) devices that should be added to the comparison. You can select more than one device.

restrict list:

show all (including archived), 2024, 2023
v1.26
log 02. 14:27:25

#0 checking url part for id 13125 +0s ... 0s

#1 checking url part for id 11387 +0s ... 0s

#2 not redirecting to Ajax server +0s ... 0s

#3 did not recreate cache, as it is less than 5 days old! Created at Sat, 01 Jun 2024 05:37:57 +0200 +0.001s ... 0.001s

#4 composed specs +0.018s ... 0.019s

#5 did output specs +0s ... 0.019s

#6 getting avg benchmarks for device 13125 +0.01s ... 0.029s

#7 got single benchmarks 13125 +0.011s ... 0.04s

#8 getting avg benchmarks for device 11387 +0.003s ... 0.043s

#9 got single benchmarks 11387 +0.01s ... 0.053s

#10 got avg benchmarks for devices +0s ... 0.053s

#11 No cached benchmark found, getting uncached values +0.123s ... 0.176s

#12 min, max, avg, median took s +0.003s ... 0.18s

#13 return log +0.022s ... 0.202s

Teilen Sie diesen Artikel, um uns zu unterstützen. Jeder Link hilft!
> Notebook Test, Laptop Test und News > Benchmarks / Technik > Benchmarks / Technik > Prozessor Vergleich - Head 2 Head
Autor: Klaus Hinum,  8.09.2017 (Update:  1.07.2023)