Notebookcheck Logo

Intel Core i5-7500 vs AMD Ryzen 5 7430U

Intel Core i5-7500

► remove from comparison Intel i5-7500

Der Intel Core i5-7500 ist ein Quad-Core Desktop-Prozessor der gehobenen Mittelklasse auf Basis der Kaby-Lake-Architektur, der im August 2015 vorgestellt wurde. Die in einem verbesserten 14-Nanometer-Prozess gefertigte CPU taktet mit 3,4 bis 3,8 GHz, bietet jedoch kein Hyper-Threading (daher nur 4 Threads).

Performance

Durch die relativ hohe Turbo-Taktrate positioniert sich der i5-7500 in etwa auf Höhe des mobilen Core i7-7700HQ. Auch anspruchsvollste Programme und Spiele werden von der High-End-CPU problemlos bewältigt. 

Mehr Benchmarks finden Sie auch in unserem Vergleich der AMD Ryzen 7 CPUs gegen Intel CPUs.

Grafikeinheit

Für Grafikberechnungen zeigt sich die im Prozessor integrierte Intel HD Graphics 630 mit 24 EUs (Execution Units) verantwortlich, die mit 350 - 1100 MHz taktet. Die Leistung ist vergleichbar mit der alten Intel HD Graphics 530 und siedelt sich daher im absoluten Low-End-Bereich an, sodass aktuelle Spiele allenfalls in niedrigen Einstellungen flüssig dargestellt werden.

Leistungsaufnahme

Der TDP ist mit 65 Watt festgelegt und liegt damit deutlich höher als beim mobilen Core i7-7700HQ (35 Watt) aber auch deutlich unter den 91 Watt des Core i5-7600K.

AMD Ryzen 5 7430U

► remove from comparison AMD R5 7430U

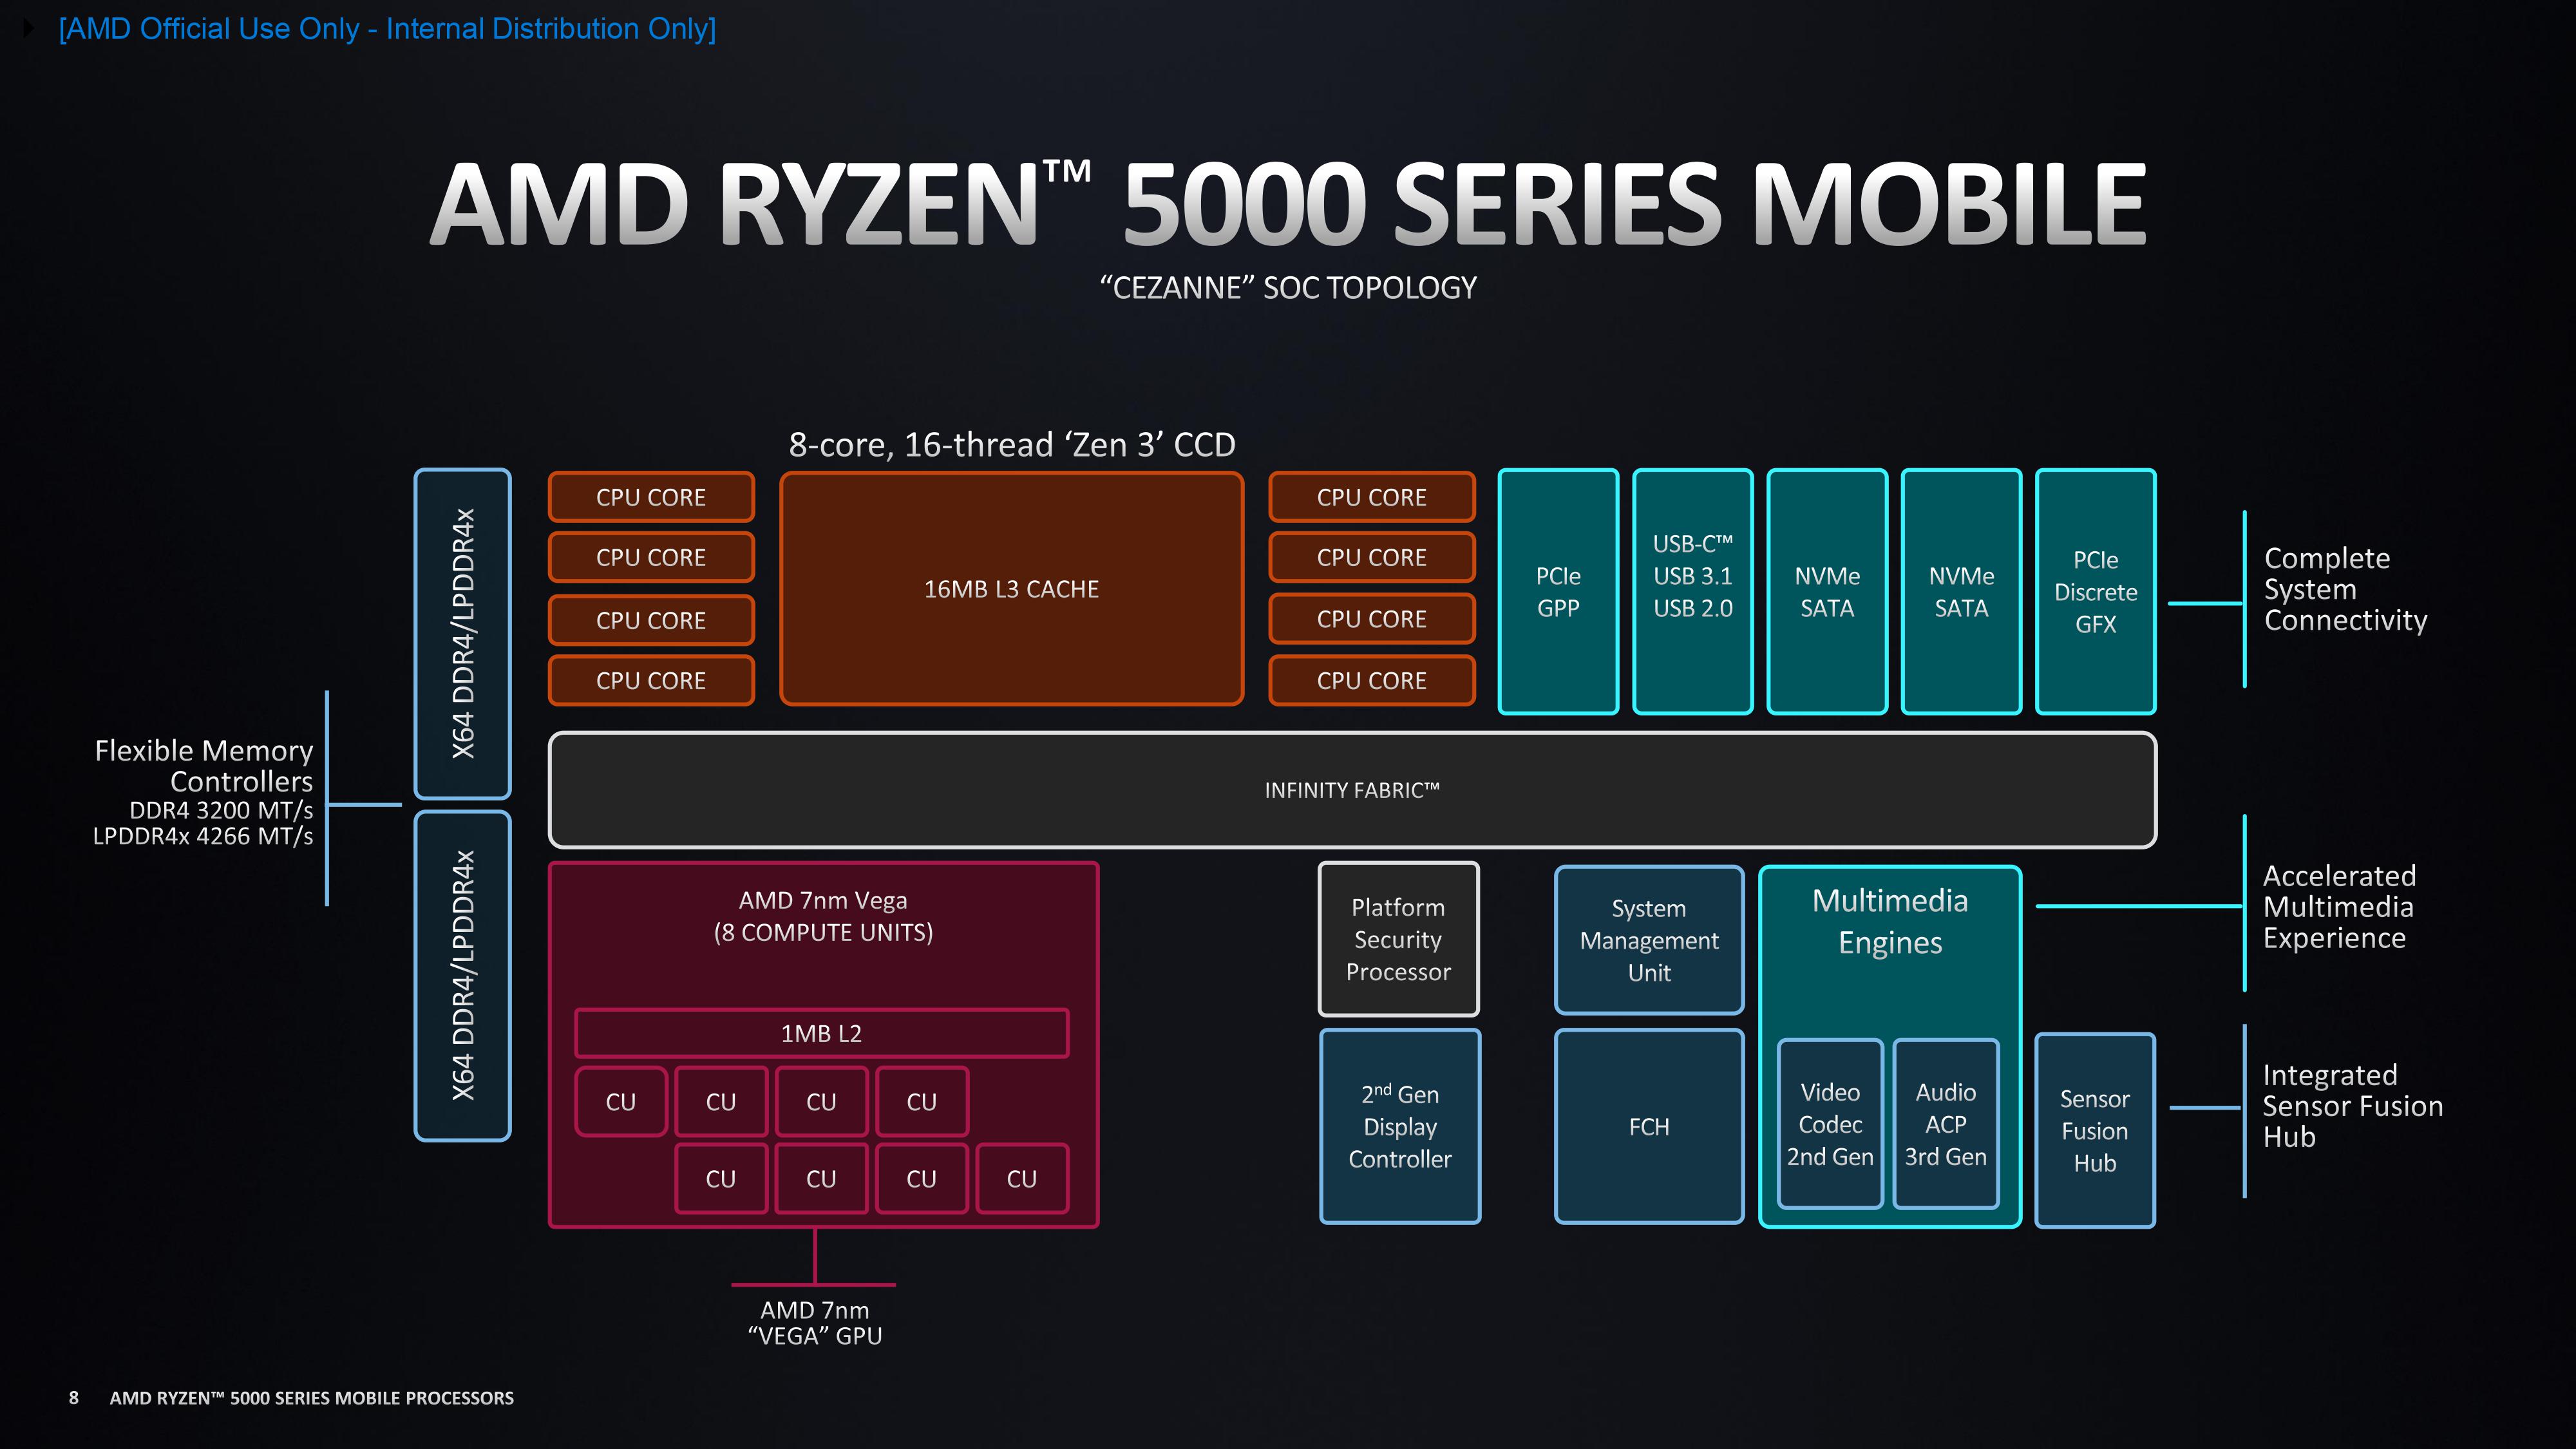
Der AMD Ryzen 5 7430U ist ein Mobilprozessor für kleine und leichte Notebooks basierend auf die Cezanne Generation. Der 7430U ist Teil des zweiten "Barcelo-R" Refresh gegen Ende 2024 und bietet die selben Spezifikationen wie der alte Ryzen 5 5625U.

Der SoC beinhaltet sechs Zen 3 Kerne (Hexa-Core CPU) welche mit bis zu 4,3 GHz getaktet werden (Turbo) und SMT / Hyperthreading (12 Threads) unterstützen. Der Chip wird im älteren 7nm Prozess bei TSMC gefertigt.

Die Performance sollte identisch zum alten Ryzen 5 5625U ausfallen und liegt damit im unteren Mittelklassesegment von Notebook-CPUs in 2023.

Der SoC integriert neben den sechs Prozessorkernen noch eine Radeon RX Vega 7 Grafikkarte (jetzt Radeon Graphics genannt) mit 7 CUs und bis zu 1800 MHz Takt, einen Dual-Channel DDR4 (DDR4-3200, LPDDR4-4266) Speicherkontroller und 16 MB Level 3 Cache. 

Der TDP ist weiterhin von 10 - 25 Watt konfigurierbar (15 Watt Default, in den meisten Notebooks aber 25 Watt). Daher ist der Chip auch für kleine und leichte Notebooks geeignet.

ModelIntel Core i5-7500AMD Ryzen 5 7430U
CodenameKaby LakeBarcelo-U (Zen 3)
SeriesIntel Kaby LakeAMD Cezanne (Zen 3, Ryzen 5000)
Serie: Cezanne (Zen 3, Ryzen 5000) Barcelo-U (Zen 3)
Intel Core i7-7700K compare4.2 - 4.5 GHz4 / 8 cores8 MB L3
Intel Core i7-7700 compare3.6 - 4.2 GHz4 / 8 cores8 MB L3
Intel Xeon E3-1535M v6 compare3.1 - 4.2 GHz4 / 8 cores8 MB L3
Intel Core i7-7920HQ compare3.1 - 4.1 GHz4 / 8 cores8 MB L3
Intel Core i7-7700T compare2.9 - 3.8 GHz4 / 8 cores8 MB L3
Intel Core i5-7600K compare3.8 - 4.2 GHz4 / 4 cores8 MB L3
Intel Xeon E3-1505M v6 compare3 - 4 GHz4 / 8 cores8 MB L3
Intel Core i7-7820HQ compare2.9 - 3.9 GHz4 / 8 cores8 MB L3
Intel Core i7-7820HK compare2.9 - 3.9 GHz4 / 8 cores8 MB L3
Intel Core i7-7700HQ compare2.8 - 3.8 GHz4 / 8 cores6 MB L3
Intel Core i5-7500 « 3.4 - 3.8 GHz4 / 4 cores6 MB L3
Intel Core i5-7440HQ compare2.8 - 3.8 GHz4 / 4 cores6 MB L3
Intel Core i7-7567U compare3.5 - 4 GHz2 / 4 cores4 MB L3
Intel Core i7-7660U compare2.5 - 4 GHz2 / 4 cores4 MB L3
Intel Core i7-7600U compare2.8 - 3.9 GHz2 / 4 cores4 MB L3
Intel Core i5-7300HQ compare2.5 - 3.5 GHz4 / 4 cores6 MB L3
Intel Core i5-7500T compare2.7 - 3.3 GHz4 / 4 cores6 MB L3
Intel Core i5-7287U compare3.3 - 3.7 GHz2 / 4 cores4 MB L3
Intel Core i7-7560U compare2.4 - 3.8 GHz2 / 4 cores4 MB L3
Intel Core i5-7267U compare3.1 - 3.5 GHz2 / 4 cores4 MB L3
Intel Core i5-7360U compare2.3 - 3.6 GHz2 / 4 cores4 MB L3
Intel Core i7-7500U compare2.7 - 3.5 GHz2 / 4 cores4 MB L3
Intel Core i5-7300U compare2.6 - 3.5 GHz2 / 4 cores3 MB L3
Intel Core i5-7260U compare2.2 - 3.4 GHz2 / 4 cores4 MB L3
Intel Core i5-7200U compare2.5 - 3.1 GHz2 / 4 cores3 MB L3
Intel Core i3-7100H compare3 GHz2 / 4 cores3 MB L3
Intel Core i3-7167U compare2.8 GHz2 / 4 cores3 MB L3
Intel Core i7-7Y75 compare1.3 - 3.6 GHz2 / 4 cores4 MB L3
Intel Core i5-7Y57 compare1.2 - 3.3 GHz2 / 4 cores4 MB L3
Intel Core i5-7Y54 compare1.2 - 3.2 GHz2 / 4 cores4 MB L3
Intel Core i3-7100U compare2.4 GHz2 / 4 cores3 MB L3
Intel Core m3-7Y32 compare1 - 3 GHz2 / 4 cores4 MB L3
Intel Pentium Gold 4415U compare2.3 GHz2 / 4 cores2 MB L3
Intel Core m3-7Y30 compare1 - 2.6 GHz2 / 4 cores4 MB L3
Intel Celeron 3965U compare2.2 GHz2 / 2 cores2 MB L3
Intel Core i3-7020U compare2.3 GHz2 / 4 cores3 MB L3
Intel Celeron 3867U compare1.8 GHz2 / 2 cores2 MB L3
Intel Celeron 3865U compare1.8 GHz2 / 2 cores2 MB L3
Intel Pentium Gold 4425Y compare1.7 GHz2 / 4 cores2 MB L3
Intel Pentium Gold 4415Y compare1.6 GHz2 / 4 cores2 MB L3
Intel Pentium Gold 4410Y compare1.5 GHz2 / 4 cores2 MB L3
Intel Celeron 3965Y compare1.5 GHz2 / 2 cores2 MB L3
AMD Ryzen 7 5825U compare2 - 4.5 GHz8 / 16 cores16 MB L3
AMD Ryzen 5 7430U « 2.3 - 4.3 GHz6 / 12 cores16 MB L3
AMD Ryzen 5 5625U compare2.3 - 4.3 GHz6 / 12 cores16 MB L3
AMD Ryzen 3 5425U compare2.7 - 4.1 GHz4 / 8 cores8 MB L3
Clock3400 - 3800 MHz2300 - 4300 MHz
L1 Cache256 KB384 KB
L2 Cache1 MB3 MB
L3 Cache6 MB16 MB
Cores / Threads4 / 46 / 12
6 x 4.3 GHz AMD Zen 3
TDP65 Watt15 Watt
Technology14 nm7 nm
SocketFCLGA1151FP6
FeaturesDDR3(L)-1600/DDR4-2400 Memory Controller, AVX, AVX2, AES-NI, TSX-NI, Quick Sync, Virtualization, vProDDR4-3200/LPDDR4x-4266 RAM (incl. ECC), PCIe 3, MMX, SSE, SSE2, SSE3, SSSE3, SSE4A, SSE4.1, SSE4.2, AVX, AVX2, BMI2, ABM, FMA, ADX, SMEP, SMAP, SMT, CPB, AES-NI, RDRAND, RDSEED, SHA, SME
iGPUIntel HD Graphics 630 (350 - 1100 MHz)AMD Radeon RX Vega 7 ( - 1800 MHz)
Architecturex86x86
$202 U.S.
Announced
Manufacturerark.intel.comwww.amd.com
max. Temp.95 °C

Benchmarks

Performance Rating - CB R15 + R20 + 7-Zip + X265 + Blender + 3DM11 CPU - R5 7430U
32.7 pt (54%)
Restrict / Search: Model: Max. age: years
Cinebench 2024 - Cinebench 2024 CPU Single Core
min: 68     avg: 77.3     median: 82 (41%)     max: 82 Points
Cinebench 2024 - Cinebench 2024 CPU Multi Core
min: 361     avg: 377.7     median: 377 (7%)     max: 395 Points
Cinebench R23 - Cinebench R23 Multi Core
min: 6561     avg: 7019     median: 7018 (7%)     max: 7477 Points
Cinebench R23 - Cinebench R23 Single Core
min: 1165     avg: 1305     median: 1367 (56%)     max: 1382 Points
Cinebench R20 - Cinebench R20 CPU (Single Core)
min: 449     avg: 507     median: 535 (58%)     max: 538 Points
Cinebench R20 - Cinebench R20 CPU (Multi Core)
min: 2679     avg: 2827     median: 2899 (7%)     max: 2902 Points
Cinebench R15 - Cinebench R15 CPU Multi 64 Bit
585 Points (4%)
min: 1168     avg: 1235     median: 1265 (8%)     max: 1271 Points
Cinebench R15 - Cinebench R15 CPU Single 64 Bit
159 Points (44%)
min: 175     avg: 206.3     median: 221 (61%)     max: 223 Points
Cinebench R11.5 - Cinebench R11.5 CPU Multi 64 Bit
6.9 Points (9%)
min: 14.67     avg: 15.4     median: 15.4 (20%)     max: 16.15 Points
Cinebench R11.5 - Cinebench R11.5 CPU Single 64 Bit
1.8 Points (43%)
min: 2.65     avg: 2.7     median: 2.7 (63%)     max: 2.66 Points
Cinebench R10 - Cinebench R10 Rend. Single (32bit)
min: 5769     avg: 5829     median: 5829 (35%)     max: 5889 Points
Cinebench R10 - Cinebench R10 Rend. Multi (32bit)
min: 27488     avg: 28595     median: 28594.5 (21%)     max: 29701 Points
Cinebench R10 - Cinebench R10 Rend. Multi (64bit)
min: 47909     avg: 50195     median: 50194.5 (32%)     max: 52480 Points
Cinebench R10 - Cinebench R10 Rend. Single (64bit)
min: 11022     avg: 11064     median: 11064 (13%)     max: 11106 Points
wPrime 2.10 - wPrime 2.0 1024m *
306 s (4%)
156.8 s (2%)
wPrime 2.10 - wPrime 2.0 32m *
9.7 s (2%)
6 s (1%)
WinRAR - WinRAR 4.0
2979 Points (5%)
6053 Points (10%)
7-Zip 18.03 - 7-Zip 18.03 Multi Thread 4 runs
min: 33691     avg: 35812     median: 36664 (21%)     max: 37081 MIPS
7-Zip 18.03 - 7-Zip 18.03 Single Thread 4 runs
min: 4285     avg: 4895     median: 5134 (61%)     max: 5267 MIPS
X264 HD Benchmark 4.0 - x264 Pass 2
39.5 fps (1%)
75.2 fps (2%)
X264 HD Benchmark 4.0 - x264 Pass 1
181.6 fps (5%)
218 fps (6%)
HWBOT x265 Benchmark v2.2 - HWBOT x265 4k Preset
min: 8.39     avg: 8.7     median: 8.5 (15%)     max: 9.25 fps
TrueCrypt - TrueCrypt Serpent
0.3 GB/s (9%)
0.7 GB/s (21%)
TrueCrypt - TrueCrypt Twofish
0.5 GB/s (9%)
1 GB/s (17%)
TrueCrypt - TrueCrypt AES
3.2 GB/s (8%)
6.8 GB/s (18%)
Blender - Blender 3.3 Classroom CPU *
min: 753     avg: 788     median: 756 (10%)     max: 854 Seconds
Blender - Blender 2.79 BMW27 CPU *
min: 409     avg: 427.3     median: 426 (3%)     max: 447 Seconds
R Benchmark 2.5 - R Benchmark 2.5 *
min: 0.555     avg: 0.6     median: 0.6 (13%)     max: 0.63 sec
3DMark 06 - CPU - 3DMark 06 - CPU
7247 Points (15%)
min: 9472     avg: 9644     median: 9644 (21%)     max: 9816 Points
Super Pi mod 1.5 XS 1M - Super Pi mod 1.5 XS 1M *
9 s (2%)
8.3 s (2%)
Super Pi mod 1.5 XS 2M - Super Pi mod 1.5 XS 2M *
22 s (1%)
17.9 s (1%)
Super Pi Mod 1.5 XS 32M - Super Pi mod 1.5 XS 32M *
100%
1 i5-7500 +
569 s (3%)
3DMark Vantage - 3DM Vant. Perf. CPU no Physx
min: 35585     avg: 37437     median: 37436.5 (29%)     max: 39288 Points
3DMark 11 - 3DM11 Performance Physics
6268 Points (15%)
min: 9682     avg: 10531     median: 10478 (26%)     max: 11433 Points
3DMark - 3DMark Ice Storm Physics
min: 56505     avg: 62516     median: 61488 (50%)     max: 69556 Points
3DMark - 3DMark Ice Storm Extreme Physics
min: 56586     avg: 62310     median: 61085 (50%)     max: 69259 Points
3DMark - 3DMark Ice Storm Unlimited Physics
60021 Points (48%)
min: 62744     avg: 74126     median: 76415 (61%)     max: 83219 Points
3DMark - 3DMark Cloud Gate Physics
5324 Points (13%)
min: 9149     avg: 10028     median: 10372 (26%)     max: 10562 Points
3DMark - 3DMark Fire Strike Standard Physics
7619 Points (14%)
min: 13885     avg: 15865     median: 16215 (29%)     max: 17496 Points
3DMark - 3DMark Time Spy CPU
min: 4321     avg: 4631     median: 4762 (20%)     max: 4810 Points
Geekbench 6.5 - Geekbench 6.5 Single-Core
min: 1505     avg: 1723     median: 1849 (43%)     max: 1906 Points
Geekbench 6.5 - Geekbench 6.5 Multi-Core
min: 5245     avg: 5816     median: 5705 (22%)     max: 6741 Points
Geekbench 6.0 - Geekbench 6.0 Single-Core
min: 1442     avg: 1617     median: 1616.5 (51%)     max: 1791 Points
Geekbench 6.0 - Geekbench 6.0 Multi-Core
min: 4924     avg: 5212     median: 5211.5 (21%)     max: 5499 Points
Geekbench 5.5 - Geekbench 5.1 - 5.5 64 Bit Single-Core
min: 1112     avg: 1323     median: 1380.5 (46%)     max: 1418 Points
Geekbench 5.5 - Geekbench 5.1 - 5.5 64 Bit Multi-Core
min: 5160     avg: 5610     median: 5587 (10%)     max: 6106 Points
Geekbench 5.0 - Geekbench 5.0 64 Bit Single-Core
min: 1098     avg: 1267     median: 1344 (6%)     max: 1360 Points
Geekbench 5.0 - Geekbench 5.0 64 Bit Multi-Core
min: 5119     avg: 5378     median: 5310 (17%)     max: 5706 Points
Geekbench 4.4 - Geekbench 4.1 - 4.4 64 Bit Single-Core
min: 5702     avg: 6424     median: 5766 (58%)     max: 7804 Points
Geekbench 4.4 - Geekbench 4.1 - 4.4 64 Bit Multi-Core
min: 21491     avg: 33644     median: 23754 (23%)     max: 55688 Points
Mozilla Kraken 1.1 - Kraken 1.1 Total Score *
1336 ms (2%)
min: 658     avg: 745     median: 717 (1%)     max: 859 ms
Sunspider - Sunspider 1.0 Total Score *
100%
1 i5-7500 +
76.3 ms (1%)
Octane V2 - Octane V2 Total Score
100%
1 i5-7500 +
32122 Points (21%)
WebXPRT 4 - WebXPRT 4 Score
min: 148.3     avg: 179.6     median: 186.5 (49%)     max: 204 Points
WebXPRT 3 - WebXPRT 3 Score
min: 180.5     avg: 216.5     median: 230 (41%)     max: 239 Points
CrossMark - CrossMark Overall
min: 966     avg: 1123     median: 1185 (44%)     max: 1219 Points
Power Consumption - Prime95 Power Consumption - external Monitor *
min: 29.6     avg: 34.7     median: 32.2 (6%)     max: 42.4 Watt
Power Consumption - Cinebench R15 Multi Power Consumption - external Monitor *
min: 39.5     avg: 41.5     median: 41.9 (8%)     max: 43 Watt
Power Consumption - Idle Power Consumption - external Monitor *
min: 5.45     avg: 7.4     median: 6.2 (4%)     max: 10.7 Watt
Power Consumption - Idle Power Consumption 150cd 1min *
min: 9.95     avg: 12.1     median: 12.1 (9%)     max: 14.2 Watt
Power Consumption - Power Efficiency - Cinebench R15 Multi external Monitor
min: 27.2     avg: 29.9     median: 30.2 (23%)     max: 32.2 Points per Watt

Average Benchmarks Intel Core i5-7500 → 100% n=20

Average Benchmarks AMD Ryzen 5 7430U → 174% n=20

- Bereich der Benchmarkergebnisse für diese Grafikkarte
red legend - Durchschnittliche Benchmarkergebnisse für diese Grafikkarte
* Smaller numbers mean a higher performance
1 This benchmark is not used for the average calculation

Add one or more devices and compare

In the following list you can select (and also search for) devices that should be added to the comparison. You can select more than one device.

restrict list:
v1.35
log 11. 18:03:13

#0 ran 0s before starting gpusingle class +0s ... 0s

#1 checking url part for id 9238 +0s ... 0s

#2 checking url part for id 19320 +0s ... 0s

#3 redirected to Ajax server, took 1768150993s time from redirect:0 +0s ... 0s

#4 did not recreate cache, as it is less than 5 days old! Created at Sat, 10 Jan 2026 05:18:44 +0100 +0s ... 0s

#5 composed specs +0.004s ... 0.004s

#6 did output specs +0s ... 0.004s

#7 getting avg benchmarks for device 9238 +0s ... 0.005s

#8 got single benchmarks 9238 +0s ... 0.005s

#9 getting avg benchmarks for device 19320 +0.005s ... 0.01s

#10 got single benchmarks 19320 +0.007s ... 0.017s

#11 got avg benchmarks for devices +0s ... 0.017s

#12 min, max, avg, median took s +0.029s ... 0.046s

#13 return log +0.002s ... 0.049s

Teilen Sie diesen Artikel, um uns zu unterstützen. Jeder Link hilft!
Mail Logo
> Notebook Test, Laptop Test und News > Benchmarks / Technik > Benchmarks / Technik > Prozessor Vergleich - Head 2 Head
Autor: Klaus Hinum,  8.09.2017 (Update:  1.07.2023)