Notebookcheck Logo

Apple M2 Max 38-Core GPU vs Apple M2 Pro 19-Core GPU vs Apple M2 8-Core GPU

Apple M2 Max 38-Core GPU

► remove from comparison Apple M2 Max 38-Core GPU

Die Apple M2 Max 38-Core GPU ist eine von Apple selbst designte Grafikkarte im Apple M2 Max SoC und laut Apple mit allen 38 Kernen. Die GPU hat keinen dedizierten Grafikspeicher aber kann auf den schnellen gemeinsamen LPDDR5-6400? Speicher (unified Memory, 32 bis 96 GB, 400 GBit Bandbreite) zugreifen.

Neu ist beim M2 Pro und Max der Support für HDMI 2.1 (8K Displays).

Die iGPU unterstützt Apple's Metal 2 Schnittstelle und dürfte eine ähnliche Architektur wie die älteren PowerVR Grafikeinheiten (z.B. im Apple A10) aufweisen.

Da der SoC im 5nm Prozess bei TSMC hergestellt wird, sollte die Energieeffizienz hervorragend sein. Laut powermetrics braucht die GPU bis zu 53,6 Watt (Chip inkl. CPU gesamt 89 Watt).

Apple M2 Pro 19-Core GPU

► remove from comparison Apple M2 Pro 19-Core GPU

Die Apple M2 Pro 19-Core GPU ist eine von Apple selbst designte Grafikkarte im Apple M2 Pro SoC und laut Apple mit allen 19 Kernen (im Einstiegs-MacBook Pro 14 sind nur 16 aktiviert). Die GPU hat keinen dedizierten Grafikspeicher aber kann auf den schnellen gemeinsamen LPDDR5-6400? Speicher (unified Memory, 16 oder 32 GB) zugreifen. Die GPU kann von 444 bis 1398 MHz takten und hält im Test auch die 1398 MHz bei Spielen.

Laut Apple soll die GPU 30% schneller sein als die alte 16-Kern GPU im M1 Pro.

Neu ist beim M2 Pro der Support für HDMI 2.1 (8K Displays).

Die iGPU unterstützt Apple's Metal 2 Schnittstelle und dürfte eine ähnliche Architektur wie die älteren PowerVR Grafikeinheiten (z.B. im Apple A10) aufweisen.

Da der SoC im 5nm Prozess bei TSMC hergestellt wird, sollte die Energieeffizienz hervorragend sein. Unter Last (Borderlands 3) braucht die GPU laut powermetrics knapp 20 Watt.

Apple M2 8-Core GPU

► remove from comparison Apple M2 8-Core GPU

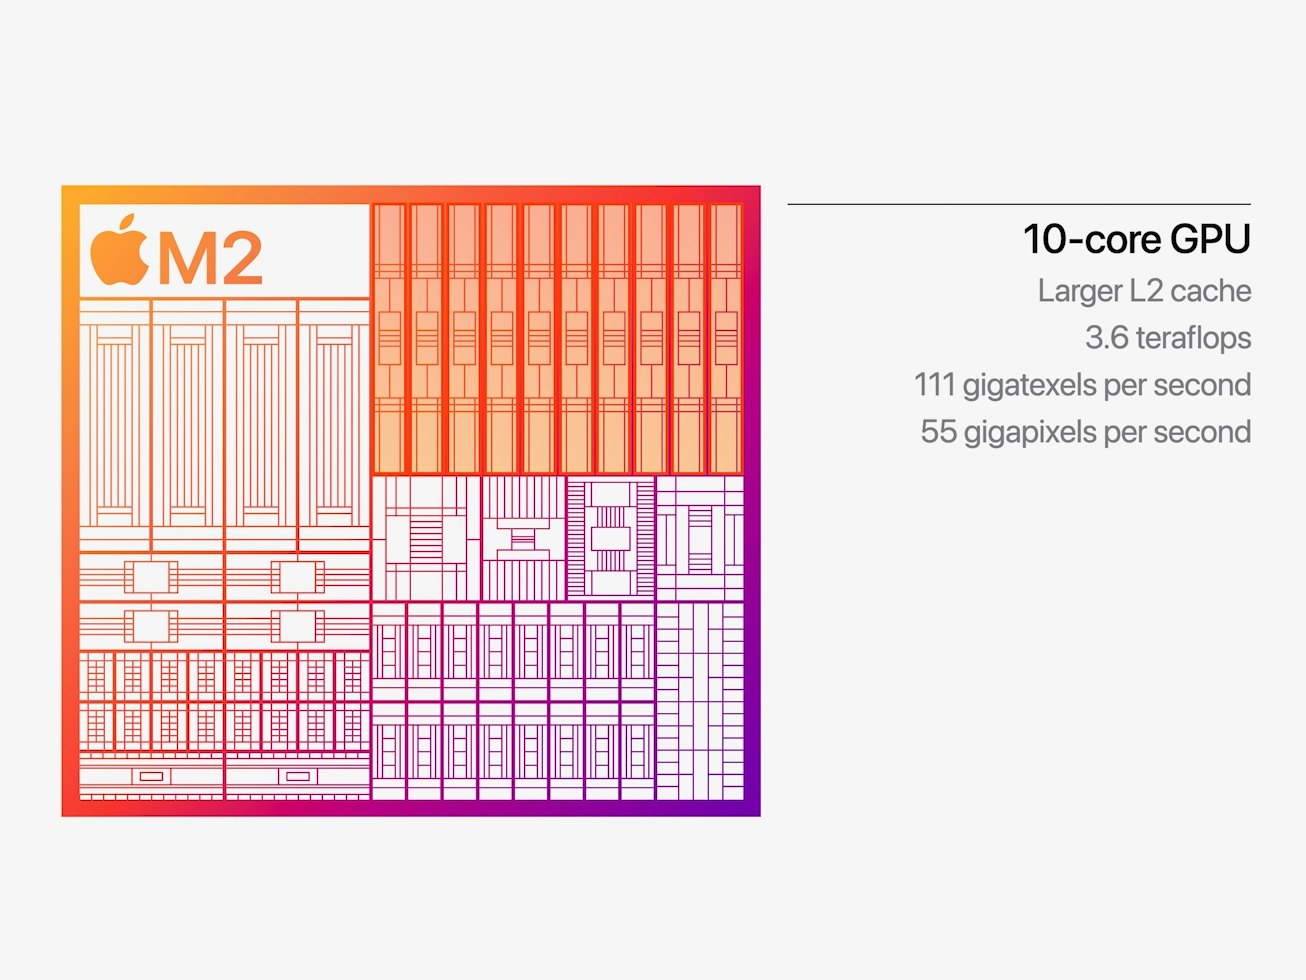
Die Apple M2 8-Kern-GPU ist eine selbst designte Grafikkarte im Apple M2 SoC und laut Apple mit acht der zehn Kerne. Die 8-Kern-Variante bietet wahrscheinlich 128 Ausführungseinheiten und eine theoretische Maximalleistung von 2,9 Teraflops (geschätzt). Damit ist sie um 0,3 Teraflop schneller als die alte 8-Kern-GPU im Apple M1 und soll auch größere Caches bieten. Im Vergleich zur 10-Kern-GPU ist die Taktung mit maximal 1398 MHz identisch, wodurch die stärkere Grafik etwa 25% schneller sein sollte.

Die M2-GPU unterstützt Apple's Metal 2 Schnittstelle und dürfte eine ähnliche Architektur wie die älteren PowerVR Grafikeinheiten (z.B. im Apple A10) aufweisen.

Da der SoC im (second generation) 5nm Prozess bei TSMC hergestellt wird (wahrscheinlich N5P), sollte die Energieeffizienz sehr sein. Nach unseren Messungen ist der Stromverbrauch der GPU alleine (laut internen Tools) bei etwa 10 Watt.

Apple M2 Max 38-Core GPUApple M2 Pro 19-Core GPUApple M2 8-Core GPU
Apple M2 Serie
M2 Max 38-Core GPU 38
M2 Max 30-Core GPU 30
M2 Pro 19-Core GPU 19 @ 0.44 - 1.4 GHz
M2 Pro 16-Core GPU 16
M2 10-Core GPU 10 @ 1.4 GHz
M2 8-Core GPU 8 @ 1.4 GHz
M2 Max 38-Core GPU 38
M2 Max 30-Core GPU 30
M2 Pro 19-Core GPU 19 @ 0.44 - 1.4 GHz
M2 Pro 16-Core GPU 16
M2 10-Core GPU 10 @ 1.4 GHz
M2 8-Core GPU 8 @ 1.4 GHz
M2 Max 38-Core GPU 38
M2 Max 30-Core GPU 30
M2 Pro 19-Core GPU 19 @ 0.44 - 1.4 GHz
M2 Pro 16-Core GPU 16
M2 10-Core GPU 10 @ 1.4 GHz
M2 8-Core GPU 8 @ 1.4 GHz
Pipelines38 - unified19 - unified8 - unified
SpeichertypLPDDR5-6400LPDDR5-6400LPDDR5-6400
Shared Memoryneinneinnein
Stromverbrauch53 Watt20 Watt10 Watt
Herstellungsprozess5 nm5 nm5 nm
Notebookgrößemittel (15.4" z.B.)mittel (15.4" z.B.)
Erscheinungsdatum17.01.2023 17.01.2023 06.06.2022
Kerntakt444 - 1398 (Boost) MHz1398 (Boost) MHz
PredecessorM1 8-Core GPU
CPU in M2 Max 38-Core GPUGPU Base SpeedGPU Boost / Turbo
Apple M2 Max12 x 2424 MHz, 79 W? MHz? MHz
CPU in M2 Pro 19-Core GPUGPU Base SpeedGPU Boost / Turbo
Apple M2 Pro12 x 2424 MHz? MHz? MHz

Benchmarks

3DMark - 3DMark Wild Life Unlimited
21009 Points (11%)
3DMark - 3DMark Wild Life Extreme Unlimited
25103 Points (29%)
min: 12968     avg: 12983     median: 12982.5 (15%)     max: 12997 Points
5689 Points (7%)
Blender - Blender 3.3 Classroom METAL *
51.2 Seconds (5%)
97 Seconds (10%)
Cinebench R15
Cinebench R15 OpenGL 64 Bit + Apple M2 Max 38-Core GPU
Cinebench R15 - Cinebench R15 OpenGL 64 Bit
147.5 fps (9%)
Cinebench R15 OpenGL 64 Bit + Apple M2 Pro 19-Core GPU
140.9 fps (8%)
Cinebench R15 OpenGL 64 Bit + Apple M2 8-Core GPU
128.6 fps (8%)
Cinebench R15 OpenGL Ref. Match 64 Bit + Apple M2 Max 38-Core GPU
Cinebench R15 - Cinebench R15 OpenGL Ref. Match 64 Bit
99.5 % (100%)
Cinebench R15 OpenGL Ref. Match 64 Bit + Apple M2 Pro 19-Core GPU
99.5 % (100%)
Cinebench R15 OpenGL Ref. Match 64 Bit + Apple M2 8-Core GPU
99.5 % (100%)
GFXBench - GFXBench 5.0 4K Aztec Ruins High Tier Offscreen
179.9 fps (73%)
min: 92.1     avg: 92.2     median: 92.2 (37%)     max: 92.2 fps
39.8 fps (16%)
GFXBench - GFXBench 5.0 Aztec Ruins High Tier Offscreen
397.6 fps (72%)
min: 210.4     avg: 210.6     median: 210.6 (38%)     max: 210.7 fps
91 fps (17%)
GFXBench - GFXBench 5.0 Aztec Ruins Normal Tier Offscreen
950 fps (70%)
min: 565.3     avg: 567     median: 566.7 (42%)     max: 568 fps
247 fps (18%)
GFXBench - GFXBench Car Chase Offscreen
585 fps (66%)
min: 434.4     avg: 435.2     median: 435.2 (49%)     max: 436 fps
199.9 fps (23%)
GFXBench 3.1 - GFXBench Manhattan ES 3.1 Offscreen
1294 fps (27%)
min: 748     avg: 748     median: 748.2 (16%)     max: 748.4 fps
306.9 fps (6%)
GFXBench 3.0 - GFXBench 3.0 Manhattan Offscreen
1708 fps (100%)
min: 1126.4     avg: 1131     median: 1131.2 (66%)     max: 1136 fps
483.7 fps (28%)
GFXBench (DX / GLBenchmark) 2.7
GFXBench T-Rex HD Offscreen C24Z16 + Apple M2 Max 38-Core GPU
GFXBench (DX / GLBenchmark) 2.7 - GFXBench T-Rex HD Offscreen C24Z16
3185 fps (25%)
GFXBench T-Rex HD Offscreen C24Z16 + Apple M2 Pro 19-Core GPU
min: 1967.2     avg: 1970     median: 1969.6 (16%)     max: 1972 fps
GFXBench T-Rex HD Offscreen C24Z16 + Apple M2 8-Core GPU
839 fps (7%)
Geekbench 6.2 - Geekbench 6.2 GPU OpenCL
50447 Points (15%)
Geekbench 6.2 - Geekbench 6.2 GPU Metal
82134 Points (53%)
Power Consumption - The Witcher 3 Power Consumption - external Monitor *
80.7 Watt (11%)
49.6 Watt (7%)
24.4 Watt (3%)
Power Consumption - Witcher 3 Power Consumption *
92 Watt (20%)
55.9 Watt (12%)
27.4 Watt (6%)
Power Consumption - Witcher 3 ultra Power Efficiency - external Monitor
0.9 fps per Watt (78%)
min: 1.028     avg: 1     median: 1 (85%)     max: 1.207 fps per Watt
Emissions Witcher 3 Fan Noise + Apple M2 Max 38-Core GPU
Emissions - Witcher 3 Fan Noise
35.1 dB(A) (56%)

Average Benchmarks Apple M2 Max 38-Core GPU → 100% n=10

Average Benchmarks Apple M2 Pro 19-Core GPU → 67% n=10

Average Benchmarks Apple M2 8-Core GPU → 39% n=10

- Bereich der Benchmarkergebnisse für diese Grafikkarte
- Durchschnittliche Benchmarkergebnisse für diese Grafikkarte
* Smaller numbers mean a higher performance
1 This benchmark is not used for the average calculation

Spiele-Benchmarks

Die folgenden Benchmarks basieren auf unseren Spieletests mit Testnotebooks. Die Performance dieser Grafikkarte bei den gelisteten Spielen ist abhängig von der verwendeten CPU, Speicherausstattung, Treiber und auch Betriebssystem. Dadurch müssen die untenstehenden Werte nicht repräsentativ sein. Detaillierte Informationen über das verwendete System sehen Sie nach einem Klick auf den fps-Wert.

low 1920x1080
M2 Pro 19-Core GPU:
39.6  fps
med. 1920x1080
M2 Pro 19-Core GPU:
33.5  fps
high 1920x1080
M2 Pro 19-Core GPU:
29.3  fps
ultra 1920x1080
M2 Pro 19-Core GPU:
26.5  fps
ultra 1920x1080
M2 Pro 19-Core GPU:
34  fps
low 1280x720
M2 Pro 19-Core GPU:
75.9 79 ~ 77 fps
M2 8-Core GPU:
43  fps
med. 1920x1080
100%
M2 Max 38-Core GPU:
72  fps
79%
M2 Pro 19-Core GPU:
54 60.3 ~ 57 fps
41%
M2 8-Core GPU:
29.7  fps
high 1920x1080
100%
M2 Max 38-Core GPU:
60.2  fps
66%
M2 Pro 19-Core GPU:
40 40.6 ~ 40 fps
28%
M2 8-Core GPU:
16.6  fps
ultra 1920x1080
100%
M2 Max 38-Core GPU:
48.6  fps
62%
M2 Pro 19-Core GPU:
29 30.4 ~ 30 fps
28%
M2 8-Core GPU:
13.4  fps
low 1280x720
100%
M2 Max 38-Core GPU:
330  fps
82%
M2 Pro 19-Core GPU:
269  fps
23%
M2 8-Core GPU:
77  fps
med. 1920x1080
100%
M2 Max 38-Core GPU:
147  fps
57%
M2 Pro 19-Core GPU:
84  fps
27%
M2 8-Core GPU:
39  fps
high 1920x1080
100%
M2 Max 38-Core GPU:
96  fps
56%
M2 Pro 19-Core GPU:
54  fps
19%
M2 8-Core GPU:
18  fps
ultra 1920x1080
100%
M2 Max 38-Core GPU:
71  fps
56%
M2 Pro 19-Core GPU:
40  fps
20%
M2 8-Core GPU:
14  fps
QHD 2560x1440
100%
M2 Max 38-Core GPU:
47  fps
53%
M2 Pro 19-Core GPU:
25  fps
low 1280x720
100%
M2 Max 38-Core GPU:
182  fps
93%
M2 Pro 19-Core GPU:
169  fps
34%
M2 8-Core GPU:
62  fps
med. 1920x1080
100%
M2 Max 38-Core GPU:
131  fps
61%
M2 Pro 19-Core GPU:
80  fps
21%
M2 8-Core GPU:
28  fps
high 1920x1080
100%
M2 Max 38-Core GPU:
122  fps
59%
M2 Pro 19-Core GPU:
72  fps
20%
M2 8-Core GPU:
24  fps
ultra 1920x1080
100%
M2 Max 38-Core GPU:
109  fps
58%
M2 Pro 19-Core GPU:
63  fps
18%
M2 8-Core GPU:
20  fps
QHD 2560x1440
100%
M2 Max 38-Core GPU:
78  fps
51%
M2 Pro 19-Core GPU:
40  fps
high 1920x1080
100%
M2 Max 38-Core GPU:
83  fps
69%
M2 Pro 19-Core GPU:
57  fps
ultra 1920x1080
100%
M2 Max 38-Core GPU:
76  fps
67%
M2 Pro 19-Core GPU:
51  fps
GTA V

GTA V

2015
low 1024x768
100%
M2 Max 38-Core GPU:
84  fps
med. 1366x768
100%
M2 Max 38-Core GPU:
81  fps
high 1920x1080
100%
M2 Max 38-Core GPU:
57  fps

Average Gaming Apple M2 Max 38-Core GPU → 100%

Average Gaming 30-70 fps → 100%

Average Gaming Apple M2 Pro 19-Core GPU → 65%

Average Gaming 30-70 fps → 63%

Average Gaming Apple M2 8-Core GPU → 25%

Average Gaming 30-70 fps → 30%

Apple M2 Pro 19-Core GPUlowmed.highultraQHD4K
Cyberpunk 2077 2.0 Phantom Liberty39.633.529.326.5
Baldur's Gate 334
Borderlands 377574030
Total War: Three Kingdoms26984544025
Shadow of the Tomb Raider16980726340
The Witcher 35751
< 30 fps
< 60 fps
< 120 fps
≥ 120 fps

1
1
2

2
2
1
3
1
1
4
1
1
1


Apple M2 8-Core GPUlowmed.highultraQHD4K
Borderlands 34329.716.613.4
Total War: Three Kingdoms77391814
Shadow of the Tomb Raider62282420
< 30 fps
< 60 fps
< 120 fps
≥ 120 fps

1
2
2
1

3


3


Apple M2 Max 38-Core GPUlowmed.highultraQHD4K
Borderlands 37260.248.6
Total War: Three Kingdoms330147967147
Shadow of the Tomb Raider18213112210978
The Witcher 38376
GTA V848157
< 30 fps
< 60 fps
< 120 fps
≥ 120 fps


1
2


2
2

1
3
1

1
3

1
1


Eine Liste mit weiteren Spielen und allen Grafikkarten finden Sie auf unserer Seite: Welches Spiel ist mit welcher Grafikkarte spielbar?

v1.26
log 28. 22:31:37

#0 checking url part for id 11574 +0s ... 0s

#1 checking url part for id 11568 +0s ... 0s

#2 checking url part for id 11375 +0s ... 0s

#3 not redirecting to Ajax server +0s ... 0s

#4 did not recreate cache, as it is less than 5 days old! Created at Sun, 28 Apr 2024 05:41:30 +0200 +0.001s ... 0.001s

#5 composed specs +0.14s ... 0.141s

#6 did output specs +0s ... 0.141s

#7 start showIntegratedCPUs +0s ... 0.141s

#8 getting avg benchmarks for device 11574 +0.036s ... 0.176s

#9 got single benchmarks 11574 +0.008s ... 0.184s

#10 getting avg benchmarks for device 11568 +0.002s ... 0.186s

#11 got single benchmarks 11568 +0.008s ... 0.194s

#12 getting avg benchmarks for device 11375 +0.002s ... 0.196s

#13 got single benchmarks 11375 +0.006s ... 0.201s

#14 got avg benchmarks for devices +0s ... 0.201s

#15 min, max, avg, median took s +0.103s ... 0.305s

#16 before gaming benchmark output +0s ... 0.305s

#17 Got 101 rows for game benchmarks. +0.013s ... 0.318s

#18 composed SQL query for gamebenchmarks +0s ... 0.318s

#19 got data and put it in $dataArray +0.006s ... 0.324s

#20 benchmarks composed for output. +0.018s ... 0.342s

#21 calculated avg scores. +0s ... 0.342s

#22 return log +0.002s ... 0.344s

Teilen Sie diesen Artikel, um uns zu unterstützen. Jeder Link hilft!
> Notebook Test, Laptop Test und News > Benchmarks / Technik > Benchmarks / Technik > Grafikkarten Vergleich - Head 2 Head
Autor: Klaus Hinum,  8.09.2017 (Update:  1.07.2023)