Performance-Test: Nvidia GeForce RTX 3080 Ti Laptop GPU

Testsystem
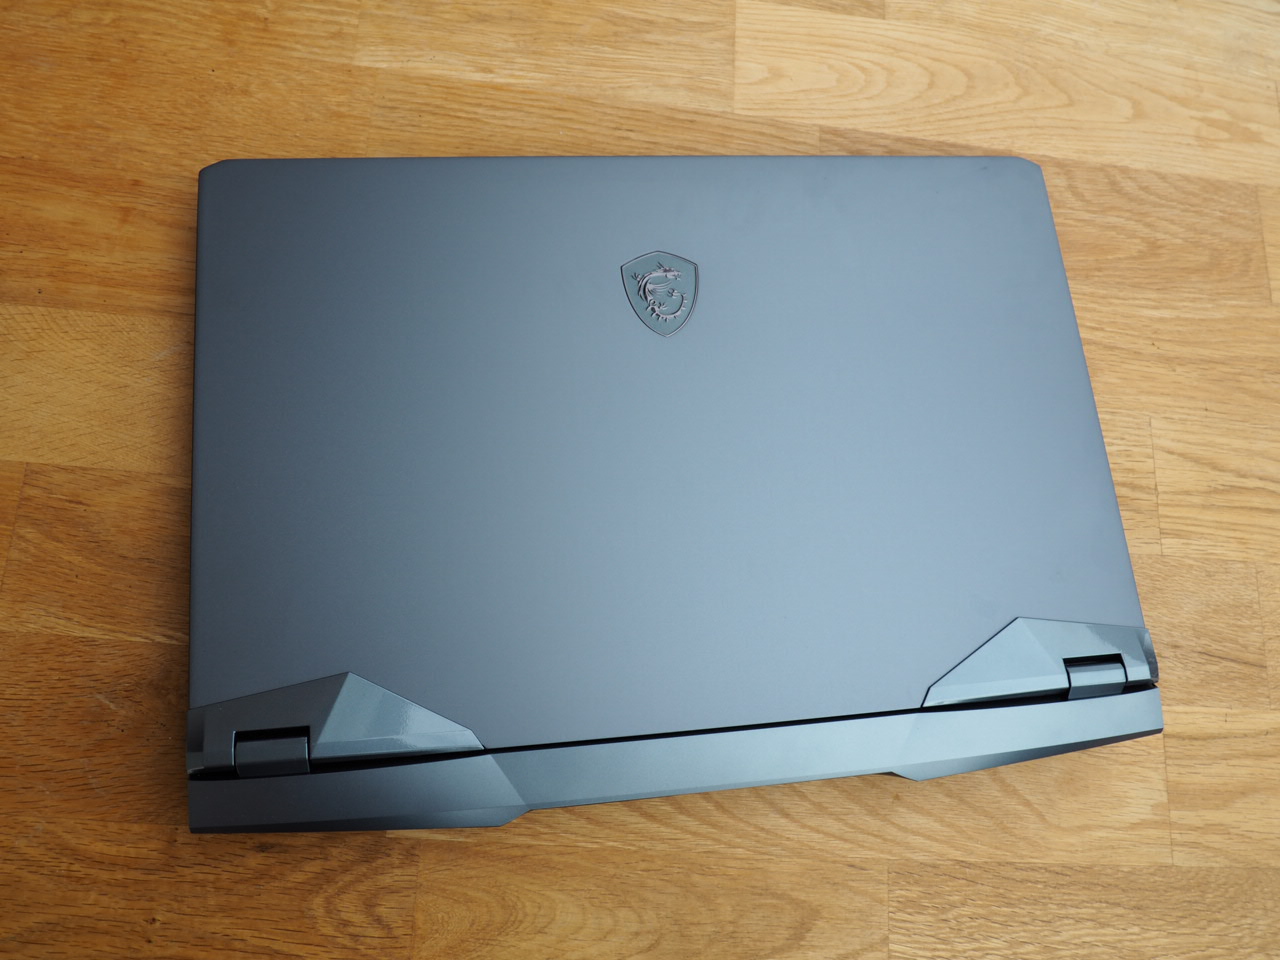
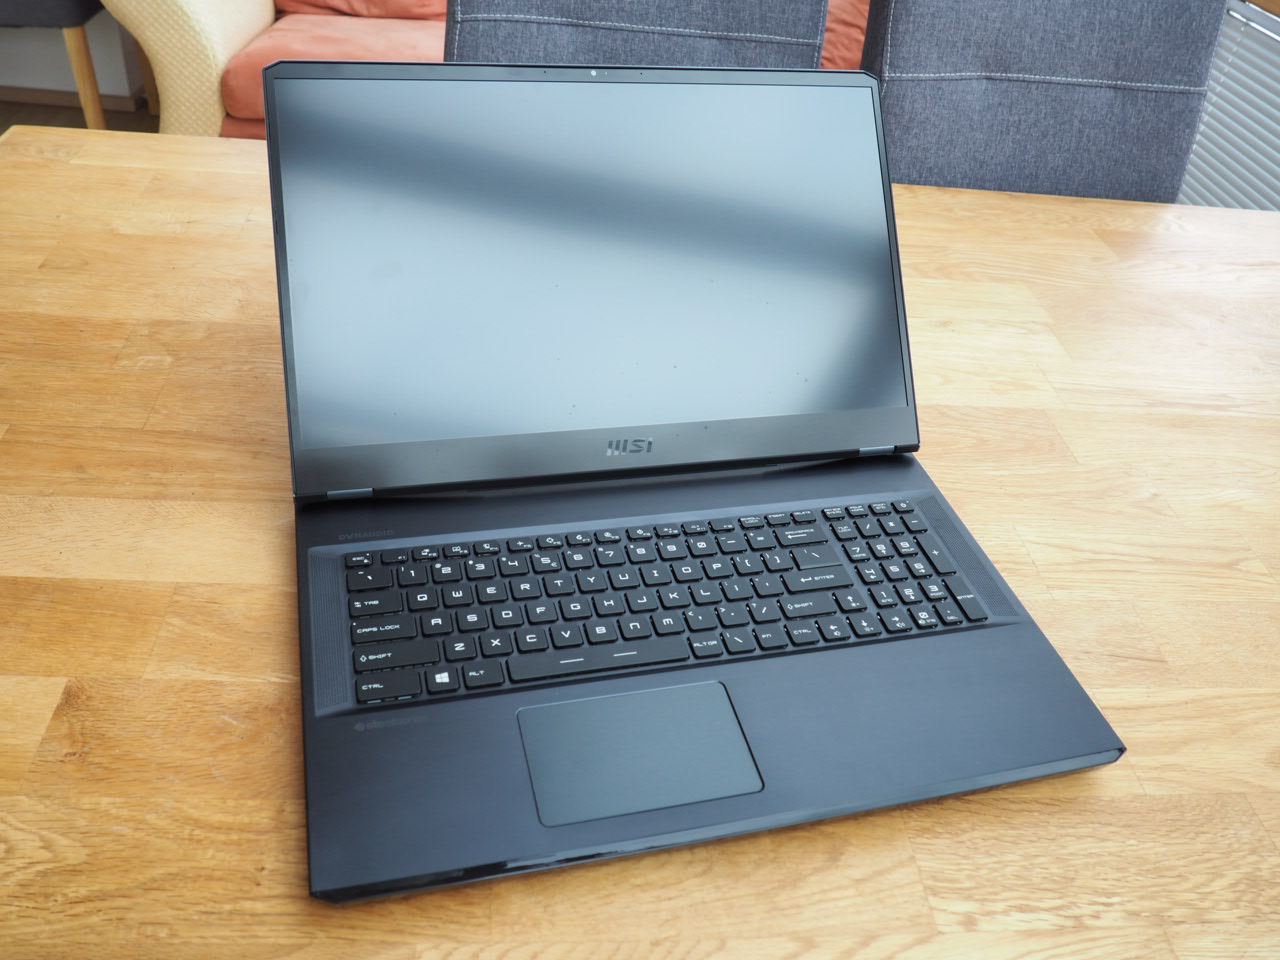
Grundlage für unseren Performance-Check bildet ein MSI GE76 Raider, das trotz des Presample-Status sehr stabil und zuverlässig lief (weder Abstürze noch Grafikfehler). Der 17-Zoll-Spross kann in der vorliegenden Ausstattung mit einem pfeilschnellen Core i9-12900HK aus Intels brandneuer Alder-Lake-Generation aufwarten. Beim Arbeitsspeicher geht es ebenfalls sehr modern zu: 2x 16 GB DDR5-4800-RAM im Dual-Channel-Modus dürften genug Reserven für die kommenden Gaming-Jahre bereithalten. Dazu gesellen sich gleich zwei 2-TB-SSDs im M.2-Format, die natürlich auf NVMe-Technik setzen.
Um eine Limitierung durch den Prozessor und somit eine Beeinflussung der Bewertung bzw. Beurteilung zu verhindern, beschränken wir uns in diesem Artikel (mit Ausnahme der Ray-Tracing-Benchmarks) auf Tests in QHD und UHD, sprich 2.560 x 1.440 Pixel und 3.840 x 2.160 Pixel. Da das extrem flotte 360-Hz-Panel des MSI GE76 Raider nur Full-HD (1.920 x 1.080) beherrscht, kam dafür ein externer 4K-Monitor zum Einsatz. Wie es um die Emissionen, den Energieverbrauch und die Akkulaufzeit des GE76 respektive der GeForce RTX 3080 Ti bestellt ist, erfahren Sie im parallel veröffentlichten Notebook-Test.
Das auf dem Laptop vorinstallierte MSI Center bietet dem Nutzer die Möglichkeit aus verschiedenen Leistungsprofilen zu wählen und diverse weitere Einstellungen am System vorzunehmen. Alle hier aufgeführten Messungen sind im User Scenario Extreme Performance ohne den optionalen Cooler Boost entstanden. Da Nvidias Grafikumschaltung Optimus je nach Spiel mal mehr und mal weniger Leistung kostet, war außerdem die iGPU deaktivert (GPU-Switch: Discrete Graphics Mode). Der Grafiktreiber wurde von der ursprünglich installierten Version 497.17 auf die Review-Version 511.14 aktualisiert.
| Notebook | MSI GE76 Raider |
|---|---|
| Display | 17,3" FHD 360 Hz |
| Prozessor | Intel Core i9-12900HK (14 Cores, 20 Threads) |
| Grafikkarte | GeForce RTX 3080 Ti (175 W TGP) mit 16 GB GDDR6-VRAM |
| Arbeitsspeicher | 2x 16 GB Micron DDR5-4800 |
| Massenspeicher | 2x 2 TB Samsung NVMe-SSD |
| Betriebssystem | Windows 11 Pro 64 Bit |
Spezifikationen
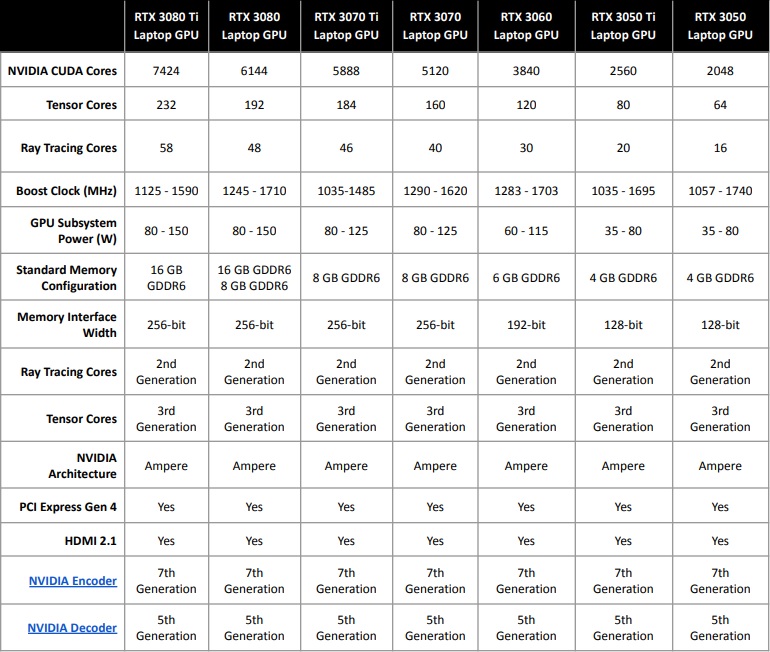
Auf dem Papier bietet die GeForce RTX 3080 Ti einige Vorteile gegenüber dem ehemaligen Spitzenreiter, der GeForce RTX 3080. So erhöht Nvidia nicht nur die Anzahl der CUDA Cores (7.424 vs. 6.144), was umgerechnet plus 20 % sind, sondern auch die für Ray Tracing besonders wichtigen Einheiten. So klettert die Menge der Ray Tracing Cores von 48 auf 58. Die Tensor Cores steigen ebenfalls, nämlich von 192 auf 232.
Im Gegenzug muss die RTX 3080 Ti mit einem geringeren Takt vorliebnehmen. Statt 1.245 bis 1.710 MHz gibt Nvidia nur noch 1.125 bis 1.590 MHz an (in der Praxis spielt das Kühlsystem eine zentrale Rolle). Gleich geblieben ist die Größe des Speicherinterfaces von 256 Bit. Dafür kann die RTX 3080 Ti jetzt standardmäßig mit 16 GB GDDR6-VRAM auftrumpfen, was im Jahr 2022 zeitgemäß für eine High-End-GPU ist. Die RTX 3080 hatte bei manchen Notebooks nur magere 8 GB.
Synthetische Benchmarks
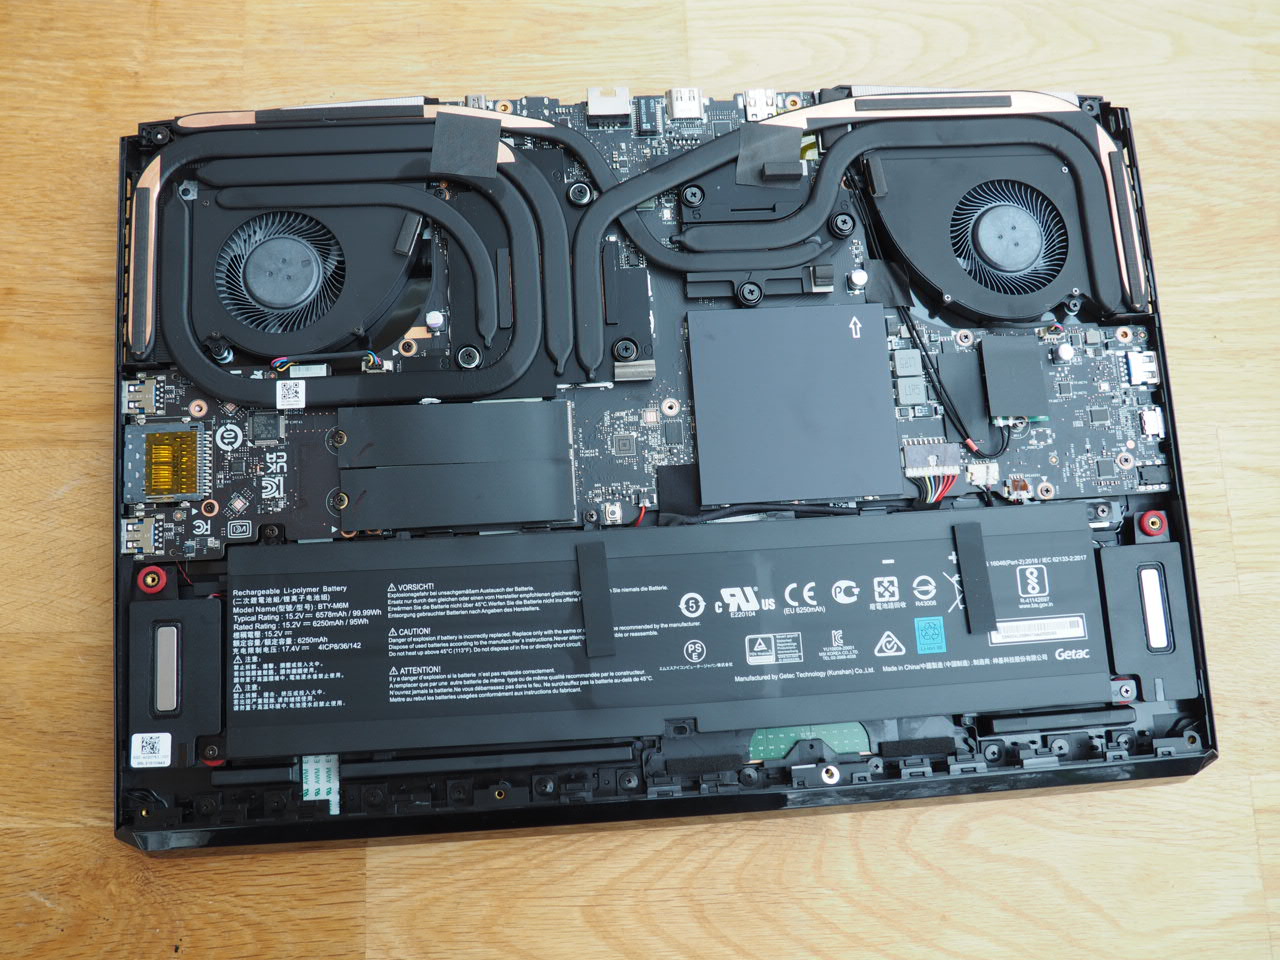
Wie bei den restlichen Ampere-Schwestern hängt die Leistungsfähigkeit der GeForce RTX 3080 Ti extrem von der eingestellten TGP ab. MSI spendiert dem GE76 eine maximale TGP von 175 Watt (inklusive Dynamic Boost), was dem Vollausbau der RTX 3080 Ti entspricht. Andere 3080-Ti-Laptops mit geringerer TGP können bei 3D-Anwendungen deutlich schlechter abschneiden.
Als Vergleichs-Kandidaten haben wir jedenfalls Notebooks gewählt, deren Grafikbeschleuniger ebenfalls über ihre Max-TGP-Einstellung verfügen, um faire Duelle zu garantieren. Neben der GeForce RTX 3080 tummelt sich im High-End-Bereich auch noch die GeForce RTX 3070. Alle günstigeren bzw. schwächeren RTX-Modelle (RTX 3060, RTX 3050 Ti etc.) sind inzwischen der Mittelklasse zuzuordnen. Ähnlich spannend ist der Vergleich zu den Desktop-Pendants, die ebenfalls in den Tabellen eingebaut sind.
Wenn es nach den synthetischen Grafikbenchmarks geht, kann sich die mobile RTX 3080 Ti nur bedingt von der mobilen RTX 3080 absetzen. In den 3DMark-Tests (Port Royal, Time Spy, Fire Strike) beläuft sich der Vorsprung auf knapp 10 bis 20 %. Die mobile RTX 3070 wird hingegen um rund 20 bis 30 % abgehängt. Insgesamt macht es sich die Notebook-RTX-3080-Ti ungefähr auf dem Niveau der Desktop-RTX-3070 bzw. knapp darüber bequem. Die Desktop-RTX-3080 hat um ca. 25 % die Nase vorn.
| 3DMark / Port Royal Graphics | |
| MSI GeForce RTX 3080 Gaming X Trio | |
| MSI GE76 Raider | |
| MSI GeForce RTX 3070 Gaming X Trio | |
| Alienware x17 RTX 3080 P48E | |
| Schenker XMG Apex 17 M21 | |
Gaming Benchmarks
Analog zu den synthetischen Grafikbenchmarks siedelt sich die mobile RTX 3080 Ti bei den Spieletests etwa auf dem Level der Desktop-RTX-3070 an, mit leichten Vorteilen zugunsten des Notebook-Chips. Die RTX 3080 Desktop ist in der Summe wieder um einen zweistelligen Prozentwert flotter. Ihre Laptop-Geschwister kann die mobile RTX 3080 Ti derweil gut in Schach halten - egal, ob mit Ray Tracing oder ohne.
Generell rechnet die GeForce RTX 3080 Ti schnell genug, um die meisten aktuellen Games auch in 4K (3.840 x 2.160 Pixel) mit maximalen Details auf den Bildschirm zu zaubern, sofern man notfalls auf Ray Tracing verzichtet. Eng wird es nur in Ausnahmefällen, die suboptimal programmiert bzw. optimiert sind, wie beispielweise Crysis Remastered und Cyberpunk 2077. Hier reicht es nicht immer für mehr als 30 bis 40 FPS. Anonsten wird in UHD oft die 60-FPS-Marke geknackt. Alle mit der RTX 3080 Ti getesteten Games finden Sie auf unserer GPU-Seite und der Spieleliste.
| Performance Rating - Percent | |
| MSI GeForce RTX 3080 Gaming X Trio -12! | |
| MSI GeForce RTX 3080 Gaming X Trio -8! | |
| MSI GE76 Raider | |
| MSI GeForce RTX 3070 Ventus 3X -8! | |
| MSI GeForce RTX 3070 Gaming X Trio -17! | |
| XMG Neo 15 @165 W TGP -11! | |
| XMG Neo 17 @140 W TGP -11! | |
| Far Cry 6 | |
| 2560x1440 Ultra Graphics Quality + HD Textures AA:T | |
| MSI GE76 Raider | |
| MSI GeForce RTX 3080 Gaming X Trio | |
| MSI GeForce RTX 3070 Ventus 3X | |
| XMG Neo 15 @165 W TGP | |
| XMG Neo 17 @140 W TGP | |
| 3840x2160 Ultra Graphics Quality + HD Textures AA:T | |
| MSI GeForce RTX 3080 Gaming X Trio | |
| MSI GeForce RTX 3070 Ventus 3X | |
| MSI GE76 Raider | |
| XMG Neo 15 @165 W TGP | |
| XMG Neo 17 @140 W TGP | |
| 1920x1080 Ultra Graphics Quality + HD Textures + DXR AA:T | |
| MSI GE76 Raider | |
| MSI GeForce RTX 3080 Gaming X Trio | |
| MSI GeForce RTX 3070 Ventus 3X | |
| XMG Neo 15 @165 W TGP | |
| XMG Neo 17 @140 W TGP | |
| Battlefield 2042 | |
| 2560x1440 Ultra Preset | |
| MSI GeForce RTX 3080 Gaming X Trio | |
| MSI GeForce RTX 3070 Ventus 3X | |
| MSI GE76 Raider | |
| XMG Neo 15 @165 W TGP | |
| XMG Neo 17 @140 W TGP | |
| 3840x2160 Ultra Preset | |
| MSI GeForce RTX 3080 Gaming X Trio | |
| MSI GeForce RTX 3070 Ventus 3X | |
| MSI GE76 Raider | |
| XMG Neo 15 @165 W TGP | |
| XMG Neo 17 @140 W TGP | |
| 1920x1080 Ultra Preset + Ray Tracing | |
| MSI GeForce RTX 3080 Gaming X Trio | |
| MSI GE76 Raider | |
| MSI GeForce RTX 3070 Ventus 3X | |
| XMG Neo 15 @165 W TGP | |
| XMG Neo 17 @140 W TGP | |
| Guardians of the Galaxy | |
| 2560x1440 Ultra Preset | |
| MSI GE76 Raider | |
| MSI GeForce RTX 3080 Gaming X Trio | |
| XMG Neo 15 @165 W TGP | |
| MSI GeForce RTX 3070 Ventus 3X | |
| XMG Neo 17 @140 W TGP | |
| 3840x2160 Ultra Preset | |
| MSI GeForce RTX 3080 Gaming X Trio | |
| MSI GE76 Raider | |
| MSI GeForce RTX 3070 Ventus 3X | |
| XMG Neo 15 @165 W TGP | |
| XMG Neo 17 @140 W TGP | |
| 1920x1080 Ultra Preset + Ultra Ray-Tracing | |
| MSI GE76 Raider | |
| MSI GeForce RTX 3080 Gaming X Trio | |
| MSI GeForce RTX 3070 Ventus 3X | |
| XMG Neo 15 @165 W TGP | |
| XMG Neo 17 @140 W TGP | |
| Resident Evil Village | |
| 2560x1440 Max Preset | |
| MSI GeForce RTX 3080 Gaming X Trio | |
| MSI GeForce RTX 3070 Ventus 3X | |
| MSI GE76 Raider | |
| 3840x2160 Max Preset | |
| MSI GeForce RTX 3080 Gaming X Trio | |
| MSI GE76 Raider | |
| MSI GeForce RTX 3070 Ventus 3X | |
| 1920x1080 Ray Tracing Preset | |
| MSI GeForce RTX 3080 Gaming X Trio | |
| MSI GeForce RTX 3070 Ventus 3X | |
| MSI GE76 Raider | |
| Watch Dogs Legion | |
| 2560x1440 Ultra Preset (DX12) | |
| MSI GeForce RTX 3080 Gaming X Trio | |
| MSI GE76 Raider | |
| MSI GeForce RTX 3070 Gaming X Trio | |
| 3840x2160 Ultra Preset (DX12) | |
| MSI GeForce RTX 3080 Gaming X Trio | |
| MSI GE76 Raider | |
| MSI GeForce RTX 3070 Gaming X Trio | |
| 1920x1080 Ultra Preset + Ultra Ray Tracing (DX12) | |
| MSI GeForce RTX 3080 Gaming X Trio | |
| MSI GE76 Raider | |
| MSI GeForce RTX 3070 Gaming X Trio | |
| Cyberpunk 2077 1.0 | |
| 1920x1080 Ray Tracing Ultra Preset (DLSS off) | |
| MSI GeForce RTX 3080 Gaming X Trio | |
| MSI GE76 Raider | |
| 3840x2160 Ultra Preset | |
| MSI GeForce RTX 3080 Gaming X Trio | |
| MSI GE76 Raider | |
| 2560x1440 Ultra Preset | |
| MSI GeForce RTX 3080 Gaming X Trio | |
| MSI GE76 Raider | |
| Crysis Remastered | |
| 2560x1440 Very High Preset AA:SM | |
| MSI GE76 Raider | |
| MSI GeForce RTX 3080 Gaming X Trio | |
| 3840x2160 Very High Preset AA:SM | |
| MSI GeForce RTX 3080 Gaming X Trio | |
| MSI GE76 Raider | |
Fazit
Bei der GeForce RTX 3080 Ti handelt es sich unserer Meinung nach um die erste Notebook-Grafikkarte, die wirklich für 4K-Displays geeignet ist. Mit den älteren Geschwistern musste man noch zu häufig Kompromisse hinsichtlich der Bildqualität eingehen. Entsprechend macht die mobile RTX 3080 Ti vor allem bei UHD-Laptops eine tolle Figur.
Wer nur mit 2.560 x 1.440 oder 1.920 x 1.080 Pixeln zockt, wird zwar ebenfalls einen Performance-Unterschied feststellen können, hier genügt aber meist noch ein Rechner auf RTX-3080- respektive RTX-3070-Basis. Der Rückstand zur Desktop-Riege bleibt indes groß. Viel mehr als RTX-3070-Niveau sollte man von der mobilen RTX 3080 Ti nicht erwarten (außer Spiele sind sehr VRAM-lastig). Für Notebook-Verhältnisse ist die gebotene Leistung dennoch beachtlich und derzeit konkurrenzlos gut.
Hinweis: In Kürze dürften dann auch die ersten Testgeräte mit RTX 3070 Ti eintrudeln.
