Skylake für Notebooks: Core i7-6700HQ und i7-6820HK im Test

Nachdem Intels Skylake-Generation bereits seit einigen Wochen im Desktop-Segment erhältlich ist, kommen nun auch die ersten Notebooks auf Basis der neuen Mikroarchitektur auf den Markt. Von den insgesamt 28 verschiedenen Modellen, die Intel Anfang September offiziell vorgestellt hat, haben heute zwei der schnellsten Quad-Core-Ableger – der Core i7-6700HQ sowie der Core i7-6820HK – den Weg in unser Testlabor gefunden. Auf Basis dieser beiden Modelle wollen wir nachfolgend einen ersten Blick auf die CPU- und GPU-Performance der Skylake-Serie werfen und des Weiteren die Fortschritte in puncto Energieeffizienz beleuchten.
Modellübersicht
Insgesamt acht Quad-Core-Prozessoren hat Intel zum Launch der mobilen Skylake-Generation präsentiert, davon zwei Xeon-Modelle für professionelle Workstation-Notebooks sowie zwei Core-i5-Chips ohne Hyper-Threading-Support. Die verbleibenden vier CPUs gehören der Core-i7-Serie an, die neben unseren beiden Testkandidaten i7-6700HQ und i7-6820HK auch noch den i7-6820HQ sowie das vorläufige Topmodell i7-6920HQ umfasst.
| Modell | Kerne/Threads | Basistakt | Turbo 1C/2C/4C | Grafikeinheit | TDP |
|---|---|---|---|---|---|
| Skylake | |||||
| i7-6920HQ | 4/8 | 2,9 GHz | 3,8/3,6/3,4 GHz | HD Graphics 530 (350 - 1.050 MHz) | 45 Watt |
| i7-6820HQ | 4/8 | 2,7 GHz | 3,6/3,4/3,2 GHz | HD Graphics 530 (350 - 1.050 MHz) | 45 Watt |
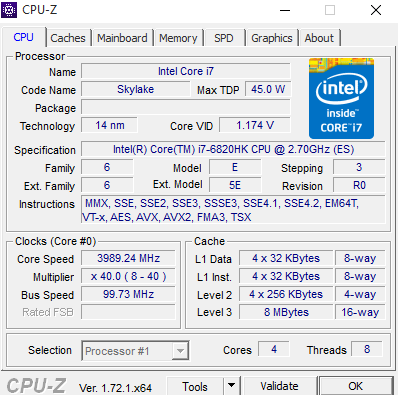
| i7-6820HK | 4/8 | 2,7 GHz | 3,6/3,4/3,2 GHz | HD Graphics 530 (350 - 1.050 MHz) | 45 Watt |
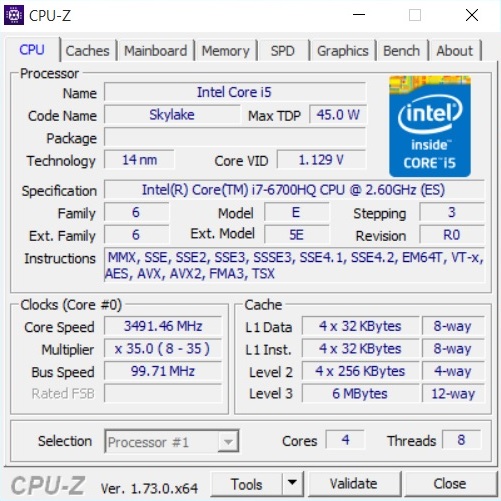
| i7-6700HQ | 4/8 | 2,6 GHz | 3,5/3,3/3,1 GHz | HD Graphics 530 (350 - 1.050 MHz) | 45 Watt |
| Broadwell (Auszug) | |||||
| i7-5700HQ | 4/8 | 2,7 GHz | 3,5/3,5/3,5 GHz | HD Graphics 5600 (300 - 1.050 MHz) | 47 Watt |
| Haswell (Auszug) | |||||
| i7-4940MX | 4/8 | 3,1 GHz | 4,0/3,9/3,8 GHz | HD Graphics 4600 (400 - 1.350 MHz) | 57 Watt |
| i7-4910MQ | 4/8 | 2,9 GHz | 3,9/3,8/3,7 GHz | HD Graphics 4600 (400 - 1.300 MHz) | 47 Watt |
| i7-4810MQ | 4/8 | 2,8 GHz | 3,8/3,7/3,6 GHz | HD Graphics 4600 (400 - 1.300 MHz) | 47 Watt |
| i7-4720HQ | 4/8 | 2,6 GHz | 3,6/3,5/3,4 GHz | HD Graphics 4600 (400 - 1.200 MHz) | 47 Watt |
Wirft man einen Blick auf die Spezifikationen der neuen CPUs, so fallen gleich mehrere Besonderheiten auf: Unter anderem taktet Skylake zumindest in dieser Klasse deutlich niedriger als Haswell und Broadwell, insbesondere bei Belastung aller vier Kerne. So liegt der Quad-Core-Turbo des Core i7-6700HQ bei nur 3,1 GHz und damit weit unter den Vorgängern Core i7-4720HQ (Haswell, 3,4 GHz) und Core i7-5700HQ (Broadwell, 3,5 GHz). Auch wenn die Pro-MHz-Leistung leicht gestiegen ist: Größere Performance-Sprünge erscheinen so nur schwer möglich.
Ebenfalls überraschend kommt der Entfall der sogenannten Extreme-Edition-Modelle, die bislang die Speerspitze des Portfolios repräsentierten. Mit dem Core i7-6820HK existiert zwar auch weiterhin eine CPU mit freiem Multiplikator, TDP und Basisfrequenzen bewegen sich jedoch abermals weit unter dem bisherigen Niveau. Laut Intel wurde der 6820HK bei internen Tests und mit Luftkühlung aber bereits auf 4,2 GHz übertaktet, was die CPU zu einem würdigen – und obendrein sehr viel preisgünstigeren – Nachfolger des 4940MX machen würde.
Die Testgeräte
Die nachfolgenden Benchmarks des Core i7-6700HQ und i7-6820HK wurden von uns auf zwei Clevo-Barebones durchgeführt, die wir Ihnen zu diesem Zeitpunkt leider noch nicht genauer vorstellen dürfen. Beide Testgeräte waren mit 2x 8 GB DDR4-2400-Speicher sowie einer PCIe-SSD von Samsung bestückt, softwareseitig kamen Windows 10 Pro in der 64-Bit-Version sowie der Intel-Grafiktreiber 10.18.15.4256 zum Einsatz.
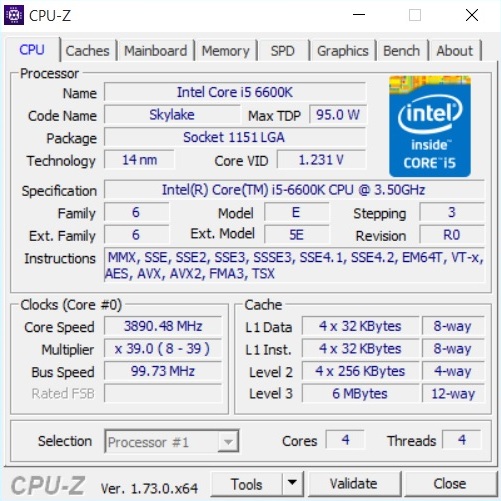
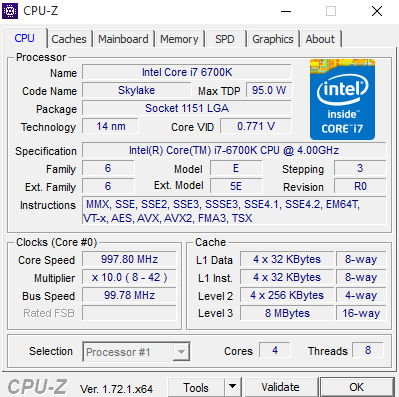
Die zu Vergleichszwecken angeführten Desktop-CPUs Core i7-6700K und Core i5-6600K wurden ebenfalls in Barebones des Herstellers Clevo vermessen, genauer gesagt den Modellen P771DM (Schenker XMG U706) sowie P751DM (Schenker XMG U506). Beide Geräte, ebenfalls mit 2x 8 GB DDR4-2400 und PCIe-SSDs ausgestattet, werden von uns in Kürze in eigenen Testberichten ausführlich präsentiert.
Alle weiteren Messwerte diverser Broadwell- und Haswell-Systeme stammen aus älteren Reviews, weshalb wir in diesen Fällen keine einheitliche Ausstattung und Software-Basis sicherstellen konnten. Nähere Details zu den jeweiligen Geräten sind der Legende respektive den zugehörigen Artikeln zu entnehmen.
Benchmarks
CPU-Performance
Im Mittel über sämtliche Benchmarks rechnet Skylake bei gleicher Frequenz rund 10 Prozent schneller als der Vor-Vorgänger Haswell, gegenüber Broadwell beträgt der Vorsprung noch immer etwa 5 Prozent. Dass sich der Core i7-6820HK dennoch nicht unangefochten an die Spitze des Testfeldes setzen kann, ist wie bereits angesprochen auf die vergleichsweise niedrigen Taktraten zurückzuführen: Zumindest bei Multi-Threading behält der Broadwell-basierte Core i7-5700HQ dank 300 MHz höherem 4-Kern-Turbo knapp die Oberhand, während bei Single-Threading der bis zu 4,0 GHz schnelle i7-4940MX dominiert. In den meisten Fällen sind die Leistungsdifferenzen aber ohnehin so klein, dass der Anwender zwischen einem schnellen Haswell-, Broadwell- und Skylake-Quad-Core keinen Unterschied spüren wird.
Die defensive Taktung der Skylake-Chips hat übrigens auch ihre Vorteile: In Verbindung mit der fortschrittlichen 14-Nanometer-Fertigung ergibt sich eine recht niedrige Leistungsaufnahme, sodass sowohl der Core i7-6700HQ als auch i7-6820HK bei reiner CPU-Last stets unter ihrer TDP-Grenze von 45 Watt operieren. Anders als bei vielen Haswell-Ablegern wird der spezifizierte Turbo Boost darum selbst bei Volllast dauerhaft stabil gehalten. Der in der Vergangenheit oftmals zweifelhafte Mehrwert der schnellsten Core-i7-Modelle, die dann in der Praxis durch ihr TDP-Limit ausgebremst wurden, fällt bei Skylake deshalb deutlich größer aus – davon profitiert in erster Linie das Topmodell i7-6920HQ.
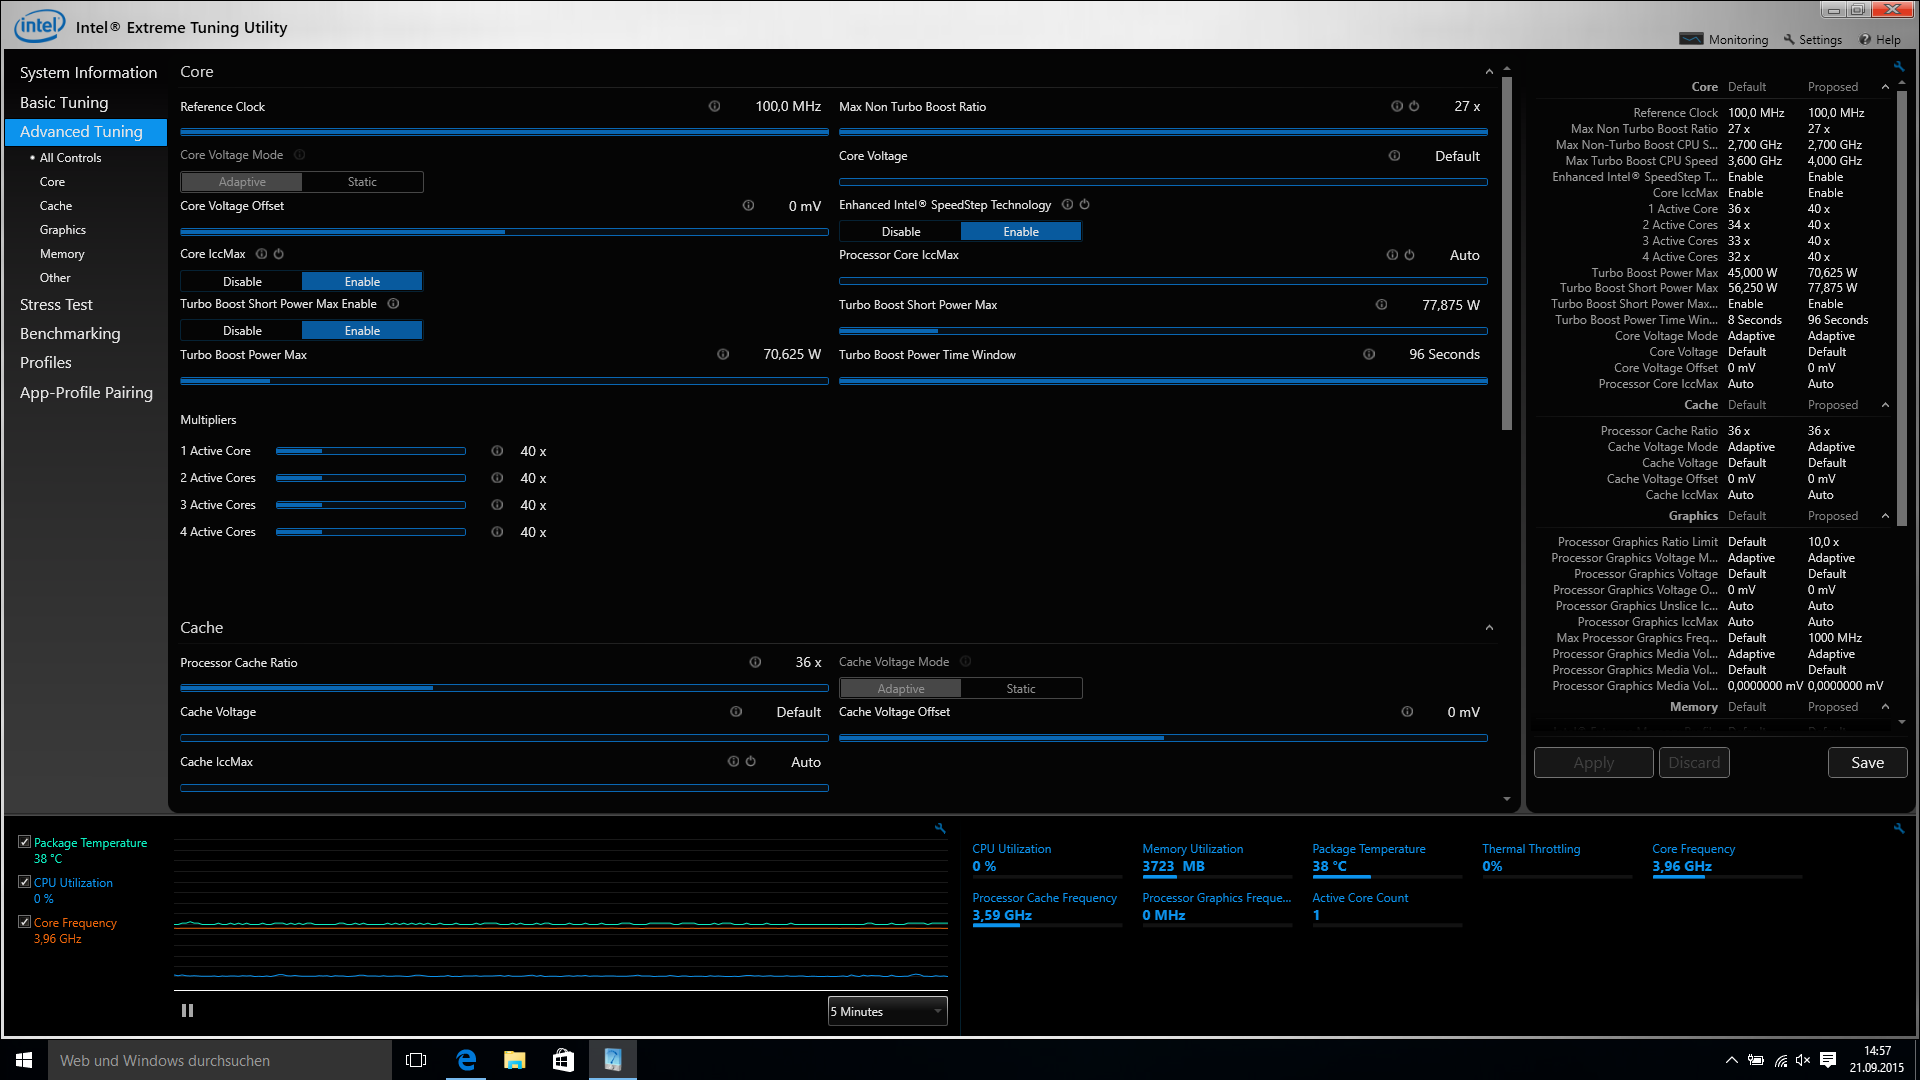
Natürlich haben wir es uns nicht nehmen lassen, die OC-Möglichkeiten des Core i7-6820HK praktisch auszutesten und mittels Intels XTU-Tool sämtliche Turbo-Stufen auf 4,0 GHz festgesetzt. Derart übertaktet steigt die Performance um circa 10 bis 20 Prozent an, was die CPU knapp auf das Level des Desktop-Modells Core i7-6700K (4,0 - 4,2 GHz) hebt. Bei guter Kühlung, optimierten Spannungen (wir haben mit "Adaptive Core Voltage" gearbeitet) und Anhebung der maximal zulässigen Ströme ("Core IccMax") dürfte sich sogar noch mehr Leistung herauskitzeln lassen.
| Cinebench R11.5 | |
| CPU Single 64Bit (nach Ergebnis sortieren) | |
| Intel Core i7-6820HK @ 4 GHz | |
| Intel Core i7-6820HK | |
| Intel Core i7-6700HQ | |
| Intel Core i7-5700HQ | |
| Intel Core i7-4940MX | |
| Intel Core i7-4930MX | |
| Intel Core i7-4800MQ | |
| Intel Core i7-4720HQ | |
| Intel Core i7-6700K | |
| Intel Core i5-6600K | |
| CPU Multi 64Bit (nach Ergebnis sortieren) | |
| Intel Core i7-6820HK @ 4 GHz | |
| Intel Core i7-6820HK | |
| Intel Core i7-6700HQ | |
| Intel Core i7-5700HQ | |
| Intel Core i7-4940MX | |
| Intel Core i7-4930MX | |
| Intel Core i7-4800MQ | |
| Intel Core i7-4720HQ | |
| Intel Core i7-6700K | |
| Intel Core i5-6600K | |
| Cinebench R15 | |
| CPU Single 64Bit (nach Ergebnis sortieren) | |
| Intel Core i7-6820HK @ 4 GHz | |
| Intel Core i7-6820HK | |
| Intel Core i7-6700HQ | |
| Intel Core i7-5700HQ | |
| Intel Core i7-4940MX | |
| Intel Core i7-4720HQ | |
| Intel Core i7-6700K | |
| Intel Core i5-6600K | |
| CPU Multi 64Bit (nach Ergebnis sortieren) | |
| Intel Core i7-6820HK @ 4 GHz | |
| Intel Core i7-6820HK | |
| Intel Core i7-6700HQ | |
| Intel Core i7-5700HQ | |
| Intel Core i7-4940MX | |
| Intel Core i7-4720HQ | |
| Intel Core i7-6700K | |
| Intel Core i5-6600K | |
| X264 HD Benchmark 4.0 | |
| Pass 1 (nach Ergebnis sortieren) | |
| Intel Core i7-6820HK @ 4 GHz | |
| Intel Core i7-6820HK | |
| Intel Core i7-6700HQ | |
| Intel Core i7-5700HQ | |
| Intel Core i7-4940MX | |
| Intel Core i7-4930MX | |
| Intel Core i7-4800MQ | |
| Intel Core i7-4720HQ | |
| Intel Core i7-6700K | |
| Intel Core i5-6600K | |
| Pass 2 (nach Ergebnis sortieren) | |
| Intel Core i7-6820HK @ 4 GHz | |
| Intel Core i7-6820HK | |
| Intel Core i7-6700HQ | |
| Intel Core i7-5700HQ | |
| Intel Core i7-4940MX | |
| Intel Core i7-4930MX | |
| Intel Core i7-4800MQ | |
| Intel Core i7-4720HQ | |
| Intel Core i7-6700K | |
| Intel Core i5-6600K | |
| TrueCrypt | |
| AES Mean 100MB (nach Ergebnis sortieren) | |
| Intel Core i7-6820HK @ 4 GHz | |
| Intel Core i7-6820HK | |
| Intel Core i7-6700HQ | |
| Intel Core i7-5700HQ | |
| Intel Core i7-4940MX | |
| Intel Core i7-4930MX | |
| Intel Core i7-4800MQ | |
| Intel Core i7-4720HQ | |
| Intel Core i7-6700K | |
| Intel Core i5-6600K | |
| Twofish Mean 100MB (nach Ergebnis sortieren) | |
| Intel Core i7-6820HK @ 4 GHz | |
| Intel Core i7-6820HK | |
| Intel Core i7-6700HQ | |
| Intel Core i7-5700HQ | |
| Intel Core i7-4940MX | |
| Intel Core i7-4930MX | |
| Intel Core i7-4800MQ | |
| Intel Core i7-4720HQ | |
| Intel Core i7-6700K | |
| Intel Core i5-6600K | |
| Serpent Mean 100MB (nach Ergebnis sortieren) | |
| Intel Core i7-6820HK @ 4 GHz | |
| Intel Core i7-6820HK | |
| Intel Core i7-6700HQ | |
| Intel Core i7-5700HQ | |
| Intel Core i7-4940MX | |
| Intel Core i7-4930MX | |
| Intel Core i7-4800MQ | |
| Intel Core i7-4720HQ | |
| Intel Core i7-6700K | |
| Intel Core i5-6600K | |
| WinRAR - Result (nach Ergebnis sortieren) | |
| Intel Core i7-6820HK @ 4 GHz | |
| Intel Core i7-6820HK | |
| Intel Core i7-6700HQ | |
| Intel Core i7-4930MX | |
| Intel Core i7-6700K | |
| Intel Core i5-6600K | |
| Super Pi Mod 1.5 XS 32M - 32M (nach Ergebnis sortieren) | |
| Intel Core i7-6820HK @ 4 GHz | |
| Intel Core i7-6820HK | |
| Intel Core i7-6700HQ | |
| Intel Core i7-5700HQ | |
| Intel Core i7-4940MX | |
| Intel Core i7-4930MX | |
| Intel Core i7-4800MQ | |
| Intel Core i7-4720HQ | |
| Intel Core i7-6700K | |
| Intel Core i5-6600K | |
| 3DMark 06 - CPU - CPU Score (nach Ergebnis sortieren) | |
| Intel Core i7-6820HK @ 4 GHz | |
| Intel Core i7-6820HK | |
| Intel Core i7-6700HQ | |
| Intel Core i7-5700HQ | |
| Intel Core i7-4940MX | |
| Intel Core i7-4930MX | |
| Intel Core i7-4800MQ | |
| Intel Core i7-4720HQ | |
| Intel Core i7-6700K | |
| Intel Core i5-6600K | |
| Geekbench 3 | |
| 64 Bit Single-Core Score (nach Ergebnis sortieren) | |
| Intel Core i7-6820HK @ 4 GHz | |
| Intel Core i7-6820HK | |
| Intel Core i7-6700HQ | |
| Intel Core i7-6700K | |
| Intel Core i5-6600K | |
| 64 Bit Multi-Core Score (nach Ergebnis sortieren) | |
| Intel Core i7-6820HK @ 4 GHz | |
| Intel Core i7-6820HK | |
| Intel Core i7-6700HQ | |
| Intel Core i7-6700K | |
| Intel Core i5-6600K | |
| Mozilla Kraken 1.1 - Total (nach Ergebnis sortieren) | |
| Intel Core i7-6820HK @ 4 GHz | |
| Intel Core i7-6820HK | |
| Intel Core i7-6700HQ | |
| Intel Core i7-6700K | |
| Intel Core i5-6600K | |
| Octane V2 - Total Score (nach Ergebnis sortieren) | |
| Intel Core i7-6820HK @ 4 GHz | |
| Intel Core i7-6820HK | |
| Intel Core i7-6700HQ | |
| Intel Core i7-6700K | |
| Intel Core i5-6600K | |
* ... kleinere Werte sind besser
GPU-Performance
Insgesamt vier verschiedene integrierte Grafiklösungen auf Basis der "Gen9-Architektur" hat Intel für die Skylake-Generation vorgesehen:
- GT1 (12 EUs, kein eDRAM): HD Graphics (Skylake), HD Graphics 510
- GT2 (24 EUs, kein eDRAM): HD Graphics 515, HD Graphics 520, HD Graphics 530
- GT3e (48 EUs, 64 MB eDRAM): Iris Graphics 540, Iris Graphics 550
- GT4e (72 EUs, 128 MB eDRAM): Iris Pro Graphics 580 (?)
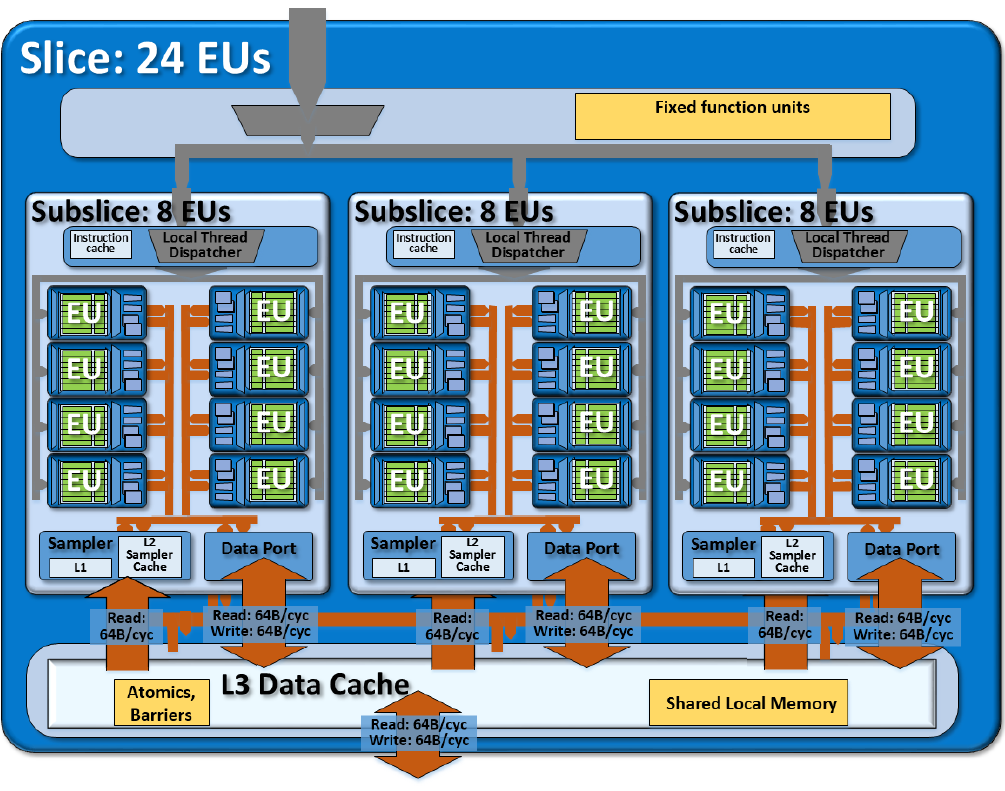
Die in den nun vorgestellten Quad-Core-Chips verbaute GT2-Version namens HD Graphics 530 stellt folglich die zweitkleinste Ausbaustufe der GPU dar und tritt die Nachfolge der HD Graphics 4600 (20 EUs, Intel Gen7.5, Haswell) und HD Graphics 5600 (24 EUs, Intel Gen8, Broadwell) an. Dank verschiedener Design-Optimierungen sollen Performance und Energieeffizienz erneut kräftig gestiegen sein, zudem profitiert die Grafikeinheit vom erstmaligen Support für DDR4-Hauptspeicher.
Die resultierenden Leistungsgewinne können sich durchaus sehen lassen und bewegen sich – mit einigen Ausreißern nach oben und unten – in einer Größenordnung von etwa 25 bis 30 Prozent gegenüber der HD Graphics 4600. Obwohl dies im Vergleich zur jüngeren HD Graphics 5600 nur einen Zuwachs von rund 5 Prozent bedeutet, erreicht die HD Graphics 530 so eine ordentliche Performance auf dem Niveau einer dedizierten Nvidia GeForce 920M. Wer Abstriche bei Auflösung und Detailgrad akzeptiert, kann damit viele aktuelle Titel in flüssigen Frameraten spielen. Deutlich höhere Settings wird wohl erst die für 2016 erwartete GT4e-Variante mit dreifacher Shaderzahl und 128 MB eDRAM-Speicher bewältigen.
Leider sind wir im Verlauf unseres Tests auch auf einige Probleme gestoßen, die von teils unerklärlich geringen Frameraten (Counter-Strike: GO, GTA V, Watch Dogs, Luxmark) bis hin zu reproduzierbaren Abstürzen (Call of Duty: Advanced Warfare) reichten. Wir vermuten, dass dies nicht (nur) auf den Intel-Grafiktreiber, sondern auch einige Kinderkrankheiten im Zusammenspiel mit Optimus zurückzuführen ist (sämtliche Skylake-Testgeräte waren mit einer dedizierten Nvidia-GPU bestückt, die von uns für die Messungen deaktiviert wurde) und werden versuchen, die entsprechenden Benchmarks mit zukünftigen Testgeräten nachzuholen.
| 3DMark 11 - 1280x720 Performance GPU (nach Ergebnis sortieren) | |
| Intel HD Graphics 530 | |
| Intel HD Graphics 530 | |
| Intel Iris Pro Graphics 5200 | |
| Intel HD Graphics 5600 | |
| Intel HD Graphics 4600 | |
| Intel HD Graphics 4600 | |
| NVIDIA GeForce 940M | |
| NVIDIA GeForce 940M | |
| NVIDIA GeForce 930M | |
| NVIDIA GeForce 930M | |
| NVIDIA GeForce 920M | |
| NVIDIA GeForce 920M | |
| 3DMark - 1920x1080 Fire Strike Graphics (nach Ergebnis sortieren) | |
| Intel HD Graphics 530 | |
| Intel HD Graphics 530 | |
| Intel Iris Pro Graphics 5200 | |
| Intel HD Graphics 5600 | |
| Intel HD Graphics 4600 | |
| Intel HD Graphics 4600 | |
| NVIDIA GeForce 940M | |
| NVIDIA GeForce 940M | |
| NVIDIA GeForce 930M | |
| NVIDIA GeForce 930M | |
| NVIDIA GeForce 920M | |
| NVIDIA GeForce 920M | |
| NVIDIA GeForce 920M | |
| Fifa 15 | |
| 1280x720 Low Preset (nach Ergebnis sortieren) | |
| Intel HD Graphics 530 | |
| Intel Iris Pro Graphics 5200 | |
| Intel HD Graphics 5600 | |
| Intel HD Graphics 4600 | |
| NVIDIA GeForce 920M | |
| NVIDIA GeForce 920M | |
| AMD Radeon R7 (Kaveri) | |
| 1366x768 High Preset AA:2x MS (nach Ergebnis sortieren) | |
| Intel HD Graphics 530 | |
| Intel Iris Pro Graphics 5200 | |
| Intel HD Graphics 5600 | |
| Intel HD Graphics 4600 | |
| NVIDIA GeForce 940M | |
| NVIDIA GeForce 930M | |
| NVIDIA GeForce 930M | |
| NVIDIA GeForce 920M | |
| NVIDIA GeForce 920M | |
| AMD Radeon R7 (Kaveri) | |
| Sims 4 | |
| 1366x768 Medium Preset (nach Ergebnis sortieren) | |
| Intel HD Graphics 530 | |
| Intel Iris Pro Graphics 5200 | |
| Intel HD Graphics 5600 | |
| Intel HD Graphics 4600 | |
| NVIDIA GeForce 920M | |
| NVIDIA GeForce 920M | |
| AMD Radeon R7 (Kaveri) | |
| 1920x1080 High Preset (nach Ergebnis sortieren) | |
| Intel HD Graphics 530 | |
| Intel Iris Pro Graphics 5200 | |
| Intel HD Graphics 5600 | |
| Intel HD Graphics 4600 | |
| NVIDIA GeForce 920M | |
| NVIDIA GeForce 920M | |
| AMD Radeon R7 (Kaveri) | |
| GRID: Autosport | |
| 1366x768 Medium Preset (nach Ergebnis sortieren) | |
| Intel HD Graphics 530 | |
| Intel Iris Pro Graphics 5200 | |
| Intel HD Graphics 5600 | |
| Intel HD Graphics 4600 | |
| NVIDIA GeForce 940M | |
| NVIDIA GeForce 940M | |
| NVIDIA GeForce 930M | |
| NVIDIA GeForce 930M | |
| NVIDIA GeForce 920M | |
| 1920x1080 High Preset (nach Ergebnis sortieren) | |
| Intel HD Graphics 530 | |
| Intel Iris Pro Graphics 5200 | |
| Intel HD Graphics 5600 | |
| Intel HD Graphics 4600 | |
| NVIDIA GeForce 940M | |
| NVIDIA GeForce 940M | |
| NVIDIA GeForce 930M | |
| NVIDIA GeForce 930M | |
| NVIDIA GeForce 920M | |
| BioShock Infinite | |
| 1280x720 Very Low Preset (nach Ergebnis sortieren) | |
| Intel HD Graphics 530 | |
| Intel HD Graphics 530 | |
| Intel Iris Pro Graphics 5200 | |
| Intel HD Graphics 5600 | |
| Intel HD Graphics 4600 | |
| NVIDIA GeForce 940M | |
| NVIDIA GeForce 930M | |
| NVIDIA GeForce 920M | |
| AMD Radeon R7 (Kaveri) | |
| 1366x768 Medium Preset (nach Ergebnis sortieren) | |
| Intel HD Graphics 530 | |
| Intel HD Graphics 530 | |
| Intel Iris Pro Graphics 5200 | |
| Intel HD Graphics 5600 | |
| Intel HD Graphics 4600 | |
| NVIDIA GeForce 940M | |
| NVIDIA GeForce 940M | |
| NVIDIA GeForce 930M | |
| NVIDIA GeForce 930M | |
| NVIDIA GeForce 920M | |
| AMD Radeon R7 (Kaveri) | |
| 1366x768 High Preset (nach Ergebnis sortieren) | |
| Intel HD Graphics 530 | |
| Intel HD Graphics 530 | |
| Intel Iris Pro Graphics 5200 | |
| Intel HD Graphics 5600 | |
| Intel HD Graphics 4600 | |
| NVIDIA GeForce 940M | |
| NVIDIA GeForce 940M | |
| NVIDIA GeForce 930M | |
| NVIDIA GeForce 930M | |
| NVIDIA GeForce 920M | |
| AMD Radeon R7 (Kaveri) | |
| Tomb Raider | |
| 1024x768 Low Preset (nach Ergebnis sortieren) | |
| Intel HD Graphics 530 | |
| Intel HD Graphics 530 | |
| Intel Iris Pro Graphics 5200 | |
| Intel HD Graphics 5600 | |
| Intel HD Graphics 4600 | |
| NVIDIA GeForce 930M | |
| NVIDIA GeForce 920M | |
| NVIDIA GeForce 920M | |
| AMD Radeon R7 (Kaveri) | |
| 1366x768 Normal Preset AA:FX AF:4x (nach Ergebnis sortieren) | |
| Intel HD Graphics 530 | |
| Intel HD Graphics 530 | |
| Intel Iris Pro Graphics 5200 | |
| Intel HD Graphics 5600 | |
| Intel HD Graphics 4600 | |
| NVIDIA GeForce 940M | |
| NVIDIA GeForce 930M | |
| NVIDIA GeForce 930M | |
| NVIDIA GeForce 920M | |
| NVIDIA GeForce 920M | |
| AMD Radeon R7 (Kaveri) | |
| 1366x768 High Preset AA:FX AF:8x (nach Ergebnis sortieren) | |
| Intel HD Graphics 530 | |
| Intel HD Graphics 530 | |
| Intel Iris Pro Graphics 5200 | |
| Intel HD Graphics 5600 | |
| Intel HD Graphics 4600 | |
| NVIDIA GeForce 940M | |
| NVIDIA GeForce 930M | |
| NVIDIA GeForce 930M | |
| NVIDIA GeForce 920M | |
| NVIDIA GeForce 920M | |
| AMD Radeon R7 (Kaveri) | |
| Diablo III | |
| 1024x768 Low / off (nach Ergebnis sortieren) | |
| Intel HD Graphics 530 | |
| Intel Iris Pro Graphics 5200 | |
| Intel HD Graphics 4600 | |
| NVIDIA GeForce 920M | |
| NVIDIA GeForce 920M | |
| 1366x768 Medium / low (nach Ergebnis sortieren) | |
| Intel HD Graphics 530 | |
| Intel Iris Pro Graphics 5200 | |
| Intel HD Graphics 4600 | |
| NVIDIA GeForce 920M | |
| NVIDIA GeForce 920M | |
| 1366x768 High AA:on (nach Ergebnis sortieren) | |
| Intel HD Graphics 530 | |
| Intel Iris Pro Graphics 5200 | |
| Intel HD Graphics 4600 | |
| NVIDIA GeForce 920M | |
| NVIDIA GeForce 920M | |
| Crysis 3 | |
| 1024x768 Low Preset (nach Ergebnis sortieren) | |
| Intel HD Graphics 530 | |
| Intel Iris Pro Graphics 5200 | |
| Intel HD Graphics 5600 | |
| Intel HD Graphics 4600 | |
| NVIDIA GeForce 940M | |
| NVIDIA GeForce 930M | |
| NVIDIA GeForce 930M | |
| AMD Radeon R7 (Kaveri) | |
| 1366x768 Medium Preset AF:16x (nach Ergebnis sortieren) | |
| Intel HD Graphics 530 | |
| Intel Iris Pro Graphics 5200 | |
| Intel HD Graphics 5600 | |
| Intel HD Graphics 4600 | |
| NVIDIA GeForce 940M | |
| NVIDIA GeForce 930M | |
| NVIDIA GeForce 930M | |
| AMD Radeon R7 (Kaveri) | |
| 1366x768 High Preset AA:FX AF:16x (nach Ergebnis sortieren) | |
| Intel HD Graphics 530 | |
| Intel Iris Pro Graphics 5200 | |
| Intel HD Graphics 5600 | |
| Intel HD Graphics 4600 | |
| AMD Radeon R7 (Kaveri) | |
| Metro: Last Light | |
| 1024x768 Low (DX10) AF:4x (nach Ergebnis sortieren) | |
| Intel HD Graphics 530 | |
| Intel Iris Pro Graphics 5200 | |
| Intel HD Graphics 5600 | |
| Intel HD Graphics 4600 | |
| NVIDIA GeForce 940M | |
| NVIDIA GeForce 930M | |
| NVIDIA GeForce 930M | |
| AMD Radeon R7 (Kaveri) | |
| 1366x768 Medium (DX10) AF:4x (nach Ergebnis sortieren) | |
| Intel HD Graphics 530 | |
| Intel Iris Pro Graphics 5200 | |
| Intel HD Graphics 5600 | |
| Intel HD Graphics 4600 | |
| NVIDIA GeForce 940M | |
| NVIDIA GeForce 930M | |
| NVIDIA GeForce 930M | |
| AMD Radeon R7 (Kaveri) | |
| 1366x768 High (DX11) AF:16x (nach Ergebnis sortieren) | |
| Intel HD Graphics 530 | |
| Intel Iris Pro Graphics 5200 | |
| Intel HD Graphics 5600 | |
| Intel HD Graphics 4600 | |
| NVIDIA GeForce 940M | |
| NVIDIA GeForce 930M | |
| NVIDIA GeForce 930M | |
| AMD Radeon R7 (Kaveri) | |
| Thief | |
| 1024x768 Very Low Preset (nach Ergebnis sortieren) | |
| Intel HD Graphics 530 | |
| Intel HD Graphics 5600 | |
| Intel HD Graphics 4600 | |
| NVIDIA GeForce 940M | |
| NVIDIA GeForce 930M | |
| NVIDIA GeForce 930M | |
| NVIDIA GeForce 920M | |
| AMD Radeon R7 (Kaveri) | |
| 1366x768 Normal Preset AA:FX (nach Ergebnis sortieren) | |
| Intel HD Graphics 530 | |
| Intel HD Graphics 5600 | |
| Intel HD Graphics 4600 | |
| NVIDIA GeForce 940M | |
| NVIDIA GeForce 930M | |
| NVIDIA GeForce 930M | |
| NVIDIA GeForce 920M | |
| AMD Radeon R7 (Kaveri) | |
| 1366x768 High Preset AA:FXAA & Low SS AF:4x (nach Ergebnis sortieren) | |
| Intel HD Graphics 530 | |
| Intel HD Graphics 5600 | |
| Intel HD Graphics 4600 | |
| NVIDIA GeForce 930M | |
| NVIDIA GeForce 930M | |
| NVIDIA GeForce 920M | |
| AMD Radeon R7 (Kaveri) | |
| Evolve | |
| 1024x768 Low Graphics Quality (nach Ergebnis sortieren) | |
| Intel HD Graphics 530 | |
| Intel Iris Pro Graphics 5200 | |
| Intel HD Graphics 5600 | |
| Intel HD Graphics 4600 | |
| NVIDIA GeForce 940M | |
| NVIDIA GeForce 930M | |
| NVIDIA GeForce 930M | |
| NVIDIA GeForce 920M | |
| NVIDIA GeForce 920M | |
| NVIDIA GeForce 920M | |
| AMD Radeon R7 (Kaveri) | |
| 1366x768 Medium Graphics Quality (nach Ergebnis sortieren) | |
| Intel HD Graphics 530 | |
| Intel Iris Pro Graphics 5200 | |
| Intel HD Graphics 5600 | |
| Intel HD Graphics 4600 | |
| NVIDIA GeForce 940M | |
| NVIDIA GeForce 930M | |
| NVIDIA GeForce 930M | |
| NVIDIA GeForce 920M | |
| NVIDIA GeForce 920M | |
| NVIDIA GeForce 920M | |
| AMD Radeon R7 (Kaveri) | |
| 1920x1080 High Graphics Quality AA:FX (nach Ergebnis sortieren) | |
| Intel HD Graphics 530 | |
| Intel Iris Pro Graphics 5200 | |
| Intel HD Graphics 5600 | |
| NVIDIA GeForce 920M | |
| NVIDIA GeForce 920M | |
| NVIDIA GeForce 920M | |
| AMD Radeon R7 (Kaveri) | |
| Battlefield Hardline | |
| 1024x768 Low Graphics Quality (DX11) (nach Ergebnis sortieren) | |
| Intel HD Graphics 530 | |
| Intel Iris Pro Graphics 5200 | |
| Intel HD Graphics 5600 | |
| Intel HD Graphics 4600 | |
| NVIDIA GeForce 940M | |
| NVIDIA GeForce 930M | |
| NVIDIA GeForce 930M | |
| NVIDIA GeForce 920M | |
| NVIDIA GeForce 920M | |
| NVIDIA GeForce 920M | |
| AMD Radeon R7 (Kaveri) | |
| 1366x768 Medium Graphics Quality (DX11) (nach Ergebnis sortieren) | |
| Intel HD Graphics 530 | |
| Intel Iris Pro Graphics 5200 | |
| Intel HD Graphics 5600 | |
| Intel HD Graphics 4600 | |
| NVIDIA GeForce 940M | |
| NVIDIA GeForce 930M | |
| NVIDIA GeForce 930M | |
| NVIDIA GeForce 920M | |
| NVIDIA GeForce 920M | |
| NVIDIA GeForce 920M | |
| AMD Radeon R7 (Kaveri) | |
| 1920x1080 High Graphics Quality (DX11) (nach Ergebnis sortieren) | |
| Intel HD Graphics 530 | |
| Intel Iris Pro Graphics 5200 | |
| Intel HD Graphics 5600 | |
| Intel HD Graphics 4600 | |
| NVIDIA GeForce 940M | |
| NVIDIA GeForce 930M | |
| NVIDIA GeForce 930M | |
| NVIDIA GeForce 920M | |
| NVIDIA GeForce 920M | |
| NVIDIA GeForce 920M | |
| AMD Radeon R7 (Kaveri) | |
| Dirt Rally | |
| 1024x768 Ultra Low Preset (nach Ergebnis sortieren) | |
| Intel HD Graphics 530 | |
| Intel Iris Pro Graphics 5200 | |
| Intel HD Graphics 5600 | |
| Intel HD Graphics 4600 | |
| NVIDIA GeForce 930M | |
| NVIDIA GeForce 920M | |
| NVIDIA GeForce 920M | |
| NVIDIA GeForce 920M | |
| AMD Radeon R7 (Kaveri) | |
| 1366x768 Medium Preset (nach Ergebnis sortieren) | |
| Intel HD Graphics 530 | |
| Intel Iris Pro Graphics 5200 | |
| Intel HD Graphics 5600 | |
| Intel HD Graphics 4600 | |
| NVIDIA GeForce 930M | |
| NVIDIA GeForce 930M | |
| NVIDIA GeForce 920M | |
| NVIDIA GeForce 920M | |
| NVIDIA GeForce 920M | |
| AMD Radeon R7 (Kaveri) | |
| 1920x1080 High Preset (nach Ergebnis sortieren) | |
| Intel HD Graphics 530 | |
| Intel Iris Pro Graphics 5200 | |
| Intel HD Graphics 5600 | |
| Intel HD Graphics 4600 | |
| NVIDIA GeForce 930M | |
| NVIDIA GeForce 930M | |
| NVIDIA GeForce 920M | |
| NVIDIA GeForce 920M | |
| NVIDIA GeForce 920M | |
| AMD Radeon R7 (Kaveri) | |
| Civilization: Beyond Earth | |
| 1024x768 Minimum Preset (nach Ergebnis sortieren) | |
| Intel HD Graphics 530 | |
| Intel Iris Pro Graphics 5200 | |
| Intel HD Graphics 4600 | |
| NVIDIA GeForce 940M | |
| NVIDIA GeForce 930M | |
| AMD Radeon R7 (Kaveri) | |
| 1366x768 Medium Preset (nach Ergebnis sortieren) | |
| Intel HD Graphics 530 | |
| Intel Iris Pro Graphics 5200 | |
| Intel HD Graphics 4600 | |
| NVIDIA GeForce 940M | |
| NVIDIA GeForce 930M | |
| NVIDIA GeForce 930M | |
| AMD Radeon R7 (Kaveri) | |
| 1920x1080 High Preset (nach Ergebnis sortieren) | |
| Intel HD Graphics 530 | |
| Intel Iris Pro Graphics 5200 | |
| Intel HD Graphics 4600 | |
| NVIDIA GeForce 940M | |
| NVIDIA GeForce 930M | |
| AMD Radeon R7 (Kaveri) | |
| Battlefield 4 | |
| 1024x768 Low Preset (nach Ergebnis sortieren) | |
| Intel HD Graphics 530 | |
| Intel HD Graphics 5600 | |
| NVIDIA GeForce 940M | |
| NVIDIA GeForce 940M | |
| NVIDIA GeForce 930M | |
| NVIDIA GeForce 930M | |
| AMD Radeon R7 (Kaveri) | |
| 1366x768 Medium Preset (nach Ergebnis sortieren) | |
| Intel HD Graphics 530 | |
| Intel HD Graphics 5600 | |
| NVIDIA GeForce 940M | |
| NVIDIA GeForce 940M | |
| NVIDIA GeForce 930M | |
| NVIDIA GeForce 930M | |
| AMD Radeon R7 (Kaveri) | |
| 1366x768 High Preset (nach Ergebnis sortieren) | |
| Intel HD Graphics 530 | |
| Intel HD Graphics 5600 | |
| NVIDIA GeForce 940M | |
| NVIDIA GeForce 940M | |
| NVIDIA GeForce 930M | |
| NVIDIA GeForce 930M | |
| AMD Radeon R7 (Kaveri) | |
| Watch Dogs | |
| 1024x768 Low Overall Quality, Medium Textures (nach Ergebnis sortieren) | |
| Intel HD Graphics 530 | |
| Intel HD Graphics 5600 | |
| Intel HD Graphics 4600 | |
| NVIDIA GeForce 920M | |
| AMD Radeon R7 (Kaveri) | |
| 1366x768 Medium Overall Quality, Medium Textures (nach Ergebnis sortieren) | |
| Intel HD Graphics 530 | |
| Intel HD Graphics 5600 | |
| Intel HD Graphics 4600 | |
| NVIDIA GeForce 920M | |
| AMD Radeon R7 (Kaveri) | |
| 1920x1080 High Overall Quality, High Textures AA:2x MS (nach Ergebnis sortieren) | |
| Intel HD Graphics 530 | |
| Intel HD Graphics 5600 | |
| Intel HD Graphics 4600 | |
| NVIDIA GeForce 920M | |
| AMD Radeon R7 (Kaveri) | |
| Alien: Isolation | |
| 1024x768 (Very) Low, Off, Shadow Map 512 AF:1x (nach Ergebnis sortieren) | |
| Intel HD Graphics 530 | |
| Intel Iris Pro Graphics 5200 | |
| Intel HD Graphics 5600 | |
| Intel HD Graphics 4600 | |
| NVIDIA GeForce 940M | |
| NVIDIA GeForce 930M | |
| NVIDIA GeForce 930M | |
| NVIDIA GeForce 920M | |
| NVIDIA GeForce 920M | |
| AMD Radeon R7 (Kaveri) | |
| 1366x768 Medium, On (AA & SSAO Off), Shadow Map 1024 AF:4x (nach Ergebnis sortieren) | |
| Intel HD Graphics 530 | |
| Intel Iris Pro Graphics 5200 | |
| Intel HD Graphics 5600 | |
| Intel HD Graphics 4600 | |
| NVIDIA GeForce 940M | |
| NVIDIA GeForce 930M | |
| NVIDIA GeForce 930M | |
| NVIDIA GeForce 920M | |
| NVIDIA GeForce 920M | |
| AMD Radeon R7 (Kaveri) | |
| 1920x1080 High, On, Shadow Map 1536, Standard SSAO AA:FX AF:8x (nach Ergebnis sortieren) | |
| Intel HD Graphics 530 | |
| Intel Iris Pro Graphics 5200 | |
| Intel HD Graphics 5600 | |
| Intel HD Graphics 4600 | |
| NVIDIA GeForce 940M | |
| NVIDIA GeForce 930M | |
| NVIDIA GeForce 930M | |
| NVIDIA GeForce 920M | |
| NVIDIA GeForce 920M | |
| AMD Radeon R7 (Kaveri) | |
| Middle-earth: Shadow of Mordor | |
| 1280x720 Lowest Preset (nach Ergebnis sortieren) | |
| Intel HD Graphics 530 | |
| Intel Iris Pro Graphics 5200 | |
| Intel HD Graphics 5600 | |
| Intel HD Graphics 4600 | |
| NVIDIA GeForce 940M | |
| NVIDIA GeForce 940M | |
| NVIDIA GeForce 930M | |
| NVIDIA GeForce 930M | |
| NVIDIA GeForce 920M | |
| NVIDIA GeForce 920M | |
| AMD Radeon R7 (Kaveri) | |
| 1344x756 Medium Preset (nach Ergebnis sortieren) | |
| Intel HD Graphics 530 | |
| Intel Iris Pro Graphics 5200 | |
| Intel HD Graphics 5600 | |
| Intel HD Graphics 4600 | |
| NVIDIA GeForce 940M | |
| NVIDIA GeForce 940M | |
| NVIDIA GeForce 930M | |
| NVIDIA GeForce 930M | |
| NVIDIA GeForce 920M | |
| NVIDIA GeForce 920M | |
| AMD Radeon R7 (Kaveri) | |
| 1920x1080 High Preset (nach Ergebnis sortieren) | |
| Intel HD Graphics 530 | |
| Intel Iris Pro Graphics 5200 | |
| Intel HD Graphics 5600 | |
| NVIDIA GeForce 940M | |
| NVIDIA GeForce 940M | |
| NVIDIA GeForce 920M | |
| NVIDIA GeForce 920M | |
| AMD Radeon R7 (Kaveri) | |
| Far Cry 4 | |
| 1024x768 Low Graphics Quality (nach Ergebnis sortieren) | |
| Intel HD Graphics 530 | |
| Intel Iris Pro Graphics 5200 | |
| Intel HD Graphics 5600 | |
| Intel HD Graphics 4600 | |
| NVIDIA GeForce 940M | |
| NVIDIA GeForce 930M | |
| NVIDIA GeForce 930M | |
| NVIDIA GeForce 920M | |
| NVIDIA GeForce 920M | |
| AMD Radeon R7 (Kaveri) | |
| 1366x768 Medium Graphics Quality (nach Ergebnis sortieren) | |
| Intel HD Graphics 530 | |
| Intel Iris Pro Graphics 5200 | |
| Intel HD Graphics 5600 | |
| Intel HD Graphics 4600 | |
| NVIDIA GeForce 940M | |
| NVIDIA GeForce 930M | |
| NVIDIA GeForce 930M | |
| NVIDIA GeForce 920M | |
| NVIDIA GeForce 920M | |
| AMD Radeon R7 (Kaveri) | |
| 1920x1080 High Graphics Quality AA:SM (nach Ergebnis sortieren) | |
| Intel HD Graphics 530 | |
| Intel Iris Pro Graphics 5200 | |
| Intel HD Graphics 5600 | |
| Intel HD Graphics 4600 | |
| NVIDIA GeForce 940M | |
| NVIDIA GeForce 920M | |
| NVIDIA GeForce 920M | |
| AMD Radeon R7 (Kaveri) | |
| Dragon Age: Inquisition | |
| 1024x768 Low Graphics Quality (nach Ergebnis sortieren) | |
| Intel HD Graphics 530 | |
| Intel HD Graphics 5600 | |
| Intel HD Graphics 4600 | |
| NVIDIA GeForce 940M | |
| NVIDIA GeForce 930M | |
| NVIDIA GeForce 930M | |
| NVIDIA GeForce 920M | |
| NVIDIA GeForce 920M | |
| NVIDIA GeForce 920M | |
| AMD Radeon R7 (Kaveri) | |
| 1366x768 Medium Graphics Quality (nach Ergebnis sortieren) | |
| Intel HD Graphics 530 | |
| Intel HD Graphics 5600 | |
| Intel HD Graphics 4600 | |
| NVIDIA GeForce 940M | |
| NVIDIA GeForce 930M | |
| NVIDIA GeForce 930M | |
| NVIDIA GeForce 920M | |
| NVIDIA GeForce 920M | |
| NVIDIA GeForce 920M | |
| AMD Radeon R7 (Kaveri) | |
| 1920x1080 High Graphics Quality (nach Ergebnis sortieren) | |
| Intel HD Graphics 530 | |
| Intel HD Graphics 5600 | |
| Intel HD Graphics 4600 | |
| NVIDIA GeForce 940M | |
| NVIDIA GeForce 930M | |
| NVIDIA GeForce 920M | |
| NVIDIA GeForce 920M | |
| NVIDIA GeForce 920M | |
| AMD Radeon R7 (Kaveri) | |
| The Witcher 3 | |
| 1024x768 Low Graphics & Postprocessing (nach Ergebnis sortieren) | |
| Intel HD Graphics 530 | |
| Intel Iris Pro Graphics 5200 | |
| Intel HD Graphics 5600 | |
| Intel HD Graphics 4600 | |
| NVIDIA GeForce 930M | |
| NVIDIA GeForce 920M | |
| NVIDIA GeForce 920M | |
| NVIDIA GeForce 920M | |
| AMD Radeon R7 (Kaveri) | |
| 1366x768 Medium Graphics & Postprocessing (nach Ergebnis sortieren) | |
| Intel HD Graphics 530 | |
| Intel HD Graphics 5600 | |
| Intel HD Graphics 4600 | |
| NVIDIA GeForce 920M | |
| NVIDIA GeForce 920M | |
| NVIDIA GeForce 920M | |
| AMD Radeon R7 (Kaveri) | |
| 1920x1080 High Graphics & Postprocessing (Nvidia HairWorks Off) (nach Ergebnis sortieren) | |
| Intel HD Graphics 530 | |
| Intel HD Graphics 5600 | |
| NVIDIA GeForce 920M | |
| NVIDIA GeForce 920M | |
| NVIDIA GeForce 920M | |
| AMD Radeon R7 (Kaveri) | |
| Batman: Arkham Knight | |
| 1280x720 Low / Off AF:Trilinear (nach Ergebnis sortieren) | |
| Intel HD Graphics 530 | |
| Intel Iris Pro Graphics 5200 | |
| Intel HD Graphics 4600 | |
| NVIDIA GeForce 920M | |
| NVIDIA GeForce 920M | |
| AMD Radeon R7 (Kaveri) | |
| 1366x768 Normal / Off AF:4x (nach Ergebnis sortieren) | |
| Intel HD Graphics 530 | |
| Intel Iris Pro Graphics 5200 | |
| Intel HD Graphics 4600 | |
| NVIDIA GeForce 920M | |
| NVIDIA GeForce 920M | |
| AMD Radeon R7 (Kaveri) | |
| 1920x1080 High / On (Interactive Smoke & Paper Debris Off) AA:SM AF:8x (nach Ergebnis sortieren) | |
| Intel HD Graphics 530 | |
| NVIDIA GeForce 920M | |
| NVIDIA GeForce 920M | |
| AMD Radeon R7 (Kaveri) | |
| Metal Gear Solid V | |
| 1024x768 Low / Off (nach Ergebnis sortieren) | |
| Intel HD Graphics 530 | |
| Intel Iris Pro Graphics 5200 | |
| Intel HD Graphics 4600 | |
| AMD Radeon R7 (Kaveri) | |
| 1366x768 Medium / Off (nach Ergebnis sortieren) | |
| Intel HD Graphics 530 | |
| Intel Iris Pro Graphics 5200 | |
| Intel HD Graphics 4600 | |
| AMD Radeon R7 (Kaveri) | |
| 1920x1080 High / On (nach Ergebnis sortieren) | |
| Intel HD Graphics 530 | |
| Intel Iris Pro Graphics 5200 | |
| Intel HD Graphics 4600 | |
| AMD Radeon R7 (Kaveri) | |
| Mad Max | |
| 1366x768 Normal Preset AF:2x (nach Ergebnis sortieren) | |
| Intel HD Graphics 530 | |
| Intel Iris Pro Graphics 5200 | |
| Intel HD Graphics 4600 | |
| AMD Radeon R7 (Kaveri) | |
| 1920x1080 High Preset AF:6x (nach Ergebnis sortieren) | |
| Intel HD Graphics 530 | |
| Intel Iris Pro Graphics 5200 | |
| Intel HD Graphics 4600 | |
Leistungsaufnahme und Energieeffizienz
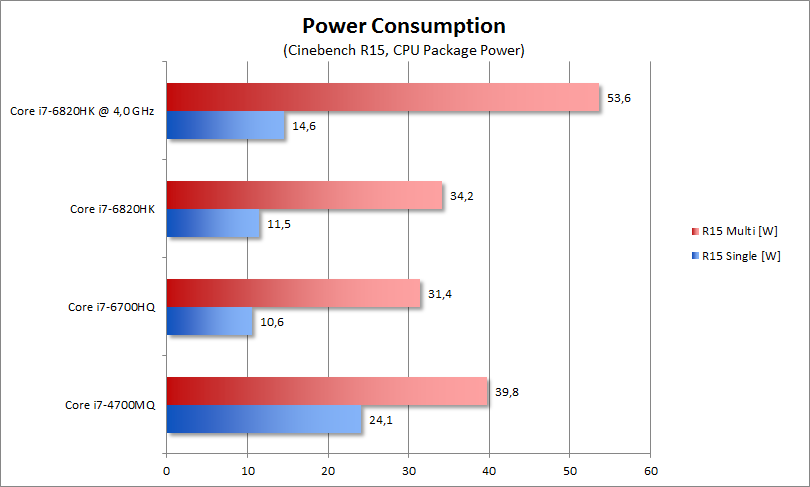
Angesichts grundlegend verschiedener Endgeräte wollen wir an dieser Stelle auf einen Vergleich von Gesamtsystem-Verbräuchen verzichten und lieber auf eine andere, sehr viel präzisere Datenquelle zurückgreifen: die mittels HWInfo ausgelesene CPU Package Power. Dieser Wert beinhaltet die gesamte Leistungsaufnahme des Prozessors ohne sonstige Komponenten und dient dem System beispielsweise auch dazu, die Einhaltung vorgegebener TDP-Grenzen zu überwachen. Zur Plausibilitätskontrolle haben wir dennoch sämtliche der nachfolgenden Werte mit dem Verbrauchsdelta an der Steckdose verglichen, ohne dabei jedoch auf offensichtliche Widersprüche zu stoßen.
Beginnen wir zunächst mit den Ergebnissen bei Multi-Thread-Belastung im Cinebench R15. Trotz höherer Performance bleiben sowohl der Core i7-6700HQ als auch der i7-6820HK messbar sparsamer als der Haswell-basierte i7-4700MQ, wenngleich die Differenzen mit etwa 6 bis 8 Watt nicht wirklich signifikant ausfallen. Absolut betrachtet sind wir dennoch beeindruckt: Bei praxisnaher CPU-Volllast könnten beide Skylake-Vierkerner sogar als 35-Watt-Modelle laufen, die spezifizierte TDP von 45 Watt dürfte auch vom Topmodell i7-6920HQ nicht erreicht werden. Erst bei Übertaktung auf 4,0 GHz (real 3,8 bis 3,9 GHz, vermutlich limitiert durch IccMax) zieht unser K-Modell mit fast 54 Watt dann doch deutlich mehr Leistung – in diesem Frequenzbereich schwinden die Vorteile der 14-Nanometer-Fertigung zunehmend dahin.
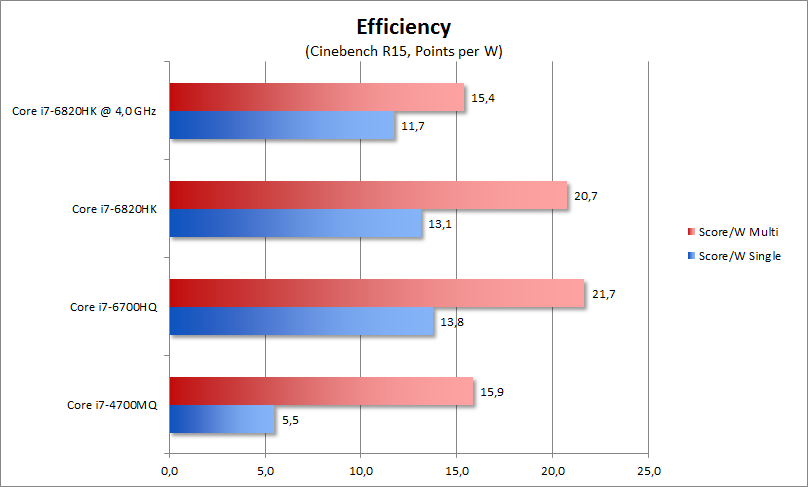
Die eigentliche Überraschung stellen jedoch die Verbesserungen im Teillastbereich dar, wo Skylake – und dabei insbesondere der niedrig taktende Core i7-6700HQ – seinen Vorgänger geradezu deklassiert. Im Single-Threading-Test des Cinebench R15 hat sich die Effizienz unseren Messungen nach mehr als verdoppelt, was für ein verbessertes Power Gating ungenutzter Hardware-Einheiten spricht. Das zahlt sich auch in der Praxis aus: Erste Akkutests deuten spürbar längere Laufzeiten vor allem bei alltäglicher Nutzung an, was wir im Zuge kommender Reviews noch genauer untersuchen werden.
Fazit
Wer auf einen spürbaren (CPU-)Leistungssprung gehofft hatte, mag von Skylake enttäuscht sein – in puncto Performance fällt der Fortschritt gegenüber Haswell und Broadwell zumindest in dieser TDP-Klasse überraschend bescheiden aus. Intels neue Mikroarchitektur deswegen als Fehlschlag anzusehen, wäre jedoch falsch: Anstatt die Leistung um jeden Preis zu steigern, hat sich der Hersteller vielmehr auf das Thema Energieeffizienz konzentriert und kann in diesem Bereich einige beachtliche Erfolge vorweisen. Speziell praxisnahe Teillast-Szenarien profitieren von den nun noch ausgefeilteren Energiesparfeatures, aber auch den Vorteilen der modernen 14-Nanometer-Fertigung.
Ebenfalls im Fokus der Entwicklung stand die Verbesserung der Grafikeinheit, die nun auch DirectX 12 mit Feature Level 12_1 beherrscht und in der vorliegenden GT2-Ausbaustufe rund 25 bis 30 Prozent schneller als ihr Haswell-Pendant rechnet. Dies genügt, um mit einer dedizierten GeForce 920M zu konkurrieren und zumindest einfache Spiele in niedrigen, teils auch mittleren Einstellungen flüssig darzustellen. Wirklich spannend wird es diesbezüglich allerdings erst in den nächsten Wochen und Monaten, wenn die stärkeren GT3e- und GT4e-Modelle auf dem Markt kommen, die dank zwei- beziehungsweise dreifacher Shaderzahl sowie schnellem eDRAM-Speicher ein nochmals höheres Leistungspotential versprechen.
Bislang noch nicht weiter angesprochen haben wir die neuen Multimediafähigkeiten der Skylake-Generation, darunter die hochmoderne Videoeinheit mit umfassender H.265-/HEVC-Unterstützung. Speziell diesem Thema werden wir uns im Rahmen eines weiteren Artikels noch einmal im Detail widmen und dabei auch Vergleiche zum Vorgänger sowie der AMD-Konkurrenz ziehen.
