Lenovo ThinkPad X13 G3 Laptop im Test: Ausdauernd im Außeneinsatz mit Intel Alder-Lake-U
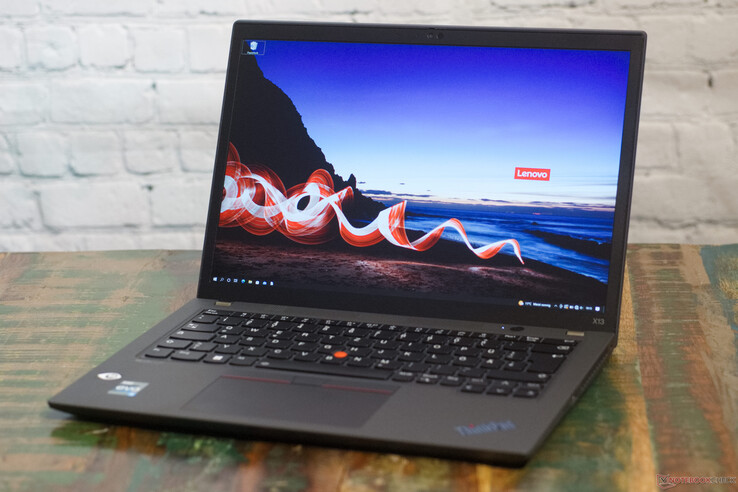
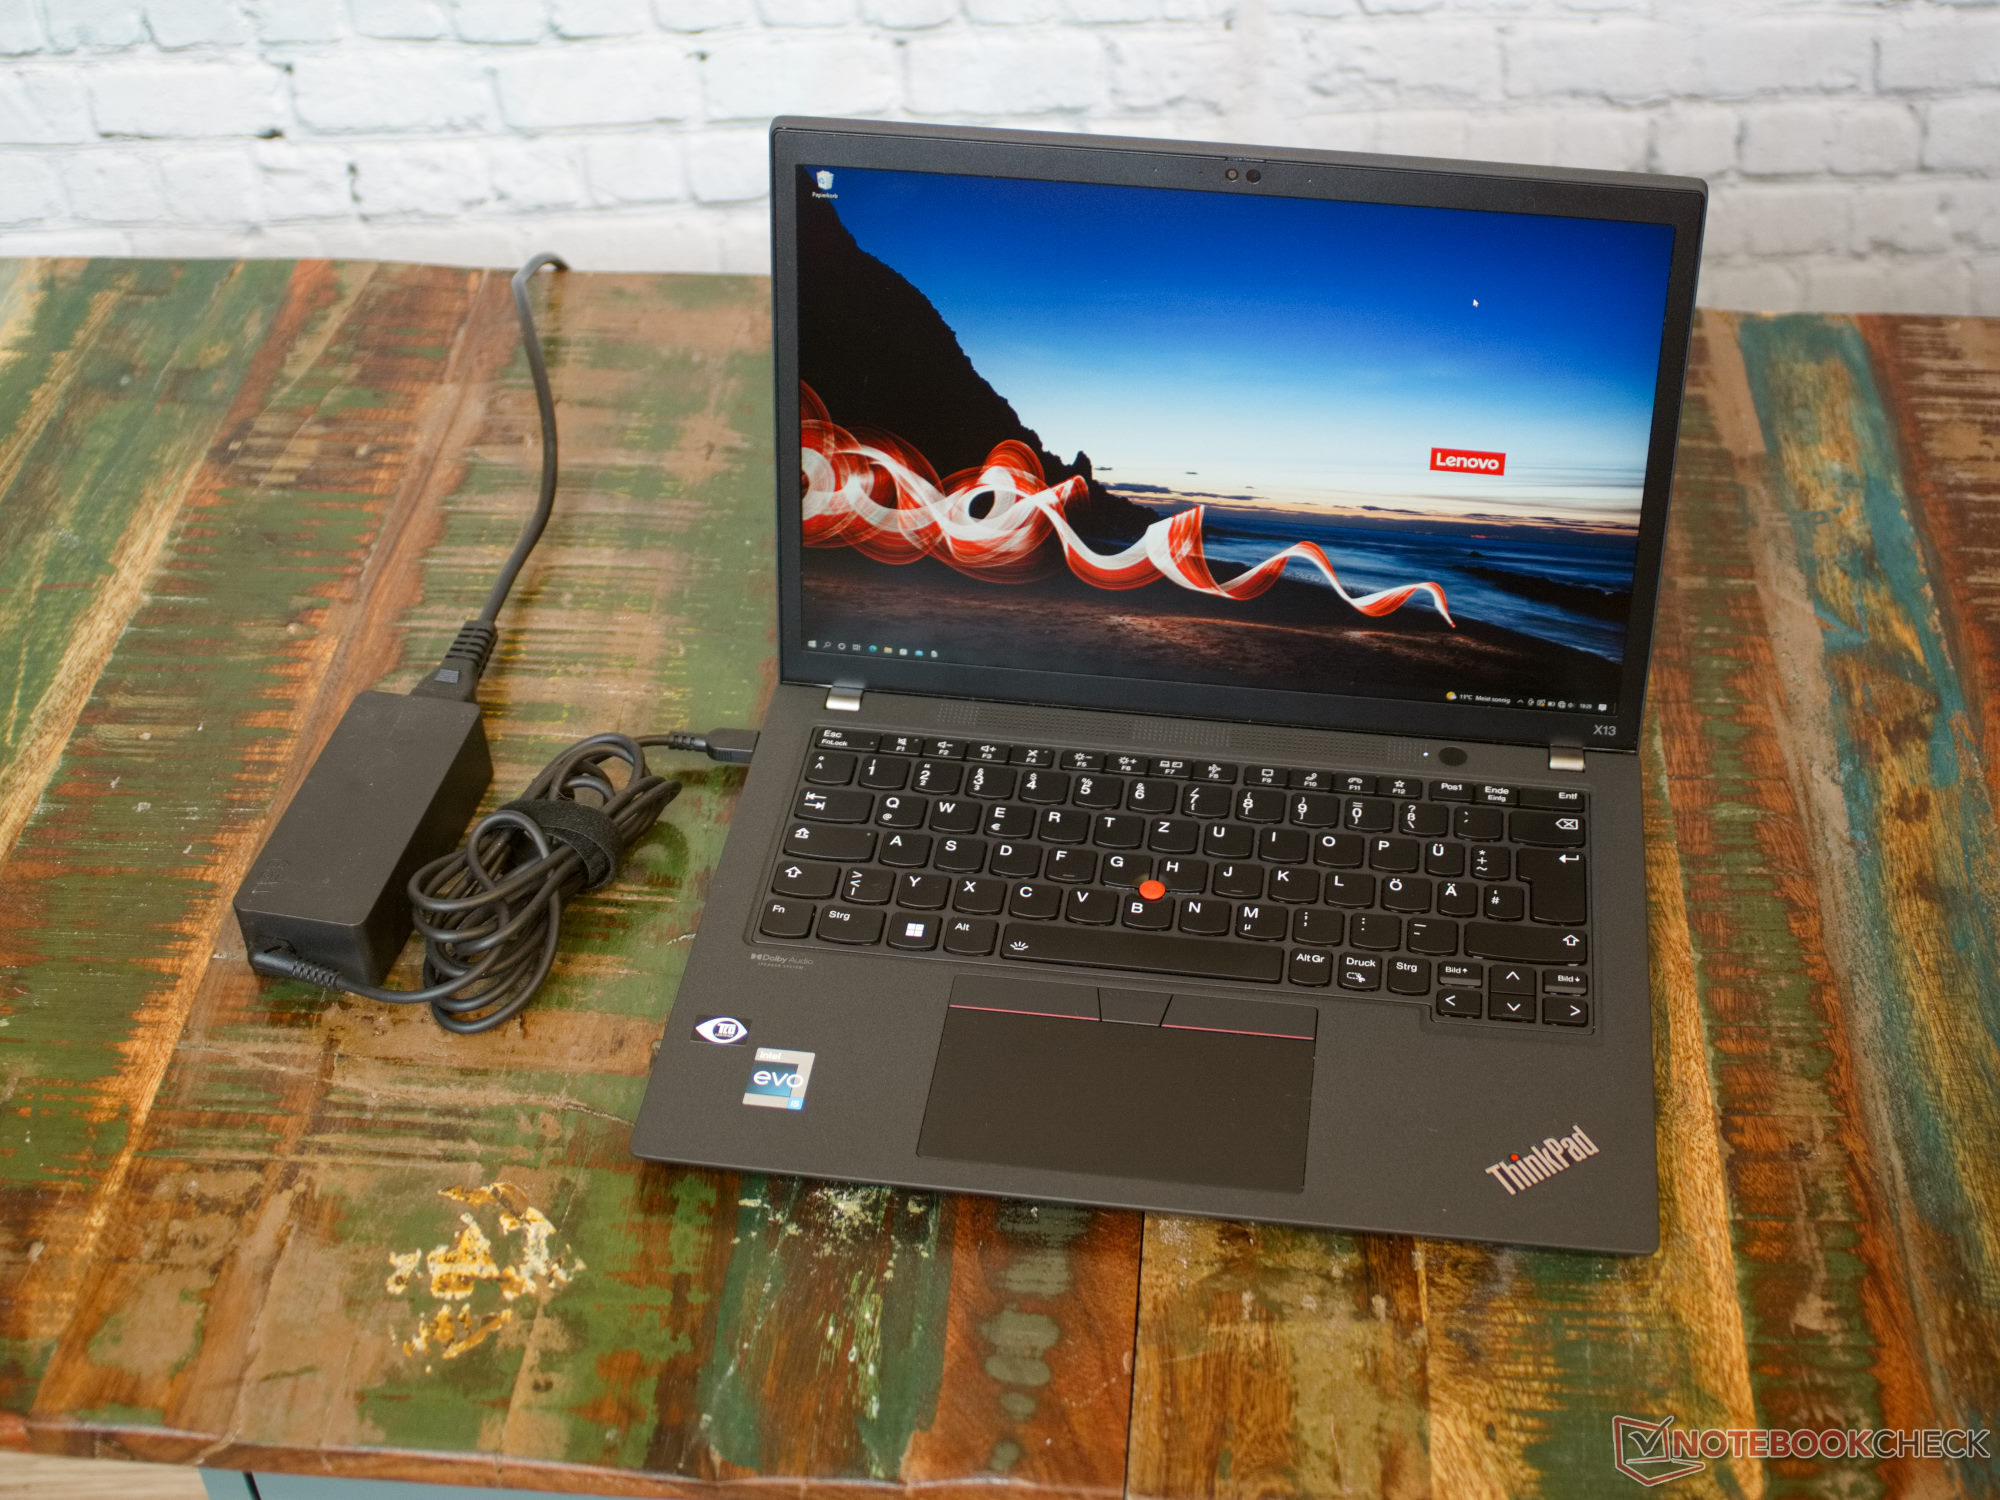
ThinkPad ist die Marke von Lenovo, wenn es um professionelle Laptops geht. Für jeden Anwendungsfall gibt es hier die richtige Ausstattung. Die X-Serie ist besonders leicht und mobil, hat eine starke Akkulaufzeit, aber dafür nicht unbedingt die beste Rechenleistung. So auch das ThinkPad X13 Gen 3 mit seinem 13,3-Zoll-großen 16:10-Monitor. Dank Intel Core i5-1235U und 16 GB Arbeitsspeicher ist das leichte Notebook aber mehr als alltagstauglich. Ein Gehäuse aus Magnesium bringt Stabilität und ein geringes Gewicht.
Unser Testgerät muss sich als Nachfolger vom ThinkPad X13 G2 mit Intel-Prozessor dem Vergleich mit verschiedenen kleinen Office-Notebooks stellen. Darunter befinden sich auch das ThinkPad X13 G2 mit AMD-Prozessor sowie das ThinkPad X1 Titanium Yoga als Convertible aus den eigenen Reihen. Als Vergleichsgeräte der Konkurrenz finden sich das HP Elite Dragonfly G3 und das Dell Latitude 13 7330 in unserer Datenbank. Als besonders interessante Alternative bietet sich auch der modulare Framework-Laptop an.
mögliche Konkurrenten im Vergleich
Bew. | Datum | Modell | Gewicht | Dicke | Größe | Auflösung | Preis ab |
|---|---|---|---|---|---|---|---|
| 89.4 % v7 (old) | 11 / 2022 | Lenovo ThinkPad X13 G3 21BN0046GE i5-1235U, Iris Xe G7 80EUs | 1.3 kg | 18.9 mm | 13.30" | 1920x1200 | |
| 85.1 % v7 (old) | 07 / 2022 | Framework Laptop 13.5 12th Gen Intel i7-1260P, Iris Xe G7 96EUs | 1.3 kg | 15.85 mm | 13.50" | 2256x1504 | |
| 91 % v7 (old) | 08 / 2022 | HP Elite Dragonfly G3 i7-1265U, Iris Xe G7 96EUs | 1.2 kg | 16.3 mm | 13.50" | 1920x1280 | |
| 89 % v7 (old) | 07 / 2022 | Dell Latitude 13 7330 i7-1265U, Iris Xe G7 96EUs | 1 kg | 16.96 mm | 13.30" | 1920x1080 | |
| 88.5 % v7 (old) | 03 / 2022 | Lenovo ThinkPad X1 Titanium Yoga G1 20QB0016GE i5-1140G7, Iris Xe G7 80EUs | 1.2 kg | 11.5 mm | 13.50" | 2256x1504 | |
| 90.6 % v7 (old) | 11 / 2021 | Lenovo ThinkPad X13 G2 AMD 20XH001KGE R5 PRO 5650U, Vega 7 | 1.4 kg | 18.19 mm | 13.30" | 1920x1200 |
Gehäuse - Leichtmetall Magnesium
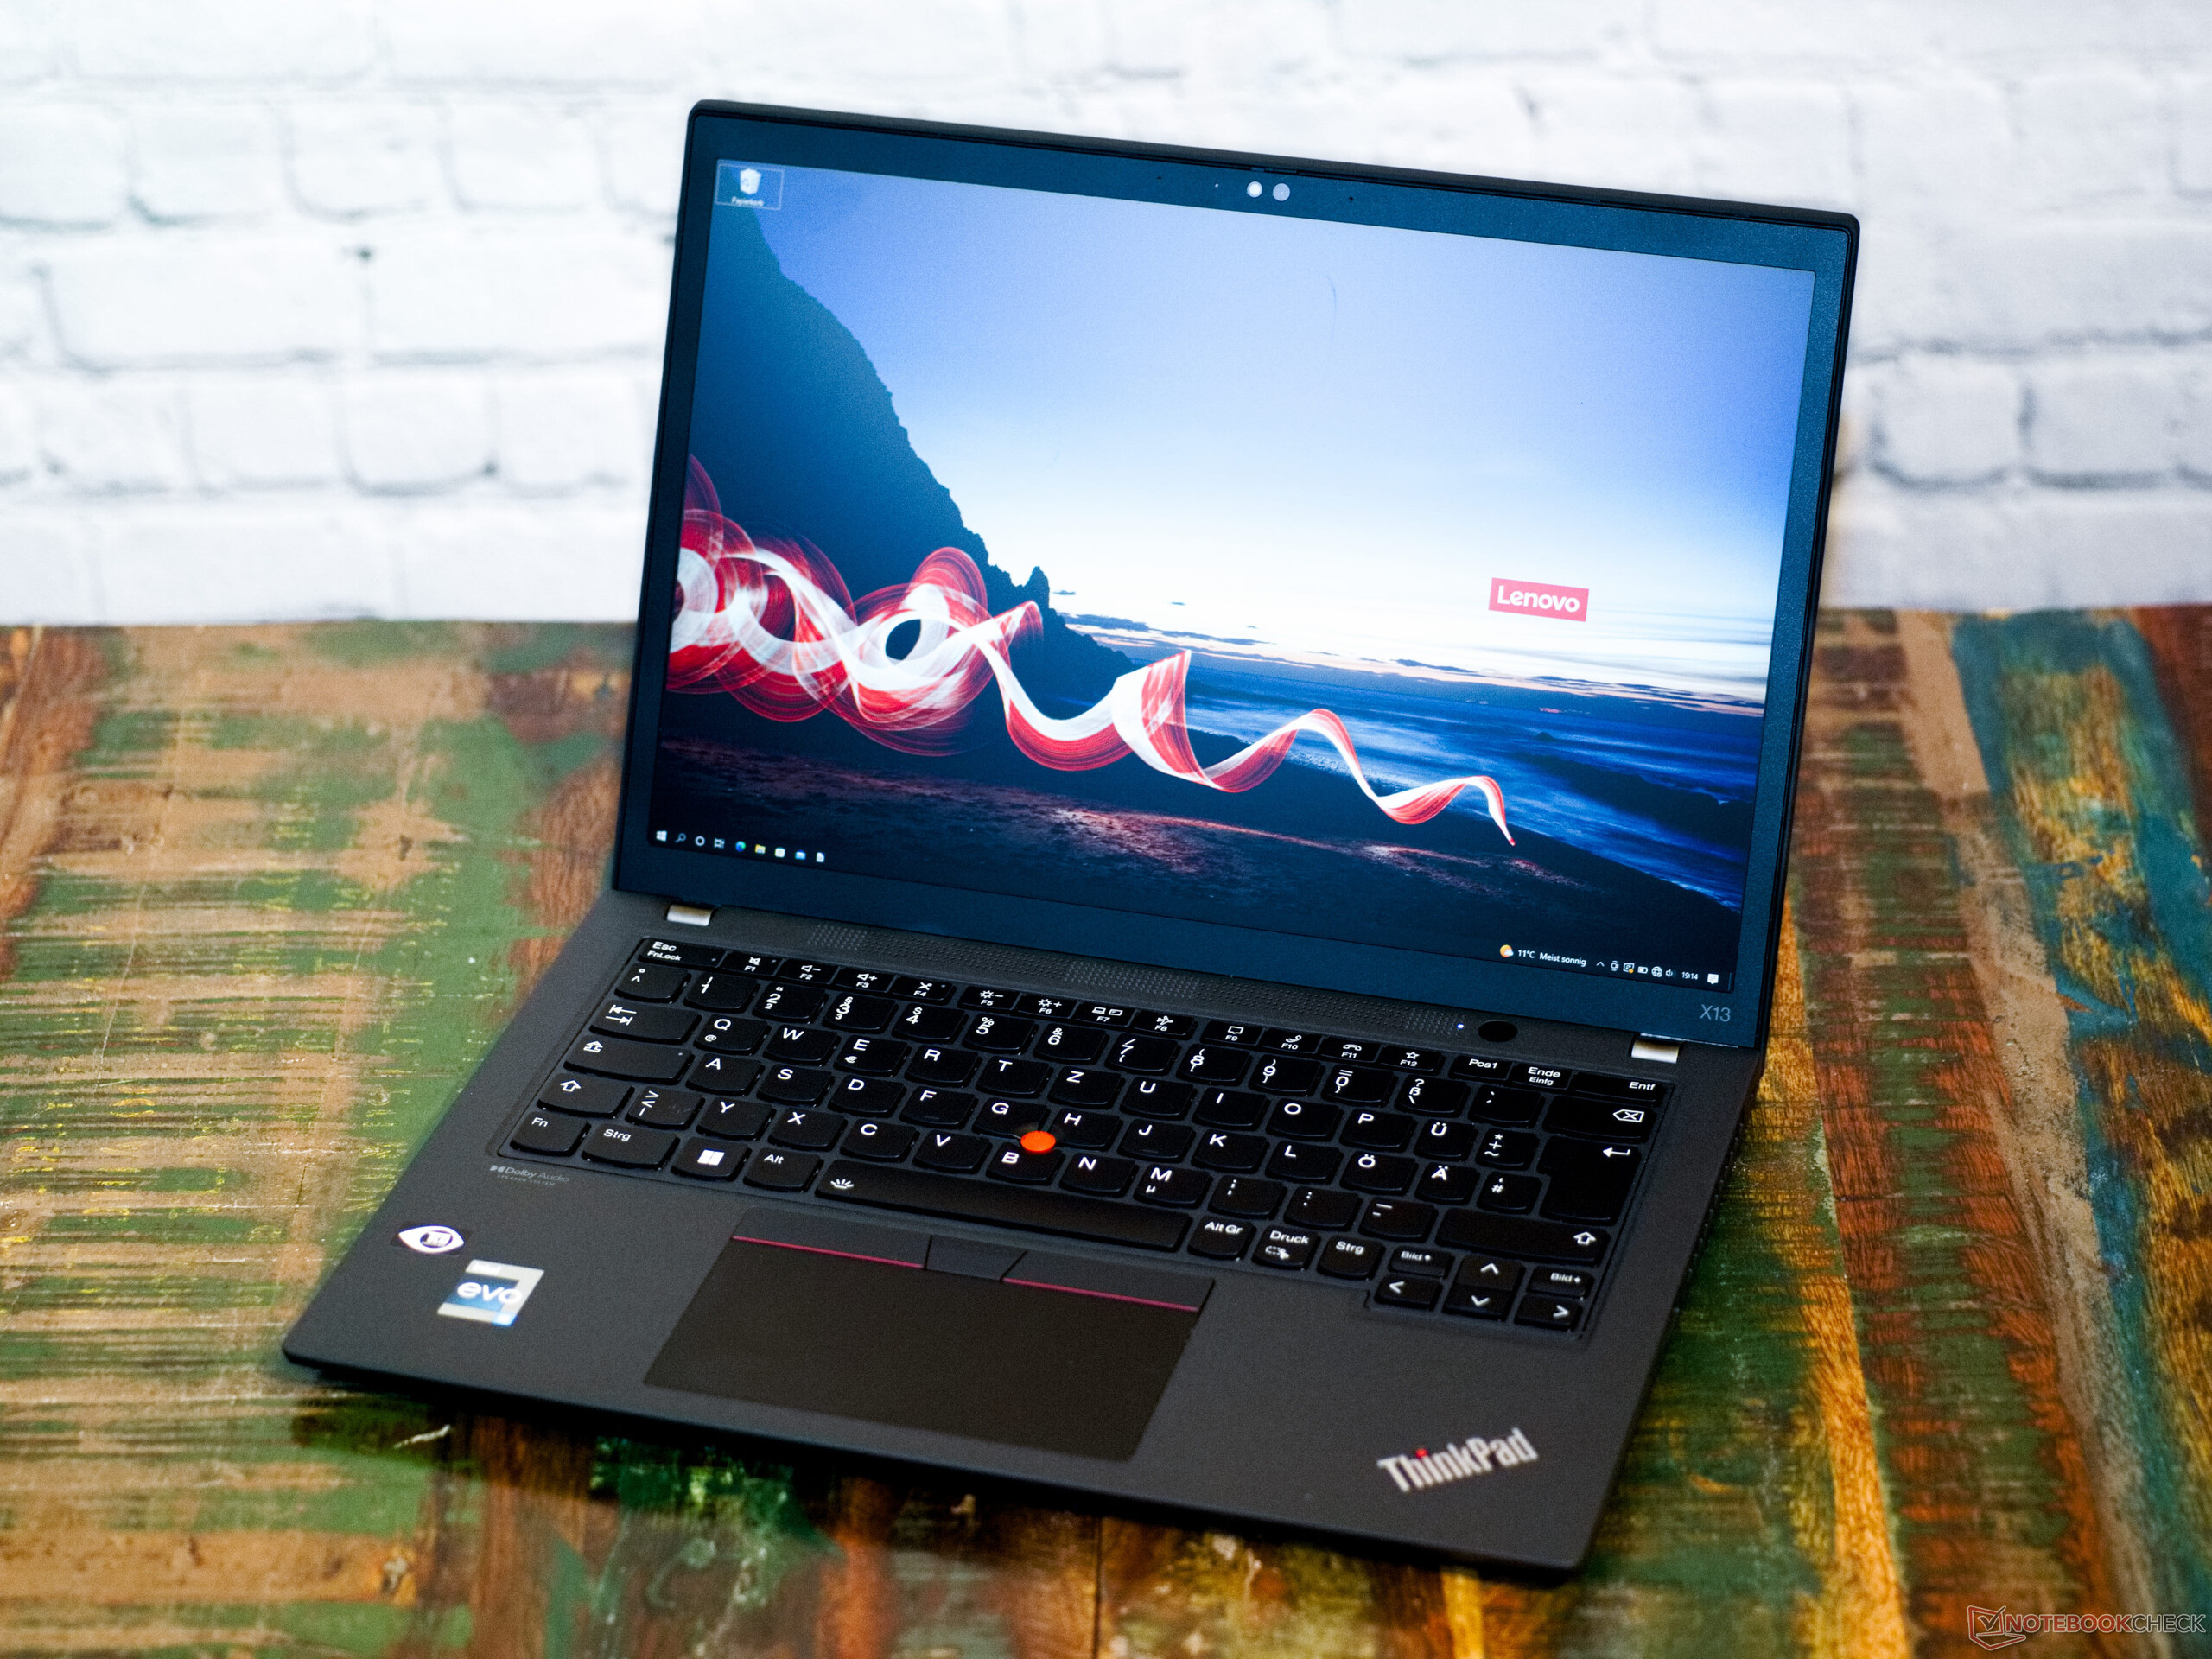
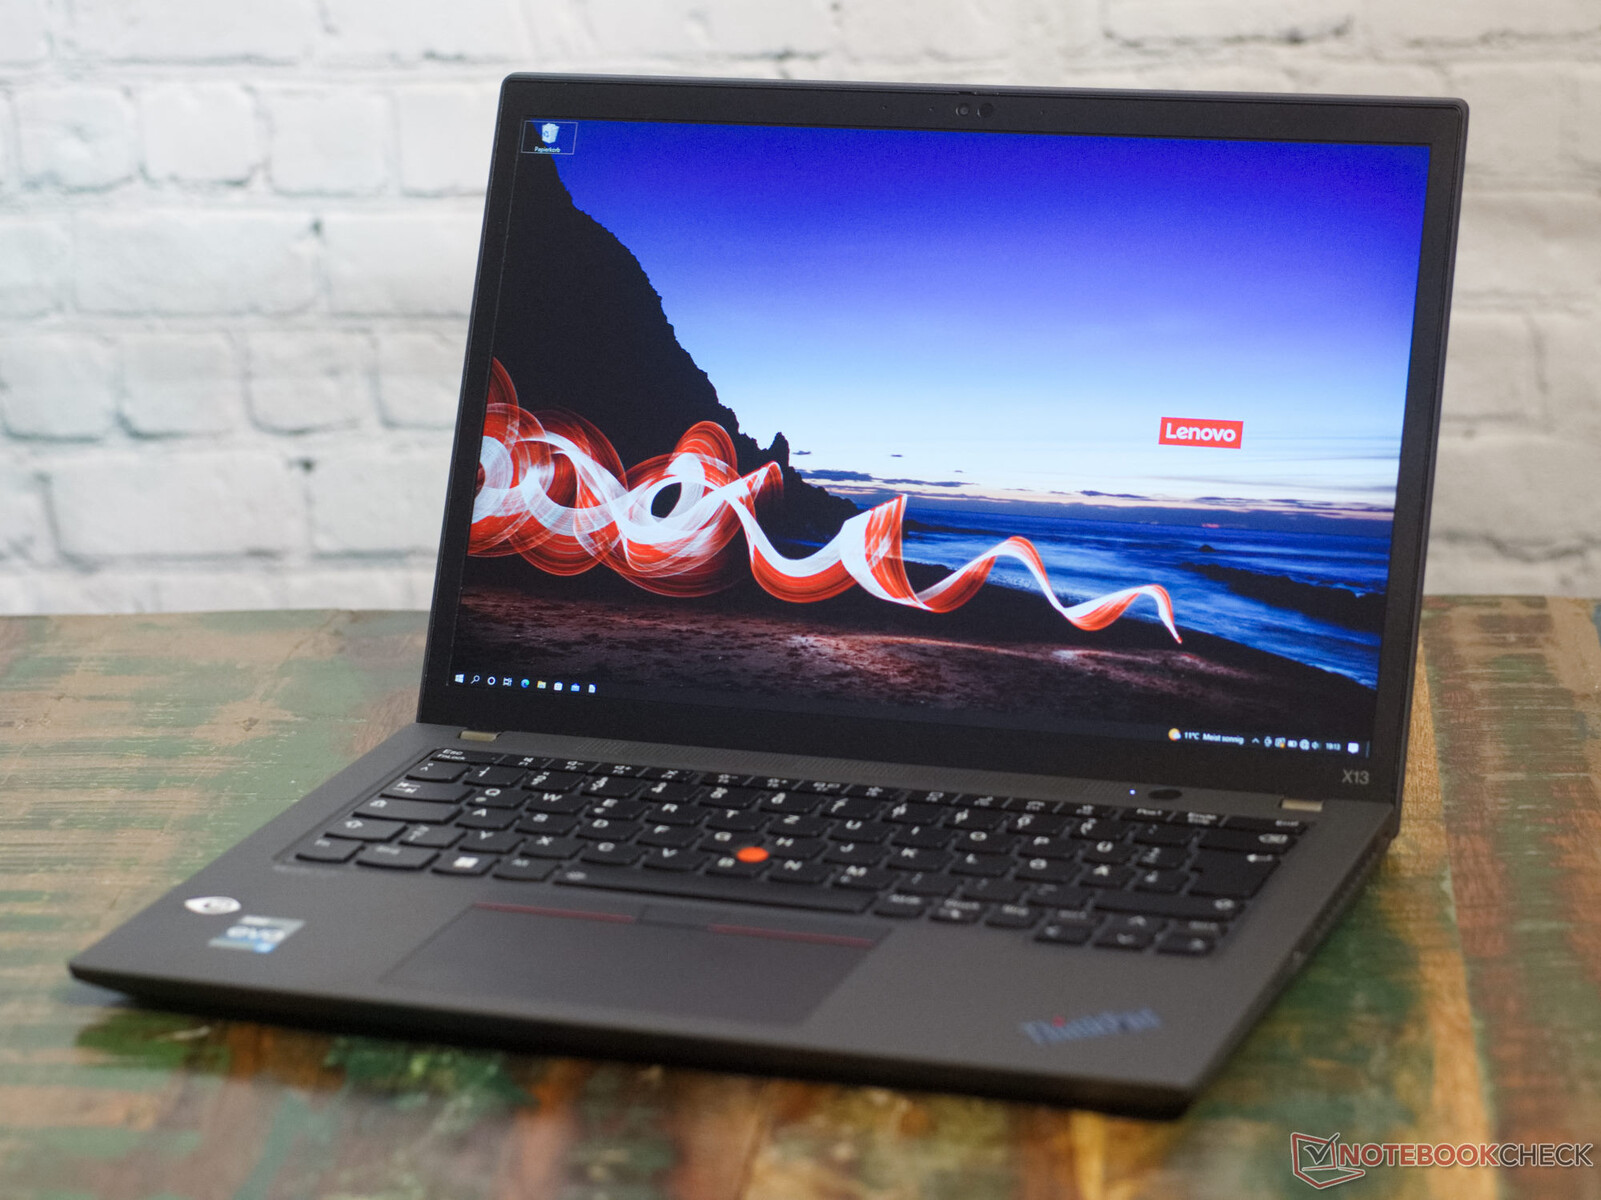
Uns begegnet hier ein typisches ThinkPad in Anthrazit. Der rote TrackPoint in der leicht tauschbaren Tastatur, ein rot leuchtender i-Punkt im Logo und klassische Formführung geben dem Notebook seinen Wiedererkennungswert. Das Gehäuse besteht hier aus einer Magnesiumlegierung. Diese verleiht dem ThinkPad X13 viel Stabilität in der Basis. Der Bildschirmdeckel, der anders als die Basis nicht aus Magnesium, sondern aus Glas-Faser-Kunststoff besteht, lässt sich hingegen relativ leicht elastisch verformen. Wobei jedoch nichts knarzt und kratzt. So fühlt sich der gesamte Laptop hochwertig und widerstandsfähig an.
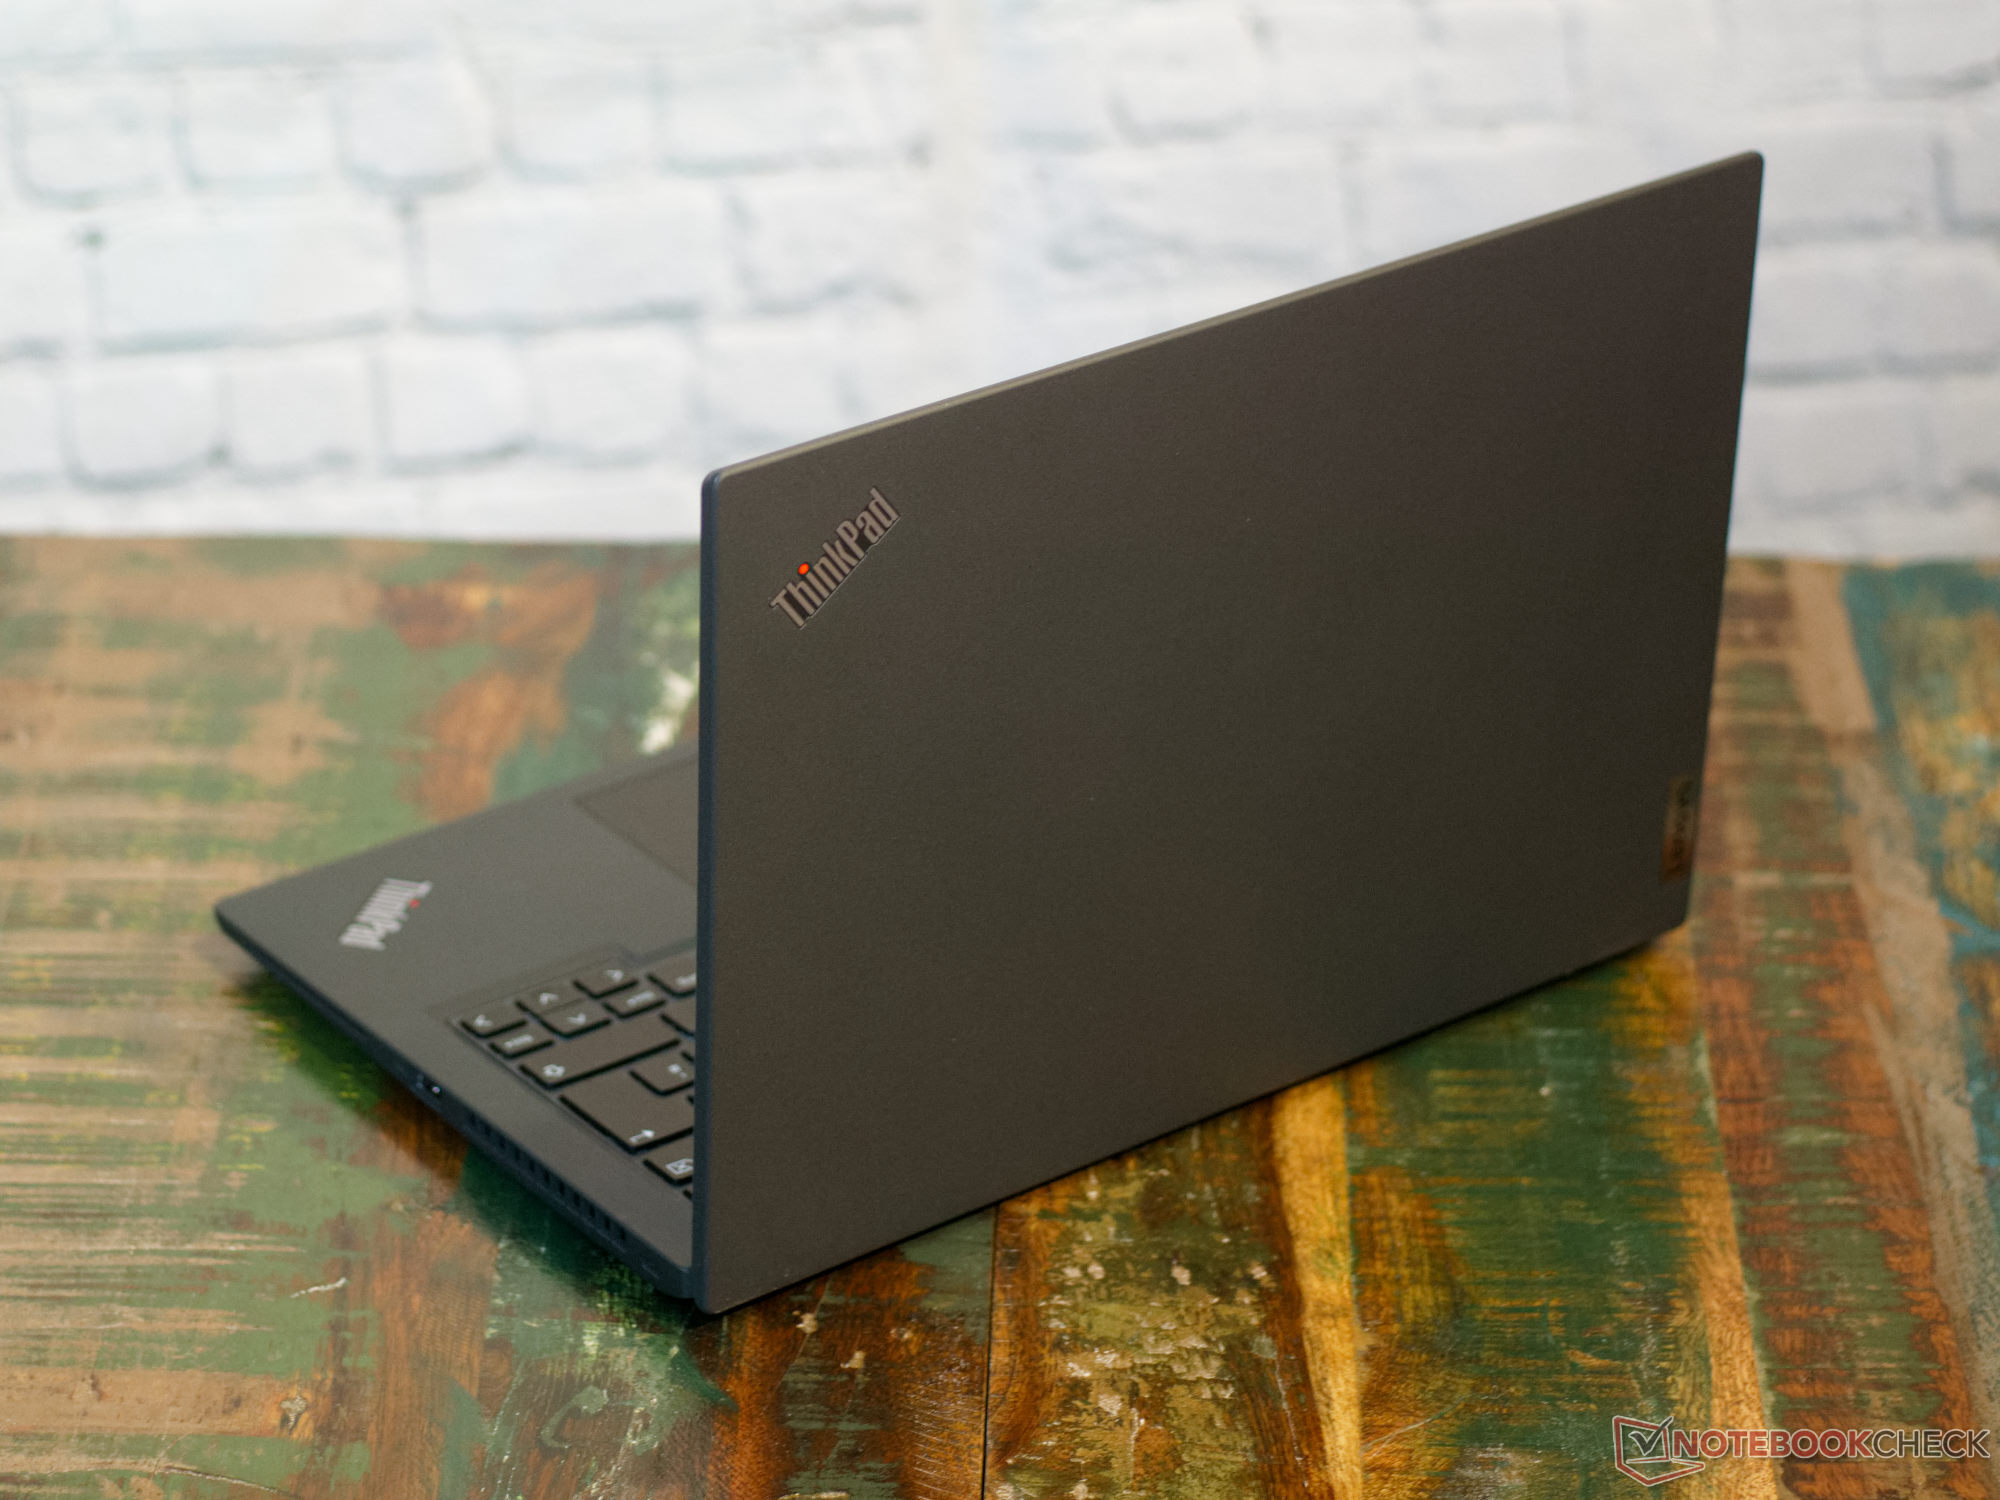
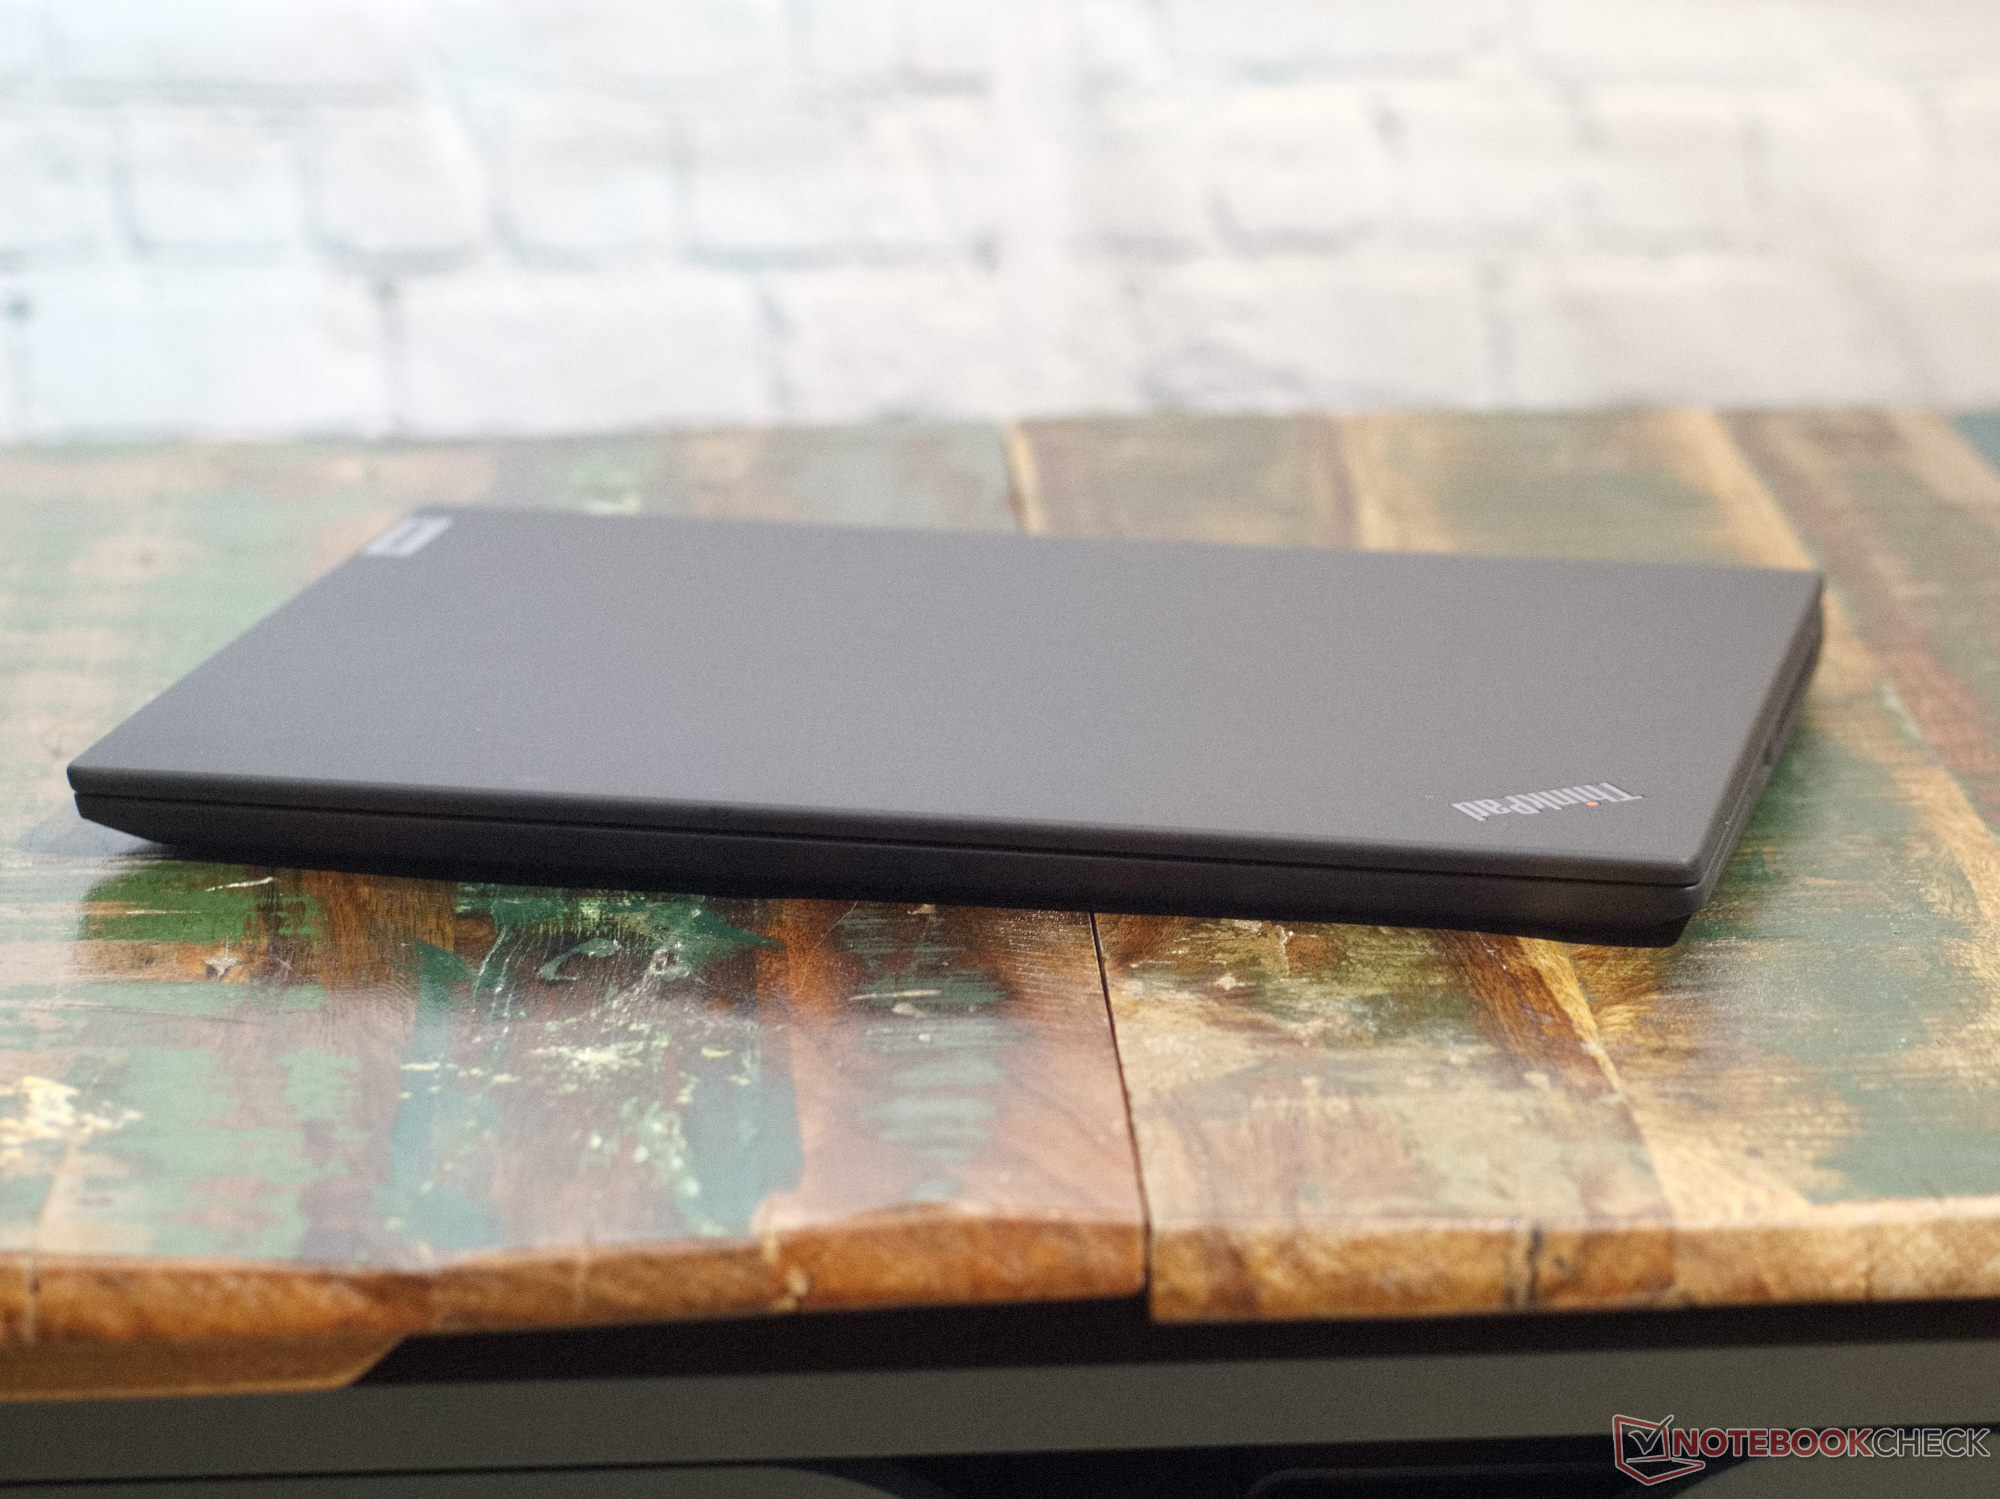
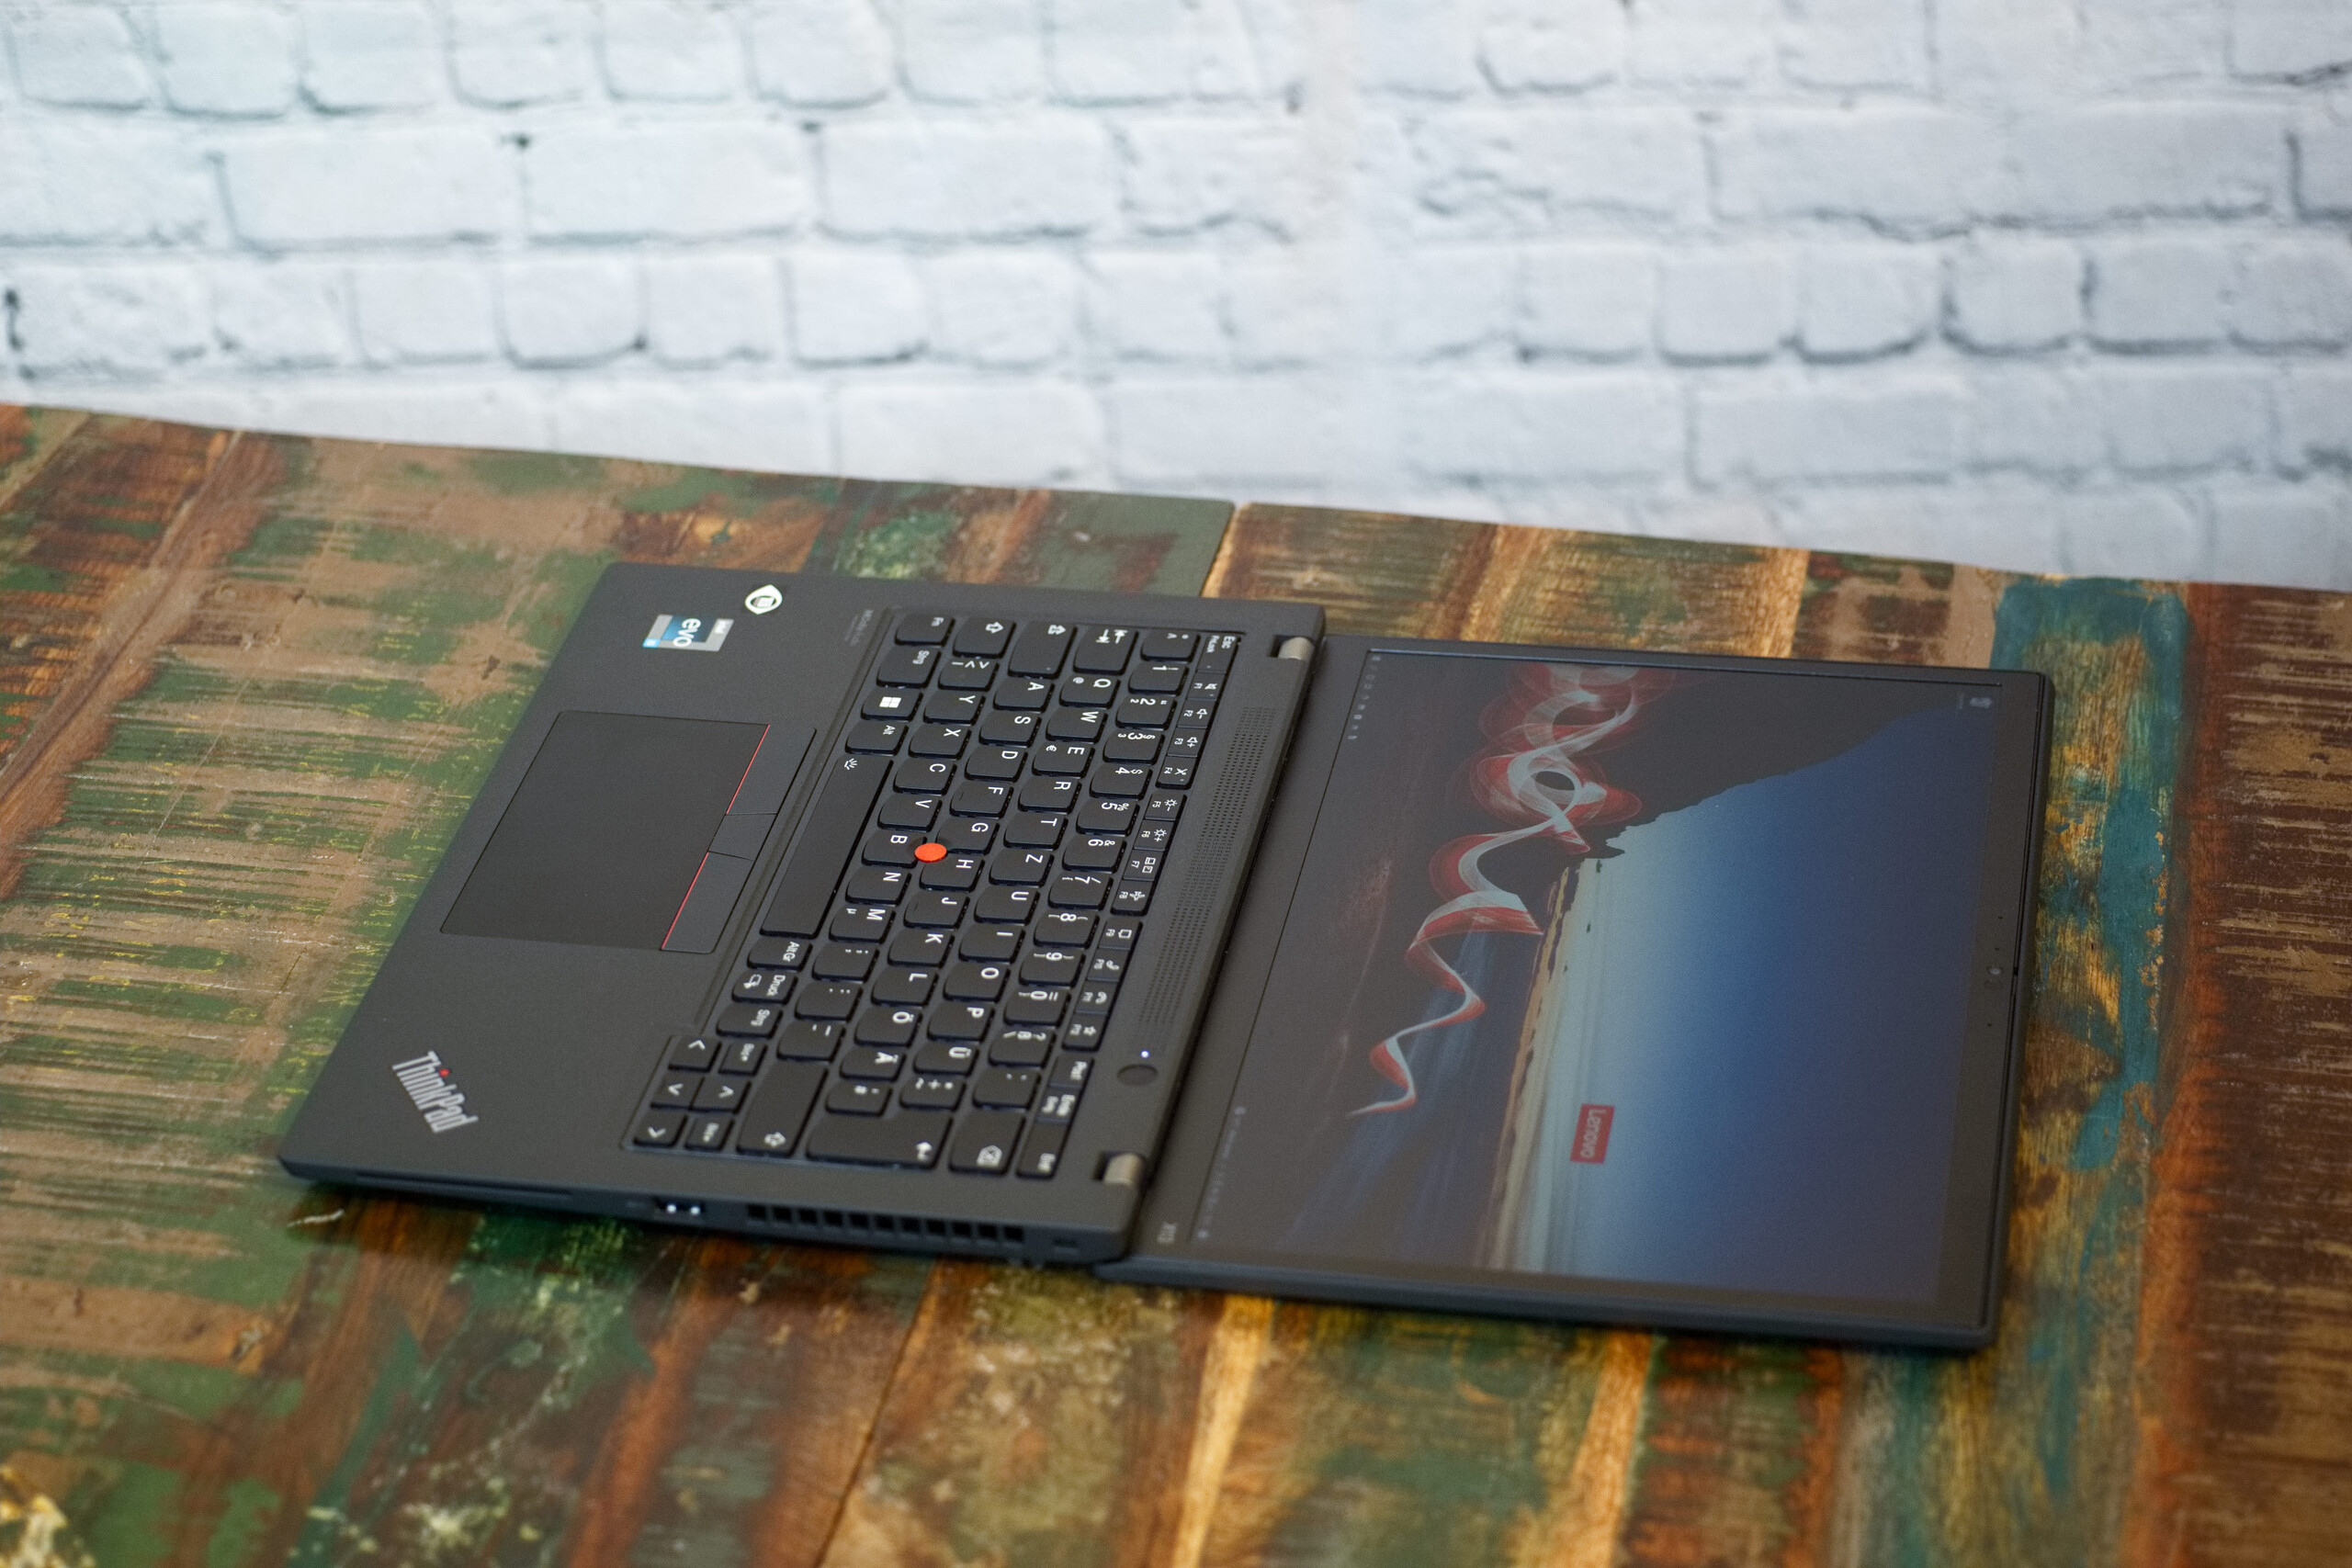
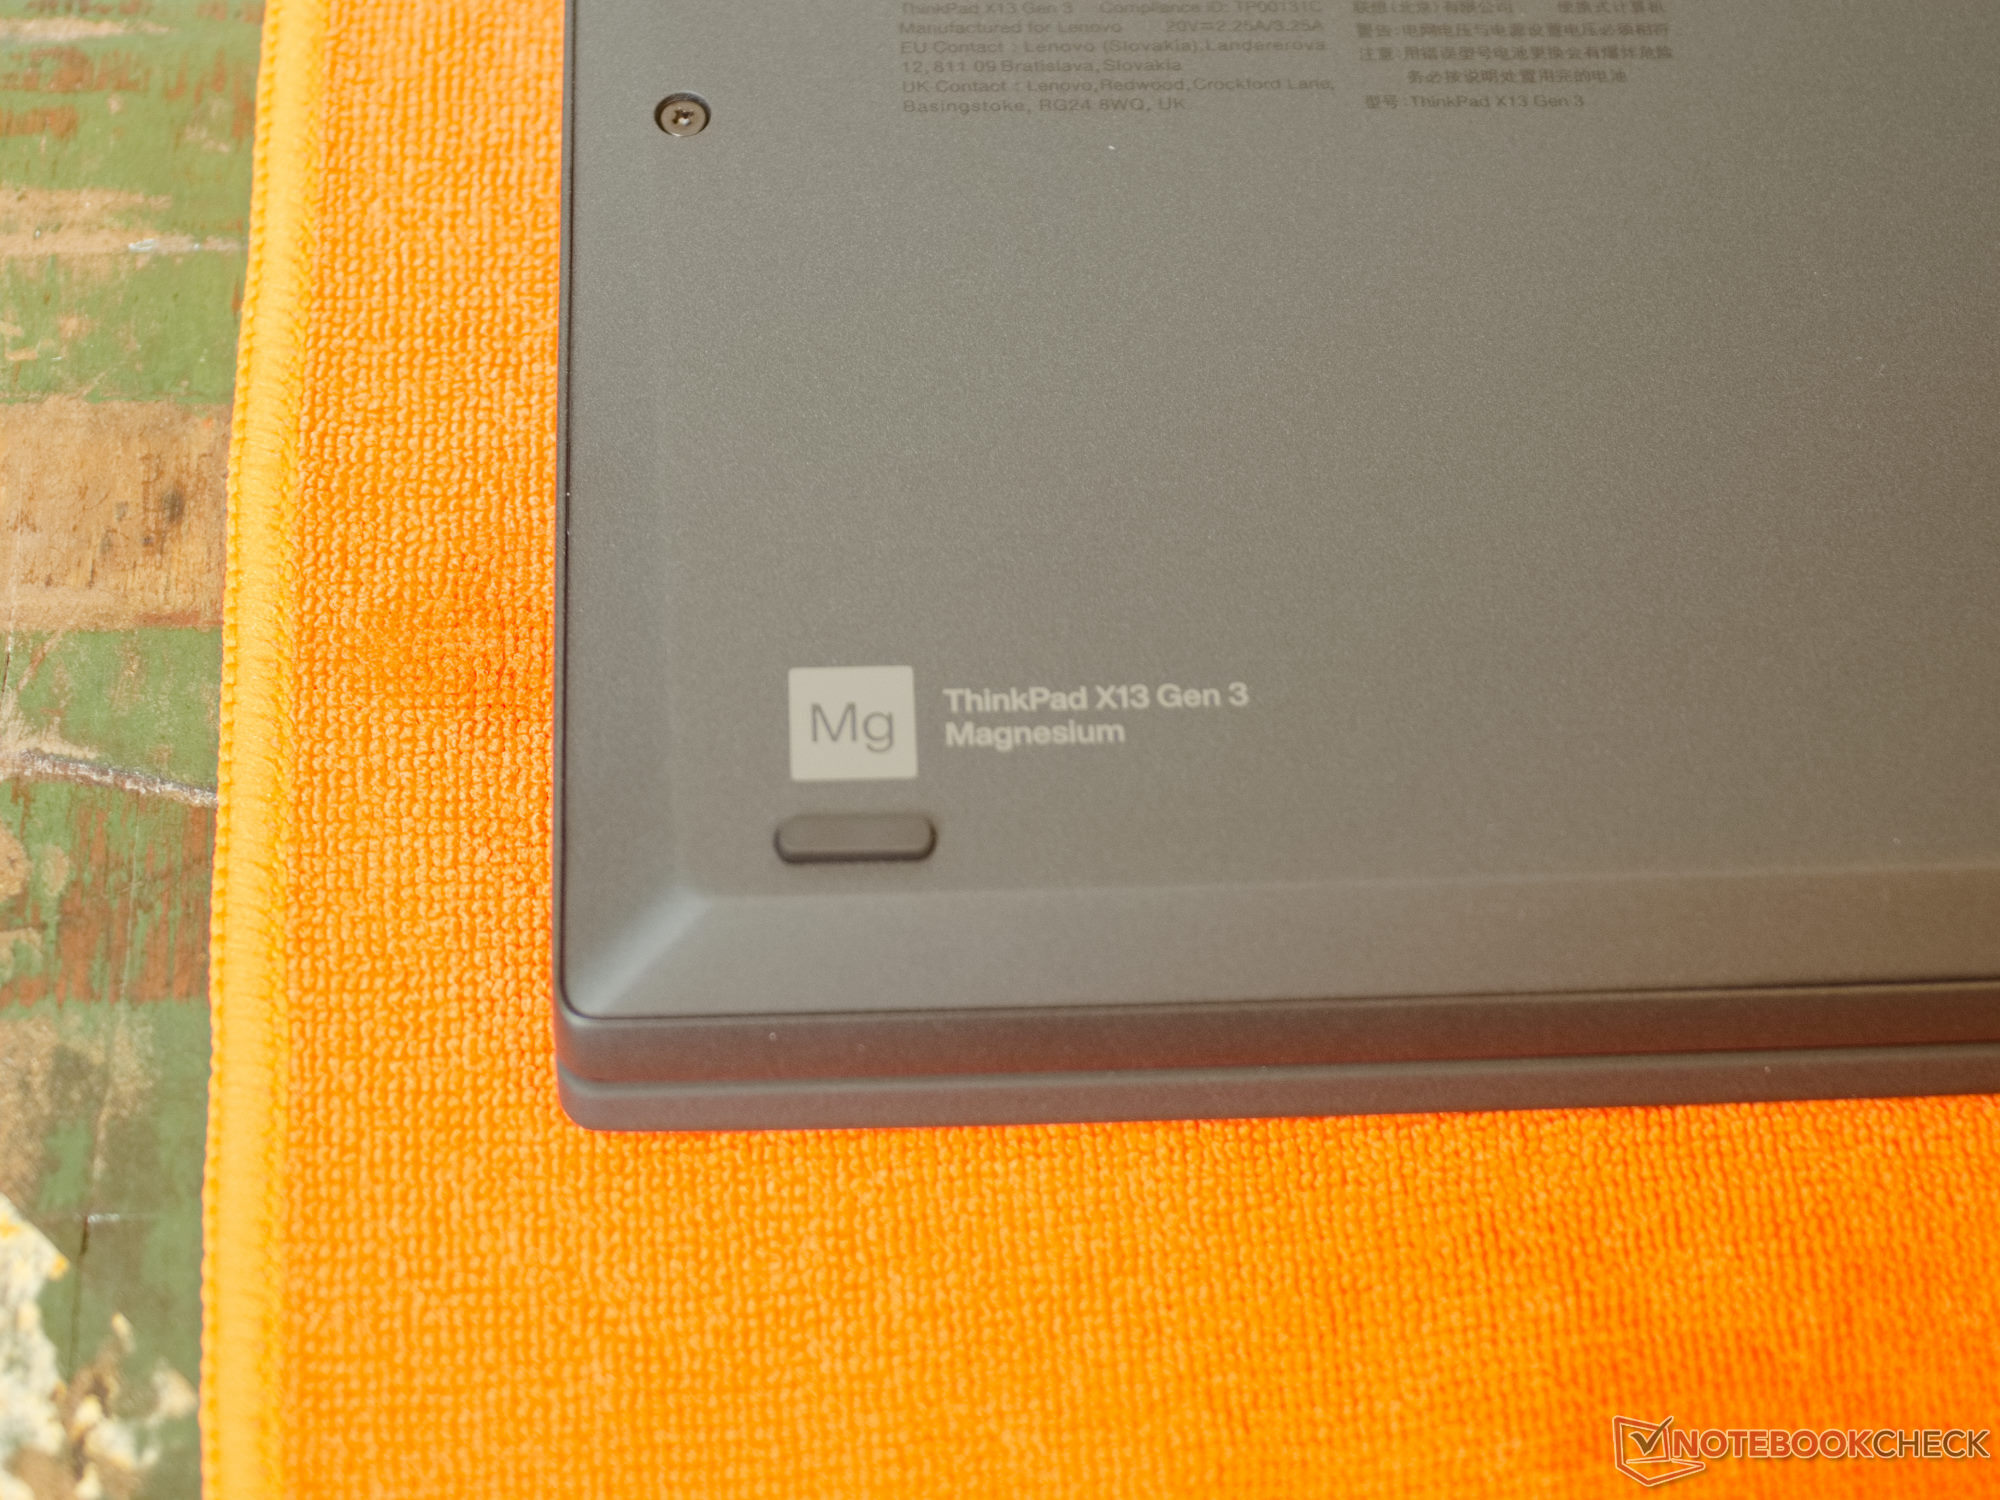
Das ThinkPad X13 besitzt eine typische Größe für die Notebooks aus der 13-Zoll-Region. Allenfalls ist das Notebook mit fast 2 cm etwas dick. Auch beim Gewicht fällt der Laptop weder positiv noch negativ auf. Das Gehäuse aus dem Leichtmetall Magnesium scheint keinen Gewichtsvorteil zu bringen.
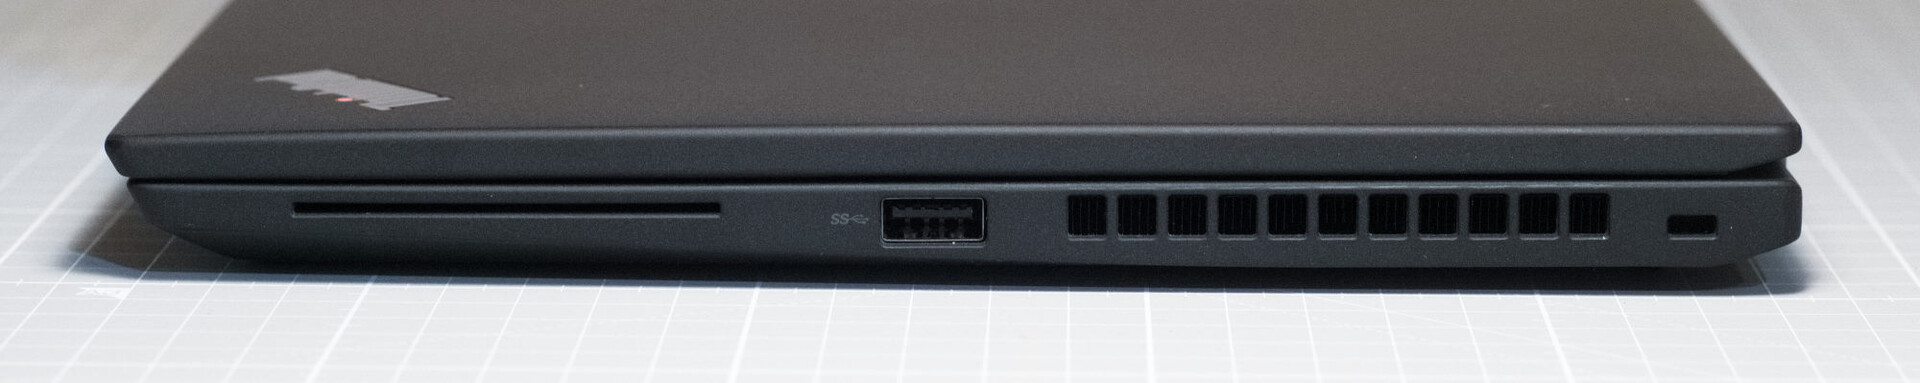
Ausstattung - USB-Typ-C mit DisplayPort und PD statt Dockingstation-Anschluss
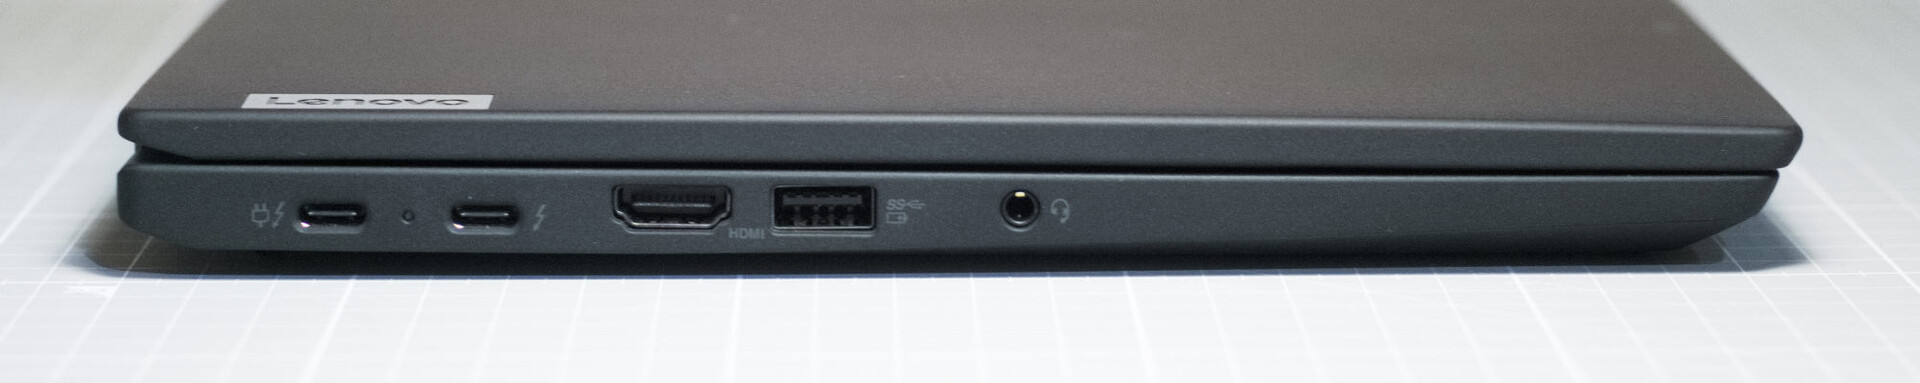
Das Gros der Anschlüsse am ThinkPad befindet sich auf der linken Seite. Rechts gibt es nur eine USB-Buchse und den Smartcard-Reader. Etwas versteckt liegt der SIM-Karten-Einschub auf der Rückseite des Büro-Laptops. Hier passen Nano-SIM-Karten. Beide USB-C-Anschlüsse bieten Vollausstattung, also Thunderbolt 4.0, DisplayPort und PowerDelivery. Der proprietäre Anschluss für eine Dockingstation von Lenovo wurde somit abgeschafft.
Kommunikation
Mit Wi-Fi-6E ist das Lenovo ThinkPad X13 auf dem aktuellen Stand der Technik. Das Intel-AX211-Modul überzeugt in unserem Testgerät mit sehr hohen Übertragungsgeschwindigkeiten am GT-AXE11000. Allerdings muss hier erwähnt werden, dass das installierte Windows 10 nicht die 6GHz Bänder unterstützt. Daneben beherrscht es aber auch Bluetooth 5.2. Das verbaute LTE-Modem kann abseits von verfügbarem WLAN für eine Verbindung mit dem Internet sorgen. Es unterstützt zwei SIM-Karten. Über eine Nano-SIM oder eine eSIM kann die Verbindung hergestellt werden.
Webcam
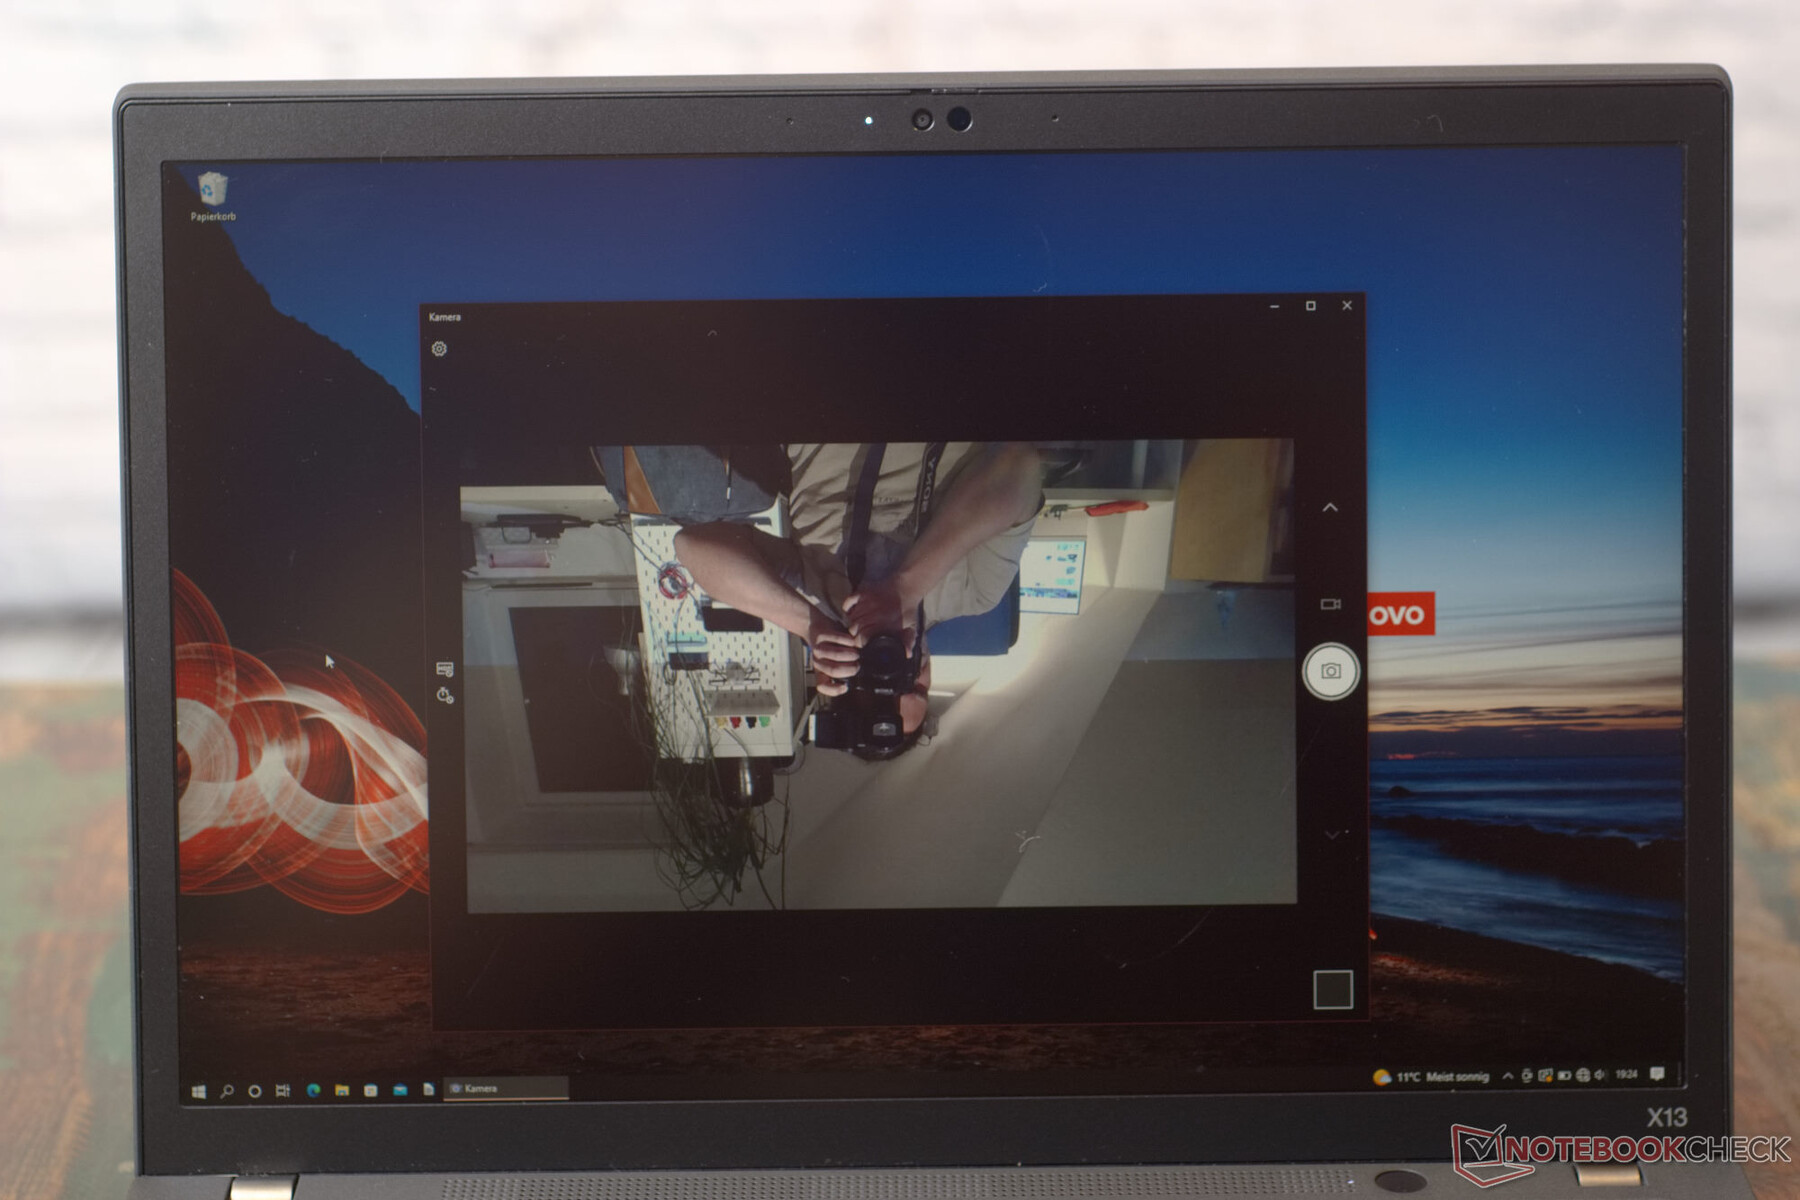
Die Windows-Hello-fähige Webcam im Lenovo ThinkPad X13 hat eine Full-HD-Auflösung und erzeugt, eine gute Beleuchtung vorausgesetzt, ein kontrastreiches und scharfes Bild. Allerdings hat die Linse hier einen auffälligen Fischaugeneffekt. Im Testbild unten wird deutlich, wie stark das Bild zu den Rändern hin verzerrt ist. Nach dem Windows 10 22H2 Update liegt ein Treiberfehler bei der Webcam vor. Sobald der Laptop aus dem Energiesparmodus eingeschaltet wird, steht das Kamerabild auf dem Kopf. Dann funktioniert auch Windows Hello per Webcam nicht mehr.


Sicherheit
Das ThinkPad X13 bietet viele verschiedene Methoden zur Sicherheit des Gerätes. Für die physische Sicherung steht ein Kensington-Lock-Slot auf der rechten Seite zur Verfügung. Hier findet man auch den Smart-Card-Reader, der eine Zugangskontrolle ermöglicht. Im Ein/Aus-Taster ist eine Fingerabdruckerkennung verbaut. Diese kann auch vor dem Booten aktiv werden und so das Gerät vor Manipulationen des Betriebssystems schützen. Die Webcam des Gerätes verfügt zudem über die Möglichkeit der Gesichtserkennung. Letztlich stehen auch die Sicherheitsfeatures des Intel Core i5 bereit.
Zubehör
Das ThinkPad X13 kommt sicher und nahezu plastikfrei verpackt, mit dem Minimum an Zubehör. Außer dem beiliegendem 65-Watt-USB-C Netzteil findet man nur die Dokumentation im Karton.
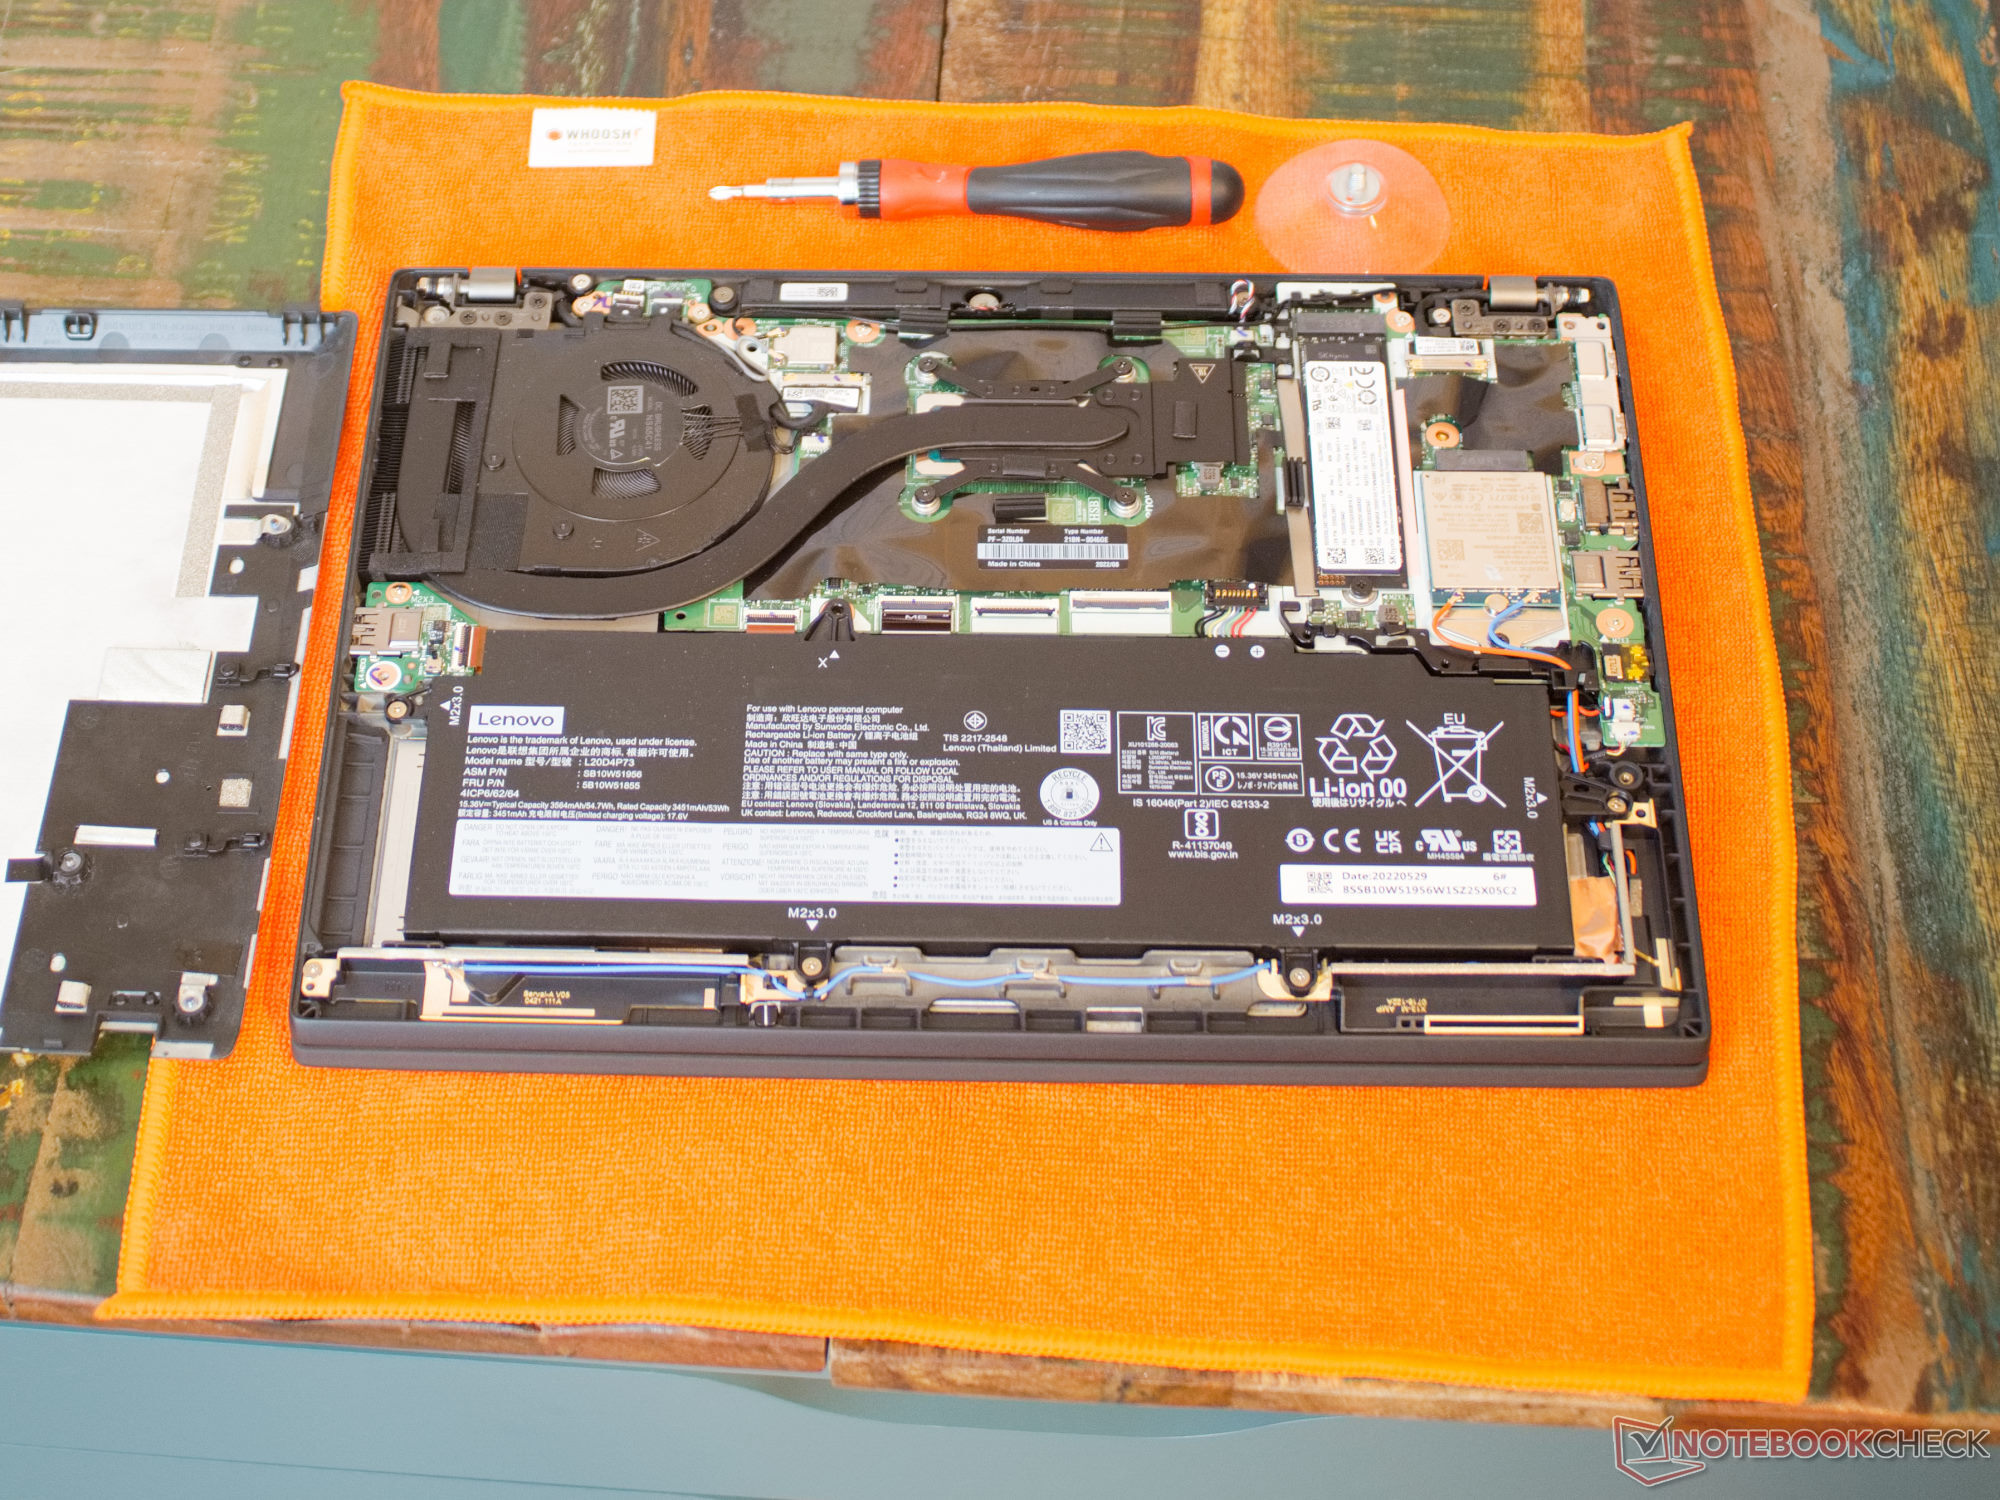
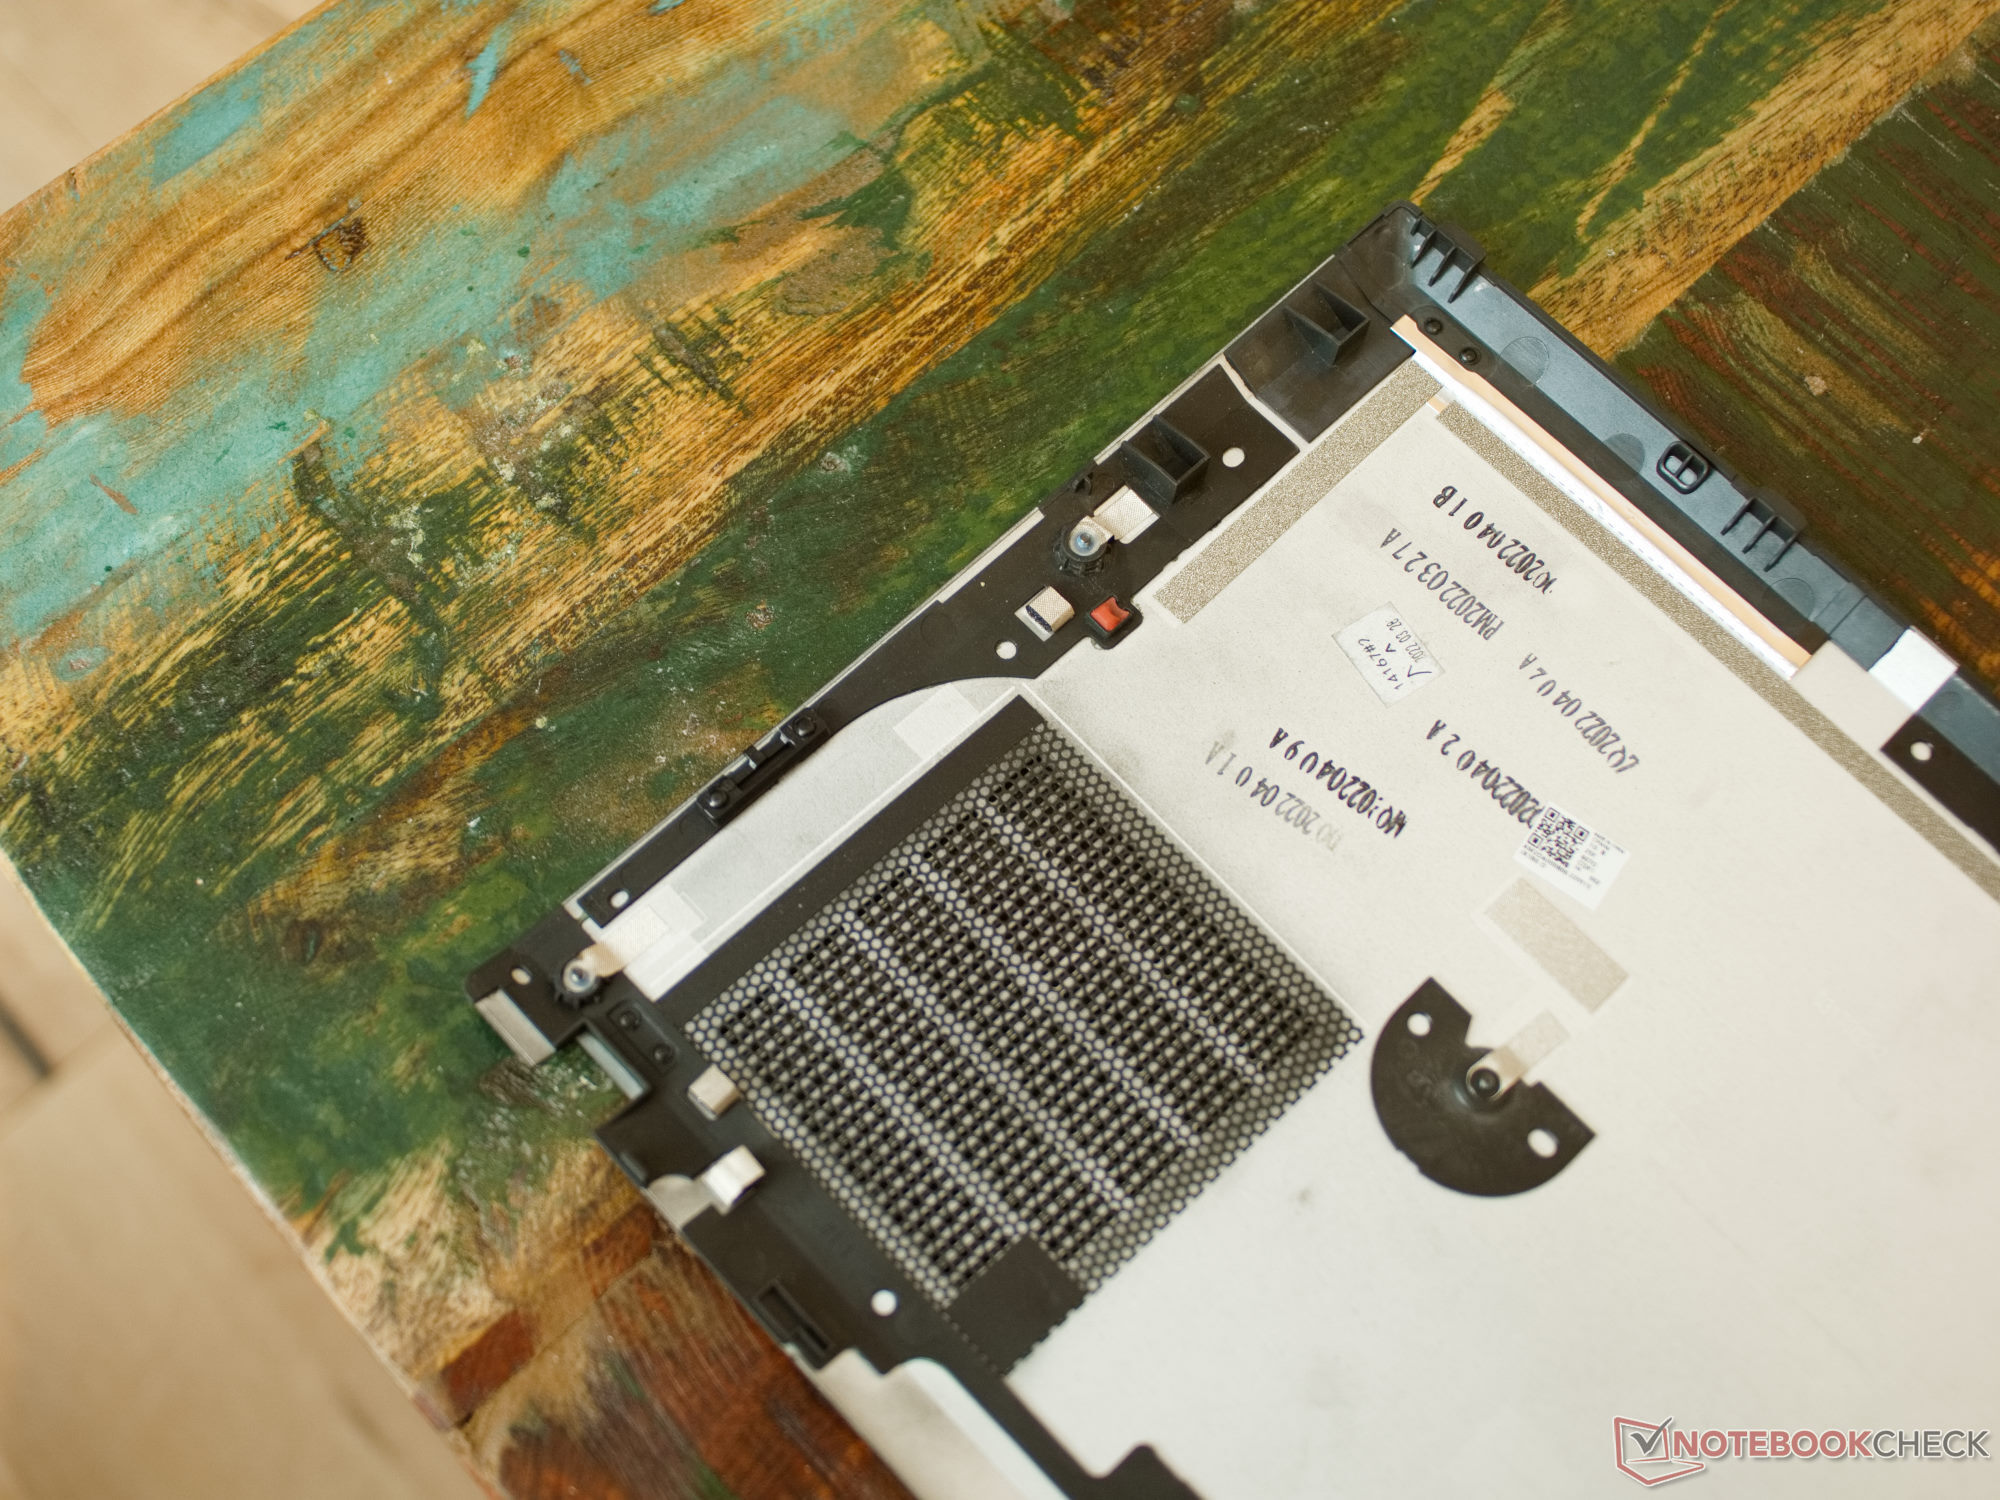
Wartung
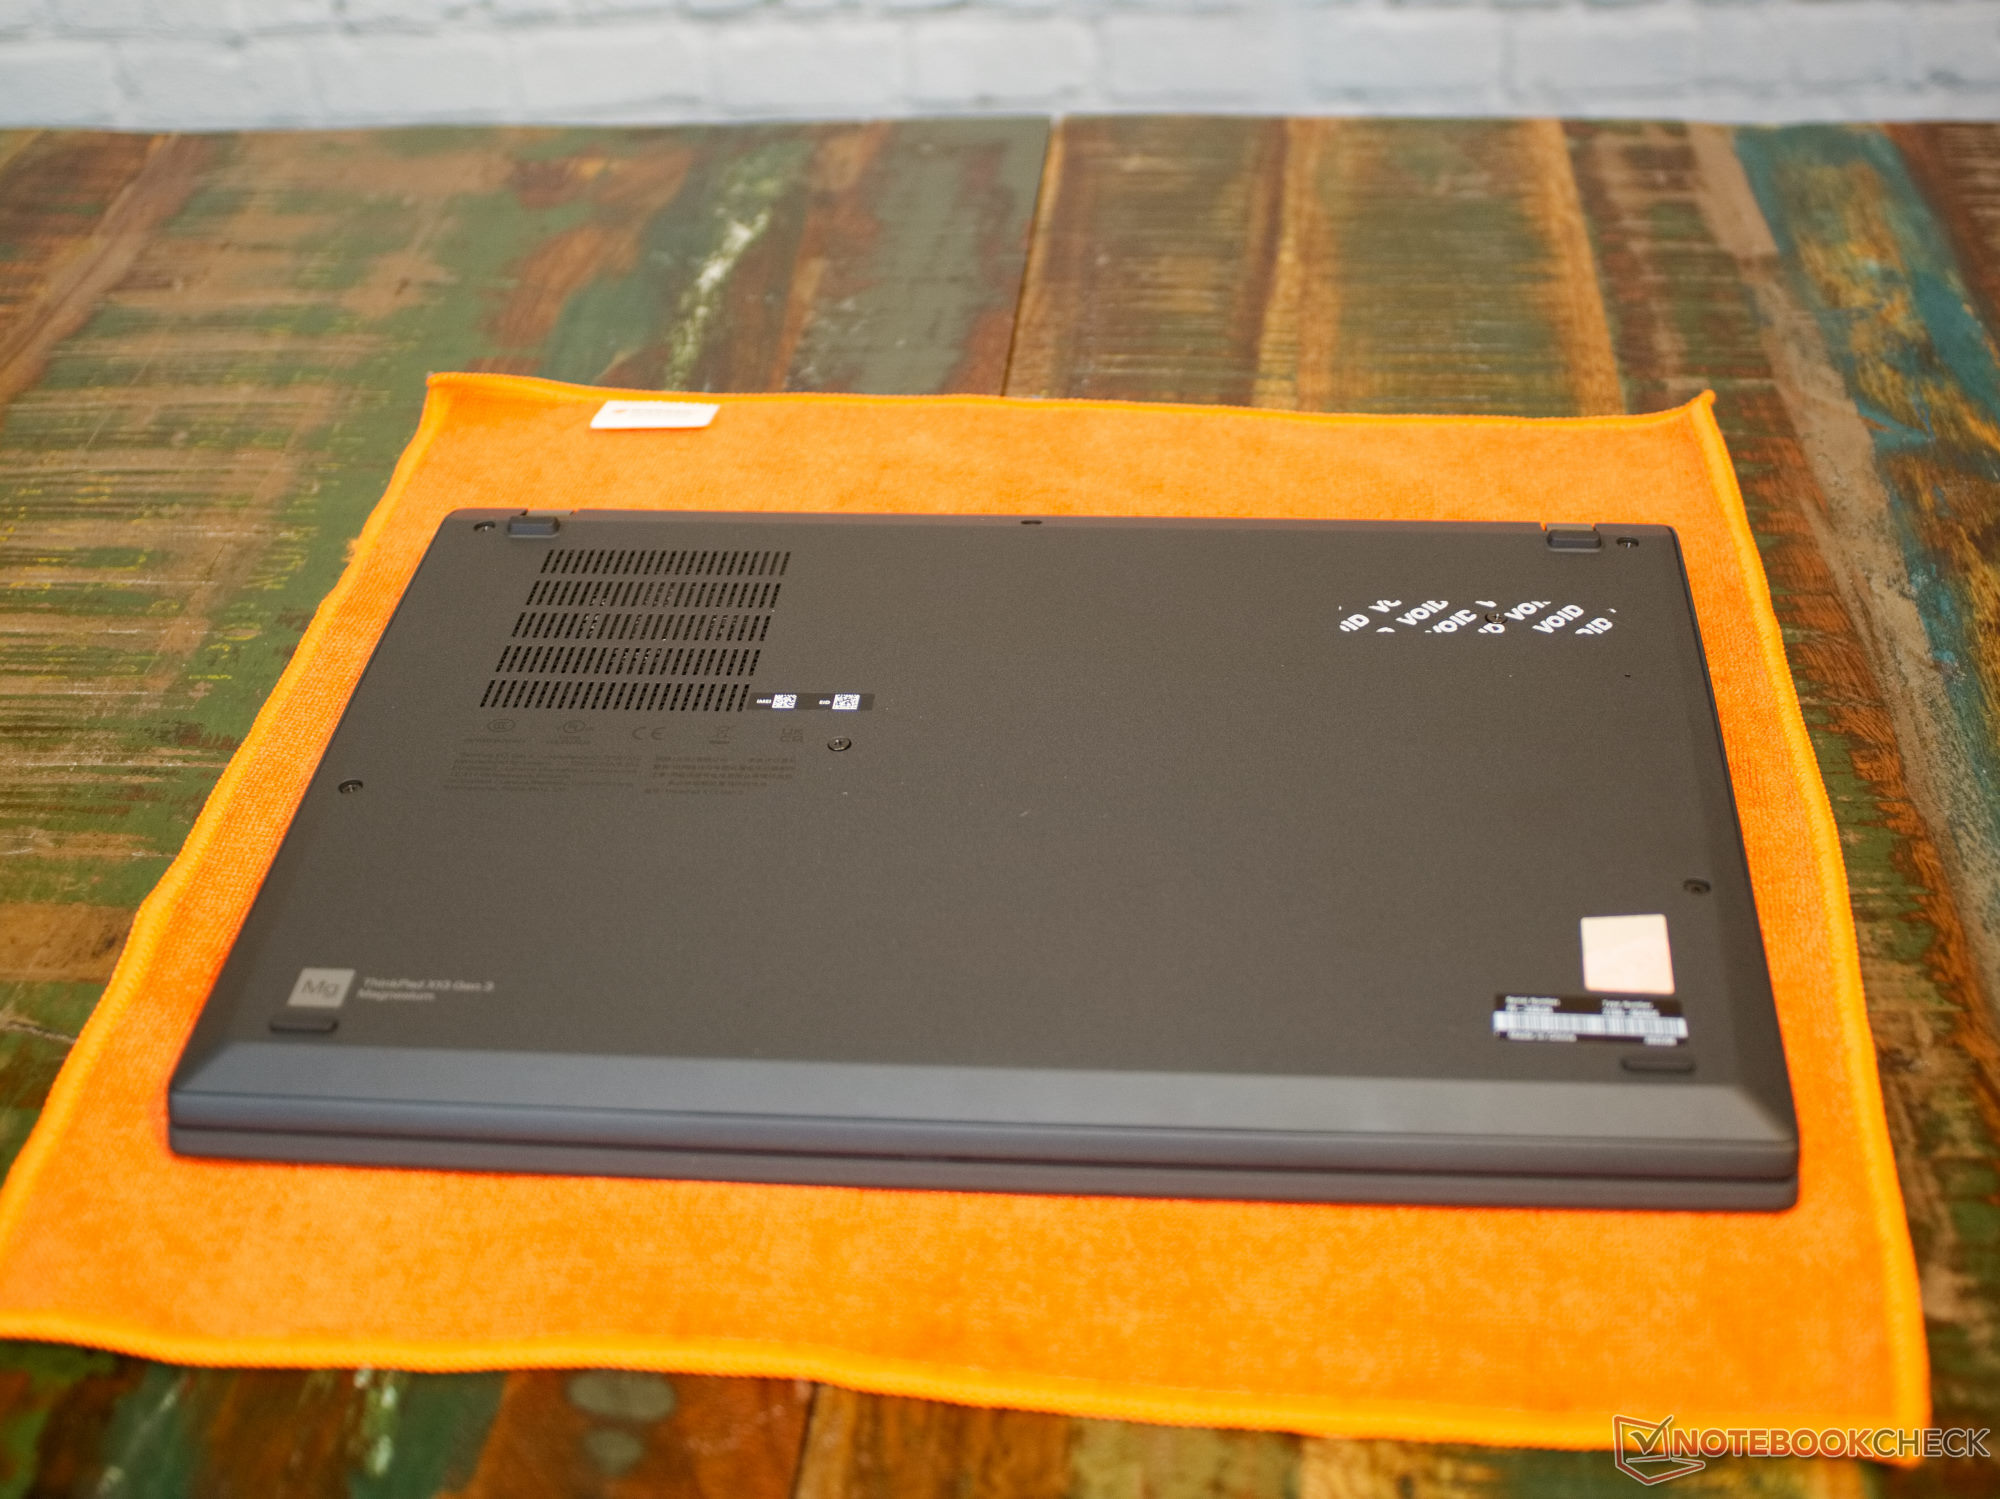
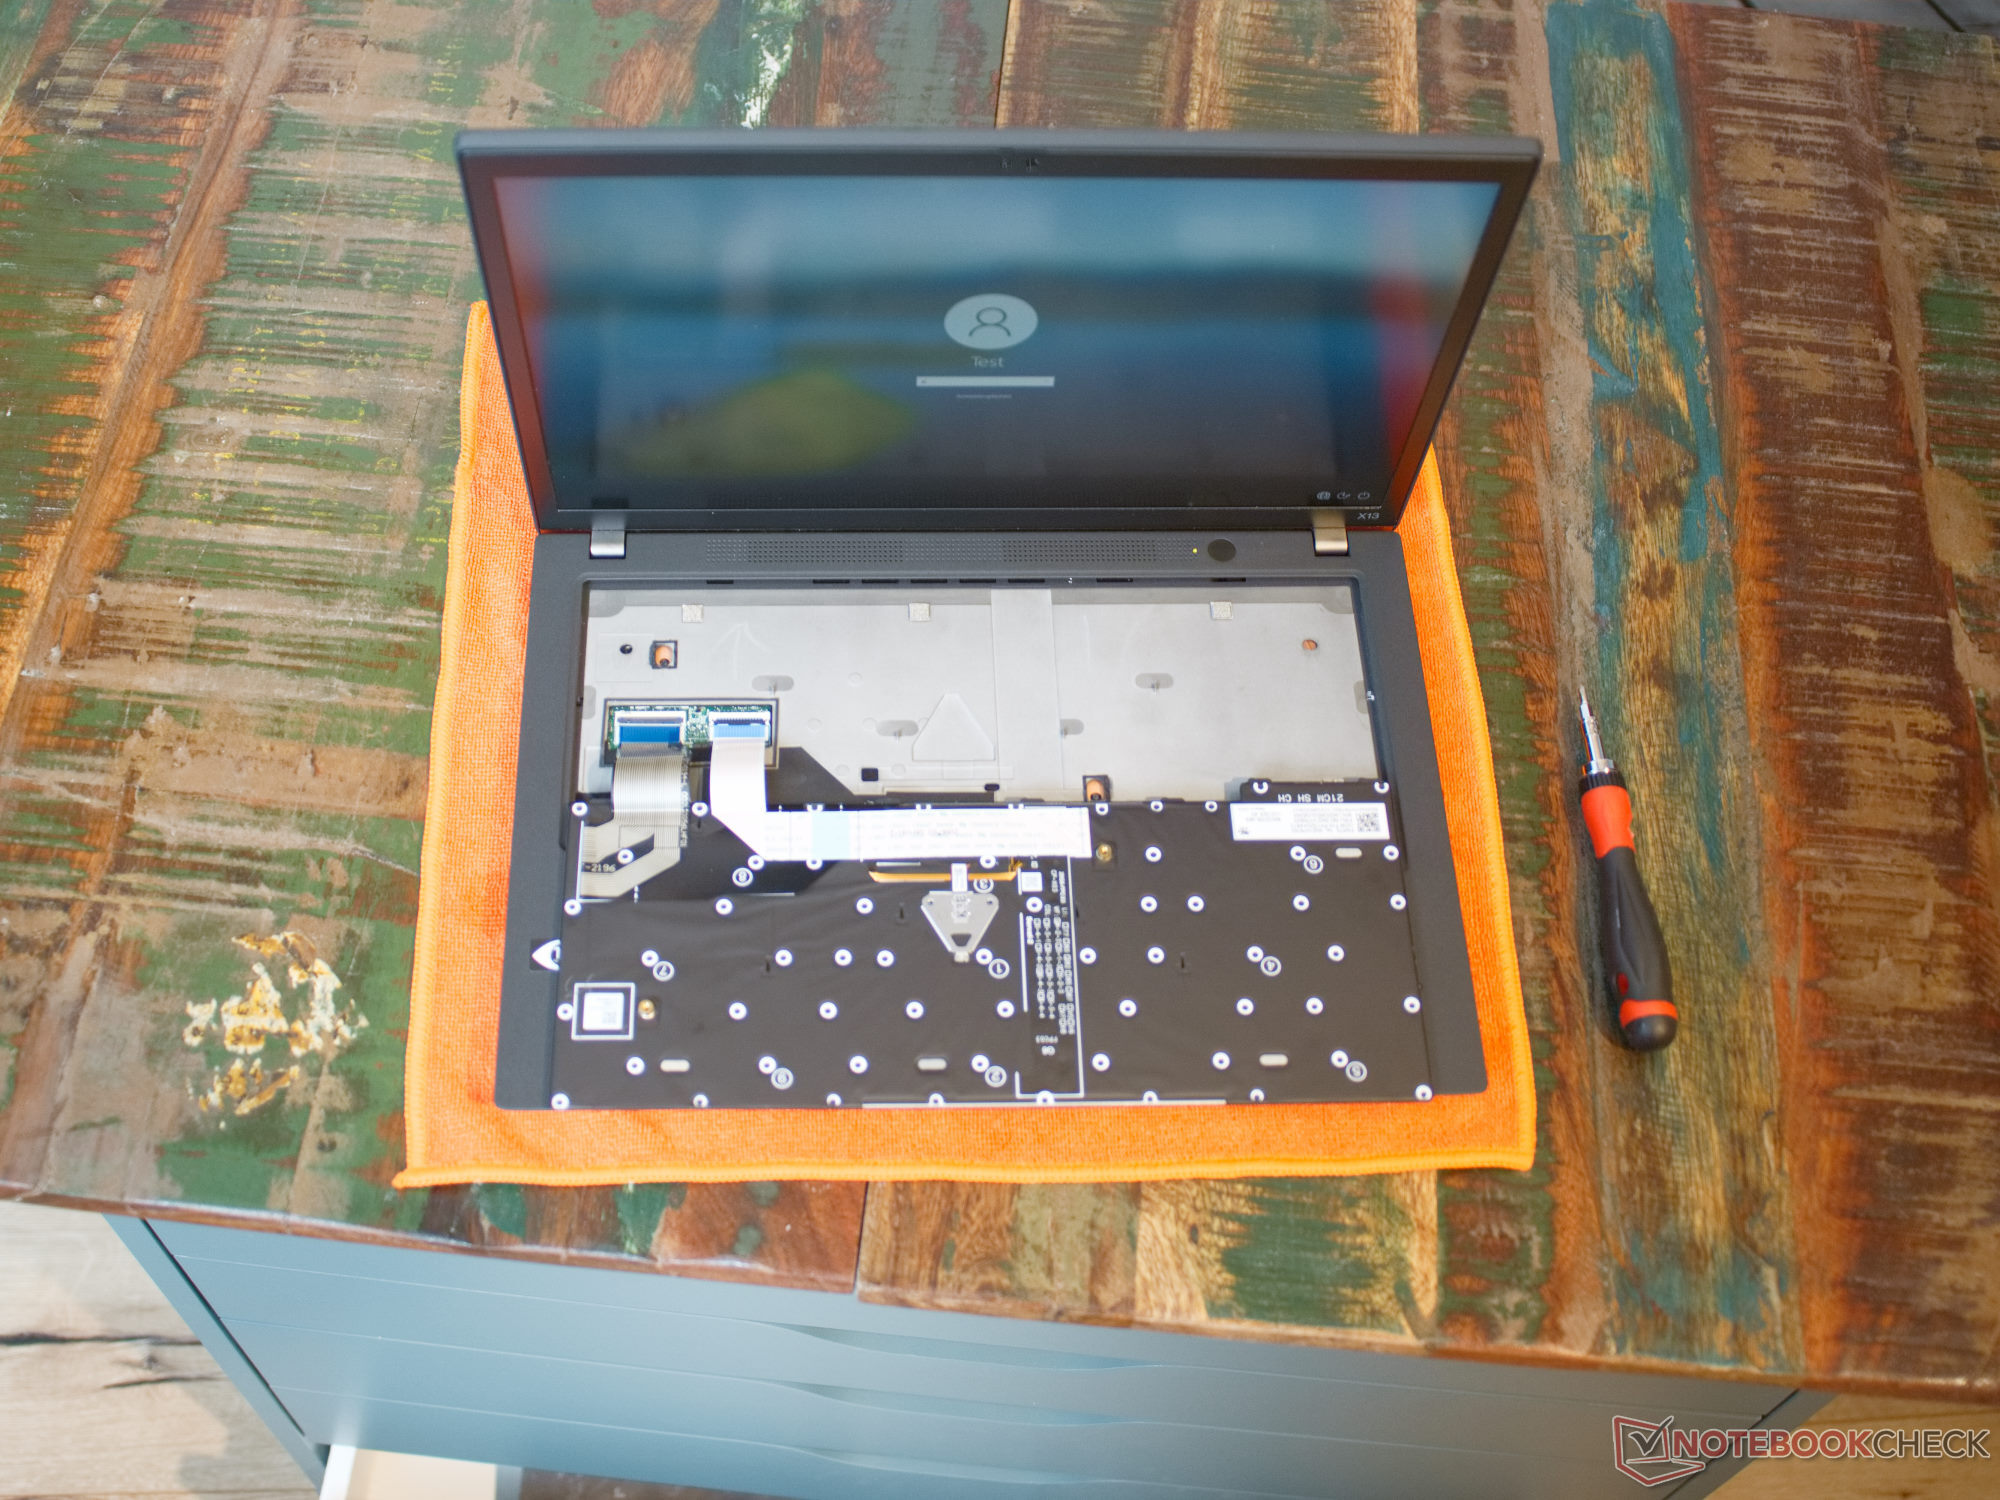
Lenovo stellt für viele Laptops umfangreiche Wartungsmanuals bereit. Auch für das ThinkPad X13 Gen 3 lässt sich das Hardware Maintenance Manual (PDF) finden. Entsprechend der Anleitung lässt sich der Laptop leicht öffnen. Im Inneren begegnen uns eine austauschbare SSD sowie das gesteckte LTE-Modul. Der Arbeitsspeicher ist verlötet und kann nicht erweitert werden. Die Tastatur des Notebooks lässt sich im Schadensfall besonders leicht wechseln. Zwei Schrauben auf der Rückseite des Lenovo-Laptops sichern diese.
Garantie
Unser Testgerät kommt mit einer Garantie von 36 Monaten. Der Garantiestatus lässt sich hier jederzeit über das Lenovo Commercial Vantage Programm abrufen.
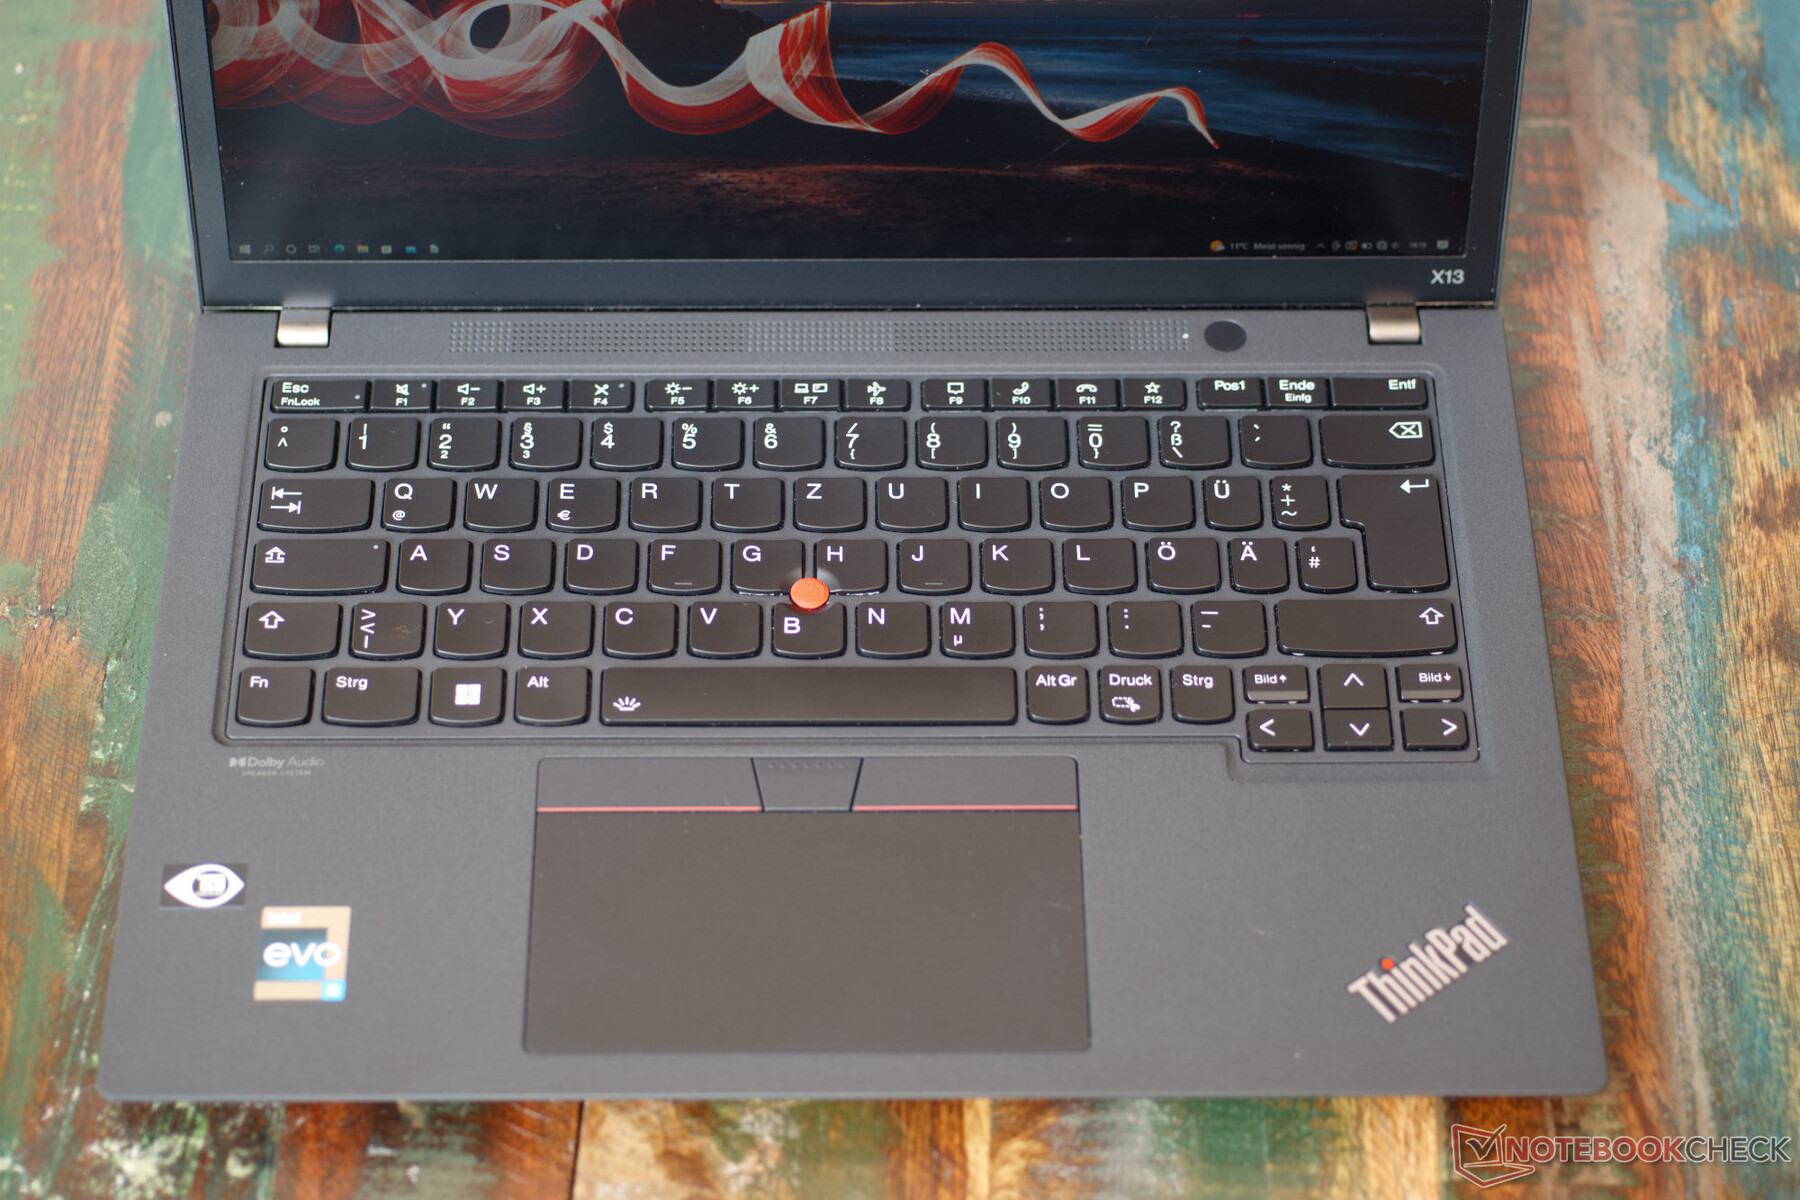
Eingabegeräte - Flache Tasten
Die Tastatur ist auf dem typischen Niveau eines ThinkPads. Sie weist einen angenehmen Druckpunkt auf. Der Tastenhub von ca. 1,5 mm könnte aber etwas höher ausfallen. Um den Cursor zu bewegen, stehen der rote Trackpoint und ein Touchpad bereit. Beim Touchpad stellen wir jedoch fest, das dieses leicht wackelig ist.
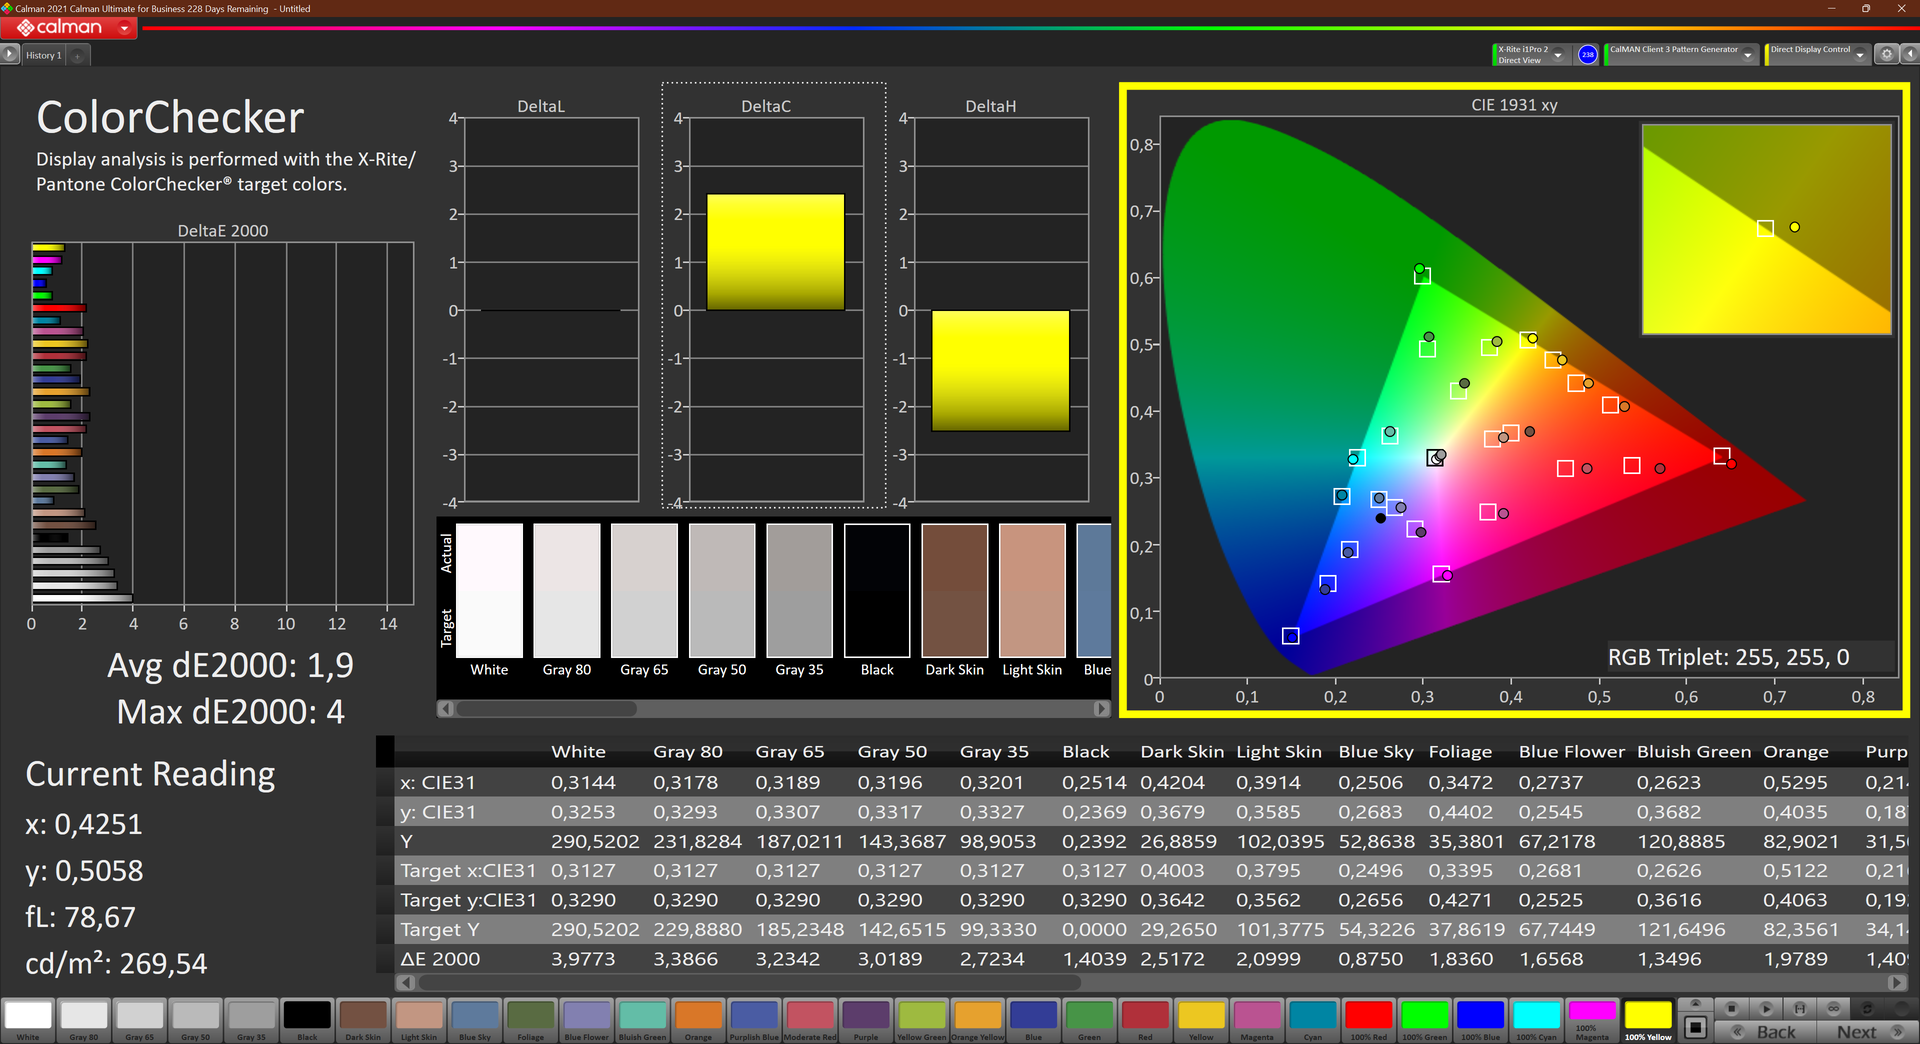
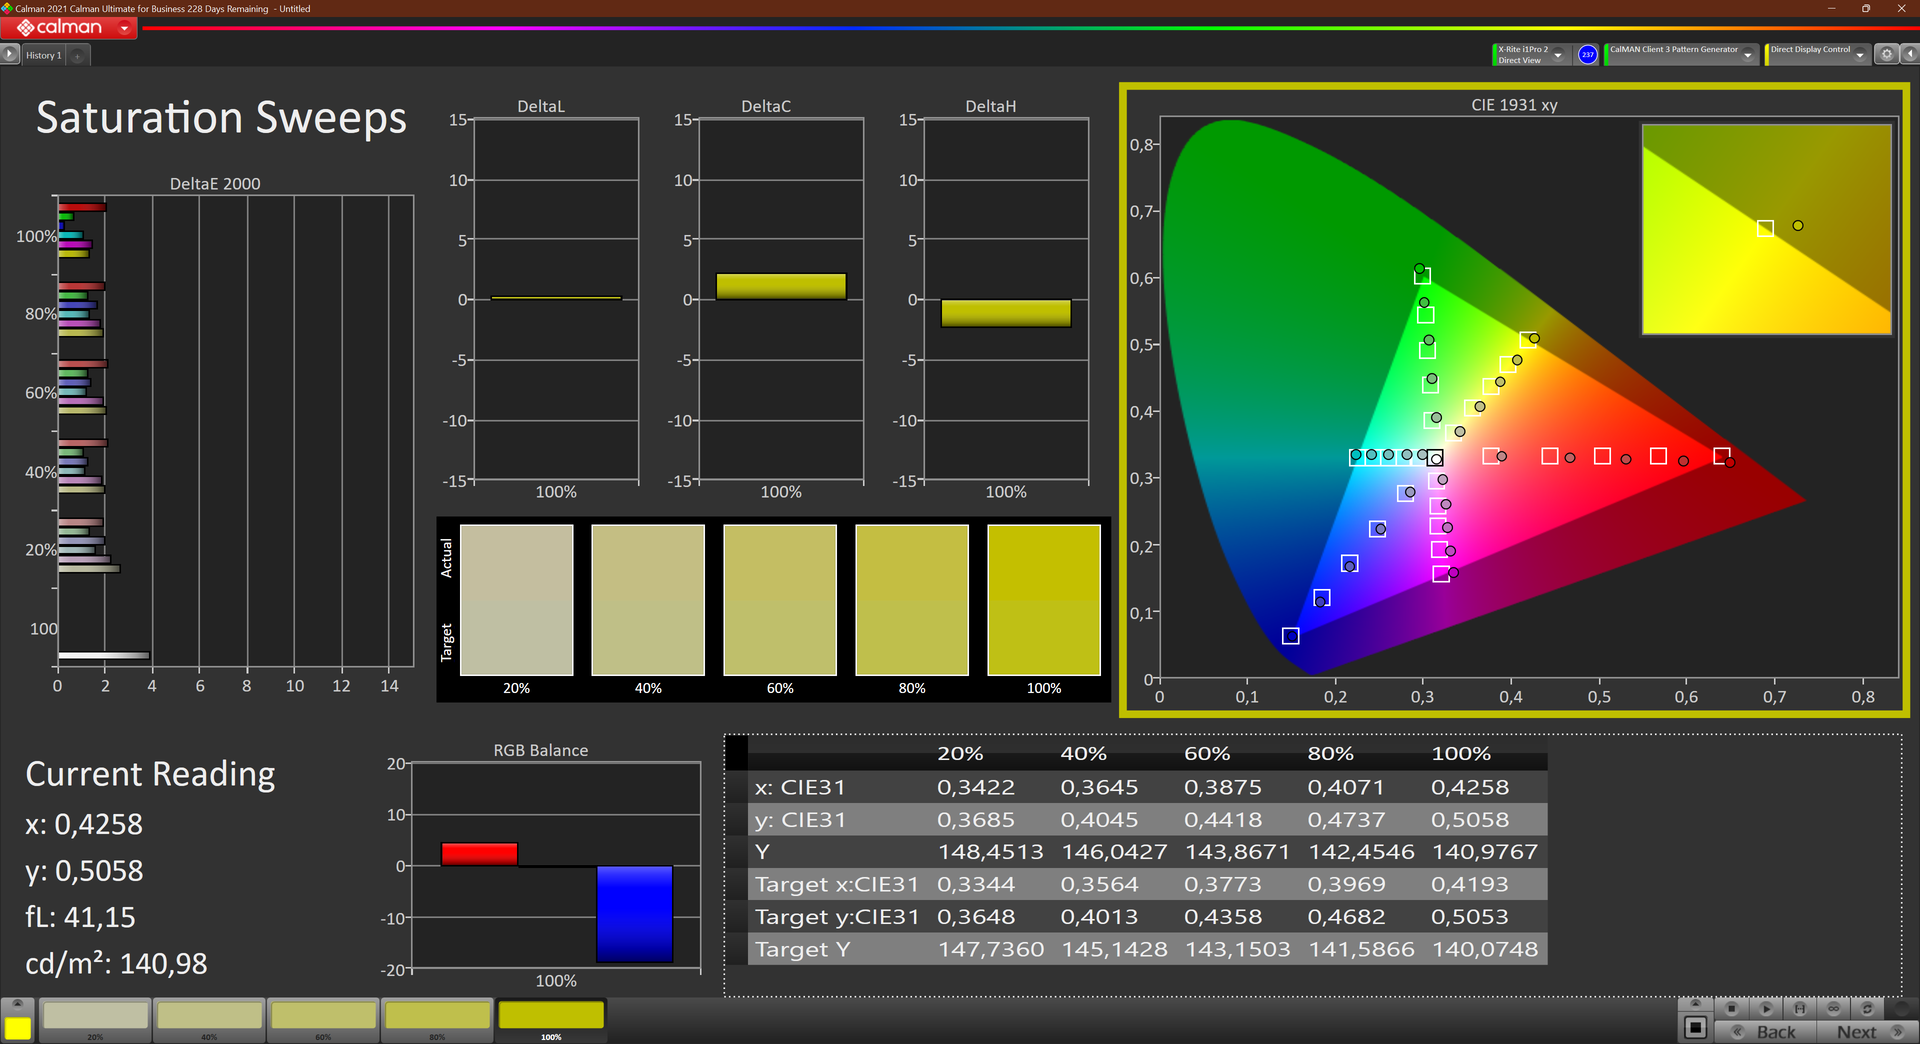
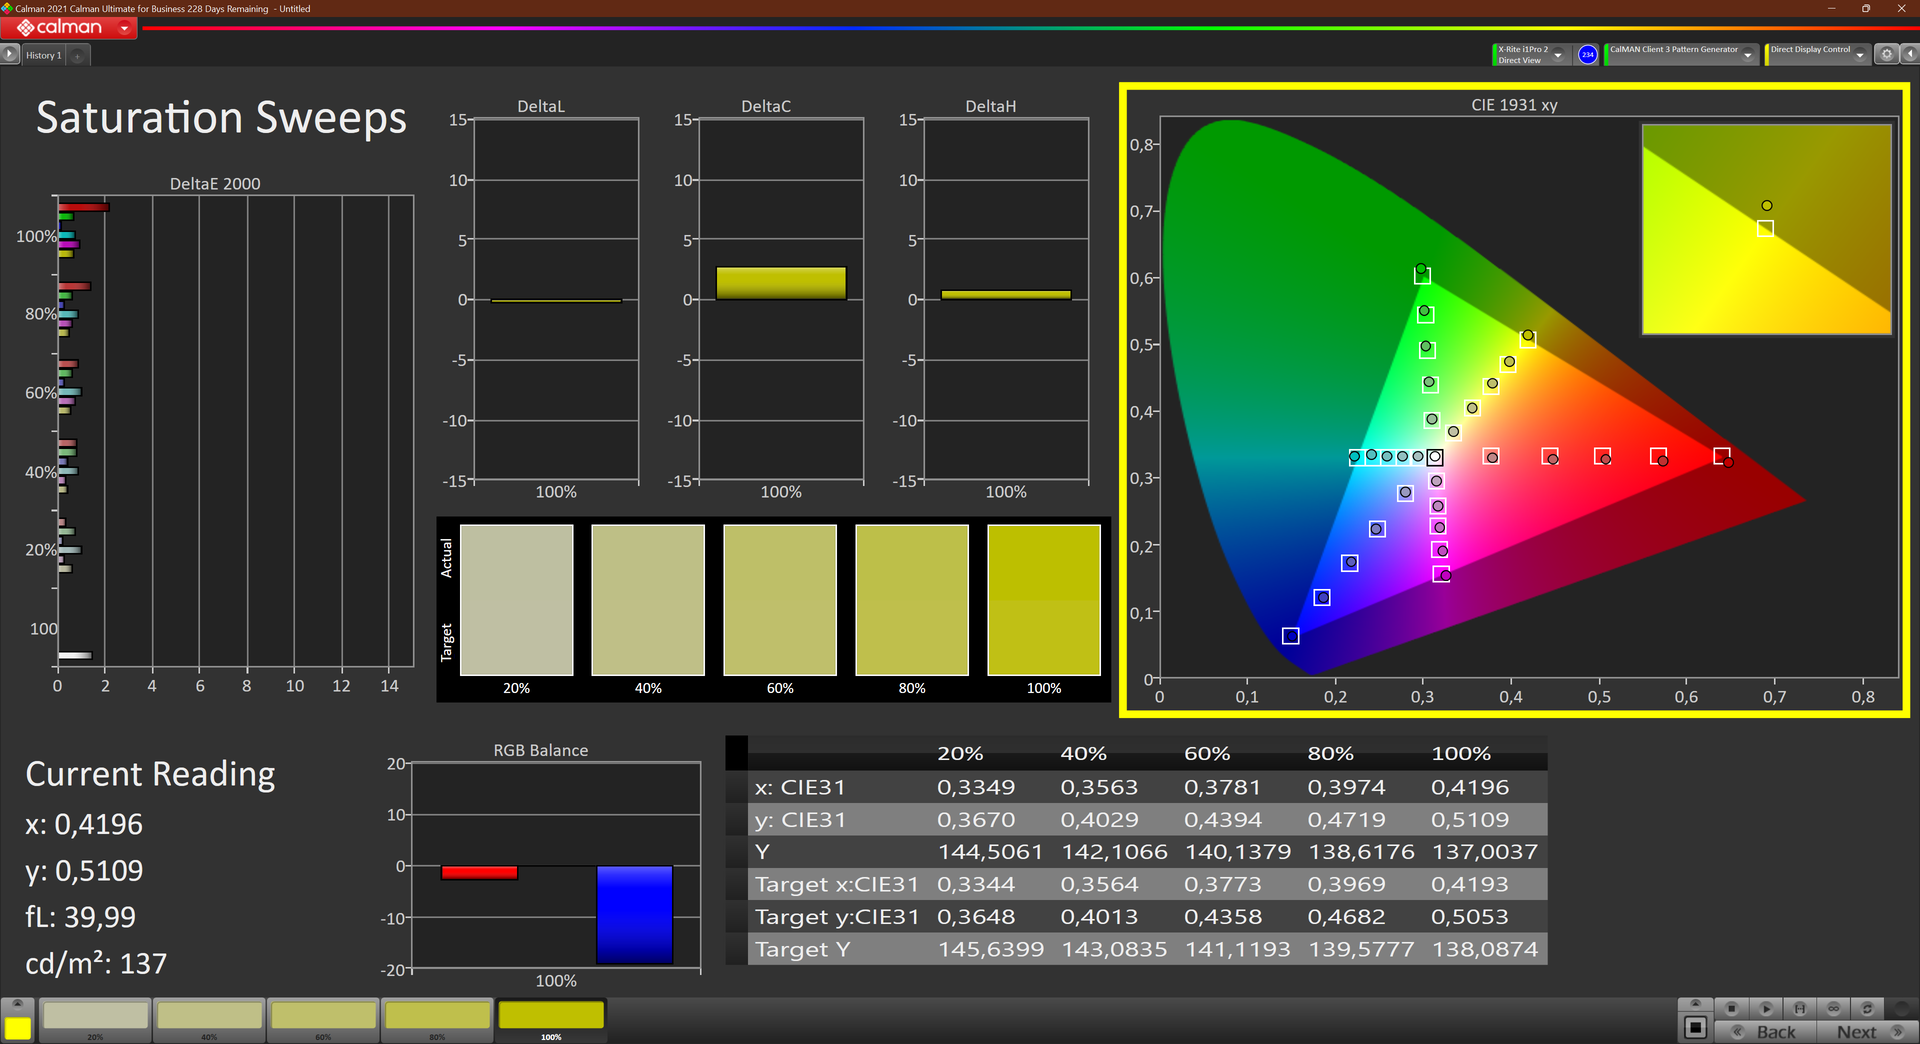
Display - 16:10 mit sehr guter Farbwiedergabe
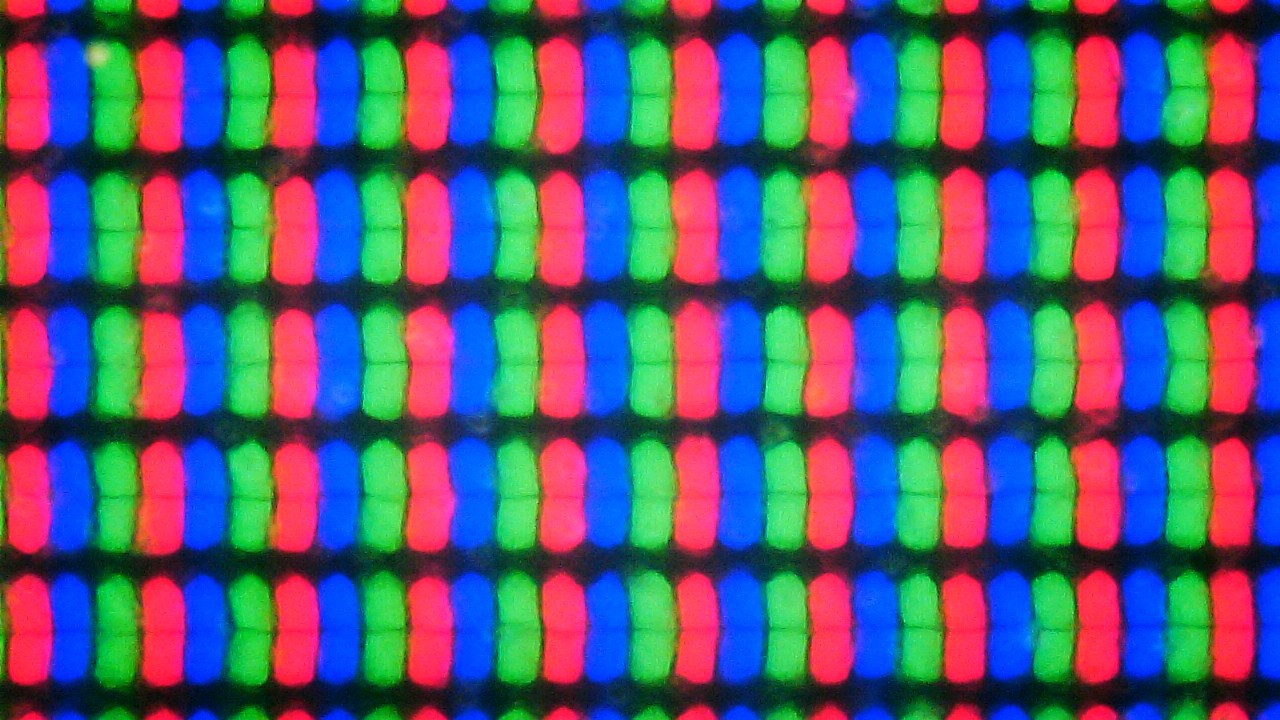

Der Bildschirm des Notebooks ist im 16:10-Format mit einer Auflösung von 1920 x 1200 Pixeln. So steht auf dem 13-Zoll-Display hier etwas mehr Bildschirmfläche zur Verfügung als bei einem vergleichbaren 16:9-Display. Lenovo gibt für das Paneel eine 72%ige NTSC-Abdeckung und eine Helligkeit von 300 cd/m² an.
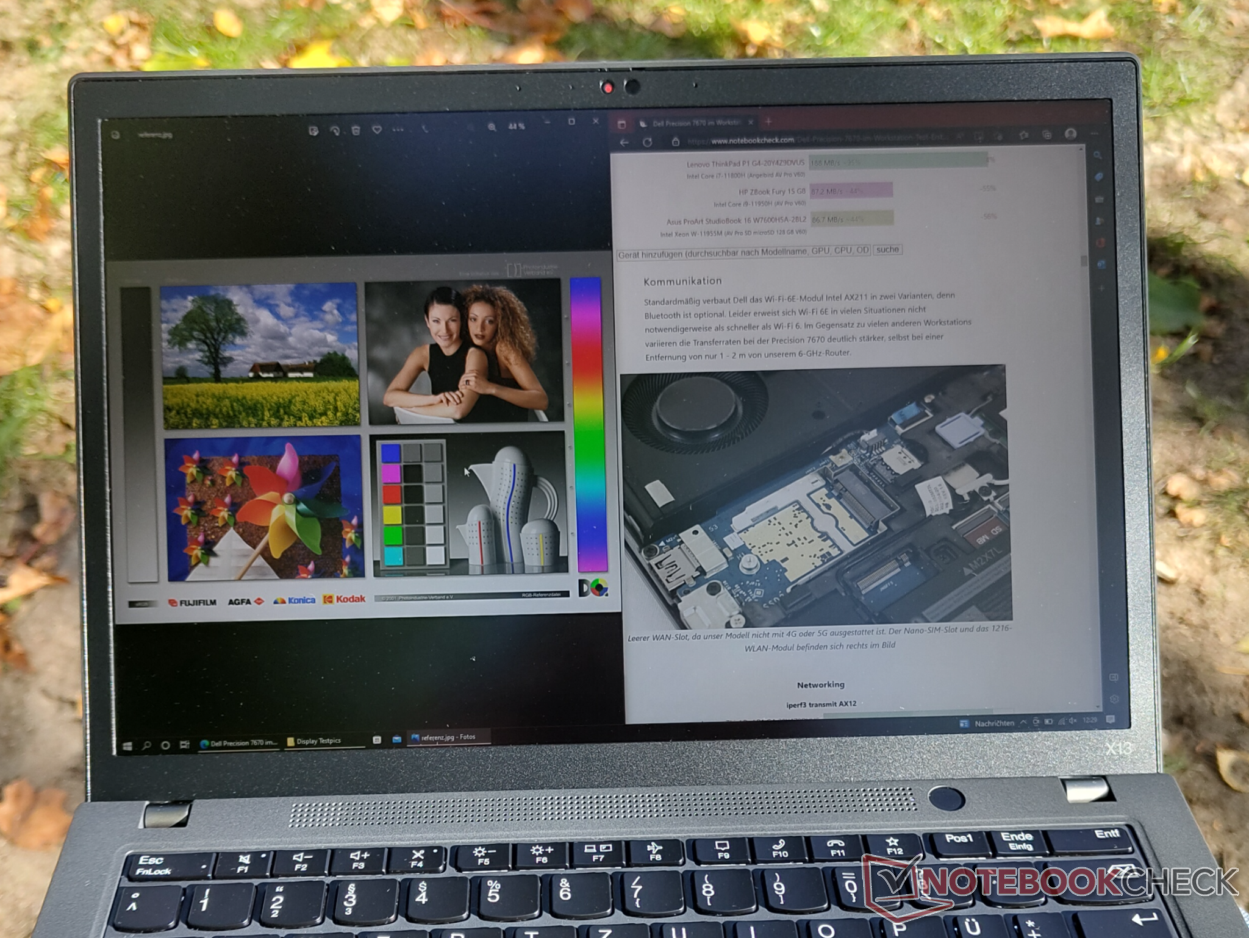
Beim ThinkPad X13 Gen 3 kommt ein IPS-Grade LCD zum Einsatz. Den matten Bildschirm vermessen wir mit durchschnittlich 288 cd/m², so bleibt er hier hinter allen Konkurrenten zurück. Ein hoher Kontrastwert von 1381:1 und die matte Oberfläche sorgen trotzdem für eine gute Ablesbarkeit des Bildschirms, auch im Außeneinsatz.
Die Ausleuchtung des Bildschirms ist nicht wirklich gleichmäßig. In den rechten Ecken messen wir nicht nur eine erhöhte Helligkeit, sondern nehmen Lichthöfe auch mit bloßem Auge wahr.
Neben dem IPS-Panel mit 300 cd/m² gibt es bei der Konfiguration des ThinkPad X13 G3 noch zwei weitere Optionen. So ist ein Touch-Display mit ebenfalls 300 cd/m² und ein ePrivacy-Display mit 500 cd/m² verfügbar. Alle drei Bildschirme werden von Lenovo sonst mit den gleichen technischen Daten angegeben.
| |||||||||||||||||||||||||
Ausleuchtung: 88 %
Helligkeit Akku: 290 cd/m²
Kontrast: 1381:1 (Schwarzwert: 0.21 cd/m²)
ΔE ColorChecker Calman: 1.9 | ∀{0.5-29.43 Ø4.76}
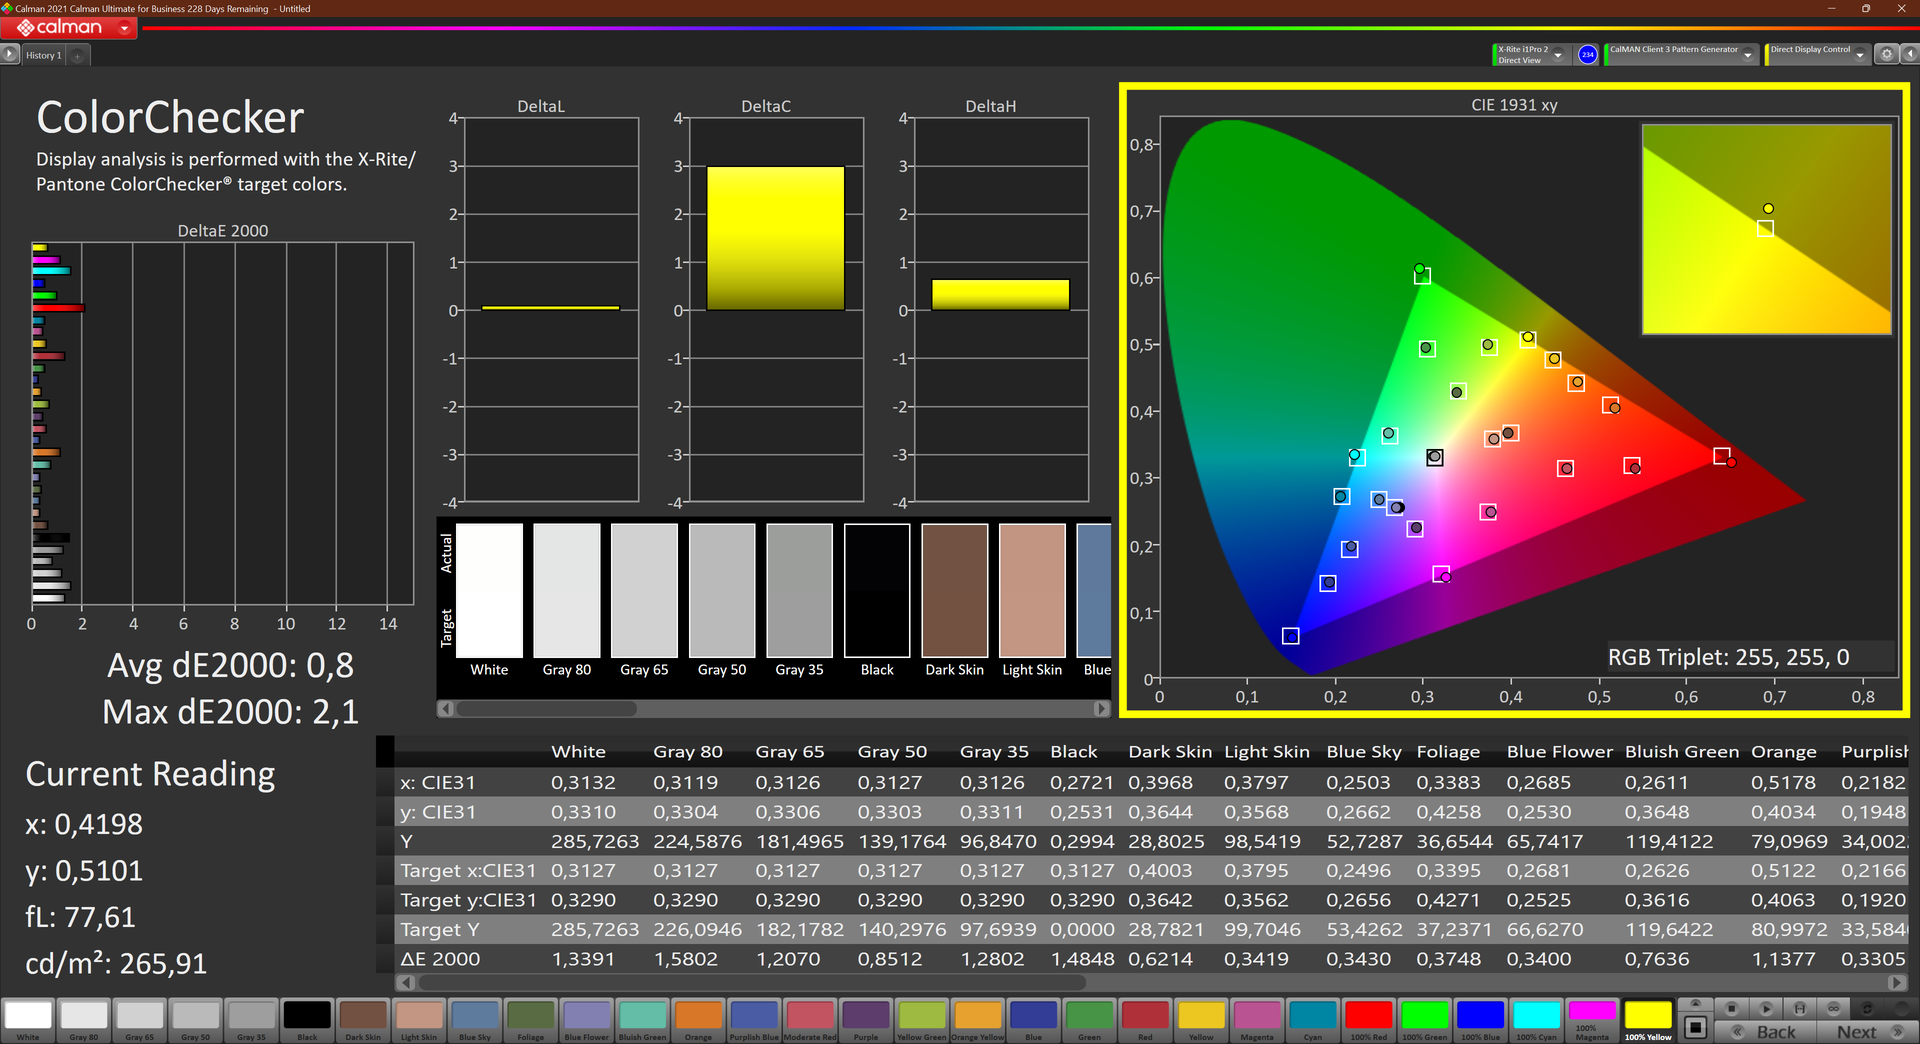
calibrated: 0.8
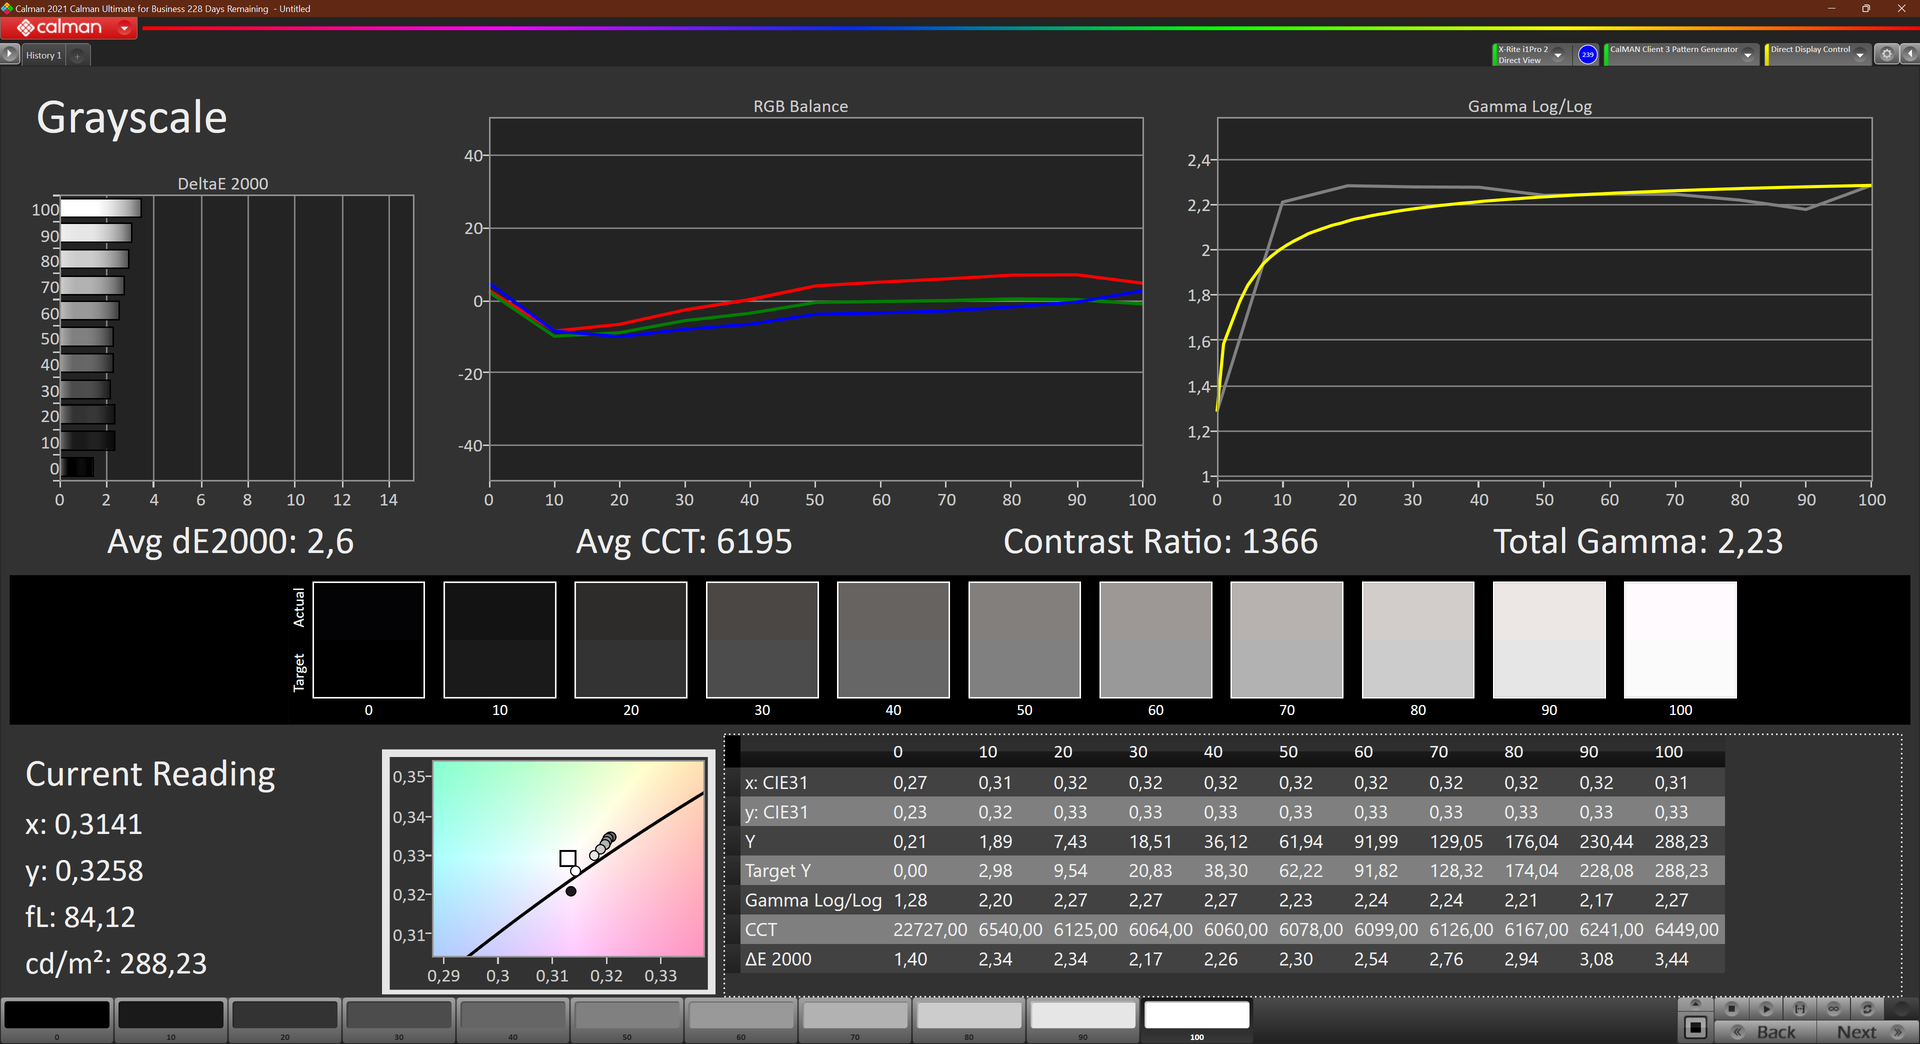
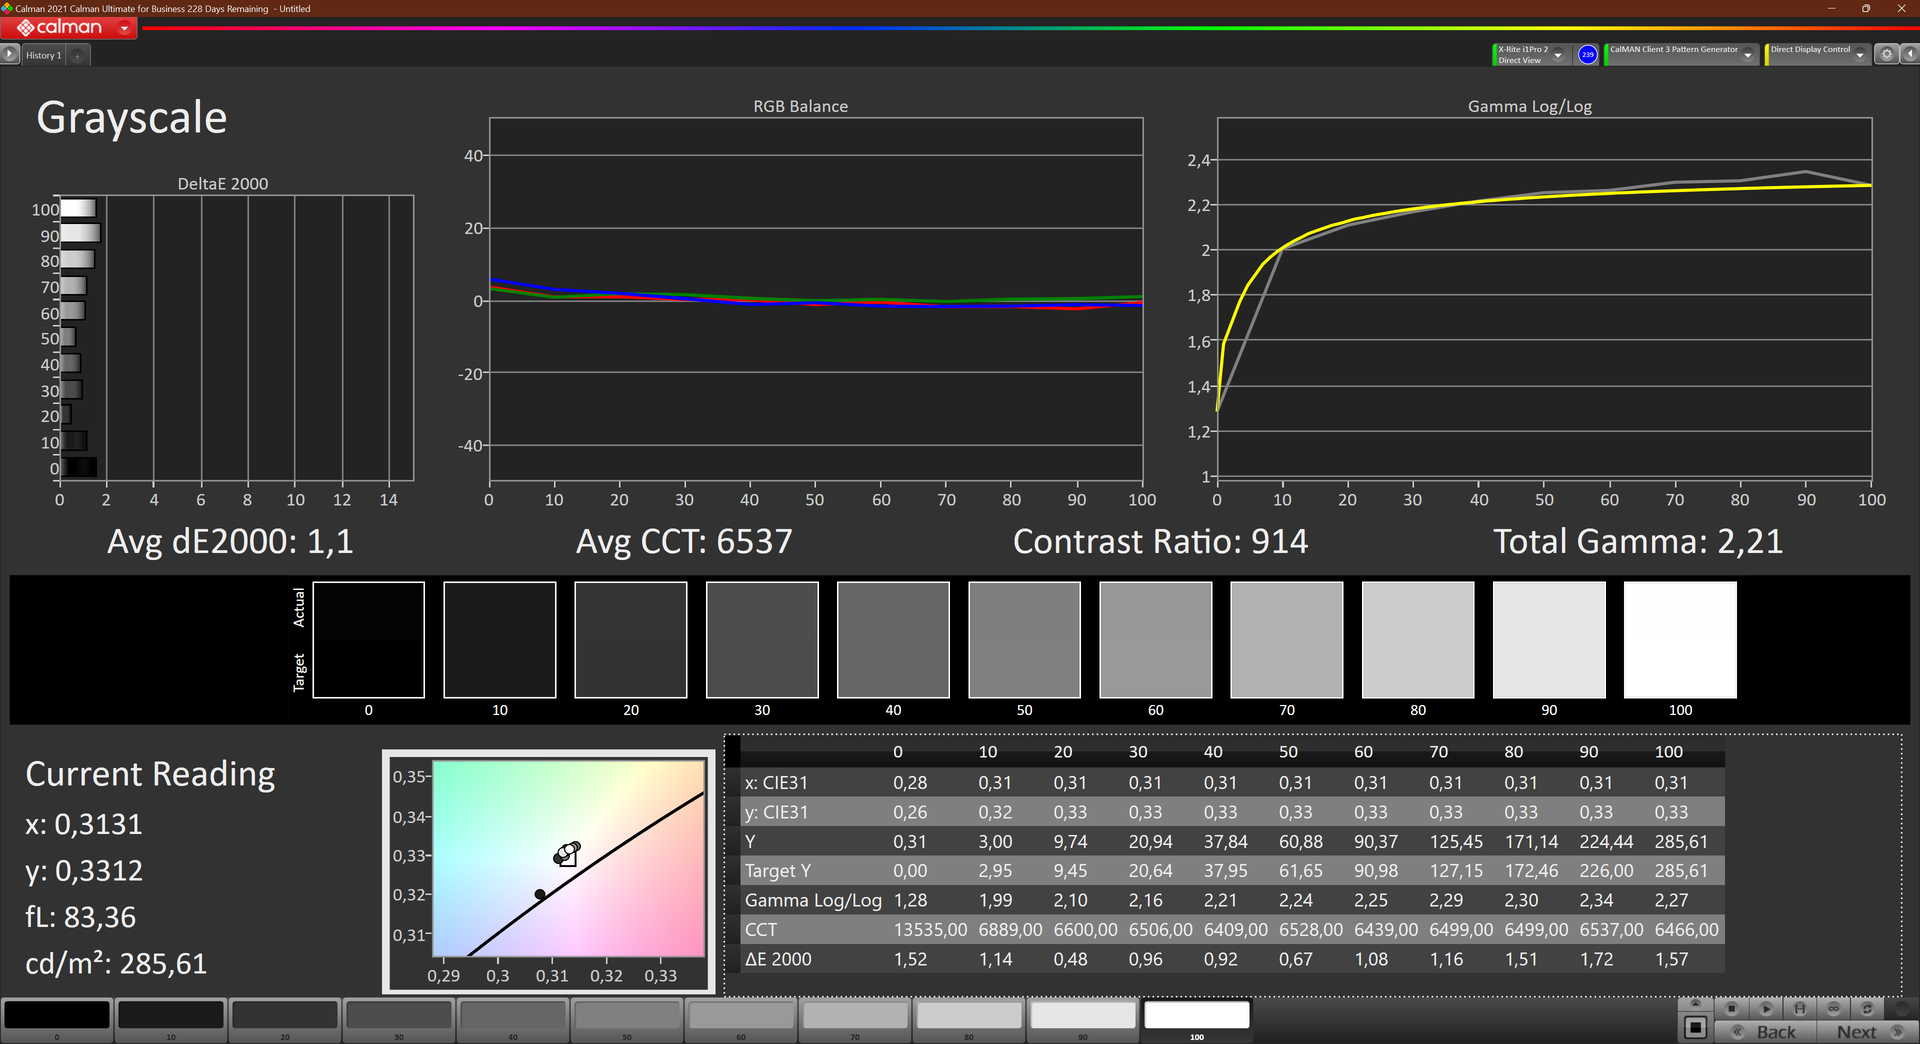
ΔE Greyscale Calman: 2.6 | ∀{0.09-98 Ø5}
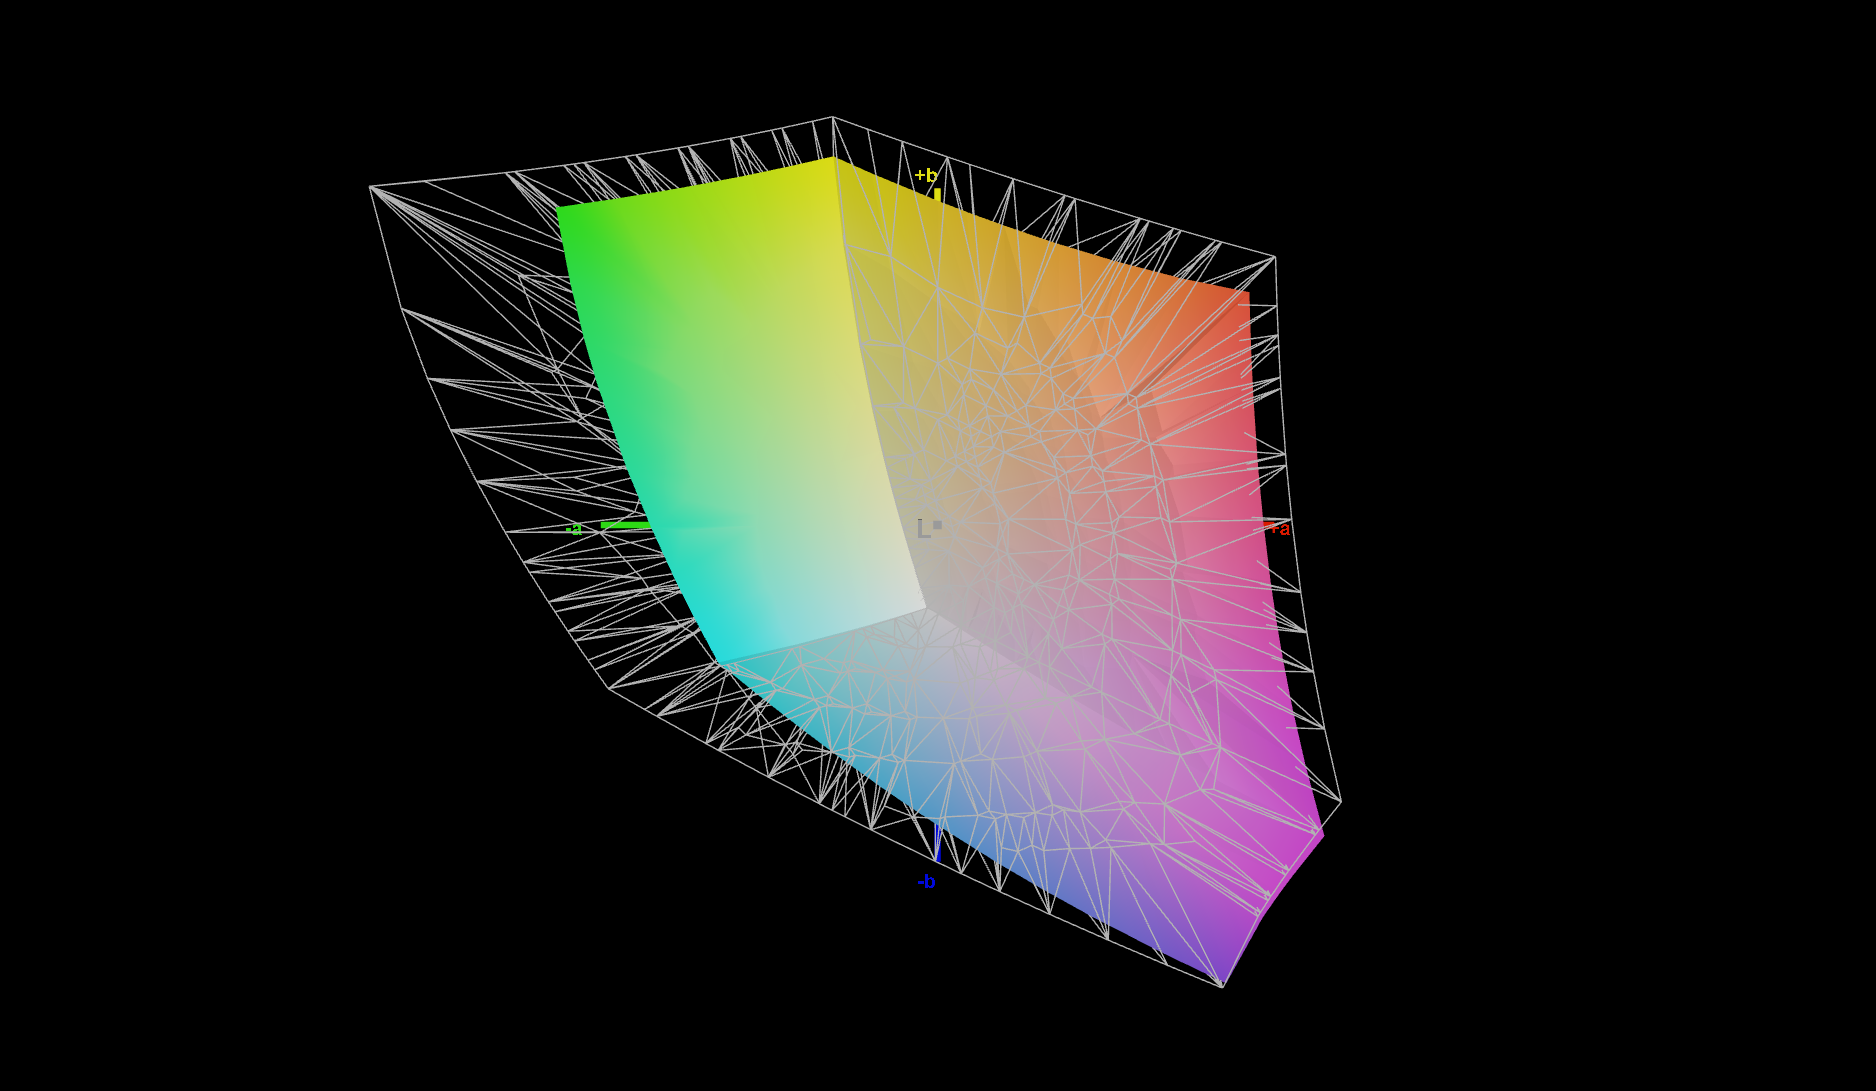
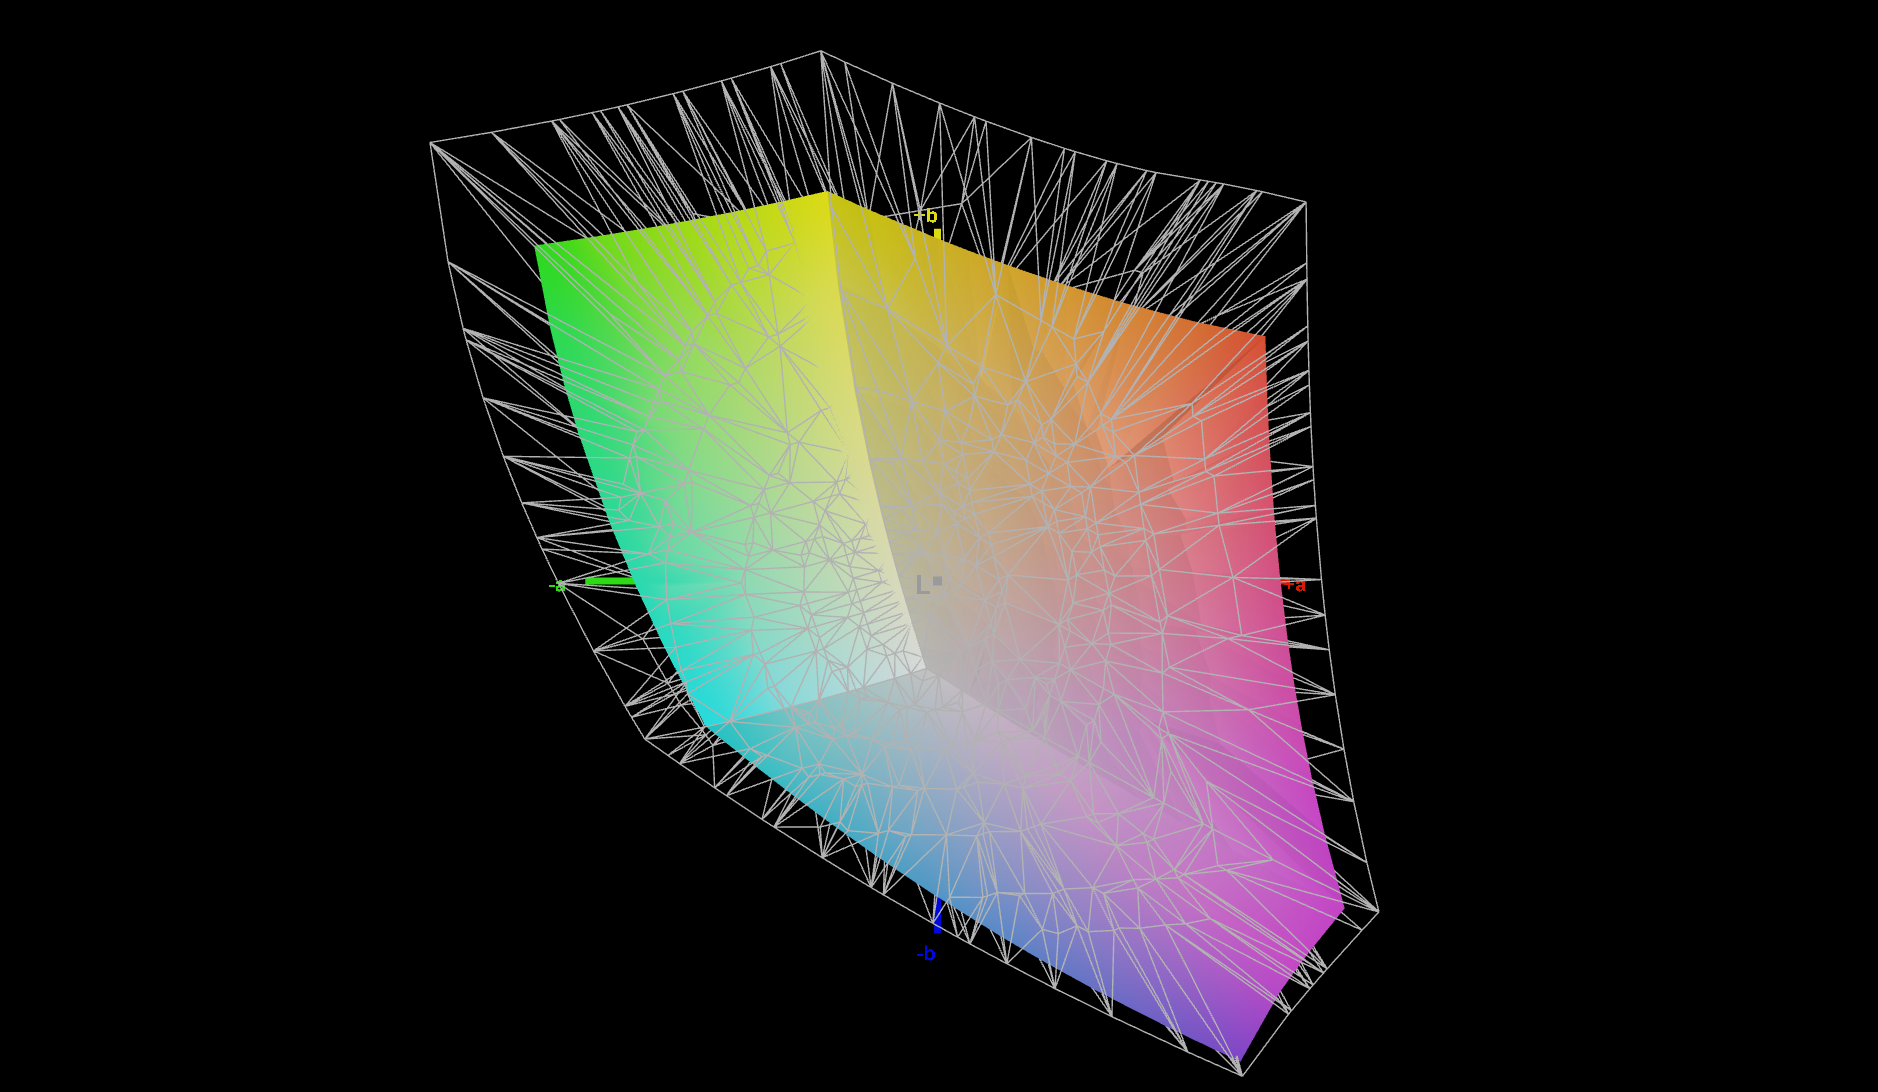
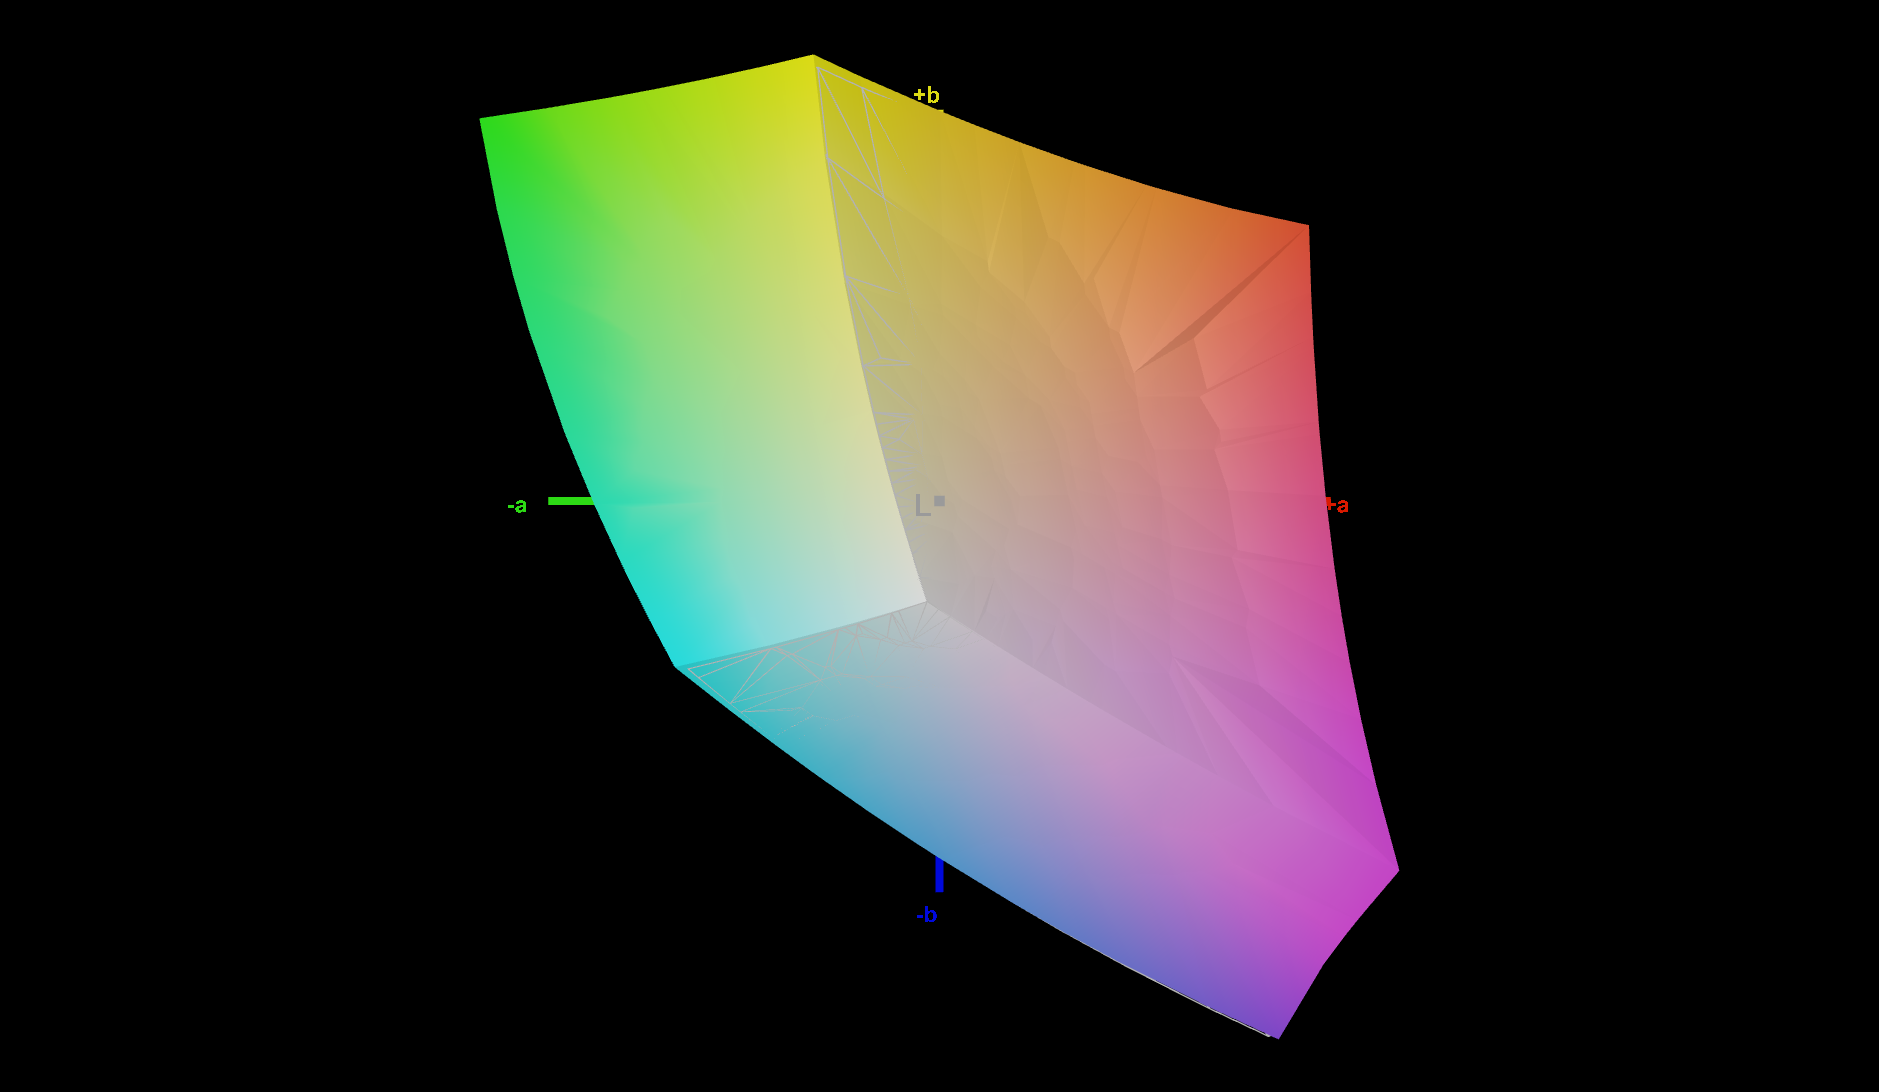
71% AdobeRGB 1998 (Argyll 3D)
99.8% sRGB (Argyll 3D)
70.4% Display P3 (Argyll 3D)
Gamma: 2.23
CCT: 6195 K
| Lenovo ThinkPad X13 G3 21BN0046GE NV133WUM-N61, IPS Grade, 1920x1200, 13.3" | Framework Laptop 13.5 12th Gen Intel BOE CQ NE135FBM-N41, IPS, 2256x1504, 13.5" | HP Elite Dragonfly G3 Chi Mei CMN13C0, IPS, 1920x1280, 13.5" | Dell Latitude 13 7330 LG Philips 133WF9, IPS, 1920x1080, 13.3" | Lenovo ThinkPad X1 Titanium Yoga G1 20QB0016GE LPM135M467, IPS LED, 2256x1504, 13.5" | Lenovo ThinkPad X13 G2 AMD 20XH001KGE NV133WUM-N61, IPS LED, 1920x1200, 13.3" | |
|---|---|---|---|---|---|---|
| Display | -0% | -2% | -5% | -3% | 0% | |
| Display P3 Coverage (%) | 70.4 | 69.9 -1% | 68 -3% | 66.1 -6% | 66.8 -5% | 70.1 0% |
| sRGB Coverage (%) | 99.8 | 99.4 0% | 98.3 -2% | 93.5 -6% | 98 -2% | 99.4 0% |
| AdobeRGB 1998 Coverage (%) | 71 | 71.1 0% | 69.9 -2% | 68.2 -4% | 68.6 -3% | 71.3 0% |
| Response Times | -69% | -130% | -106% | -188% | -49% | |
| Response Time Grey 50% / Grey 80% * (ms) | 22.9 ? | 34.7 ? -52% | 50.8 ? -122% | 48.4 ? -111% | 64 ? -179% | 34 ? -48% |
| Response Time Black / White * (ms) | 14.8 ? | 27.5 ? -86% | 35.2 ? -138% | 29.6 ? -100% | 44 ? -197% | 22 ? -49% |
| PWM Frequency (Hz) | ||||||
| Bildschirm | -17% | -0% | 7% | 10% | 3% | |
| Helligkeit Bildmitte (cd/m²) | 290 | 449.6 55% | 387.2 34% | 460.1 59% | 465 60% | 309 7% |
| Brightness (cd/m²) | 288 | 431 50% | 360 25% | 445 55% | 451 57% | 297 3% |
| Brightness Distribution (%) | 88 | 90 2% | 80 -9% | 89 1% | 92 5% | 81 -8% |
| Schwarzwert * (cd/m²) | 0.21 | 0.31 -48% | 0.26 -24% | 0.31 -48% | 0.28 -33% | 0.26 -24% |
| Kontrast (:1) | 1381 | 1450 5% | 1489 8% | 1484 7% | 1661 20% | 1188 -14% |
| Delta E Colorchecker * | 1.9 | 2.76 -45% | 2.36 -24% | 2.42 -27% | 2 -5% | 1.6 16% |
| Colorchecker dE 2000 max. * | 4 | 7.96 -99% | 4.79 -20% | 3.97 1% | 4.7 -18% | 3 25% |
| Colorchecker dE 2000 calibrated * | 0.8 | 0.58 28% | 0.63 21% | 0.77 4% | 0.7 13% | 0.8 -0% |
| Delta E Graustufen * | 2.6 | 5.2 -100% | 3 -15% | 2.3 12% | 2.9 -12% | 2 23% |
| Gamma | 2.23 99% | 2.23 99% | 2.17 101% | 2.23 99% | 2.09 105% | 2.24 98% |
| CCT | 6195 105% | 6475 100% | 6137 106% | 6262 104% | 6181 105% | 6315 103% |
| Durchschnitt gesamt (Programm / Settings) | -29% /
-21% | -44% /
-19% | -35% /
-12% | -60% /
-21% | -15% /
-5% |
* ... kleinere Werte sind besser
Die Reaktionszeiten der Anzeige sind für einen Büro-Laptop überdurchschnittlich. Die Farbabweichungen und darstellbaren Farbräume sind hingegen im Schnitt der höherklassigen Office-Notebooks.
So bildet das ThinkPad X13 Gen 3 den sRGB-Farbraum nahezu vollständig ab, kann aber Adobe RGB und Display P3 nur unvollständig wiedergeben. Kalibriert kommt der Bildschirm auf eine sehr geringe Farbabweichung. Mit dem ICC-Profil aus der Infobox kommt der Laptop auf eine Farbabweichung von nur ΔΕ 0.8.
Reaktionszeiten (Response Times) des Displays
| ↔ Reaktionszeiten Schwarz zu Weiß | ||
|---|---|---|
| 14.8 ms ... steigend ↗ und fallend ↘ kombiniert | ↗ 7.2 ms steigend | 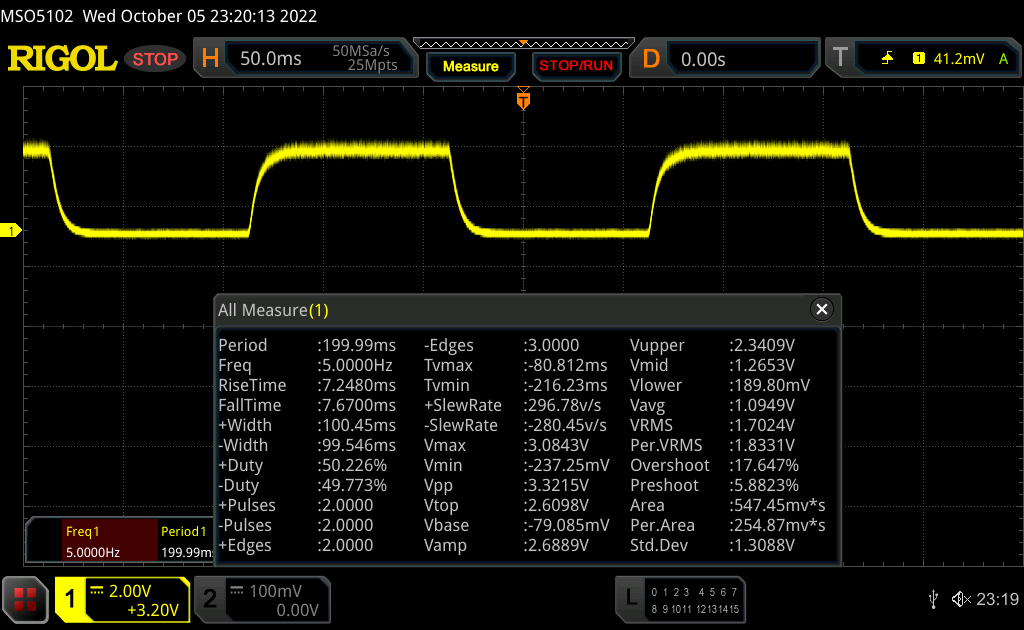 |
| ↘ 7.6 ms fallend | ||
| Die gemessenen Reaktionszeiten sind gut, für anspruchsvolle Spieler könnten der Bildschirm jedoch zu langsam sein. Im Vergleich rangierten die bei uns getesteten Geräte von 0.1 (Minimum) zu 240 (Maximum) ms. » 35 % aller Screens waren schneller als der getestete. Daher sind die gemessenen Reaktionszeiten besser als der Durchschnitt aller vermessenen Geräte (20.1 ms). | ||
| ↔ Reaktionszeiten 50% Grau zu 80% Grau | ||
| 22.9 ms ... steigend ↗ und fallend ↘ kombiniert | ↗ 8.6 ms steigend | 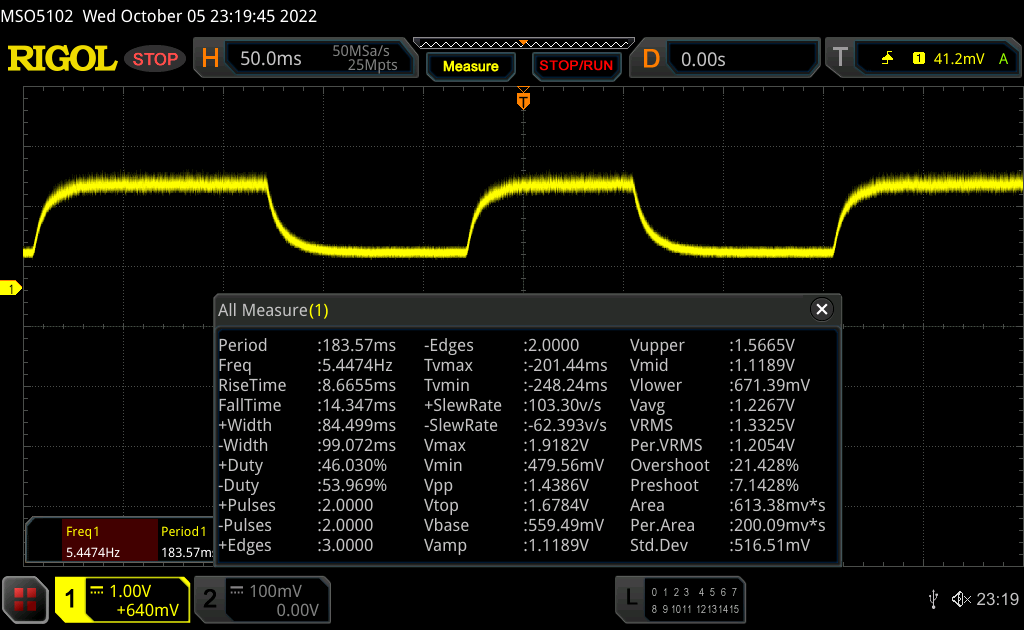 |
| ↘ 14.3 ms fallend | ||
| Die gemessenen Reaktionszeiten sind gut, für anspruchsvolle Spieler könnten der Bildschirm jedoch zu langsam sein. Im Vergleich rangierten die bei uns getesteten Geräte von 0.165 (Minimum) zu 636 (Maximum) ms. » 33 % aller Screens waren schneller als der getestete. Daher sind die gemessenen Reaktionszeiten besser als der Durchschnitt aller vermessenen Geräte (31.4 ms). | ||
Bildschirm-Flackern / PWM (Pulse-Width Modulation)
| Flackern / PWM nicht festgestellt | 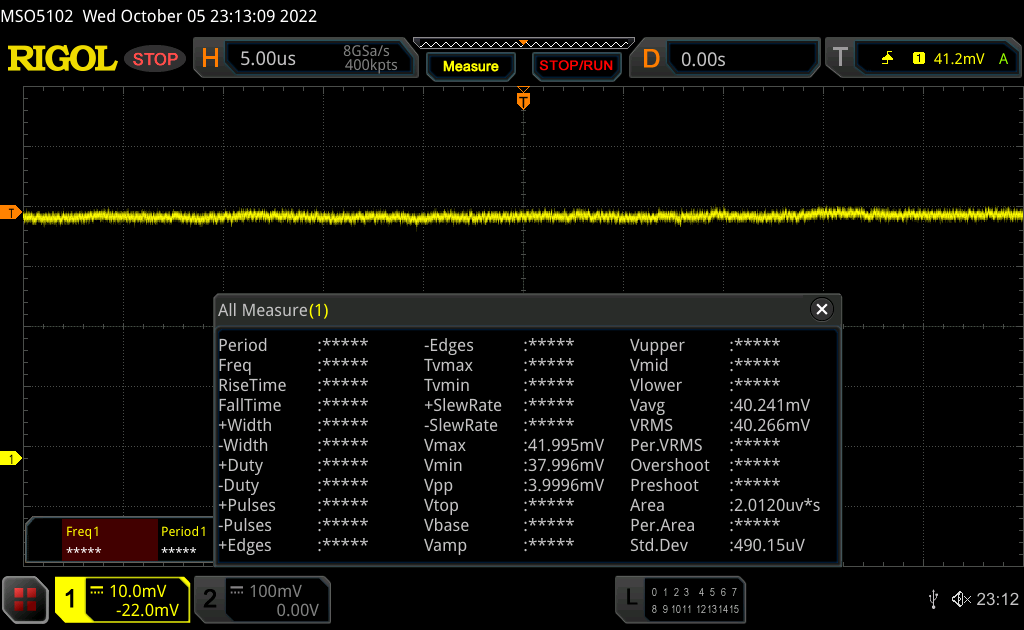 | ||
Im Vergleich: 53 % aller getesteten Geräte nutzten kein PWM um die Helligkeit zu reduzieren. Wenn PWM eingesetzt wurde, dann bei einer Frequenz von durchschnittlich 8013 (Minimum 5, Maximum 343500) Hz. | |||
Der matte Bildschirm überzeugt mit geringen Reflexionen und Blickwinkelstabilität.

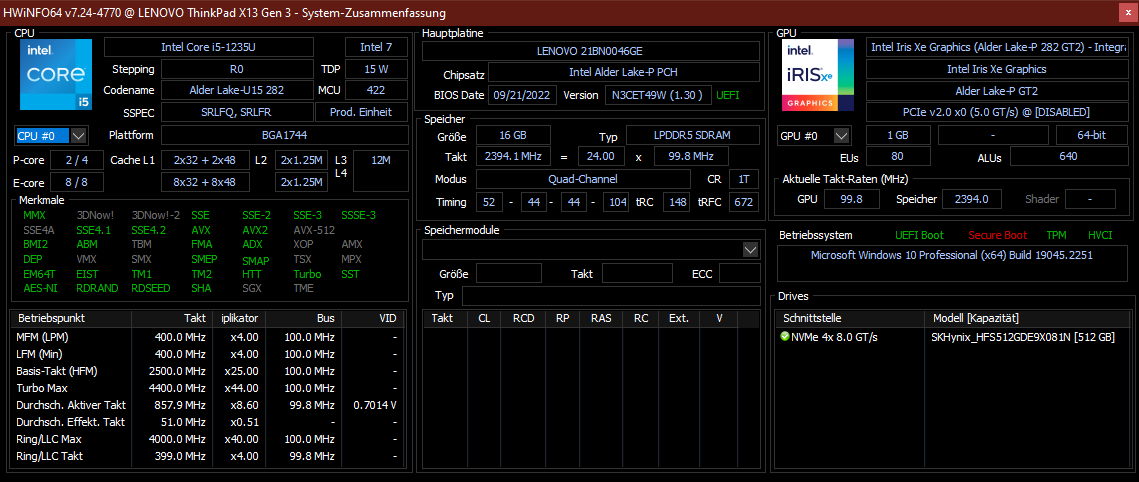
Leistung - Alder-Lake bringt leichtes Leistungsplus
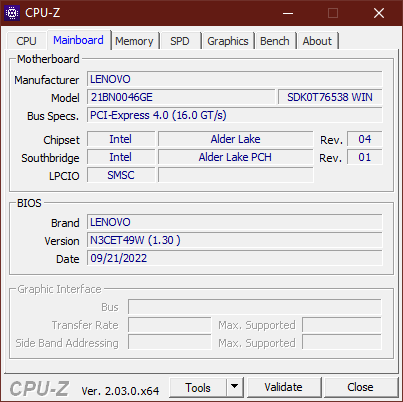
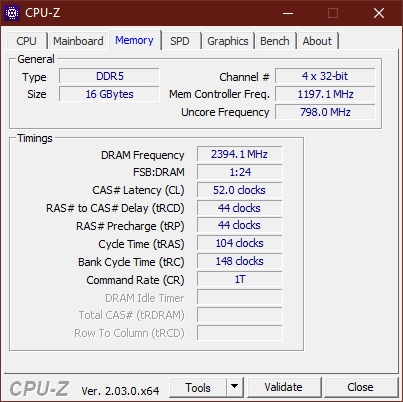
Unser Testgerät mit Intel Core i5-1235U und 16 GB Arbeitsspeicher ist eine der wenigen vorkonfigurierten Versionen des ThinkPad X13 Gen 3. Generell ist das ThinkPad relativ frei konfigurierbar. So stehen gleich acht unterschiedliche Intel-Prozessoren aus der Alder-Lake-Generation, verschiedenste Prozessoren mit bis zu 32 GB Arbeitsspeicher, diverse Betriebssysteme und weitere Hardware-Optionen zur Verfügung.
Testbedingungen
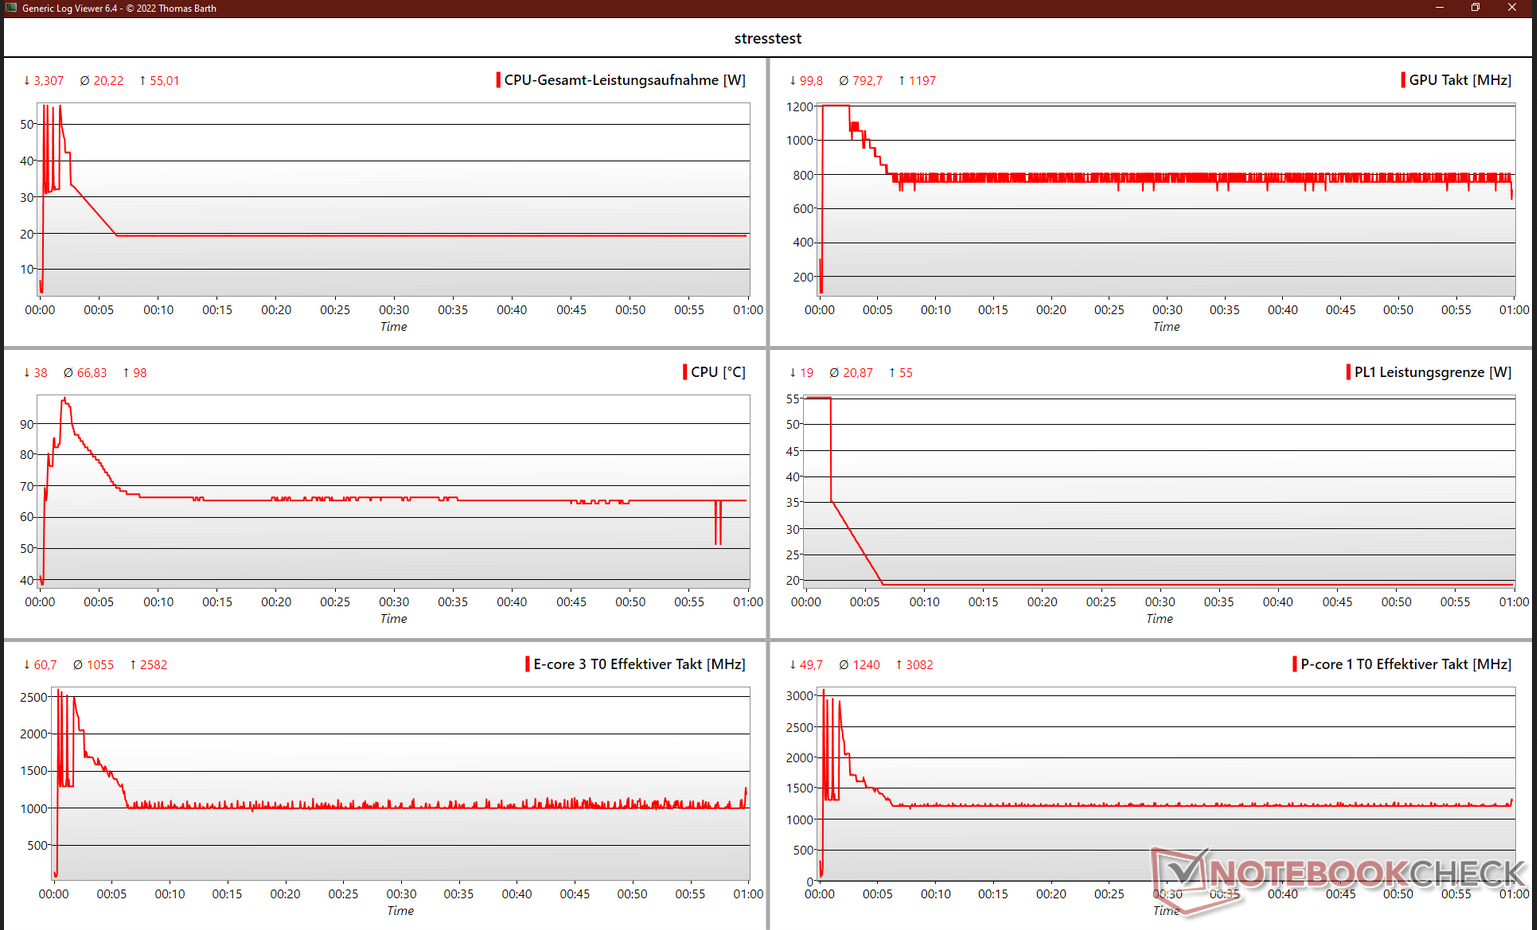
Die Leistungssteuerung des ThinkPads erfolgt über die Energieoptionen von Windows. Über den bekannten Schieberegler werden der Eco-Modus, der automatische Leistungsmodus und der Leistungsmodus, wie sie von Lenovo-Laptops bekannt sind, aktiviert. In allen drei Leistungsmodi hat der Laptop eine Boost-Leistung von rund 56 Watt. Je nach Modus fällt die Prozessorleistung anschließend mal mehr oder weniger langsam auf circa 19 Watt. Mehr als 70 °C lässt die Leistungssteuerung bei der Prozessortemperatur langfristig nicht zu.
Die Benchmarks mit PCMark, 3DMark und die verschiedenen Prozessor-Benchmarks wurden im Leistungsmodus ausgeführt. Die Laufzeiten im Akkubetrieb wurden im Eco-Modus geprüft. Geräuschemissionen und Energieaufnahme haben wir entsprechend der verschiedenen Belastungen in allen drei Power-Smart-Einstellungen geprüft.
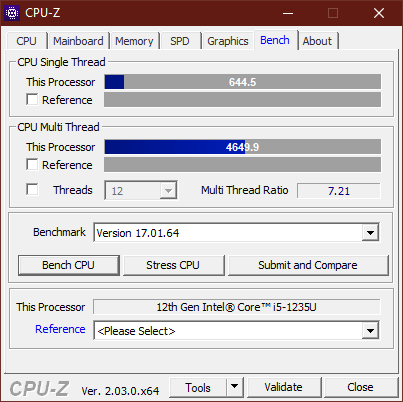
Prozessor
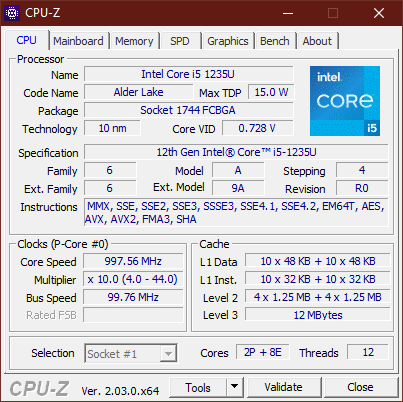
Als Mid-Range-CPU aus der aktuellen Alder-Lake-Generation von Intel ist der Core i5-1235U relativ leistungsstark. Insgesamt zehn Kerne stehen hier zur Verfügung. Zwei davon sind P-Kerne, womit zusammengenommen 12 Threads arbeiten können. Da dem Prozessor kurzfristig eine hohe Leistung zur Verfügung steht, kann er im ThinkPad X13 eine starke Leistung zeigen. Wie es für Intel-Prozessoren mittlerweile typisch ist, überzeugt vorrangig die Single-Core-Leistung. Der neue Intel-Prozessor im X13 G3 ist im Boost deutlich stärker als der im X13 G2, liegt aber langfristig auf dem gleichen Niveau.
Die Leistungssteuerung im kleinen Büro-Laptop hat ihre Tücken. So bricht primär bei längeren Belastungen die Leistung stark ein, wie unser Cinebench-R15-Loop zeigt.
Cinebench R15 Multi Dauertest
Cinebench R23: Multi Core | Single Core
Cinebench R20: CPU (Multi Core) | CPU (Single Core)
Cinebench R15: CPU Multi 64Bit | CPU Single 64Bit
Blender: v2.79 BMW27 CPU
7-Zip 18.03: 7z b 4 | 7z b 4 -mmt1
Geekbench 5.5: Multi-Core | Single-Core
HWBOT x265 Benchmark v2.2: 4k Preset
LibreOffice : 20 Documents To PDF
R Benchmark 2.5: Overall mean
| CPU Performance Rating | |
| Durchschnitt der Klasse Subnotebook | |
| Framework Laptop 13.5 12th Gen Intel | |
| Dell Latitude 13 7330 | |
| Lenovo ThinkPad X13 G3 21BN0046GE | |
| Durchschnittliche Intel Core i5-1235U | |
| Lenovo ThinkPad X13 G2 AMD 20XH001KGE | |
| HP Elite Dragonfly G3 | |
| Lenovo ThinkPad X13 G2 20WK0024GE | |
| Cinebench R23 / Multi Core | |
| Durchschnitt der Klasse Subnotebook (1555 - 21812, n=72, der letzten 2 Jahre) | |
| Framework Laptop 13.5 12th Gen Intel | |
| Dell Latitude 13 7330 | |
| Lenovo ThinkPad X13 G2 AMD 20XH001KGE | |
| Durchschnittliche Intel Core i5-1235U (2485 - 9208, n=8) | |
| HP Elite Dragonfly G3 | |
| Lenovo ThinkPad X13 G2 20WK0024GE | |
| Lenovo ThinkPad X13 G3 21BN0046GE | |
| Cinebench R23 / Single Core | |
| Dell Latitude 13 7330 | |
| Durchschnitt der Klasse Subnotebook (358 - 2165, n=73, der letzten 2 Jahre) | |
| Lenovo ThinkPad X13 G3 21BN0046GE | |
| Framework Laptop 13.5 12th Gen Intel | |
| Durchschnittliche Intel Core i5-1235U (1444 - 1698, n=8) | |
| HP Elite Dragonfly G3 | |
| Lenovo ThinkPad X13 G2 20WK0024GE | |
| Lenovo ThinkPad X13 G2 AMD 20XH001KGE | |
| Cinebench R20 / CPU (Multi Core) | |
| Durchschnitt der Klasse Subnotebook (579 - 8541, n=67, der letzten 2 Jahre) | |
| Framework Laptop 13.5 12th Gen Intel | |
| Lenovo ThinkPad X13 G3 21BN0046GE | |
| Dell Latitude 13 7330 | |
| Lenovo ThinkPad X13 G2 AMD 20XH001KGE | |
| Durchschnittliche Intel Core i5-1235U (1783 - 3537, n=8) | |
| HP Elite Dragonfly G3 | |
| Lenovo ThinkPad X13 G2 20WK0024GE | |
| Cinebench R20 / CPU (Single Core) | |
| Framework Laptop 13.5 12th Gen Intel | |
| Dell Latitude 13 7330 | |
| Lenovo ThinkPad X13 G3 21BN0046GE | |
| Durchschnitt der Klasse Subnotebook (128 - 826, n=67, der letzten 2 Jahre) | |
| Durchschnittliche Intel Core i5-1235U (566 - 651, n=8) | |
| HP Elite Dragonfly G3 | |
| Lenovo ThinkPad X13 G2 20WK0024GE | |
| Lenovo ThinkPad X13 G2 AMD 20XH001KGE | |
| Cinebench R15 / CPU Multi 64Bit | |
| Durchschnitt der Klasse Subnotebook (327 - 3345, n=67, der letzten 2 Jahre) | |
| Framework Laptop 13.5 12th Gen Intel | |
| Dell Latitude 13 7330 | |
| Lenovo ThinkPad X13 G2 AMD 20XH001KGE | |
| HP Elite Dragonfly G3 | |
| Durchschnittliche Intel Core i5-1235U (785 - 1587, n=8) | |
| Lenovo ThinkPad X13 G3 21BN0046GE | |
| Lenovo ThinkPad X13 G2 20WK0024GE | |
| Cinebench R15 / CPU Single 64Bit | |
| Durchschnitt der Klasse Subnotebook (72.4 - 322, n=67, der letzten 2 Jahre) | |
| Framework Laptop 13.5 12th Gen Intel | |
| Dell Latitude 13 7330 | |
| Lenovo ThinkPad X13 G2 20WK0024GE | |
| HP Elite Dragonfly G3 | |
| Lenovo ThinkPad X13 G2 AMD 20XH001KGE | |
| Durchschnittliche Intel Core i5-1235U (151.5 - 242, n=8) | |
| Lenovo ThinkPad X13 G3 21BN0046GE | |
| Blender / v2.79 BMW27 CPU | |
| Lenovo ThinkPad X13 G2 20WK0024GE | |
| Durchschnittliche Intel Core i5-1235U (366 - 662, n=8) | |
| HP Elite Dragonfly G3 | |
| Lenovo ThinkPad X13 G3 21BN0046GE | |
| Lenovo ThinkPad X13 G2 AMD 20XH001KGE | |
| Dell Latitude 13 7330 | |
| Durchschnitt der Klasse Subnotebook (159 - 2271, n=70, der letzten 2 Jahre) | |
| Framework Laptop 13.5 12th Gen Intel | |
| 7-Zip 18.03 / 7z b 4 | |
| Durchschnitt der Klasse Subnotebook (11668 - 77867, n=67, der letzten 2 Jahre) | |
| Framework Laptop 13.5 12th Gen Intel | |
| Lenovo ThinkPad X13 G3 21BN0046GE | |
| Lenovo ThinkPad X13 G2 AMD 20XH001KGE | |
| Dell Latitude 13 7330 | |
| Durchschnittliche Intel Core i5-1235U (20166 - 38643, n=8) | |
| HP Elite Dragonfly G3 | |
| Lenovo ThinkPad X13 G2 20WK0024GE | |
| 7-Zip 18.03 / 7z b 4 -mmt1 | |
| Framework Laptop 13.5 12th Gen Intel | |
| Dell Latitude 13 7330 | |
| Durchschnitt der Klasse Subnotebook (2643 - 6442, n=69, der letzten 2 Jahre) | |
| Lenovo ThinkPad X13 G2 20WK0024GE | |
| Lenovo ThinkPad X13 G3 21BN0046GE | |
| Lenovo ThinkPad X13 G2 AMD 20XH001KGE | |
| Durchschnittliche Intel Core i5-1235U (4371 - 5233, n=8) | |
| HP Elite Dragonfly G3 | |
| Geekbench 5.5 / Multi-Core | |
| Durchschnitt der Klasse Subnotebook (2557 - 17218, n=62, der letzten 2 Jahre) | |
| Framework Laptop 13.5 12th Gen Intel | |
| Lenovo ThinkPad X13 G3 21BN0046GE | |
| HP Elite Dragonfly G3 | |
| Dell Latitude 13 7330 | |
| Durchschnittliche Intel Core i5-1235U (5528 - 8571, n=10) | |
| Lenovo ThinkPad X13 G2 AMD 20XH001KGE | |
| Lenovo ThinkPad X13 G2 20WK0024GE | |
| Geekbench 5.5 / Single-Core | |
| Durchschnitt der Klasse Subnotebook (726 - 2350, n=62, der letzten 2 Jahre) | |
| Dell Latitude 13 7330 | |
| Framework Laptop 13.5 12th Gen Intel | |
| Durchschnittliche Intel Core i5-1235U (1426 - 1643, n=10) | |
| Lenovo ThinkPad X13 G2 20WK0024GE | |
| HP Elite Dragonfly G3 | |
| Lenovo ThinkPad X13 G3 21BN0046GE | |
| Lenovo ThinkPad X13 G2 AMD 20XH001KGE | |
| HWBOT x265 Benchmark v2.2 / 4k Preset | |
| Durchschnitt der Klasse Subnotebook (0.97 - 25.1, n=67, der letzten 2 Jahre) | |
| Framework Laptop 13.5 12th Gen Intel | |
| Dell Latitude 13 7330 | |
| Lenovo ThinkPad X13 G2 AMD 20XH001KGE | |
| Lenovo ThinkPad X13 G3 21BN0046GE | |
| Durchschnittliche Intel Core i5-1235U (4.99 - 9.43, n=8) | |
| HP Elite Dragonfly G3 | |
| Lenovo ThinkPad X13 G2 20WK0024GE | |
| LibreOffice / 20 Documents To PDF | |
| HP Elite Dragonfly G3 | |
| Durchschnitt der Klasse Subnotebook (38.5 - 220, n=66, der letzten 2 Jahre) | |
| Lenovo ThinkPad X13 G2 AMD 20XH001KGE | |
| Durchschnittliche Intel Core i5-1235U (42.4 - 65.5, n=8) | |
| Dell Latitude 13 7330 | |
| Lenovo ThinkPad X13 G2 20WK0024GE | |
| Framework Laptop 13.5 12th Gen Intel | |
| Lenovo ThinkPad X13 G3 21BN0046GE | |
| R Benchmark 2.5 / Overall mean | |
| Lenovo ThinkPad X13 G2 20WK0024GE | |
| Lenovo ThinkPad X13 G2 AMD 20XH001KGE | |
| HP Elite Dragonfly G3 | |
| Durchschnitt der Klasse Subnotebook (0.403 - 1.456, n=68, der letzten 2 Jahre) | |
| Durchschnittliche Intel Core i5-1235U (0.4986 - 0.603, n=8) | |
| Lenovo ThinkPad X13 G3 21BN0046GE | |
| Dell Latitude 13 7330 | |
| Framework Laptop 13.5 12th Gen Intel | |
* ... kleinere Werte sind besser
AIDA64: FP32 Ray-Trace | FPU Julia | CPU SHA3 | CPU Queen | FPU SinJulia | FPU Mandel | CPU AES | CPU ZLib | FP64 Ray-Trace | CPU PhotoWorxx
| Performance Rating | |
| Durchschnitt der Klasse Subnotebook | |
| Lenovo ThinkPad X13 G2 AMD 20XH001KGE | |
| Framework Laptop 13.5 12th Gen Intel | |
| Lenovo ThinkPad X13 G3 21BN0046GE | |
| Dell Latitude 13 7330 | |
| HP Elite Dragonfly G3 | |
| Durchschnittliche Intel Core i5-1235U | |
| Lenovo ThinkPad X1 Titanium Yoga G1 20QB0016GE | |
| AIDA64 / FP32 Ray-Trace | |
| Durchschnitt der Klasse Subnotebook (1135 - 32888, n=68, der letzten 2 Jahre) | |
| Lenovo ThinkPad X13 G2 AMD 20XH001KGE | |
| Lenovo ThinkPad X13 G3 21BN0046GE | |
| Dell Latitude 13 7330 | |
| HP Elite Dragonfly G3 | |
| Framework Laptop 13.5 12th Gen Intel | |
| Durchschnittliche Intel Core i5-1235U (3078 - 7457, n=8) | |
| Lenovo ThinkPad X1 Titanium Yoga G1 20QB0016GE | |
| AIDA64 / FPU Julia | |
| Durchschnitt der Klasse Subnotebook (5218 - 123315, n=68, der letzten 2 Jahre) | |
| Lenovo ThinkPad X13 G2 AMD 20XH001KGE | |
| Lenovo ThinkPad X13 G3 21BN0046GE | |
| Dell Latitude 13 7330 | |
| HP Elite Dragonfly G3 | |
| Durchschnittliche Intel Core i5-1235U (15838 - 37760, n=8) | |
| Framework Laptop 13.5 12th Gen Intel | |
| Lenovo ThinkPad X1 Titanium Yoga G1 20QB0016GE | |
| AIDA64 / CPU SHA3 | |
| Durchschnitt der Klasse Subnotebook (444 - 5287, n=68, der letzten 2 Jahre) | |
| Lenovo ThinkPad X13 G3 21BN0046GE | |
| Dell Latitude 13 7330 | |
| Framework Laptop 13.5 12th Gen Intel | |
| Lenovo ThinkPad X13 G2 AMD 20XH001KGE | |
| Durchschnittliche Intel Core i5-1235U (978 - 2072, n=8) | |
| HP Elite Dragonfly G3 | |
| Lenovo ThinkPad X1 Titanium Yoga G1 20QB0016GE | |
| AIDA64 / CPU Queen | |
| Framework Laptop 13.5 12th Gen Intel | |
| Lenovo ThinkPad X13 G2 AMD 20XH001KGE | |
| Durchschnitt der Klasse Subnotebook (10579 - 115682, n=67, der letzten 2 Jahre) | |
| Dell Latitude 13 7330 | |
| HP Elite Dragonfly G3 | |
| Lenovo ThinkPad X13 G3 21BN0046GE | |
| Durchschnittliche Intel Core i5-1235U (45680 - 62404, n=8) | |
| Lenovo ThinkPad X1 Titanium Yoga G1 20QB0016GE | |
| AIDA64 / FPU SinJulia | |
| Lenovo ThinkPad X13 G2 AMD 20XH001KGE | |
| Durchschnitt der Klasse Subnotebook (744 - 18418, n=68, der letzten 2 Jahre) | |
| Framework Laptop 13.5 12th Gen Intel | |
| Lenovo ThinkPad X13 G3 21BN0046GE | |
| Dell Latitude 13 7330 | |
| HP Elite Dragonfly G3 | |
| Durchschnittliche Intel Core i5-1235U (3099 - 4644, n=8) | |
| Lenovo ThinkPad X1 Titanium Yoga G1 20QB0016GE | |
| AIDA64 / FPU Mandel | |
| Durchschnitt der Klasse Subnotebook (3341 - 65433, n=68, der letzten 2 Jahre) | |
| Lenovo ThinkPad X13 G2 AMD 20XH001KGE | |
| Lenovo ThinkPad X13 G3 21BN0046GE | |
| Dell Latitude 13 7330 | |
| HP Elite Dragonfly G3 | |
| Framework Laptop 13.5 12th Gen Intel | |
| Durchschnittliche Intel Core i5-1235U (8046 - 18819, n=8) | |
| Lenovo ThinkPad X1 Titanium Yoga G1 20QB0016GE | |
| AIDA64 / CPU AES | |
| Lenovo ThinkPad X13 G2 AMD 20XH001KGE | |
| Framework Laptop 13.5 12th Gen Intel | |
| Durchschnitt der Klasse Subnotebook (638 - 124284, n=68, der letzten 2 Jahre) | |
| Lenovo ThinkPad X1 Titanium Yoga G1 20QB0016GE | |
| Lenovo ThinkPad X13 G3 21BN0046GE | |
| Dell Latitude 13 7330 | |
| Durchschnittliche Intel Core i5-1235U (23386 - 67140, n=8) | |
| HP Elite Dragonfly G3 | |
| AIDA64 / CPU ZLib | |
| Durchschnitt der Klasse Subnotebook (164.9 - 1379, n=68, der letzten 2 Jahre) | |
| Framework Laptop 13.5 12th Gen Intel | |
| Lenovo ThinkPad X13 G3 21BN0046GE | |
| Dell Latitude 13 7330 | |
| Durchschnittliche Intel Core i5-1235U (329 - 633, n=8) | |
| Lenovo ThinkPad X13 G2 AMD 20XH001KGE | |
| HP Elite Dragonfly G3 | |
| Lenovo ThinkPad X1 Titanium Yoga G1 20QB0016GE | |
| AIDA64 / FP64 Ray-Trace | |
| Durchschnitt der Klasse Subnotebook (610 - 17495, n=68, der letzten 2 Jahre) | |
| Lenovo ThinkPad X13 G2 AMD 20XH001KGE | |
| Lenovo ThinkPad X13 G3 21BN0046GE | |
| Dell Latitude 13 7330 | |
| HP Elite Dragonfly G3 | |
| Framework Laptop 13.5 12th Gen Intel | |
| Durchschnittliche Intel Core i5-1235U (1670 - 3928, n=8) | |
| Lenovo ThinkPad X1 Titanium Yoga G1 20QB0016GE | |
| AIDA64 / CPU PhotoWorxx | |
| Durchschnitt der Klasse Subnotebook (6569 - 64588, n=68, der letzten 2 Jahre) | |
| Lenovo ThinkPad X13 G3 21BN0046GE | |
| HP Elite Dragonfly G3 | |
| Lenovo ThinkPad X1 Titanium Yoga G1 20QB0016GE | |
| Durchschnittliche Intel Core i5-1235U (15933 - 41909, n=8) | |
| Framework Laptop 13.5 12th Gen Intel | |
| Dell Latitude 13 7330 | |
| Lenovo ThinkPad X13 G2 AMD 20XH001KGE | |
System Performance
Auch wenn Arbeitsspeicher und Massenspeicher im Office-Laptop schnell arbeiten, fehlt es dem ThinkPad X13 vorwiegend an Prozessorleistung, um im Vergleich der Systemleistung mitzuhalten. Die langfristigen Belastungen, wie sie in den Benchmarks mit PCMark und Crossmark auftreten, steckt der flache Laptop nicht so gut weg. So fällt hier auf, dass das ThinkPad X13 G3 in den meisten Bereichen nur mäßige Ergebnisse liefert, aber gerade im Crossmark-Responsiveness-Test eine starke Punktzahl erreicht. Hier werden die Speicher und das Boostverhalten der CPU besonders beansprucht.
CrossMark: Overall | Productivity | Creativity | Responsiveness
| PCMark 10 / Score | |
| Durchschnitt der Klasse Subnotebook (4920 - 8424, n=54, der letzten 2 Jahre) | |
| Framework Laptop 13.5 12th Gen Intel | |
| Lenovo ThinkPad X13 G2 AMD 20XH001KGE | |
| Dell Latitude 13 7330 | |
| Durchschnittliche Intel Core i5-1235U, Intel Iris Xe Graphics G7 80EUs (4528 - 5543, n=8) | |
| HP Elite Dragonfly G3 | |
| Lenovo ThinkPad X13 G3 21BN0046GE | |
| Lenovo ThinkPad X1 Titanium Yoga G1 20QB0016GE | |
| PCMark 10 / Essentials | |
| Framework Laptop 13.5 12th Gen Intel | |
| Dell Latitude 13 7330 | |
| Durchschnitt der Klasse Subnotebook (8552 - 11406, n=54, der letzten 2 Jahre) | |
| Lenovo ThinkPad X13 G2 AMD 20XH001KGE | |
| Durchschnittliche Intel Core i5-1235U, Intel Iris Xe Graphics G7 80EUs (9143 - 11273, n=8) | |
| Lenovo ThinkPad X1 Titanium Yoga G1 20QB0016GE | |
| HP Elite Dragonfly G3 | |
| Lenovo ThinkPad X13 G3 21BN0046GE | |
| PCMark 10 / Productivity | |
| Durchschnitt der Klasse Subnotebook (5435 - 16132, n=54, der letzten 2 Jahre) | |
| Lenovo ThinkPad X13 G2 AMD 20XH001KGE | |
| Framework Laptop 13.5 12th Gen Intel | |
| Dell Latitude 13 7330 | |
| Durchschnittliche Intel Core i5-1235U, Intel Iris Xe Graphics G7 80EUs (6440 - 7354, n=8) | |
| Lenovo ThinkPad X13 G3 21BN0046GE | |
| Lenovo ThinkPad X1 Titanium Yoga G1 20QB0016GE | |
| HP Elite Dragonfly G3 | |
| PCMark 10 / Digital Content Creation | |
| Durchschnitt der Klasse Subnotebook (5722 - 12442, n=54, der letzten 2 Jahre) | |
| Framework Laptop 13.5 12th Gen Intel | |
| Lenovo ThinkPad X13 G2 AMD 20XH001KGE | |
| HP Elite Dragonfly G3 | |
| Durchschnittliche Intel Core i5-1235U, Intel Iris Xe Graphics G7 80EUs (4220 - 5839, n=8) | |
| Dell Latitude 13 7330 | |
| Lenovo ThinkPad X13 G3 21BN0046GE | |
| Lenovo ThinkPad X1 Titanium Yoga G1 20QB0016GE | |
| CrossMark / Overall | |
| Framework Laptop 13.5 12th Gen Intel | |
| Durchschnitt der Klasse Subnotebook (365 - 2038, n=67, der letzten 2 Jahre) | |
| Dell Latitude 13 7330 | |
| HP Elite Dragonfly G3 | |
| Lenovo ThinkPad X13 G3 21BN0046GE | |
| Durchschnittliche Intel Core i5-1235U, Intel Iris Xe Graphics G7 80EUs (983 - 1644, n=8) | |
| CrossMark / Productivity | |
| Framework Laptop 13.5 12th Gen Intel | |
| Durchschnitt der Klasse Subnotebook (364 - 1918, n=67, der letzten 2 Jahre) | |
| Dell Latitude 13 7330 | |
| HP Elite Dragonfly G3 | |
| Durchschnittliche Intel Core i5-1235U, Intel Iris Xe Graphics G7 80EUs (1026 - 1676, n=8) | |
| Lenovo ThinkPad X13 G3 21BN0046GE | |
| CrossMark / Creativity | |
| Framework Laptop 13.5 12th Gen Intel | |
| Durchschnitt der Klasse Subnotebook (372 - 2396, n=67, der letzten 2 Jahre) | |
| HP Elite Dragonfly G3 | |
| Dell Latitude 13 7330 | |
| Lenovo ThinkPad X13 G3 21BN0046GE | |
| Durchschnittliche Intel Core i5-1235U, Intel Iris Xe Graphics G7 80EUs (1032 - 1618, n=8) | |
| CrossMark / Responsiveness | |
| Framework Laptop 13.5 12th Gen Intel | |
| Durchschnitt der Klasse Subnotebook (312 - 1889, n=67, der letzten 2 Jahre) | |
| Lenovo ThinkPad X13 G3 21BN0046GE | |
| Dell Latitude 13 7330 | |
| Durchschnittliche Intel Core i5-1235U, Intel Iris Xe Graphics G7 80EUs (746 - 1867, n=8) | |
| HP Elite Dragonfly G3 | |
| PCMark 10 Score | 4528 Punkte | |
Hilfe | ||
| AIDA64 / Memory Copy | |
| Durchschnitt der Klasse Subnotebook (14554 - 109734, n=68, der letzten 2 Jahre) | |
| HP Elite Dragonfly G3 | |
| Lenovo ThinkPad X13 G3 21BN0046GE | |
| Lenovo ThinkPad X1 Titanium Yoga G1 20QB0016GE | |
| Durchschnittliche Intel Core i5-1235U (24653 - 61921, n=8) | |
| Framework Laptop 13.5 12th Gen Intel | |
| Dell Latitude 13 7330 | |
| Lenovo ThinkPad X13 G2 AMD 20XH001KGE | |
| AIDA64 / Memory Read | |
| Durchschnitt der Klasse Subnotebook (15948 - 127174, n=68, der letzten 2 Jahre) | |
| Lenovo ThinkPad X13 G3 21BN0046GE | |
| HP Elite Dragonfly G3 | |
| Lenovo ThinkPad X1 Titanium Yoga G1 20QB0016GE | |
| Durchschnittliche Intel Core i5-1235U (24441 - 66108, n=8) | |
| Framework Laptop 13.5 12th Gen Intel | |
| Dell Latitude 13 7330 | |
| Lenovo ThinkPad X13 G2 AMD 20XH001KGE | |
| AIDA64 / Memory Write | |
| Durchschnitt der Klasse Subnotebook (15709 - 117898, n=68, der letzten 2 Jahre) | |
| Lenovo ThinkPad X1 Titanium Yoga G1 20QB0016GE | |
| Lenovo ThinkPad X13 G3 21BN0046GE | |
| HP Elite Dragonfly G3 | |
| Durchschnittliche Intel Core i5-1235U (25156 - 75808, n=8) | |
| Framework Laptop 13.5 12th Gen Intel | |
| Dell Latitude 13 7330 | |
| Lenovo ThinkPad X13 G2 AMD 20XH001KGE | |
| AIDA64 / Memory Latency | |
| Lenovo ThinkPad X13 G2 AMD 20XH001KGE | |
| HP Elite Dragonfly G3 | |
| Durchschnitt der Klasse Subnotebook (6.8 - 187.8, n=67, der letzten 2 Jahre) | |
| Lenovo ThinkPad X1 Titanium Yoga G1 20QB0016GE | |
| Lenovo ThinkPad X13 G3 21BN0046GE | |
| Durchschnittliche Intel Core i5-1235U (76.3 - 119, n=8) | |
| Framework Laptop 13.5 12th Gen Intel | |
| Dell Latitude 13 7330 | |
* ... kleinere Werte sind besser
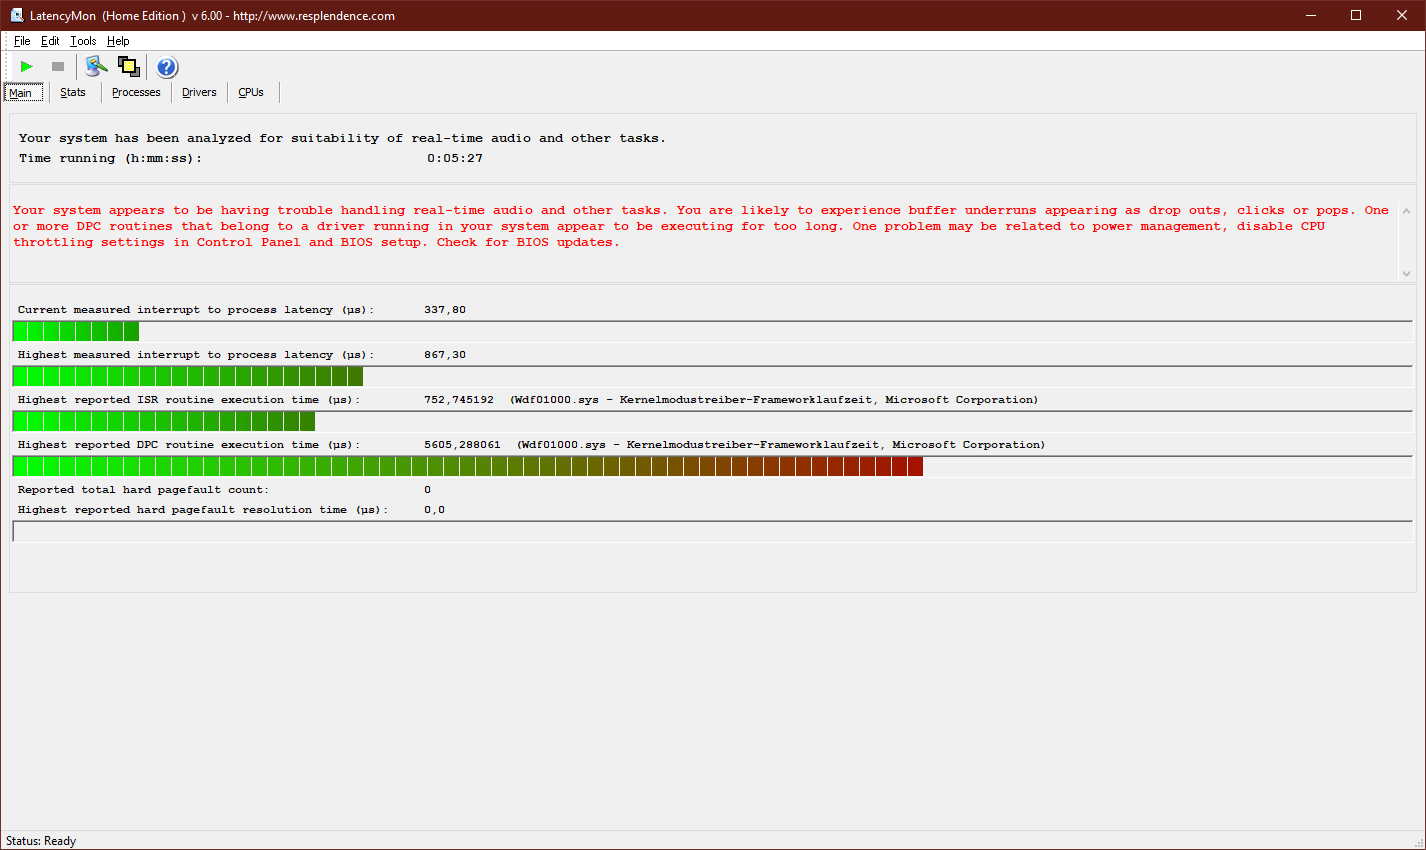
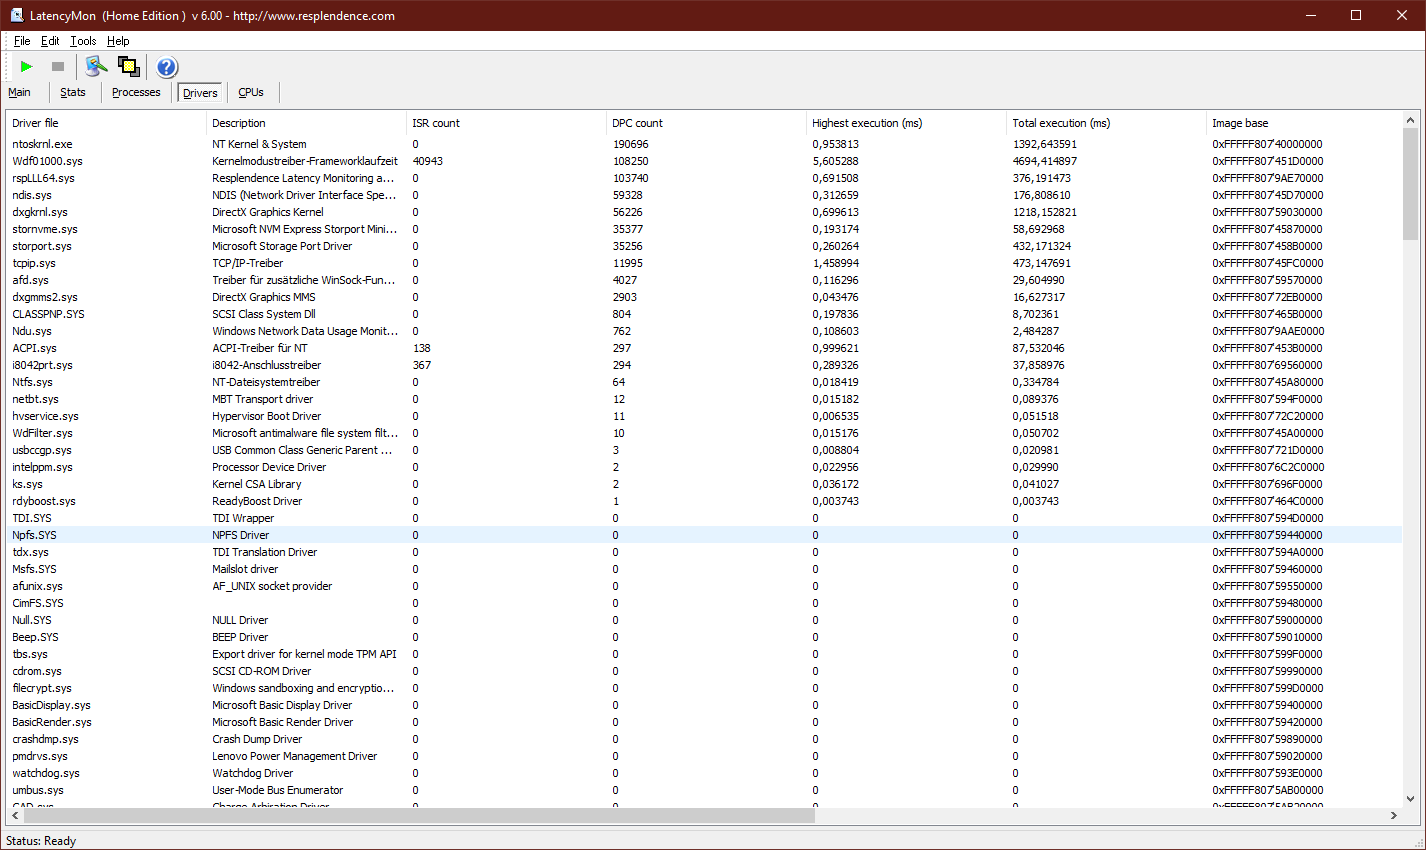
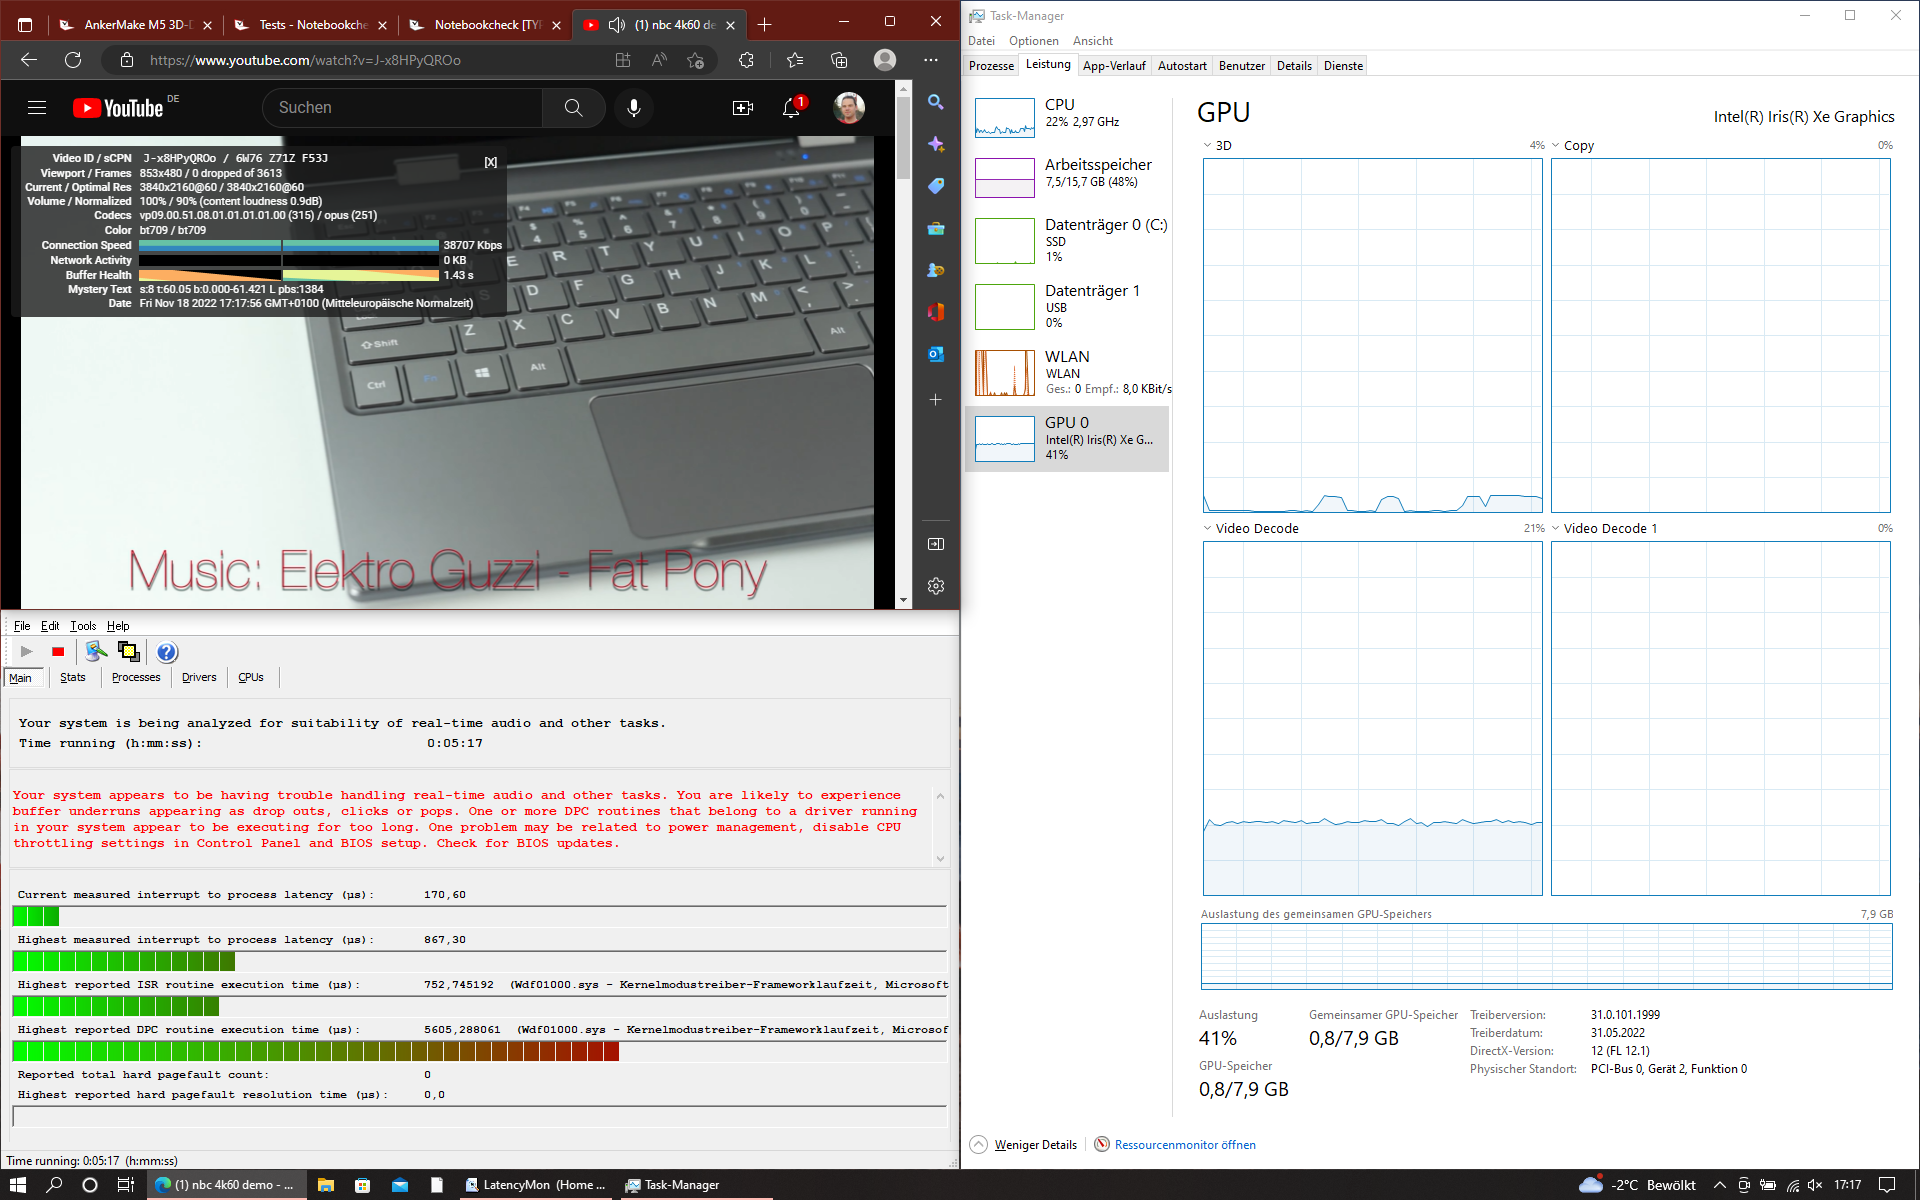
DPC-Latenzen
Mit den zum Testzeitpunkt aktuellen Treibern liegen die DPC-Latenzen des Laptops in einem hohen Bereich. Die Wiedergabe des 4K60HZ-YouTube-Testvideos schafft das ThinkPad dennoch ohne ein Bild auszulassen.
| DPC Latencies / LatencyMon - interrupt to process latency (max), Web, Youtube, Prime95 | |
| Framework Laptop 13.5 12th Gen Intel | |
| Lenovo ThinkPad X13 G2 AMD 20XH001KGE | |
| Lenovo ThinkPad X13 G3 21BN0046GE | |
| Dell Latitude 13 7330 | |
| Lenovo ThinkPad X1 Titanium Yoga G1 20QB0016GE | |
| HP Elite Dragonfly G3 | |
* ... kleinere Werte sind besser
Massenspeicher
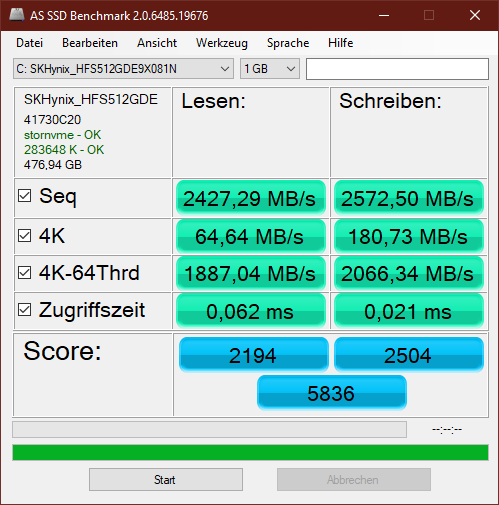
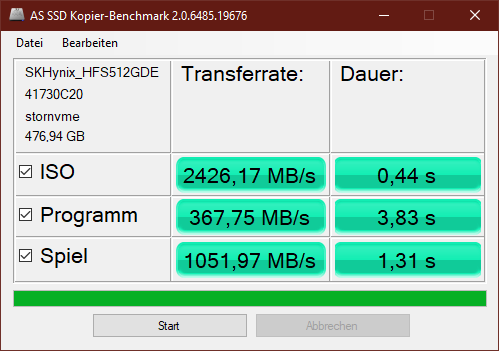
Die SK Hynix HFS512 GDE9X081N gehört definitiv zu den schnelleren M.2-Festspeichern. So liefert die SSD in den verschiedensten Benchmarks hohe Übertragungsgeschwindigkeiten. Bei längerer Belastung bricht die Übertragungsrate der SSD zeitweise ein. Dieses Verhalten kann durch ein kurzzeitiges Überhitzen ausgelöst werden.

* ... kleinere Werte sind besser
Dauerleistung Lesen: DiskSpd Read Loop, Queue Depth 8
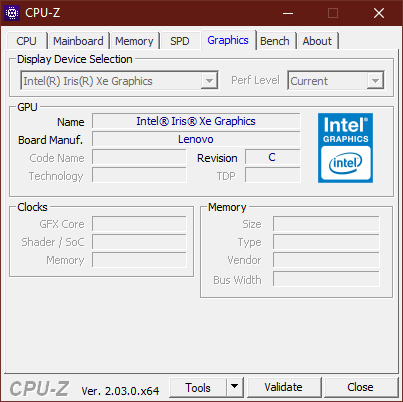
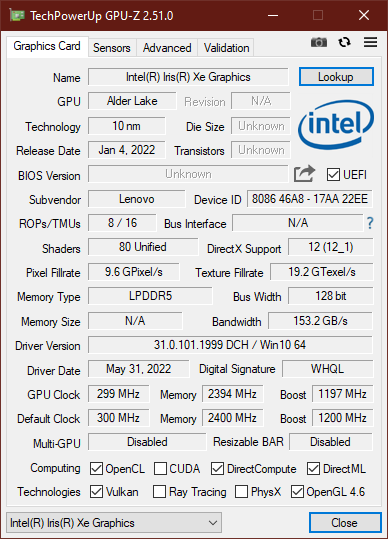
Grafikkarte
Eine dedizierte GPU bietet das ThinkPad X13 nicht, so muss es auf die iGPU im Intel Core i5-1235U zurückgreifen. Die Intel Xe mit 80 EUs liefert mittlerweile aber eine recht hohe Leistung. Vor allem in Verbindung mit schnellem Arbeitsspeicher, wie er hier verbaut ist, kann der Grafikchip überzeugen. In den Grafik-Benchmarks mit 3DMark und den Spiele-Benchmarks kommen moderate Punktzahlen respektive FPS zustande. So eignet sich der kleine Laptop mit kleinen Einschränkungen auch für 3D-Anwendungen.
| 3DMark 11 Performance | 5674 Punkte | |
| 3DMark Ice Storm Standard Score | 93199 Punkte | |
| 3DMark Cloud Gate Standard Score | 20580 Punkte | |
| 3DMark Fire Strike Score | 4171 Punkte | |
| 3DMark Time Spy Score | 1468 Punkte | |
Hilfe | ||
Gaming Performance
Das ThinkPad X13 Gen 3 besitzt nur einen relativ kleinen Bildschirm. So ist Gaming in Full-HD nicht unbedingt notwendig. Mit einer Auflösung von 1366 × 768 Pixeln, laufen viele Spiele auch mit mittleren Qualitätseinstellungen auf hohen Bildraten. Viel mehr darf man von der Intel Iris Xe mit 80 Shadern nicht erwarten.
| min. | mittel | hoch | max. | |
|---|---|---|---|---|
| GTA V (2015) | 82.2 | 19.6 | 8.69 | |
| The Witcher 3 (2015) | 77 | 52 | 15.8 | 10.7 |
| Dota 2 Reborn (2015) | 116.1 | 87.4 | 47.2 | 43.6 |
| Final Fantasy XV Benchmark (2018) | 36.7 | 19.8 | 19.8 | |
| X-Plane 11.11 (2018) | 52.6 | 33.7 | 30.2 | |
| Strange Brigade (2018) | 68.8 | 30.2 | 23.8 | 19.2 |
Emissionen - Kaum hörbarer Laptop
Geräuschemissionen
Der Office-Laptop von Lenovo ist ausgesprochen leise. Maximal 34 dB(A) konnten wir feststellen. Dies ist auch in einer leisen Büroumgebung kaum hörbar. Anfangs war von dem Laptop ein leises hochfrequentes Geräusch wahrnehmbar. Das Spulenfiepen verschwand aber nach einigen Tagen.
Lautstärkediagramm
| Idle |
| 24.6 / 24.6 / 25.9 dB(A) |
| Last |
| 30.7 / 34.6 dB(A) |
 | ||
30 dB leise 40 dB(A) deutlich hörbar 50 dB(A) störend |
||
min: | ||
| Lenovo ThinkPad X13 G3 21BN0046GE Iris Xe G7 80EUs, i5-1235U, SK Hynix HFS512 GDE9X081N | Framework Laptop 13.5 12th Gen Intel Iris Xe G7 96EUs, i7-1260P, WDC PC SN730 SDBPNTY-512G | HP Elite Dragonfly G3 Iris Xe G7 96EUs, i7-1265U, Micron 3400 MTFDKBA512TFH 512GB | Dell Latitude 13 7330 Iris Xe G7 96EUs, i7-1265U, Toshiba KBG40ZNS512G NVMe | Lenovo ThinkPad X1 Titanium Yoga G1 20QB0016GE Iris Xe G7 80EUs, i5-1140G7, Lenovo UMIS RPJTJ256MEE1OWX | Lenovo ThinkPad X13 G2 AMD 20XH001KGE Vega 7, R5 PRO 5650U, Samsung SSD PM981a MZVLB512HBJQ | |
|---|---|---|---|---|---|---|
| Geräuschentwicklung | -15% | 8% | -5% | -10% | 4% | |
| aus / Umgebung * (dB) | 24.6 | 22.8 7% | 22.8 7% | 23.4 5% | 25.61 -4% | 24.17 2% |
| Idle min * (dB) | 24.6 | 23 7% | 23.2 6% | 23.4 5% | 25.61 -4% | 24.17 2% |
| Idle avg * (dB) | 24.6 | 23 7% | 23.2 6% | 23.4 5% | 25.61 -4% | 24.17 2% |
| Idle max * (dB) | 25.9 | 23 11% | 23.2 10% | 23.4 10% | 25.61 1% | 24.17 7% |
| Last avg * (dB) | 30.7 | 47.3 -54% | 25.1 18% | 37.8 -23% | 40.14 -31% | 29.92 3% |
| Witcher 3 ultra * (dB) | 34.6 | 47.3 -37% | 32 8% | 39.2 -13% | ||
| Last max * (dB) | 34.6 | 49.8 -44% | 35.2 -2% | 43 -24% | 40.14 -16% | 31.52 9% |
* ... kleinere Werte sind besser
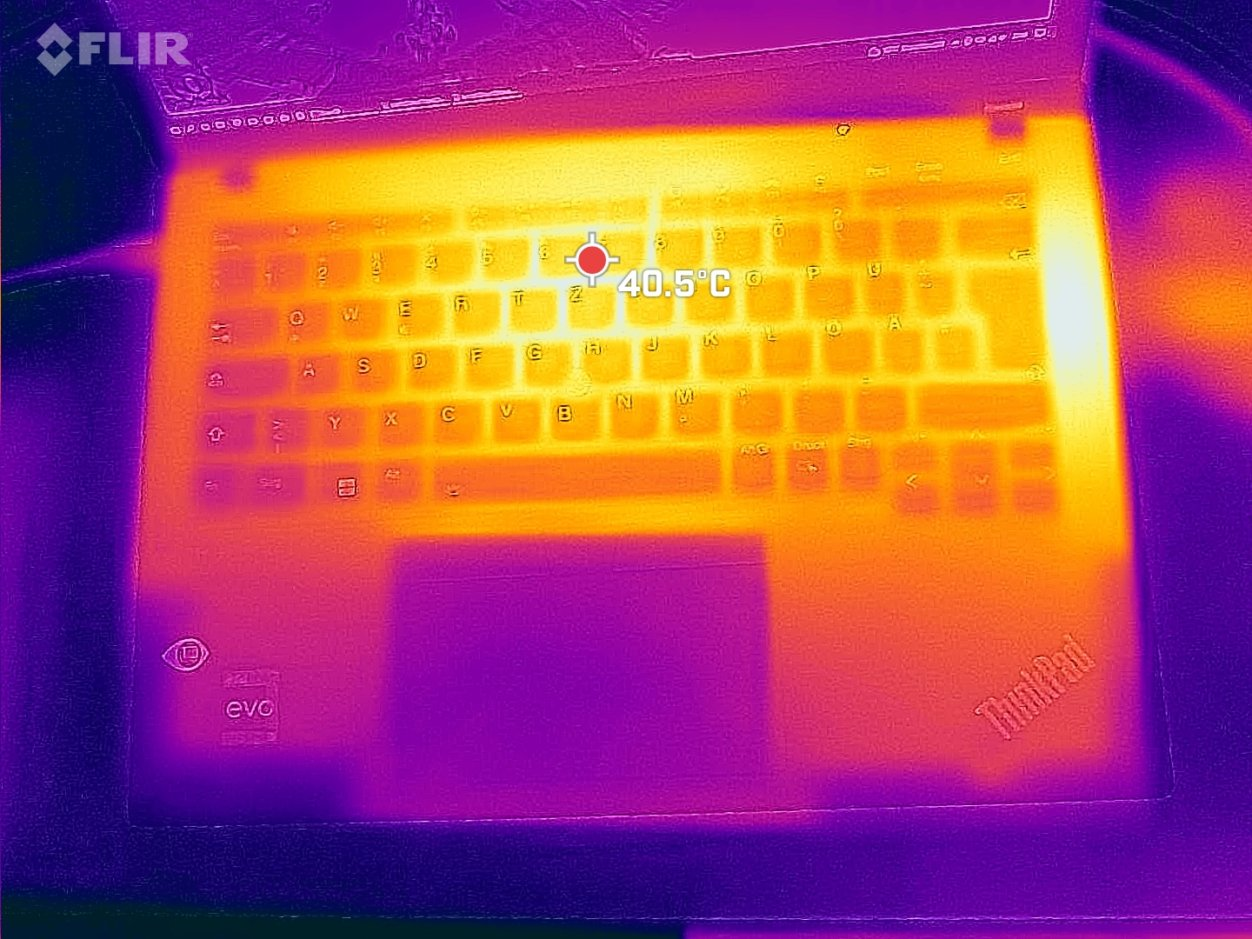
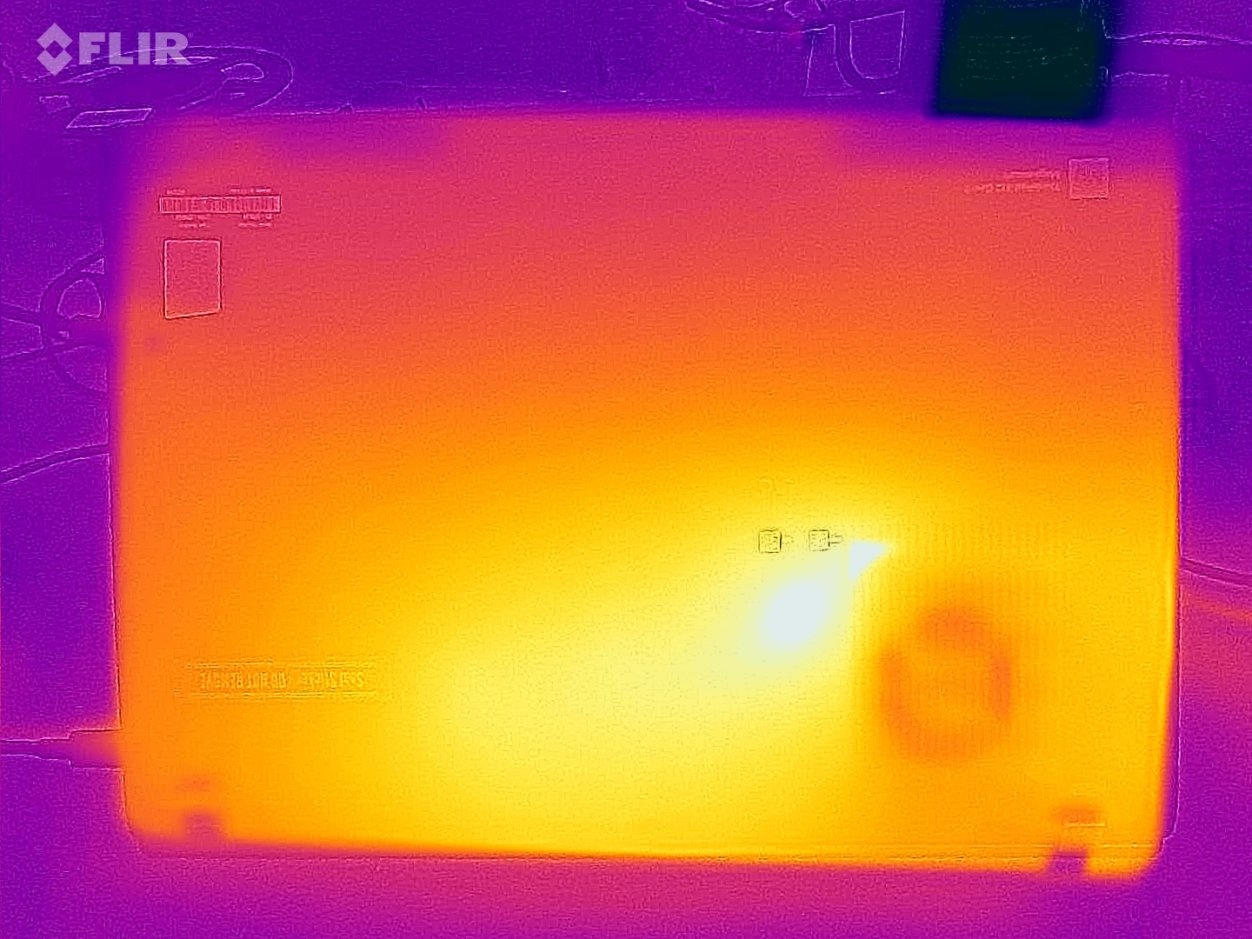
Temperatur
Obwohl die Oberflächentemperaturen des Notebooks nicht auf hohe Werte ansteigen, können auch die gemessenen 45 °C, welche das Gehäuse in der Mitte und der rechten Seite des Notebooks erreicht, unangenehm sein. Allerdings stellen wir diese Oberflächentemperaturen nur unter längerer Belastung fest. Im normalen Betrieb erwärmt sich der Laptop kaum.
(-) Die maximale Temperatur auf der Oberseite ist 45.3 °C. Im Vergleich liegt der Klassendurchschnitt bei 35.9 °C (von 21.4 bis 59 °C für die Klasse Subnotebook).
(±) Auf der Unterseite messen wir eine maximalen Wert von 41.8 °C (im Vergleich zum Durchschnitt von 39.3 °C).
(+) Ohne Last messen wir eine durchschnittliche Temperatur von 28.9 °C auf der Oberseite. Der Klassendurchschnitt erreicht 30.8 °C.
(±) Beim längeren Spielen von The Witcher 3 erhitzt sich das Gerät durchschnittlich auf 35.9 °C. Der Durchschnitt der Klasse ist derzeit 30.8 °C.
(+) Die Handballen und der Touchpad-Bereich erreichen maximal 32.1 °C und damit die typische Hauttemperatur und fühlen sich daher nicht heiß an.
(-) Die durchschnittliche Handballen-Temperatur anderer getesteter Geräte war 28.2 °C (-3.9 °C).
| Lenovo ThinkPad X13 G3 21BN0046GE Intel Core i5-1235U, Intel Iris Xe Graphics G7 80EUs | Framework Laptop 13.5 12th Gen Intel Intel Core i7-1260P, Intel Iris Xe Graphics G7 96EUs | HP Elite Dragonfly G3 Intel Core i7-1265U, Intel Iris Xe Graphics G7 96EUs | Dell Latitude 13 7330 Intel Core i7-1265U, Intel Iris Xe Graphics G7 96EUs | Lenovo ThinkPad X1 Titanium Yoga G1 20QB0016GE Intel Core i5-1140G7, Intel Iris Xe Graphics G7 80EUs | Lenovo ThinkPad X13 G2 AMD 20XH001KGE AMD Ryzen 5 PRO 5650U, AMD Radeon RX Vega 7 | |
|---|---|---|---|---|---|---|
| Hitze | 13% | 10% | 16% | 6% | 13% | |
| Last oben max * (°C) | 45.3 | 36.8 19% | 39 14% | 38.6 15% | 46.3 -2% | 43.7 4% |
| Last unten max * (°C) | 41.8 | 42.4 -1% | 42.2 -1% | 42 -0% | 43.3 -4% | 38 9% |
| Idle oben max * (°C) | 31.6 | 24.2 23% | 26.8 15% | 23.8 25% | 26.8 15% | 25.8 18% |
| Idle unten max * (°C) | 32.6 | 29 11% | 28.2 13% | 24.6 25% | 28.3 13% | 26.2 20% |
* ... kleinere Werte sind besser
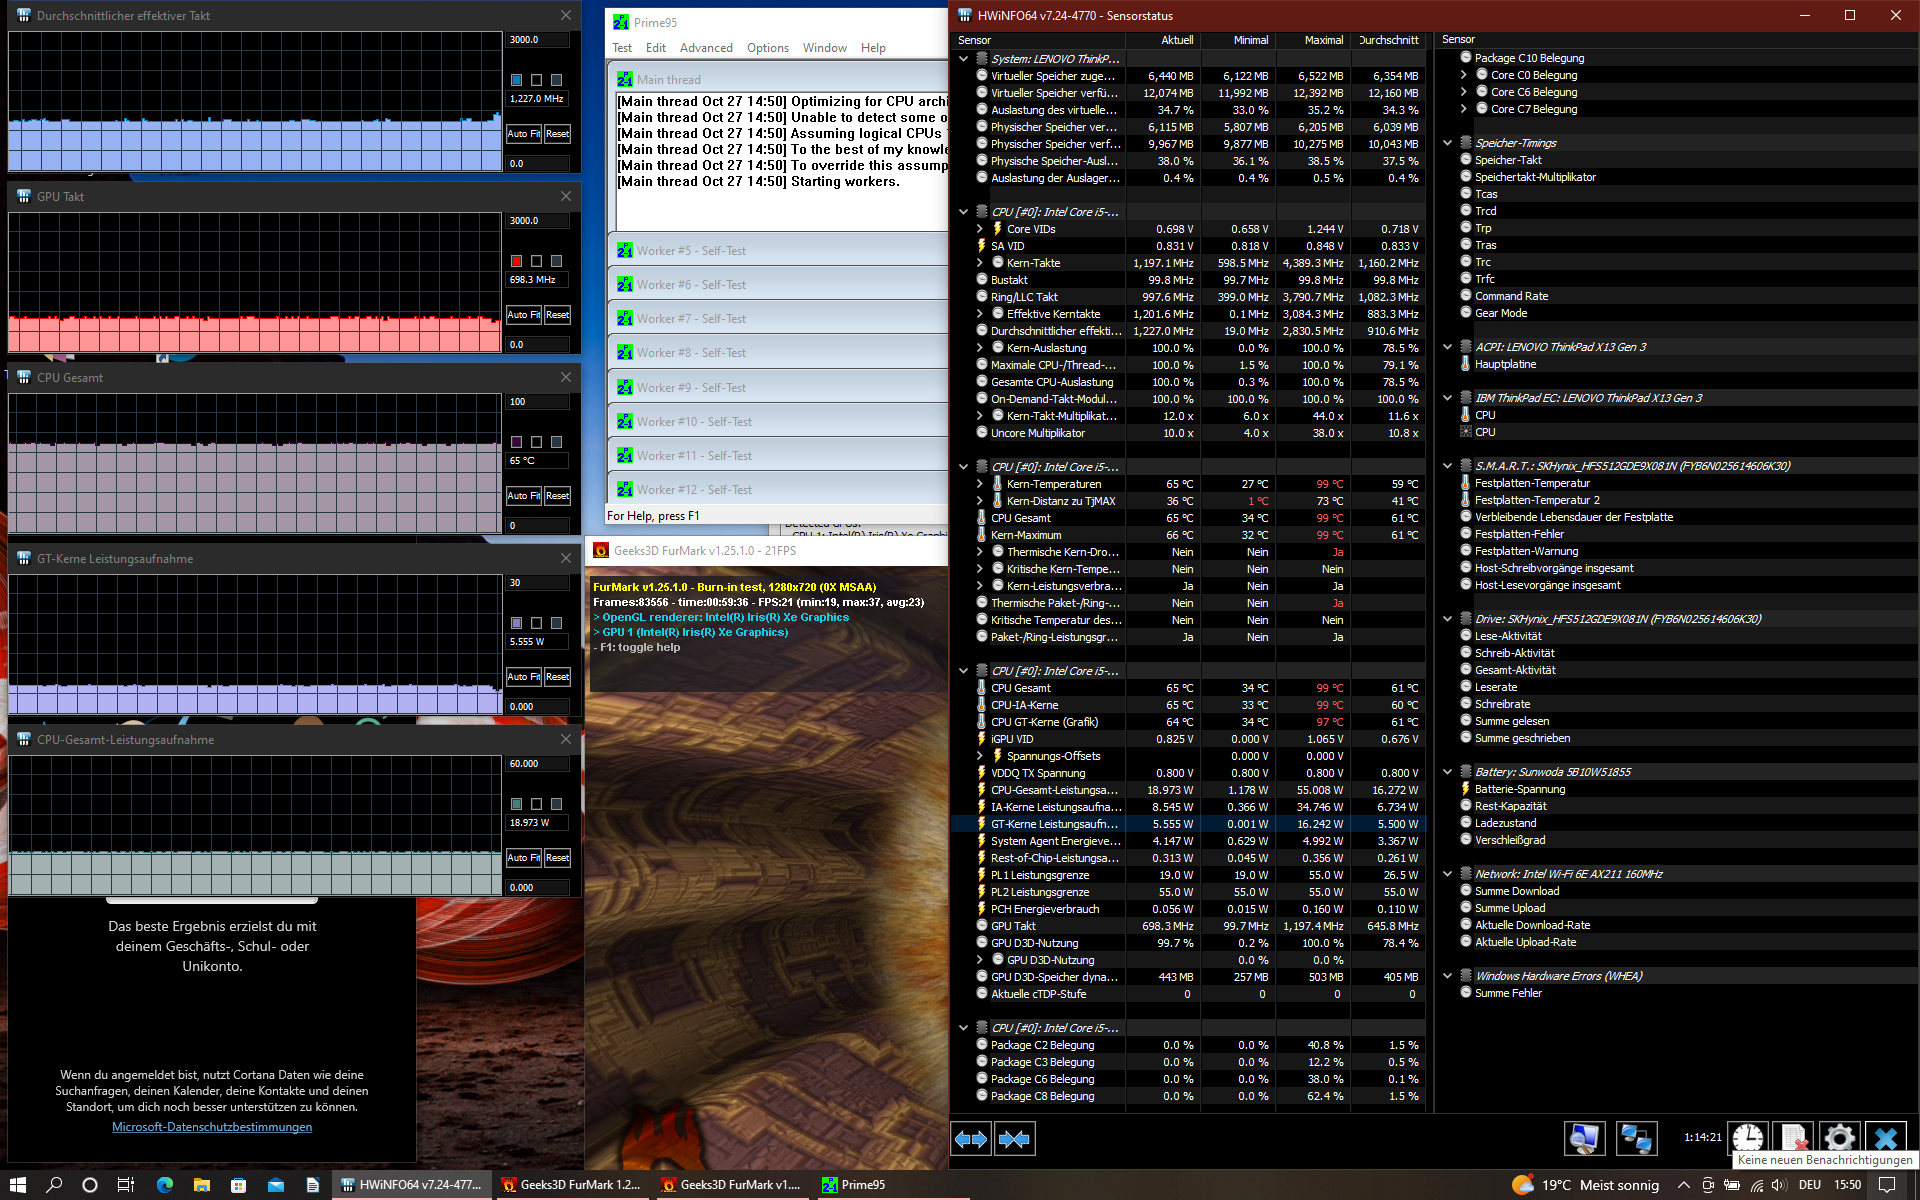
Stresstest
Nach circa sieben Minuten im Stresstest fällt die Leistungsaufnahme und das PL1 des Prozessors unabhängig vom Leistungsmodus auf 19 Watt. Vorher können wir eine Boost-Leistung von bis zu 55 Watt feststellen. Die Dauerleistung von 19 Watt kann der Laptop konstant halten.
Lautsprecher
Eigentlich müsste man beim ThinkPad X13 G3 von einem Mono-Lautsprecher sprechen. Direkt unter dem Bildschirm liegt das Modul, welches den linken und rechten Lautsprecher enthält. Somit sind die Treiber für beide Kanäle nur rund 11 cm voneinander entfernt.
Der Klang aus dem kleinen Lautsprechermodul ist eher schwach. Höhen und Tiefen werden zu leise dargestellt. Somit eignet sie das Ultrabook kaum zur Musikwiedergabe.
Lenovo ThinkPad X13 G3 21BN0046GE Audio Analyse
(±) | Mittelmäßig laut spielende Lautsprecher (74.4 dB)
Bass 100 - 315 Hz
(-) | kaum Bass - 18.7% niedriger als der Median
(±) | durchschnittlich lineare Bass-Wiedergabe (14.1% Delta zum Vorgänger)
Mitteltöne 400 - 2000 Hz
(+) | ausgeglichene Mitten, vom Median nur 2.5% abweichend
(+) | lineare Mitten (6.1% Delta zum Vorgänger)
Hochtöne 2 - 16 kHz
(+) | ausgeglichene Hochtöne, vom Median nur 1.6% abweichend
(+) | sehr lineare Hochtöne (3.9% Delta zum Vorgänger)
Gesamt im hörbaren Bereich 100 - 16.000 Hz
(±) | hörbarer Bereich ist durchschnittlich linear (16.6% Abstand zum Median)
Im Vergleich zu allen Geräten derselben Klasse
» 42% aller getesteten Geräte dieser Klasse waren besser, 6% vergleichbar, 53% schlechter
» Das beste Gerät hat einen Delta-Wert von 5%, durchschnittlich ist 18%, das schlechteste Gerät hat 53%
Im Vergleich zu allen Geräten im Test
» 28% aller getesteten Geräte waren besser, 6% vergleichbar, 66% schlechter
» Das beste Gerät hat einen Delta-Wert von 4%, durchschnittlich ist 24%, das schlechteste Gerät hat 134%
HP Elite Dragonfly G3 Audio Analyse
(+) | Die Lautsprecher können relativ laut spielen (84.7 dB)
Bass 100 - 315 Hz
(±) | abgesenkter Bass - 9.4% geringer als der Median
(±) | durchschnittlich lineare Bass-Wiedergabe (11.4% Delta zum Vorgänger)
Mitteltöne 400 - 2000 Hz
(+) | ausgeglichene Mitten, vom Median nur 0.9% abweichend
(+) | lineare Mitten (2.8% Delta zum Vorgänger)
Hochtöne 2 - 16 kHz
(+) | ausgeglichene Hochtöne, vom Median nur 2.1% abweichend
(+) | sehr lineare Hochtöne (3.9% Delta zum Vorgänger)
Gesamt im hörbaren Bereich 100 - 16.000 Hz
(+) | hörbarer Bereich ist sehr linear (6.6% Abstand zum Median
Im Vergleich zu allen Geräten derselben Klasse
» 0% aller getesteten Geräte dieser Klasse waren besser, 0% vergleichbar, 100% schlechter
» Das beste Gerät hat einen Delta-Wert von 7%, durchschnittlich ist 21%, das schlechteste Gerät hat 53%
Im Vergleich zu allen Geräten im Test
» 1% aller getesteten Geräte waren besser, 0% vergleichbar, 99% schlechter
» Das beste Gerät hat einen Delta-Wert von 4%, durchschnittlich ist 24%, das schlechteste Gerät hat 134%
Energieverwaltung - Noch mehr Ausdauer
Energieaufnahme
Der kleine Laptop ist größtenteils recht genügsam bei der Energieaufnahme. Erst wenn die ganze verfügbare Rechenleistung vom ThinkPad gefordert wird, steigt die Energieaufnahme auf bis zu 66,7 Watt. Langfristig sinkt diese jedoch wieder auf rund 36 Watt ab. Auch hier macht sich der Einfluss der Leistungssteuerung bemerkbar. Somit wird das beigelegte 65-Watt-Netzteil noch innerhalb seiner Spezifikationen belastet.
| Aus / Standby | |
| Idle | |
| Last |
|
Legende:
min: | |
| Lenovo ThinkPad X13 G3 21BN0046GE i5-1235U, Iris Xe G7 80EUs, SK Hynix HFS512 GDE9X081N, IPS Grade, 1920x1200, 13.3" | Framework Laptop 13.5 12th Gen Intel i7-1260P, Iris Xe G7 96EUs, WDC PC SN730 SDBPNTY-512G, IPS, 2256x1504, 13.5" | HP Elite Dragonfly G3 i7-1265U, Iris Xe G7 96EUs, Micron 3400 MTFDKBA512TFH 512GB, IPS, 1920x1280, 13.5" | Dell Latitude 13 7330 i7-1265U, Iris Xe G7 96EUs, Toshiba KBG40ZNS512G NVMe, IPS, 1920x1080, 13.3" | Lenovo ThinkPad X1 Titanium Yoga G1 20QB0016GE i5-1140G7, Iris Xe G7 80EUs, Lenovo UMIS RPJTJ256MEE1OWX, IPS LED, 2256x1504, 13.5" | Lenovo ThinkPad X13 G2 AMD 20XH001KGE R5 PRO 5650U, Vega 7, Samsung SSD PM981a MZVLB512HBJQ, IPS LED, 1920x1200, 13.3" | Durchschnittliche Intel Iris Xe Graphics G7 80EUs | Durchschnitt der Klasse Subnotebook | |
|---|---|---|---|---|---|---|---|---|
| Stromverbrauch | -49% | -11% | -3% | -6% | -3% | -29% | -26% | |
| Idle min * (Watt) | 2.7 | 5.3 -96% | 3.4 -26% | 2.8 -4% | 3.75 -39% | 3.82 -41% | 4.47 ? -66% | 3.96 ? -47% |
| Idle avg * (Watt) | 5.2 | 8.4 -62% | 5.6 -8% | 4.8 8% | 7.75 -49% | 5.74 -10% | 7.37 ? -42% | 6.86 ? -32% |
| Idle max * (Watt) | 6.2 | 11.2 -81% | 8.4 -35% | 7.3 -18% | 8.69 -40% | 7.65 -23% | 9.24 ? -49% | 8.44 ? -36% |
| Last avg * (Watt) | 38.4 | 57.4 -49% | 40.8 -6% | 48.1 -25% | 33.12 14% | 35.79 7% | 36.6 ? 5% | 43.9 ? -14% |
| Witcher 3 ultra * (Watt) | 41.9 | 46.7 -11% | 35.5 15% | 35.4 16% | 28.7 32% | 35.6 15% | ||
| Last max * (Watt) | 66.7 | 61.2 8% | 68.4 -3% | 63.6 5% | 35.19 47% | 45.04 32% | 61.7 ? 7% | 66.6 ? -0% |
* ... kleinere Werte sind besser
Energieaufnahme Witcher 3 / Stresstest
Energieaufnahme mit externem Monitor
Akkulaufzeit
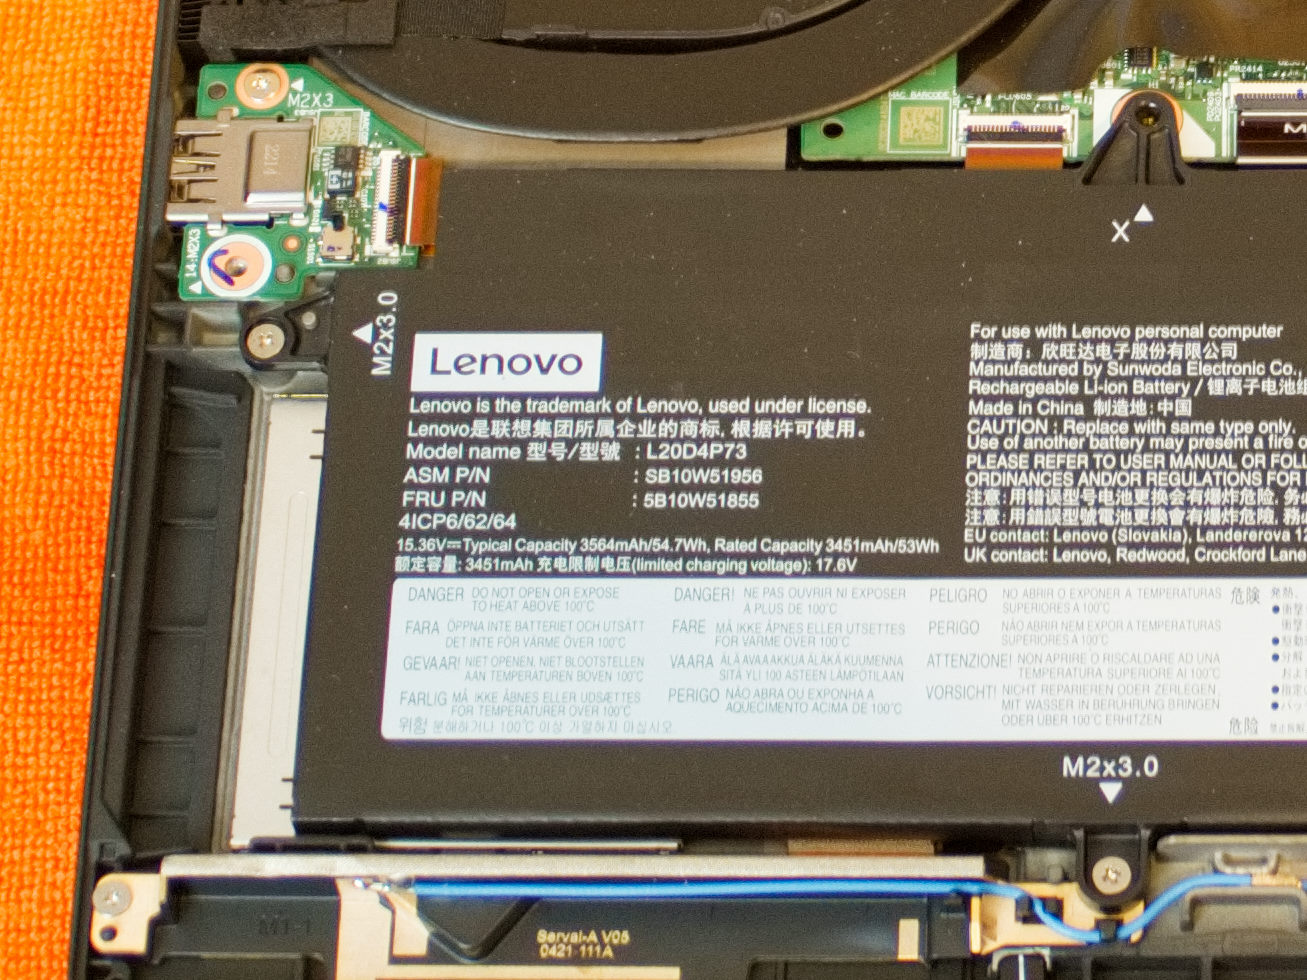
Mit 53 Wattstunden wird die Kapazität des im Lenovo ThinkPad X13 G3 verbauten Akkus angegeben. Die gespeicherte Energiemenge reicht aus, um den Laptop über 10 Stunden im praxisnahen Wi-Fi-Websurfing-Test laufen zu lassen. Auch unter Last schafft es das Ultrabook immerhin gut zwei Stunden, ohne eine externe Spannungsquelle zu verlangen.
| Lenovo ThinkPad X13 G3 21BN0046GE i5-1235U, Iris Xe G7 80EUs, 54.7 Wh | Framework Laptop 13.5 12th Gen Intel i7-1260P, Iris Xe G7 96EUs, 55 Wh | HP Elite Dragonfly G3 i7-1265U, Iris Xe G7 96EUs, 68 Wh | Dell Latitude 13 7330 i7-1265U, Iris Xe G7 96EUs, 41 Wh | Lenovo ThinkPad X1 Titanium Yoga G1 20QB0016GE i5-1140G7, Iris Xe G7 80EUs, 44.5 Wh | Lenovo ThinkPad X13 G2 AMD 20XH001KGE R5 PRO 5650U, Vega 7, 54.7 Wh | Durchschnitt der Klasse Subnotebook | |
|---|---|---|---|---|---|---|---|
| Akkulaufzeit | -26% | 86% | 2% | -20% | 40% | ||
| Idle (h) | 14.2 | 37.8 166% | 21.9 54% | 27.2 ? 92% | |||
| WLAN (h) | 10.2 | 7.5 -26% | 11.8 16% | 8.3 -19% | 9.3 -9% | 13.4 ? 31% | |
| Last (h) | 2 | 3.5 75% | 1.4 -30% | 1.4 -30% | 1.915 ? -4% | ||
| H.264 (h) | 13.6 | 16.1 ? |
Pro
Contra
Fazit - Reisenotebook mit Platzmangel
Mit Intels Alder-Lake-Prozessoren in petto wird das ThinkPad X13 G3 etwas leistungsstärker als seine Vorgänger. Egal ob mit Intel- oder AMD-Prozessoren, können die ThinkPads aus der zweiten Generation im Sprint nicht mit der dritten Generation mithalten, wobei das ThinkPad X13 G2 mit AMD-Prozessor in den Benchmarks mit länger Belastung besser abschneidet.
Die wenigen Kritikpunkte am X13 G3 sind generationenübergreifend und lassen sich meist auf das geringe Platzangebot im Gehäuse zurückführen. Für einen Arbeitslaptop wäre eine Tastatur mit höherem Tastenhub wünschenswert, die langfristige Leistungsbereitschaft ist gering und der Klang des Notebooks schwach. Hier gilt wohl, wer ein besonders platzsparendes Notebook sucht, muss mit diesen Einschränkungen leben. Denn auch andere Ultrabooks wie das HP Elite Dragonfly G3 weisen ähnliche Kritikpunkte auf.
Für ein so kompaktes Gerät bietet das ThinkPad X13 G3 primär bei der Konnektivität einiges. Schnelles WLAN 6E und ein LTE-Modem sorgen für eine dauerhafte Verbindung mit dem Internet. Das 16:10-Display ist stark und auch die Leistung des Ultrabooks ist angemessen.
Die starke Plattform des Lenovo ThinkPad X13 wird mit der aktuellen Intel-Prozessorgeneration nochmals aufgewertet. Das stabile und gleichzeitig leichte Gerät lädt zum Reisen mit dem Laptop ein. Vergleicht man den Business-Laptop mit einem Consumer-Gerät mögen eventuell zunächst keine Leistungsunterschiede auffallen. Aber vor allem bei den Soft-Skills wie Garantielaufzeit, Anschlussvielfalt und Ergonomie haben die ThinkPads oft einen deutlichen Vorsprung. Das gilt freilich auch für die Business-Konkurrenz wie das sehr ähnliche Dell Latitude 7330, das ebenfalls drei Jahre Garantielaufzeit bietet.
Preis und Verfügbarkeit
Auch das kleinste ThinkPad hat einen großen Preis. Ab rund 1.500 Euro starten die verschiedenen Konfigurationen des ThinkPad X13 G3 bei Lenovo.
Lenovo ThinkPad X13 G3 21BN0046GE
- 21.11.2022 v7 (old)
Marc Herter
