Apple M3 Pro 14-Core GPU vs Apple M3 Max 40-Core GPU vs Apple M3 10-Core GPU
Apple M3 Pro 14-Core GPU ► remove from comparison
Die Apple M3 Pro 14-Core GPU ist eine selbst designte Grafikkarte im Apple M3 Pro (mit 11 CPU-Kernen) und bietet vierzehn der achtzehn Kerne welche auf dem Chip vorhanden sind. Die Grafikkarte nutzt eine neue Architektur und bietet nun Dynamic Caching, Mesh Shading und Ray Tracing-Beschleunigung.
Die GPU kann über einen 192 Bit Speicherbus (max 150 GBit/s) auf bis zu 24 GB LPDDR5-6400 Unified Memory zugreifen. Dank Dynamic Caching, soll die GPU dabei nur soviel Speicher reservieren, wie benötigt wird.
Da der gesamte Chip wird im aktuellen 3nm Prozess (wahrscheinlich N3B) bei TSMC hergestellt.
Apple M3 Max 40-Core GPU ► remove from comparison
Die Apple M3 Max 40-Core GPU ist eine selbst designte Grafikkarte im Apple M3 SoC und laut Apple mit vierzig Kernen. Laut Apple nutzt die GPU eine neue Architektur und bietet nun Dynamic Caching, Mesh Shading und Ray Tracing-Beschleunigung.
Die GPU kann auf bis zu 128 GB LPDDR5-6400 Unified Memory zugreifen über einen 512 Bit Speicherbus (max 400 GBit/s). Dank Dynamic Caching, soll die GPU dabei nur soviel Speicher reservieren, wie benötigt wird.
Da der SoC im aktuellen 3nm (wahrscheinlich N3B) bei TSMC hergestellt. Laut powermetrics braucht die GPU bis zu 60 Watt (Chip inkl. CPU gesamt 78 Watt).
Apple M3 10-Core GPU ► remove from comparison
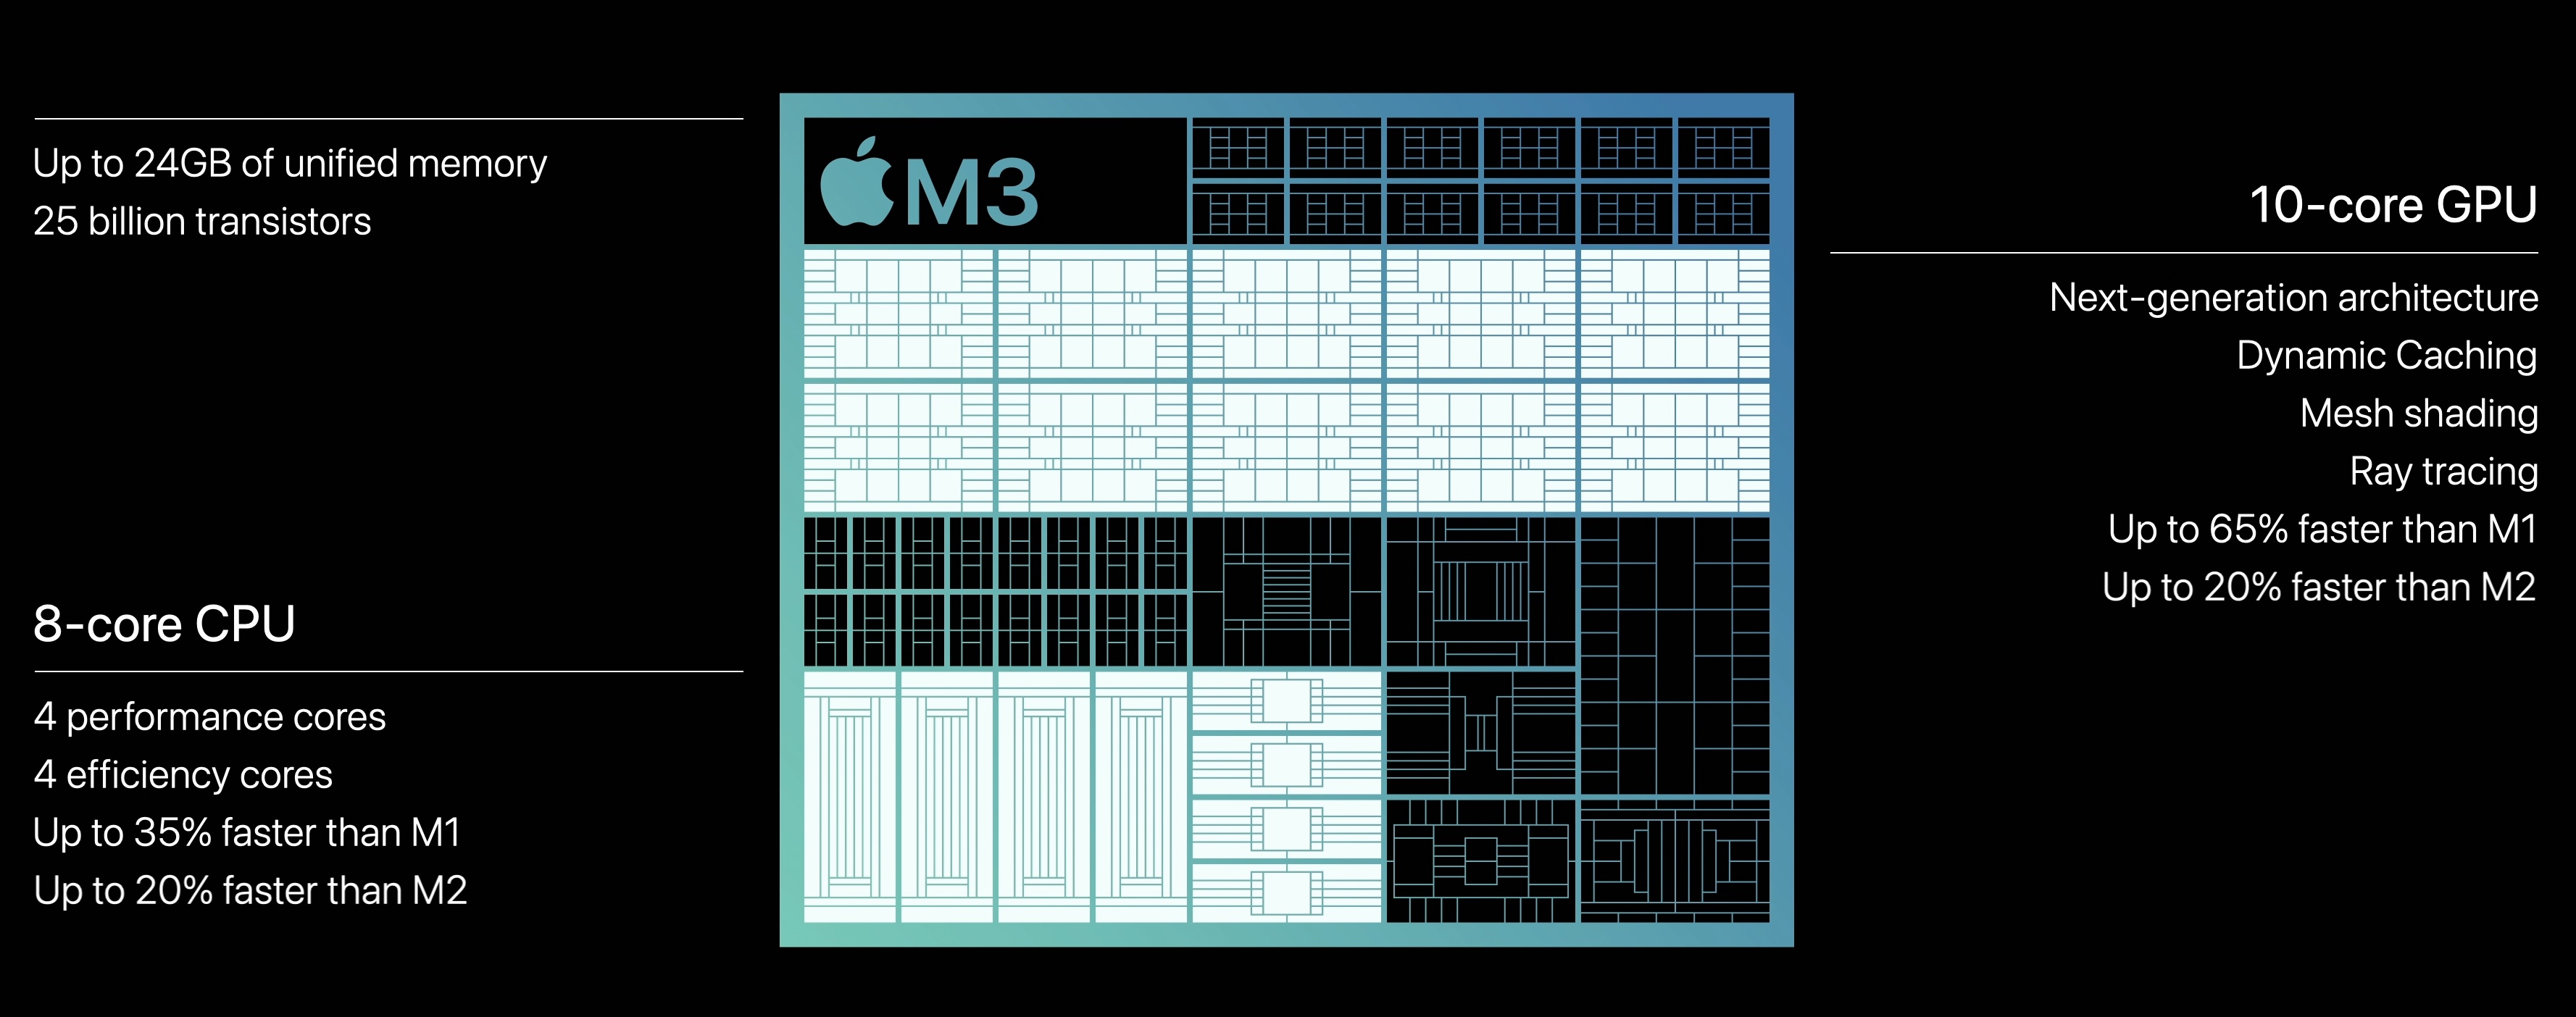
Die Apple M3 GPU ist eine selbst designte Grafikkarte im Apple M3 SoC und laut Apple mit acht oder zehn Kernen. Laut Apple nutzt die GPU eine neue Architektur und bietet nun Dynamic Caching, Mesh Shading und Ray Tracing-Beschleunigung.
Die Performance liegt laut Apple um 20% oberhalb der alten M2 10-Kern-GPU.
Die GPU kann weiterhin auf 8, 16 oder 24 GB LPDDR5-6400 Unified Memory zugreifen über einen 128 Bit Speicherbus (max 100 GBit/s). Dank Dynamic Caching, soll die GPU dabei nur soviel Speicher reservieren, wie benötigt wird.
Da der SoC im aktuellen 3nm (wahrscheinlich N3B) bei TSMC hergestellt. Die GPU nutzt in etwa 15 Watt laut interner Tools.
Apple M3 Pro 14-Core GPU Apple M3 Max 40-Core GPU Apple M3 10-Core GPU Apple M3 Serie Pipelines 14 - unified 40 - unified 10 - unified Speichertyp LPDDR5-6400 LPDDR5-6400 LPDDR5-6400 Shared Memory nein nein nein Herstellungsprozess 5 nm 5 nm 5 nm Notebookgröße mittel (15.4" z.B.) mittel (15.4" z.B.) Erscheinungsdatum 31.10.2023 31.10.2023 31.10.2023 Stromverbrauch 53 Watt 15 Watt Predecessor M1 8-Core GPU
CPU in M3 Pro 14-Core GPU GPU Base Speed GPU Boost / Turbo Apple M3 Pro 11-Core 11 x 2748 MHz, 27 W ? MHz ? MHz
CPU in M3 Max 40-Core GPU GPU Base Speed GPU Boost / Turbo Apple M3 Max 16-Core 16 x 2748 MHz, 78 W ? MHz ? MHz
CPU in M3 10-Core GPU GPU Base Speed GPU Boost / Turbo Apple M3 8 x 2748 MHz ? MHz ? MHz
Benchmarks 3DMark - 3DMark Wild Life Extreme Unlimited
12094 Points (14%)
min: 31268 avg: 31336 median: 31335.5 (36%) max: 31403 Points
GPU TDP 24 W TDP 60 W 39% 100%
min: 8239 avg: 8276 median: 8286 (10%) max: 8302 Points
GPU TDP 15 W TDP 24 W TDP 60 W 26% 39% 100%
Blender - Blender 3.3 Classroom METAL *
73 Seconds (8%)
min: 29.6 avg: 30.8 median: 30.8 (3%) max: 32 Seconds
GPU TDP 24 W TDP 60 W 100% 105%
min: 121 avg: 128 median: 129 (13%) max: 134 Seconds
GPU TDP 15 W TDP 24 W TDP 60 W 100% 107% 112%
Cinebench R15 + Apple M3 Pro 14-Core GPU Cinebench R15 - Cinebench R15 OpenGL 64 Bit
129.9 fps (8%)
Cinebench R15 OpenGL 64 Bit + Apple M3 Max 40-Core GPU
min: 136.23 avg: 137.4 median: 137.4 (8%) max: 138.52 fps
GPU TDP 24 W TDP 60 W 95% 100%
Cinebench R15 OpenGL 64 Bit + Apple M3 10-Core GPU
129.8 fps (8%)
GPU TDP 15 W TDP 24 W TDP 60 W 94% 95% 100%
Cinebench R15 OpenGL Ref. Match 64 Bit + Apple M3 Pro 14-Core GPU Cinebench R15 - Cinebench R15 OpenGL Ref. Match 64 Bit
99.5 % (100%)
Cinebench R15 OpenGL Ref. Match 64 Bit + Apple M3 Max 40-Core GPU
99.5 % (100%)
GPU TDP 24 W TDP 60 W 100% 100%
Cinebench R15 OpenGL Ref. Match 64 Bit + Apple M3 10-Core GPU
99.5 % (100%)
GPU TDP 15 W TDP 24 W TDP 60 W 100% 100% 100%
GFXBench - GFXBench 5.0 4K Aztec Ruins High Tier Offscreen
79 fps (32%)
min: 188.2 avg: 196 median: 196 (80%) max: 203.7 fps
GPU TDP 24 W TDP 60 W 40% 100%
min: 51.8 avg: 52.2 median: 52.3 (21%) max: 52.6 fps
GPU TDP 15 W TDP 24 W TDP 60 W 27% 40% 100%
GFXBench - GFXBench 5.0 Aztec Ruins High Tier Offscreen
178.7 fps (32%)
min: 416 avg: 431 median: 431 (78%) max: 446 fps
GPU TDP 24 W TDP 60 W 41% 100%
min: 114.4 avg: 118.5 median: 120 (22%) max: 121 fps
GPU TDP 15 W TDP 24 W TDP 60 W 27% 41% 100%
GFXBench - GFXBench 5.0 Aztec Ruins Normal Tier Offscreen
481.9 fps (36%)
min: 858 avg: 863 median: 863 (64%) max: 868 fps
GPU TDP 24 W TDP 60 W 56% 100%
min: 320 avg: 326.9 median: 329.6 (24%) max: 331 fps
GPU TDP 15 W TDP 24 W TDP 60 W 38% 56% 100%
GFXBench - GFXBench Car Chase Offscreen
376.3 fps (42%)
min: 556 avg: 560 median: 560 (63%) max: 564 fps
GPU TDP 24 W TDP 60 W 67% 100%
min: 259 avg: 262.5 median: 260 (29%) max: 268.6 fps
GPU TDP 15 W TDP 24 W TDP 60 W 47% 67% 100%
GFXBench 3.1 - GFXBench Manhattan ES 3.1 Offscreen
565 fps (12%)
min: 1163 avg: 1178 median: 1178 (25%) max: 1193 fps
GPU TDP 24 W TDP 60 W 48% 100%
min: 370 avg: 378.3 median: 372 (8%) max: 393 fps
GPU TDP 15 W TDP 24 W TDP 60 W 32% 48% 100%
GFXBench 3.0 - GFXBench 3.0 Manhattan Offscreen
818 fps (48%)
min: 1557 avg: 1573 median: 1573 (92%) max: 1589 fps
GPU TDP 24 W TDP 60 W 52% 100%
min: 541 avg: 552 median: 551 (32%) max: 563.5 fps
GPU TDP 15 W TDP 24 W TDP 60 W 35% 52% 100%
GFXBench (DX / GLBenchmark) 2.7 + Apple M3 Pro 14-Core GPU GFXBench (DX / GLBenchmark) 2.7 - GFXBench T-Rex HD Offscreen C24Z16
1299 fps (10%)
GFXBench T-Rex HD Offscreen C24Z16 + Apple M3 Max 40-Core GPU
min: 2893 avg: 2942 median: 2941.5 (23%) max: 2990 fps
GPU TDP 24 W TDP 60 W 44% 100%
GFXBench T-Rex HD Offscreen C24Z16 + Apple M3 10-Core GPU
min: 835 avg: 849 median: 848 (7%) max: 864.2 fps
GPU TDP 15 W TDP 24 W TDP 60 W 29% 44% 100%
Geekbench 6.2 - Geekbench 6.2 GPU OpenCL
42798 Points (12%)
min: 91413 avg: 91416 median: 91415.5 (26%) max: 91418 Points
GPU TDP 24 W TDP 60 W 47% 100%
min: 30414 avg: 30463 median: 30470 (9%) max: 30506 Points
GPU TDP 15 W TDP 24 W TDP 60 W 33% 47% 100%
Geekbench 6.2 - Geekbench 6.2 GPU Metal
68043 Points (44%)
min: 154675 avg: 155214 median: 155214 (100%) max: 155752 Points
GPU TDP 24 W TDP 60 W 44% 100%
min: 47494 avg: 47626 median: 47686 (31%) max: 47699 Points
GPU TDP 15 W TDP 24 W TDP 60 W 31% 44% 100%
Power Consumption - The Witcher 3 Power Consumption - external Monitor *
32.8 Watt (5%)
min: 87.7 avg: 91.6 median: 91.6 (13%) max: 95.4 Watt
GPU TDP 24 W TDP 60 W 109% 100%
min: 21.9 avg: 22.8 median: 23.2 (3%) max: 23.2 Watt
GPU TDP 15 W TDP 24 W TDP 60 W 111% 109% 100%
Power Consumption - Witcher 3 Power Consumption *
42.8 Watt (9%)
min: 92.5 avg: 100.8 median: 100.8 (22%) max: 109 Watt
GPU TDP 24 W TDP 60 W 116% 100%
min: 28.6 avg: 30 median: 29.6 (7%) max: 31.9 Watt
GPU TDP 15 W TDP 24 W TDP 60 W 120% 116% 100%
Power Consumption - Witcher 3 ultra Power Efficiency
0.9 fps per Watt (90%)
min: 0.633 avg: 0.8 median: 0.8 (81%) max: 0.995 fps per Watt
GPU TDP 24 W TDP 60 W 100% 89%
min: 0.811 avg: 0.8 median: 0.8 (83%) max: 0.878 fps per Watt
GPU TDP 15 W TDP 24 W TDP 60 W 92% 100% 89%
Power Consumption - Witcher 3 ultra Power Efficiency - external Monitor
min: 1.189 avg: 1.2 median: 1.2 (99%) max: 1.207 fps per Watt
min: 0.723 avg: 0.9 median: 0.9 (73%) max: 1.207 fps per Watt
GPU TDP 24 W TDP 60 W 100% 75%
min: 1.034 avg: 1.1 median: 1.1 (91%) max: 1.207 fps per Watt
GPU TDP 15 W TDP 24 W TDP 60 W 94% 100% 75%
Emissions Witcher 3 Fan Noise + Apple M3 Pro 14-Core GPU Emissions - Witcher 3 Fan Noise
25.1 dB(A) (40%)
Witcher 3 Fan Noise + Apple M3 Max 40-Core GPU
min: 42.8 avg: 43.1 median: 43.1 (69%) max: 43.4 dB(A)
GPU TDP 24 W TDP 60 W 58% 100%
Witcher 3 Fan Noise + Apple M3 10-Core GPU
25.1 dB(A) (40%)
GPU TDP 15 W TDP 24 W TDP 60 W 58% 58% 100%
Average Benchmarks Apple M3 Pro 14-Core GPU → 100% n=13 Average Benchmarks Apple M3 Max 40-Core GPU → 189% n=13 Average Benchmarks Apple M3 10-Core GPU → 75% n=13
- Bereich der Benchmarkergebnisse für diese Grafikkarte
- Durchschnittliche Benchmarkergebnisse für diese Grafikkarte
* Smaller numbers mean a higher performance
1 This benchmark is not used for the average calculation
Spiele-Benchmarks Die folgenden Benchmarks basieren auf unseren Spieletests mit Testnotebooks. Die Performance dieser Grafikkarte bei den gelisteten Spielen ist abhängig von der verwendeten CPU, Speicherausstattung, Treiber und auch Betriebssystem. Dadurch müssen die untenstehenden Werte nicht repräsentativ sein. Detaillierte Informationen über das verwendete System sehen Sie nach einem Klick auf den fps-Wert.
100%
M3 Pro 14-Core GPU:
193 fps
125%
M3 Max 40-Core GPU:
242 fps
100%
M3 Pro 14-Core GPU:
125 fps
168%
M3 Max 40-Core GPU:
207 212 ~ 210 fps
63%
M3 10-Core GPU:
67 83 86 ~ 79 fps
100%
M3 Pro 14-Core GPU:
67 fps
207%
M3 Max 40-Core GPU:
138 139 ~ 139 fps
66%
M3 10-Core GPU:
43 44 45 ~ 44 fps
100%
M3 Pro 14-Core GPU:
53 fps
206%
M3 Max 40-Core GPU:
97 121 ~ 109 fps
62%
M3 10-Core GPU:
28 35 36 ~ 33 fps
100%
M3 Pro 14-Core GPU:
35 fps
234%
M3 Max 40-Core GPU:
82 82 ~ 82 fps
69%
M3 10-Core GPU:
24 fps
M3 Max 40-Core GPU:
45 fps
M3 Max 40-Core GPU:
44 fps
M3 10-Core GPU:
31 32 ~ 32 fps
M3 10-Core GPU:
26 26 ~ 26 fps
100%
M3 Pro 14-Core GPU:
42 fps
229%
M3 Max 40-Core GPU:
96 fps
52%
M3 10-Core GPU:
21 22 ~ 22 fps
100%
M3 Pro 14-Core GPU:
39 fps
231%
M3 Max 40-Core GPU:
90 fps
49%
M3 10-Core GPU:
19 19 ~ 19 fps
M3 Max 40-Core GPU:
60 fps
M3 Max 40-Core GPU:
51 fps
100%
M3 Pro 14-Core GPU:
75 fps
227%
M3 Max 40-Core GPU:
170 170 ~ 170 fps
69%
M3 10-Core GPU:
52 fps
100%
M3 Pro 14-Core GPU:
49.5 fps
224%
M3 Max 40-Core GPU:
109 113 ~ 111 fps
67%
M3 10-Core GPU:
33 fps
100%
M3 Pro 14-Core GPU:
35.9 fps
228%
M3 Max 40-Core GPU:
80 84 ~ 82 fps
67%
M3 10-Core GPU:
24 fps
100%
M3 Pro 14-Core GPU:
22.5 fps
249%
M3 Max 40-Core GPU:
54 58 ~ 56 fps
67%
M3 10-Core GPU:
15 fps
100%
M3 Pro 14-Core GPU:
66 fps
224%
M3 Max 40-Core GPU:
145 150 ~ 148 fps
64%
M3 10-Core GPU:
38 44 45 ~ 42 fps
100%
M3 Pro 14-Core GPU:
60 fps
232%
M3 Max 40-Core GPU:
135 143 ~ 139 fps
63%
M3 10-Core GPU:
34 38 41 ~ 38 fps
100%
M3 Pro 14-Core GPU:
53 fps
226%
M3 Max 40-Core GPU:
118 122 ~ 120 fps
62%
M3 10-Core GPU:
30 32 36 ~ 33 fps
100%
M3 Pro 14-Core GPU:
34 fps
256%
M3 Max 40-Core GPU:
86 88 ~ 87 fps
68%
M3 10-Core GPU:
23 fps
M3 Max 40-Core GPU:
56 fps
M3 Max 40-Core GPU:
53 54 ~ 54 fps
M3 Max 40-Core GPU:
50 51 ~ 51 fps
M3 Max 40-Core GPU:
49 49 ~ 49 fps
M3 Max 40-Core GPU:
87 fps
M3 10-Core GPU:
36 36 38 ~ 37 fps
100%
M3 Pro 14-Core GPU:
39 fps
208%
M3 Max 40-Core GPU:
69 92 ~ 81 fps
64%
M3 10-Core GPU:
24 24 28 ~ 25 fps
100%
M3 Pro 14-Core GPU:
79 fps
99%
M3 Max 40-Core GPU:
77 79 ~ 78 fps
86%
M3 10-Core GPU:
68 fps
100%
M3 Pro 14-Core GPU:
50 fps
108%
M3 Max 40-Core GPU:
53 54 ~ 54 fps
88%
M3 10-Core GPU:
44 fps
M3 Max 40-Core GPU:
51 52 ~ 52 fps
Average Gaming Apple M3 Pro 14-Core GPU → 100% Average Gaming 30-70 fps → 100%
Average Gaming Apple M3 Max 40-Core GPU → 204% Average Gaming 30-70 fps → 178%
Average Gaming Apple M3 10-Core GPU → 66% Average Gaming 30-70 fps → 70%
Apple M3 Pro 14-Core GPU low med. high ultra QHD 4K Total War Pharaoh 193 125 67 53 35 Baldur's Gate 3 42 39 Total War: Three Kingdoms 75 49.5 35.9 22.5 Shadow of the Tomb Raider 66 60 53 34 The Witcher 3 39 GTA V 79 50 < 30 fps < 60 fps < 120 fps ≥ 120 fps 1 2 1 2 3 6 1 2
Apple M3 Max 40-Core GPU low med. high ultra QHD 4K Total War Pharaoh 242 210 139 109 82 Cyberpunk 2077 2.1 Phantom Liberty 45 44 44 42 36 Baldur's Gate 3 96 90 60 Star Wars Jedi Survivor 51 Total War: Three Kingdoms 170 111 82 56 Shadow of the Tomb Raider 148 139 120 87 Far Cry 5 56 54 51 49 The Witcher 3 87 81 GTA V 78 54 52 < 30 fps < 60 fps < 120 fps ≥ 120 fps 1 1 2 3 2 4 2 4 4 1 4 3
Apple M3 10-Core GPU low med. high ultra QHD 4K Total War Pharaoh 130 79 44 33 24 Cyberpunk 2077 2.1 Phantom Liberty 33 25.7 21.3 18.1 Baldur's Gate 3 32 26 22 19 Total War: Three Kingdoms 151 52 33 24 15 Shadow of the Tomb Raider 106 42 38 33 23 Far Cry 5 79 46 42 39 26 The Witcher 3 37 25 GTA V 98 83 68 44 < 30 fps < 60 fps < 120 fps ≥ 120 fps 2 3 2 2 3 2 2 5 1 4 4 4
v1.26
log 31. 15:24:16
#0 checking url part for id 12032 +0s ... 0s
#1 checking url part for id 11636 +0s ... 0s
#2 checking url part for id 11633 +0s ... 0s
#3 not redirecting to Ajax server +0s ... 0s
#4 did not recreate cache, as it is less than 5 days old! Created at Fri, 31 May 2024 05:41:40 +0200 +0.001s ... 0.001s
#5 composed specs +0.109s ... 0.11s
#6 did output specs +0s ... 0.11s
#7 start showIntegratedCPUs +0s ... 0.11s
#8 getting avg benchmarks for device 12032 +0.036s ... 0.147s
#9 got single benchmarks 12032 +0.007s ... 0.154s
#10 getting avg benchmarks for device 11636 +0.002s ... 0.156s
#11 got single benchmarks 11636 +0.008s ... 0.164s
#12 getting avg benchmarks for device 11633 +0.002s ... 0.165s
#13 got single benchmarks 11633 +0.01s ... 0.175s
#14 got avg benchmarks for devices +0s ... 0.175s
#15 min, max, avg, median took s +0.105s ... 0.28s
#16 before gaming benchmark output +0s ... 0.28s
#17 Got 159 rows for game benchmarks. +0.021s ... 0.301s
#18 composed SQL query for gamebenchmarks +0s ... 0.301s
#19 got data and put it in $dataArray +0.007s ... 0.308s
#20 benchmarks composed for output. +0.022s ... 0.33s
#21 calculated avg scores. +0s ... 0.33s
#22 return log +0.002s ... 0.332s
Teilen Sie diesen Artikel, um uns zu unterstützen. Jeder Link hilft!
Autor: Klaus Hinum, 8.09.2017 (Update: 1.07.2023)
 Deutsch
 English
 Español
 Français
 Italiano
 Nederlands
 Polski
 Português
 Русский
 Türkçe
 Svenska
 Chinese
 Magyar