AMD Ryzen 7 3800XT Desktop CPU im Test - Matisse-Refresh für den Sockel AM4
Die Zen2-Architektur kennen wir nun schon ziemlich genau ein Jahr. Die Vorteile des Chiplet-Designs liegen auf der Hand und bevor Zen3 als Nachfolger Zen2 beerbt hat AMD drei neue Prozessoren auf Basis der Zen2-Architektur vorgestellt. Beim Flaggschiff, dem AMD Ryzen 9 3950X, bleibt alles beim Alten, wenngleich beim 12-, 8-, und dem 6-Kerner Modifikationen am Takt vorgenommen wurden. Im Namensschema werden die neuen Ryzen-Modelle mit einem XT versehen, was auf die Refesh-CPUs hindeutet.
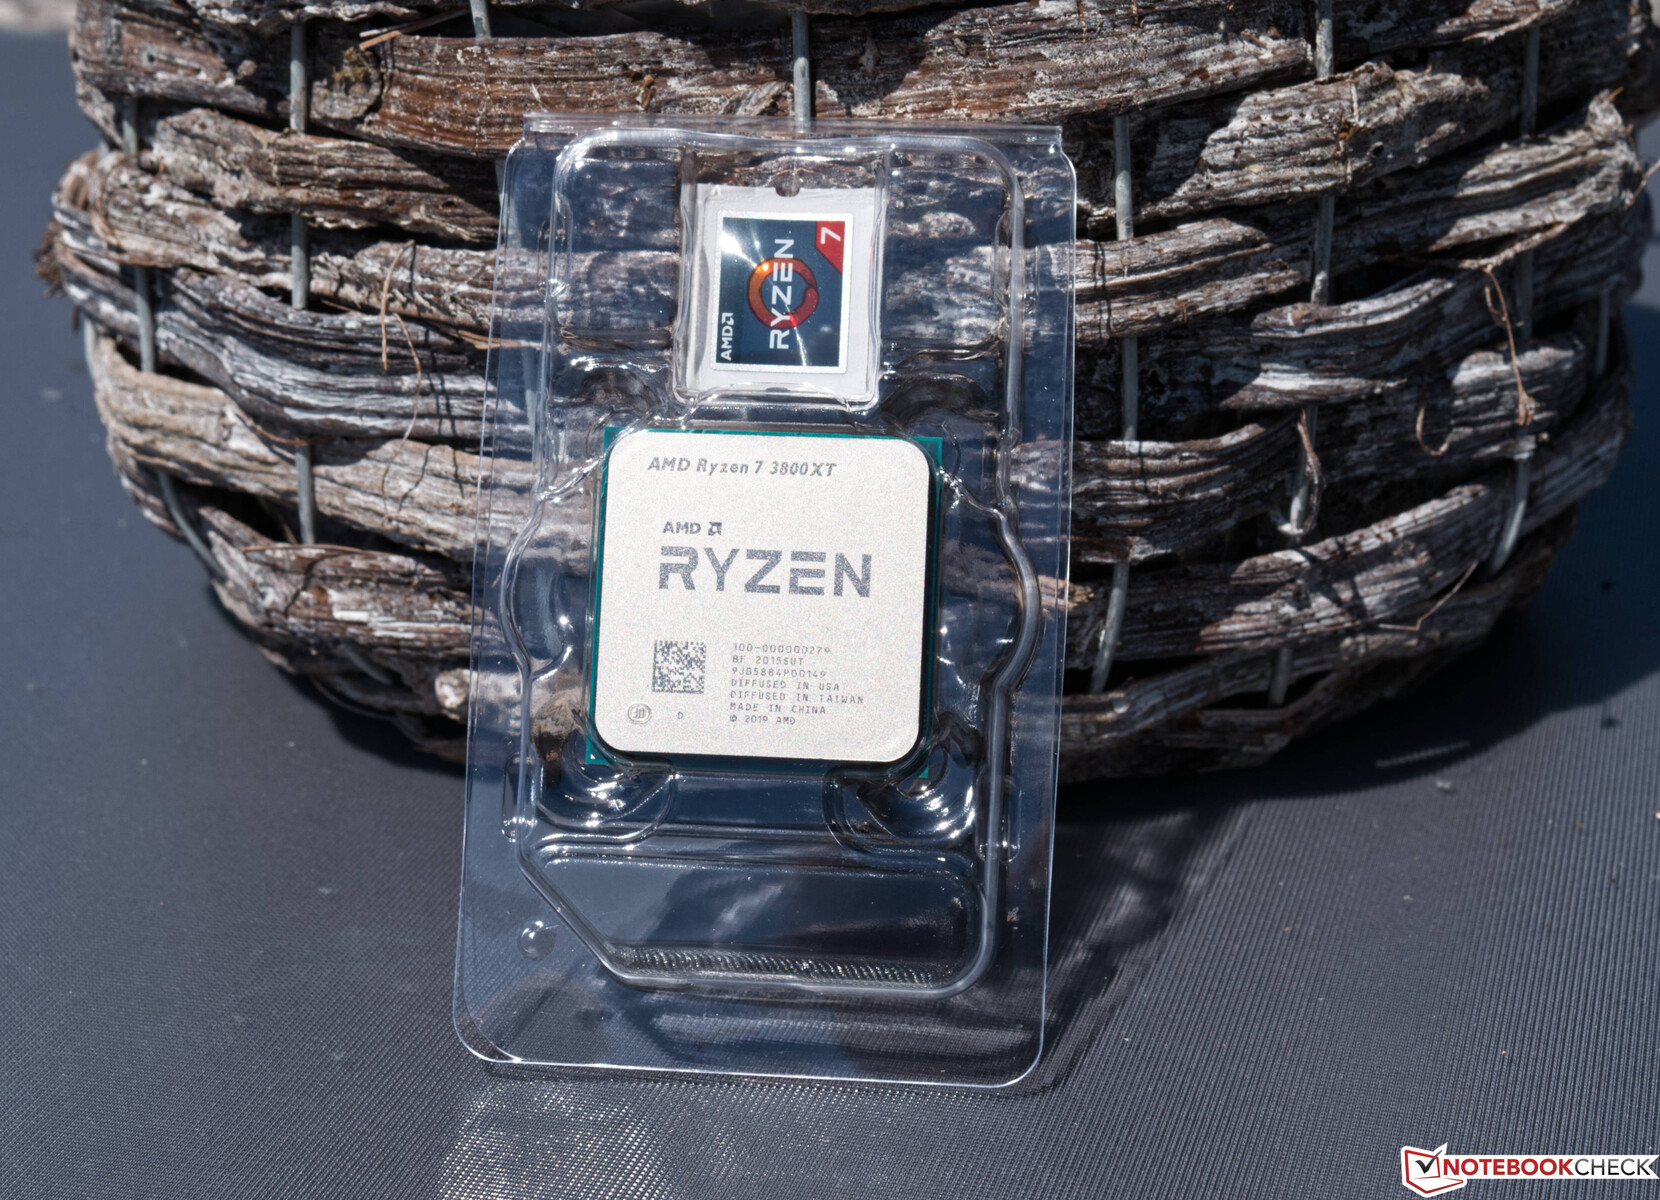
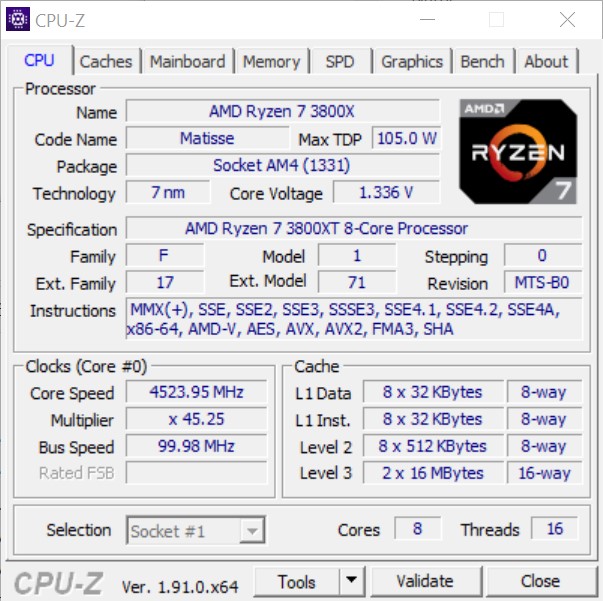
Im Test haben wir uns den AMD Ryzen 7 3800XT mit seinen 8-Kernen und 16-Threads genauer angesehen und gegen aktuelle Modelle aus den eigenen Reihen antreten lassen. Aber auch aktuelle Intel-Prozessoren dienen als Exempel für einen direkten Vergleich. Beim Ryzen 7 3800XT verändert AMD den Basistakt im Vergleich zum Ryzen 7 3800X allerdings nicht. Nur der Boost-Takt wird um 200 MHz angehoben, sodass nun 4,7 GHz erreicht werden können. Beim Ryzen 5 3600XT und dem Ryzen 9 3900XT beträgt der Zuwachs des maximalen Boost sogar nur 100 MHz, was den Leistungsunterschied zu den non-XT-Modellen schmälert.
Preislich liegt unser Sample bei 419 Euro. Gleichwohl verlangt AMD für den Ryzen 5 3600XT 259 Euro, wenngleich beim 12-Kerner schon 529 Euro fällig werden. Die Preise beinhalten schon die für Deutschland gültige Umsatzsteuer.
Die AMD-Ryzen-Prozessoren im Überblick
| Modell | Kerne / Threads | Basistakt | Turbotakt | L3-Cache | TDP | Launch-Preis |
|---|---|---|---|---|---|---|
| Ryzen R9 3950X | 16/32 | 3,5 GHz | 4,7 GHz | 64 MB | 105 Watt | 819 Euro |
| Ryzen R9 3900XT | 12/24 | 3,8 GHz | 4,7 GHz | 64 MB | 105 Watt | 529 Euro |
| Ryzen R9 3900X | 12/24 | 3,8 GHz | 4,6 GHz | 64 MB | 105 Watt | 529 Euro |
| Ryzen R7 3800XT | 8/16 | 3,9 GHz | 4,7 GHz | 32 MB | 105 Watt | 419 Euro |
| Ryzen R7 3800X | 8/16 | 3,9 GHz | 4,5 GHz | 32 MB | 105 Watt | 429 Euro |
| Ryzen R7 3700X | 8/16 | 3,6 GHz | 4,4 GHz | 32 MB | 65 Watt | 349 Euro |
| Ryzen R5 3600XT | 6/12 | 3,8 GHz | 4,5 GHz | 32 MB | 95 Watt | 259 Euro |
| Ryzen R5 3600X | 6/12 | 3,8 GHz | 4,4 GHz | 32 MB | 95 Watt | 265 Euro |
| Ryzen R5 3600 | 6/12 | 3,6 GHz | 4,2 GHz | 32 MB | 65 Watt | 209 Euro |
| Ryzen R3 3300X | 4/8 | 3,8 GHz | 4,3 GHz | 16 MB | 65 Watt | 129 Euro |
| Ryzen R3 3100 | 4/8 | 3,6 GHz | 3,9 GHz | 16 MB | 65 Watt | 109 Euro |
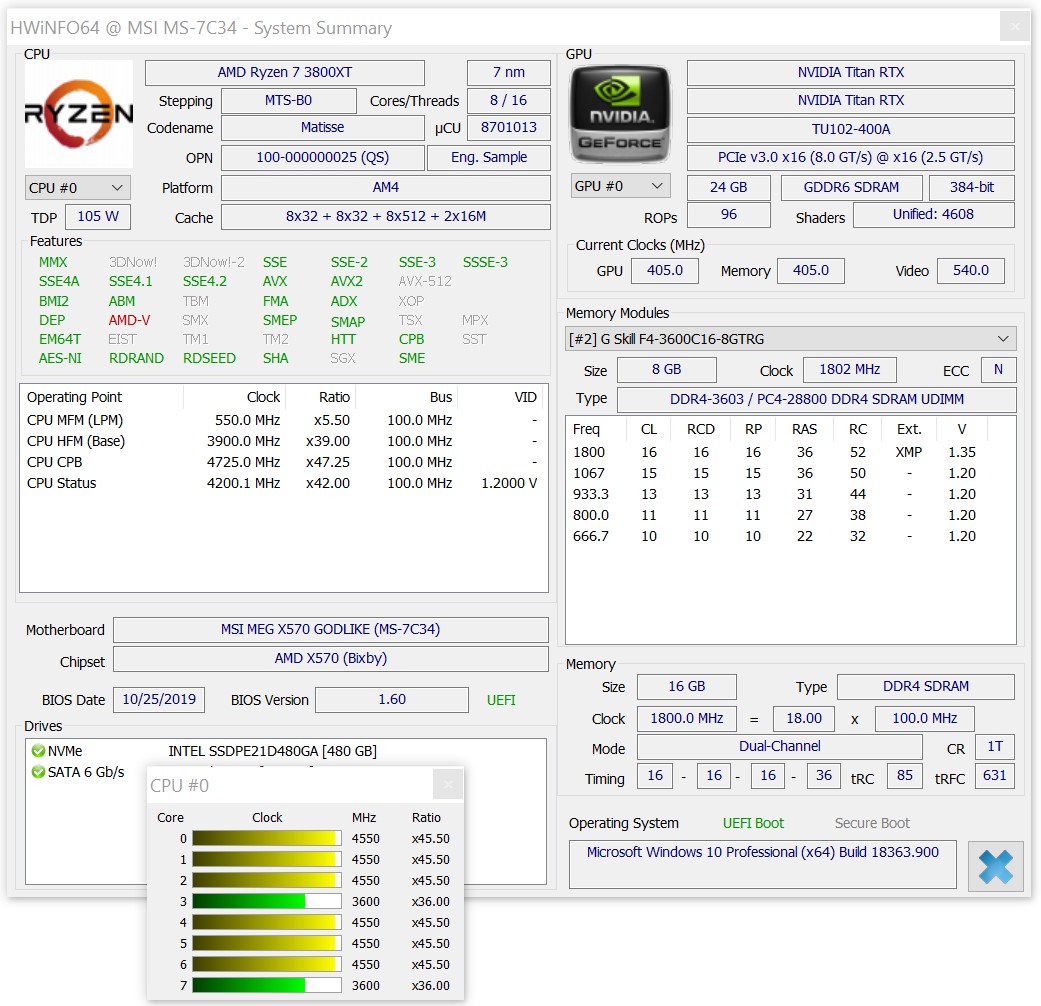
Details zu unserem Testsystem
Für die folgenden Benchmarks und Tests nutzen wir folgendes System:
- Raijintek Pean Benchtable
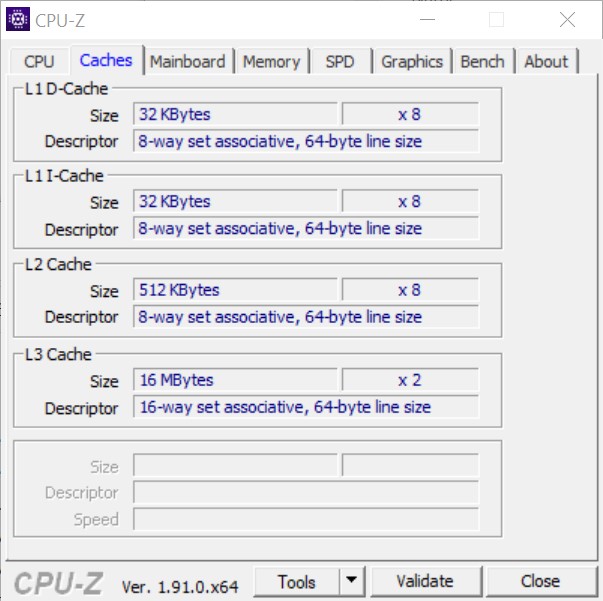
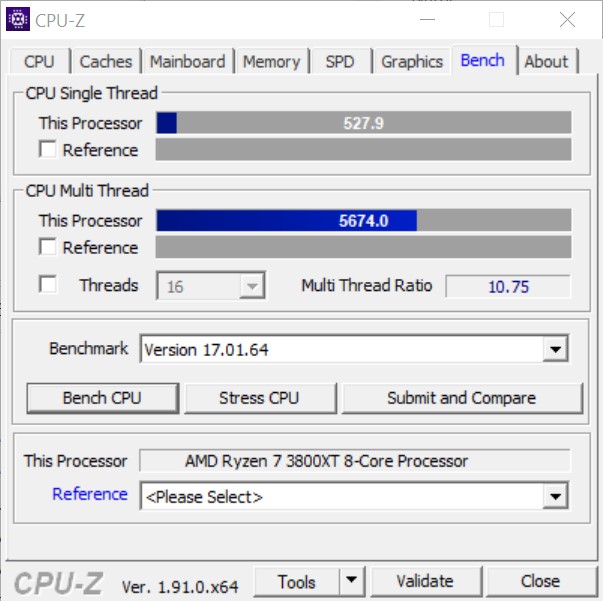
- AMD Ryzen 7 3800XT
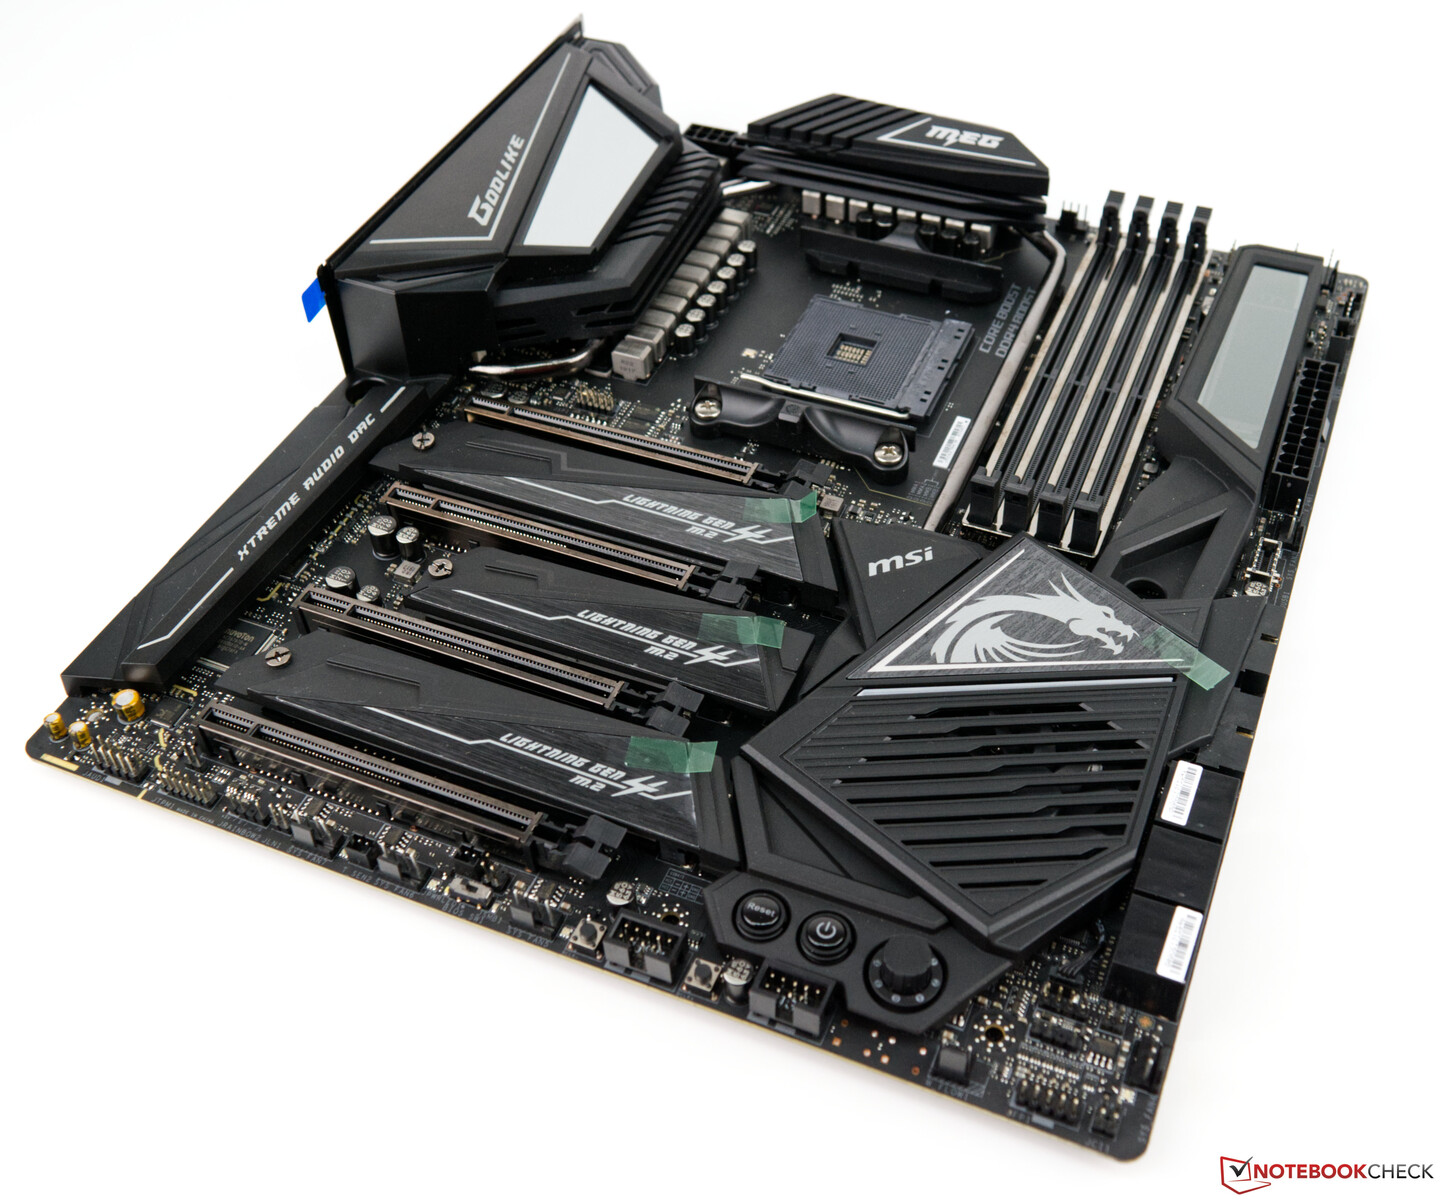
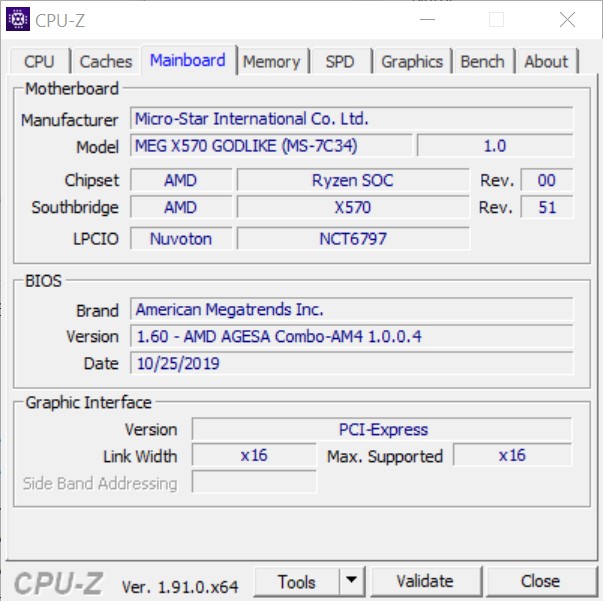
- MSI MEG X570 Godlike
- Alphacool Eisbear 280 AiO
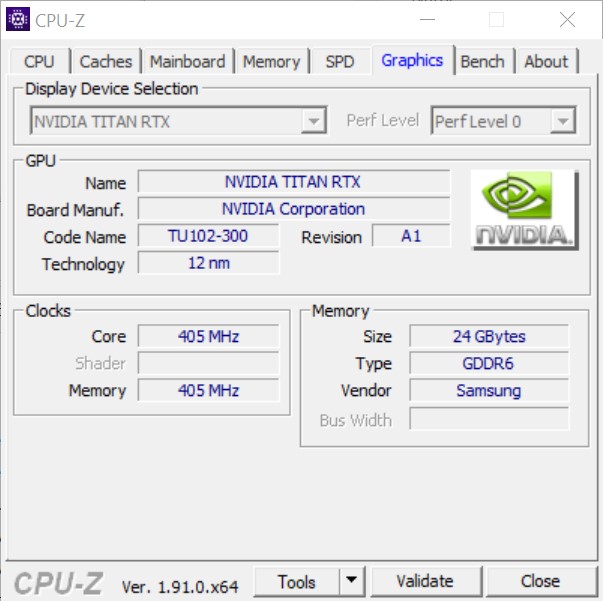
- Nvidia Titan RTX
- Corsair RM 1000X Netzteil
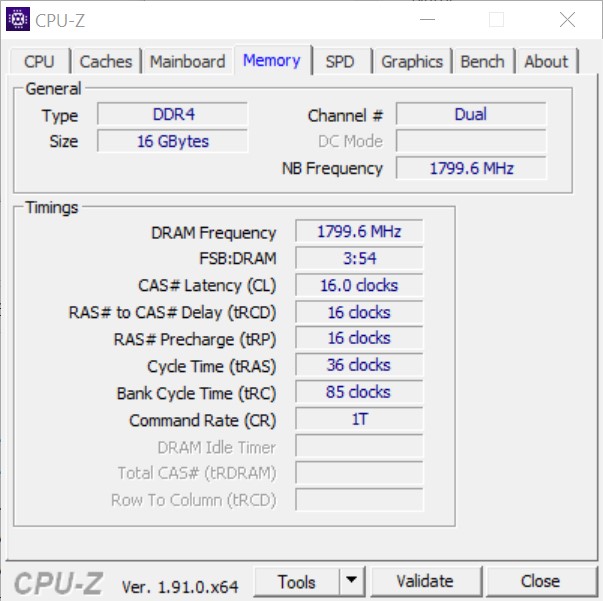
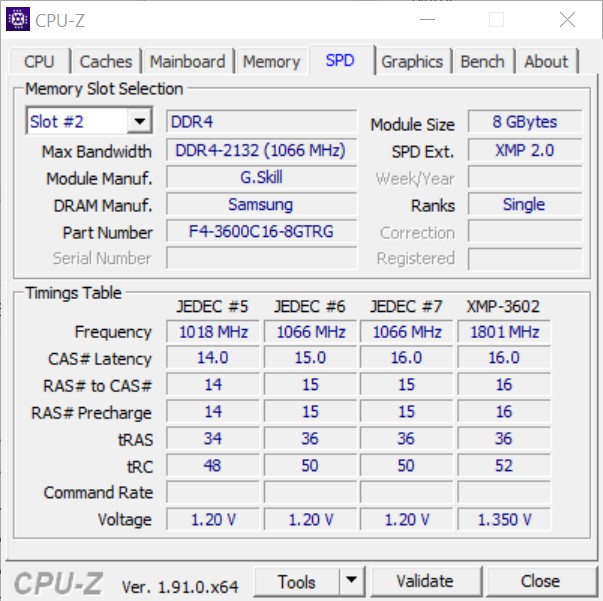
- G-Skill Trident Z Royal gold DDR4-3600 Speicherkit 2 x 8 GB, eingestellt auf DDR4-3600 CL16-16-16-36
- Intel Optane 905P 480GB PCIe-SSD
- Microsoft Windows 10 Professional 64-Bit (Version 1909)
Wir bedanken uns an dieser Stelle bei Caseking, für die Leihgabe des Raijintek Pean welches zusätzlich mit Lasergravuren individualisiert wurde. Von AMD direkt stammt das Mainboard und der Arbeitsspeicher, welches zusammen im Pressekit zum Release der Zen2-Prozessoren AMD Ryzen 9 3900X und AMD Ryzen 7 3700X enthalten war. Als Kühlung nutzen wir die Alphacool Eisbear 280, die uns Alphacool zur Verfügung stellt.
Prozessor-Benchmarks
Bei den reinen CPU-Benchmarks schlägt der AMD Ryzen 7 3800XT den Intel Core i7-9700K. Gleichwohl ist dieser Vergleich, den AMD selbst in seinem Product-Briefing verwendet, unsere Ansicht nach nicht ganz fair, denn der Core i7-9700K bietet nur 8 Threads bei 8 Kernen. Vielmehr lohnt sich der Vergleich mit einem Intel Core i9-9900K, da dieser preislich ähnlich aufgestellt ist. Auch hier hat der Ryzen 7 3800XT die Nase vorn, wenngleich der Punkt für die bessere Single-Core-Leistung an Intel geht. Mit einem Intel Core i9-10900K kann es der Ryzen 7 3800XT allerdings nicht aufnehmen. Der extrem hohe Takt des Intel-Flaggschiffes in Verbindung mit 10 Kernen sorgt für eine bessere Performance, die allerdings auch ihre Nachteile mit sich bringt (Stichwort: TDP).
Der AMD Ryzen 7 3800X hatte es bislang schon schwer seine Daseinsberechtigung neben dem deutlich sparsameren Ryzen 7 3700X zu bestätigen. Aufgrund des nun höheren Boost-Takt wird die Rolle des Ryzen 7 3800XT nun etwas deutlicher, wenngleich der Leistungsvorsprung zum Ryzen 7 3700X weiterhin nur wenige Prozente ausmacht.
| R Benchmark 2.5 - Overall mean | |
| Intel Core i5-10600K | |
| AMD Ryzen 9 3900X | |
| AMD Ryzen 3 3300X | |
| Intel Core i9-10900K | |
| AMD Ryzen 9 3950X | |
| AMD Ryzen 7 3800XT | |
| LibreOffice - 20 Documents To PDF | |
| Intel Core i9-10900K | |
| AMD Ryzen 9 3900X | |
| AMD Ryzen 9 3950X | |
| AMD Ryzen 3 3300X | |
| Intel Core i5-10600K | |
| AMD Ryzen 7 3800XT | |
| WebXPRT 3 - Overall | |
| Intel Core i9-10900K | |
| AMD Ryzen 7 3800XT | |
| AMD Ryzen 9 3950X | |
| Intel Core i5-10600K | |
| AMD Ryzen 3 3300X | |
| Mozilla Kraken 1.1 - Total | |
| Intel Core i5-10600K | |
| AMD Ryzen 3 3300X | |
| Intel Core i9-10900K | |
| AMD Ryzen 9 3950X | |
| AMD Ryzen 7 3800XT | |
* ... kleinere Werte sind besser
Belastungstest mit der Cinebench-R15-Multi-Schleife
Mit unserem Belastungstest, der Cinebench-R15-Multi-Schleife, hat der AMD Ryzen 7 3800XT keine Schwierigkeiten. Die verbaute AiO hat zusammen mit dem 280-Millimeter-Radiator keine Probleme den AMD Ryzen 7 3800XT zuverlässig zu kühlen.
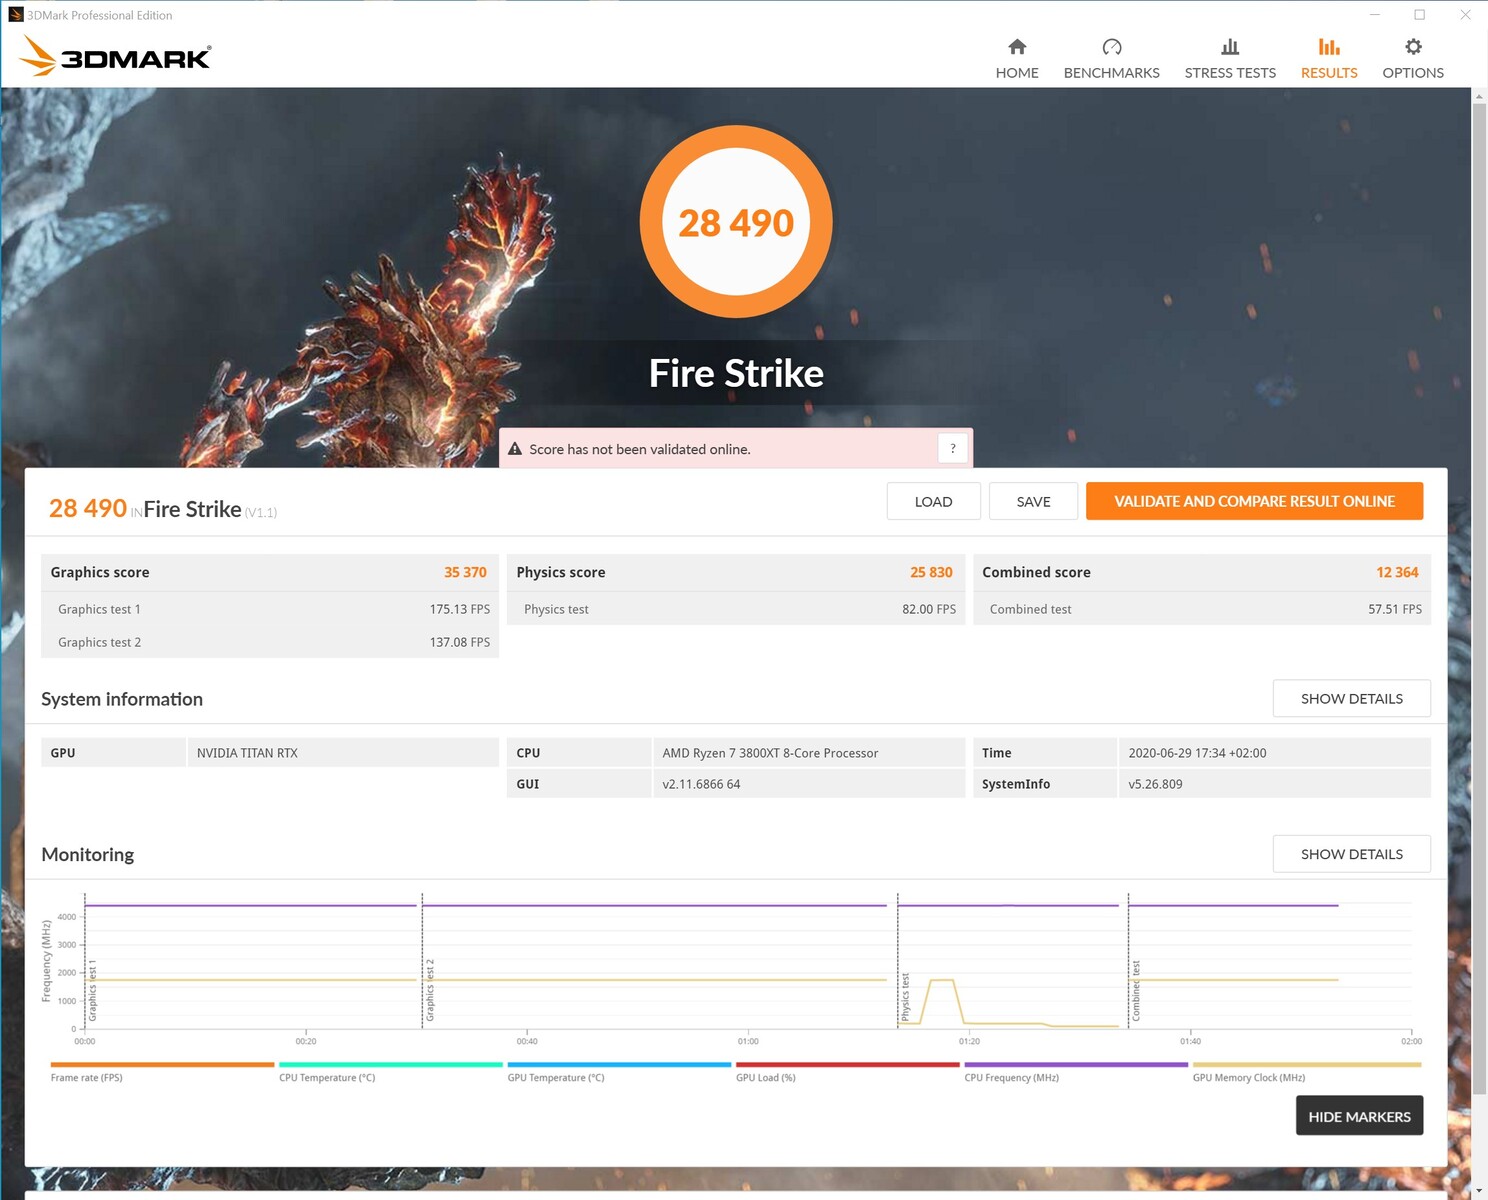
Anwendungsleistung
Viele Anwendungen skalieren mit bis zu 8 Kernen recht gut. Gleichwohl steigt die Performance mit weiteren Rechenkernen nur noch leicht, wie sich beim Vergleich mit dem AMD Ryzen 9 3950X zeigt. Nur drei Prozentpunkte liegt das deutlich teurere Flaggschiff vor dem Ryzen 7 3800XT. Bei den synthetischen 3D-Benchmarks liegen diese sogar gleichauf. Selbst der preiswerte Ryzen 3 3300X kann hier bei gleicher GPU-Bestückung mithalten. Intel schafft es hingegen hier einen leichten Vorsprung herauszuholen. Dieser ist aber sehr gering und fällt in unserem Fall nicht spürbar ins Gewicht.
Gaming Performance
Für ein reines Gaming-System eignet sich der AMD Ryzen 7 3800XT durchaus. Dennoch sollte man sich bewusst sein, dass Intel mit den aktuellen Comet Lake S Prozessoren die besten Gaming-CPUs auf dem Markt hat. In höheren Auflösungen und mit maximalen Details schmälert sich allerdings der Vorsprung der Intel CPUs gegenüber AMDs Ryzen Modelle. In Verbindung mit unserer Nvidia Titan RTX (vergleichbar mit einer RTX 2080 Ti) lassen sich selbst modernste Titel mit maximalen Details genießen. Die CPU rückt jedoch mit steigender Grafiklast in den Hintergrund. Wer zugleich noch streamen möchte, wird aber die 8 Kerne nicht mehr missen.
| Borderlands 3 | |
| 1280x720 Very Low Overall Quality (DX11) | |
| Intel Core i9-10900K | |
| Intel Core i5-10600K | |
| Intel Core i9-9900KS, Nvidia Titan RTX | |
| AMD Ryzen 9 3900X | |
| AMD Ryzen 9 3950X | |
| AMD Ryzen 7 3800XT | |
| AMD Ryzen 3 3300X | |
| AMD Radeon RX Vega 64 | |
| AMD Ryzen 3 3100 | |
| 1920x1080 Badass Overall Quality (DX11) | |
| Intel Core i9-10900K | |
| AMD Ryzen 7 3800XT | |
| Intel Core i5-10600K | |
| Intel Core i9-9900KS, Nvidia Titan RTX | |
| AMD Ryzen 9 3900X | |
| AMD Ryzen 9 3950X | |
| AMD Ryzen 3 3300X | |
| AMD Ryzen 3 3100 | |
| AMD Radeon RX Vega 64 | |
| Metro Exodus | |
| 1280x720 Low Quality AF:4x | |
| Intel Core i9-10900K | |
| Intel Core i5-10600K | |
| Intel Core i9-9900KS, Nvidia Titan RTX | |
| AMD Ryzen 7 3800XT | |
| AMD Ryzen 9 3900X | |
| AMD Ryzen 3 3300X | |
| AMD Ryzen 9 3950X | |
| AMD Ryzen 3 3100 | |
| 1920x1080 Ultra Quality AF:16x | |
| Intel Core i9-10900K | |
| Intel Core i5-10600K | |
| Intel Core i9-9900KS, Nvidia Titan RTX | |
| AMD Ryzen 3 3300X | |
| AMD Ryzen 7 3800XT | |
| AMD Ryzen 9 3900X | |
| AMD Ryzen 9 3950X | |
| AMD Ryzen 3 3100 | |
| X-Plane 11.11 | |
| 1280x720 low (fps_test=1) | |
| Intel Core i9-10900K | |
| Intel Core i9-9900KS, Nvidia Titan RTX | |
| Intel Core i5-10600K | |
| AMD Ryzen 7 3800XT | |
| AMD Ryzen 9 3900X | |
| AMD Ryzen 9 3950X | |
| AMD Ryzen 3 3300X | |
| AMD Ryzen 3 3100 | |
| AMD Radeon RX Vega 64 | |
| AMD Radeon RX Vega 64 | |
| 1920x1080 high (fps_test=3) | |
| Intel Core i9-9900KS, Nvidia Titan RTX | |
| Intel Core i9-10900K | |
| Intel Core i5-10600K | |
| AMD Ryzen 7 3800XT | |
| AMD Ryzen 9 3900X | |
| AMD Ryzen 9 3950X | |
| AMD Ryzen 3 3300X | |
| AMD Ryzen 3 3100 | |
| AMD Radeon RX Vega 64 | |
| AMD Radeon RX Vega 64 | |
| Dota 2 Reborn | |
| 1280x720 min (0/3) fastest | |
| Intel Core i9-10900K | |
| Intel Core i9-9900KS, Nvidia Titan RTX | |
| Intel Core i5-10600K | |
| AMD Ryzen 7 3800XT | |
| AMD Radeon RX Vega 64 | |
| AMD Ryzen 9 3900X | |
| AMD Radeon RX Vega 64 | |
| AMD Ryzen 9 3950X | |
| AMD Ryzen 3 3300X | |
| AMD Ryzen 3 3100 | |
| 1920x1080 ultra (3/3) best looking | |
| Intel Core i9-10900K | |
| Intel Core i9-9900KS, Nvidia Titan RTX | |
| Intel Core i5-10600K | |
| AMD Radeon RX Vega 64 | |
| AMD Ryzen 7 3800XT | |
| AMD Ryzen 9 3900X | |
| AMD Radeon RX Vega 64 | |
| AMD Ryzen 9 3950X | |
| AMD Ryzen 3 3300X | |
| AMD Ryzen 3 3100 | |
Intel Core i9-10900K + Nvidia Titan RTX
| min. | mittel | hoch | max. | QHD | 4K | |
|---|---|---|---|---|---|---|
| The Witcher 3 (2015) | 388 | 348 | 252 | 139 | 103 | |
| Dota 2 Reborn (2015) | 169.8 | 151.6 | 151.2 | 139.7 | 138.1 | |
| Final Fantasy XV Benchmark (2018) | 189 | 161 | 118 | 59.3 | ||
| X-Plane 11.11 (2018) | 131 | 118 | 96 | 82.8 | ||
| Far Cry 5 (2018) | 148 | 129 | 122 | 115 | 110 | 78 |
| Shadow of the Tomb Raider (2018) | 154 | 145 | 142 | 138 | 118 | 66.8 |
| Forza Horizon 4 (2018) | 210 | 185 | 184 | 173 | 157 | 112 |
| Far Cry New Dawn (2019) | 132 | 115 | 111 | 101 | 97 | 76 |
| Metro Exodus (2019) | 169 | 142 | 121 | 99.3 | 80.2 | 52.3 |
| Borderlands 3 (2019) | 151 | 138 | 124 | 116 | 93.1 | 52.8 |
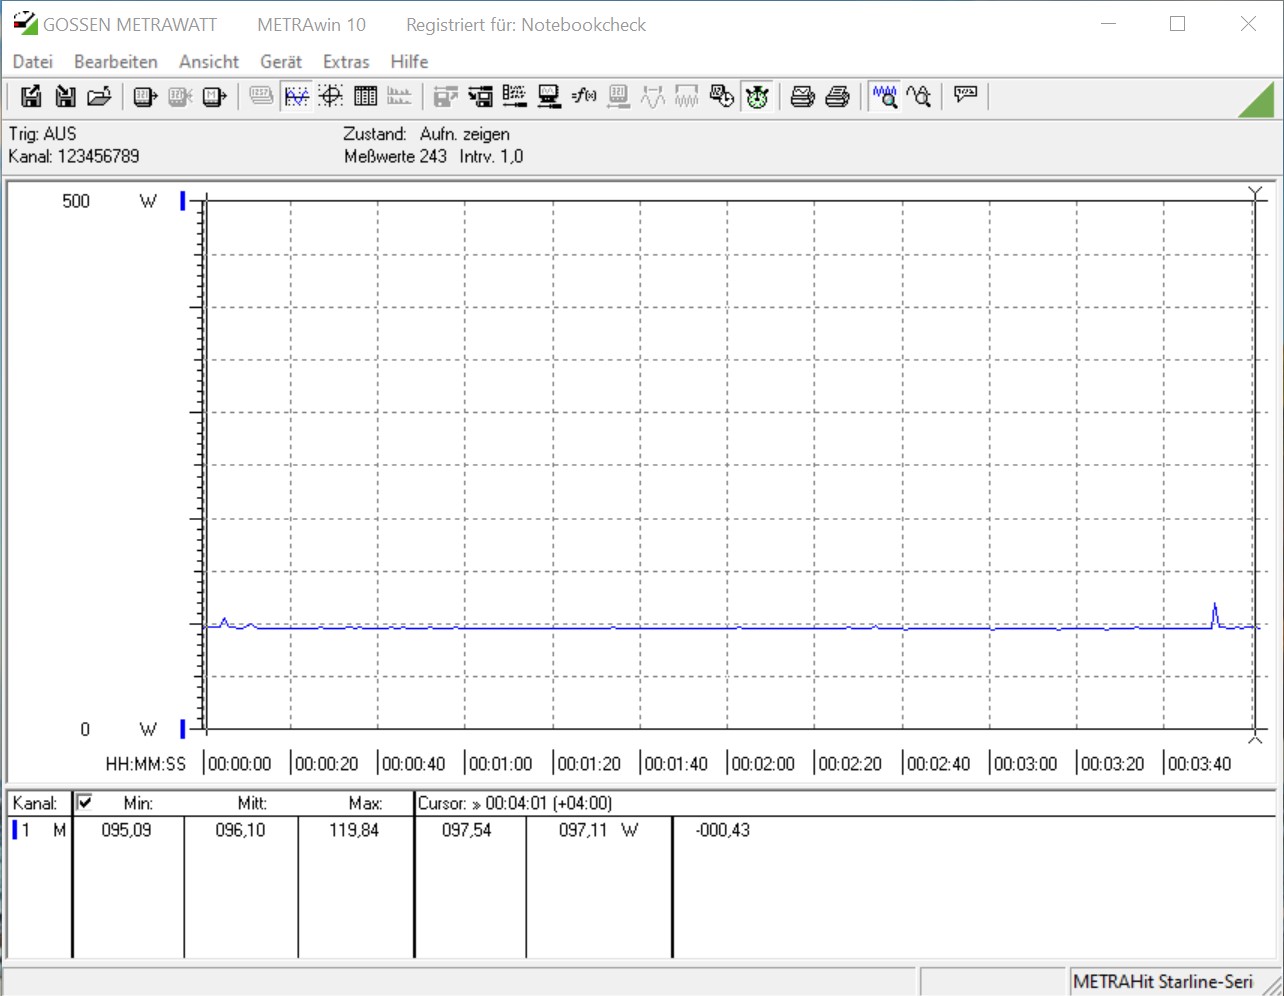
Energieverbrauch - sparsamer als Intel
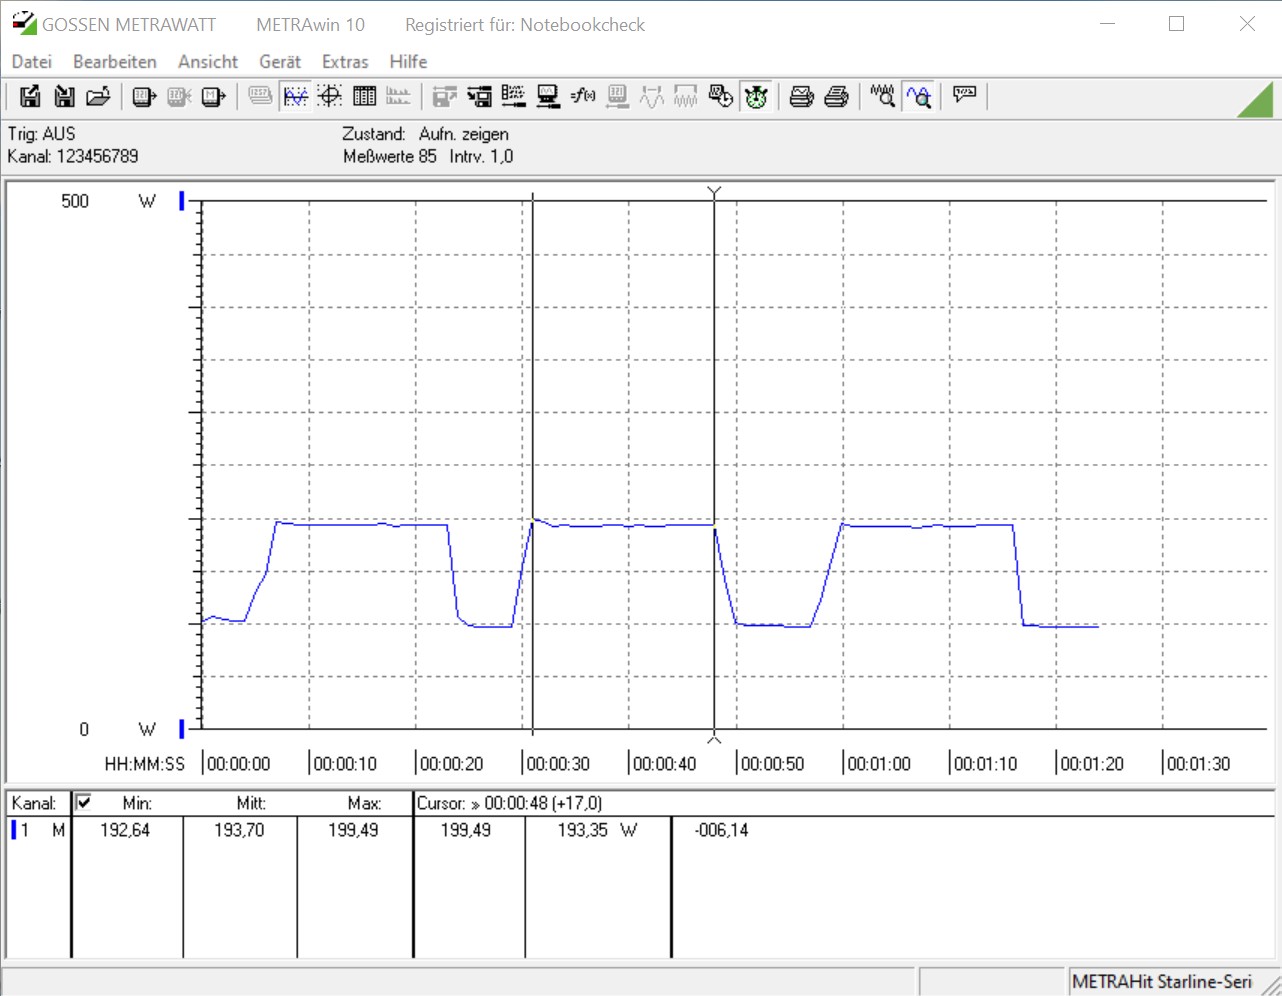
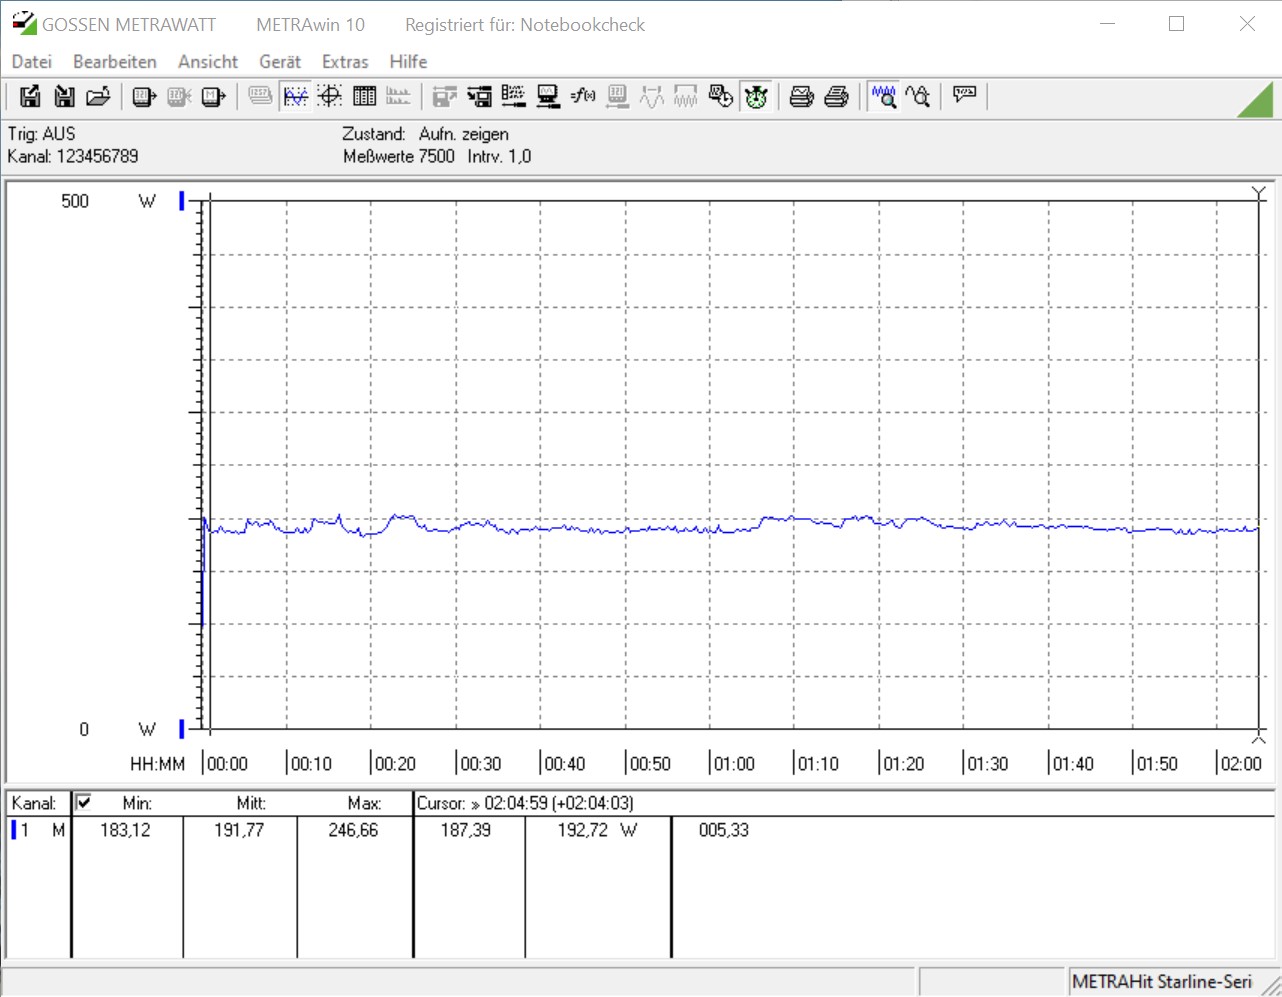
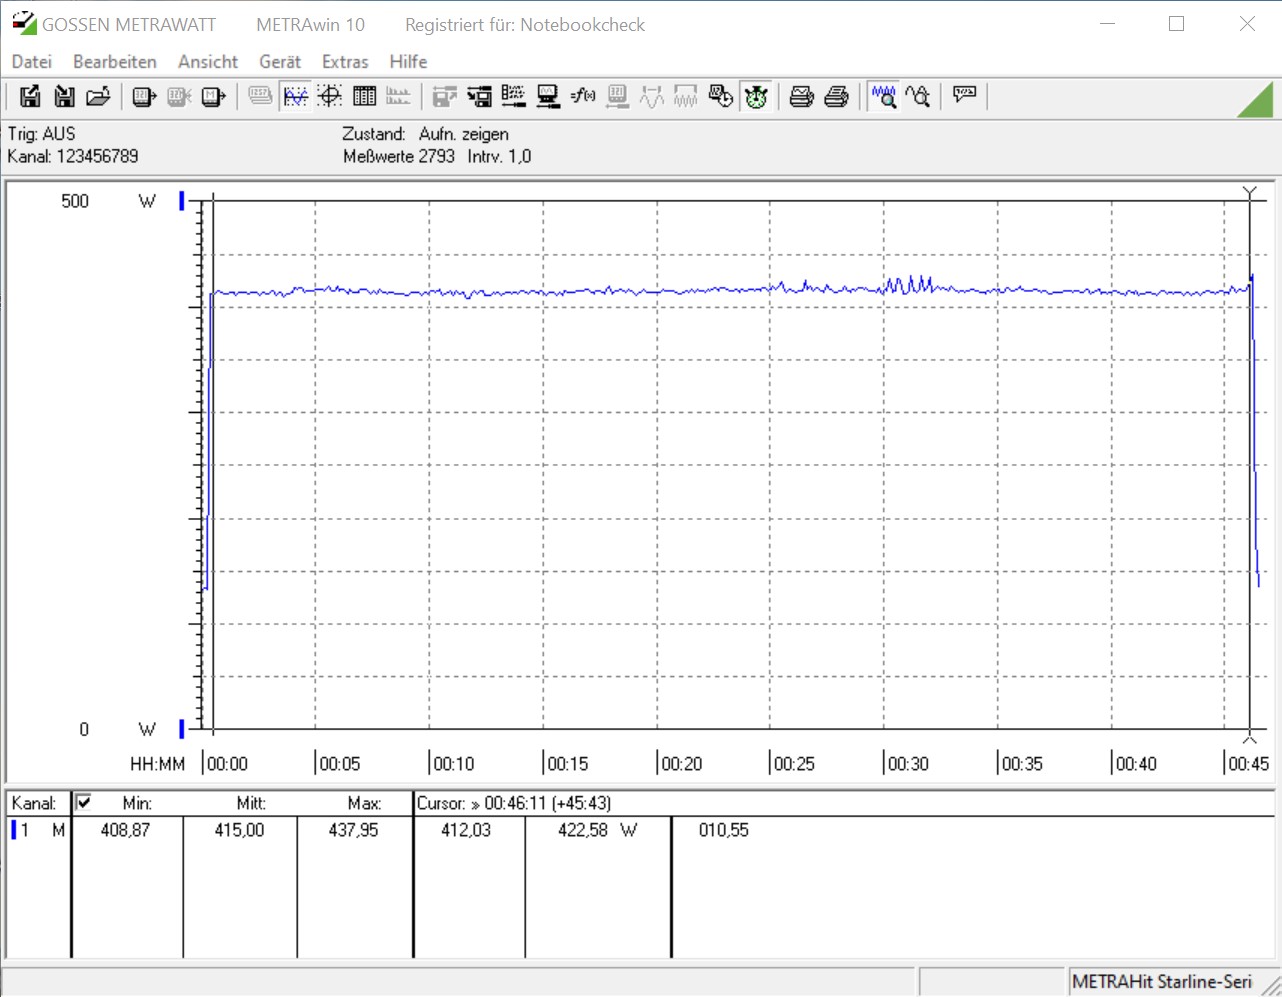
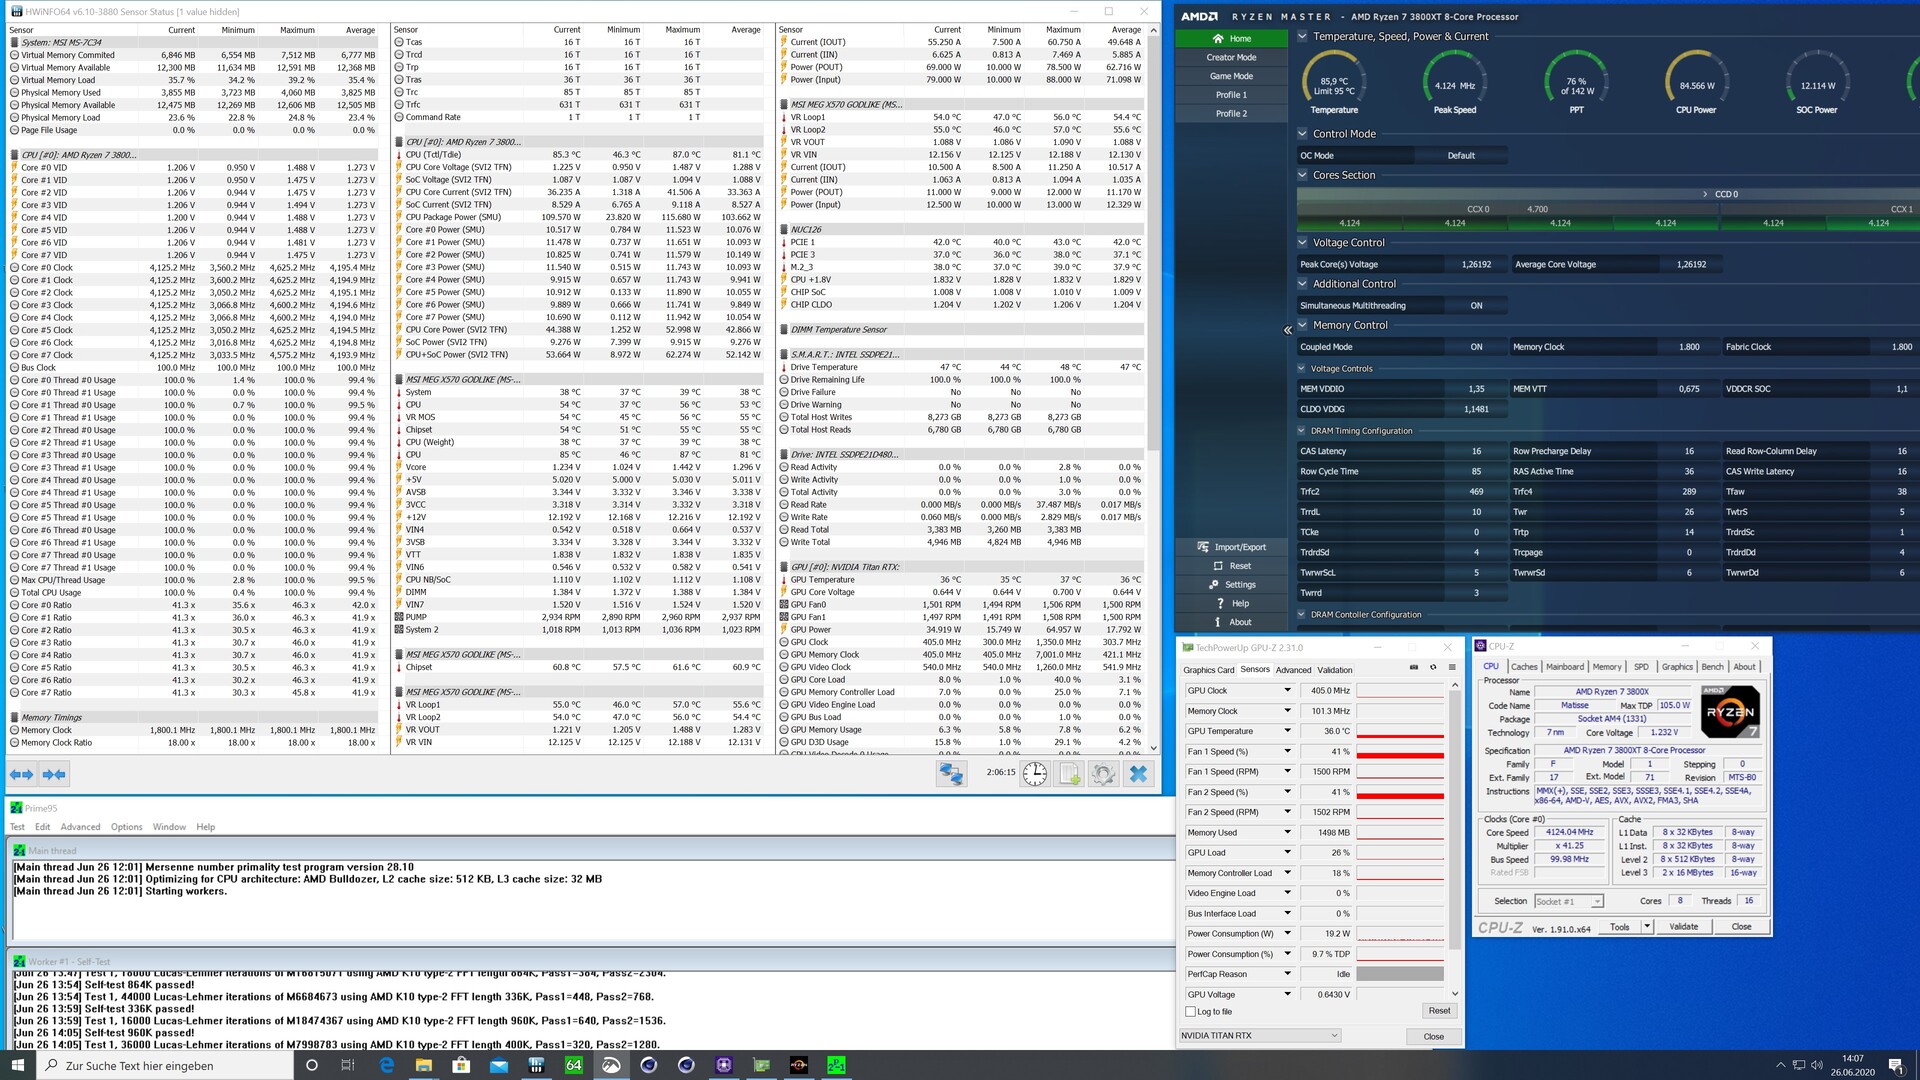
AMD gibt beim Ryzen 7 3800XT eine TDP von 105 Watt an. Diese wird jedoch auch für die beiden Ryzen 9 Modelle ausgegeben. Gleichwohl wissen wir, dass unter bestimmten Umständen diese TDP-Grenze auch überschritten werden darf. Intel macht dieses ebenfalls genauso und lässt beim Core i9-10900K sogar bis zu 250 Watt zu. Bei unserem Stresstest mit Prime95 (v.28.10) gibt uns HWiNFO maximal 115 Watt für die CPU aus. Im Durchschnitt pendelte sich der Verbrauch bei 103,7 Watt ein. Gleichwohl messen wir beim Stresstest 191,8 Watt für das gesamte System, was im Vergleich minimal weniger ist, als beim Ryzen 9 3900X. Beim Spielen klettert der Verbrauch aufgrund der zusätzlichen Belastung der GPU auf 415 Watt. Im Vergleich zu den beiden Ryzen 9 Modellen ist der Ryzen 7 3800XT hier nicht viel sparsamer.
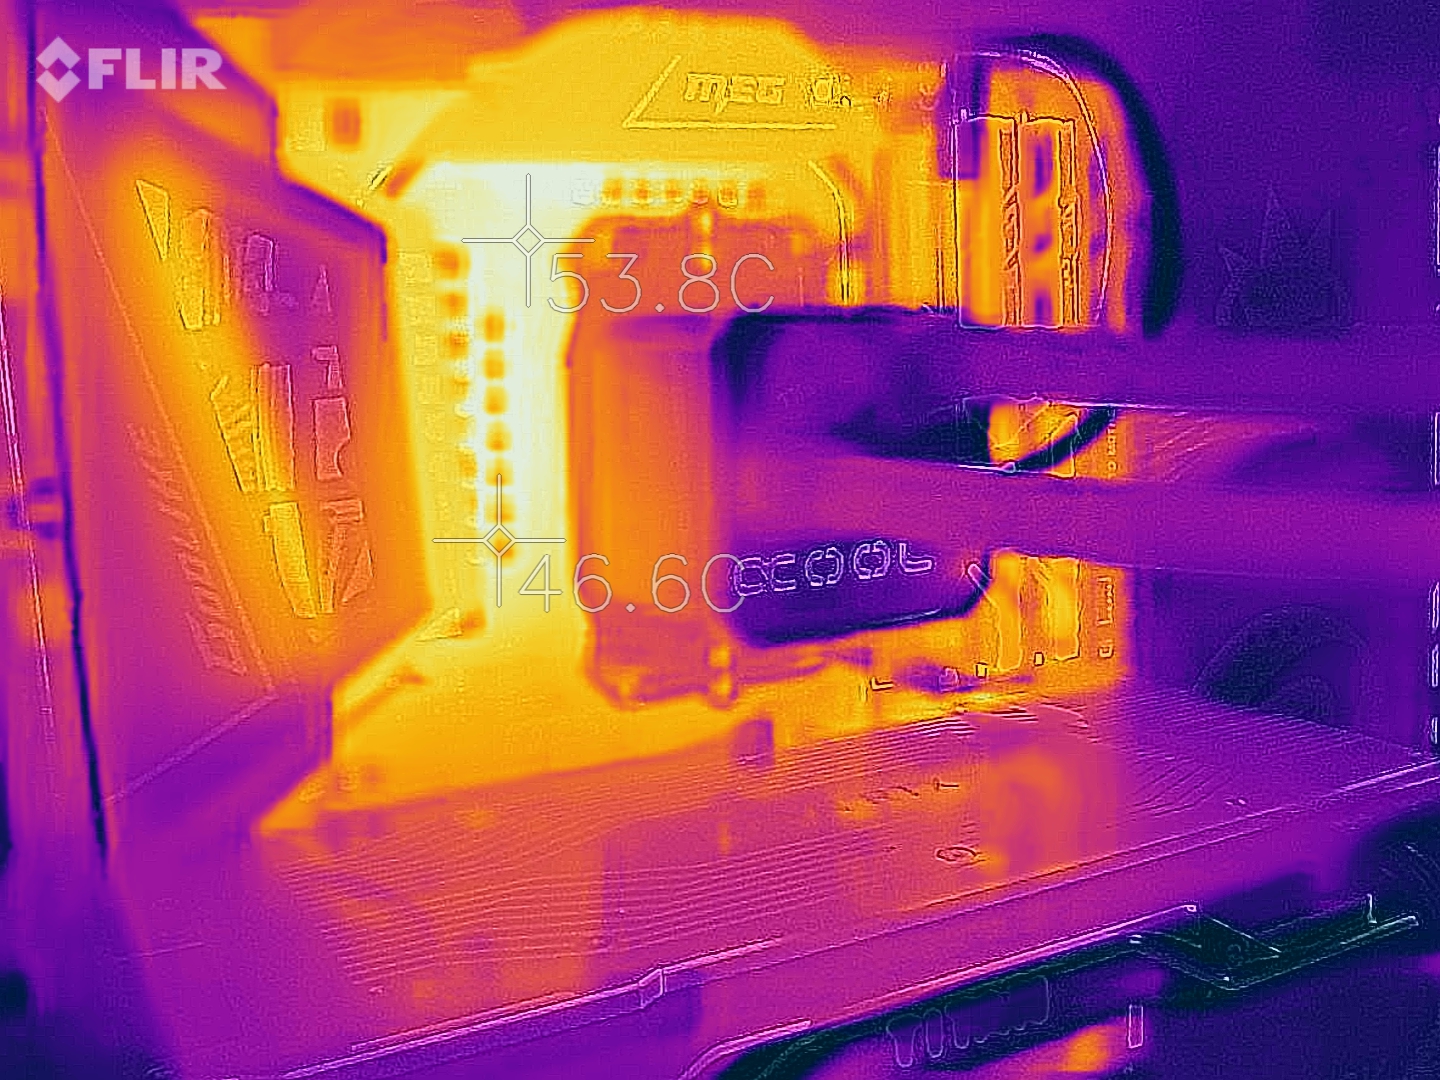
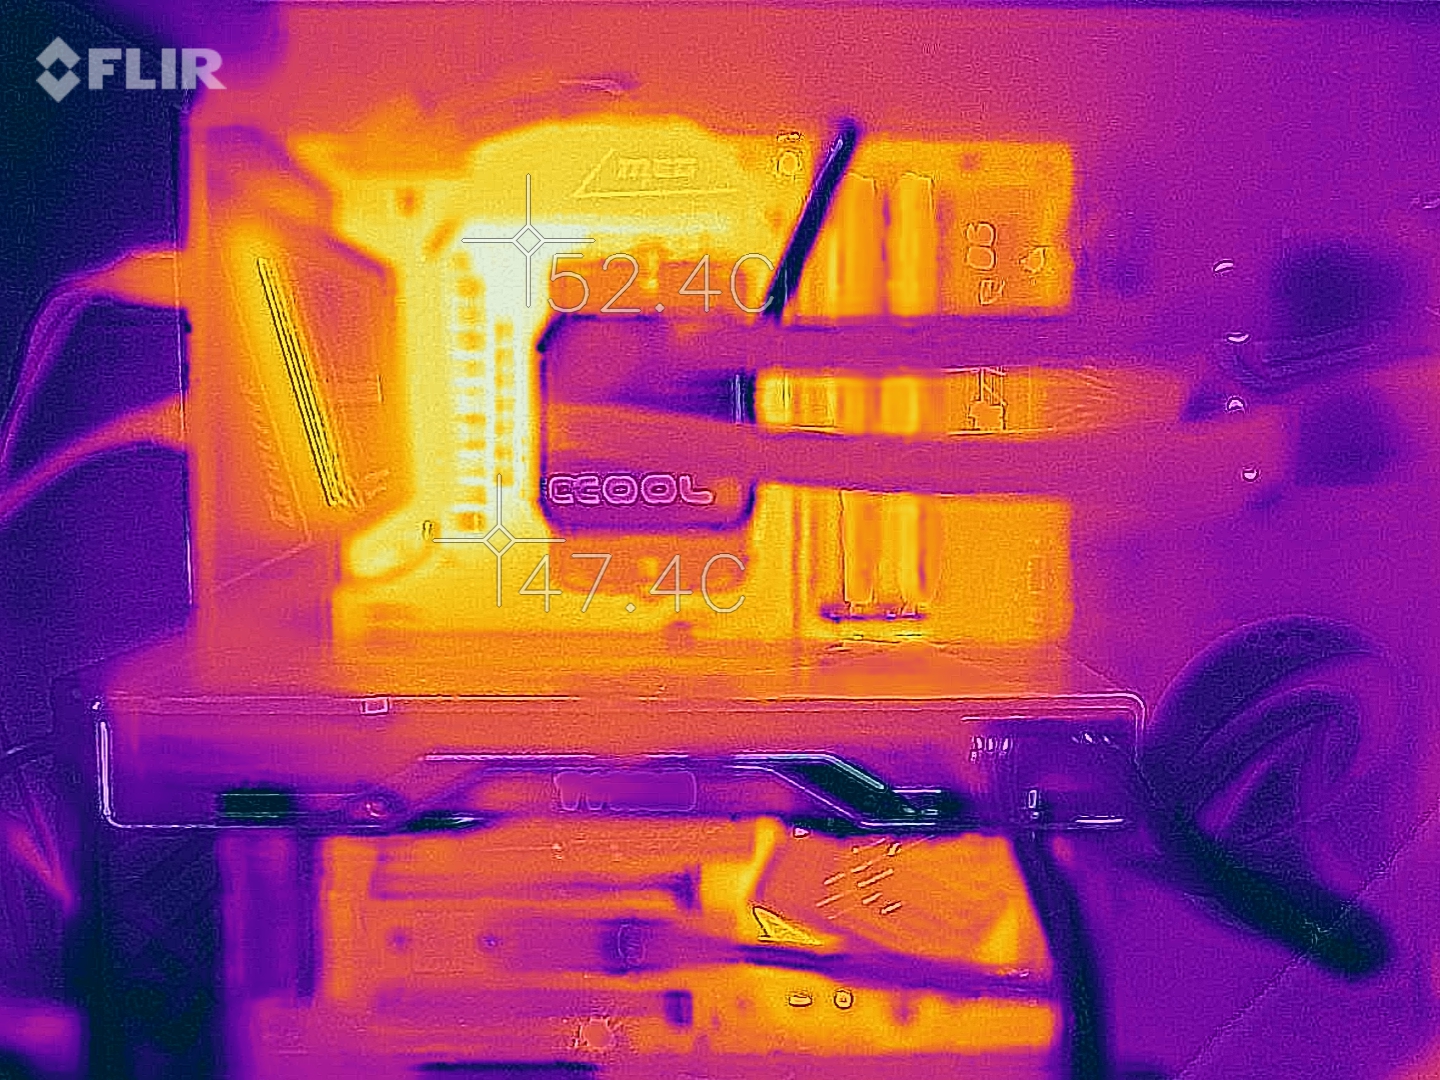
Die gemessenen CPU-Temperaturen wurden aufgrund des Gehäuses im offenen Aufbau notiert. Trotz der gut dimensionierten AiO aus dem Hause Alphacool liegt die maximale CPU-Temperatur während des Stresstests bei 87 °C. Da AMD den Ryzen 7 3800X ohne einen Lüfter verkauft sollte beim Kauf dieser CPU eine leistungsstarke Kühlung unbedingt mit eingeplant werden.
* ... kleinere Werte sind besser
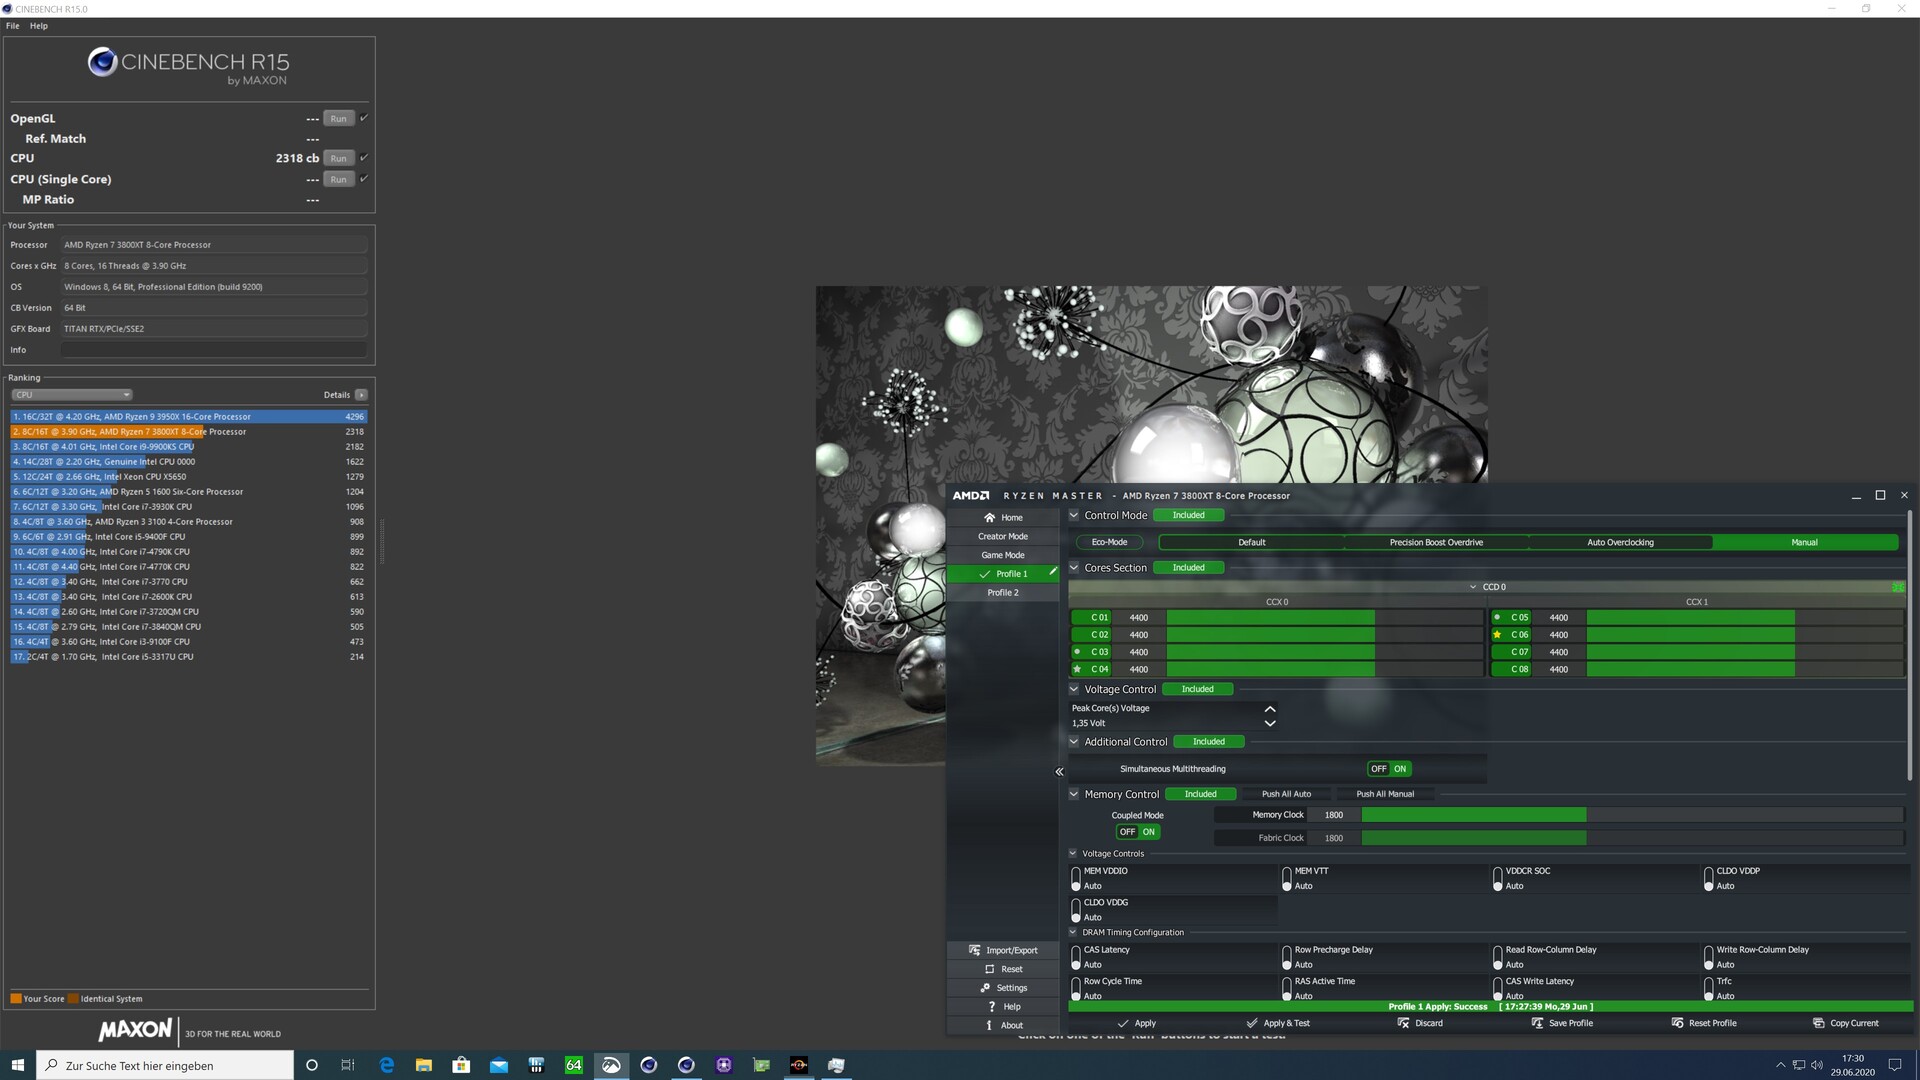
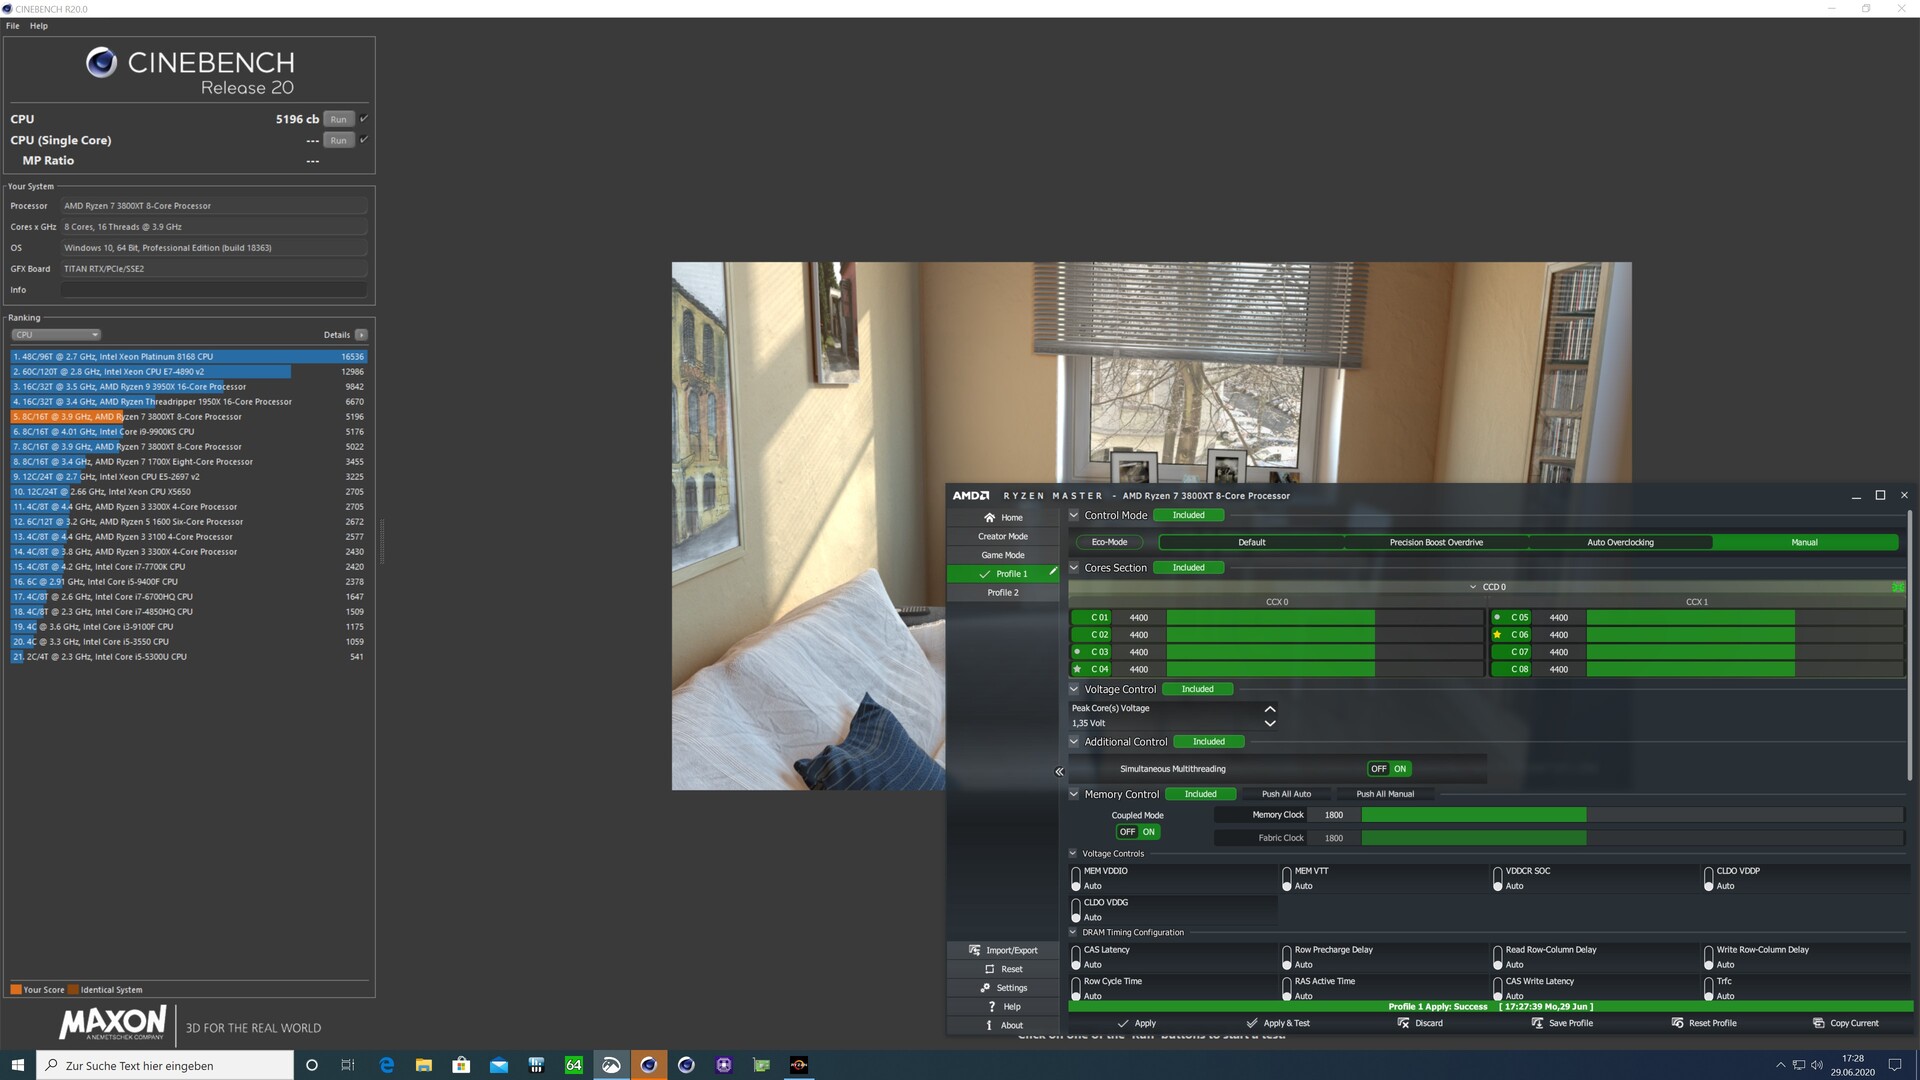
Overclocking - nicht empfehlenswert
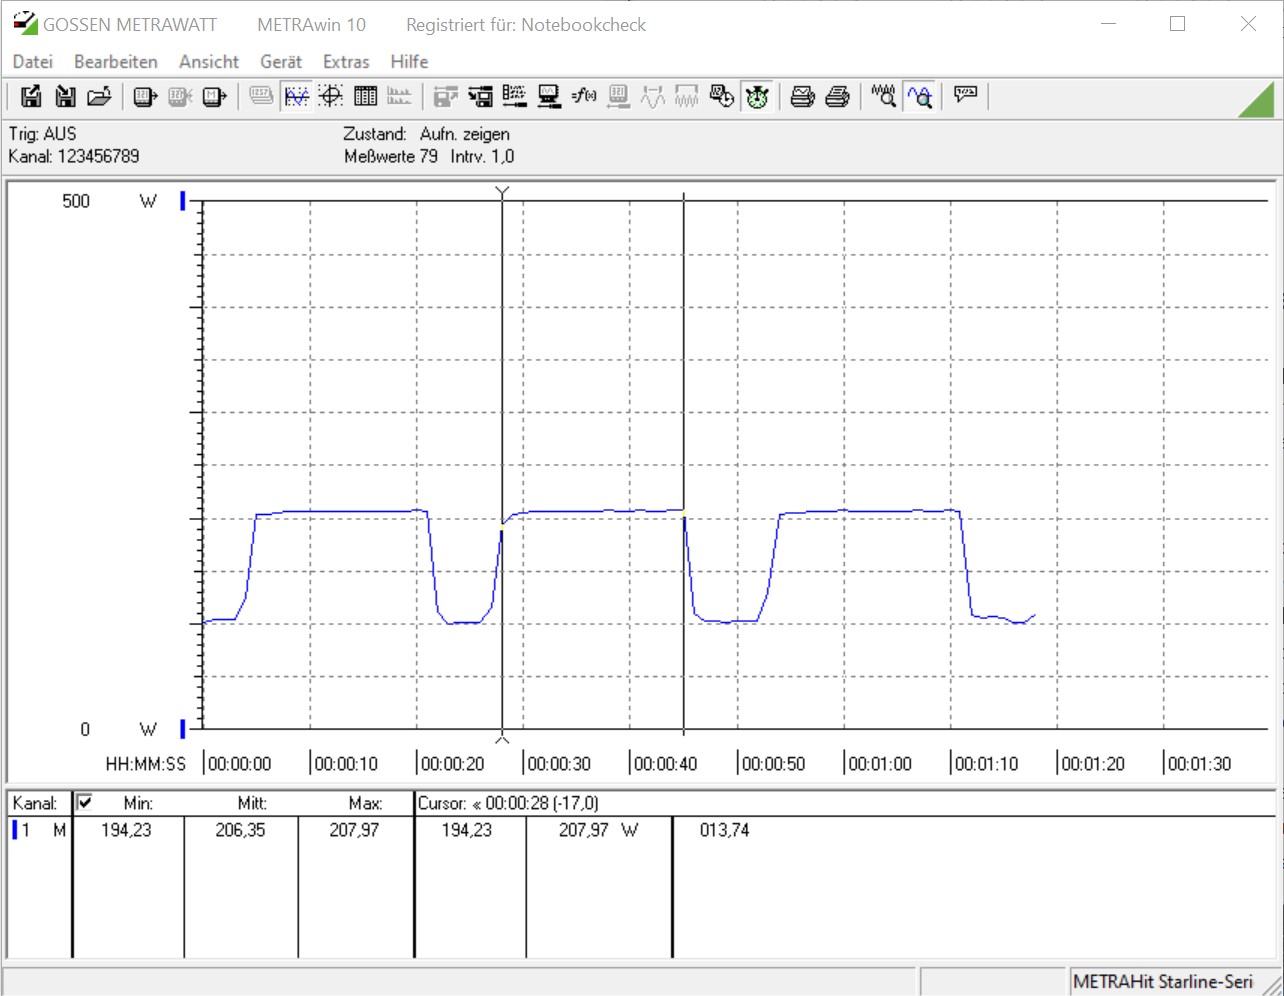
Auch wenn der AMD Ryzen 7 3800XT schon eine sehr gute Leistung liefert wollen viele mithilfe des Übertaktens noch etwas mehr aus der CPU quetschen. Mit dem Ryzen Master lassen sich die AMD Ryzen Prozessoren bequem aus dem Windows heraus übertakten. Gleichwohl sollte man wissen, dass damit sämtliche Garantieansprüche erlöschen. Des Weiteren wird PBO (Precision Boost Overdrive) deaktiviert, was den maximalen Turbo von 4,7 GHz dann nicht mehr zulässt und somit die Single-Thread-Leistung negativ beeinflusst. In unserem Fall war es möglich den AMD Ryzen 7 3800XT ohne viel Aufwand auf 4,4 GHz auf allen acht Kernen zu betreiben. Der Leistungszuwachs lässt sich messen, aber spürbar ist dieser nicht. Im gleichen Atemzug musste auch die Spannung leicht erhöht werden, was einen etwas höheren Energiebedarf zur Folge hat. Genauer gesagt stieg der Energiebedarf des Systems beim Cinebench-R15-Multi-Benchmark um 13 Watt, auf nunmehr 206 Watt an.
Für einen dauerhaften Betrieb außerhalb der vorgegebenen Spezifikationen raten wir aus den genannten Gründen ab. Der zu erwartende Leistungszuwachs ist einfach zu gering.
Pro
Contra
Fazit - Der Preis entscheidet über Sieg oder Niederlage!

Der AMD Ryzen 7 3800XT beerbt den AMD Ryzen 7 3800X, welcher bis heute einen schweren Stand hat und bislang nicht aus der Masse stechen konnte. Auch der Refresh des Ryzen 7 3800X wird mit diesen Vorurteilen leben müssen. Im Test zeigt der 8-Kerner eine gute Leistung, die sich zwischen dem Ryzen 7 3700X und dem Ryzen 9 3900X einpendelt. Das war auch so zu erwarten. Gleichwohl ist die höheren TDP gegenüber dem Ryzen 7 3700X noch immer ein Kritikpunkt, wenn die Wahl auf eine 8-Kern-CPU aus dem Hause AMD fallen soll. Die um 40 Watt höhere TDP des AMD Ryzen 7 3800XT gegenüber dem Ryzen 7 3700X spiegelt sich nicht in einem spürbaren Leistungsplus wider. Von der Erhöhung des Turbos auf bis zu 4,7 GHz profitieren vor allem Single-Thread-Anwendungen.
Der AMD Ryzen 7 3800XT ist eine schnelle Gaming-CPU, welche es aber aufgrund der Preisgestaltung weiterhin schwer haben wird Käufer zu gewinnen.
529 Euro verlangt AMD zum Release für diese CPU, was unserer Ansicht nach mindestens 100 Euro zu teuer ist, wenn man die Leistung in Relation zum Preis sieht. Der Ryzen 7 3800X ist inzwischen schon ab 310 Euro zu bekommen, was dem Ryzen 7 3800XT nicht gerade in die Karten spielt.
Im Großen und Ganzen betreibt AMD mit den XT-Prozessoren nur minimale Produktpflege. Dennoch stellt sich die Frage, warum nun diese Prozessoren noch veröffentlicht werden, da der Start von Zen3 ja in diesem Jahr noch bevorsteht, wenn man der Gerüchteküche Glauben schenkt.
