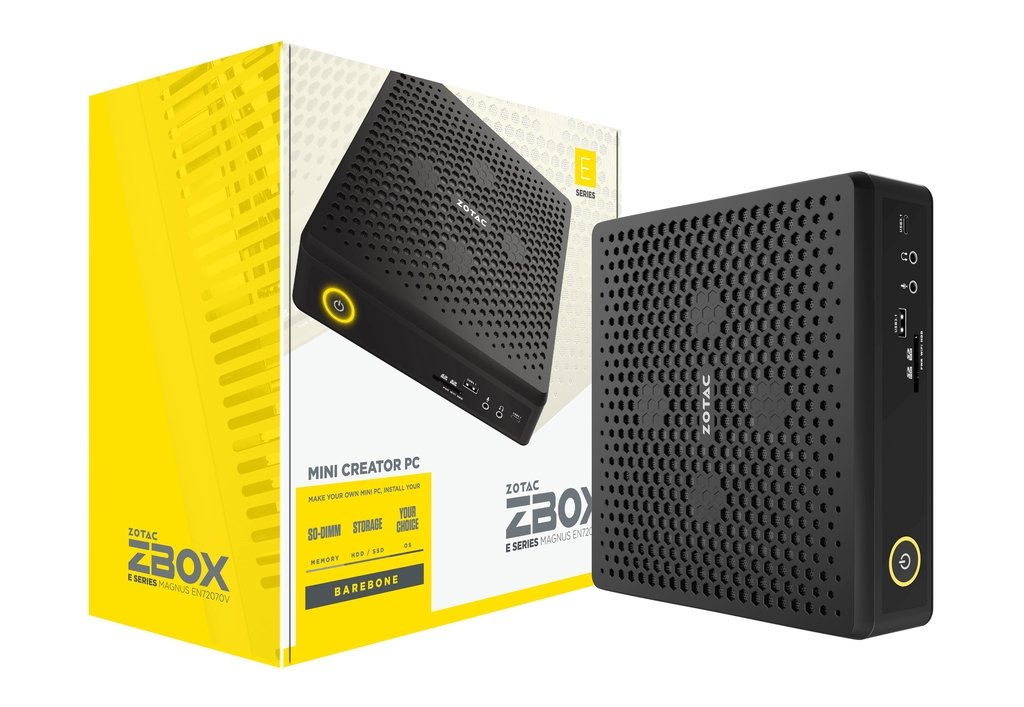
Zotac's ZBOX Magnus Mini-PC mit GeForce RTX 2080 im Test

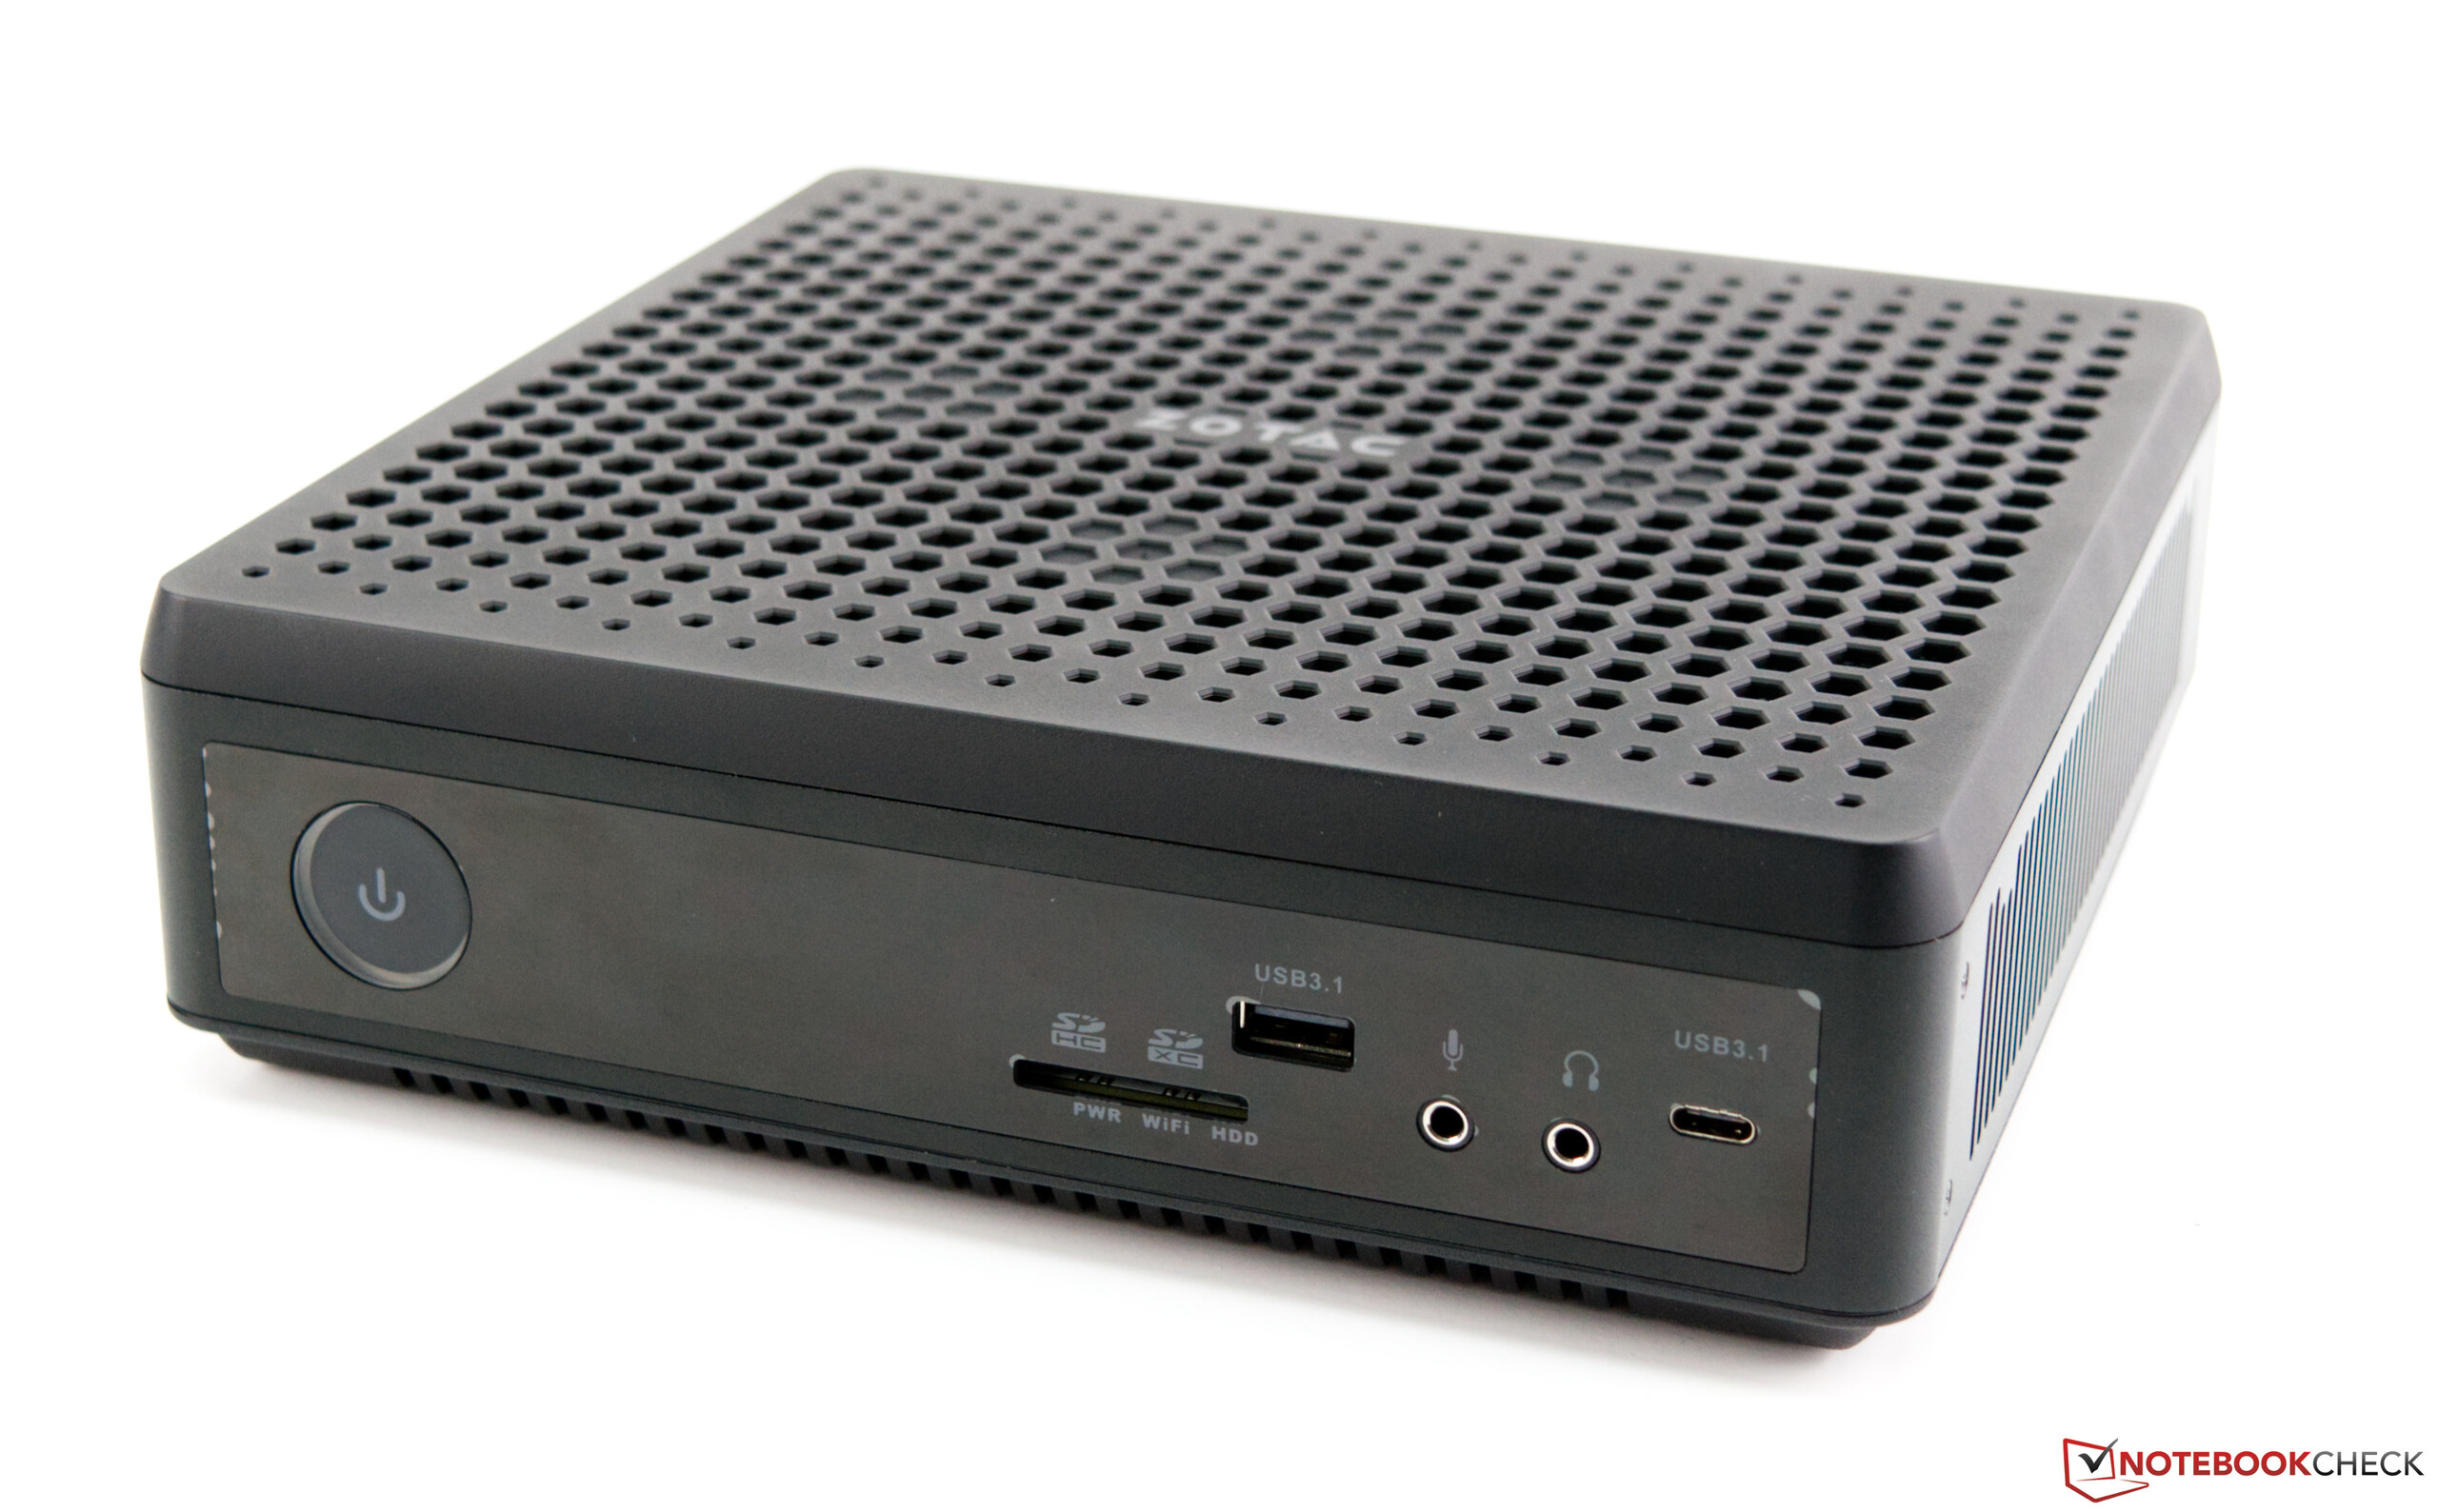
Die ZBOX von Zotac gibt es schon länger und das Grundkonzept ist nicht neu. Mit der aktuellsten Version paart der Hersteller Intels 9. Generation der Core-Prozessoren mit der Turing-Architektur der Nvidia Grafikkarten. Diese Konfiguration basiert auf Komponenten, welche sonst nur bei Laptops zu finden sind, um die Leistungsaufnahme und die resultierende Abwärme im Zaum zu halten. Immerhin muss alles in dem Mini-System, welches eine Stellfläche von nur 21 x 20,3 Zentimetern besitzt, unterkommen. Auch die Höhe ist mit 6,22 Zentimetern recht flach.
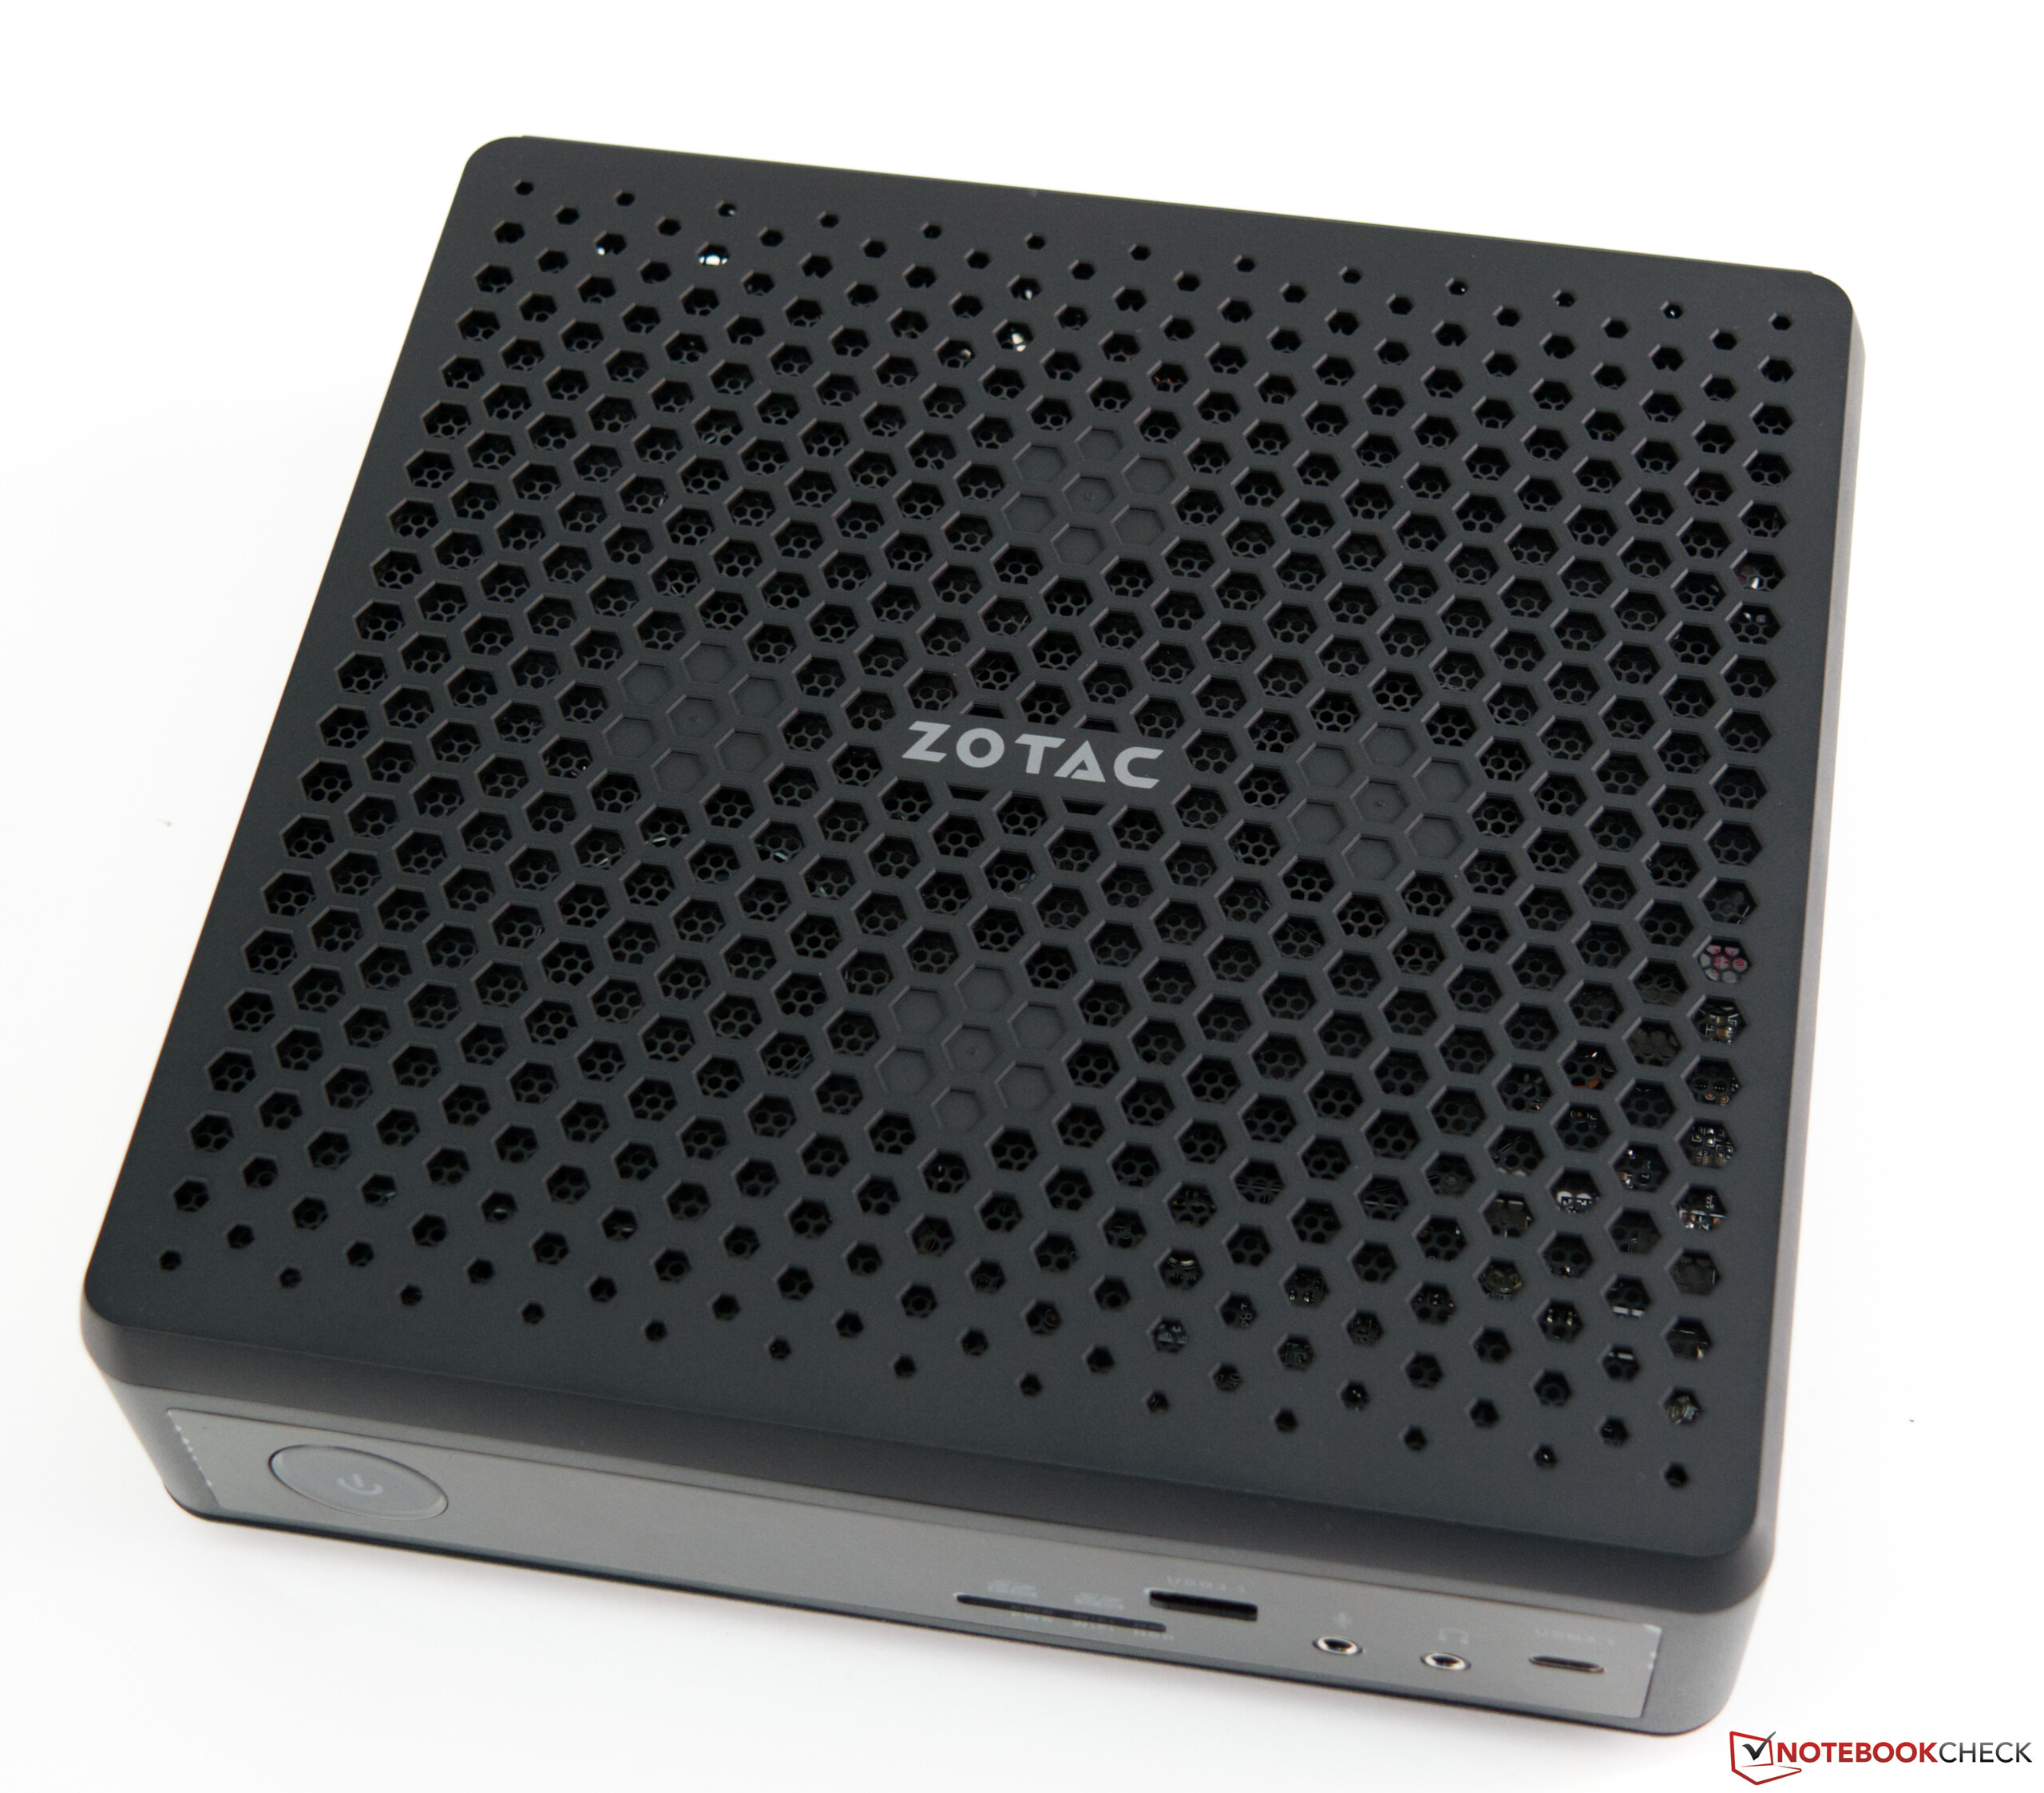
Das kompakte Gehäuse wirkt sehr hochwertig und stabil und ist komplett in Schwarz gehalten. Auf Beleuchtungselemente wurde bei dem Barebone bewusst verzichtet. Wer auf viel Bling Bling steht, kann sich den Test zum Zotac MEK Mini anschauen. Ausgestattet ist die ZBOX Magnus mit einem Intel Core i7-9750H, welcher eine solide Performance bei modernen Spielen liefert. Zusammen mit der verbauten GeForce RTX 2080 (Mobile) lassen sich auch sehr aufwendige Spiele auf dem System spielen. Mehr dazu finden Sie in dem jeweiligen Abschnitt, weiter unten im Test.
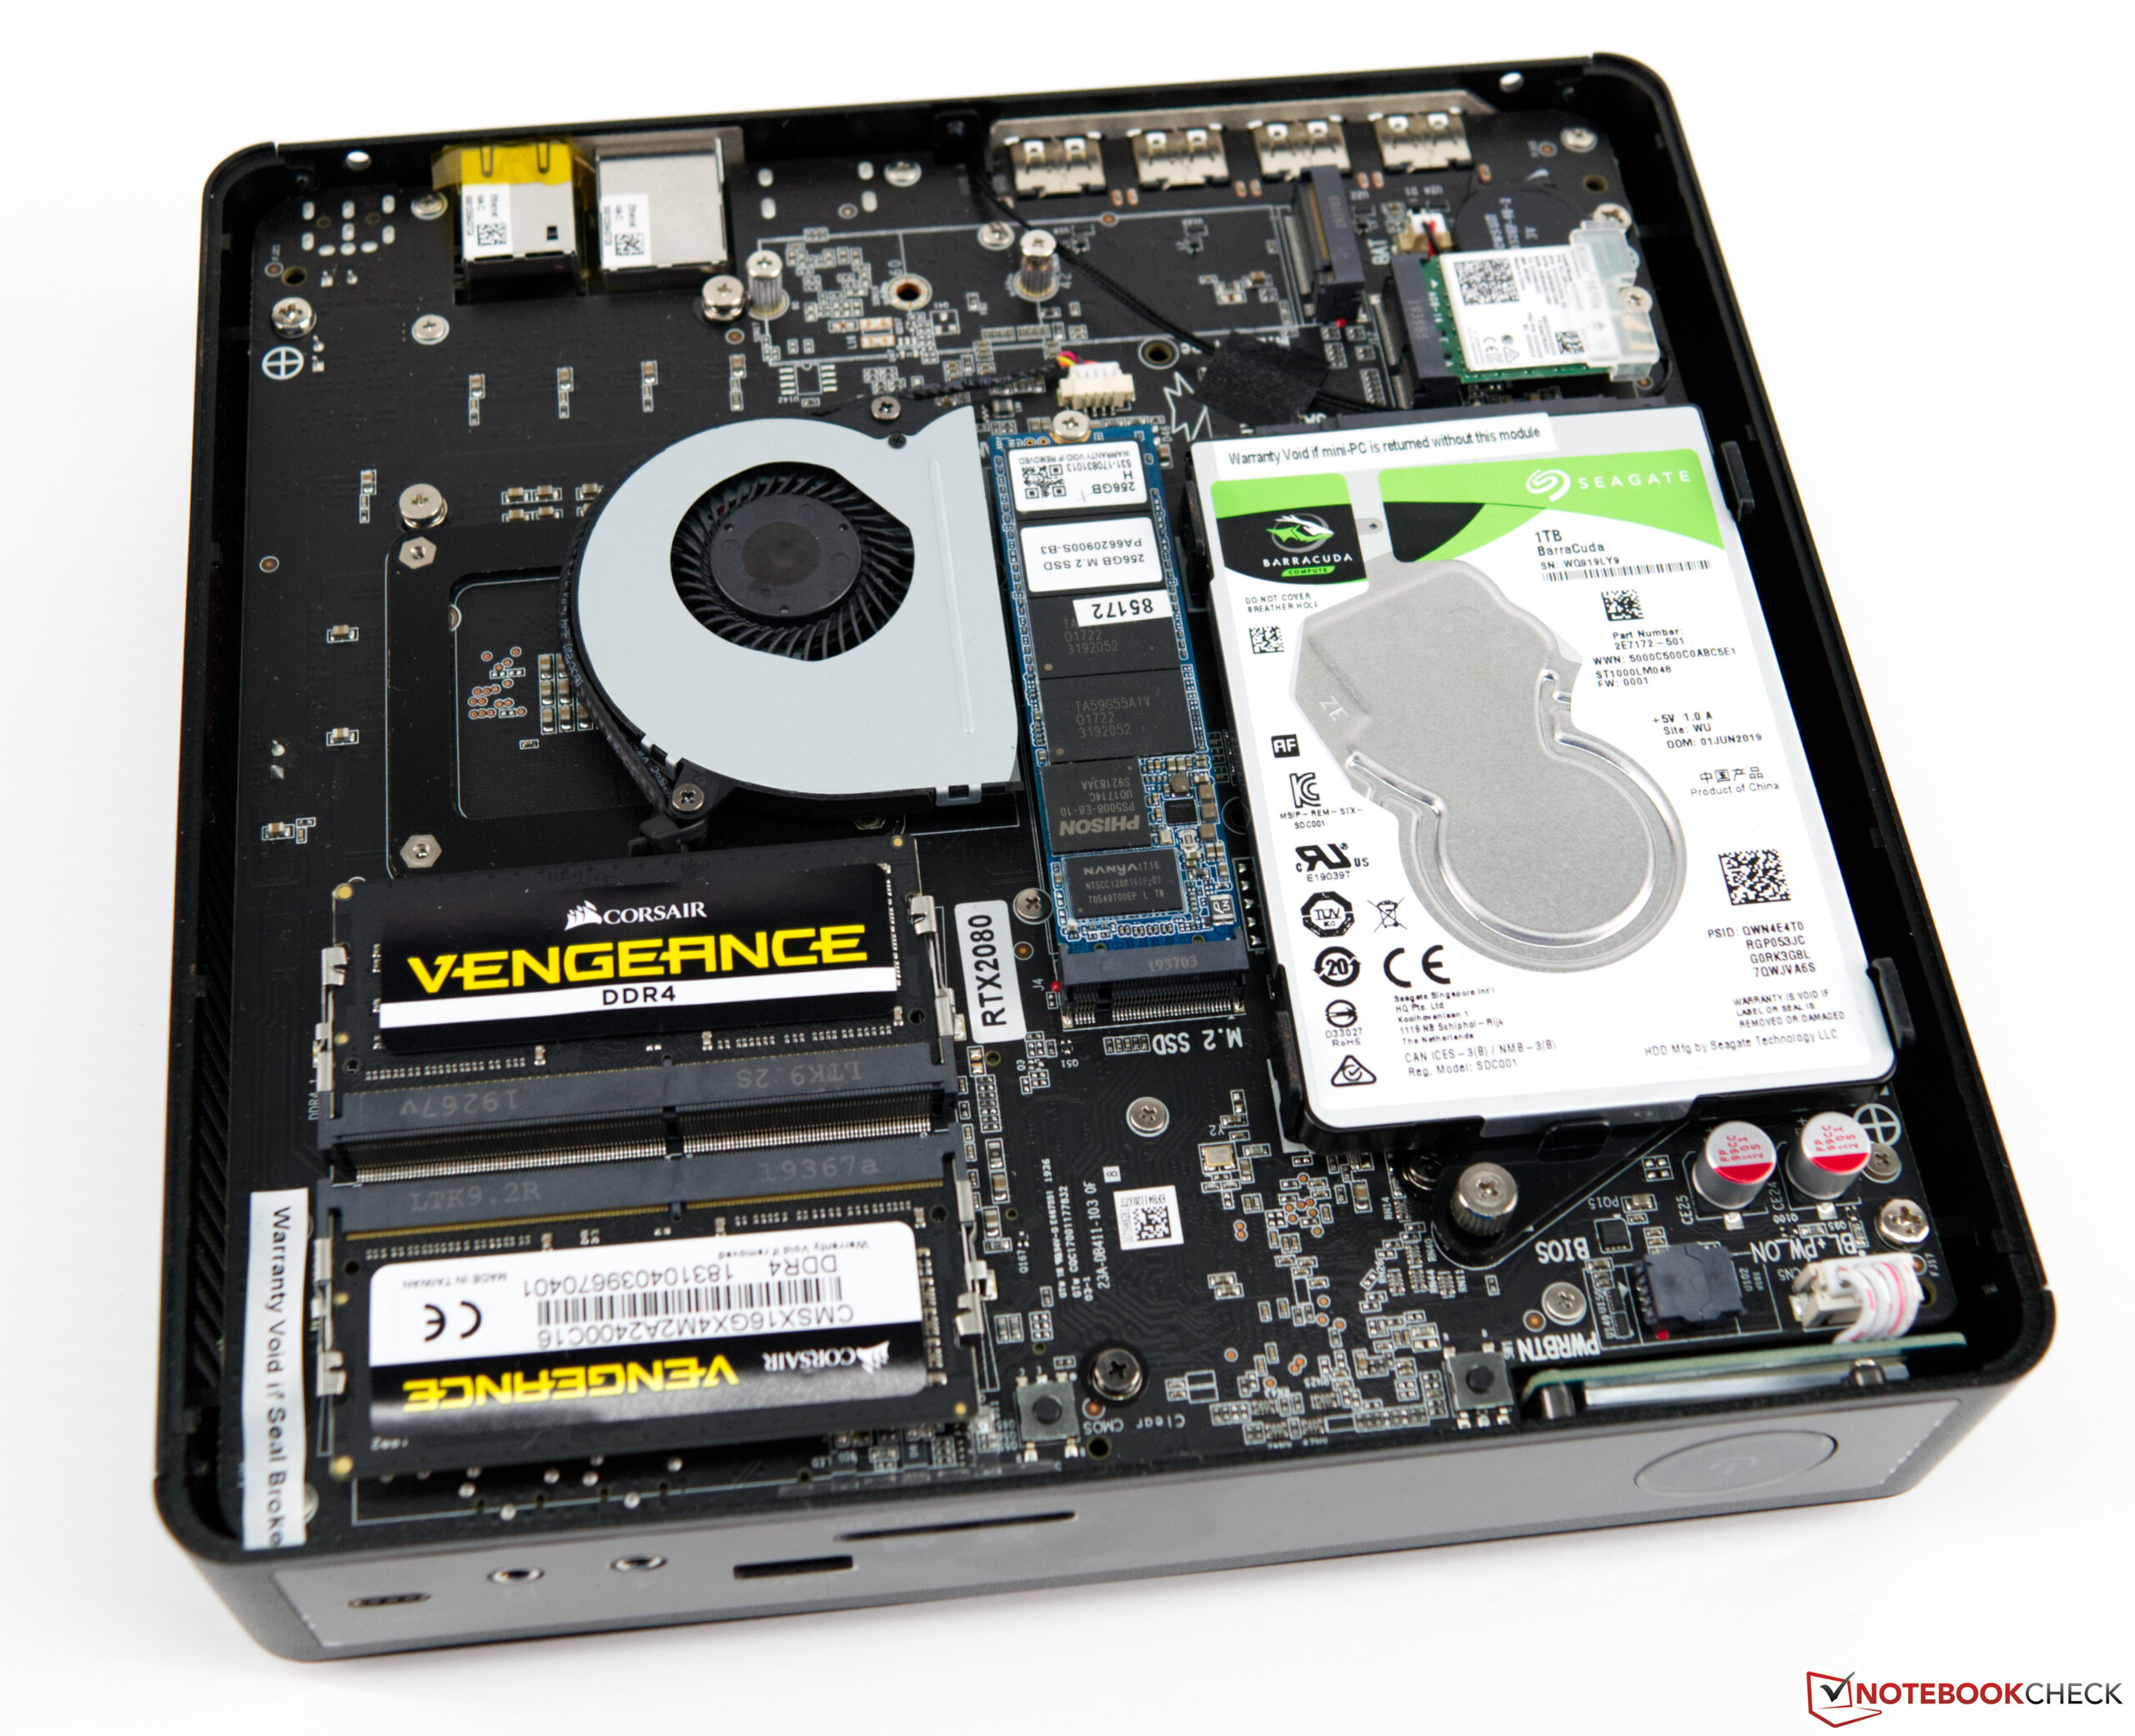
Da es sich wie schon öfter erwähnt um ein Barebone-System handelt, wird die ZBOX ohne Arbeitsspeicher und Massenspeicher ausgeliefert. Hier kann der Käufer selbst entscheiden, was er verbauen möchte und ist damit nicht auf ein vorkonfiguriertes System angewiesen.
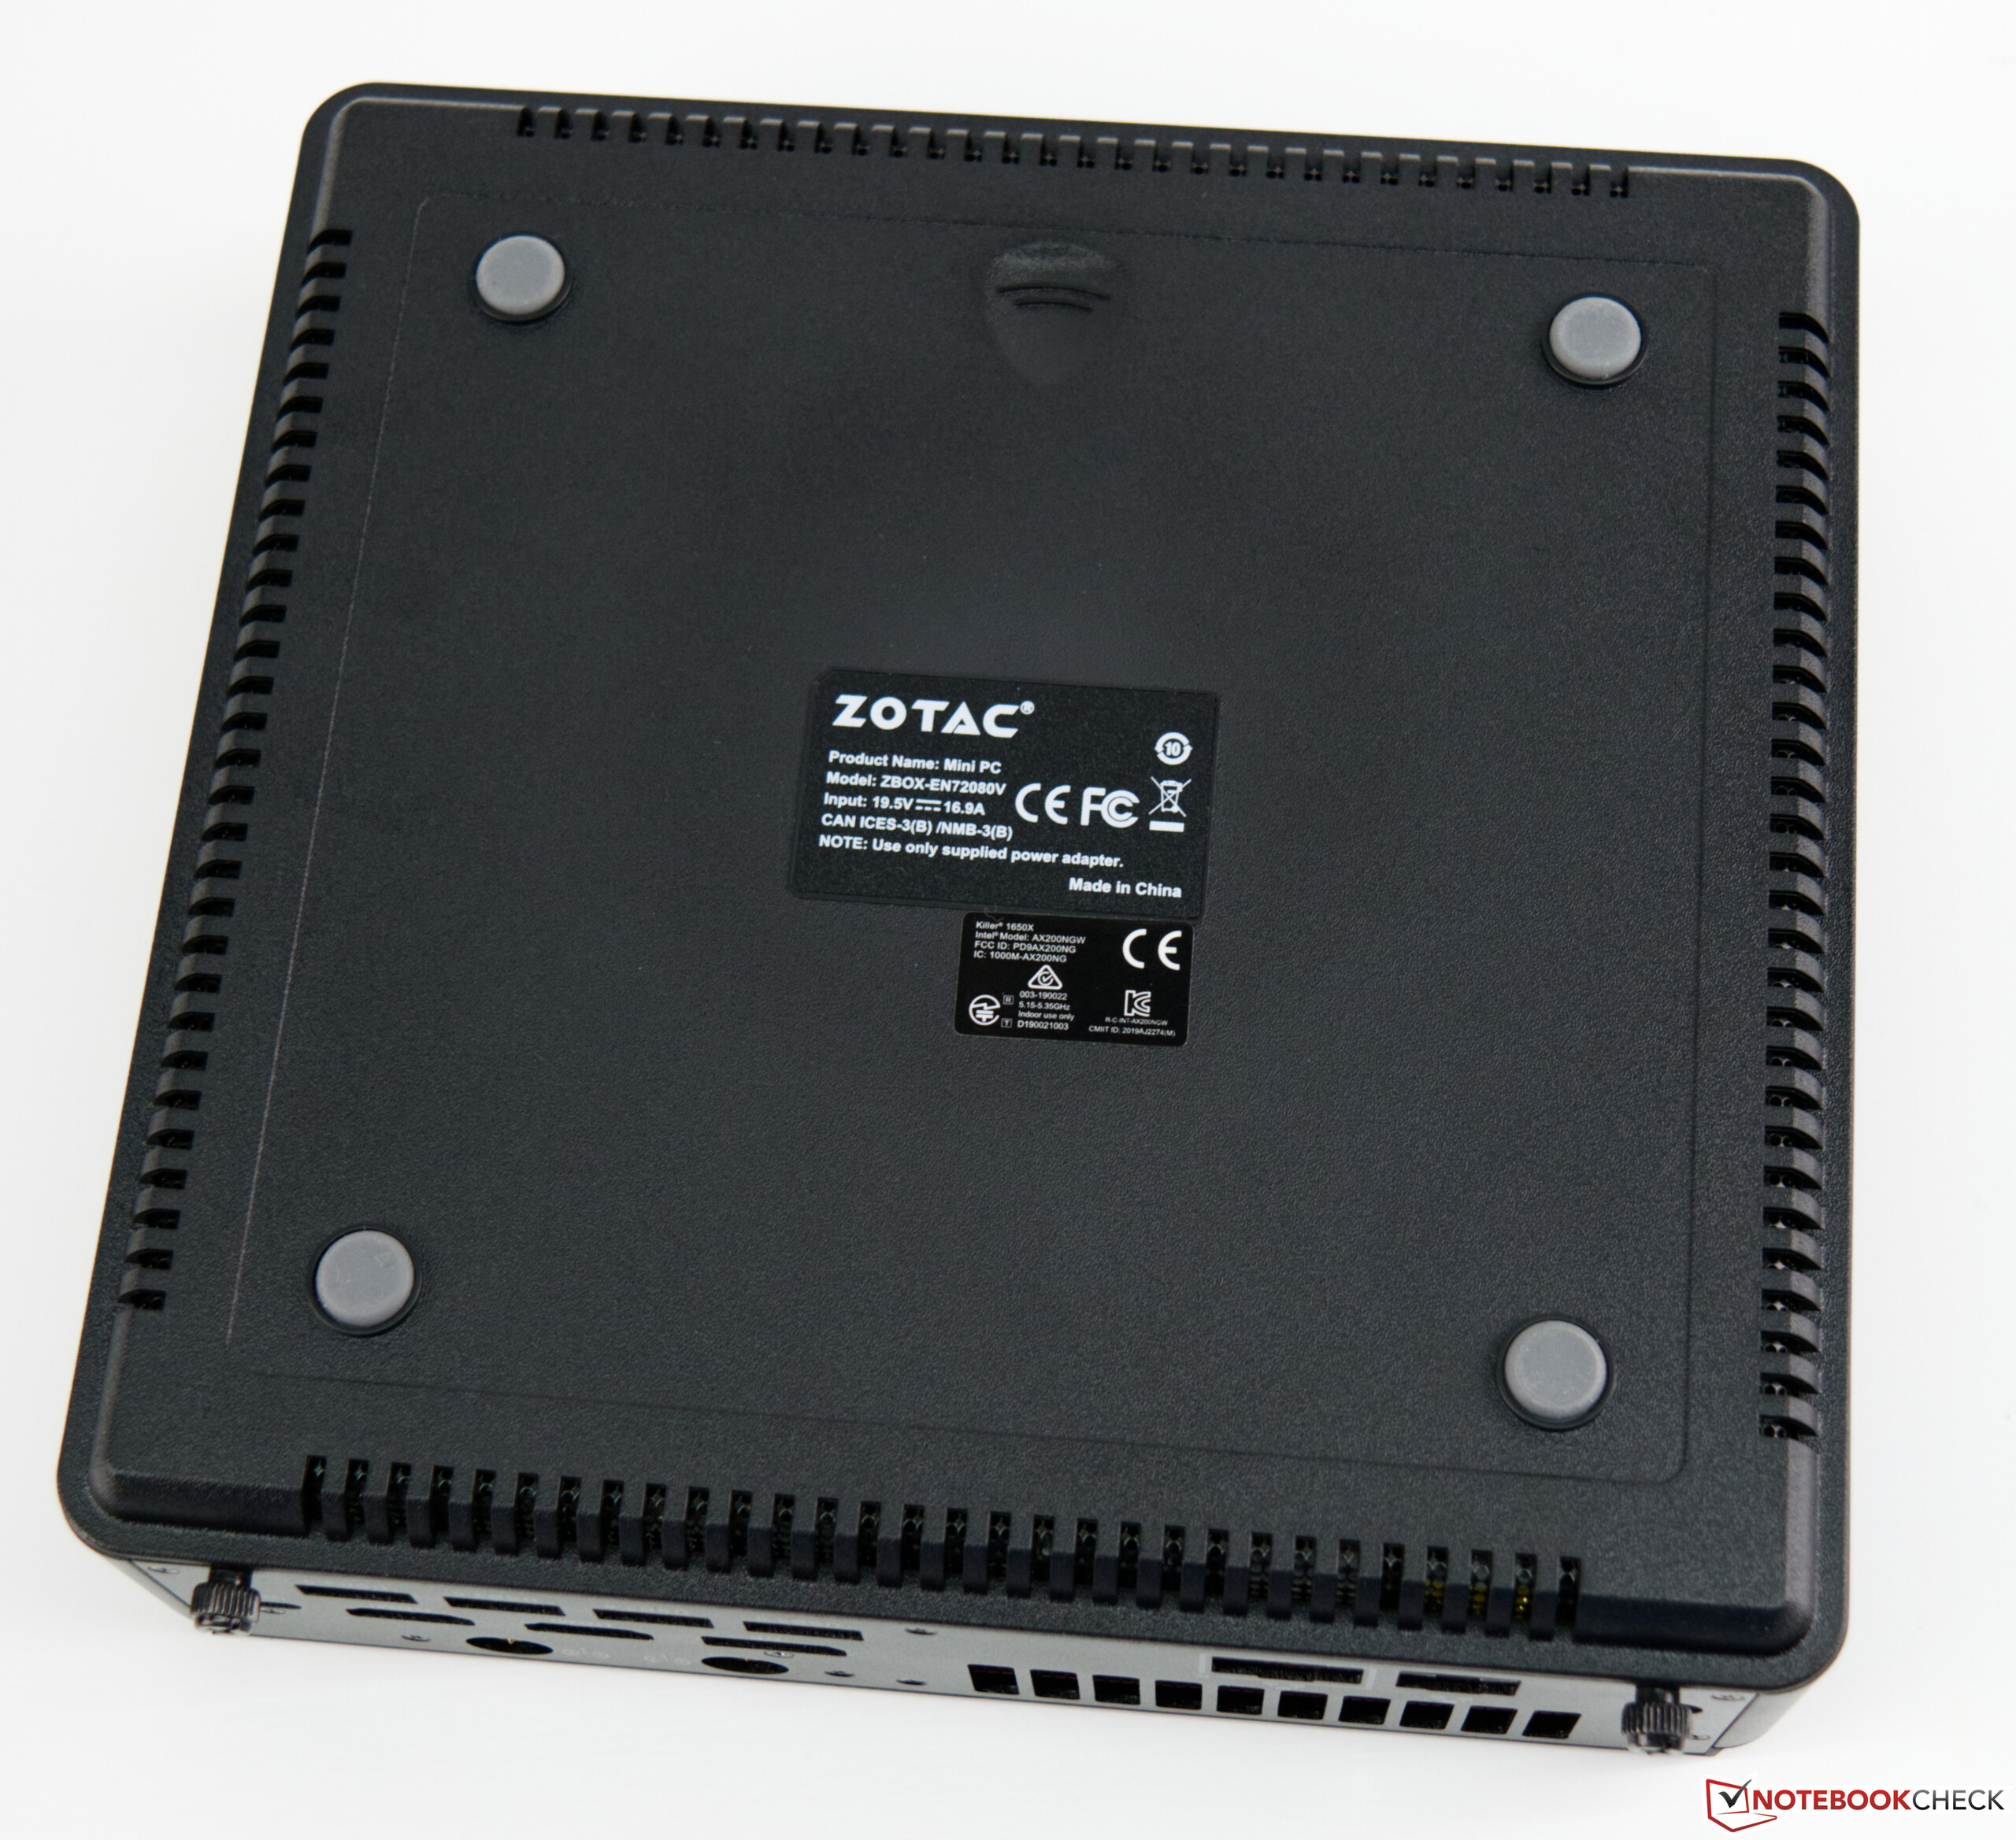
Für die Zotac ZBOX Magnus EN72080V müssen zum Testzeitpunkt knapp 1.700 Euro auf den Tisch gelegt werden.
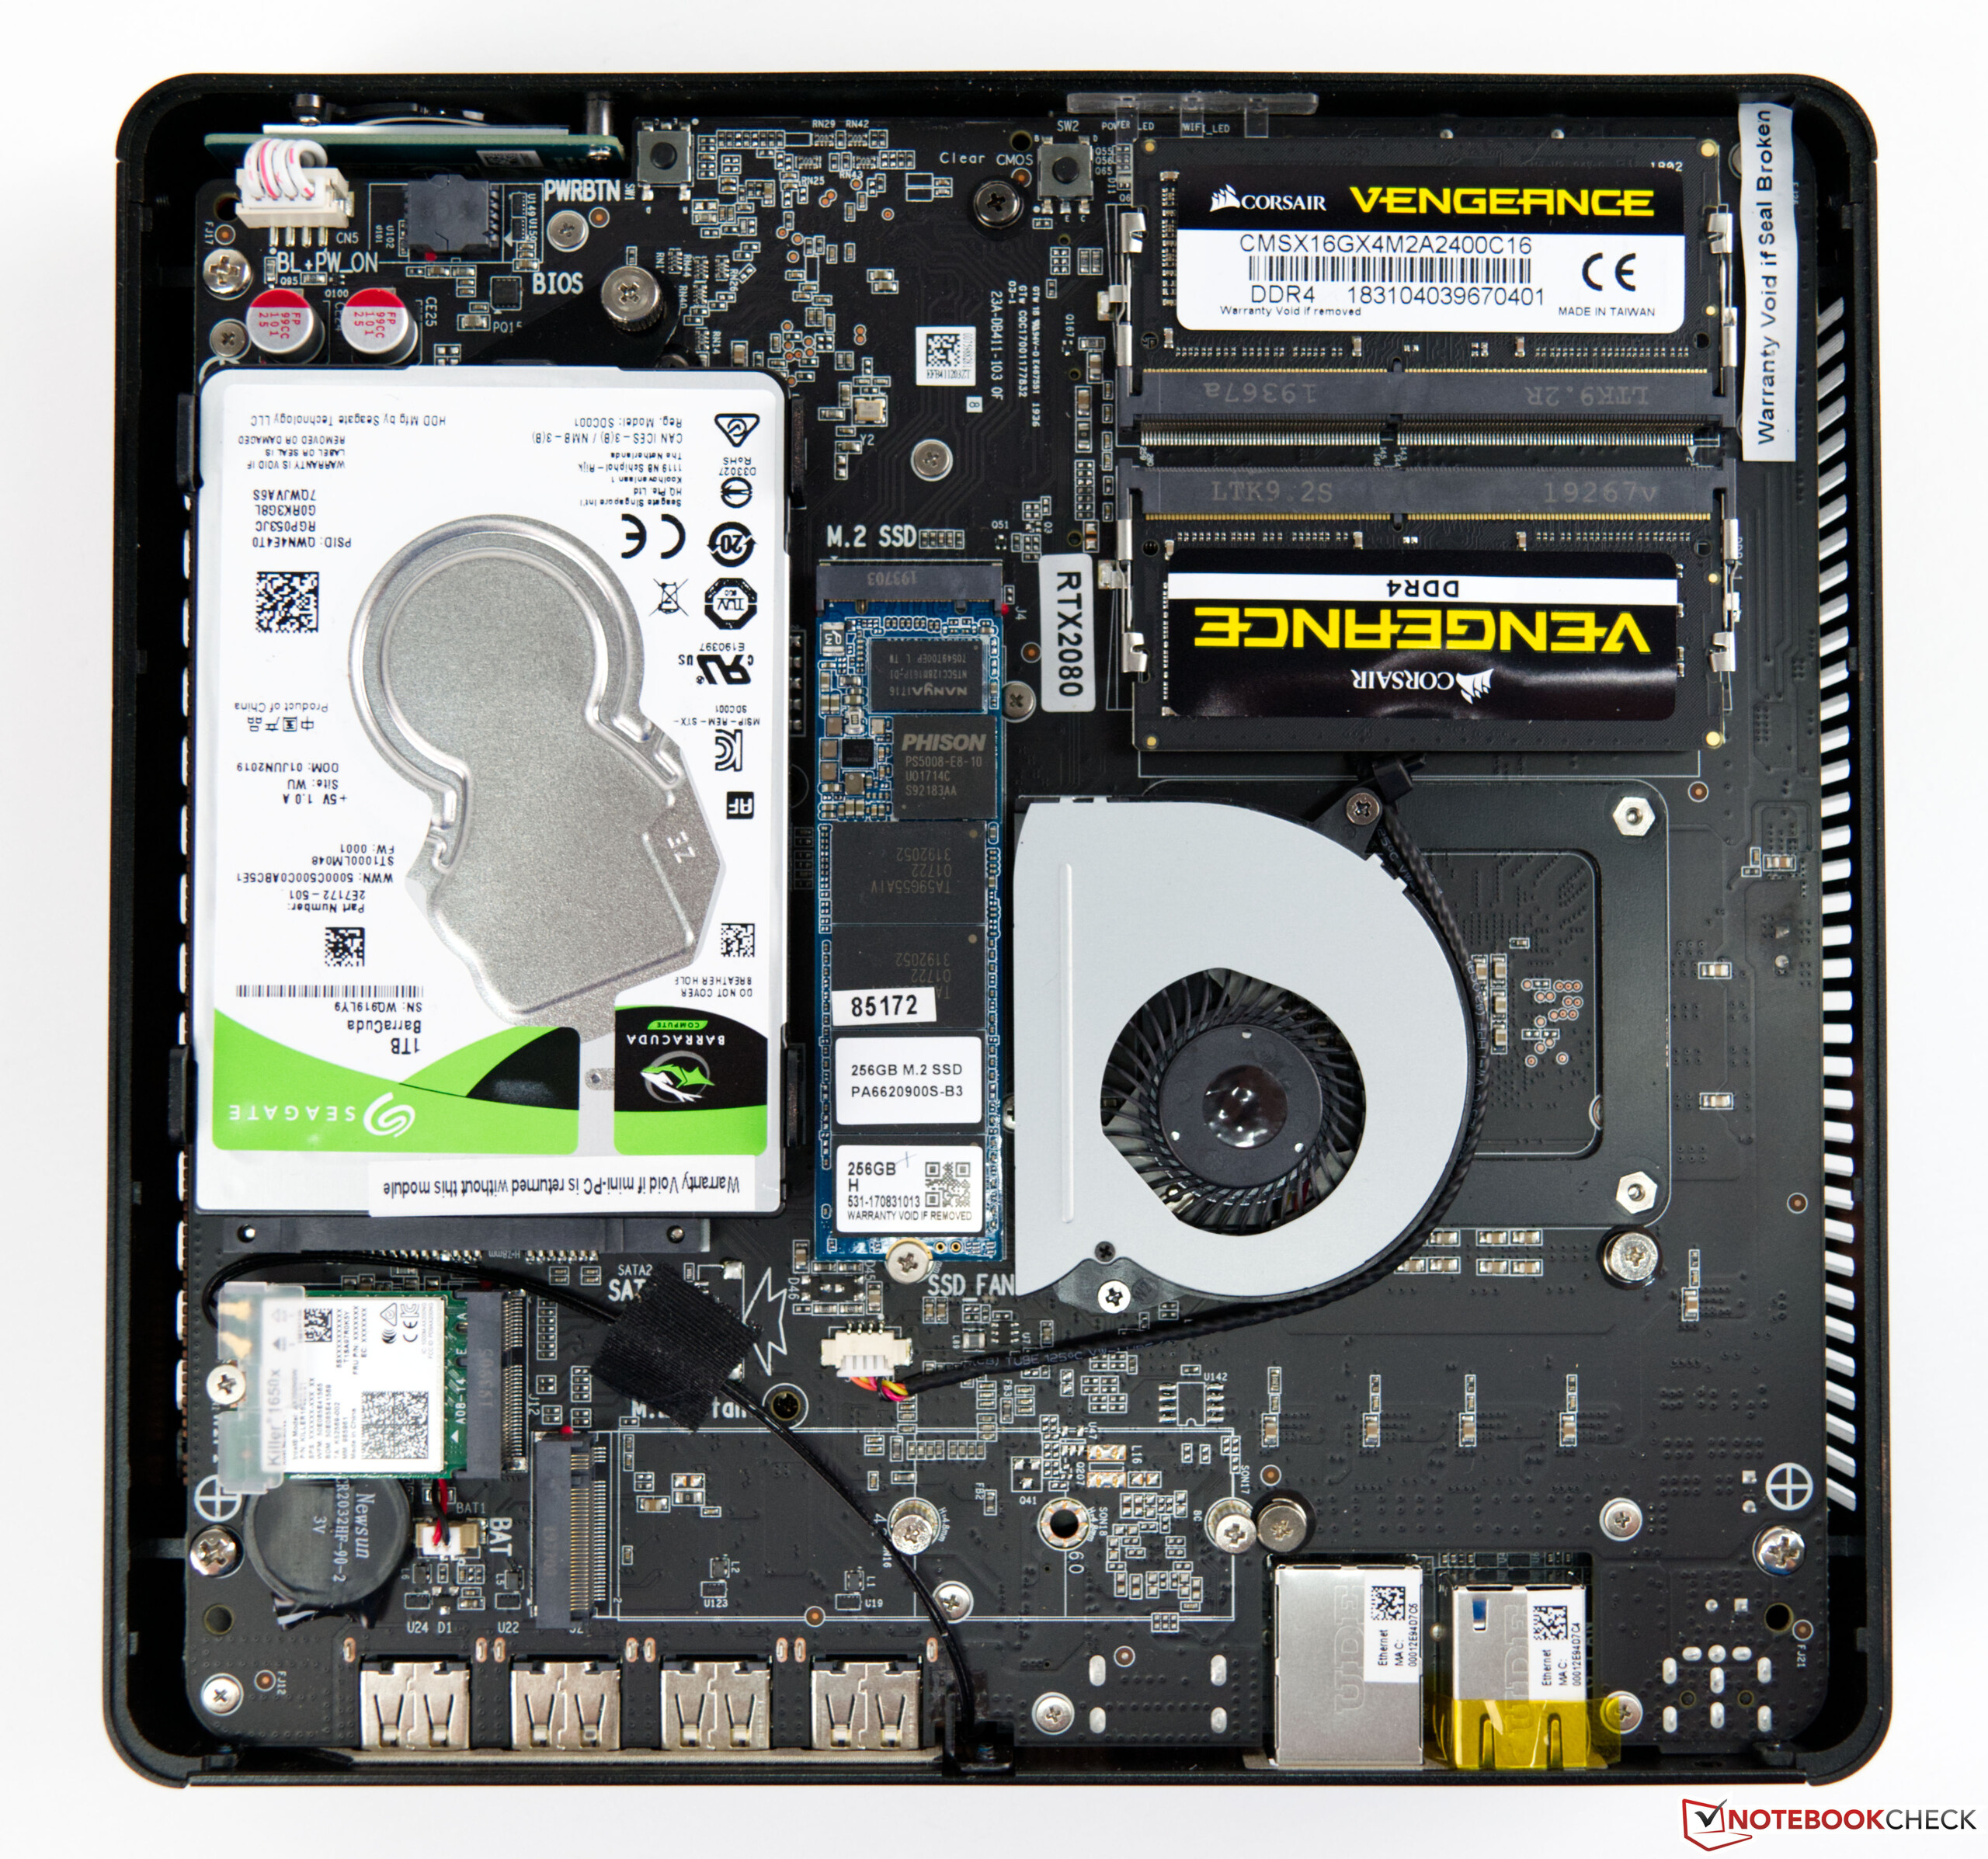
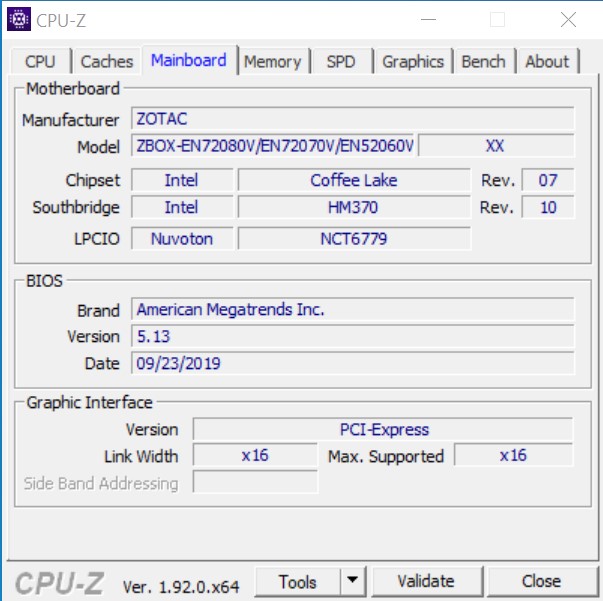
Zotac ZBOX Magnus im Detail
Wie Eingangs schon erwähnt, ist die Zotac ZBOX Magnus ein Barebone-System. Somit bleibt es dem Anwender selbst überlassen, welchen Massenspeicher und welchen Arbeitsspeicher er einbauen möchte. Alles Weitere bringt der PC bereits mit. In unserer Ausführung ist der Intel Core i7-9750H zusammen mit der GeForce RTX 2080 verbaut. Viele IO-Ports befinden sich auf der Rückseite und auch an der Vorderseite. Schnelles WLAN (WiFi6) und ein Dual-LAN-Port sorgen für die nötigen Netzwerkverbindungen.
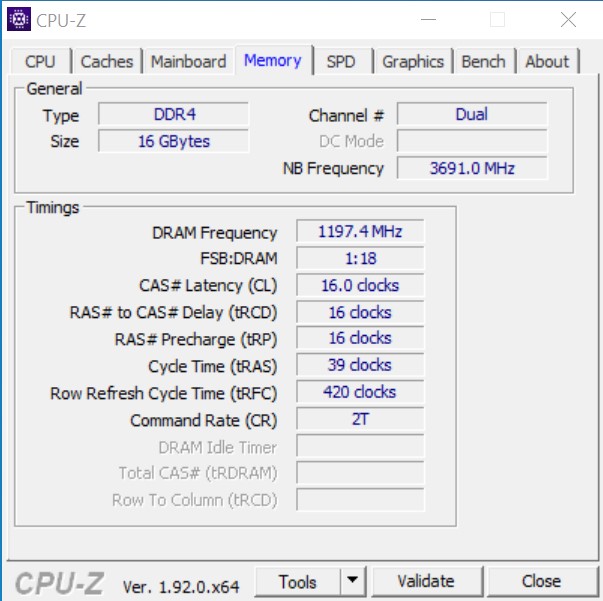
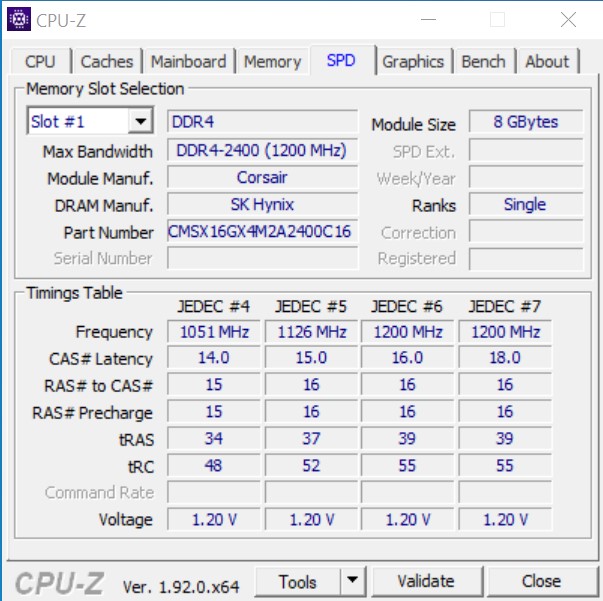
Für unseren Test hat Zotac das Gerät bereits mit einer M.2-SSD und einer Festplatte bestückt. Gleiches gilt für den Arbeitsspeicher. Dieser kann bei Bedarf auf bis zu 32 GB erweitert werden.
Prozessor Benchmarks
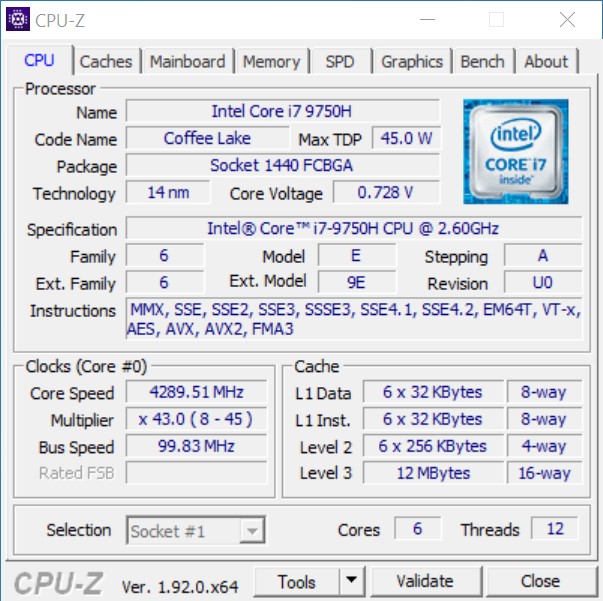
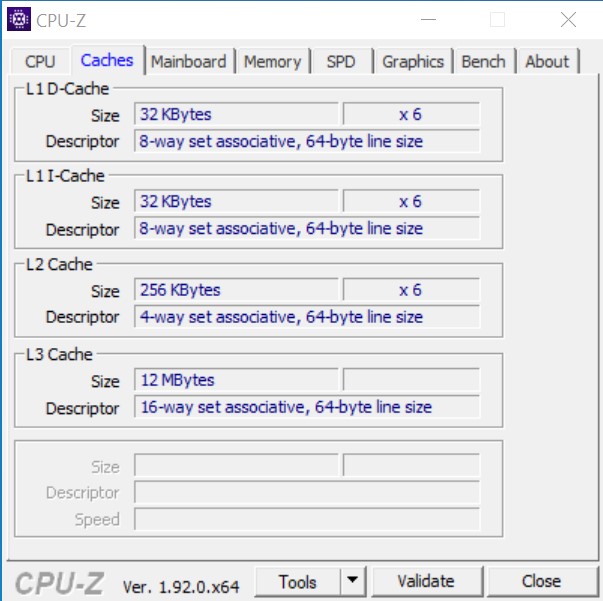
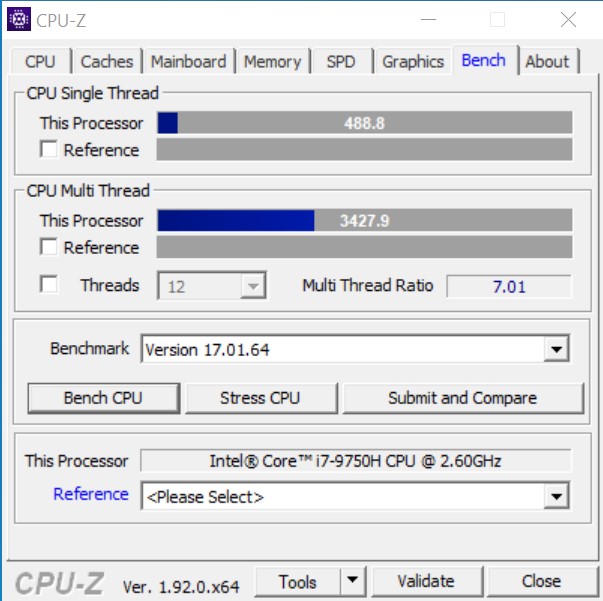
Der Intel Core i7-9750H ist ein schneller 6-Kern-Prozessor, welcher vorrangig in Notebooks eingesetzt wird. Aufgrund der Kompaktheit und der geringen Leistungsaufnahme hat sich der Hersteller für diesen Prozessor entschieden. Im Test konnte die ZBOX Magnus mit dem Core i7-9750H ein gutes Ergebnis abliefern. Die gute Kühleinheit sorgt dafür, dass die Leistung des SoC über dem Durchschnitt der von uns bereits getesteten Core i7-9750H liegt. Der Vergleich mit Intel’s Ghost Canyon NUC verliert die ZBOX, was aufgrund der zwei fehlenden Kerne einhergeht, denn das NUC von Intel ist mit einem Core i9-9980HK ausgestattet.
* ... kleinere Werte sind besser
Zotac ZBOX Magnus in der Cinebench-R15-Multi-Schleife
Die kompakte Bauweise erfordert ein ausgeklügeltes und effektives Kühlsystem. Genau dies bietet die ZBOX Magnus von Zotac, denn bei der Cinebench-R15-Dauerschleife ist auch bei anhaltender Belastung kein gravierender Leistungsverlust zu verzeichnen.
Anwendungsleistung
Die Anwendungsbenchmarks absolviert die Zotac ZBOX Magnus ohne Zwischenfälle mit einem guten Ergebnis. Im Vergleich zu den herkömmlichen Desktop-PCs zieht der Mini-PC aber den Kürzeren. Gleichwohl ist der Leistungsunterschied bei alltäglichen Arbeiten aber nicht Nennenswert. Bei den Grafiktests geriet die GeForce RTX 2080 Mobile etwas ins Hintertreffen. Aber auch die Desktop-Version der GeForce RTX 2070 konnte im Ghost Canyon NUC keine deutlich besseren Werte liefern.
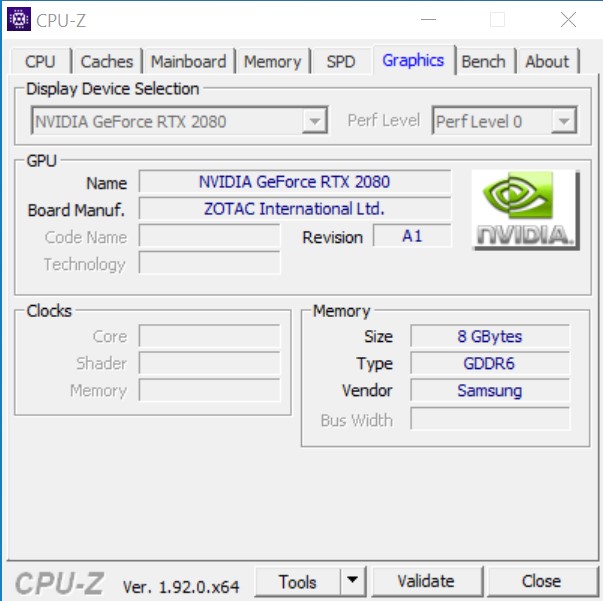
3D-Leistung und Gaming Performance
Für die 3D-Performance ist die verbaute Grafikkarte von entscheidender Bedeutung. In unserem Fall bietet die ZBOX Magnus mit der GeForce RTX 2080 eine sehr gute Wahl, welche auch noch etwas Zukunftssicherheit vermittelt. Den direkten Vergleich mit einer GeForce RTX 2070 als Desktop-Variante verliert die mobile Version der RTX 2080. Gleichwohl lassen sich aber alle Spiele in 1080p mit maximalen Details flüssig spielen. Selbst eine höhere Auflösung von 1440p meistert die Zotac ZBOX Magnus. Erst ab 2160p schafft es die GeForce RTX 2080 Mobile nicht mehr bei jedem Spiel flüssige Frameraten zu erzeugen. Das gleiche Schicksal ereilt auch die Nvidia GeForce RTX 2070 im Intel Ghost Canyon NUC.
| Borderlands 3 | |
| 1280x720 Very Low Overall Quality (DX11) | |
| Intel Ghost Canyon NUC (RTX 2070) | |
| Durchschnittliche NVIDIA GeForce RTX 2080 Mobile (128 - 150, n=2) | |
| Zotac ZBOX Magnus EN72070V | |
| 1920x1080 Badass Overall Quality (DX11) | |
| Zotac ZBOX Magnus EN72070V | |
| Durchschnittliche NVIDIA GeForce RTX 2080 Mobile (79.4 - 89.4, n=4) | |
| Intel Ghost Canyon NUC (RTX 2070) | |
| Metro Exodus | |
| 1280x720 Low Quality AF:4x | |
| Intel Ghost Canyon NUC (RTX 2070) | |
| Durchschnittliche NVIDIA GeForce RTX 2080 Mobile (149 - 165, n=2) | |
| Zotac ZBOX Magnus EN72070V | |
| 1920x1080 Ultra Quality AF:16x | |
| Durchschnittliche NVIDIA GeForce RTX 2080 Mobile (67.7 - 77.4, n=5) | |
| Zotac ZBOX Magnus EN72070V | |
| Intel Ghost Canyon NUC (RTX 2070) | |
| Far Cry New Dawn | |
| 1280x720 Low Preset | |
| Intel Ghost Canyon NUC (RTX 2070) | |
| Zotac ZBOX Magnus EN72070V | |
| Durchschnittliche NVIDIA GeForce RTX 2080 Mobile (109 - 117, n=2) | |
| 1920x1080 Ultra Preset | |
| Durchschnittliche NVIDIA GeForce RTX 2080 Mobile (82 - 108, n=5) | |
| Zotac ZBOX Magnus EN72070V | |
| Intel Ghost Canyon NUC (RTX 2070) | |
| Forza Horizon 4 | |
| 1280x720 Very Low Preset | |
| Intel Ghost Canyon NUC (RTX 2070) | |
| Zotac ZBOX Magnus EN72070V | |
| Durchschnittliche NVIDIA GeForce RTX 2080 Mobile (n=1) | |
| 1920x1080 Ultra Preset AA:2xMS | |
| Zotac ZBOX Magnus EN72070V | |
| Durchschnittliche NVIDIA GeForce RTX 2080 Mobile (n=1) | |
| Intel Ghost Canyon NUC (RTX 2070) | |
| Far Cry 5 | |
| 1280x720 Low Preset AA:T | |
| Intel Ghost Canyon NUC (RTX 2070) | |
| Zotac ZBOX Magnus EN72070V | |
| Durchschnittliche NVIDIA GeForce RTX 2080 Mobile (123 - 123, n=2) | |
| 1920x1080 Ultra Preset AA:T | |
| Durchschnittliche NVIDIA GeForce RTX 2080 Mobile (73 - 115, n=3) | |
| Intel Ghost Canyon NUC (RTX 2070) | |
| Zotac ZBOX Magnus EN72070V | |
| X-Plane 11.11 | |
| 1280x720 low (fps_test=1) | |
| Intel Ghost Canyon NUC (RTX 2070) | |
| Zotac ZBOX Magnus EN72070V | |
| Durchschnittliche NVIDIA GeForce RTX 2080 Mobile (98.2 - 114, n=3) | |
| 1920x1080 high (fps_test=3) | |
| Intel Ghost Canyon NUC (RTX 2070) | |
| Zotac ZBOX Magnus EN72070V | |
| Durchschnittliche NVIDIA GeForce RTX 2080 Mobile (73.1 - 84.7, n=3) | |
| Final Fantasy XV Benchmark | |
| 1280x720 Lite Quality | |
| Intel Ghost Canyon NUC (RTX 2070) | |
| Zotac ZBOX Magnus EN72070V | |
| Durchschnittliche NVIDIA GeForce RTX 2080 Mobile (n=1) | |
| 1920x1080 High Quality | |
| Durchschnittliche NVIDIA GeForce RTX 2080 Mobile (90.6 - 108, n=3) | |
| Intel Ghost Canyon NUC (RTX 2070) | |
| Zotac ZBOX Magnus EN72070V | |
| Dota 2 Reborn | |
| 1280x720 min (0/3) fastest | |
| Intel Ghost Canyon NUC (RTX 2070) | |
| Zotac ZBOX Magnus EN72070V | |
| Durchschnittliche NVIDIA GeForce RTX 2080 Mobile (134.8 - 152.8, n=3) | |
| 1920x1080 ultra (3/3) best looking | |
| Intel Ghost Canyon NUC (RTX 2070) | |
| Zotac ZBOX Magnus EN72070V | |
| Durchschnittliche NVIDIA GeForce RTX 2080 Mobile (103.9 - 133.8, n=3) | |
| The Witcher 3 | |
| 1024x768 Low Graphics & Postprocessing | |
| Zotac ZBOX Magnus EN72070V | |
| Durchschnittliche NVIDIA GeForce RTX 2080 Mobile (195.8 - 414, n=9) | |
| Intel Ghost Canyon NUC (RTX 2070) | |
| 1920x1080 Ultra Graphics & Postprocessing (HBAO+) | |
| Zotac ZBOX Magnus EN72070V | |
| Durchschnittliche NVIDIA GeForce RTX 2080 Mobile (82.2 - 105, n=16) | |
| Intel Ghost Canyon NUC (RTX 2070) | |
| 3DMark | |
| Fire Strike Extreme Graphics | |
| Durchschnittliche NVIDIA GeForce RTX 2080 Mobile (11133 - 12514, n=2) | |
| Zotac ZBOX Magnus EN72070V | |
| Intel Ghost Canyon NUC (RTX 2070) | |
| 1920x1080 Fire Strike Graphics | |
| Durchschnittliche NVIDIA GeForce RTX 2080 Mobile (22504 - 27319, n=16) | |
| Zotac ZBOX Magnus EN72070V | |
| Intel Ghost Canyon NUC (RTX 2070) | |
| 2560x1440 Time Spy Graphics | |
| Durchschnittliche NVIDIA GeForce RTX 2080 Mobile (9411 - 10992, n=15) | |
| Zotac ZBOX Magnus EN72070V | |
| Intel Ghost Canyon NUC (RTX 2070) | |
| min. | mittel | hoch | max. | QHD | 4K | |
|---|---|---|---|---|---|---|
| The Witcher 3 (2015) | 338 | 279 | 175 | 95.9 | 63.9 | |
| Dota 2 Reborn (2015) | 145.2 | 135.5 | 130.5 | 124.6 | 119 | |
| Final Fantasy XV Benchmark (2018) | 150 | 117 | 90.6 | 67.7 | 39.5 | |
| X-Plane 11.11 (2018) | 114 | 102 | 84.7 | 73 | ||
| Far Cry 5 (2018) | 123 | 72 | 84 | 73 | 67 | 52 |
| Forza Horizon 4 (2018) | 169 | 147 | 145 | 139 | 122 | 82 |
| Far Cry New Dawn (2019) | 117 | 102 | 97 | 88 | 82 | 54 |
| Metro Exodus (2019) | 149 | 112 | 88.1 | 69.5 | 54.8 | 35.1 |
| Borderlands 3 (2019) | 128 | 117 | 93.4 | 84.3 | 61.4 | 33.2 |
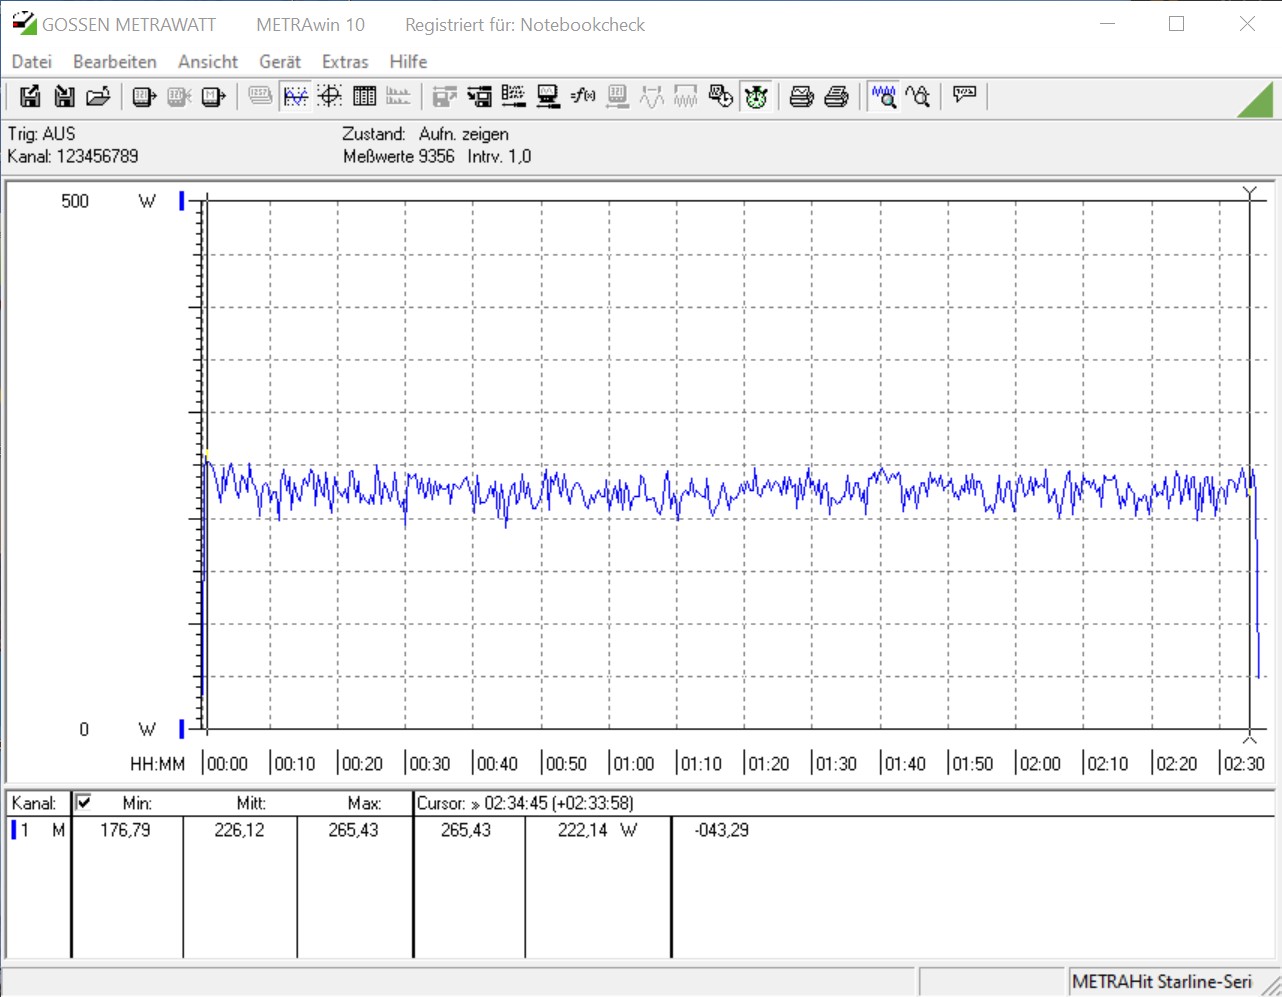
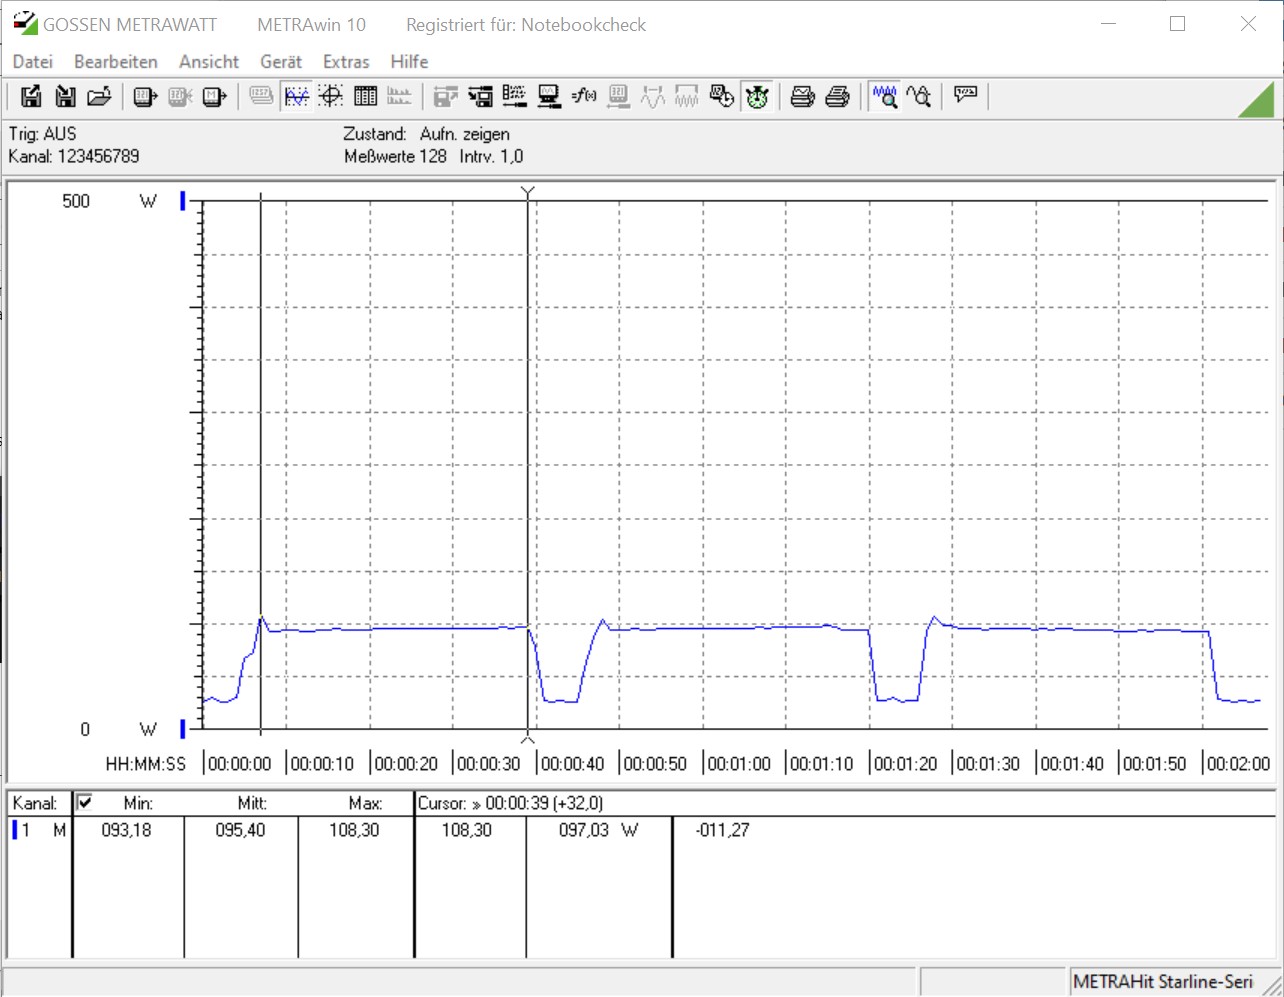
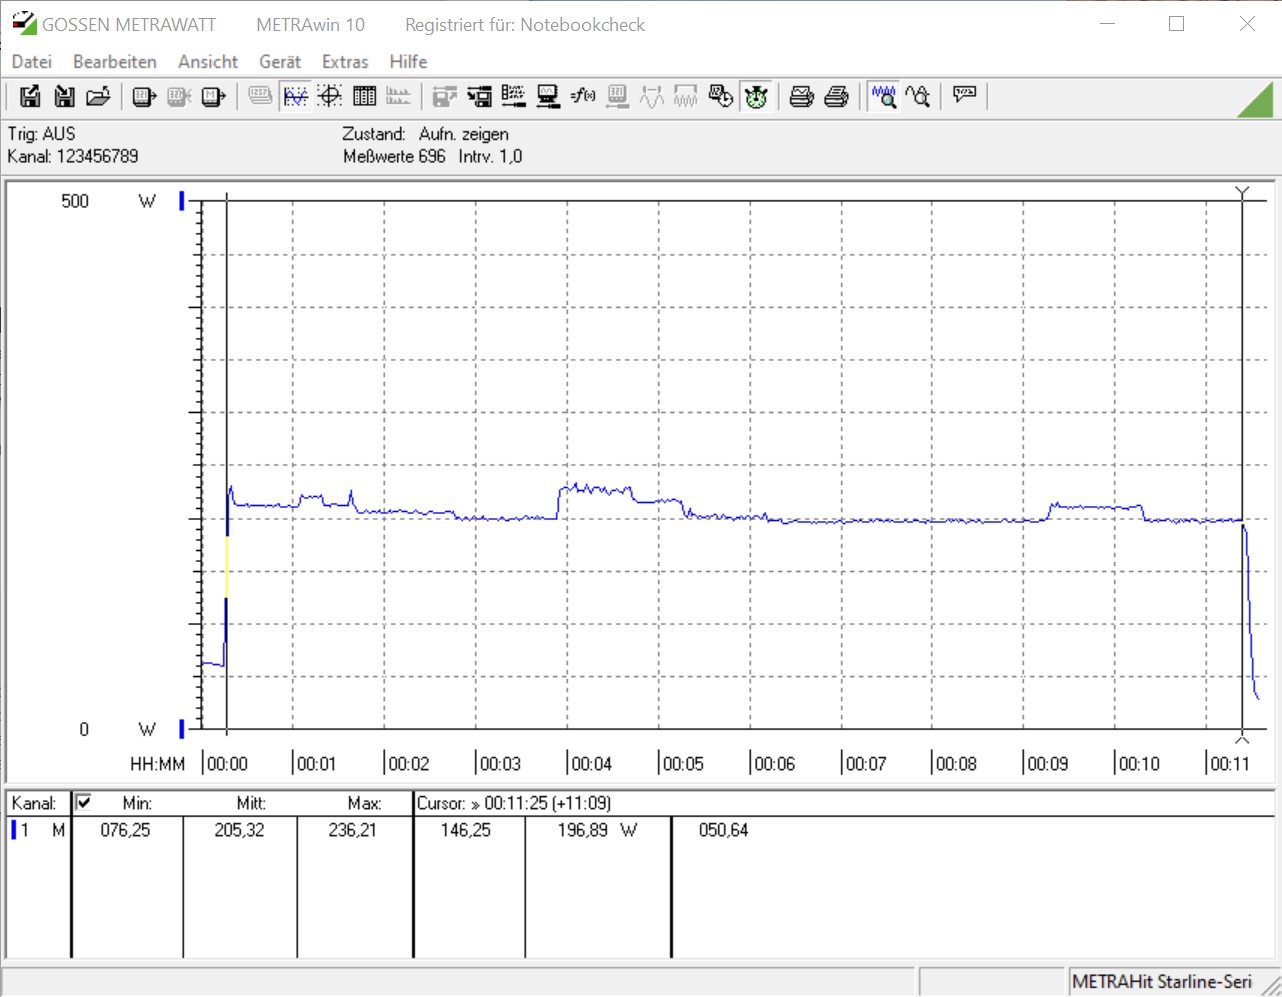
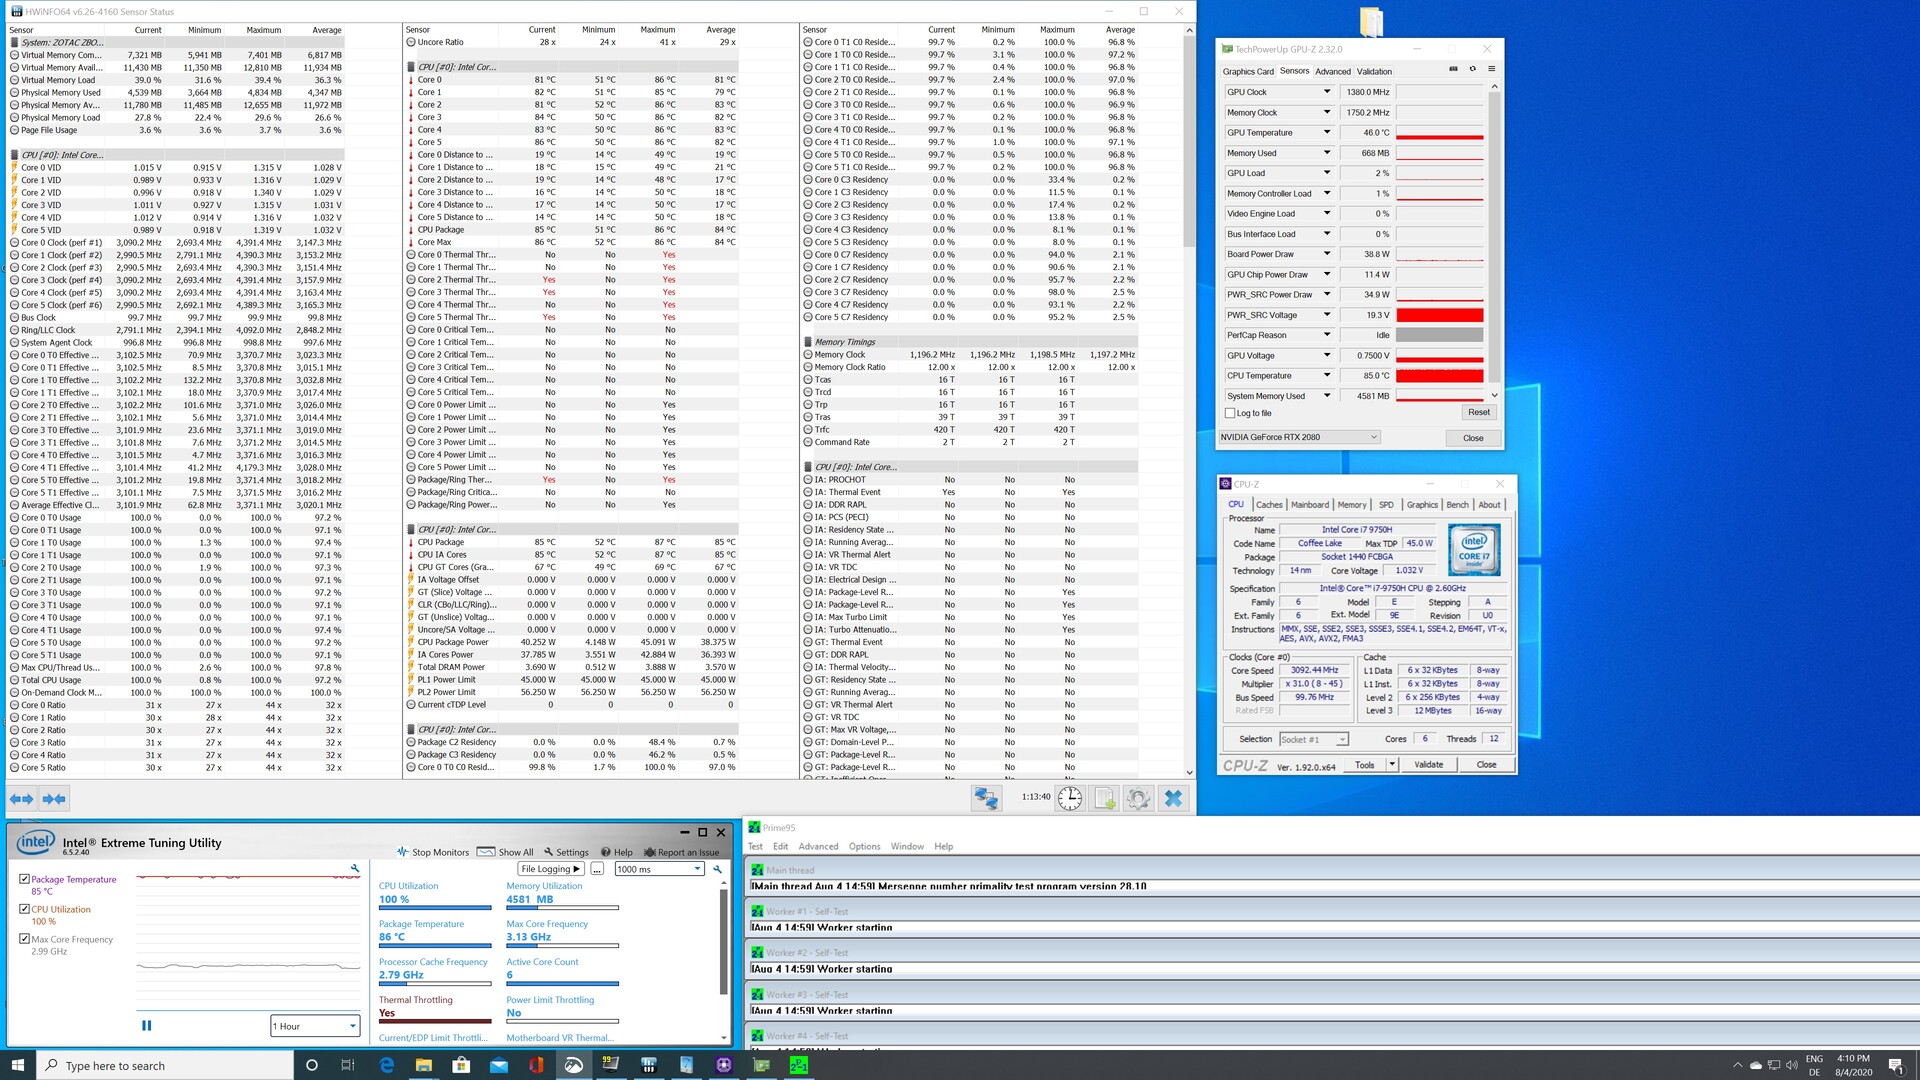
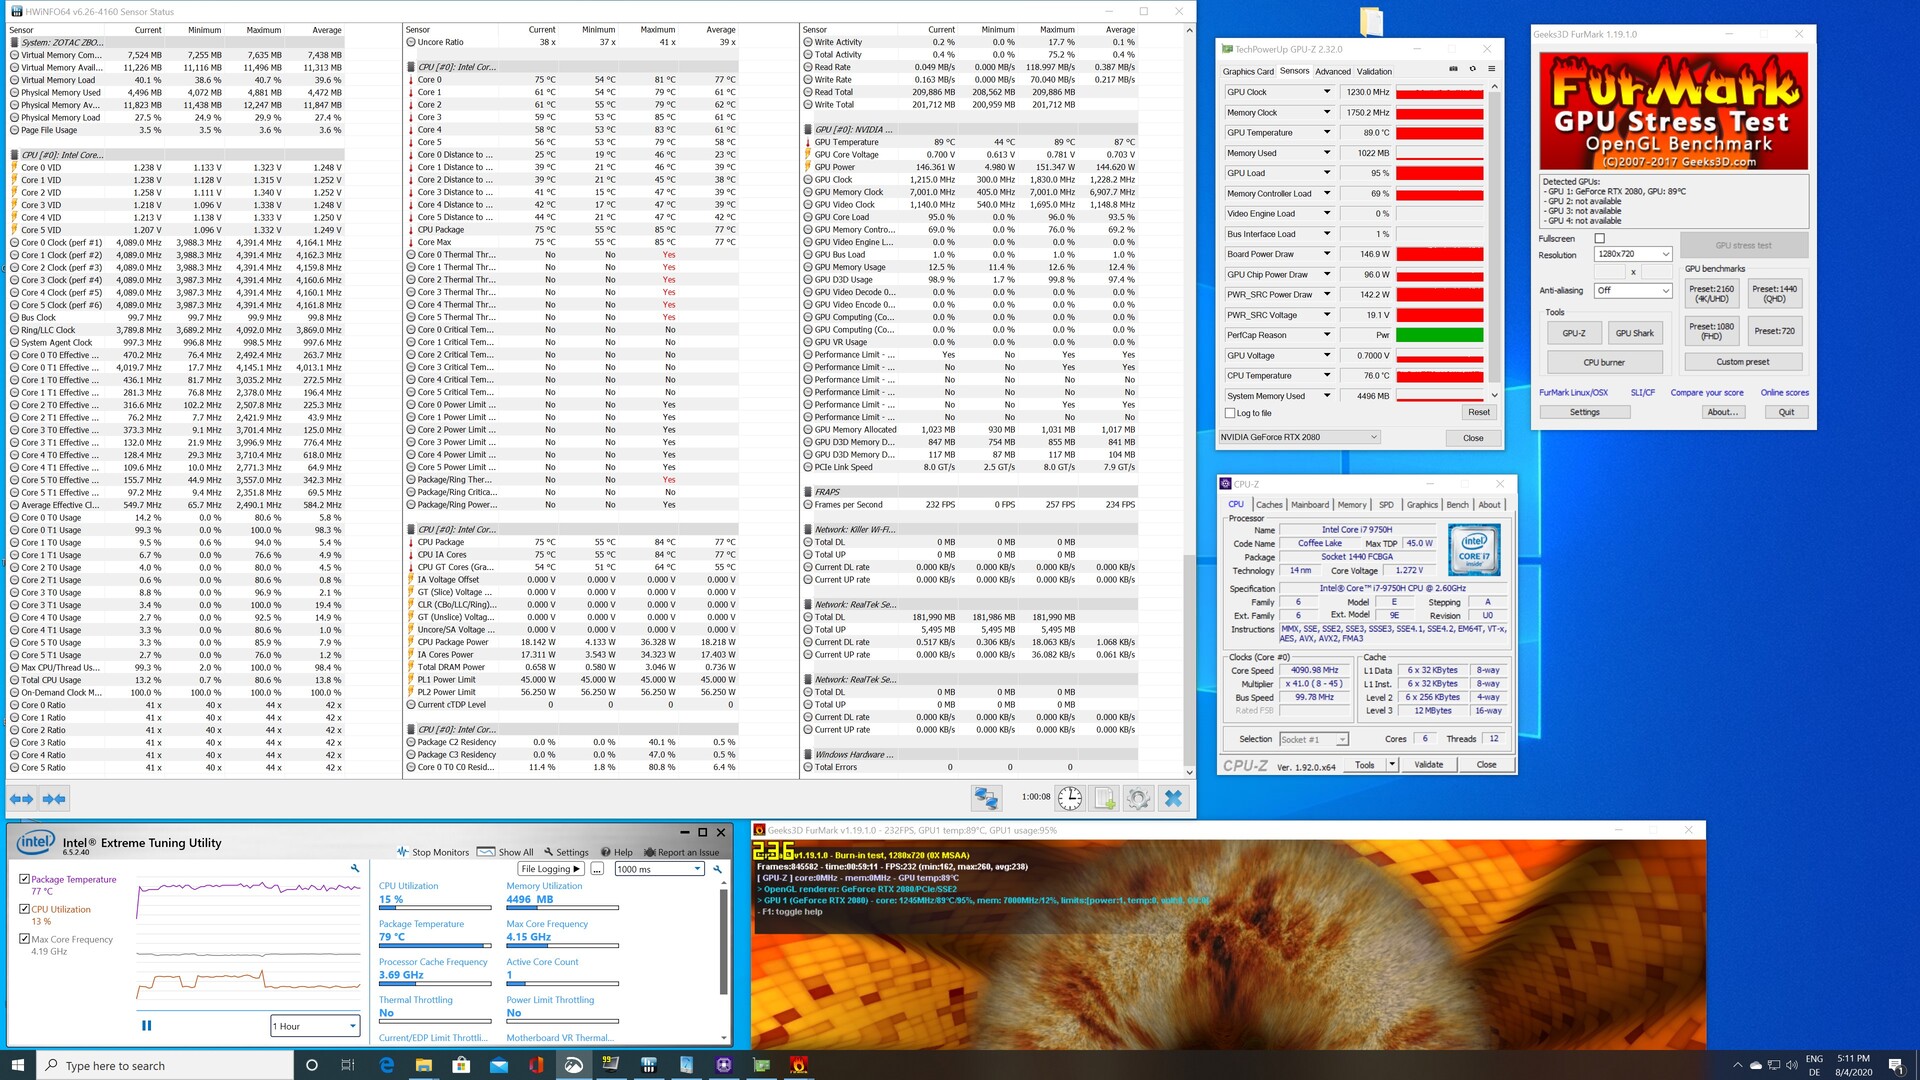
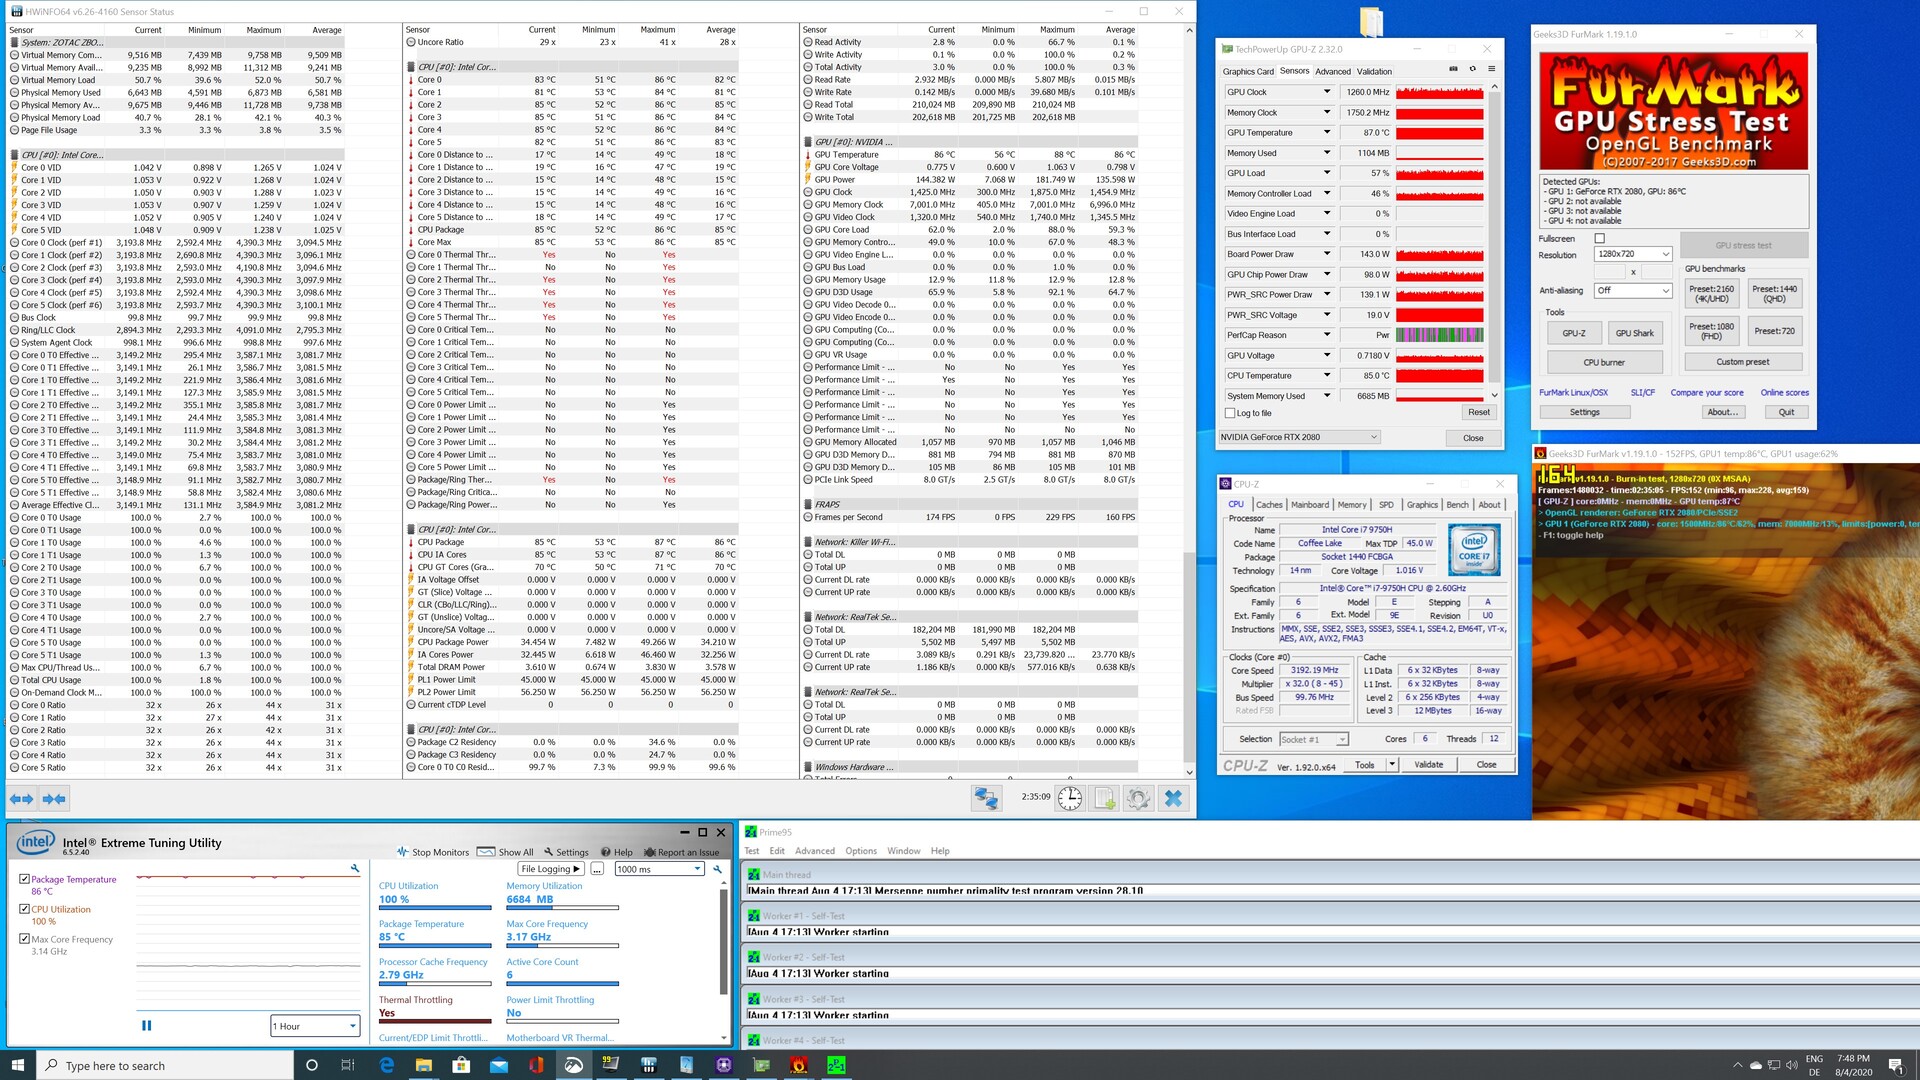
Energieverbrauch und Hitzeentwicklung bei der ZBOX Magnus
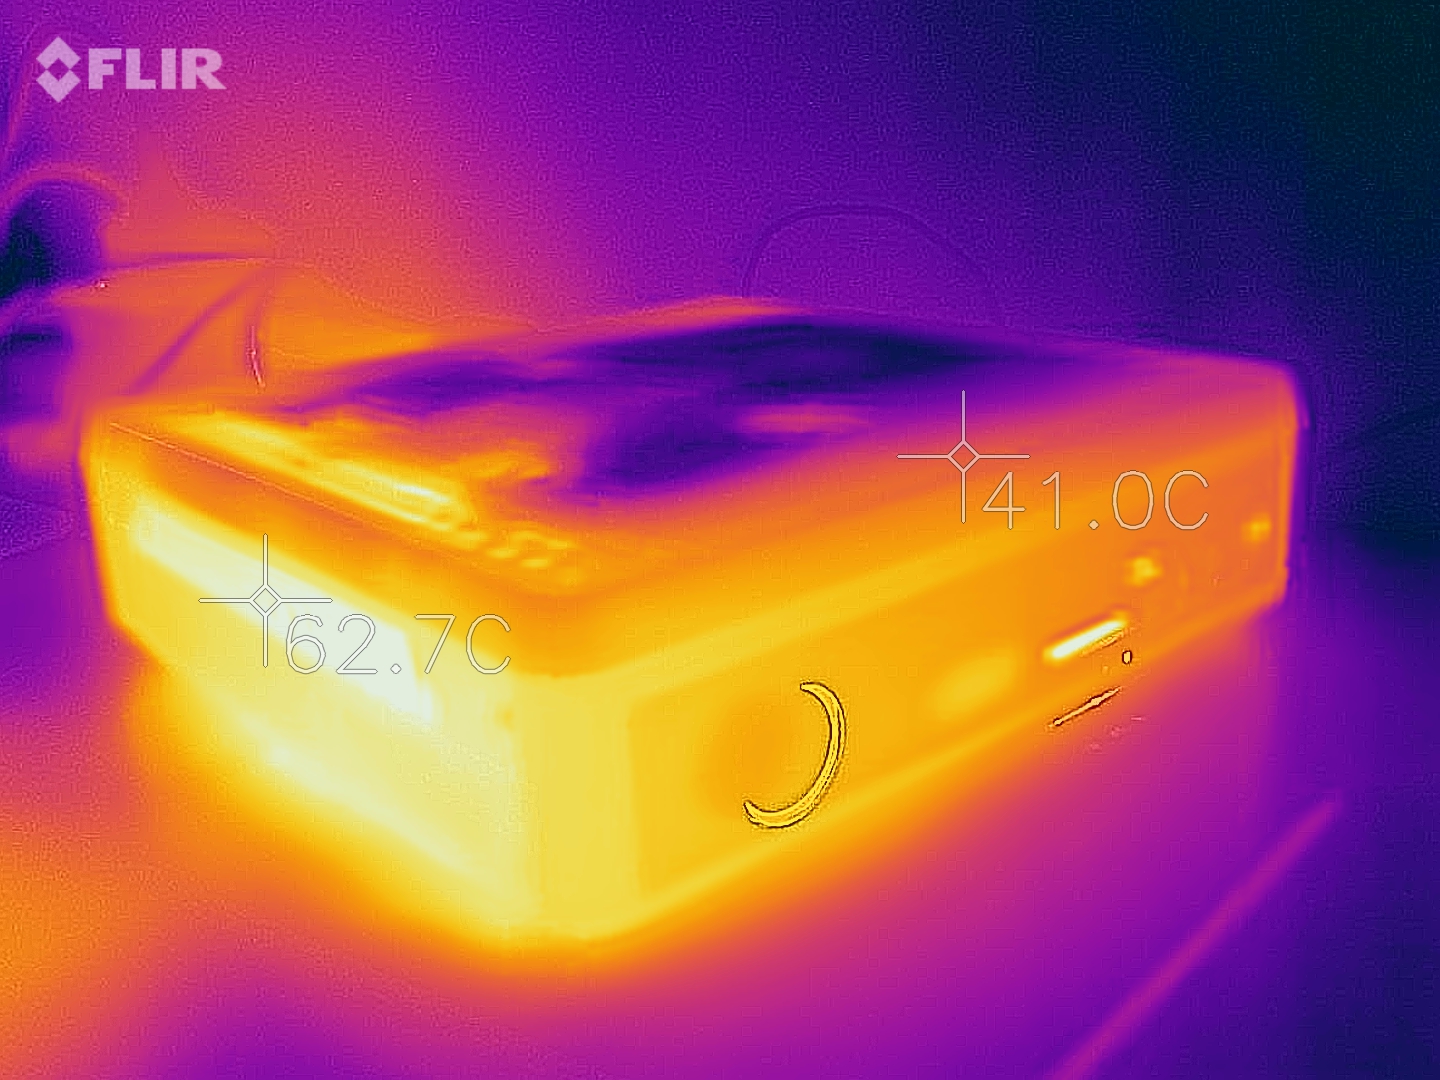
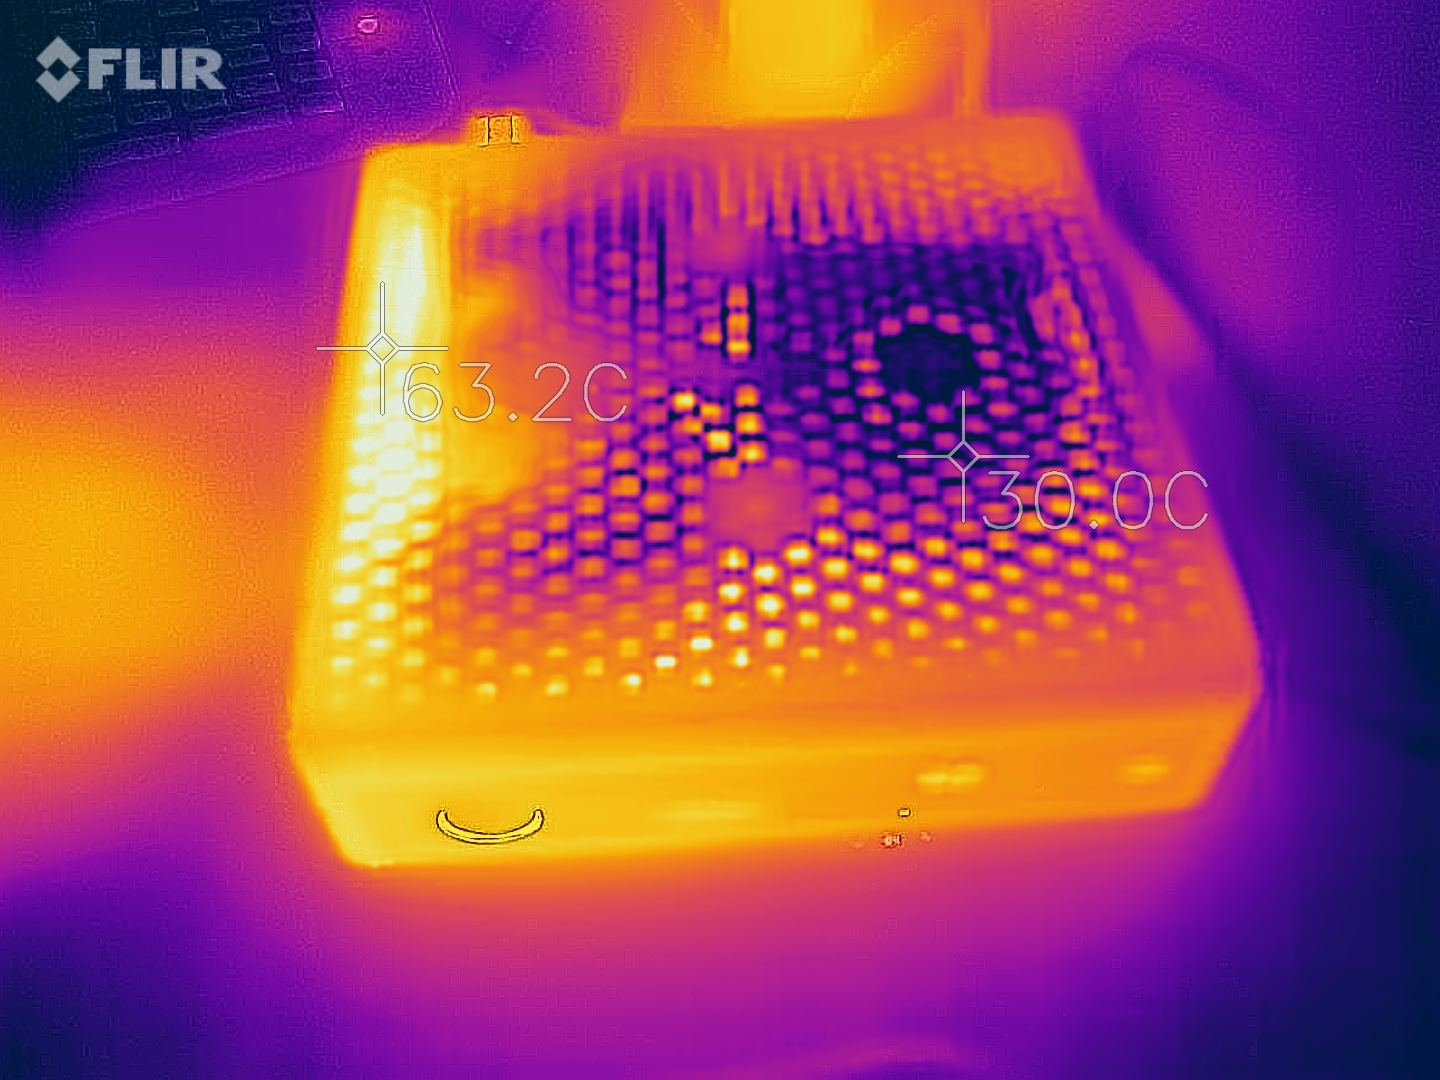
Die ZBOX Magnus von Zotac besitzt ein ausgeklügeltes Kühlsystem, welches die Komponenten effektiv und zuverlässig kühlt. Die meiste Hitze wird seitlich und auf der Rückseite aus dem Gehäuse geleitet. Sehr gut hat uns die Lautstärke unter Last gefallen, denn mit 38,6 dB(A) war der Mini-PC hörbar, aber nicht störend. Das nicht hochfrequente Lüftergeräusch sorgt ebenfalls für ein nicht nerviges Betriebsgeräusch unter Volllast. Beim Spielen war die Geräuschkulisse mit 37,2 dB(A) sogar noch etwas leiser. Trotz der guten Kühlung erhitzen sich Prozessor und Grafikkarte bei unserem Stresstest auf knapp 90 °C. Das liegt noch innerhalb der vorgesehenen Spezifikationen.
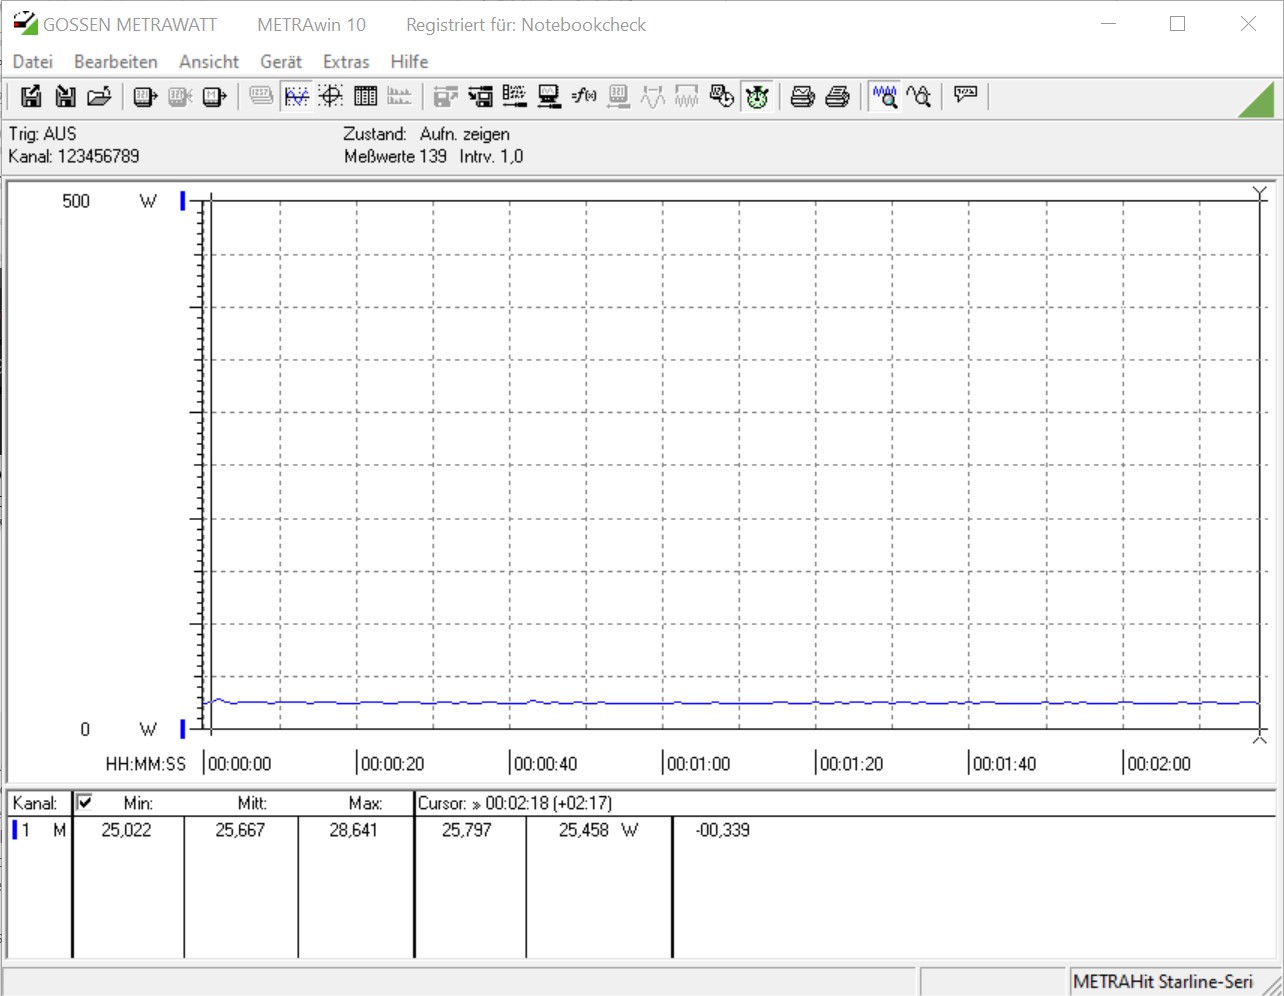
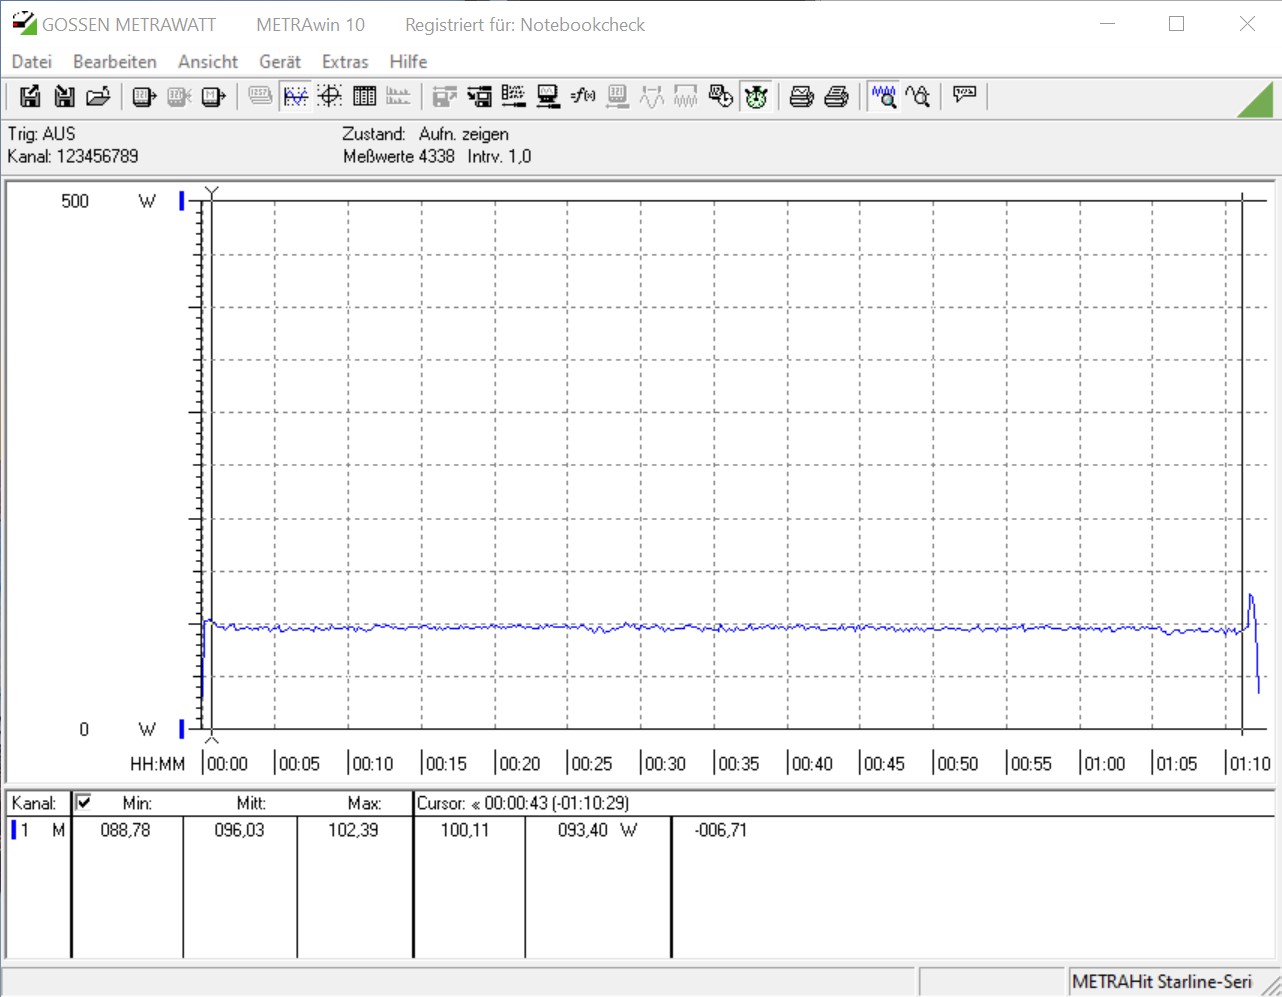
Die eigentliche Stärke der ZBOX liegt in der Energieeffizienz, denn im Vergleich zu einem herkömmlichen Desktop-PC ist unser Testsample sehr sparsam. Auch gegenüber dem Ghost Canyon NUC konnte sich die ZBOX Magnus mit einer geringeren Energieaufnahme behaupten. Maximal 236 Watt haben wir beim Spielen gemessen, da hierbei CPU und GPU extrem belastet werden. Damit hat das 330 Watt starke Netzteil keine Probleme.
| Power Consumption | |
| 1920x1080 The Witcher 3 ultra (external Monitor) | |
| AMD Ryzen 9 3950X (Idle: 95 W) | |
| Intel Core i9-10900K (Idle: 52.3 W) | |
| Intel Core i5-10600K (Idle: 52.2 W) | |
| Intel Core i5 9400F (Idle: 57 W) | |
| Intel Ghost Canyon NUC (RTX 2070) (Idle: 33.1 W) | |
| Zotac ZBOX Magnus EN72070V (Idle: 25.7 W) | |
| Prime95 V2810 Stress (external Monitor) | |
| Intel Core i9-10900K (Idle: 52.3 W) | |
| Intel Core i5-10600K (Idle: 52.2 W) | |
| AMD Ryzen 9 3950X (Idle: 95 W) | |
| Intel Core i5 9400F (Idle: 57 W) | |
| Intel Ghost Canyon NUC (RTX 2070) (Idle: 33.1 W) | |
| Zotac ZBOX Magnus EN72070V (Idle: 25.7 W) | |
| Cinebench R15 Multi (external Monitor) | |
| Intel Core i9-10900K (Idle: 52.3 W) | |
| AMD Ryzen 9 3950X (Idle: 95 W) | |
| Intel Core i5-10600K (Idle: 52.2 W) | |
| Intel Core i5 9400F (Idle: 57 W) | |
| Zotac ZBOX Magnus EN72070V (Idle: 25.7 W) | |
| Temperatures - CPU Temperature Prime95 | |
| Intel Core i9-10900K | |
| Zotac ZBOX Magnus EN72070V | |
| AMD Ryzen 9 3950X | |
| Intel Core i5-10600K | |
| Intel Core i5 9400F | |
* ... kleinere Werte sind besser
Pro
Contra
Fazit - leistungsstarke und leise ZBOX Magnus
Die Zotac ZBOX Magnus ist nicht irgendein Fertig-PC, sondern bietet als Barebone-System dem Nutzer die Möglichkeit das Gerät nach seinen Bedürfnissen zu vervollständigen. Die freie Auswahl fällt dabei auf die Massenspeicher sowie den Arbeitsspeicher. Beim Prozessor und der verbauten Grafikkarte ist man leider limitiert, denn auch ein späteres Aufrüsten dieser Komponenten ist nicht möglich.
Im Test hatten wir die ZBOX Magnus mit dem Intel Core i7-9750H im Zusammenspiel mit der Nvidia GeForce RTX 2080 Mobile. Rein leistungstechnisch kann man mit dem kleinen PC alle modernen Spiele flüssig darstellen, ohne auf Details verzichten zu müssen. Voraussetzung ist allerdings die WQHD-Auflösung. Viele Titel meistert die ZBOX aber auch in UHD, wenngleich man hierbei oftmals die Details reduzieren muss. Im Umkehrschluss liefert die GeForce RTX 2080 Mobile etwa die gleiche Leistung wie die GeForce RTX 2070 Desktop.
Die Zotac ZBOX Magnus ist ein leistungsstarker Gaming-PC im Mini-Format. Vor dem Kauf sollte man sich aber mit den Eigenheiten eines Barebone-Systems vertraut machen.
Einen großen Vorteil liefert das System bei der Lautstärke. Oftmals sind die sehr kompakten Geräte sehr laut und leiden unter starker Hitzeentwicklung. Das Hitzeproblem hat Zotac im Großen und Ganzen sehr gut im Griff und die Lautstärke unter Last geht mit knapp 39 dB(A) ebenfalls in Ordnung.
Wer nun die 1.700 Euro für das Barebone-System investieren möchte kennt nun die Vor- und Nachteile, welche die ZBOX Magnus bietet. Preislich schenken sich Intel mit dem Ghost Canyon NUC und Zotac mit der ZBOX Magnus nichts. Allerdings muss man bedenken, dass beim Ghost Canyon NUC keine dedizierte Grafikkarte im Kaufpreis inkludiert ist. Damit geht dieser Punkt ganz klar an Zotac.
