Notebookcheck Logo

Intel Core Ultra 5 235 vs Intel Core Ultra 5 225F

Intel Core Ultra 5 235

► remove from comparison Intel Ultra 5 235

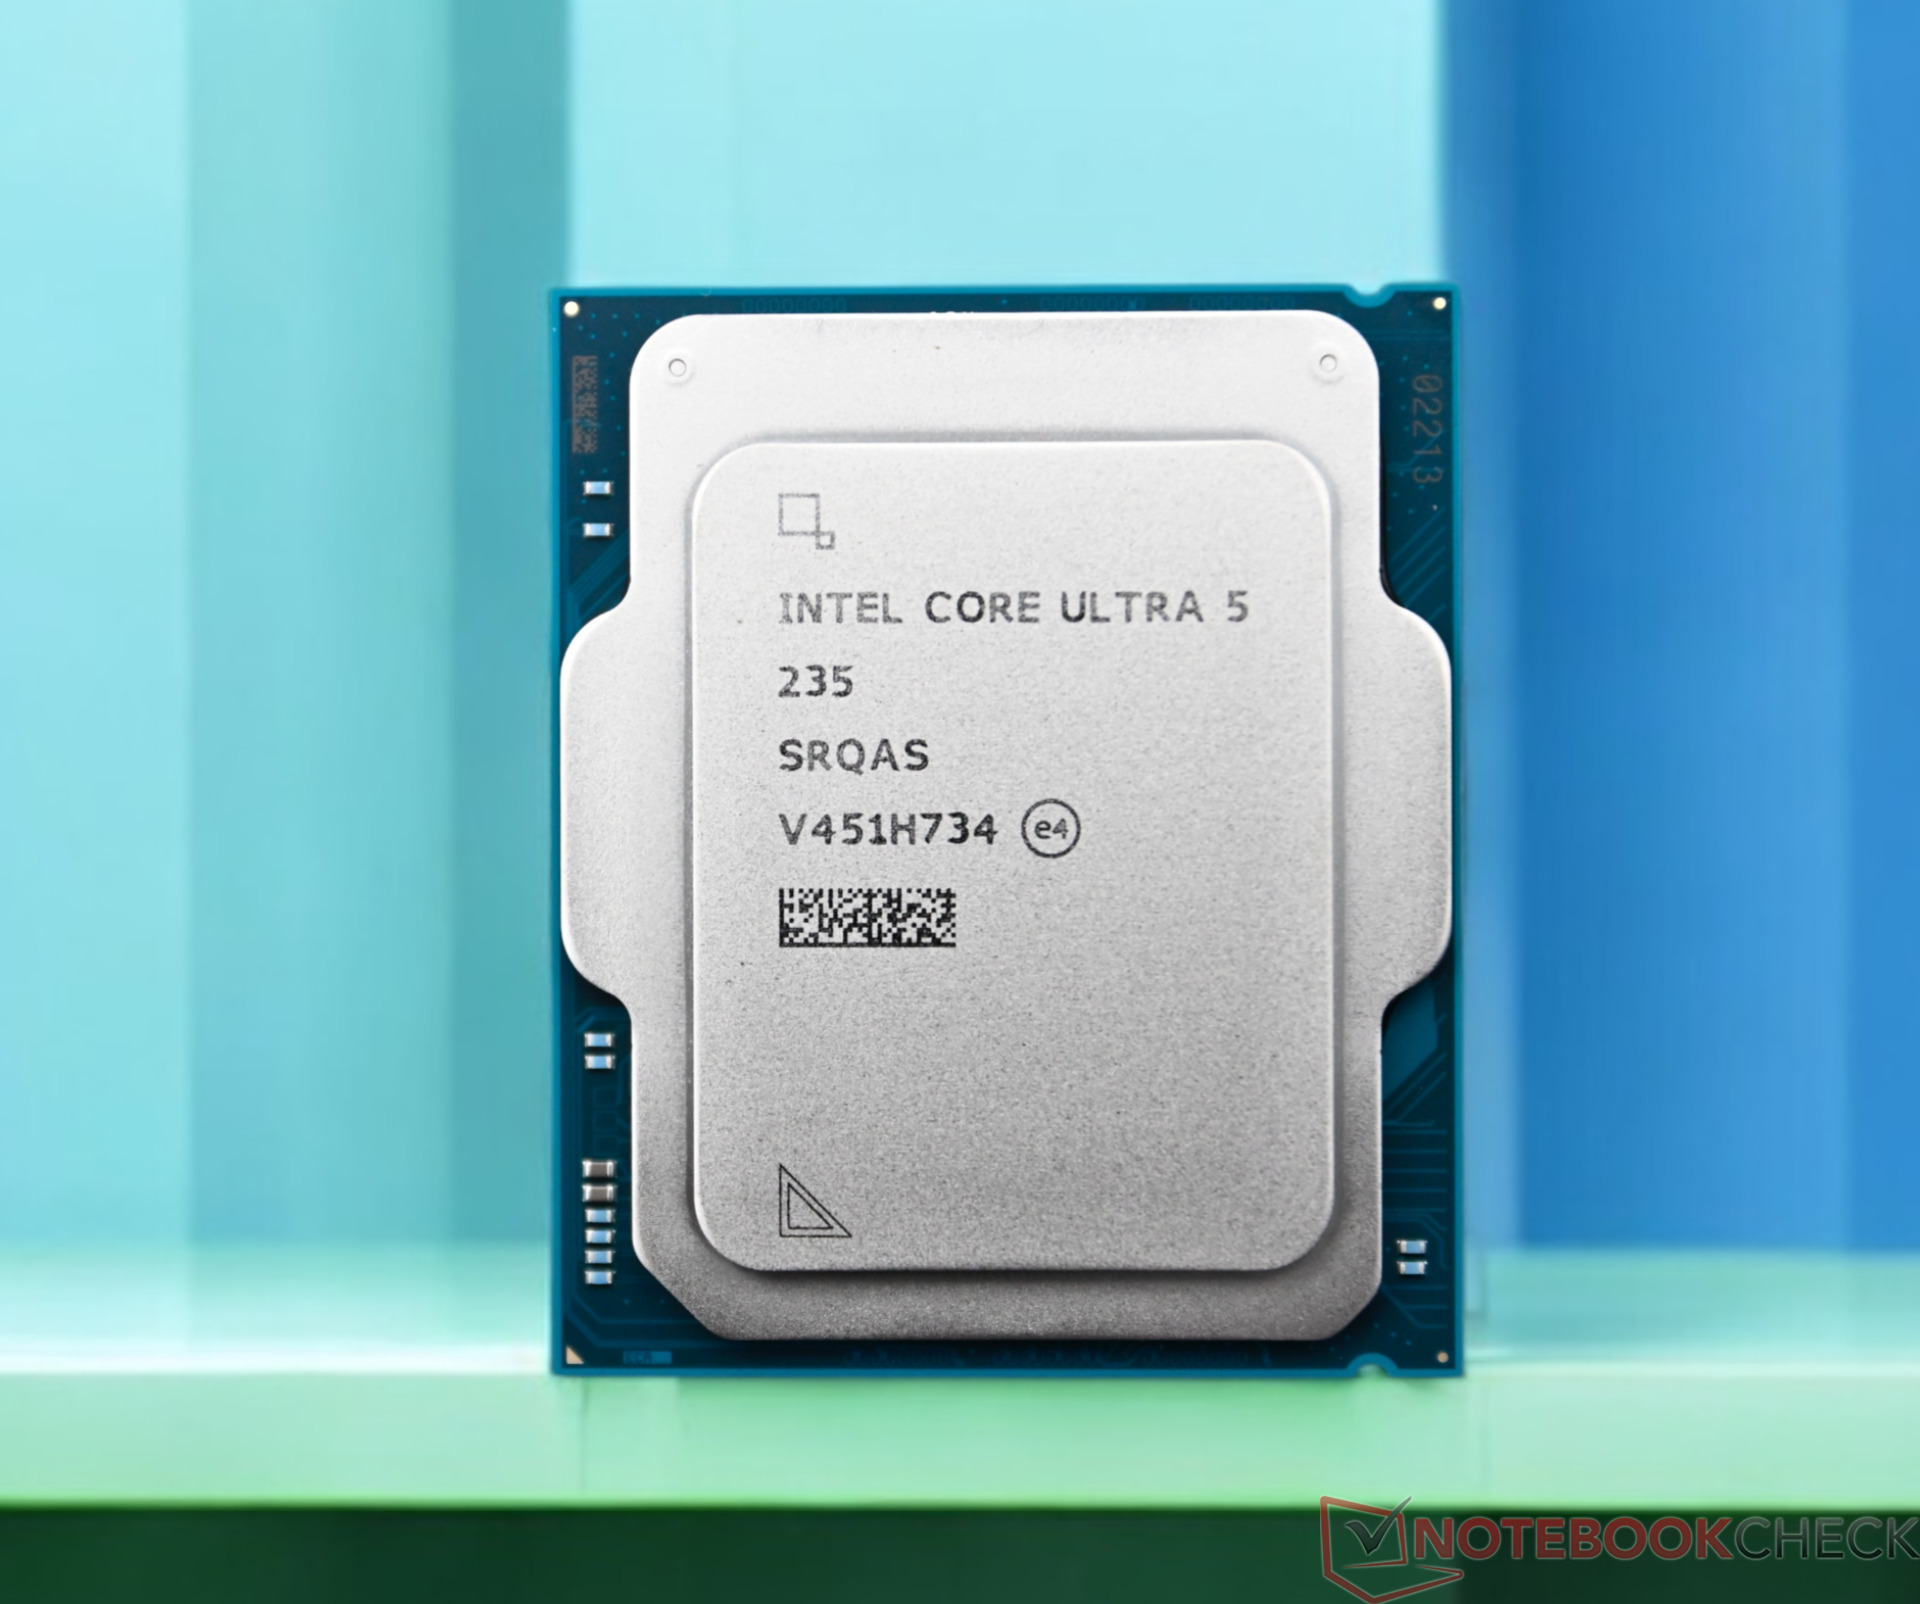
Der Intel Core Ultra 5 235 ist ein auf Arrow Lake-S basierender Desktop-Prozessor mit 14 Kernen der Anfang 2025 vorgestellt wurde. Er bietet 6 Performance Kerne mit bis zu 5 GHz und 8 Effizienzkerne mit bis zu 4,4 GHz.

Die CPU-Performance ist vergleichbar mit dem alten Intel Core i5-13600K und damit gut geeignet auch für anspruchsvolle Aufgaben.

Die Arrow Lake-S Chips werden aus mehreren Chiplets zusammengesetzt. Der CPU-Teil wird bei TSMC im modernen N3B (3nm) Prozess gefertigt, Die GPU kommt ebenfalls von TSMC im N5P Prozess. SoC und I/O Tile werden im TSMC N6 Prozess gefertigt. Der Basis-Tile wird von Intel im 22nm Prozess hergestellt und trägt dank Foveros 3D Packaging die einzelnen Chiplets.

Der TDP ist mit 65 Watt (Langzeit) bis 121 Watt (Turbo) spezifiziert.

Intel Core Ultra 5 225F

► remove from comparison Intel Ultra 5 225F

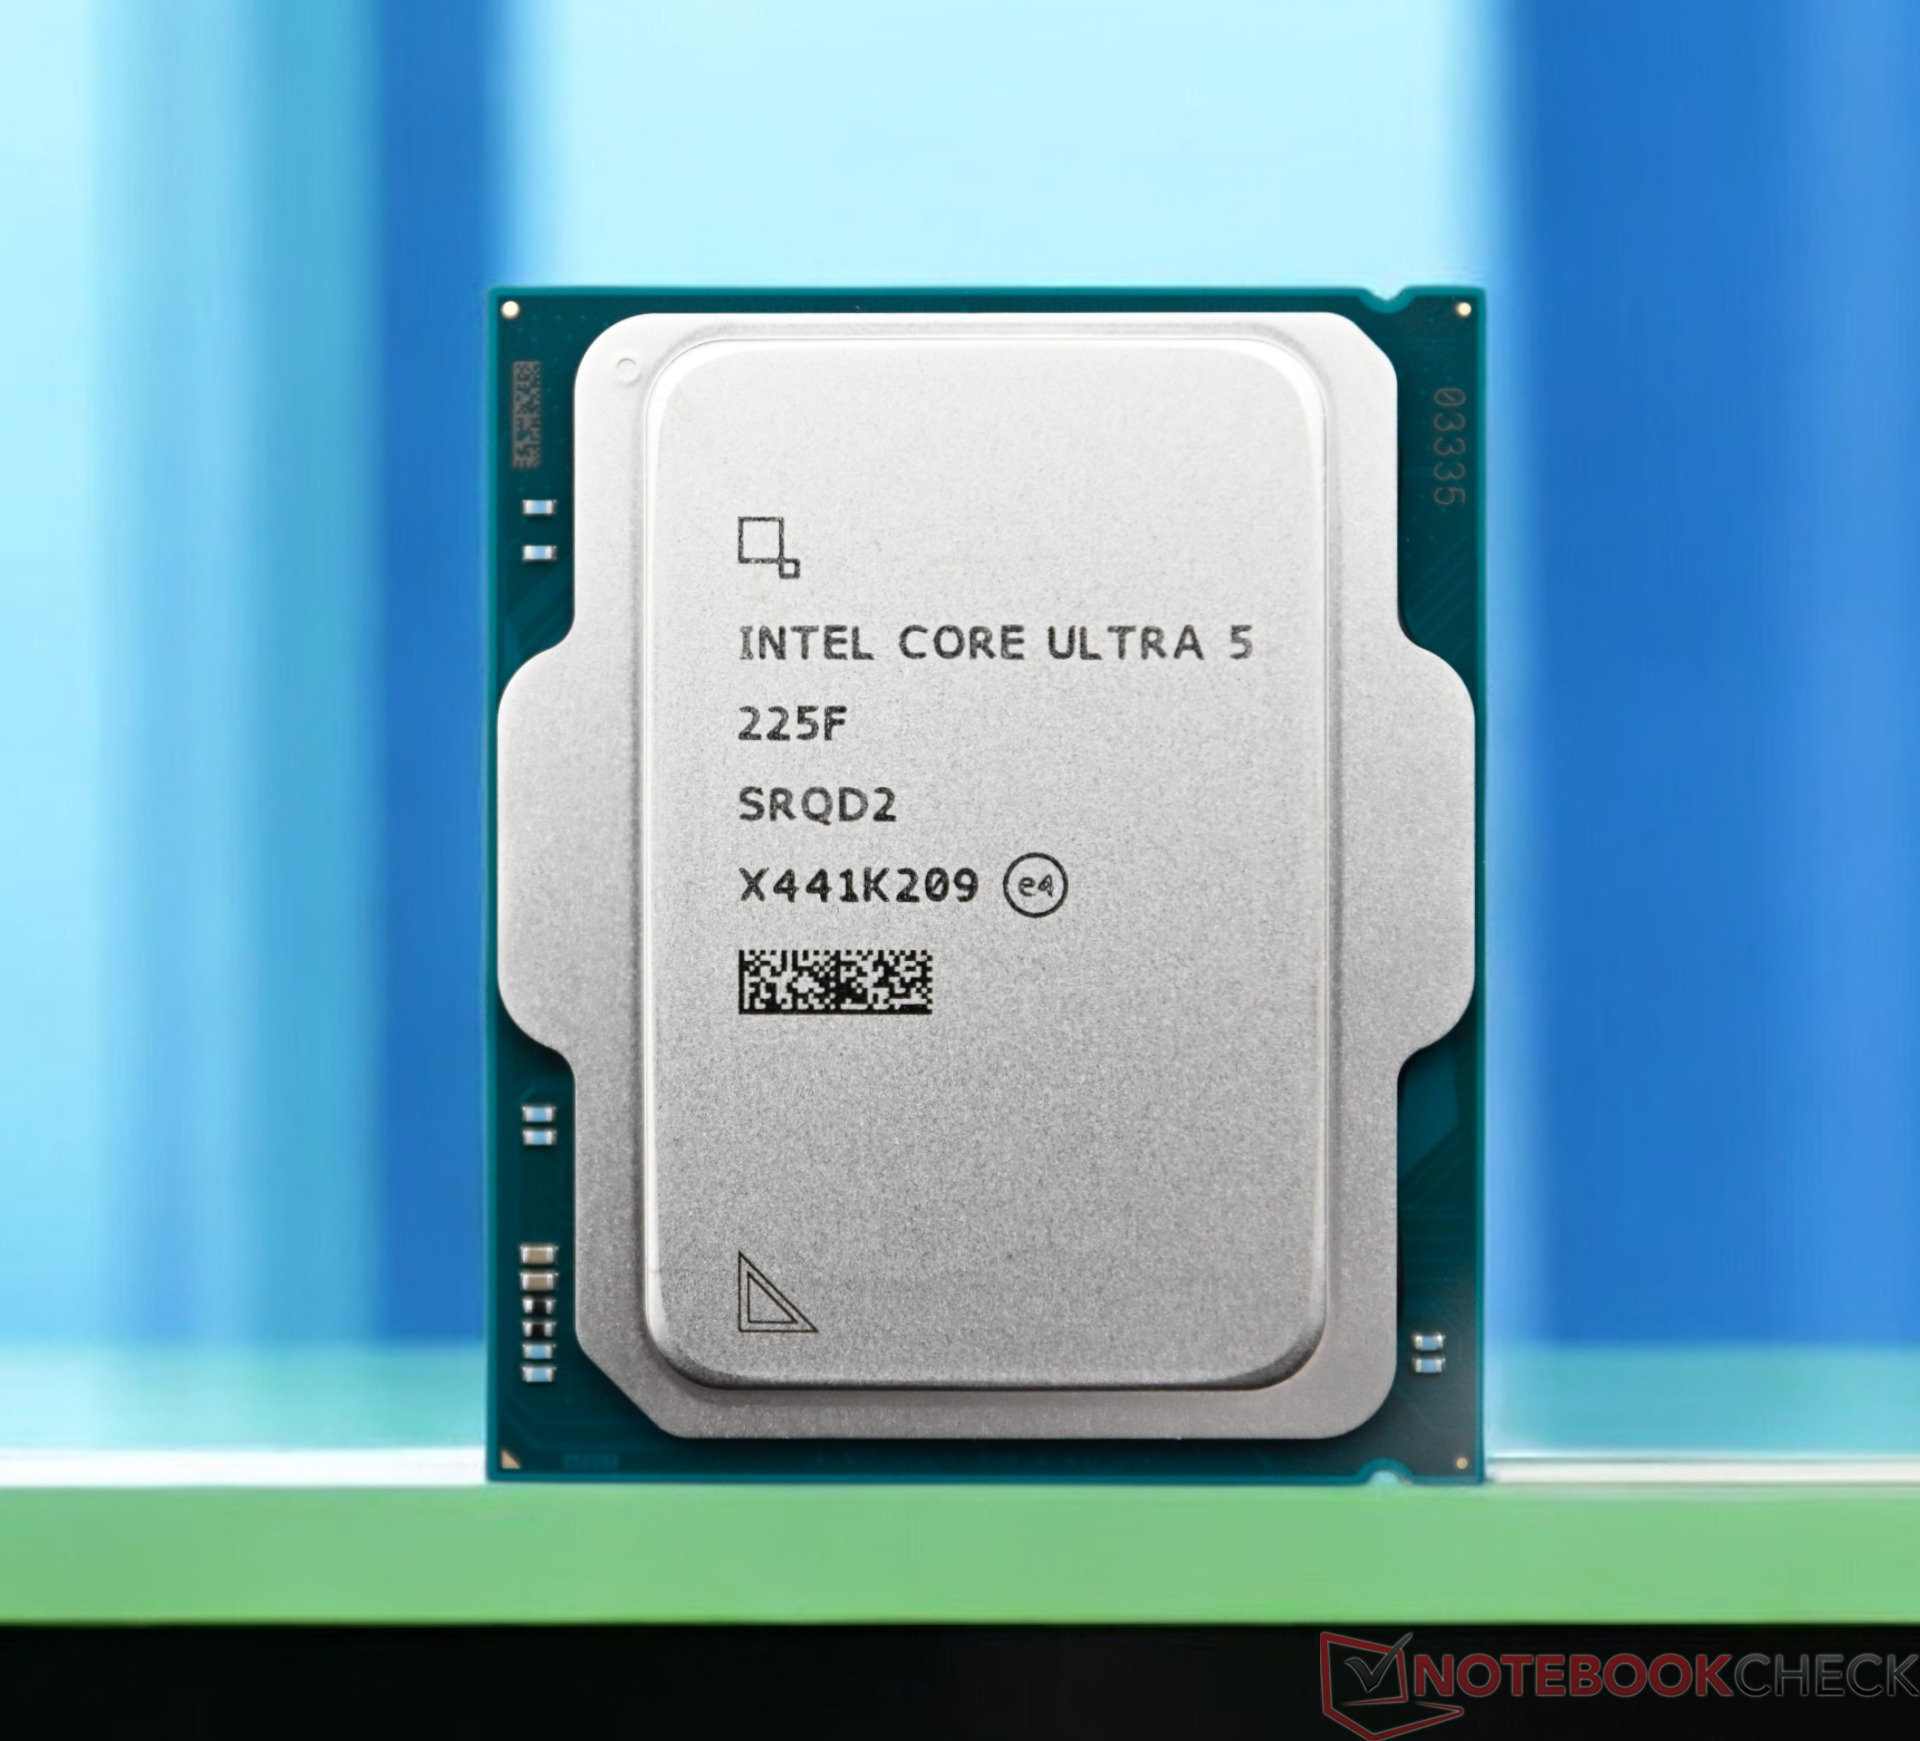
Der Intel Core Ultra 5 225F ist ein relativ sparsamer Desktop Prozessor der Arrow Lake Generation. Er integriert 10 Kerne in zwei Clustern. Die 6 Performance-Kerne (Lion Cove P-Cores) takten von 3,3 bis 4,9 GHz und die 4 Effizienzkerne (Skymont E-Cores) takten von 2,7 bis 4,4 GHz. Die CPU kann auf 20 MB Smart Cache und 22 MB L2-Cache zugreifen.

Detaillierte Benchmarks und Messwerte finden Sie in unserem ausführlichen Testbericht über den Core Ultra 5 225F.

Die F-Serie ist mit einem TDP von 65 Watt spezifiziert und eignet sich daher auch für kleinere Desktop-PCs mit Luftkühlung.

ModelIntel Core Ultra 5 235Intel Core Ultra 5 225F
CodenameArrow Lake-SArrow Lake-S
SeriesIntel Arrow LakeIntel Arrow Lake
Serie: Arrow Lake Arrow Lake-S
Intel Core Ultra 9 285K compare3.2 - 5.7 GHz24 / 24 cores36 MB L3
Intel Core Ultra 9 285 compare1.9 - 5.6 GHz24 / 24 cores36 MB L3
Intel Core Ultra 7 265KF compare3.3 - 5.5 GHz20 / 20 cores30 MB L3
Intel Core Ultra 7 265K compare3.3 - 5.5 GHz20 / 20 cores30 MB L3
Intel Core Ultra 5 245KF compare3.6 - 5.2 GHz14 / 14 cores24 MB L3
Intel Core Ultra 5 245K compare3.6 - 5.2 GHz14 / 14 cores24 MB L3
Intel Core Ultra 5 245 compare3 - 5.1 GHz14 / 14 cores24 MB L3
Intel Core Ultra 5 235 « 3.4 - 5 GHz14 / 14 cores24 MB L3
Intel Core Ultra 5 225F3.3 - 4.9 GHz10 / 10 cores20 MB L3
Intel Core Ultra 5 225 compare3.3 - 4.9 GHz10 / 10 cores20 MB L3
Intel Core Ultra 9 285K compare3.2 - 5.7 GHz24 / 24 cores36 MB L3
Intel Core Ultra 9 285 compare1.9 - 5.6 GHz24 / 24 cores36 MB L3
Intel Core Ultra 7 265KF compare3.3 - 5.5 GHz20 / 20 cores30 MB L3
Intel Core Ultra 7 265K compare3.3 - 5.5 GHz20 / 20 cores30 MB L3
Intel Core Ultra 5 245KF compare3.6 - 5.2 GHz14 / 14 cores24 MB L3
Intel Core Ultra 5 245K compare3.6 - 5.2 GHz14 / 14 cores24 MB L3
Intel Core Ultra 5 245 compare3 - 5.1 GHz14 / 14 cores24 MB L3
Intel Core Ultra 5 2353.4 - 5 GHz14 / 14 cores24 MB L3
Intel Core Ultra 5 225F « 3.3 - 4.9 GHz10 / 10 cores20 MB L3
Intel Core Ultra 5 225 compare3.3 - 4.9 GHz10 / 10 cores20 MB L3
Clock3400 - 5000 MHz3300 - 4900 MHz
L2 Cache26 MB22 MB
L3 Cache24 MB20 MB
Cores / Threads14 / 14
6 x 5.0 GHz Intel Lion Cove P-Core
8 x 4.4 GHz Intel Skymont E-Core
10 / 10
6 x 4.9 GHz Intel Lion Cove P-Core
4 x 4.4 GHz Intel Skymont E-Core
TDP65 Watt65 Watt
TDP Turbo PL2121 Watt121 Watt
Technology3 nm3 nm
SocketLGA1851LGA1851
iGPUIntel Graphics 4-Core iGPU (Meteor / Arrow Lake) (300 - 2000 MHz)
NPU / AI13 TOPS INT813 TOPS INT8
Chip AI27 TOPS INT819 TOPS INT8
Architecturex86x86
$247 U.S.$221 U.S.
Announced
Manufacturerwww.intel.dewww.intel.de
max. Temp.105 °C

Benchmarks

Performance Rating - CB R15 + R20 + 7-Zip + X265 + Blender + 3DM11 CPU - Ultra 5 235
43.8 pt (73%)
Restrict / Search: Model: Max. age: years
Performance Rating - CB R15 + R20 + 7-Zip + X265 + Blender + 3DM11 CPU - Ultra 5 225F
40.3 pt (67%)
Restrict / Search: Model: Max. age: years
Cinebench 2024 - Cinebench 2024 CPU Single Core
127 Points (64%)
119 Points (60%)
Cinebench 2024 - Cinebench 2024 CPU Multi Core
1172 Points (22%)
931 Points (17%)
Cinebench R23 - Cinebench R23 Multi Core
21677 Points (20%)
16467 Points (15%)
Cinebench R23 - Cinebench R23 Single Core
2057 Points (84%)
1893 Points (77%)
Cinebench R20 - Cinebench R20 CPU (Single Core)
795 Points (87%)
726 Points (79%)
Cinebench R20 - Cinebench R20 CPU (Multi Core)
8518 Points (21%)
6386 Points (16%)
Cinebench R15 - Cinebench R15 CPU Multi 64 Bit
3642 Points (23%)
2660 Points (17%)
Cinebench R15 - Cinebench R15 CPU Single 64 Bit
312 Points (86%)
287 Points (80%)
Cinebench R11.5 - Cinebench R11.5 CPU Multi 64 Bit
44.3 Points (57%)
32.7 Points (42%)
Cinebench R11.5 - Cinebench R11.5 CPU Single 64 Bit
3.8 Points (90%)
3.6 Points (86%)
Cinebench R10 - Cinebench R10 Rend. Single (32bit)
11400 Points (69%)
11133 Points (67%)
Cinebench R10 - Cinebench R10 Rend. Multi (32bit)
84924 Points (62%)
71536 Points (52%)
Cinebench R10 - Cinebench R10 Rend. Multi (64bit)
131431 Points (84%)
115987 Points (74%)
Cinebench R10 - Cinebench R10 Rend. Single (64bit)
17602 Points (21%)
17066 Points (21%)
wPrime 2.10 - wPrime 2.0 1024m *
77.7 s (1%)
107.7 s (1%)
wPrime 2.10 - wPrime 2.0 32m *
2.8 s (1%)
3.6 s (1%)
WinRAR - WinRAR 4.0
9883 Points (16%)
8846 Points (14%)
7-Zip 18.03 - 7-Zip 18.03 Multi Thread 4 runs
71174 MIPS (41%)
54166 MIPS (31%)
7-Zip 18.03 - 7-Zip 18.03 Single Thread 4 runs
6479 MIPS (76%)
6000 MIPS (71%)
X264 HD Benchmark 4.0 - x264 Pass 2
200.9 fps (5%)
148.9 fps (4%)
X264 HD Benchmark 4.0 - x264 Pass 1
378 fps (10%)
364.5 fps (9%)
HWBOT x265 Benchmark v2.2 - HWBOT x265 4k Preset
25 fps (44%)
20.7 fps (36%)
TrueCrypt - TrueCrypt Serpent
1.4 GB/s (41%)
1 GB/s (29%)
TrueCrypt - TrueCrypt Twofish
2.8 GB/s (48%)
2.1 GB/s (36%)
TrueCrypt - TrueCrypt AES
15.9 GB/s (41%)
11.6 GB/s (30%)
Blender - Blender 3.3 Classroom CPU *
278 Seconds (4%)
351 Seconds (4%)
Blender - Blender 2.79 BMW27 CPU *
168 Seconds (1%)
218 Seconds (2%)
R Benchmark 2.5 - R Benchmark 2.5 *
0.4 sec (9%)
0.5 sec (10%)
3DMark 06 - CPU - 3DMark 06 - CPU
19133 Points (41%)
16795 Points (36%)
Super Pi mod 1.5 XS 1M - Super Pi mod 1.5 XS 1M *
7.6 s (2%)
7.8 s (2%)
Super Pi mod 1.5 XS 2M - Super Pi mod 1.5 XS 2M *
16.7 s (1%)
17 s (1%)
3DMark Vantage - 3DM Vant. Perf. CPU no Physx
104702 Points (80%)
80449 Points (62%)
3DMark 11 - 3DM11 Performance Physics
26990 Points (66%)
21562 Points (53%)
3DMark - 3DMark Ice Storm Physics
113507 Points (92%)
115779 Points (94%)
3DMark - 3DMark Ice Storm Extreme Physics
114645 Points (93%)
115875 Points (94%)
3DMark - 3DMark Ice Storm Unlimited Physics
116826 Points (94%)
119117 Points (96%)
3DMark - 3DMark Cloud Gate Physics
24481 Points (62%)
19272 Points (49%)
3DMark - 3DMark Fire Strike Standard Physics
37722 Points (67%)
31547 Points (56%)
3DMark - 3DMark Time Spy CPU
16138 Points (68%)
11220 Points (47%)
Geekbench 6.5 - Geekbench 6.5 Single-Core
2971 Points (69%)
2860 Points (66%)
Geekbench 6.5 - Geekbench 6.5 Multi-Core
17484 Points (68%)
14878 Points (58%)
Geekbench 5.5 - Geekbench 5.1 - 5.5 64 Bit Single-Core
2171 Points (73%)
2082 Points (70%)
Geekbench 5.5 - Geekbench 5.1 - 5.5 64 Bit Multi-Core
17696 Points (32%)
13898 Points (25%)
Geekbench 5.0 - Geekbench 5.0 64 Bit Single-Core
2127 Points (9%)
2035 Points (9%)
Geekbench 5.0 - Geekbench 5.0 64 Bit Multi-Core
17664 Points (56%)
13908 Points (44%)
Geekbench 4.4 - Geekbench 4.1 - 4.4 64 Bit Single-Core
9043 Points (90%)
8813 Points (88%)
Geekbench 4.4 - Geekbench 4.1 - 4.4 64 Bit Multi-Core
65823 Points (65%)
50491 Points (49%)
Mozilla Kraken 1.1 - Kraken 1.1 Total Score *
436 ms (1%)
451 ms (1%)
WebXPRT 4 - WebXPRT 4 Score
313 Points (82%)
304 Points (79%)
WebXPRT 3 - WebXPRT 3 Score
329 Points (59%)
319 Points (57%)
CrossMark - CrossMark Overall
2131 Points (80%)
2006 Points (75%)
Power Consumption - Prime95 Power Consumption - external Monitor *
163 Watt (28%)
163.7 Watt (28%)
Power Consumption - Cinebench R15 Multi Power Consumption - external Monitor *
225 Watt (41%)
193.8 Watt (35%)
Power Consumption - Idle Power Consumption - external Monitor *
92.3 Watt (61%)
94 Watt (62%)
Power Consumption - Power Efficiency - Cinebench R15 Multi external Monitor
16.2 Points per Watt (12%)
13.7 Points per Watt (10%)

Average Benchmarks Intel Core Ultra 5 235 → 100% n=51

Average Benchmarks Intel Core Ultra 5 225F → 86% n=51

- Bereich der Benchmarkergebnisse für diese Grafikkarte
red legend - Durchschnittliche Benchmarkergebnisse für diese Grafikkarte
* Smaller numbers mean a higher performance
1 This benchmark is not used for the average calculation

Add one or more devices and compare

In the following list you can select (and also search for) devices that should be added to the comparison. You can select more than one device.

restrict list:
v1.35
log 02. 13:28:58

#0 ran 0s before starting gpusingle class +0s ... 0s

#1 checking url part for id 19651 +0s ... 0s

#2 checking url part for id 19654 +0s ... 0s

#3 redirected to Ajax server, took 1767356938s time from redirect:0 +0s ... 0s

#4 did not recreate cache, as it is less than 5 days old! Created at Thu, 01 Jan 2026 05:18:32 +0100 +0s ... 0s

#5 composed specs +0.004s ... 0.004s

#6 did output specs +0s ... 0.004s

#7 getting avg benchmarks for device 19651 +0.005s ... 0.009s

#8 got single benchmarks 19651 +0.006s ... 0.015s

#9 getting avg benchmarks for device 19654 +0.005s ... 0.019s

#10 got single benchmarks 19654 +0.005s ... 0.024s

#11 got avg benchmarks for devices +0s ... 0.024s

#12 min, max, avg, median took s +0.053s ... 0.078s

#13 return log +0.002s ... 0.08s

Teilen Sie diesen Artikel, um uns zu unterstützen. Jeder Link hilft!
Mail Logo
> Notebook Test, Laptop Test und News > Benchmarks / Technik > Benchmarks / Technik > Prozessor Vergleich - Head 2 Head
Autor: Klaus Hinum,  8.09.2017 (Update:  1.07.2023)