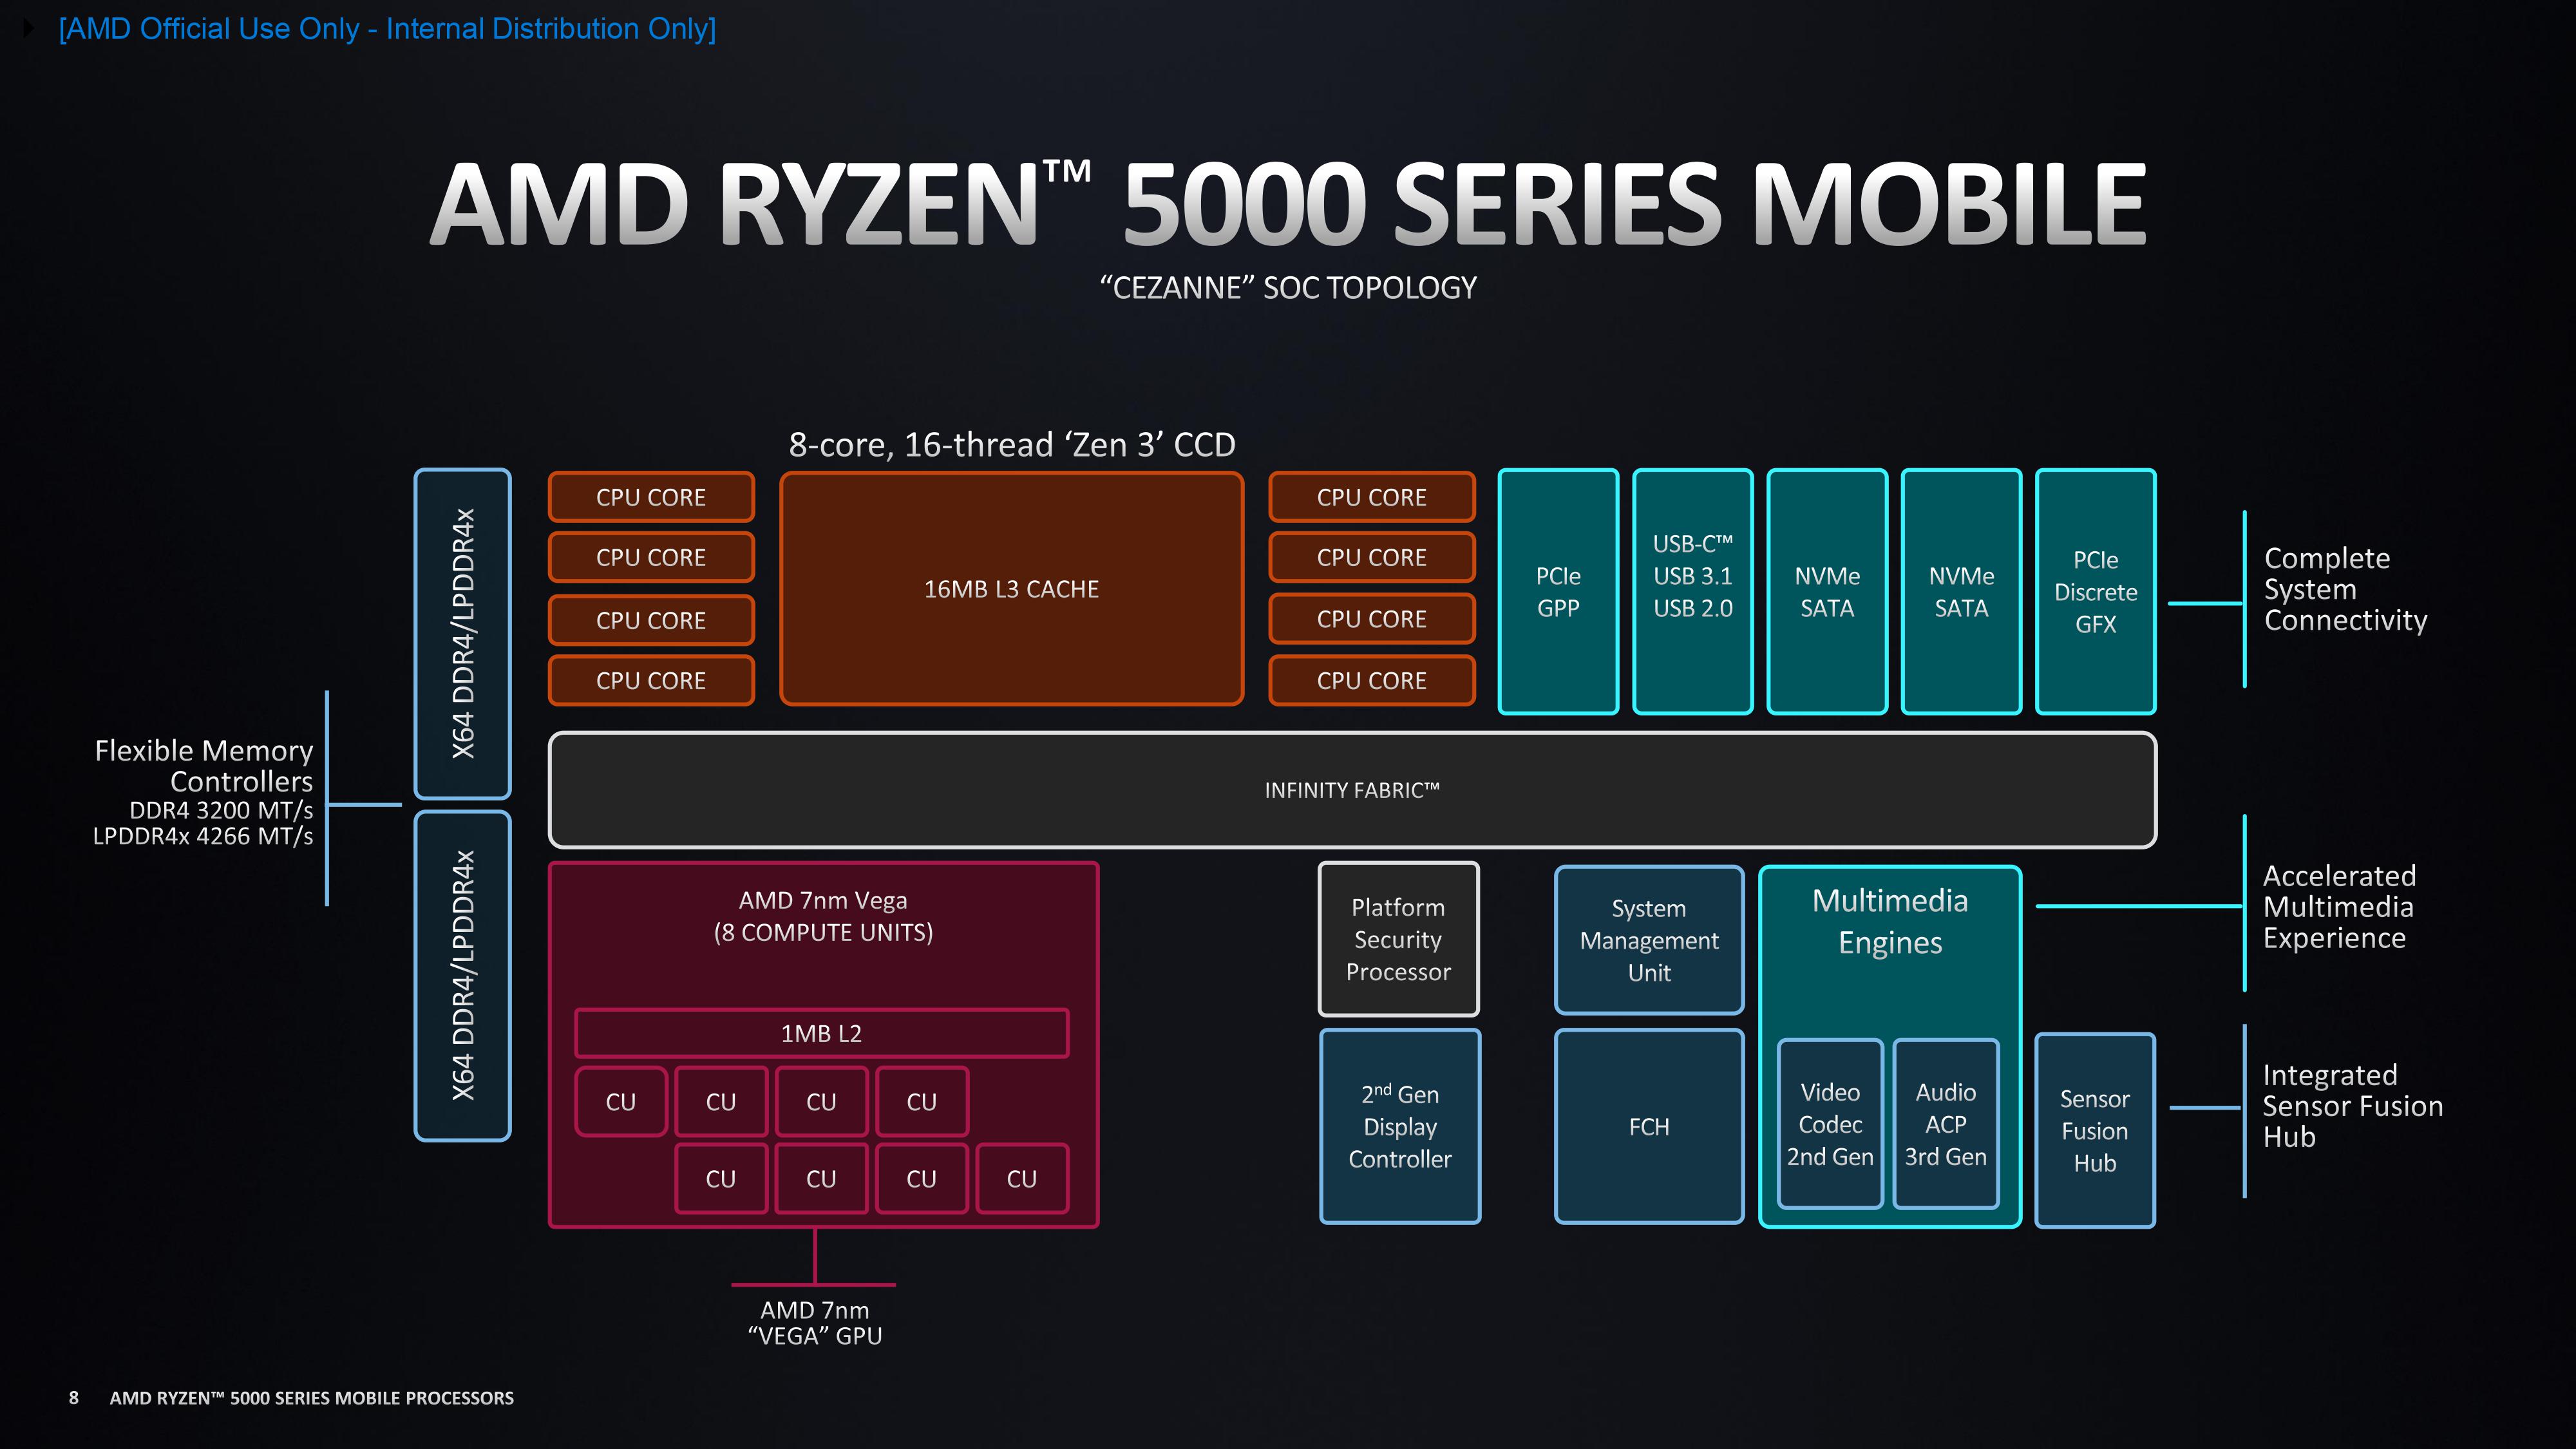
AMD Ryzen 7 5825U ► remove from comparison Der AMD Ryzen 7 5825U ist ein Mobilprozessor für kleine und leichte Notebooks basierend auf die Cezanne Serie. Er ist Teil des Barcelo-Refresh Anfang 2022. Der SoC beinhaltet acht Zen 3 Kerne (Octa-Core CPU) welche von 2 bis zu 4,5 GHz getaktet werden (Turbo) und SMT / Hyperthreading (16 Threads) unterstützen. Der Chip wird im modernen 7nm Prozess bei TSMC gefertigt. Im Vergleich zum Ryzen 7 5800U , bietet der 5825U um 100 MHz höhere Taktraten der CPU-Kerne.
Die Leistung sollte nur minimal oberhalb des Ryzen 7 5800U liegen und hinter dem neuen Ryzen 7 6800U mit bis zu 4,7 GHz und deutlich schnellerer iGPU.
Der SoC integriert neben den acht Prozessorkernen noch eine Radeon RX Vega 8 Grafikkarte mit 8 CUs und bis zu 2000 MHz Takt (bzw. 1900 MHz im Geekbench Leak), einen Dual-Channel DDR4 Speicherkontroller (DDR4-3200, LPDDR4-4266) und 16 MB Level 3 Cache.
Der TDP ist weiterhin von 10 - 25 Watt konfigurierbar (15 Watt Default, in den meisten Notebooks aber 25 Watt). Daher ist der Chip auch für kleine und leichte Notebooks geeignet.
Intel Core i5-7600K ► remove from comparison Der Intel Core i5-7600K ist ein High-End Quad-Core Desktop-Prozessor auf Basis der Kaby-Lake-Architektur , der im August 2015 vorgestellt wurde. Die in einem verbesserten 14-Nanometer-Prozess gefertigte CPU taktet mit 3,8 bis 4,2 GHz, bietet jedoch kein Hyper-Threading (daher nur 4 Threads). Als sogenanntes "K"-Modell verfügt der Core i7-7700K über einen freien Multiplikator und lässt sich so besonders einfach übertakten.
Performance
Durch die relativ hohe Taktrate positioniert sich der i5-7600K etwa 10% vor dem direkten Vorgänger, dem Core i5-6600K und etwas hinter dem älteren Spitzenmodell i7-4790K. Die Leistung pro Takt ist identisch zu den Skylake Modellen. Auch anspruchsvollste Programme und Spiele werden von der High-End-CPU problemlos bewältigt.
Mehr Benchmarks finden Sie auch in unserem Vergleich der AMD Ryzen 7 CPUs gegen Intel CPUs .
Grafikeinheit
Für Grafikberechnungen zeigt sich die im Prozessor integrierte Intel HD Graphics 630 mit 24 EUs (Execution Units) verantwortlich, die mit 350 - 1150 MHz taktet. Die Leistung ist vergleichbar mit der alten Intel HD Graphics 530 und siedelt sich daher im absoluten Low-End-Bereich an, sodass aktuelle Spiele allenfalls in niedrigen Einstellungen flüssig dargestellt werden.
Leistungsaufnahme
Der TDP ist wie beim Spitzenmodell i7-7700K mit 91 Watt festgelegt.
Model AMD Ryzen 7 5825U Intel Core i5-7600K Codename Barcelo-U (Zen 3) Kaby Lake Series AMD Cezanne (Zen 3, Ryzen 5000) Intel Kaby Lake Serie: Kaby Lake Kaby Lake Clock 2000 - 4500 MHz 3800 - 4200 MHz L1 Cache 512 KB 256 KB L2 Cache 4 MB 1 MB L3 Cache 16 MB 8 MB Cores / Threads 8 / 16 4 / 4 TDP 15 Watt 91 Watt Technology 7 nm 14 nm max. Temp. 95 °C Socket FP6 FCLGA1151 Features DDR4-3200/LPDDR4x-4266 RAM (incl. ECC), PCIe 3, MMX, SSE, SSE2, SSE3, SSSE3, SSE4A, SSE4.1, SSE4.2, AVX, AVX2, BMI2, ABM, FMA, ADX, SMEP, SMAP, SMT, CPB, AES-NI, RDRAND, RDSEED, SHA, SME DDR3(L)-1600/DDR4-2400 Memory Controller, AVX, AVX2, AES-NI, TSX-NI, Quick Sync, Virtualization, vPro iGPU AMD Radeon RX Vega 8 (Ryzen 4000/5000) ( - 2000 MHz)Intel HD Graphics 630 (350 - 1150 MHz)Architecture x86 x86 Announced Manufacturer www.amd.com ark.intel.com $242 U.S.
Performance Rating - CB R15 + R20 + 7-Zip + X265 + Blender + 3DM11 CPU - R7 5825U
Cinebench 2024 - Cinebench 2024 CPU Single Core
Cinebench 2024 - Cinebench 2024 CPU Multi Core
Cinebench R23 - Cinebench R23 Multi Core
min: 9339 avg: 10179 median: 10152 (9%) max: 10904 Points
CPU TDP ? TDP 10 W TDP 15 W TDP 30 W TDP 37 W 86% 93% 93% 95% 100%
Cinebench R23 - Cinebench R23 Single Core
min: 1433 avg: 1448 median: 1452 (59%) max: 1460 Points
CPU TDP ? TDP 10 W TDP 15 W TDP 30 W TDP 37 W 99% 99% 100% 98% 100%
Cinebench R20 - Cinebench R20 CPU (Single Core)
min: 547 avg: 559 median: 565 (62%) max: 567 Points
CPU TDP ? TDP 10 W TDP 15 W TDP 30 W TDP 37 W 96% 100% 100% 96% 100%
Cinebench R20 - Cinebench R20 CPU (Multi Core)
min: 3645 avg: 3954 median: 3973 (10%) max: 4180 Points
CPU TDP ? TDP 10 W TDP 15 W TDP 30 W TDP 37 W 87% 95% 94% 97% 100%
Cinebench R15 - Cinebench R15 CPU Multi 64 Bit
min: 1575 avg: 1736 median: 1757 (11%) max: 1860 Points
CPU TDP ? TDP 10 W TDP 15 W TDP 30 W TDP 37 W 85% 97% 91% 94% 100%
min: 660 avg: 674 median: 674 (4%) max: 688 Points
CPU TDP ? TDP 10 W TDP 15 W TDP 30 W TDP 37 W 52% 97% 91% 94% 100%
Cinebench R15 - Cinebench R15 CPU Single 64 Bit
min: 228 avg: 231.6 median: 232 (64%) max: 235 Points
CPU TDP ? TDP 10 W TDP 15 W TDP 30 W TDP 37 W 99% 98% 100% 97% 99%
min: 168 avg: 179.5 median: 179.5 (50%) max: 191 Points
CPU TDP ? TDP 10 W TDP 15 W TDP 30 W TDP 37 W 84% 98% 100% 97% 99%
Cinebench R11.5 - Cinebench R11.5 CPU Multi 64 Bit
min: 18.56 avg: 19.1 median: 19.1 (25%) max: 19.72 Points
CPU TDP 10 W TDP 15 W 94% 100%
min: 7.67 avg: 7.9 median: 7.9 (10%) max: 8.07 Points
CPU TDP ? TDP 10 W TDP 15 W 40% 94% 100%
Cinebench R11.5 - Cinebench R11.5 CPU Single 64 Bit
min: 2.75 avg: 2.8 median: 2.8 (66%) max: 2.78 Points
CPU TDP 10 W TDP 15 W 99% 100%
min: 1.98 avg: 2 median: 2 (48%) max: 2.05 Points
CPU TDP ? TDP 10 W TDP 15 W 72% 99% 100%
Cinebench R10 - Cinebench R10 Rend. Single (32bit)
min: 6200 avg: 6252 median: 6252 (38%) max: 6304 Points
CPU TDP 10 W TDP 15 W 100% 98%
min: 6730 avg: 6814 median: 6814 (41%) max: 6898 Points
CPU TDP ? TDP 10 W TDP 15 W 100% 93% 91%
Cinebench R10 - Cinebench R10 Rend. Multi (32bit)
min: 32641 avg: 32965 median: 32964.5 (24%) max: 33288 Points
CPU TDP 10 W TDP 15 W 98% 100%
min: 23585 avg: 24179 median: 24179 (18%) max: 24773 Points
CPU TDP ? TDP 10 W TDP 15 W 73% 98% 100%
Cinebench R10 - Cinebench R10 Rend. Multi (64bit)
min: 59300 avg: 59732 median: 59731.5 (38%) max: 60163 Points
CPU TDP 10 W TDP 15 W 100% 99%
Cinebench R10 - Cinebench R10 Rend. Single (64bit)
min: 11823 avg: 11834 median: 11834 (14%) max: 11845 Points
CPU TDP 10 W TDP 15 W 100% 100%
wPrime 2.10 - wPrime 2.0 1024m *
min: 116.561 avg: 228.7 median: 228.7 (3%) max: 340.8 s
CPU TDP 10 W TDP 15 W 100% 103%
min: 253.6 avg: 256.6 median: 256.6 (3%) max: 259.5 s
CPU TDP ? TDP 10 W TDP 15 W 101% 100% 103%
wPrime 2.10 - wPrime 2.0 32m *
min: 4.018 avg: 6.6 median: 6.6 (1%) max: 9.2 s
CPU TDP 10 W TDP 15 W 100% 101%
min: 8.3 avg: 8.5 median: 8.5 (2%) max: 8.672 s
CPU TDP ? TDP 10 W TDP 15 W 100% 100% 101%
WinRAR - WinRAR 4.0
min: 5835 avg: 6637 median: 6637 (11%) max: 7439 Points
CPU TDP 10 W TDP 15 W 78% 100%
CPU TDP ? TDP 10 W TDP 15 W 48% 78% 100%
7-Zip 18.03 - 7-Zip 18.03 Multi Thread 4 runs
min: 42883 avg: 47619 median: 48177 (28%) max: 50524 MIPS
CPU TDP ? TDP 10 W TDP 15 W TDP 30 W TDP 37 W 85% 95% 100% 93% 98%
7-Zip 18.03 - 7-Zip 18.03 Single Thread 4 runs
min: 5208 avg: 5386 median: 5427 (64%) max: 5468 MIPS
CPU TDP ? TDP 10 W TDP 15 W TDP 30 W TDP 37 W 100% 100% 98% 95% 99%
X264 HD Benchmark 4.0 - x264 Pass 2
min: 98.05 avg: 99.2 median: 99.2 (3%) max: 100.3 fps
CPU TDP 10 W TDP 15 W 100% 98%
CPU TDP ? TDP 10 W TDP 15 W 46% 100% 98%
X264 HD Benchmark 4.0 - x264 Pass 1
min: 249.6 avg: 250.6 median: 250.6 (6%) max: 251.5 fps
CPU TDP 10 W TDP 15 W 99% 100%
CPU TDP ? TDP 10 W TDP 15 W 89% 99% 100%
HWBOT x265 Benchmark v2.2 - HWBOT x265 4k Preset
min: 11.1 avg: 12.4 median: 12.6 (22%) max: 13.4 fps
CPU TDP ? TDP 10 W TDP 15 W TDP 30 W TDP 37 W 83% 94% 90% 95% 100%
TrueCrypt - TrueCrypt Serpent
CPU TDP 10 W TDP 15 W 100% 100%
min: 0.303 avg: 0.3 median: 0.3 (10%) max: 0.367 GB/s
CPU TDP ? TDP 10 W TDP 15 W 30% 100% 100%
TrueCrypt - TrueCrypt Twofish
min: 1.4 avg: 1.5 median: 1.5 (25%) max: 1.5 GB/s
CPU TDP 10 W TDP 15 W 100% 93%
min: 0.534 avg: 0.6 median: 0.6 (10%) max: 0.611 GB/s
CPU TDP ? TDP 10 W TDP 15 W 38% 100% 93%
TrueCrypt - TrueCrypt AES
min: 8.7 avg: 9.9 median: 9.9 (26%) max: 11 GB/s
CPU TDP 10 W TDP 15 W 79% 100%
min: 2.9 avg: 3.3 median: 3.3 (9%) max: 3.7 GB/s
CPU TDP ? TDP 10 W TDP 15 W 30% 79% 100%
Blender - Blender 3.3 Classroom CPU *
min: 486 avg: 539 median: 555 (7%) max: 567 Seconds
CPU TDP ? TDP 10 W TDP 15 W TDP 30 W TDP 37 W 100% 100% 100% 101% 101%
Blender - Blender 2.79 BMW27 CPU *
min: 281 avg: 301 median: 297 (2%) max: 322 Seconds
CPU TDP ? TDP 10 W TDP 15 W TDP 30 W TDP 37 W 100% 100% 100% 100% 100%
R Benchmark 2.5 - R Benchmark 2.5 *
min: 0.515 avg: 0.5 median: 0.5 (11%) max: 0.536 sec
CPU TDP ? TDP 10 W TDP 15 W TDP 30 W TDP 37 W 100% 100% 100% 100% 101%
3DMark 06 - CPU - 3DMark 06 - CPU
min: 11292 avg: 11671 median: 11670.5 (25%) max: 12049 Points
CPU TDP 10 W TDP 15 W 94% 100%
CPU TDP ? TDP 10 W TDP 15 W 71% 94% 100%
Super Pi mod 1.5 XS 1M - Super Pi mod 1.5 XS 1M *
min: 7.2 avg: 7.6 median: 7.6 (2%) max: 7.912 s
CPU TDP 10 W TDP 15 W 100% 100%
min: 8.74 avg: 8.8 median: 8.8 (2%) max: 8.891 s
CPU TDP ? TDP 10 W TDP 15 W 100% 100% 100%
Super Pi mod 1.5 XS 2M - Super Pi mod 1.5 XS 2M *
min: 15.7 avg: 16.4 median: 16.4 (1%) max: 17.124 s
CPU TDP 10 W TDP 15 W 100% 100%
min: 19.9 avg: 20.1 median: 20.1 (1%) max: 20.22 s
CPU TDP ? TDP 10 W TDP 15 W 100% 100% 100%
Super Pi Mod 1.5 XS 32M - Super Pi mod 1.5 XS 32M *
min: 465 avg: 466.3 median: 466.3 (2%) max: 467.5 s
CPU TDP ? TDP 10 W 100% 100%
3DMark Vantage - 3DM Vant. Perf. CPU no Physx
3DMark 11 - 3DM11 Performance Physics
min: 10473 avg: 12841 median: 12620 (31%) max: 15153 Points
CPU TDP ? TDP 10 W TDP 15 W TDP 30 W TDP 37 W 69% 90% 100% 81% 83%
CPU TDP ? TDP 10 W TDP 15 W TDP 30 W TDP 37 W 62% 90% 100% 81% 83%
3DMark - 3DMark Ice Storm Physics
CPU TDP ? TDP 15 W 88% 100%
3DMark - 3DMark Ice Storm Extreme Physics
CPU TDP ? TDP 15 W 89% 100%
3DMark - 3DMark Ice Storm Unlimited Physics
CPU TDP ? TDP 15 W 82% 100%
3DMark - 3DMark Cloud Gate Physics
min: 13778 avg: 14930 median: 14798 (37%) max: 16247 Points
CPU TDP ? TDP 10 W TDP 15 W TDP 30 W TDP 37 W 85% 95% 89% 91% 100%
CPU TDP ? TDP 10 W TDP 15 W TDP 30 W TDP 37 W 61% 95% 89% 91% 100%
3DMark - 3DMark Fire Strike Standard Physics
min: 19642 avg: 20827 median: 20481 (37%) max: 22730 Points
CPU TDP ? TDP 10 W TDP 15 W TDP 30 W TDP 37 W 86% 90% 88% 94% 100%
min: 8839 avg: 9066 median: 9065.5 (16%) max: 9292 Points
CPU TDP ? TDP 10 W TDP 15 W TDP 30 W TDP 37 W 55% 90% 88% 94% 100%
3DMark - 3DMark Time Spy CPU
min: 5841 avg: 6534 median: 6520 (27%) max: 7124 Points
CPU TDP ? TDP 10 W TDP 15 W TDP 30 W TDP 37 W 82% 89% 100% 92% 96%
CPU TDP ? TDP 10 W TDP 15 W TDP 30 W TDP 37 W 70% 89% 100% 92% 96%
Geekbench 6.5 - Geekbench 6.5 Single-Core
Geekbench 6.5 - Geekbench 6.5 Multi-Core
Geekbench 6.0 - Geekbench 6.0 Single-Core
min: 1847 avg: 1889 median: 1889 (60%) max: 1931 Points
CPU TDP 15 W TDP 30 W 100% 96%
Geekbench 6.0 - Geekbench 6.0 Multi-Core
min: 6556 avg: 7374 median: 7373.5 (30%) max: 8191 Points
CPU TDP 15 W TDP 30 W 100% 80%
Geekbench 5.5 - Geekbench 5.1 - 5.5 64 Bit Single-Core
min: 1438 avg: 1481 median: 1482 (50%) max: 1520 Points
CPU TDP ? TDP 15 W TDP 30 W TDP 37 W 95% 100% 97% 98%
Geekbench 5.5 - Geekbench 5.1 - 5.5 64 Bit Multi-Core
min: 5827 avg: 7077 median: 7074.5 (13%) max: 8330 Points
CPU TDP ? TDP 15 W TDP 30 W TDP 37 W 70% 100% 81% 88%
Geekbench 5.0 - Geekbench 5.0 64 Bit Single-Core
min: 1447 avg: 1451 median: 1451 (6%) max: 1455 Points
CPU TDP 15 W TDP 37 W 99% 100%
Geekbench 5.0 - Geekbench 5.0 64 Bit Multi-Core
min: 7235 avg: 7750 median: 7749.5 (24%) max: 8264 Points
CPU TDP 15 W TDP 37 W 100% 88%
Geekbench 4.4 - Geekbench 4.1 - 4.4 64 Bit Single-Core
Geekbench 4.4 - Geekbench 4.1 - 4.4 64 Bit Multi-Core
Geekbench 4.0 - Geekbench 4.0 64 Bit Single-Core
Geekbench 4.0 - Geekbench 4.0 64 Bit Multi-Core
Geekbench 3 - Geekbench 3 64 Bit Multi-Core
Geekbench 3 - Geekbench 3 64 Bit Single-Core
Mozilla Kraken 1.1 - Kraken 1.1 Total Score *
min: 619 avg: 628 median: 623 (1%) max: 645 ms
CPU TDP ? TDP 10 W TDP 15 W TDP 30 W TDP 37 W 100% 100% 100% 100% 100%
CPU TDP ? TDP 10 W TDP 15 W TDP 30 W TDP 37 W 100% 100% 100% 100% 100%
Sunspider - Sunspider 1.0 Total Score *
Octane V2 - Octane V2 Total Score
WebXPRT 4 - WebXPRT 4 Score
min: 207 avg: 217.8 median: 213 (55%) max: 242 Points
CPU TDP ? TDP 10 W TDP 15 W TDP 30 W TDP 37 W 86% 88% 88% 100% 88%
WebXPRT 3 - WebXPRT 3 Score
min: 239 avg: 260.2 median: 264 (47%) max: 275 Points
CPU TDP ? TDP 10 W TDP 15 W TDP 30 W TDP 37 W 96% 98% 92% 87% 100%
CrossMark - CrossMark Overall
min: 1124 avg: 1293 median: 1324 (50%) max: 1387 Points
CPU TDP ? TDP 10 W TDP 15 W TDP 30 W TDP 37 W 81% 95% 100% 94% 96%
Power Consumption - Prime95 Power Consumption - external Monitor *
min: 34.6 avg: 44.5 median: 42.6 (7%) max: 54.3 Watt
CPU TDP ? TDP 10 W TDP 15 W TDP 30 W TDP 37 W 104% 103% 102% 100% 100%
CPU TDP ? TDP 10 W TDP 15 W TDP 30 W TDP 37 W 100% 108% 107% 105% 105%
Power Consumption - Cinebench R15 Multi Power Consumption - external Monitor *
min: 37.3 avg: 47.1 median: 48.5 (9%) max: 54 Watt
CPU TDP ? TDP 10 W TDP 15 W TDP 37 W 103% 101% 101% 100%
CPU TDP ? TDP 10 W TDP 15 W TDP 37 W 100% 104% 104% 103%
Power Consumption - Idle Power Consumption - external Monitor *
min: 2.81 avg: 4.6 median: 3.5 (2%) max: 8.73 Watt
CPU TDP ? TDP 10 W TDP 15 W TDP 30 W 104% 104% 100% 103%
Power Consumption - Idle Power Consumption 150cd 1min *
min: 4.11 avg: 5.1 median: 4.8 (3%) max: 6.3 Watt
CPU TDP ? TDP 10 W TDP 30 W 102% 101% 100%
Power Consumption - Power Efficiency - Cinebench R15 Multi external Monitor
min: 33.6 avg: 35.5 median: 34.4 (26%) max: 38.6 Points per Watt
CPU TDP 10 W TDP 15 W TDP 37 W 100% 87% 89%
CPU TDP ? TDP 10 W TDP 15 W TDP 37 W 18% 100% 87% 89%
Average Benchmarks AMD Ryzen 7 5825U → 100% n=26 Average Benchmarks Intel Core i5-7600K → 67% n=26
- Bereich der Benchmarkergebnisse für diese Grafikkarte
- Durchschnittliche Benchmarkergebnisse für diese Grafikkarte
* Smaller numbers mean a higher performance
1 This benchmark is not used for the average calculation
log 31. 10:12:23
#0 ran 0s before starting gpusingle class +0s ... 0s
#1 checking url part for id 14092 +0s ... 0s
#2 checking url part for id 8528 +0s ... 0s
#3 redirected to Ajax server, took 1767172343s time from redirect:0 +0s ... 0s
#4 did not recreate cache, as it is less than 5 days old! Created at Wed, 31 Dec 2025 05:18:59 +0100 +0s ... 0s
#5 composed specs +0.004s ... 0.004s
#6 did output specs +0s ... 0.004s
#7 getting avg benchmarks for device 14092 +0.004s ... 0.008s
#8 got single benchmarks 14092 +0.01s ... 0.019s
#9 getting avg benchmarks for device 8528 +0s ... 0.019s
#10 got single benchmarks 8528 +0s ... 0.02s
#11 got avg benchmarks for devices +0s ... 0.02s
#12 min, max, avg, median took s +0.033s ... 0.053s
#13 return log +0.001s ... 0.054s