Notebookcheck Logo

Intel Core i7-7700 vs Intel Core i5-13600K

Intel Core i7-7700

► remove from comparison

Der Intel Core i7-7700 ist ein High-End Quad-Core Desktop-Prozessor auf Basis der Kaby-Lake-Architektur, der im August 2015 vorgestellt wurde. Die in einem verbesserten 14-Nanometer-Prozess gefertigte CPU taktet mit 3,6 bis 4,2 GHz und kann dank Hyper-Threading bis zu 8 Threads parallel bearbeiten. Er ist das schnellste Modell der Kaby-Lake Familie (zum Launch) mit einem TDP von 65 Watt. Die schnelleren Modelle, wie der i7-7700K, sind mit 91 Watt spezifiziert.

Grafikeinheit

Für Grafikberechnungen zeigt sich die im Prozessor integrierte Intel HD Graphics 630 mit 24 EUs (Execution Units) verantwortlich, die mit 350 - 1150 MHz taktet. Die Leistung ist vergleichbar mit der alten Intel HD Graphics 530 und siedelt sich daher im absoluten Low-End-Bereich an, sodass aktuelle Spiele allenfalls in niedrigen Einstellungen flüssig dargestellt werden.

Intel Core i5-13600K

► remove from comparison Intel i5-13600K

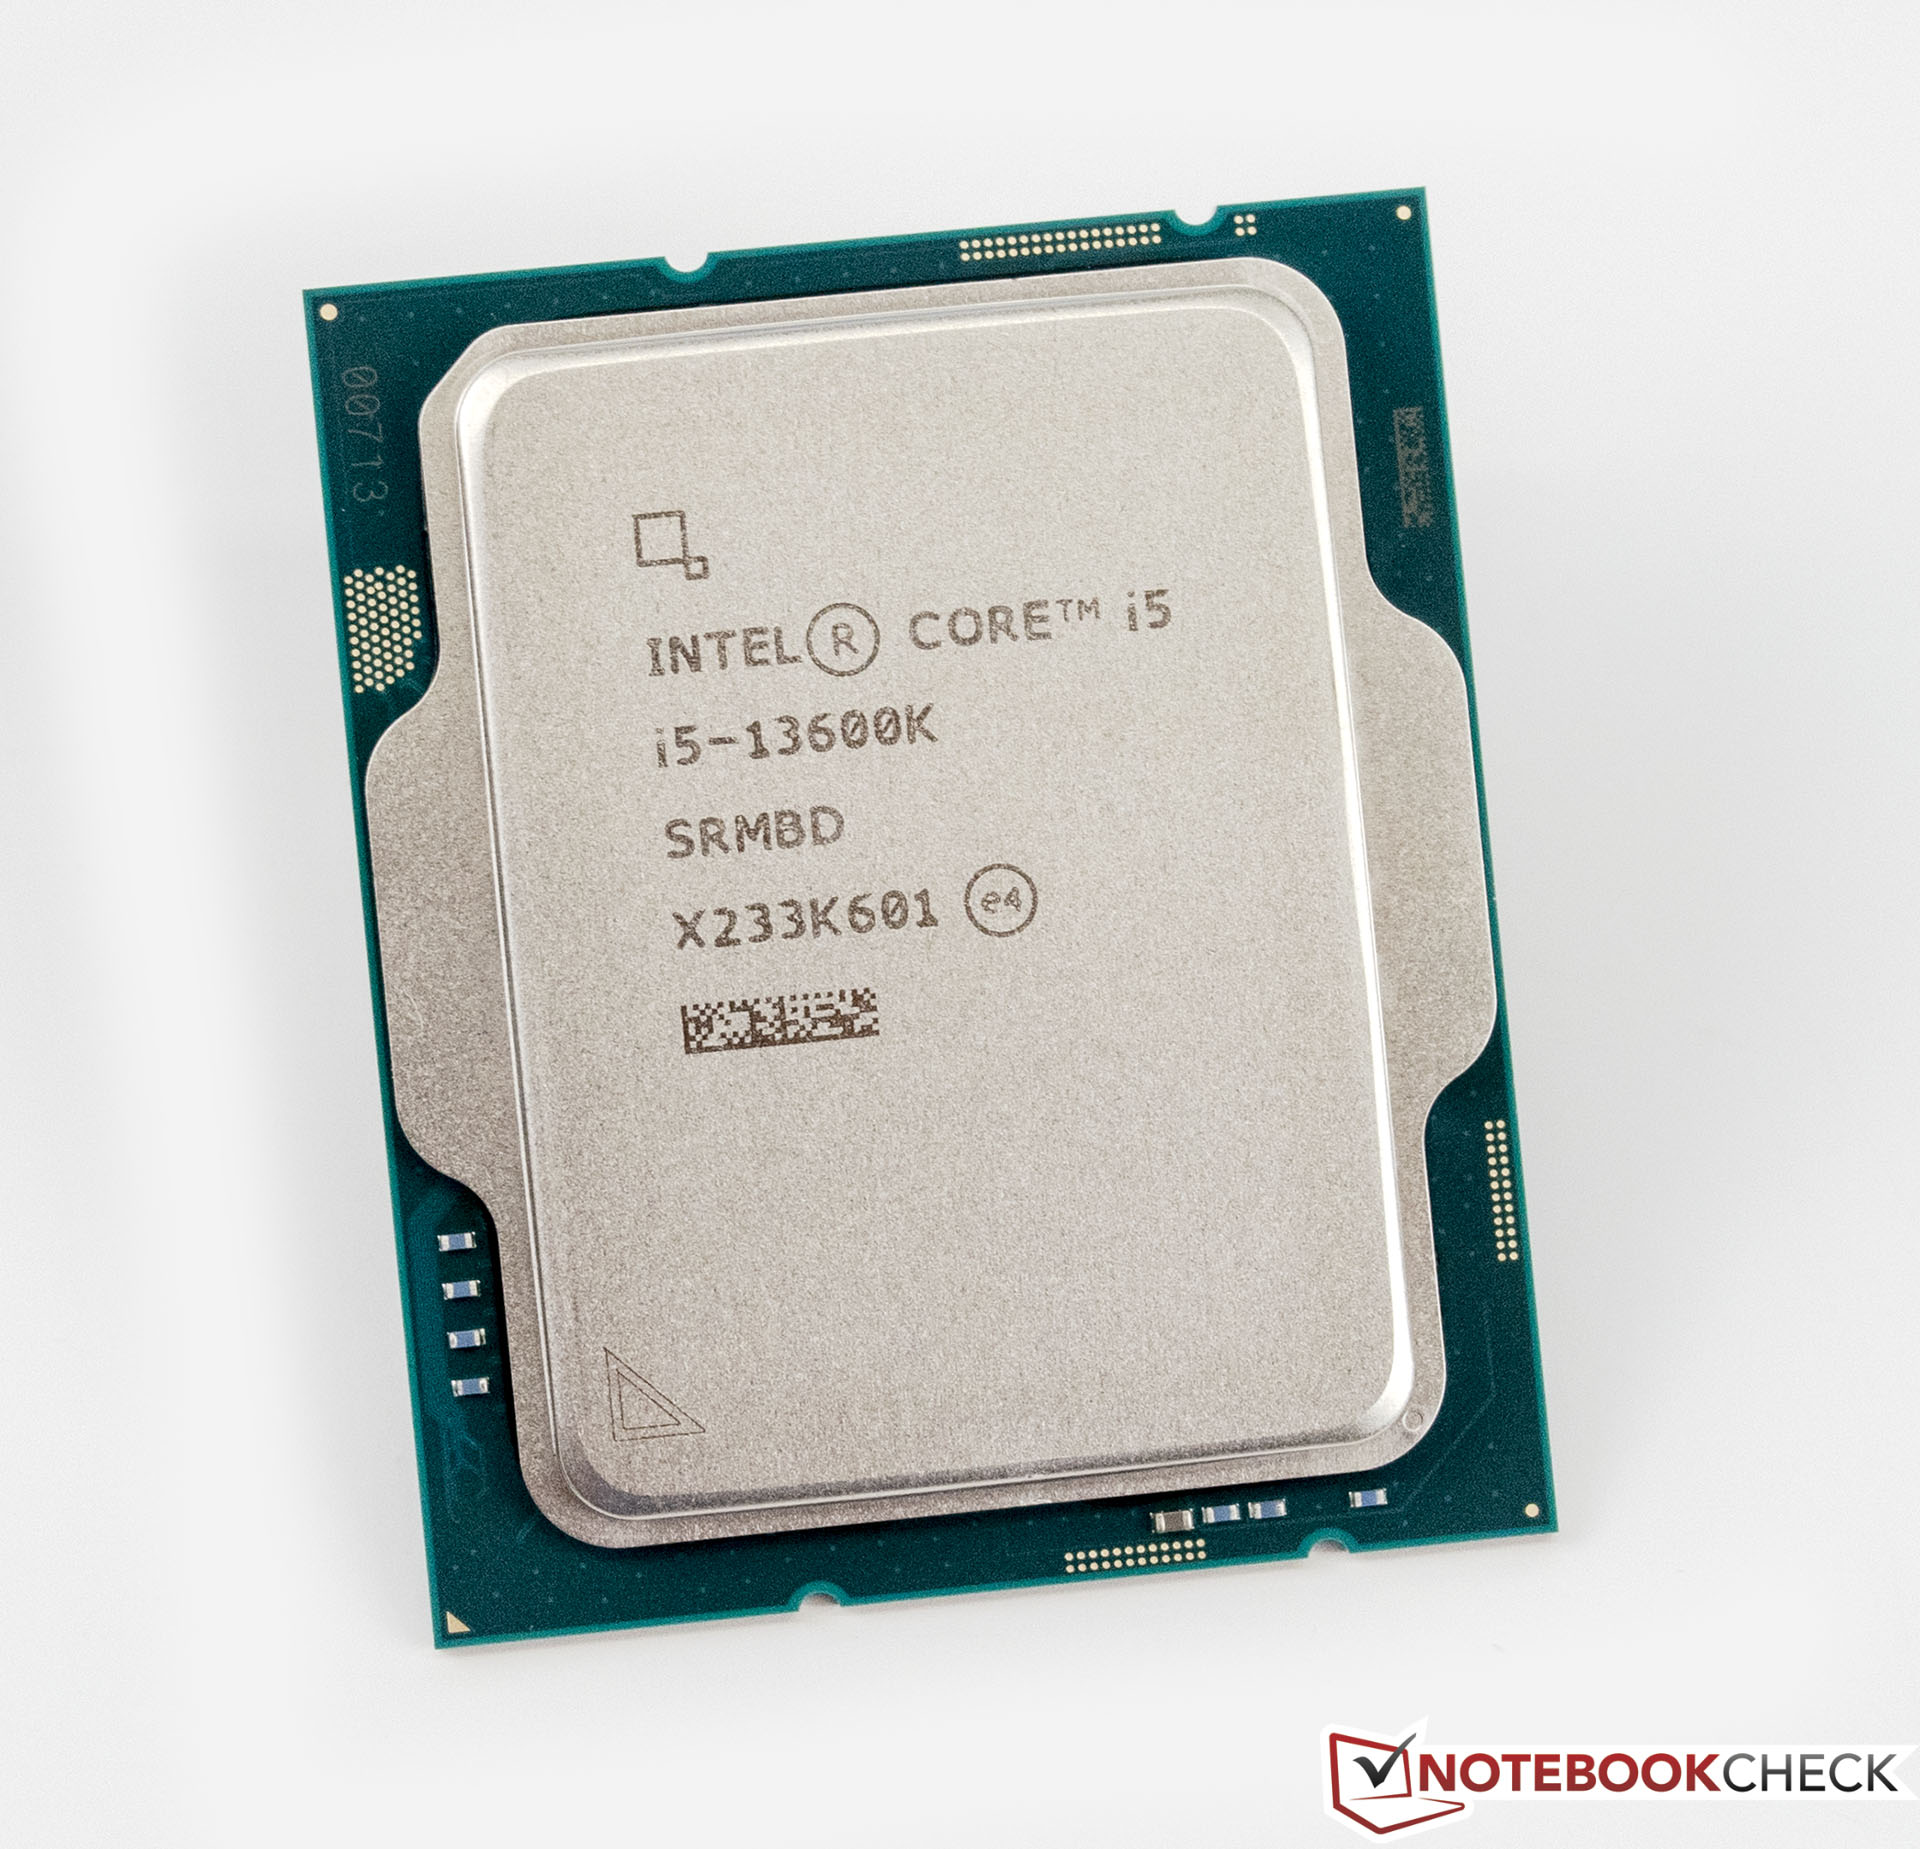
Der Intel Core i5-13600K ist ein top moderner und sehr schneller Desktop Prozessor auf Basis der neuen Raptor-Lake-Architektur, die im Oktober 2022 vorgestellt wurde. Der Prozessor bietet einen Basistakt von 3,5 GHz und erreicht bis zu 5,1 GHz im Turbo. Die mit Alder-Lake eingeführte hybride Architektur sehen wir auch bei den aktuellen Raptor-Lake-Prozessoren. Im Vergleich zum Intel Core i5-12600K hat Intel die Anzahl der E-Cores jedoch verdoppelt, womit in Summe bis zu 20 Threads parallel verarbeitet werden können. Die Performance-Kerne (P-Cores) bieten hierzu Hyperthreading, was den energieeffizienten Kernen (E-Cores) weiterhin vorenthalten wird. Der Intel Core i5-13600K bietet weiterhin einen freien Multiplikator, was das Übertakten deutlich vereinfacht. Als Basis wird ebenfalls auf den LGA 1700 Sockel gesetzt, der mit Alder-Lake vorgestellt wurde.

Performance

Im Vergleich zum Intel Core i5-12600K konnte die IPC beim neuen Core i5-13600K deutlich gesteigert werden. Das sorgt insgesamt für einen spürbaren Leistungsschub, der sich auch auf die Multi-Core-Leistung auswirkt. Durch die Verdopplung der E-Cores auf 8 seht den P-Cores deutlich mehr Leistung zur Verfügung. Wenn alle Voraussetzungen erfüllt werden, kann Intel Turbo Boost 3.0 den Takt der P-Cores auf bis zu 5,1 GHz erhöhen. Auch die E-Cores lassen sich übertakten und erreichen maximal 3,9 GHz. 

Grafikeinheit

Wie auch der Intel Core i5-12600K bietet der Intel Core i5-13600K eine integrierte Grafikeinheit. Als Basis dient weiterhin die Intel Iris Xe-Architektur. Rein leistungstechnisch hat sich bei der neuen Intel UHD Graphics 770 aber nicht viel verändert. 

Leistungsaufnahme

Die TDP des Intel Core i5-13600K beläuft sich auf 125 Watt, mit der Option im Turbo bis zu 181 Watt zu verbrauchen. Somit steigt der Energiebedarf im Vergleich zur älteren Alder-Lake-S-Generation deutlich.

ModelIntel Core i7-7700Intel Core i5-13600K
SeriesIntel Kaby LakeIntel Raptor Lake-S
CodenameKaby LakeRaptor Lake
Serie: Raptor Lake-S Raptor Lake
Intel Core i7-7700K compare4.2 - 4.5 GHz4 / 8 cores8 MB L3
Intel Core i7-7700 « 3.6 - 4.2 GHz4 / 8 cores8 MB L3
Intel Xeon E3-1535M v6 compare3.1 - 4.2 GHz4 / 8 cores8 MB L3
Intel Core i7-7920HQ compare3.1 - 4.1 GHz4 / 8 cores8 MB L3
Intel Core i7-7700T compare2.9 - 3.8 GHz4 / 8 cores8 MB L3
Intel Core i5-7600K compare3.8 - 4.2 GHz4 / 4 cores8 MB L3
Intel Xeon E3-1505M v6 compare3 - 4 GHz4 / 8 cores8 MB L3
Intel Core i7-7820HQ compare2.9 - 3.9 GHz4 / 8 cores8 MB L3
Intel Core i7-7820HK compare2.9 - 3.9 GHz4 / 8 cores8 MB L3
Intel Core i7-7700HQ compare2.8 - 3.8 GHz4 / 8 cores6 MB L3
Intel Core i5-7500 compare3.4 - 3.8 GHz4 / 4 cores6 MB L3
Intel Core i5-7440HQ compare2.8 - 3.8 GHz4 / 4 cores6 MB L3
Intel Core i7-7567U compare3.5 - 4 GHz2 / 4 cores4 MB L3
Intel Core i7-7660U compare2.5 - 4 GHz2 / 4 cores4 MB L3
Intel Core i7-7600U compare2.8 - 3.9 GHz2 / 4 cores4 MB L3
Intel Core i5-7300HQ compare2.5 - 3.5 GHz4 / 4 cores6 MB L3
Intel Core i5-7500T compare2.7 - 3.3 GHz4 / 4 cores6 MB L3
Intel Core i5-7287U compare3.3 - 3.7 GHz2 / 4 cores4 MB L3
Intel Core i7-7560U compare2.4 - 3.8 GHz2 / 4 cores4 MB L3
Intel Core i5-7267U compare3.1 - 3.5 GHz2 / 4 cores4 MB L3
Intel Core i5-7360U compare2.3 - 3.6 GHz2 / 4 cores4 MB L3
Intel Core i7-7500U compare2.7 - 3.5 GHz2 / 4 cores4 MB L3
Intel Core i5-7300U compare2.6 - 3.5 GHz2 / 4 cores3 MB L3
Intel Core i5-7260U compare2.2 - 3.4 GHz2 / 4 cores4 MB L3
Intel Core i5-7200U compare2.5 - 3.1 GHz2 / 4 cores3 MB L3
Intel Core i3-7100H compare3 GHz2 / 4 cores3 MB L3
Intel Core i3-7167U compare2.8 GHz2 / 4 cores3 MB L3
Intel Core i7-7Y75 compare1.3 - 3.6 GHz2 / 4 cores4 MB L3
Intel Core i5-7Y57 compare1.2 - 3.3 GHz2 / 4 cores4 MB L3
Intel Core i5-7Y54 compare1.2 - 3.2 GHz2 / 4 cores4 MB L3
Intel Core i3-7100U compare2.4 GHz2 / 4 cores3 MB L3
Intel Core m3-7Y32 compare1 - 3 GHz2 / 4 cores4 MB L3
Intel Pentium Gold 4415U compare2.3 GHz2 / 4 cores2 MB L3
Intel Core m3-7Y30 compare1 - 2.6 GHz2 / 4 cores4 MB L3
Intel Celeron 3965U compare2.2 GHz2 / 2 cores2 MB L3
Intel Core i3-7020U compare2.3 GHz2 / 4 cores3 MB L3
Intel Celeron 3867U compare1.8 GHz2 / 2 cores2 MB L3
Intel Celeron 3865U compare1.8 GHz2 / 2 cores2 MB L3
Intel Pentium Gold 4425Y compare1.7 GHz2 / 4 cores2 MB L3
Intel Pentium Gold 4415Y compare1.6 GHz2 / 4 cores2 MB L3
Intel Pentium Gold 4410Y compare1.5 GHz2 / 4 cores2 MB L3
Intel Celeron 3965Y compare1.5 GHz2 / 2 cores2 MB L3
Intel Core i9-13900K compare3 - 5.8 GHz24 / 32 cores36 MB L3
Intel Core i7-13700K compare3.4 - 5.4 GHz16 / 24 cores30 MB L3
Intel Core i5-13600K « 3.5 - 5.1 GHz14 / 20 cores24 MB L3
Clock3600 - 4200 MHz3500 - 5100 MHz
L1 Cache256 KB
L2 Cache1 MB20 MB
L3 Cache8 MB24 MB
Cores / Threads4 / 814 / 20
6 x 5.1 GHz Intel Raptor Cove P-Core
8 x 3.9 GHz Intel Gracemont E-Core
TDP65 Watt125 Watt
Technology14 nm10 nm
SocketFCLGA1151LGA 1700
FeaturesDDR3(L)-1600/DDR4-2400 Memory Controller, HyperThreading, AVX, AVX2, AES-NI, TSX-NI, Quick Sync, Virtualization, vProIntel UHD Graphics 770, DDR5 5600 MT/s, DDR4 3200 MT/s
iGPUIntel HD Graphics 630 (350 - 1150 MHz)Intel UHD Graphics 770 (300 - 1500 MHz)
Architecturex86x86
$303 U.S.$319 U.S.
Announced
Manufacturerark.intel.comwww.intel.com
Die Size257 mm2
max. Temp.100 °C

Benchmarks

Performance Rating - CB R15 + R20 + 7-Zip + X265 + Blender + 3DM11 CPU - i5-13600K
49.4 pt (69%)
Cinebench R23 - Cinebench R23 Multi Core
min: 24174     avg: 24221     median: 24221 (22%)     max: 24268 Points
Cinebench R23 - Cinebench R23 Single Core
min: 1991     avg: 2001     median: 2000.5 (85%)     max: 2010 Points
Cinebench R20 - Cinebench R20 CPU (Single Core)
min: 766     avg: 771     median: 770.5 (86%)     max: 775 Points
Cinebench R20 - Cinebench R20 CPU (Multi Core)
min: 9217     avg: 9241     median: 9241 (23%)     max: 9265 Points
Cinebench R15 - Cinebench R15 CPU Multi 64 Bit
min: 836     avg: 861     median: 857 (5%)     max: 889 Points
min: 3641     avg: 3642     median: 3642 (23%)     max: 3643 Points
Cinebench R15 - Cinebench R15 CPU Single 64 Bit
min: 153     avg: 171.3     median: 178 (54%)     max: 183 Points
min: 286     avg: 287.5     median: 287.5 (87%)     max: 289 Points
Cinebench R11.5 - Cinebench R11.5 CPU Multi 64 Bit
9.5 Points (12%)
min: 42.2     avg: 42.3     median: 42.3 (55%)     max: 42.38 Points
Cinebench R11.5 - Cinebench R11.5 CPU Single 64 Bit
2 Points (50%)
min: 3.45     avg: 3.5     median: 3.5 (86%)     max: 3.48 Points
Cinebench R10 - Cinebench R10 Rend. Single (32bit)
min: 10710     avg: 10755     median: 10754.5 (65%)     max: 10799 Points
Cinebench R10 - Cinebench R10 Rend. Multi (32bit)
min: 67973     avg: 68880     median: 68879.5 (50%)     max: 69786 Points
Cinebench R10 - Cinebench R10 Rend. Multi (64bit)
min: 110412     avg: 110969     median: 110969 (77%)     max: 111526 Points
Cinebench R10 - Cinebench R10 Rend. Single (64bit)
min: 16074     avg: 16155     median: 16154.5 (20%)     max: 16235 Points
wPrime 2.10 - wPrime 2.0 1024m *
210.1 s (2%)
min: 172.189     avg: 174.9     median: 174.9 (2%)     max: 177.592 s
wPrime 2.10 - wPrime 2.0 32m *
6.7 s (1%)
min: 2.518     avg: 2.5     median: 2.5 (1%)     max: 2.527 s
WinRAR - WinRAR 4.0
min: 10937     avg: 10967     median: 10967 (17%)     max: 10997 Points
7-Zip 18.03 - 7-Zip 18.03 Multli Thread 4 runs
min: 89527     avg: 89587     median: 89587 (51%)     max: 89647 MIPS
7-Zip 18.03 - 7-Zip 18.03 Single Thread 4 runs
min: 6253     avg: 6378     median: 6377.5 (76%)     max: 6502 MIPS
X264 HD Benchmark 4.0 - x264 Pass 2
49 fps (17%)
min: 198.6     avg: 198.8     median: 198.8 (69%)     max: 199 fps
X264 HD Benchmark 4.0 - x264 Pass 1
181 fps (42%)
min: 387     avg: 387.5     median: 387.5 (89%)     max: 388 fps
HWBOT x265 Benchmark v2.2 - HWBOT x265 4k Preset
min: 27.5     avg: 27.6     median: 27.6 (48%)     max: 27.6 fps
TrueCrypt - TrueCrypt Serpent
1.7 GB/s (0%)
TrueCrypt - TrueCrypt Twofish
min: 3.1     avg: 3.2     median: 3.2 (54%)     max: 3.2 GB/s
TrueCrypt - TrueCrypt AES
min: 18.8     avg: 19.1     median: 19.1 (50%)     max: 19.4 GB/s
Blender - Blender 3.3 Classroom CPU *
min: 37     avg: 161.7     median: 224 (3%)     max: 224 Seconds
Blender - Blender 2.79 BMW27 CPU *
135 Seconds (1%)
R Benchmark 2.5 - R Benchmark 2.5 *
min: 0.4048     avg: 0.4     median: 0.4 (9%)     max: 0.405 sec
3DMark 06 - CPU - 3DMark 06 - CPU
17627 Points (38%)
Super Pi mod 1.5 XS 1M - Super Pi mod 1.5 XS 1M *
10.2 s (2%)
min: 6.471     avg: 6.5     median: 6.5 (1%)     max: 6.58 s
Super Pi mod 1.5 XS 2M - Super Pi mod 1.5 XS 2M *
22.9 s (1%)
min: 14.876     avg: 14.9     median: 14.9 (1%)     max: 14.993 s
Super Pi Mod 1.5 XS 32M - Super Pi mod 1.5 XS 32M *
556 s (2%)
min: 328.929     avg: 331.4     median: 331.4 (1%)     max: 333.798 s
3DMark Vantage - 3DM Vant. Perf. CPU no Physx
97718 Points (86%)
3DMark 11 - 3DM11 Performance Physics
min: 10706     avg: 10740     median: 10739.5 (29%)     max: 10773 Points
min: 30358     avg: 30419     median: 30419 (82%)     max: 30480 Points
3DMark - 3DMark Ice Storm Physics
min: 54177     avg: 57570     median: 57569.5 (47%)     max: 60962 Points
min: 86734     avg: 86952     median: 86952 (71%)     max: 87170 Points
3DMark - 3DMark Ice Storm Extreme Physics
53710 Points (44%)
min: 87784     avg: 87861     median: 87860.5 (71%)     max: 87937 Points
3DMark - 3DMark Ice Storm Unlimited Physics
min: 88547     avg: 89321     median: 89321 (75%)     max: 90095 Points
3DMark - 3DMark Cloud Gate Physics
min: 8301     avg: 8650     median: 8650 (22%)     max: 8999 Points
min: 26359     avg: 26394     median: 26394 (67%)     max: 26429 Points
3DMark - 3DMark Fire Strike Standard Physics
min: 11520     avg: 12081     median: 12081 (22%)     max: 12642 Points
min: 35386     avg: 35395     median: 35395 (63%)     max: 35404 Points
3DMark - 3DMark Time Spy CPU
min: 17079     avg: 17102     median: 17101.5 (72%)     max: 17124 Points
Geekbench 5.5 - Geekbench 5.1 - 5.4 64 Bit Single-Core
min: 1967     avg: 1973     median: 1973 (83%)     max: 1979 Points
Geekbench 5.5 - Geekbench 5.1 - 5.4 64 Bit Multi-Core
min: 16651     avg: 16671     median: 16670.5 (30%)     max: 16690 Points
Geekbench 5.0 - Geekbench 5.0 64 Bit Single-Core
min: 1931     avg: 1948     median: 1947.5 (8%)     max: 1964 Points
Geekbench 5.0 - Geekbench 5.0 64 Bit Multi-Core
min: 16497     avg: 16566     median: 16566 (52%)     max: 16635 Points
Geekbench 4.4 - Geekbench 4.1 - 4.4 64 Bit Single-Core
min: 8618     avg: 8625     median: 8624.5 (86%)     max: 8631 Points
Geekbench 4.4 - Geekbench 4.1 - 4.4 64 Bit Multi-Core
min: 60407     avg: 61014     median: 61014 (67%)     max: 61621 Points
Mozilla Kraken 1.1 - Kraken 1.1 Total Score *
min: 467     avg: 468     median: 468 (1%)     max: 469 ms
WebXPRT 4 - WebXPRT 4 Score
288 Points (83%)
WebXPRT 3 - WebXPRT 3 Score
min: 329     avg: 331     median: 331 (69%)     max: 333 Points
CrossMark - CrossMark Overall
min: 2237     avg: 2254     median: 2254 (86%)     max: 2271 Points
Power Consumption - Prime95 Power Consumption - external Monitor *
min: 278     avg: 313     median: 313 (54%)     max: 348 Watt
Power Consumption - Cinebench R15 Multi Power Consumption - external Monitor *
min: 245     avg: 265.5     median: 265.5 (48%)     max: 286 Watt
Power Consumption - Idle Power Consumption - external Monitor *
min: 69.3     avg: 73.3     median: 73.3 (48%)     max: 77.3 Watt
Power Consumption - Cinebench R15 Multi Power Efficiency - external Monitor
min: 12.7     avg: 13.8     median: 13.8 (10%)     max: 14.9 Points per Watt

Average Benchmarks Intel Core i7-7700 → 100% n=16

Average Benchmarks Intel Core i5-13600K → 220% n=16

- Bereich der Benchmarkergebnisse für diese Grafikkarte
- Durchschnittliche Benchmarkergebnisse für diese Grafikkarte
* Smaller numbers mean a higher performance
1 This benchmark is not used for the average calculation

Add one or more devices and compare

In the following list you can select (and also search for) devices that should be added to the comparison. You can select more than one device.

restrict list:

show all (including archived), 2024, 2023
v1.26
log 18. 18:50:44

#0 checking url part for id 8566 +0s ... 0s

#1 checking url part for id 14626 +0s ... 0s

#2 not redirecting to Ajax server +0s ... 0s

#3 did not recreate cache, as it is less than 5 days old! Created at Fri, 17 May 2024 11:21:47 +0200 +0.001s ... 0.001s

#4 composed specs +0.022s ... 0.023s

#5 did output specs +0s ... 0.023s

#6 getting avg benchmarks for device 8566 +0.003s ... 0.026s

#7 got single benchmarks 8566 +0.009s ... 0.035s

#8 getting avg benchmarks for device 14626 +0.017s ... 0.052s

#9 got single benchmarks 14626 +0.012s ... 0.064s

#10 got avg benchmarks for devices +0s ... 0.064s

#11 min, max, avg, median took s +0.241s ... 0.305s

#12 return log +0.025s ... 0.33s

Teilen Sie diesen Artikel, um uns zu unterstützen. Jeder Link hilft!
> Notebook Test, Laptop Test und News > Benchmarks / Technik > Benchmarks / Technik > Prozessor Vergleich - Head 2 Head
Autor: Klaus Hinum,  8.09.2017 (Update:  1.07.2023)