Intel Rocket Lake-S im Test: Nur noch 8 Kerne beim Core i9-11900K
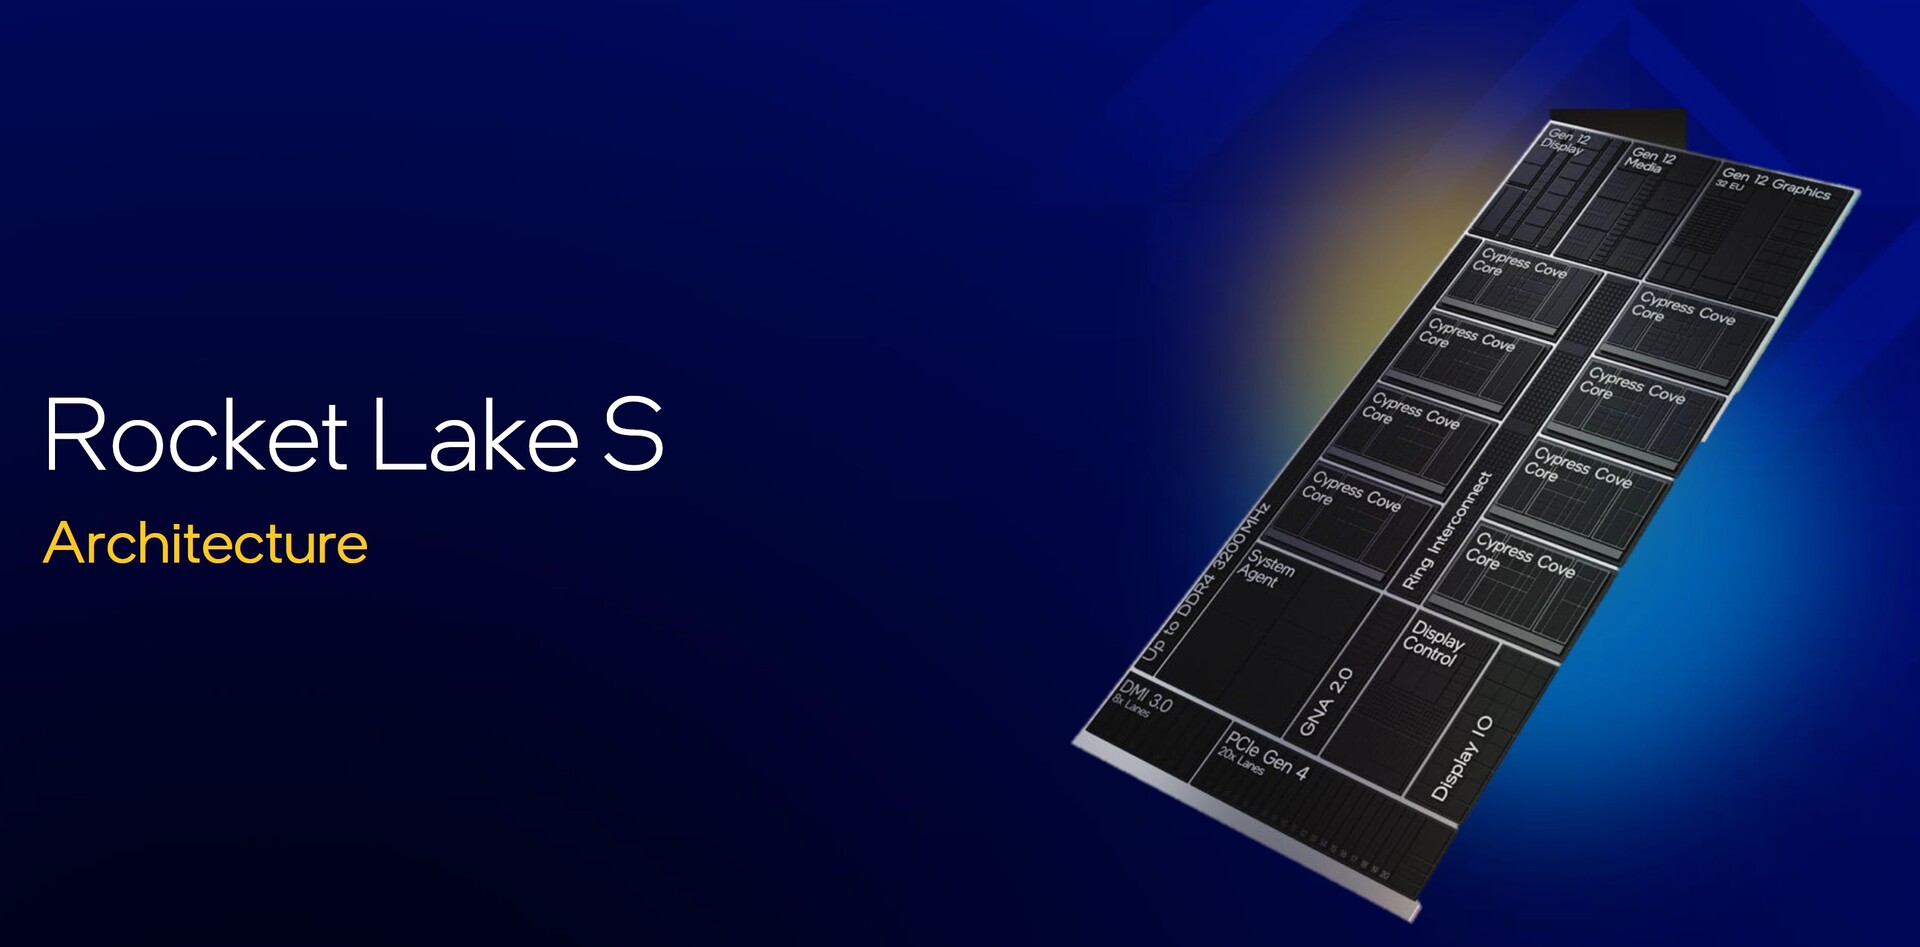
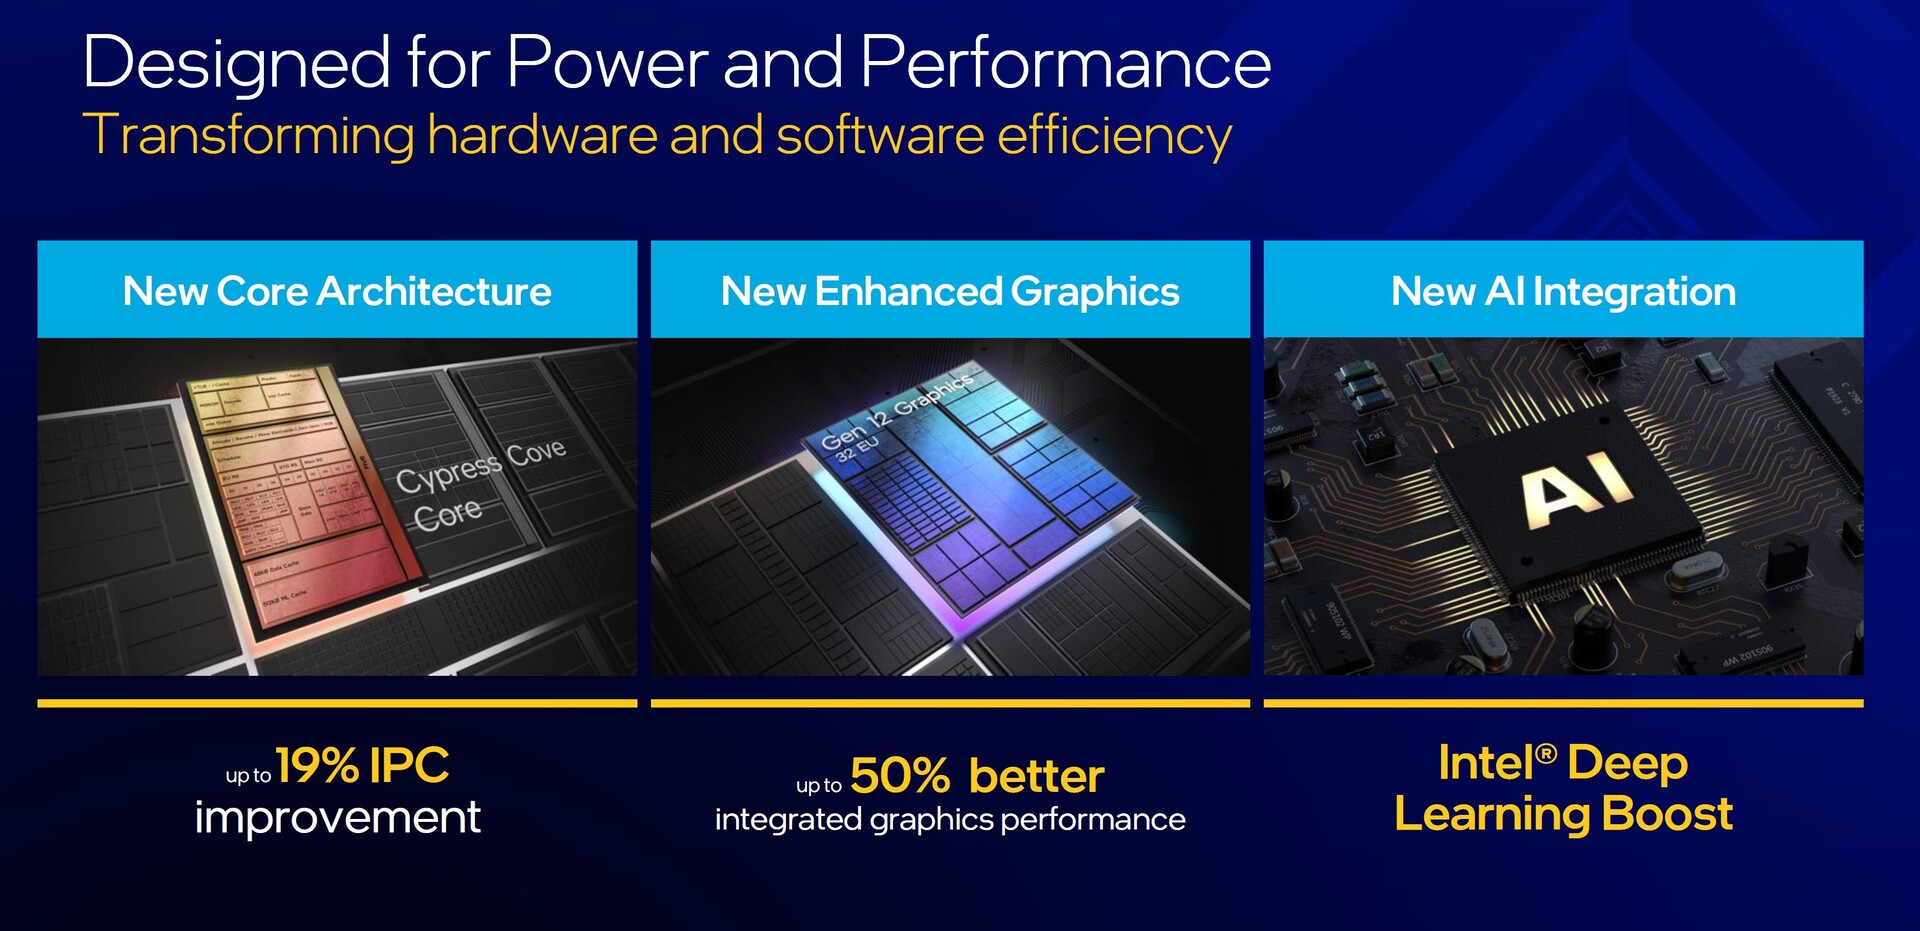
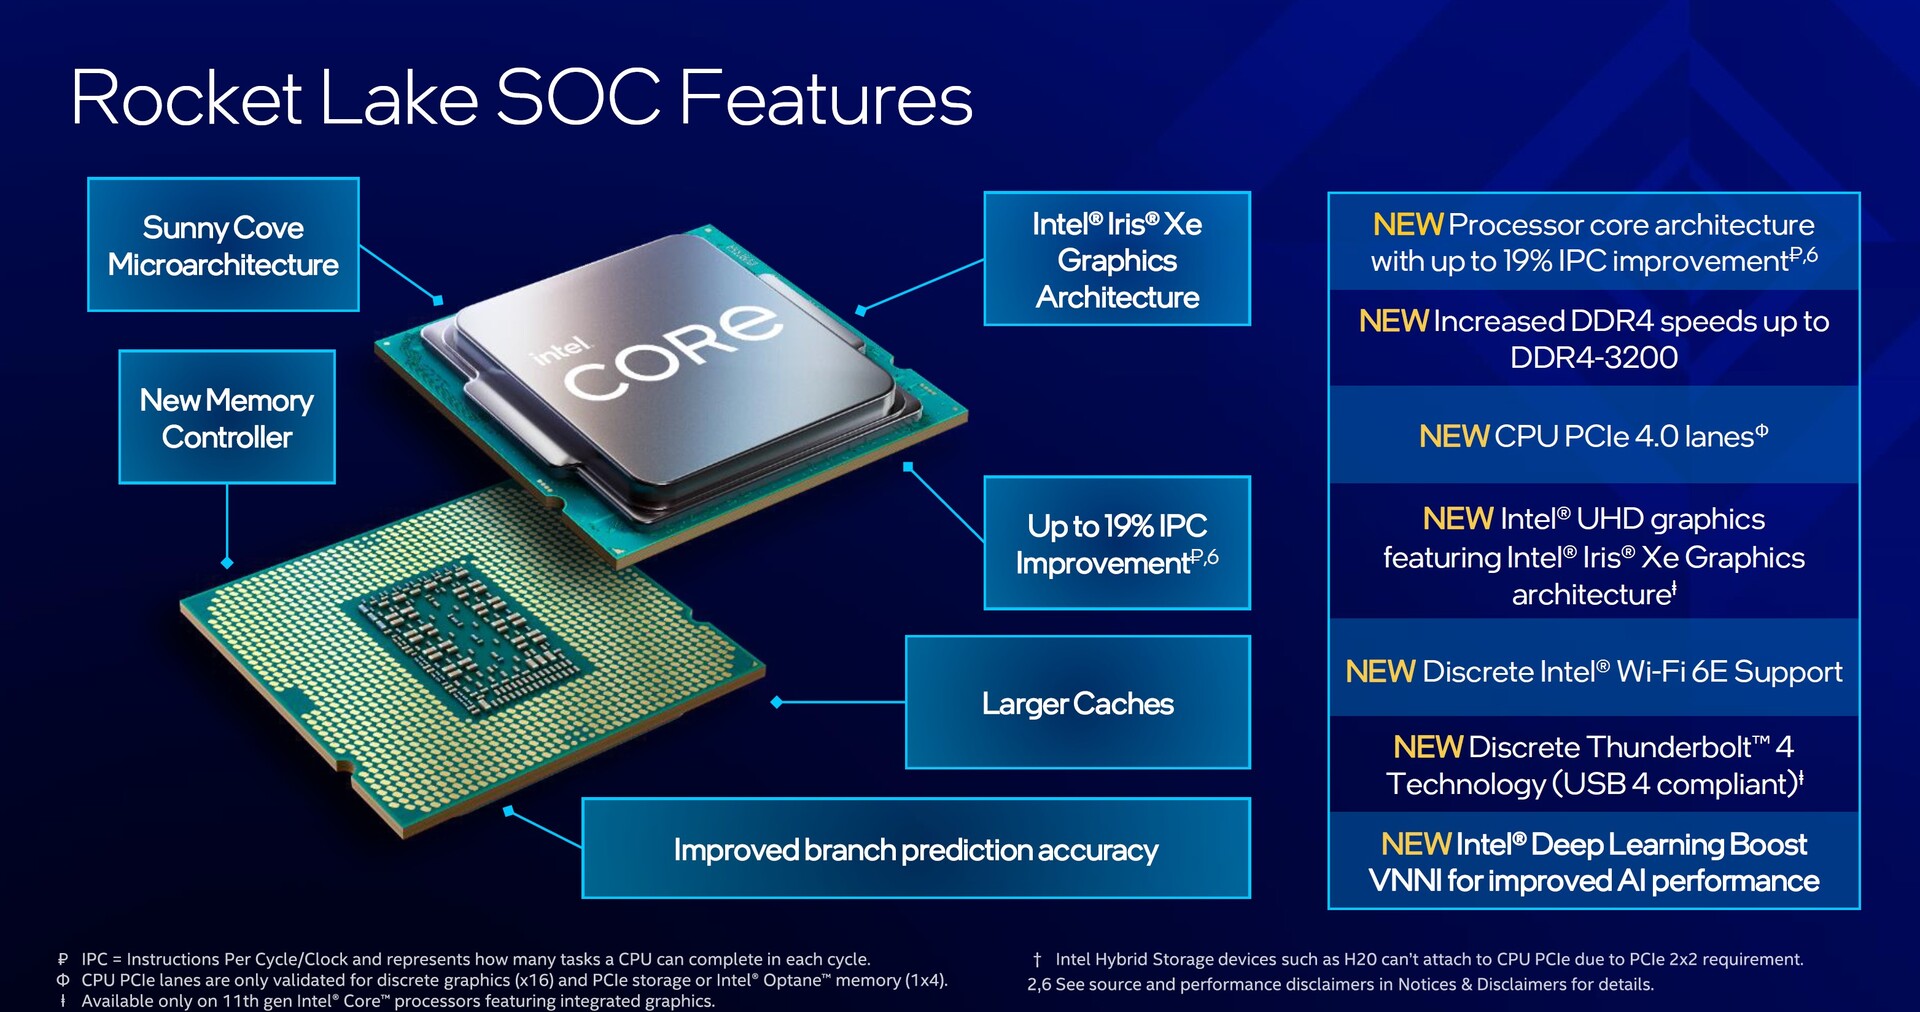

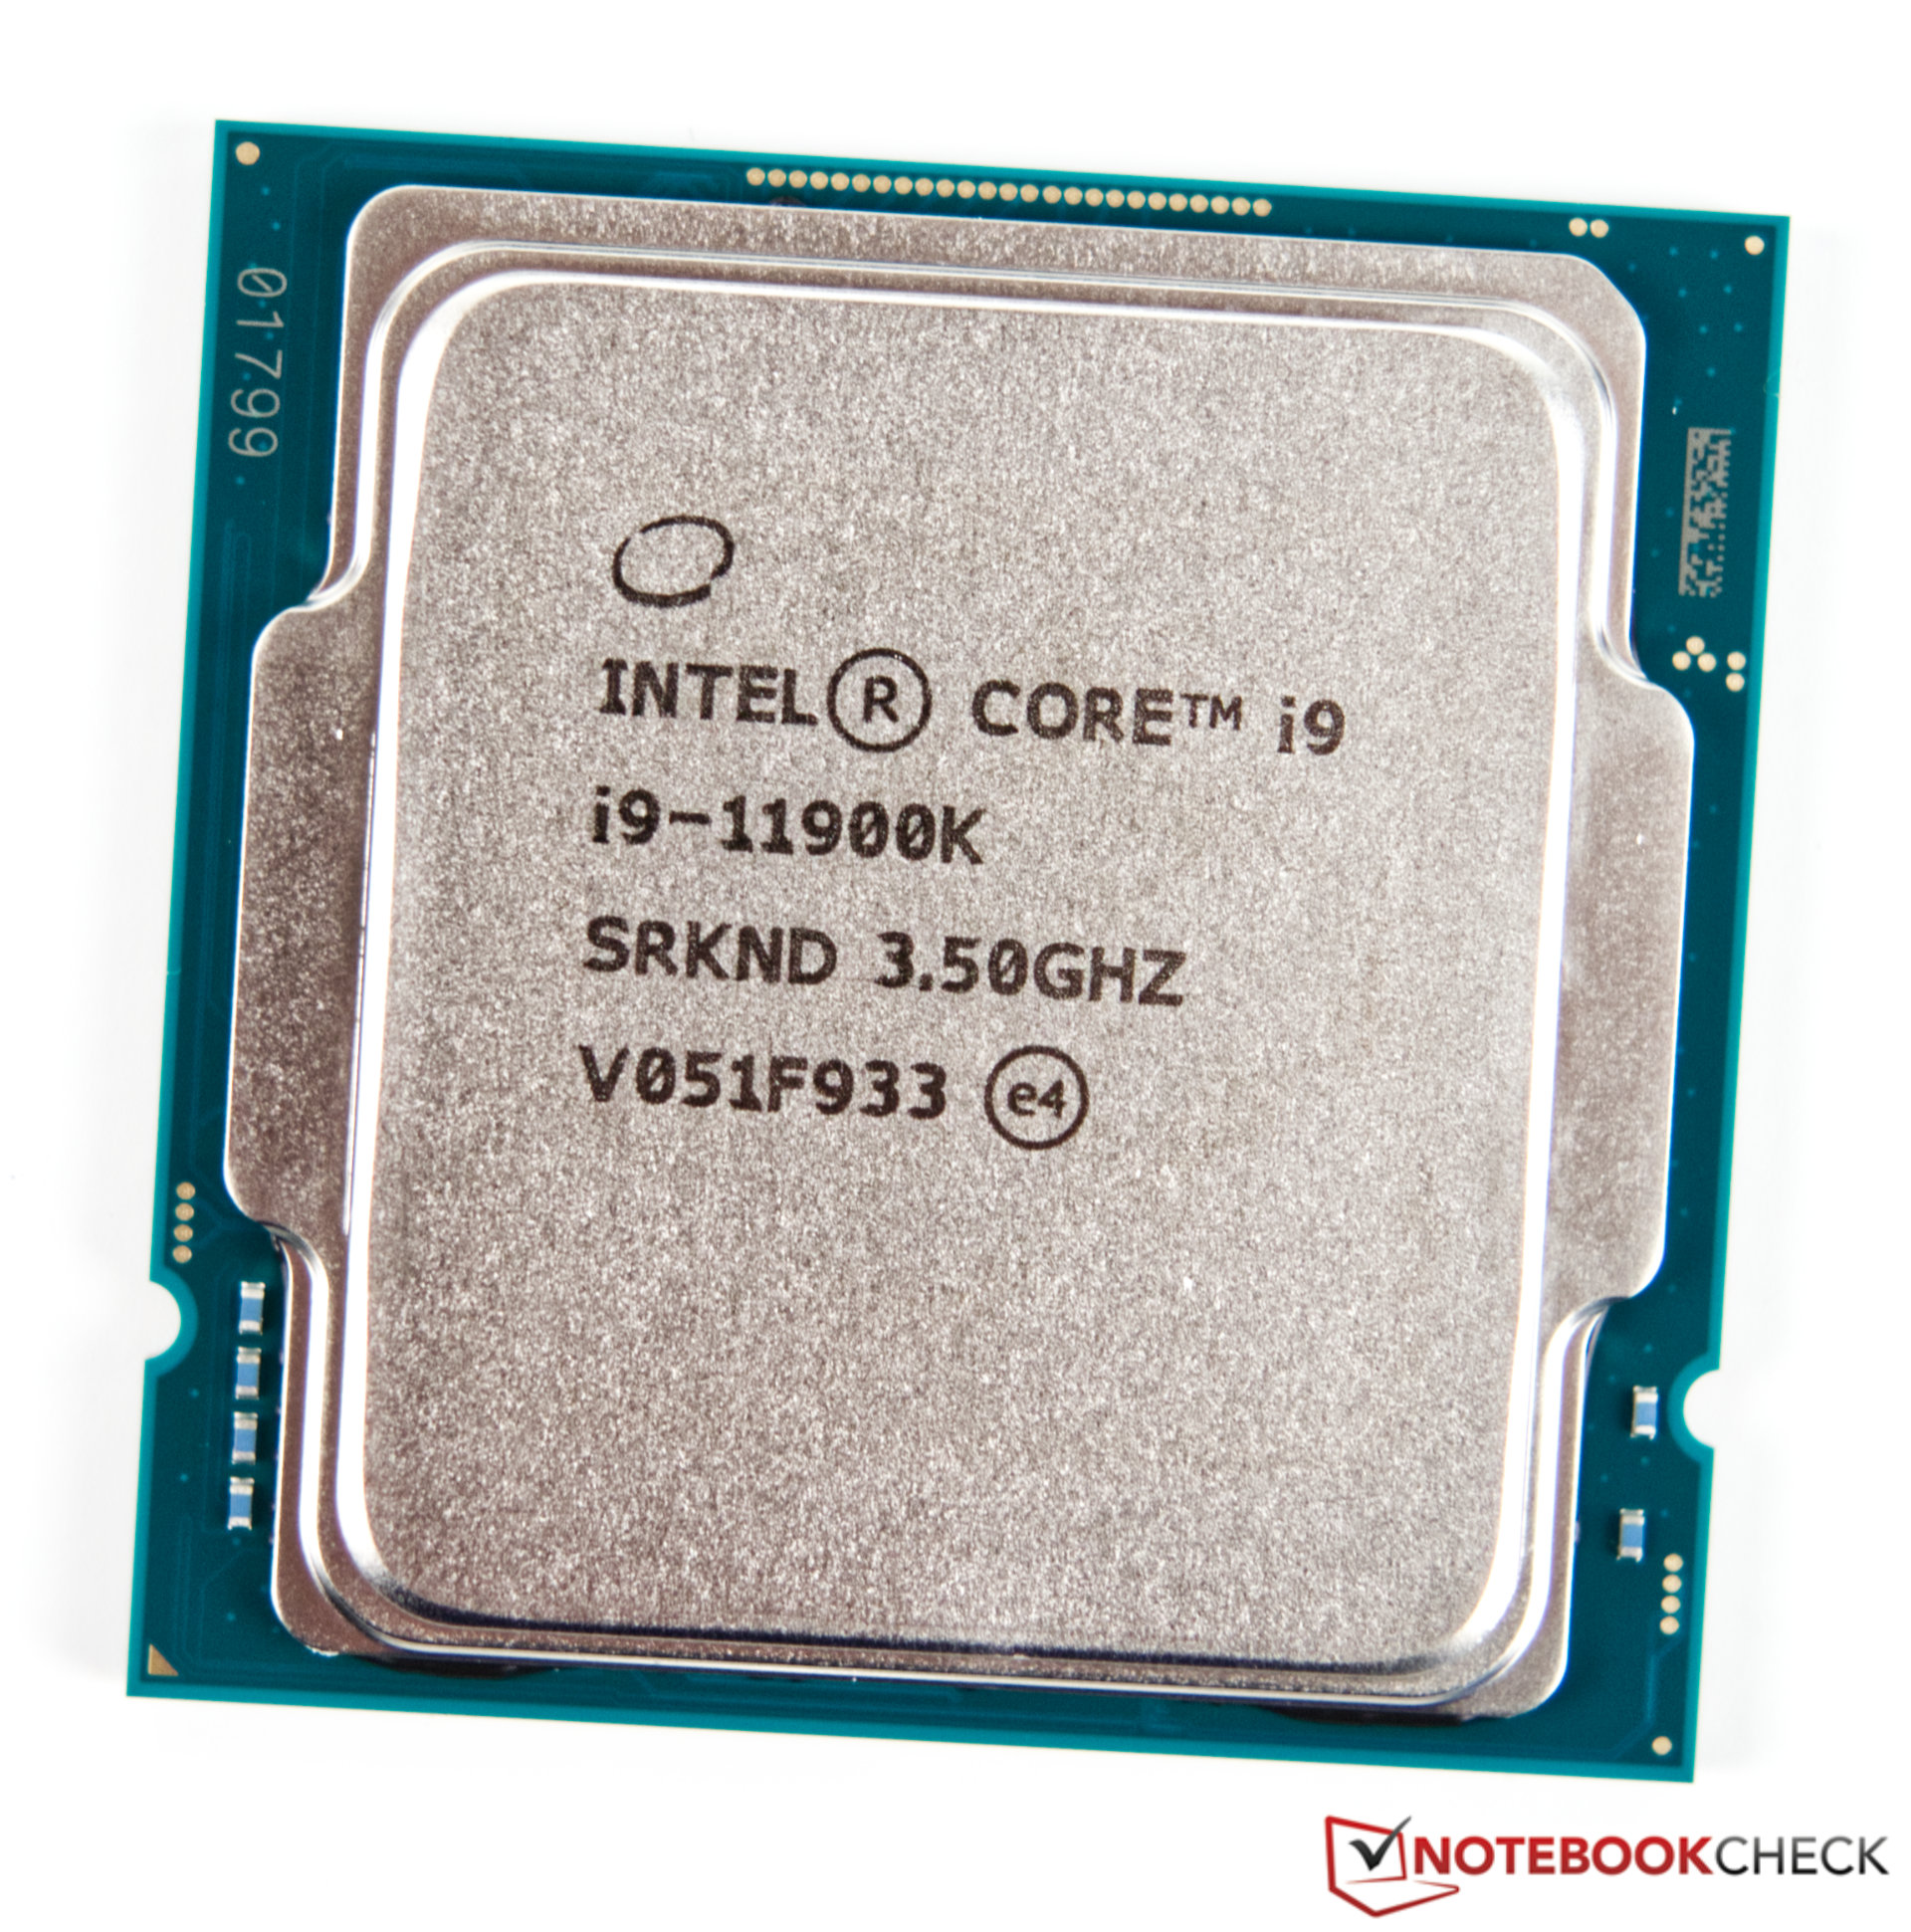
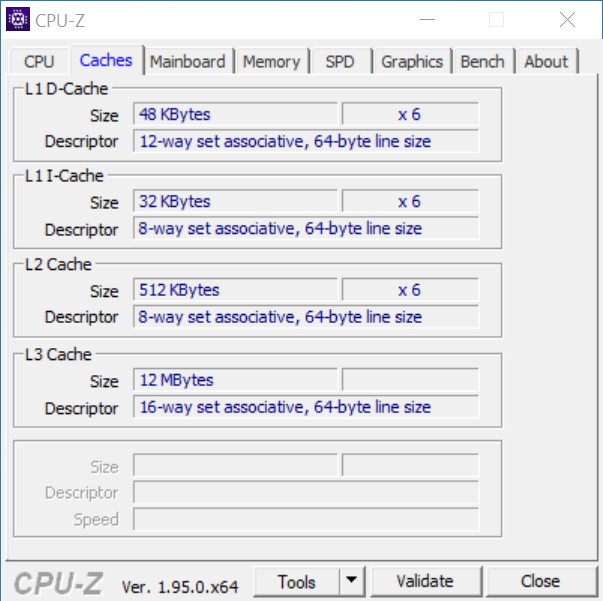
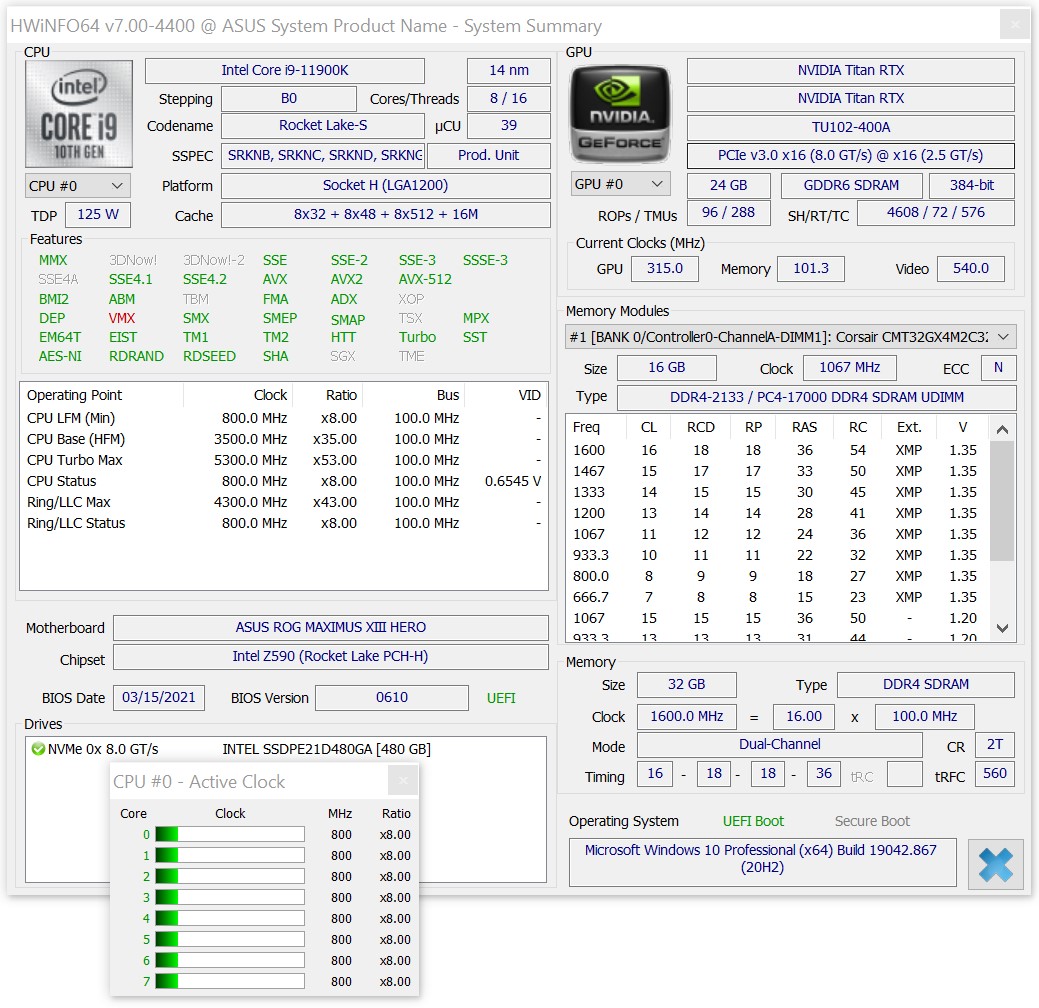
Ein flüchtiger Blick auf die technischen Daten der neuen Rocket Lake-S Prozessoren sollte man nicht machen. Trotz des alten 14nm-Fertigungsprozesess hat sich unter dem Heatspreader einiges getan. Die alte Skylake-Architektur hat nunmehr ausgedient und wird durch Sunny Cove ersetzt. Ganz unbekannt ist Sunny Cove allerdings nicht, denn im Notebook-Bereich feierte die neue Architektur schon mit Intel Ice Lake ihr Debüt. Beim Vergleich der Micoarchitekturen wird klar, dass es nun einen etwas größeren L2-Cache gibt. Jeder Rechenkern ist etwas größer worden, was die Die-Fläche betrifft. Außerdem hat Intel die integrierte Grafikeinheit überarbeitet. Diese basiert nun auf der Intel Iris Xe Architektur und beanspruchen auch etwas mehr Fläche. Daraus resultiert die maximale Anzahl an Recheneinheiten, die sich beim Topmodell auf 8 beschränkt. Zum Vergleich, der Intel Core i9-10900K bot seinerzeit 10 Rechenkerne.
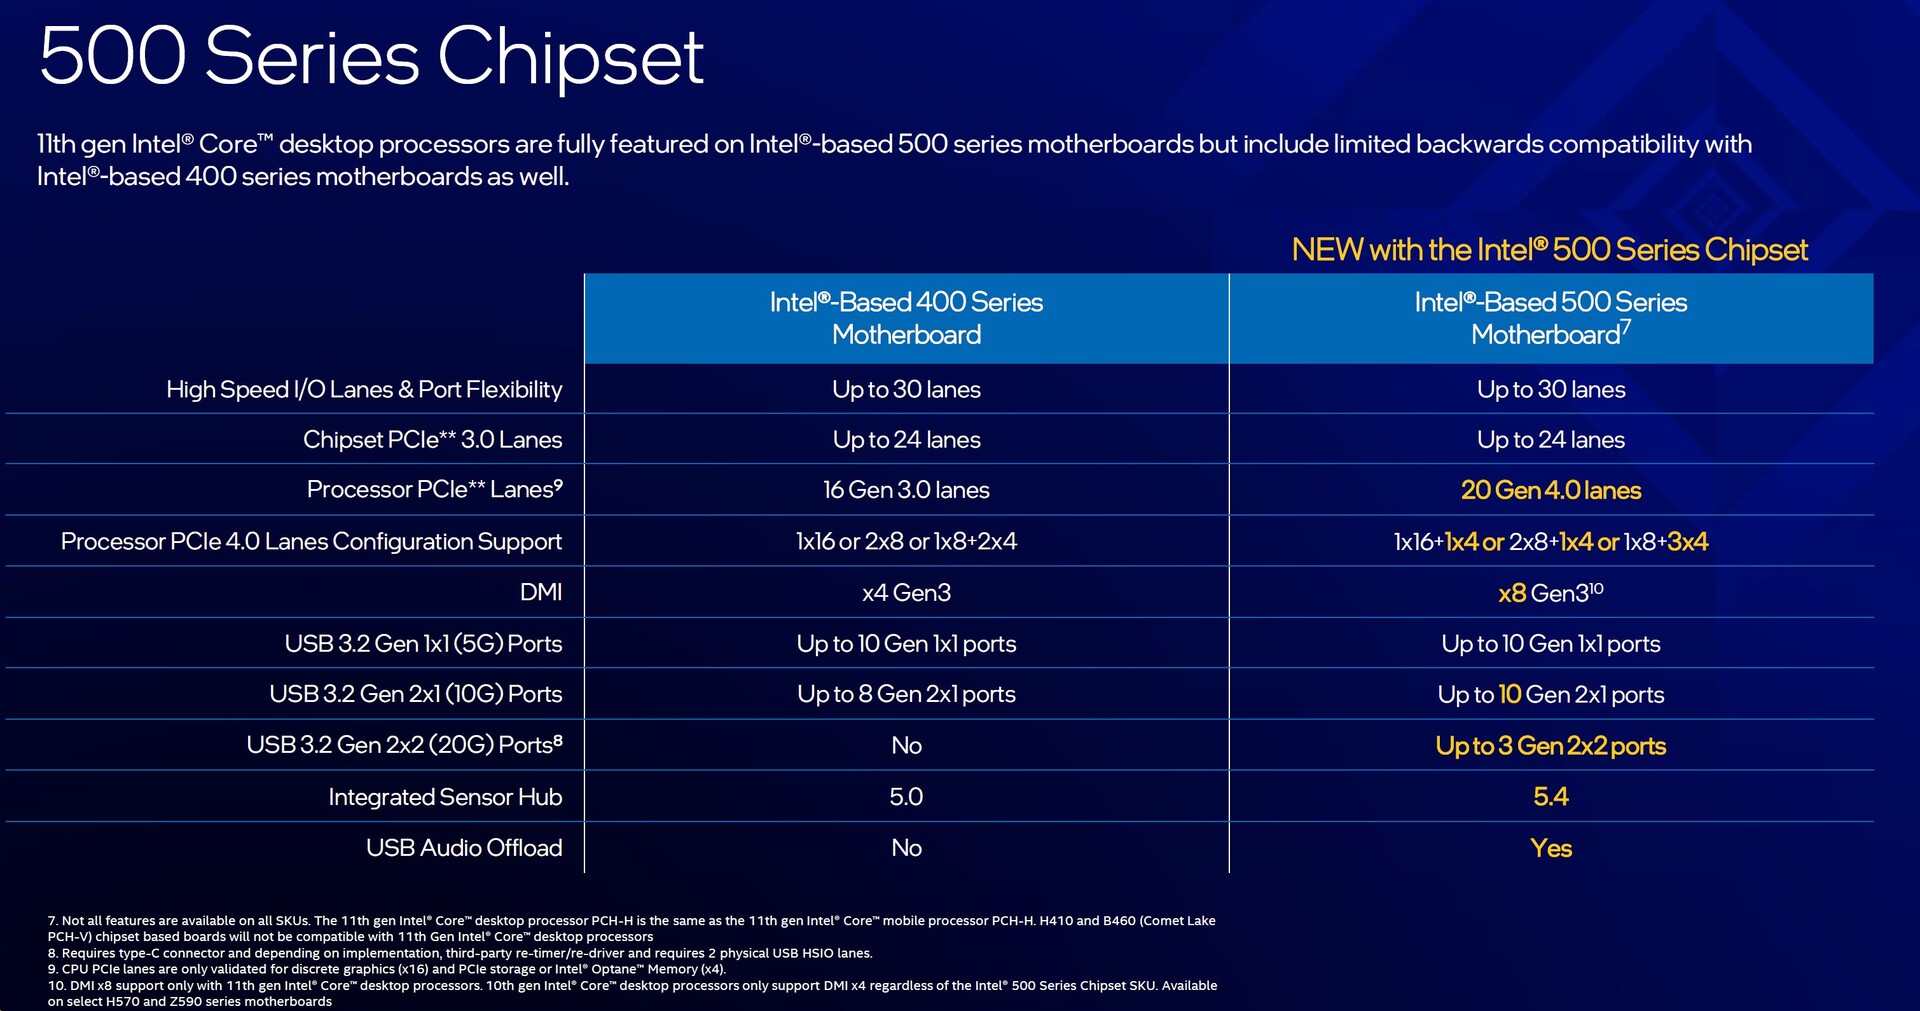
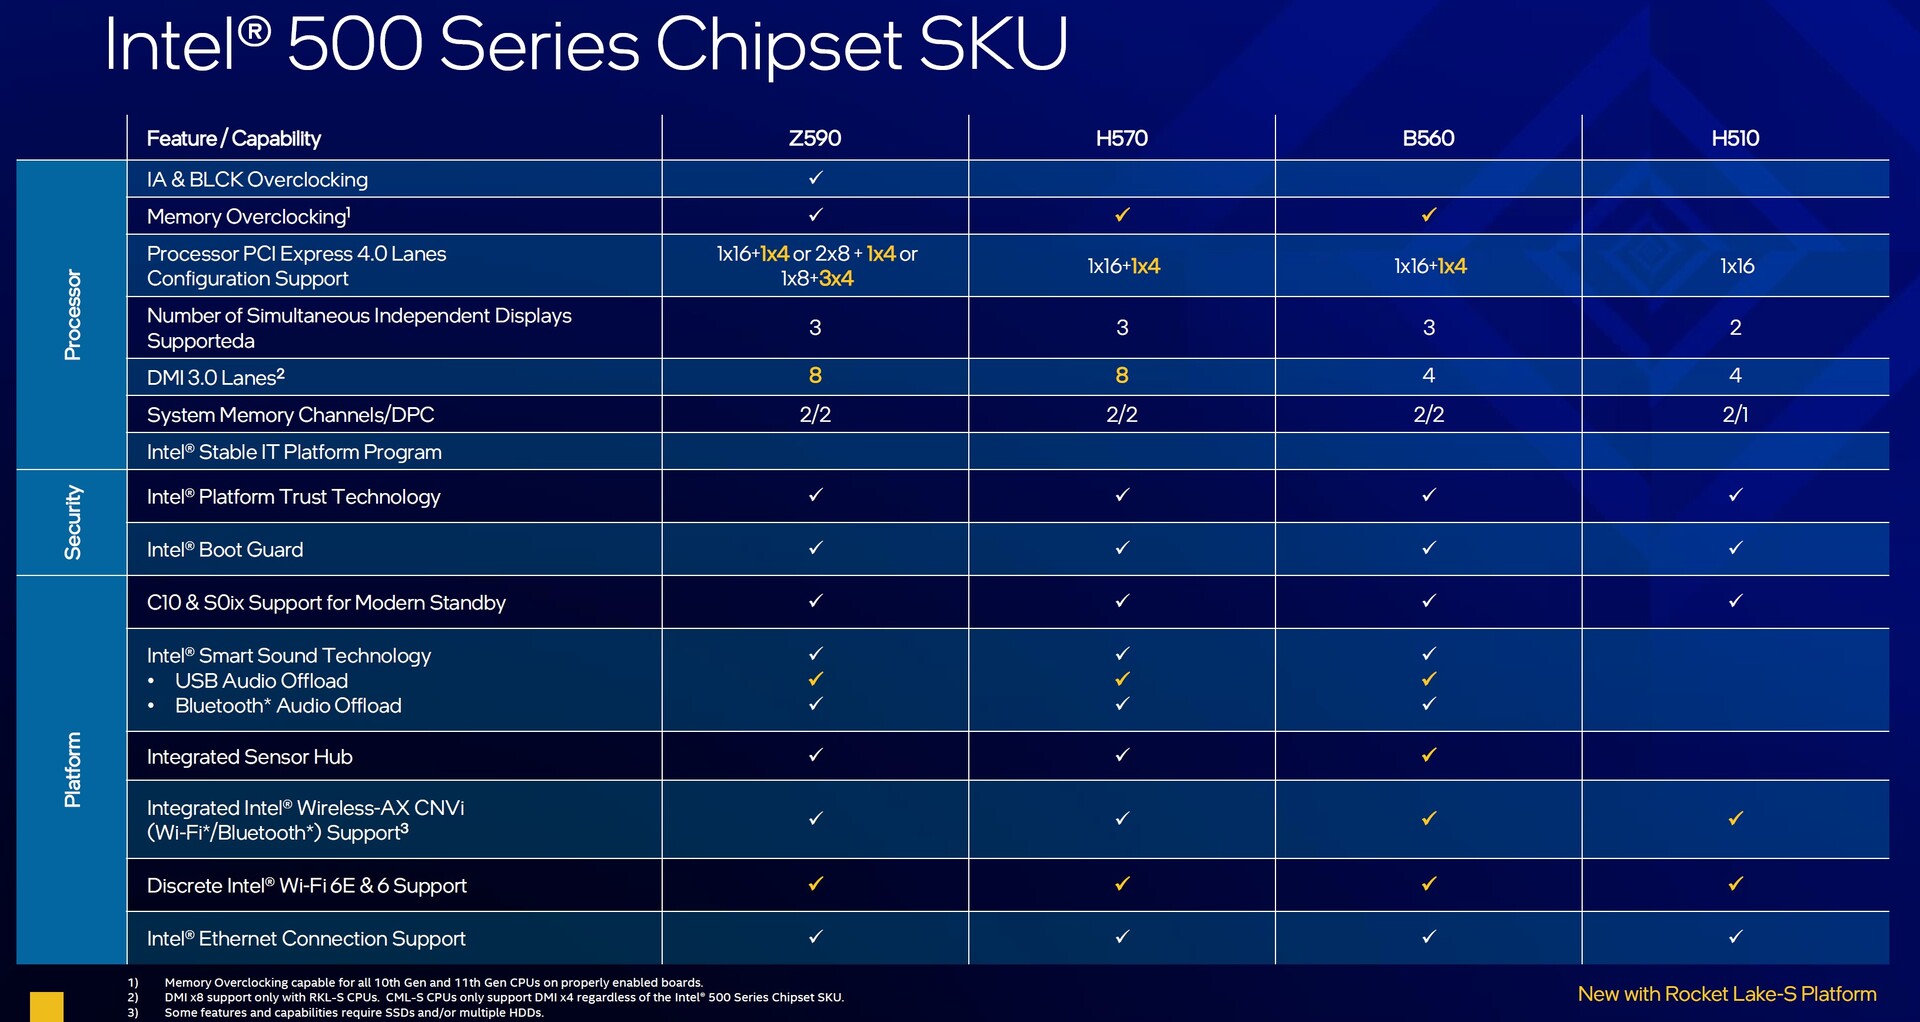
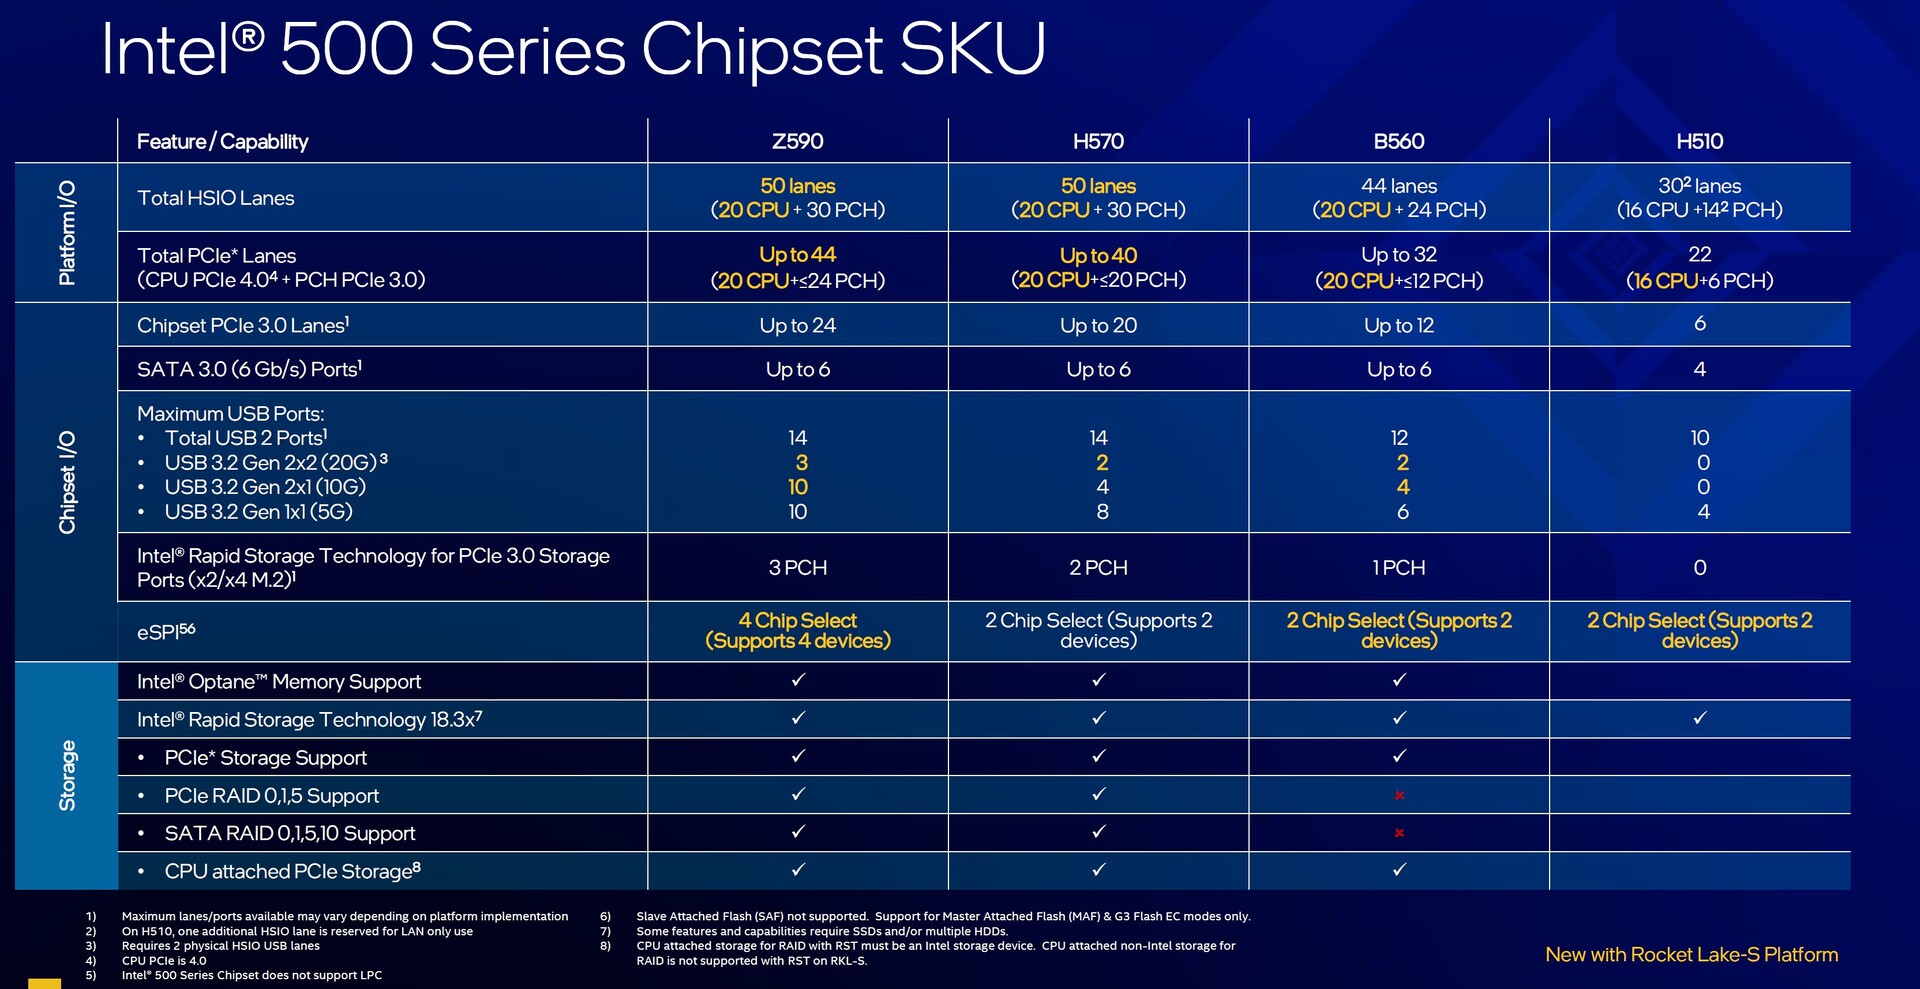
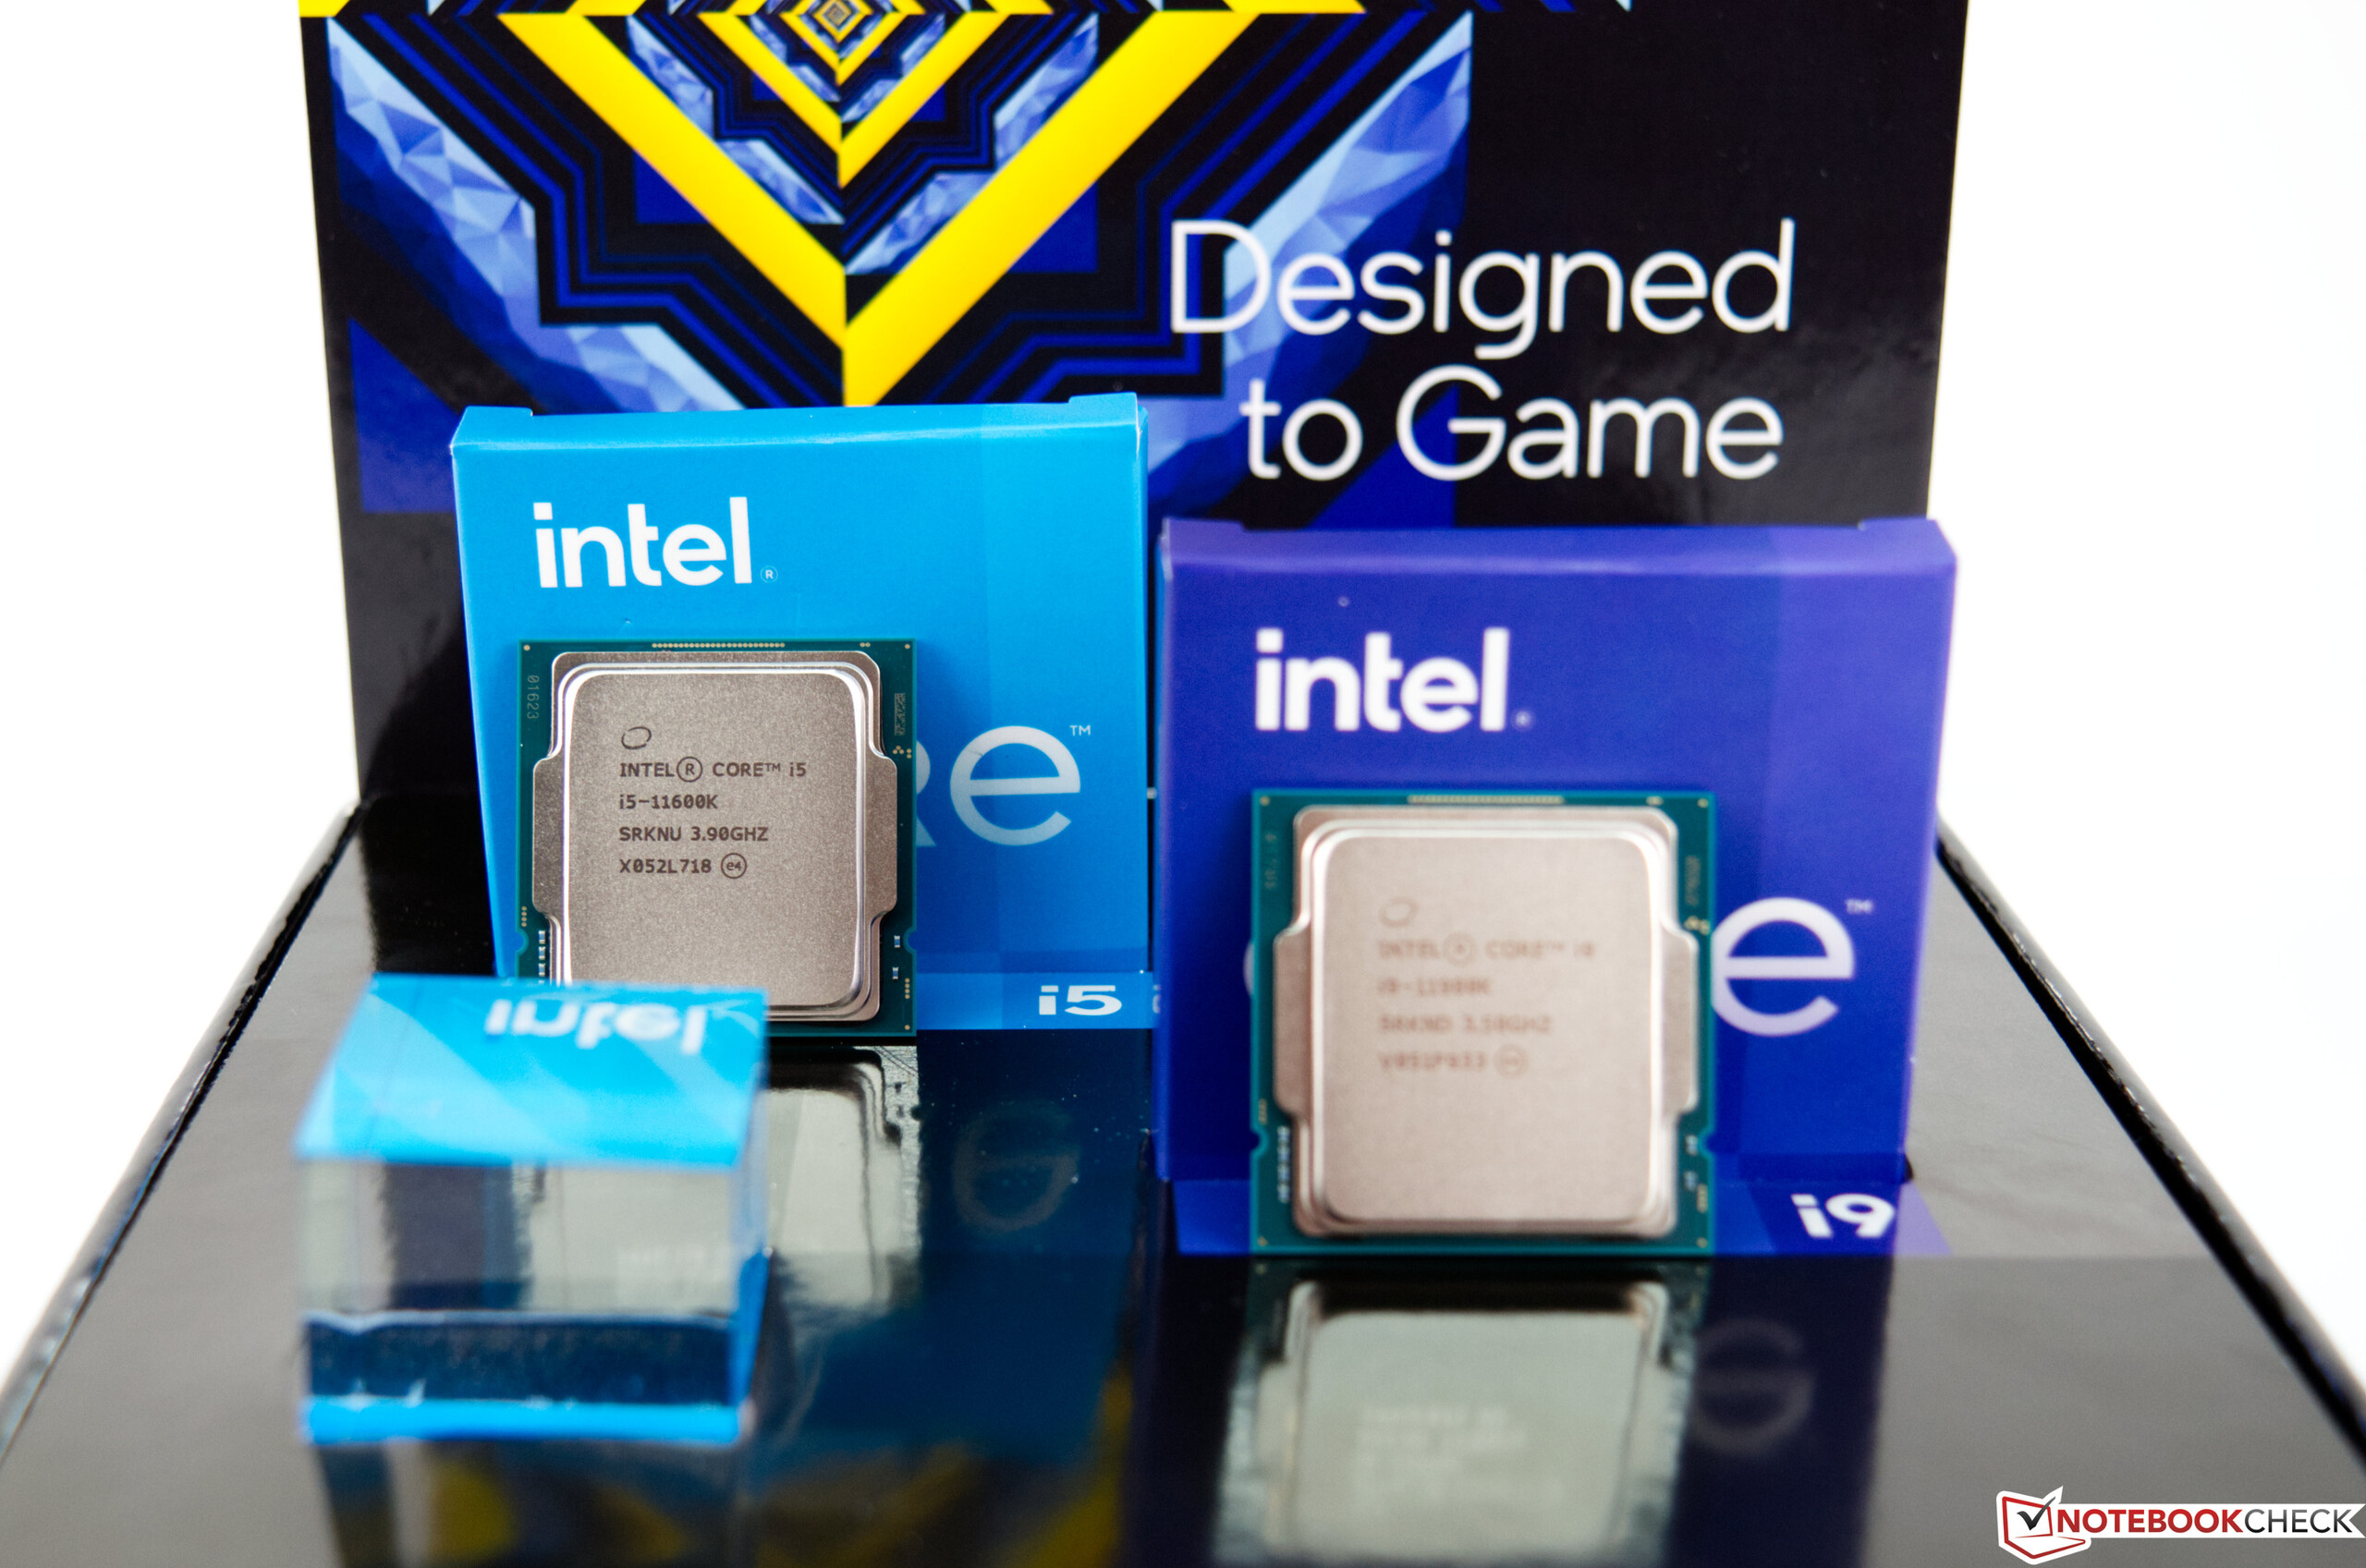
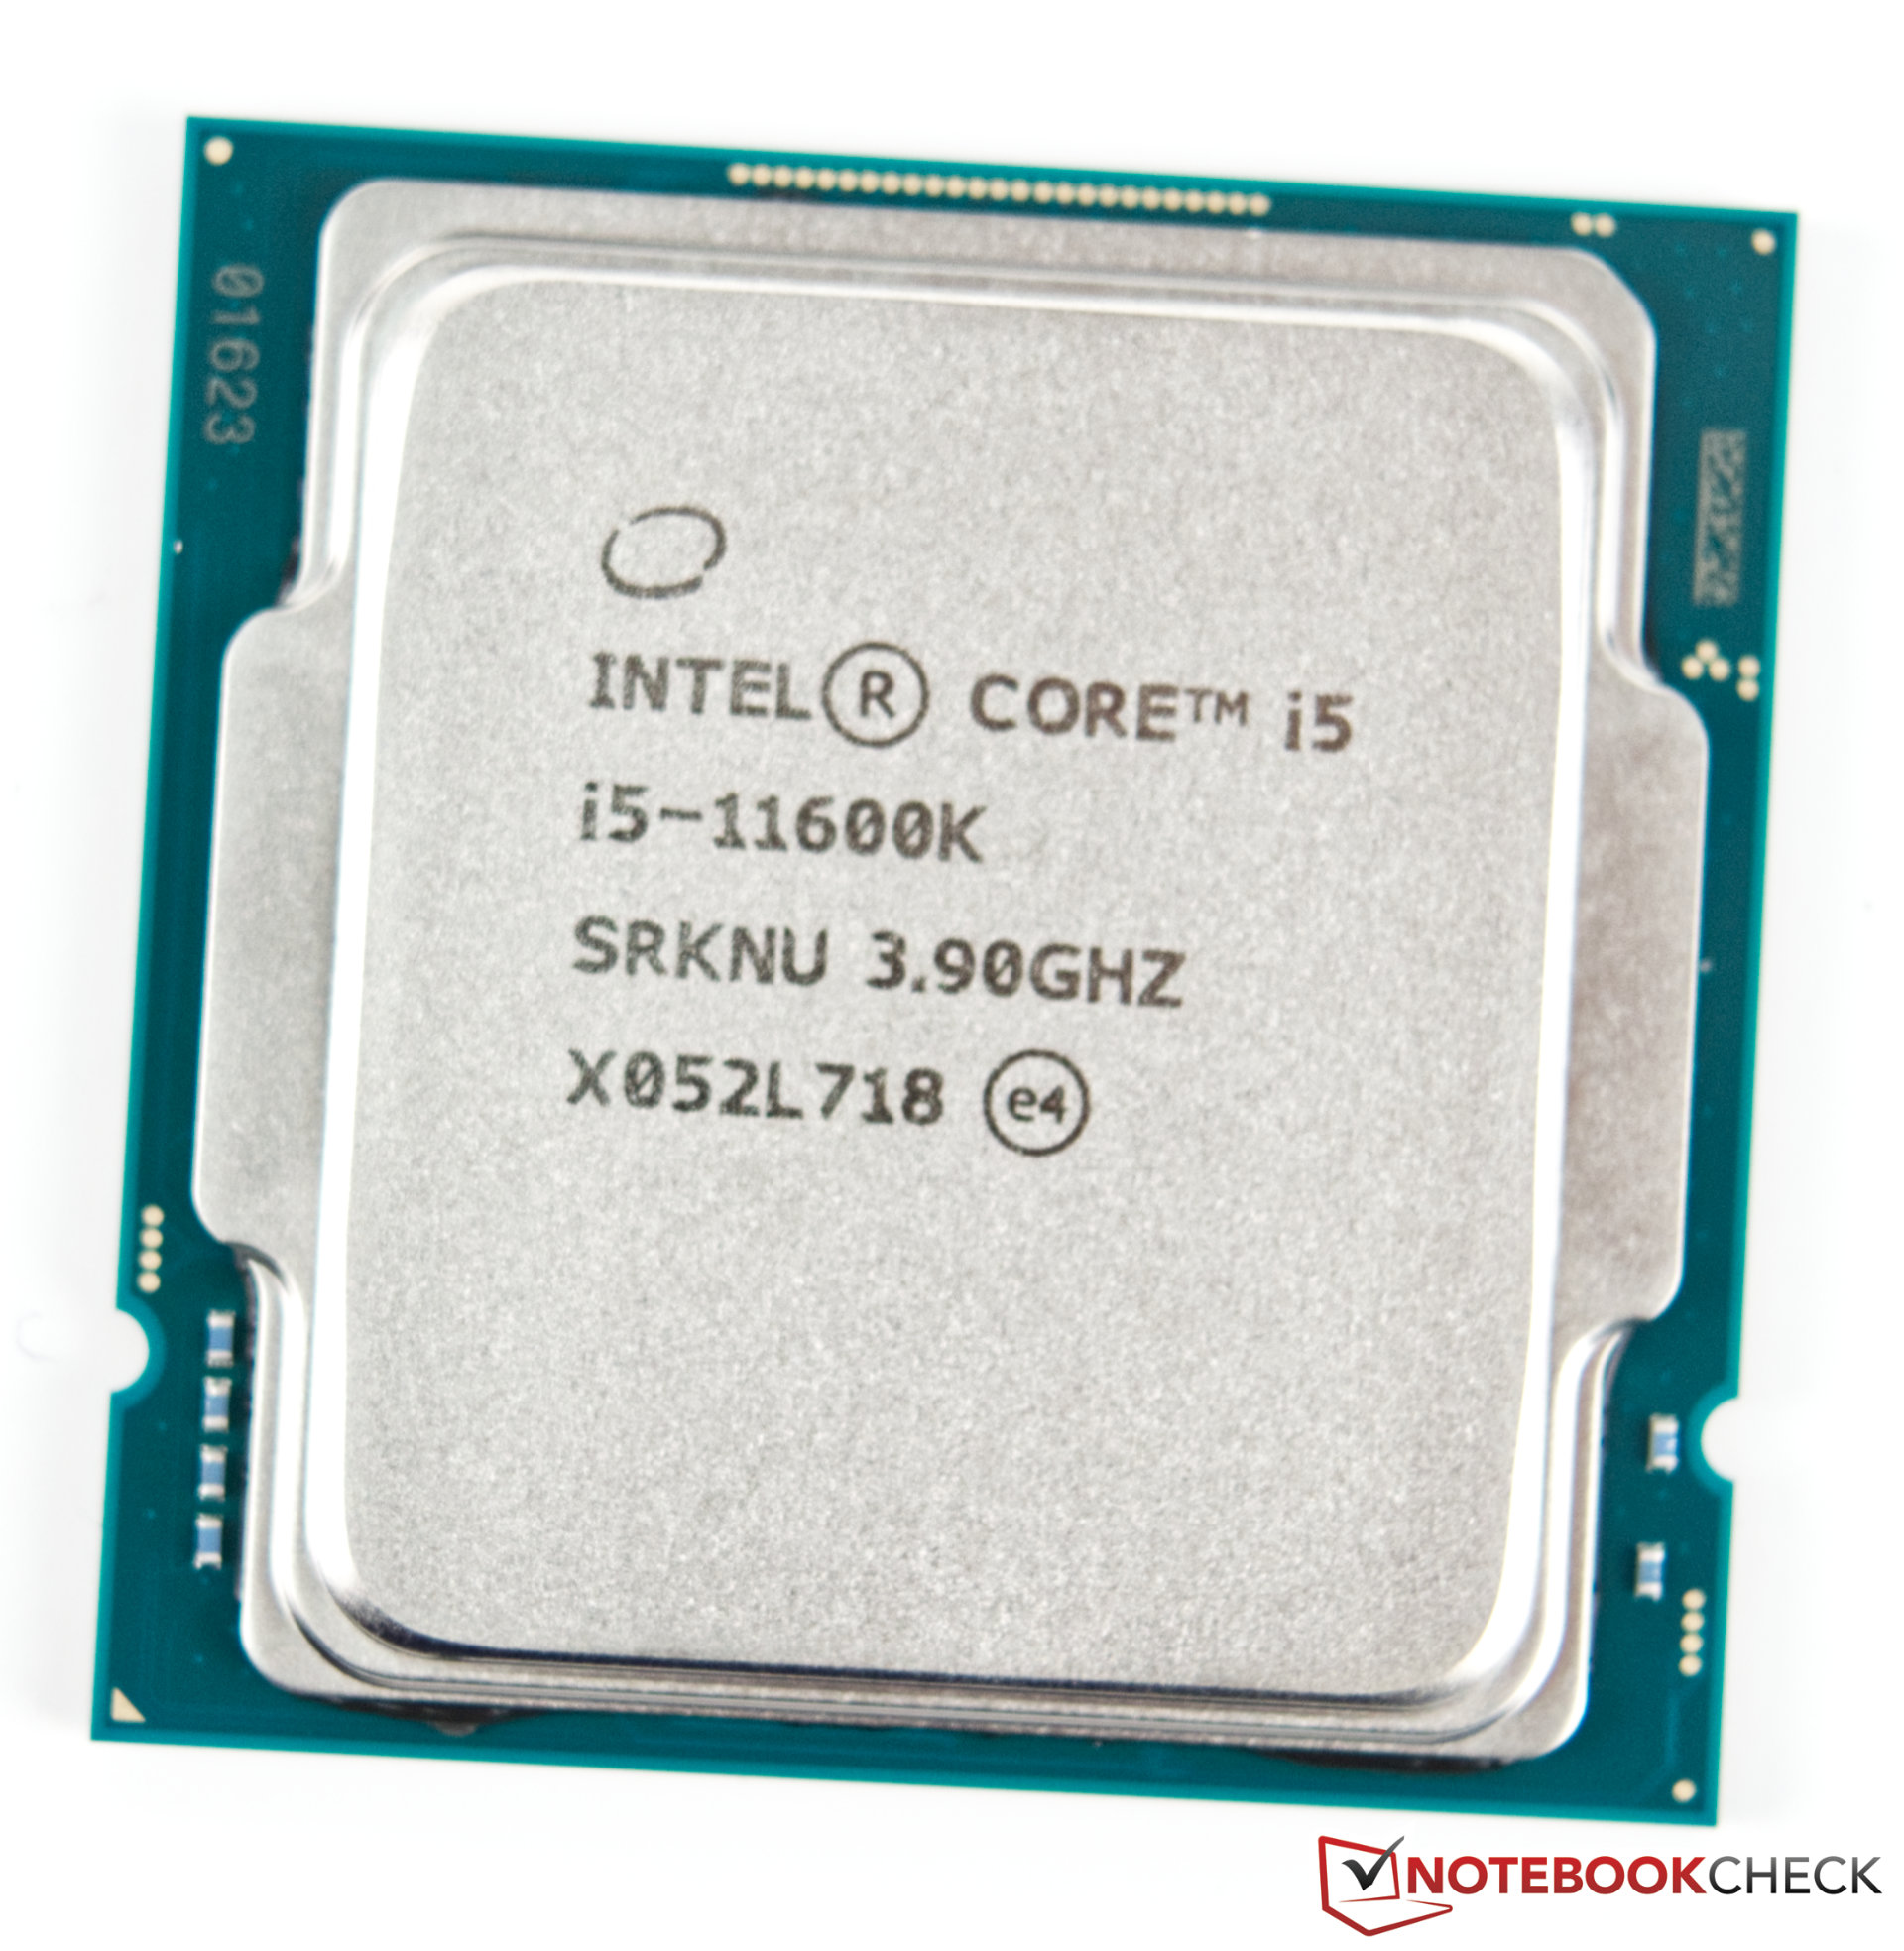
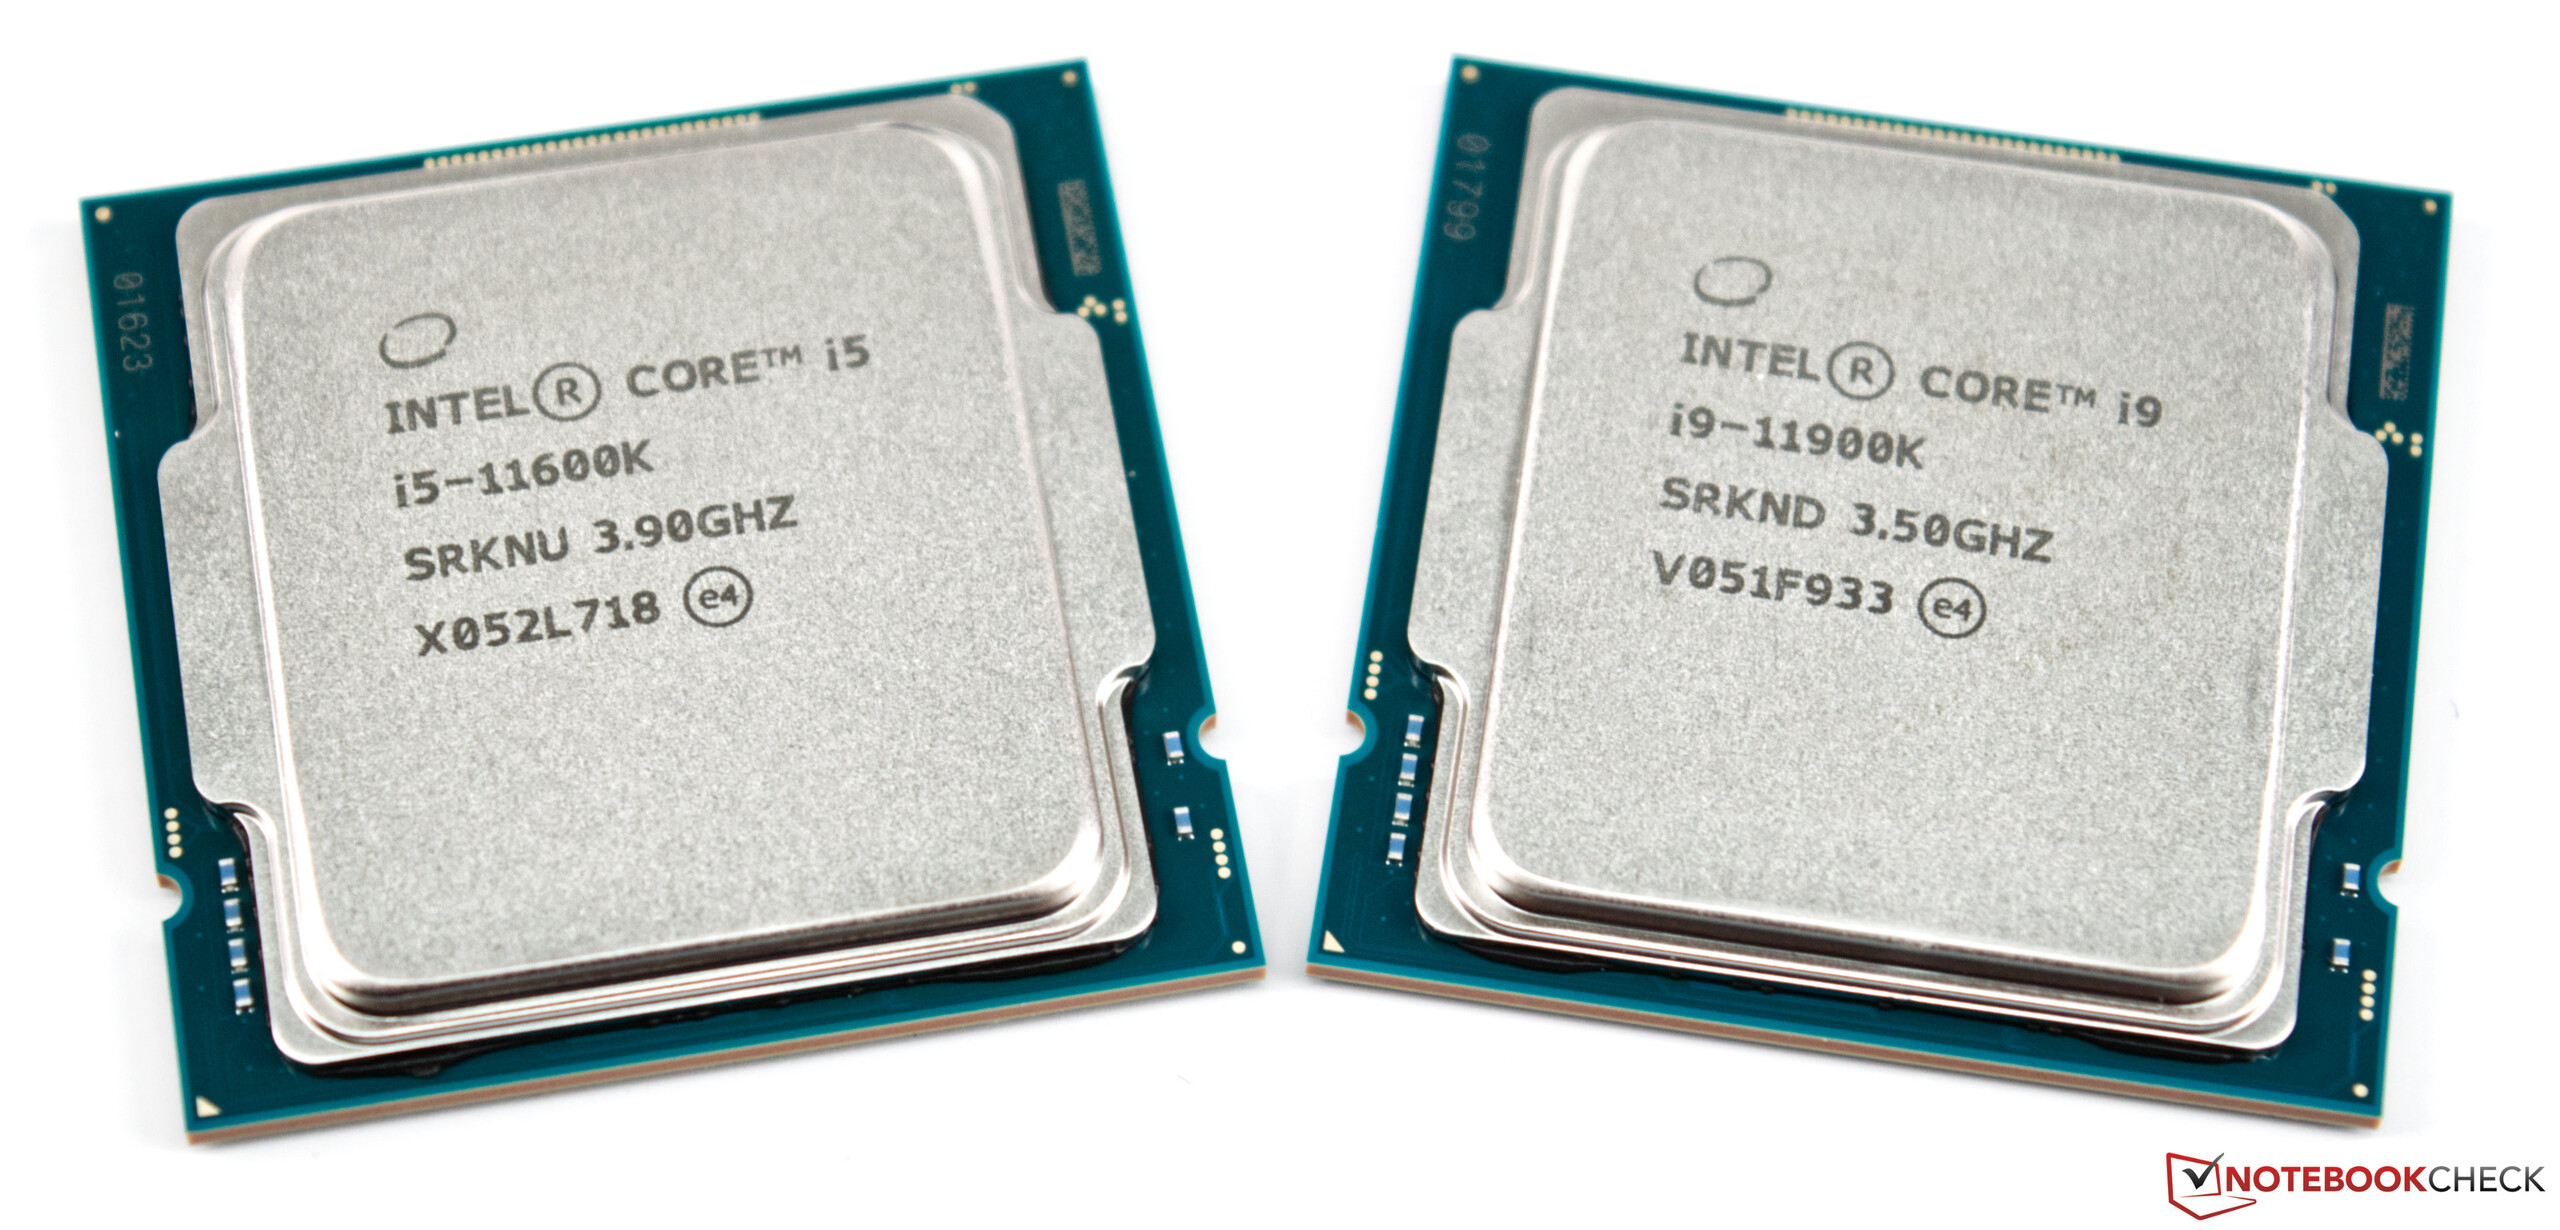
In diesem Test wollen wir uns den Intel Core i9-11900K und dem Intel Core i5-11600K widmen. Beide tragen das K in ihrer Bezeichnung, was für einen frei wählbaren Multiplikator spricht. Gleichzeitig verfügen beide Modelle über eine iGPU. Das bereits bekannte Namensschema wird beibehalten. Somit gibt es auch Varianten ohne iGPU oder auch ohne einen frei wählbaren Multiplikator, was für Overclocker eine schlechte Wahl wäre. Die aktuelle Rocket-Lake-Generation bleibt dem Sockel 1200 treu. Gleichwohl gibt es mit dem Z590-Chipsatz eine neue High-End-Plattform für die neuen Prozessoren. Per BIOS-Update lassen sich die neuen Chips aber auch auf den 400er-Mainboards betreiben. Inwieweit dann aber die neuen Features alle unterstützt werden, liegt in der Hand der jeweiligen Bordpartner. Wer auf Nummer sicher gehen möchte, sollte eine aktuelle Platine wählen, dann gibt es auch sicher PCI-E 4.0 Support mit maximal 20 Lanes. Kleinere Chipsätze hören auf die Namen H570, B560 sowie H510. Der wohl größte Unterschied ist die Option "Memory Overclocking", welche mit Ausnahme des H510 nun alle neuen Chipsätze unterstützen.
In der folgenden Tabelle haben wir einmal die wichtigsten Vertreter der neuen Rocket Lake-S Familie für Sie zusammengetragen.
Die Core-Prozessoren der Rocket Lake-S Serie im Überblick
| Modell | Kerne / Threads |
Basistakt | Turbo 2.0 | Turbo 3.0 | TVB 1C/xC | All Core Boost | Speicher | Grafik | TDP | Preis (UVP) |
|---|---|---|---|---|---|---|---|---|---|---|
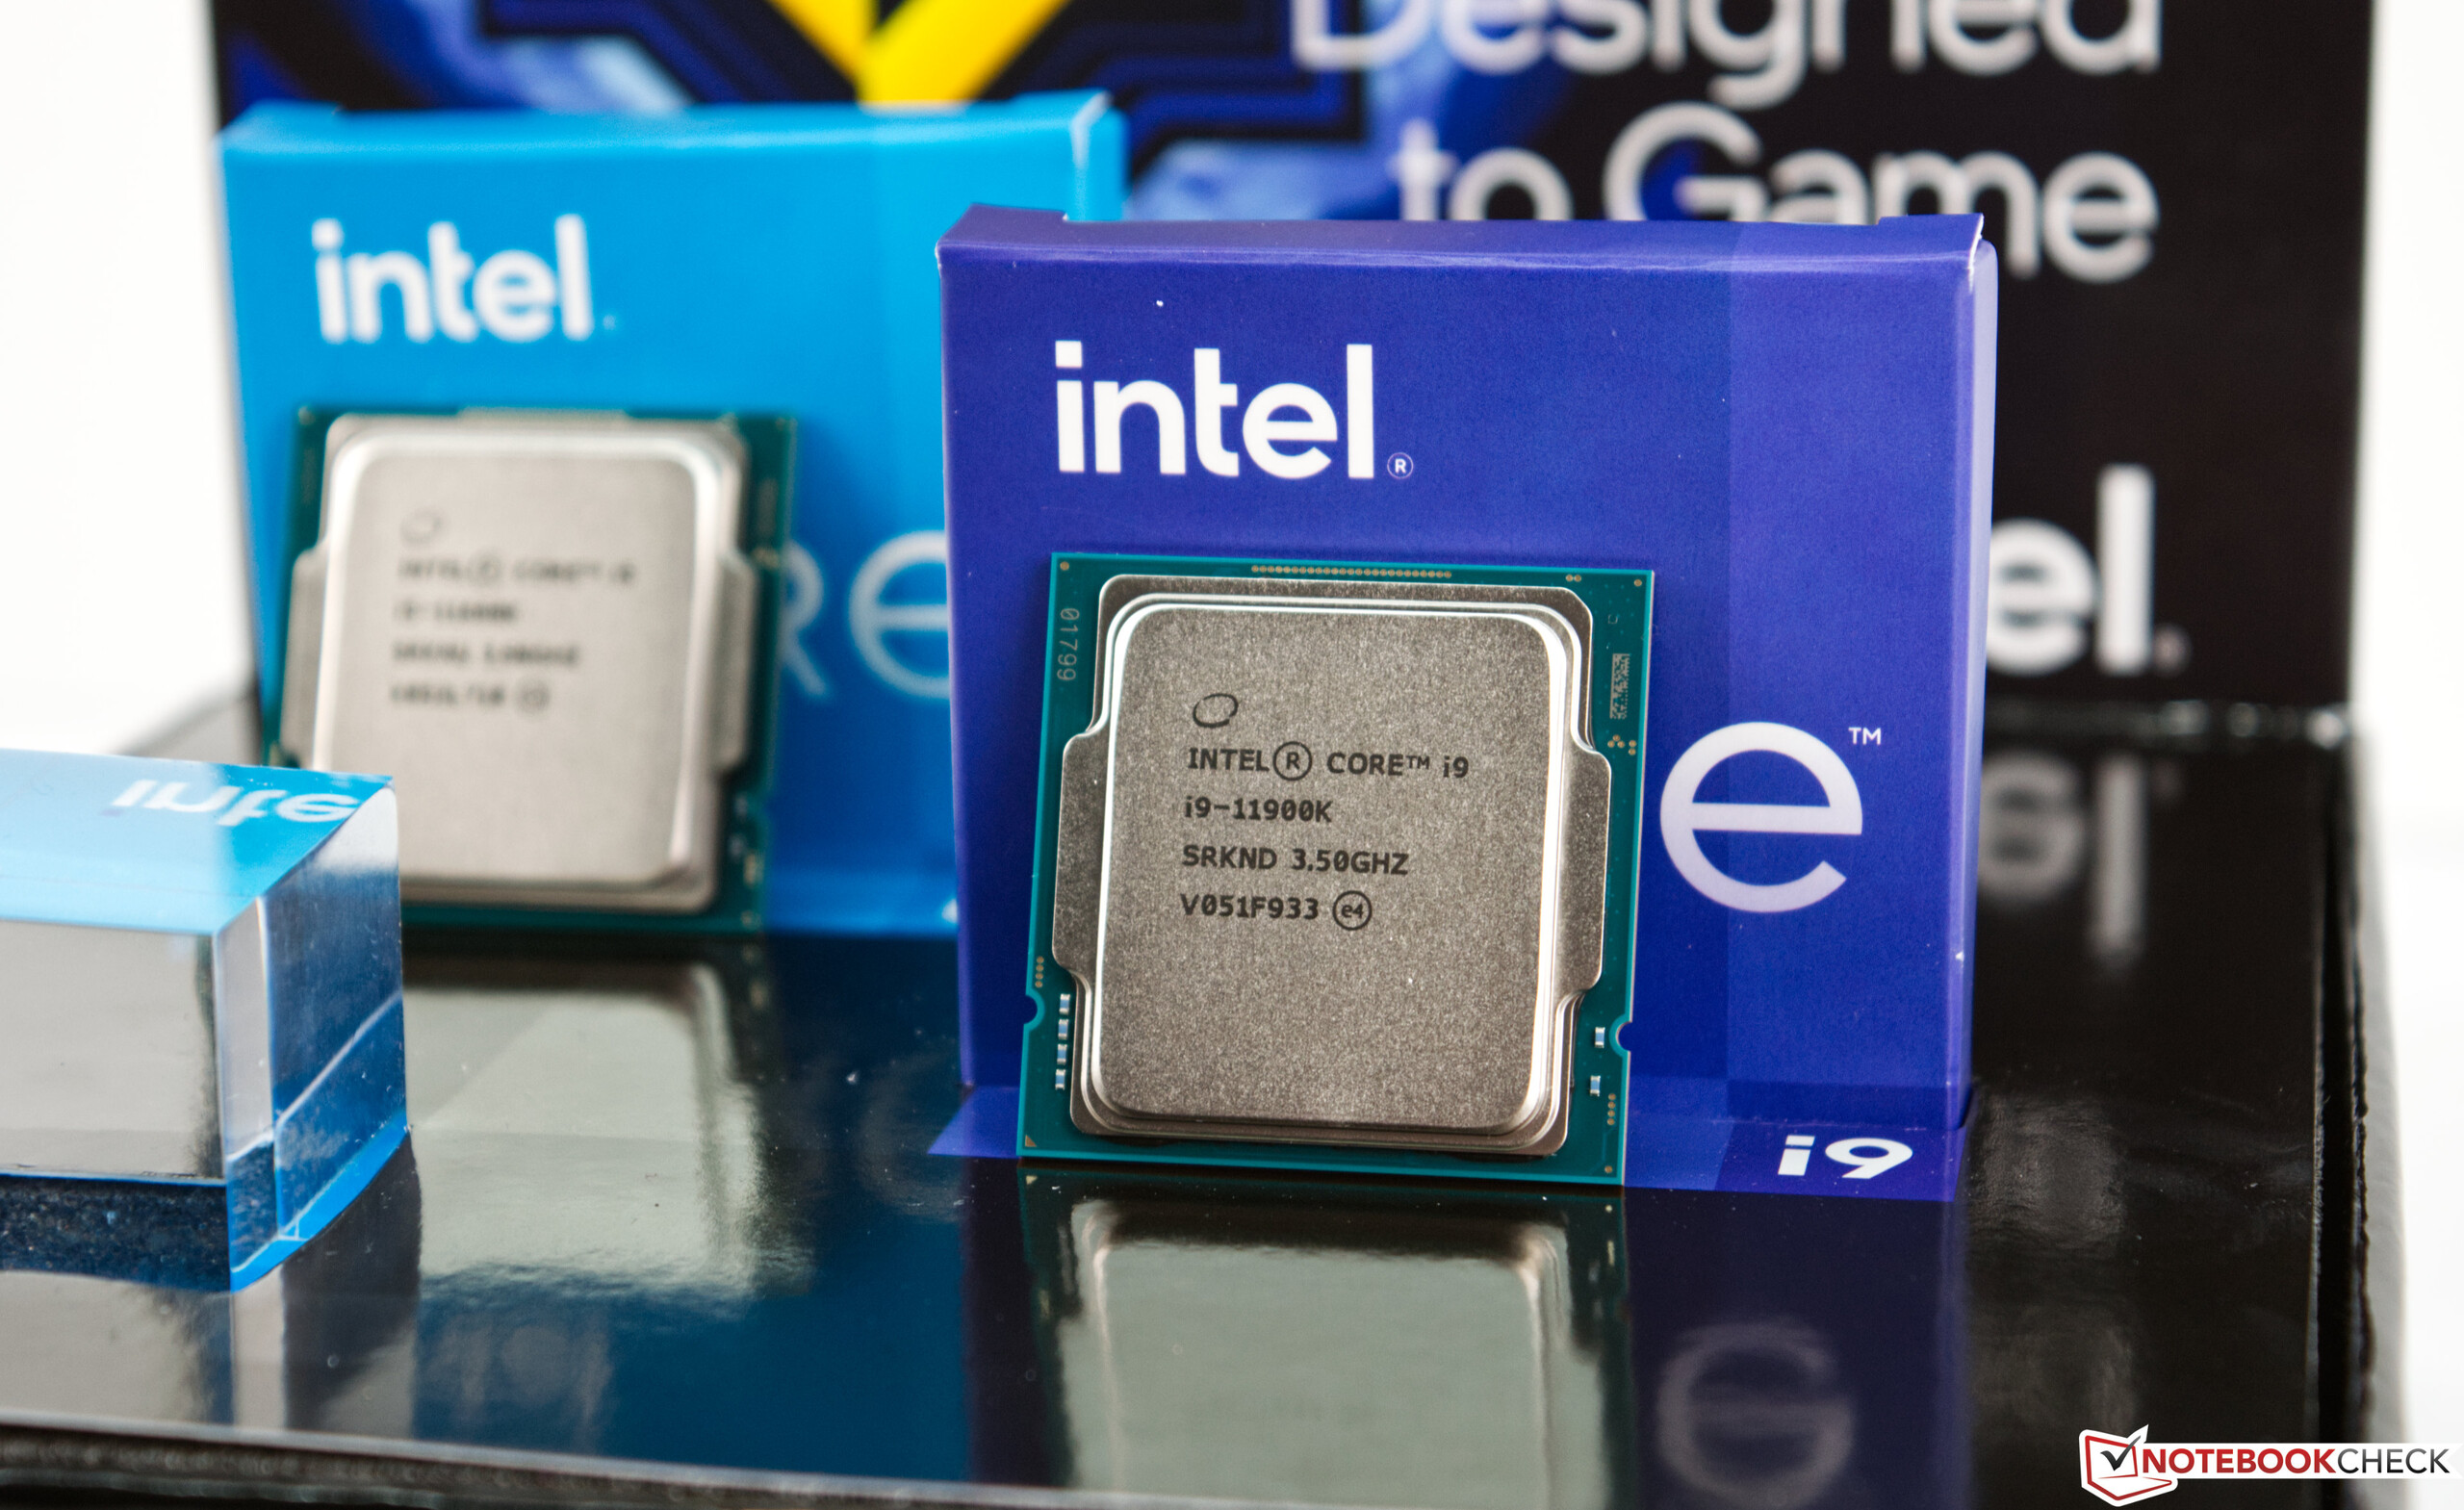
| Core i9-11900K | 8/16 | 3,5 GHz | 5,1 GHz | 5,3 GHz | 5,3 / 4,8 GHz | 4,7 GHz | DDR4-3200 | UHD 750 | 125 Watt | €629 |
| Core i9-11900KF | 8/16 | 3,5 GHz | 5,1 GHz | 5,2 GHz | 5,3 / 4,8 GHz | 4,7 GHz | DDR4-3200 | - | 125 Watt | €599 |
| Core i9-11900 | 8/16 | 2,5 GHz | 5,0 GHz | 5,1 GHz | 5,2 / 4,7 GHz | 4,6 GHz | DDR4-3200 | UHD 750 | 65 Watt | €509 |
| Core i9-11900F | 8/16 | 2,5 GHz | 5,0 GHz | 5,1 GHz | 5,2 / 4,7 GHz | 4,6 GHz | DDR4-3200 | - | 65 Watt | €479 |
| Core i9-11900T | 8/16 | 1,5 GHz | 4,8 GHz | 4,9 GHz | - | 3,7 GHz | DDR4-3200 | UHD 750 | 35 Watt | TBD |
| Core i7-11700K | 8/16 | 3,6 GHz | 4,9 GHz | 5,0 GHz | - | 4,6 GHz | DDR4-3200 | UHD 750 | 125 Watt | €469 |
| Core i7-11700KF | 8/16 | 3,6 GHz | 4,9 GHz | 5,0 GHz | - | 4,6 GHz | DDR4-3200 | - | 125 Watt | €439 |
| Core i7-11700 | 8/16 | 2,5 GHz | 4,8 GHz | 4,9 GHz | - | 4,4 GHz | DDR4-3200 | UHD 750 | 65 Watt | €379 |
| Core i7-11700F | 8/16 | 2,5 GHz | 4,8 GHz | 4,9 GHz | - | 4,4 GHz | DDR4-3200 | - | 65 Watt | TBD |
| Core i7-11700T | 8/16 | 1,4 GHz | 4,5 GHz | 4,6 GHz | - | 3,6 GHz | DDR4-3200 | UHD 750 | 35 Watt | TBD |
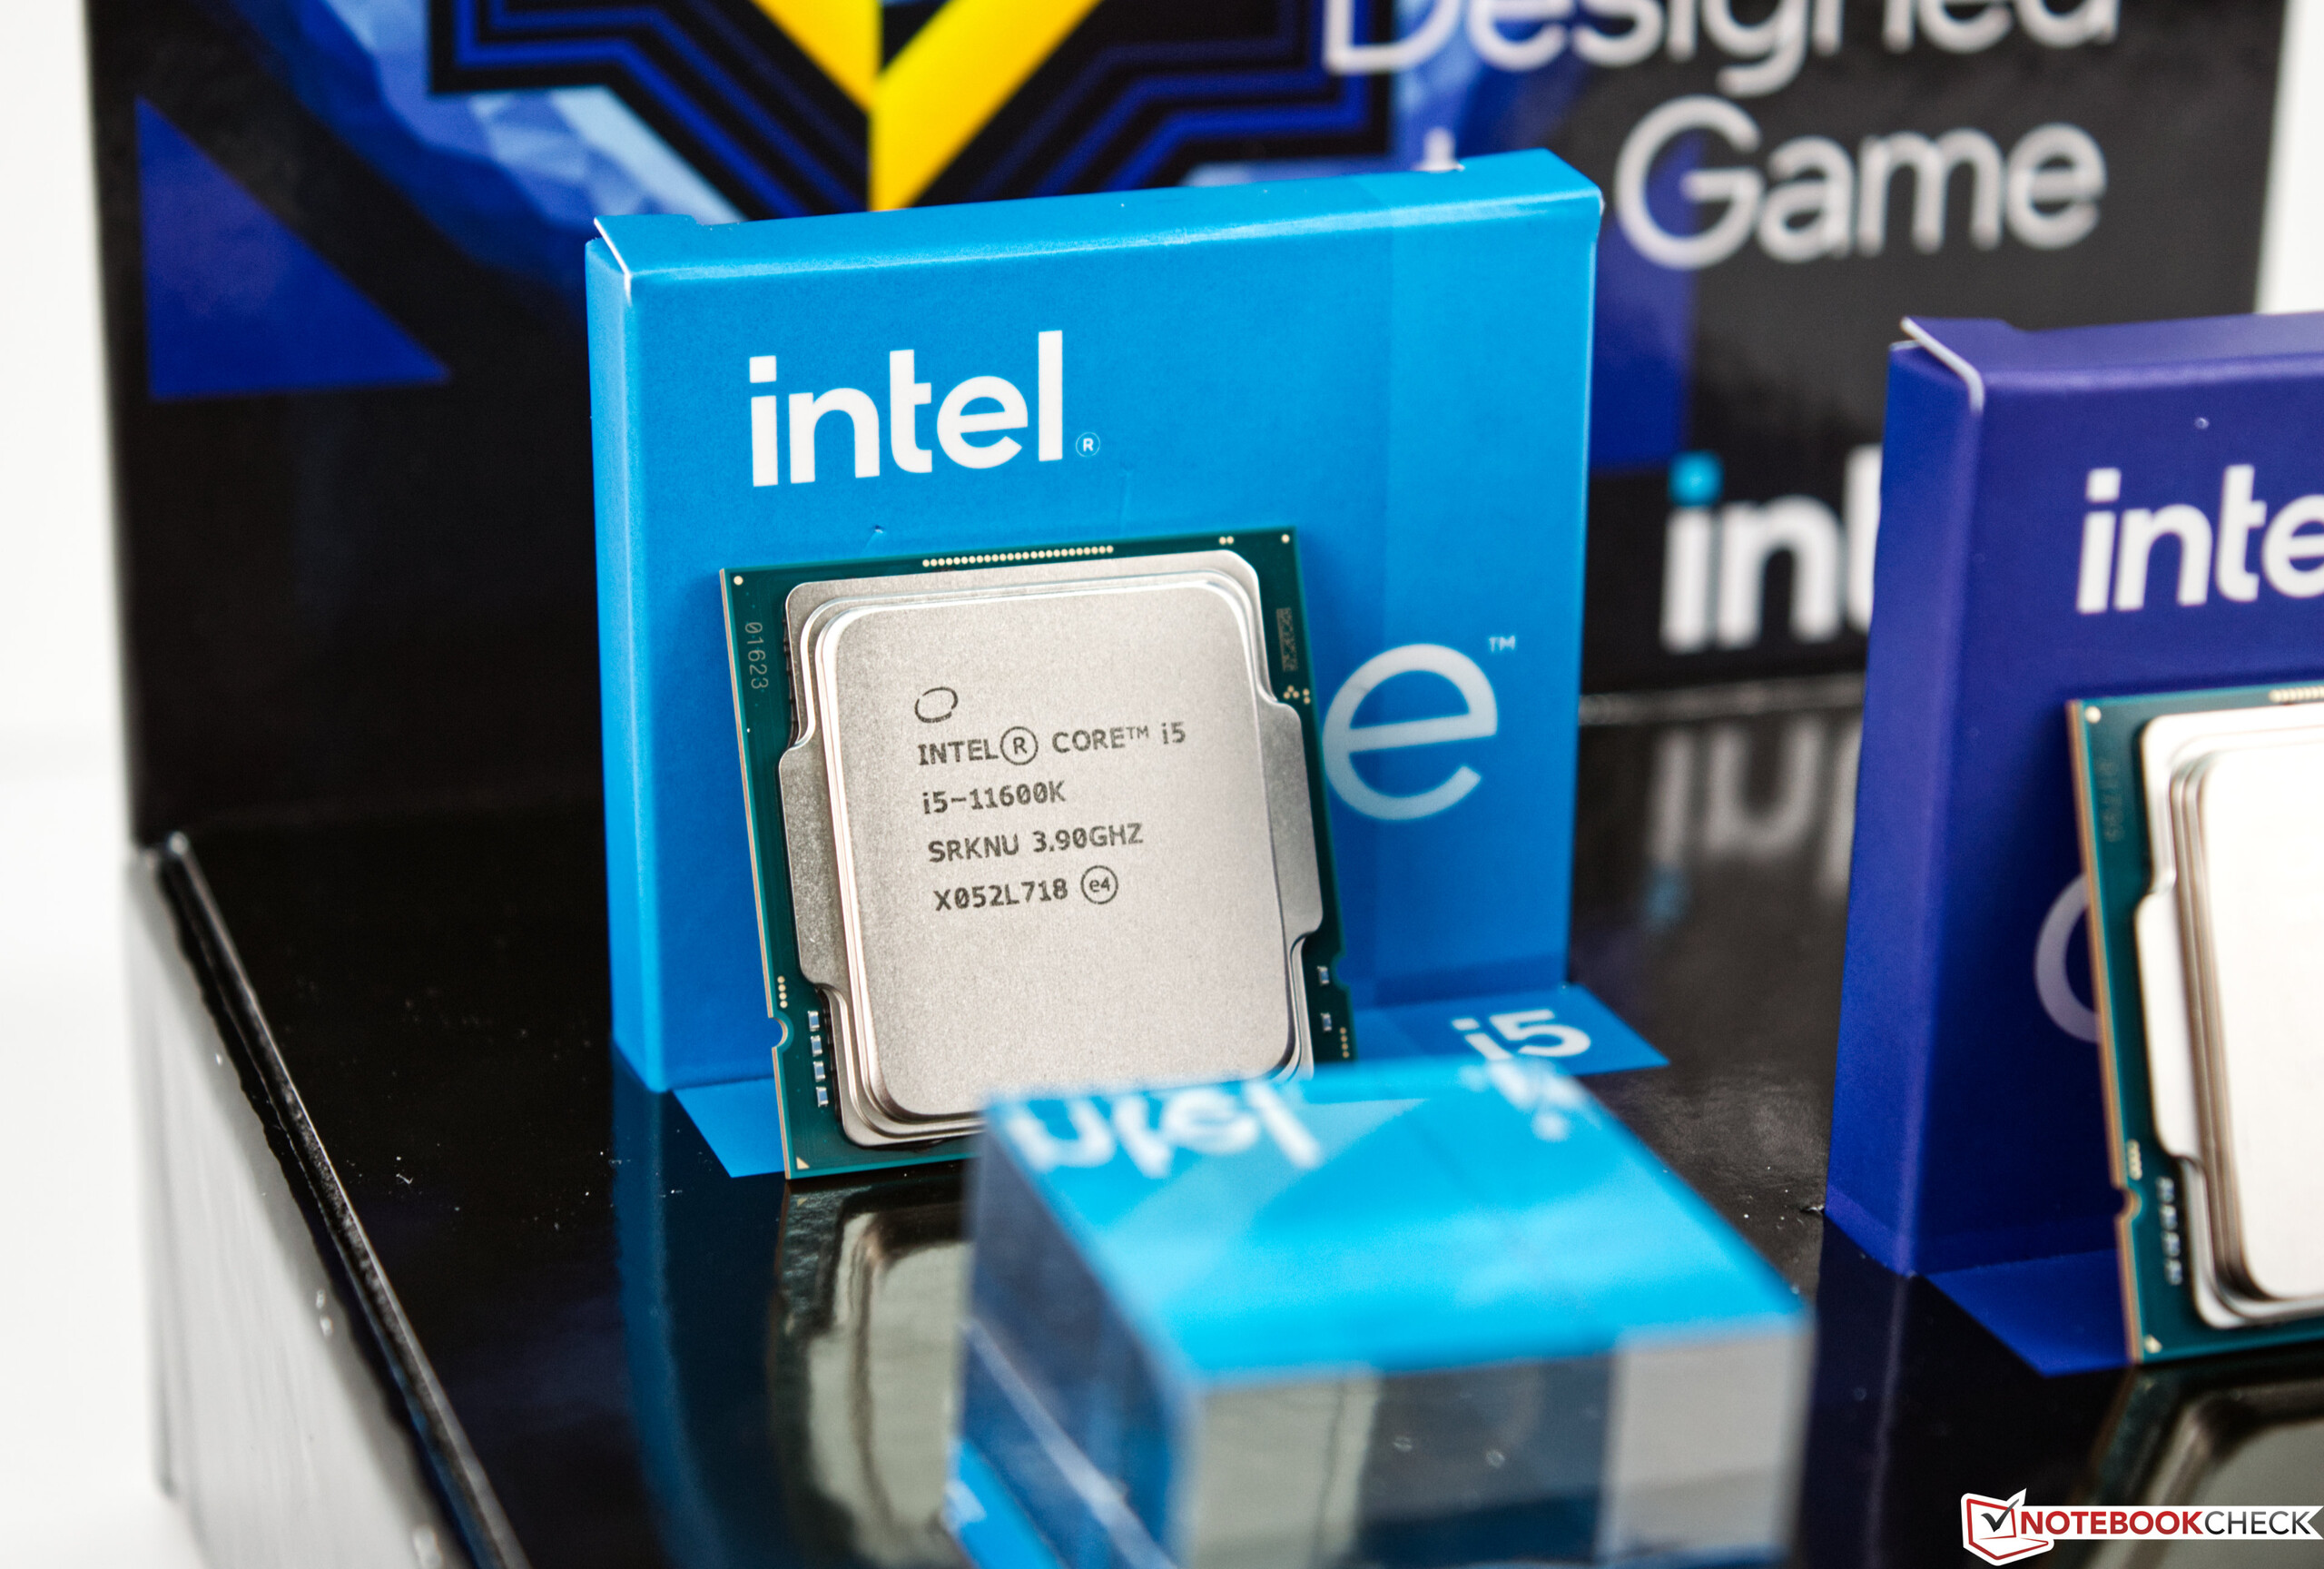
| Core i5-11600K | 6/12 | 3,9 GHz | 4,9 GHz | - | - | 4,6 GHz | DDR4-3200 | UHD 750 | 125 Watt | €299 |
| Core i5-11600KF | 6/12 | 3,9 GHz | 4,9 GHz | - | - | 4,6 GHz | DDR4-3200 | - | 125 Watt | TBD |
| Core i5-11600 | 6/12 | 2,8 GHz | 4,8 GHz | - | - | 4,3 GHz | DDR4-3200 | UHD 750 | 65 Watt | €259 |
| Core i5-11600T | 6/12 | 1,7 GHz | 4,1 GHz | - | - | 3,5 GHz | DDR4-3200 | UHD 750 | 35 Watt | TBD |
| Core i5-11500 | 6/12 | 2,7 GHz | 4,6 GHz | - | - | 4,2 GHz | DDR4-3200 | UHD 750 | 65 Watt | €229 |
| Core i5-11500T | 6/12 | 1,5 GHz | 3,9 GHz | - | - | 3,4 GHz | DDR4-3200 | UHD 750 | 35 Watt | TBD |
| Core i5-11400 | 6/12 | 2,6 GHz | 4,4 GHz | - | - | 4,2 GHz | DDR4-3200 | UHD 730 | 65 Watt | €209 |
| Core i5-11400F | 6/12 | 2,6 GHz | 4,4 GHz | - | - | 4,2 GHz | DDR4-3200 | - | 65 Watt | €179 |
| Core i5-11400T | 6/12 | 1,3 GHz | 3,7 GHz | - | - | 3,3 GHz | DDR4-3200 | UHD 730 | 35 Watt | TBD |
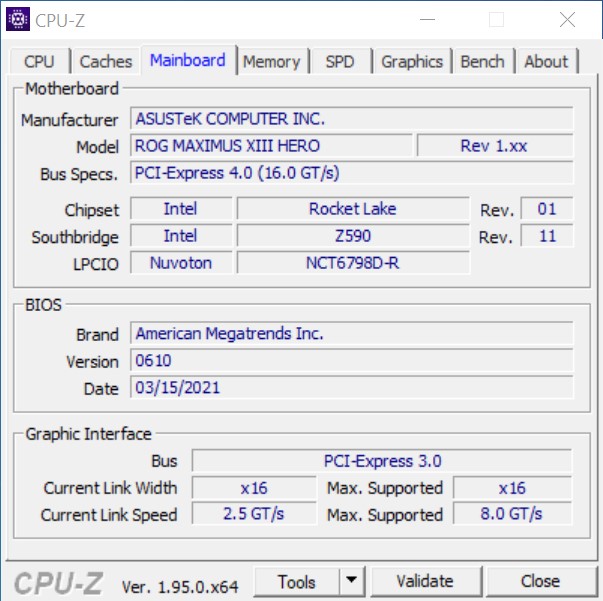
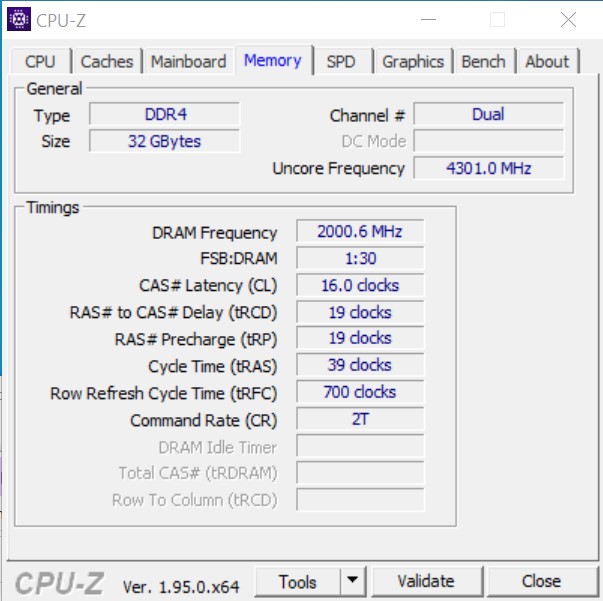
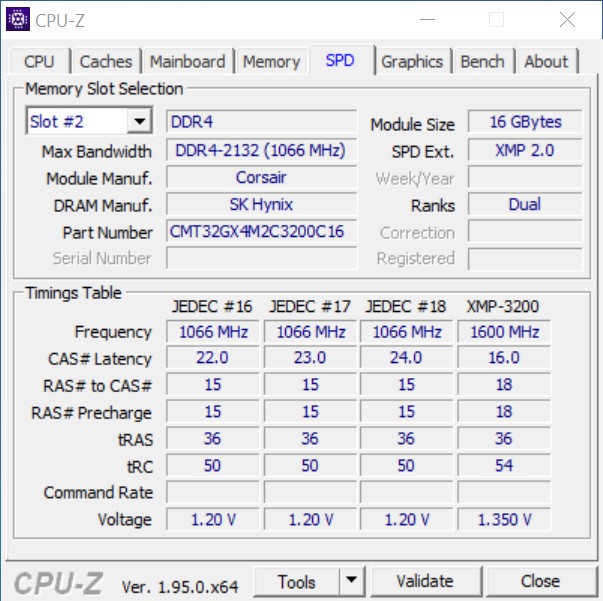
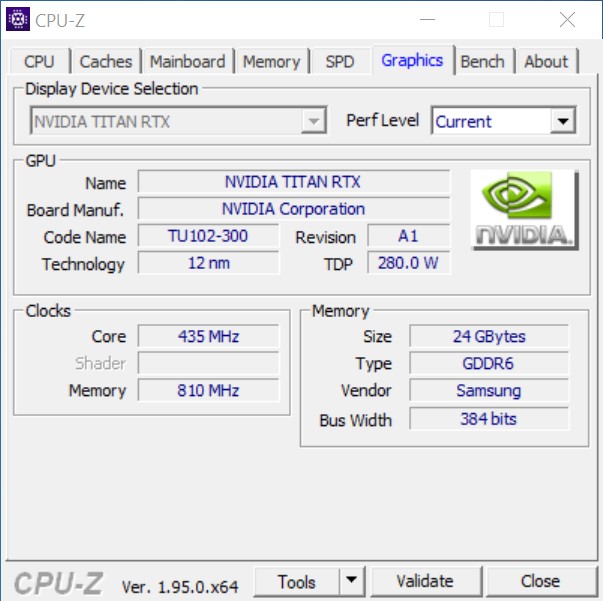
Details zu unserem Testsystem
Für die folgenden Benchmarks und Tests nutzen wir folgendes System:
- Raijintek Pean Benchtable
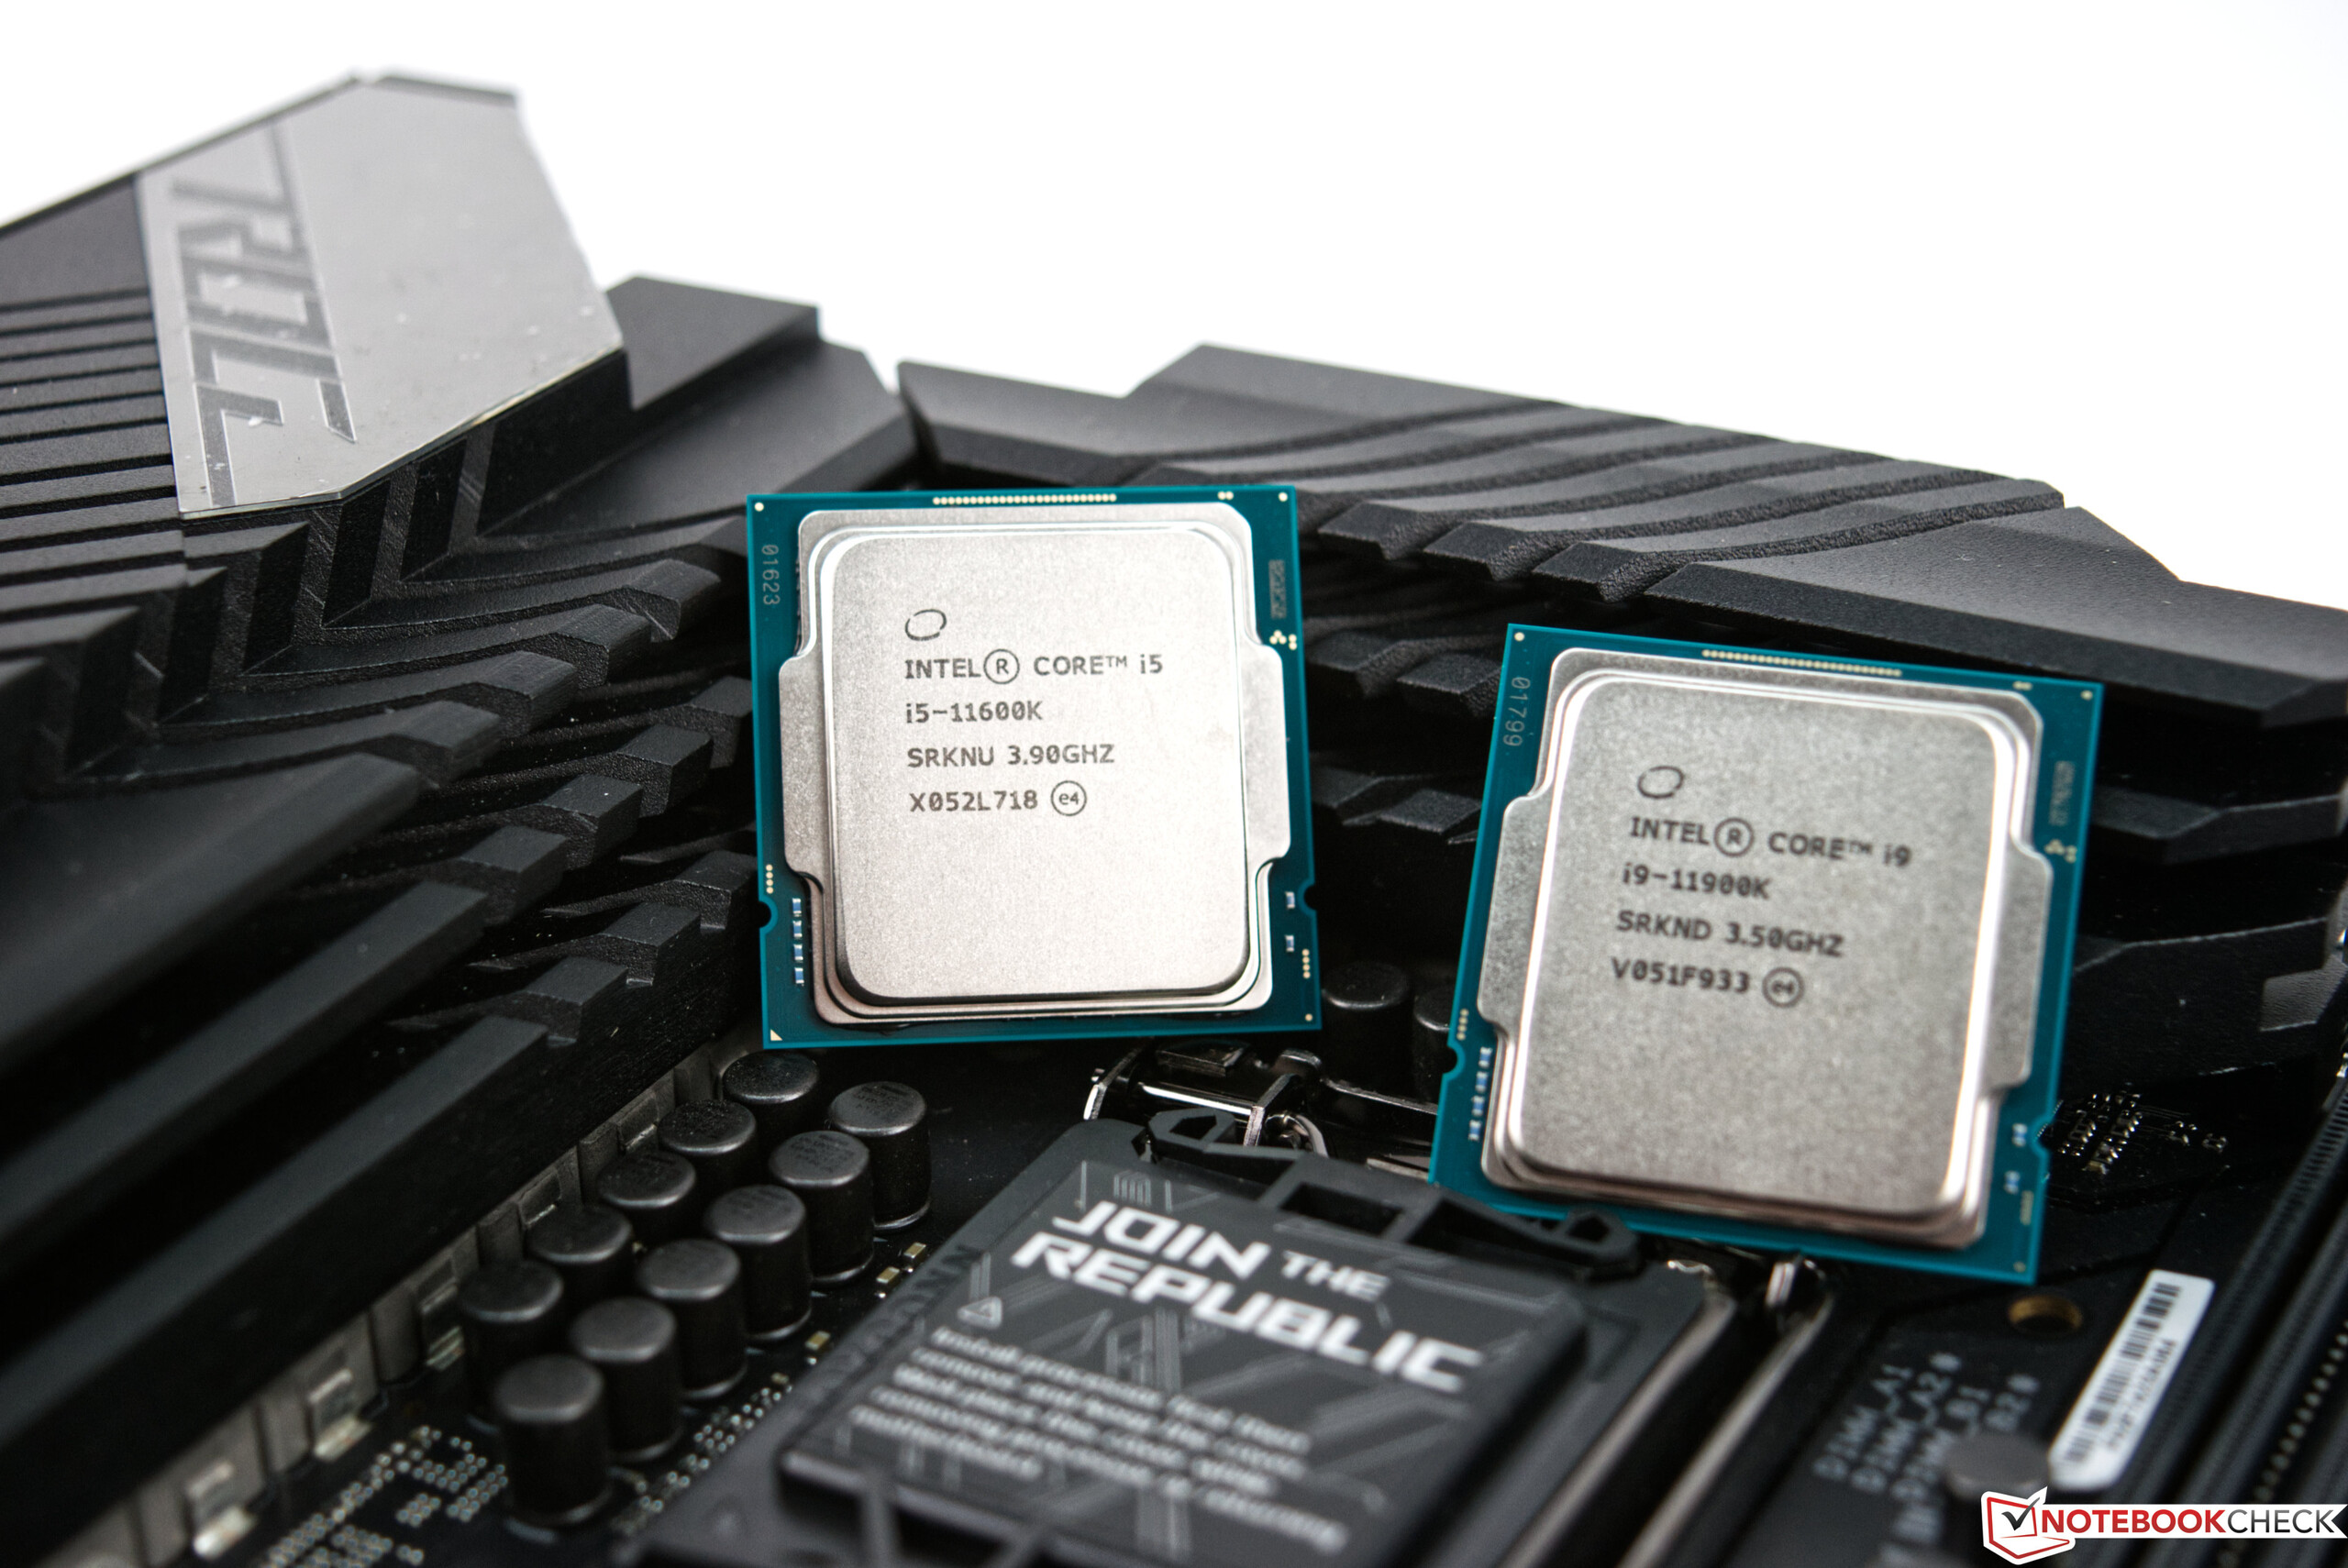
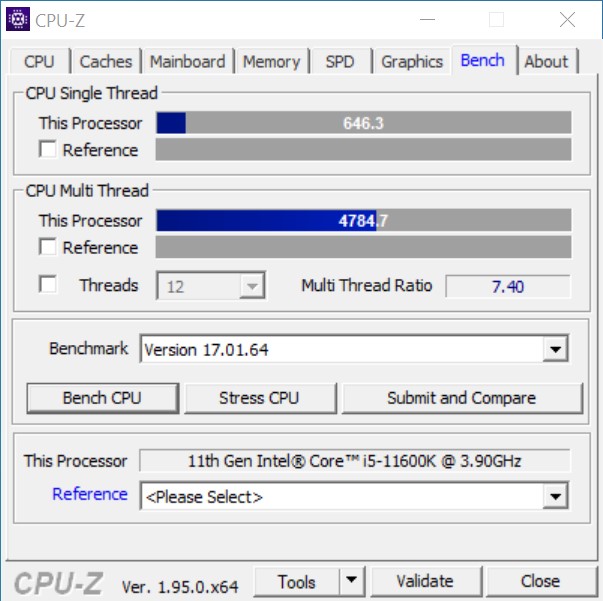
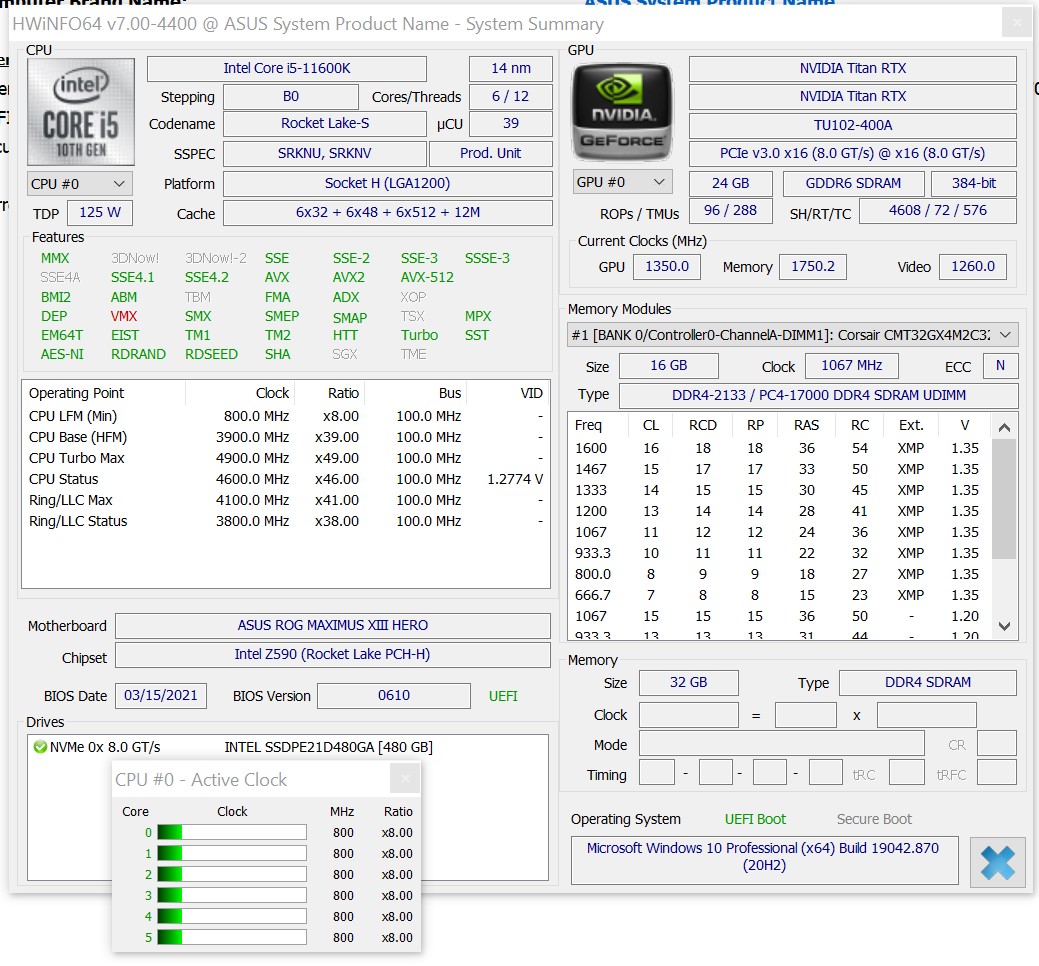
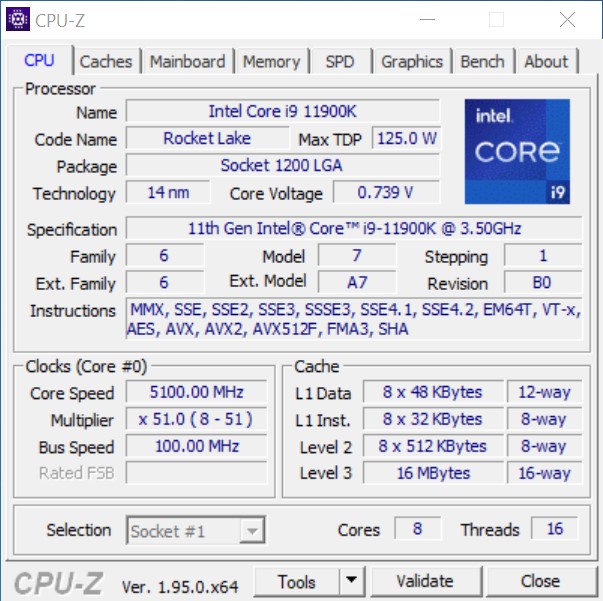
- Intel Core i9-11900K, Intel Core i5-11600K
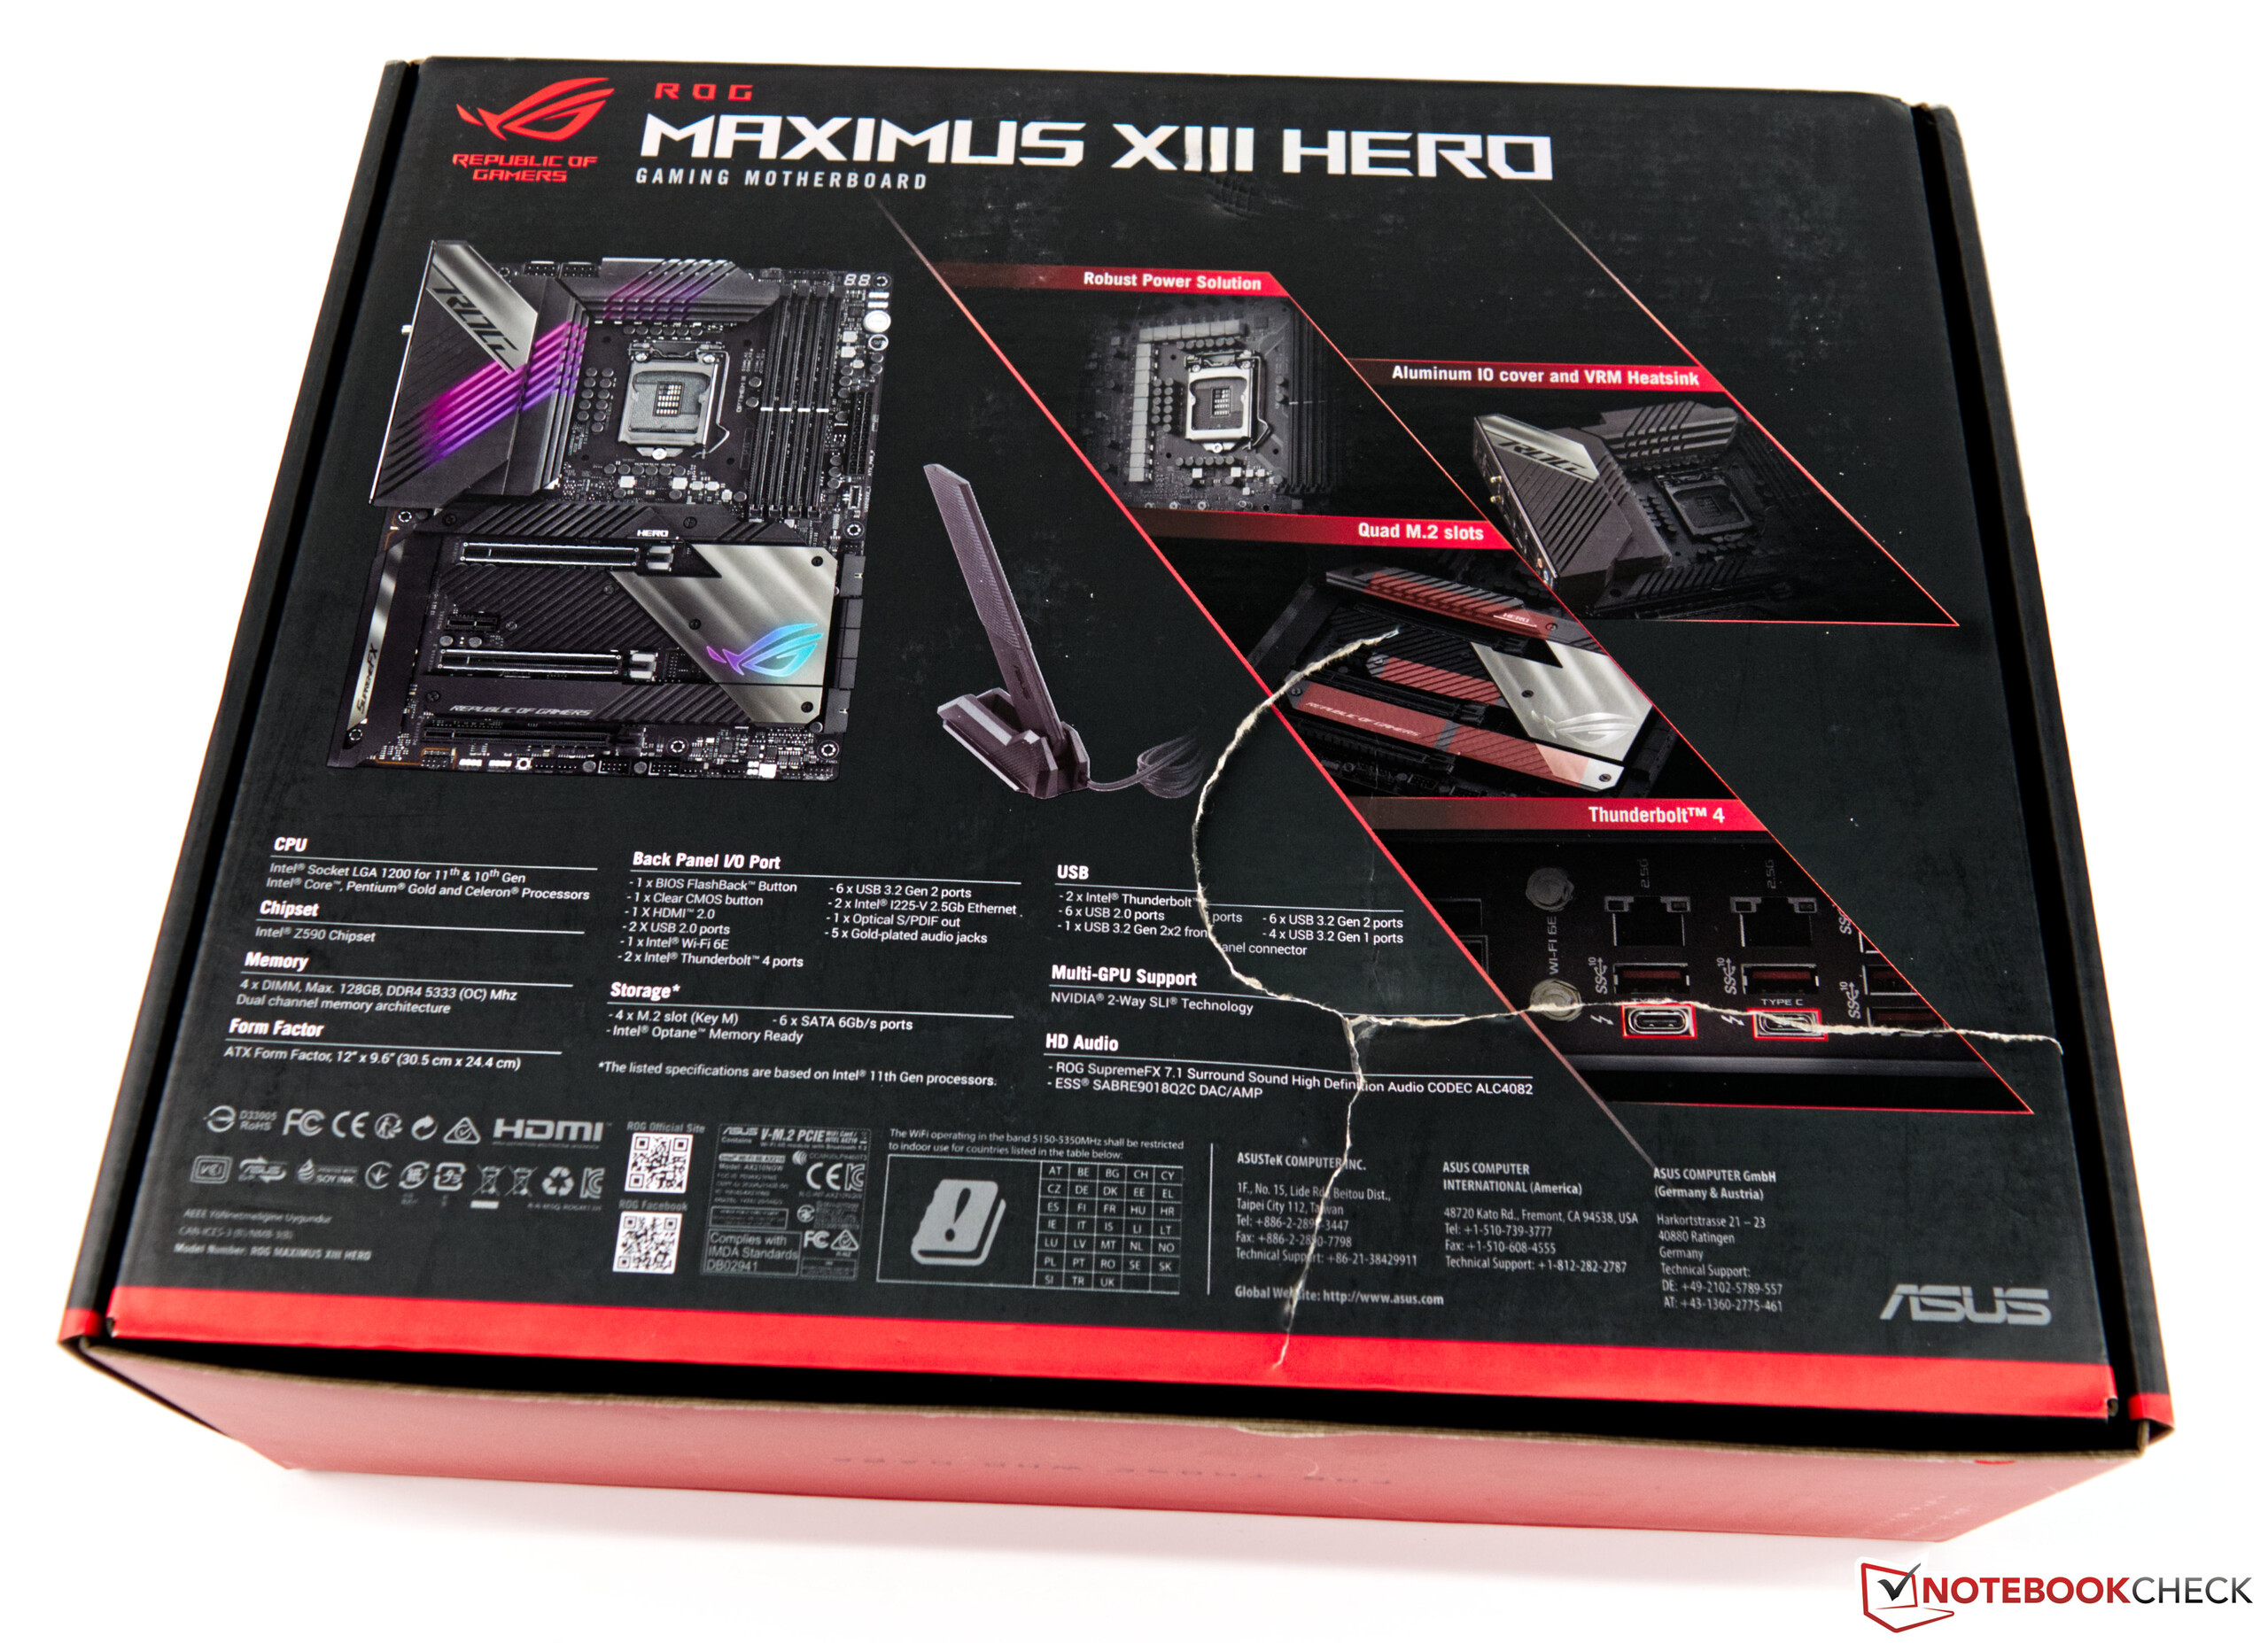
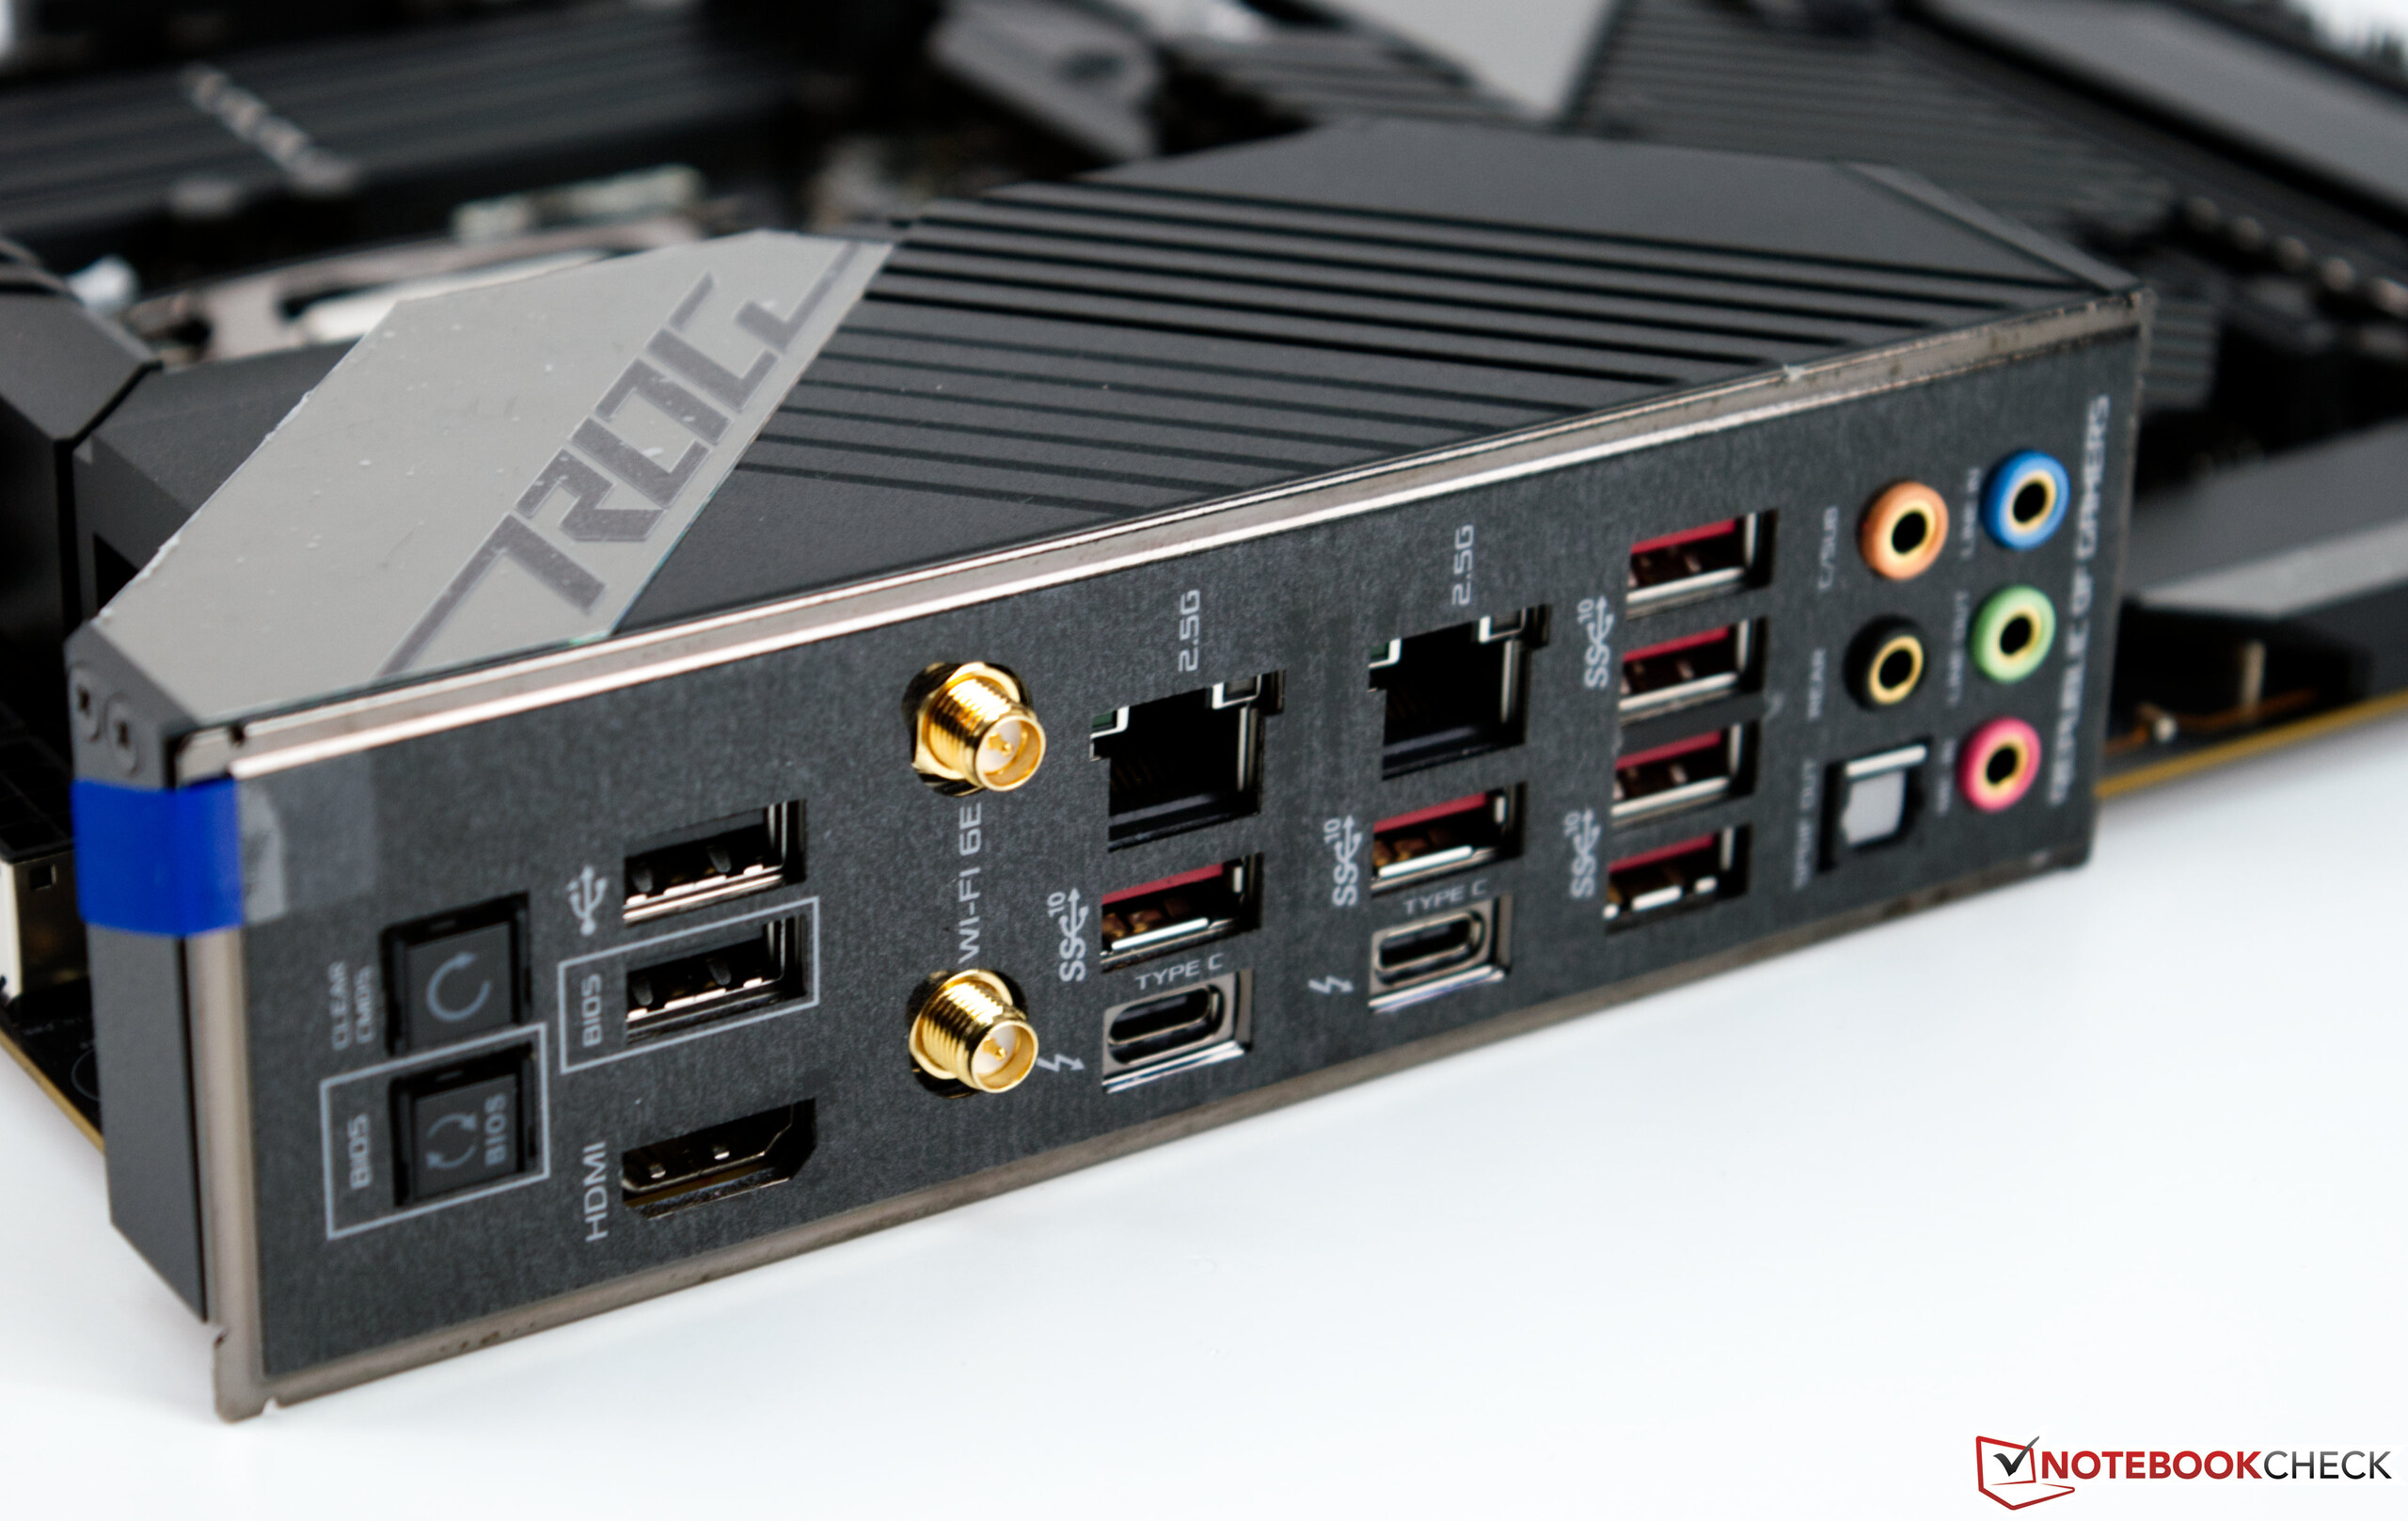
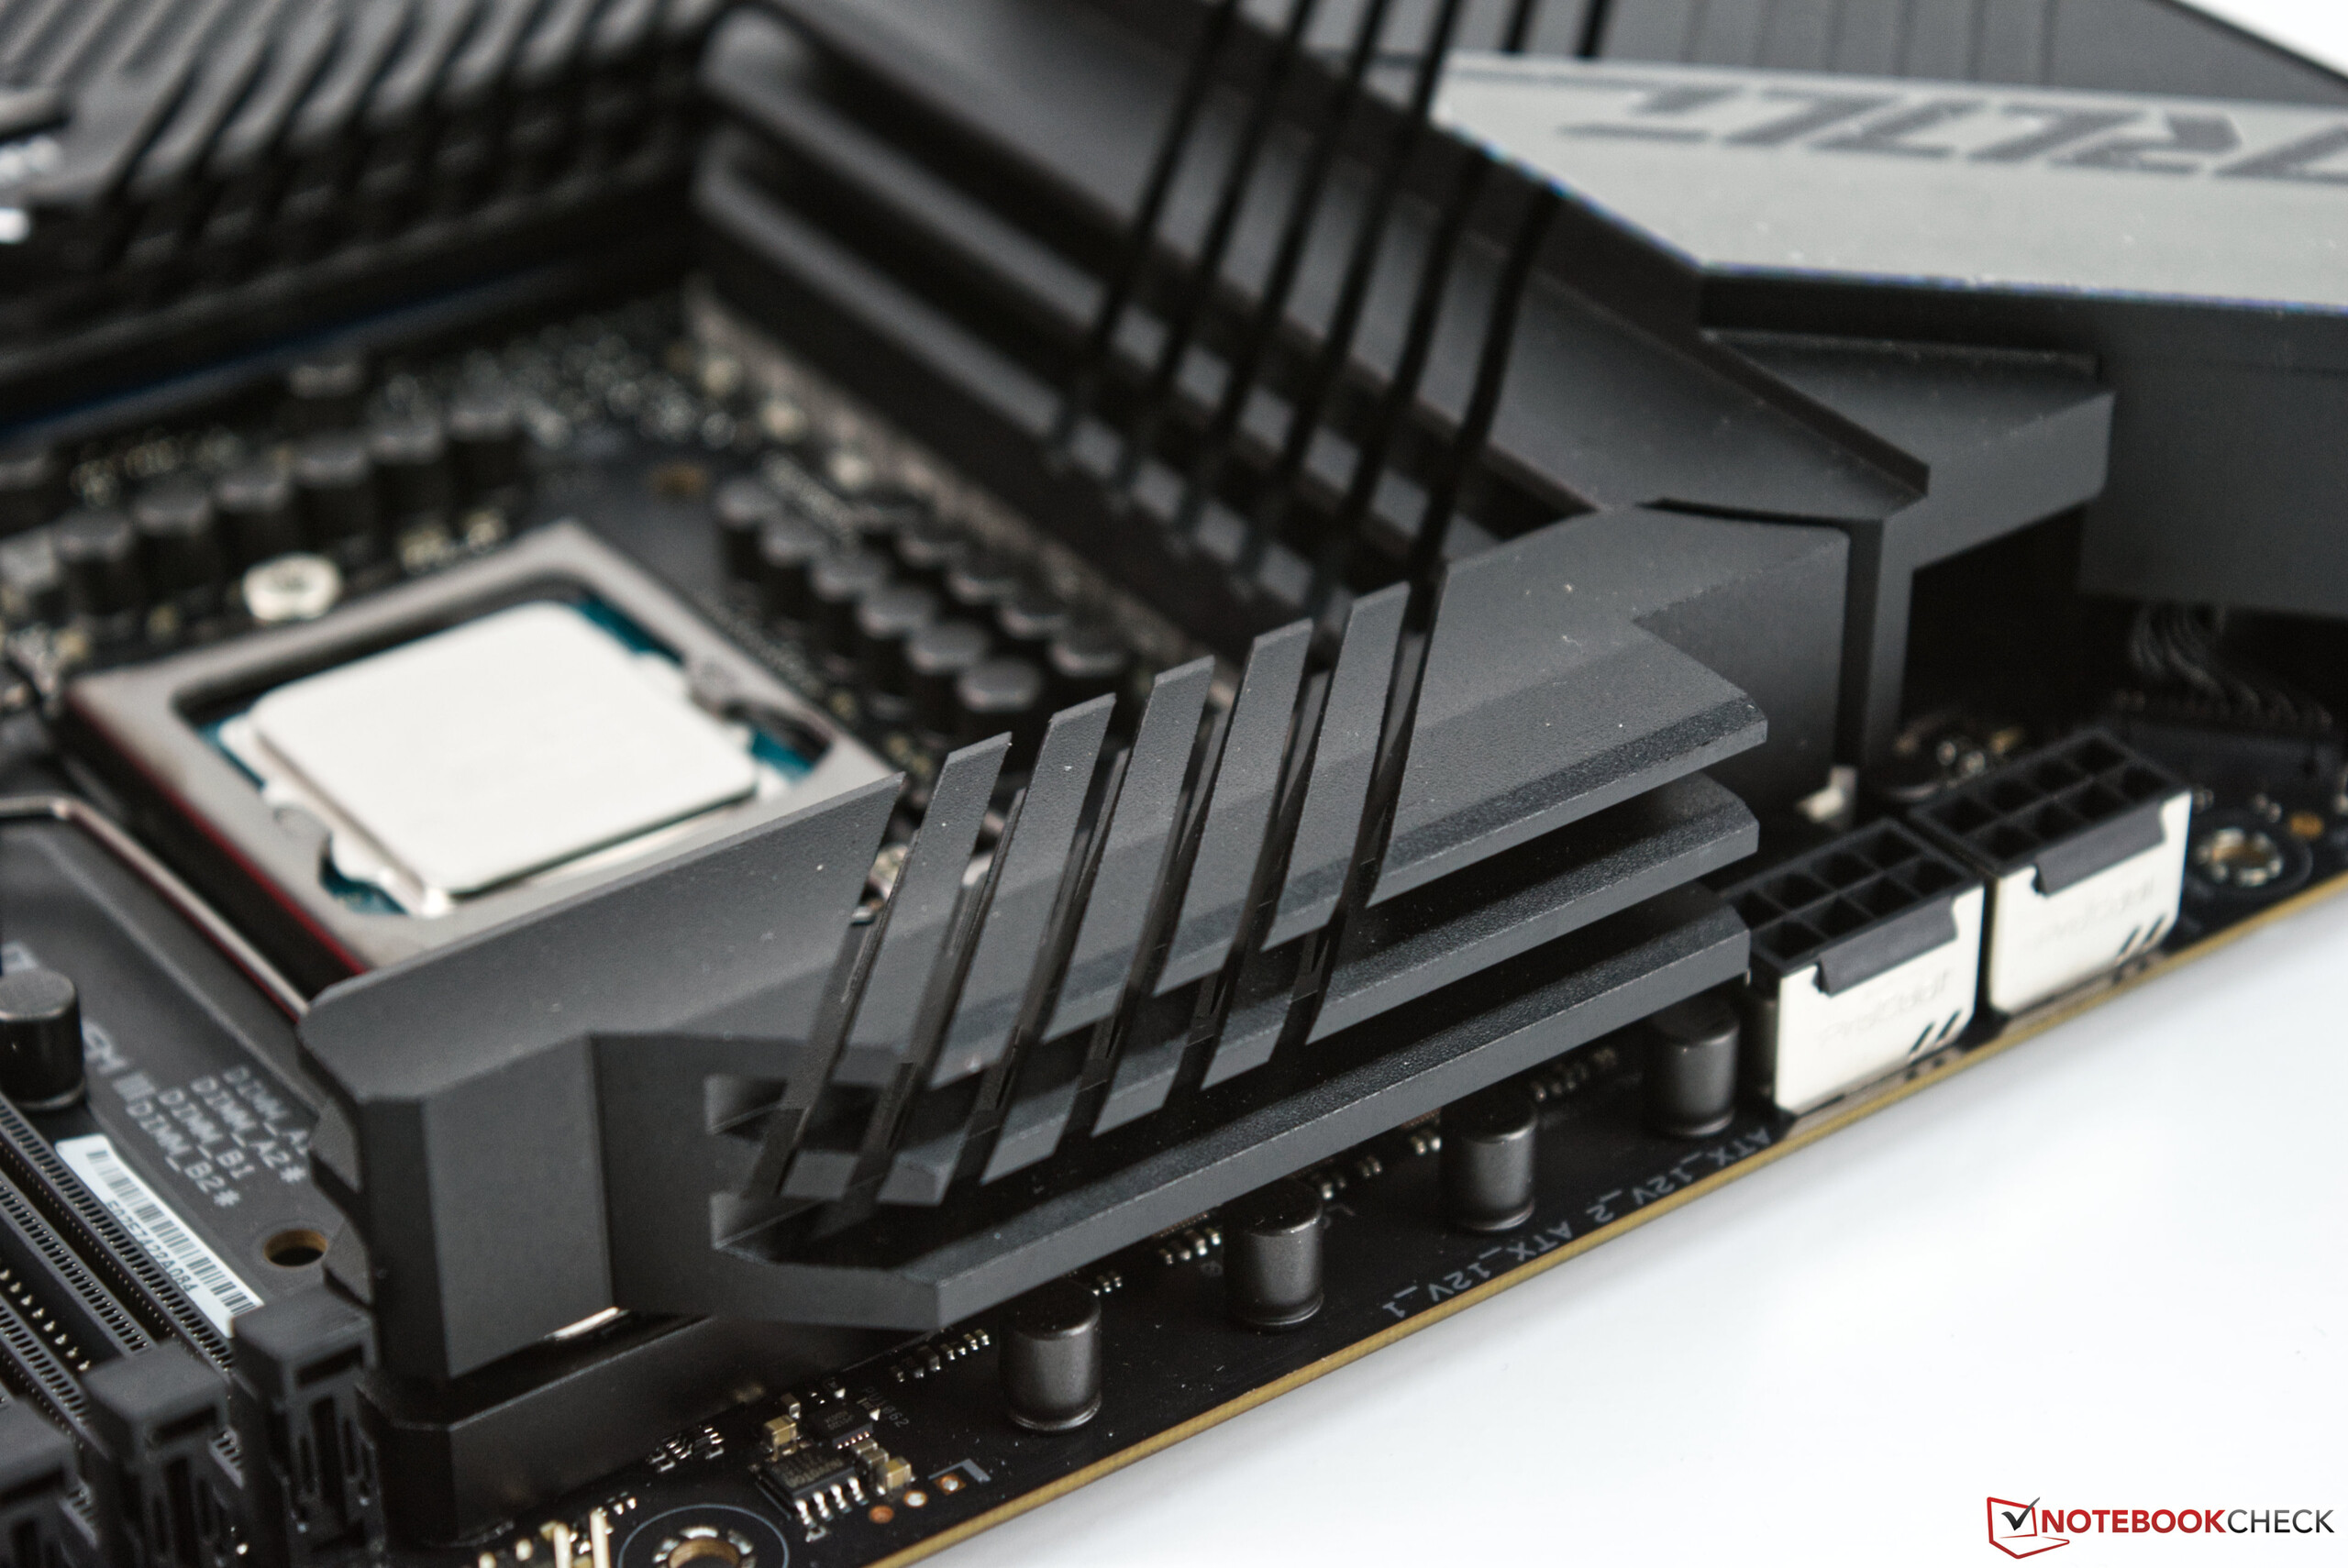
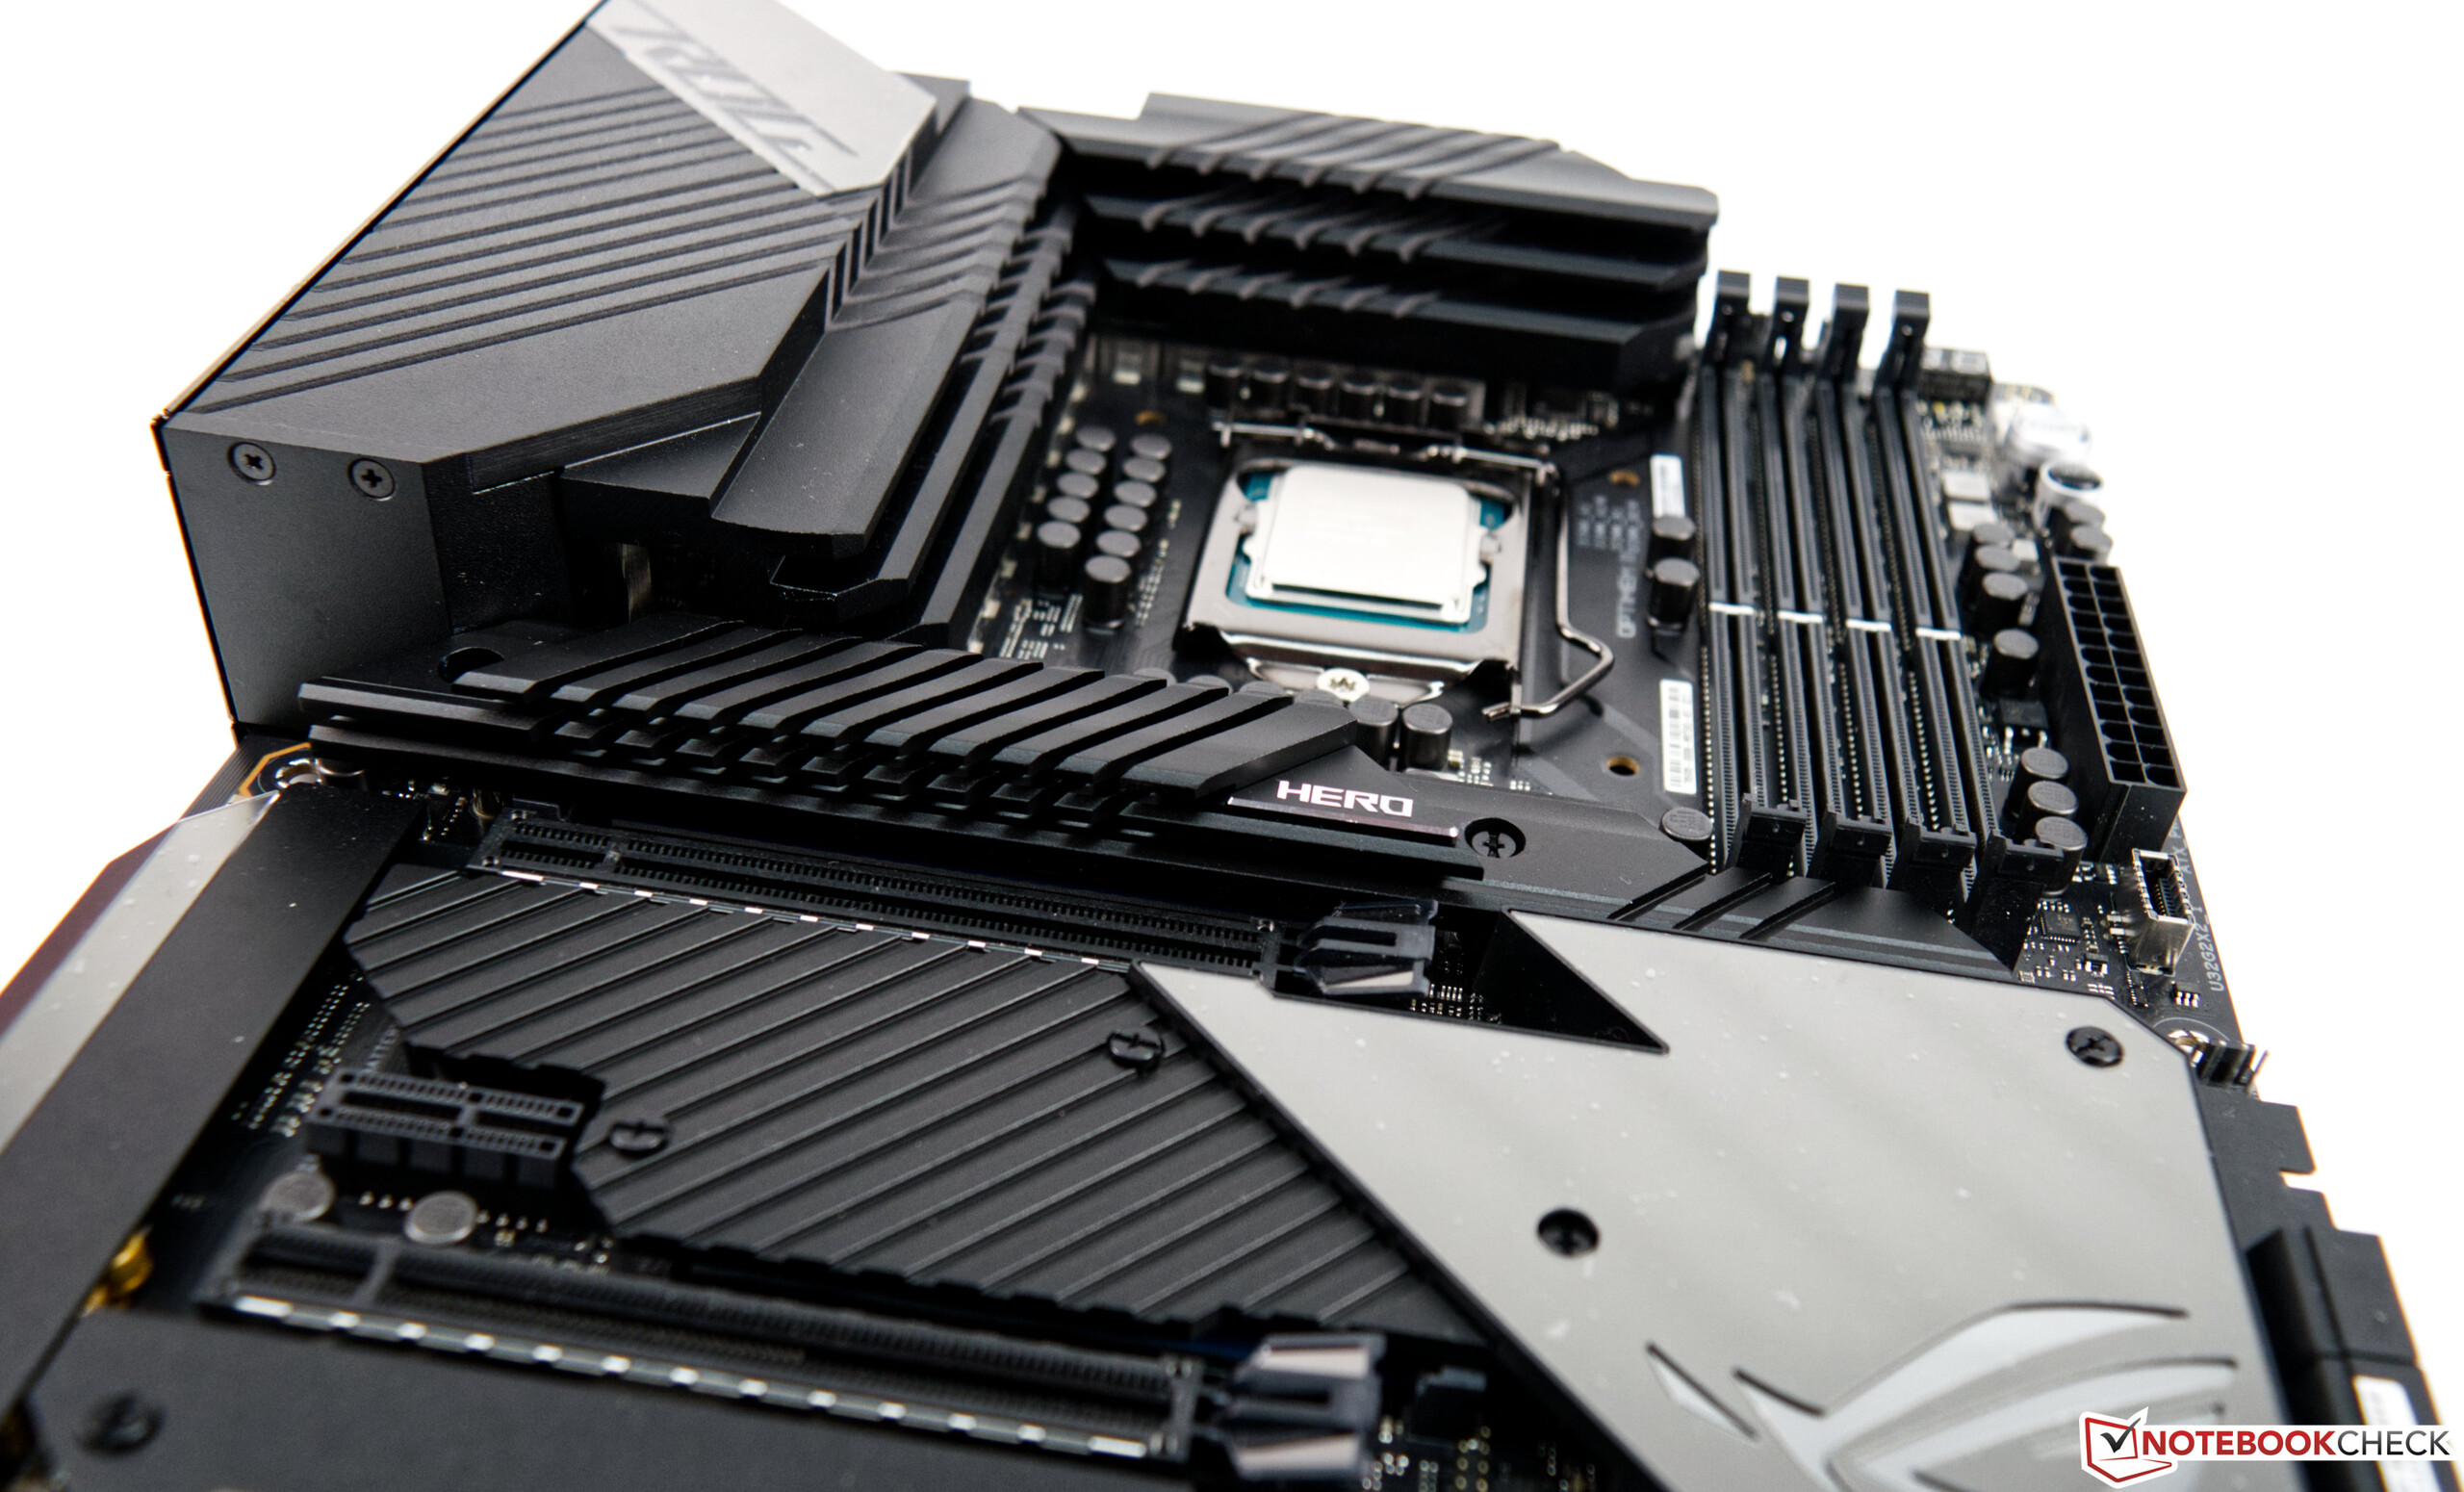
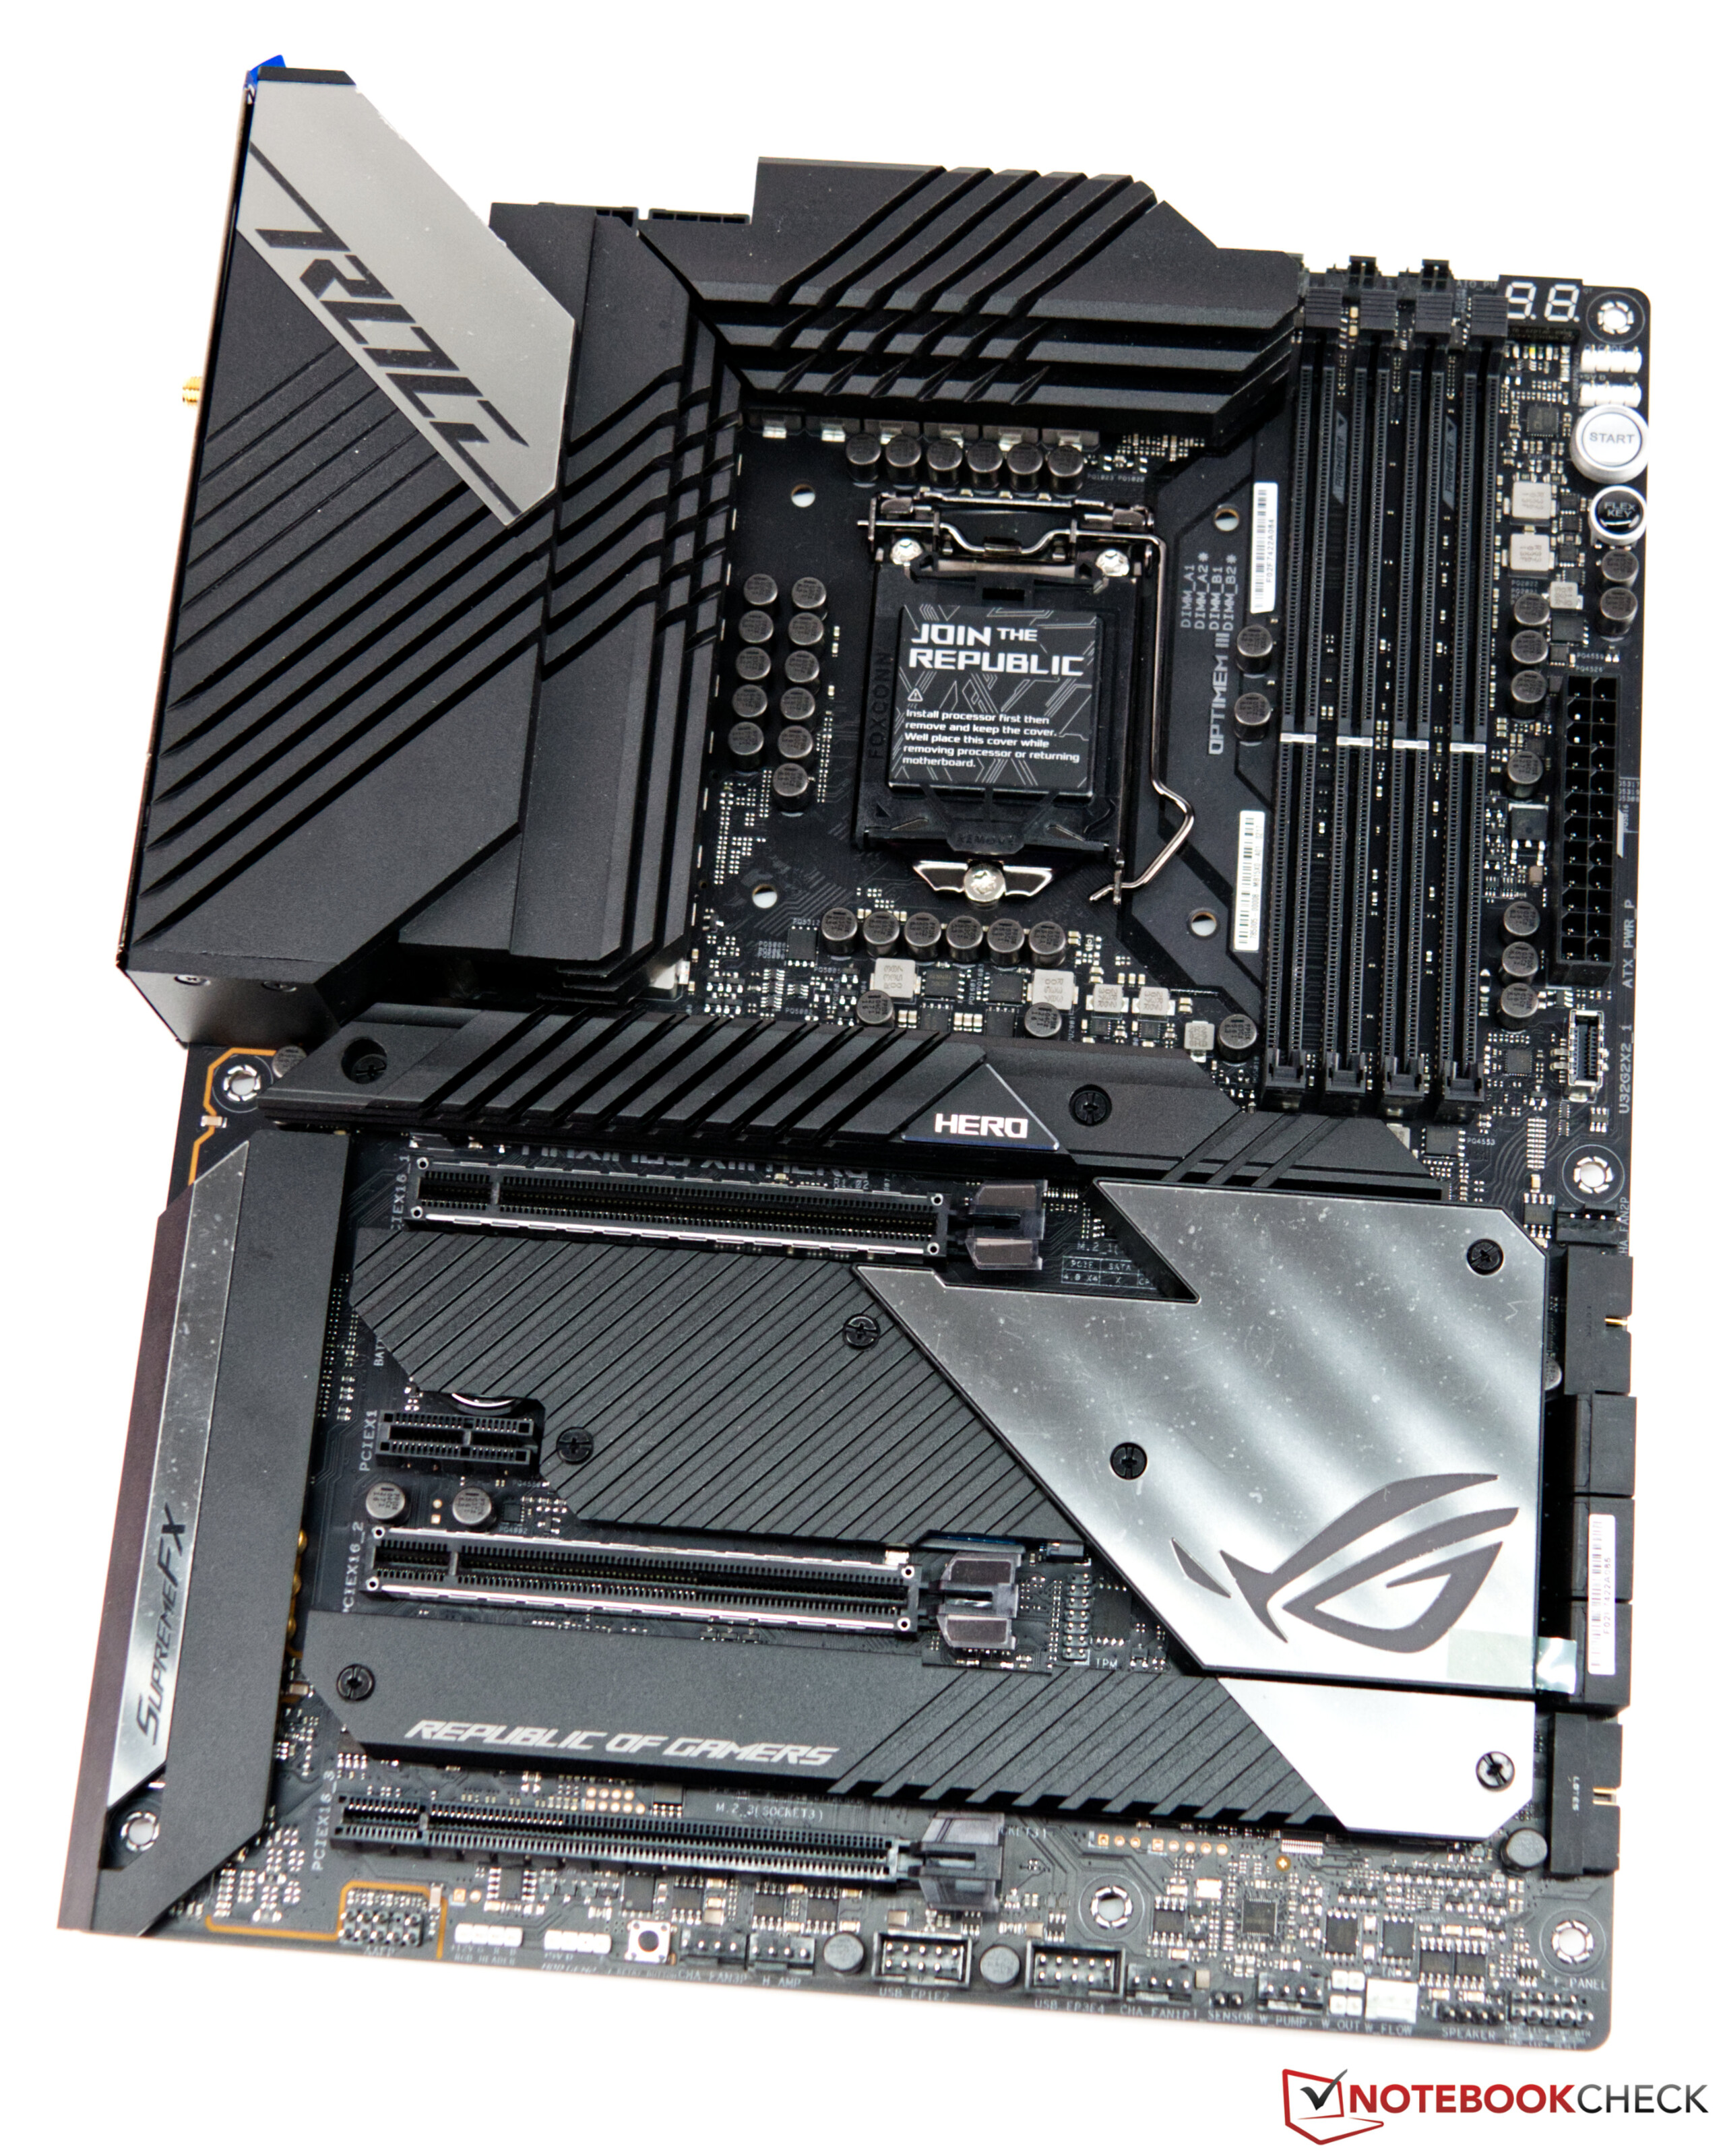
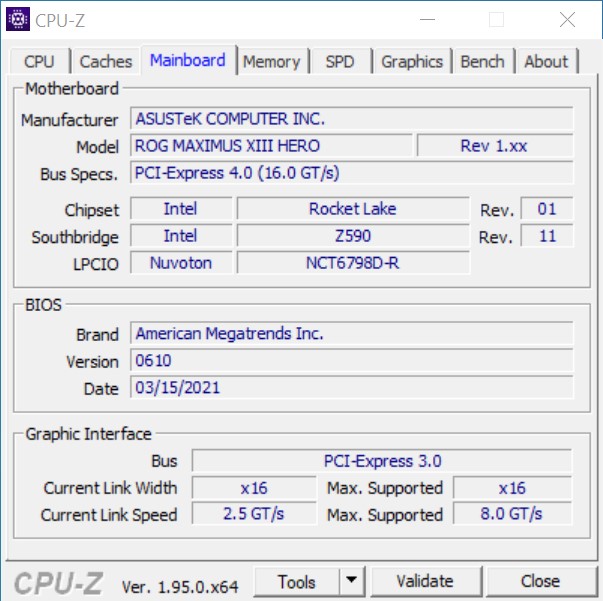
- Asus Z590 ROG Maximus XIII Hero
- Alphacool Eisbear 280 AiO
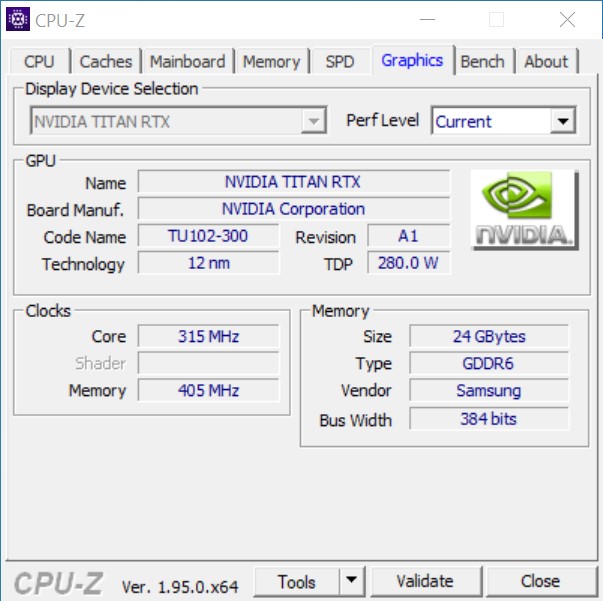
- Nvidia Titan RTX
- Corsair HX 1200X Netzteil
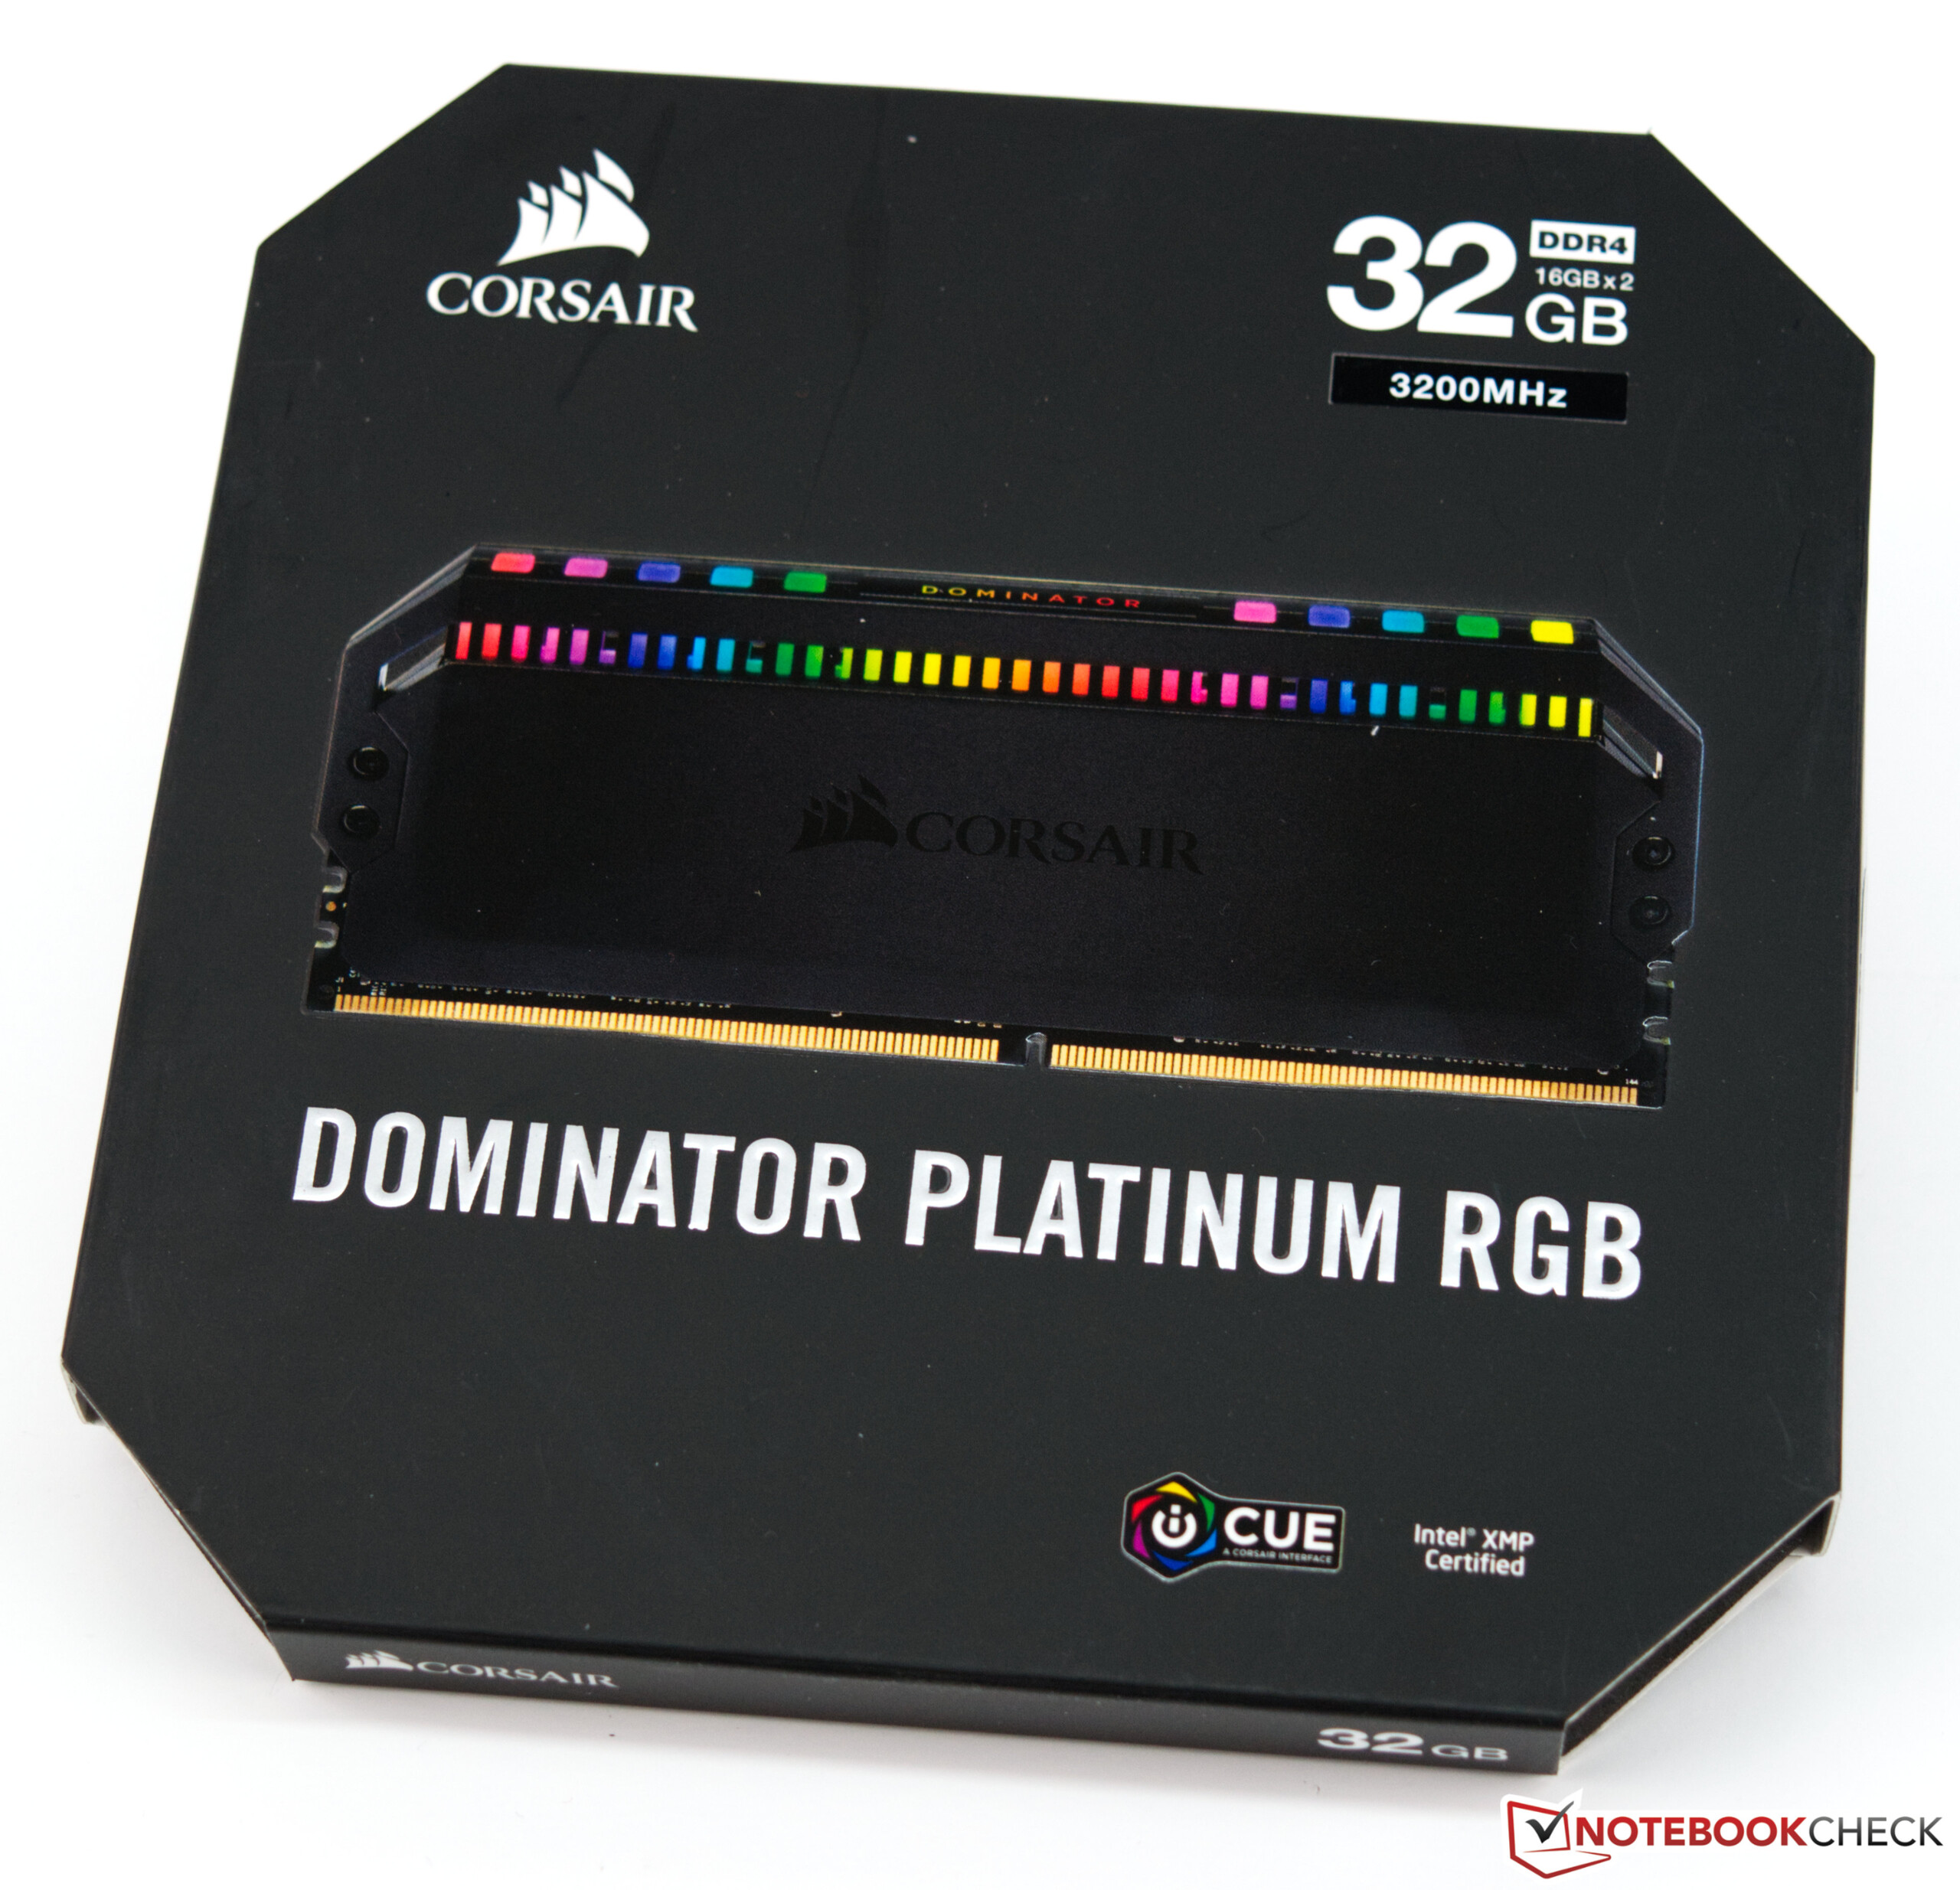
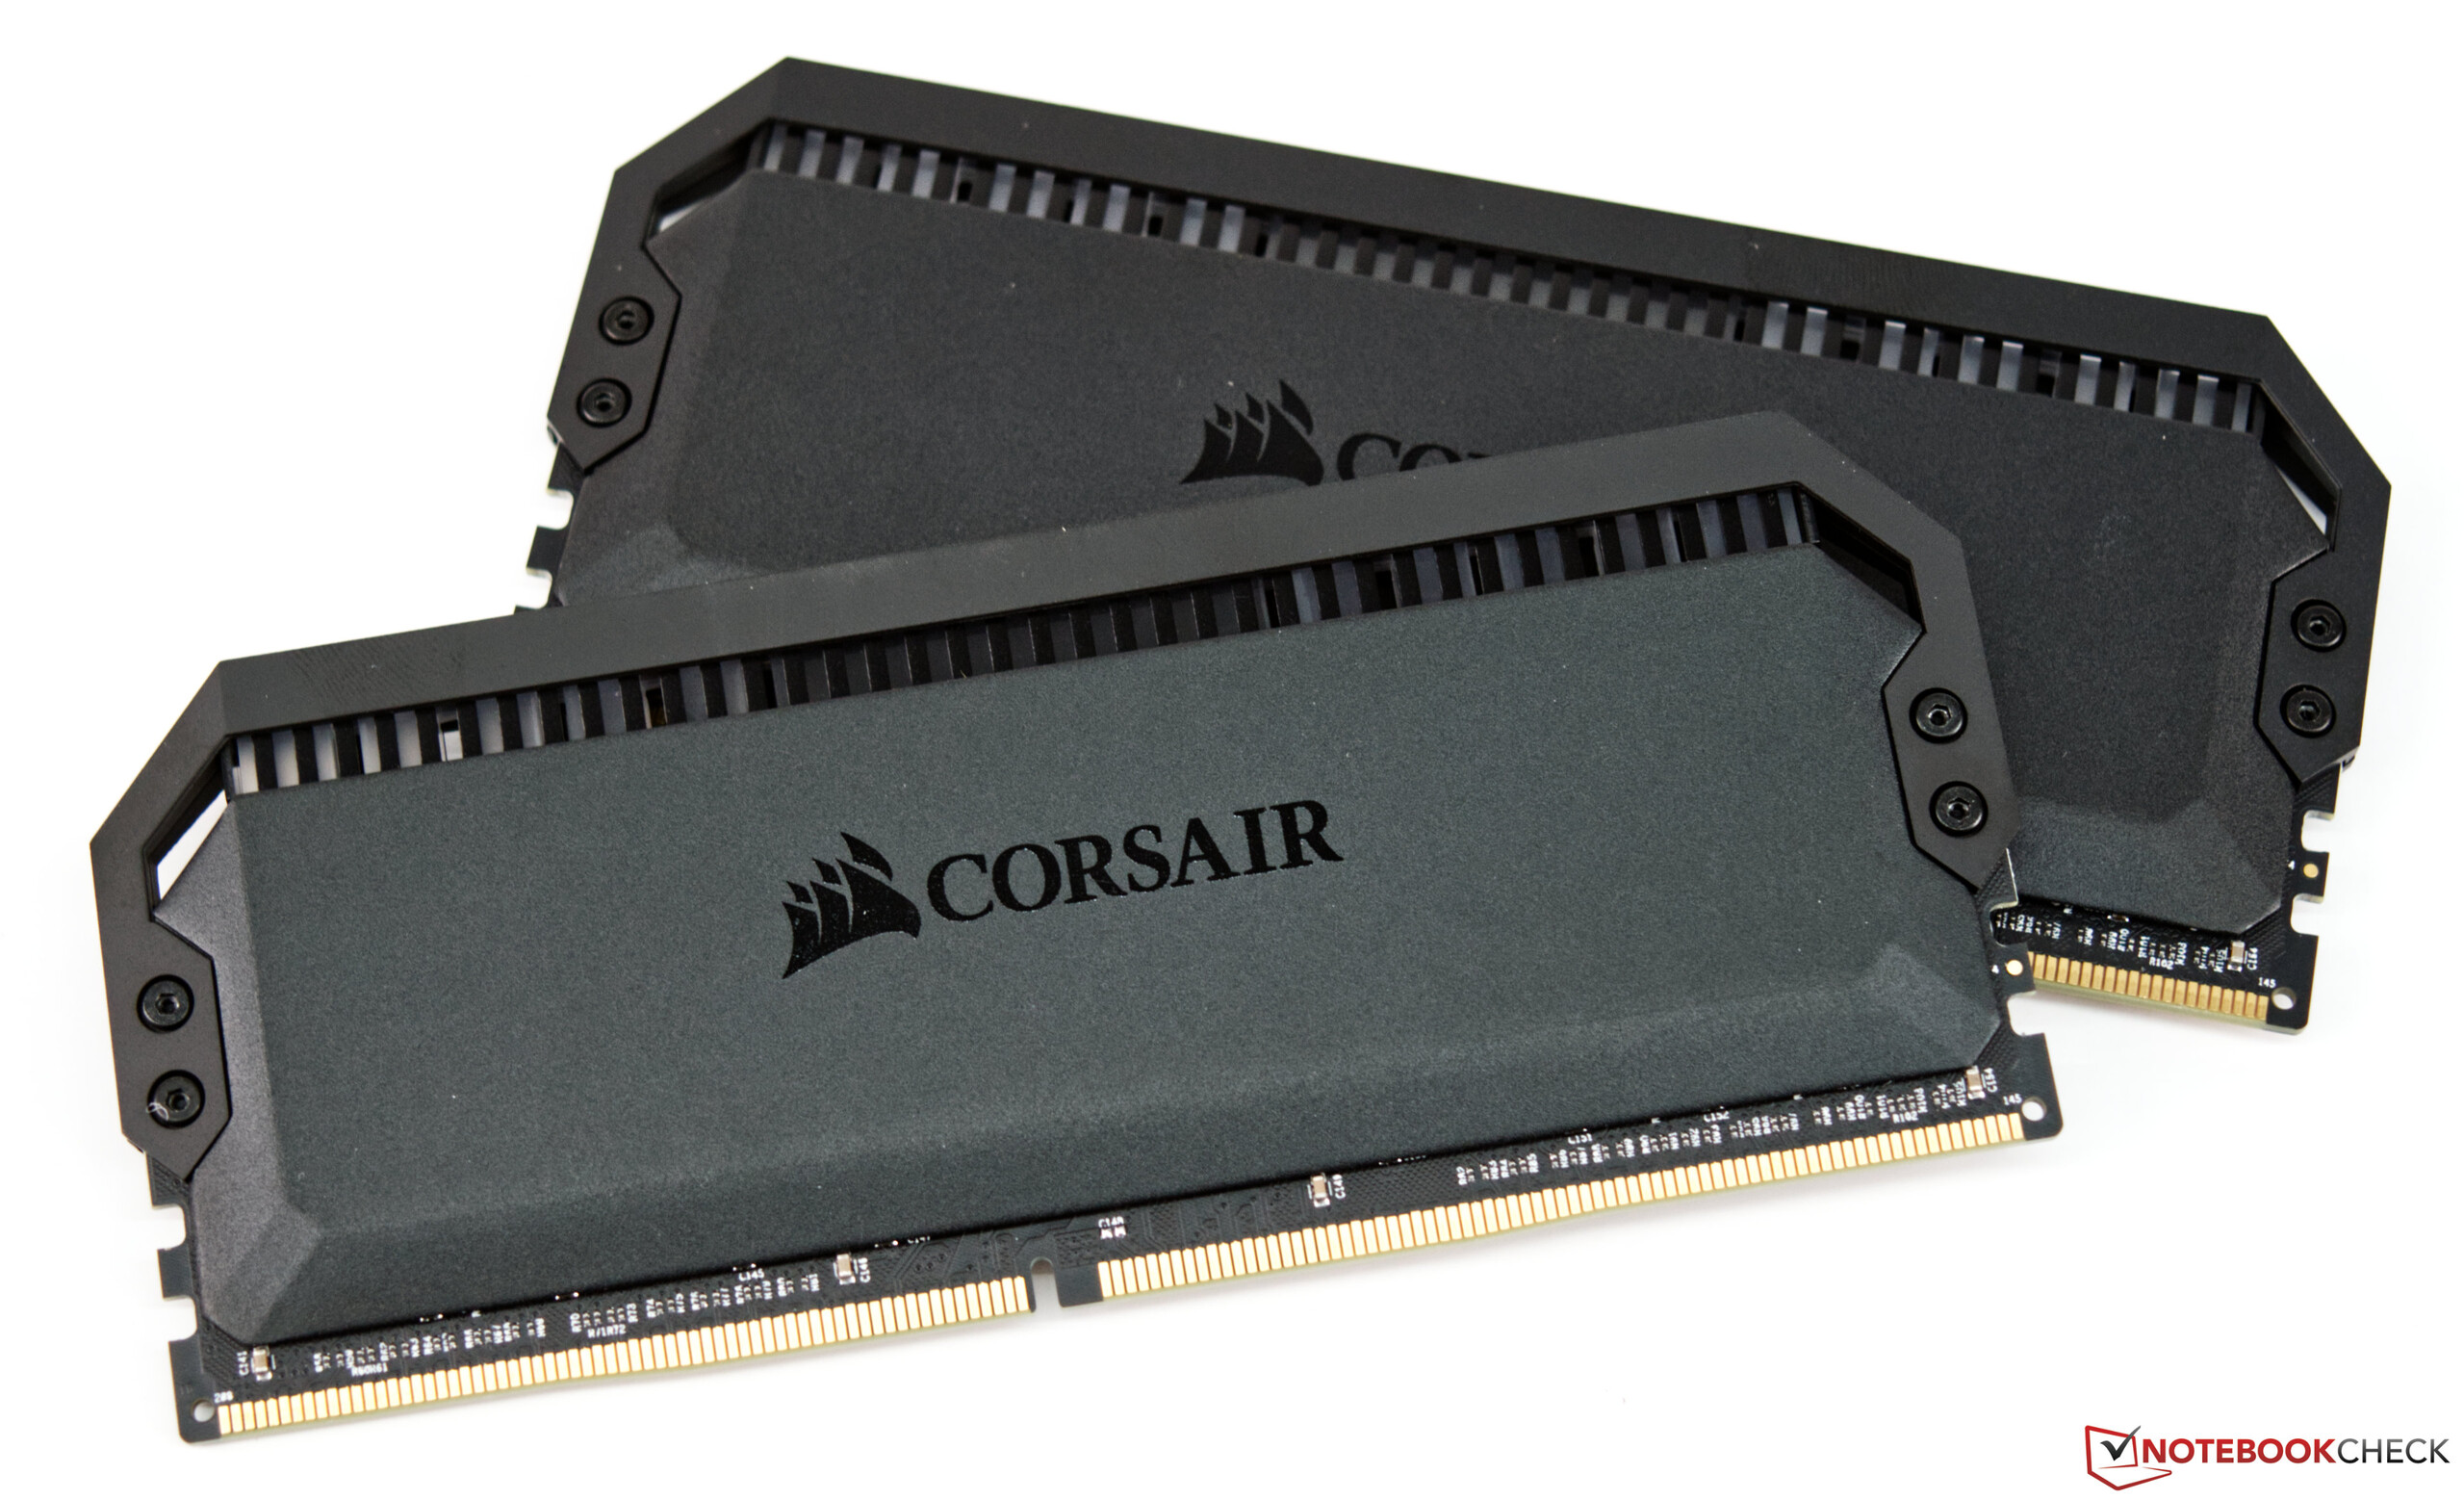
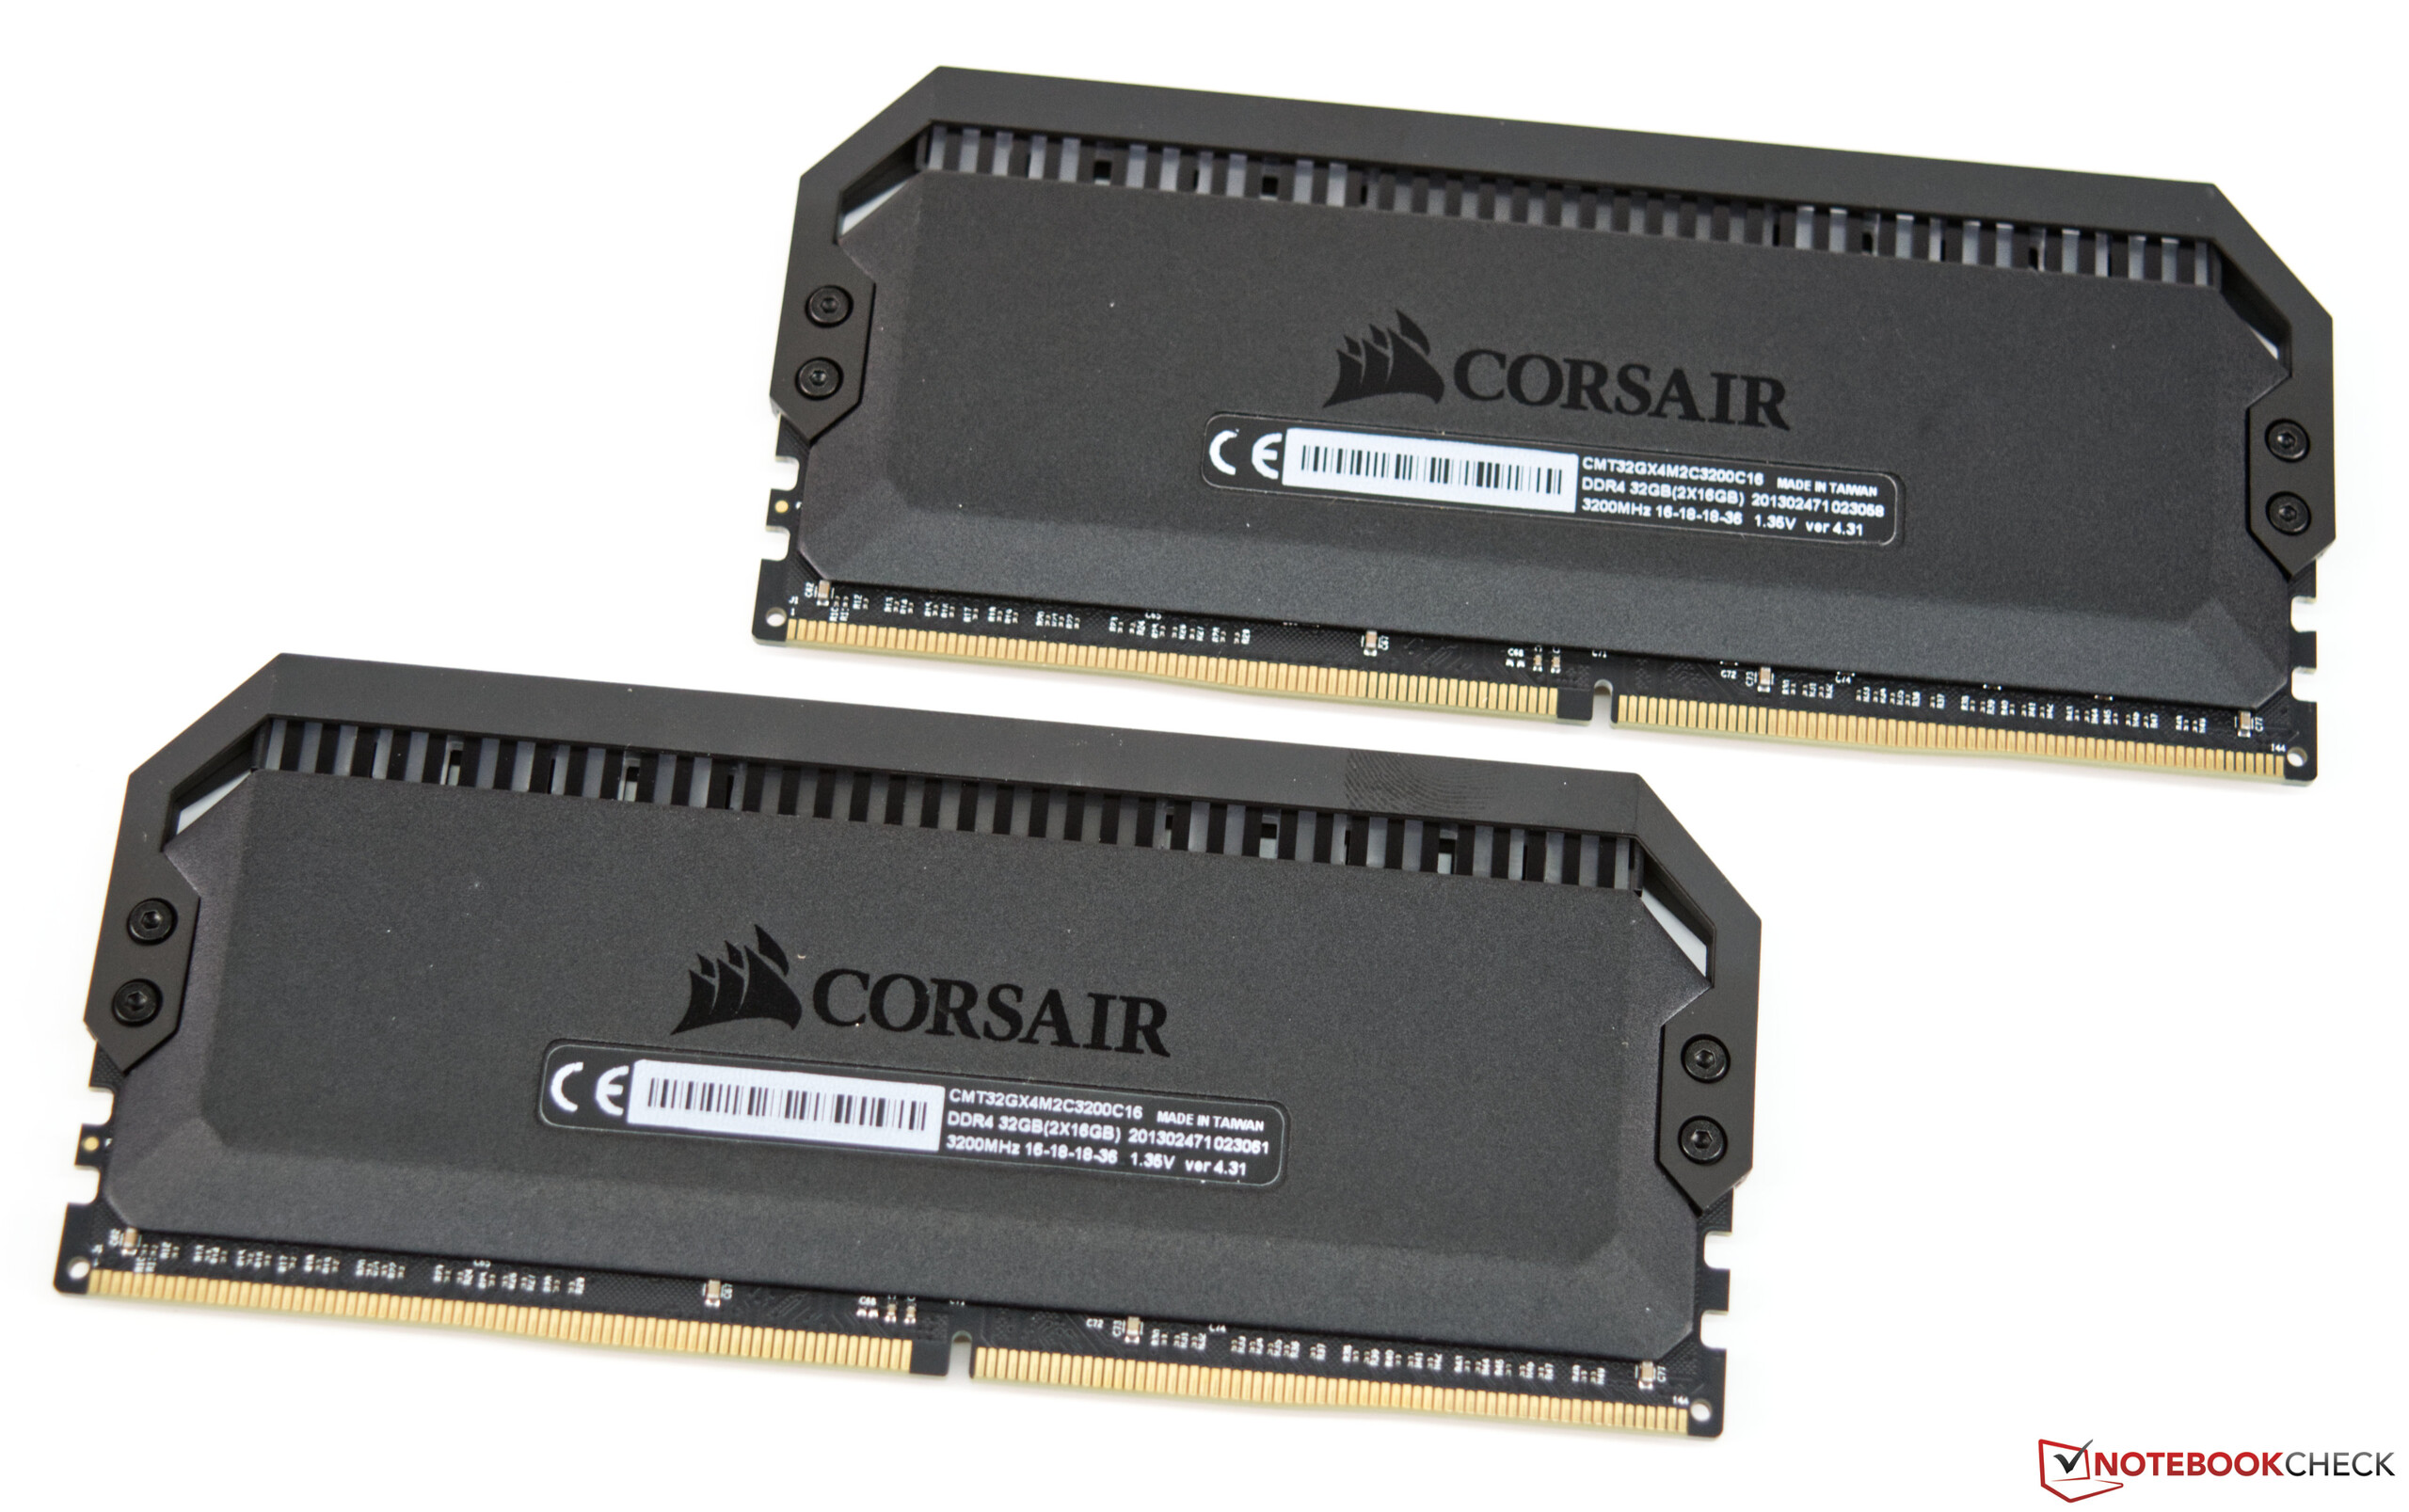
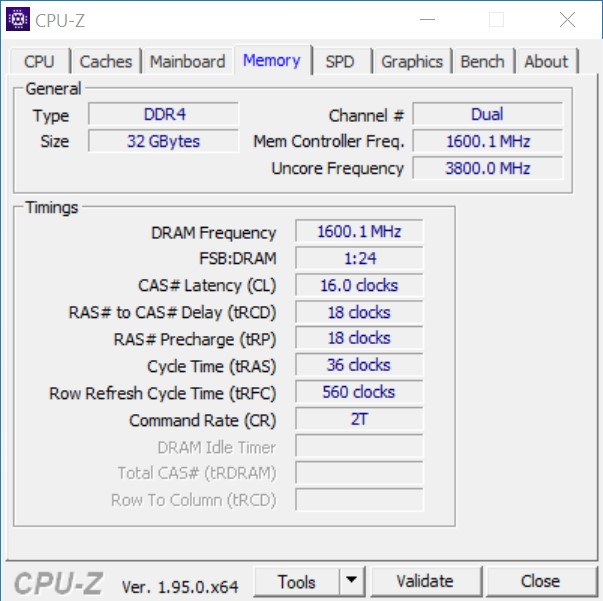
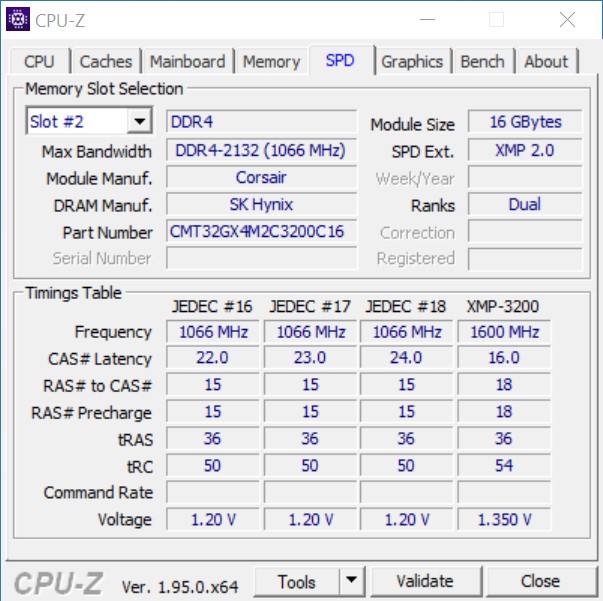
- Corsair Dominator Platinum RGB (2x 16GB - DDR4-3200)
- Intel Optane 905p
- Microsoft Windows 10 Professional 64-Bit (Version 20H2)
Von Intel direkt kommen die beiden Prozessoren der Arbeitsspeicher sowie das neuen Z590 Mainboard. Von Caseking stammt das Raijintek Pean Showcase und als Kühlung nutzen wir die Alphacool Eisbear 280 AiO, welche wir von Alphacool selbst zur Verfügung gestellt bekommen haben.
Prozessor-Benchmarks
Gegenüber Comet Lake-S zeigt sich, dass Intel mit der neuen Architektur durchaus noch ordentlich Potenzial aus dem Silizium quetscht. Es ist schon erstaunlich, wenn man bedenkt, dass wir es hier immer noch mit Prozessoren zu tun haben, die im 14nm Verfahren gefertigt werden. AMD ist mit 7nm schon einen großen Schritt weiter. Um das Duell nicht unfair zu gestallten, haben wir auf seitens von AMD ebenfalls die 6- bzw. 8-Kerner gewählt. Im direkten Konkurrenzkampf zeigt sich aber ein klarer Vorteil für AMD. Sowohl beim Duell der 8-Kerner als auch bei den 6-Kernern muss sich Intel geschlagen geben. Dennoch war es nötig diese Prozessoren zu entwickeln, um den Anschluss an die Konkurrenz nicht komplett zu verlieren, denn gegenüber Comet Lake-S waren die neuen Zen3-Prozessoren deutlich überlegen. Nun schmilzt der Vorsprung von AMD auf ca. 5 Prozentpunkte, wenn wir uns die synthetischen Prozessor-Benchmarks einmal kumuliert betrachten.
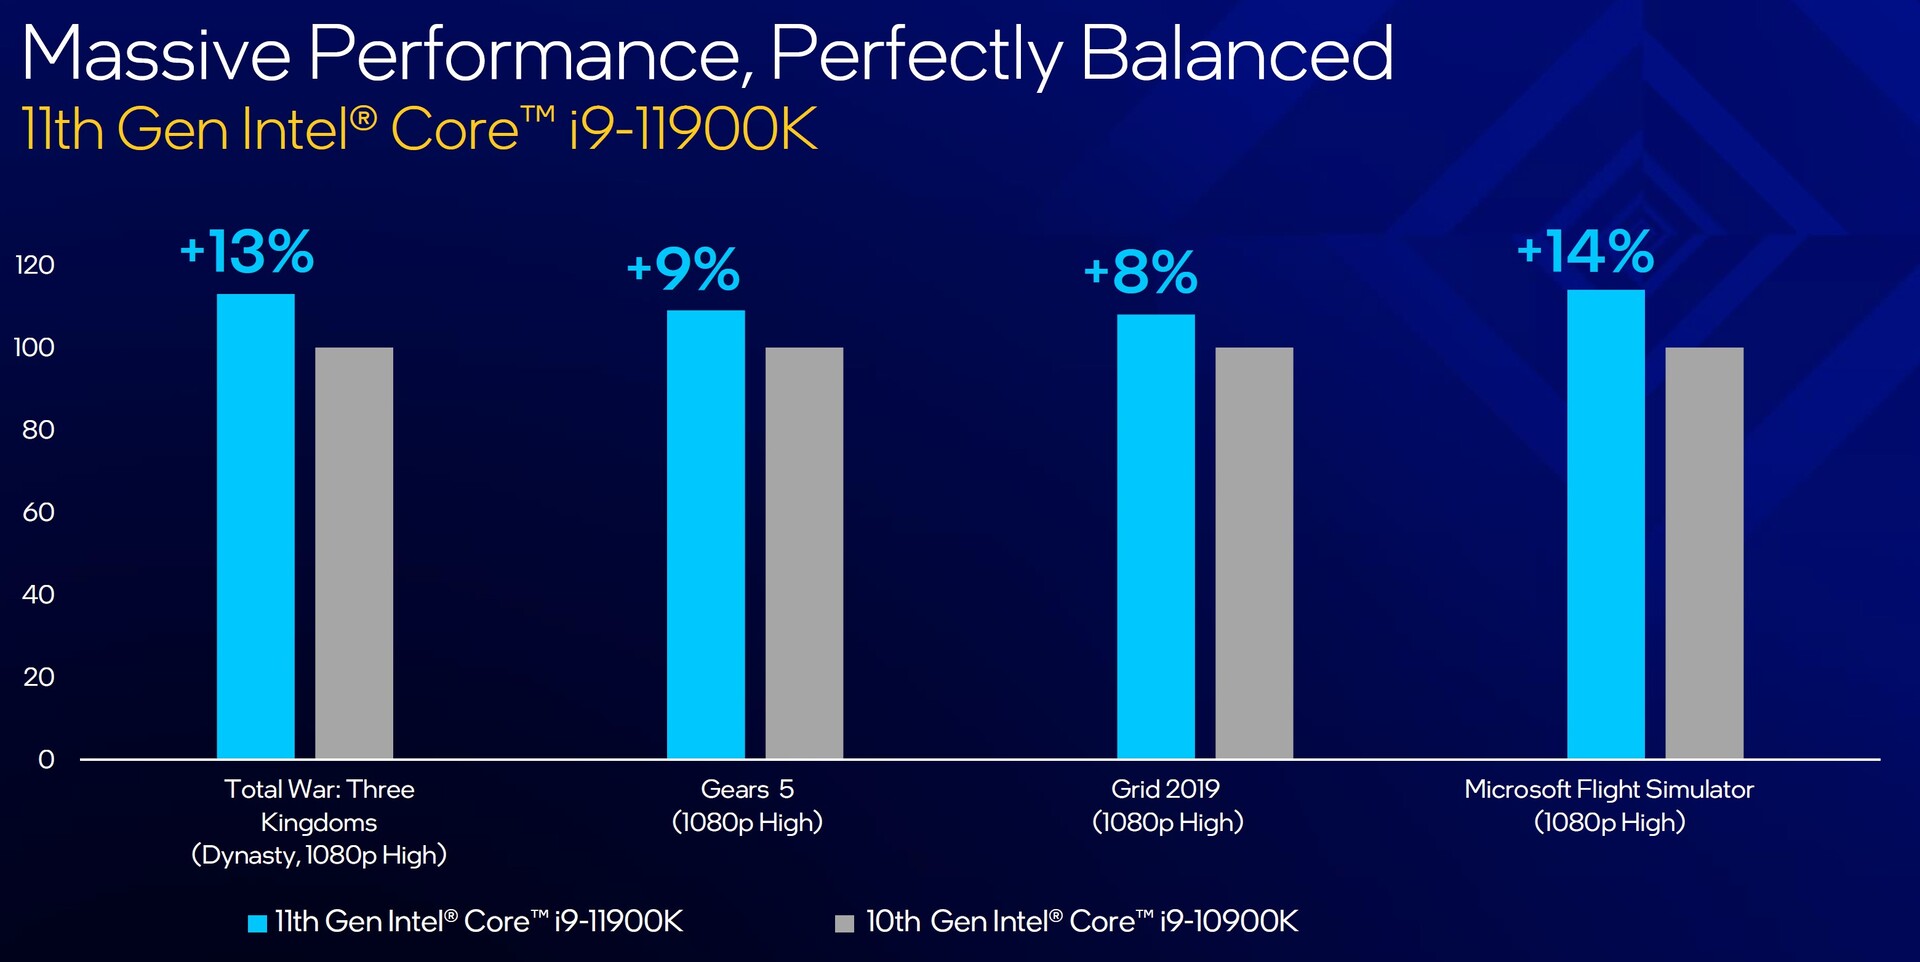
Beachtlich ist die Leistung der neuen Intel-Generation aber dennoch. Gegenüber dem Intel Core i9-10900K verliert der Intel Core i9-11900K nur in wenigen Multi-Core-Tests. Der Rückstand ist aber relativ gering, sodass es insgesamt für ein besseres Ergebnis reicht. Somit hat man die geringere Anzahl an Rechenkernen sehr gut kompensiert, zumal die Single-Thread-Performance teilweise 20 Prozent besser geworden ist.
Im absoluten High-End-Bereich ist AMD aber mit seinen 12- und 16-Kernern aber noch einmal einen deutlichen Schritt voraus. Um hier zukünftig mithalten zu können, muss Intel langsam den Schritt wagen und der Fertigungsprozess verkleinern, um mehr Recheneinheiten auf gleicher Fläche unterzubringen.
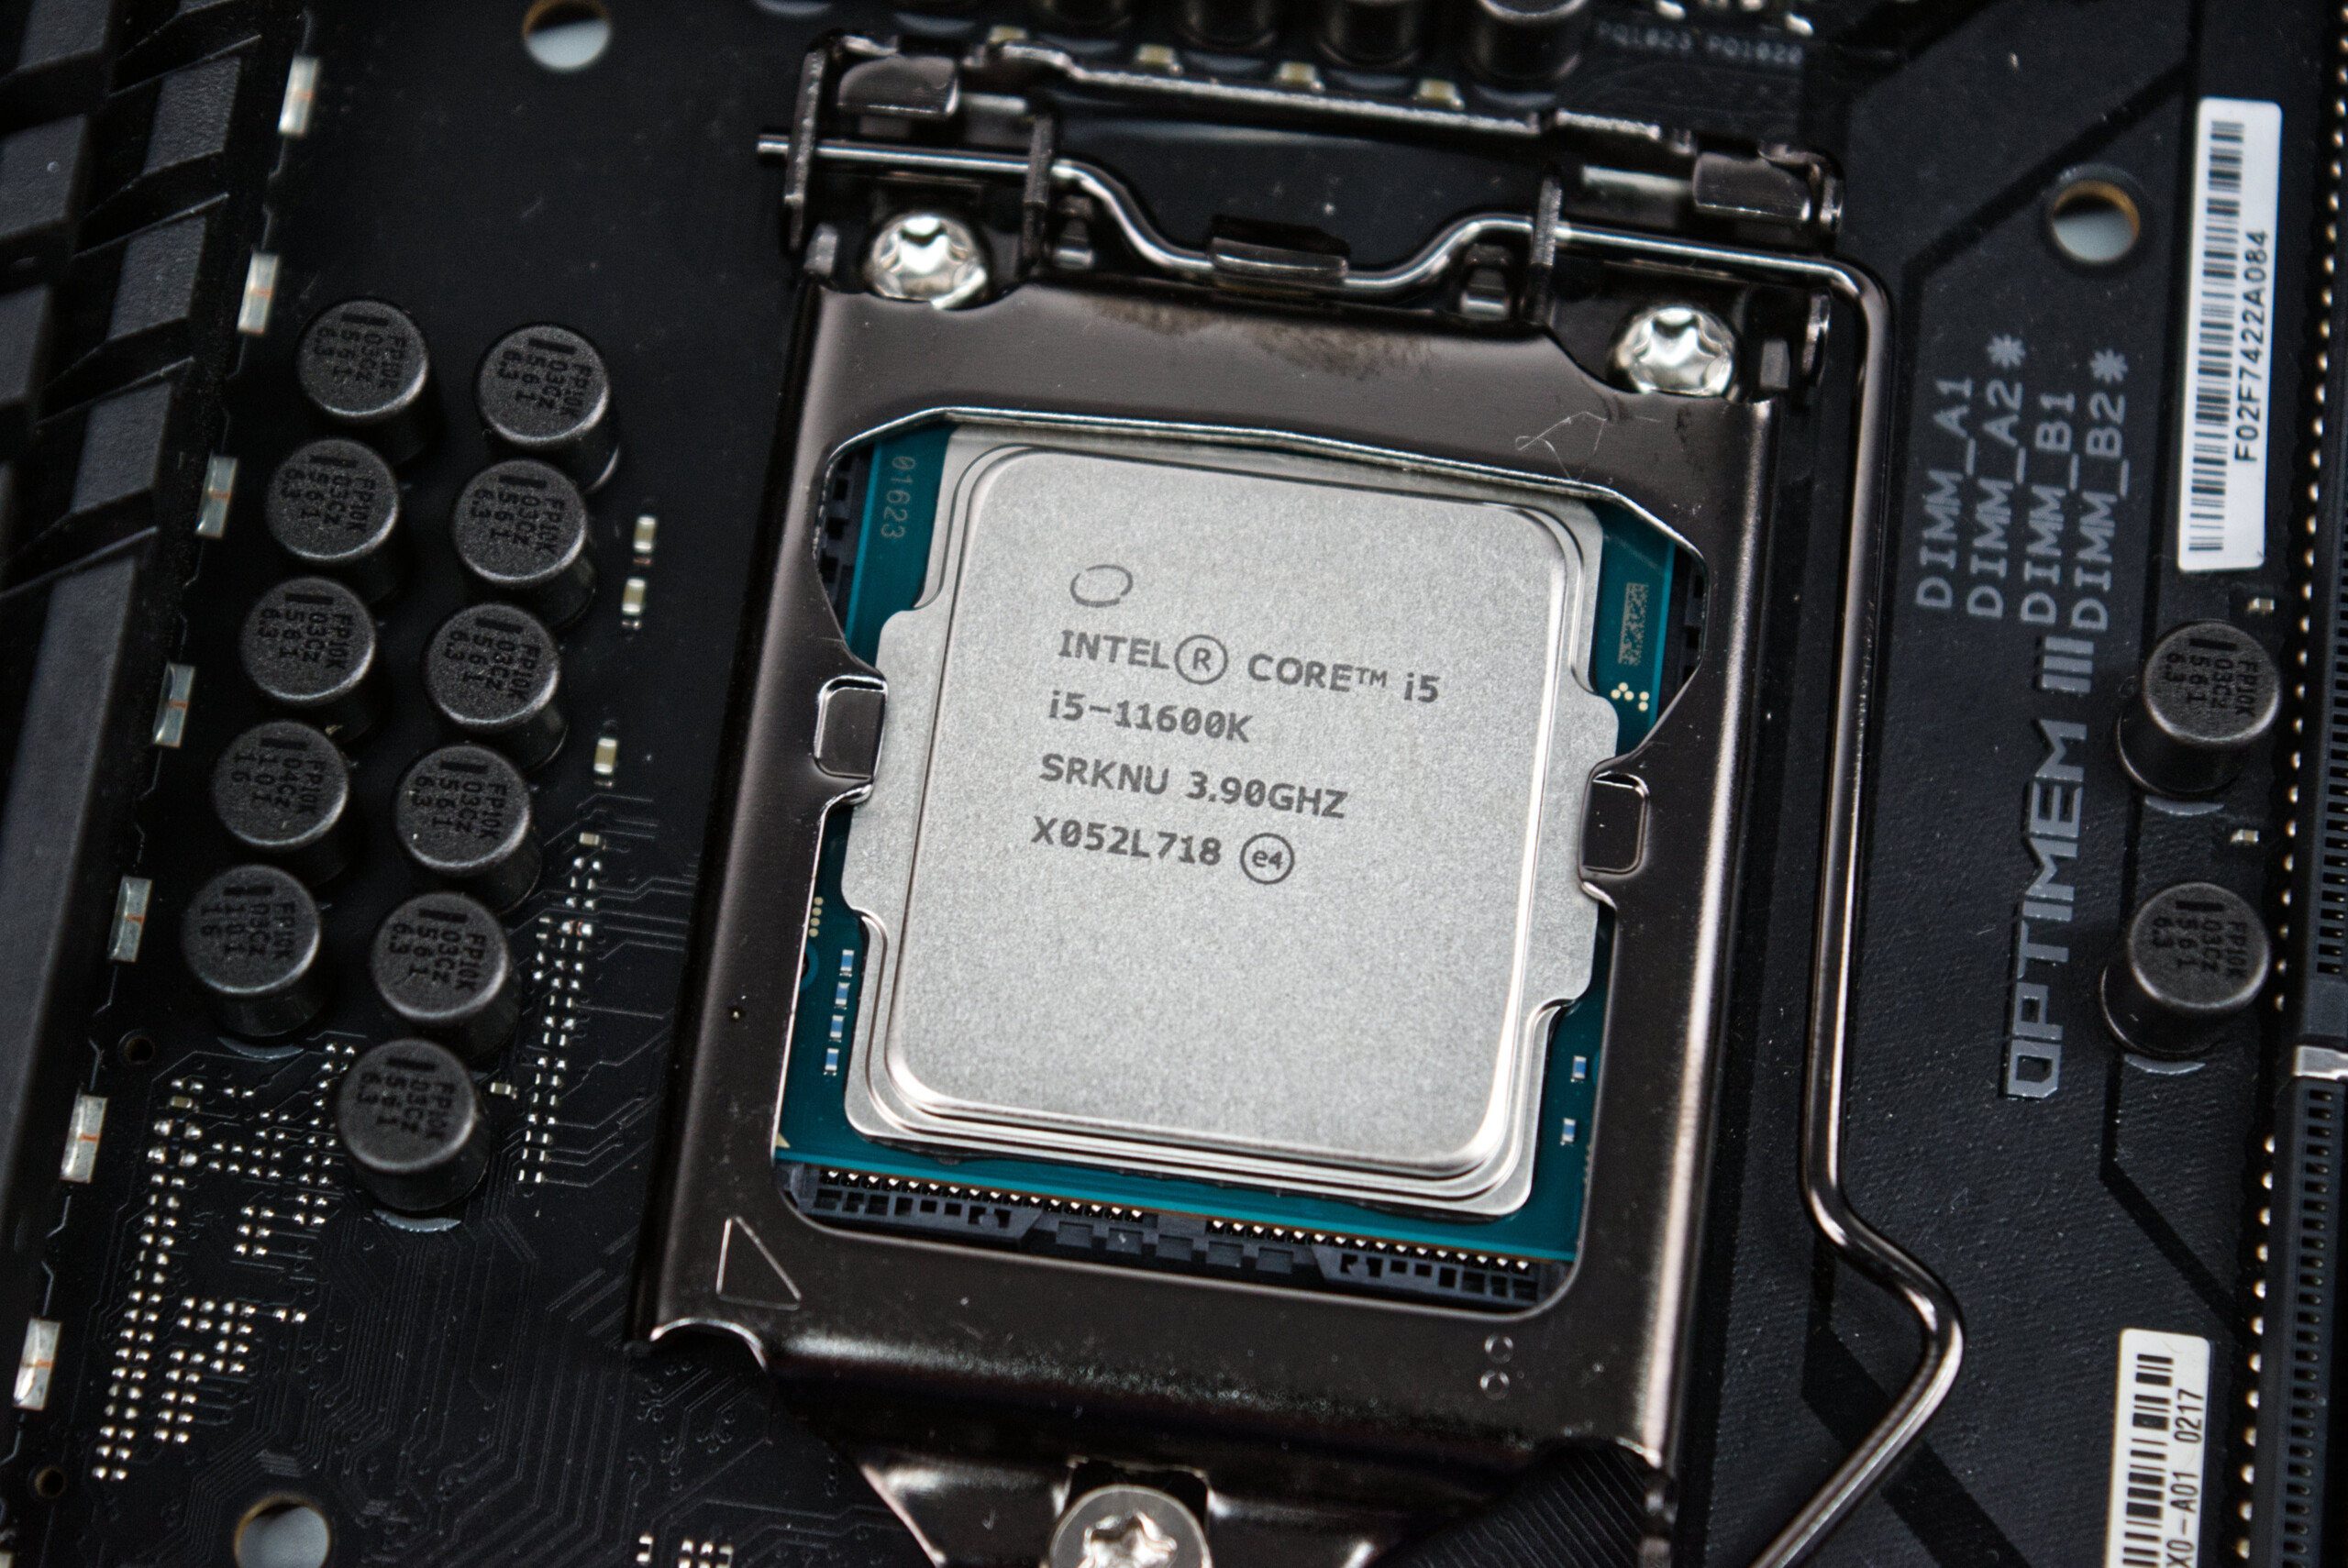
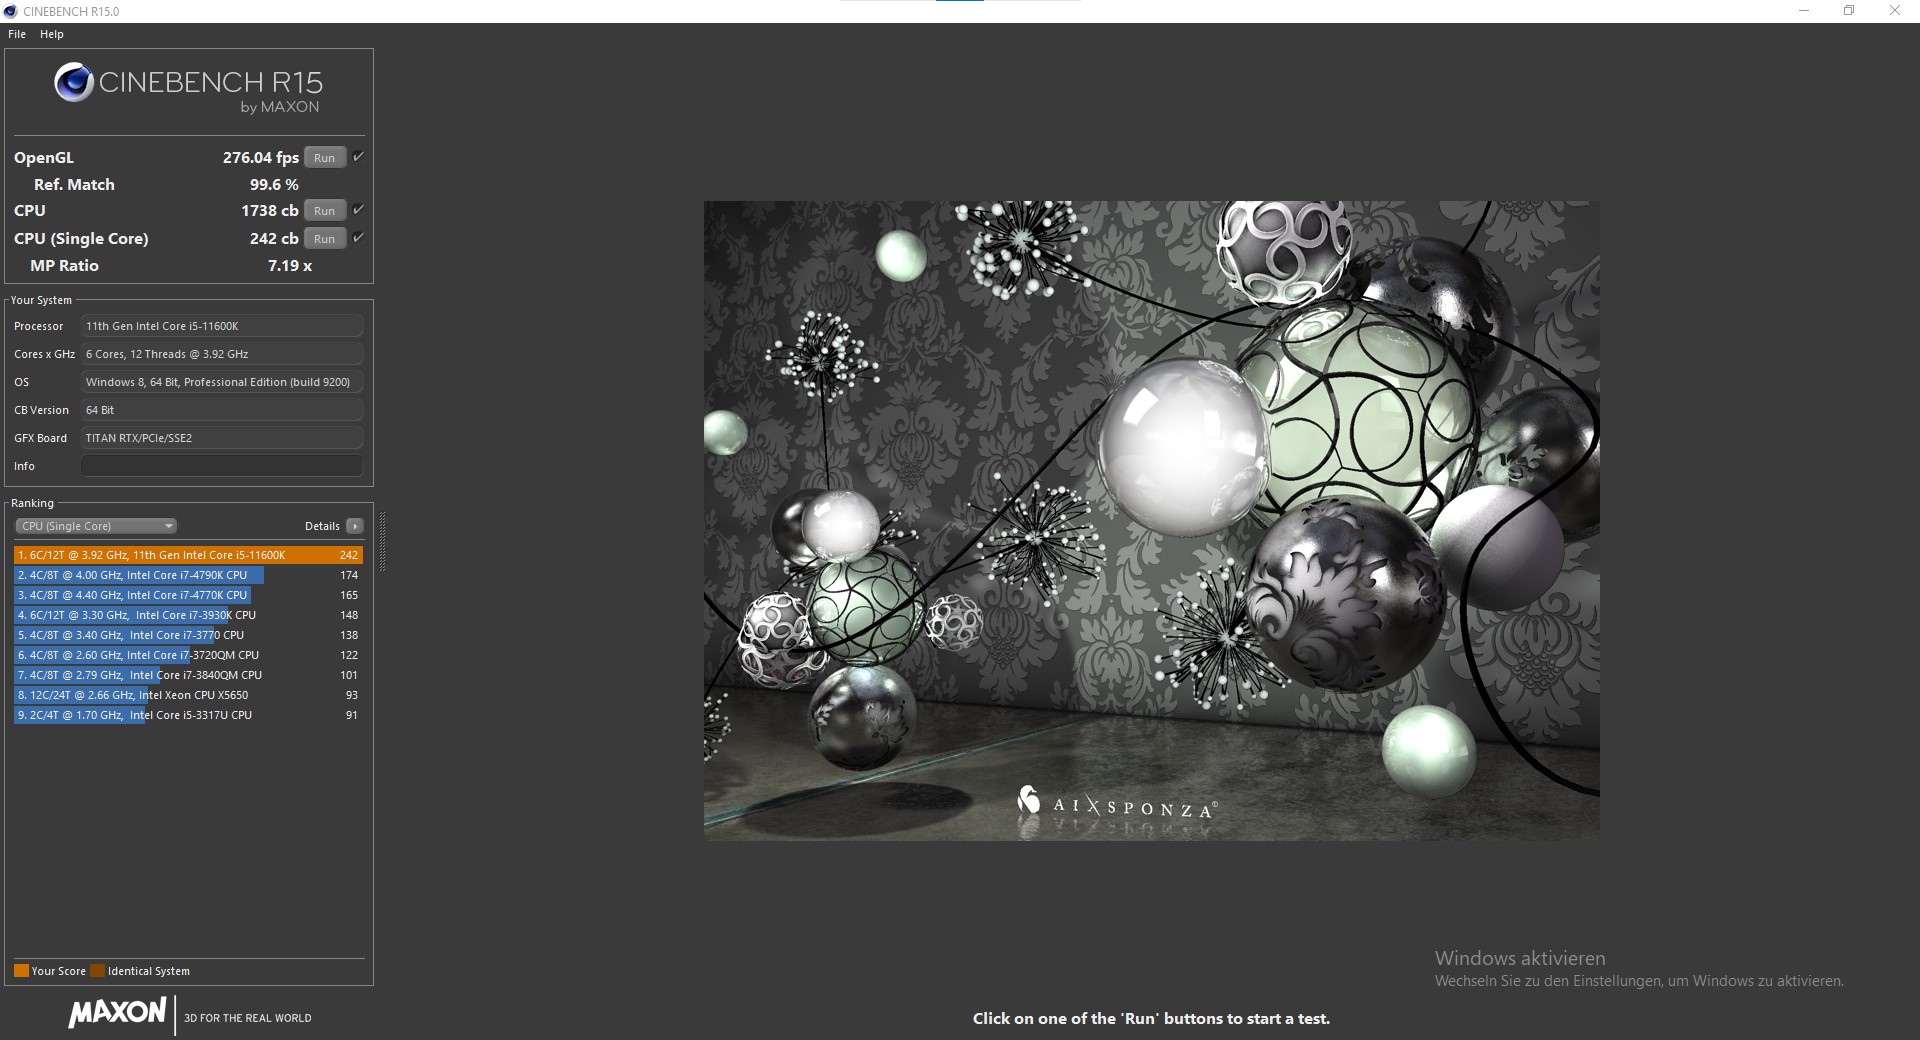
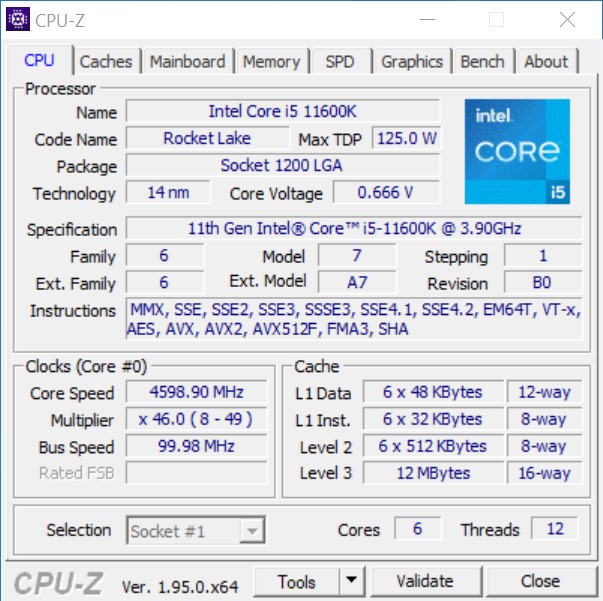
Intel Core i5-11600K
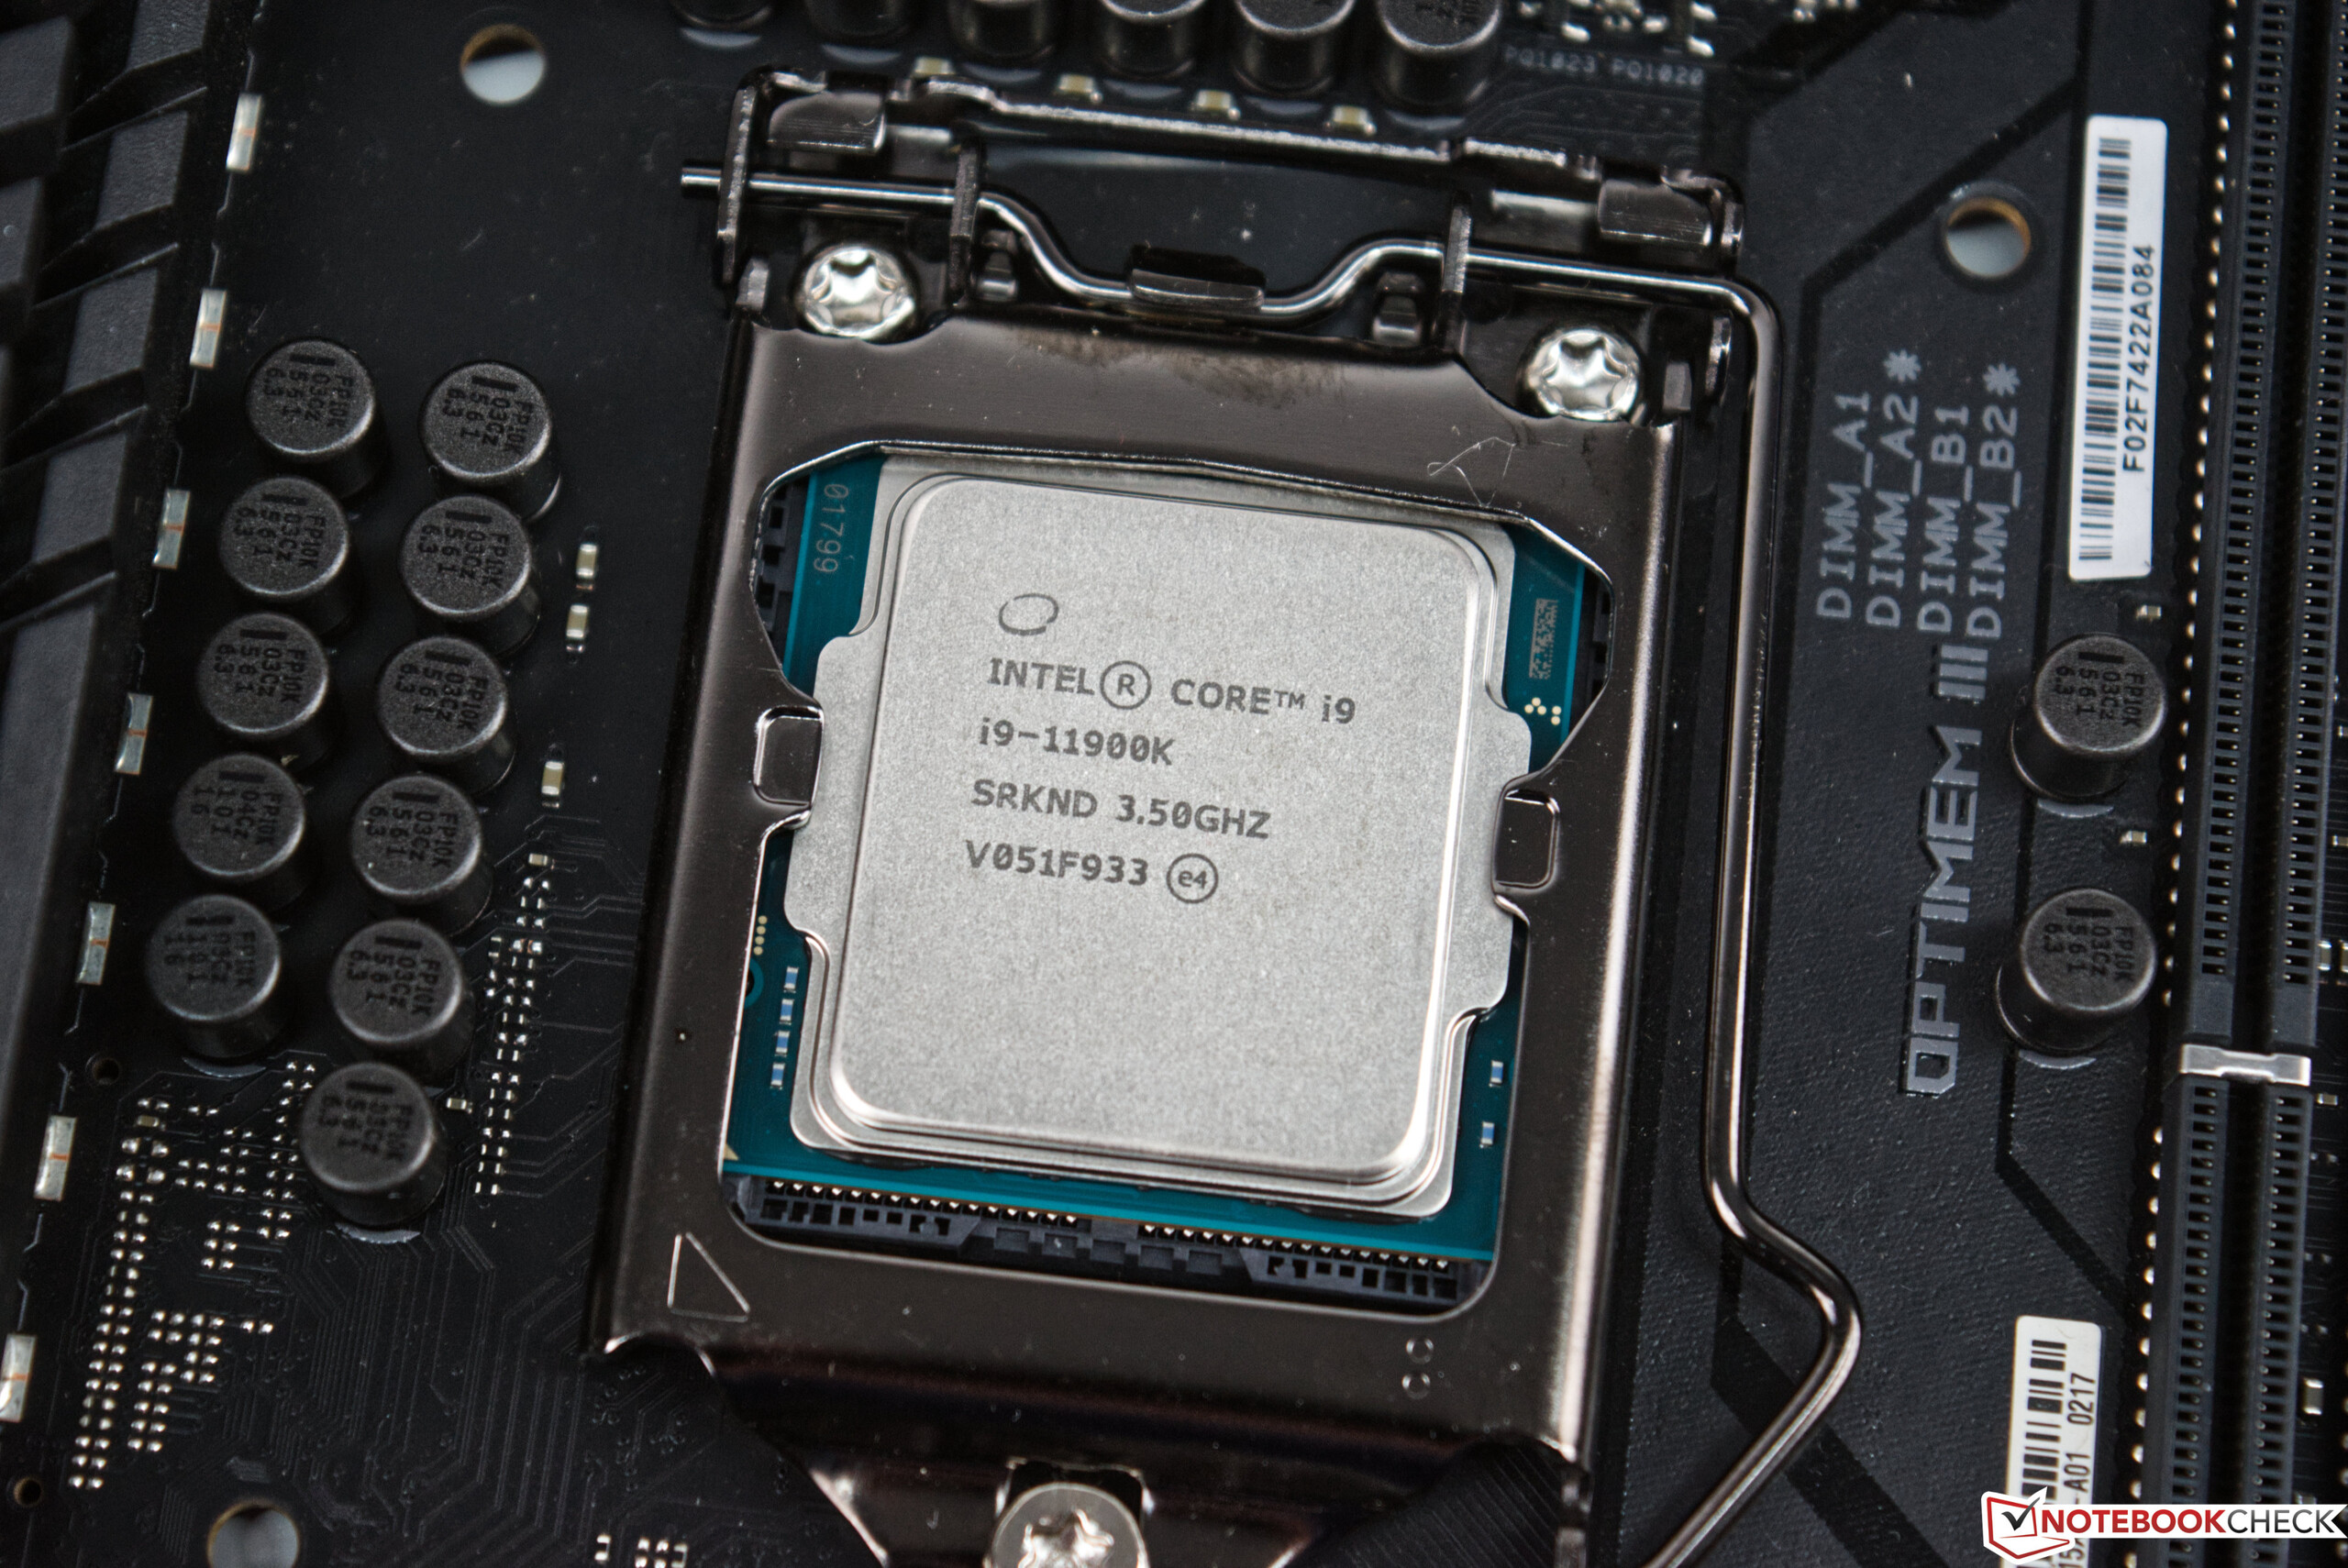
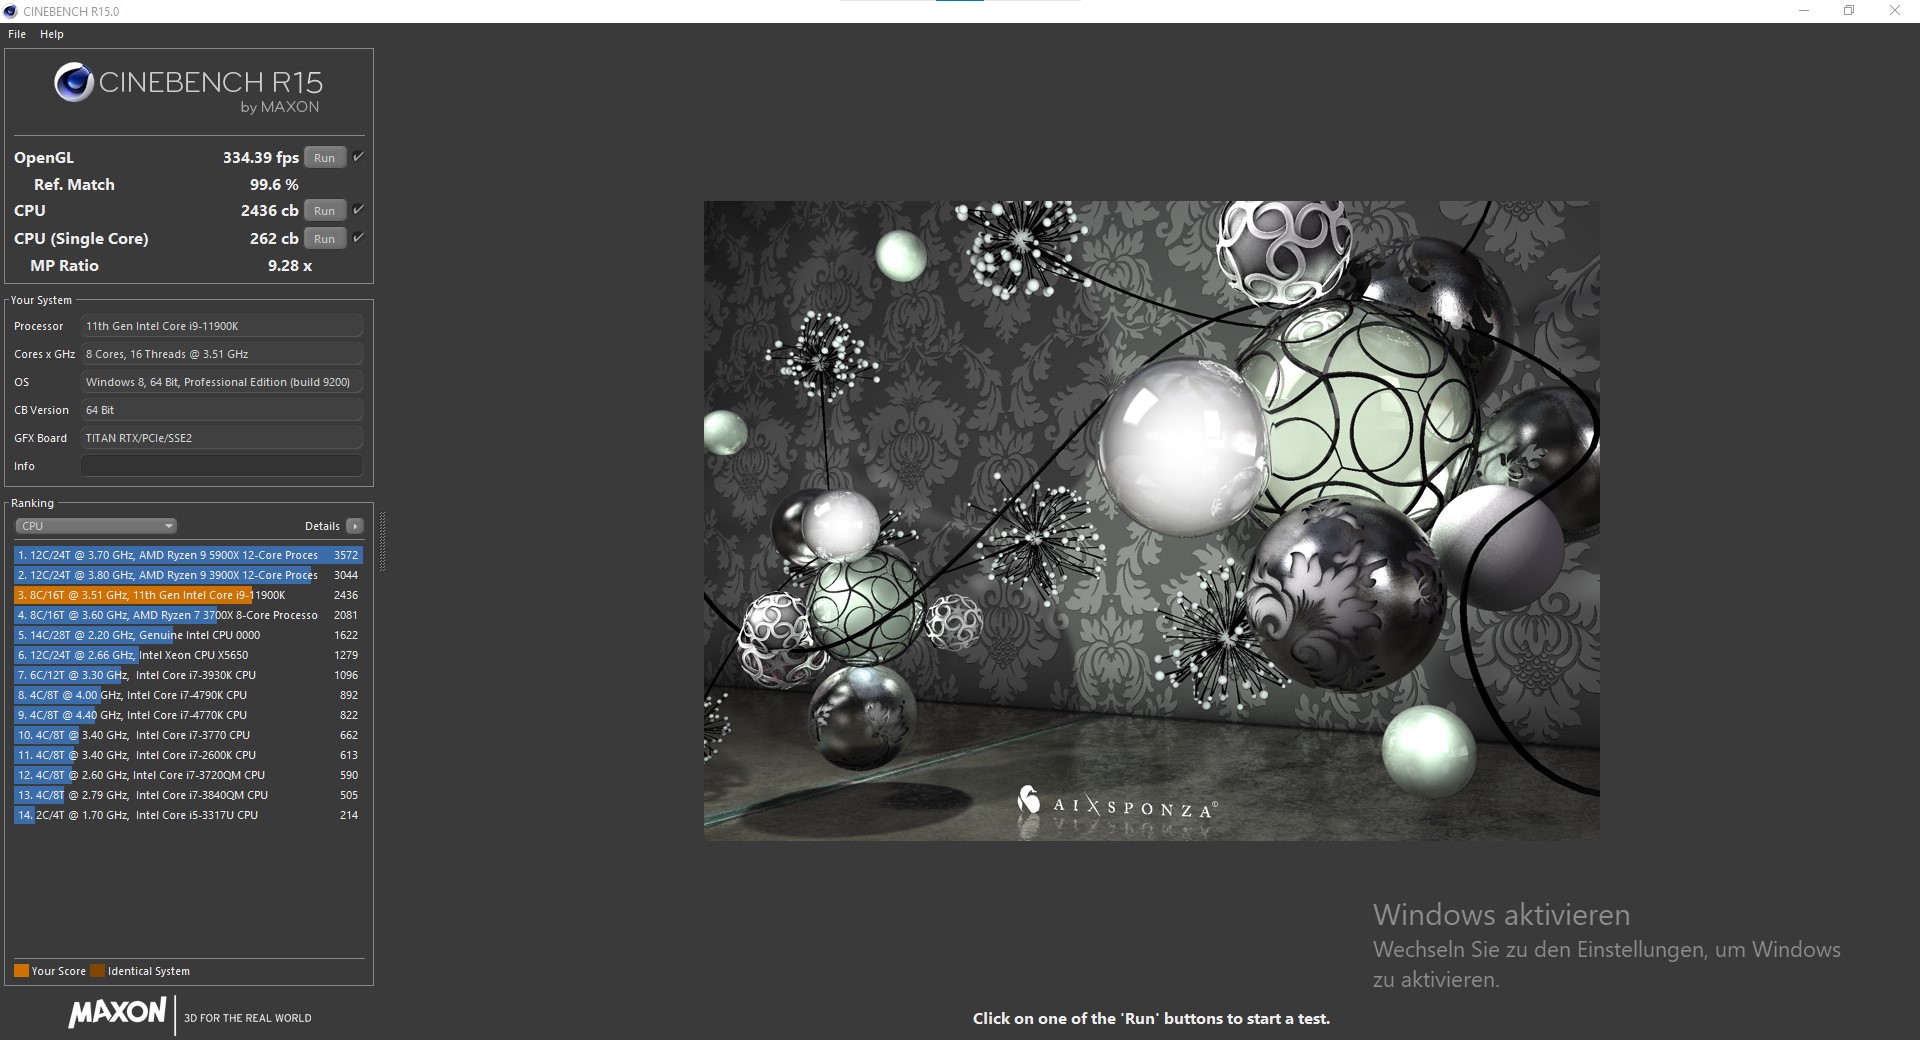
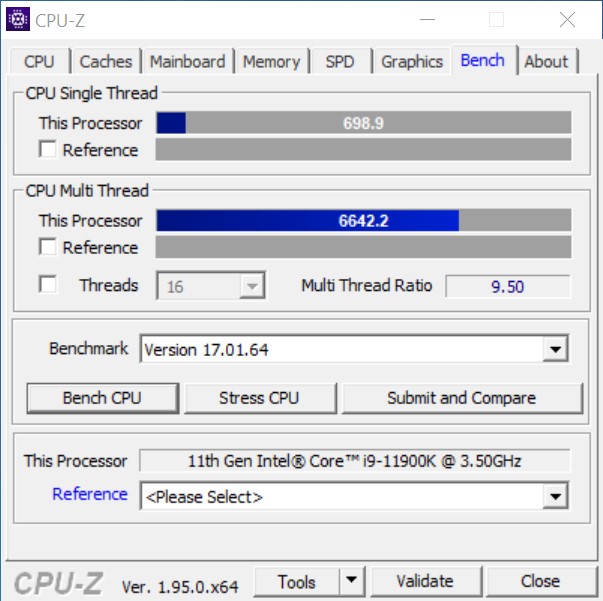
Intel Core i9-11900K

| Performance Rating - Percent | |
| AMD Ryzen 7 5800X | |
| Intel Core i9-11900K | |
| Intel Core i9-10900K | |
| AMD Ryzen 5 5600X | |
| Intel Core i5-11600K | |
| Intel Core i5-10600K | |
| Cinebench R10 | |
| Rendering Single CPUs 64Bit | |
| Intel Core i9-11900K | |
| AMD Ryzen 7 5800X | |
| Intel Core i5-11600K | |
| AMD Ryzen 5 5600X | |
| Intel Core i9-10900K | |
| Intel Core i5-10600K | |
| Rendering Multiple CPUs 64Bit | |
| AMD Ryzen 7 5800X | |
| Intel Core i9-11900K | |
| Intel Core i9-10900K | |
| AMD Ryzen 5 5600X | |
| Intel Core i5-11600K | |
| Intel Core i5-10600K | |
| Blender - v2.79 BMW27 CPU | |
| Intel Core i5-10600K | |
| Intel Core i5-11600K | |
| AMD Ryzen 5 5600X | |
| AMD Ryzen 7 5800X | |
| Intel Core i9-11900K | |
| Intel Core i9-10900K | |
| WinRAR - Result | |
| AMD Ryzen 7 5800X | |
| AMD Ryzen 5 5600X | |
| Intel Core i9-10900K | |
| Intel Core i9-11900K | |
| Intel Core i5-11600K | |
| Intel Core i5-10600K | |
| Geekbench 4.4 | |
| 64 Bit Single-Core Score | |
| Intel Core i9-11900K | |
| Intel Core i5-11600K | |
| AMD Ryzen 7 5800X | |
| AMD Ryzen 5 5600X | |
| Intel Core i9-10900K | |
| Intel Core i5-10600K | |
| 64 Bit Multi-Core Score | |
| AMD Ryzen 7 5800X | |
| Intel Core i9-10900K | |
| Intel Core i9-11900K | |
| AMD Ryzen 5 5600X | |
| Intel Core i5-11600K | |
| Intel Core i5-10600K | |
| 3DMark 11 - 1280x720 Performance Physics | |
| AMD Ryzen 7 5800X | |
| Intel Core i9-10900K | |
| Intel Core i9-11900K | |
| AMD Ryzen 5 5600X | |
| Intel Core i5-11600K | |
| Intel Core i5-10600K | |
| HWBOT x265 Benchmark v2.2 - 4k Preset | |
| Intel Core i9-10900K | |
| AMD Ryzen 7 5800X | |
| Intel Core i9-11900K | |
| AMD Ryzen 5 5600X | |
| Intel Core i5-11600K | |
| Intel Core i5-10600K | |
| R Benchmark 2.5 - Overall mean | |
| Intel Core i5-10600K | |
| Intel Core i9-10900K | |
| Intel Core i5-11600K | |
| AMD Ryzen 5 5600X | |
| Intel Core i9-11900K | |
| AMD Ryzen 7 5800X | |
| LibreOffice - 20 Documents To PDF | |
| Intel Core i9-10900K | |
| Intel Core i9-11900K | |
| Intel Core i5-10600K | |
| AMD Ryzen 5 5600X | |
| AMD Ryzen 7 5800X | |
| Intel Core i5-11600K | |
| WebXPRT 3 - Overall | |
| AMD Ryzen 7 5800X | |
| AMD Ryzen 5 5600X | |
| Intel Core i5-11600K | |
| Intel Core i9-10900K | |
| Intel Core i5-10600K | |
| Intel Core i9-11900K | |
| Mozilla Kraken 1.1 - Total | |
| Intel Core i5-10600K | |
| Intel Core i9-10900K | |
| Intel Core i5-11600K | |
| AMD Ryzen 5 5600X | |
| AMD Ryzen 7 5800X | |
| Intel Core i9-11900K | |
| 3DMark | |
| 3840x2160 Fire Strike Ultra Physics | |
| AMD Ryzen 7 5800X | |
| Intel Core i9-10900K | |
| Intel Core i9-11900K | |
| AMD Ryzen 5 5600X | |
| Intel Core i5-11600K | |
| Intel Core i5-10600K | |
| 1920x1080 Fire Strike Physics | |
| AMD Ryzen 7 5800X | |
| Intel Core i9-10900K | |
| Intel Core i9-11900K | |
| AMD Ryzen 5 5600X | |
| Intel Core i5-11600K | |
| Intel Core i5-10600K | |
| 2560x1440 Time Spy CPU | |
| Intel Core i9-10900K | |
| Intel Core i9-11900K | |
| AMD Ryzen 7 5800X | |
| Intel Core i5-11600K | |
| AMD Ryzen 5 5600X | |
| Intel Core i5-10600K | |
* ... kleinere Werte sind besser
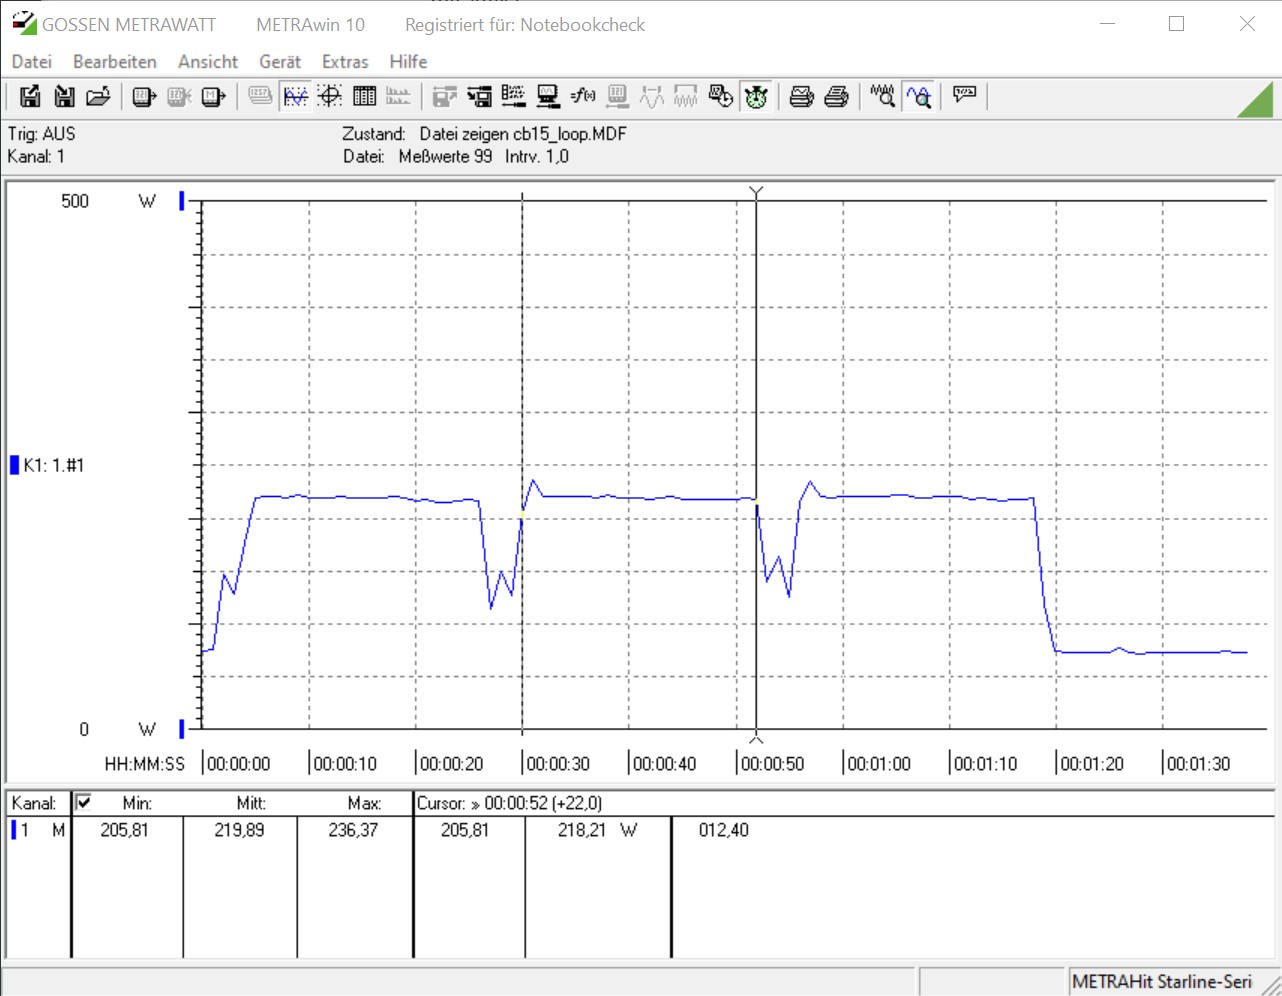
Rocket Lake-S vs. Cinebench-R15-Multi-Schleife
Beim ersten Belastungstest zeigen beide Testsamples eine sehr stabile Performance. Der Intel Core i9-11900K reiht sich aber hinter dem Intel Core i9-10900K ein. Trotzdem ist der 10 Kerner in greifbarer Nähe. Das Duell der beiden Core i5 Modelle ist hier etwas Aussagekräftiger, da beide Modelle über 6 Kerne und 12 Threads verfügen. Hier kann sich der Rocket Lake-S gegenüber dem Comet Lake-S deutlich absetzen.
Anwendungsleistung
| PCMark 10 - Score | |
| AMD Ryzen 5 5600X | |
| AMD Ryzen 7 5800X | |
| Intel Core i9-11900K | |
| Intel Core i5-11600K | |
| Intel Core i9-10900K | |
| Intel Core i7-10700K | |
| Intel Core i5-10600K | |
Spiele Benchmarks
Nun widmen wir uns Intels Paradedisziplin, den Spiele-Tests. Lange Zeit war Intel hier die Nummer 1, wenn es um die beste und schnellste Gaming-CPU geht. Nachdem AMD mit Zen3 einen ordentlichen Leistungszuwachs verbuchen konnte, ging die Leistungskrone in dieser Disziplin an die Konkurrenz. Daran kann leider auch Rocket Lake-S momentan nichts ändern. Im Vergleich zum Ryzen 7 5800X ist der Intel Core i9-11900K aber gleich schnell, auch wenn das Rating hier mit dem dritten Platz das genaue Ergebnis anhand der Zahlen zeigt. Der Unterschied ist verschwindend gering und nur messbar. Von einem spürbaren Leistungsunterschied kann keine Rede sein. Beide Prozessorhersteller liefern sich hier also ein Kopf an Kopf Duell, wobei hier nur der Anwender profitieren kann.
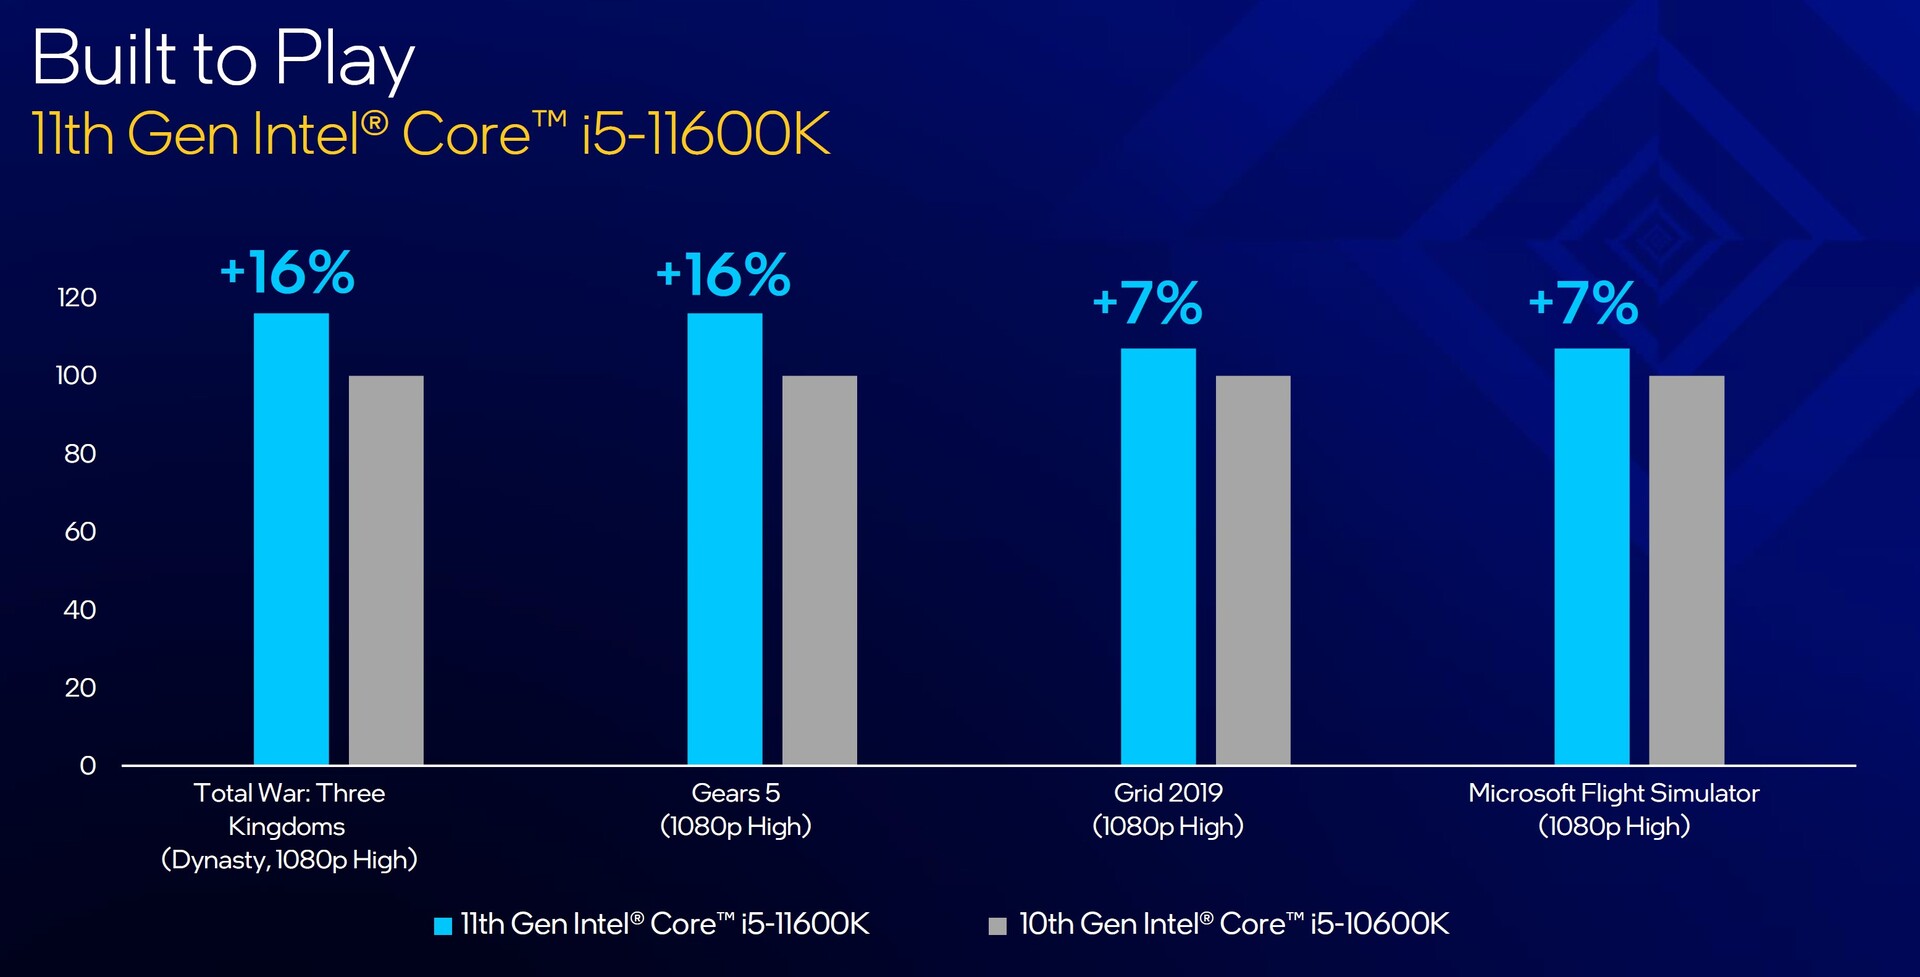
Der kleinere Intel Core i5-11600K macht einen größeren Sprung und reiht sich in unserem Vergleich auf Platz vier ein. Auch hier ist der Abstand zum AMD Ryzen 5 5600X verschwindend gering, sodass hier kein eindeutiger Sieger hervorgeht.
Nichtsdestotrotz eignen sich beide Testsamples hervorragend für alle aktuellen Spiele. Im CPU-Limit erreicht der Intel Core i9-11900K hohe Frameraten, welches für eine sehr gute IPC spricht. Im GPU-Limit kommt es vielmehr auf die Grafikkarte an, sodass hier die Leistung der CPU immer mehr ins Hintertreffen geriet. Nur einige wenige Titel profitieren von einer hohen Anzahl an Rechenkernen. Hier muss jeder Anwender selbst abwägen, was einem wichtiger ist. Vielmehr wird aber auch der Preis und die Verfügbarkeit eine große Rolle spielen.
| Performance Rating - Percent | |
| AMD Ryzen 7 5800X -2! | |
| AMD Ryzen 5 5600X -2! | |
| Intel Core i9-11900K | |
| Intel Core i5-11600K | |
| Intel Core i9-10900K | |
| Intel Core i7-10700K -4! | |
| Intel Core i5-10600K | |
| Borderlands 3 | |
| 1280x720 Very Low Overall Quality (DX11) | |
| AMD Ryzen 7 5800X | |
| AMD Ryzen 5 5600X | |
| Intel Core i9-11900K | |
| Intel Core i9-10900K | |
| Intel Core i5-11600K | |
| Intel Core i7-10700K | |
| Intel Core i5-10600K | |
| 1920x1080 Badass Overall Quality (DX11) | |
| Intel Core i9-11900K | |
| Intel Core i9-10900K | |
| Intel Core i7-10700K | |
| Intel Core i5-11600K | |
| AMD Ryzen 7 5800X | |
| AMD Ryzen 5 5600X | |
| Intel Core i5-10600K | |
| Metro Exodus | |
| 1280x720 Low Quality AF:4x | |
| AMD Ryzen 7 5800X | |
| AMD Ryzen 5 5600X | |
| Intel Core i9-11900K | |
| Intel Core i9-10900K | |
| Intel Core i7-10700K | |
| Intel Core i5-10600K | |
| Intel Core i5-11600K | |
| 1920x1080 Ultra Quality AF:16x | |
| Intel Core i7-10700K | |
| Intel Core i9-10900K | |
| Intel Core i5-10600K | |
| AMD Ryzen 5 5600X | |
| AMD Ryzen 7 5800X | |
| Intel Core i9-11900K | |
| Intel Core i5-11600K | |
| Forza Horizon 4 | |
| 1280x720 Very Low Preset | |
| Intel Core i9-11900K | |
| Intel Core i9-10900K | |
| Intel Core i5-11600K | |
| Intel Core i5-10600K | |
| 1920x1080 Ultra Preset AA:2xMS | |
| Intel Core i9-10900K | |
| Intel Core i9-11900K | |
| Intel Core i5-11600K | |
| Intel Core i5-10600K | |
| Final Fantasy XV Benchmark | |
| 1280x720 Lite Quality | |
| AMD Ryzen 7 5800X | |
| AMD Ryzen 5 5600X | |
| Intel Core i9-10900K | |
| Intel Core i9-11900K | |
| Intel Core i5-11600K | |
| Intel Core i5-10600K | |
| Intel Core i7-10700K | |
| 1920x1080 High Quality | |
| Intel Core i9-11900K | |
| Intel Core i9-10900K | |
| Intel Core i5-11600K | |
| Intel Core i5-10600K | |
| AMD Ryzen 7 5800X | |
| AMD Ryzen 5 5600X | |
| Intel Core i7-10700K | |
| Dota 2 Reborn | |
| 1280x720 min (0/3) fastest | |
| AMD Ryzen 7 5800X | |
| AMD Ryzen 5 5600X | |
| Intel Core i9-10900K | |
| Intel Core i9-11900K | |
| Intel Core i7-10700K | |
| Intel Core i5-11600K | |
| Intel Core i5-10600K | |
| 1920x1080 ultra (3/3) best looking | |
| AMD Ryzen 7 5800X | |
| AMD Ryzen 5 5600X | |
| Intel Core i9-10900K | |
| Intel Core i9-11900K | |
| Intel Core i5-11600K | |
| Intel Core i7-10700K | |
| Intel Core i5-10600K | |
| The Witcher 3 | |
| 1024x768 Low Graphics & Postprocessing | |
| AMD Ryzen 7 5800X | |
| AMD Ryzen 5 5600X | |
| Intel Core i9-10900K | |
| Intel Core i9-11900K | |
| Intel Core i7-10700K | |
| Intel Core i5-11600K | |
| Intel Core i5-10600K | |
| 1920x1080 Ultra Graphics & Postprocessing (HBAO+) | |
| Intel Core i5-11600K | |
| Intel Core i7-10700K | |
| Intel Core i5-10600K | |
| Intel Core i9-11900K | |
| Intel Core i9-10900K | |
| AMD Ryzen 7 5800X | |
| AMD Ryzen 5 5600X | |
| Shadow of the Tomb Raider | |
| 1280x720 Lowest Preset | |
| AMD Ryzen 7 5800X | |
| AMD Ryzen 5 5600X | |
| Intel Core i9-10900K | |
| Intel Core i9-11900K | |
| Intel Core i5-11600K | |
| Intel Core i5-10600K | |
| 1920x1080 Highest Preset AA:T | |
| AMD Ryzen 7 5800X | |
| Intel Core i9-11900K | |
| Intel Core i9-10900K | |
| AMD Ryzen 5 5600X | |
| Intel Core i5-11600K | |
| Intel Core i5-10600K | |
Intel Core i9-11900K + Nvidia Titan RTX
| min. | mittel | hoch | max. | QHD | 4K | |
|---|---|---|---|---|---|---|
| The Witcher 3 (2015) | 514 | 447 | 190 | 140 | 105 | |
| Dota 2 Reborn (2015) | 195.1 | 180.2 | 173.2 | 165.3 | 161.8 | |
| Final Fantasy XV Benchmark (2018) | 219 | 186 | 143 | 108 | 64.9 | |
| X-Plane 11.11 (2018) | 170 | 153 | 125 | 109 | ||
| Far Cry 5 (2018) | 212 | 183 | 175 | 164 | 141 | 80 |
| Shadow of the Tomb Raider (2018) | 203 | 186 | 178 | 168 | 127 | 70.4 |
| Forza Horizon 4 (2018) | 251 | 221 | 218 | 192 | 162 | 115 |
| Far Cry New Dawn (2019) | 178 | 155 | 149 | 135 | 126 | 82 |
| Metro Exodus (2019) | 228 | 173 | 133 | 106 | 84.6 | 54.7 |
| Borderlands 3 (2019) | 200 | 175 | 141 | 118 | 84.8 | 47.2 |
Intel Core i5-11600K + Nvidia Titan RTX
| min. | mittel | hoch | max. | QHD | 4K | |
|---|---|---|---|---|---|---|
| The Witcher 3 (2015) | 466 | 396 | 275 | 144 | 106 | |
| Dota 2 Reborn (2015) | 184.8 | 170.7 | 164.8 | 162.9 | 159.1 | |
| Final Fantasy XV Benchmark (2018) | 216 | 182 | 141 | 107 | 65.5 | |
| X-Plane 11.11 (2018) | 157 | 138 | 112 | 99.3 | ||
| Far Cry 5 (2018) | 199 | 177 | 167 | 157 | 140 | 83 |
| Shadow of the Tomb Raider (2018) | 188 | 171 | 168 | 158 | 127 | 70.2 |
| Forza Horizon 4 (2018) | 236 | 209 | 207 | 189 | 165 | 117 |
| Far Cry New Dawn (2019) | 168 | 148 | 143 | 129 | 122 | 83 |
| Metro Exodus (2019) | 210 | 167 | 132 | 105 | 85.4 | 55.2 |
| Borderlands 3 (2019) | 188 | 165 | 138 | 117 | 85 | 47.2 |
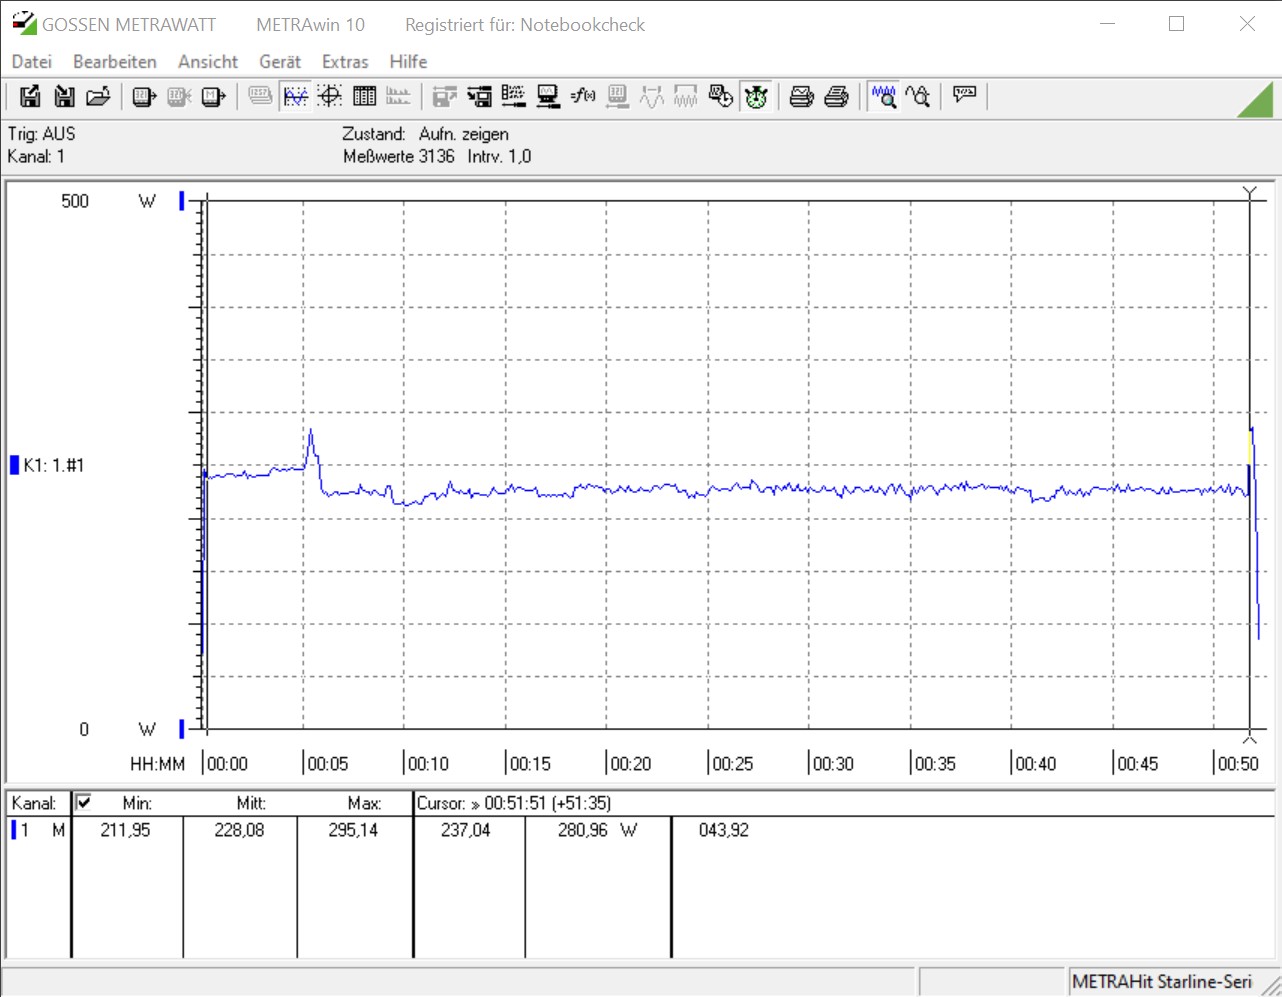
Energieverbrauch
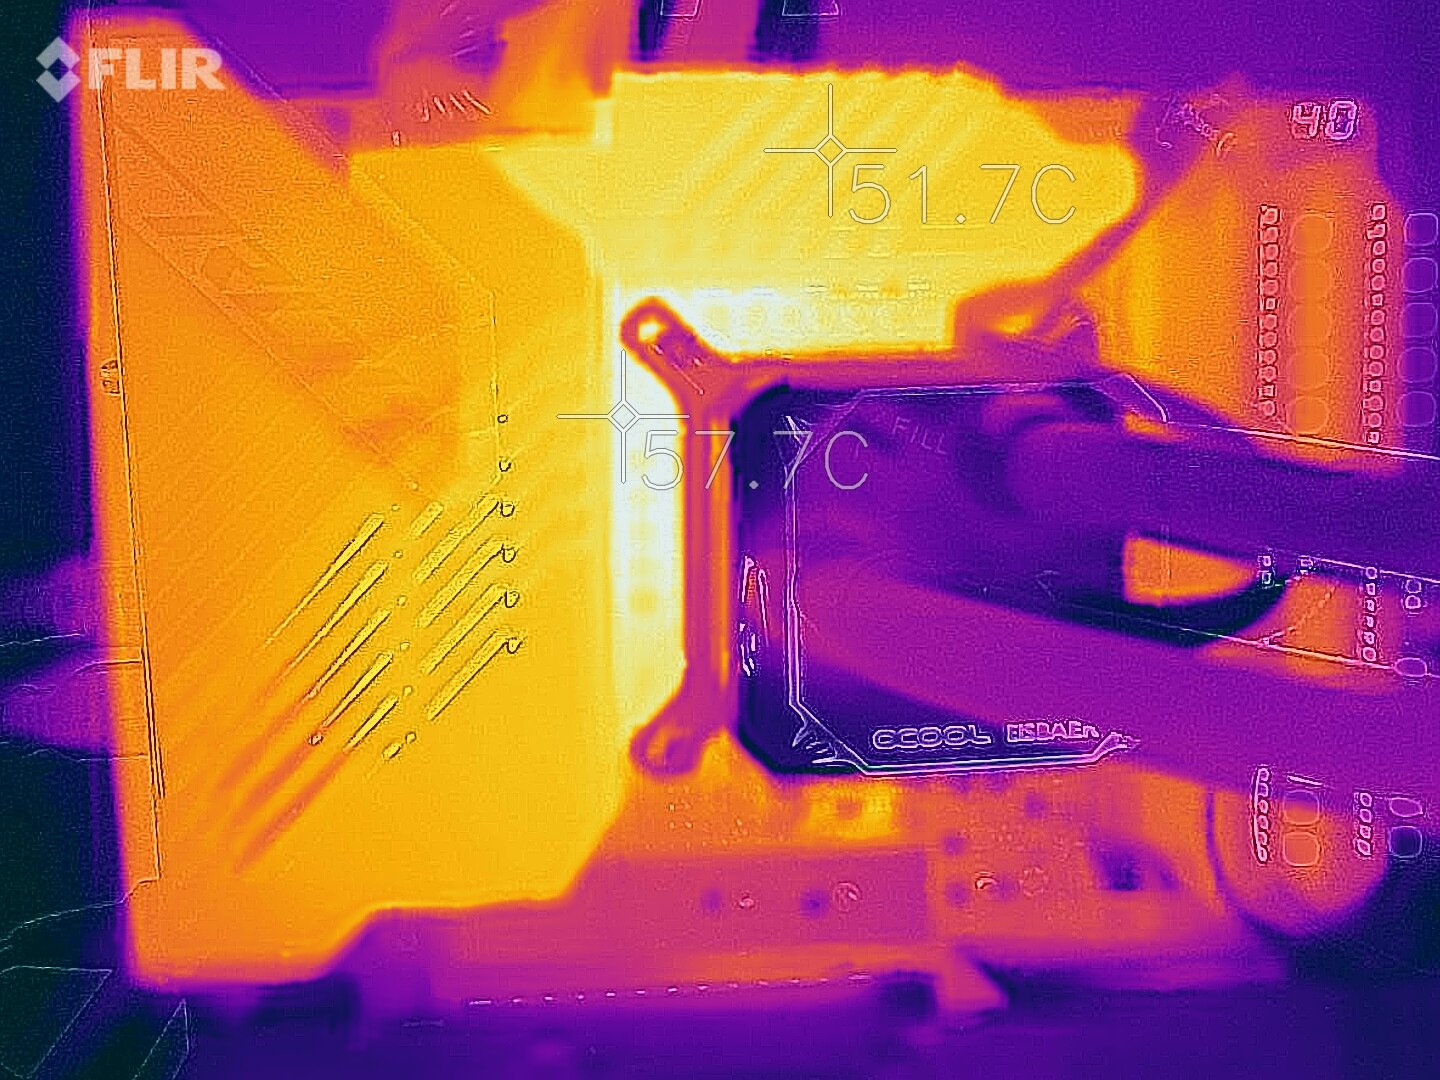
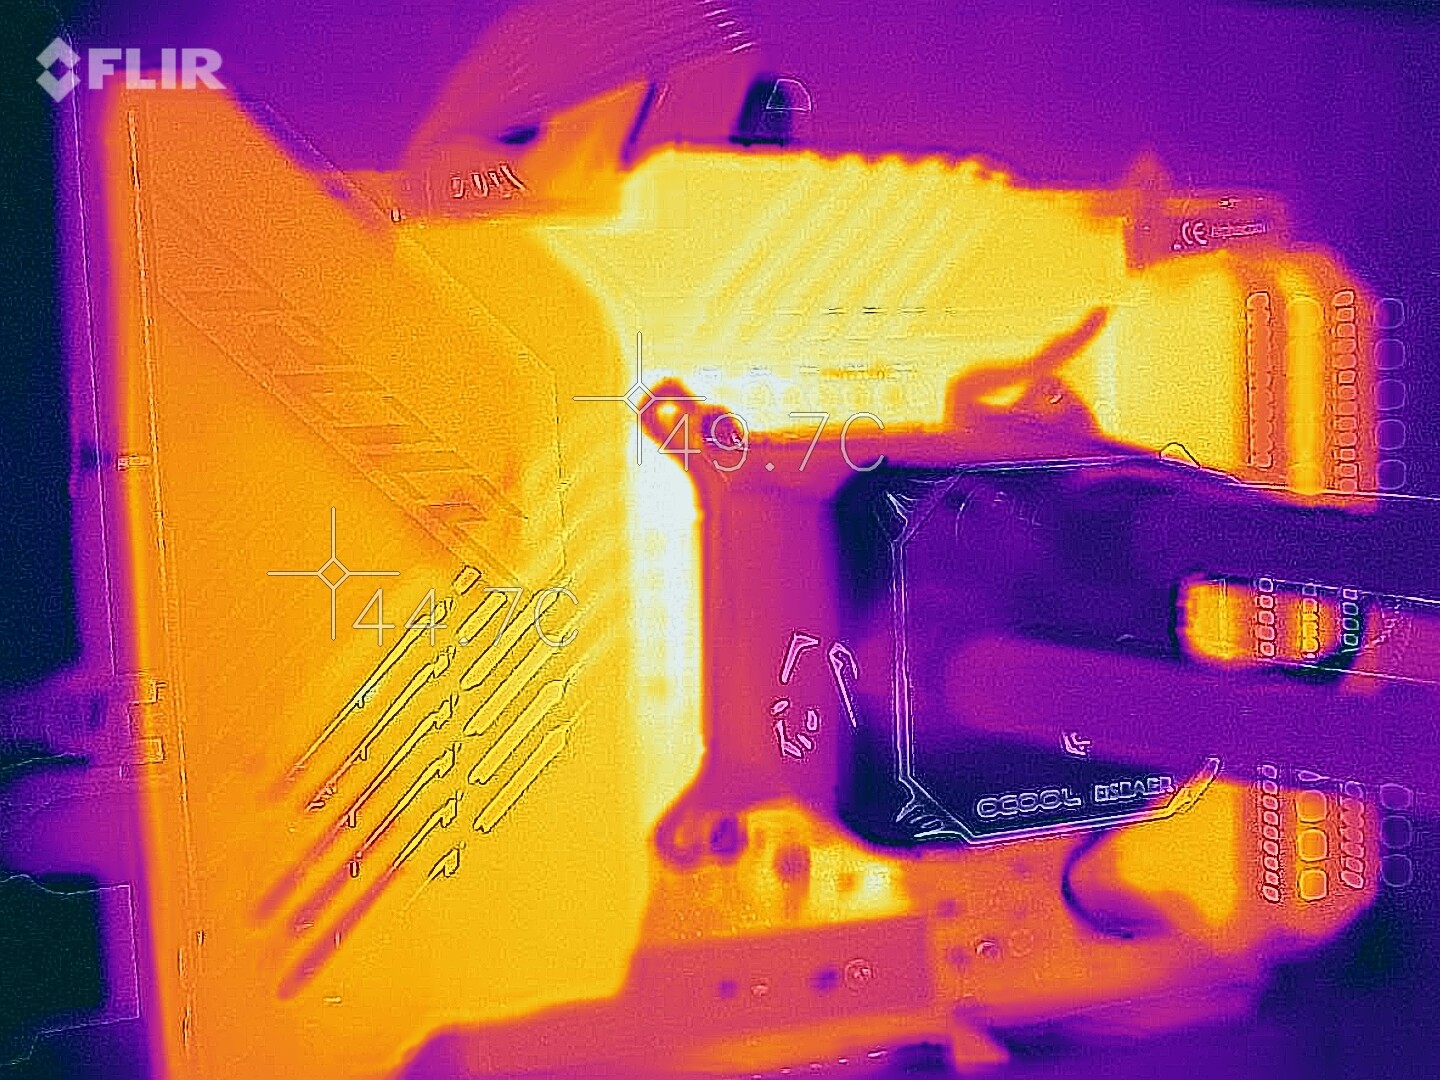
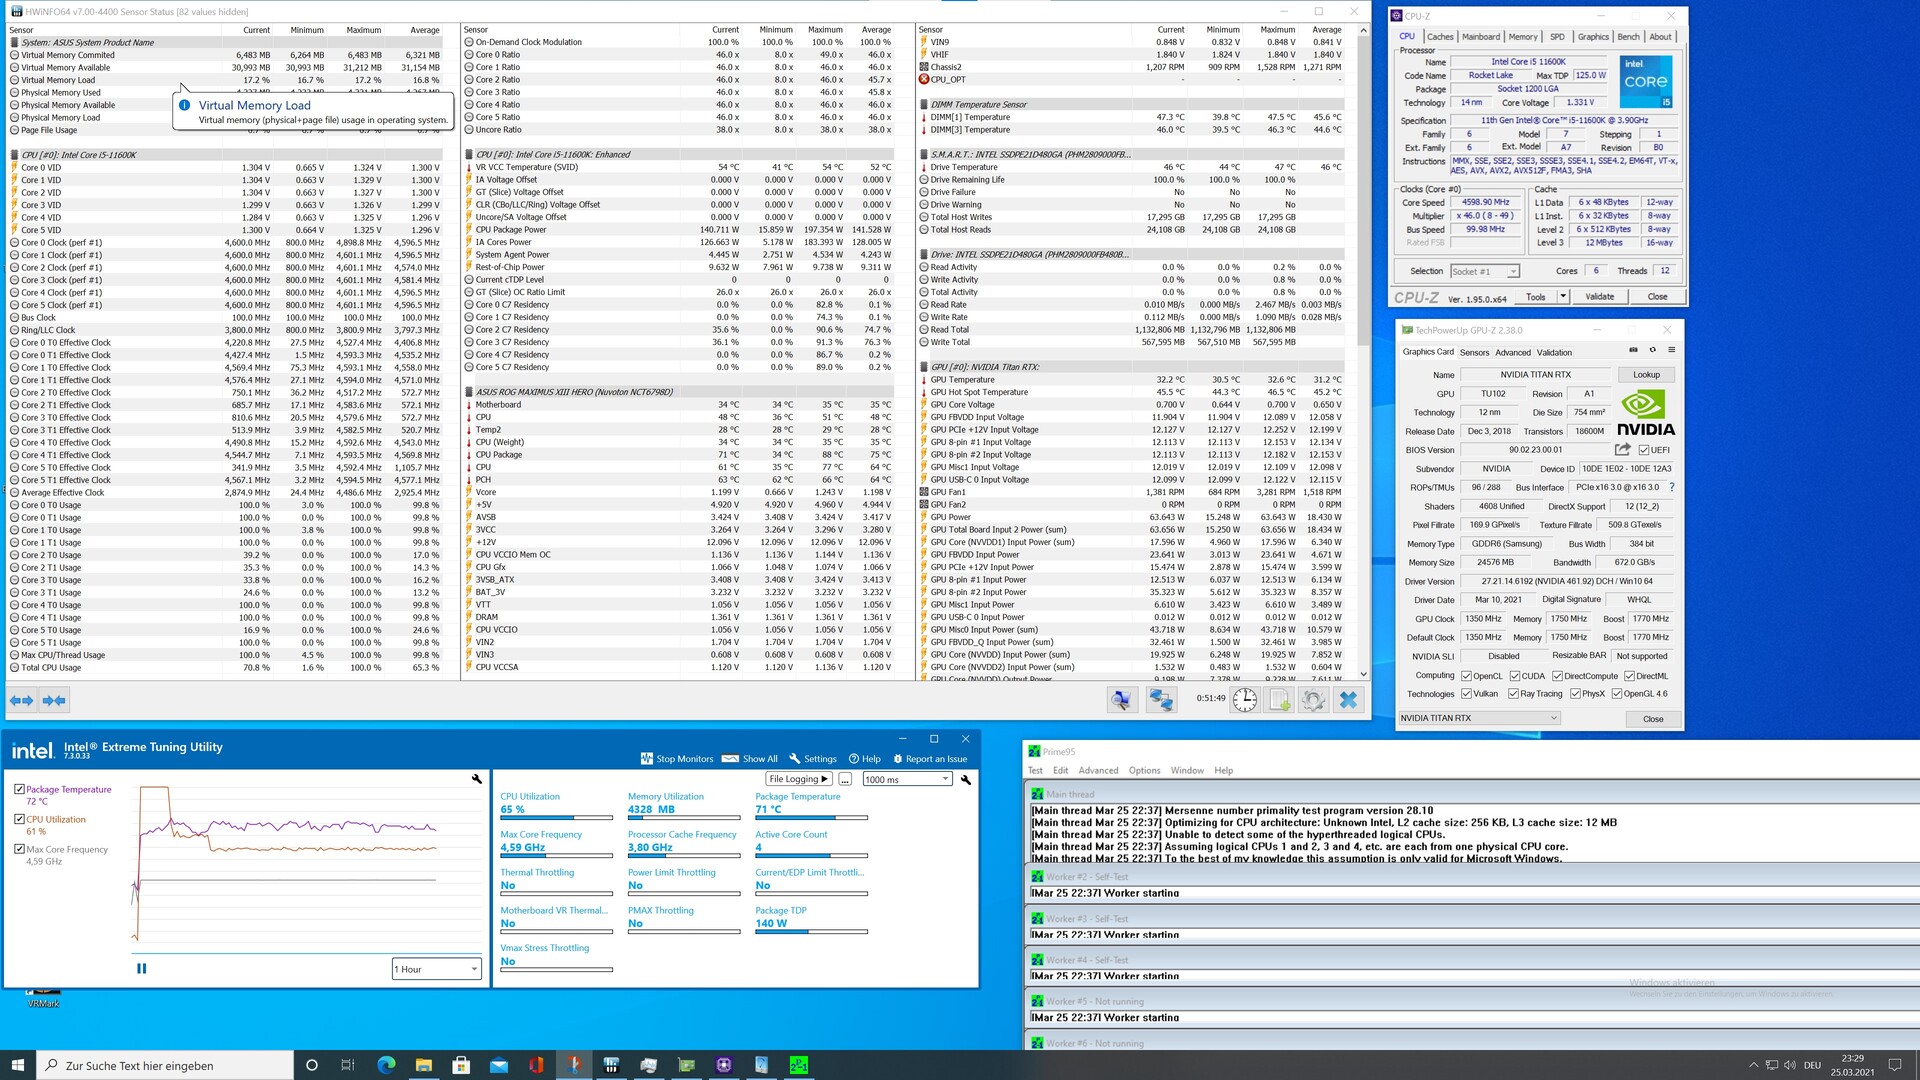
Der Energieverbrauch ist gegenüber Comet Lake-S auf einem ähnlichen Niveau. Die TDP ist mit 125 Watt gleich und auch die PL2-Werte sind mit knapp 250 Watt identisch. Gleiches gilt auch für die Tau-Werte, welche den maximalen Zeitraum des Turbos definieren. Unterm Strich ist das gesamte Testsystem im Leerlauf mit 57 Watt beim Core i9-11900K und 67 Watt beim Core i5-11600K sehr sparsam. Gegenüber AMD ist der Wert besser, welcher aber auch aufgrund der verbauten Komponenten und unterschiedliche Mainboards deutlich schwanken kann.
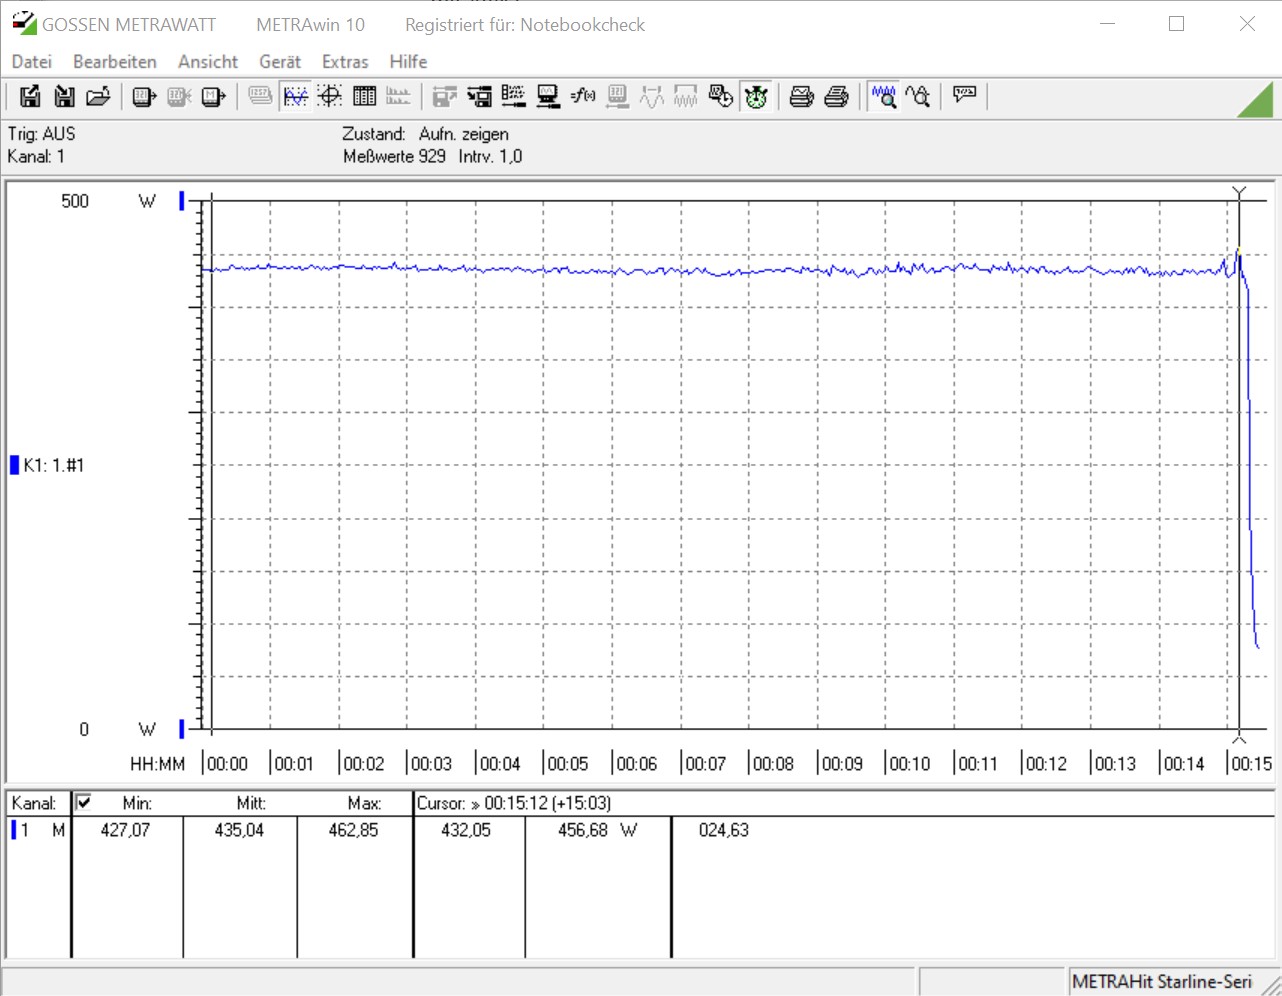
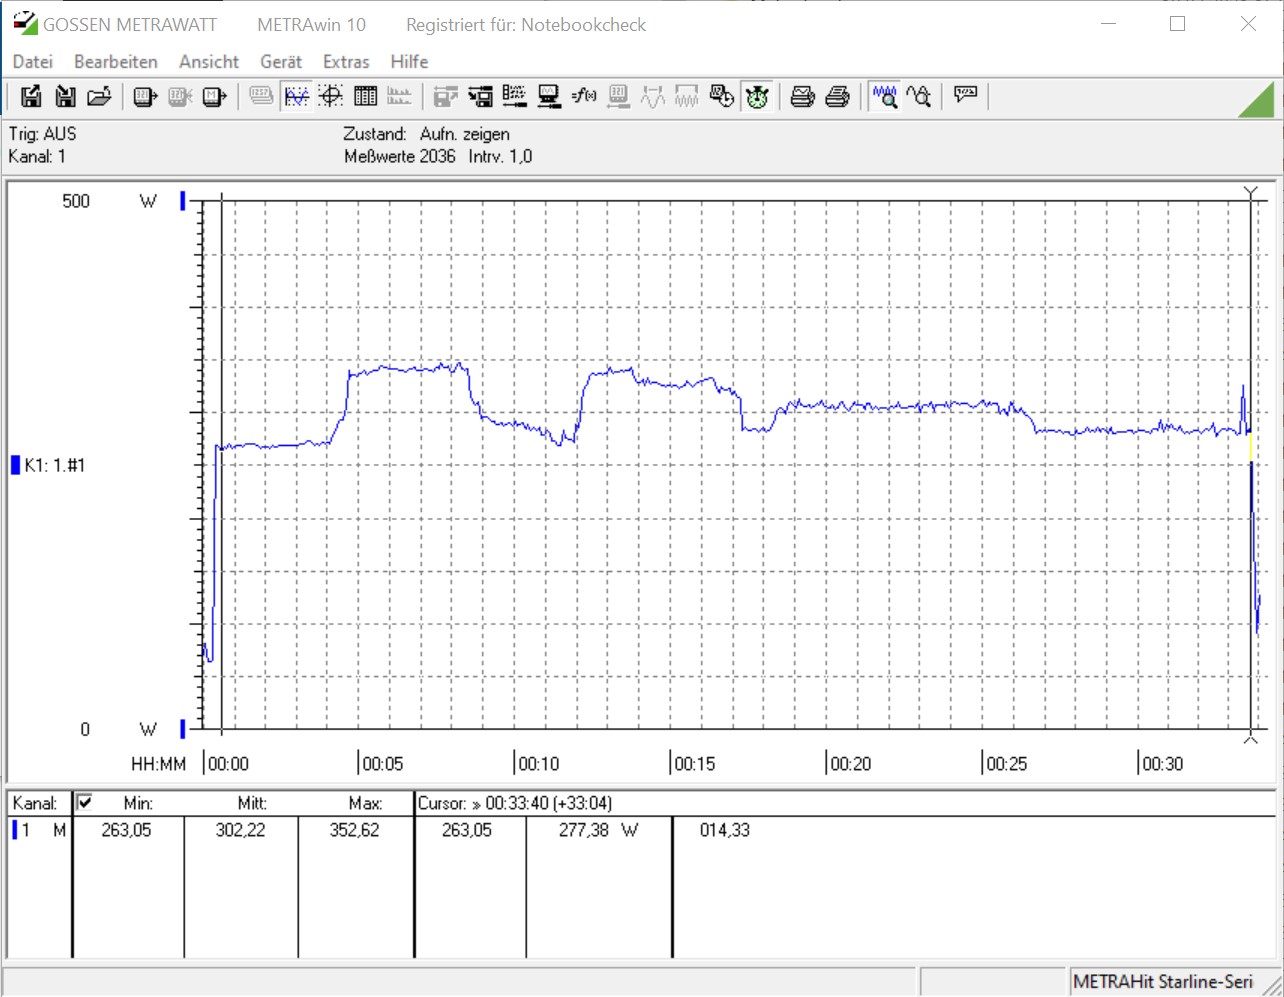
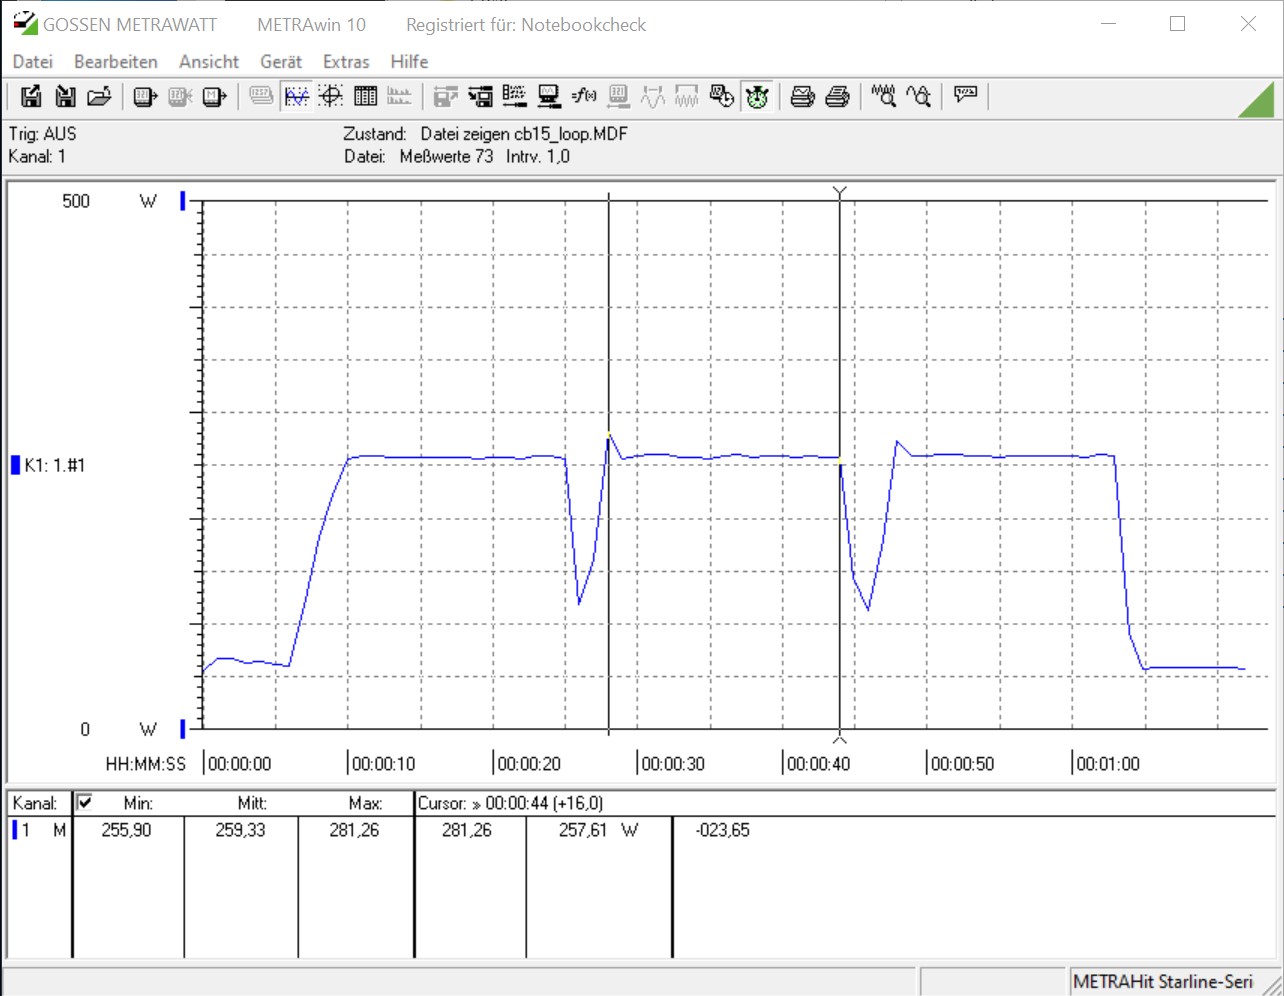
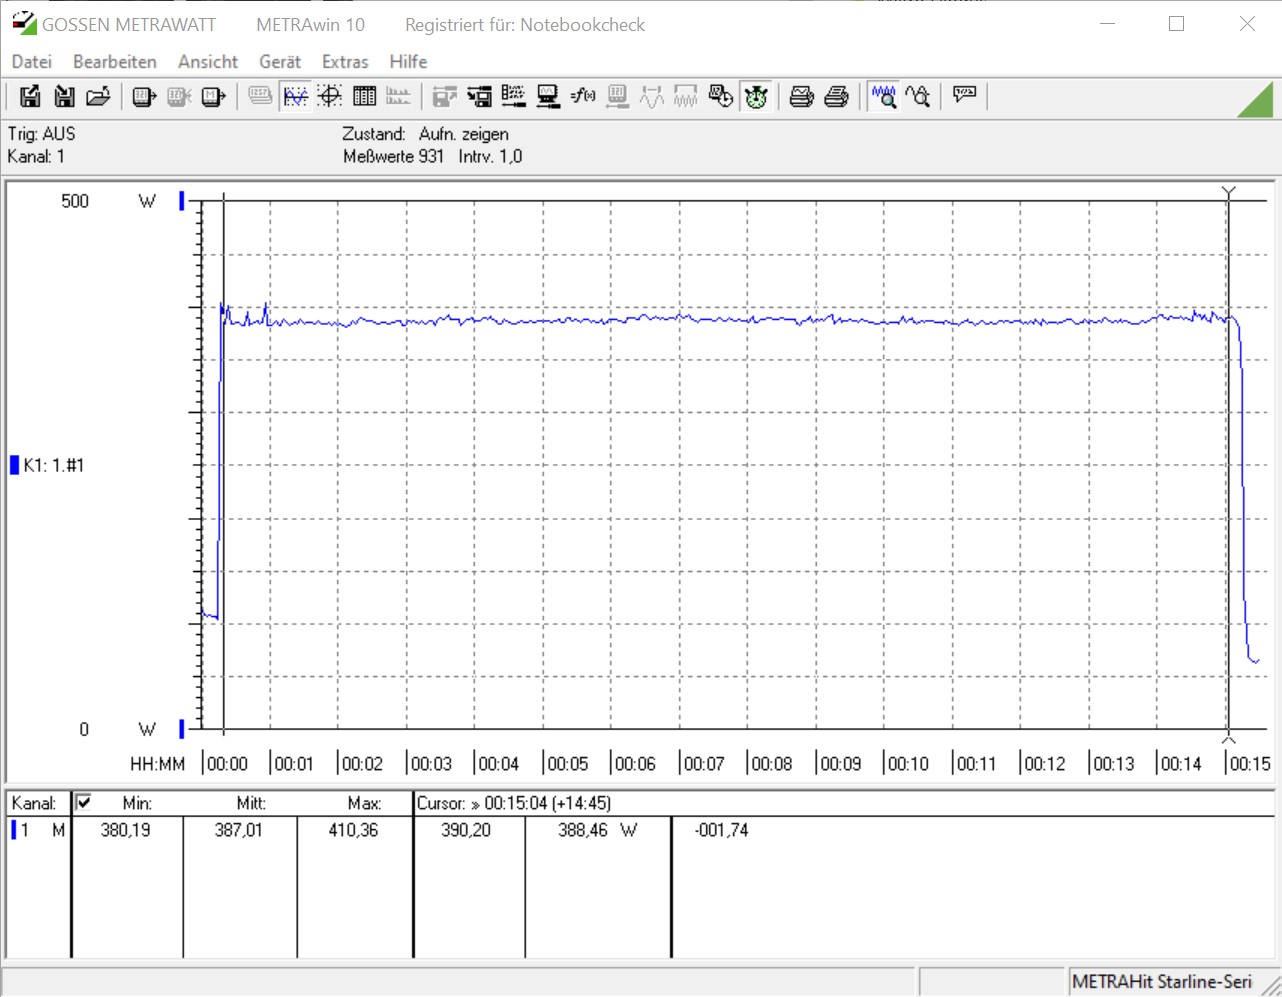
Beim Stresstest zeigte unser Messgerät knapp über 300 Watt an. Mit 387 Watt ist das System mit dem neuen Core i9 beim Spielen aber nochmals etwas durstiger. Überraschenderweise benötigte unser System mit dem Intel Core i5-11600K beim Spielen sogar noch etwas mehr Energie, was vermutlich auf eine höhere CPU-Last beim Spielen hindeutet. Der 8-Kerner scheint also das sparsamere Modell im Gaming-Betrieb zu sein - zumindest in unserem Test. Gegenüber dem AMD Ryzen 7 5800X steht der Intel Core i9-11900K aber gar nicht so schlecht dar, auch wenn auf dem Papier deutlich höhere maximale TDP steht. Die Temperaturen sind unter Last hoch, aber noch nicht in einem kritischen Bereich. Für unserer Tests verwendeten wir eine AiO mit einem 280 Millimeter-Radiator. Gute Luftkühler sollten also auch in der Lage sein, um den neuen 8-Kerner im Zaum zu halten.
| Power Consumption | |
| 1920x1080 The Witcher 3 ultra (external Monitor) | |
| Intel Core i5-11600K (Idle: 69.49 W) | |
| AMD Ryzen 7 5800X (Idle: 77.5 W) | |
| AMD Ryzen 5 5600X (Idle: 79.23 W) | |
| Intel Core i7-10700K (Idle: 67.7 W) | |
| Intel Core i9-10900K (Idle: 52.3 W) | |
| Intel Core i9-11900K (Idle: 57.3 W) | |
| Intel Core i5-10600K (Idle: 52.2 W) | |
| Prime95 V2810 Stress (external Monitor) | |
| Intel Core i9-11900K (Idle: 57.3 W) | |
| Intel Core i9-10900K (Idle: 52.3 W) | |
| AMD Ryzen 7 5800X (Idle: 77.5 W) | |
| Intel Core i5-11600K (Idle: 69.49 W) | |
| Intel Core i7-10700K (Idle: 67.7 W) | |
| Intel Core i5-10600K (Idle: 52.2 W) | |
| AMD Ryzen 5 5600X (Idle: 79.23 W) | |
| Cinebench R15 Multi (external Monitor) | |
| Intel Core i9-10900K (Idle: 52.3 W) | |
| Intel Core i9-11900K (Idle: 57.3 W) | |
| AMD Ryzen 7 5800X (Idle: 77.5 W) | |
| Intel Core i5-11600K (Idle: 69.49 W) | |
| Intel Core i7-10700K (Idle: 67.7 W) | |
| Intel Core i5-10600K (Idle: 52.2 W) | |
| AMD Ryzen 5 5600X (Idle: 79.23 W) | |
| Temperatures - CPU Temperature Prime95 | |
| Intel Core i9-11900K | |
| AMD Ryzen 7 5800X | |
| Intel Core i9-10900K | |
| Intel Core i5-11600K | |
| Intel Core i5-10600K | |
* ... kleinere Werte sind besser


Pro
Contra
Fazit - Nur noch 8 Kerne aber trotzdem schnell!

Mit Rocket Lake-S versucht Intel die Lücke zu AMD zu schließen. Teilweise gelingt es ihnen und an vielen Stellen sind die neuen Prozessoren auf Augenhöhe mit AMD. Dennoch sollte man nicht vergessen, dass Intel derzeit nur noch maximal 8 Kerne mit 16 Threads anbietet. AMD bietet im High-End-Bereich momentan sogar bis zu 16 Kerne an. Die meisten werden aber zu einer preiswerteren CPU greifen. Apropos preiswert, mit einer UVP von 629 Euro ist der Intel Core i9-11900K aber kein echtes Schnäppchen, denn der etwa gleichschnelle AMD Ryzen 7 5800X kostet ca. 200 Euro weniger. Deutlich interessanter ist der Intel Core i5-11600K, welche in den Spieletests etwa die gleiche Leistung bietet. Mit 299 Euro kostet dieser etwa genauso viel, wie der AMD Ryzen 5 5600X.
Der Intel Core i9-11900K ist eine sehr gute Gaming-CPU. Für die Krone hat es allerdings nicht ganz gereicht.
Wer von den Genannten das Rennen machen wird, wird sich in der Zukunft zeigen. Vielmehr wird aber auch wieder einmal die Verfügbarkeit der Komponenten eine Rolle spielen. Sollte es Intel schaffen ausreichende Stückzahlen liefern zu können, stehen die Chancen nicht schlecht. Dennoch sollte der Core i9-11900K deutlich im Preis sinken, um konkurrenzfähig zu sein. Wenn wir preislich den Ryzen 9 5900X als Gegenspieler nehmen, hinkt der 8 Kerner dem 12 Kerner deutlich hinterher. Leider ist der Intel Core i9-11900K auch gegenüber dem Intel Core i9-10900K nicht immer die Beste Wahl, denn die zwei fehlenden Kerne machen sich bei Multi-Thread-Anwendungen teilweise bemerkbar. Auch preislich seht der Vorgänger, welcher momentan für ca. 450 Euro zu bekommen ist, besser dar.
Abschließend lässt sich aber festhalten, dass es immer wieder erstaunlich ist, was Intel noch aus der schon relativ alten 14nm-Fertigung herausholt. Dabei hat man diesmal nicht nur Kleinigkeiten verändert, sondern ein komplett neues Modell für den Sockel 1200 entworfen. Im Hinterkopf sollten man aber haben, dass Rocket Lake die letzte CPU für den Sockel 1200 sein dürfte. Die nächste Generation wird mit einem komplett neuen Sockel 1700 daherkommen und den Gerüchten zufolge auch DDR5 unterstützen und dann sollten auch Desktop-User in den Genuss des 10nm-Prozess kommen.
