Intel Alder Lake-S im Test: Hat Intel wieder die schnellste Gaming CPU?


Mit Alder Lake-S hat sich Intel sehr viel vorgenommen. Jahrelang war Intel die Benchmark, wenn es um die schnellste Gaming-CPU geht, bis AMD mit seinen Ryzen 5000 durchstartete und die Spitze übernahm. Für den Endverbraucher hat dieses Katz- und Maus-Spiel viele Vorteile, denn Neuerungen gelangen so schneller in die breite Masse.
Mit der neuesten Intel Prozessoren für den Desktop-Bereich läutet Intel mit der 12. Generation der Core Serie wieder einen Wechsel der Plattform ein. LGA1200 ist schon nach Comet Lake-S und Rocket Lake-S Geschichte und der größere LGA 1700-Sockel tritt das Erbe an. Die bekanntesten Neuerungen sind der DDR5- und PCIe 5.0-Support. Gleichwohl gibt es aber zum jetzigen Zeitpunkt noch keine Produkte, die diese volle Bandbreite nutzen können. Somit ist die Investition in den Unterbau derzeit nur eine Investition, welche in der Zukunft nutzbar sein wird. Beim Arbeitsspeicher sieht es allerdings etwas besser aus. Wer auf den neuesten Zug aufspringen und die beste Performance bekommen möchte, kommt den neuen DDR5-Arbeitsspeicher nicht herum. Die Intel Alder Lake-S-Prozessoren unterstützen jedoch auch DDR4-RAM. Passenden Platinen werden auch mit dem neuen High-End-Chipsatz Z690 im Handel zu finden sein.
Mit Alder Lake-S macht Intel einen großen Schritt nach vorn und nicht nur einen kleinen Rocket Lake-S-Refresh. Das neue Design teilt sich in Performance-Kerne, sogenannte P-Cores und energieeffiziente Kerne, die E-Cores. Somit kann das Topmodell mit 24 Threads auftrumpfen. Diese errechnen sich aus 8 P-Cores samt Hyperthreading (HT) und 8 E-Cores (ohne HT). Beim kleineren Intel Core i5-12600K, den wir in diesem Review ebenfalls genau unter die Lupe genommen haben, sind es 6 P-Cores und 4 E-Cores, was in Summe 16 Threads ergibt. Durch die neuen E-Cores sollen die P-Cores entlastet werden, um genügend Rechenleistung für fordernde Anwendungen zu haben. Die E-Cores kümmern sich hingegen um die Hintergrundprozesse. Dabei sind diese aber keineswegs langsame Recheneinheiten, denn die Leistung der E-Cores liegt auf Skylake Niveau. Die optimale Zuteilung der Kerne übernimmt der Thread Director von Intel. Voraussetzung für die optimale Nutzung ist Windows 11 als Betriebssystem.
In der folgenden Tabelle haben wir einmal die wichtigsten Vertreter der neuen Alder Lake-S Familie für Sie zusammengetragen.
Die Core-Prozessoren der Alder Lake-S Serie im Überblick
| Modell | Kerne / Threads |
Takt P-Core / Turbo | Turbo 3.0 | Takt E-Core / Turbo | Cache L2 + L3 | Grafik | PBP | MTB | Preis (UVP) |
| Core i9-12900K | 16 (8P + 8E) /24 | 3,2 GHz / 5,1 GHz | 5,2 GHz | 2,4 GHz / 3,9 GHz | 14 + 30 MB | UHD 770 | 125 Watt | 241 Watt | $ 589 |
| Core i9-12900KF | 16 (8P + 8E) /24 | 3,2 GHz / 5,1 GHz | 5,2 GHz | 2,4 GHz / 3,9 GHz | 14 + 30 MB | - | 125 Watt | 241 Watt | $ 564 |
| Core i7-12700K | 12 (8P + 4E) /20 | 3,6 GHz / 4,9 GHz | 5,0 GHz | 2,7 GHz / 3,8 GHz | 12 + 25 MB | UHD 770 | 125 Watt | 190 Watt | $ 409 |
| Core i7-12700KF | 12 (8P + 4E) /20 | 3,6 GHz / 4,9 GHz | 5,0 GHz | 2,7 GHz / 3,8 GHz | 12 + 25 MB | - | 125 Watt | 190 Watt | $ 384 |
| Core i5-12600K | 10 (6P + 4E) /16 | 3,7 GHz / 4,9 GHz | - | 2,8 GHz / 3,6 GHz | 9,5 + 20 MB | UHD 770 | 125 Watt | 150 Watt | $ 289 |
| Core i5-12600KF | 10 (6P + 4E) /16 | 3,7 GHz / 4,9 GHz | - | 2,8 GHz / 3,6 GHz | 9,5 + 20 MB | - | 125 Watt | 150 Watt | $ 264 |
Details zu unserem Testsystem
Für die folgenden Benchmarks und Tests nutzen wir folgendes System:
- Raijintek Pean Benchtable
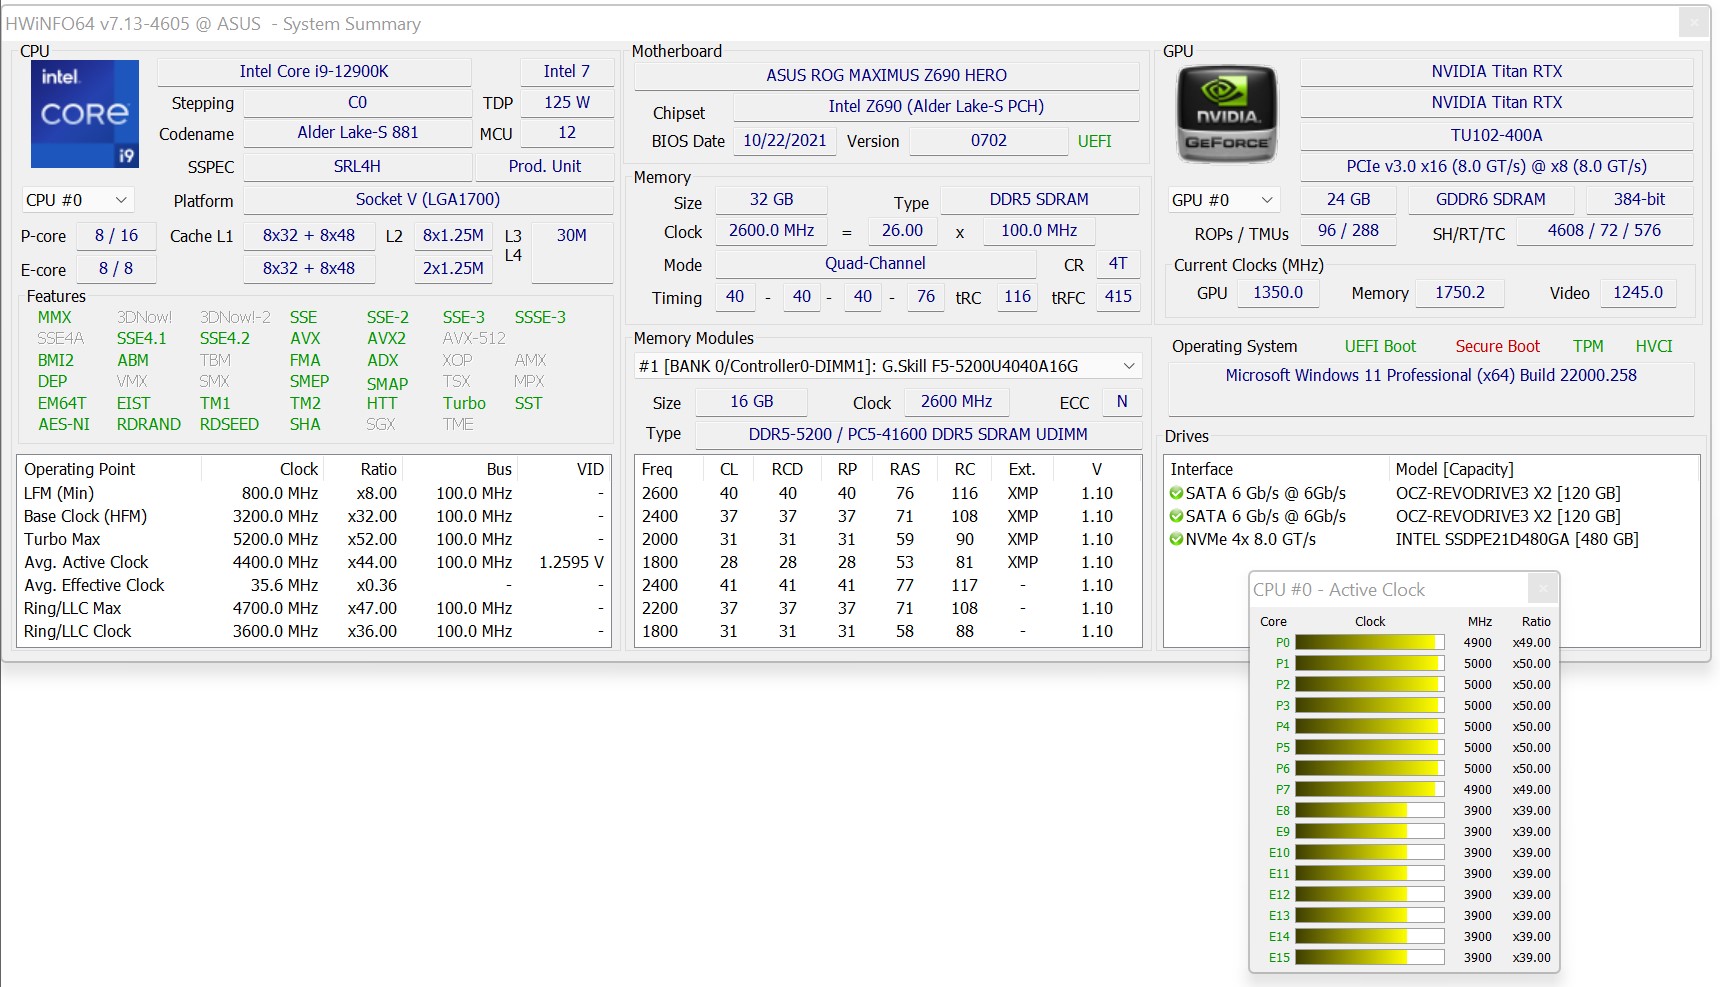
- Intel Core i9-12900K, Intel Core i5-12600K
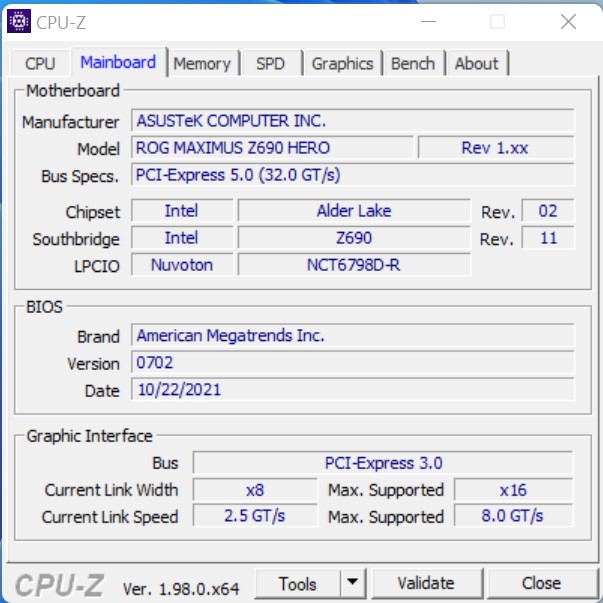
- Asus ROG Maximus Z690 Hero
- Alphacool Eisbear Aurora 280 AiO
- Nvidia Titan RTX
- Corsair HX 1200X Netzteil
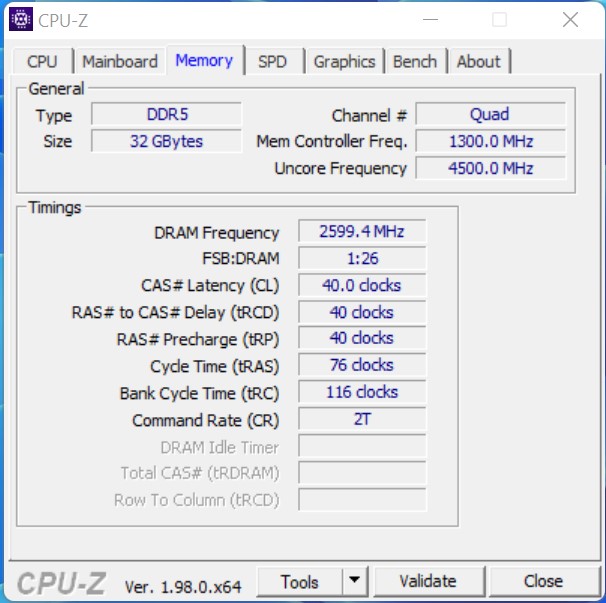
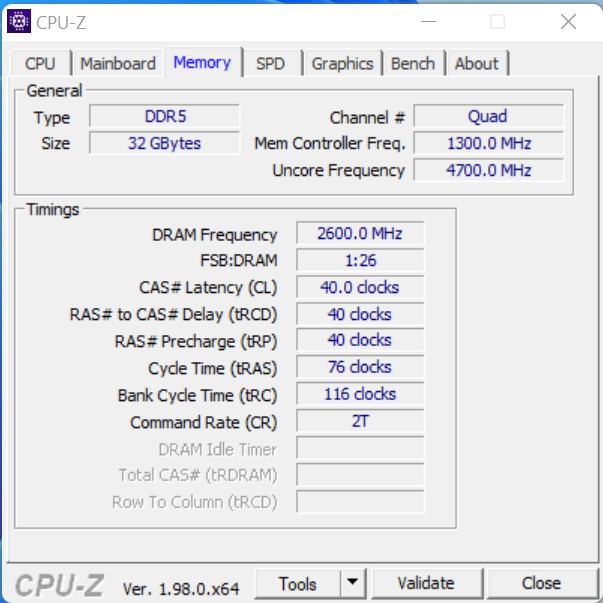
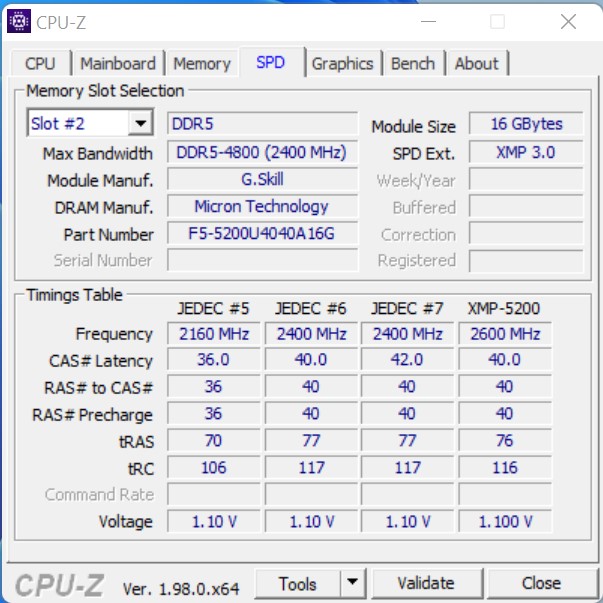
- G.Skill Ripjaws S5 (2x 16GB - DDR5-5200) / Corsair Vengeance (2x 16GB - DDR5-5200)
- Intel Optane 905p (480 GB System + Benchmarks)
- OCZ Revodrive (480 GB für Games)
- Microsoft Windows 11 Professional 64-Bit (Version 21H2)
Von Intel direkt kommen die beiden Prozessoren. G.Skill und auch Corsair haben uns mit dem brandaktuellen DDR5-Arbeitsspeicher ausgestattet und das neue Z690 Mainboard stammt direkt von Asus. Caseking unterstützt uns mit dem Raijintek Pean Showcase und als Kühlung nutzen wir die Alphacool Eisbear Aurora 280 AiO, welche wir von Alphacool zur Verfügung gestellt bekommen haben.
Wichtiger Hinweis:
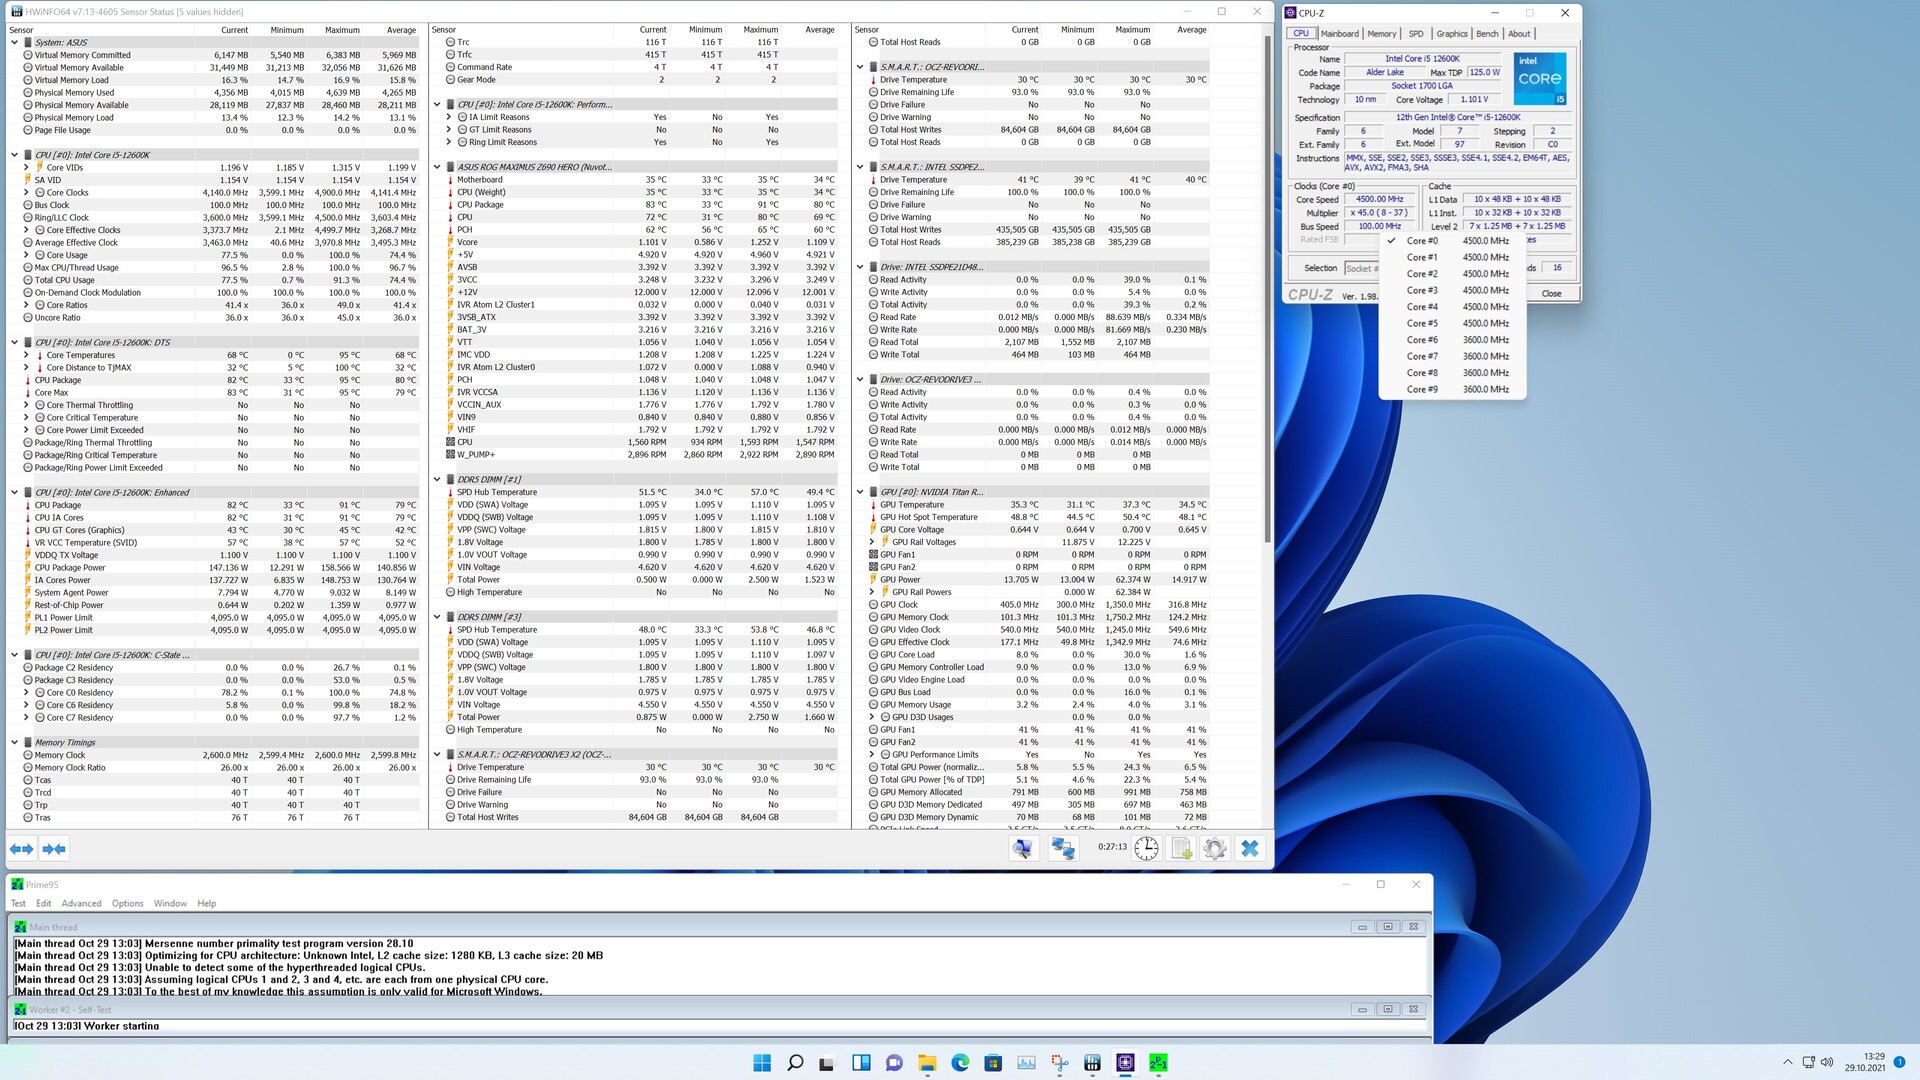
Alle durchgeführten Benchmarks wurden auf einem frisch installierten Windows 11 System durchgeführt. Die aktuellste Bios-Version wurde uns zuvor von Asus bereitgestellt. Wichtig zu wissen ist jedoch dass mit standard-Einstellungen PL1 = PL2 ist, was bedeutet, dass sich die CPU zu jeder Zeit und ohne Einschränkung die maximale Leistung nehmen darf. Für dieses Review haben wir die Standard-Settings übernommen.


Das Asus ROG Maximus Z690 Hero im Detail
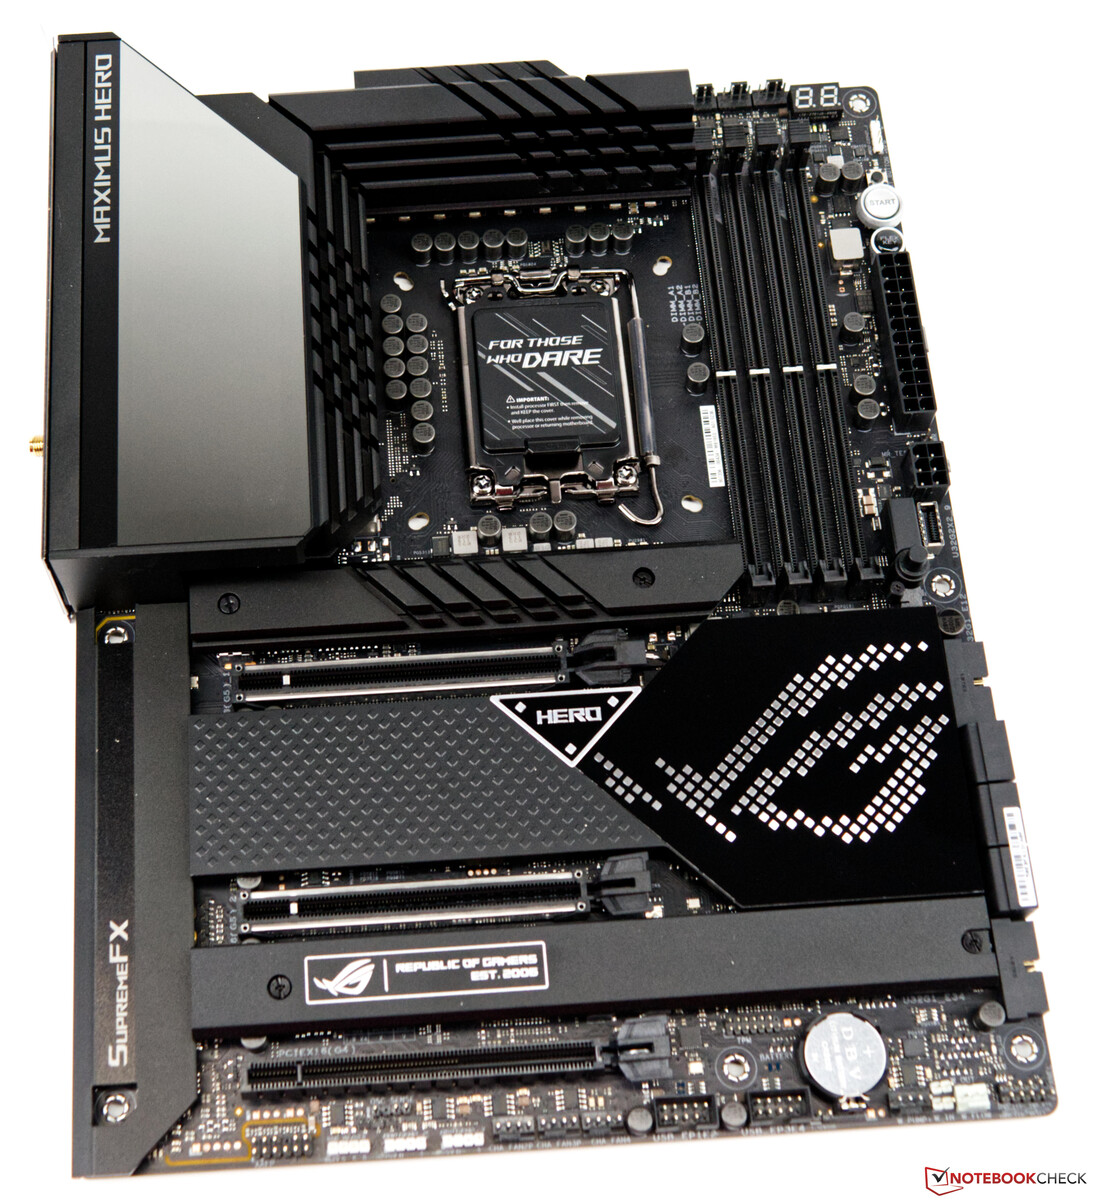
Asus hat uns rechtzeitig das ROG Maximus Z690 Hero bereitgestellt, welches als Unterbau für dieses Review dient. Für diese Leihgabe bedanken wir uns bei Asus Deutschland. Das Asus ROG Maximus Z690 Hero wirkt sehr massiv, was auf die großen Kühlkörper zurückzuführen ist. Insgesamt lassen sich bis zu fünf M.2-SSDs auf dem Mainboard unterbringen. Allerdings müssen zwei der fünf auf einer separaten Hyper M.2 Karte installiert werden. Diese kann die volle Bandbreite der Gen 5 Unterstützung nutzen und liegt als Zubehör im Karton. Der neue LGA 1700 Sockel sticht durch das etwas längliche Design hervor. Viele LGA 1200 Kühler sind auch mit dem neuen LGA 1700 Sockel kompatibel. Gleichwohl sollte man sich aber beim Hersteller direkt informieren. Teilweise werden andere Halterungen für LGA 1700 angeboten, um den optimalen Anpressdruck auf die CPU zu gewährleisten.
Auf dem Mainboard lassen sich bis zu 128 GB des neuen DDR5-Arbeitsspeichers installieren. WiFi, 2,5 GBit LAN und insgesamt 20 USB-Ports sorgen für ausreichend Konnektivität.
Die CPU wird über zwei 8-Pin-Strombuchsen unweit des Sockels mit Energie versorgt. Die Spannungswandler sind mit einem sehr massiven Kühlblock samt Heatpipe bedeckt. Außerdem befindet sich über dem I/O Shield ein schickes Polymo Lightning Panel, was als Hingucker die Blicke auf sich zieht.


Prozessor-Benchmarks


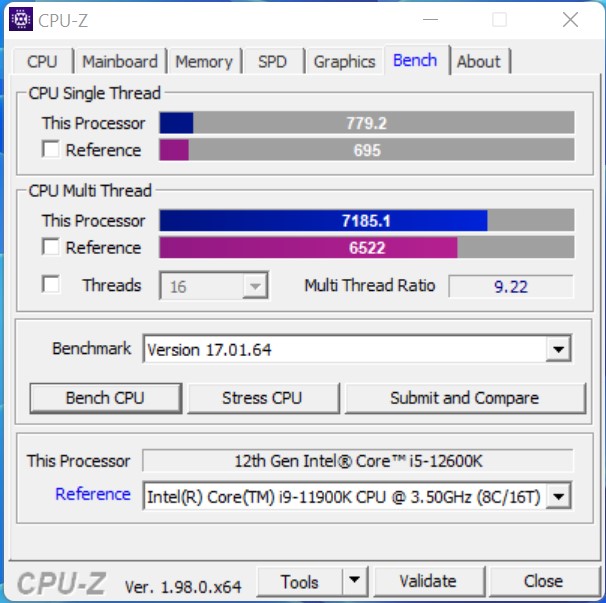
Verglichen mit den Rocket Lake-S Prozessoren kann Intel das Versprechen von einem deutlichen Leistungszuwachs einhalten. Im Performance Rating, was den Leistungsunterschied über alle aufgelisteten Benchmarks widerspiegelt kann sich der Intel Core i9-12900K klar an die Spitze setzen. Gegenüber dem AMD Ryzen 9 5900X, welcher ebenfalls in Summe über 24 Threads verfügt, kann sich das neuen Flaggschiff aus dem Hause Intel um 13 Prozentpunkte absetzen. Nehmen wir einmal den Intel Core i9-11900K als Referenz, so rechnet der Core i9-12900K 23 Prozent schneller. In den einzelnen Benchmarks schwanken die Unterschiede etwas, was aber auf die jeweilige CPU-Architektur zurückzuführen ist.
Beim kleineren Intel Core i5-12600K zeigt sich ein ähnliches Bild. Nehmen wir hier den AMD Ryzen 7 5800X als Gegenspieler aufgrund der gleichen Anzahl an Threads, so liegen die Kontrahenten bei den kumuliert Benchmarkergebnissen auf Augenhöhe. An die starke Single-Core-Leistung beißt sich der Zen3-Prozessor jedoch die Zähne aus. Abschreiben sollte man AMD allerdings nicht, denn die Zen3-CPUs sind schon ein Jahr auf dem Markt und ein Nachfolger steht laut der Gerüchteküche schon in den Startlöchern. Dann werden die Würfel neu gemischt und Rocket Lake-S muss sich erneut beweisen.
Aufgrund der PL1 = PL2 Diskussion haben wir uns einmal Cinebench R23 herausgesucht und einen erneuten Durchlauf mit einem limitierten PL1-Wert bei 125 Watt gemacht. Beim Ergebnis gab es keine nennenswerten Veränderungen. Die Schwankungen waren minimal und lassen sich als Messtoleranz verbuchen.
Dass Intel mit dem neuen Design der P- und E-Cores einen deutlichen Sprung machen würde war klar. Somit kann Intel auch die Lücke zu den 12- und 16-Kernern von AMD schließen. Das war mit dem Core i9-11900K nicht möglich.
Intel Core i5-12600K


Intel Core i9-12900K


* ... kleinere Werte sind besser
Alder Lake-S vs. Cinebench-R15-Multi-Schleife
Beim Belastungstest zeigen beide Testsamples eine sehr stabile Performance. Gegenüber dem Intel Core i9-11900K kann sich der Intel Core i9-12900K kontinuierlich und ohne Leistungseinbrüche mit durchschnittlich 3987 Punkten auf den ersten Platz schieben. Auch der Intel Core i5-12600K kann sich stabil und mit einem deutlichen Vorsprung vor dem Rocket Lake-S Pendant ala Intel Core i5-11600K platzieren. Die höhere Anzahl an nativen Rechenkernen sorgt unterm Strich für diesen Leistungsunterschied.
Synthetische Benchmarks und Anwendungsleistung
Bei den synthetischen Benchmarks geben die beiden neuen Alder Lake-S Prozessoren den Ton an. Bis auf wenige Ausnahmen, in denen vermeidlich AMD die bessere Platform bietet, kann sich der Intel Core i9-12900K einen soliden Vorsprung erarbeiten. So verwundert es nicht, dass bei den kumulierten Benchmarkergebnissen beide Alder Lake-S CPUs sich die vorderen Plätze teilen. Etwas überrascht waren wir aber dennoch, denn mit dem Intel Core i5-12600K hätten wir im Gesamtranking nicht mit dem zweiten Platz gerechnet.
Spiele Benchmarks
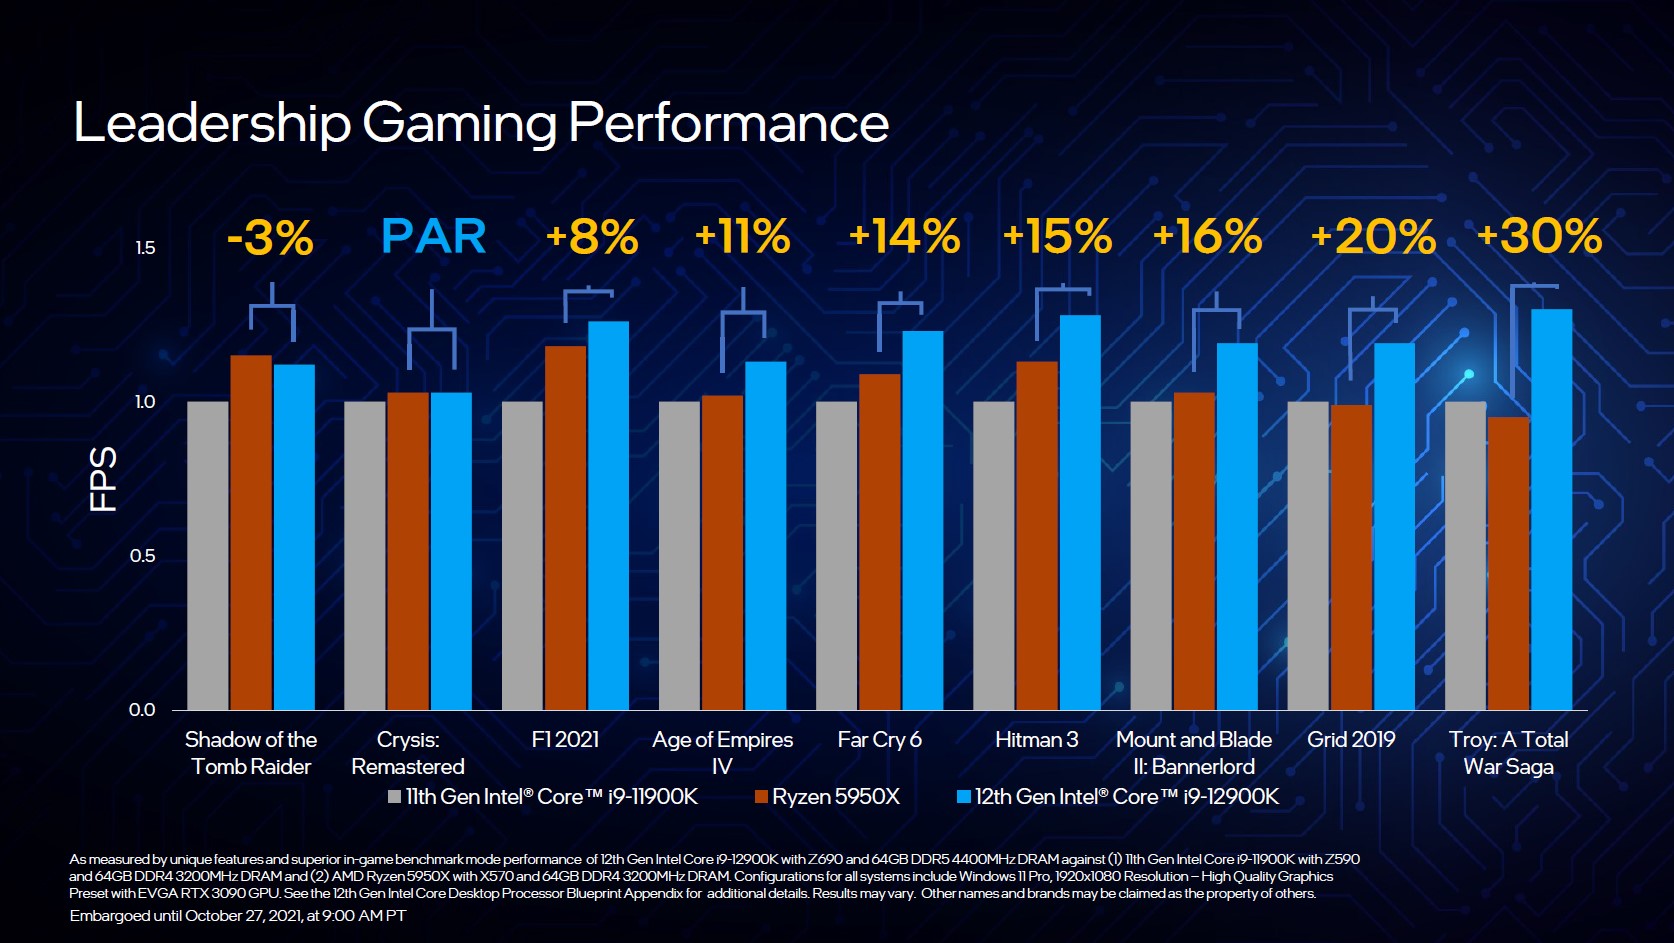

Kommen wir nun zu den interessantesten Benchmarks und zur Paradedisziplin der neuen Intel Alder Lake-S Prozessoren. Gegenüber Rocket Lake-S konnten die neuen Prozessoren deutlich an Performance zulegen, wie man den Spiele-Benchmarks entnehmen kann. Im kumulierten Vergleich der neun Spiele kann sich der Intel Core i9-12900K knapp vor dem AMD Ryzen 9 5900X schieben. Auch hier muss man wissen, dass es Spiele gibt, die besser mit Intel Prozessoren harmonieren und wiederum auch Spiele, die bessere Leistung mit AMD Prozessoren abliefern. Im internen Duell der beiden Alder Lake-S Prozessoren verliert der Intel Core i5-12600K acht Prozentpunkte auf das Flaggschiff und rangiert damit nur knapp vor dem Intel Core i5-11600K.
Nichtsdestotrotz liefern beide Prozessoren eine sehr gute Gaming-Performance. Aufgrund der vielen Neuerungen bei Plattform und Betriebssystem kann es sein, dass in Zukunft noch mit ein paar Leistungssteigerungen in Form von Updates zu erwarten sind. Eine Garantie gibt es dafür jedoch nicht. Die Leistung im reinen CPU-Limit ist sehr hoch und je nach Spiel auch deutlich vor der Konkurrenz. Dennoch muss man festhalten, dass Intel hier zwar die schnellste Gaming-CPU im Portfolio hat, aber ein überragender Abstand zu Zen3 ist nicht erkennbar. Zudem rücken alle Kontrahenten bei zunehmender Auflösung zusammen, sodass die CPU als ausschlaggebender FPS-Booster hinter der GPU nur noch die zweite Geige spielt. Wer nunmehr neben dem eigentlichen Spielen auch streamt, profitiert von der höheren Anzahl an Threads, was die neuen Modelle somit für Content-Creator sehr interessant macht.
| Performance Rating - Percent | |
| Intel Core i9-12900K | |
| AMD Ryzen 9 5900X -2! | |
| AMD Ryzen 7 5800X -2! | |
| AMD Ryzen 9 5950X -2! | |
| AMD Ryzen 5 5600X -2! | |
| Intel Core i9-11900K | |
| Intel Core i5-12600K | |
| Intel Core i5-11600K | |
| Intel Core i9-10900K | |
| Intel Core i7-10700K -4! | |
| Intel Core i5-10600K | |
| Forza Horizon 4 | |
| 1280x720 Very Low Preset | |
| Intel Core i9-12900K | |
| Intel Core i5-12600K | |
| Intel Core i9-11900K | |
| Intel Core i9-10900K | |
| Intel Core i5-11600K | |
| Intel Core i5-10600K | |
| 1920x1080 Ultra Preset AA:2xMS | |
| Intel Core i9-10900K | |
| Intel Core i9-11900K | |
| Intel Core i5-11600K | |
| Intel Core i5-10600K | |
| Intel Core i9-12900K | |
| Intel Core i5-12600K | |
Intel Core i9-12900K + Nvidia Titan RTX
| min. | mittel | hoch | max. | QHD | 4K | |
|---|---|---|---|---|---|---|
| GTA V (2015) | 187 | 187 | 185 | 135 | 123 | 138 |
| The Witcher 3 (2015) | 589 | 422 | 271 | 139 | 103 | |
| Dota 2 Reborn (2015) | 203.5 | 208.7 | 201.7 | 189.7 | 178.9 | |
| Final Fantasy XV Benchmark (2018) | 227 | 195 | 144 | 108 | 64.1 | |
| X-Plane 11.11 (2018) | 200 | 176 | 137 | 117 | ||
| Far Cry 5 (2018) | 220 | 191 | 178 | 167 | 145 | 83 |
| Strange Brigade (2018) | 593 | 371 | 308 | 266 | 197 | 115 |
| Shadow of the Tomb Raider (2018) | 221 | 192 | 183 | 169 | 124 | 69.3 |
| Forza Horizon 4 (2018) | 293 | 227 | 216 | 178 | 153 | 111 |
| Far Cry New Dawn (2019) | 188 | 162 | 154 | 140 | 129 | 84 |
| Borderlands 3 (2019) | 202 | 172 | 147 | 124 | 89.9 | 49.2 |
| F1 2020 (2020) | 432 | 343 | 303 | 213 | 167 | 101 |
| F1 2021 (2021) | 491 | 383 | 307 | 160 | 121 | 71.9 |
| Far Cry 6 (2021) | 185 | 157 | 142 | 134 | 109 | 64 |
Intel Core i5-12600K + Nvidia Titan RTX
| min. | mittel | hoch | max. | QHD | 4K | |
|---|---|---|---|---|---|---|
| GTA V (2015) | 186 | 185 | 181 | 124 | 115 | 136 |
| The Witcher 3 (2015) | 500 | 406 | 277 | 144 | 107 | |
| Dota 2 Reborn (2015) | 183.7 | 188 | 181.1 | 174.9 | 165.8 | |
| Final Fantasy XV Benchmark (2018) | 218 | 192 | 141 | 107 | 63.6 | |
| X-Plane 11.11 (2018) | 172 | 153 | 119 | 104 | ||
| Far Cry 5 (2018) | 200 | 174 | 165 | 154 | 140 | 81 |
| Strange Brigade (2018) | 489 | 352 | 301 | 262 | 196 | 114 |
| Shadow of the Tomb Raider (2018) | 195 | 176 | 172 | 163 | 124 | 70.1 |
| Forza Horizon 4 (2018) | 263 | 218 | 212 | 178 | 154 | 112 |
| Far Cry New Dawn (2019) | 171 | 147 | 141 | 126 | 121 | 84 |
| Metro Exodus (2019) | 227 | 174 | 135 | 108 | 87.7 | 56.6 |
| Borderlands 3 (2019) | 175 | 155 | 138 | 119 | 90.4 | 49.8 |
| F1 2020 (2020) | 340 | 291 | 288 | 216 | 168 | 103 |
| F1 2021 (2021) | 407 | 367 | 302 | 160 | 122 | 72.6 |
| Far Cry 6 (2021) | 164 | 136 | 129 | 124 | 105 | 64 |
Energieverbrauch und Temperatur


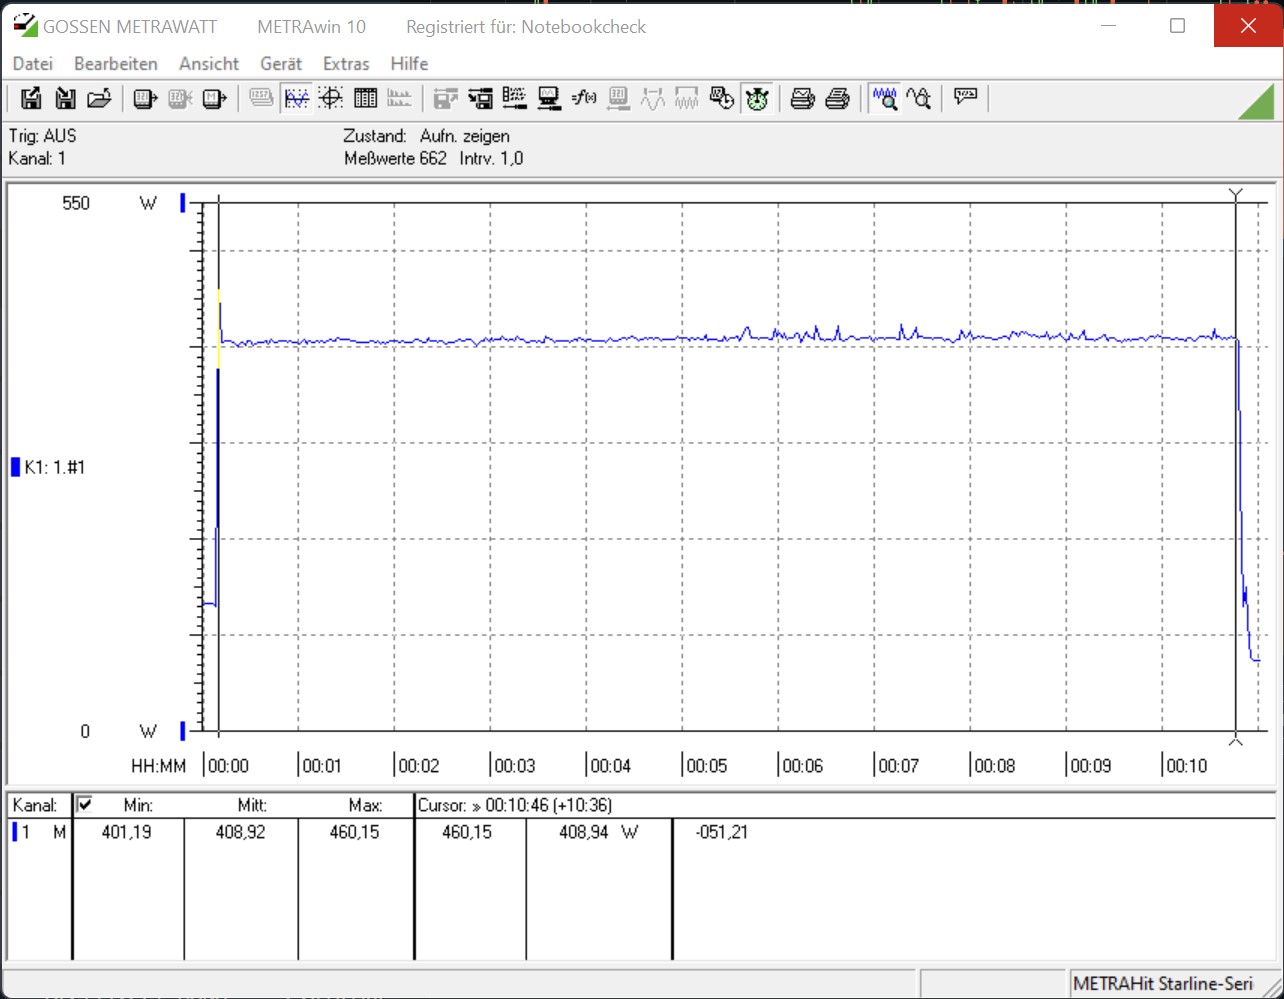
Laut den technischen Daten bieten die Prozessoren eine TDP von 125 Watt. Dabei bezieht man sich auf den PL1-Wert. Der PL2-Wert gibt an, wie viel Watt der Prozessor unter Volllast verbrauchen darf, wenn alle Voraussetzungen erfüllt sind. Mit maximal 241 Watt ist der Intel Core i9-12900K etwas sparsamer als der Intel Core i9-11900K. Im Test war das Alder Lake-S Flaggschiff tatsächlich nur beim Prime95 Stresstest etwas sparsamer als der Vorgänger. Dennoch zeigte unser Messgerät knapp 280 Watt für das gesamte System. Beim Cinebench-R15-Multi-Test verbrauchte unser Testsystem knapp 25 Prozent mehr Energie. Ein Zuwachs, der nicht so einfach von der Hand zuweisen ist. Beim Intel Core i5-12600K ist der PL2-Wert bei 150 Watt gedeckelt, was sich auch in unseren Messergebnissen widerspiegelt. Gegenüber dem Intel Core i5-11600K ist der Intel Core i5-12600K 7 Prozent sparsamer. Beim Stresstest wendet sich allerdings das Blatt und der Core i5-12600K zieht 13 Prozent mehr Energie aus der Steckdose. Die Messwerte beim Spielen werden natürlich von der Nvidia Titan RTX in die Höhe getrieben. Aber auch hier zeigt sich, dass die Alder Lake-S Plattform nicht zum Stromsparen einlädt.
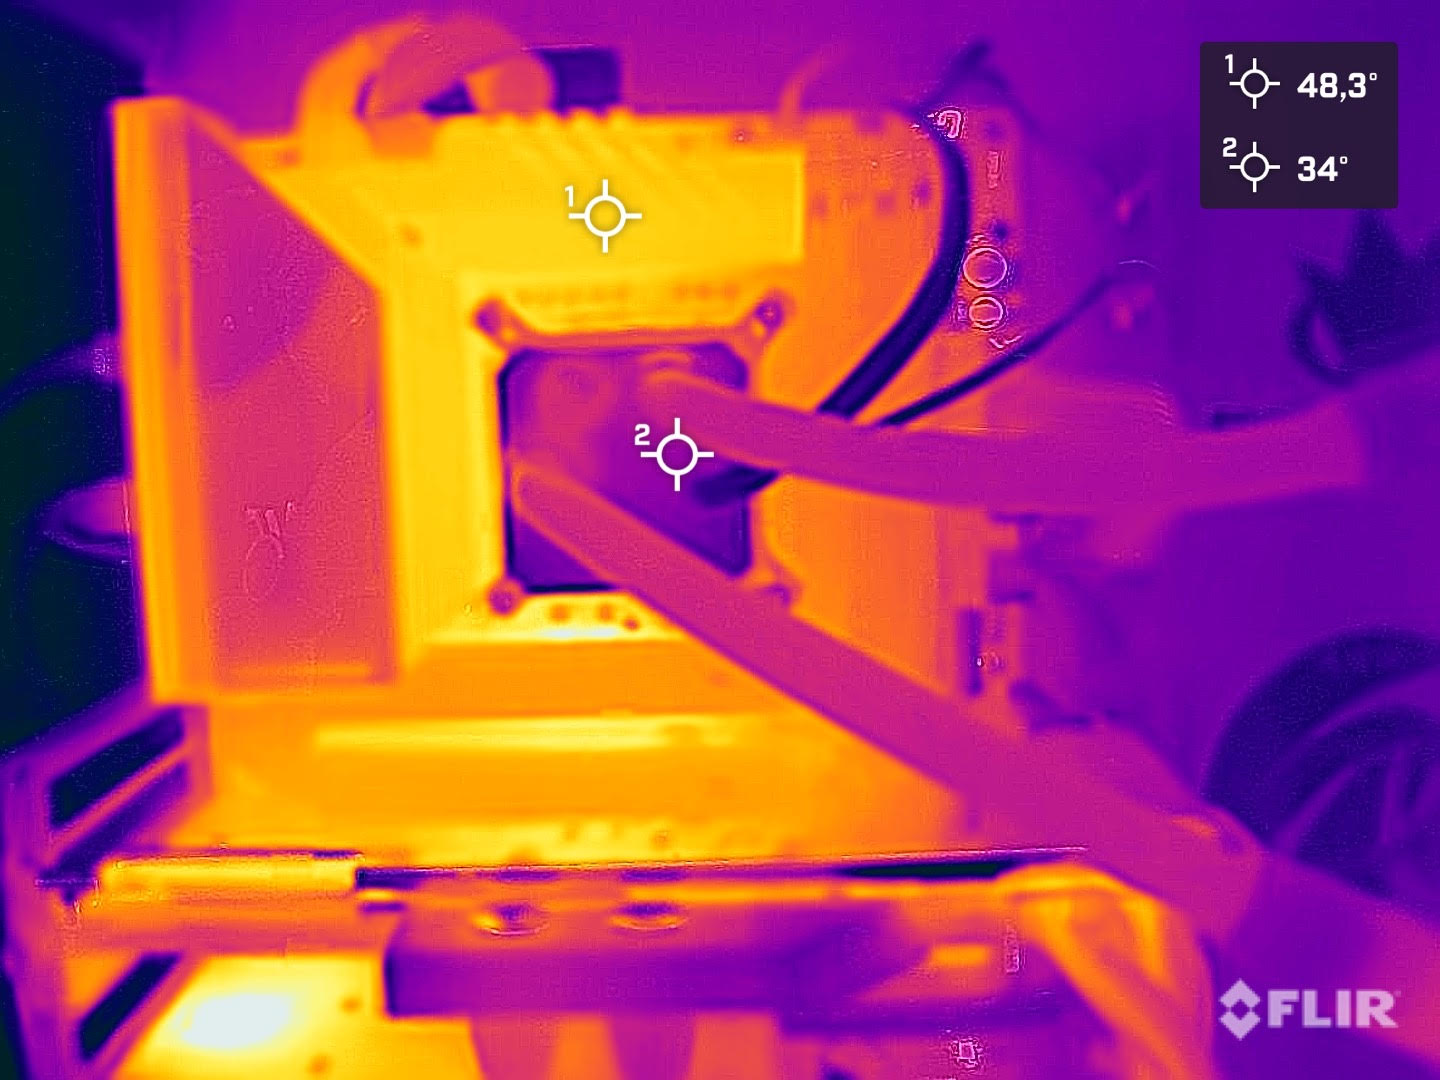
Bei den ermittelten Temperaturen zeigte sich, dass schon einige Minuten nach dem Start von Prime95 der Intel Core i9-12900K die 100 °C erreichte. Im weiteren Verlauf des Stresstestes musste die CPU dann runter getaktet werden, damit diese nicht beschädigt wird. Hier rächt sich das PL1 = PL2 Setting im Bios. Ein Throttling unter Last konnten wir jedoch bei der Cinebench-R15-Multi-Schleife nicht feststellen. Um eine falsche Installation des Kühlers auszuschließen, haben wir diesen einmal demontiert und neu aufgesetzt. Das Ergebnis im Anschluss war jedoch dasselbe. Auch Alphacool haben wir kontaktiert, um eine Inkompatibilität des verwendeten Kühlers auszuschließen. Laut Herstellerangaben ist die verwendete Alphacool Eisbear Aurora 280 AiO mit dem Sockel LGA 1700 kompatibel. Der Intel Core i5-12600K ließ sich unter Last etwas besser kühlen. Gleichwohl notieren wir auch hier eine maximale Temperatur von 95 °C.
Wer also einen Intel Core i9-12900K nutzen möchte, sollte eine sehr leistungsstarke Kühlung verwenden, um das bestmögliche aus dem Prozessor herauszuholen.
| Power Consumption | |
| 1920x1080 The Witcher 3 ultra (external Monitor) | |
| Intel Core i9-12900K (Idle: 70.5 W) | |
| AMD Ryzen 9 5950X (Idle: 78 W) | |
| AMD Ryzen 9 5900X (Idle: 78.1 W) | |
| Intel Core i5-11600K (Idle: 69.49 W) | |
| AMD Ryzen 7 5800X (Idle: 77.5 W) | |
| AMD Ryzen 5 5600X (Idle: 79.23 W) | |
| Intel Core i5-12600K (Idle: 70.45 W) | |
| Intel Core i7-10700K (Idle: 67.7 W) | |
| Intel Core i9-10900K (Idle: 52.3 W) | |
| Intel Core i9-11900K (Idle: 57.3 W) | |
| Intel Core i5-10600K (Idle: 52.2 W) | |
| Prime95 V2810 Stress (external Monitor) | |
| Intel Core i9-11900K (Idle: 57.3 W) | |
| Intel Core i9-12900K (Idle: 70.5 W) | |
| Intel Core i9-10900K (Idle: 52.3 W) | |
| Intel Core i5-12600K (Idle: 70.45 W) | |
| AMD Ryzen 9 5950X (Idle: 78 W) | |
| AMD Ryzen 7 5800X (Idle: 77.5 W) | |
| AMD Ryzen 9 5900X (Idle: 78.1 W) | |
| Intel Core i5-11600K (Idle: 69.49 W) | |
| Intel Core i7-10700K (Idle: 67.7 W) | |
| Intel Core i5-10600K (Idle: 52.2 W) | |
| AMD Ryzen 5 5600X (Idle: 79.23 W) | |
| Cinebench R15 Multi (external Monitor) | |
| Intel Core i9-12900K (Idle: 70.5 W) | |
| Intel Core i9-10900K (Idle: 52.3 W) | |
| Intel Core i9-11900K (Idle: 57.3 W) | |
| AMD Ryzen 9 5900X (Idle: 78.1 W) | |
| AMD Ryzen 9 5950X (Idle: 78 W) | |
| AMD Ryzen 7 5800X (Idle: 77.5 W) | |
| Intel Core i5-11600K (Idle: 69.49 W) | |
| Intel Core i7-10700K (Idle: 67.7 W) | |
| Intel Core i5-12600K (Idle: 70.45 W) | |
| Intel Core i5-10600K (Idle: 52.2 W) | |
| AMD Ryzen 5 5600X (Idle: 79.23 W) | |
| Temperatures - CPU Temperature Prime95 | |
| Intel Core i9-11900K | |
| AMD Ryzen 7 5800X | |
| Intel Core i9-10900K | |
| Intel Core i5-11600K | |
| AMD Ryzen 9 5900X | |
| Intel Core i5-10600K | |
| AMD Ryzen 9 5950X | |
* ... kleinere Werte sind besser


Pro
Contra
Fazit - Mit insgesamt 24 Threads zurück an die Spitze
Mit Ader Lake-S gelingt es Intel tatsächlich wieder, die schnellste Gaming-CPU zu haben, zumindest vorerst. Aber damit nicht genug. Alder Lake-S ist nicht nur wieder ein aufgemotzter Last-Gen-Prozessor, so wie wir es schon öfter erlebt haben. Nein, denn hinter der neuen Architektur verbergen sich sehr vielen Neuerungen. Viele dieser kennt man aus dem mobilen Bereich, denn in Smartphones und Tablets gibt es schon seit Jahren Prozessoren mit Performance-Kernen uns Stromspar-Kernen. Dieses macht sich Intel nun auch bei seinem aktuellen Desktop-Lineup zunutze und steigert damit die Multi-Core-Leistung drastisch. In Summer kommt der Intel Core i9-12900K somit auf 24 Threads, die parallel verarbeitet werden können. Damit aber nicht genug, denn auch die IPC wurde ordentlich verbessert, wovon Spiele enorm profitieren.
Auch der Unterbau ändert sich komplett und ein einfaches Upgrade von Rocket Lake-S geht nicht ohne den Mainboardtausch vonstatten. Das sollte man unbedingt in die Kostenkalkulation mit einfließen lassen. Apropos Kosten, die UVP liegt bei 589 USD und aktuell gibt es Angebote ab 659 Euro. Je nach Verfügbarkeit könnte es hier, wie auch bei den Grafikkarten, zu einem Preisanstieg kommen. Der etwas schwächere, aber trotzdem sehr schnelle Intel Core i5-12600K startet laut Intel mit einer UVP von 289 USD. Nach ersten Recherchen gibt es das Modell bereits ab 319 Euro im Handel. Ein attraktiver Preis, den auch AMD momentan nicht schlagen kann. Der vergleichbare AMD Ryzen 7 5800X kostet derzeit 379 Euro. Beim Topmodell sieht es etwas anders aus. Hier ist der AMD Ryzen 9 5900X mit 519 Euro deutlich preiswerter.
Der Intel Core i9-12900K ist eine sehr gute Gaming-CPU mit Reserven für die Zukunft. Mit der schnellsten Gaming-CPU am Mark kann sich Intel vorerst auf die Schulter klopfen.
Damit der Intel Core i9-12900K aber konkurrenzfähig ist, sollte der Preis allerdings sinken, denn wie schon erwählt muss zwangsläufig auch ein neues Mainboard und unter Umständen auch in neuen Arbeitsspeicher investiert werden, wenn es denn DDR5 sein soll. Gut finden wir allerdings auch die Option weiterhin DDR4 verwenden zu können. Dazu bieten die Mainbordhersteller spezielle Modelle mit DDR4-RAM an. Ob diesen dann allerdings auch Raptor Lake-S unterstützen werden, steht momentan leider in den Sternen.
Etwas enttäuscht waren wir beim Energieverbrauch. Natürlich wurde die Leistung drastisch verbessert und das Verhältnis zum etwas höheren Energieverbrauch ist dabei überschaubar. Aber es wäre doch toll gewesen, diesen Leistungsschub mit einem spürbar geringeren Energieverbrauch zu koppeln. Damit würde man auch die Kühlproblematik etwas in den Griff bekommen.
Wer jetzt schon zuschlagen möchte, kann den Intel Core i5-12600K bei Amazon für 349 Euro ergattern. Den Intel Core i9-12900K kann hingegen bei notebooksbilliger.de für 699 Euro vorbestellt werden.
