Notebookcheck Logo

Intel Core i7-7700 vs Intel Core i3-N305

Intel Core i7-7700

► remove from comparison

Der Intel Core i7-7700 ist ein High-End Quad-Core Desktop-Prozessor auf Basis der Kaby-Lake-Architektur, der im August 2015 vorgestellt wurde. Die in einem verbesserten 14-Nanometer-Prozess gefertigte CPU taktet mit 3,6 bis 4,2 GHz und kann dank Hyper-Threading bis zu 8 Threads parallel bearbeiten. Er ist das schnellste Modell der Kaby-Lake Familie (zum Launch) mit einem TDP von 65 Watt. Die schnelleren Modelle, wie der i7-7700K, sind mit 91 Watt spezifiziert.

Grafikeinheit

Für Grafikberechnungen zeigt sich die im Prozessor integrierte Intel HD Graphics 630 mit 24 EUs (Execution Units) verantwortlich, die mit 350 - 1150 MHz taktet. Die Leistung ist vergleichbar mit der alten Intel HD Graphics 530 und siedelt sich daher im absoluten Low-End-Bereich an, sodass aktuelle Spiele allenfalls in niedrigen Einstellungen flüssig dargestellt werden.

Intel Core i3-N305

► remove from comparison Intel i3-N305

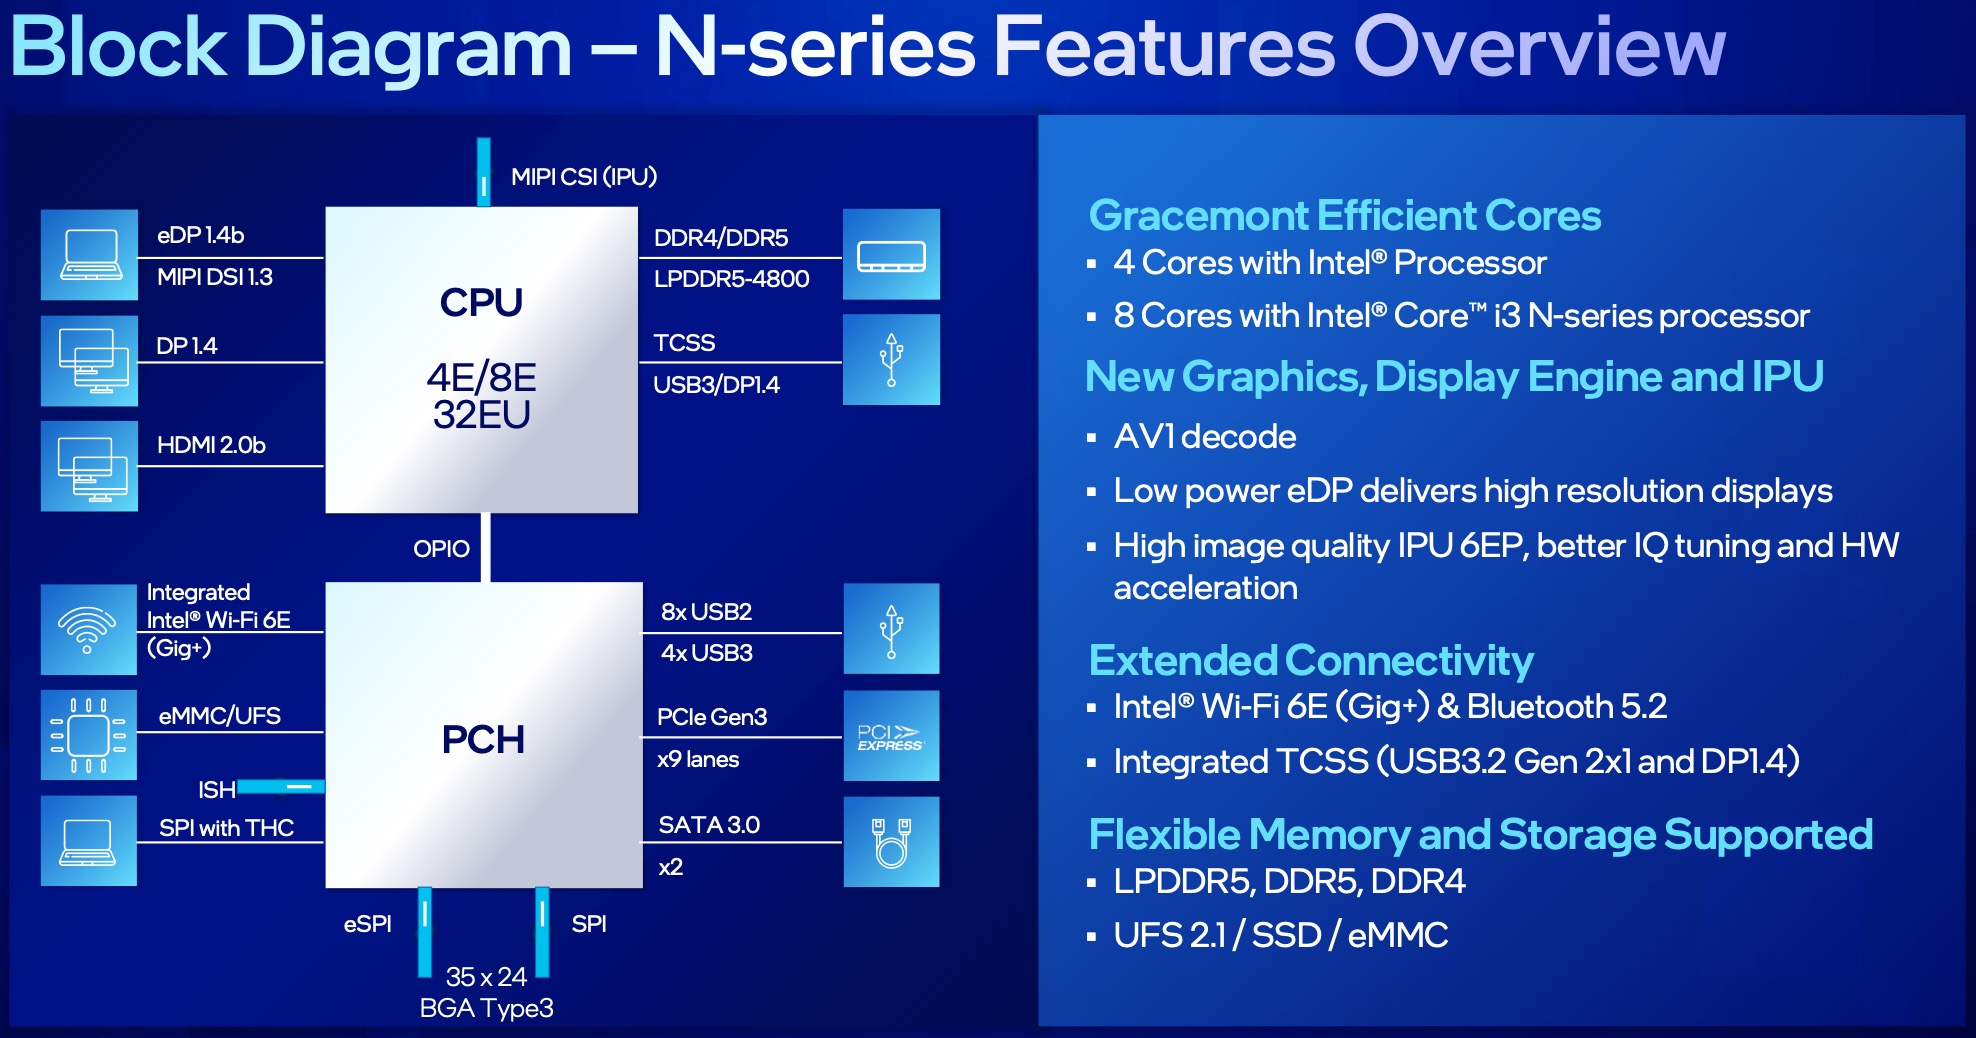
Der Intel Core i3-N305 ist eine Notebook-CPU der Einstiegsklasse der Alder Lake-N Serie. Er wurde im Januar 2023 vorgestellt und bietet 8 Effizienzkerne (E-Kerne, Gracemont Architektur) mit bis zu 3,8 GHz (3 GHz Multi-Core-Turbo). Die E-Kerne unterstützen kein HyperThreading und sollen eine vergleichbare Performance wie alte Skylake Kerne bieten (z.B. i7-6300HQ). Der i3 bietet keinerlei vPro Management Features.

Performance

Die Performance des i3 ist stark abhängig von der Kühlung und den TDP Settings. Wenn alle 8 Kerne ausgelastet werden, sollte er eine gute Multi-Thread-Performance bieten (deutlich oberhalb der alten Quad-Core CPUs wie ein i5-8260U. Die Einzelkernperformance ist aber aufgrund der fehlenden P-Kerne in Alder Lake-N eingeschränkt.

Grafikeinheit

Alder Lake-N integriert eine Xe basierende Grafikeinheit mit bis zu 32 EUs (Execution Units). Diese sind alle im i3-N305 aktiviert und takten bis 1,25 GHz. Durch die geringe Kernanzahl und die Einschränkung auf Single-Channel-RAM, ist die Spieleleistung aber deutlich eingeschränkt.

Features

Der kleine Alder-Lake-N-Chip integriert teilweise Wi-Fi 6E und Bluetooth 5.2 (im PCH). Der integrierte Speicherkontroller unterstützt Single-Channel DDR4-3200, DDR5-4800 und LPDDR5-4800. Die Media Engine Quick Sync kann nun auch AV1 dekodieren (wie bei Alder Lake). Für die externe Anbindung von Peripherie unterstützt der PCH PCIe Gen3 x9.

Leistungsaufnahme

Der i3-N305 ist mit 15 Watt (PL1) TDP (cTDP-down 9 Watt, dann nur 1 GHz Basistakt) spezifiziert. Gefertigt wird der Prozessor im verbesserten Intel 7 Prozess (10 nm SuperFin).

ModelIntel Core i7-7700Intel Core i3-N305
SeriesIntel Kaby LakeIntel Alder Lake-N
CodenameKaby LakeAlder Lake-N
Serie: Alder Lake-N Alder Lake-N
Intel Core i7-7700K compare4.2 - 4.5 GHz4 / 8 cores8 MB L3
Intel Core i7-7700 « 3.6 - 4.2 GHz4 / 8 cores8 MB L3
Intel Xeon E3-1535M v6 compare3.1 - 4.2 GHz4 / 8 cores8 MB L3
Intel Core i7-7920HQ compare3.1 - 4.1 GHz4 / 8 cores8 MB L3
Intel Core i7-7700T compare2.9 - 3.8 GHz4 / 8 cores8 MB L3
Intel Core i5-7600K compare3.8 - 4.2 GHz4 / 4 cores8 MB L3
Intel Xeon E3-1505M v6 compare3 - 4 GHz4 / 8 cores8 MB L3
Intel Core i7-7820HQ compare2.9 - 3.9 GHz4 / 8 cores8 MB L3
Intel Core i7-7820HK compare2.9 - 3.9 GHz4 / 8 cores8 MB L3
Intel Core i7-7700HQ compare2.8 - 3.8 GHz4 / 8 cores6 MB L3
Intel Core i5-7500 compare3.4 - 3.8 GHz4 / 4 cores6 MB L3
Intel Core i5-7440HQ compare2.8 - 3.8 GHz4 / 4 cores6 MB L3
Intel Core i7-7567U compare3.5 - 4 GHz2 / 4 cores4 MB L3
Intel Core i7-7660U compare2.5 - 4 GHz2 / 4 cores4 MB L3
Intel Core i7-7600U compare2.8 - 3.9 GHz2 / 4 cores4 MB L3
Intel Core i5-7300HQ compare2.5 - 3.5 GHz4 / 4 cores6 MB L3
Intel Core i5-7500T compare2.7 - 3.3 GHz4 / 4 cores6 MB L3
Intel Core i5-7287U compare3.3 - 3.7 GHz2 / 4 cores4 MB L3
Intel Core i7-7560U compare2.4 - 3.8 GHz2 / 4 cores4 MB L3
Intel Core i5-7267U compare3.1 - 3.5 GHz2 / 4 cores4 MB L3
Intel Core i5-7360U compare2.3 - 3.6 GHz2 / 4 cores4 MB L3
Intel Core i7-7500U compare2.7 - 3.5 GHz2 / 4 cores4 MB L3
Intel Core i5-7300U compare2.6 - 3.5 GHz2 / 4 cores3 MB L3
Intel Core i5-7260U compare2.2 - 3.4 GHz2 / 4 cores4 MB L3
Intel Core i5-7200U compare2.5 - 3.1 GHz2 / 4 cores3 MB L3
Intel Core i3-7100H compare3 GHz2 / 4 cores3 MB L3
Intel Core i3-7167U compare2.8 GHz2 / 4 cores3 MB L3
Intel Core i7-7Y75 compare1.3 - 3.6 GHz2 / 4 cores4 MB L3
Intel Core i5-7Y57 compare1.2 - 3.3 GHz2 / 4 cores4 MB L3
Intel Core i5-7Y54 compare1.2 - 3.2 GHz2 / 4 cores4 MB L3
Intel Core i3-7100U compare2.4 GHz2 / 4 cores3 MB L3
Intel Core m3-7Y32 compare1 - 3 GHz2 / 4 cores4 MB L3
Intel Pentium Gold 4415U compare2.3 GHz2 / 4 cores2 MB L3
Intel Core m3-7Y30 compare1 - 2.6 GHz2 / 4 cores4 MB L3
Intel Celeron 3965U compare2.2 GHz2 / 2 cores2 MB L3
Intel Core i3-7020U compare2.3 GHz2 / 4 cores3 MB L3
Intel Celeron 3867U compare1.8 GHz2 / 2 cores2 MB L3
Intel Celeron 3865U compare1.8 GHz2 / 2 cores2 MB L3
Intel Pentium Gold 4425Y compare1.7 GHz2 / 4 cores2 MB L3
Intel Pentium Gold 4415Y compare1.6 GHz2 / 4 cores2 MB L3
Intel Pentium Gold 4410Y compare1.5 GHz2 / 4 cores2 MB L3
Intel Celeron 3965Y compare1.5 GHz2 / 2 cores2 MB L3
Intel Core i3-N305 « 1.8 - 3.8 GHz8 / 8 cores6 MB L3
Intel Core i3-N300 compare - 3.8 GHz8 / 8 cores6 MB L3
Intel Processor N200 compare1 - 3.7 GHz4 / 4 cores6 MB L3
Intel Processor N97 compare - 3.6 GHz4 / 4 cores6 MB L3
Intel Processor N95 compare - 3.4 GHz4 / 4 cores6 MB L3
Intel Processor N100 compare1 - 3.4 GHz4 / 4 cores6 MB L3
Intel Processor N50 compare1 - 3.4 GHz2 / 2 cores6 MB L3
Clock3600 - 4200 MHz1800 - 3800 MHz
L1 Cache256 KB768 KB
L2 Cache1 MB4 MB
L3 Cache8 MB6 MB
Cores / Threads4 / 88 / 8
8 x 3.8 GHz Intel Gracemont E-Core
TDP65 Watt15 Watt
Technology14 nm10 nm
SocketFCLGA1151BGA1264
FeaturesDDR3(L)-1600/DDR4-2400 Memory Controller, HyperThreading, AVX, AVX2, AES-NI, TSX-NI, Quick Sync, Virtualization, vProDDR4-3200/DDR5-4800/LPDDR5-4800 RAM (sin. chan.), PCIe 3, GNA, MMX, SSE, SSE2, SSE3, SSSE3, SSE4.1, SSE4.2, AVX, AVX2, BMI2, ABM, FMA, ADX, VMX, SMEP, SMAP, EIST, TM1, TM2, Turbo, SST, AES-NI, RDRAND, RDSEED, SHA
iGPUIntel HD Graphics 630 (350 - 1150 MHz)Intel UHD Graphics 32EUs (Alder Lake) (1000 - 1250 MHz)
Architecturex86x86
$303 U.S.
Announced
Manufacturerark.intel.comark.intel.com
max. Temp.105 °C

Benchmarks

Performance Rating - CB R15 + R20 + 7-Zip + X265 + Blender + 3DM11 CPU - i3-N305
28.8 pt (40%)
Cinebench 2024 - CB24 CPU Single Core
100%
1 i3-N305 +
65 Points (45%)
Cinebench 2024 - CB24 CPU Multi Core
100%
1 i3-N305 +
324 Points (6%)
Cinebench R23 - Cinebench R23 Multi Core
100%
1 i3-N305 +
min: 4832     avg: 5049     median: 5092 (5%)     max: 5181 Points
Cinebench R23 - Cinebench R23 Single Core
100%
1 i3-N305 +
min: 939     avg: 983     median: 995 (42%)     max: 1001 Points
Cinebench R20 - Cinebench R20 CPU (Single Core)
100%
1 i3-N305 +
min: 375     avg: 377     median: 376 (42%)     max: 380 Points
Cinebench R20 - Cinebench R20 CPU (Multi Core)
100%
1 i3-N305 +
min: 1855     avg: 1943     median: 1976 (5%)     max: 1998 Points
Cinebench R15 - Cinebench R15 CPU Multi 64 Bit
min: 836     avg: 861     median: 857 (5%)     max: 889 Points
min: 828     avg: 845     median: 829 (5%)     max: 878 Points
Cinebench R15 - Cinebench R15 CPU Single 64 Bit
min: 153     avg: 171.3     median: 178 (54%)     max: 183 Points
min: 163.6     avg: 165.1     median: 164.7 (50%)     max: 167 Points
Cinebench R11.5 - Cinebench R11.5 CPU Multi 64 Bit
9.5 Points (12%)
min: 10.6     avg: 11.3     median: 11.3 (15%)     max: 12.05 Points
Cinebench R11.5 - Cinebench R11.5 CPU Single 64 Bit
2 Points (50%)
min: 2.04     avg: 2     median: 2 (51%)     max: 2.05 Points
Cinebench R10 - Cinebench R10 Rend. Single (32bit)
100%
1 i3-N305 +
min: 5622     avg: 5651     median: 5651 (34%)     max: 5680 Points
Cinebench R10 - Cinebench R10 Rend. Multi (32bit)
100%
1 i3-N305 +
min: 25813     avg: 26169     median: 26168.5 (19%)     max: 26524 Points
Cinebench R10 - Cinebench R10 Rend. Multi (64bit)
100%
1 i3-N305 +
min: 39133     avg: 39930     median: 39929.5 (28%)     max: 40726 Points
Cinebench R10 - Cinebench R10 Rend. Single (64bit)
100%
1 i3-N305 +
min: 8648     avg: 8708     median: 8708 (11%)     max: 8768 Points
wPrime 2.10 - wPrime 2.0 1024m *
210.1 s (2%)
min: 246.308     avg: 1175     median: 1174.7 (14%)     max: 2103.1 s
wPrime 2.10 - wPrime 2.0 32m *
6.7 s (1%)
min: 8.142     avg: 35.8     median: 35.8 (7%)     max: 63.4 s
WinRAR - WinRAR 4.0
100%
1 i3-N305 +
min: 3300     avg: 3377     median: 3377 (5%)     max: 3454 Points
7-Zip 18.03 - 7-Zip 18.03 Multli Thread 4 runs
100%
1 i3-N305 +
min: 21080     avg: 21623     median: 21239 (12%)     max: 22551 MIPS
7-Zip 18.03 - 7-Zip 18.03 Single Thread 4 runs
100%
1 i3-N305 +
min: 3871     avg: 4033     median: 4105 (49%)     max: 4123 MIPS
X264 HD Benchmark 4.0 - x264 Pass 2
49 fps (17%)
min: 55.6     avg: 55.9     median: 55.9 (20%)     max: 56.2 fps
X264 HD Benchmark 4.0 - x264 Pass 1
181 fps (42%)
min: 201.6     avg: 202.6     median: 202.6 (47%)     max: 203.5 fps
HWBOT x265 Benchmark v2.2 - HWBOT x265 4k Preset
100%
1 i3-N305 +
min: 5.41     avg: 5.5     median: 5.6 (10%)     max: 5.62 fps
TrueCrypt - TrueCrypt Serpent
100%
1 i3-N305 +
min: 0.52     avg: 0.5     median: 0.5 (0%)     max: 0.539 GB/s
TrueCrypt - TrueCrypt Twofish
100%
1 i3-N305 +
min: 1     avg: 1.1     median: 1.1 (18%)     max: 1.1 GB/s
TrueCrypt - TrueCrypt AES
100%
1 i3-N305 +
min: 5.1     avg: 5.5     median: 5.5 (14%)     max: 5.9 GB/s
Blender - Blender 3.3 Classroom CPU *
100%
1 i3-N305 +
min: 1152     avg: 1199     median: 1198.5 (15%)     max: 1245 Seconds
Blender - Blender 2.79 BMW27 CPU *
100%
1 i3-N305 +
min: 583     avg: 598     median: 589 (4%)     max: 622 Seconds
R Benchmark 2.5 - R Benchmark 2.5 *
100%
1 i3-N305 +
min: 0.766     avg: 0.8     median: 0.8 (17%)     max: 0.786 sec
3DMark 06 - CPU - 3DMark 06 - CPU
100%
1 i3-N305 +
9081 Points (19%)
Super Pi mod 1.5 XS 1M - Super Pi mod 1.5 XS 1M *
10.2 s (2%)
min: 17.549     avg: 17.8     median: 17.8 (4%)     max: 18 s
Super Pi mod 1.5 XS 2M - Super Pi mod 1.5 XS 2M *
22.9 s (1%)
36.5 s (2%)
Super Pi Mod 1.5 XS 32M - Super Pi mod 1.5 XS 32M *
556 s (2%)
min: 744.681     avg: 758     median: 758.3 (3%)     max: 772 s
3DMark Vantage - 3DM Vant. Perf. CPU no Physx
100%
1 i3-N305 +
min: 28884     avg: 28911     median: 28910.5 (25%)     max: 28937 Points
3DMark 11 - 3DM11 Performance Physics
min: 10706     avg: 10740     median: 10739.5 (29%)     max: 10773 Points
min: 8651     avg: 8896     median: 8926 (24%)     max: 9111 Points
3DMark - 3DMark Ice Storm Physics
min: 54177     avg: 57570     median: 57569.5 (47%)     max: 60962 Points
55544 Points (45%)
3DMark - 3DMark Ice Storm Extreme Physics
53710 Points (44%)
56367 Points (46%)
3DMark - 3DMark Ice Storm Unlimited Physics
100%
1 i3-N305 +
61854 Points (52%)
3DMark - 3DMark Cloud Gate Physics
min: 8301     avg: 8650     median: 8650 (22%)     max: 8999 Points
min: 8263     avg: 8470     median: 8567 (22%)     max: 8580 Points
3DMark - 3DMark Fire Strike Standard Physics
min: 11520     avg: 12081     median: 12081 (22%)     max: 12642 Points
min: 11357     avg: 11598     median: 11625 (21%)     max: 11813 Points
3DMark - 3DMark Time Spy CPU
100%
1 i3-N305 +
min: 3455     avg: 3514     median: 3493 (15%)     max: 3593 Points
Geekbench 6.2 - Geekbench 6.2 Single-Core
100%
1 i3-N305 +
min: 1304     avg: 1316     median: 1318 (40%)     max: 1326 Points
Geekbench 6.2 - Geekbench 6.2 Multi-Core
100%
1 i3-N305 +
min: 4632     avg: 4798     median: 4727 (19%)     max: 5034 Points
Geekbench 5.5 - Geekbench 5.1 - 5.4 64 Bit Single-Core
100%
1 i3-N305 +
min: 1050     avg: 1068     median: 1071 (45%)     max: 1083 Points
Geekbench 5.5 - Geekbench 5.1 - 5.4 64 Bit Multi-Core
100%
1 i3-N305 +
min: 4492     avg: 4680     median: 4644 (8%)     max: 4905 Points
Geekbench 5.0 - Geekbench 5.0 64 Bit Single-Core
100%
1 i3-N305 +
min: 1006     avg: 1044     median: 1053 (5%)     max: 1072 Points
Geekbench 5.0 - Geekbench 5.0 64 Bit Multi-Core
100%
1 i3-N305 +
min: 4218     avg: 4496     median: 4497 (14%)     max: 4774 Points
Geekbench 4.4 - Geekbench 4.1 - 4.4 64 Bit Single-Core
100%
1 i3-N305 +
min: 4469     avg: 4633     median: 4632.5 (46%)     max: 4796 Points
Geekbench 4.4 - Geekbench 4.1 - 4.4 64 Bit Multi-Core
100%
1 i3-N305 +
min: 16566     avg: 17128     median: 17128 (19%)     max: 17690 Points
Mozilla Kraken 1.1 - Kraken 1.1 Total Score *
100%
1 i3-N305 +
min: 981     avg: 986     median: 984 (1%)     max: 993 ms
WebXPRT 4 - WebXPRT 4 Score
100%
1 i3-N305 +
min: 140.3     avg: 158.2     median: 145.3 (42%)     max: 189 Points
WebXPRT 3 - WebXPRT 3 Score
100%
1 i3-N305 +
min: 179.4     avg: 185.1     median: 185.4 (39%)     max: 190.4 Points
CrossMark - CrossMark Overall
100%
1 i3-N305 +
min: 881     avg: 907     median: 881 (34%)     max: 958 Points
Power Consumption - Prime95 Power Consumption - external Monitor *
100%
1 i3-N305 +
min: 22.9     avg: 27.6     median: 25.5 (4%)     max: 34.5 Watt
Power Consumption - Cinebench R15 Multi Power Consumption - external Monitor *
100%
1 i3-N305 +
36.9 Watt (7%)
Power Consumption - Idle Power Consumption - external Monitor *
100%
1 i3-N305 +
min: 3.01     avg: 4.6     median: 3.5 (2%)     max: 7.2 Watt
Power Consumption - Idle Power Consumption 150cd 1min *
100%
1 i3-N305 +
min: 5.18     avg: 5.5     median: 5.5 (6%)     max: 5.76 Watt
Power Consumption - Cinebench R15 Multi Power Efficiency - external Monitor
100%
1 i3-N305 +
22.4 Points per Watt (17%)

Average Benchmarks Intel Core i7-7700 → 100% n=16

Average Benchmarks Intel Core i3-N305 → 100% n=16

- Bereich der Benchmarkergebnisse für diese Grafikkarte
- Durchschnittliche Benchmarkergebnisse für diese Grafikkarte
* Smaller numbers mean a higher performance
1 This benchmark is not used for the average calculation

Add one or more devices and compare

In the following list you can select (and also search for) devices that should be added to the comparison. You can select more than one device.

restrict list:

show all (including archived), 2024, 2023
v1.26
log 09. 14:02:32

#0 checking url part for id 8566 +0s ... 0s

#1 checking url part for id 14926 +0s ... 0s

#2 not redirecting to Ajax server +0s ... 0s

#3 did not recreate cache, as it is less than 5 days old! Created at Tue, 07 May 2024 05:39:01 +0200 +0.001s ... 0.001s

#4 composed specs +0.029s ... 0.03s

#5 did output specs +0s ... 0.03s

#6 getting avg benchmarks for device 8566 +0.003s ... 0.033s

#7 got single benchmarks 8566 +0.011s ... 0.044s

#8 getting avg benchmarks for device 14926 +0.02s ... 0.064s

#9 got single benchmarks 14926 +0.022s ... 0.086s

#10 got avg benchmarks for devices +0s ... 0.086s

#11 min, max, avg, median took s +0.235s ... 0.321s

#12 return log +0.598s ... 0.919s

Teilen Sie diesen Artikel, um uns zu unterstützen. Jeder Link hilft!
> Notebook Test, Laptop Test und News > Benchmarks / Technik > Benchmarks / Technik > Prozessor Vergleich - Head 2 Head
Autor: Klaus Hinum,  8.09.2017 (Update:  1.07.2023)