Eurocom C315 Blitz Laptop im Test: Core i7-1360P ist eine gemischte Sache

Das C315 Blitz ist ein schlankes und leichtes Multimedia-Notebook der Einsteiger- bis Mittelklasse von Eurocom, das auf dem Gehäusedesign des Clevo X170KM basiert. Die verfügbaren Ausstattungsvarianten reichen vom Core i5-1340P bis zum Core i7-1360P mit Optionen für ein 1080p- oder 2160p (4K)-Display. In unserem Testgerät handelt es sich um eine hochwertigere Konfiguration mit Core i7 und einer 4K-Option.
Als Alternativen zum C315 Blitz kommen andere 15,6-Zoll-Multimedia- oder Office-Notebooks wie das Acer Aspire 5 A515 oder das Asus VivoBook S15 in Frage.
Weitere Eurocom Bewertungen:
Mögliche Konkurrenten im Vergleich
Bew. | Datum | Modell | Gewicht | Dicke | Größe | Auflösung | Preis ab |
|---|---|---|---|---|---|---|---|
| 83.4 % v7 (old) | 11 / 2023 | Eurocom C315 Blitz i7-1360P, Iris Xe G7 96EUs | 1.7 kg | 19.9 mm | 15.60" | 3840x2160 | |
| 84.3 % v7 (old) | 02 / 2022 | Schenker Work 15 Tiger Lake-H i7-11370H, Iris Xe G7 96EUs | 1.7 kg | 19.9 mm | 15.60" | 1920x1080 | |
| 86.6 % v7 (old) | 12 / 2023 | Lenovo ThinkPad L15 Gen 4 21H70021GE R7 PRO 7730U, Vega 8 | 1.9 kg | 19.93 mm | 15.60" | 1920x1080 | |
| 82 % v7 (old) | 09 / 2023 | Acer Aspire 5 A515-58GM-76S8 i7-1355U, GeForce RTX 2050 Mobile | 1.8 kg | 19.7 mm | 15.60" | 1920x1080 | |
| 83.2 % v7 (old) | 02 / 2023 | Asus VivoBook S15 M3502RA-L1029W R7 6800H, Radeon 680M | 1.9 kg | 18.8 mm | 15.60" | 1920x1080 | |
| 79.8 % v7 (old) | 08 / 2022 | Samsung Galaxy Book2 15 i7-1260P, A350M | 1.6 kg | 15 mm | 15.60" | 1920x1080 |
Gehäuse
Das Gehäuse ist identisch mit dem des letztjährigen Schenker Work 15, da beide auf demselben X170KM-Gehäuse basieren. Zu beachten ist, dass nur einer der beiden USB-C-Anschlüsse Thunderbolt, USB-C-Laden und DisplayPort-Out unterstützt.

SD-Kartenleser
| SD Card Reader | |
| average JPG Copy Test (av. of 3 runs) | |
| Schenker Work 15 Tiger Lake-H (Angelbird AV Pro V60) | |
| Eurocom C315 Blitz (Angelbird AV Pro V60) | |
| Lenovo ThinkPad L15 Gen 4 21H70021GE | |
| Samsung Galaxy Book2 15 (Angelbird AV Pro V60) | |
| maximum AS SSD Seq Read Test (1GB) | |
| Lenovo ThinkPad L15 Gen 4 21H70021GE | |
| Eurocom C315 Blitz (Angelbird AV Pro V60) | |
| Schenker Work 15 Tiger Lake-H (Angelbird AV Pro V60) | |
| Samsung Galaxy Book2 15 (Angelbird AV Pro V60) | |
Kommunikation
| Networking | |
| iperf3 transmit AX12 | |
| Schenker Work 15 Tiger Lake-H | |
| iperf3 receive AX12 | |
| Schenker Work 15 Tiger Lake-H | |
| iperf3 transmit AXE11000 | |
| Samsung Galaxy Book2 15 | |
| Lenovo ThinkPad L15 Gen 4 21H70021GE | |
| Eurocom C315 Blitz | |
| Acer Aspire 5 A515-58GM-76S8 | |
| Asus VivoBook S15 M3502RA-L1029W | |
| iperf3 receive AXE11000 | |
| Lenovo ThinkPad L15 Gen 4 21H70021GE | |
| Samsung Galaxy Book2 15 | |
| Eurocom C315 Blitz | |
| Acer Aspire 5 A515-58GM-76S8 | |
| Asus VivoBook S15 M3502RA-L1029W | |
| iperf3 transmit AXE11000 6GHz | |
| Acer Aspire 5 A515-58GM-76S8 | |
| Lenovo ThinkPad L15 Gen 4 21H70021GE | |
| Eurocom C315 Blitz | |
| iperf3 receive AXE11000 6GHz | |
| Lenovo ThinkPad L15 Gen 4 21H70021GE | |
| Acer Aspire 5 A515-58GM-76S8 | |
| Eurocom C315 Blitz | |
Webcam
Obwohl Eurocom mit einer 2 MP-Webcam wirbt, können Sie in der Windows-Kamera-App nur maximal 1 MP oder 720p30-Aufnahmen auswählen.


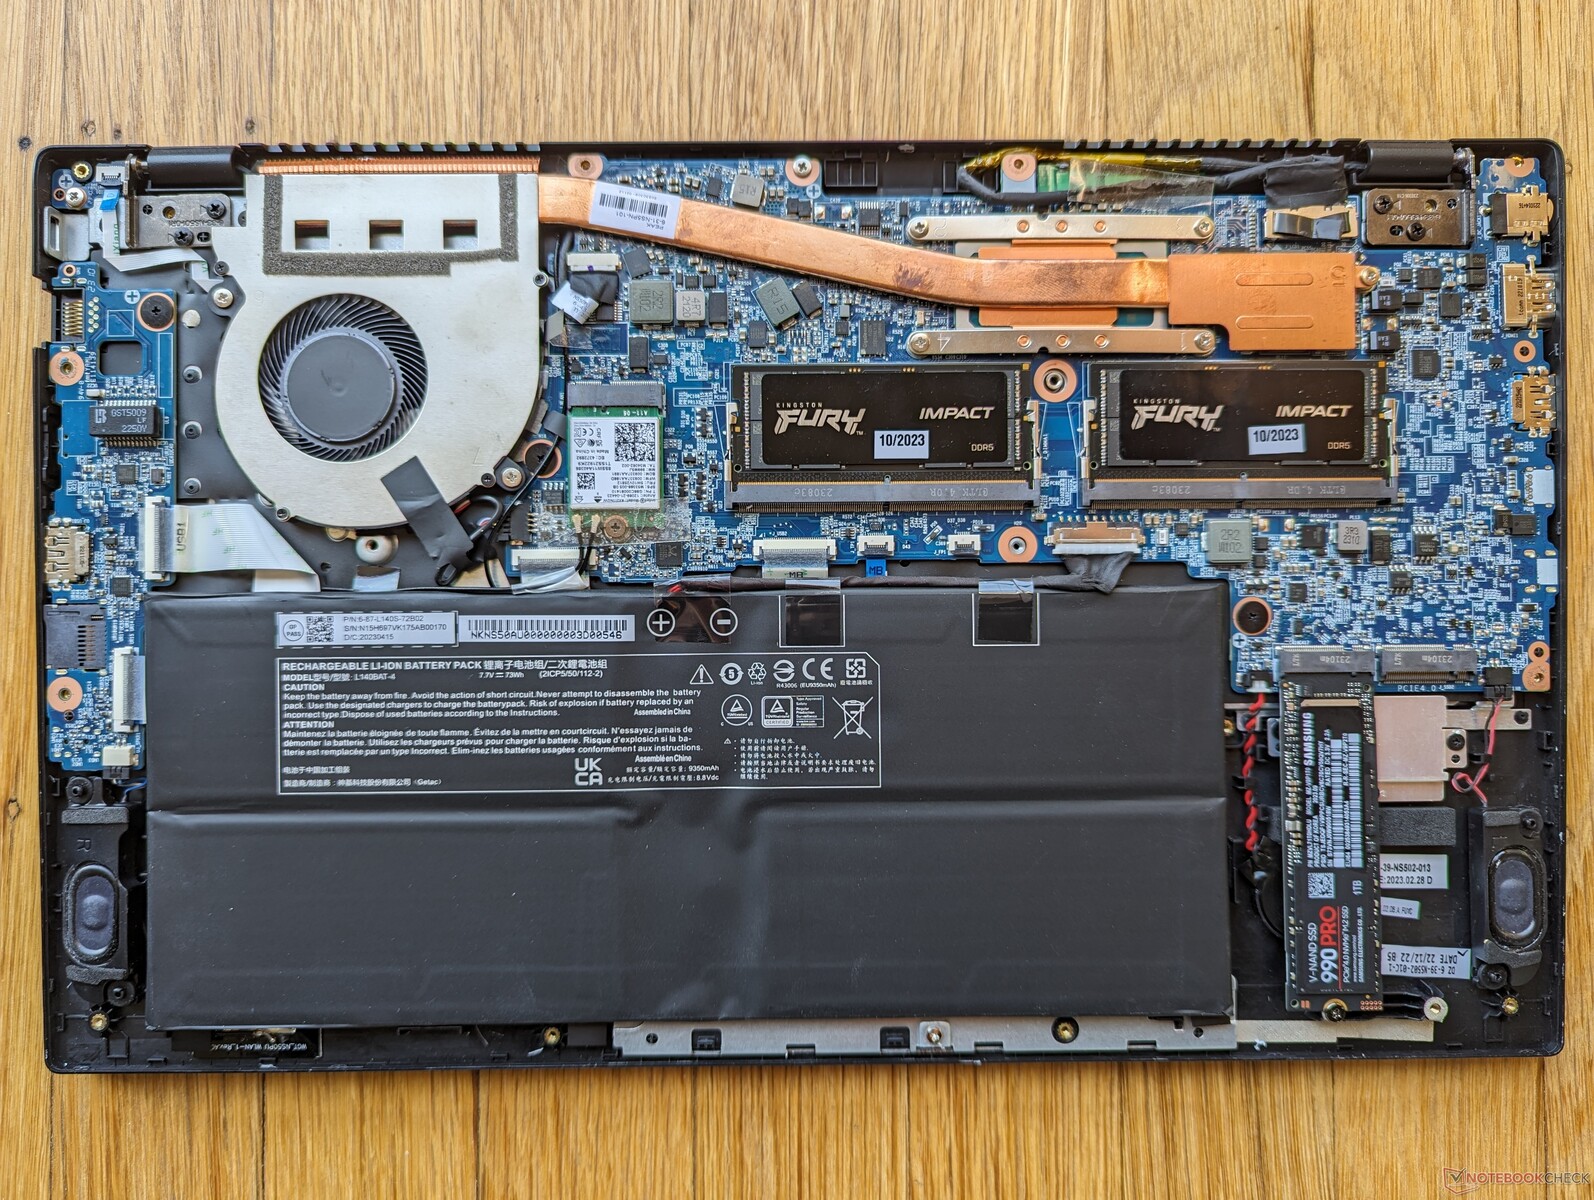
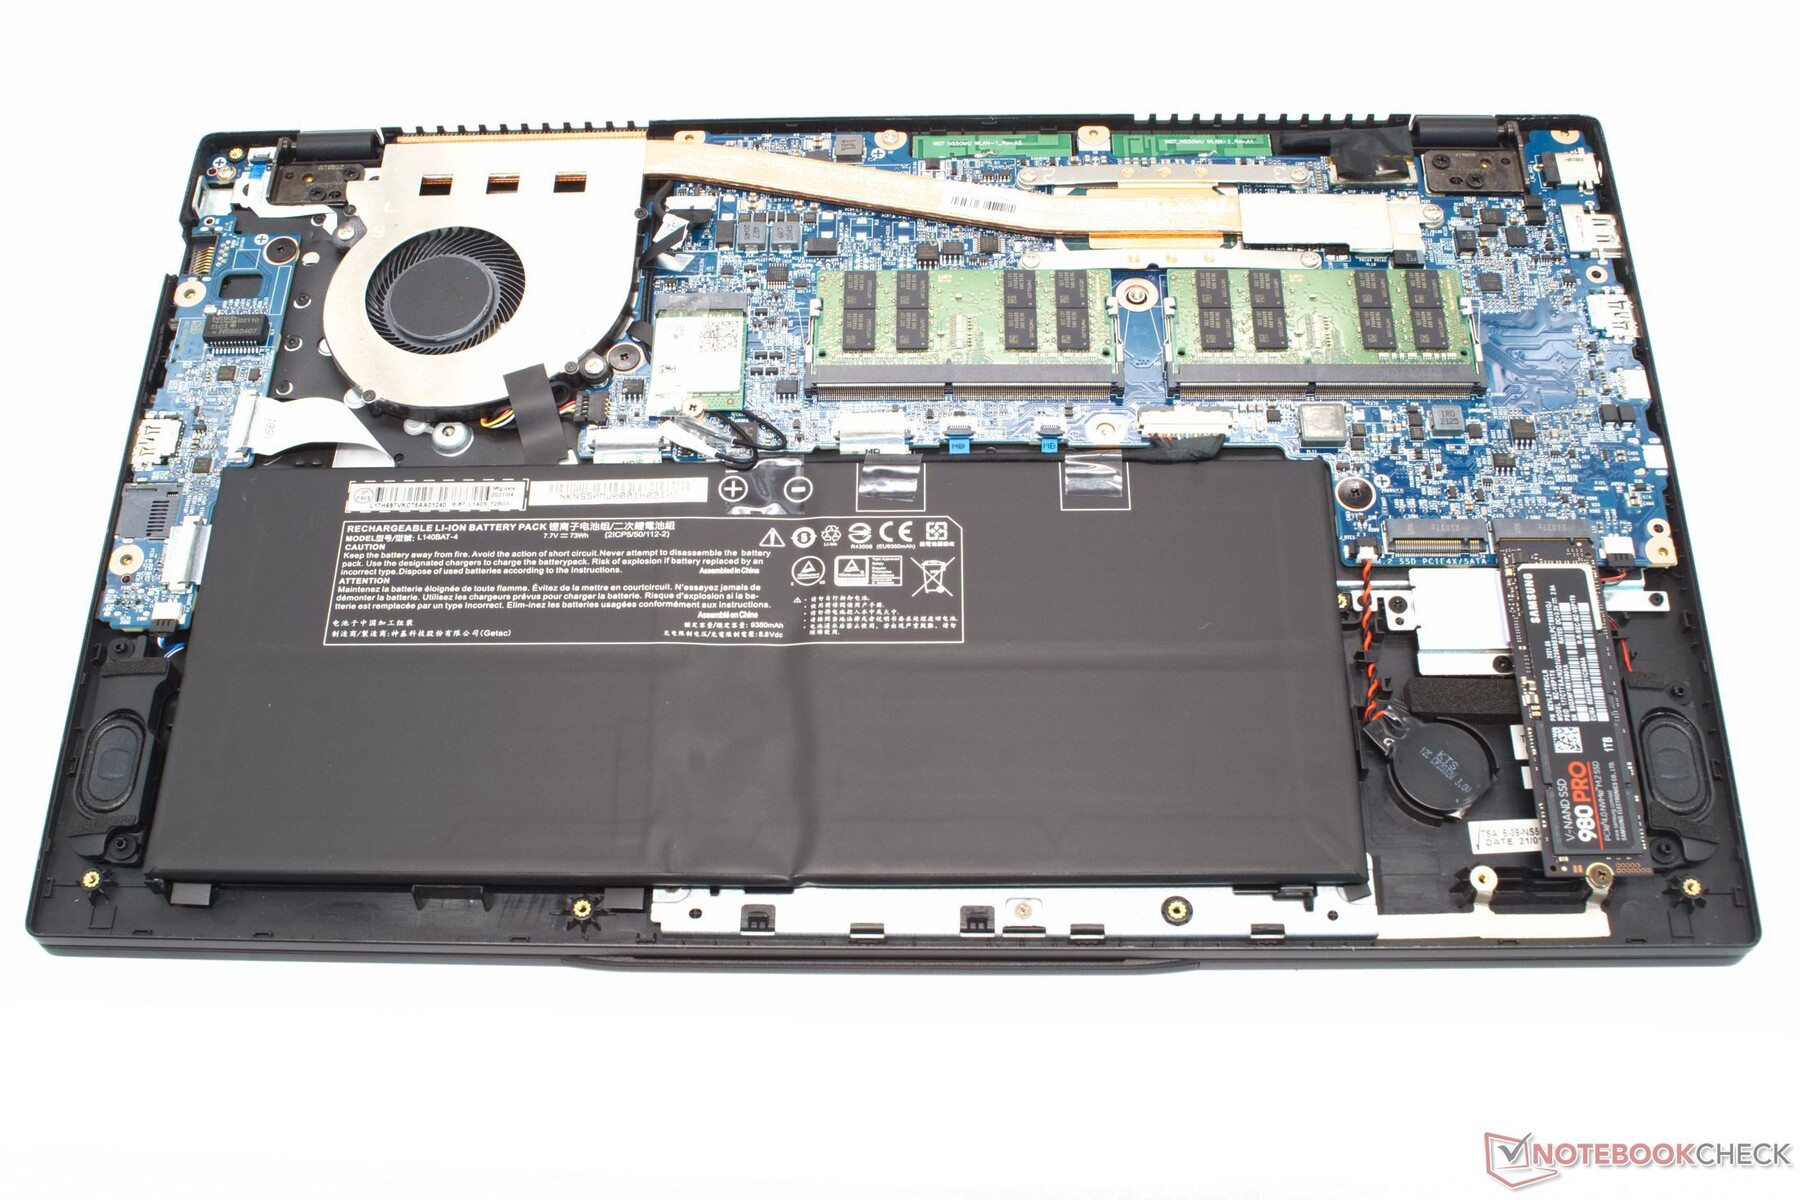
Wartung
Garantie
Beim Kauf in den USA gilt die eingeschränkte Standardgarantie von einem Jahr. Eurocom bietet optionale Verlängerungspläne von bis zu drei Jahren an.
Display
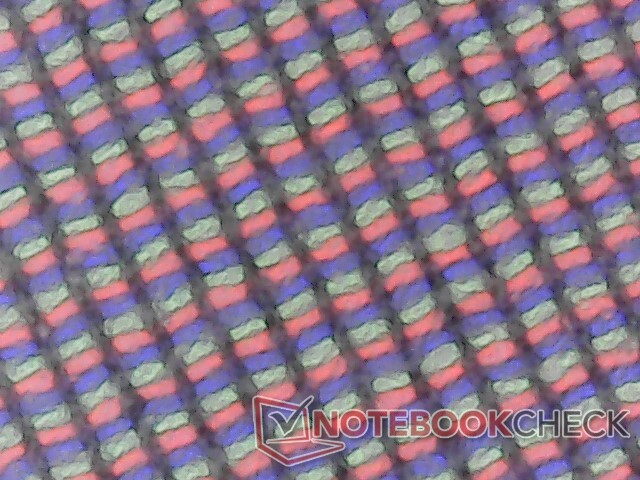
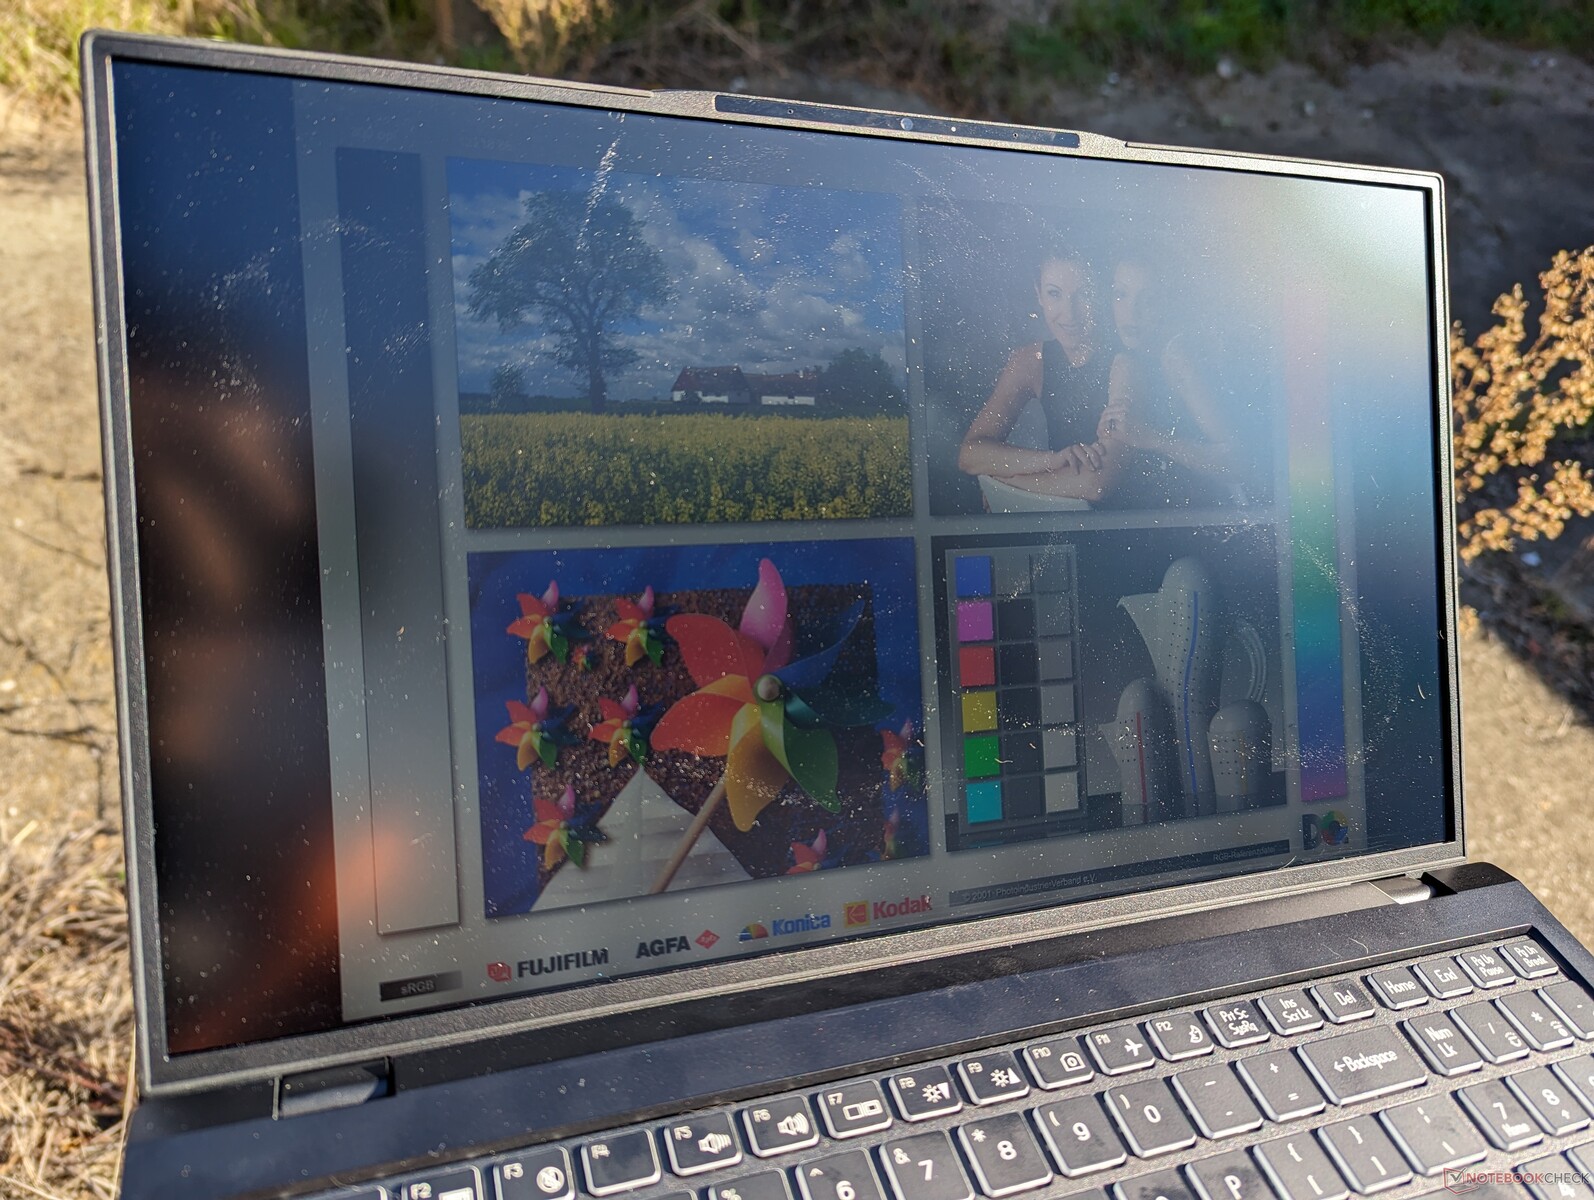
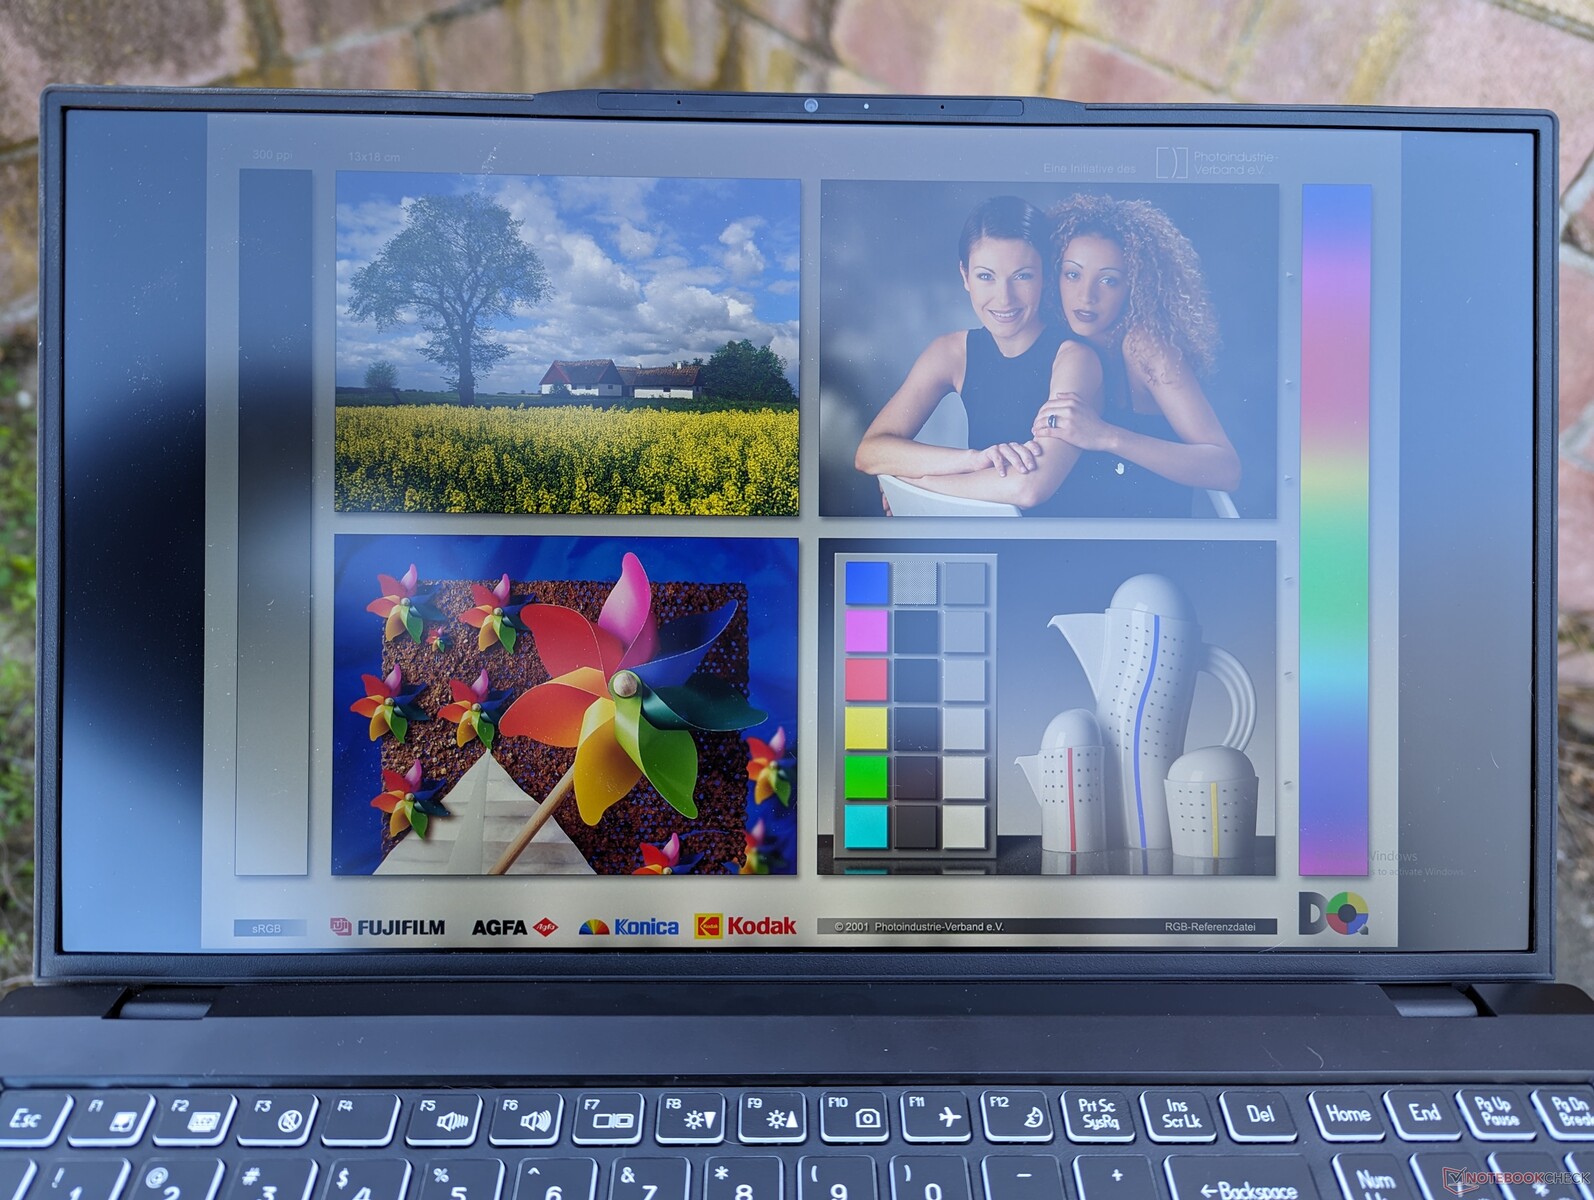
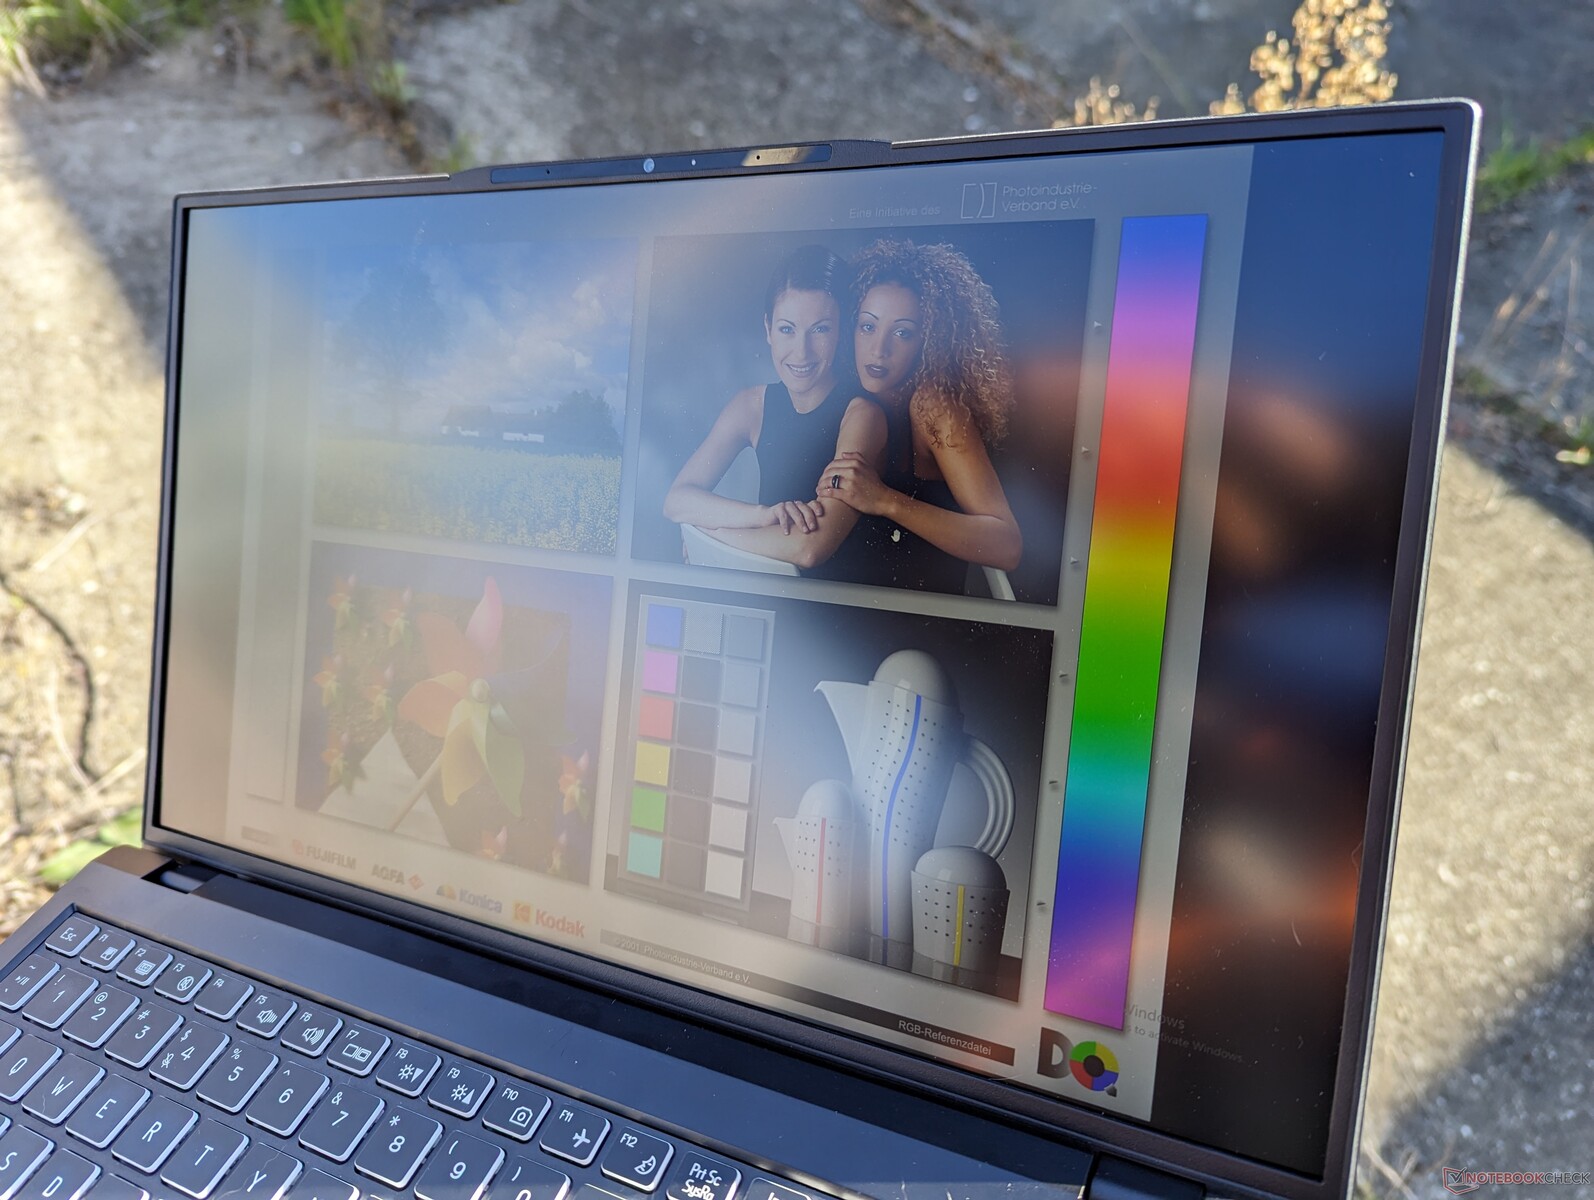
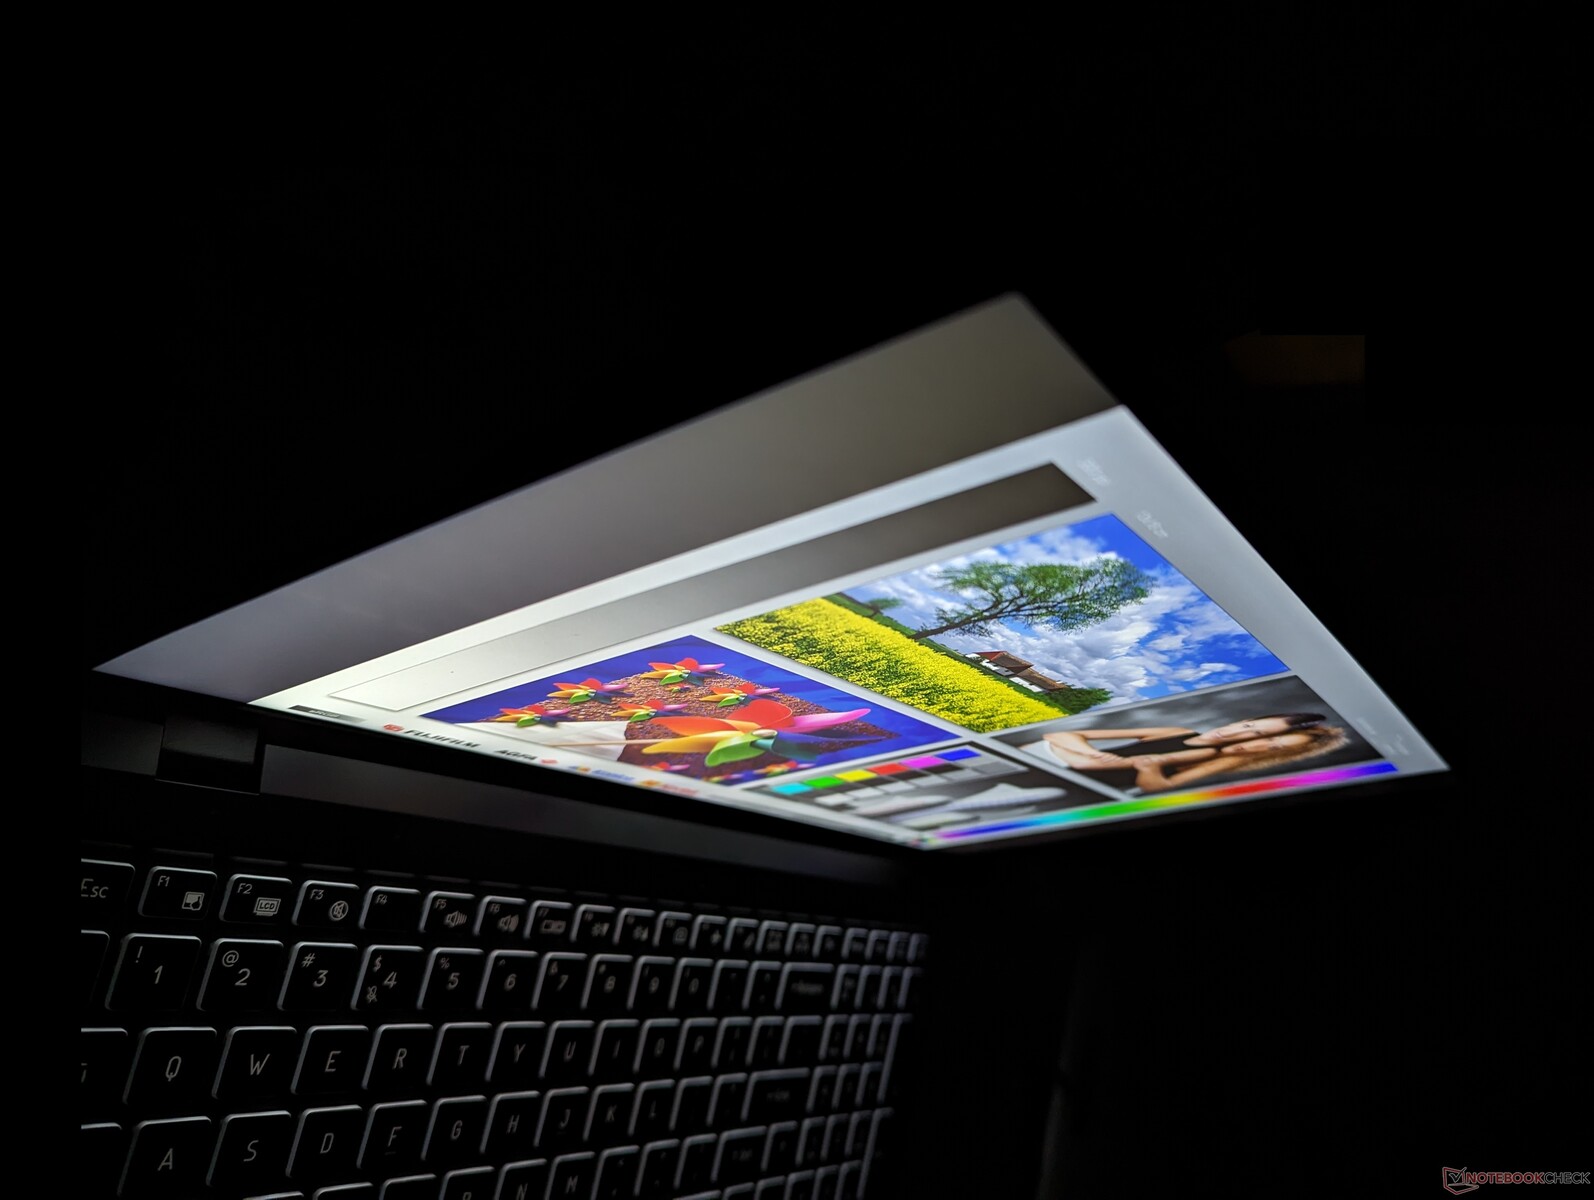
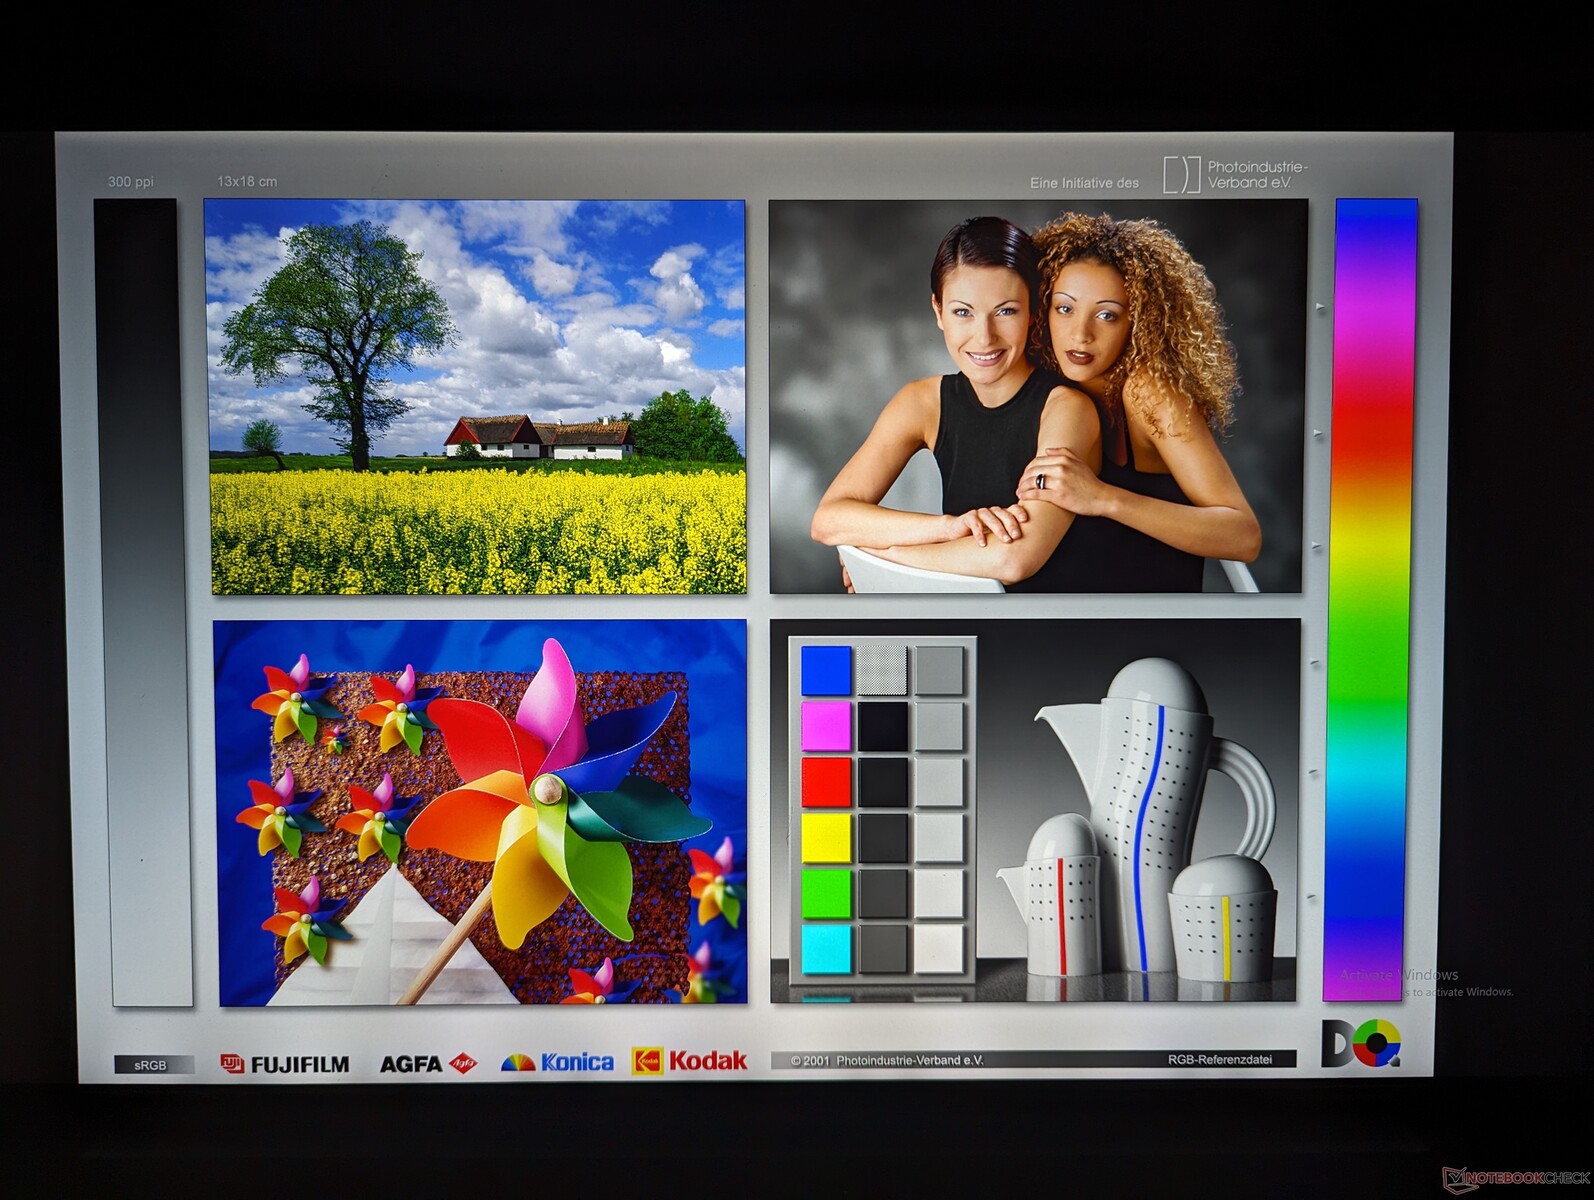
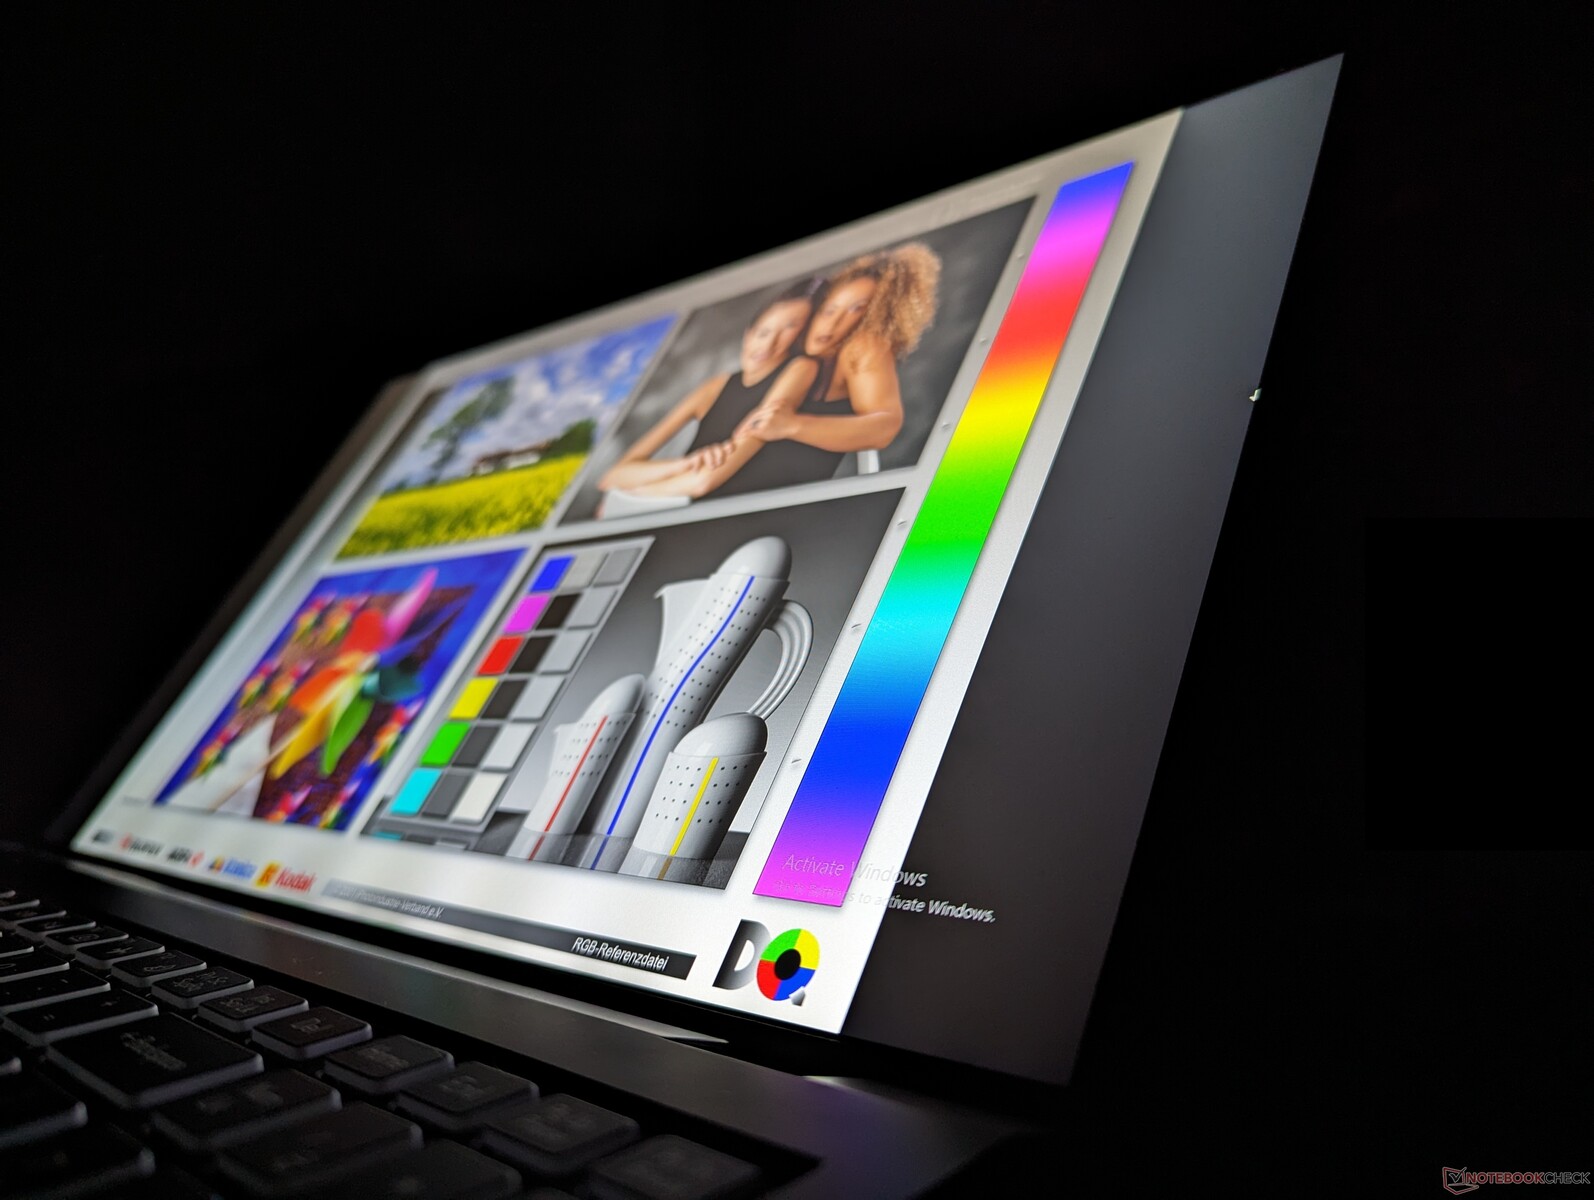
Unsere Eurocom-Konfiguration verfügt über ein 4K-Panel mit höherer Auflösung als das 1080p-Panel in unserem Schenker. Allerdings haben sich die Schwarz-Weiß-Reaktionszeiten nicht verbessert, sodass Geisterbilder spürbar bleiben. Leider bietet der C315 Blitz keine Optionen mit HDR, voller DCI-P3, AdobeRGB-Abdeckung oder Panels mit höheren Bildwiederholraten.
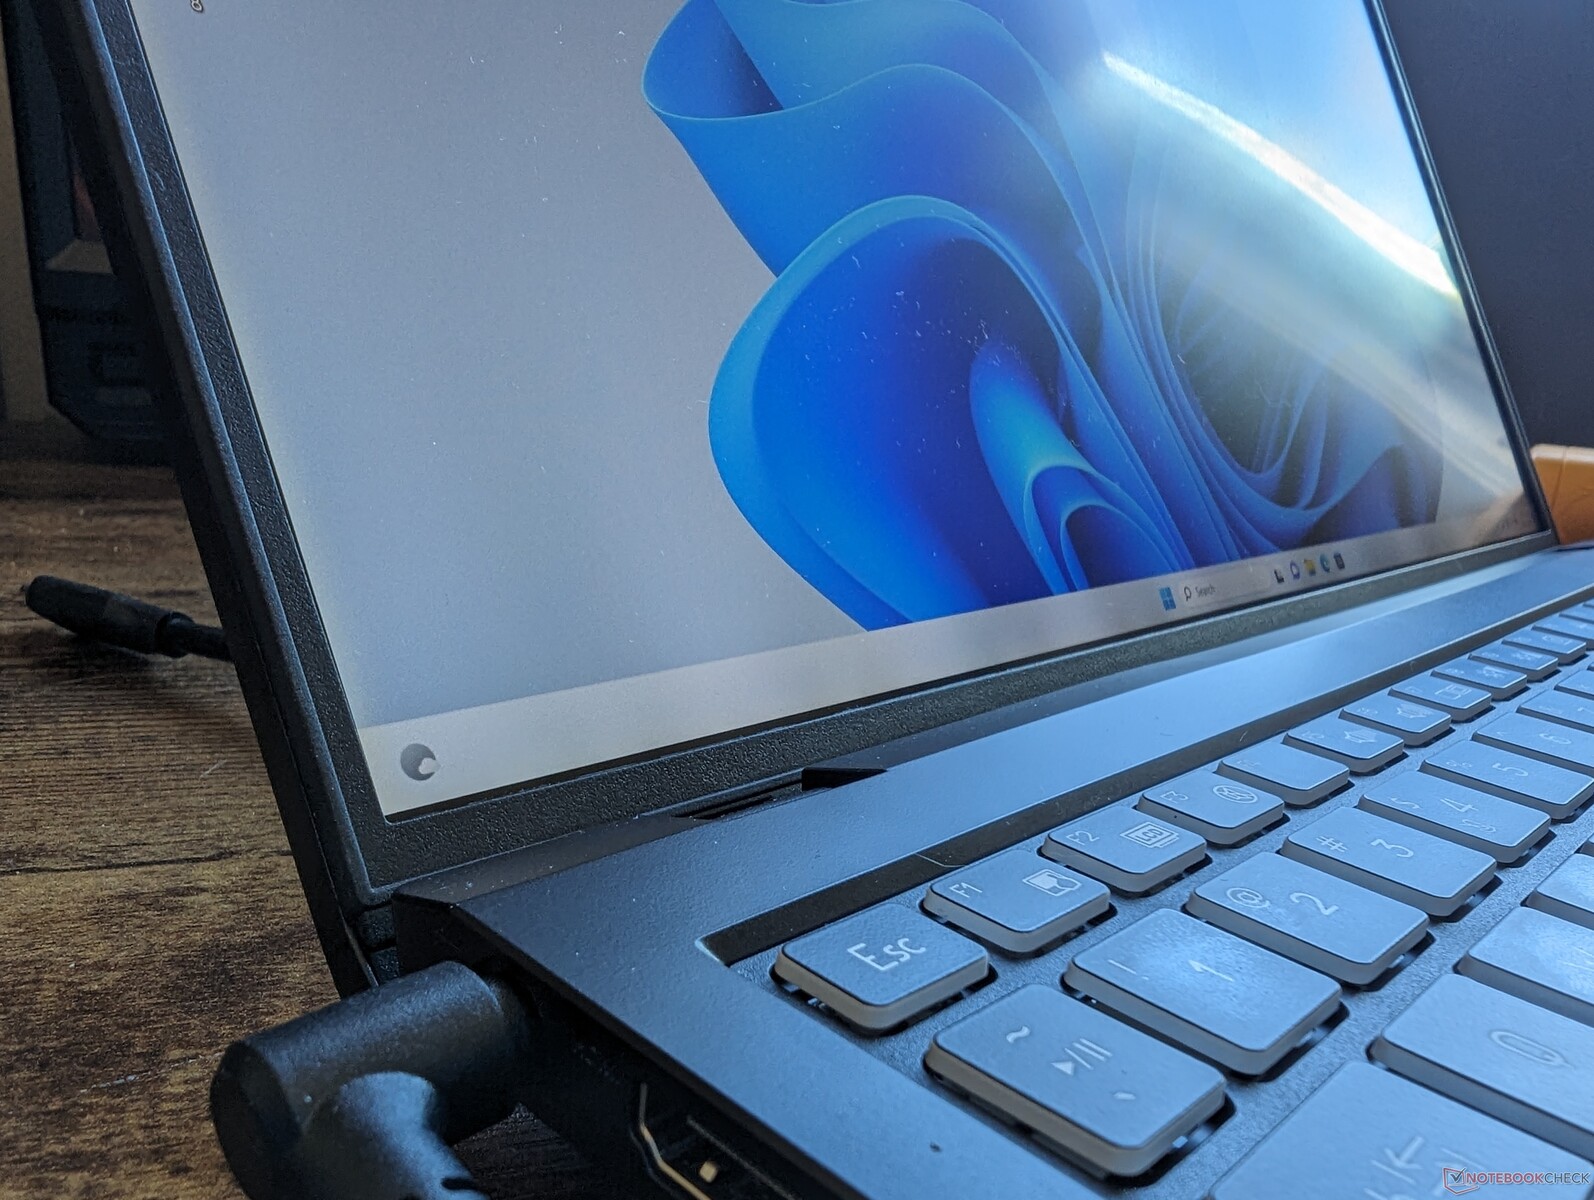
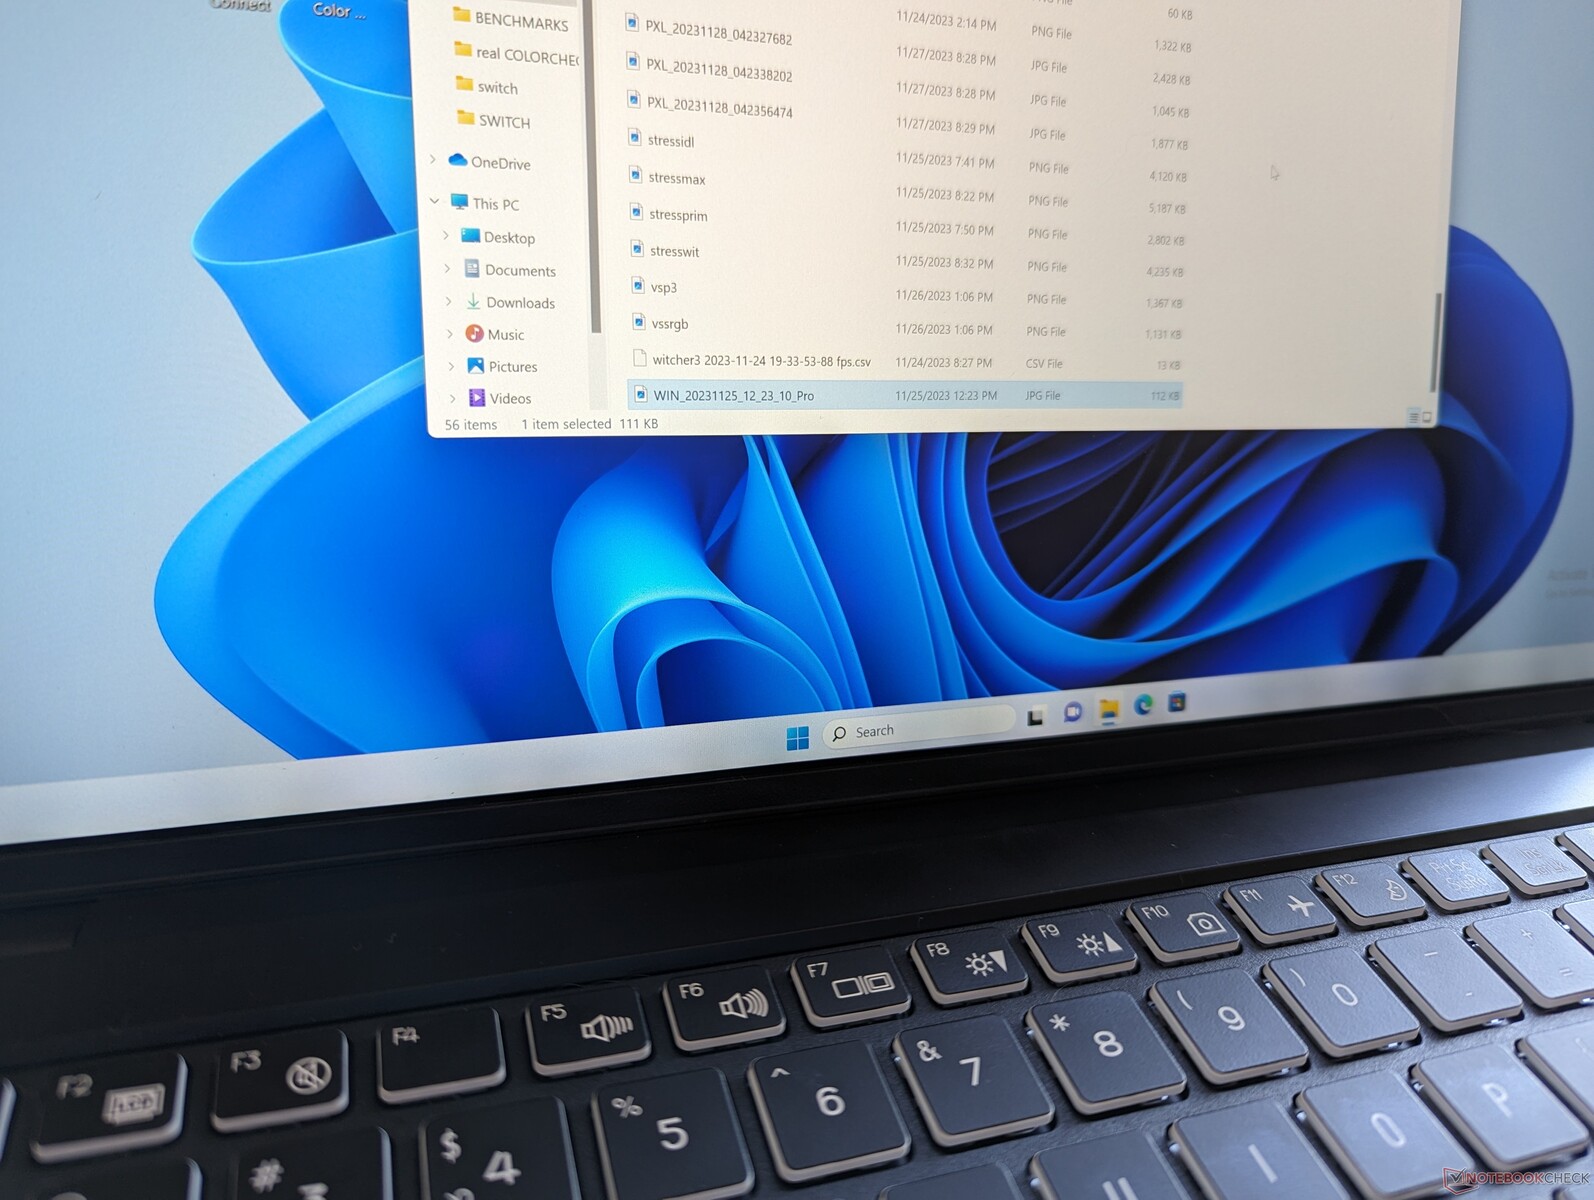
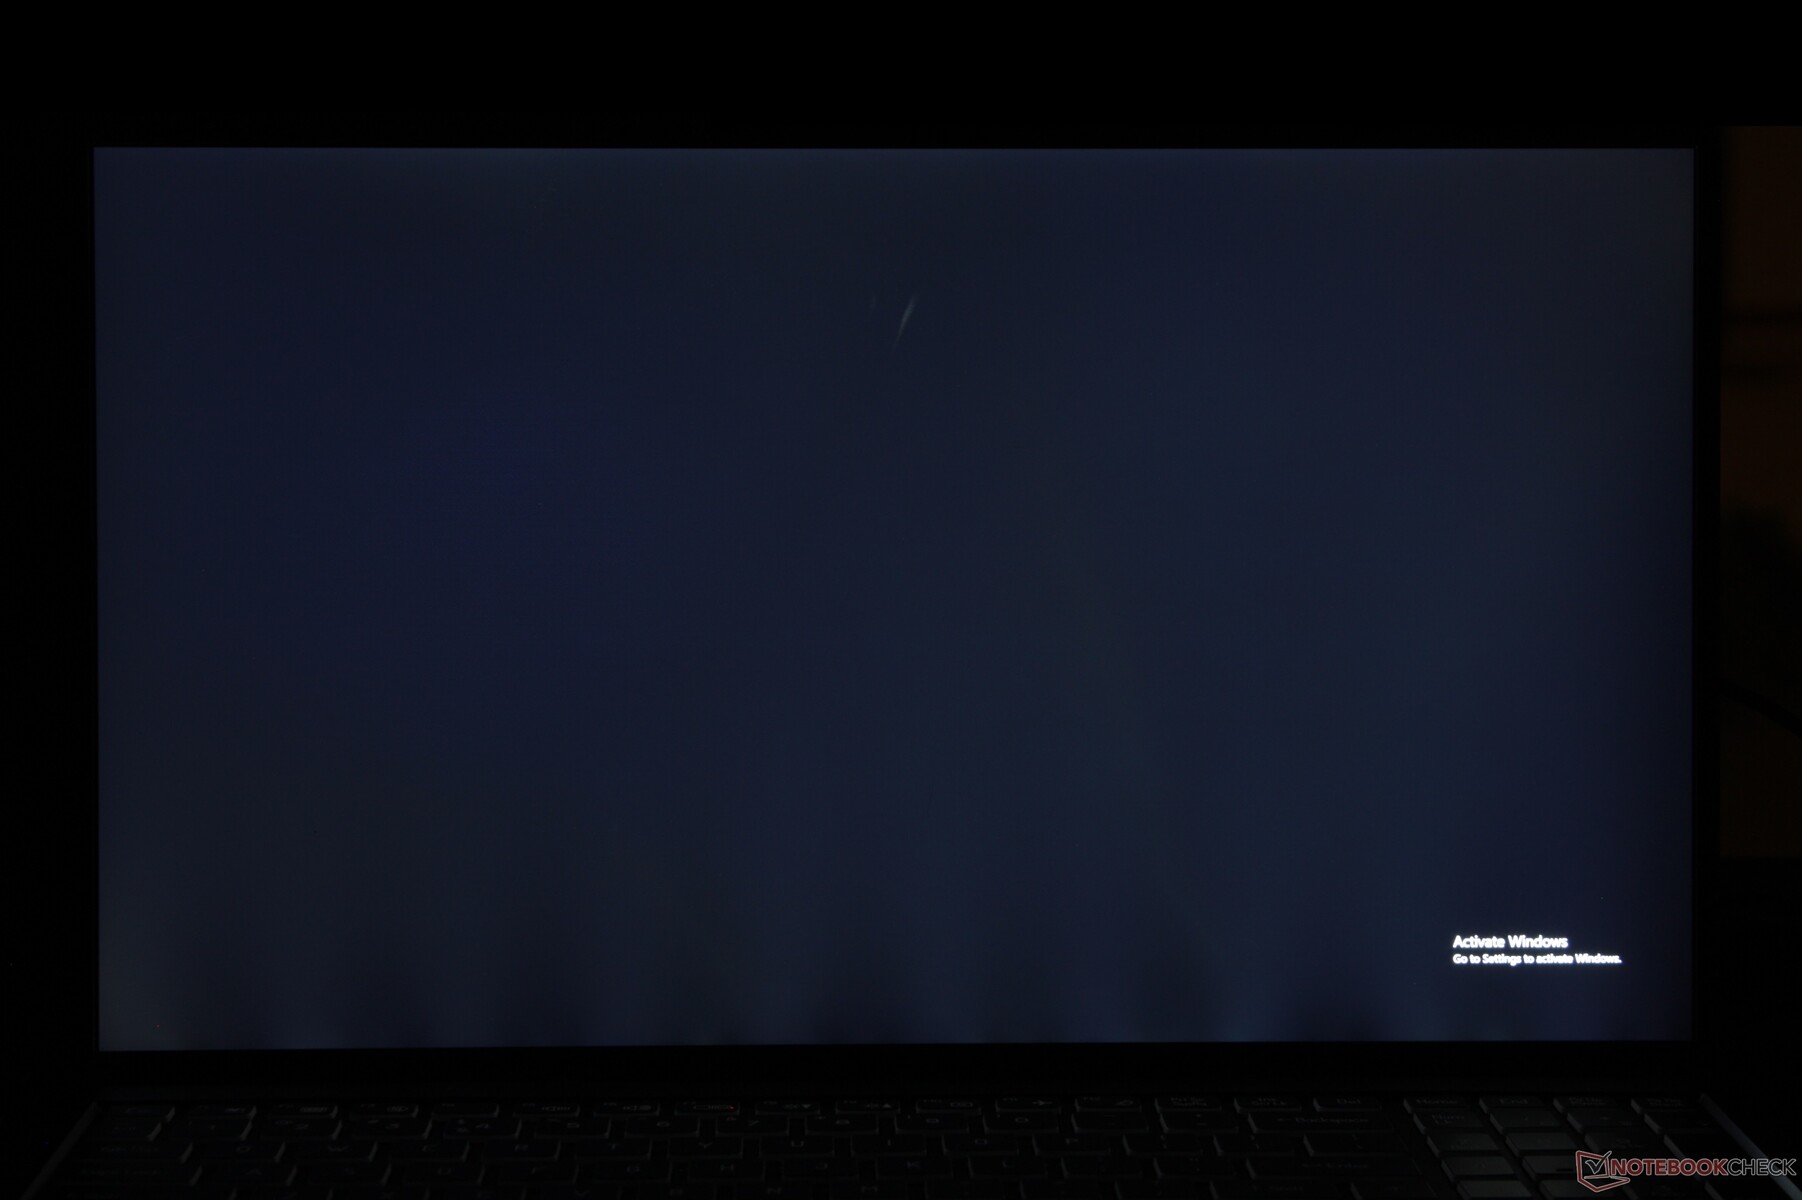
Der Bildschirm unseres Testgeräts leidet unter extremem Backlight-Bleeding am unteren Rand, wie die Bilder unten zeigen. Wir empfehlen, Ihren Kauf zu überprüfen, um sicherzustellen, dass es keine Probleme mit dem Bildschirm gibt.
| |||||||||||||||||||||||||
Ausleuchtung: 85 %
Helligkeit Akku: 262.5 cd/m²
Kontrast: 1050:1 (Schwarzwert: 0.25 cd/m²)
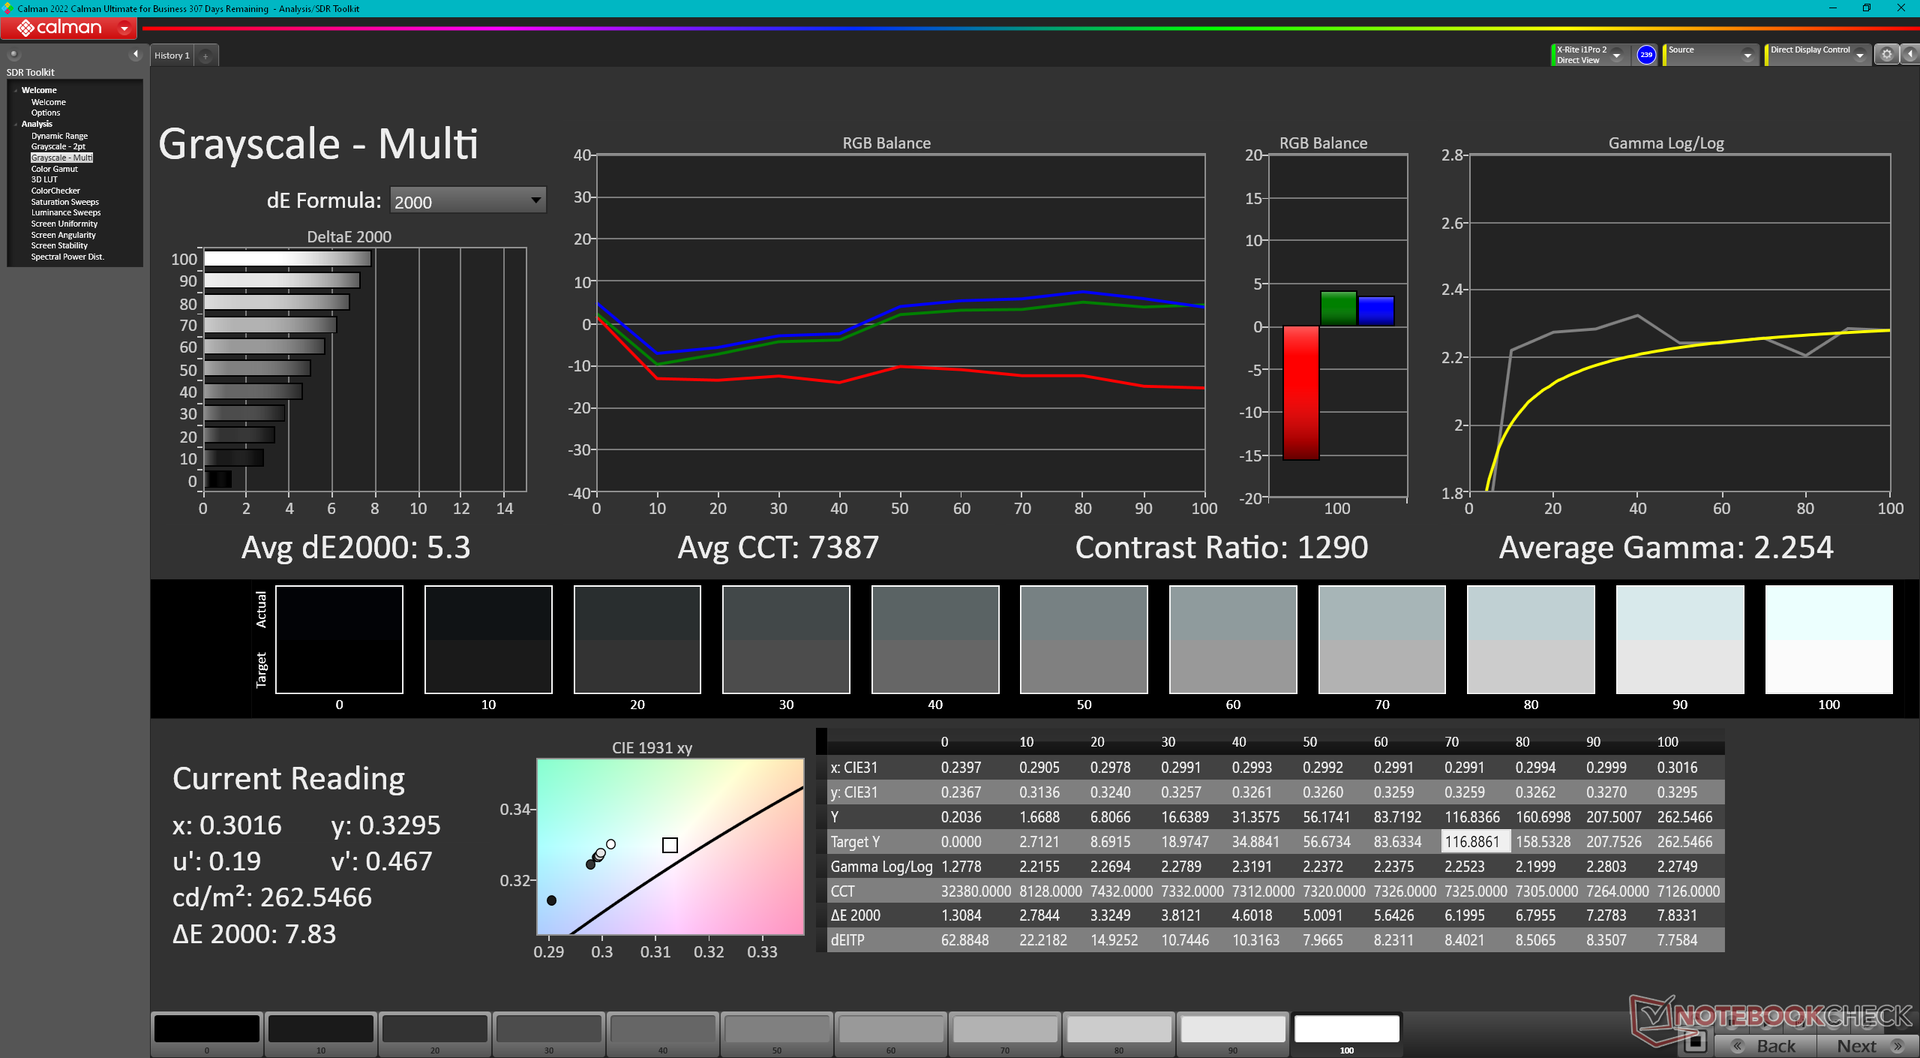
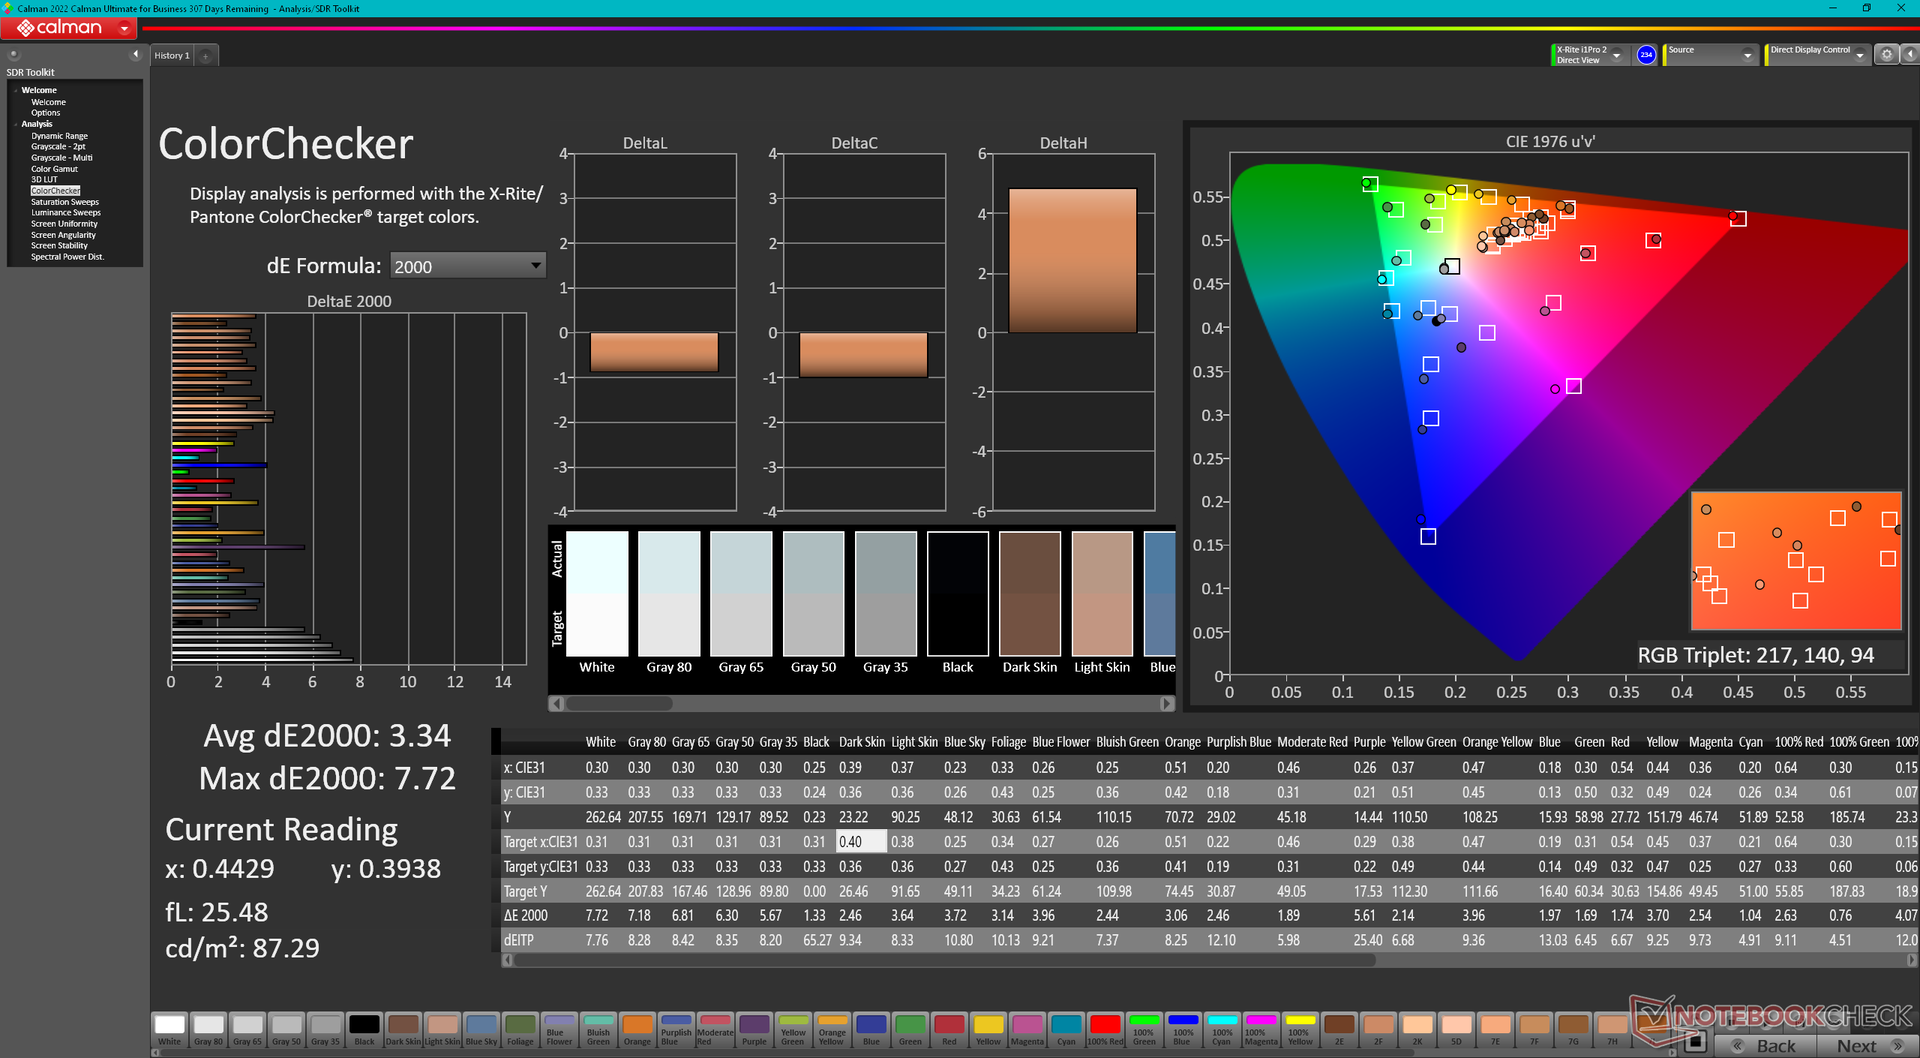
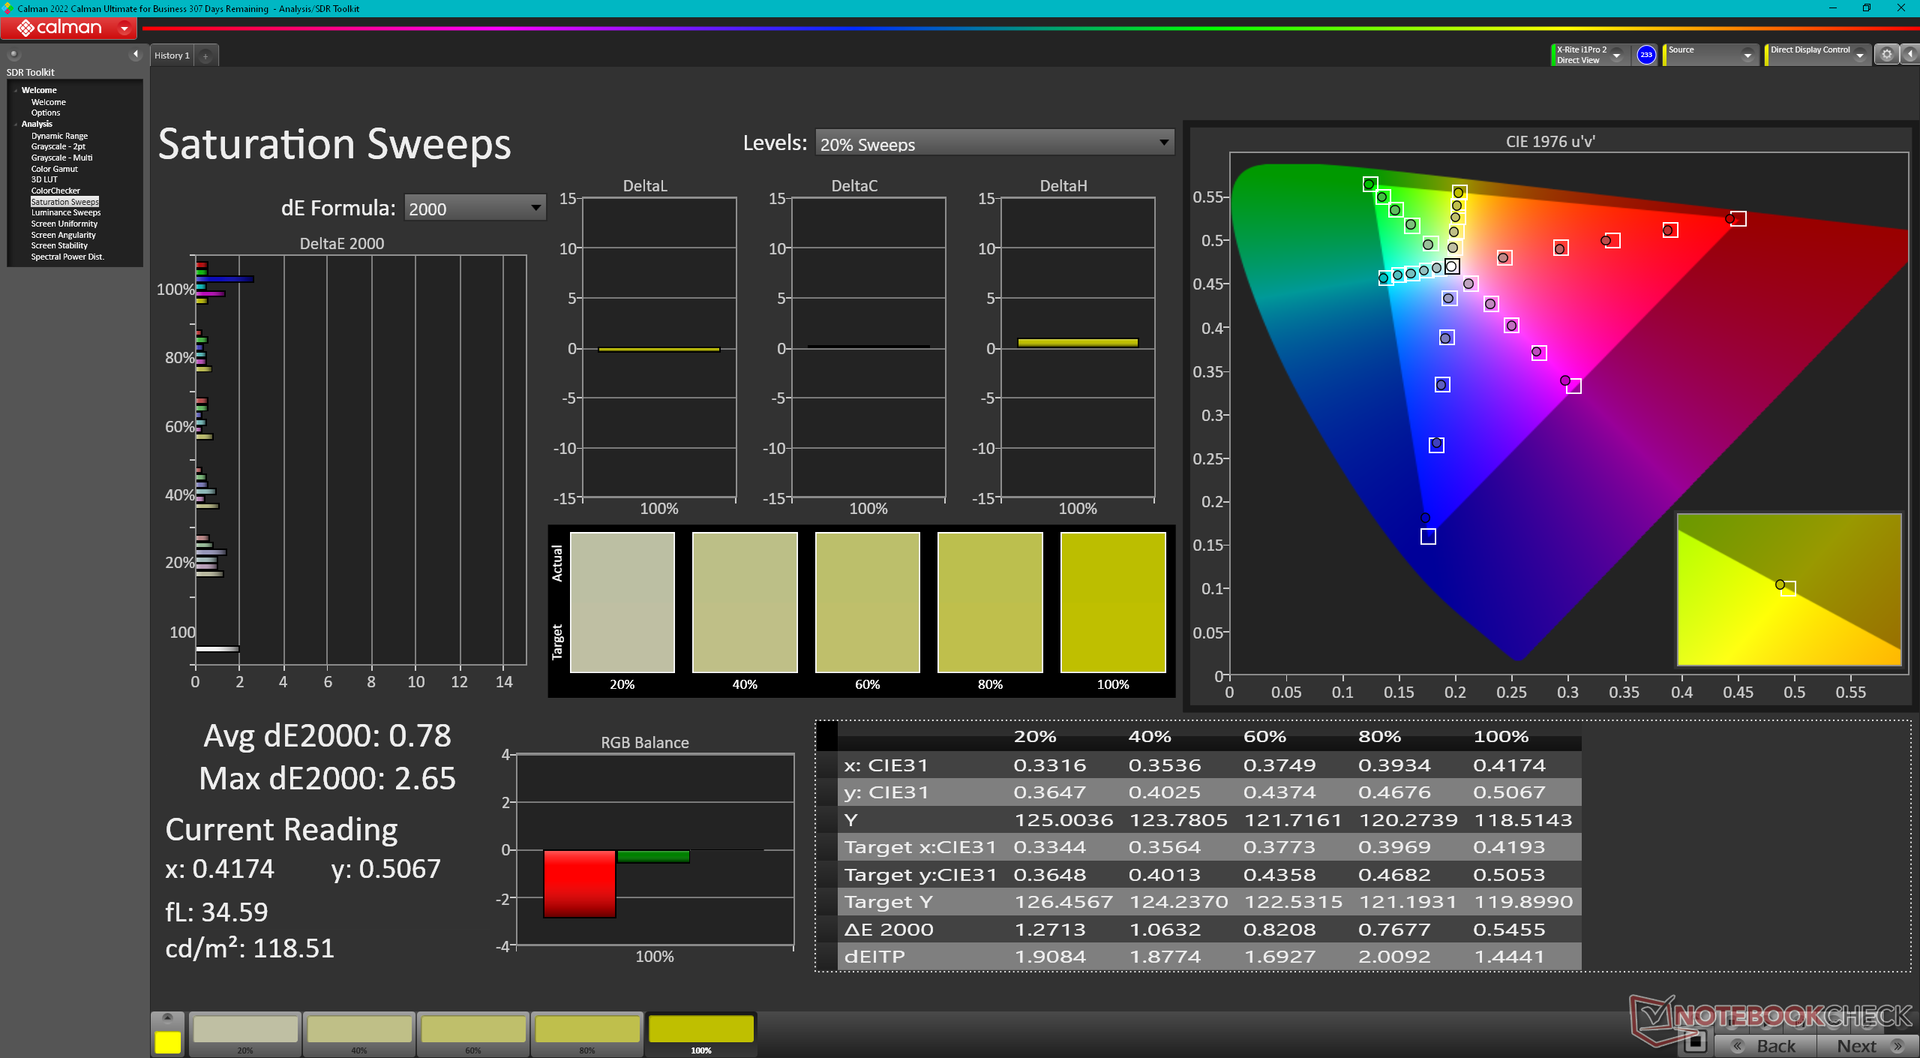
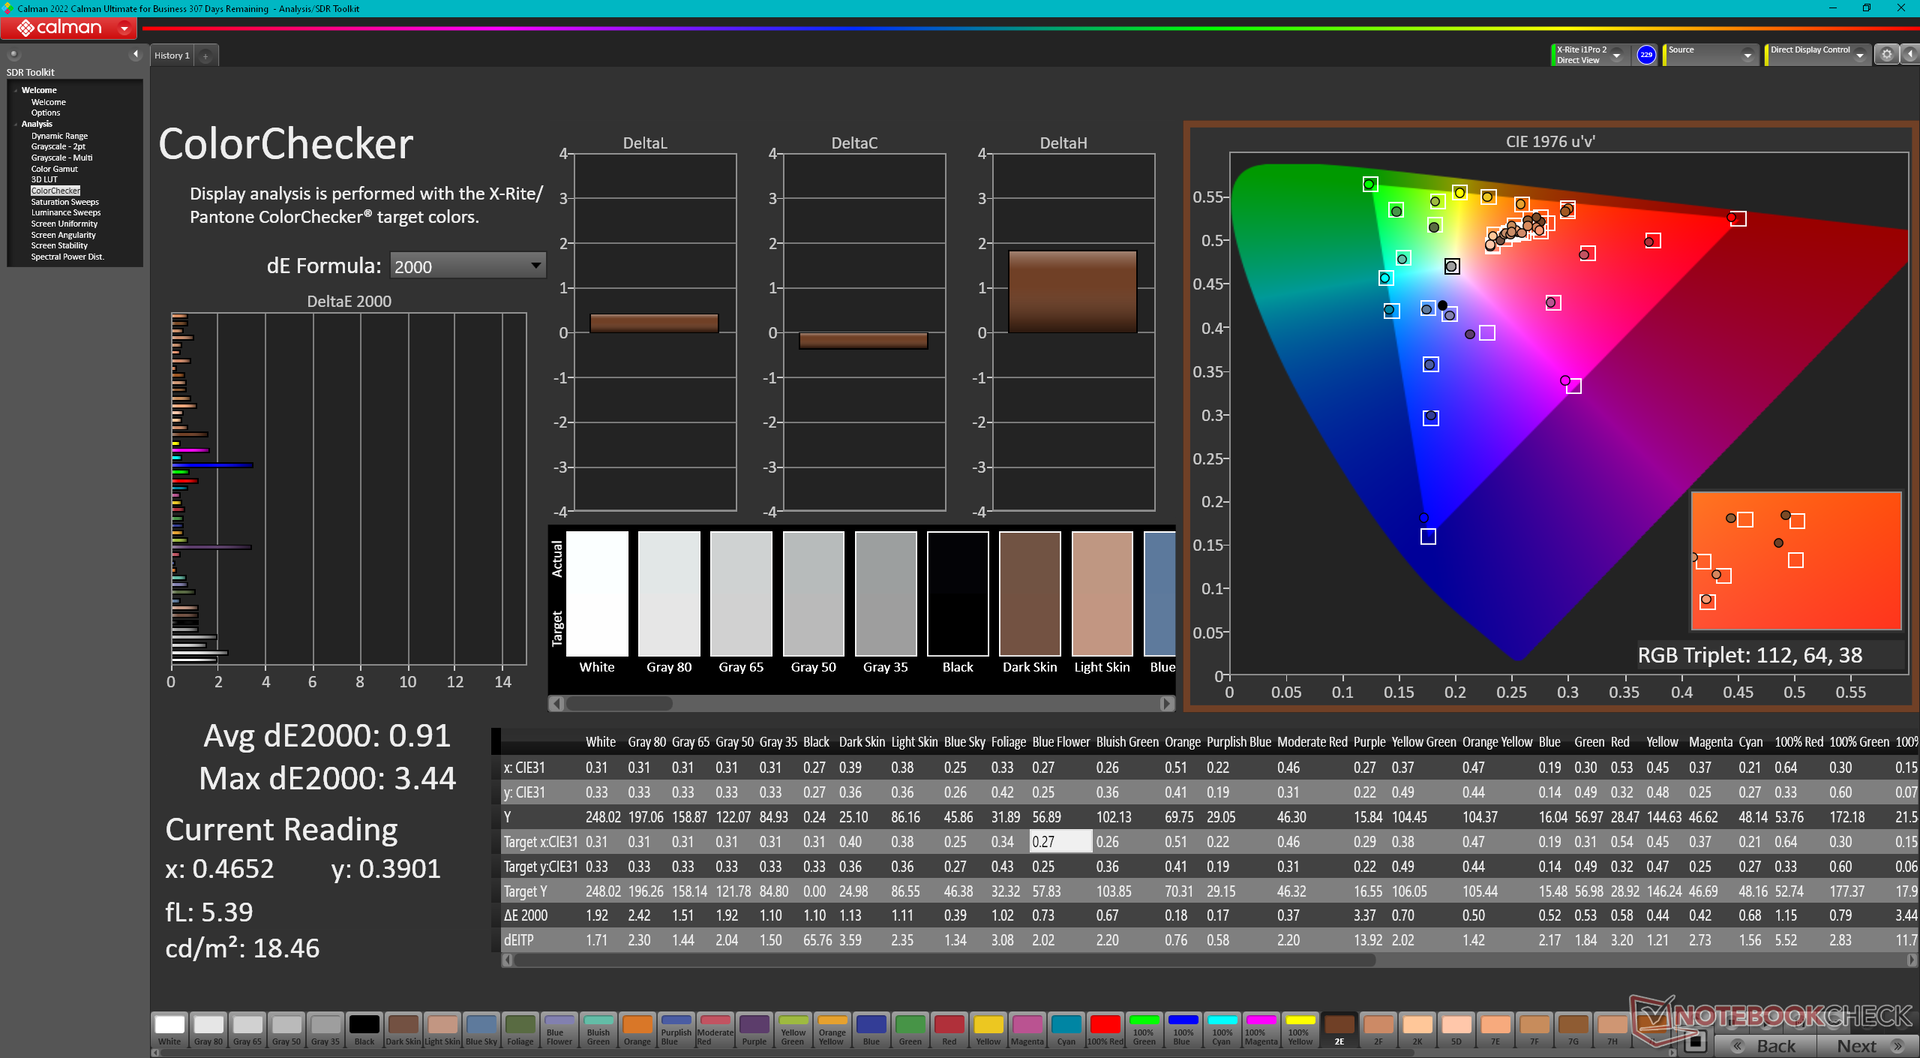
ΔE ColorChecker Calman: 3.34 | ∀{0.5-29.43 Ø4.72}
calibrated: 0.91
ΔE Greyscale Calman: 5.3 | ∀{0.09-98 Ø4.97}
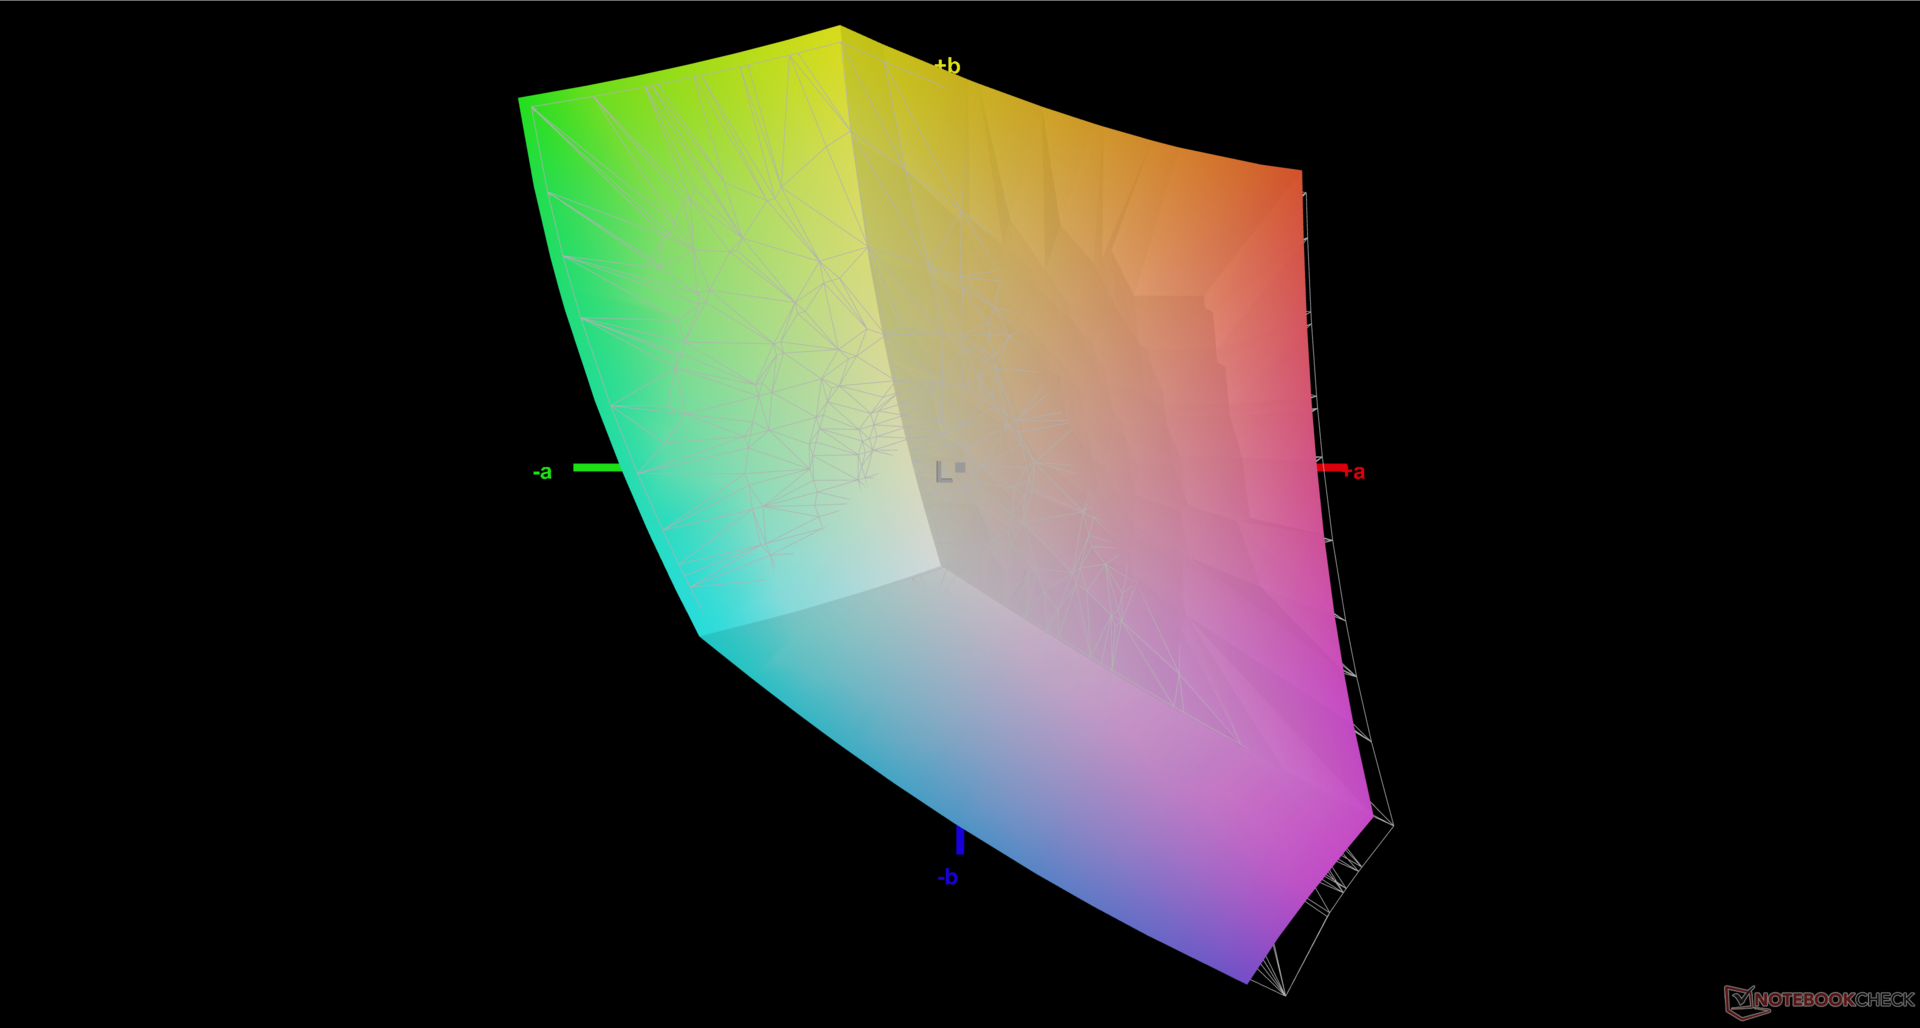
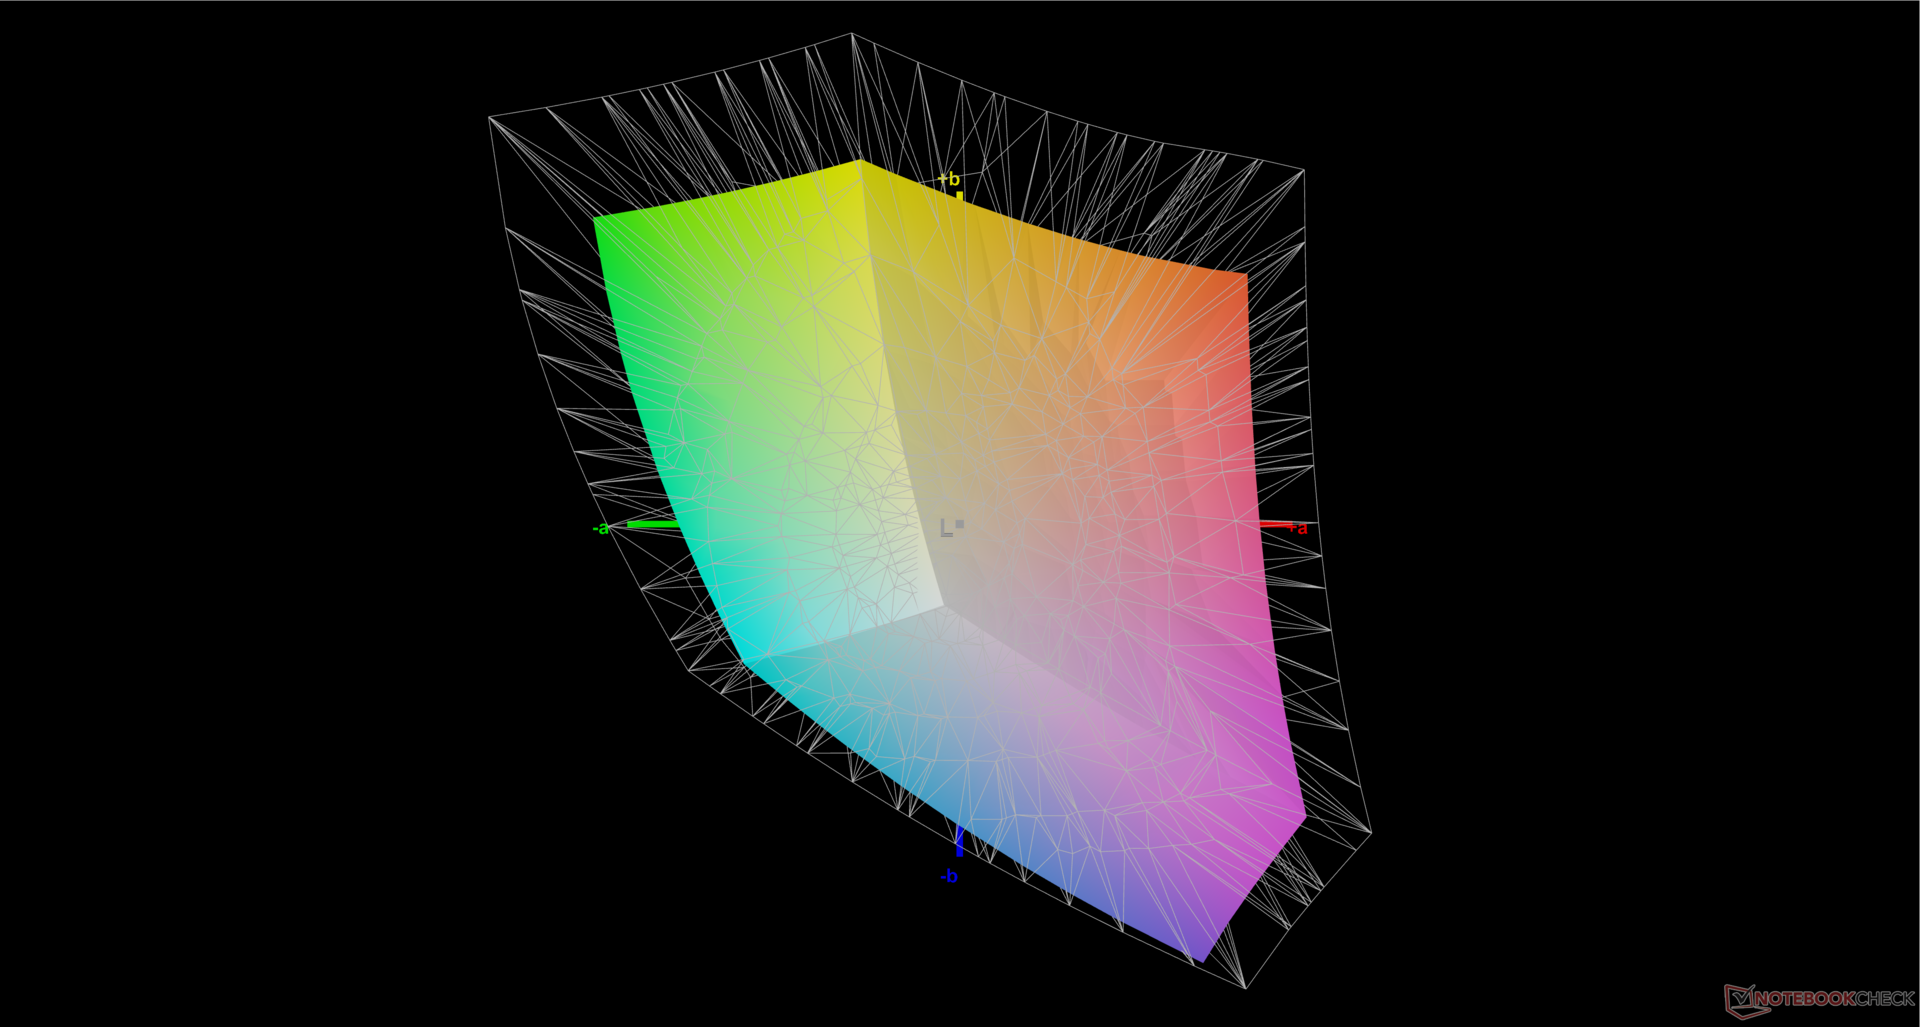
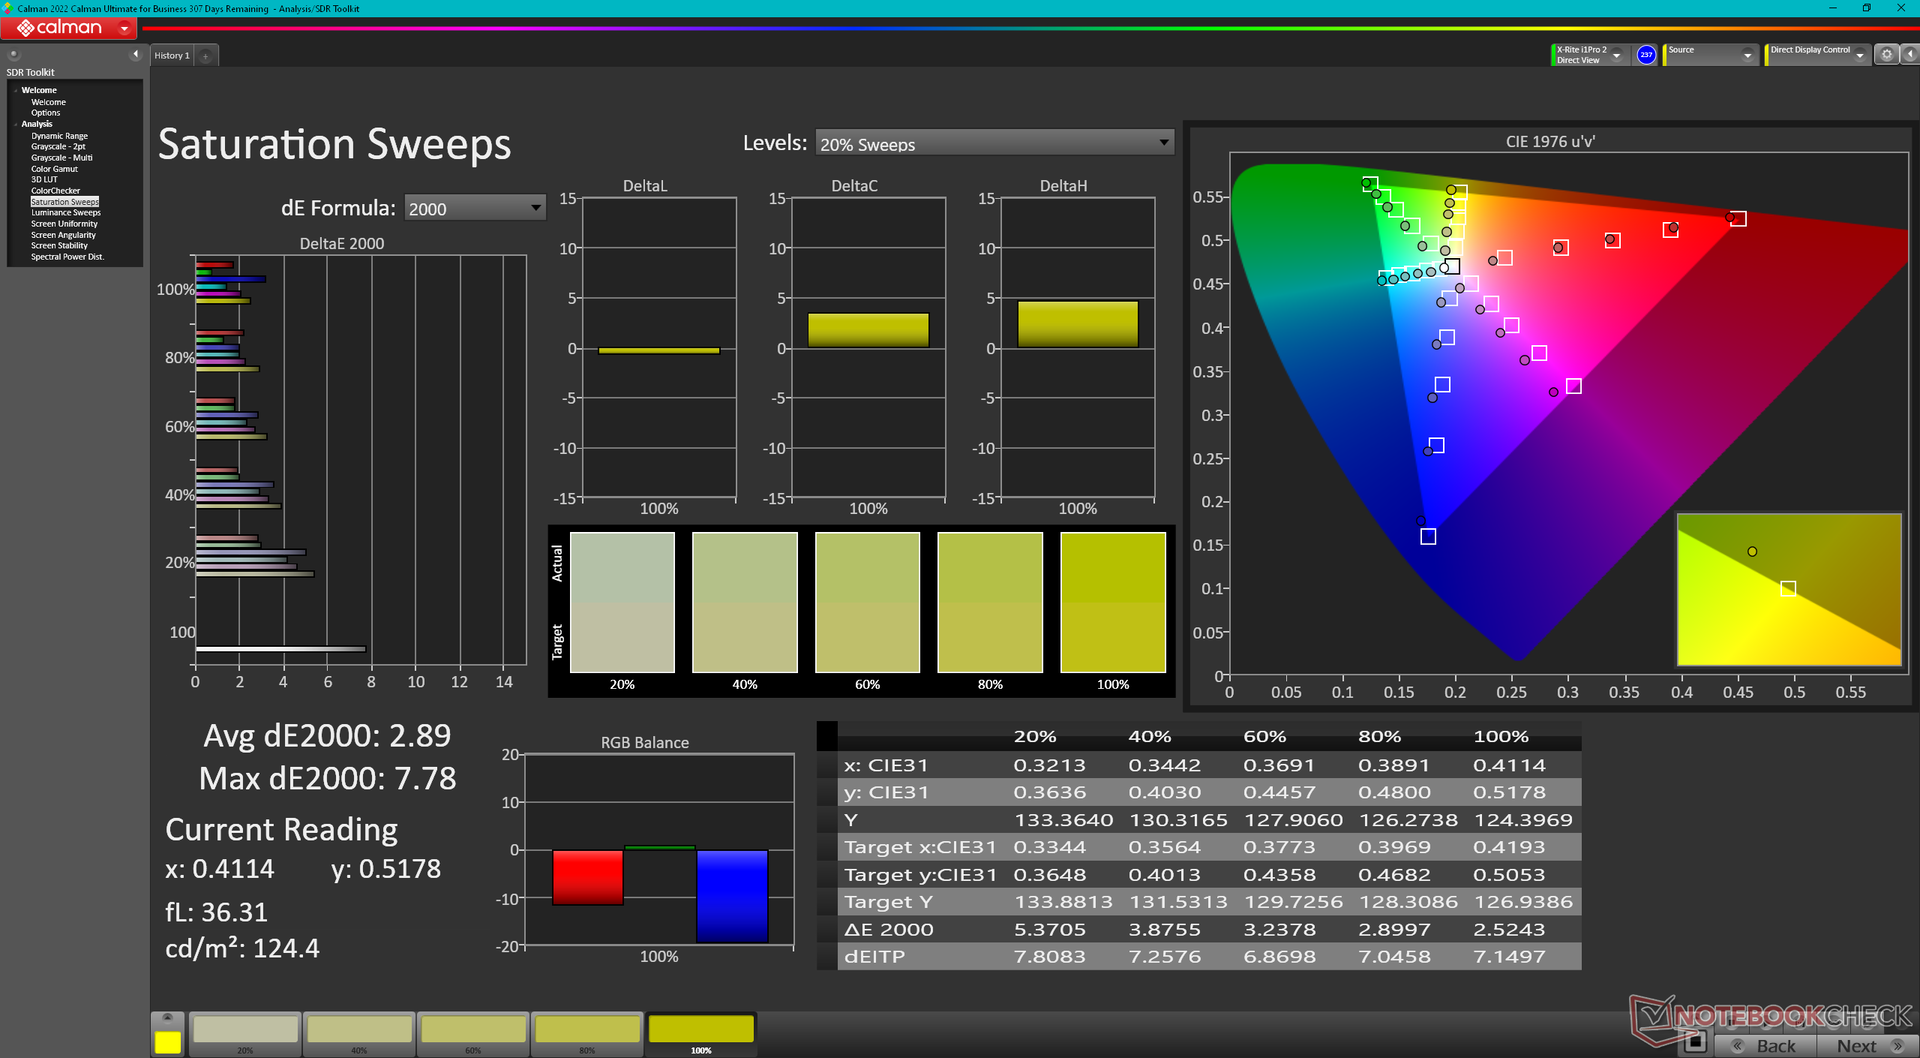
69.8% AdobeRGB 1998 (Argyll 3D)
96.5% sRGB (Argyll 3D)
67.7% Display P3 (Argyll 3D)
Gamma: 2.25
CCT: 7387 K
| Eurocom C315 Blitz BOE HF NE156QUM-N64, IPS, 3840x2160, 15.6" | Schenker Work 15 Tiger Lake-H BOE07D8, IPS, 1920x1080, 15.6" | Lenovo ThinkPad L15 Gen 4 21H70021GE N156HCA-E5B, IPS, 1920x1080, 15.6" | Acer Aspire 5 A515-58GM-76S8 LP156WFH-SPD5, IPS, 1920x1080, 15.6" | Asus VivoBook S15 M3502RA-L1029W Samsung SDC4161, OLED, 1920x1080, 15.6" | Samsung Galaxy Book2 15 NE156FHM-NS0, IPS, 1920x1080, 15.6" | |
|---|---|---|---|---|---|---|
| Display | -9% | -37% | -43% | 31% | -25% | |
| Display P3 Coverage (%) | 67.7 | 64.5 -5% | 41.8 -38% | 38.11 -44% | 99.9 48% | 49.6 -27% |
| sRGB Coverage (%) | 96.5 | 86.2 -11% | 62.5 -35% | 57.7 -40% | 100 4% | 74.8 -22% |
| AdobeRGB 1998 Coverage (%) | 69.8 | 62.9 -10% | 43.2 -38% | 39.41 -44% | 98.6 41% | 51.3 -27% |
| Response Times | -4% | 49% | 34% | 97% | 35% | |
| Response Time Grey 50% / Grey 80% * (ms) | 54.4 ? | 58.4 ? -7% | 24.4 ? 55% | 33.6 ? 38% | 0.74 99% | 32.3 ? 41% |
| Response Time Black / White * (ms) | 34.8 ? | 35.2 ? -1% | 19.7 ? 43% | 24.8 ? 29% | 2 ? 94% | 25 ? 28% |
| PWM Frequency (Hz) | 59 ? | |||||
| Bildschirm | -25% | -53% | -77% | 8% | -42% | |
| Helligkeit Bildmitte (cd/m²) | 262.5 | 329 25% | 275 5% | 257.4 -2% | 378 44% | 337 28% |
| Brightness (cd/m²) | 260 | 316 22% | 252 -3% | 248 -5% | 378 45% | 325 25% |
| Brightness Distribution (%) | 85 | 92 8% | 84 -1% | 88 4% | 98 15% | 89 5% |
| Schwarzwert * (cd/m²) | 0.25 | 0.3 -20% | 0.16 36% | 0.3209 -28% | 0.4 -60% | |
| Kontrast (:1) | 1050 | 1097 4% | 1719 64% | 802 -24% | 843 -20% | |
| Delta E Colorchecker * | 3.34 | 5.4 -62% | 6.2 -86% | 6.26 -87% | 2.2 34% | 4.7 -41% |
| Colorchecker dE 2000 max. * | 7.72 | 10.1 -31% | 19.2 -149% | 18.28 -137% | 4.87 37% | 15.7 -103% |
| Colorchecker dE 2000 calibrated * | 0.91 | 2.5 -175% | 4.2 -362% | 4.99 -448% | 2.68 -195% | 2.8 -208% |
| Delta E Graustufen * | 5.3 | 5.1 4% | 4.1 23% | 3.7 30% | 1.43 73% | 5.4 -2% |
| Gamma | 2.25 98% | 2.1 105% | 1.91 115% | 2.186 101% | 2.47 89% | 2.07 106% |
| CCT | 7387 88% | 7609 85% | 6352 102% | 6606 98% | 6464 101% | 7727 84% |
| Durchschnitt gesamt (Programm / Settings) | -13% /
-19% | -14% /
-35% | -29% /
-54% | 45% /
28% | -11% /
-27% |
* ... kleinere Werte sind besser
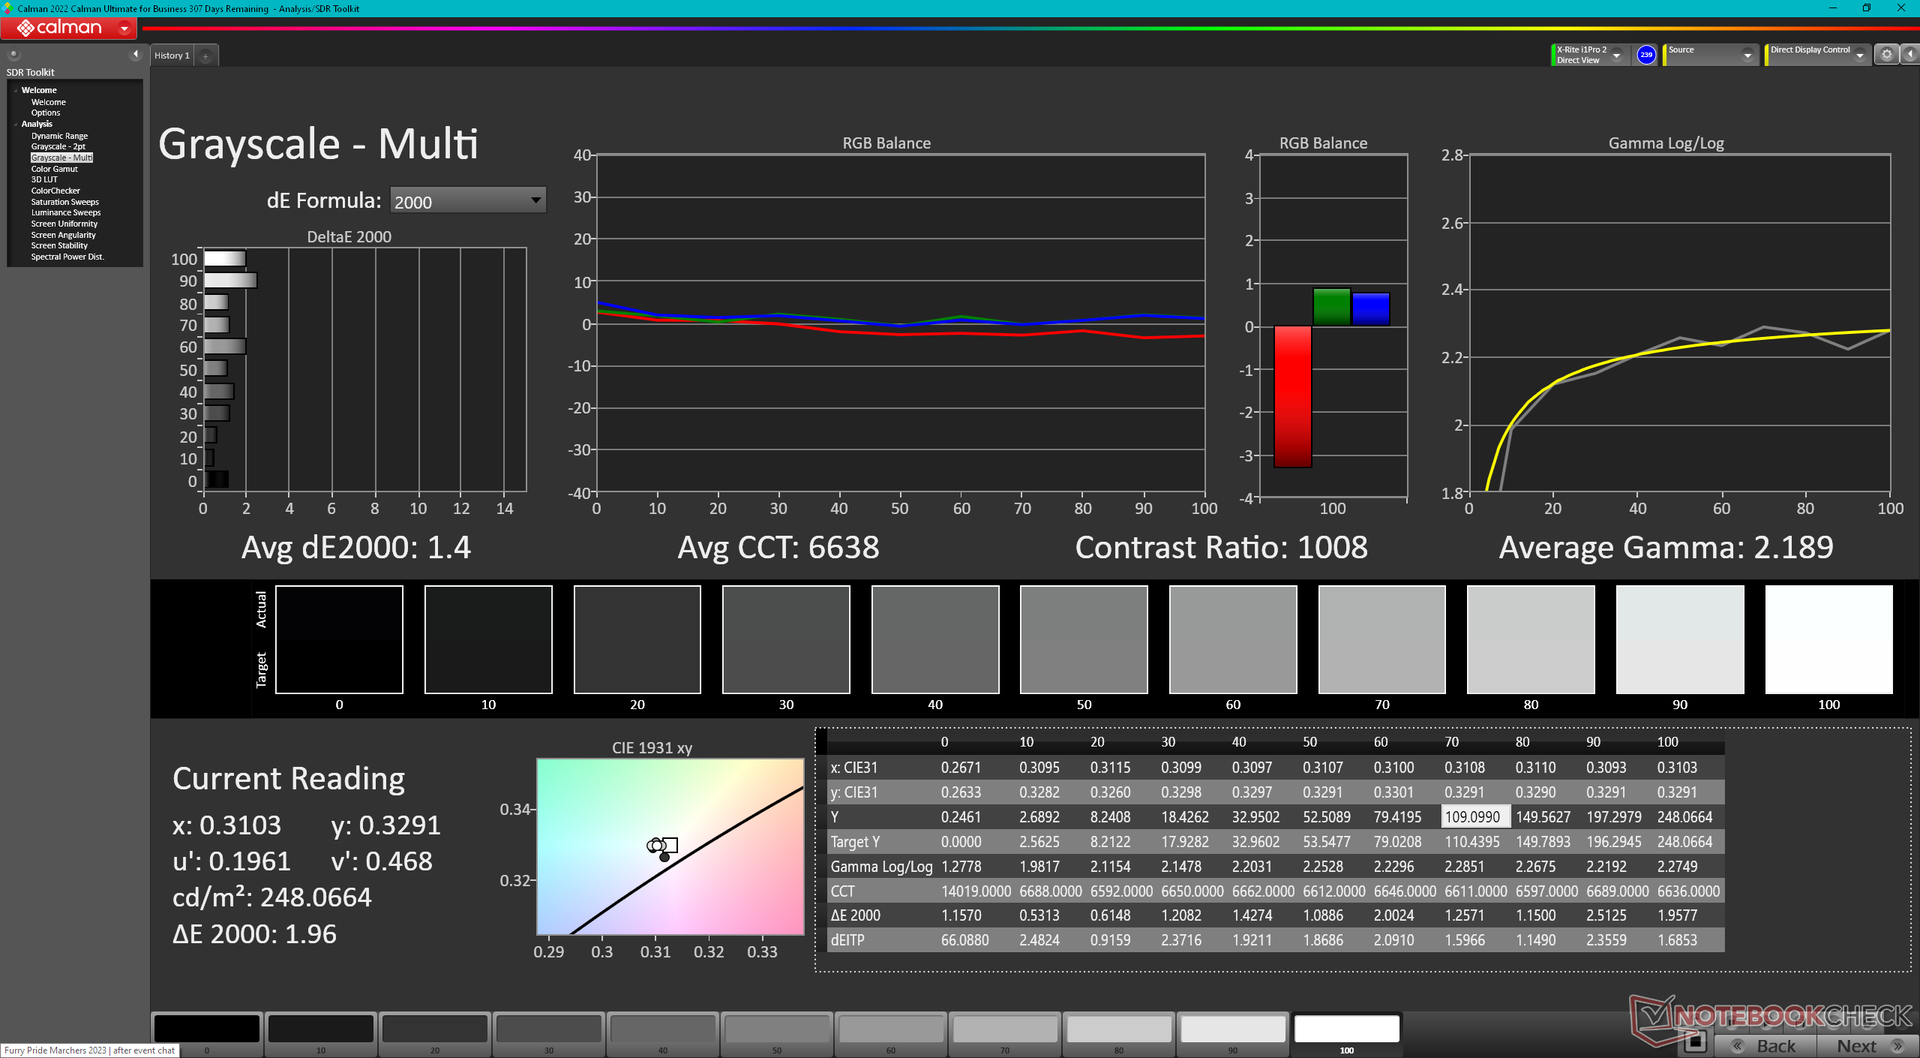
Das Display wird nicht vorkalibriert geliefert. Eurocom bietet jedoch optionale Kalibrierungsdienste für Benutzer an, die keinen Zugang zu Farbmessgeräten haben. Wir sind in der Lage, mit unserem eigenen X-Rite-Farbmessgerät durchschnittliche DeltaE-Werte bis hinunter zu <2 zu erreichen.
Reaktionszeiten (Response Times) des Displays
| ↔ Reaktionszeiten Schwarz zu Weiß | ||
|---|---|---|
| 34.8 ms ... steigend ↗ und fallend ↘ kombiniert | ↗ 16.8 ms steigend | 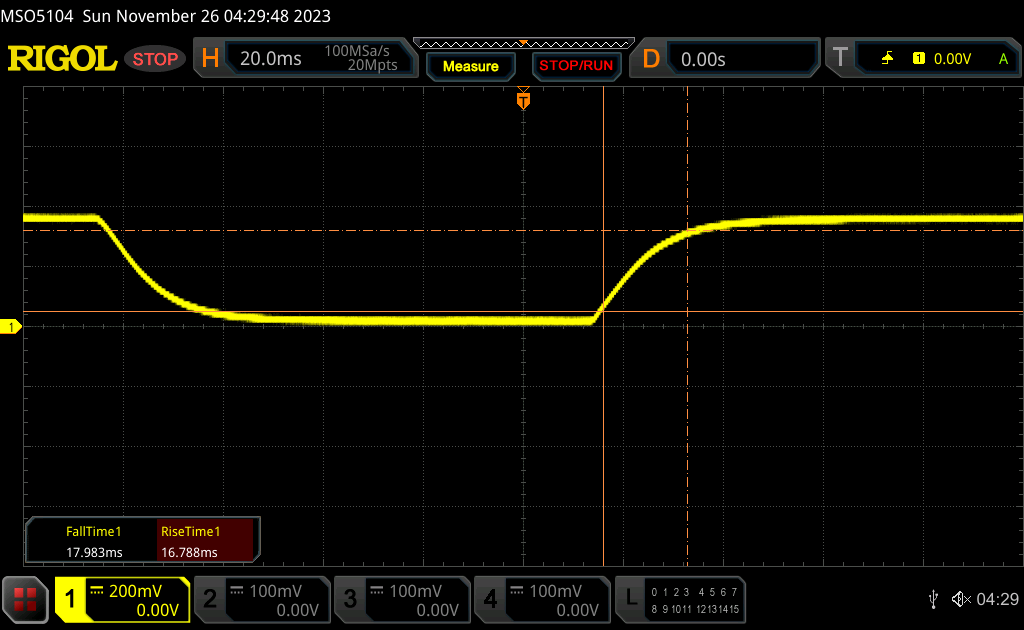 |
| ↘ 18 ms fallend | ||
| Die gemessenen Reaktionszeiten sind langsam und dadurch für viele Spieler wahrscheinlich zu langsam. Im Vergleich rangierten die bei uns getesteten Geräte von 0.1 (Minimum) zu 240 (Maximum) ms. » 92 % aller Screens waren schneller als der getestete. Daher sind die gemessenen Reaktionszeiten schlechter als der Durchschnitt aller vermessenen Geräte (19.8 ms). | ||
| ↔ Reaktionszeiten 50% Grau zu 80% Grau | ||
| 54.4 ms ... steigend ↗ und fallend ↘ kombiniert | ↗ 25.3 ms steigend | 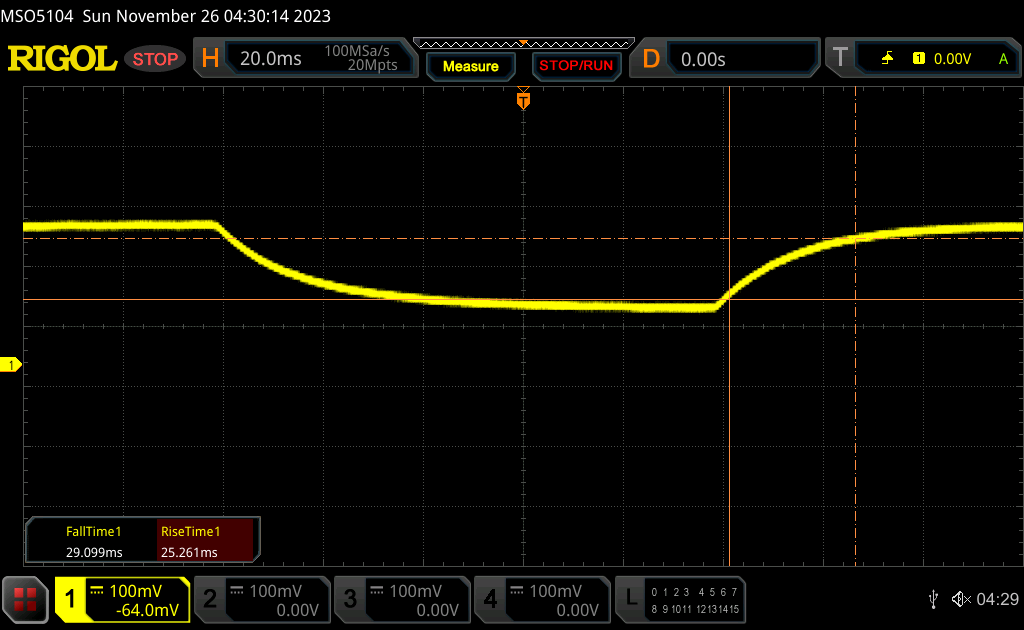 |
| ↘ 29.1 ms fallend | ||
| Die gemessenen Reaktionszeiten sind langsam und dadurch für viele Spieler wahrscheinlich zu langsam. Im Vergleich rangierten die bei uns getesteten Geräte von 0.165 (Minimum) zu 636 (Maximum) ms. » 91 % aller Screens waren schneller als der getestete. Daher sind die gemessenen Reaktionszeiten schlechter als der Durchschnitt aller vermessenen Geräte (31 ms). | ||
Bildschirm-Flackern / PWM (Pulse-Width Modulation)
| Flackern / PWM nicht festgestellt | 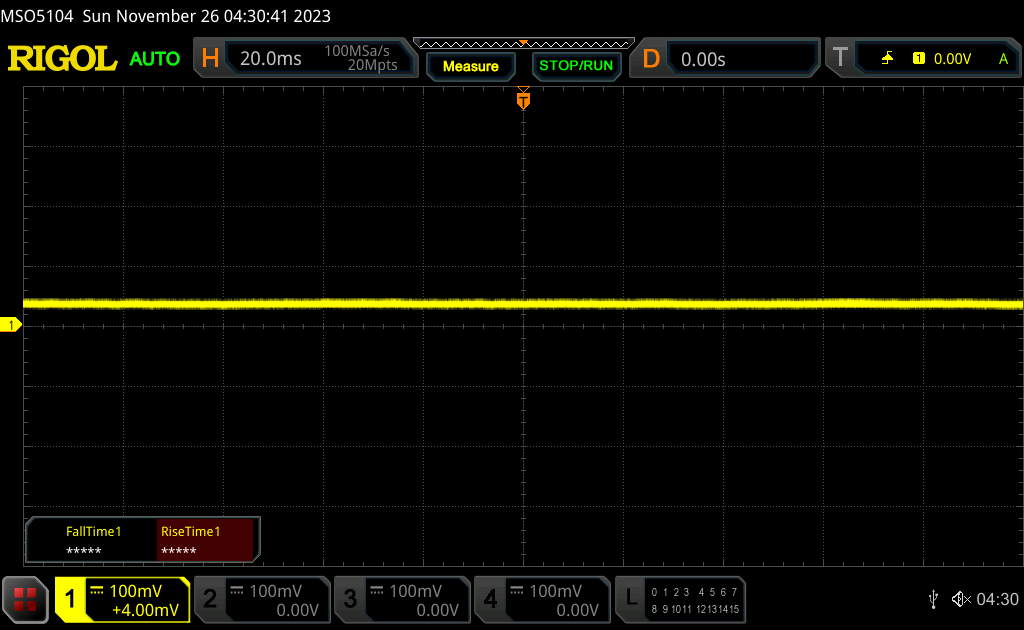 | ||
Im Vergleich: 52 % aller getesteten Geräte nutzten kein PWM um die Helligkeit zu reduzieren. Wenn PWM eingesetzt wurde, dann bei einer Frequenz von durchschnittlich 7763 (Minimum 5, Maximum 343500) Hz. | |||
Performance

Testbedingungen
Wir haben Windows auf den Performance-Modus eingestellt, bevor wir die folgenden Benchmarks durchgeführt haben. Das System enthält keine spezielle "Control Center"-Software zur Anpassung von Zusatzfunktionen oder zusätzlichen Leistungsprofilen.
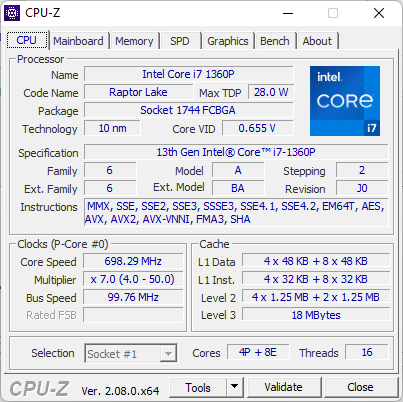
Prozessor
Der Core i7-1360P ist eine etwas zwiespältige Angelegenheit. Auf der einen Seite bietet er eine ähnliche Leistung wie der ältere und anspruchsvollere Core i7-11370H im Schenker Work 15. Andererseits bleibt er aber hinter Alternativen wie dem Core i7-1355U oder dem Ryzen 7 5700U zurück. Außerdem leidet er unter Throttling, da unser anfänglicher CineBench R15 xT Score von 1079 Punkten um etwa 21 Prozent abfällt, wenn der Benchmark in einer Schleife läuft.
Die Core i7-CPU schneidet bei unserem Eurocom definitiv unterdurchschnittlich ab. Der Core i5-1340P im Samsung Galaxy Book3 Pro 360 16 zum Beispiel würde laut mehreren Multi-Thread-Benchmarks 50 bis 70 Prozent schneller laufen.
Cinebench R15 Multi Dauertest
Cinebench R23: Multi Core | Single Core
Cinebench R20: CPU (Multi Core) | CPU (Single Core)
Cinebench R15: CPU Multi 64Bit | CPU Single 64Bit
Blender: v2.79 BMW27 CPU
7-Zip 18.03: 7z b 4 | 7z b 4 -mmt1
Geekbench 5.5: Multi-Core | Single-Core
HWBOT x265 Benchmark v2.2: 4k Preset
LibreOffice : 20 Documents To PDF
R Benchmark 2.5: Overall mean
* ... kleinere Werte sind besser
AIDA64: FP32 Ray-Trace | FPU Julia | CPU SHA3 | CPU Queen | FPU SinJulia | FPU Mandel | CPU AES | CPU ZLib | FP64 Ray-Trace | CPU PhotoWorxx
| Performance Rating | |
| Asus VivoBook S15 M3502RA-L1029W | |
| Lenovo ThinkPad L15 Gen 4 21H70021GE | |
| Durchschnittliche Intel Core i7-1360P | |
| Acer Aspire 5 A515-58GM-76S8 | |
| Schenker Work 15 Tiger Lake-H | |
| Samsung Galaxy Book2 15 | |
| Eurocom C315 Blitz | |
| AIDA64 / FP32 Ray-Trace | |
| Asus VivoBook S15 M3502RA-L1029W | |
| Lenovo ThinkPad L15 Gen 4 21H70021GE | |
| Durchschnittliche Intel Core i7-1360P (5610 - 11188, n=17) | |
| Acer Aspire 5 A515-58GM-76S8 | |
| Schenker Work 15 Tiger Lake-H | |
| Samsung Galaxy Book2 15 | |
| Eurocom C315 Blitz | |
| AIDA64 / FPU Julia | |
| Asus VivoBook S15 M3502RA-L1029W | |
| Lenovo ThinkPad L15 Gen 4 21H70021GE | |
| Durchschnittliche Intel Core i7-1360P (29251 - 56942, n=16) | |
| Acer Aspire 5 A515-58GM-76S8 | |
| Schenker Work 15 Tiger Lake-H | |
| Eurocom C315 Blitz | |
| Samsung Galaxy Book2 15 | |
| AIDA64 / CPU SHA3 | |
| Asus VivoBook S15 M3502RA-L1029W | |
| Lenovo ThinkPad L15 Gen 4 21H70021GE | |
| Durchschnittliche Intel Core i7-1360P (1444 - 2728, n=16) | |
| Acer Aspire 5 A515-58GM-76S8 | |
| Schenker Work 15 Tiger Lake-H | |
| Eurocom C315 Blitz | |
| Samsung Galaxy Book2 15 | |
| AIDA64 / CPU Queen | |
| Asus VivoBook S15 M3502RA-L1029W | |
| Lenovo ThinkPad L15 Gen 4 21H70021GE | |
| Durchschnittliche Intel Core i7-1360P (65324 - 89266, n=16) | |
| Eurocom C315 Blitz | |
| Samsung Galaxy Book2 15 | |
| Acer Aspire 5 A515-58GM-76S8 | |
| Schenker Work 15 Tiger Lake-H | |
| AIDA64 / FPU SinJulia | |
| Asus VivoBook S15 M3502RA-L1029W | |
| Lenovo ThinkPad L15 Gen 4 21H70021GE | |
| Samsung Galaxy Book2 15 | |
| Durchschnittliche Intel Core i7-1360P (4370 - 7269, n=16) | |
| Acer Aspire 5 A515-58GM-76S8 | |
| Schenker Work 15 Tiger Lake-H | |
| Eurocom C315 Blitz | |
| AIDA64 / FPU Mandel | |
| Asus VivoBook S15 M3502RA-L1029W | |
| Lenovo ThinkPad L15 Gen 4 21H70021GE | |
| Durchschnittliche Intel Core i7-1360P (14104 - 28019, n=16) | |
| Acer Aspire 5 A515-58GM-76S8 | |
| Schenker Work 15 Tiger Lake-H | |
| Eurocom C315 Blitz | |
| Samsung Galaxy Book2 15 | |
| AIDA64 / CPU AES | |
| Asus VivoBook S15 M3502RA-L1029W | |
| Acer Aspire 5 A515-58GM-76S8 | |
| Schenker Work 15 Tiger Lake-H | |
| Durchschnittliche Intel Core i7-1360P (30391 - 99244, n=16) | |
| Lenovo ThinkPad L15 Gen 4 21H70021GE | |
| Samsung Galaxy Book2 15 | |
| Eurocom C315 Blitz | |
| AIDA64 / CPU ZLib | |
| Asus VivoBook S15 M3502RA-L1029W | |
| Lenovo ThinkPad L15 Gen 4 21H70021GE | |
| Samsung Galaxy Book2 15 | |
| Durchschnittliche Intel Core i7-1360P (420 - 807, n=16) | |
| Acer Aspire 5 A515-58GM-76S8 | |
| Eurocom C315 Blitz | |
| Schenker Work 15 Tiger Lake-H | |
| AIDA64 / FP64 Ray-Trace | |
| Asus VivoBook S15 M3502RA-L1029W | |
| Lenovo ThinkPad L15 Gen 4 21H70021GE | |
| Durchschnittliche Intel Core i7-1360P (2906 - 5957, n=16) | |
| Acer Aspire 5 A515-58GM-76S8 | |
| Schenker Work 15 Tiger Lake-H | |
| Samsung Galaxy Book2 15 | |
| Eurocom C315 Blitz | |
| AIDA64 / CPU PhotoWorxx | |
| Durchschnittliche Intel Core i7-1360P (29108 - 49328, n=16) | |
| Samsung Galaxy Book2 15 | |
| Eurocom C315 Blitz | |
| Schenker Work 15 Tiger Lake-H | |
| Asus VivoBook S15 M3502RA-L1029W | |
| Acer Aspire 5 A515-58GM-76S8 | |
| Lenovo ThinkPad L15 Gen 4 21H70021GE | |
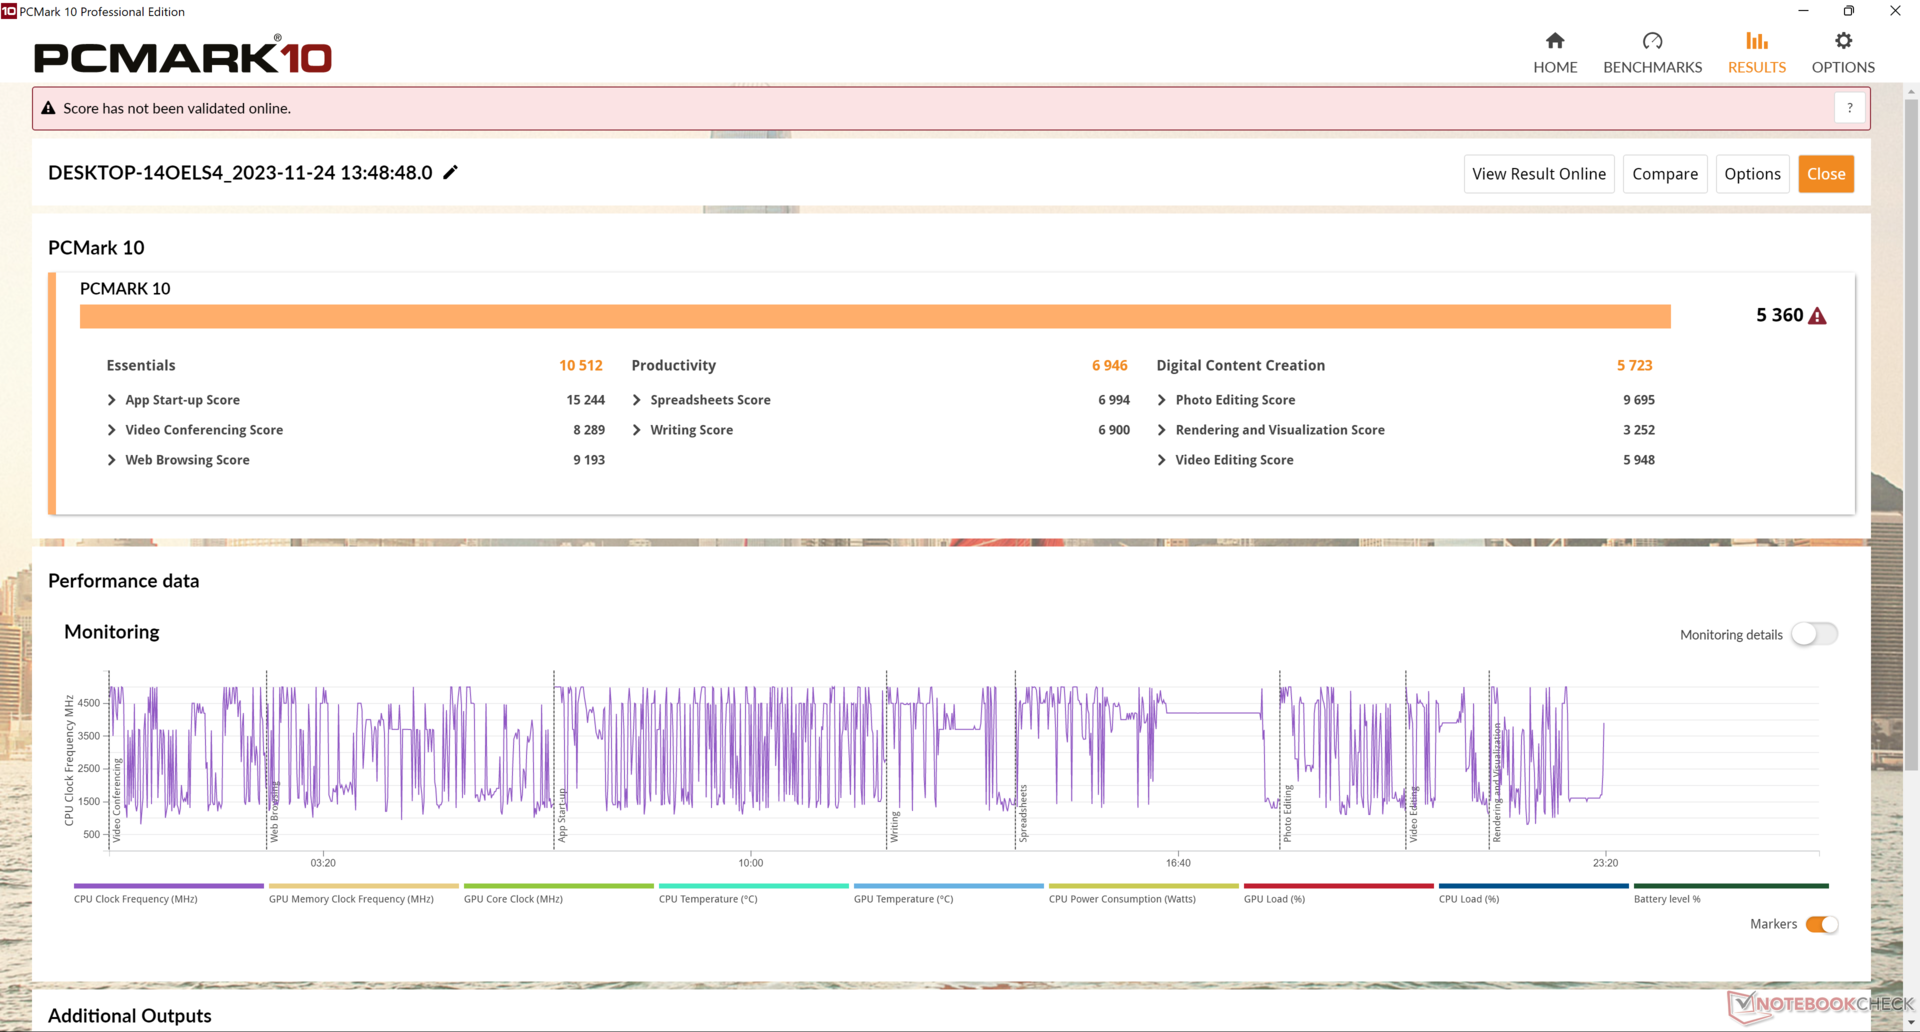
System Performance
Die PCMark-Ergebnisse sind im Wesentlichen identisch mit denen des Schenker Work 15, das mit dem älteren und stromhungrigeren Core i7-11370H läuft.
CrossMark: Overall | Productivity | Creativity | Responsiveness
| PCMark 10 / Score | |
| Asus VivoBook S15 M3502RA-L1029W | |
| Acer Aspire 5 A515-58GM-76S8 | |
| Durchschnittliche Intel Core i7-1360P, Intel Iris Xe Graphics G7 96EUs (5360 - 6281, n=14) | |
| Samsung Galaxy Book2 15 | |
| Schenker Work 15 Tiger Lake-H | |
| Lenovo ThinkPad L15 Gen 4 21H70021GE | |
| Eurocom C315 Blitz | |
| PCMark 10 / Essentials | |
| Acer Aspire 5 A515-58GM-76S8 | |
| Durchschnittliche Intel Core i7-1360P, Intel Iris Xe Graphics G7 96EUs (9883 - 12059, n=14) | |
| Schenker Work 15 Tiger Lake-H | |
| Eurocom C315 Blitz | |
| Asus VivoBook S15 M3502RA-L1029W | |
| Lenovo ThinkPad L15 Gen 4 21H70021GE | |
| Samsung Galaxy Book2 15 | |
| PCMark 10 / Productivity | |
| Asus VivoBook S15 M3502RA-L1029W | |
| Lenovo ThinkPad L15 Gen 4 21H70021GE | |
| Acer Aspire 5 A515-58GM-76S8 | |
| Durchschnittliche Intel Core i7-1360P, Intel Iris Xe Graphics G7 96EUs (6572 - 8161, n=14) | |
| Schenker Work 15 Tiger Lake-H | |
| Eurocom C315 Blitz | |
| Samsung Galaxy Book2 15 | |
| PCMark 10 / Digital Content Creation | |
| Asus VivoBook S15 M3502RA-L1029W | |
| Acer Aspire 5 A515-58GM-76S8 | |
| Durchschnittliche Intel Core i7-1360P, Intel Iris Xe Graphics G7 96EUs (5723 - 7612, n=14) | |
| Samsung Galaxy Book2 15 | |
| Schenker Work 15 Tiger Lake-H | |
| Eurocom C315 Blitz | |
| Lenovo ThinkPad L15 Gen 4 21H70021GE | |
| CrossMark / Overall | |
| Eurocom C315 Blitz | |
| Acer Aspire 5 A515-58GM-76S8 | |
| Durchschnittliche Intel Core i7-1360P, Intel Iris Xe Graphics G7 96EUs (1527 - 1891, n=15) | |
| Asus VivoBook S15 M3502RA-L1029W | |
| Lenovo ThinkPad L15 Gen 4 21H70021GE | |
| CrossMark / Productivity | |
| Acer Aspire 5 A515-58GM-76S8 | |
| Eurocom C315 Blitz | |
| Durchschnittliche Intel Core i7-1360P, Intel Iris Xe Graphics G7 96EUs (1503 - 1842, n=15) | |
| Asus VivoBook S15 M3502RA-L1029W | |
| Lenovo ThinkPad L15 Gen 4 21H70021GE | |
| CrossMark / Creativity | |
| Eurocom C315 Blitz | |
| Durchschnittliche Intel Core i7-1360P, Intel Iris Xe Graphics G7 96EUs (1558 - 2003, n=15) | |
| Asus VivoBook S15 M3502RA-L1029W | |
| Acer Aspire 5 A515-58GM-76S8 | |
| Lenovo ThinkPad L15 Gen 4 21H70021GE | |
| CrossMark / Responsiveness | |
| Acer Aspire 5 A515-58GM-76S8 | |
| Eurocom C315 Blitz | |
| Durchschnittliche Intel Core i7-1360P, Intel Iris Xe Graphics G7 96EUs (1311 - 1899, n=15) | |
| Asus VivoBook S15 M3502RA-L1029W | |
| Lenovo ThinkPad L15 Gen 4 21H70021GE | |
| PCMark 10 Score | 5360 Punkte | |
Hilfe | ||
| AIDA64 / Memory Copy | |
| Eurocom C315 Blitz | |
| Samsung Galaxy Book2 15 | |
| Durchschnittliche Intel Core i7-1360P (44299 - 72748, n=16) | |
| Asus VivoBook S15 M3502RA-L1029W | |
| Schenker Work 15 Tiger Lake-H | |
| Acer Aspire 5 A515-58GM-76S8 | |
| Lenovo ThinkPad L15 Gen 4 21H70021GE | |
| AIDA64 / Memory Read | |
| Eurocom C315 Blitz | |
| Samsung Galaxy Book2 15 | |
| Durchschnittliche Intel Core i7-1360P (44751 - 68945, n=16) | |
| Asus VivoBook S15 M3502RA-L1029W | |
| Schenker Work 15 Tiger Lake-H | |
| Acer Aspire 5 A515-58GM-76S8 | |
| Lenovo ThinkPad L15 Gen 4 21H70021GE | |
| AIDA64 / Memory Write | |
| Eurocom C315 Blitz | |
| Durchschnittliche Intel Core i7-1360P (45887 - 93331, n=16) | |
| Samsung Galaxy Book2 15 | |
| Asus VivoBook S15 M3502RA-L1029W | |
| Schenker Work 15 Tiger Lake-H | |
| Acer Aspire 5 A515-58GM-76S8 | |
| Lenovo ThinkPad L15 Gen 4 21H70021GE | |
| AIDA64 / Memory Latency | |
| Lenovo ThinkPad L15 Gen 4 21H70021GE | |
| Durchschnittliche Intel Core i7-1360P (85 - 110.5, n=16) | |
| Asus VivoBook S15 M3502RA-L1029W | |
| Eurocom C315 Blitz | |
| Schenker Work 15 Tiger Lake-H | |
| Acer Aspire 5 A515-58GM-76S8 | |
| Samsung Galaxy Book2 15 | |
* ... kleinere Werte sind besser
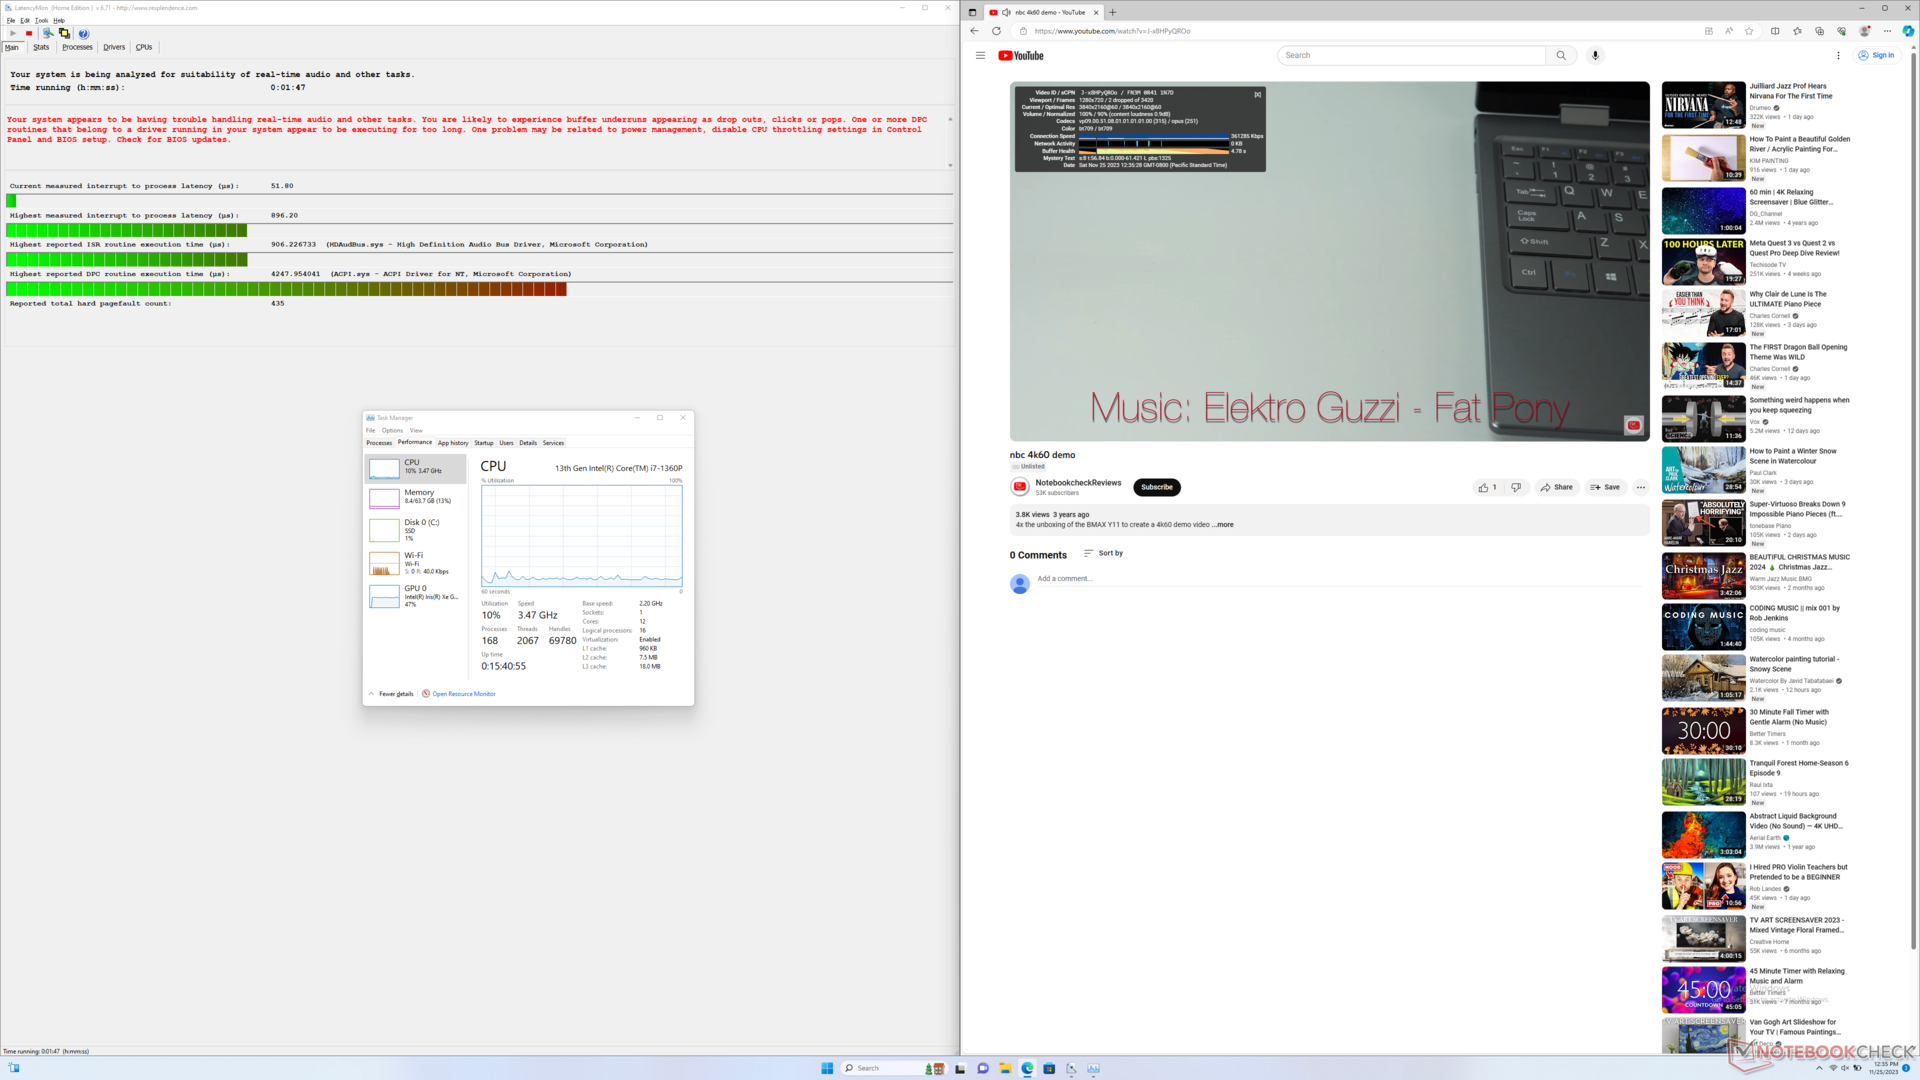
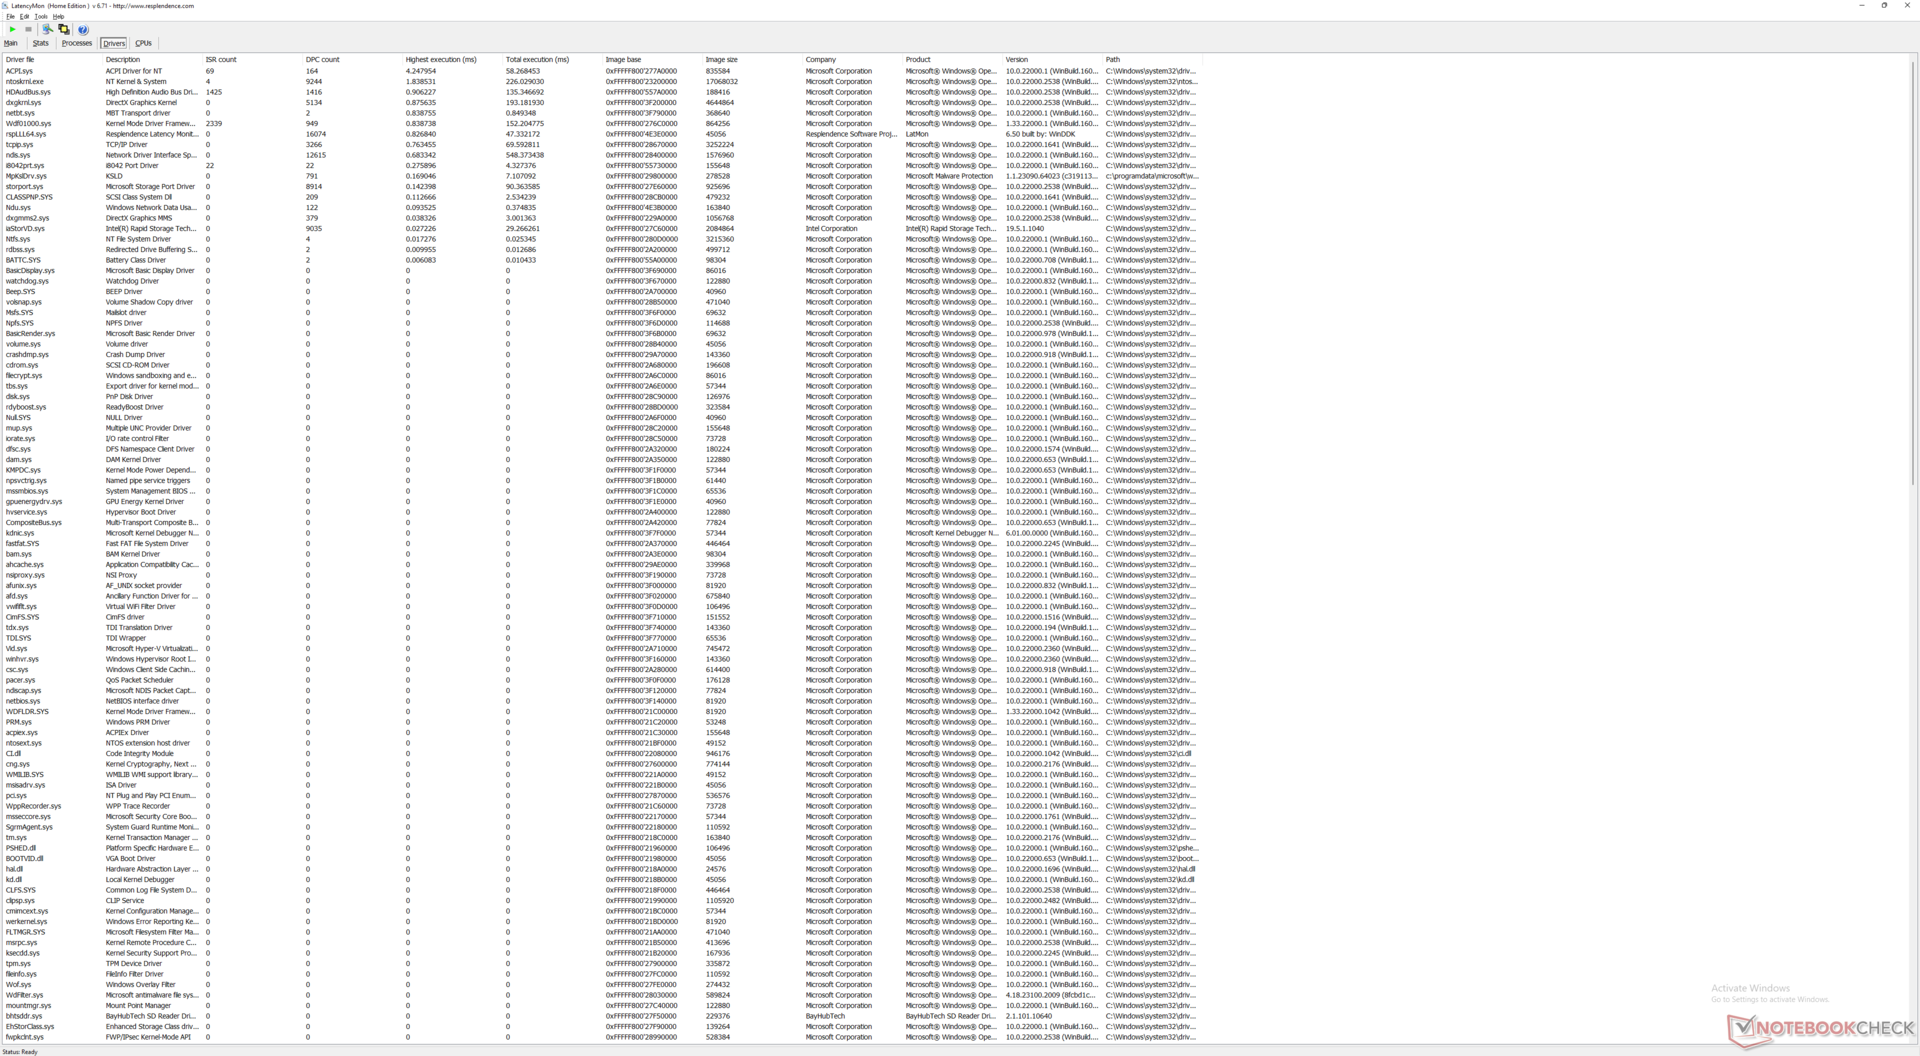
DPC-Latenzen
LatencyMon zeigt DPC-Probleme beim Öffnen mehrerer Browser-Tabs unserer Homepage. Die 4K-Videowiedergabe bei 60 FPS ist hervorragend. In einem Zeitraum von einer Minute gab es nur zwei Bildaussetzer.
| DPC Latencies / LatencyMon - interrupt to process latency (max), Web, Youtube, Prime95 | |
| Lenovo ThinkPad L15 Gen 4 21H70021GE | |
| Schenker Work 15 Tiger Lake-H | |
| Acer Aspire 5 A515-58GM-76S8 | |
| Eurocom C315 Blitz | |
| Samsung Galaxy Book2 15 | |
| Asus VivoBook S15 M3502RA-L1029W | |
* ... kleinere Werte sind besser
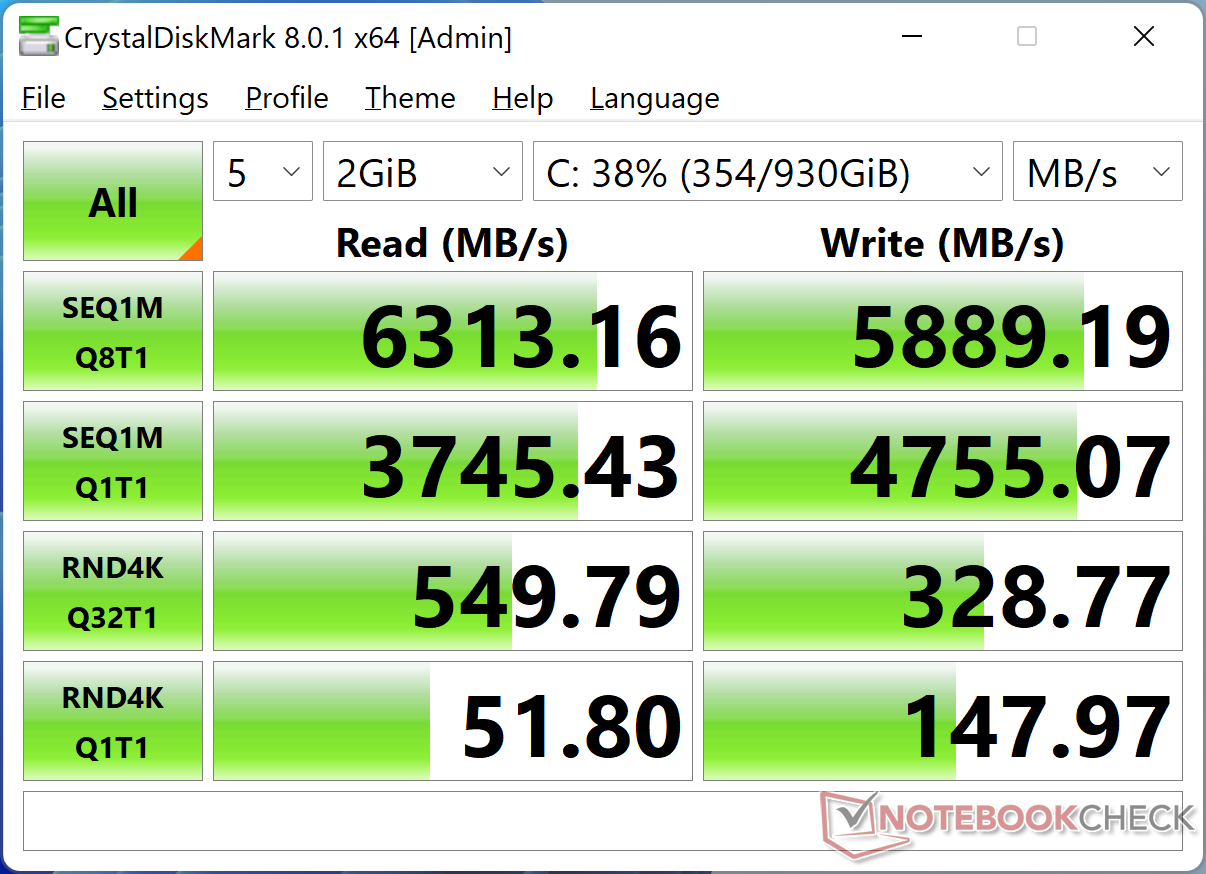
Massenspeicher
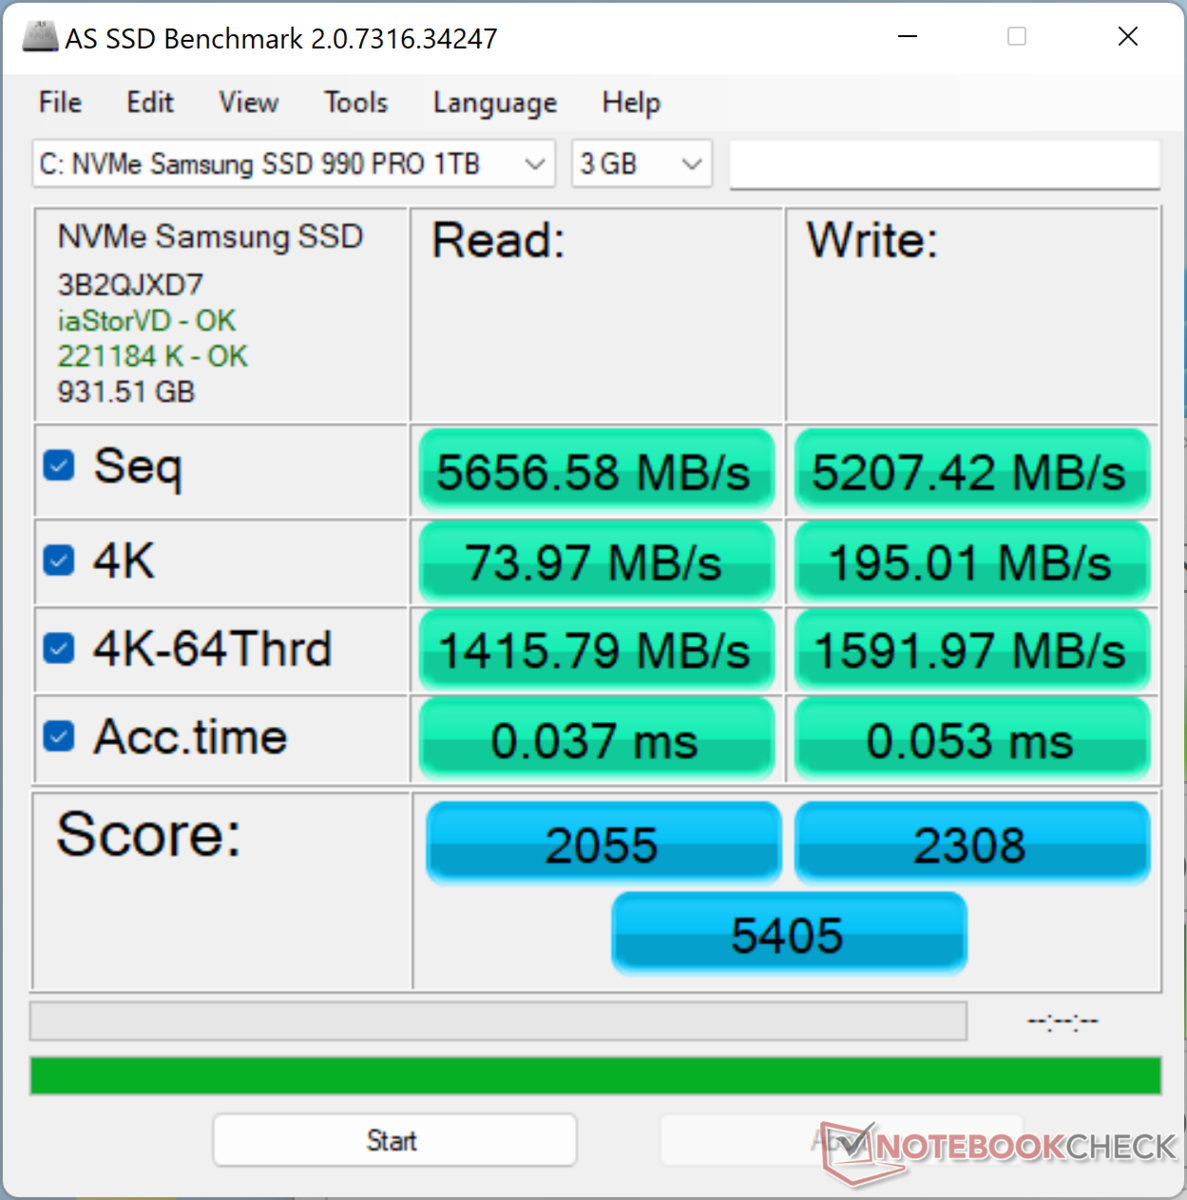
Unser Gerät wird mit einer High-End-Festplatte Samsung 990 Pro ausgeliefert, die sequenzielle Lese- und Schreibgeschwindigkeiten von bis zu 7450 MB/s bzw. 6900 MB/s verspricht. Das Laufwerk in unserem Gerät kann ein Maximum von 7100 MB/s ohne Drosselungsprobleme aufrechterhalten. Das mitgelieferte Wärmeleitpad auf der SSD ermöglicht die Ableitung von Wärme an die Metallbodenplatte.

* ... kleinere Werte sind besser
Disk Throttling: DiskSpd Read Loop, Queue Depth 8
GPU-Leistung
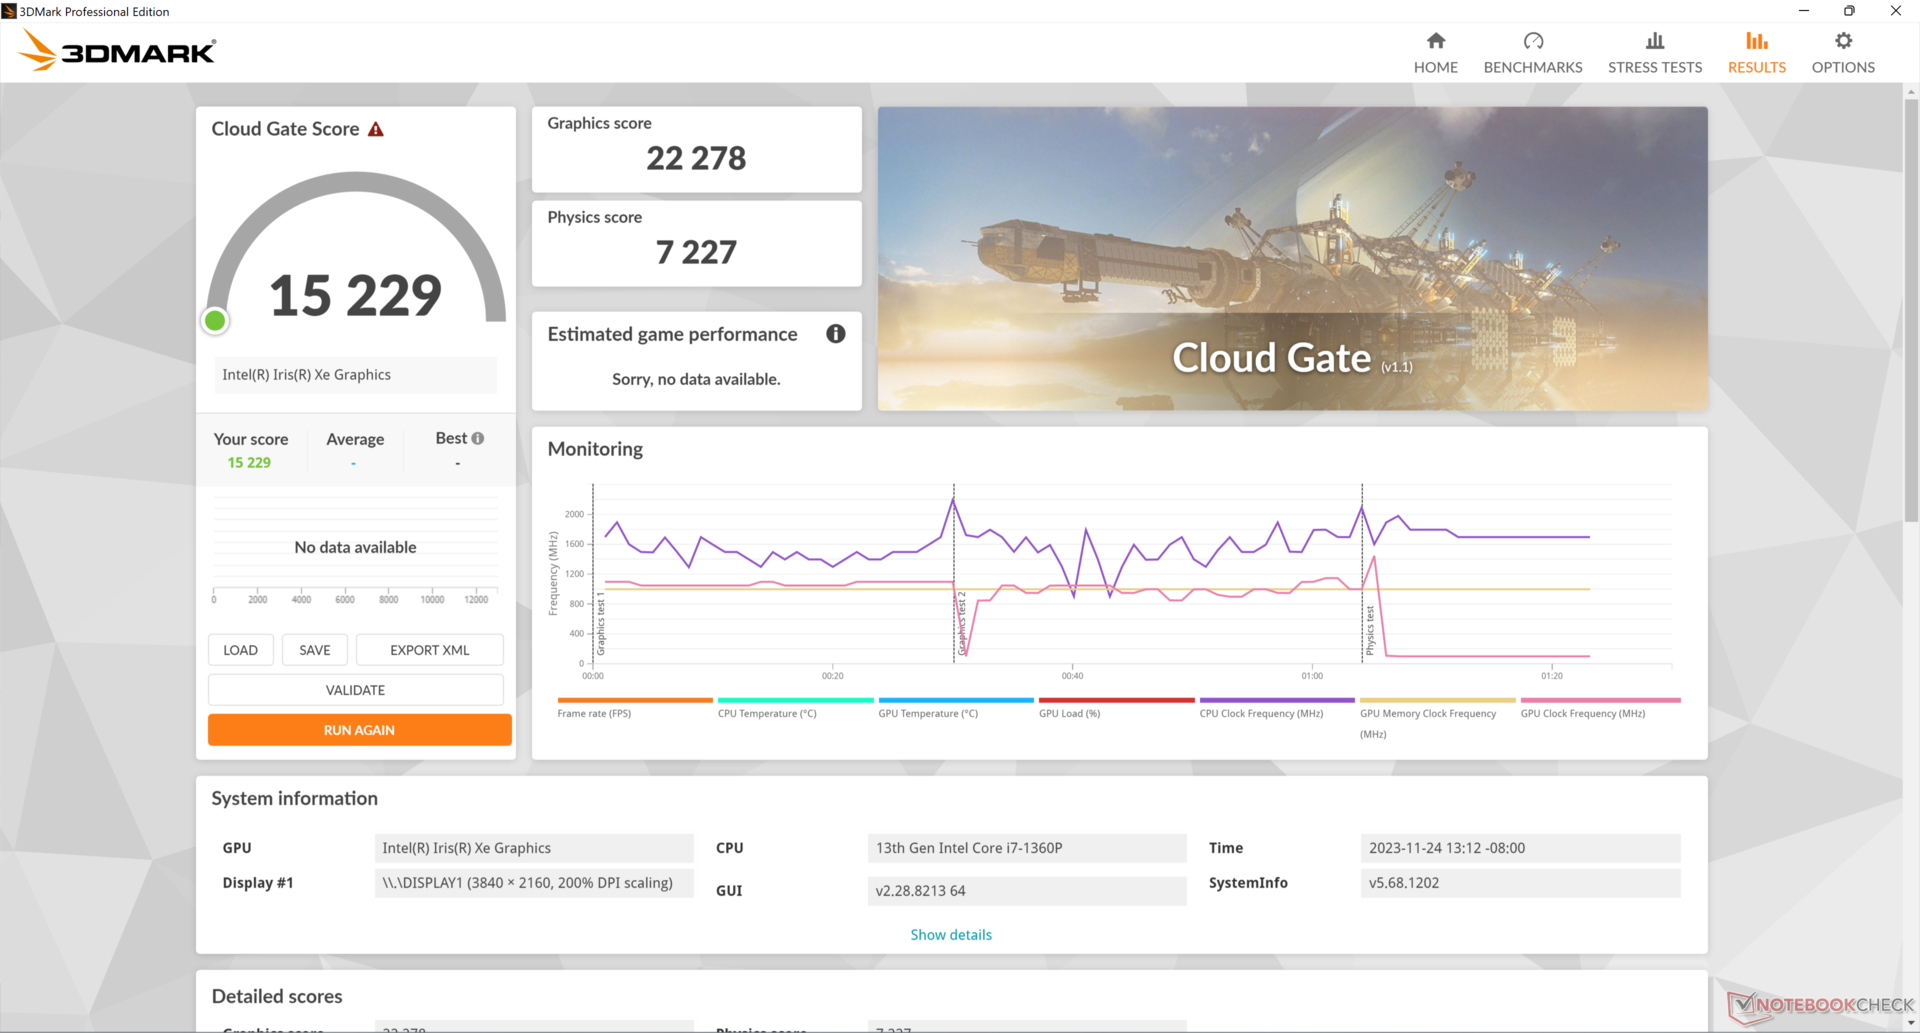
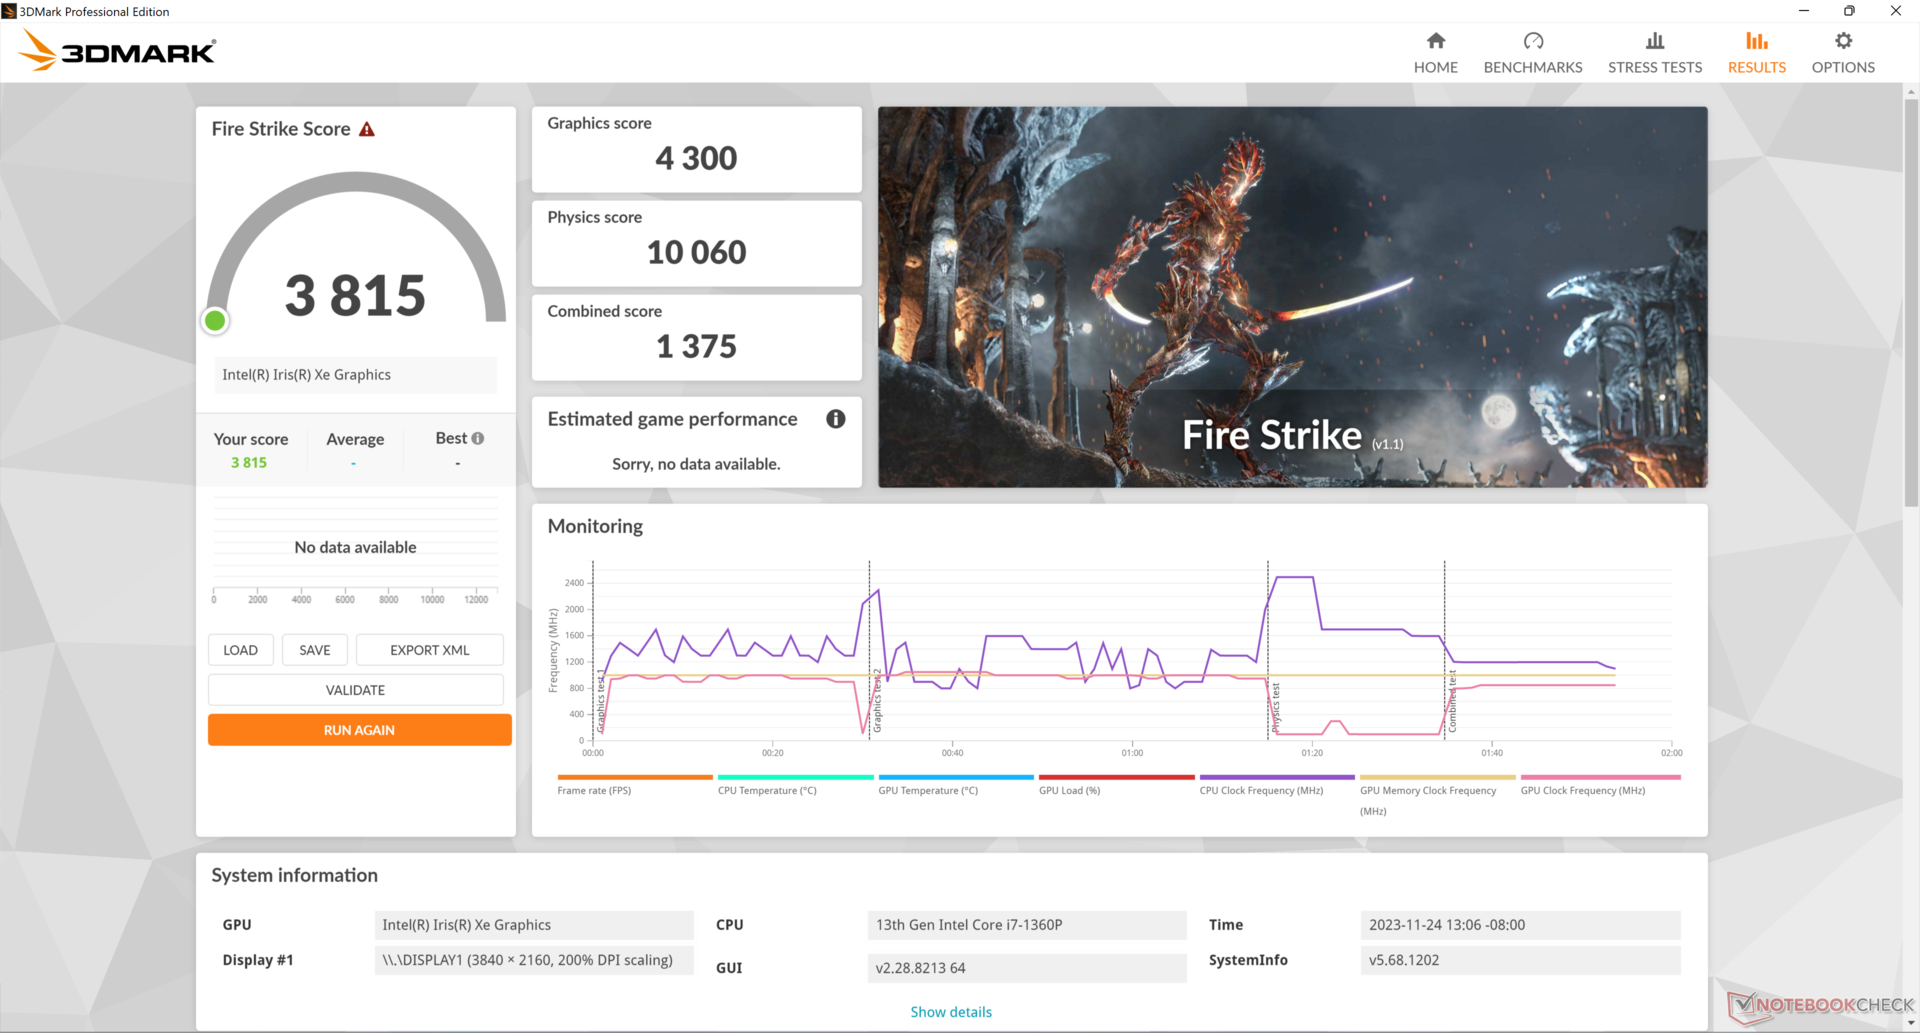
Die integrierte Iris Xe 96 EUs schneidet im Vergleich zu anderen Laptops mit der gleichen GPU leicht unterdurchschnittlich ab. Tatsächlich würde unser Schenker Work 15 mit dem älteren Core i7-11370H trotz ähnlicher GPUs höhere 3DMark-Scores erzielen als unser Eurocom.
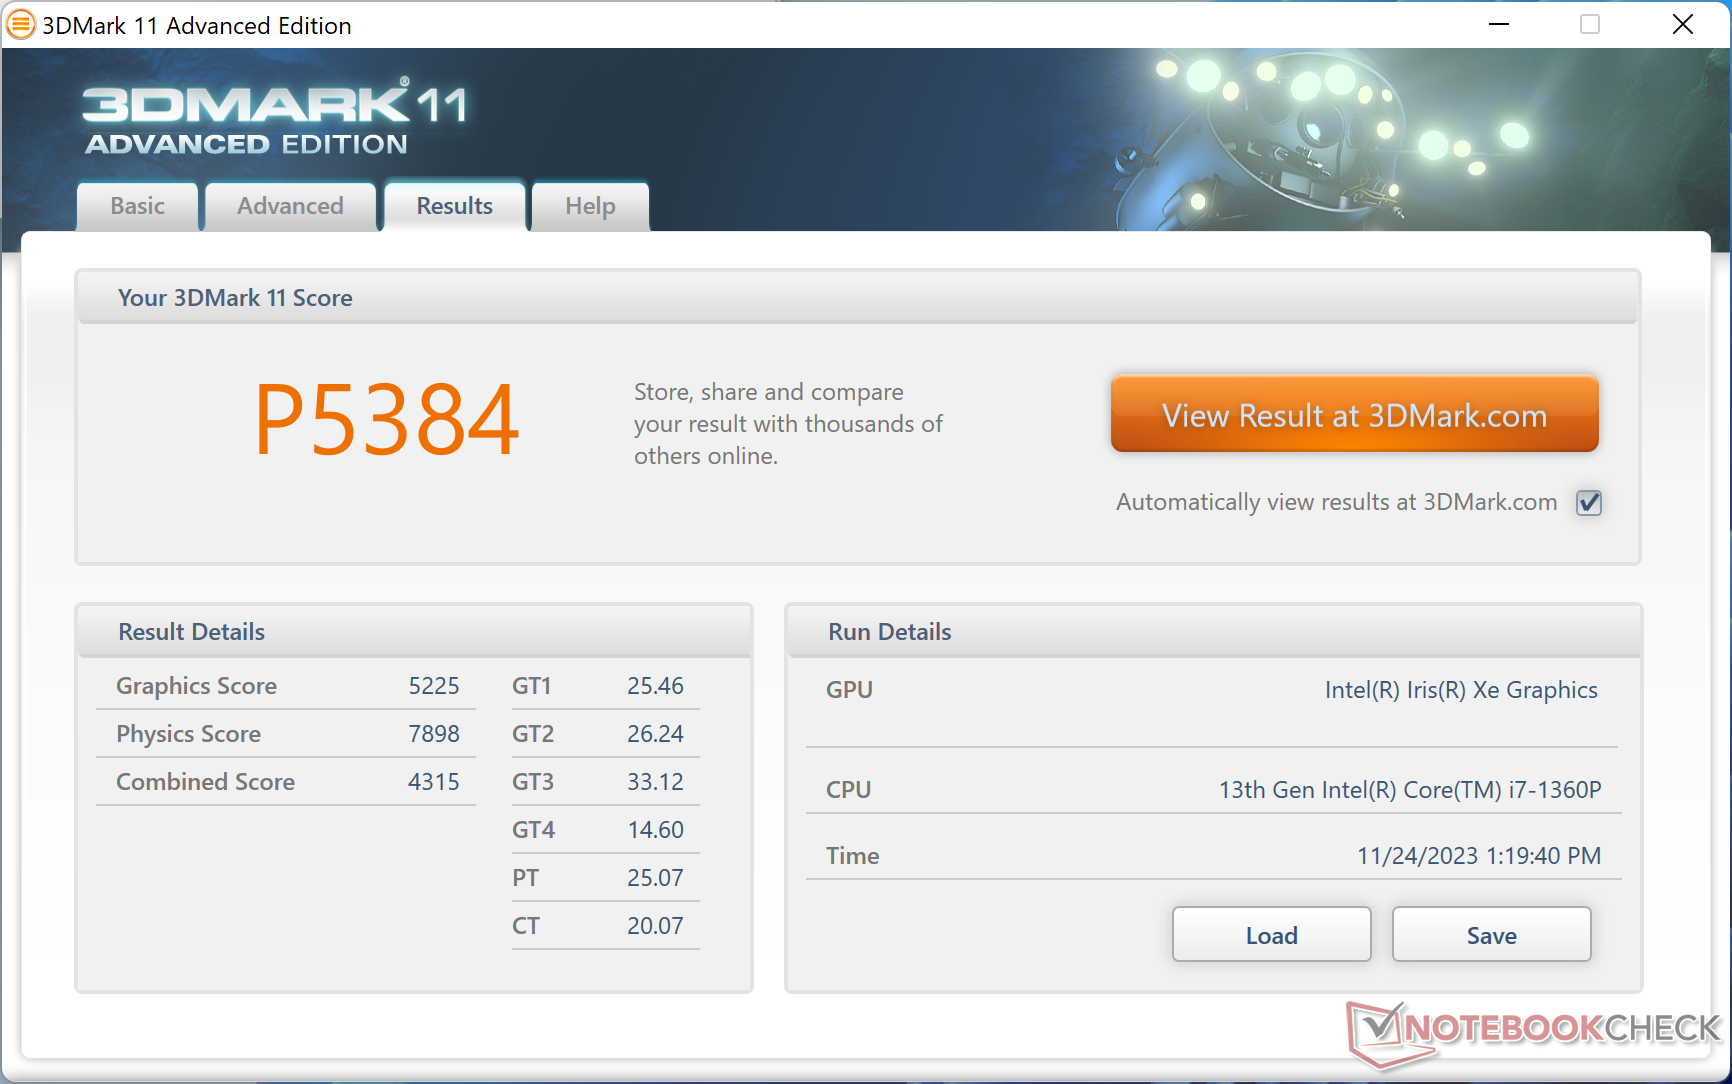
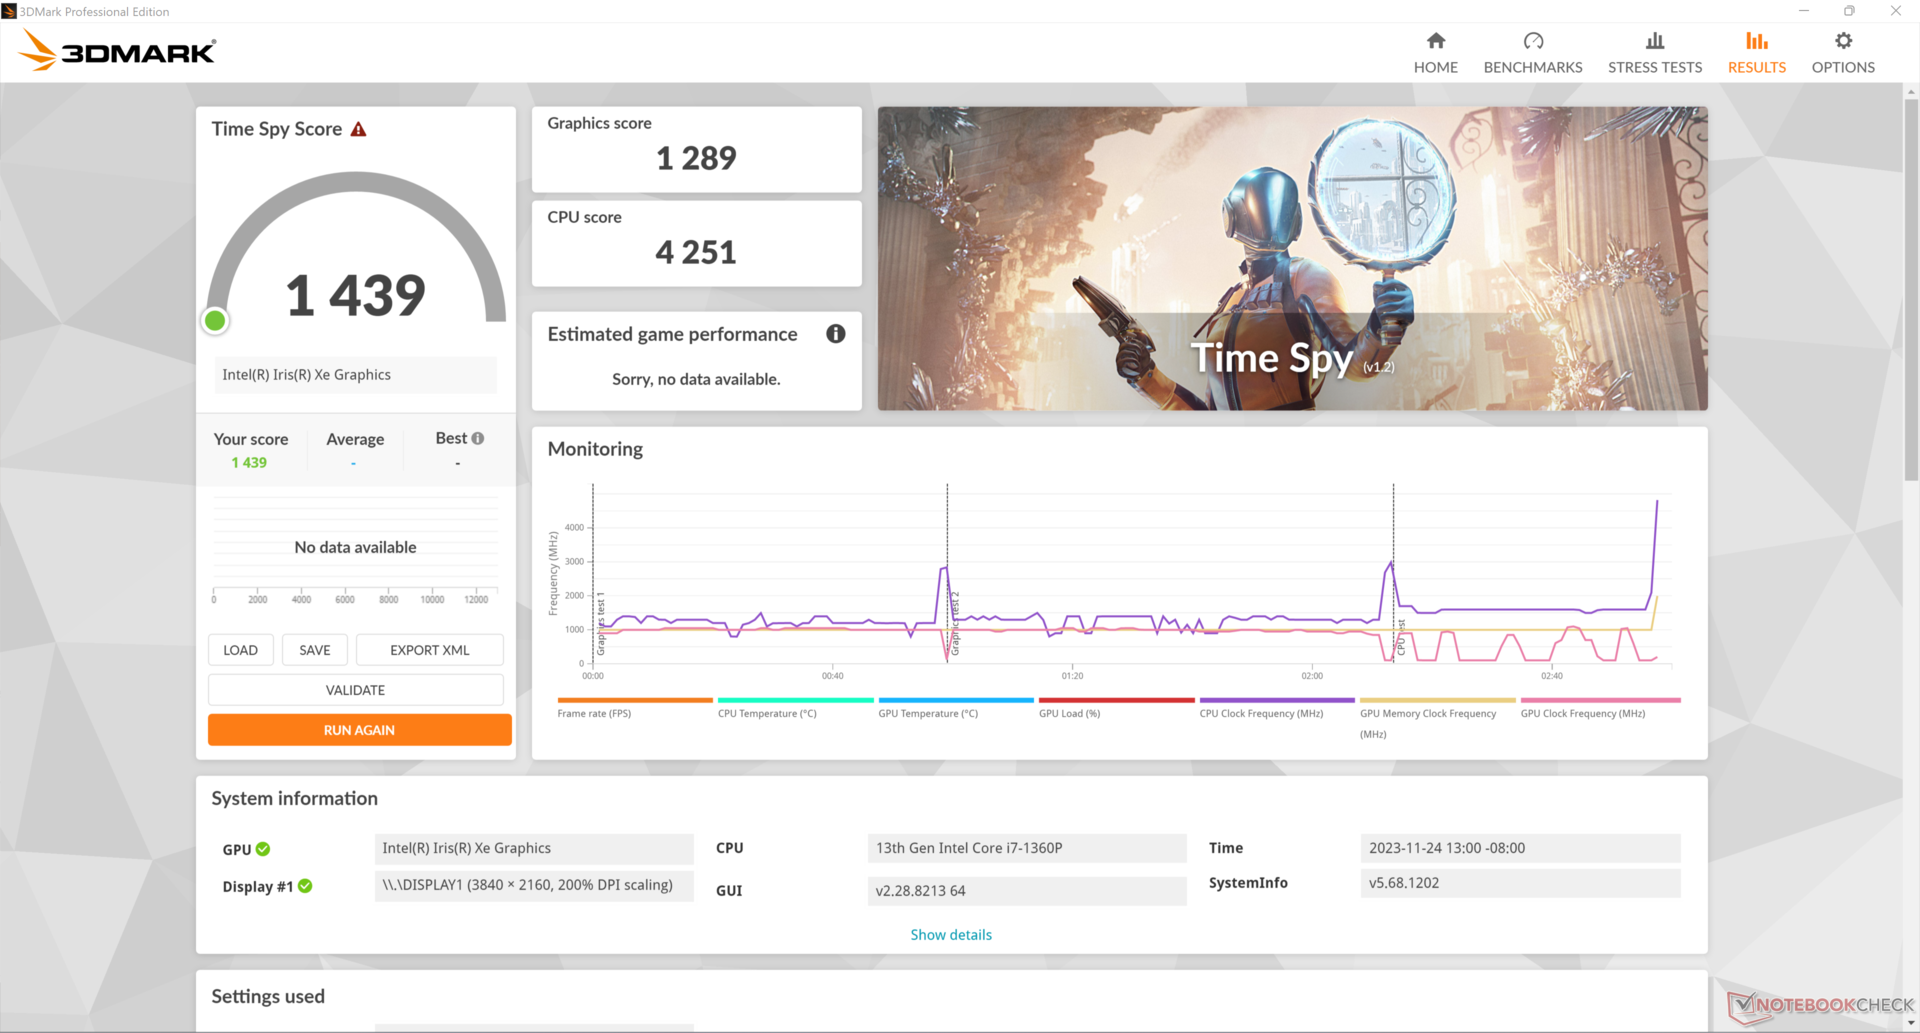
| 3DMark 11 Performance | 5384 Punkte | |
| 3DMark Cloud Gate Standard Score | 15229 Punkte | |
| 3DMark Fire Strike Score | 3815 Punkte | |
| 3DMark Time Spy Score | 1439 Punkte | |
Hilfe | ||
* ... kleinere Werte sind besser
| Tiny Tina's Wonderlands - 1280x720 Lowest Preset (DX12) | |
| Durchschnittliche Intel Iris Xe Graphics G7 96EUs (25.9 - 67.3, n=32) | |
| Eurocom C315 Blitz | |
Witcher 3 FPS-Diagramm
| min. | mittel | hoch | max. | |
|---|---|---|---|---|
| GTA V (2015) | 84.7 | 72.7 | 22.5 | 9.68 |
| The Witcher 3 (2015) | 66.7 | 46.9 | 26.3 | 13 |
| Dota 2 Reborn (2015) | 96.8 | 66.3 | 48.6 | 40.9 |
| Final Fantasy XV Benchmark (2018) | 33.4 | 18.8 | 14 | |
| X-Plane 11.11 (2018) | 43.4 | 32.2 | 29.3 | |
| Far Cry 5 (2018) | 36 | 23 | 21 | 20 |
| Strange Brigade (2018) | 76.8 | 34.7 | 28.2 | 23.3 |
| Cyberpunk 2077 1.6 (2022) | 14.1 | |||
| Tiny Tina's Wonderlands (2022) | ||||
| F1 22 (2022) | 38.5 | 34.5 | 25.3 | 19.2 |
Emissionen
Geräuschemissionen
Das Geräuschverhalten des Lüfters muss noch optimiert werden. Wenn er an das Stromnetz angeschlossen ist, pulsiert der Lüfter gelegentlich zwischen leise und 35 dB(A), selbst wenn er im Energiesparmodus auf dem Desktop läuft. Nur im Akkubetrieb bleibt der Lüfter leise und pulsiert nicht unnötig. Ansonsten ist das Lüftergeräusch bei anspruchsvoller Last wie Spielen fast identisch mit dem, was wir beim Schenker Work 15 mit der älteren Core H-Serie CPU beobachtet haben.
Lautstärkediagramm
| Idle |
| 25.1 / 25.1 / 34.9 dB(A) |
| Last |
| 42.1 / 44.2 dB(A) |
 | ||
30 dB leise 40 dB(A) deutlich hörbar 50 dB(A) störend |
||
min: | ||
| Eurocom C315 Blitz Iris Xe G7 96EUs, i7-1360P, Samsung 990 Pro 1 TB | Schenker Work 15 Tiger Lake-H Iris Xe G7 96EUs, i7-11370H, Samsung SSD 980 Pro 1TB MZ-V8P1T0BW | Lenovo ThinkPad L15 Gen 4 21H70021GE Vega 8, R7 PRO 7730U, SK hynix HFS512GEJ4X113N | Acer Aspire 5 A515-58GM-76S8 GeForce RTX 2050 Mobile, i7-1355U, Micron 2450 1TB MTFDKBA1T0TFK | Asus VivoBook S15 M3502RA-L1029W Radeon 680M, R7 6800H, WD PC SN735 SDBPNHH-512G | Samsung Galaxy Book2 15 A350M, i7-1260P, Samsung PM991 MZVLQ512HBLU | |
|---|---|---|---|---|---|---|
| Geräuschentwicklung | 3% | 18% | 2% | -14% | -2% | |
| aus / Umgebung * (dB) | 22.5 | 24.4 -8% | 23.5 -4% | 25.04 -11% | 26 -16% | 24.3 -8% |
| Idle min * (dB) | 25.1 | 24.4 3% | 23.5 6% | 26.3 -5% | 26 -4% | 24.3 3% |
| Idle avg * (dB) | 25.1 | 24.4 3% | 23.5 6% | 26.3 -5% | 26 -4% | 24.3 3% |
| Idle max * (dB) | 34.9 | 26.7 23% | 23.5 33% | 26.3 25% | 28.1 19% | 29.8 15% |
| Last avg * (dB) | 42.1 | 43.8 -4% | 27.5 35% | 32.5 23% | 56.9 -35% | 47.5 -13% |
| Witcher 3 ultra * (dB) | 44.5 | 43.8 2% | 32.7 27% | 46.7 -5% | 47.5 -7% | |
| Last max * (dB) | 44.2 | 44.8 -1% | 32.7 26% | 49 -11% | 62.6 -42% | 47.5 -7% |
* ... kleinere Werte sind besser
Temperatur
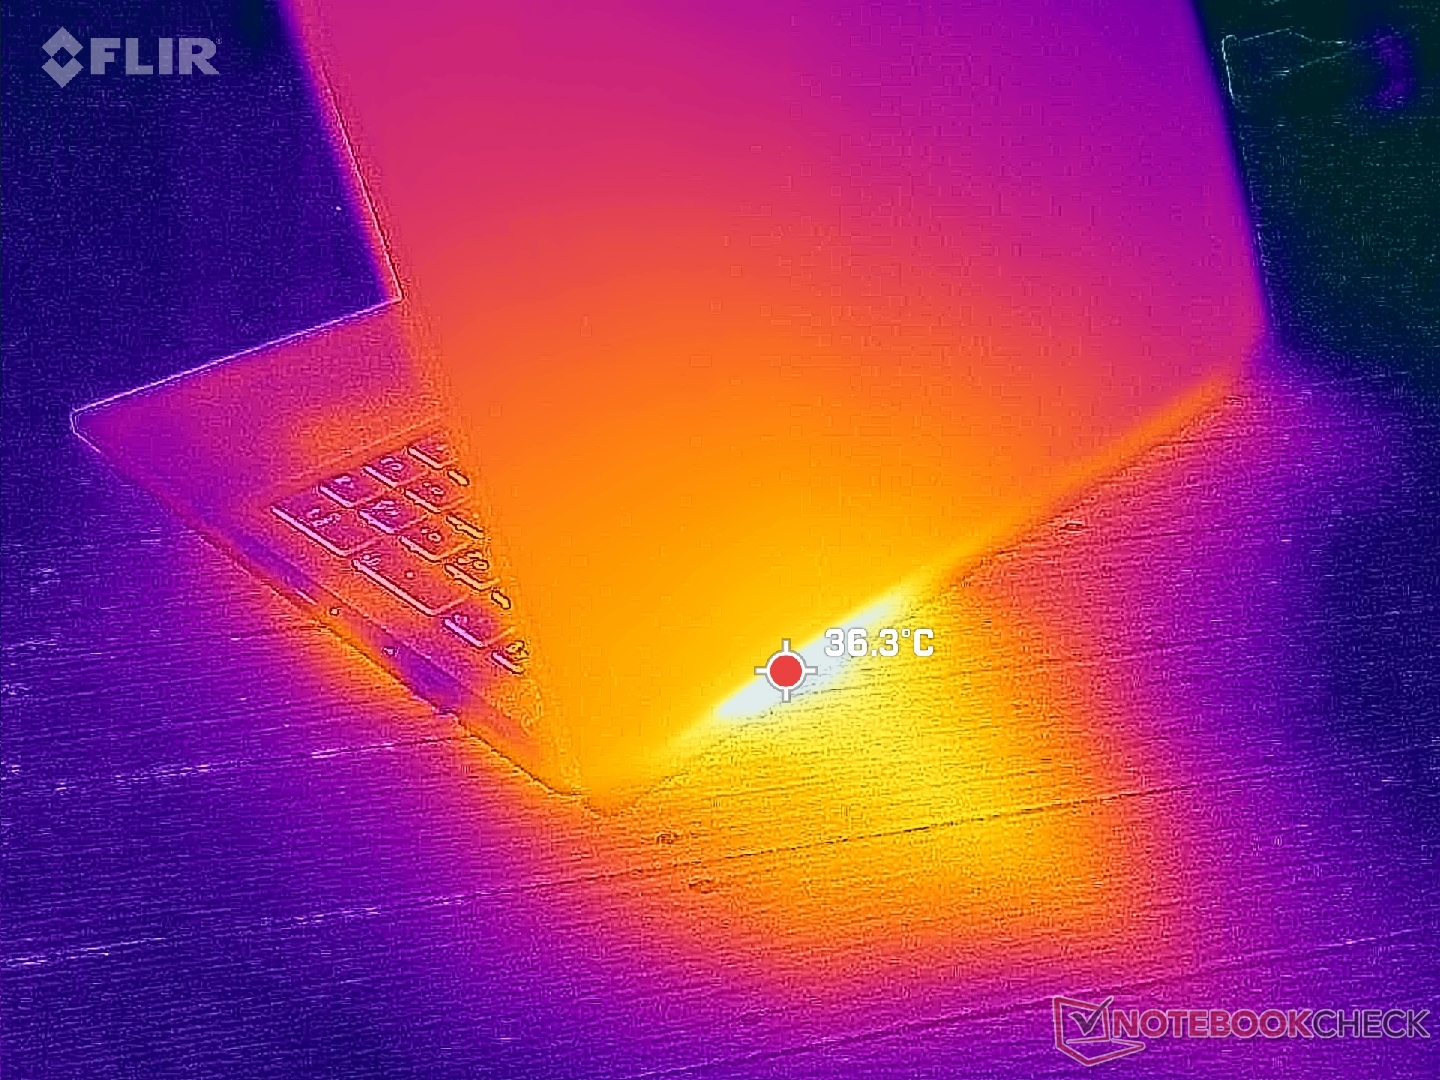
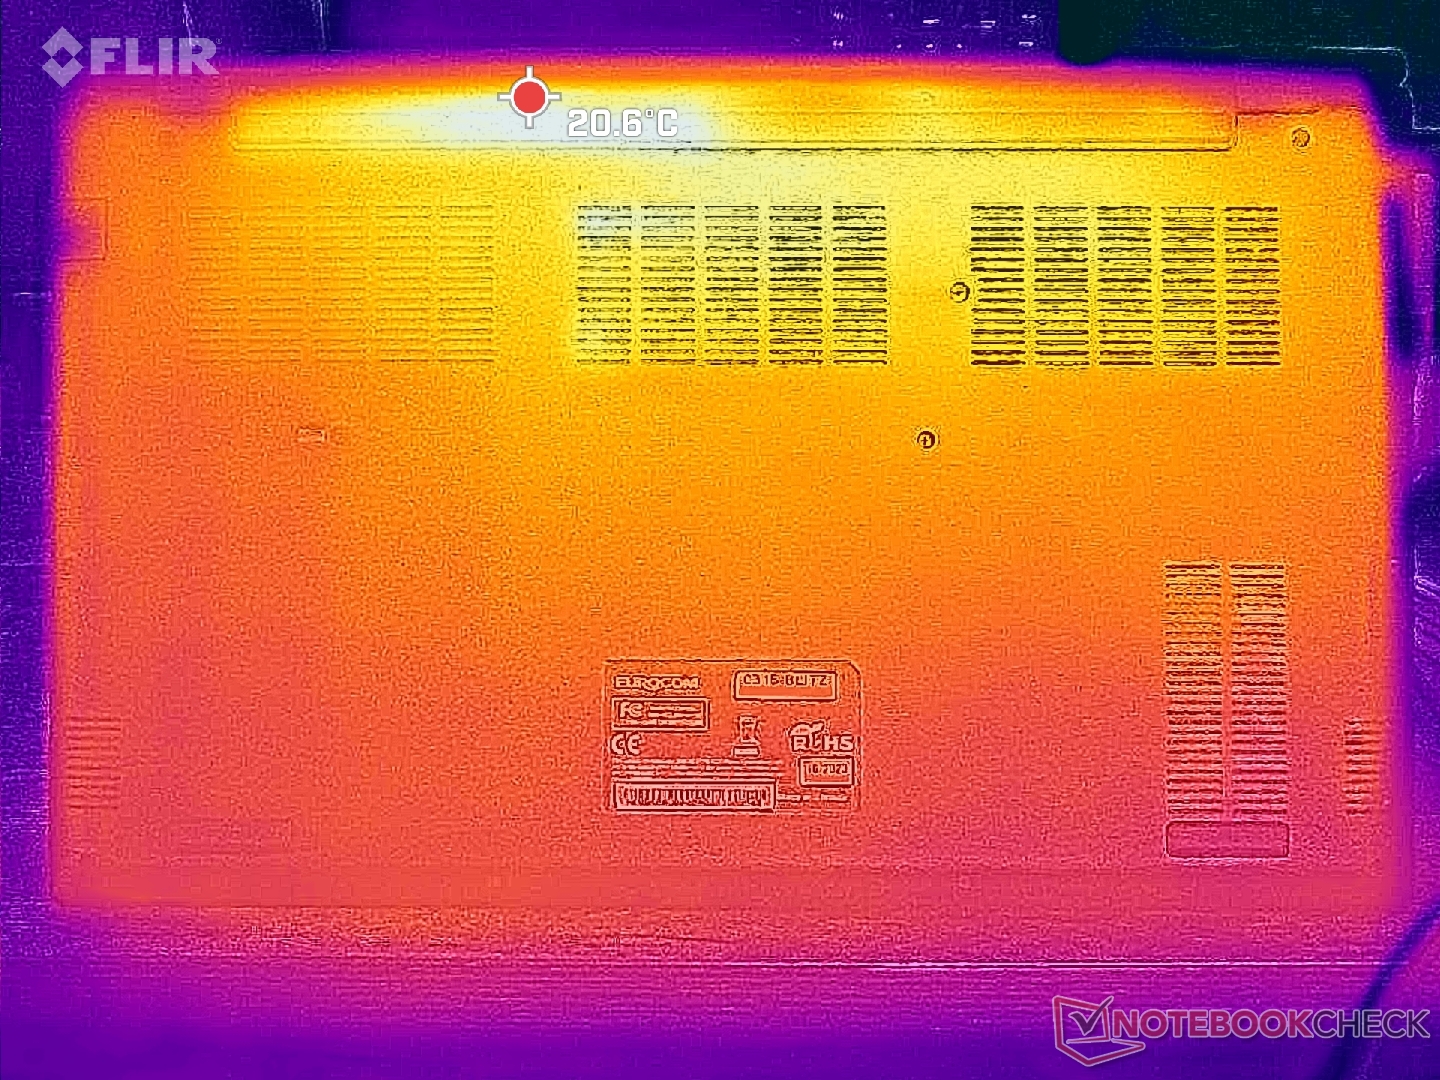
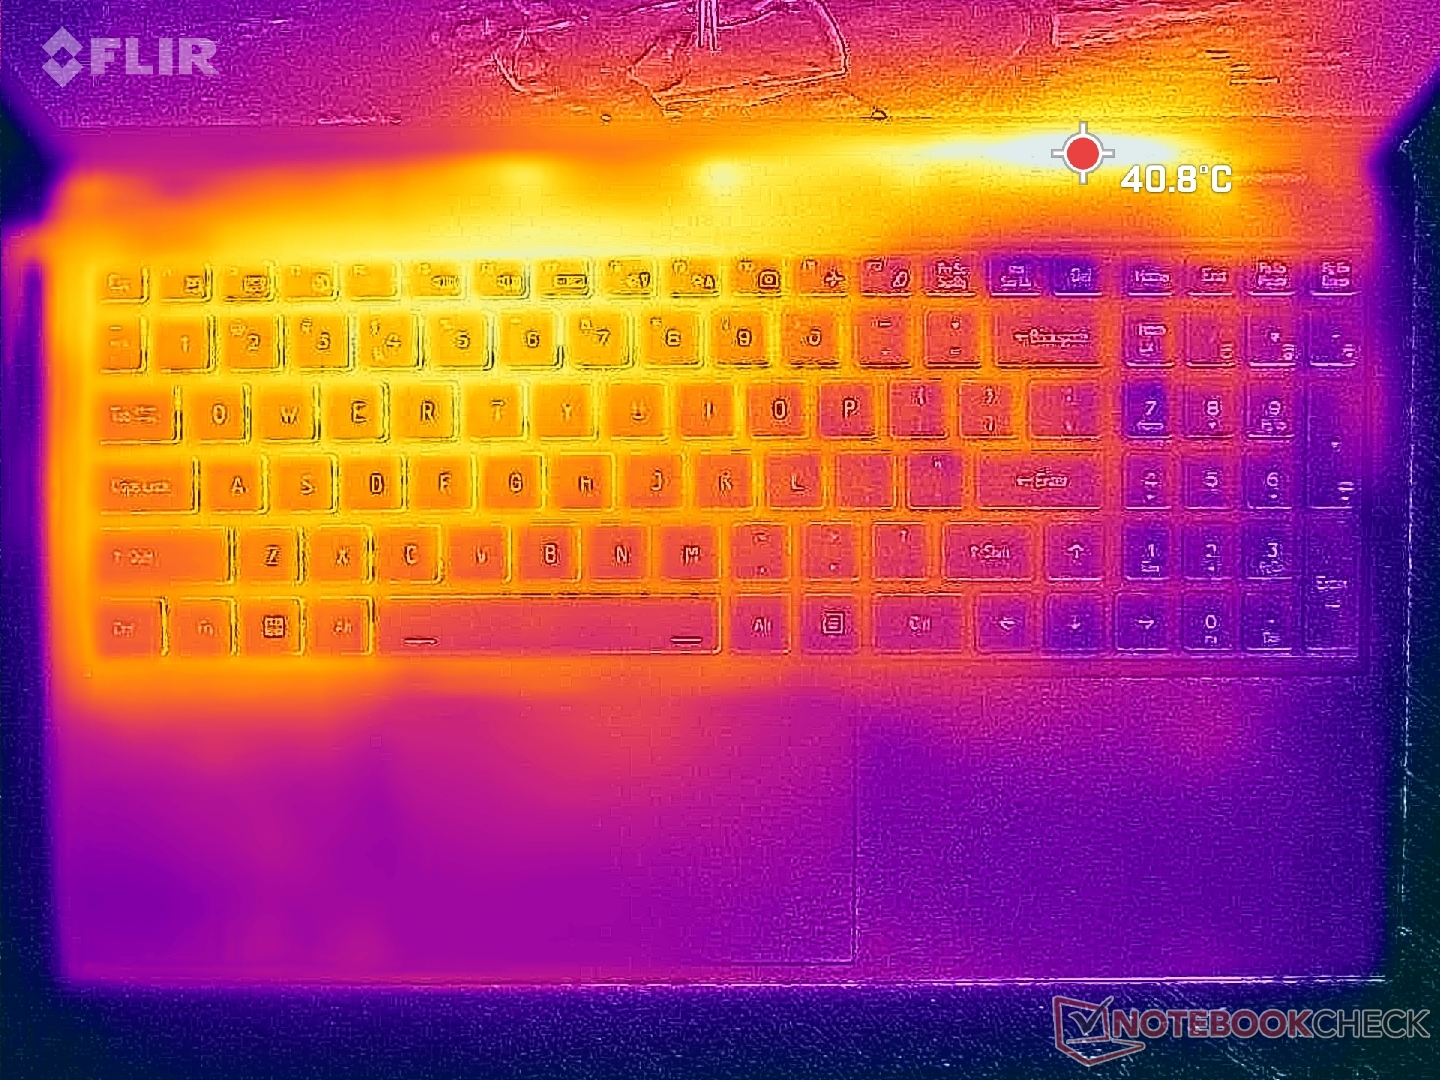
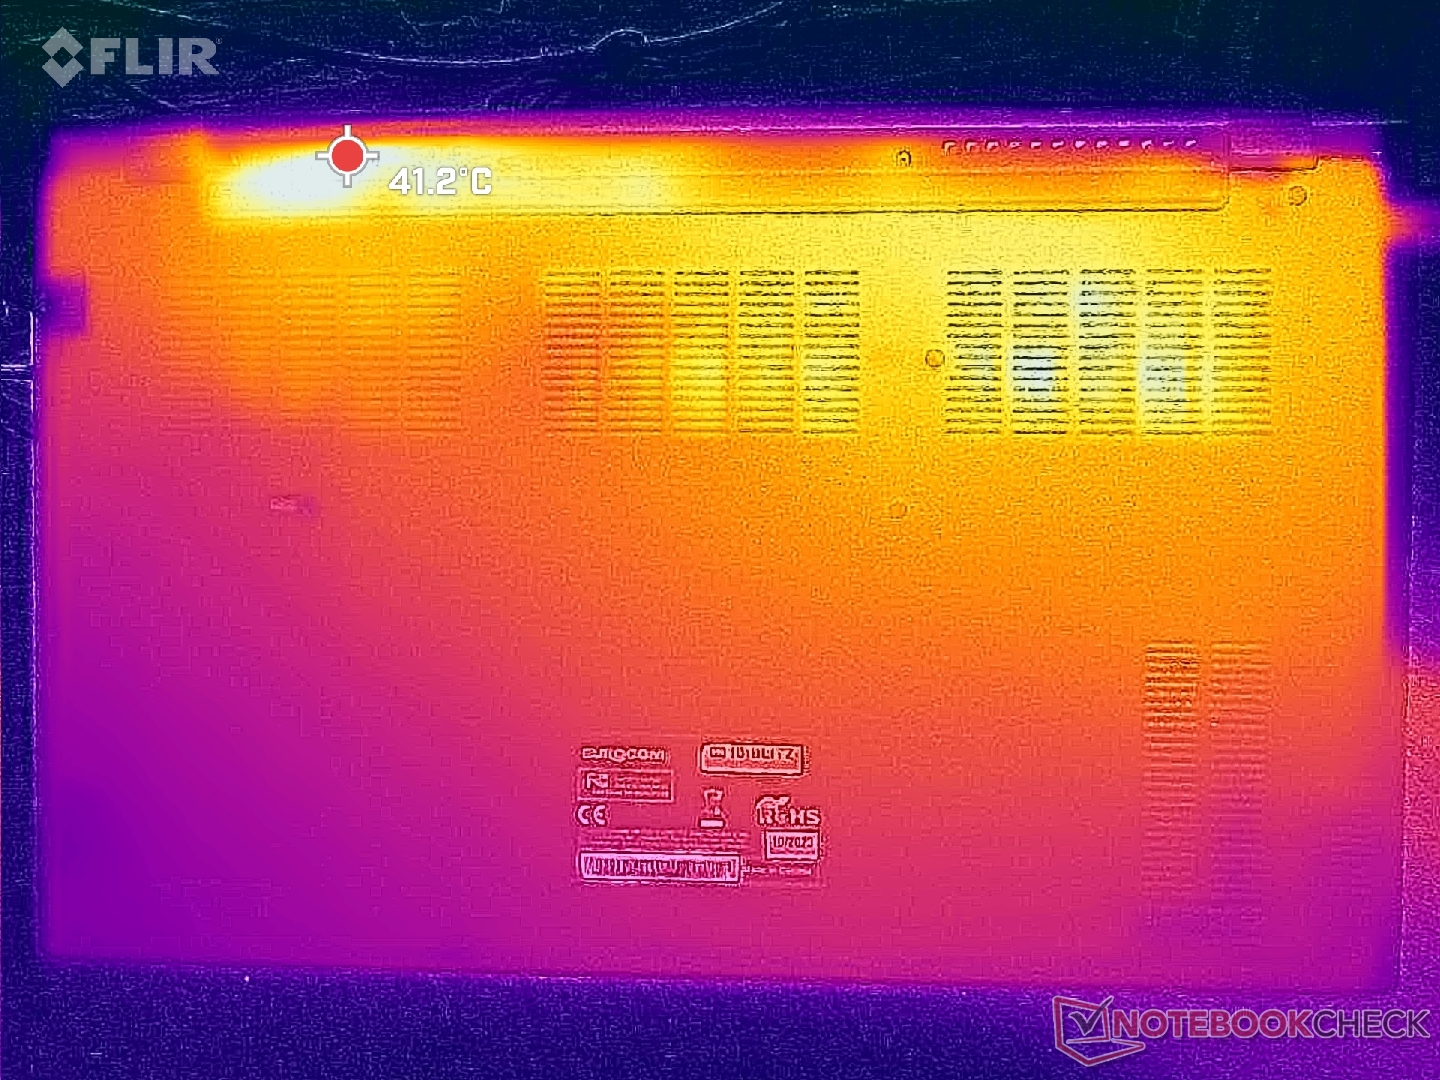
Die Oberflächentemperaturen sind im Durchschnitt etwas kühler als die, die wir beim Schenker Work 15 beobachtet haben. Bei anspruchsvollen Lasten erreichen die heißen Stellen an der Rückseite des Gehäuse beispielsweise nur 35 bis 38 °C, während es beim Schenker 43 °C waren.
(+) Die maximale Temperatur auf der Oberseite ist 35.6 °C. Im Vergleich liegt der Klassendurchschnitt bei 34.3 °C (von 21.2 bis 62.5 °C für die Klasse Office).
(+) Auf der Unterseite messen wir eine maximalen Wert von 37.8 °C (im Vergleich zum Durchschnitt von 36.8 °C).
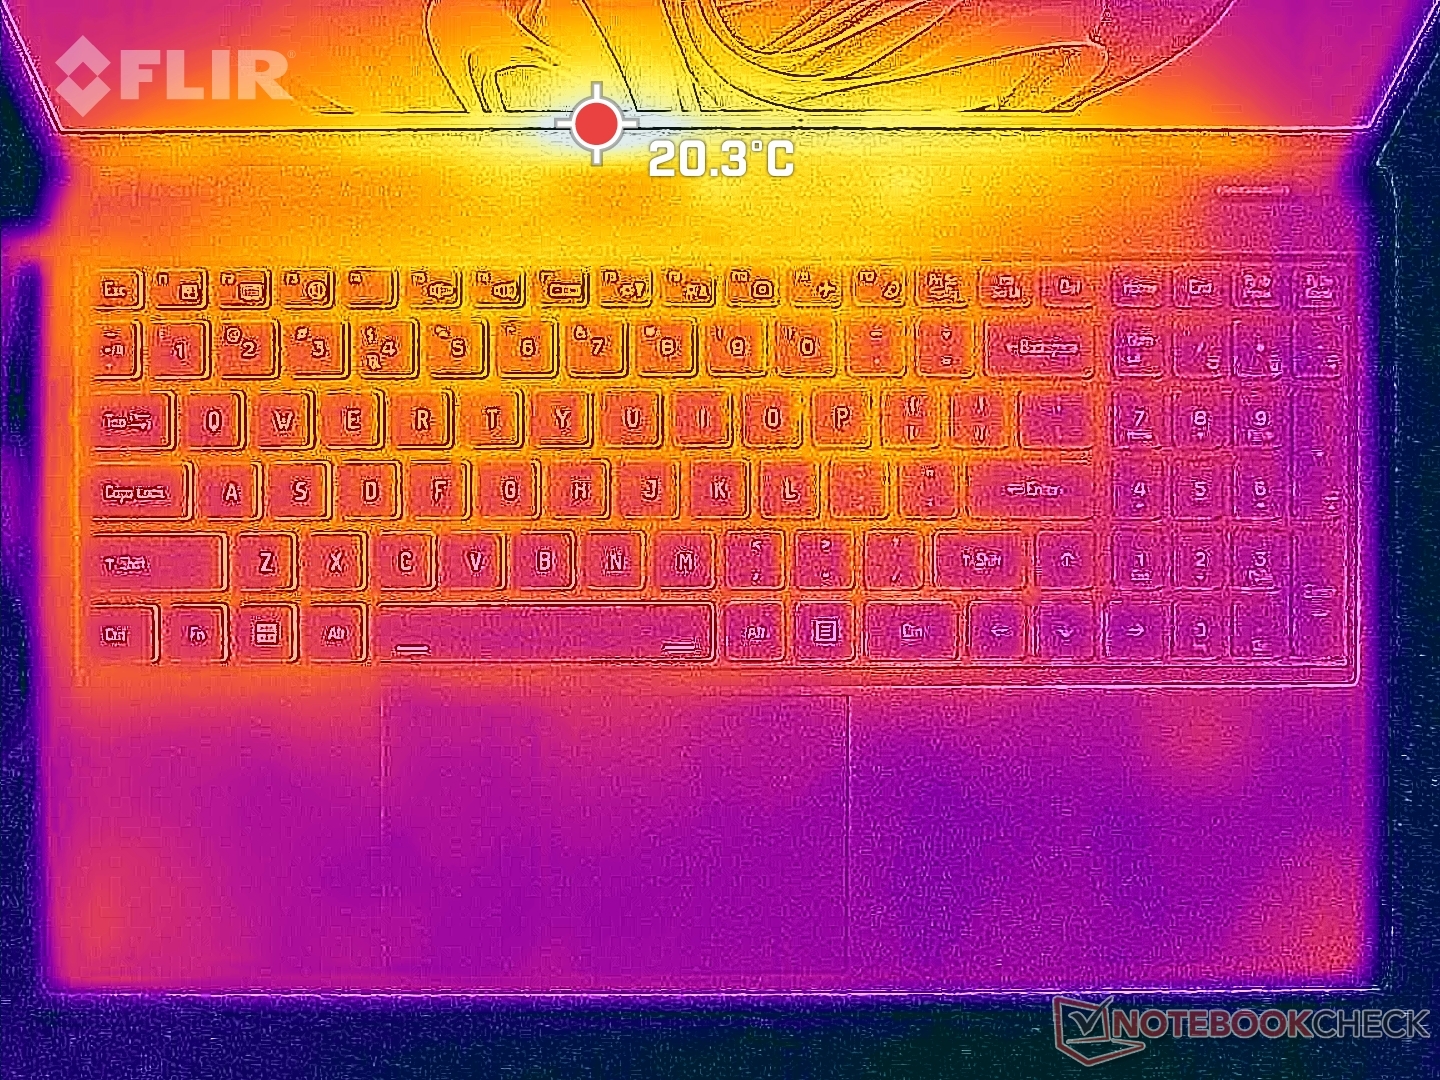
(+) Ohne Last messen wir eine durchschnittliche Temperatur von 22.8 °C auf der Oberseite. Der Klassendurchschnitt erreicht 29.5 °C.
(+) Die Handballen und der Touchpad-Bereich sind mit gemessenen 26.6 °C kühler als die typische Hauttemperatur und fühlen sich dadurch kühl an.
(±) Die durchschnittliche Handballen-Temperatur anderer getesteter Geräte war 27.5 °C (+0.9 °C).
| Eurocom C315 Blitz Intel Core i7-1360P, Intel Iris Xe Graphics G7 96EUs | Schenker Work 15 Tiger Lake-H Intel Core i7-11370H, Intel Iris Xe Graphics G7 96EUs | Lenovo ThinkPad L15 Gen 4 21H70021GE AMD Ryzen 7 PRO 7730U, AMD Radeon RX Vega 8 (Ryzen 4000/5000) | Acer Aspire 5 A515-58GM-76S8 Intel Core i7-1355U, NVIDIA GeForce RTX 2050 Mobile | Asus VivoBook S15 M3502RA-L1029W AMD Ryzen 7 6800H, AMD Radeon 680M | Samsung Galaxy Book2 15 Intel Core i7-1260P, Intel Arc A350M | |
|---|---|---|---|---|---|---|
| Hitze | -6% | 0% | -5% | -35% | -15% | |
| Last oben max * (°C) | 35.6 | 39.1 -10% | 39.1 -10% | 35.7 -0% | 50.2 -41% | 44.6 -25% |
| Last unten max * (°C) | 37.8 | 43.4 -15% | 36.1 4% | 36.8 3% | 50.2 -33% | 47.5 -26% |
| Idle oben max * (°C) | 24.2 | 24.3 -0% | 23.1 5% | 27.9 -15% | 32.1 -33% | 25.8 -7% |
| Idle unten max * (°C) | 26 | 25.1 3% | 25.7 1% | 27.9 -7% | 34.6 -33% | 26.1 -0% |
* ... kleinere Werte sind besser
Stresstest
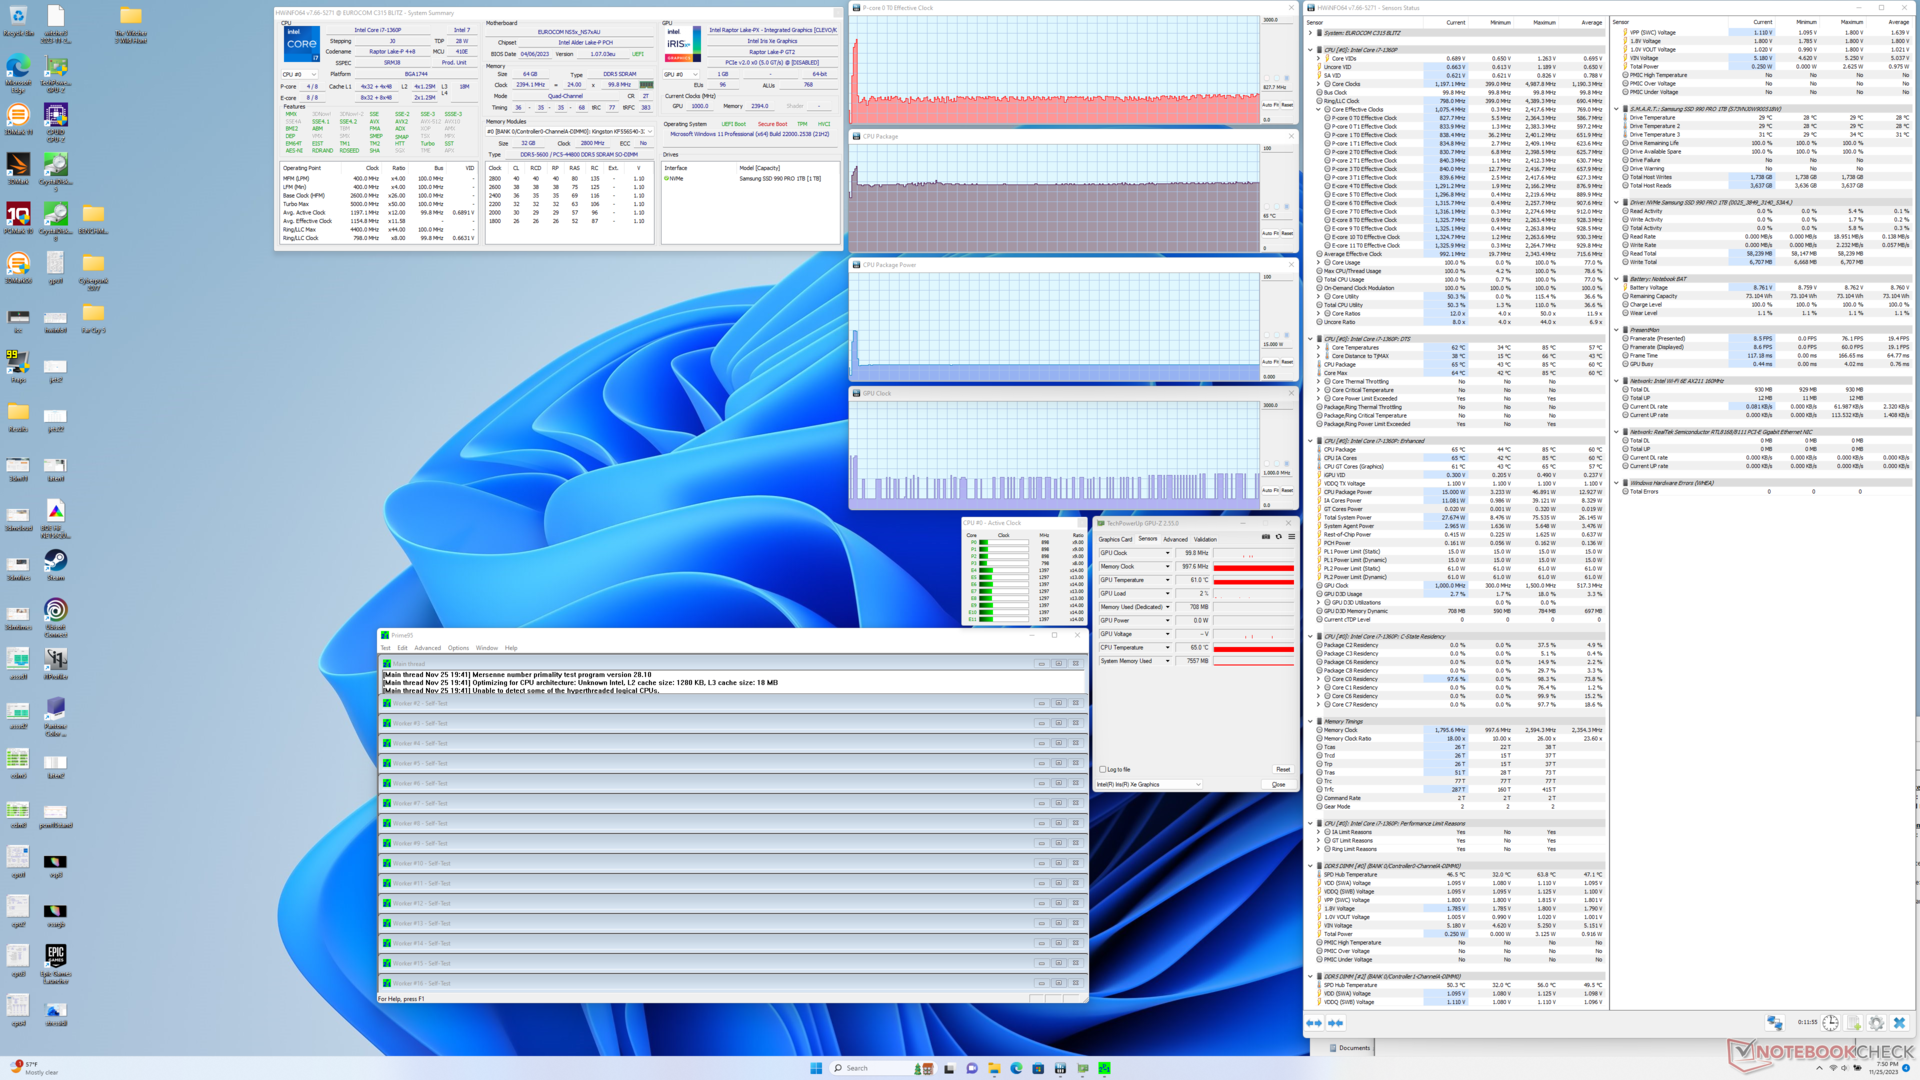
Beim Starten des Prime95-Stresstests stieg die CPU für einige Sekunden auf 2,4 GHz, 47 W und 85 W, bevor sie abfiel und sich bei 800 MHz stabilisierte - 1,3 GHz, 15 W und 65 W. Der steile Leistungsabfall stimmt mit unseren CineBench R15 xT-Schleifenergebnissen überein. Wir hatten eine bessere Nachhaltigkeit der Leistung erwartet, da die Core P-Serie eine Zwischenstufe der langsameren U-Serie und der leistungsfähigeren H-Serie darstellt, aber ihr Verhalten in unserem Eurocom ist stattdessen typisch für die meisten CPUs der U-Serie.
Die Kerntemperatur stabilisierte sich bei anspruchsvoller Last bei etwa 65 °C, verglichen mit 78 °C beim Schenker Work 15 mit dem älteren Core i7-11730H.
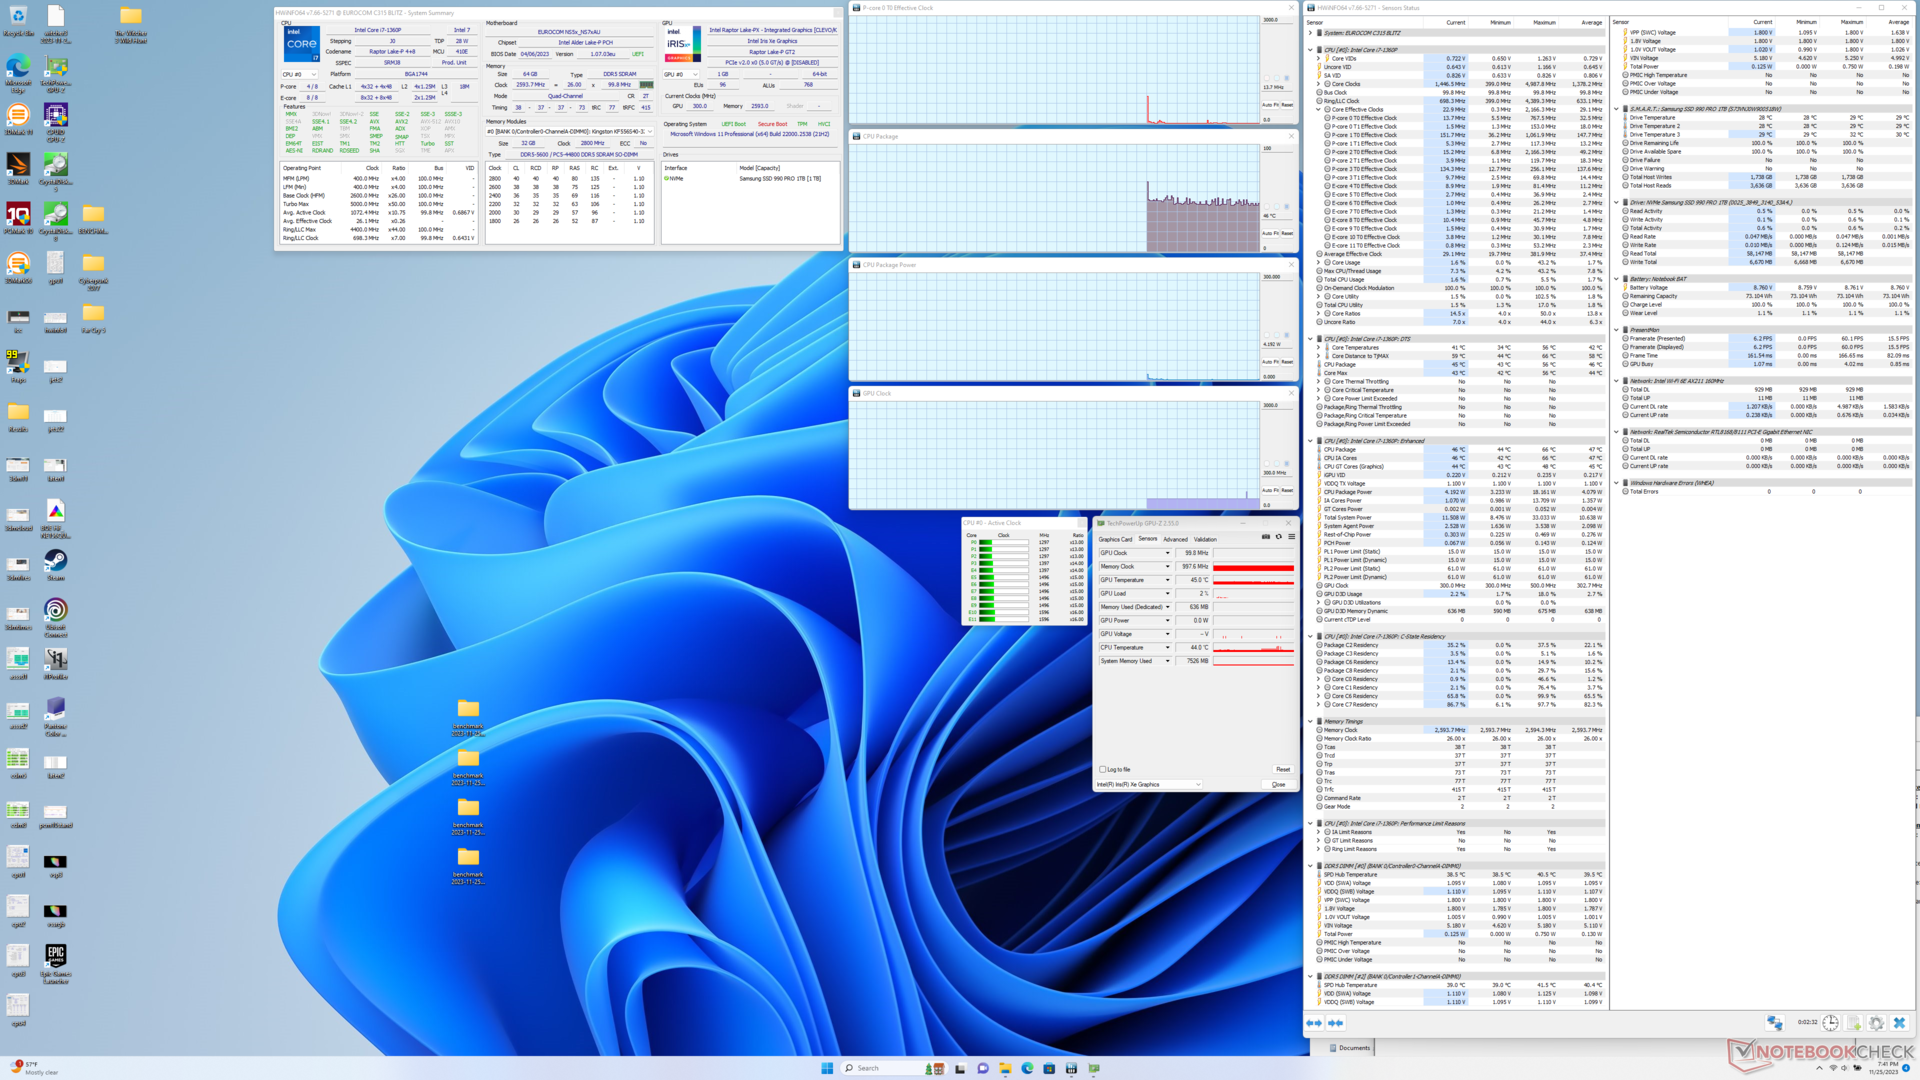
| CPU-Takt (GHz) | GPU-Takt (MHz) | Durchschnittliche CPU-Temperatur (°C) | |
| System im Leerlauf | -- | -- | 46 |
| Prime95 Stresstest | 0.7 - 0.8 | -- | 65 |
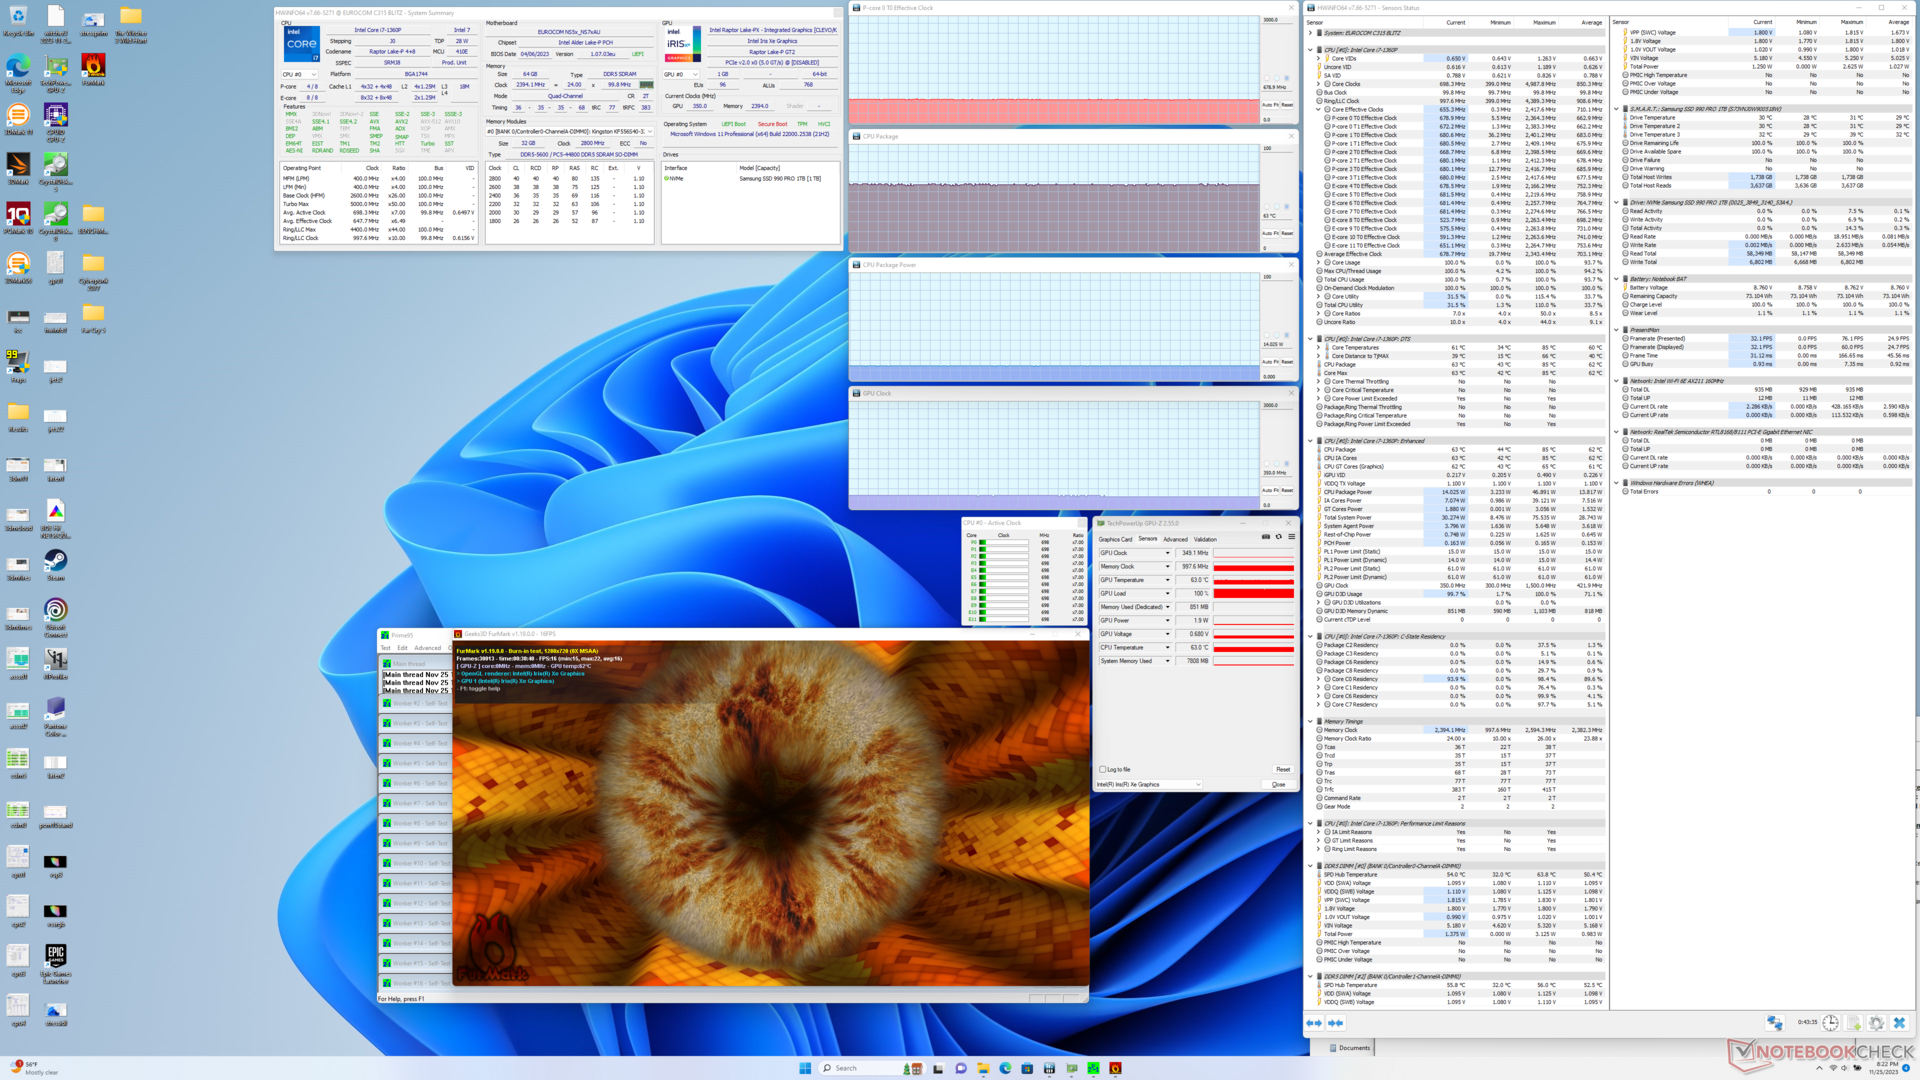
| Prime95 + FurMark Stresstest | 0.7 | 350 | 63 |
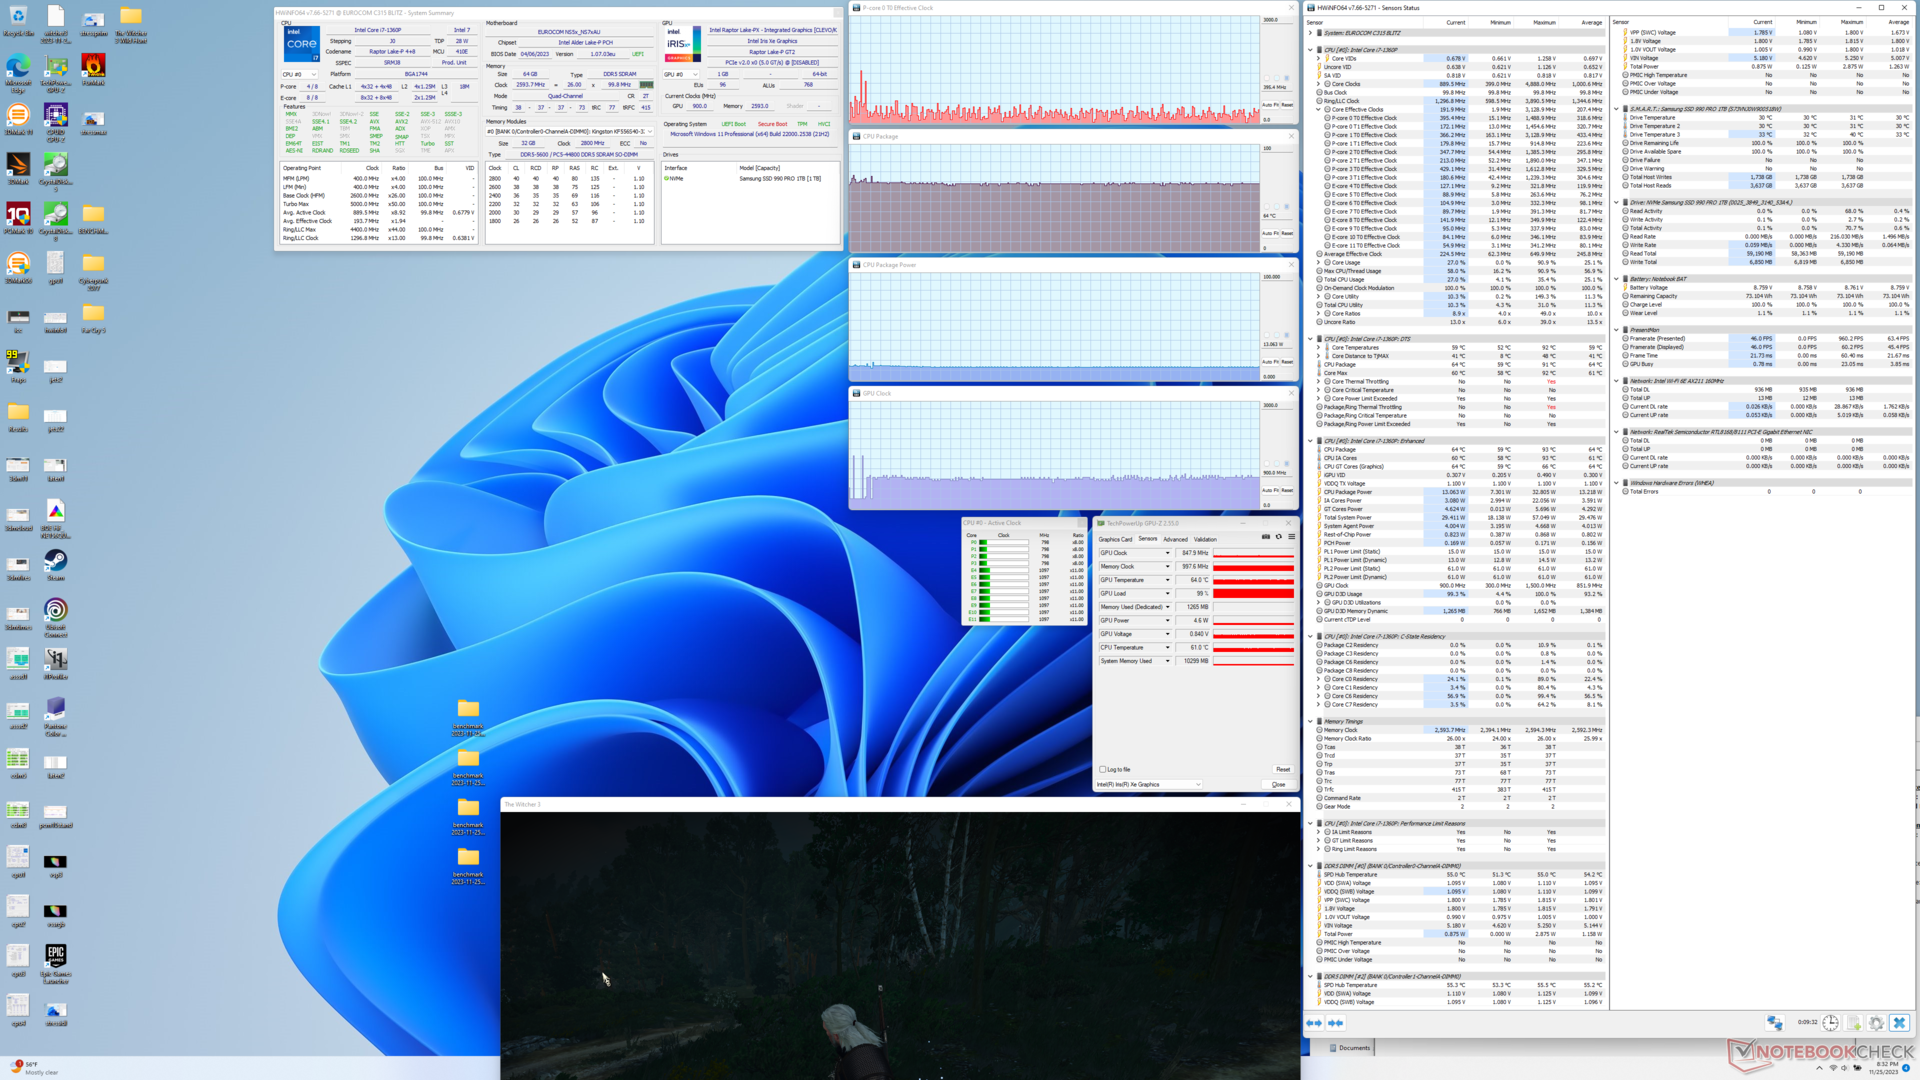
| Witcher 3 Stresstest | ~0.4 | 900 | 64 |
Lautsprecher
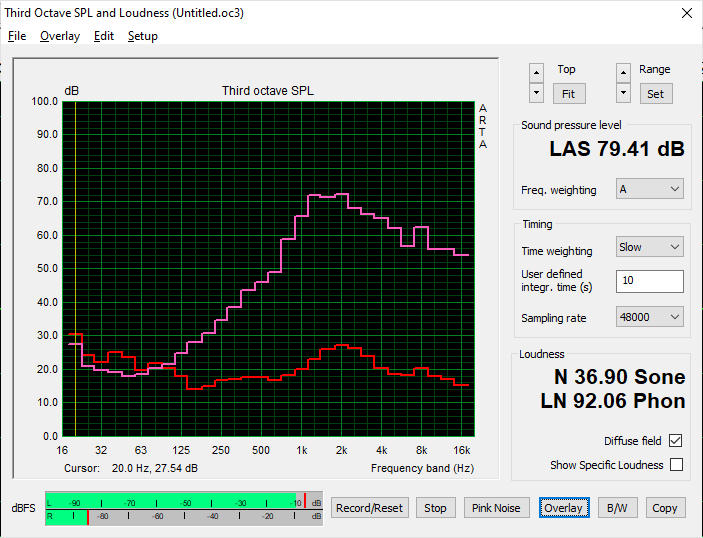
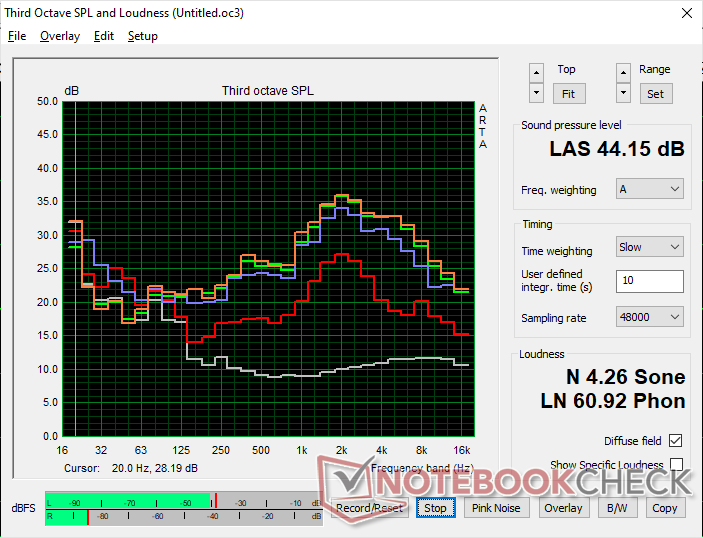
Eurocom C315 Blitz Audio Analyse
(±) | Mittelmäßig laut spielende Lautsprecher (79.4 dB)
Bass 100 - 315 Hz
(-) | kaum Bass - 26.1% niedriger als der Median
(±) | durchschnittlich lineare Bass-Wiedergabe (8% Delta zum Vorgänger)
Mitteltöne 400 - 2000 Hz
(±) | zu hohe Mitten, vom Median 11.2% abweichend
(±) | Linearität der Mitten ist durchschnittlich (11.5% Delta zum Vorgänger)
Hochtöne 2 - 16 kHz
(±) | zu hohe Hochtöne, vom Median nur 6.6% abweichend
(±) | durchschnittlich lineare Hochtöne (10.4% Delta zum Vorgänger)
Gesamt im hörbaren Bereich 100 - 16.000 Hz
(-) | hörbarer Bereich ist nur wenig linear (35.6% Abstand zum Median)
Im Vergleich zu allen Geräten derselben Klasse
» 97% aller getesteten Geräte dieser Klasse waren besser, 1% vergleichbar, 2% schlechter
» Das beste Gerät hat einen Delta-Wert von 7%, durchschnittlich ist 21%, das schlechteste Gerät hat 53%
Im Vergleich zu allen Geräten im Test
» 94% aller getesteten Geräte waren besser, 1% vergleichbar, 5% schlechter
» Das beste Gerät hat einen Delta-Wert von 4%, durchschnittlich ist 23%, das schlechteste Gerät hat 134%
Apple MacBook Pro 16 2021 M1 Pro Audio Analyse
(+) | Die Lautsprecher können relativ laut spielen (84.7 dB)
Bass 100 - 315 Hz
(+) | guter Bass - nur 3.8% Abweichung vom Median
(+) | lineare Bass-Wiedergabe (5.2% Delta zum Vorgänger)
Mitteltöne 400 - 2000 Hz
(+) | ausgeglichene Mitten, vom Median nur 1.3% abweichend
(+) | lineare Mitten (2.1% Delta zum Vorgänger)
Hochtöne 2 - 16 kHz
(+) | ausgeglichene Hochtöne, vom Median nur 1.9% abweichend
(+) | sehr lineare Hochtöne (2.7% Delta zum Vorgänger)
Gesamt im hörbaren Bereich 100 - 16.000 Hz
(+) | hörbarer Bereich ist sehr linear (4.6% Abstand zum Median
Im Vergleich zu allen Geräten derselben Klasse
» 0% aller getesteten Geräte dieser Klasse waren besser, 0% vergleichbar, 100% schlechter
» Das beste Gerät hat einen Delta-Wert von 5%, durchschnittlich ist 17%, das schlechteste Gerät hat 45%
Im Vergleich zu allen Geräten im Test
» 0% aller getesteten Geräte waren besser, 0% vergleichbar, 100% schlechter
» Das beste Gerät hat einen Delta-Wert von 4%, durchschnittlich ist 23%, das schlechteste Gerät hat 134%
Energieverwaltung
Energieaufnahme
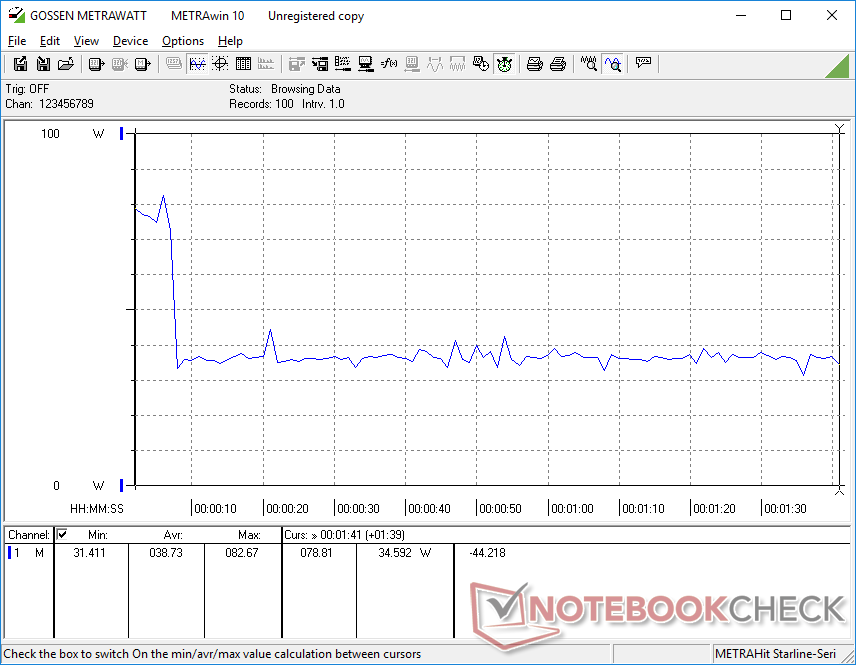
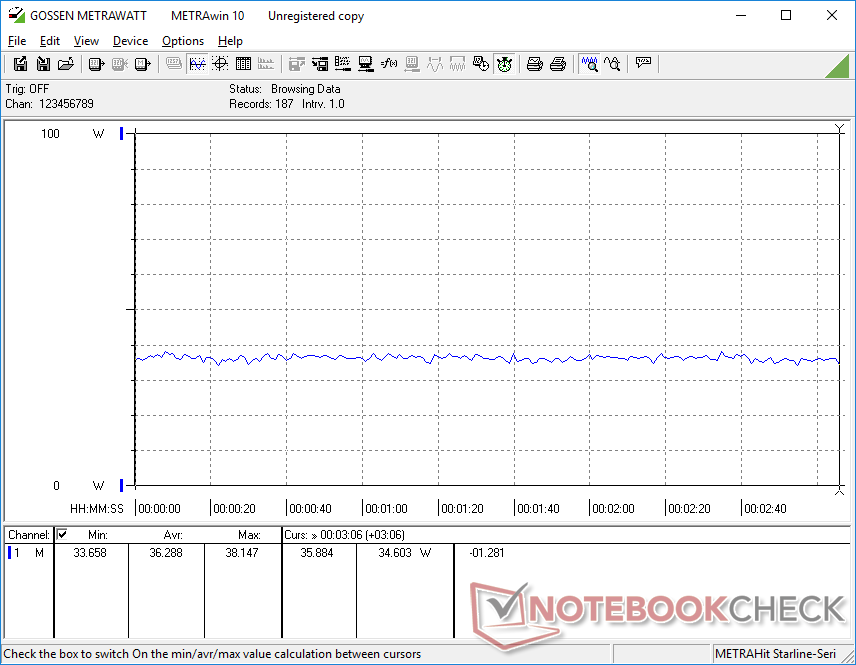
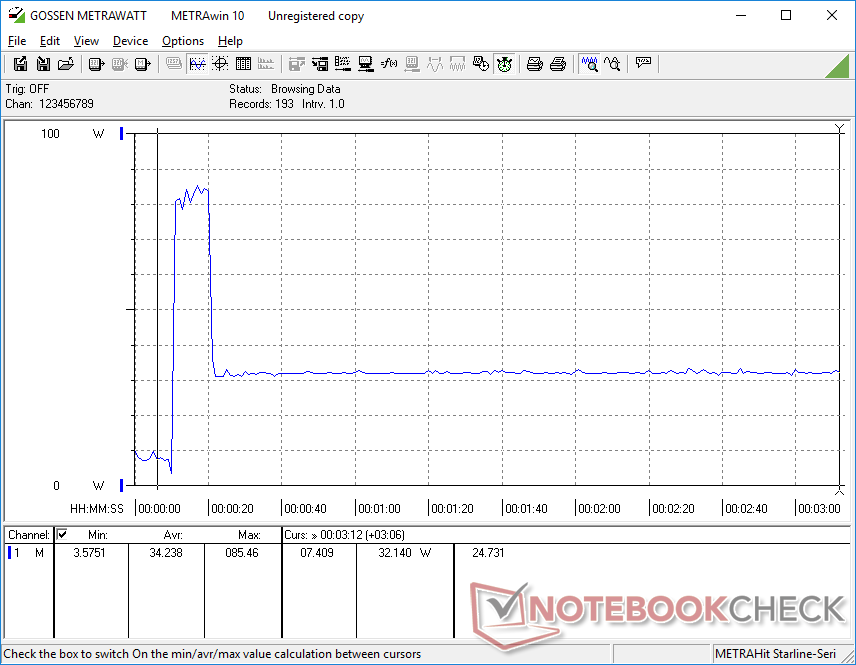
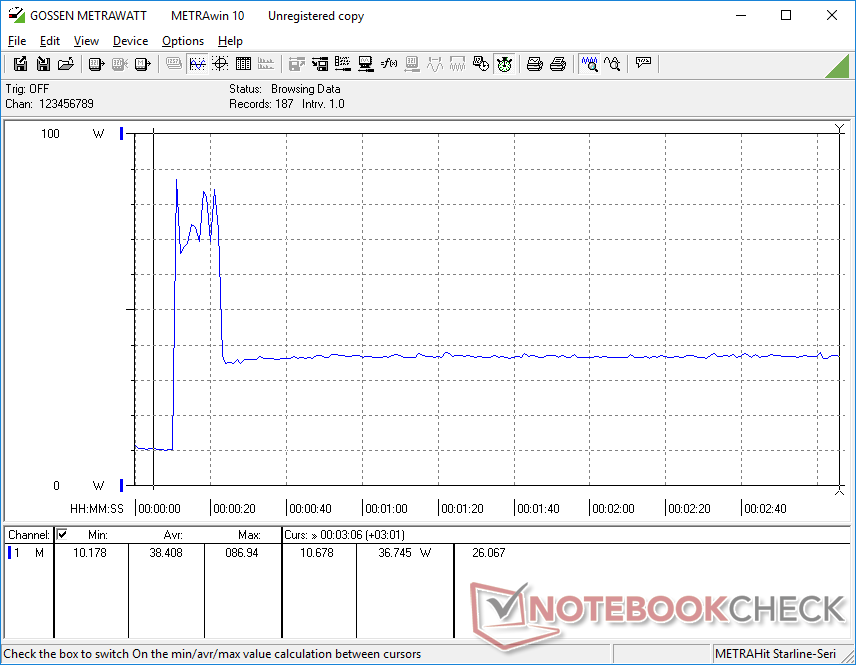
Der Leerlauf auf dem Desktop würde ein paar Watt mehr verbrauchen als beim Schenker Work 15, was wahrscheinlich auf unser höher auflösendes 4K-Display zurückzuführen ist. Bei höherer Last wäre der Verbrauch jedoch im Durchschnitt etwa gleich, trotz der Leistungs- und Temperaturunterschiede zwischen dem Core i7-1360P und dem Core i7-11370H.
Mit dem kleinen (~12,5 x 4,8 x 3 cm) 90-Watt-Netzteil können wir bei 100-prozentiger Auslastung der CPU eine maximale Leistungsaufnahme von 87 W verzeichnen. Dieser Bedarf ist nur vorübergehend, bevor die Drosselung einsetzt, wie unsere Stromverbrauchsgrafiken unten zeigen.
| Aus / Standby | |
| Idle | |
| Last |
|
Legende:
min: | |
| Eurocom C315 Blitz i7-1360P, Iris Xe G7 96EUs, Samsung 990 Pro 1 TB, IPS, 3840x2160, 15.6" | Schenker Work 15 Tiger Lake-H i7-11370H, Iris Xe G7 96EUs, Samsung SSD 980 Pro 1TB MZ-V8P1T0BW, IPS, 1920x1080, 15.6" | Lenovo ThinkPad L15 Gen 4 21H70021GE R7 PRO 7730U, Vega 8, SK hynix HFS512GEJ4X113N, IPS, 1920x1080, 15.6" | Acer Aspire 5 A515-58GM-76S8 i7-1355U, GeForce RTX 2050 Mobile, Micron 2450 1TB MTFDKBA1T0TFK, IPS, 1920x1080, 15.6" | Asus VivoBook S15 M3502RA-L1029W R7 6800H, Radeon 680M, WD PC SN735 SDBPNHH-512G, OLED, 1920x1080, 15.6" | Samsung Galaxy Book2 15 i7-1260P, A350M, Samsung PM991 MZVLQ512HBLU, IPS, 1920x1080, 15.6" | |
|---|---|---|---|---|---|---|
| Stromverbrauch | 18% | 22% | -6% | -5% | 6% | |
| Idle min * (Watt) | 9.4 | 4.5 52% | 4.5 52% | 4.31 54% | 4.4 53% | 4 57% |
| Idle avg * (Watt) | 11.5 | 8.5 26% | 8.5 26% | 6.52 43% | 5.1 56% | 7.8 32% |
| Idle max * (Watt) | 12.1 | 9.1 25% | 10.5 13% | 8.037 34% | 9.3 23% | 8.5 30% |
| Last avg * (Watt) | 38.7 | 43.5 -12% | 35.6 8% | 75.2 -94% | 67 -73% | 59.1 -53% |
| Witcher 3 ultra * (Watt) | 36.3 | 37.5 -3% | 37.4 -3% | 60.8 -67% | 66.4 -83% | 56.7 -56% |
| Last max * (Watt) | 87 | 69.4 20% | 57.9 33% | 89.5 -3% | 93.5 -7% | 62.4 28% |
* ... kleinere Werte sind besser
Energieverbrauch Witcher 3 / Stresstest
Power Consumption external Monitor
Akkulaufzeit
Die WLAN-Laufzeit ist spürbar kürzer als beim älteren Schenker Work 15, nämlich über 2 Stunden. Die Diskrepanz kann auf unser höher auflösendes 4K-Display zurückgeführt werden. Unsere Core-P-CPU würde auch auf höhere Taktraten und Verbrauchswerte als der ältere Core i7 der 11. Generation hochfahren, was sich noch stärker auf die Akkulaufzeit auswirkt.
Das Aufladen vom leeren Zustand bis zur vollen Kapazität dauert etwas mehr als 90 Minuten.
| Eurocom C315 Blitz i7-1360P, Iris Xe G7 96EUs, 73 Wh | Schenker Work 15 Tiger Lake-H i7-11370H, Iris Xe G7 96EUs, 73 Wh | Lenovo ThinkPad L15 Gen 4 21H70021GE R7 PRO 7730U, Vega 8, 57 Wh | Acer Aspire 5 A515-58GM-76S8 i7-1355U, GeForce RTX 2050 Mobile, 48 Wh | Asus VivoBook S15 M3502RA-L1029W R7 6800H, Radeon 680M, 70 Wh | Samsung Galaxy Book2 15 i7-1260P, A350M, 54 Wh | |
|---|---|---|---|---|---|---|
| Akkulaufzeit | 27% | 49% | 9% | 44% | 2% | |
| WLAN (h) | 8 | 10.2 27% | 11.9 49% | 8.7 9% | 11.5 44% | 8.2 2% |
| Idle (h) | 24.5 | 25.1 | ||||
| H.264 (h) | 9.6 | 9.5 | 6.6 | 12.8 | 10.6 | |
| Last (h) | 2.2 | 2.2 | 2 | 1 | 1.5 |
Pro
Contra
Fazit - Die CPU-Leistung könnte noch etwas verbessert werden
Der Core i7-1360P trägt dazu bei, das Eurocom C315 Blitz von den meisten anderen Laptops zu unterscheiden, da diese CPU-Option eher ungewöhnlich ist. Leider drosselt der Prozessor beim Eurocom zu stark, sodass die Gesamtleistung identisch mit der des Core i7-11370H oder sogar langsamer als die des günstigenen Core i5-1340P sein kann. Das LG Gram 2-in-1 16, das mit der gleichen Core i7-1360P-Option ausgeliefert wird, ist in der Lage, die CPU bis zu 80 Prozent schneller zu betreiben als unser Eurocom.
Das Eurocom C315 Blitz wird durch die drosselanfällige Core i7-1360P-CPU und die fehlenden Display-Optionen gebremst.
Andere wichtige Aspekte des Modells sind in Bezug auf die Funktionen unzureichend. Das 4K-Panel bietet zum Beispiel keine DCI-P3-Farben, hohe Bildwiederholraten oder HDR-Unterstützung, auf die bestimmte Profis oder Multimedia-Nutzer Wert legen könnten. Die Akkulaufzeit und die Webcam-Qualität sind ebenfalls nur durchschnittlich oder nicht überzeugend.
Die Clevo X170KM Base könnte sicherlich von einem Facelift mit zusätzlichem Performance-Tuning, Lüftergeräusch-Optimierung und erweiterten Display-Funktionen profitieren, besonders wenn man den Startpreis von ~1200 Euro bedenkt. Der Bereich von 900 bis 1300 Euro ist in diesem Segment bereits äußerst wettbewerbsintensiv mit professionellen Optionen wie dem Lenovo ThinkPad L15, dem HP ProBook oder der Dell Latitude-Serie.
Preis und Verfügbarkeit
Eurocom liefert den C315 Blitz jetzt ab ~1200 Euro für die Basiskonfiguration bis über ~2200 Euro, wenn er mit 64 GB RAM und einer 1 TB SSD wie bei uns konfiguriert ist.
Eurocom C315 Blitz
- 29.11.2023 v7 (old)
Allen Ngo
Transparenz
Die Auswahl der zu testenden Geräte erfolgt innerhalb der Redaktion. Das vorliegende Testmuster wurde dem Autor vom Hersteller oder einem Shop zu Testzwecken leihweise zur Verfügung gestellt. Eine Einflussnahme des Leihstellers auf den Testbericht gab es nicht, der Hersteller erhielt keine Version des Reviews vor der Veröffentlichung. Es bestand keine Verpflichtung zur Publikation. Als eigenständiges, unabhängiges Unternehmen unterliegt Notebookcheck keiner Diktion von Herstellern, Shops und Verlagen.
So testet Notebookcheck
Pro Jahr werden von Notebookcheck hunderte Laptops und Smartphones unabhängig in von uns standardisierten technischen Verfahren getestet, um eine Vergleichbarkeit aller Testergebnisse zu gewährleisten. Seit rund 20 Jahren entwickeln wir diese Testmethoden kontinuierlich weiter und setzen damit Branchenstandards. In unseren Testlaboren kommt ausschließlich hochwertiges Messequipment in die Hände erfahrener Techniker und Redakteure. Die Tests unterliegen einer mehrstufigen Kontrolle. Unsere komplexe Gesamtbewertung basiert auf hunderten fundierten Messergebnissen und Benchmarks, womit Ihnen Objektivität garantiert ist. Weitere Informationen zu unseren Testmethoden gibt es hier.
Preisvergleich

