Intel Core Ultra 5 338H vs Intel Core Ultra 7 365
Intel Core Ultra 5 338H
► remove from comparison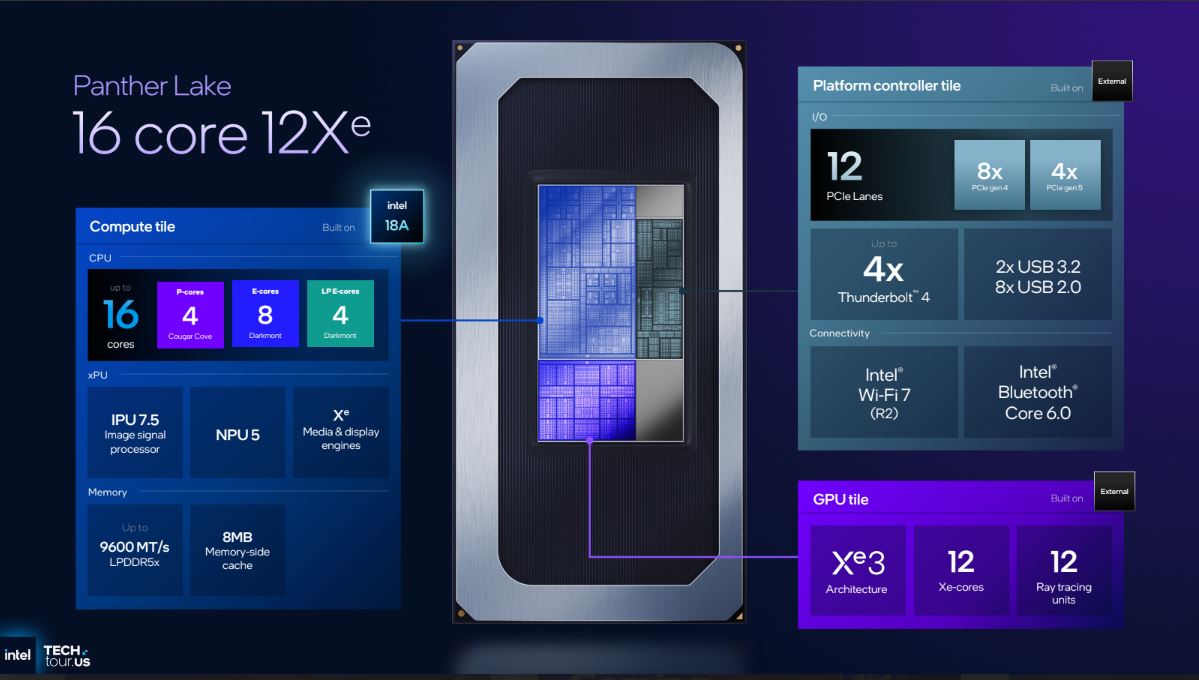
Der Intel Core Ultra 5 338H ist ein schneller Mittelklasse 12-Kern SoC der Panther Lake Familie für Notebooks. Der Chip bietet weiters eine starke 10-Kerne iGPU. Die CPU unterstützt vPro Management Features.
Der 338H integriert einen Compute Tile der bei Intel im neuen 18A Prozess gefertigt wird. Dieser beinhaltet 4 große Cougar Cove P-Cores mit bis zu 1,7 - 4,7 GHz, 4 der 8 Darkmont E-Cores mit 1,5 - 3,6 GHz und nochmals 4 kleine Darkmont LP (Low Power) E-Cores mit 1,5 - 3,3 GHz. Weiters ist die neue NPU 5 mit 50 TOPS INT 8 und ein IPU 7.5 Bildprozessor verbaut. Der integrierte Speicherkontroller unterstützt bis zu 96 GB LPDDR5-9600 bzw. 128 GB DDR5-7200.
Der GPU-Tile beinhaltet eine starke iGPU mit 10 der 12 Xe3 Kernen und Raytracing-Unterstützung.
Das dritte Chiplet integriert den Platform Controller mit 12 PCIe Lanes (im Vergleich zu 12 bei den anderen 2 Chips), 4x Thunderbolt 4, Wi-Fi 7 (R2) und Bluetooth Core 6.0. Der Platform Controller werden ebenfalls bei TSMC gefertigt.
Der TDP ist laut Intel von 15 - 25 Watt (Base) und kurzfristig bis zu 80 Watt spezifiziert.
Intel Core Ultra 7 365
► remove from comparison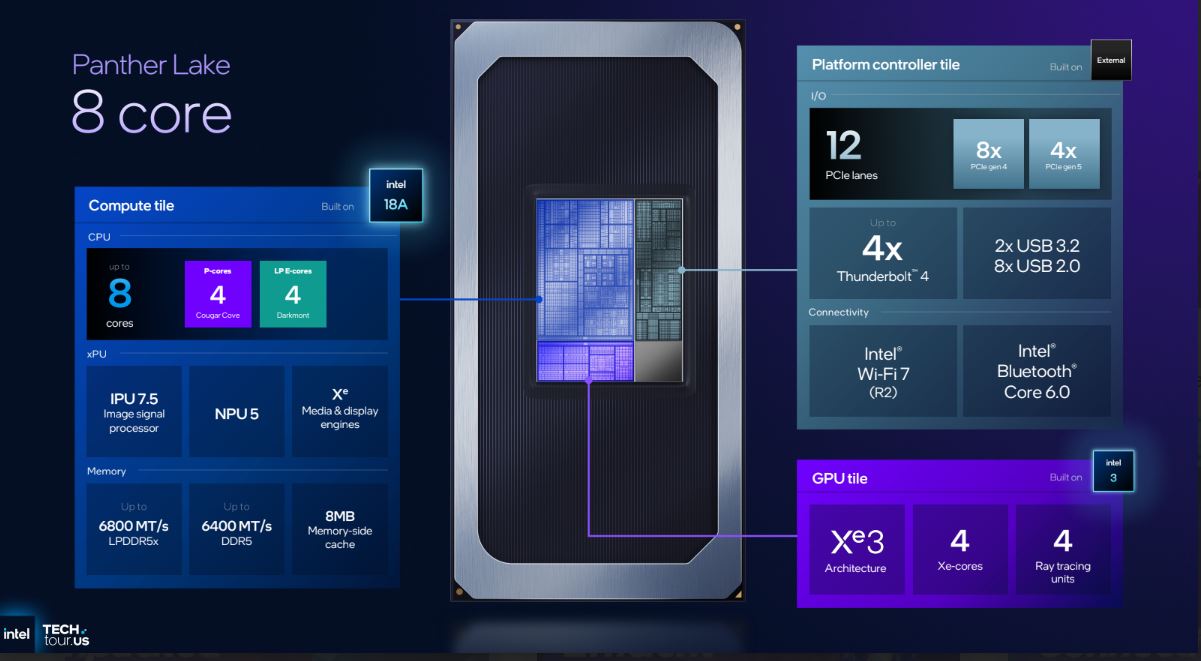
Der Intel Core Ultra 5 365 ist ein Mittelklasse 8-Kern (4+4) SoC der Panther Lake Familie für Notebooks. Die CPU unterstützt vPro Management Features.
Er integriert einen Compute Tile der bei Intel im neuen 18A Prozess gefertigt wird mit 4 großen starken Cougar Cove P-Cores mit 2,4 - 4,8 GHz und 4 Darkmont LP (Low Power) E-Cores mit 1,8 - 3,6 GHz. Weiters ist die neue NPU 5 mit 50 TOPS INT 8 und ein IPU 7.5 Bildprozessor verbaut. Der integrierte Speicherkontroller unterstützt bis zu 96 GB LPDDR5X-7467 bzw. 128 GB DDR5-6400.
Der GPU-Tile beinhaltet eine schnelle iGPU mit 4 Xe3 Kernen und Raytracing-Unterstützung und wird bei Intel im Intel 3 Prozess gefertigt.
Das dritte Chiplet integriert den Platform Controller mit 12 PCIe Lanes, 4x Thunderbolt 4, Wi-Fi 7 (R2) und Bluetooth Core 6.0. Der Platform Controller werden ebenfalls bei TSMC gefertigt.
Der TDP ist laut Intel von 15 - 25 Watt (Base) und kurzfristig bis zu 55 Watt spezifiziert.
| Model | Intel Core Ultra 5 338H | Intel Core Ultra 7 365 | ||||||||||||||||||||||||||||||||||||||||||||||||||||||||||||||||||||||||||||||||||||||||||||||||||||||||||||||||
| Codename | Panther Lake | Panther Lake | ||||||||||||||||||||||||||||||||||||||||||||||||||||||||||||||||||||||||||||||||||||||||||||||||||||||||||||||||
| Series | Intel Panther Lake | Intel Panther Lake | ||||||||||||||||||||||||||||||||||||||||||||||||||||||||||||||||||||||||||||||||||||||||||||||||||||||||||||||||
| Serie: Panther Lake Panther Lake |
|
| ||||||||||||||||||||||||||||||||||||||||||||||||||||||||||||||||||||||||||||||||||||||||||||||||||||||||||||||||
| Clock | 1500 - 4700 MHz | 1800 - 4800 MHz | ||||||||||||||||||||||||||||||||||||||||||||||||||||||||||||||||||||||||||||||||||||||||||||||||||||||||||||||||
| L3 Cache | 18 MB | 12 MB | ||||||||||||||||||||||||||||||||||||||||||||||||||||||||||||||||||||||||||||||||||||||||||||||||||||||||||||||||
| Cores / Threads | 12 / 12 4 x 4.7 GHz Intel Cougar Cove P-Core 4 x 3.6 GHz Intel Darkmont E-Core 4 x 3.3 GHz Intel Darkmont LP E-Core | 8 / 8 4 x 4.8 GHz Intel Cougar Cove P-Core 4 x 3.6 GHz Intel Darkmont LP E-Core | ||||||||||||||||||||||||||||||||||||||||||||||||||||||||||||||||||||||||||||||||||||||||||||||||||||||||||||||||
| TDP | 25 Watt | 25 Watt | ||||||||||||||||||||||||||||||||||||||||||||||||||||||||||||||||||||||||||||||||||||||||||||||||||||||||||||||||
| TDP Turbo PL2 | 80 Watt | 55 Watt | ||||||||||||||||||||||||||||||||||||||||||||||||||||||||||||||||||||||||||||||||||||||||||||||||||||||||||||||||
| Technology | 1.8 nm | 1.8 nm | ||||||||||||||||||||||||||||||||||||||||||||||||||||||||||||||||||||||||||||||||||||||||||||||||||||||||||||||||
| max. Temp. | 100 °C | 100 °C | ||||||||||||||||||||||||||||||||||||||||||||||||||||||||||||||||||||||||||||||||||||||||||||||||||||||||||||||||
| Socket | FCBGA2540 | FCBGA2540 | ||||||||||||||||||||||||||||||||||||||||||||||||||||||||||||||||||||||||||||||||||||||||||||||||||||||||||||||||
| iGPU | Intel Arc B370 10 Xe3 Panther Lake iGPU ( - 2400 MHz) | Intel Graphics 4 Xe3 Panther Lake iGPU ( - 2500 MHz) | ||||||||||||||||||||||||||||||||||||||||||||||||||||||||||||||||||||||||||||||||||||||||||||||||||||||||||||||||
| NPU / AI | 50 TOPS INT8 | 50 TOPS INT8 | ||||||||||||||||||||||||||||||||||||||||||||||||||||||||||||||||||||||||||||||||||||||||||||||||||||||||||||||||
| Chip AI | 180 TOPS INT8 | |||||||||||||||||||||||||||||||||||||||||||||||||||||||||||||||||||||||||||||||||||||||||||||||||||||||||||||||||
| Architecture | x86 | x86 | ||||||||||||||||||||||||||||||||||||||||||||||||||||||||||||||||||||||||||||||||||||||||||||||||||||||||||||||||
| Announced | ||||||||||||||||||||||||||||||||||||||||||||||||||||||||||||||||||||||||||||||||||||||||||||||||||||||||||||||||||
| Manufacturer | www.intel.com | www.intel.com | ||||||||||||||||||||||||||||||||||||||||||||||||||||||||||||||||||||||||||||||||||||||||||||||||||||||||||||||||
| L1 Cache | 2.3 MB | |||||||||||||||||||||||||||||||||||||||||||||||||||||||||||||||||||||||||||||||||||||||||||||||||||||||||||||||||
| L2 Cache | 16 MB |

Benchmarks

* Smaller numbers mean a higher performance