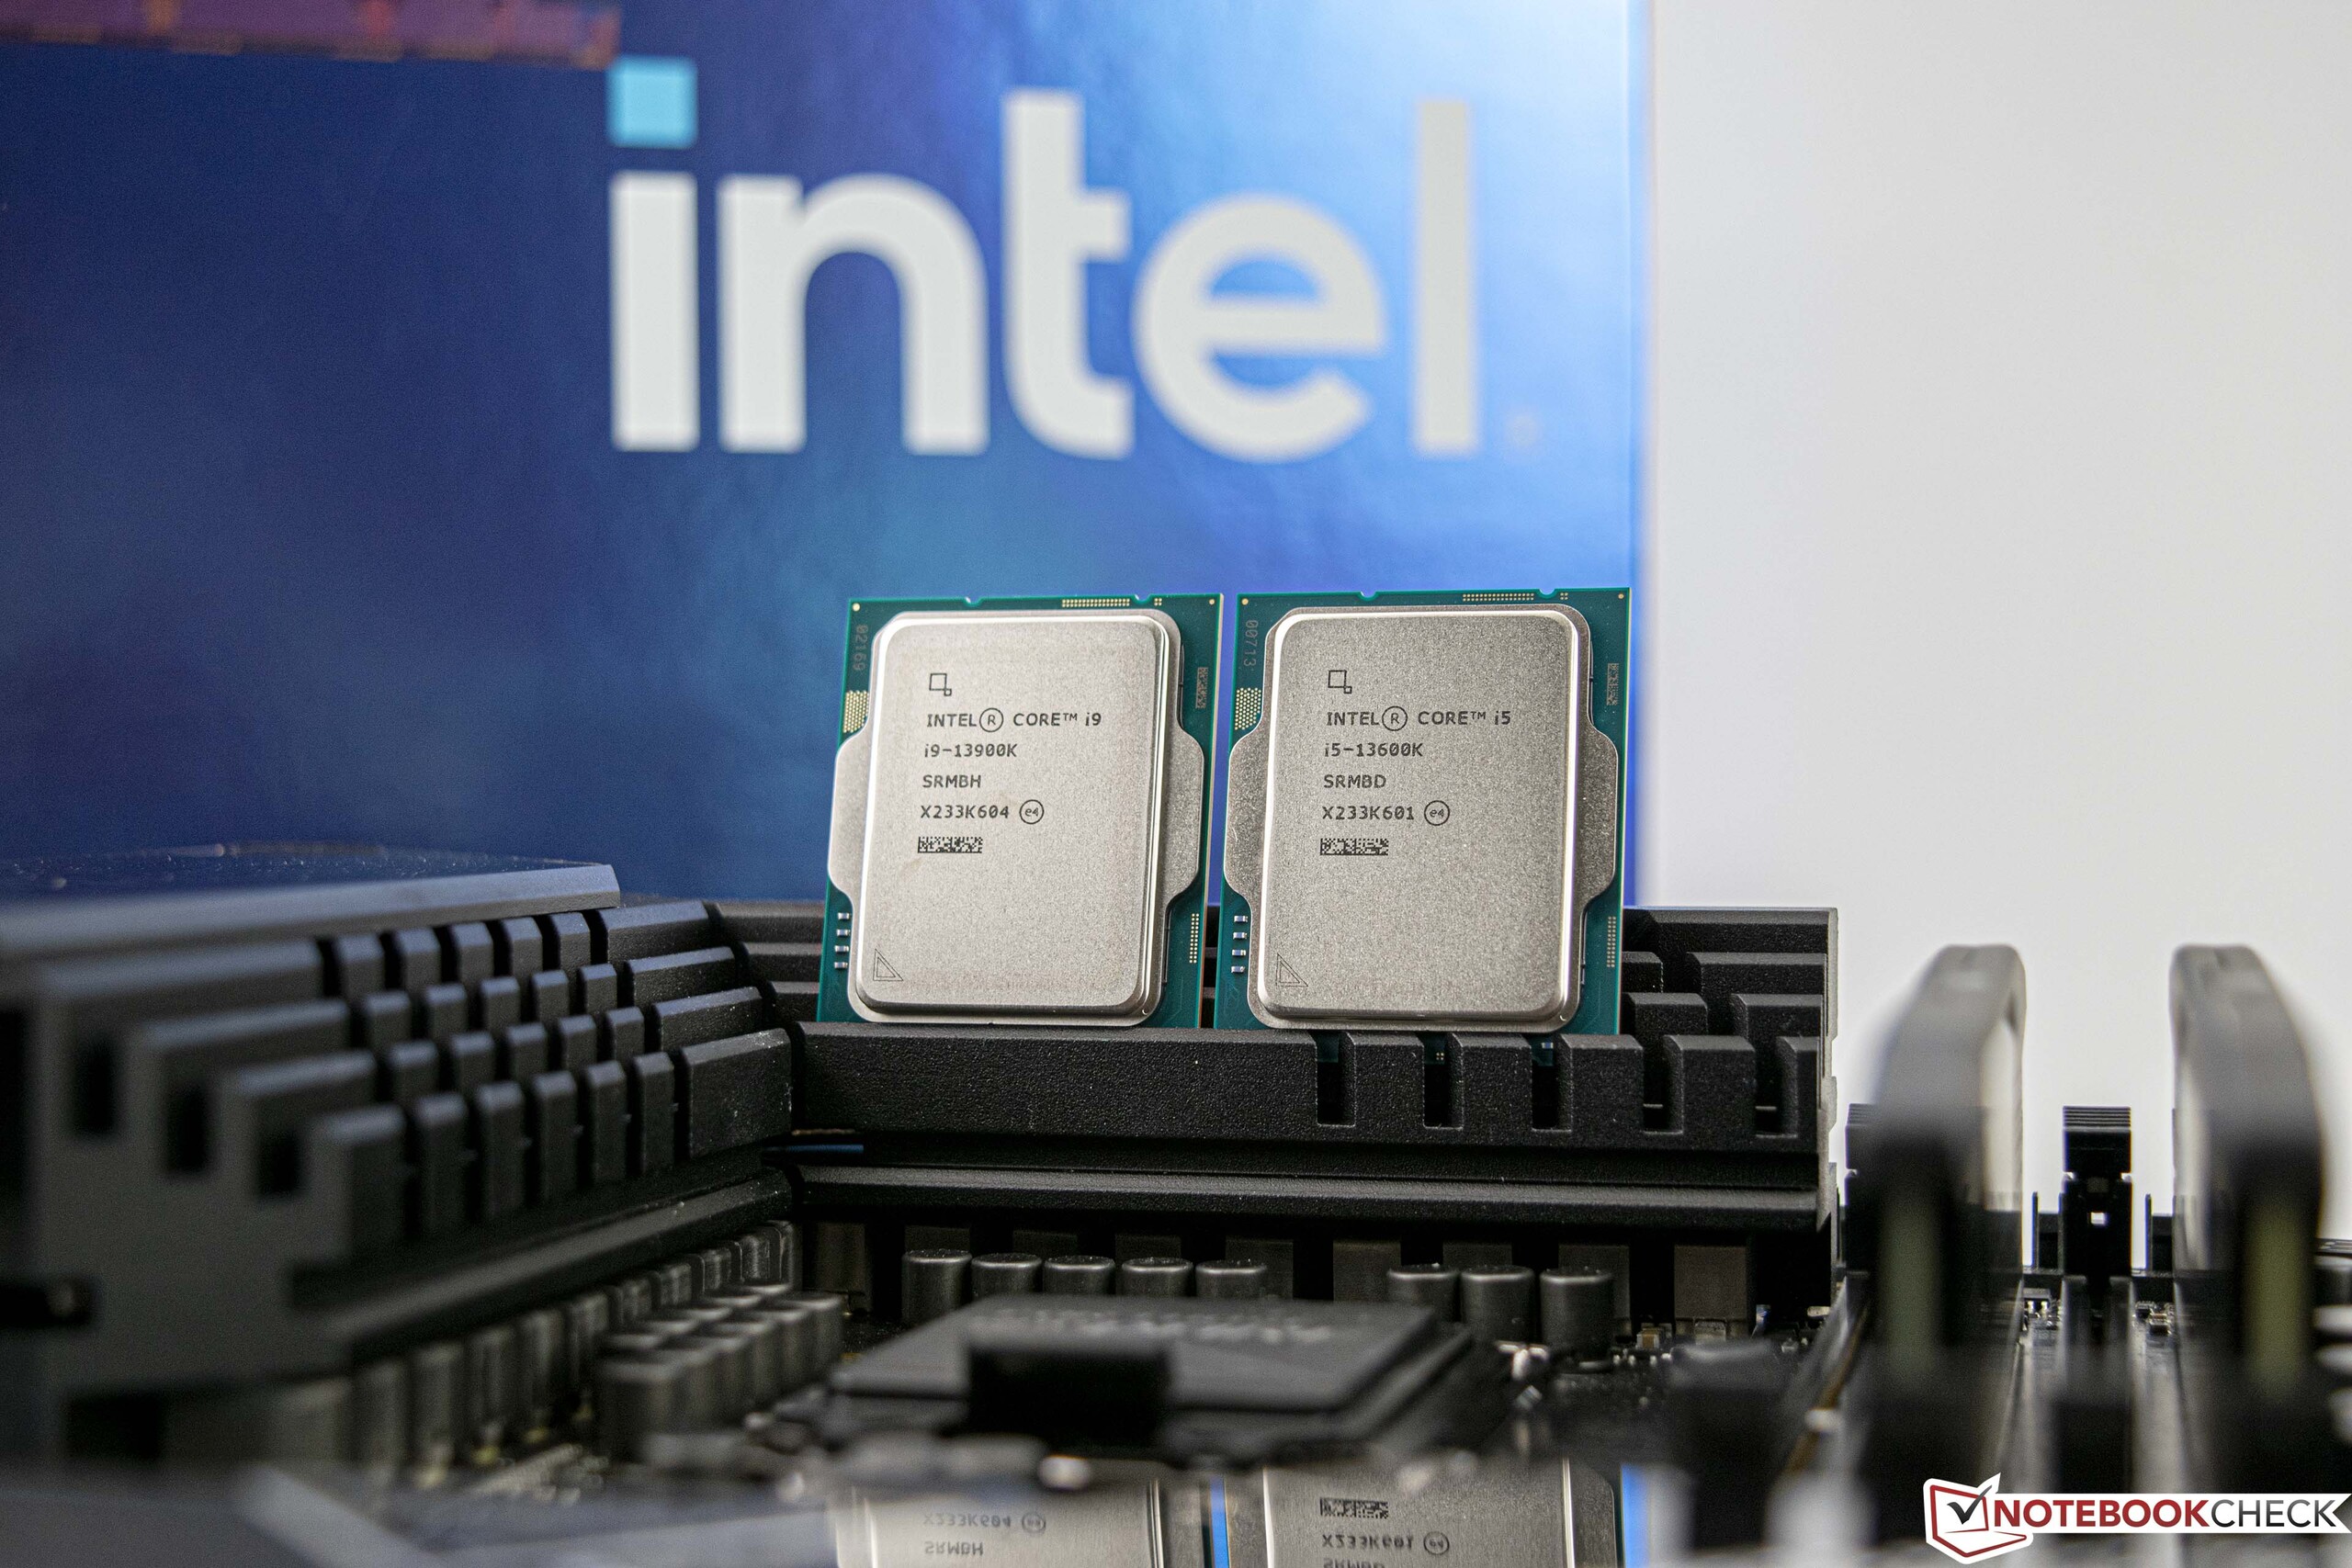
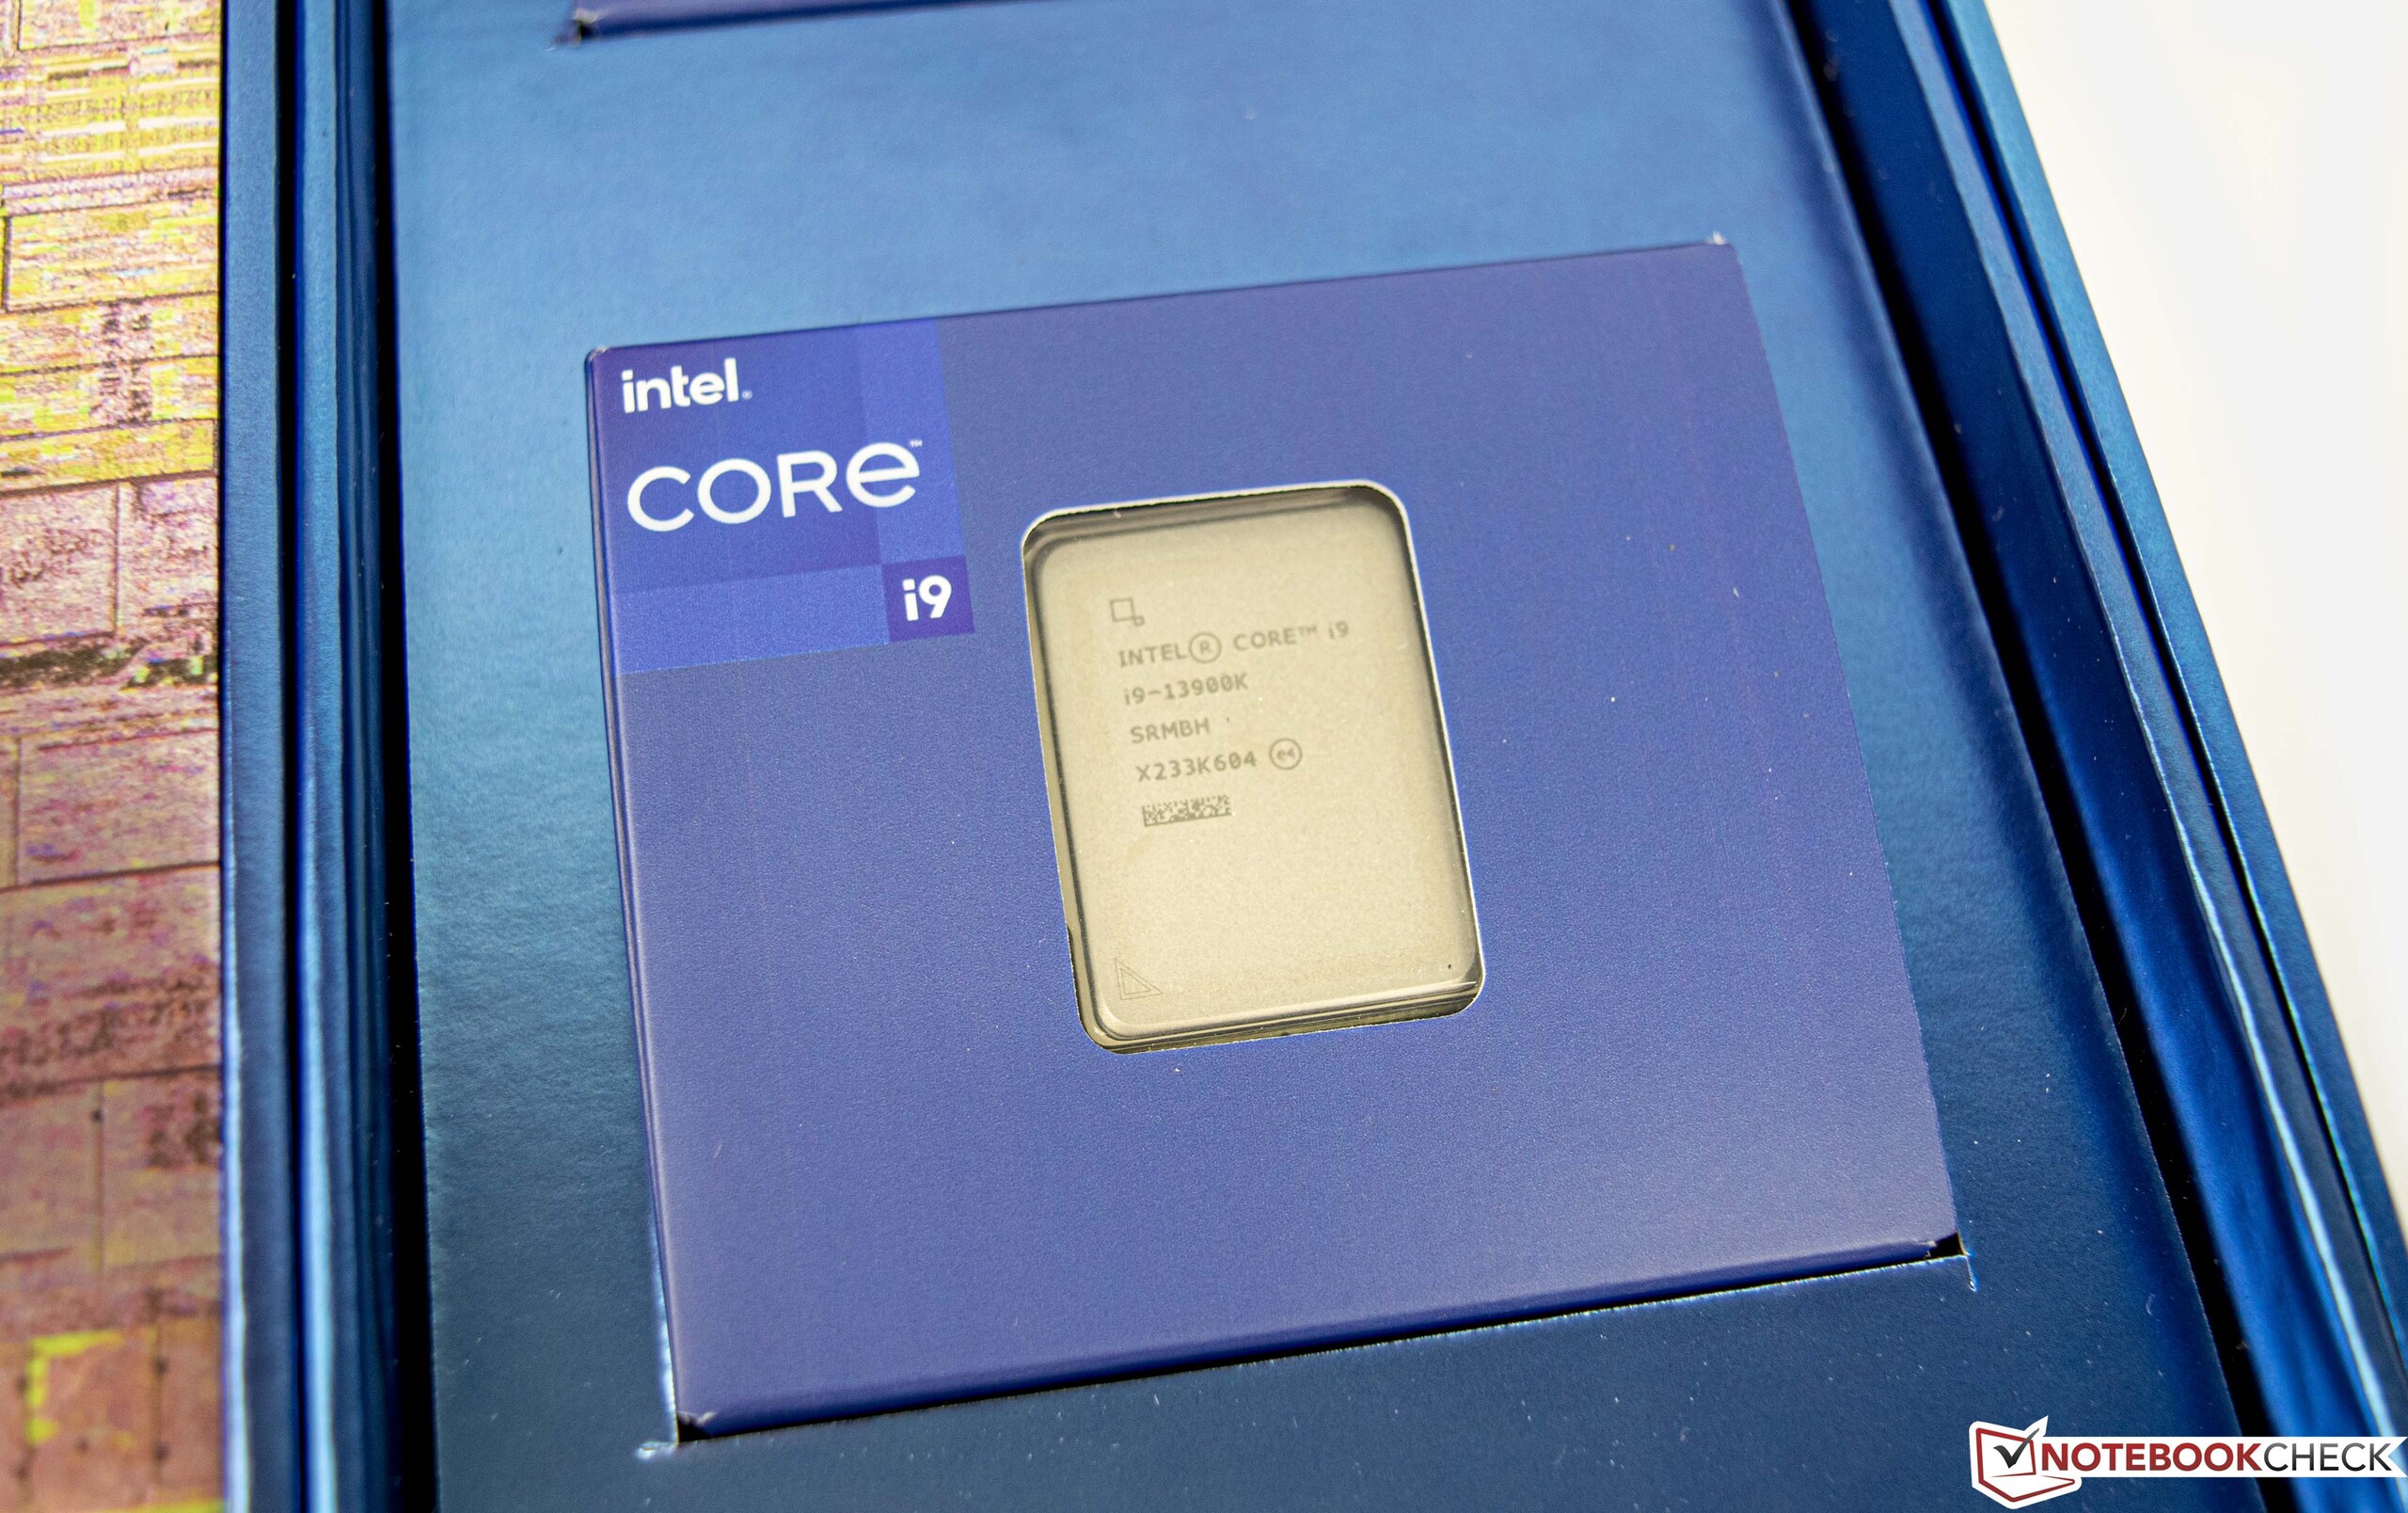
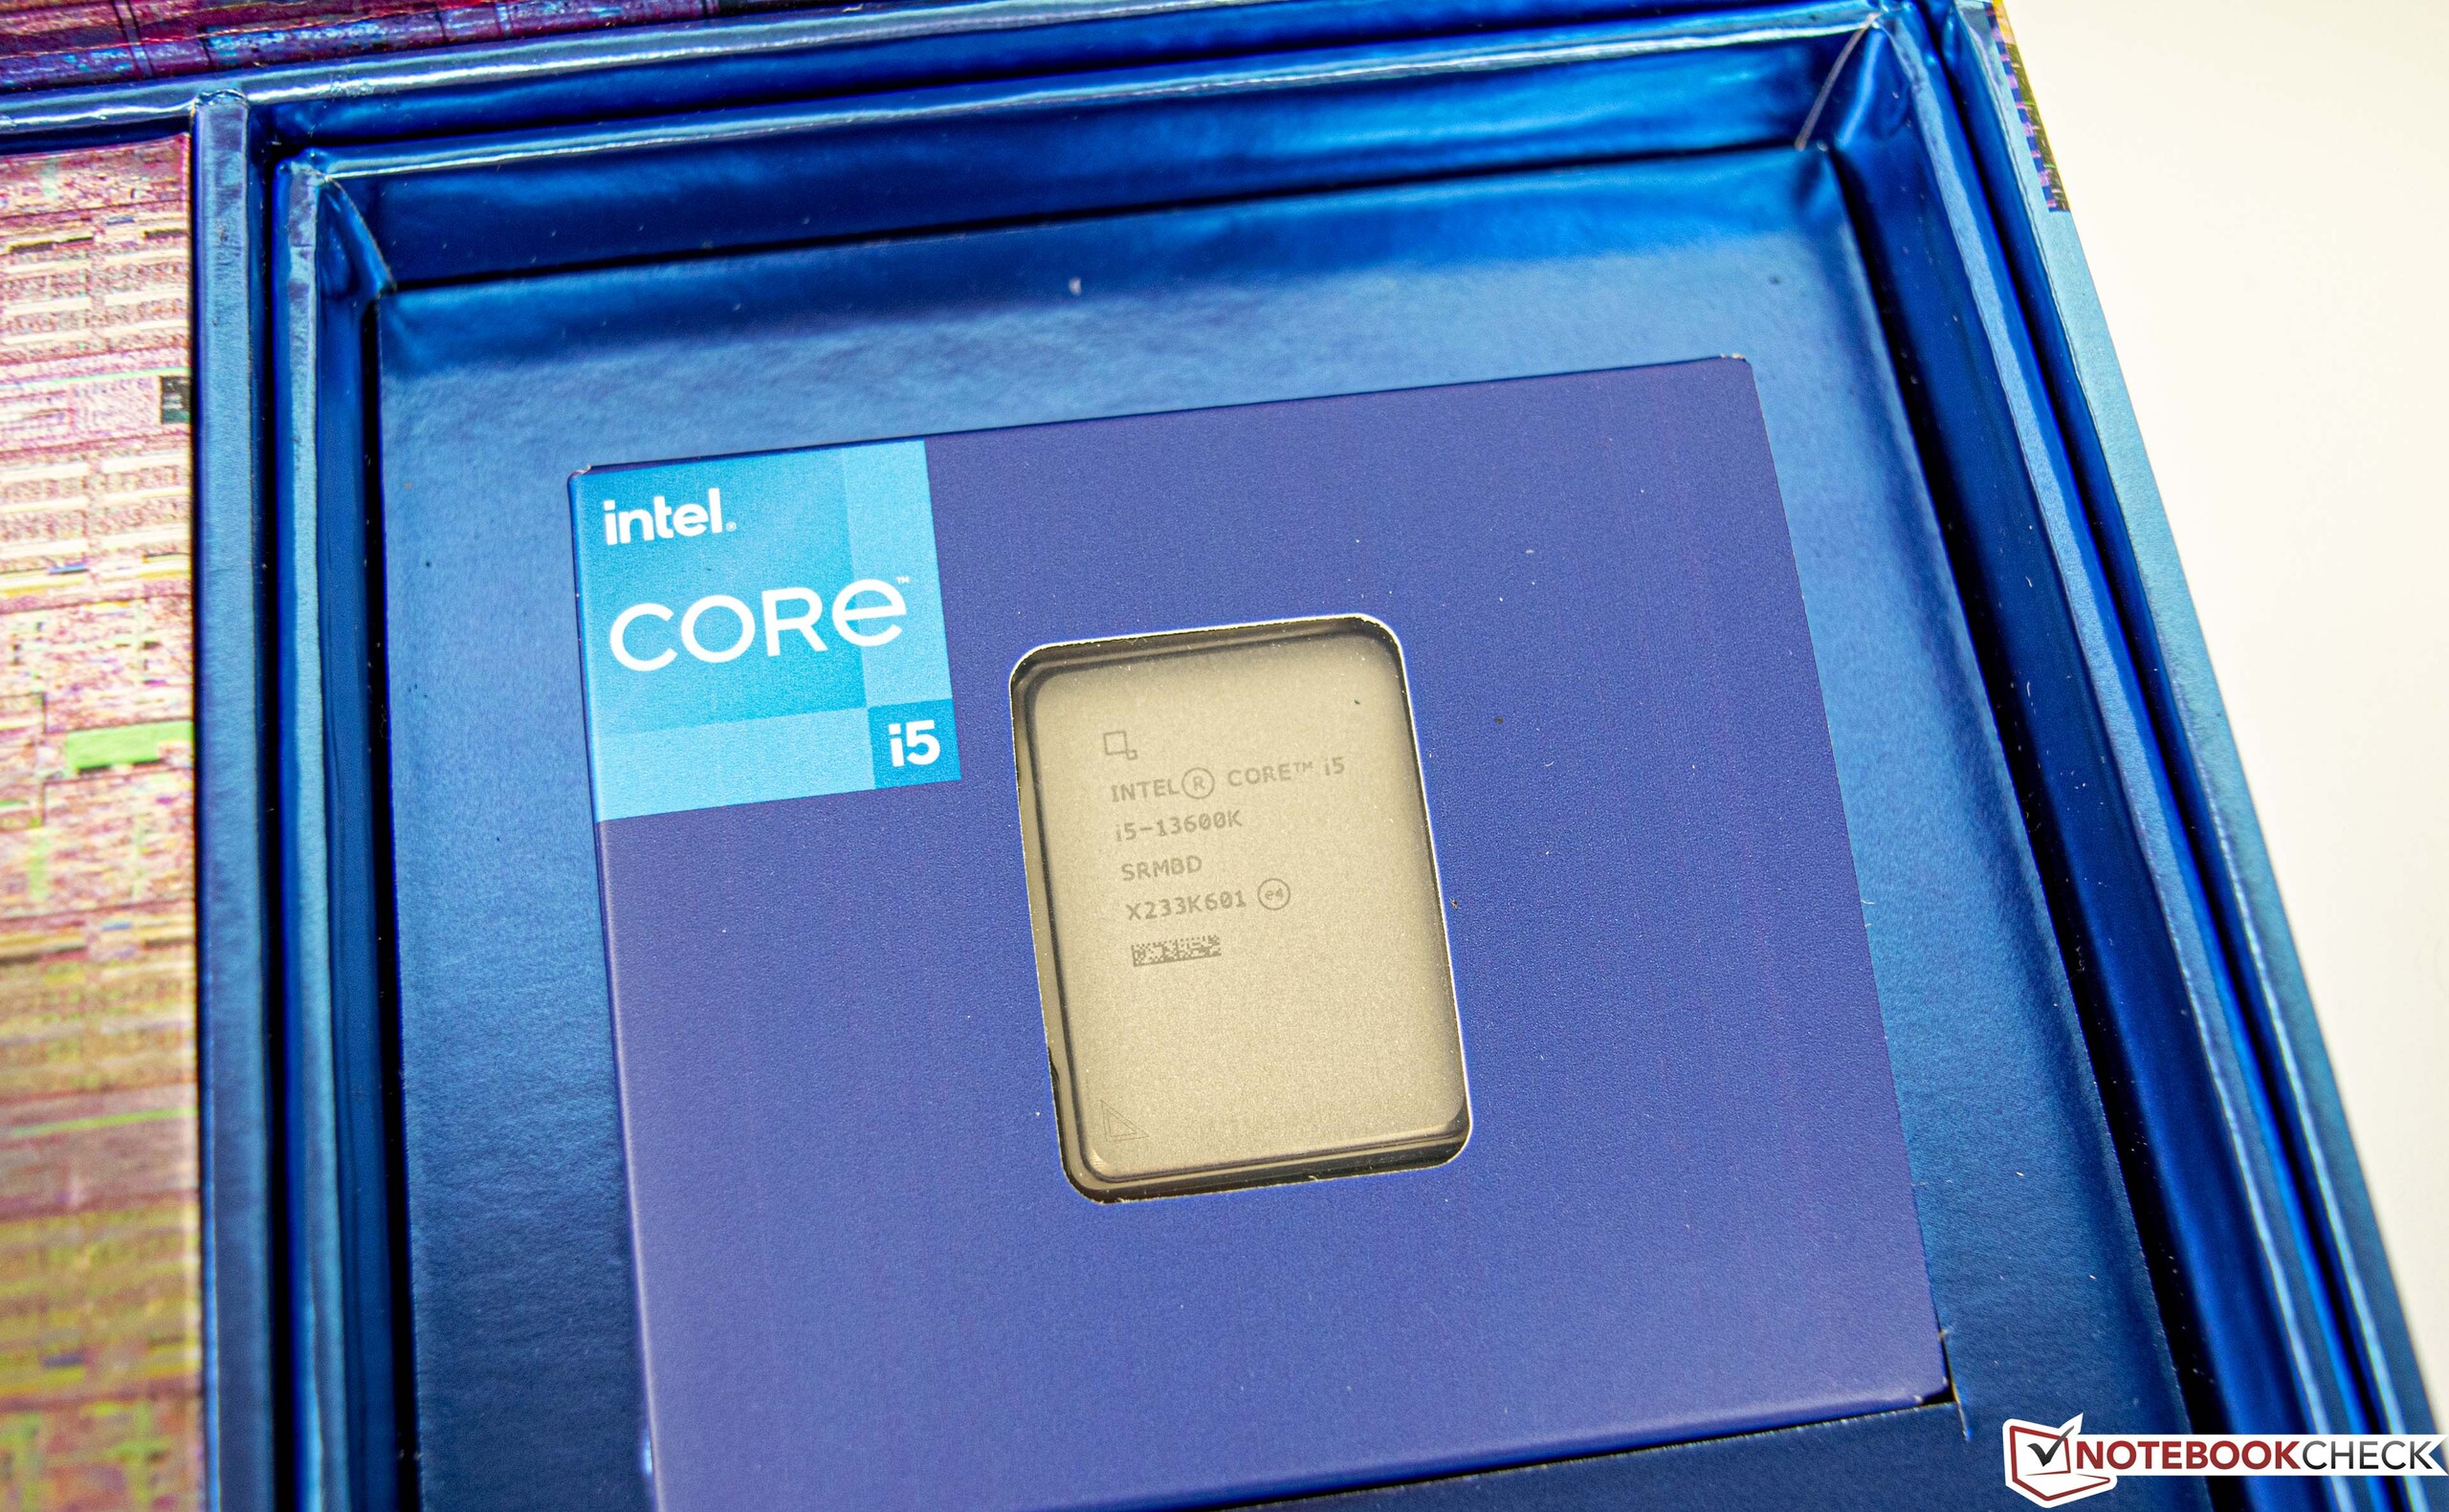
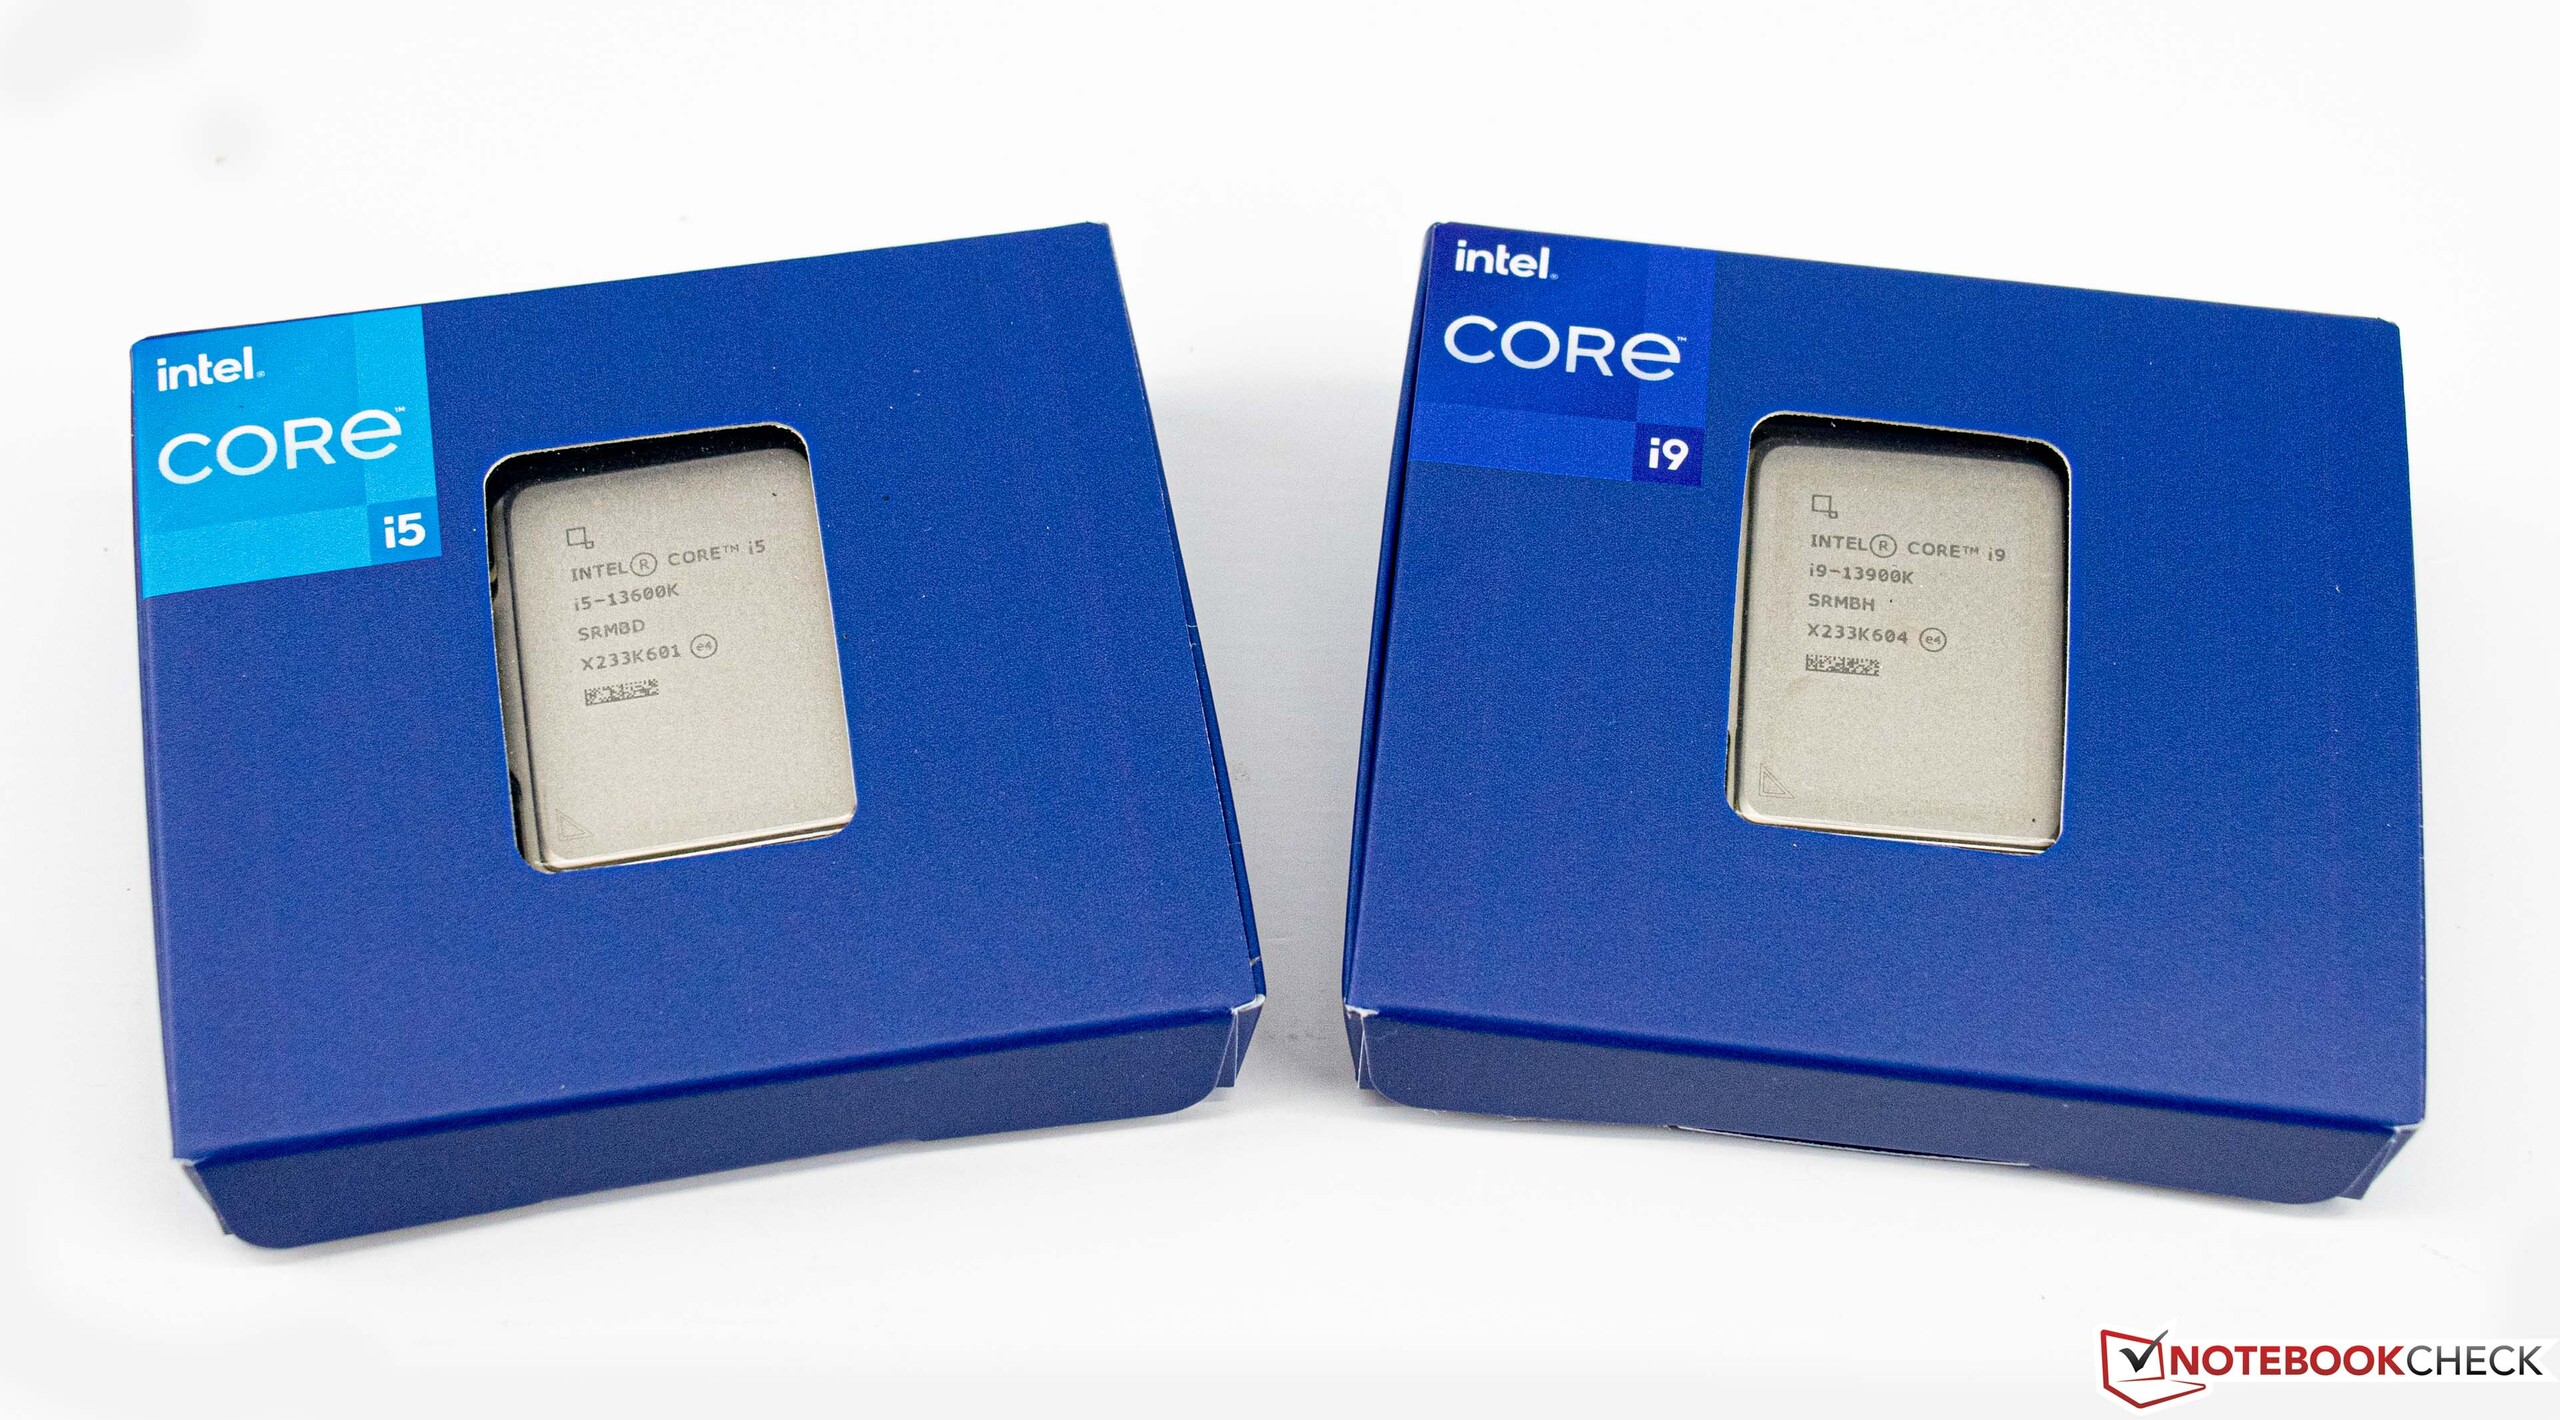
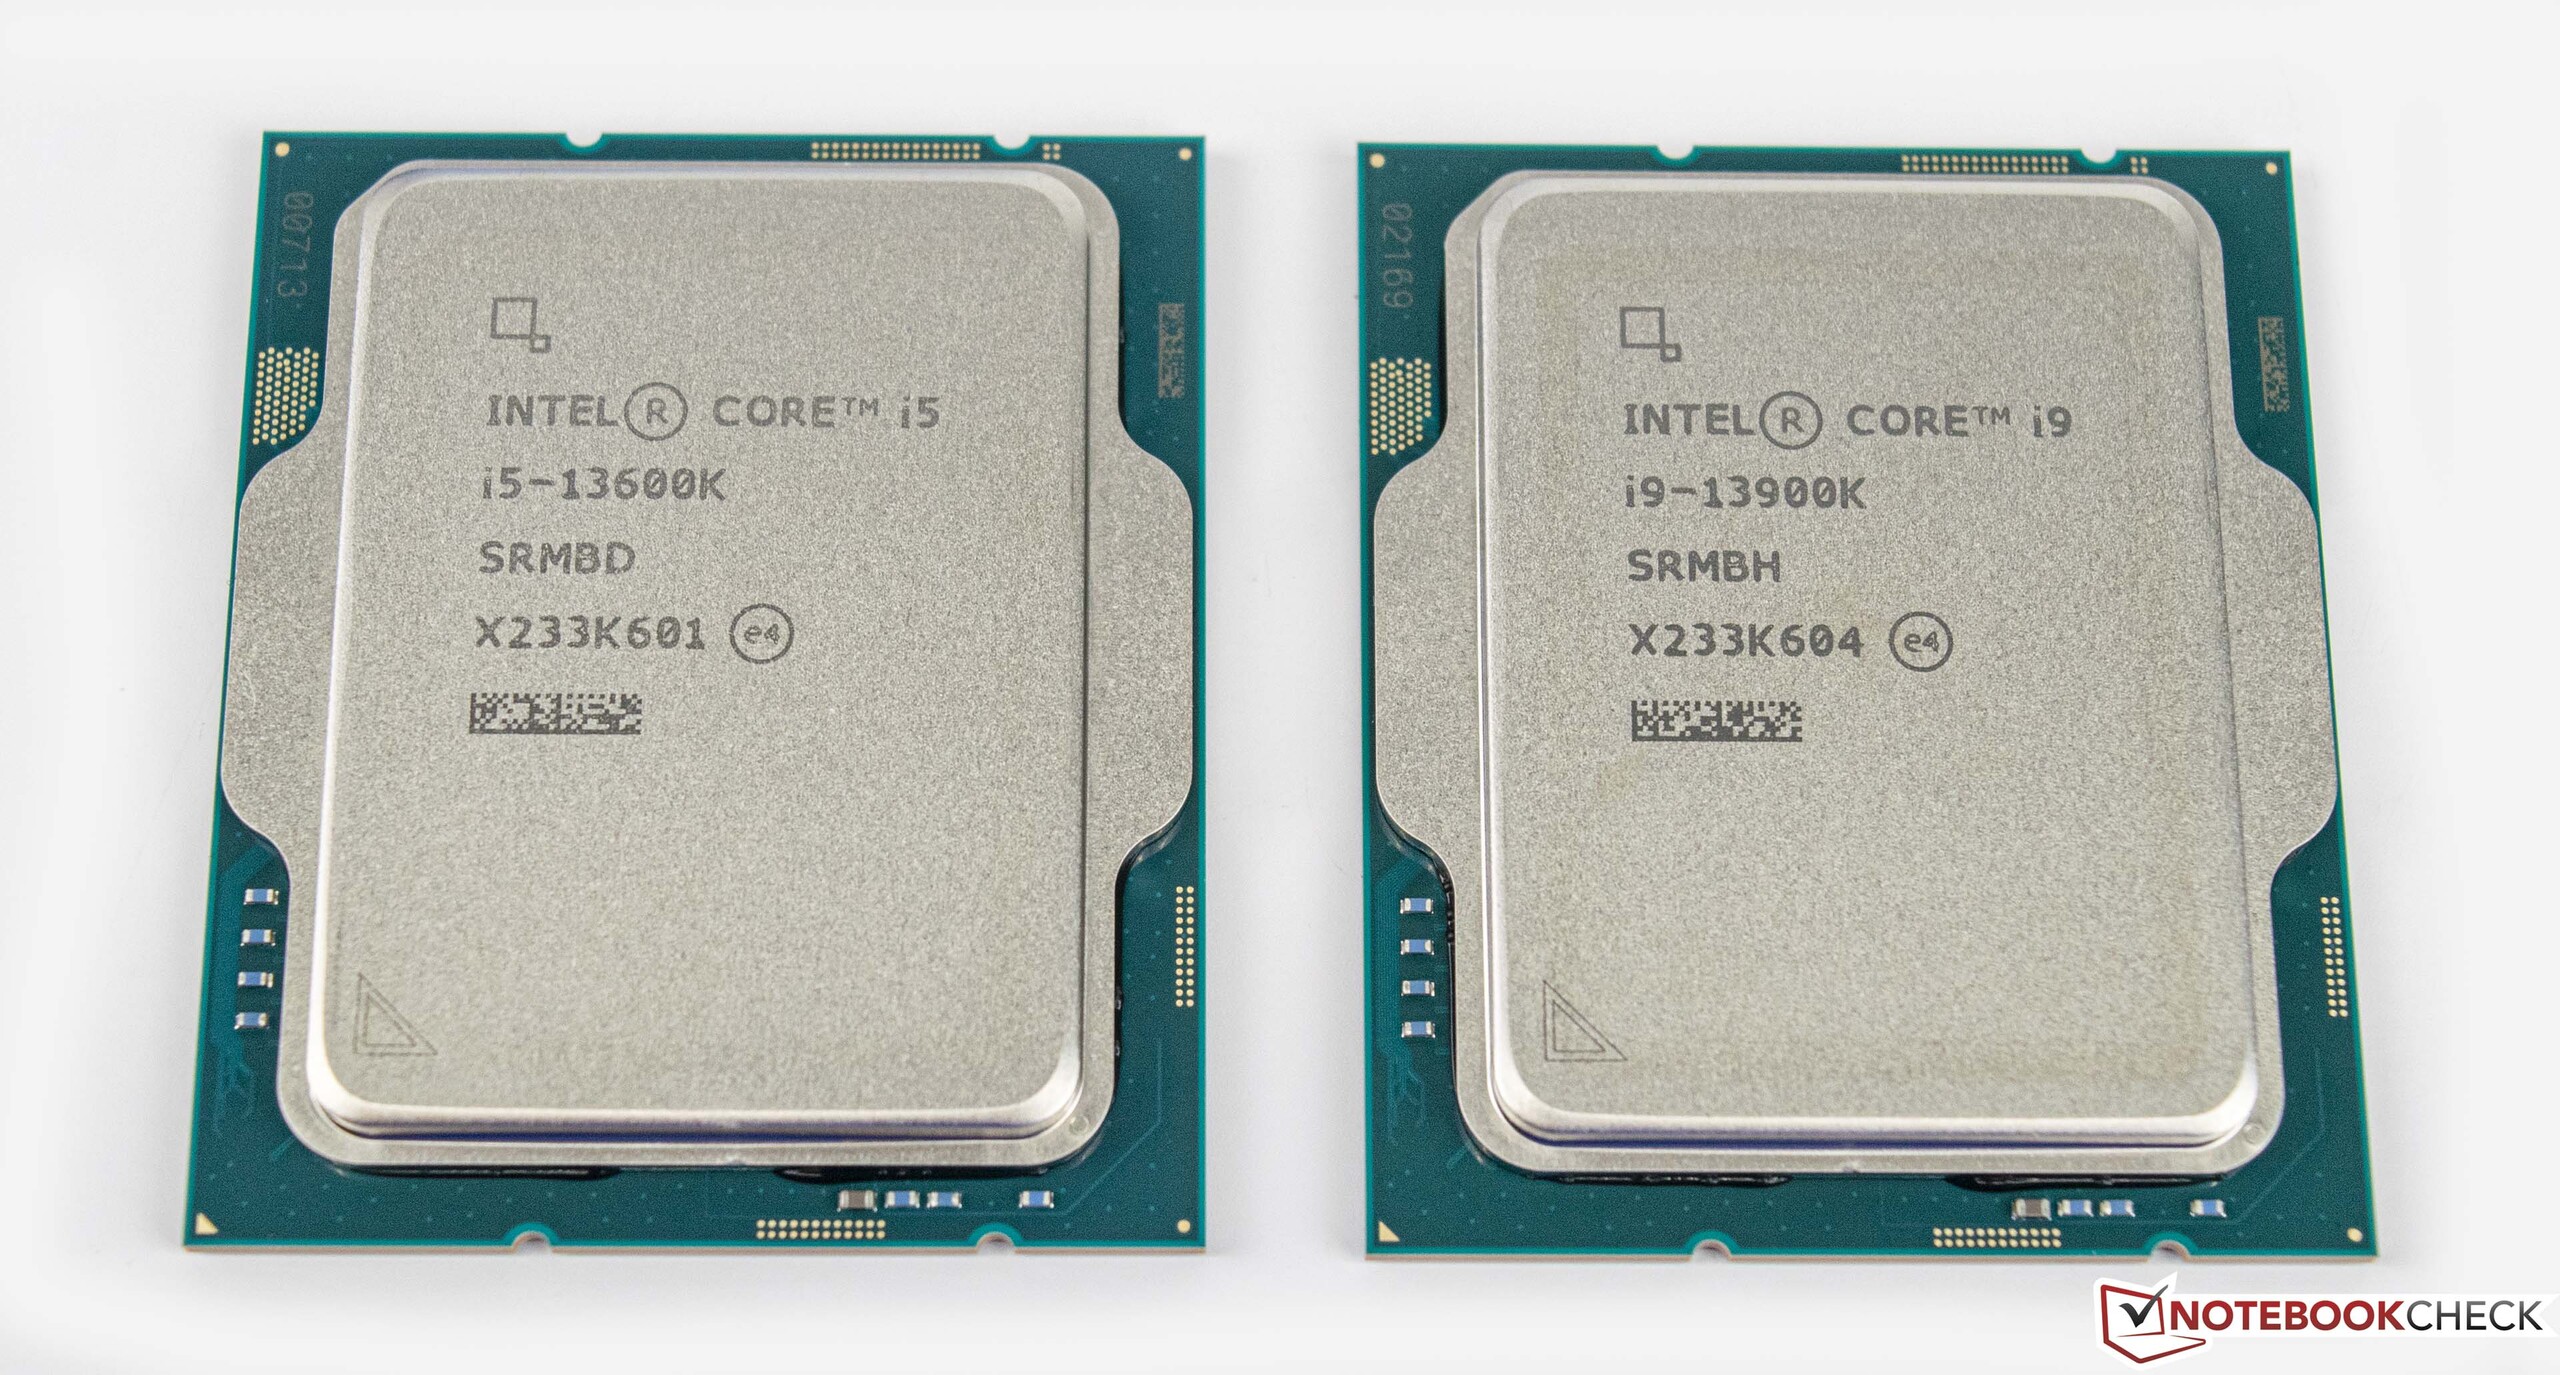
Intel Core i9-13900K und Intel Core i5-13600K im Test: Mehr Kerne und mehr Takt mit Raptor-Lake
Mit Einführung der hybriden CPUs im Desktop-Bereich konnte Intel letztes Jahr einen beachtlichen Leistungssprung verzeichnen. Dabei setzte die Alder-Lake-Plattform erstmals P- und E-Cores ein, um die Leistung besser zu verteilen. AMD verfolgt mit seiner Chiplet-Architektur einen anderen Ansatz und konnte bis dato ebenfalls sehr gute Leistungen erreichen. Mit den kürzlich vorgestellten Zen-4-Prozessoren konnte AMD abermals einen deutlichen Leistungszuwachs verzeichnen. Raptor-Lake soll es nun wieder richten und Intel die Performance-Krone zurückholen.
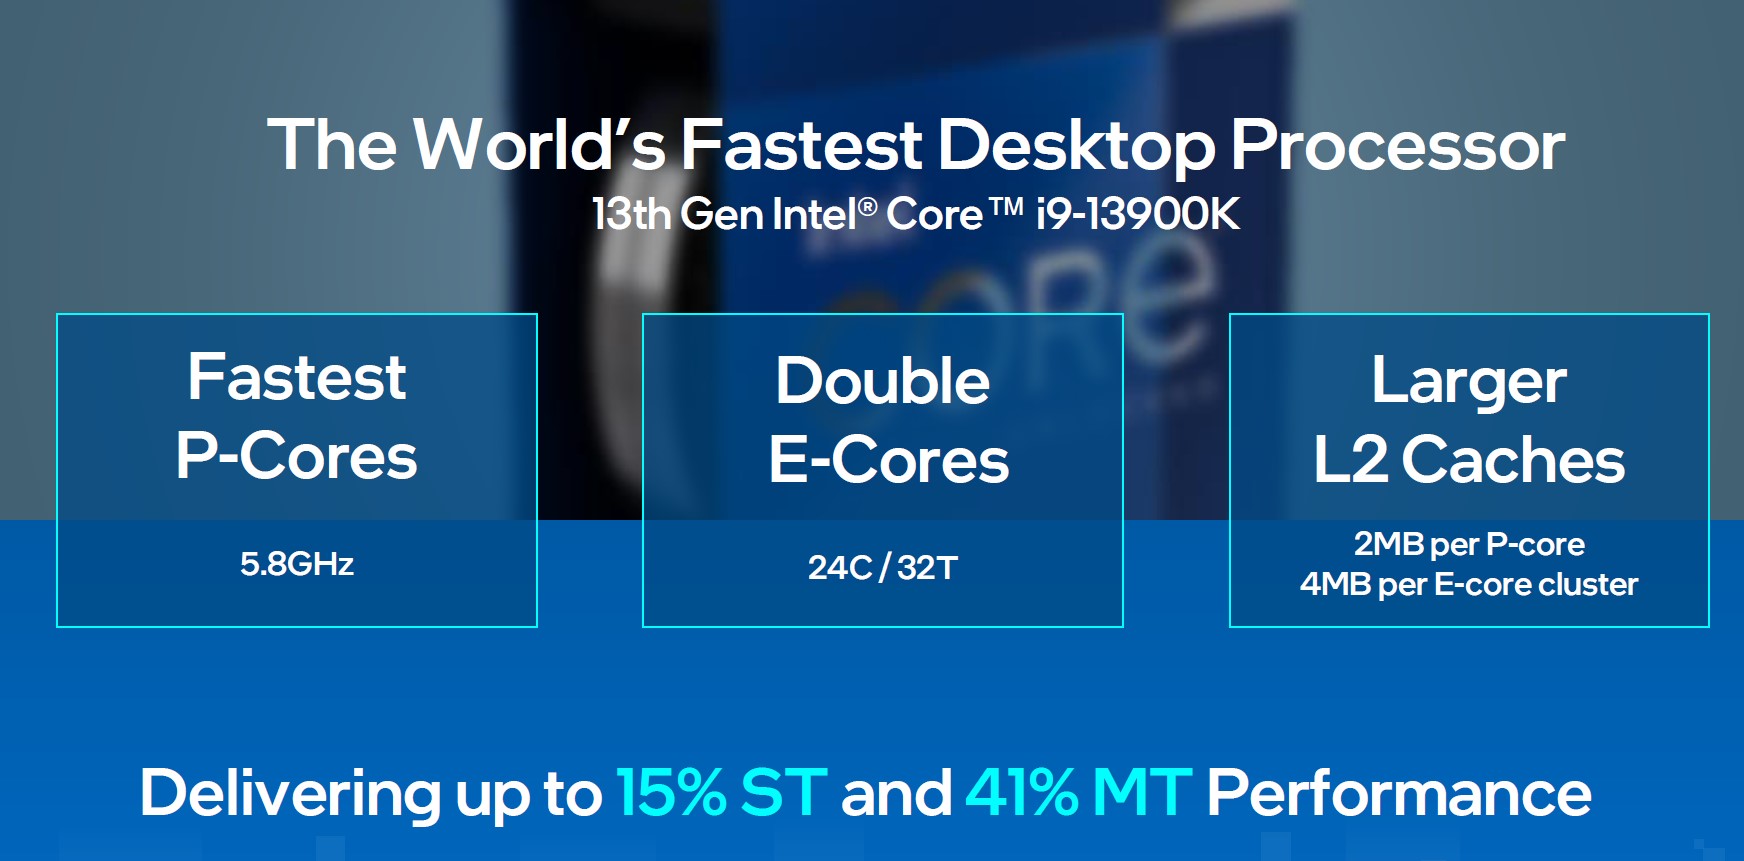
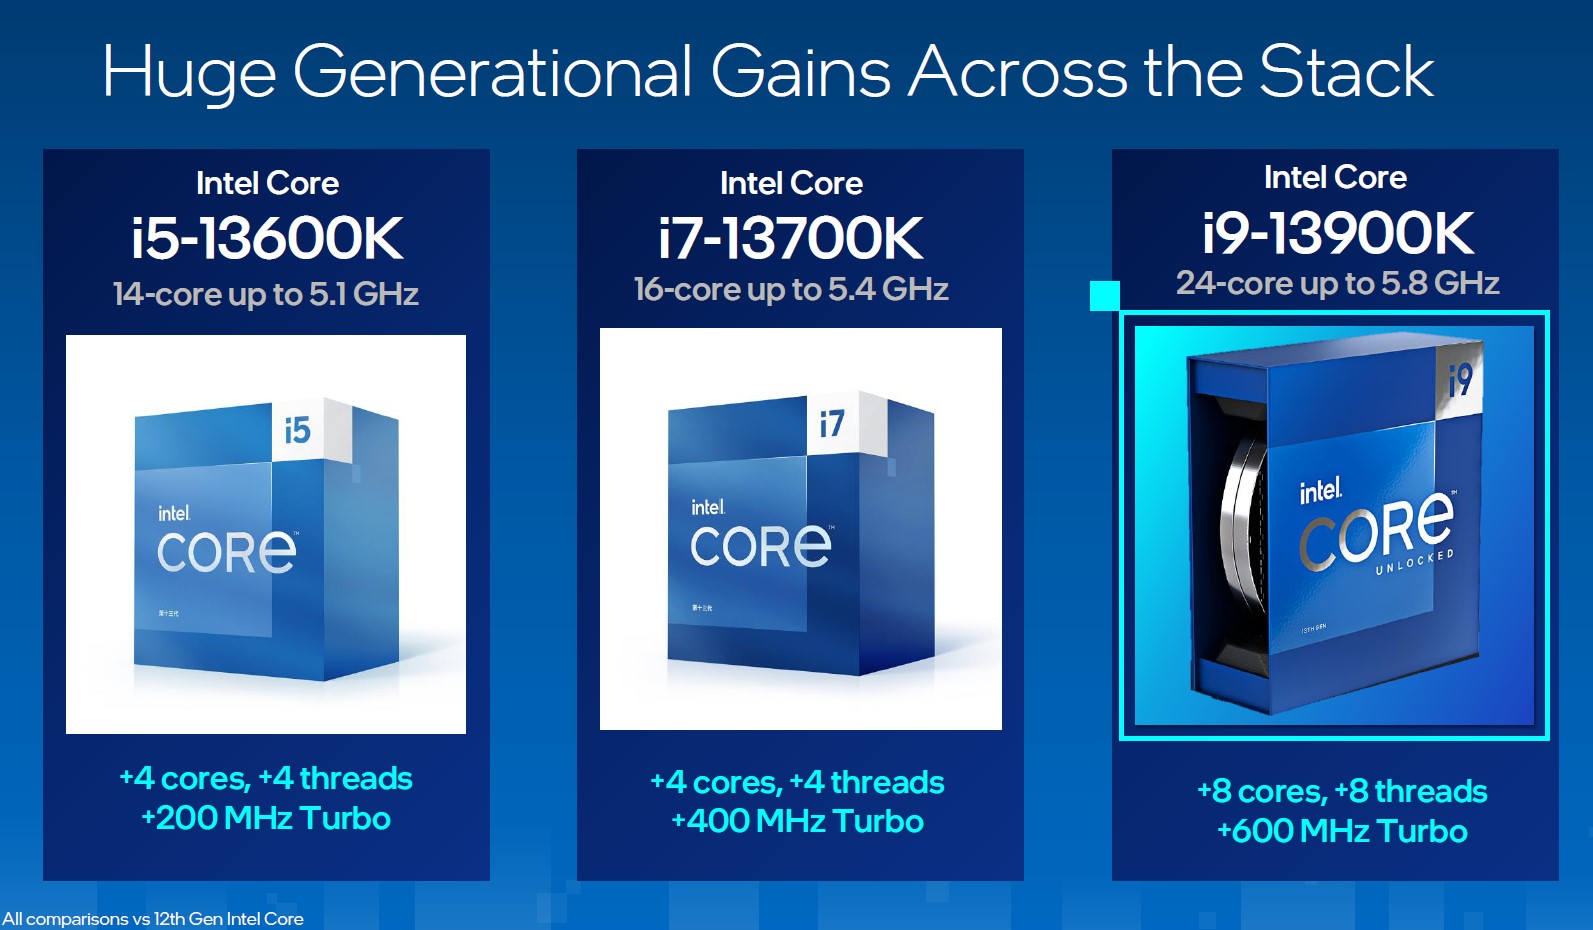
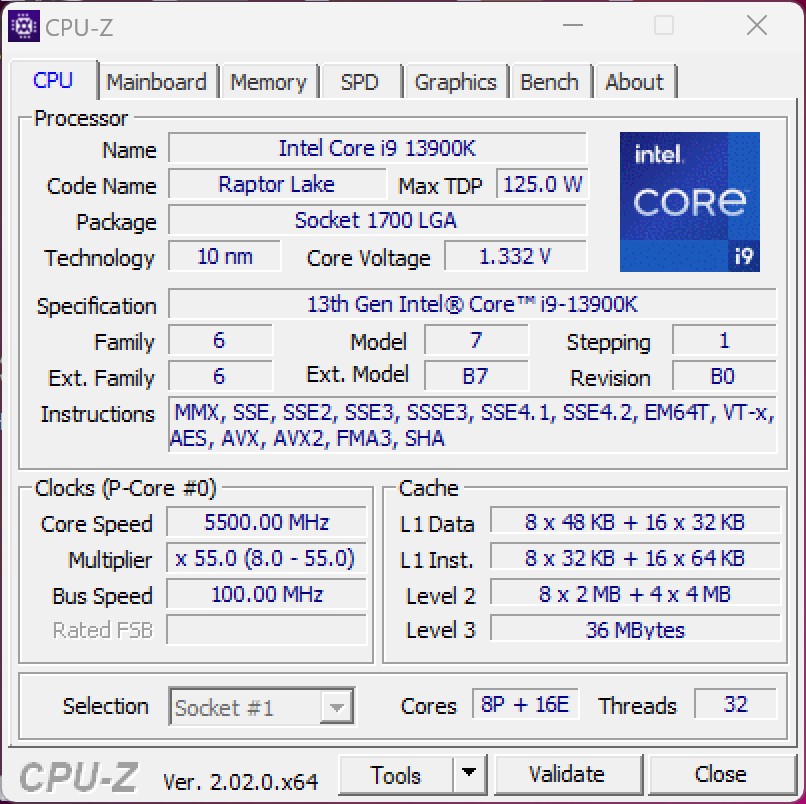
Grundsätzlich bleibt Intel bei dieser Generation dem Sockel 1700 treu. Dennoch gibt es zahlreiche Änderungen, die in Summe zu einem Kopf-an-Kopf-Duell mit AMDs Ryzen 9 7950X führen. So gibt es einen deutlich größeren Cache, insgesamt mehr Threads und überarbeitete P-Cores mit einer höheren IPC. Zudem hat Intel das Turbo um bis zu 600 MHz auf maximal 5,8 GHz erhöht. Die genannten Änderungen ziehen sich durch das gesamte Line-up der neuen Raptor-Lake-Serie.
In der folgenden Tabelle haben wir die wichtigsten Vertreter der neuen Raptor-Lake-S-Familie für Sie zusammengetragen.
Preislich orientiert sich Intel an der Alder-Lake-Serie, wenngleich aber der aktuell schwache Euro-Kurs die Preise der neuen Prozessoren subjektiv betrachtet höher ausfallen lässt.
Intels Core-Prozessoren im Vergleich
| Modell | Kerne / Threads |
Takt P-Core / Turbo | Takt E-Core / Turbo | Cache L2 + L3 | Grafik | PBP | MTB | Preis (UVP) |
| Core i9-13900K | 24 (8P + 16E) /32 | 3,0 GHz / 5,8 GHz | 2,2 GHz / 4,3 GHz | 32 + 36 MB | UHD 770 | 125 Watt | 253 Watt | U$ 589 |
| Core i9-13900KF | 16 (8P + 16E) /32 | 3,0 GHz / 5,8 GHz | 2,2 GHz / 4,3 GHz | 32 + 36 MB | - | 125 Watt | 253 Watt | U$ 564 |
| Core i9-12900K | 16 (8P + 8E) /24 | 3,2 GHz / 5,1 GHz | 2,4 GHz / 3,9 GHz | 14 + 30 MB | UHD 770 | 125 Watt | 241 Watt | U$ 589 |
| Core i9-12900KF | 16 (8P + 8E) /24 | 3,2 GHz / 5,1 GHz | 2,4 GHz / 3,9 GHz | 14 + 30 MB | - | 125 Watt | 241 Watt | U$ 564 |
| Core i7-13700K | 16 (8P + 8E) /24 | 3,4 GHz / 5,4 GHz | 2,5 GHz / 4,2 GHz | 24 + 30 MB | UHD 770 | 125 Watt | 253 Watt | U$ 409 |
| Core i7-13700KF | 16 (8P + 8E) /24 | 3,4 GHz / 5,4 GHz | 2,5 GHz / 4,2 GHz | 24 + 30 MB | - | 125 Watt | 253 Watt | U$ 384 |
| Core i7-12700K | 12 (8P + 4E) /20 | 3,6 GHz / 4,9 GHz | 2,7 GHz / 3,8 GHz | 12 + 25 MB | UHD 770 | 125 Watt | 190 Watt | U$ 409 |
| Core i7-12700KF | 12 (8P + 4E) /20 | 3,6 GHz / 4,9 GHz | 2,7 GHz / 3,8 GHz | 12 + 25 MB | - | 125 Watt | 190 Watt | U$ 384 |
| Core i5-13600K | 14 (6P + 8E) /20 | 3,5 GHz / 5,1 GHz | 2,6 GHz / 3,9 GHz | 20 + 24 MB | UHD 770 | 125 Watt | 181 Watt | U$ 319 |
| Core i5-13600KF | 14 (6P + 8E) /20 | 3,5 GHz / 5,1 GHz | 2,6 GHz / 3,9 GHz | 20 + 24 MB | - | 125 Wat | 181 Watt | U$ 294 |
| Core i5-12600K | 10 (6P + 4E) /16 | 3,7 GHz / 4,9 GHz | 2,8 GHz / 3,6 GHz | 9,5 + 20 MB | UHD 770 | 125 Watt | 150 Watt | U$ 289 |
| Core i5-12600KF | 10 (6P + 4E) /16 | 3,7 GHz / 4,9 GHz | 2,8 GHz / 3,6 GHz | 9,5 + 20 MB | - | 125 Watt | 150 Watt | U$ 264 |
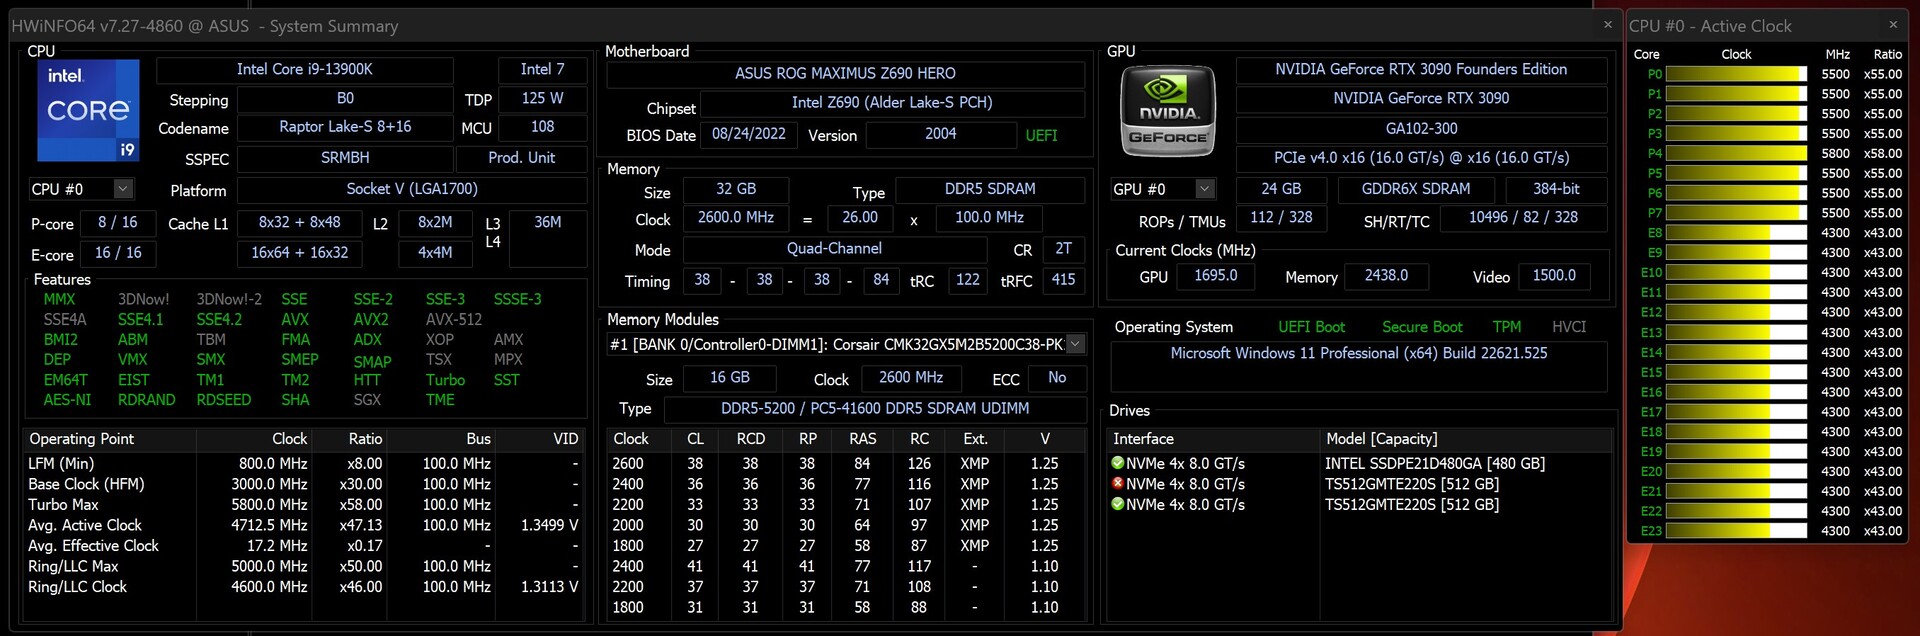
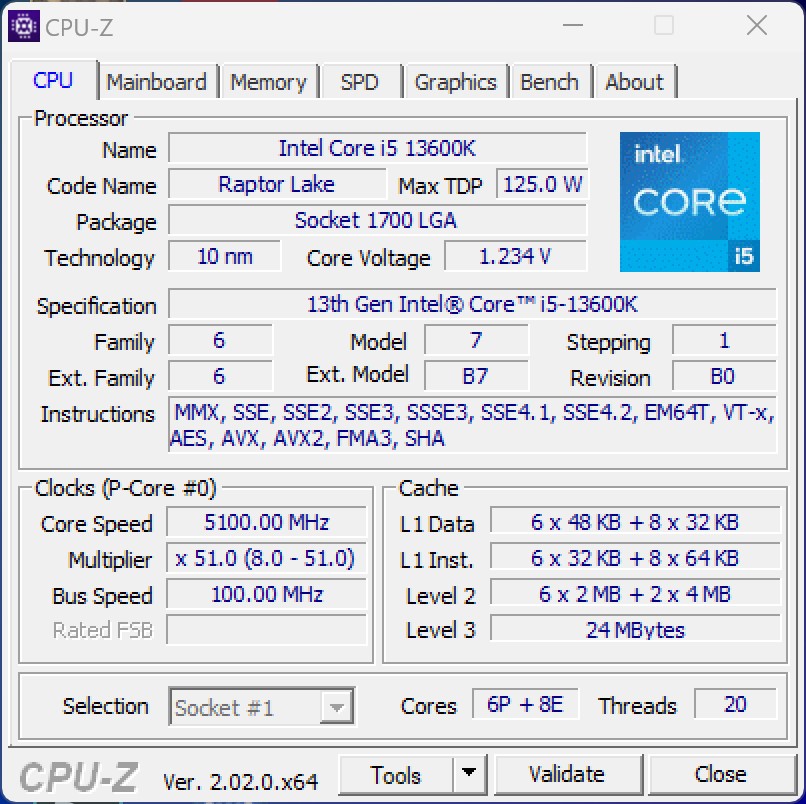
Details zu unserem Testsystem
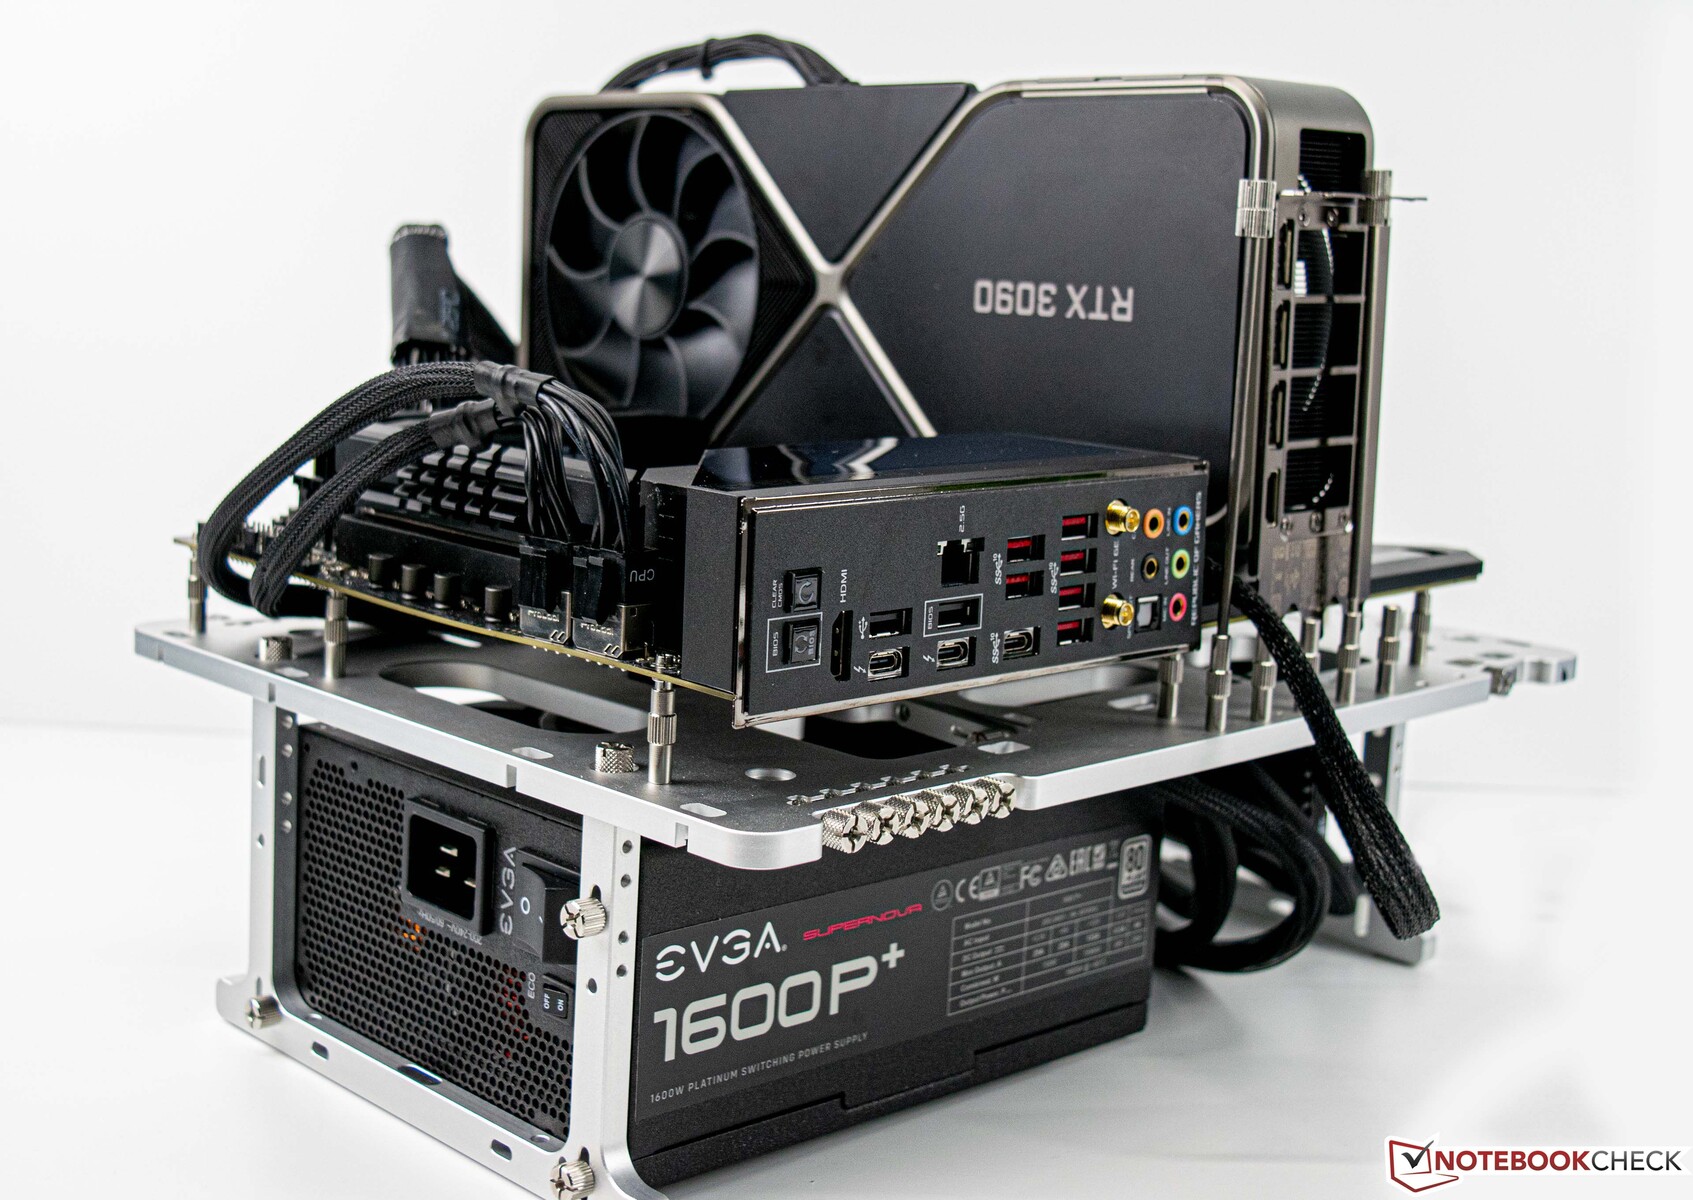
Für die folgenden Benchmarks und Tests nutzen wir folgendes System:
- Streacom BC1 V2 Open Benchtable
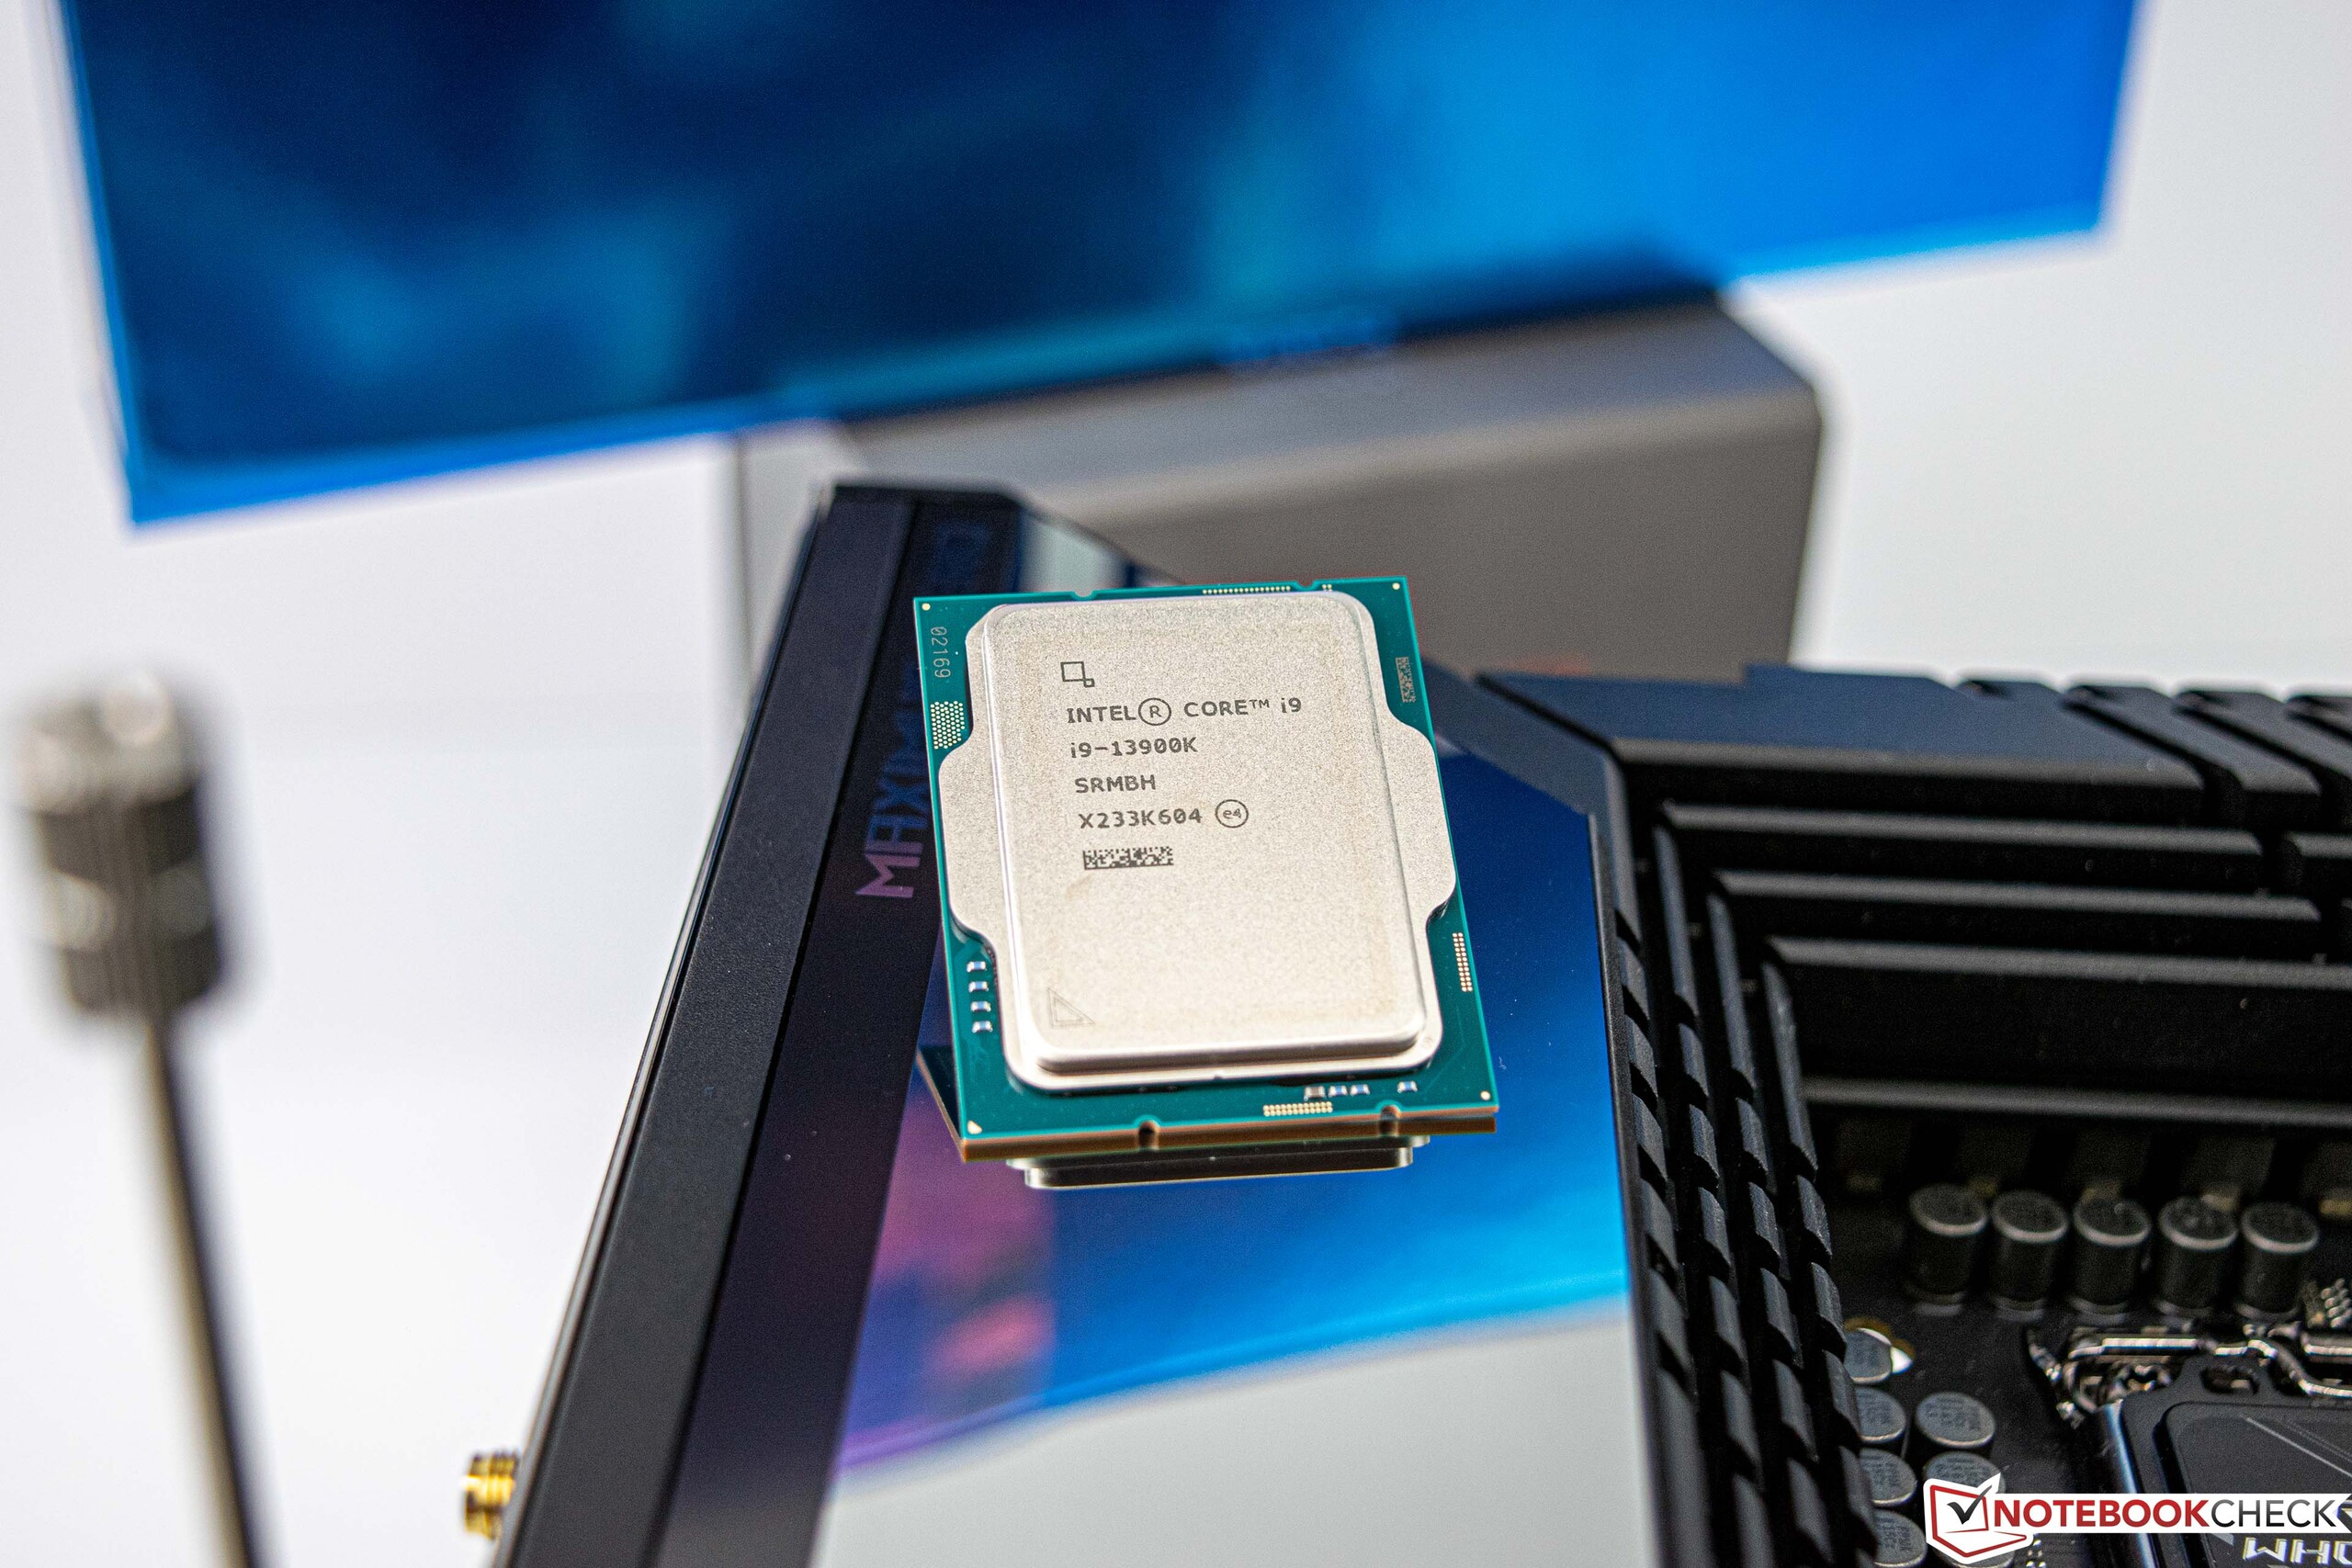
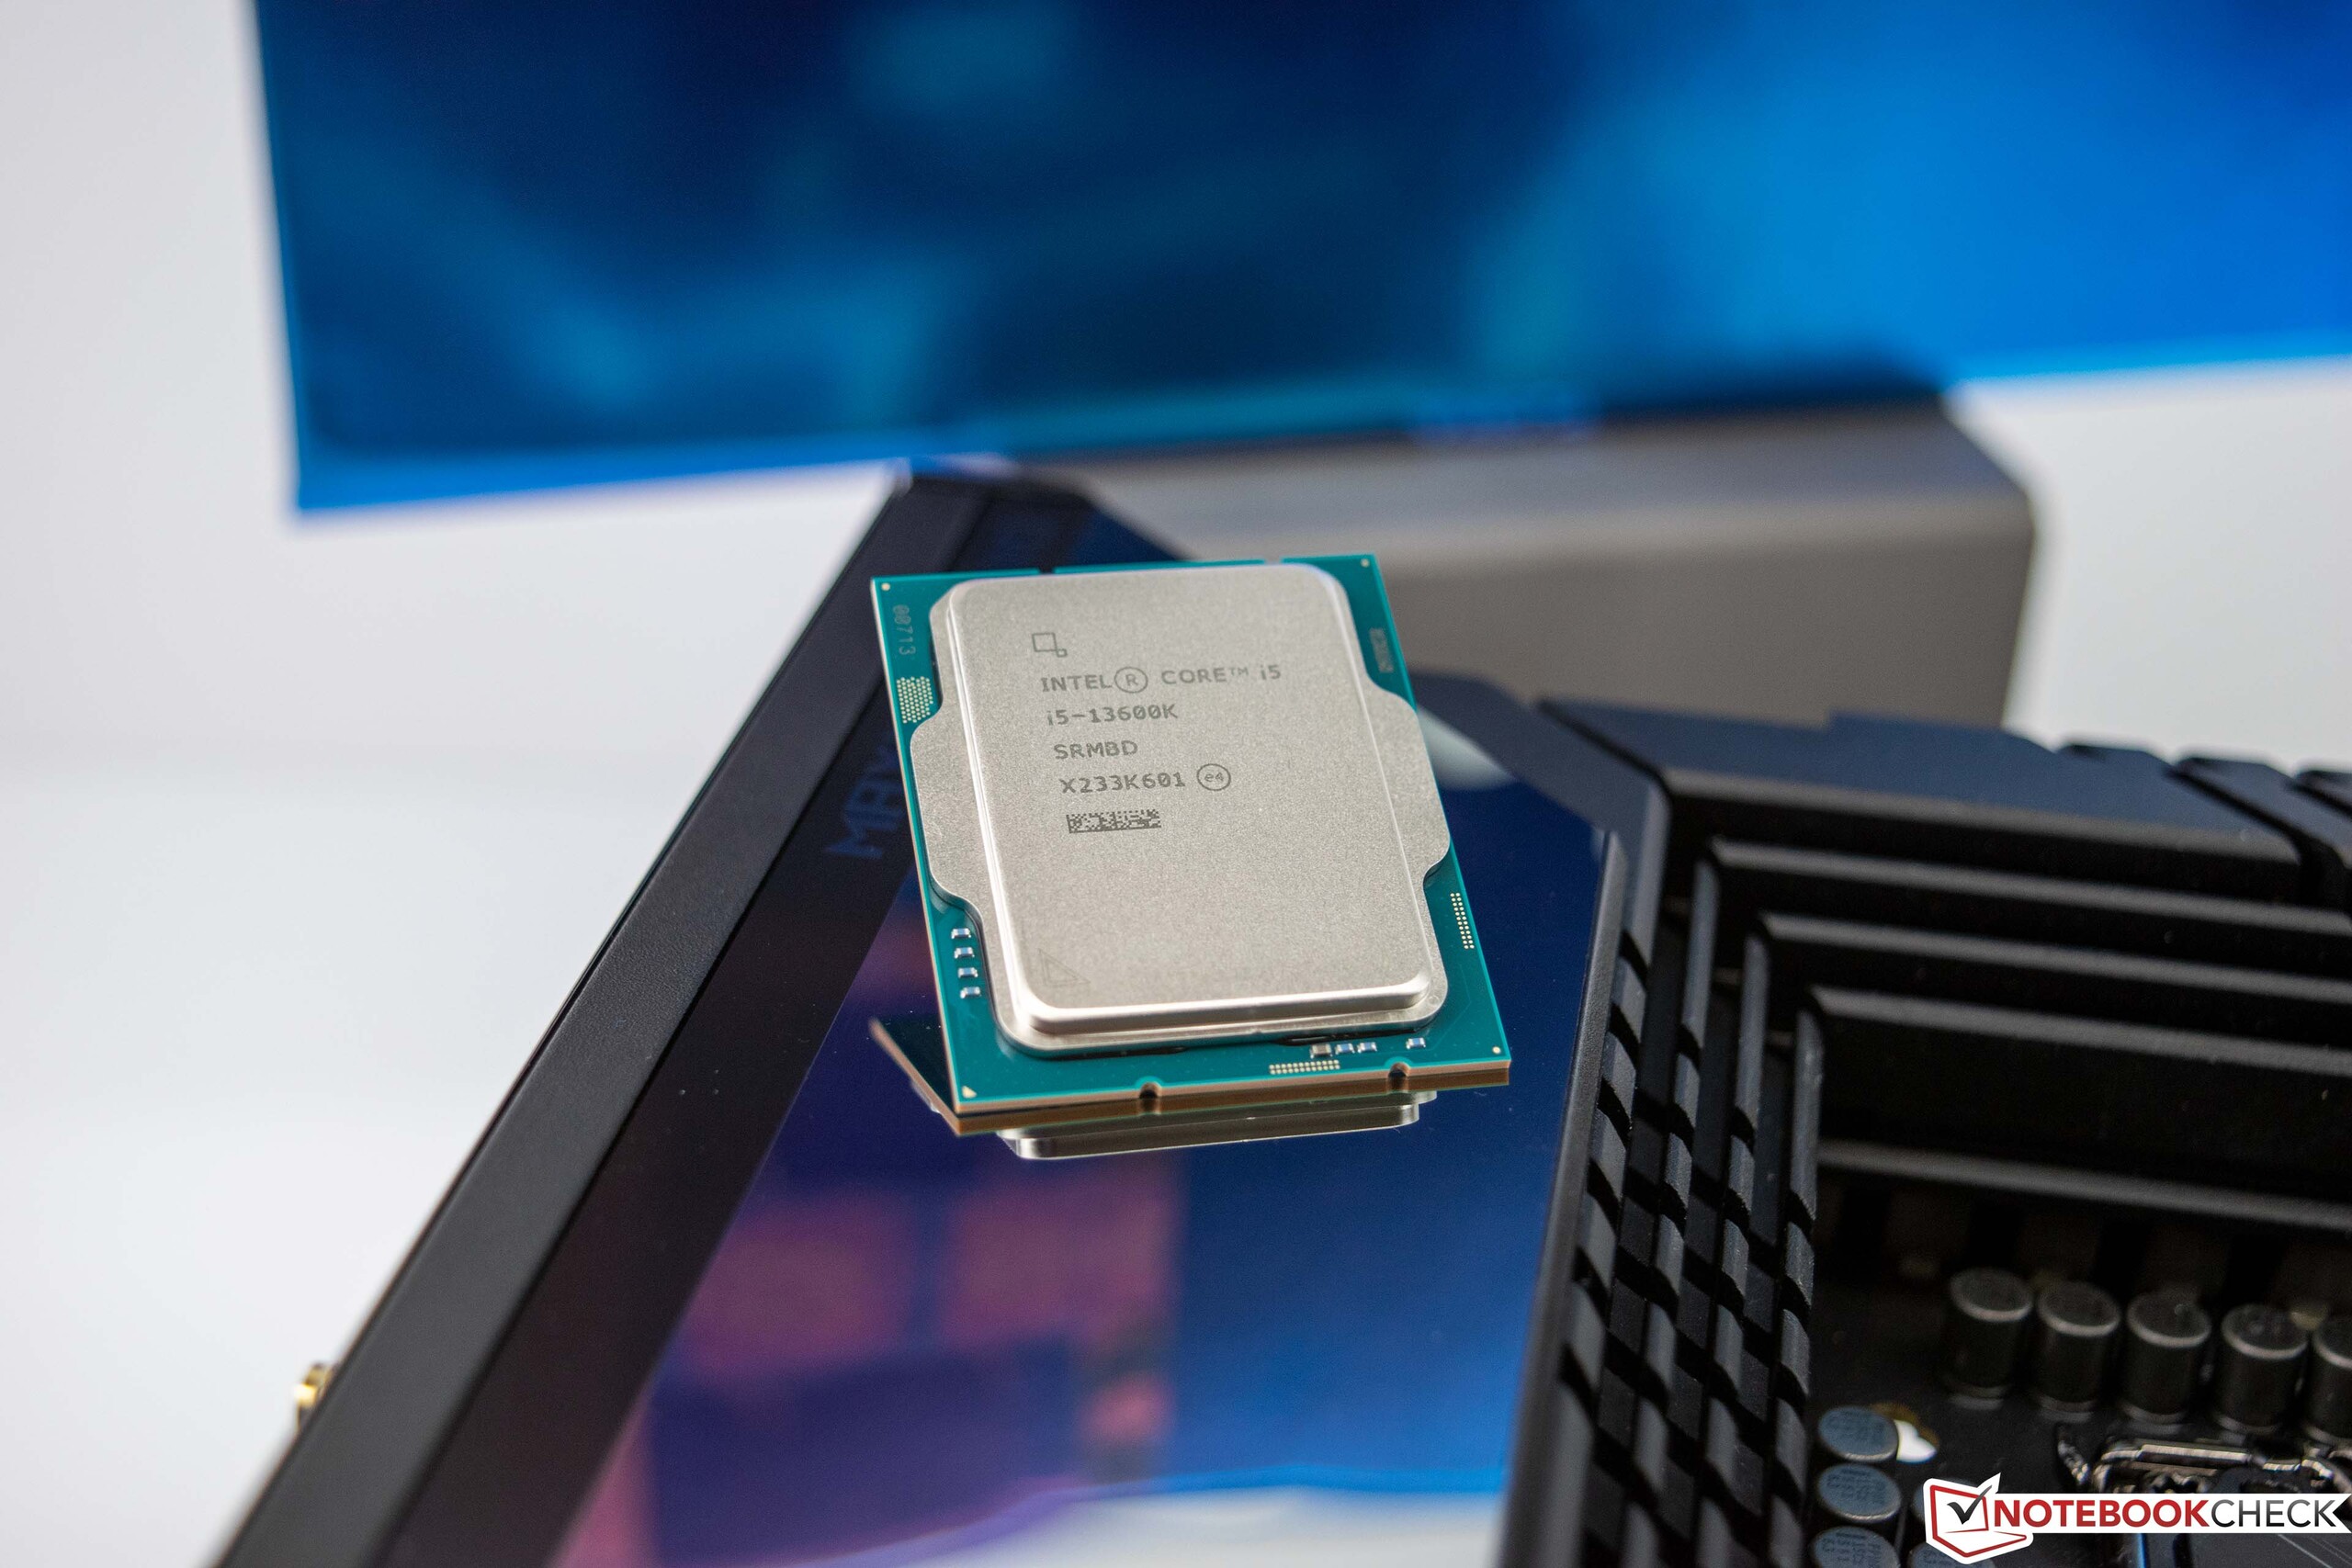
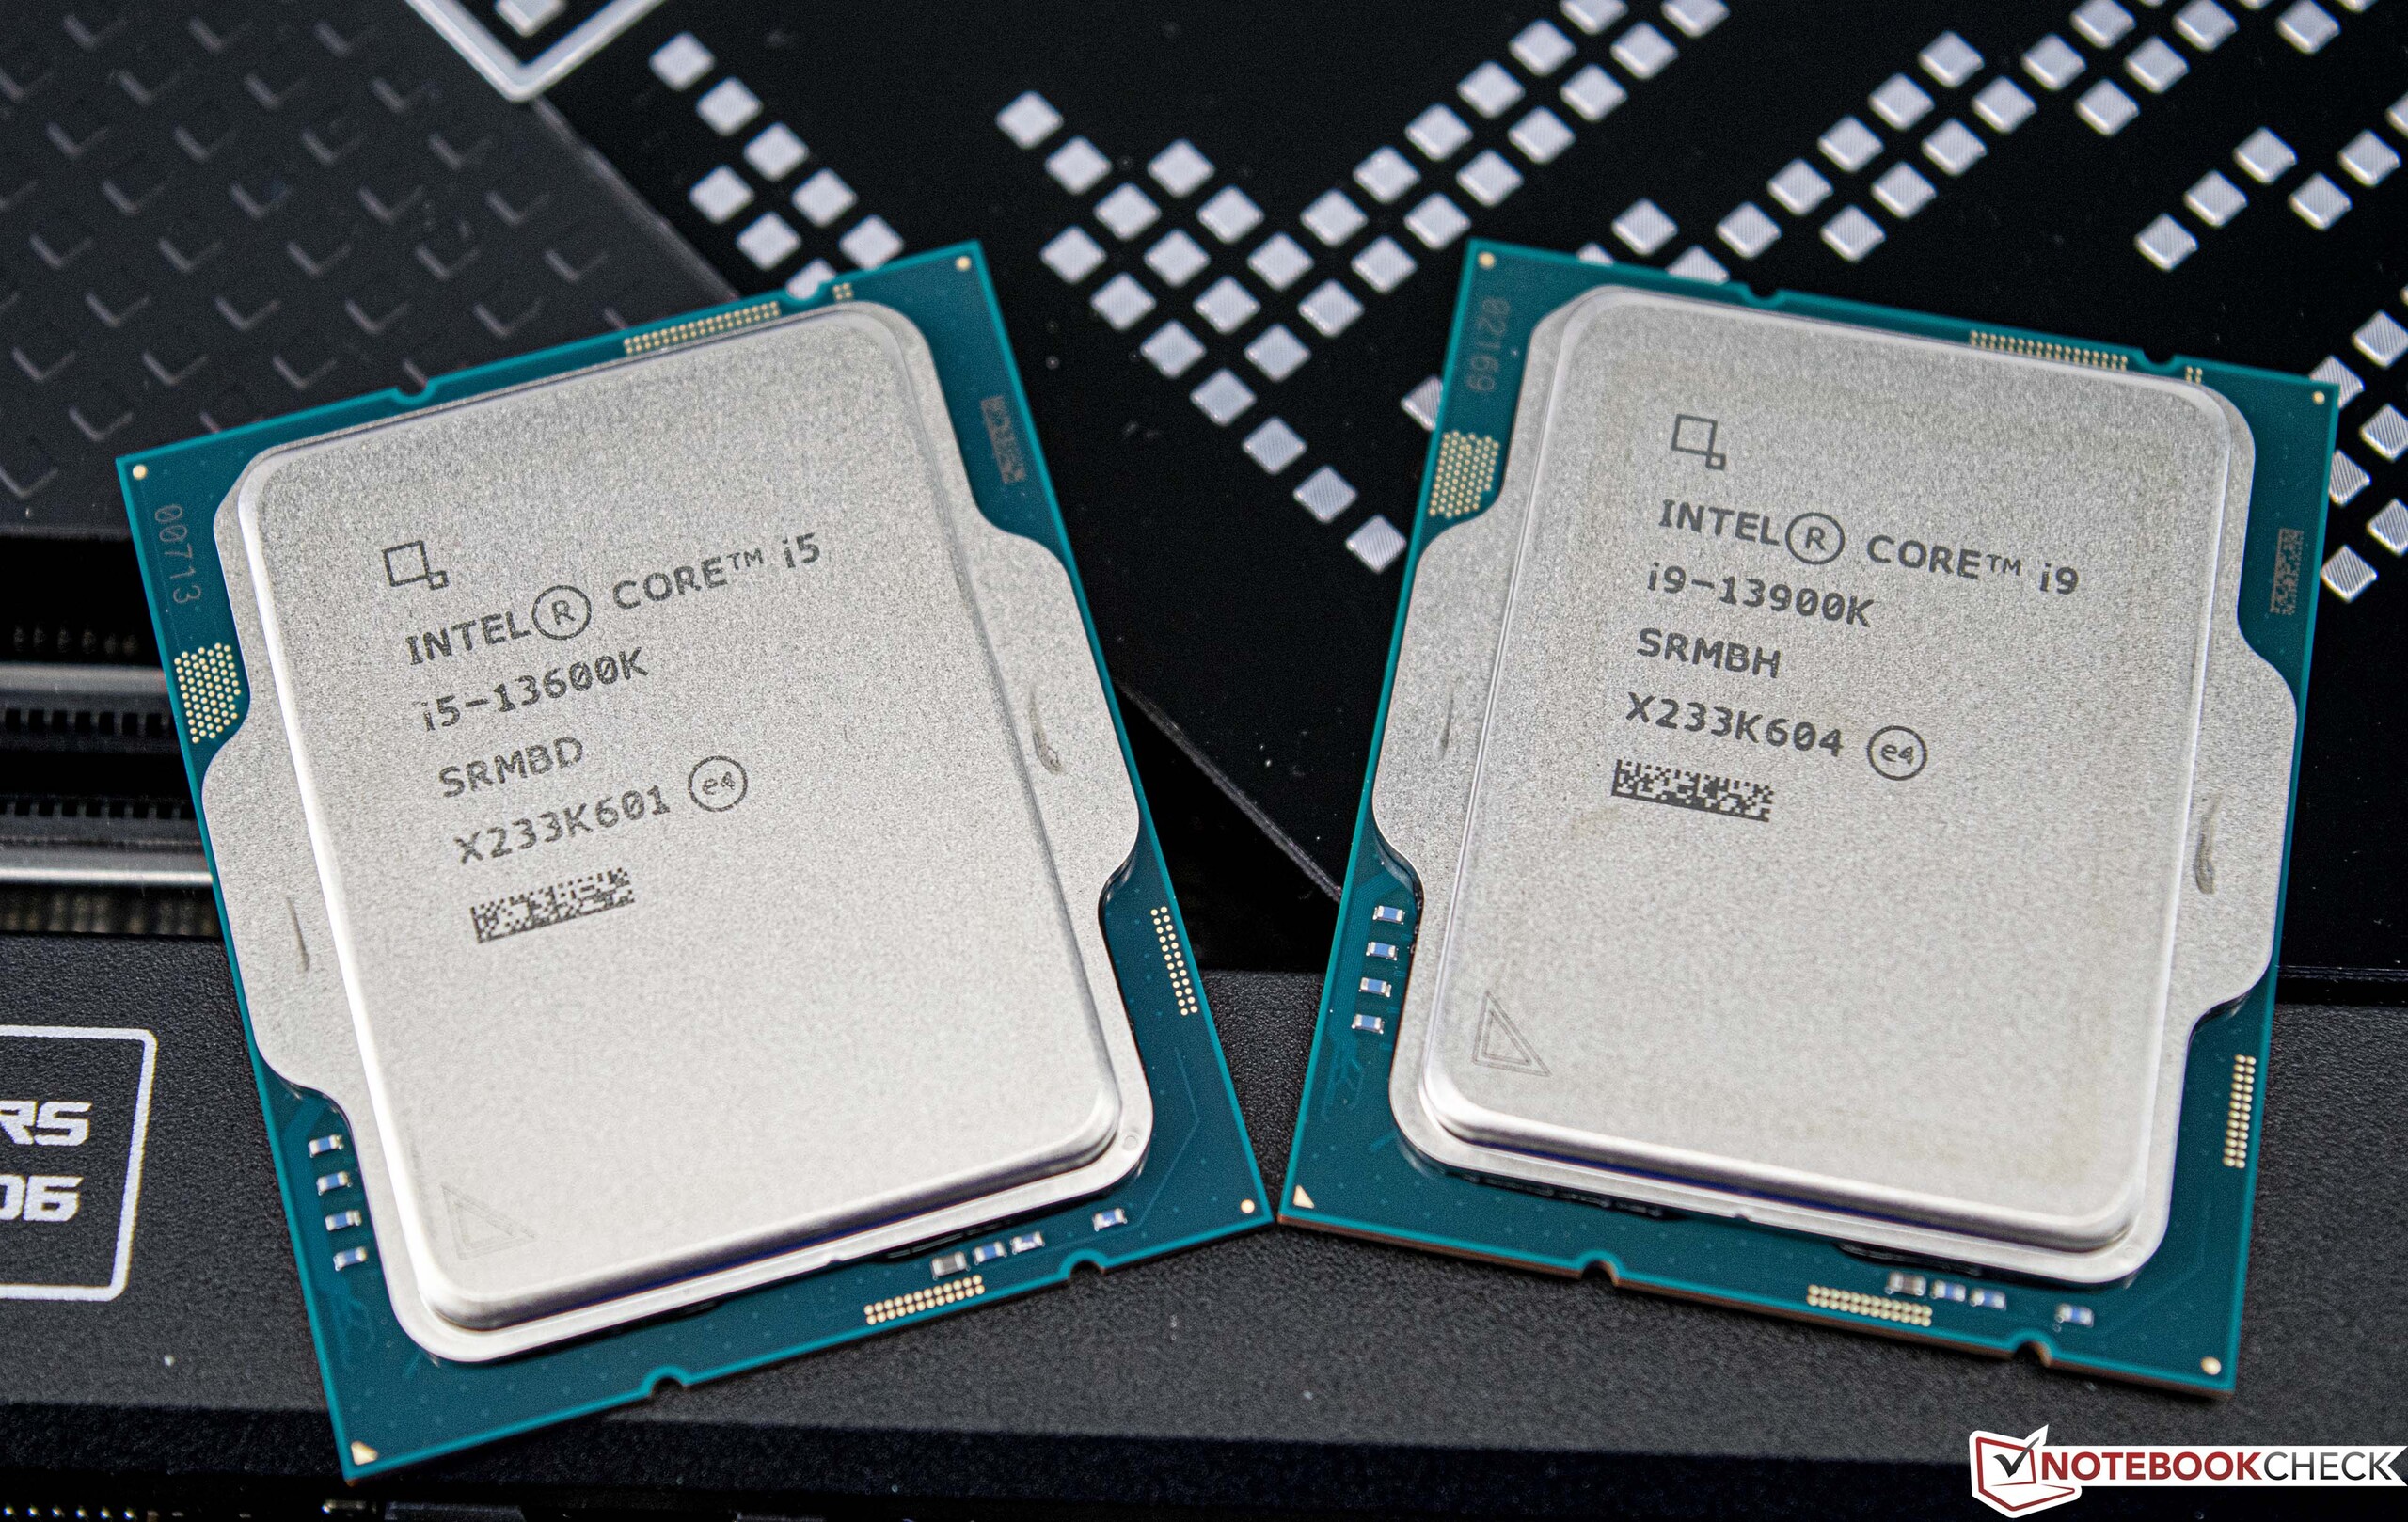
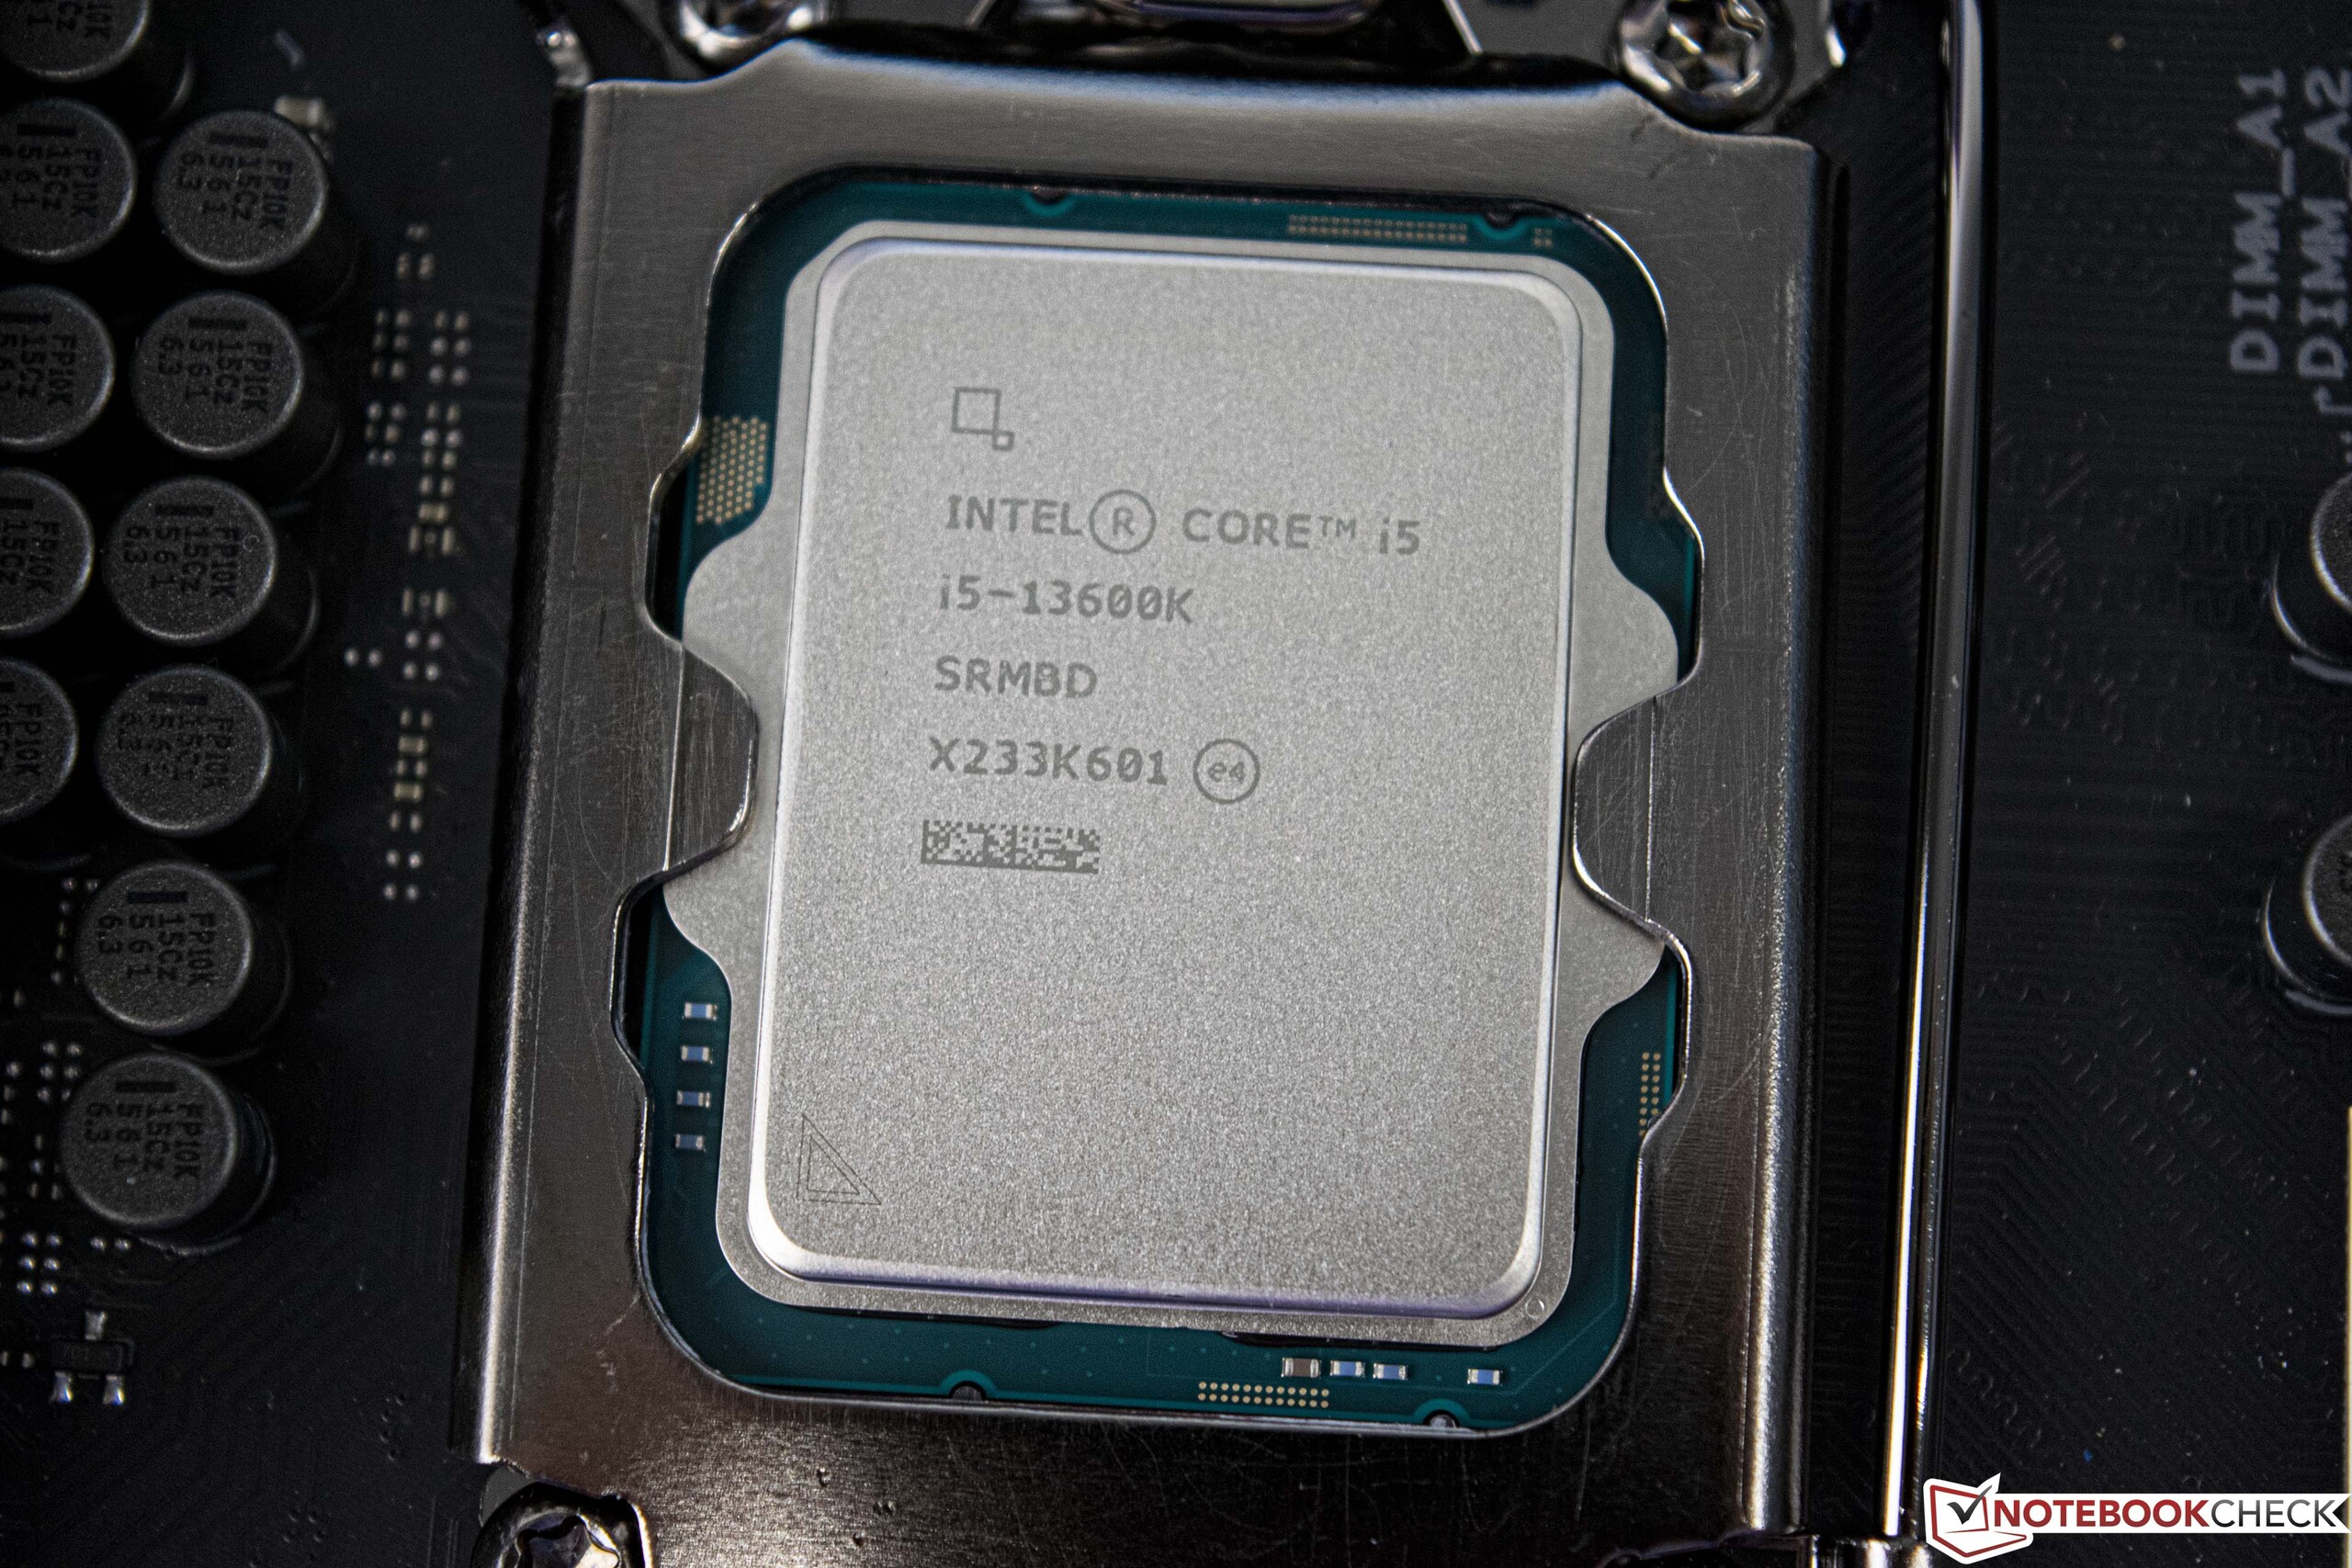
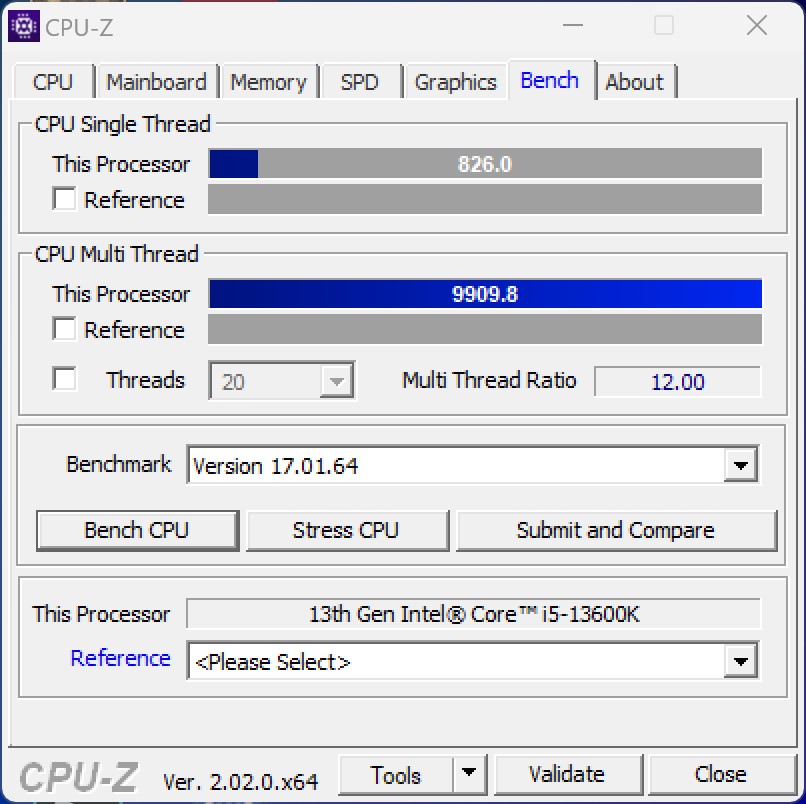
- Intel Core i9-13900K, Intel Core i5-13600K
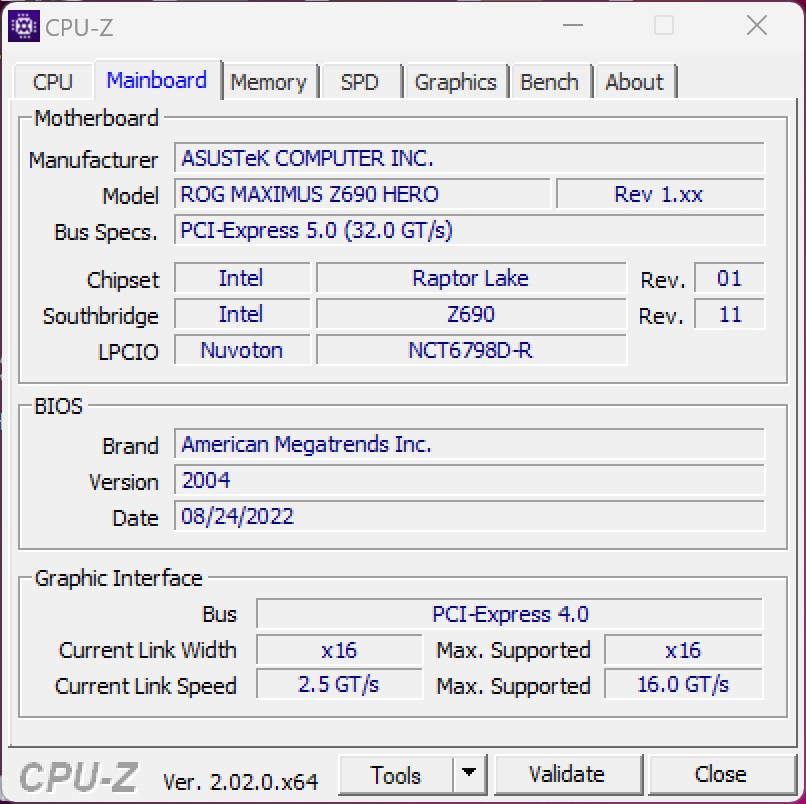
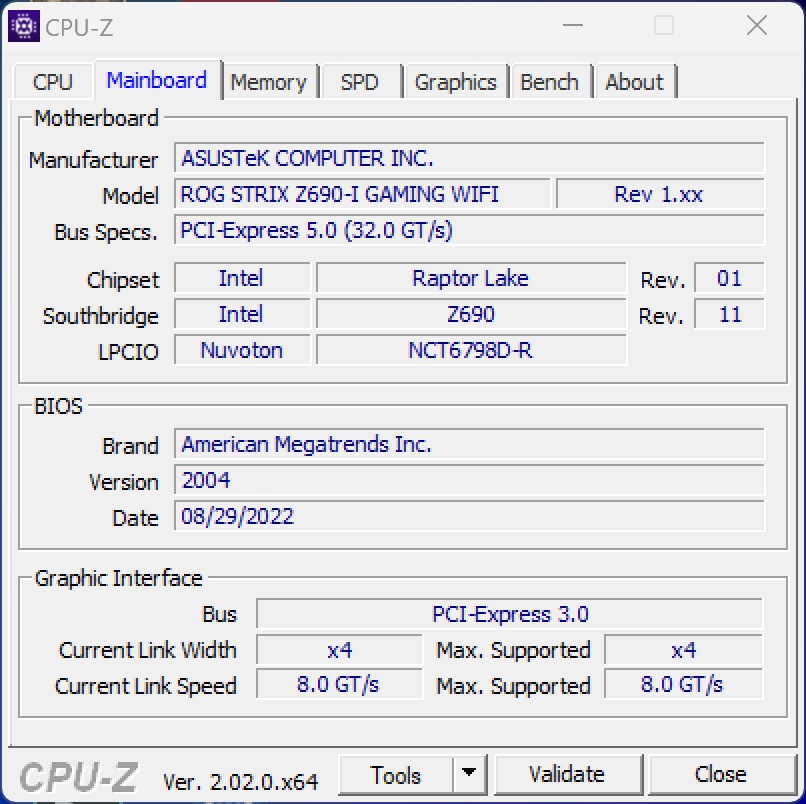
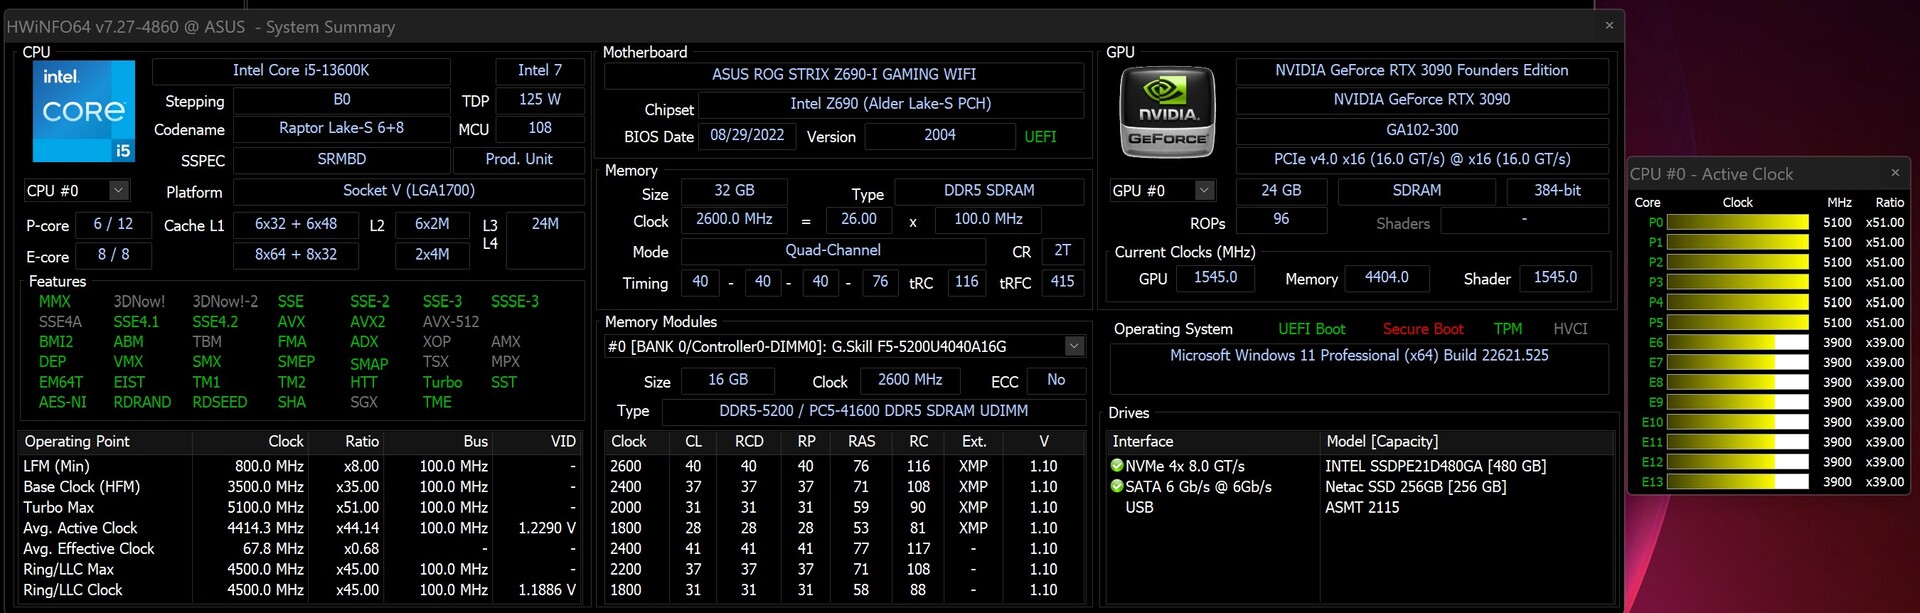
- Asus ROG Maximus Z690 Hero (BIOS v2004) / Asus ROG Strix Z690-I Gaming WiFi (BIOS v2004)
- Custom-Loop Wasserkühlung (Pumpe: Alphacool Aquastream XT Ultra, Radiator: EK MO-RA3 420 LT BLACK)
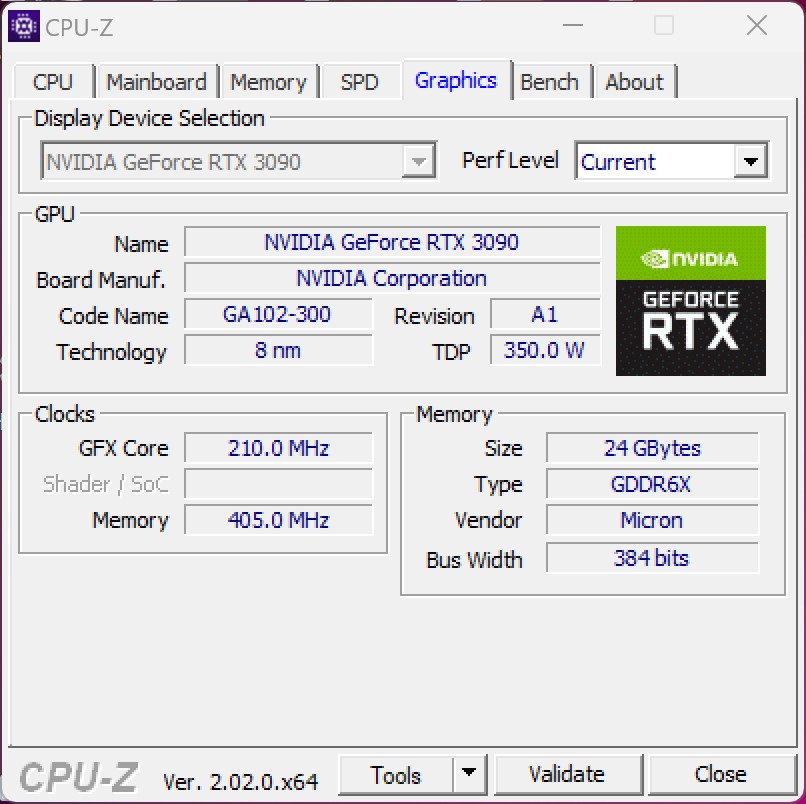
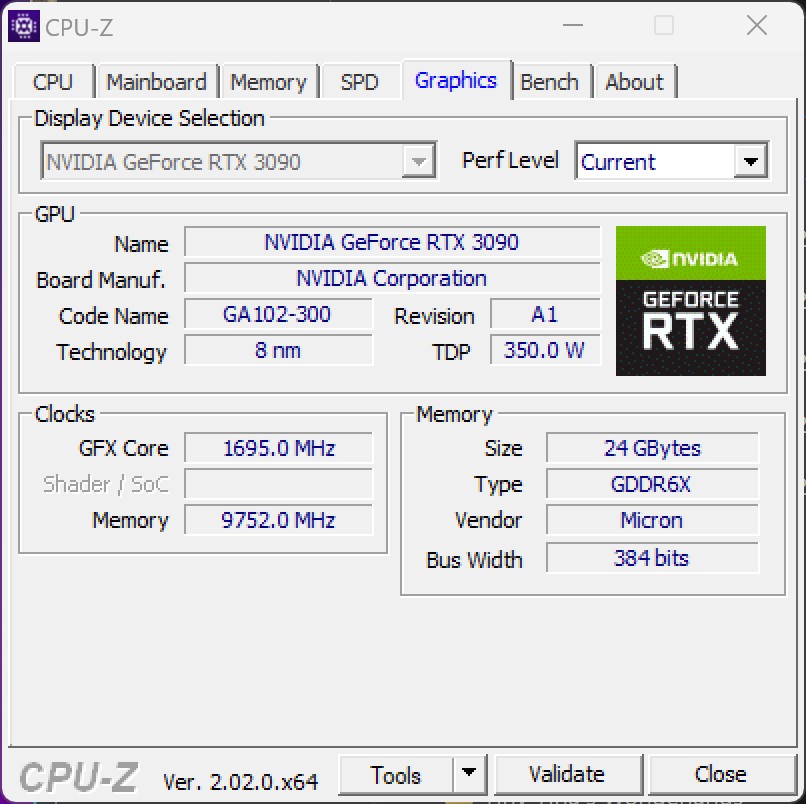
- Nvidia GeForce RTX 3090 Founders Edition (Treiber: 517.48)
- EVGA SuperNOVA P+ 1600W
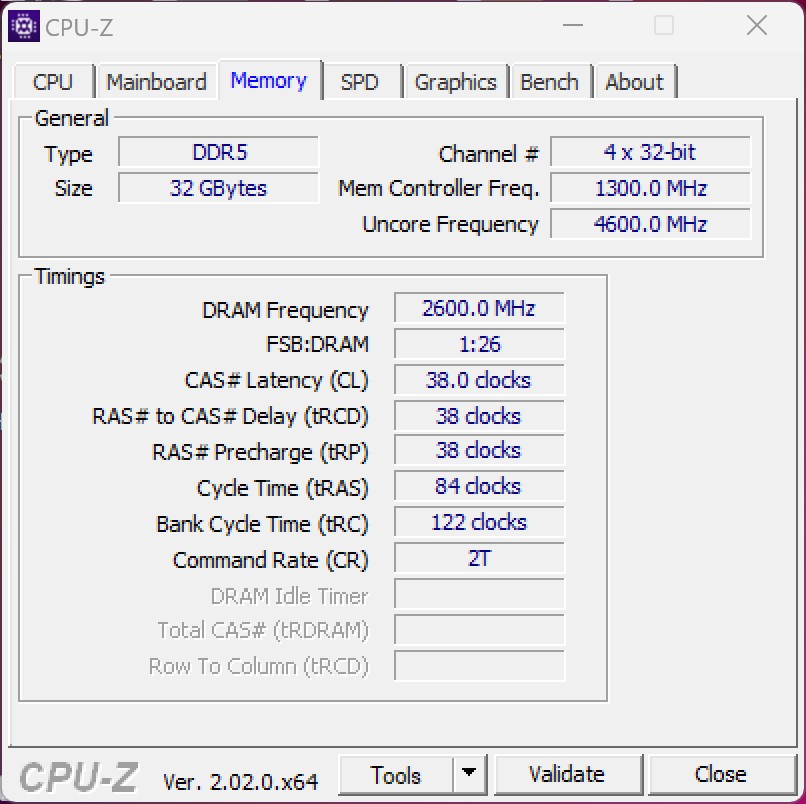
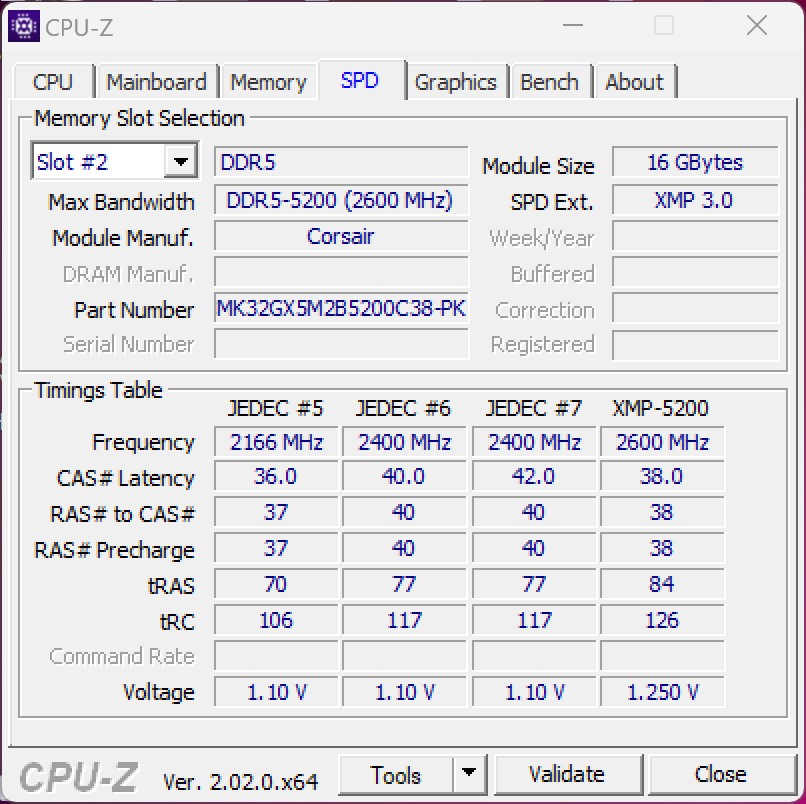
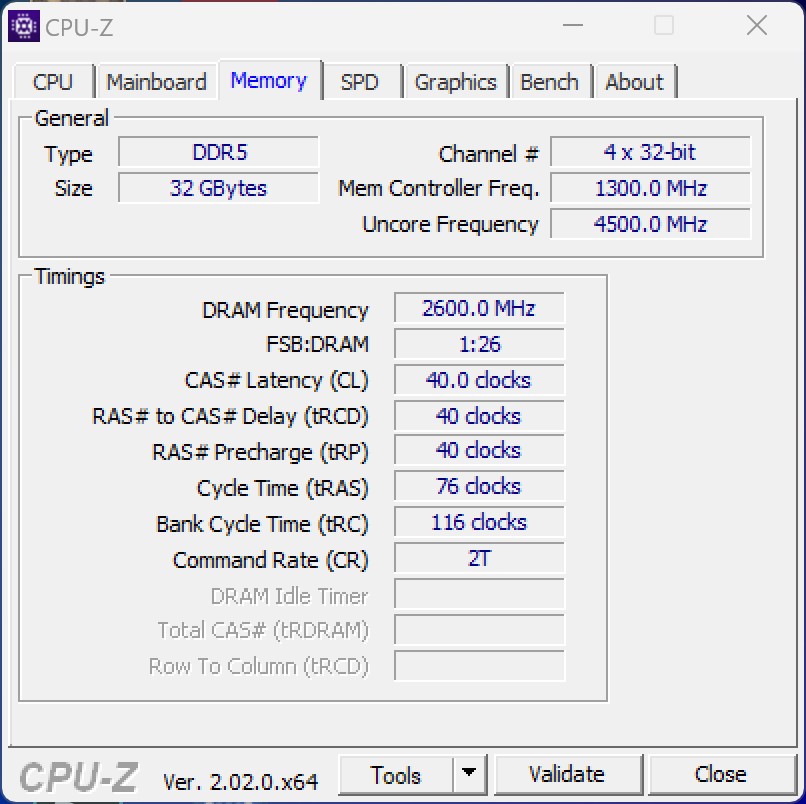
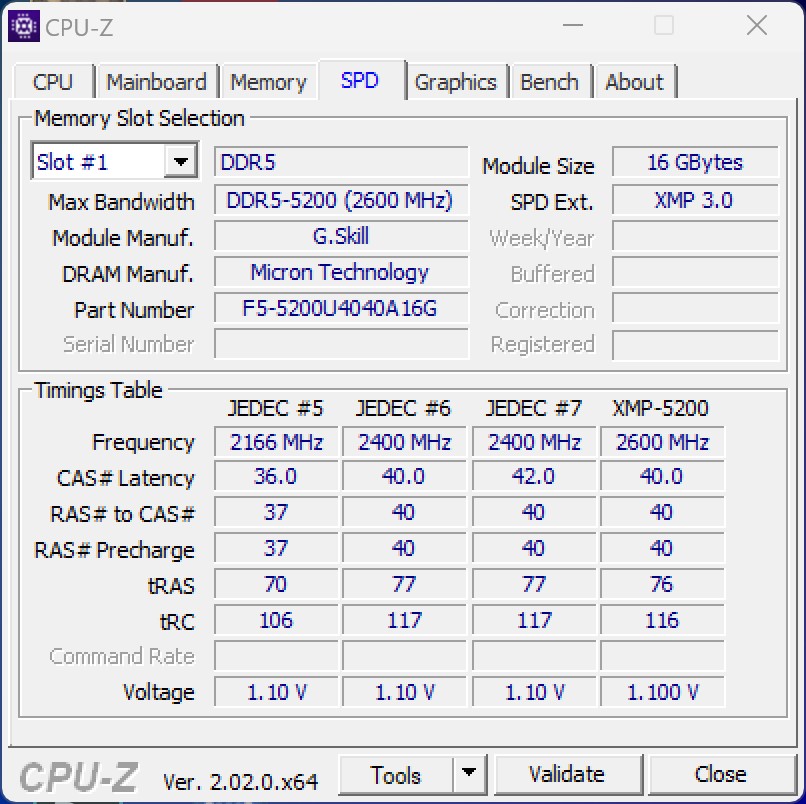
- G.Skill Ripjaws S5 (2x 16 GB - DDR5-5200)
- Intel Optane 905p (480-GB-System + Benchmarks)
- Microsoft Windows 11 Professional 64-Bit (Version 22H2)
Testbedingungen - Z690 nach BIOS-Update weiterhin nutzbar
Für diesen Test nutzen wir das Asus ROG Maximus Z690 Hero, welches schon beim Alder-Lake-S-Launch zum Einsatz kam. Nichtsdestotrotz wird es mit dem neuen Z790-Chipsatz aktualisierte Mainboards geben, die sowohl die 12.- als auch die 13. Generation der Intel Prozessoren unterstützen. Dennoch sollte man nicht vergessen, dass die Intel-Raptor-Lake-Serie voraussichtlich die letzte Generation sein wird, welche den Sockel 1700 verwendet.
Alle Tests wurden mit dem aktuellsten BIOS und aktiviertem XMP-Profil durchgeführt. Zudem wurden alle Power-Limit-Beschränkungen deaktiviert, um die volle Leistung der Prozessoren abzurufen.
Hinweis:
Aufgrund von Problemen mit Asus ROG Maximus Z690 Hero während unserer Tests mussten wir für alle Benchmarks mit dem Intel Core i5-13600K auf das Asus ROG Strix Z690-I Gaming WiFi auswichen. Ein kurzer Leistungsvergleich zu dem Asus ROG Maximus Z690 Hero ergab keine signifikanten Leistungsunterschiede. Nach Rücksprache mit Asus konnte ein Problem mit dem BIOS der bis dato verwendeten Version festgestellt werden. Asus hat sofort reagiert und mit der Version 2103 die Probleme beseitigt.
Prozessor-Benchmarks
Vergleichen mit den älteren Alder-Lake-S-Prozessoren ist der Leistungszuwachs durchweg enorm. Die gesteigerte IPC wird von einem deutlich höheren Boost-Takt begleitet, was im Umkehrschluss zu einem Leistungsplus von 19 Prozent beim Intel Core i9-13900K gegenüber dem Intel Core i9-12900K reicht. Dabei sind in Einzelvergleichen sogar Sprünge von bis zu 49 Prozent möglich. Beim kleinere Core-i5-Modell verzeichnen wir einen Leistungsgewinn von 14 Prozent gegenüber dem ältere Alder-Lake-Sample.
Beim Top-Duell kann sich der Intel Core i9-13900K knapp vor dem AMD Ryzen 9 7950X setzen. Subjektiv betrachtet arbeiten beide Top-Modelle auf Augenhöhe. Dennoch zeigt sich, dass im einen oder anderen Test mal Intel und mal AMD besser liegt. Als Beispiel sei einmal 3DMark zu nennen, wo der Intel in puncto der CPU-Benchmarks den AMD-Modellen deutlich überlegen ist. Wiederum kann AMD beim wPrime punkten, und Intel hat hier eindeutig das Nachsehen.
Der kleinere Intel Core i5-13600K duelliert sich mit dem AMD Ryzen 5 7600X. Die deutlich höhere Anzahl an Threads (20 vs. 12) sind hier der Schlüssel zum Erfolg. Dennoch ist der Vorsprung mit 7 Prozent im Performance Rating kein eindeutiges Ausrufezeichen. Der Vergleich dieser beiden Prozessoren ist dennoch angebracht, da diese in derselben Preisklasse heimisch sind.
Der Vollständigkeit halber haben wir alle CPU-Tests ebenfalls einmal mit aktiviertem PL2 gemacht. Wie aus den Ergebnissen zu entnehmen ist, gibt es an dieser Stelle keinen Nachteil, wenn das Power-Limit gesetzt wird. Teilweise sind sogar bessere Werte möglich, da die CPUs hier keine kritischen Temperaturen erreichen.
Weitere Benchmarks zu den Prozessoren finden Sie hier.
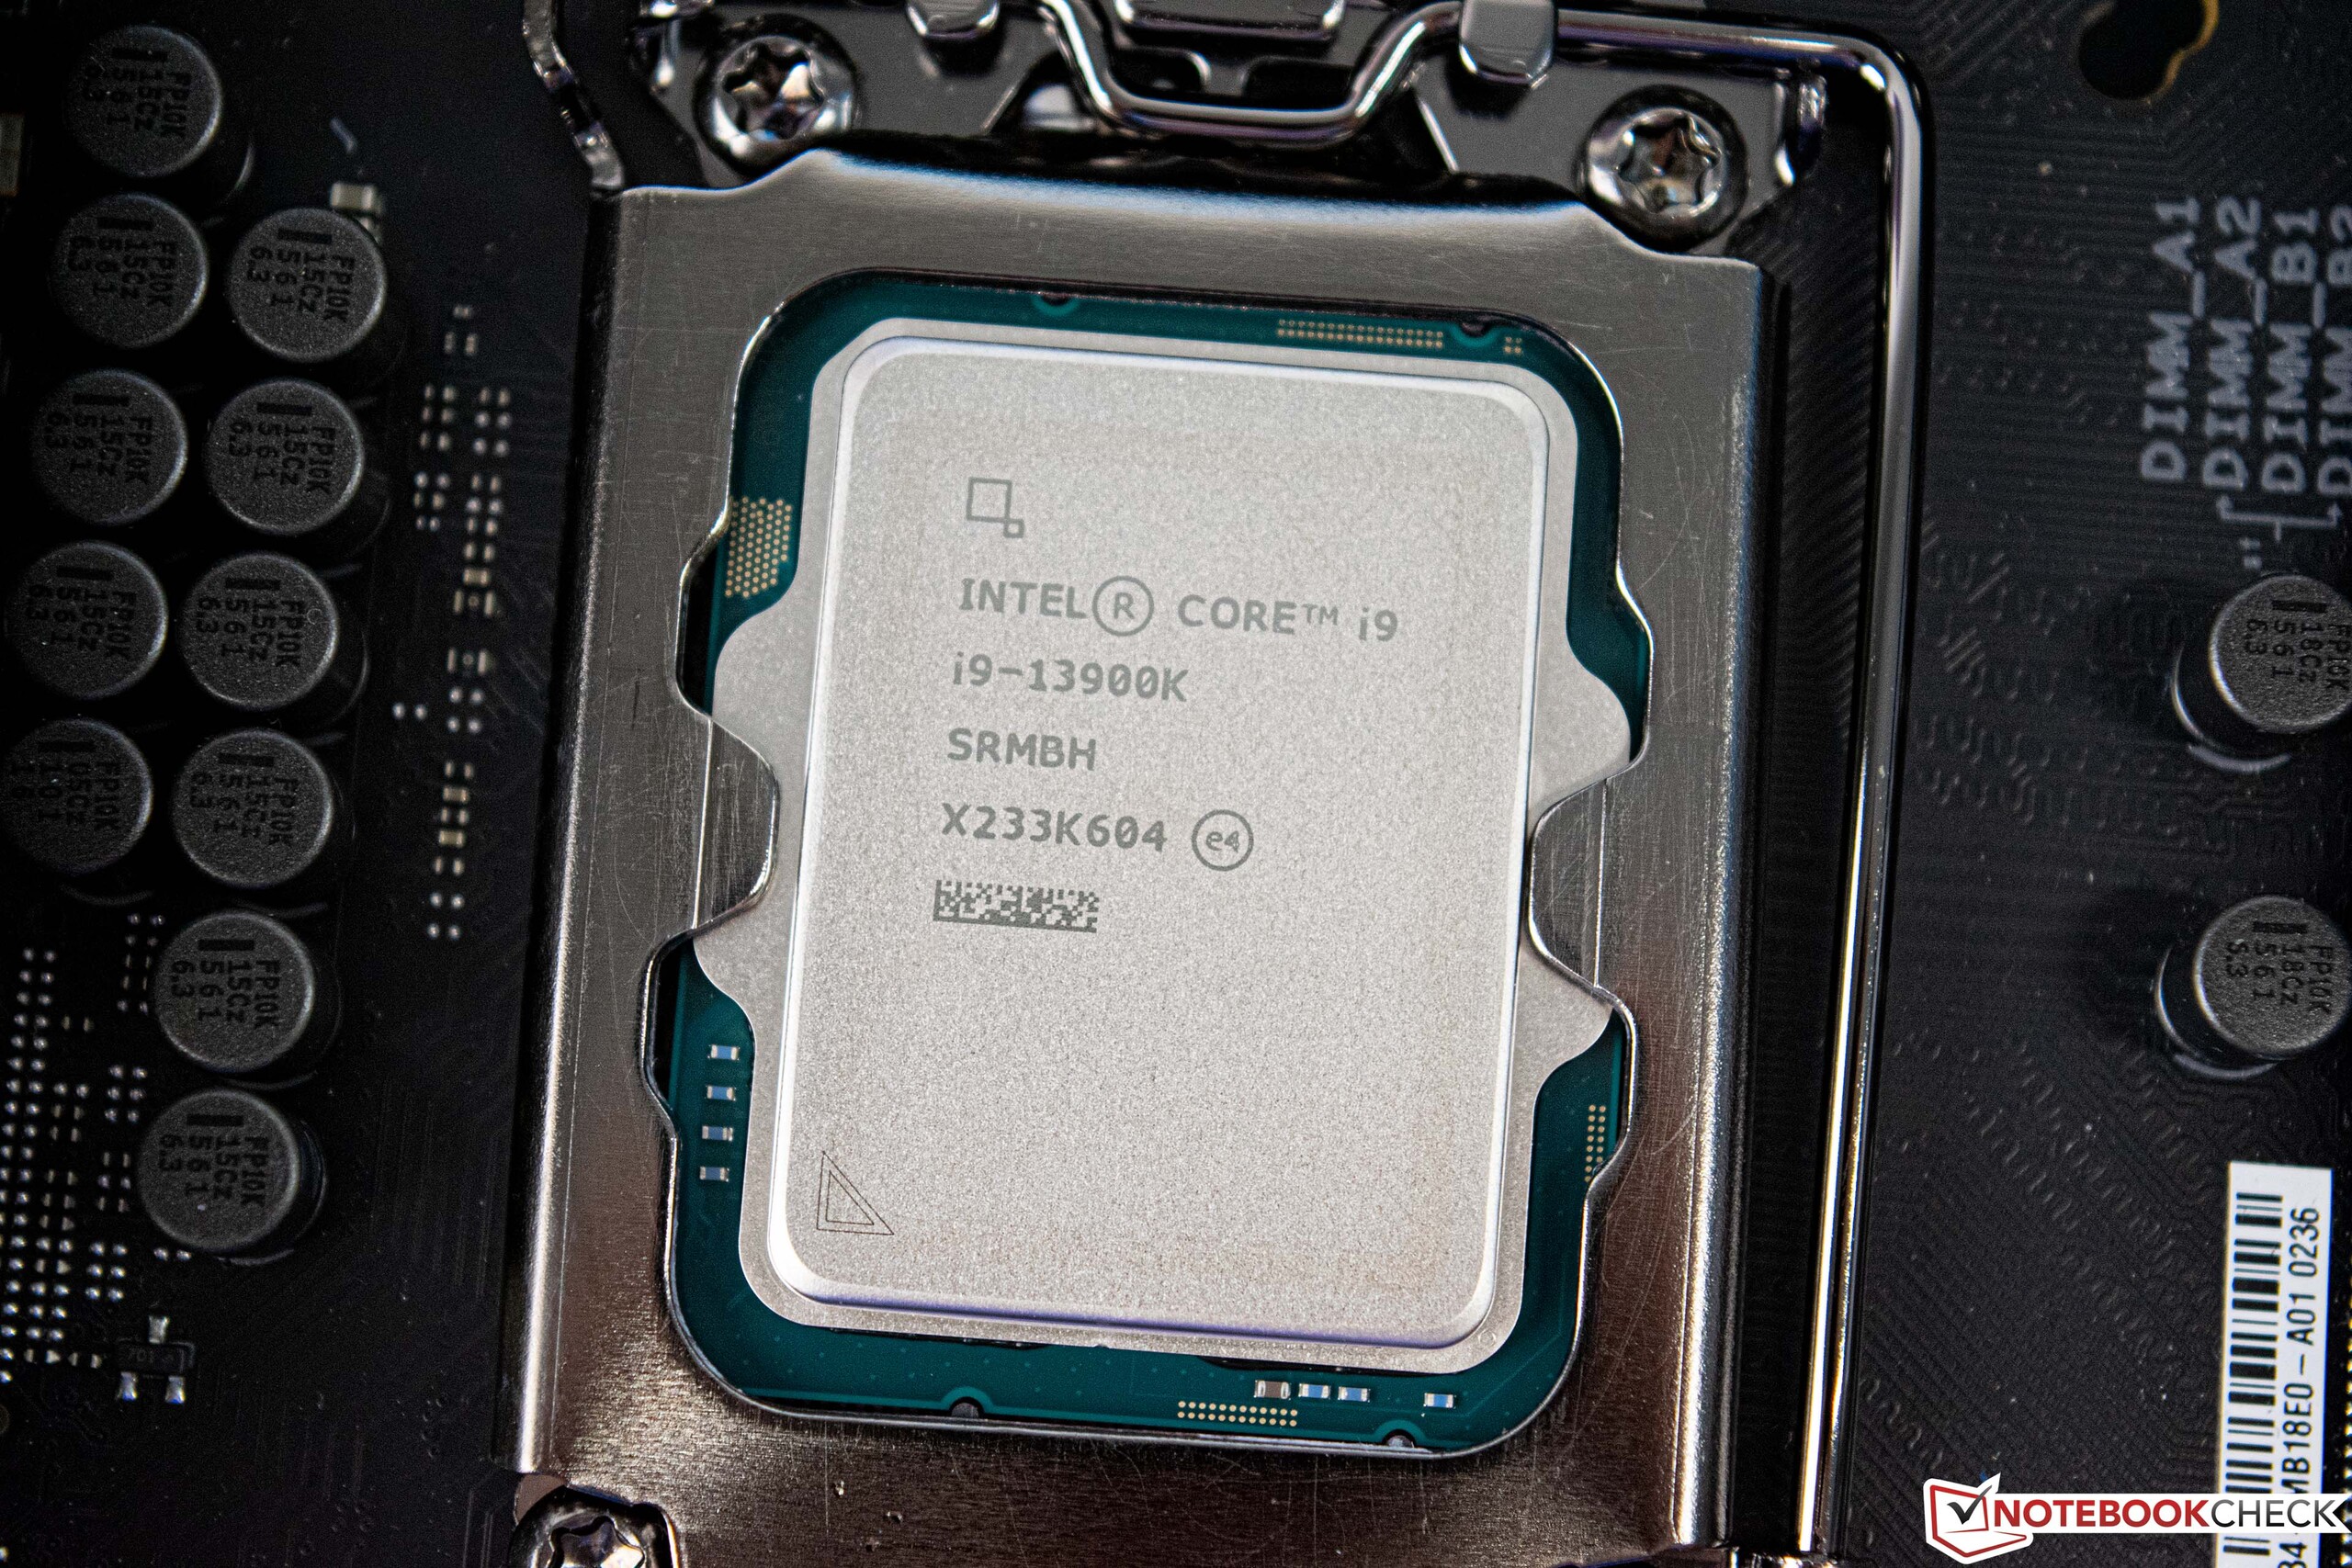
Intel Core i9-13900K

Intel Core i5-13600K
| Performance Rating - Percent | |
| Intel Core i9-13900K | |
| Intel Core i9-13900K @253W | |
| NVIDIA GeForce RTX 3090 Founders Edition | |
| AMD Ryzen 9 7900X | |
| Intel Core i9-12900K | |
| Intel Core i5-13600K | |
| Intel Core i5-13600K @181W | |
| AMD Ryzen 5 7600X | |
| Intel Core i5-12600K | |
| Cinebench R15 | |
| CPU Single 64Bit | |
| NVIDIA GeForce RTX 3090 Founders Edition | |
| Intel Core i9-13900K @253W | |
| Intel Core i9-13900K | |
| AMD Ryzen 9 7900X | |
| AMD Ryzen 5 7600X | |
| Intel Core i5-13600K | |
| Intel Core i9-12900K | |
| Intel Core i5-13600K @181W | |
| Intel Core i5-12600K | |
| CPU Multi 64Bit | |
| NVIDIA GeForce RTX 3090 Founders Edition | |
| Intel Core i9-13900K | |
| Intel Core i9-13900K @253W | |
| AMD Ryzen 9 7900X | |
| Intel Core i9-12900K | |
| Intel Core i5-13600K | |
| Intel Core i5-13600K @181W | |
| Intel Core i5-12600K | |
| AMD Ryzen 5 7600X | |
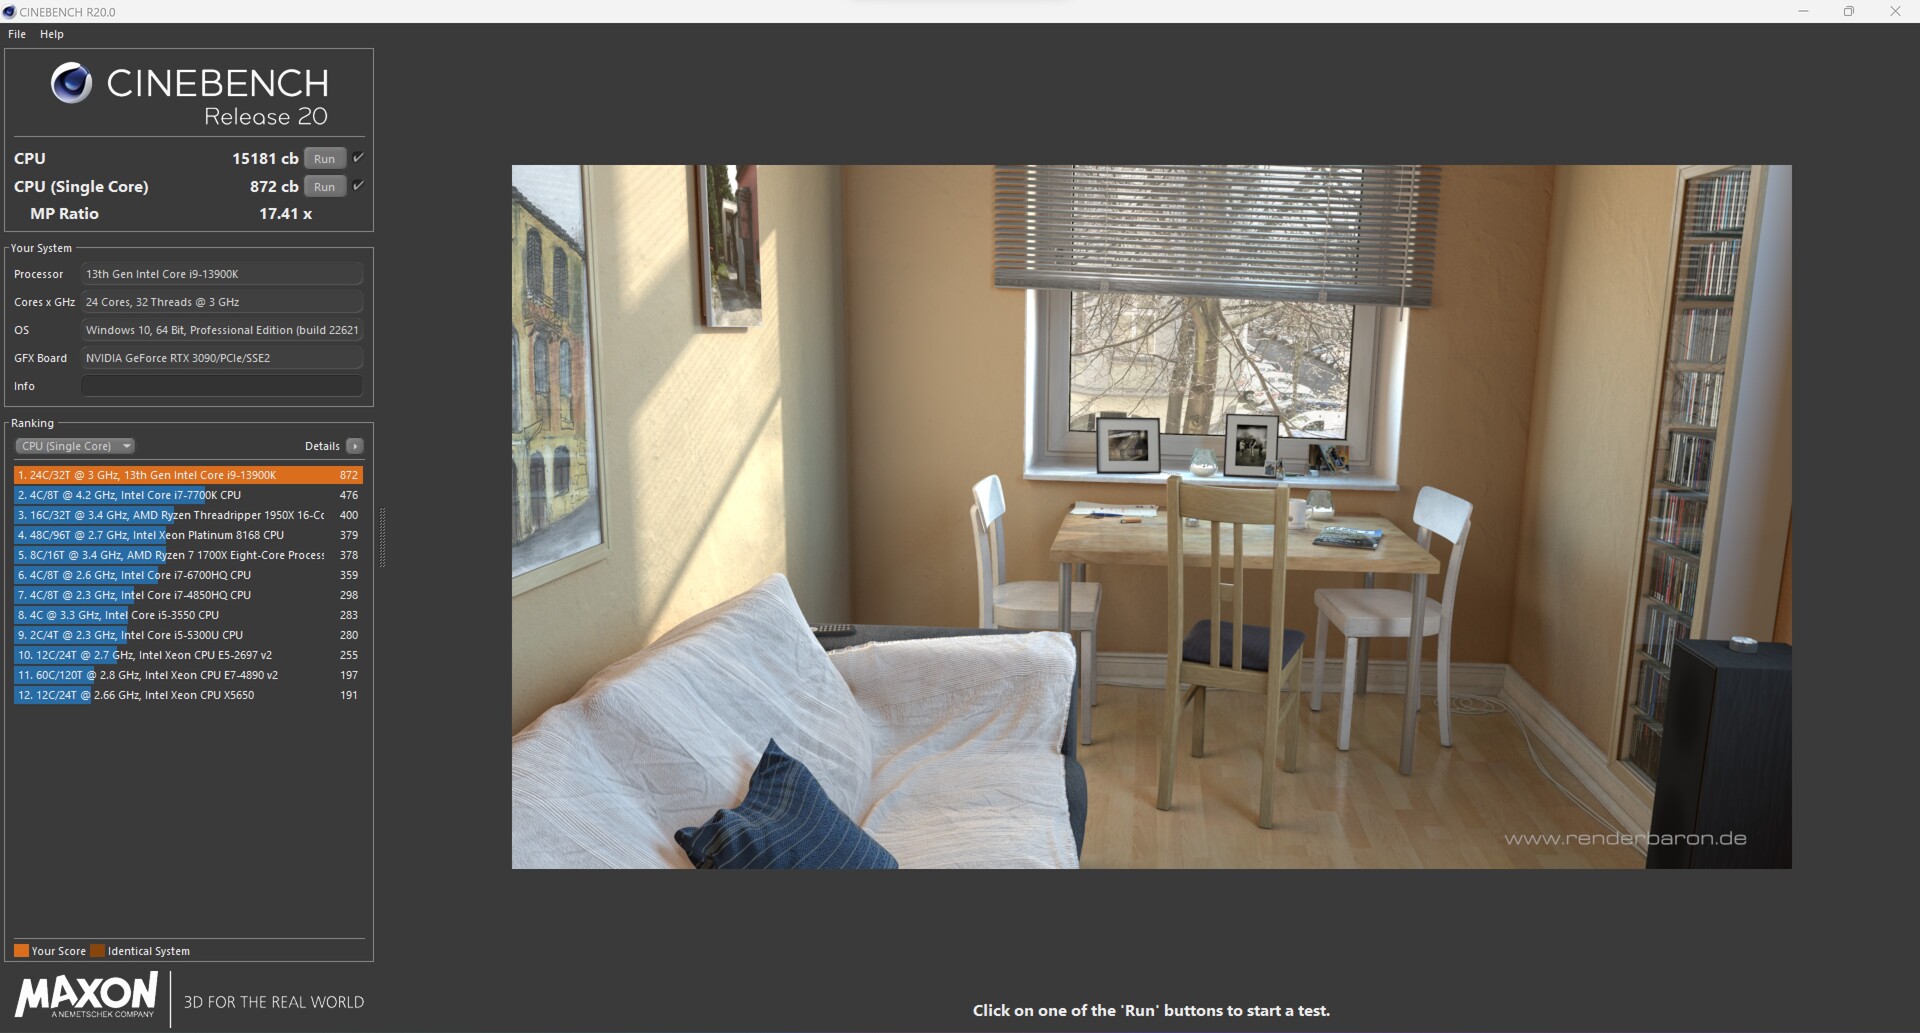
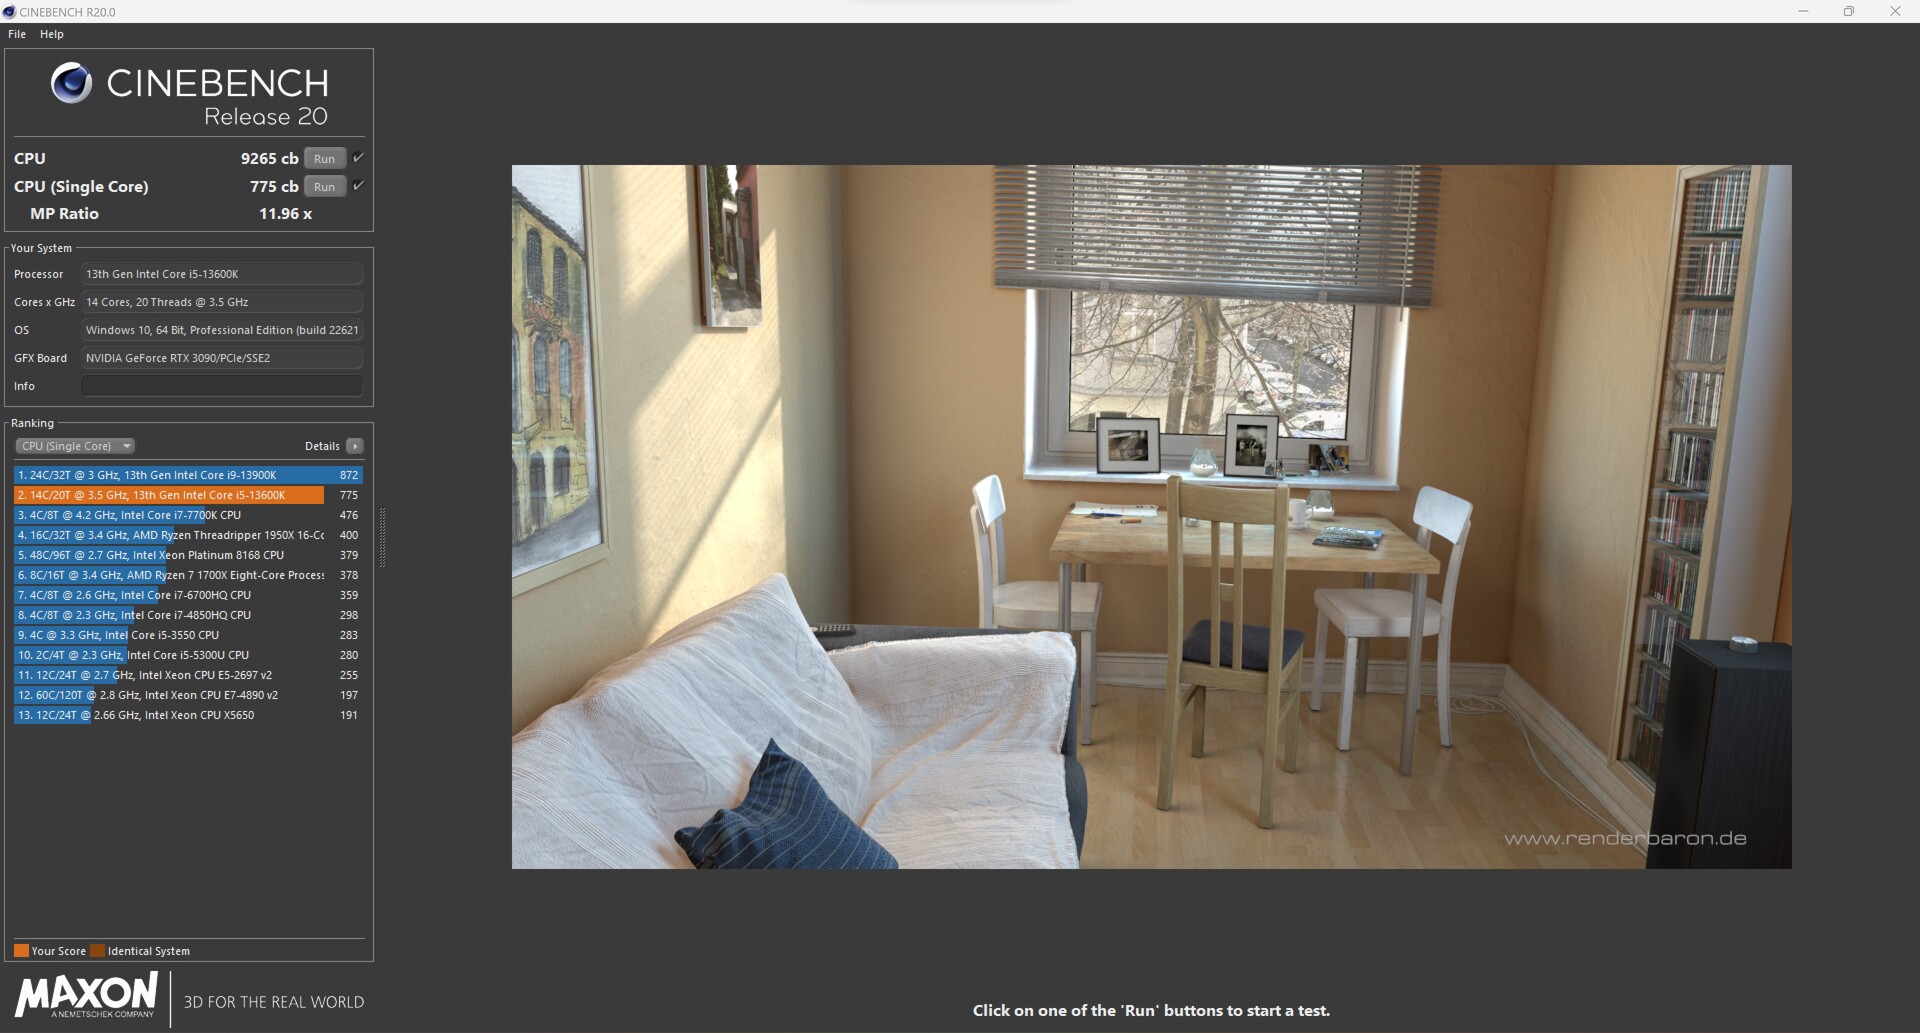
| Cinebench R20 | |
| CPU (Single Core) | |
| Intel Core i9-13900K @253W | |
| Intel Core i9-13900K | |
| NVIDIA GeForce RTX 3090 Founders Edition | |
| AMD Ryzen 9 7900X | |
| Intel Core i5-13600K | |
| Intel Core i9-12900K | |
| Intel Core i5-13600K @181W | |
| AMD Ryzen 5 7600X | |
| Intel Core i5-12600K | |
| CPU (Multi Core) | |
| Intel Core i9-13900K | |
| NVIDIA GeForce RTX 3090 Founders Edition | |
| Intel Core i9-13900K @253W | |
| AMD Ryzen 9 7900X | |
| Intel Core i9-12900K | |
| Intel Core i5-13600K | |
| Intel Core i5-13600K @181W | |
| Intel Core i5-12600K | |
| AMD Ryzen 5 7600X | |
| Cinebench R23 | |
| Single Core | |
| Intel Core i9-13900K @253W | |
| Intel Core i9-13900K | |
| NVIDIA GeForce RTX 3090 Founders Edition | |
| AMD Ryzen 9 7900X | |
| Intel Core i5-13600K | |
| Intel Core i9-12900K | |
| Intel Core i5-13600K @181W | |
| AMD Ryzen 5 7600X | |
| Intel Core i5-12600K | |
| Multi Core | |
| Intel Core i9-13900K | |
| Intel Core i9-13900K @253W | |
| NVIDIA GeForce RTX 3090 Founders Edition | |
| AMD Ryzen 9 7900X | |
| Intel Core i9-12900K | |
| Intel Core i5-13600K | |
| Intel Core i5-13600K @181W | |
| Intel Core i5-12600K | |
| AMD Ryzen 5 7600X | |
| Cinebench R11.5 | |
| CPU Single 64Bit | |
| Intel Core i9-13900K @253W | |
| Intel Core i9-13900K | |
| NVIDIA GeForce RTX 3090 Founders Edition | |
| AMD Ryzen 9 7900X | |
| AMD Ryzen 5 7600X | |
| Intel Core i9-12900K | |
| Intel Core i5-13600K | |
| Intel Core i5-13600K @181W | |
| Intel Core i5-12600K | |
| CPU Multi 64Bit | |
| Intel Core i9-13900K | |
| NVIDIA GeForce RTX 3090 Founders Edition | |
| Intel Core i9-13900K @253W | |
| AMD Ryzen 9 7900X | |
| Intel Core i9-12900K | |
| Intel Core i5-13600K | |
| Intel Core i5-13600K @181W | |
| Intel Core i5-12600K | |
| AMD Ryzen 5 7600X | |
| Cinebench R10 | |
| Rendering Single CPUs 64Bit | |
| Intel Core i9-13900K @253W | |
| Intel Core i9-13900K | |
| AMD Ryzen 9 7900X | |
| NVIDIA GeForce RTX 3090 Founders Edition | |
| Intel Core i5-13600K | |
| Intel Core i9-12900K | |
| Intel Core i5-13600K @181W | |
| AMD Ryzen 5 7600X | |
| Intel Core i5-12600K | |
| Rendering Multiple CPUs 64Bit | |
| Intel Core i9-13900K @253W | |
| Intel Core i9-13900K | |
| NVIDIA GeForce RTX 3090 Founders Edition | |
| AMD Ryzen 9 7900X | |
| Intel Core i9-12900K | |
| Intel Core i5-13600K @181W | |
| Intel Core i5-13600K | |
| AMD Ryzen 5 7600X | |
| Intel Core i5-12600K | |
| Blender - v2.79 BMW27 CPU | |
| AMD Ryzen 5 7600X | |
| Intel Core i5-12600K | |
| Intel Core i5-13600K | |
| Intel Core i5-13600K @181W | |
| Intel Core i9-12900K | |
| AMD Ryzen 9 7900X | |
| NVIDIA GeForce RTX 3090 Founders Edition | |
| Intel Core i9-13900K @253W | |
| Intel Core i9-13900K | |
| wPrime 2.10 | |
| 32m | |
| Intel Core i9-12900K | |
| Intel Core i5-12600K | |
| AMD Ryzen 5 7600X | |
| Intel Core i5-13600K | |
| Intel Core i5-13600K @181W | |
| Intel Core i9-13900K @253W | |
| Intel Core i9-13900K | |
| AMD Ryzen 9 7900X | |
| NVIDIA GeForce RTX 3090 Founders Edition | |
| 1024m | |
| Intel Core i5-12600K | |
| Intel Core i9-12900K | |
| Intel Core i5-13600K | |
| Intel Core i5-13600K @181W | |
| Intel Core i9-13900K @253W | |
| Intel Core i9-13900K | |
| AMD Ryzen 5 7600X | |
| AMD Ryzen 9 7900X | |
| NVIDIA GeForce RTX 3090 Founders Edition | |
| X264 HD Benchmark 4.0 | |
| Pass 1 | |
| Intel Core i9-13900K @253W | |
| Intel Core i9-13900K | |
| Intel Core i5-13600K | |
| Intel Core i5-13600K @181W | |
| NVIDIA GeForce RTX 3090 Founders Edition | |
| AMD Ryzen 9 7900X | |
| Intel Core i9-12900K | |
| AMD Ryzen 5 7600X | |
| Intel Core i5-12600K | |
| Pass 2 | |
| Intel Core i9-13900K | |
| NVIDIA GeForce RTX 3090 Founders Edition | |
| Intel Core i9-13900K @253W | |
| AMD Ryzen 9 7900X | |
| Intel Core i9-12900K | |
| Intel Core i5-13600K | |
| Intel Core i5-13600K @181W | |
| Intel Core i5-12600K | |
| AMD Ryzen 5 7600X | |
| WinRAR - Result | |
| AMD Ryzen 9 7900X | |
| NVIDIA GeForce RTX 3090 Founders Edition | |
| AMD Ryzen 5 7600X | |
| Intel Core i9-13900K @253W | |
| Intel Core i9-13900K | |
| Intel Core i5-13600K @181W | |
| Intel Core i5-13600K | |
| Intel Core i9-12900K | |
| Intel Core i5-12600K | |
| TrueCrypt | |
| AES Mean 100MB | |
| NVIDIA GeForce RTX 3090 Founders Edition | |
| Intel Core i9-13900K | |
| Intel Core i9-13900K @253W | |
| Intel Core i5-13600K @181W | |
| Intel Core i5-13600K | |
| Intel Core i9-12900K | |
| AMD Ryzen 9 7900X | |
| AMD Ryzen 5 7600X | |
| Intel Core i5-12600K | |
| Twofish Mean 100MB | |
| Intel Core i9-13900K | |
| Intel Core i9-13900K @253W | |
| NVIDIA GeForce RTX 3090 Founders Edition | |
| Intel Core i9-12900K | |
| Intel Core i5-13600K @181W | |
| Intel Core i5-13600K | |
| AMD Ryzen 9 7900X | |
| Intel Core i5-12600K | |
| AMD Ryzen 5 7600X | |
| Serpent Mean 100MB | |
| Intel Core i9-13900K | |
| Intel Core i9-13900K @253W | |
| NVIDIA GeForce RTX 3090 Founders Edition | |
| Intel Core i9-12900K | |
| Intel Core i5-13600K | |
| Intel Core i5-13600K @181W | |
| AMD Ryzen 9 7900X | |
| Intel Core i5-12600K | |
| AMD Ryzen 5 7600X | |
| Geekbench 5.5 | |
| Multi-Core | |
| NVIDIA GeForce RTX 3090 Founders Edition | |
| Intel Core i9-13900K | |
| Intel Core i9-13900K @253W | |
| AMD Ryzen 9 7900X | |
| Intel Core i9-12900K | |
| Intel Core i5-13600K @181W | |
| Intel Core i5-13600K | |
| Intel Core i5-12600K | |
| AMD Ryzen 5 7600X | |
| Single-Core | |
| NVIDIA GeForce RTX 3090 Founders Edition | |
| Intel Core i9-13900K | |
| Intel Core i9-13900K @253W | |
| AMD Ryzen 9 7900X | |
| AMD Ryzen 5 7600X | |
| Intel Core i9-12900K | |
| Intel Core i5-13600K @181W | |
| Intel Core i5-13600K | |
| Intel Core i5-12600K | |
| Geekbench 5.0 | |
| 5.0 Multi-Core | |
| NVIDIA GeForce RTX 3090 Founders Edition | |
| Intel Core i9-13900K | |
| Intel Core i9-13900K @253W | |
| AMD Ryzen 9 7900X | |
| Intel Core i9-12900K | |
| Intel Core i5-13600K | |
| Intel Core i5-13600K @181W | |
| Intel Core i5-12600K | |
| AMD Ryzen 5 7600X | |
| 5.0 Single-Core | |
| Intel Core i9-13900K @253W | |
| NVIDIA GeForce RTX 3090 Founders Edition | |
| Intel Core i9-13900K | |
| AMD Ryzen 9 7900X | |
| AMD Ryzen 5 7600X | |
| Intel Core i9-12900K | |
| Intel Core i5-13600K @181W | |
| Intel Core i5-13600K | |
| Intel Core i5-12600K | |
| Geekbench 4.4 | |
| 64 Bit Single-Core Score | |
| Intel Core i9-13900K @253W | |
| Intel Core i9-13900K | |
| NVIDIA GeForce RTX 3090 Founders Edition | |
| AMD Ryzen 9 7900X | |
| AMD Ryzen 5 7600X | |
| Intel Core i9-12900K | |
| Intel Core i5-13600K @181W | |
| Intel Core i5-13600K | |
| Intel Core i5-12600K | |
| 64 Bit Multi-Core Score | |
| NVIDIA GeForce RTX 3090 Founders Edition | |
| Intel Core i9-13900K | |
| Intel Core i9-13900K @253W | |
| AMD Ryzen 9 7900X | |
| Intel Core i9-12900K | |
| Intel Core i5-13600K @181W | |
| Intel Core i5-13600K | |
| AMD Ryzen 5 7600X | |
| Intel Core i5-12600K | |
| 3DMark 11 - 1280x720 Performance Physics | |
| Intel Core i9-13900K | |
| Intel Core i9-13900K @253W | |
| Intel Core i5-13600K | |
| Intel Core i5-13600K @181W | |
| AMD Ryzen 9 7900X | |
| NVIDIA GeForce RTX 3090 Founders Edition | |
| Intel Core i9-12900K | |
| AMD Ryzen 5 7600X | |
| Intel Core i5-12600K | |
| 7-Zip 18.03 | |
| 7z b 4 | |
| NVIDIA GeForce RTX 3090 Founders Edition | |
| Intel Core i9-13900K | |
| Intel Core i9-13900K @253W | |
| AMD Ryzen 9 7900X | |
| Intel Core i9-12900K | |
| Intel Core i5-13600K | |
| Intel Core i5-13600K @181W | |
| AMD Ryzen 5 7600X | |
| Intel Core i5-12600K | |
| 7z b 4 -mmt1 | |
| NVIDIA GeForce RTX 3090 Founders Edition | |
| AMD Ryzen 9 7900X | |
| AMD Ryzen 5 7600X | |
| Intel Core i9-13900K @253W | |
| Intel Core i9-13900K | |
| Intel Core i9-12900K | |
| Intel Core i5-13600K | |
| Intel Core i5-13600K @181W | |
| Intel Core i5-12600K | |
| HWBOT x265 Benchmark v2.2 - 4k Preset | |
| NVIDIA GeForce RTX 3090 Founders Edition | |
| Intel Core i9-13900K | |
| Intel Core i9-13900K @253W | |
| AMD Ryzen 9 7900X | |
| Intel Core i5-12600K | |
| Intel Core i9-12900K | |
| Intel Core i5-13600K | |
| Intel Core i5-13600K @181W | |
| AMD Ryzen 5 7600X | |
| R Benchmark 2.5 - Overall mean | |
| Intel Core i5-12600K | |
| Intel Core i9-12900K | |
| Intel Core i5-13600K | |
| Intel Core i5-13600K @181W | |
| AMD Ryzen 5 7600X | |
| AMD Ryzen 9 7900X | |
| NVIDIA GeForce RTX 3090 Founders Edition | |
| Intel Core i9-13900K | |
| Intel Core i9-13900K @253W | |
| LibreOffice - 20 Documents To PDF | |
| Intel Core i5-12600K | |
| Intel Core i9-12900K | |
| AMD Ryzen 5 7600X | |
| Intel Core i9-13900K | |
| Intel Core i5-13600K @181W | |
| NVIDIA GeForce RTX 3090 Founders Edition | |
| Intel Core i5-13600K | |
| AMD Ryzen 9 7900X | |
| Intel Core i9-13900K @253W | |
| WebXPRT 3 - Overall | |
| AMD Ryzen 9 7900X | |
| Intel Core i9-13900K @253W | |
| NVIDIA GeForce RTX 3090 Founders Edition | |
| AMD Ryzen 5 7600X | |
| Intel Core i9-13900K | |
| Intel Core i5-13600K | |
| Intel Core i5-13600K @181W | |
| Intel Core i9-12900K | |
| Intel Core i5-12600K | |
| Mozilla Kraken 1.1 - Total | |
| Intel Core i5-12600K | |
| Intel Core i9-12900K | |
| Intel Core i5-13600K | |
| Intel Core i5-13600K @181W | |
| AMD Ryzen 5 7600X | |
| NVIDIA GeForce RTX 3090 Founders Edition | |
| Intel Core i9-13900K | |
| AMD Ryzen 9 7900X | |
| Intel Core i9-13900K @253W | |
| 3DMark | |
| 3840x2160 Fire Strike Ultra Physics | |
| Intel Core i9-13900K @253W | |
| Intel Core i9-13900K | |
| AMD Ryzen 9 7900X | |
| NVIDIA GeForce RTX 3090 Founders Edition | |
| Intel Core i9-12900K | |
| Intel Core i5-13600K @181W | |
| Intel Core i5-13600K | |
| AMD Ryzen 5 7600X | |
| Intel Core i5-12600K | |
| 1920x1080 Fire Strike Physics | |
| Intel Core i9-13900K @253W | |
| Intel Core i9-13900K | |
| AMD Ryzen 9 7900X | |
| NVIDIA GeForce RTX 3090 Founders Edition | |
| Intel Core i9-12900K | |
| Intel Core i5-13600K @181W | |
| Intel Core i5-13600K | |
| AMD Ryzen 5 7600X | |
| Intel Core i5-12600K | |
| 2560x1440 Time Spy CPU | |
| Intel Core i9-13900K @253W | |
| Intel Core i9-13900K | |
| Intel Core i9-12900K | |
| Intel Core i5-13600K | |
| Intel Core i5-13600K @181W | |
| AMD Ryzen 9 7900X | |
| NVIDIA GeForce RTX 3090 Founders Edition | |
| Intel Core i5-12600K | |
| AMD Ryzen 5 7600X | |
* ... kleinere Werte sind besser
Intel Core i9-13900K + Intel Core i5-13600K vs. Cinebench-R15-Multi-Schleife
Beim Belastungstest, den wir mit der Cinebench-R15-Dauerschleife durchführen, zeigen beide Testsamples eine sehr stabile Performance. Dennoch muss man erwähnen, dass der Intel Core i9-13900K ständig im Temperatur-Limit agierte. Mit über 2.000 Punkten ist aber auch hier der Leistungszuwachs gegenüber dem Intel Core i9-12900K enorm. Der Intel Core i5-13600K ist mit durchschnittlich 3.620 Punkten über alle 50 Durchläufe hinweg ebenfalls nicht zu vernachlässigen.
Synthetische Benchmarks und Anwendungsleistung
Waren die synthetischen Benchmarks beim letztjährigen Alder-Lake-Release noch deutlich in Intels Hand, so sieht es dieses Jahr nicht so eindeutig aus. AMD kann mit seinen Ryzen-9-Prozessoren mithalten, und Intel bleibt beim PCMark 10 nur der dritte Platz. Gegenüber Alder Lake konnte sich Raptor Lake aber durchweg durchsetzen und die Leistung gut umsetzen.
| PCMark 10 - Score | |
| AMD Ryzen 9 7900X, NVIDIA GeForce RTX 3090 | |
| NVIDIA GeForce RTX 3090 Founders Edition, NVIDIA GeForce RTX 3090 | |
| Intel Core i9-13900K, NVIDIA GeForce RTX 3090 | |
| AMD Ryzen 5 7600X, NVIDIA GeForce RTX 3090 | |
| Intel Core i5-13600K, NVIDIA GeForce RTX 3090 | |
| Intel Core i9-12900K, NVIDIA Titan RTX | |
| Intel Core i5-12600K, NVIDIA Titan RTX | |
| 3DMark | |
| 1920x1080 Fire Strike Physics | |
| Intel Core i9-13900K @253W, NVIDIA GeForce RTX 3090 | |
| Intel Core i9-13900K, NVIDIA GeForce RTX 3090 | |
| AMD Ryzen 9 7900X, NVIDIA GeForce RTX 3090 | |
| NVIDIA GeForce RTX 3090 Founders Edition, NVIDIA GeForce RTX 3090 | |
| Intel Core i9-12900K, NVIDIA Titan RTX | |
| Intel Core i5-13600K @181W, NVIDIA GeForce RTX 3090 | |
| Intel Core i5-13600K, NVIDIA GeForce RTX 3090 | |
| AMD Ryzen 5 7600X, NVIDIA GeForce RTX 3090 | |
| Intel Core i5-12600K, NVIDIA Titan RTX | |
| 2560x1440 Time Spy CPU | |
| Intel Core i9-13900K @253W, NVIDIA GeForce RTX 3090 | |
| Intel Core i9-13900K, NVIDIA GeForce RTX 3090 | |
| Intel Core i9-12900K, NVIDIA Titan RTX | |
| Intel Core i5-13600K, NVIDIA GeForce RTX 3090 | |
| Intel Core i5-13600K @181W, NVIDIA GeForce RTX 3090 | |
| AMD Ryzen 9 7900X, NVIDIA GeForce RTX 3090 | |
| NVIDIA GeForce RTX 3090 Founders Edition, NVIDIA GeForce RTX 3090 | |
| Intel Core i5-12600K, NVIDIA Titan RTX | |
| AMD Ryzen 5 7600X, NVIDIA GeForce RTX 3090 | |
| 3DMark 11 - 1280x720 Performance Physics | |
| Intel Core i9-13900K, NVIDIA GeForce RTX 3090 | |
| Intel Core i9-13900K @253W, NVIDIA GeForce RTX 3090 | |
| Intel Core i5-13600K, NVIDIA GeForce RTX 3090 | |
| Intel Core i5-13600K @181W, NVIDIA GeForce RTX 3090 | |
| AMD Ryzen 9 7900X, NVIDIA GeForce RTX 3090 | |
| NVIDIA GeForce RTX 3090 Founders Edition, NVIDIA GeForce RTX 3090 | |
| Intel Core i9-12900K, NVIDIA Titan RTX | |
| AMD Ryzen 5 7600X, NVIDIA GeForce RTX 3090 | |
| Intel Core i5-12600K, NVIDIA Titan RTX | |
| Desktop-PC, NVIDIA GeForce RTX 3090 | |
| CrossMark - Overall | |
| Intel Core i9-13900K, NVIDIA GeForce RTX 3090 | |
| Intel Core i9-13900K @253W, NVIDIA GeForce RTX 3090 | |
| NVIDIA GeForce RTX 3090 Founders Edition, NVIDIA GeForce RTX 3090 | |
| AMD Ryzen 9 7900X, NVIDIA GeForce RTX 3090 | |
| Intel Core i5-13600K, NVIDIA GeForce RTX 3090 | |
| Intel Core i5-13600K @181W, NVIDIA GeForce RTX 3090 | |
| AMD Ryzen 5 7600X, NVIDIA GeForce RTX 3090 | |
| Intel Core i5-12600K, NVIDIA GeForce RTX 3090 | |
| AIDA64 / Memory Copy | |
| Intel Core i9-13900K @253W | |
| Intel Core i9-13900K | |
| Intel Core i5-13600K @181W | |
| Intel Core i9-12900K | |
| NVIDIA GeForce RTX 3090 Founders Edition | |
| Intel Core i5-13600K | |
| Intel Core i5-12600K | |
| AMD Ryzen 9 7900X | |
| AMD Ryzen 5 7600X | |
| Durchschnitt der Klasse (4514 - 234662, n=2123) | |
| AIDA64 / Memory Read | |
| Intel Core i9-13900K | |
| Intel Core i9-13900K @253W | |
| Intel Core i9-12900K | |
| NVIDIA GeForce RTX 3090 Founders Edition | |
| Intel Core i5-13600K @181W | |
| Intel Core i5-12600K | |
| Intel Core i5-13600K | |
| AMD Ryzen 9 7900X | |
| AMD Ryzen 5 7600X | |
| Durchschnitt der Klasse (4031 - 271066, n=2085) | |
| AIDA64 / Memory Write | |
| AMD Ryzen 5 7600X | |
| NVIDIA GeForce RTX 3090 Founders Edition | |
| AMD Ryzen 9 7900X | |
| Intel Core i9-13900K | |
| Intel Core i5-13600K @181W | |
| Intel Core i9-13900K @253W | |
| Intel Core i5-12600K | |
| Intel Core i9-12900K | |
| Intel Core i5-13600K | |
| Durchschnitt der Klasse (3506 - 242868, n=2090) | |
| AIDA64 / Memory Latency | |
| Durchschnitt der Klasse (8.7 - 536, n=2153) | |
| Intel Core i5-13600K | |
| Intel Core i9-13900K @253W | |
| Intel Core i9-13900K | |
| Intel Core i5-13600K @181W | |
| AMD Ryzen 5 7600X | |
| AMD Ryzen 9 7900X | |
| NVIDIA GeForce RTX 3090 Founders Edition | |
* ... kleinere Werte sind besser
Spiele-Benchmarks
Wenn es die letzten Jahre um die schnellste Gaming-CPU ging, war Intel immer ein Garant dafür. Doch AMD konnte mit seinen Zen-4-Prozessoren das Feld gut aufmischen, sodass hier kein eindeutiger Sieger hervorgeht. Im kumulierten Vergleich der elf Spiele muss sich der Intel Core i9-13900K knapp hinter dem AMD Ryzen 9 7950X einreihen. Wenn wir aber die Preisklasse der Prozessoren mit einbeziehen, so kann sich Intels Core i9-13900K knapp vor dem AMD Ryzen 9 7900X platzieren. Wir dürfen allerdings nicht vergessen, dass es Spiele gibt, die besser mit Intel Prozessoren harmonieren und wiederum auch Spiele, die bessere Leistung mit AMD Prozessoren abliefern. Im internen Duell der beiden Raptor-Lake-S Prozessoren verliert der Intel Core i5-13600K nur sieben Prozentpunkte auf das Flaggschiff. Wer allerdings noch mit einem AM4-Mainboard unterwegs ist, kann auch einen Blick auf den AMD Ryzen 7 5800X3D werfen, denn diese CPU bietet ebenfalls eine sehr gute Gaming-Leistung.
Der Intel Core i9-13900K sowie der Intel Core i5-13600K liefern beide eine sehr gute Gaming-Performance. Im CPU-Limit dokumentieren wir teilweise deutliche Leistungsunterschiede zwischen den Kontrahenten, welche aber mit zunehmender Auflösung und Detailstufe immer mehr in den Hintergrund rückt. Die schnellste Gaming-CPU können wir Intel dieses Jahr nicht attestieren, denn AMD ist mit dem Ryzen 9 7950X einen Tick schneller unterwegs. Alle Kontrahenten rücken wieder näher zusammen. Wer neben dem eigentlichen Spielen auch streamt und die Öffentlichkeit teilhaben lassen möchte, profitiert von der höheren Anzahl an Threads, womit auch die aktuellen Raptor-Lake-Prozessoren für Content Creators sehr interessant sind.
Gaming Performace - Raptor-Lake vs Alder-Lake
| Performance Rating - Percent | |
| Intel Core i9-13900K | |
| Intel Core i9-12900K | |
| Intel Core i5-13600K | |
| Intel Core i5-12600K -2! | |
| F1 22 | |
| 1920x1080 Low Preset AA:T AF:16x | |
| Intel Core i5-13600K | |
| Intel Core i9-13900K | |
| Intel Core i9-12900K | |
| Intel Core i5-12600K | |
| 1920x1080 Ultra High Preset AA:T AF:16x | |
| Intel Core i9-12900K | |
| Intel Core i5-12600K | |
| Intel Core i5-13600K | |
| Intel Core i9-13900K | |
| Far Cry 5 | |
| 1920x1080 Ultra Preset AA:T | |
| Intel Core i9-13900K | |
| Intel Core i5-13600K | |
| Intel Core i9-12900K | |
| Intel Core i5-12600K | |
| 1280x720 Low Preset AA:T | |
| Intel Core i9-13900K | |
| Intel Core i5-13600K | |
| Intel Core i9-12900K | |
| Intel Core i5-12600K | |
| X-Plane 11.11 | |
| 1920x1080 high (fps_test=3) | |
| Intel Core i9-13900K | |
| Intel Core i9-12900K | |
| Intel Core i5-13600K | |
| Intel Core i5-12600K | |
| 1280x720 low (fps_test=1) | |
| Intel Core i9-13900K | |
| Intel Core i9-12900K | |
| Intel Core i5-13600K | |
| Intel Core i5-12600K | |
| Final Fantasy XV Benchmark | |
| 1920x1080 High Quality | |
| Intel Core i5-13600K | |
| Intel Core i9-13900K | |
| Intel Core i9-12900K | |
| Intel Core i5-12600K | |
| 1280x720 Lite Quality | |
| Intel Core i5-13600K | |
| Intel Core i9-13900K | |
| Intel Core i9-12900K | |
| Intel Core i5-12600K | |
| Dota 2 Reborn | |
| 1920x1080 ultra (3/3) best looking | |
| Intel Core i9-13900K | |
| Intel Core i5-13600K | |
| Intel Core i9-12900K | |
| Intel Core i5-12600K | |
| 1280x720 min (0/3) fastest | |
| Intel Core i9-13900K | |
| Intel Core i5-13600K | |
| Intel Core i9-12900K | |
| Intel Core i5-12600K | |
| The Witcher 3 | |
| 1920x1080 Ultra Graphics & Postprocessing (HBAO+) | |
| Intel Core i5-13600K | |
| Intel Core i9-12900K | |
| Intel Core i9-13900K | |
| 1024x768 Low Graphics & Postprocessing | |
| Intel Core i9-13900K | |
| Intel Core i9-12900K | |
| Intel Core i5-13600K | |
| GTA V | |
| 1920x1080 Highest AA:4xMSAA + FX AF:16x | |
| Intel Core i9-13900K | |
| Intel Core i5-13600K | |
| Intel Core i9-12900K | |
| Intel Core i5-12600K | |
| 1024x768 Lowest Settings possible | |
| Intel Core i9-13900K | |
| Intel Core i5-13600K | |
| Intel Core i9-12900K | |
| Intel Core i5-12600K | |
Gaming Performace im diekten Vergleich mit AMD
| Performance Rating - Percent | |
| AMD Ryzen 9 7950X | |
| Intel Core i9-13900K | |
| AMD Ryzen 9 7900X | |
| AMD Ryzen 5 7600X | |
| Intel Core i5-13600K | |
| F1 22 | |
| 1920x1080 Low Preset AA:T AF:16x | |
| AMD Ryzen 9 7950X | |
| AMD Ryzen 9 7900X | |
| AMD Ryzen 5 7600X | |
| Intel Core i5-13600K | |
| Intel Core i9-13900K | |
| 1920x1080 Ultra High Preset AA:T AF:16x | |
| AMD Ryzen 9 7950X | |
| Intel Core i5-13600K | |
| AMD Ryzen 5 7600X | |
| AMD Ryzen 9 7900X | |
| Intel Core i9-13900K | |
| Far Cry 5 | |
| 1920x1080 Ultra Preset AA:T | |
| Intel Core i9-13900K | |
| AMD Ryzen 9 7950X | |
| Intel Core i5-13600K | |
| AMD Ryzen 9 7900X | |
| AMD Ryzen 5 7600X | |
| 1280x720 Low Preset AA:T | |
| Intel Core i9-13900K | |
| AMD Ryzen 9 7900X | |
| Intel Core i5-13600K | |
| AMD Ryzen 9 7950X | |
| AMD Ryzen 5 7600X | |
| X-Plane 11.11 | |
| 1920x1080 high (fps_test=3) | |
| AMD Ryzen 9 7900X | |
| AMD Ryzen 9 7950X | |
| AMD Ryzen 5 7600X | |
| Intel Core i9-13900K | |
| Intel Core i5-13600K | |
| 1280x720 low (fps_test=1) | |
| Intel Core i9-13900K | |
| AMD Ryzen 5 7600X | |
| AMD Ryzen 9 7900X | |
| AMD Ryzen 9 7950X | |
| Intel Core i5-13600K | |
| Final Fantasy XV Benchmark | |
| 1920x1080 High Quality | |
| AMD Ryzen 9 7900X | |
| Intel Core i5-13600K | |
| Intel Core i9-13900K | |
| AMD Ryzen 9 7950X | |
| AMD Ryzen 5 7600X | |
| 1280x720 Lite Quality | |
| AMD Ryzen 9 7900X | |
| Intel Core i5-13600K | |
| AMD Ryzen 9 7950X | |
| Intel Core i9-13900K | |
| AMD Ryzen 5 7600X | |
| Dota 2 Reborn | |
| 1920x1080 ultra (3/3) best looking | |
| AMD Ryzen 9 7950X | |
| AMD Ryzen 9 7900X | |
| Intel Core i9-13900K | |
| AMD Ryzen 5 7600X | |
| Intel Core i5-13600K | |
| 1280x720 min (0/3) fastest | |
| AMD Ryzen 5 7600X | |
| AMD Ryzen 9 7900X | |
| AMD Ryzen 9 7950X | |
| Intel Core i9-13900K | |
| Intel Core i5-13600K | |
| The Witcher 3 | |
| 1920x1080 Ultra Graphics & Postprocessing (HBAO+) | |
| AMD Ryzen 9 7950X | |
| AMD Ryzen 9 7900X | |
| AMD Ryzen 5 7600X | |
| Intel Core i5-13600K | |
| Intel Core i9-13900K | |
| 1024x768 Low Graphics & Postprocessing | |
| AMD Ryzen 9 7950X | |
| AMD Ryzen 9 7900X | |
| Intel Core i9-13900K | |
| AMD Ryzen 5 7600X | |
| Intel Core i5-13600K | |
| GTA V | |
| 1920x1080 Highest AA:4xMSAA + FX AF:16x | |
| Intel Core i9-13900K | |
| AMD Ryzen 9 7950X | |
| AMD Ryzen 9 7900X | |
| AMD Ryzen 5 7600X | |
| Intel Core i5-13600K | |
| 1024x768 Lowest Settings possible | |
| Intel Core i9-13900K | |
| AMD Ryzen 9 7900X | |
| AMD Ryzen 5 7600X | |
| Intel Core i5-13600K | |
| AMD Ryzen 9 7950X | |
| Borderlands 3 | |
| 1280x720 Very Low Overall Quality (DX11) | |
| AMD Ryzen 9 7900X | |
| Intel Core i9-13900K | |
| AMD Ryzen 9 7950X | |
| AMD Ryzen 5 7600X | |
| Intel Core i5-13600K | |
| 1920x1080 Badass Overall Quality (DX11) | |
| AMD Ryzen 9 7950X | |
| AMD Ryzen 9 7900X | |
| Intel Core i9-13900K | |
| AMD Ryzen 5 7600X | |
| Intel Core i5-13600K | |
| Far Cry New Dawn | |
| 1280x720 Low Preset | |
| Intel Core i9-13900K | |
| AMD Ryzen 9 7950X | |
| Intel Core i5-13600K | |
| AMD Ryzen 9 7900X | |
| AMD Ryzen 5 7600X | |
| 1920x1080 Ultra Preset | |
| Intel Core i9-13900K | |
| AMD Ryzen 9 7950X | |
| Intel Core i5-13600K | |
| AMD Ryzen 9 7900X | |
| AMD Ryzen 5 7600X | |
| Shadow of the Tomb Raider | |
| 1280x720 Lowest Preset | |
| AMD Ryzen 9 7950X | |
| AMD Ryzen 9 7900X | |
| Intel Core i9-13900K | |
| AMD Ryzen 5 7600X | |
| Intel Core i5-13600K | |
| 1920x1080 Highest Preset AA:T | |
| AMD Ryzen 9 7900X | |
| AMD Ryzen 9 7950X | |
| Intel Core i9-13900K | |
| AMD Ryzen 5 7600X | |
| Intel Core i5-13600K | |
| Tiny Tina's Wonderlands | |
| 1920x1080 Low Preset (DX12) | |
| AMD Ryzen 9 7950X | |
| Intel Core i9-13900K | |
| AMD Ryzen 5 7600X | |
| AMD Ryzen 9 7900X | |
| Intel Core i5-13600K | |
| 1920x1080 Badass Preset (DX12) | |
| AMD Ryzen 9 7900X | |
| AMD Ryzen 5 7600X | |
| AMD Ryzen 9 7950X | |
| Intel Core i9-13900K | |
| Intel Core i5-13600K | |
Intel Core i9-13900K mit Nvidia GeForce RTX 3090
| min. | mittel | hoch | max. | QHD | 4K | |
|---|---|---|---|---|---|---|
| GTA V (2015) | 187.7 | 187.7 | 187.4 | 165.6 | 156.7 | 182.5 |
| The Witcher 3 (2015) | 752 | 584 | 368 | 179.8 | 151.6 | |
| Dota 2 Reborn (2015) | 285.3 | 256.1 | 243.7 | 229.2 | 215.9 | |
| Final Fantasy XV Benchmark (2018) | 234 | 233 | 188.9 | 148.2 | 88.5 | |
| X-Plane 11.11 (2018) | 234 | 202 | 148.4 | 128.4 | ||
| Far Cry 5 (2018) | 263 | 232 | 220 | 205 | 186 | 110 |
| Strange Brigade (2018) | 749 | 506 | 402 | 350 | 266 | 159 |
| Shadow of the Tomb Raider (2018) | 314 | 265 | 250 | 230 | 167.4 | 97.1 |
| Far Cry New Dawn (2019) | 221 | 191 | 183 | 166 | 156 | 111 |
| Metro Exodus (2019) | 285 | 217 | 173.9 | 141.3 | 116.4 | 76.2 |
| Borderlands 3 (2019) | 243 | 215 | 190.3 | 163 | 128.3 | 73.1 |
| F1 2020 (2020) | 515 | 438 | 407 | 297 | 233 | 142.4 |
| F1 2021 (2021) | 590 | 520 | 435 | 224 | 171.8 | 103.4 |
| Far Cry 6 (2021) | 226 | 192.3 | 169.2 | 159.1 | 133.5 | 84.5 |
| Forza Horizon 5 (2021) | 334 | 214 | 196 | 127 | 113 | 85 |
| God of War (2022) | 240 | 204 | 170.8 | 121.9 | 108.4 | 77.1 |
| Tiny Tina's Wonderlands (2022) | 368 | 297 | 209 | 165.8 | 121.7 | 69.2 |
| F1 22 (2022) | 320 | 338 | 308 | 122.6 | 82.5 | 41.8 |
| The Quarry (2022) | 279 | 217 | 177.3 | 146.1 | 104.6 | 59 |
Intel Core i5-13600K mit Nvidia GeForce RTX 3090
| min. | mittel | hoch | max. | QHD | 4K | |
|---|---|---|---|---|---|---|
| GTA V (2015) | 187.5 | 187.5 | 186.7 | 154.9 | 148.5 | 180.7 |
| The Witcher 3 (2015) | 611 | 551 | 369 | 183.2 | 152.8 | |
| Dota 2 Reborn (2015) | 246.2 | 224.6 | 216.8 | 205.4 | 200.4 | |
| Final Fantasy XV Benchmark (2018) | 235 | 230 | 189.7 | 145.6 | 86.8 | |
| X-Plane 11.11 (2018) | 200 | 175.3 | 131.4 | 112.7 | ||
| Far Cry 5 (2018) | 240 | 212 | 201 | 188 | 177 | 108 |
| Strange Brigade (2018) | 679 | 487 | 398 | 348 | 265 | 158.4 |
| Shadow of the Tomb Raider (2018) | 269 | 240 | 234 | 220 | 167.1 | 96.4 |
| Far Cry New Dawn (2019) | 201 | 176 | 170 | 153 | 146 | 108 |
| Metro Exodus (2019) | 272 | 218 | 173 | 140.8 | 115.5 | 75.7 |
| Borderlands 3 (2019) | 223 | 195.3 | 176.3 | 156.3 | 128.3 | 73.2 |
| F1 2020 (2020) | 456 | 383 | 376 | 295 | 233 | 142.1 |
| F1 2021 (2021) | 512 | 474 | 399 | 223 | 171.8 | 101.8 |
| Far Cry 6 (2021) | 195.3 | 183.1 | 170.8 | 151.2 | 132.4 | 84.1 |
| God of War (2022) | 228 | 205 | 168.9 | 122 | 106.5 | 76.5 |
| GRID Legends (2022) | 287 | 261 | 232 | 156 | 177.8 | 115.1 |
| Tiny Tina's Wonderlands (2022) | 358 | 290 | 208 | 165.1 | 120.8 | 68.8 |
| F1 22 (2022) | 322 | 373 | 432 | 128.1 | 84.1 | 42.4 |
| The Quarry (2022) | 270 | 213 | 177.9 | 145.9 | 105 | 59.4 |
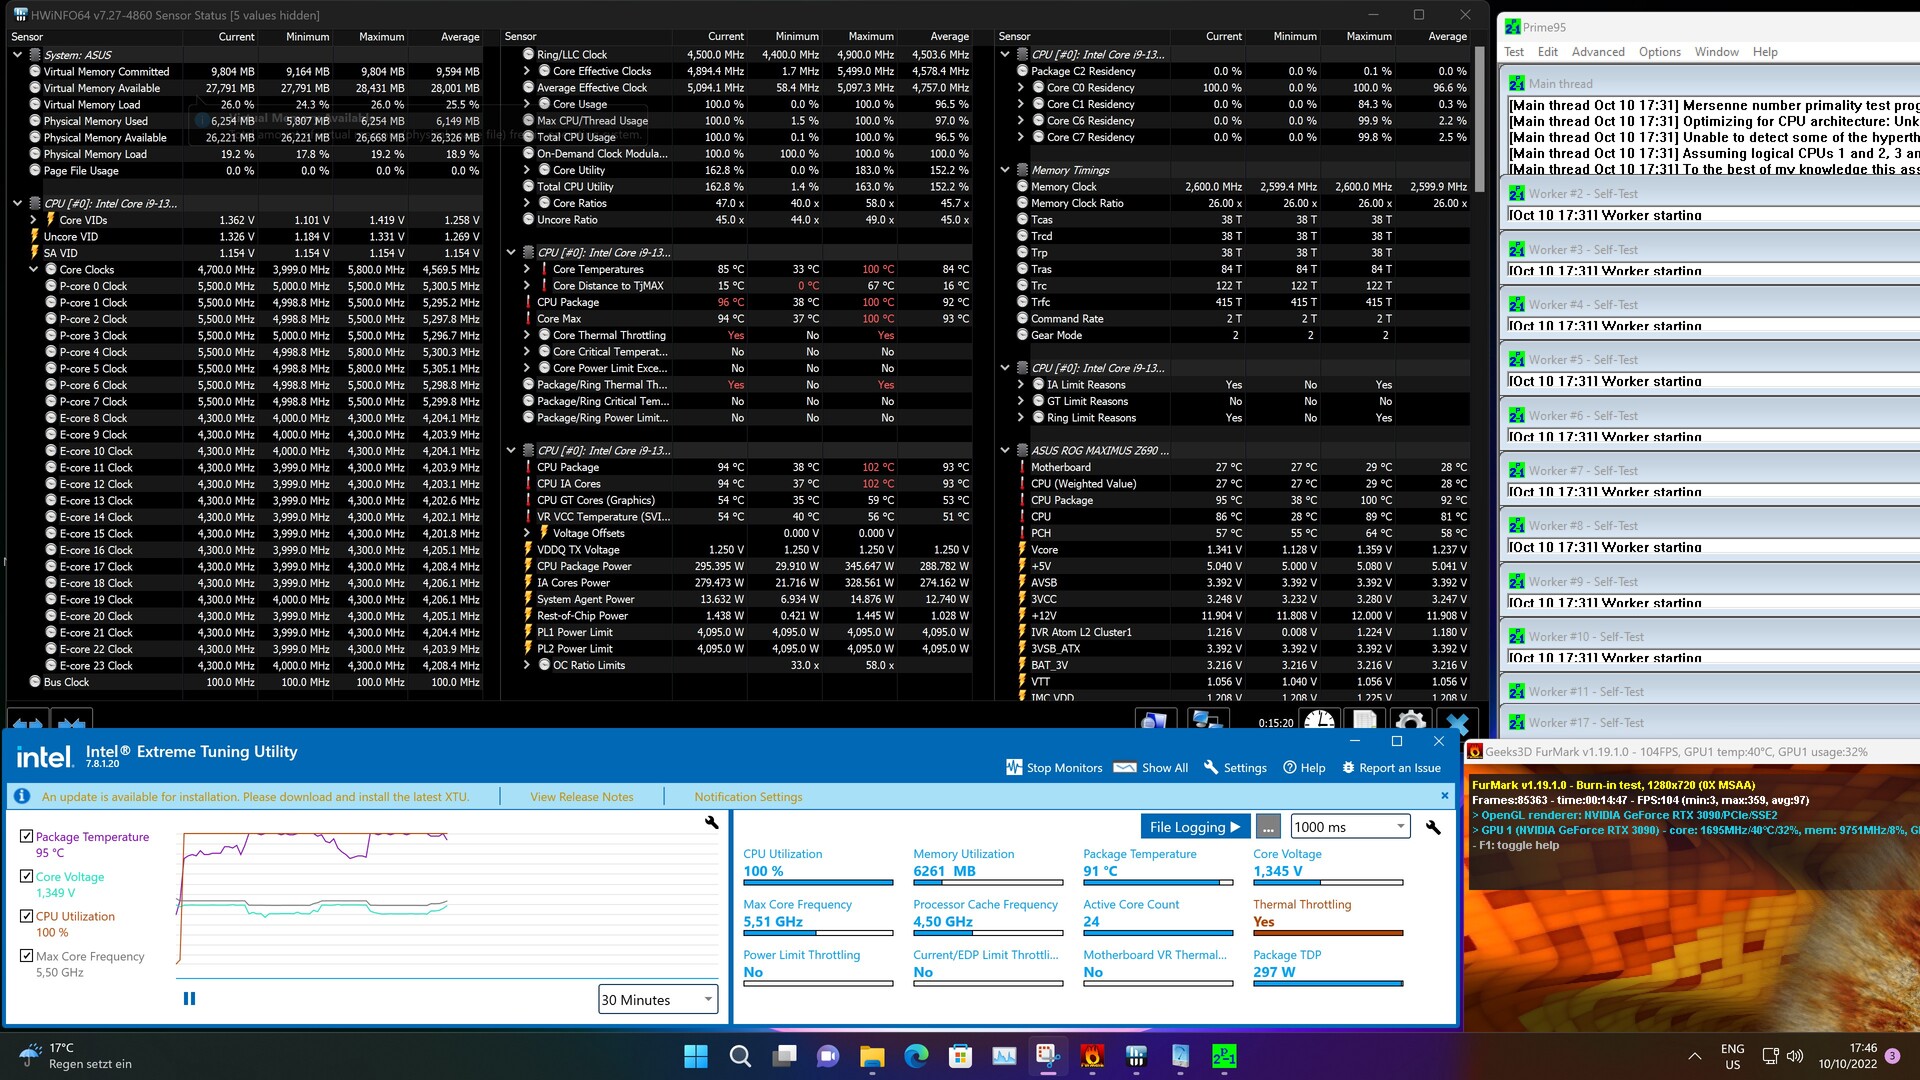
Energieverbrauch
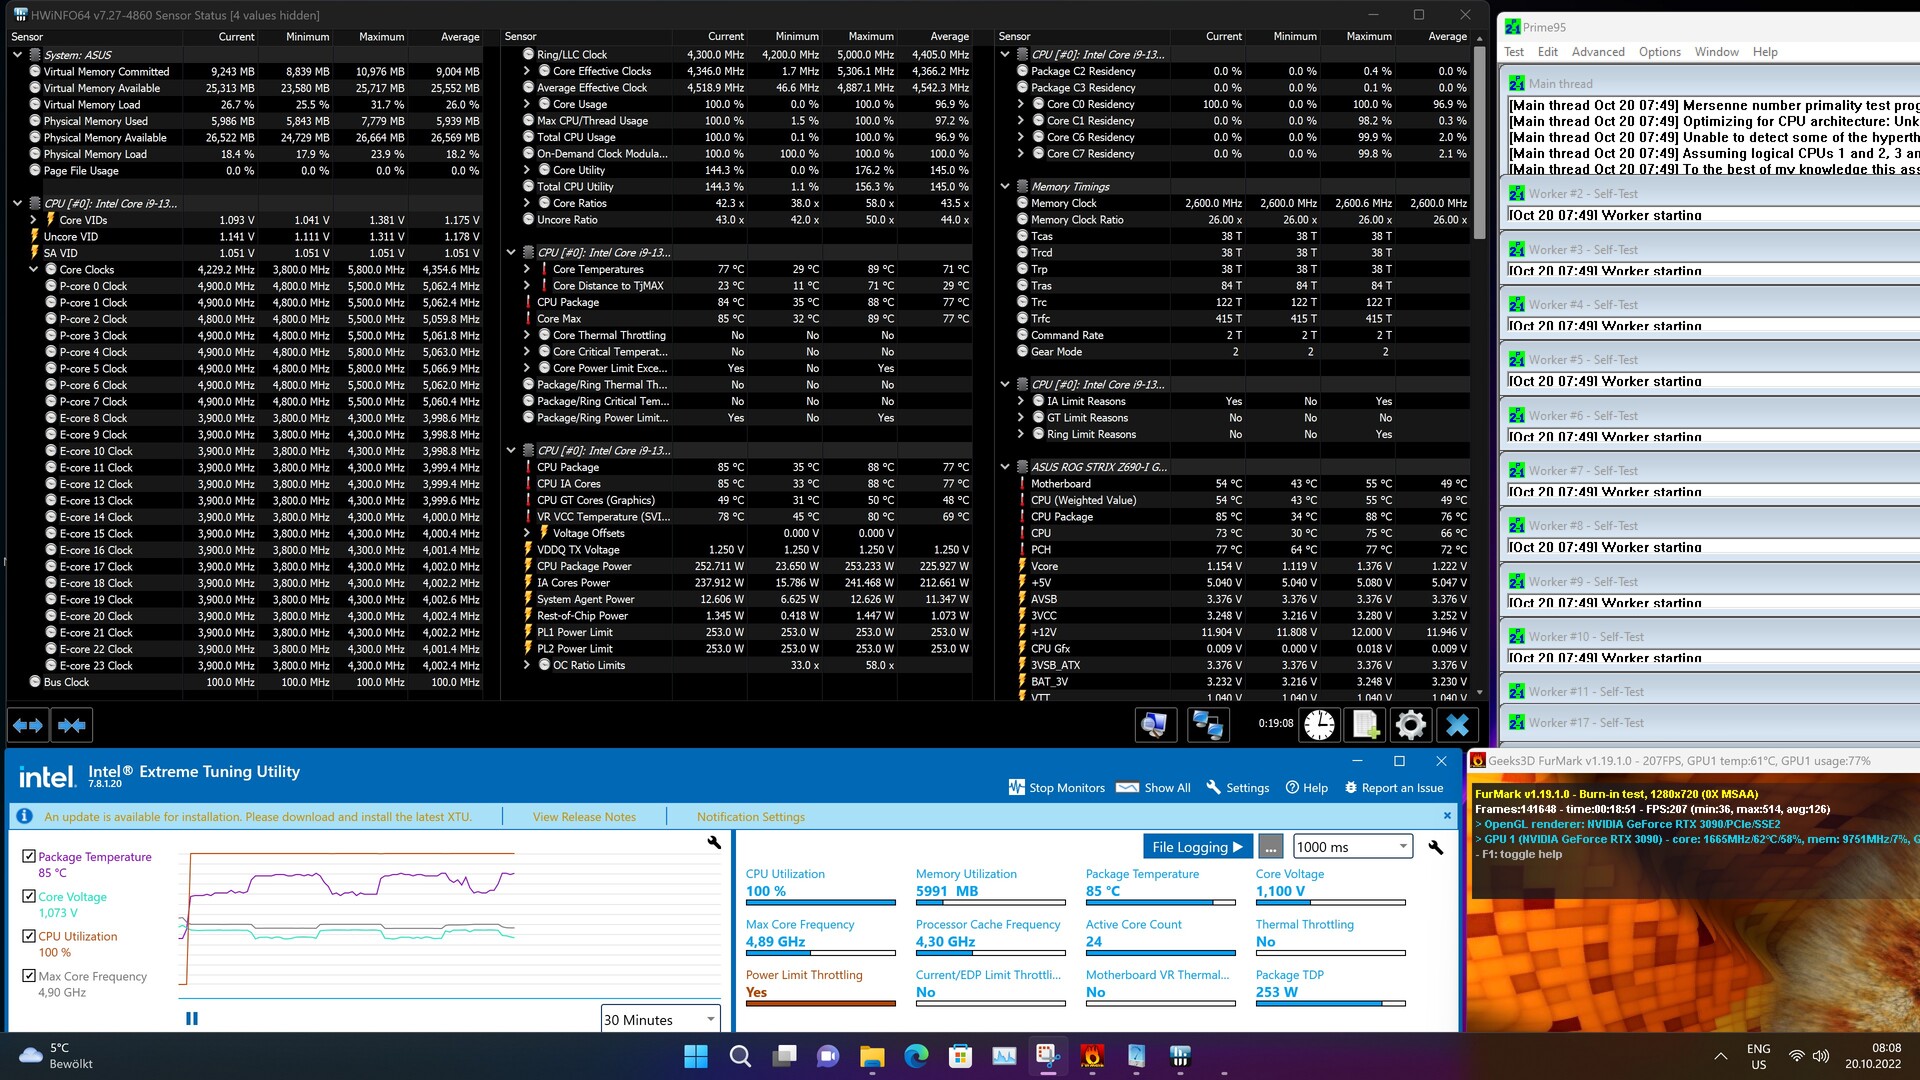
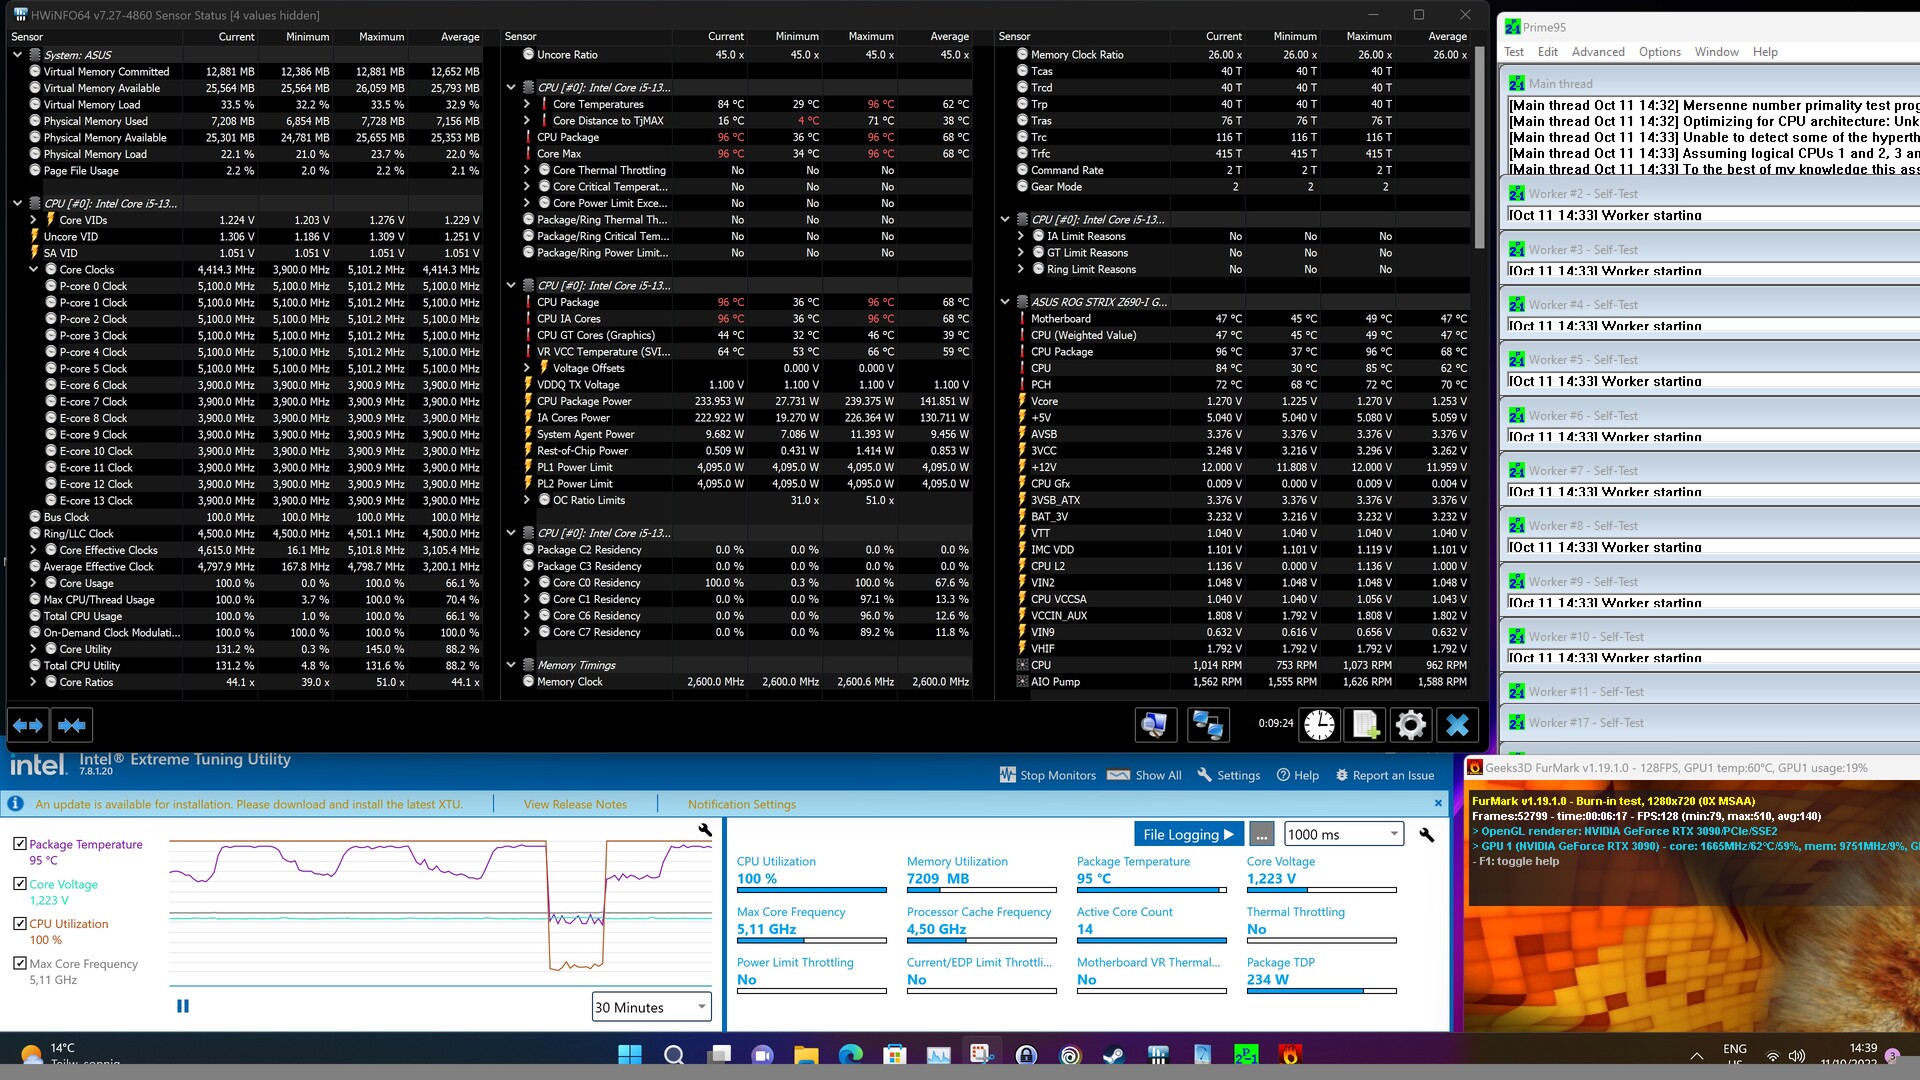
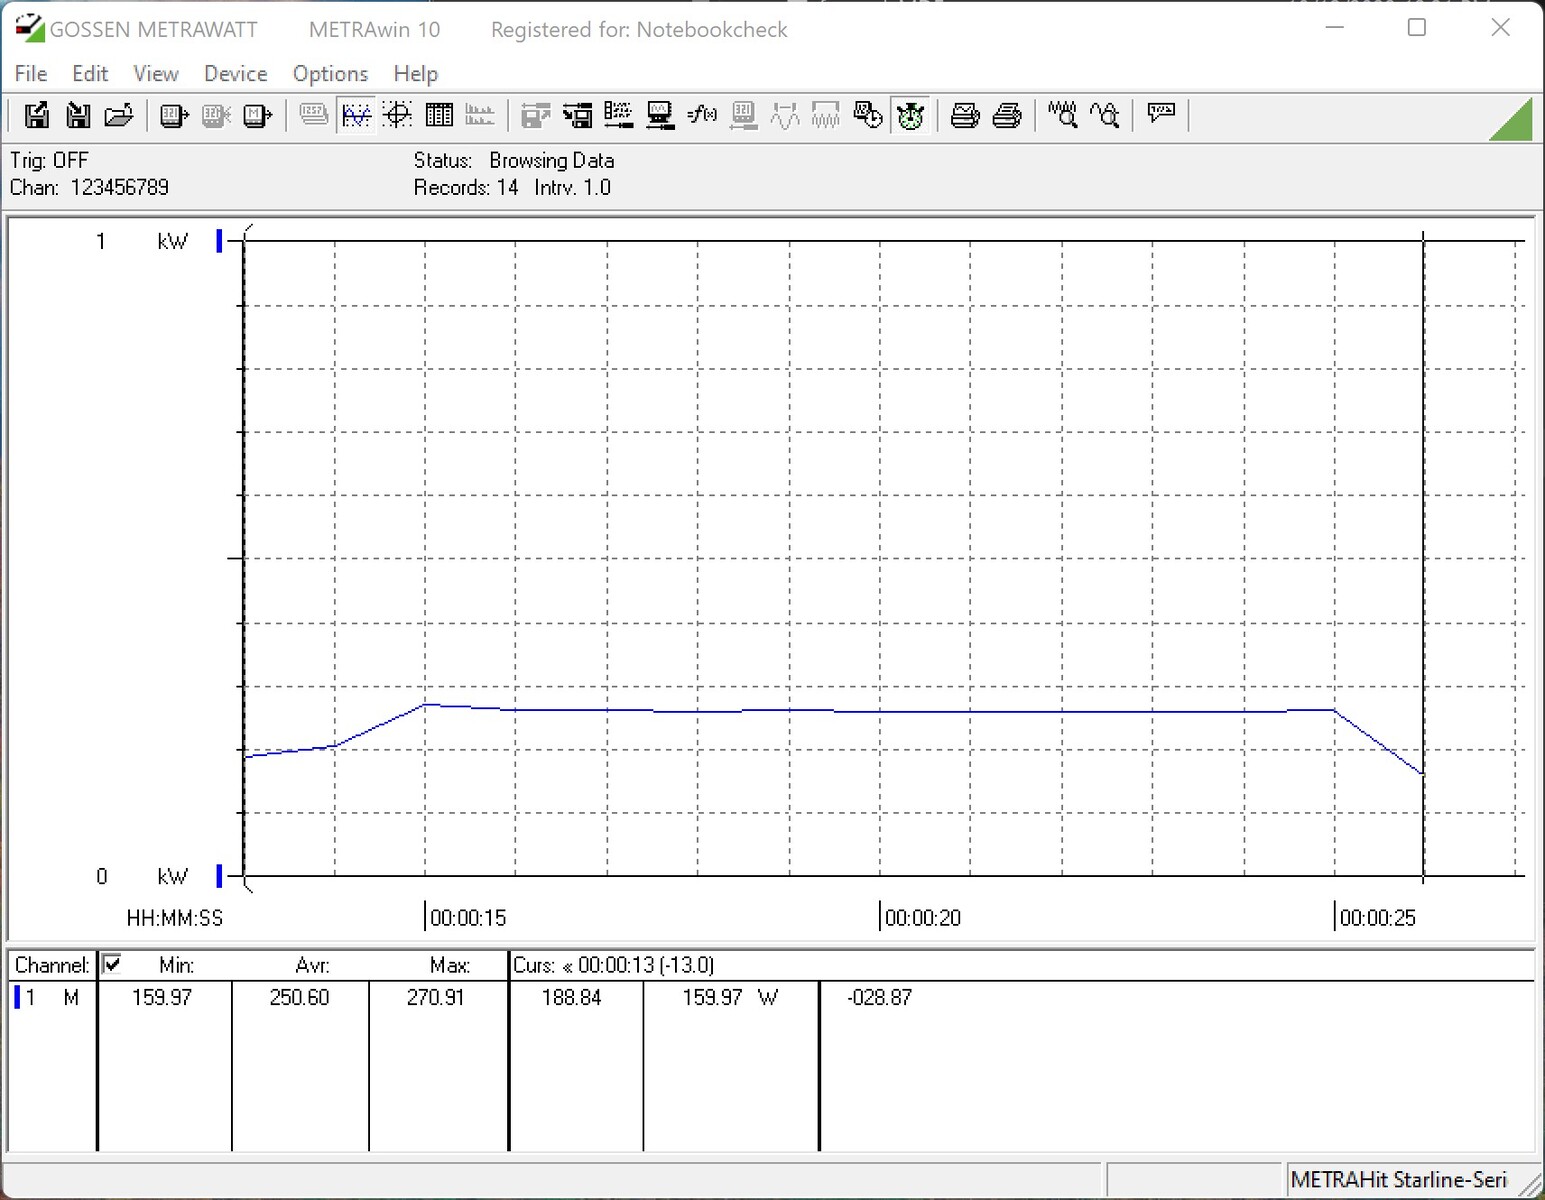
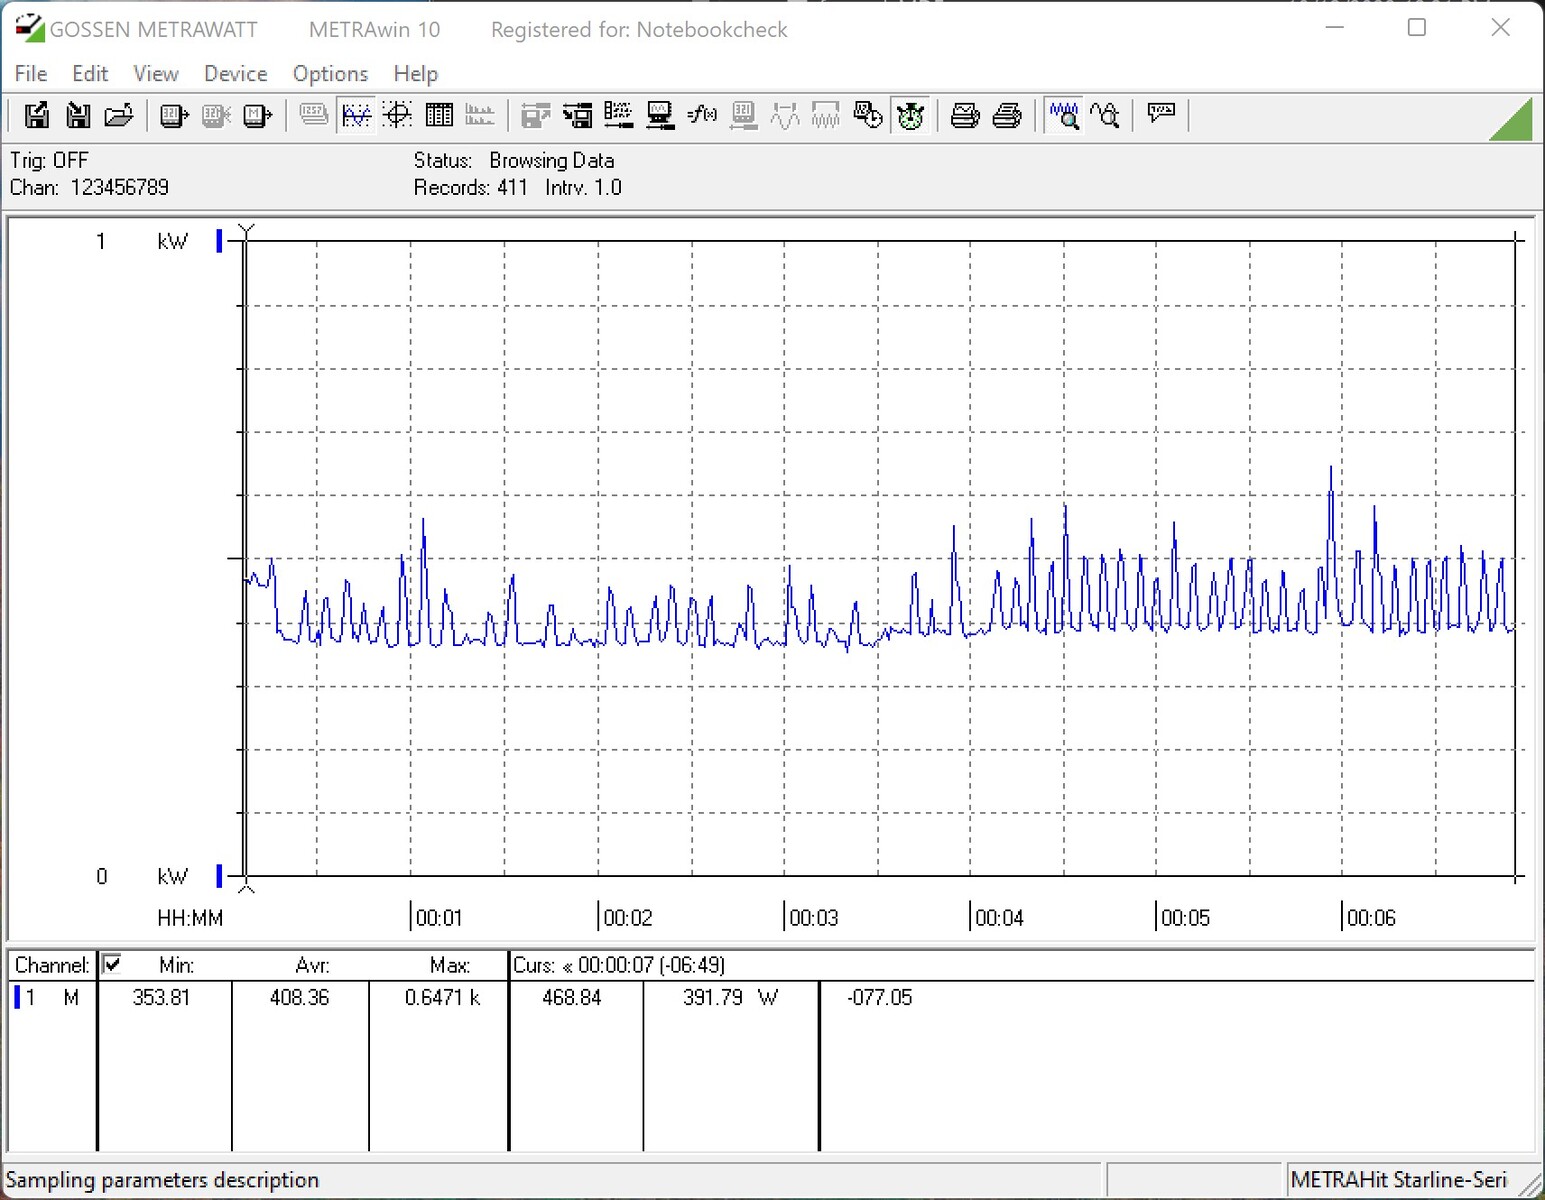
Laut den technischen Daten bieten die Prozessoren weiterhin eine TDP von 125 Watt. Dabei bezieht man sich auf den PL1-Wert. Der PL2-Wert gibt an, wie viel Watt der Prozessor unter Volllast verbrauchen darf, wenn alle Voraussetzungen erfüllt sind. Sind alle Restriktionen im BIOS-aktiviert, so darf der Intel Core i9-13900K maximal 253 Watt verbrauchen. Beim Intel Core i5-13600K sind es immerhin noch 181 Watt. Werden alle Restriktionen deaktiviert, so gibt es keine direkte Einschränkung der Leistungsaufnahme, was im Umkehrschluss bedeutet, dass nun nur noch das Temperatur-Limit die CPU einbremsen kann. Somit ist es auch nicht verwunderlich, dass wir bei unseren Stresstests immer wieder die 100-°C-Marke knacken - mit dokumentierten 345 Watt beim Core i9-13900K und 240 Watt beim Core i5-13600K. Damit steigt die Leistungsaufnahme bei Verwendung einer guten Kühlung ordentlich.
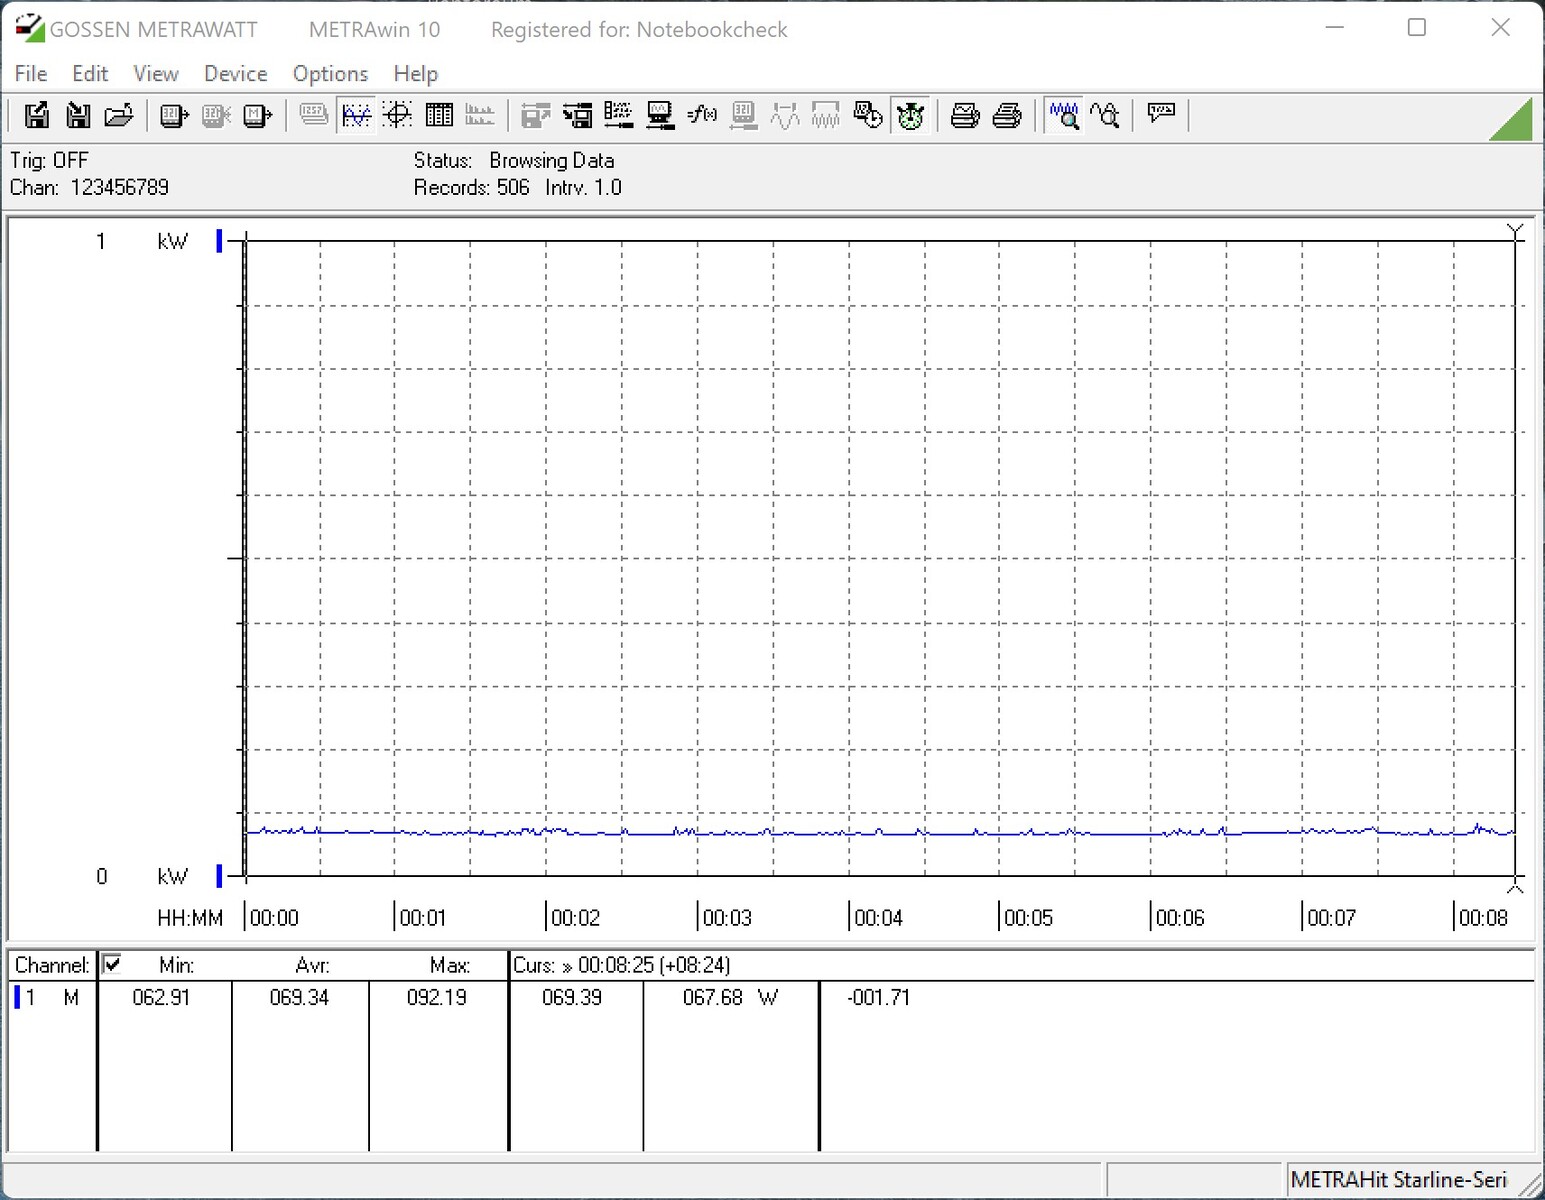
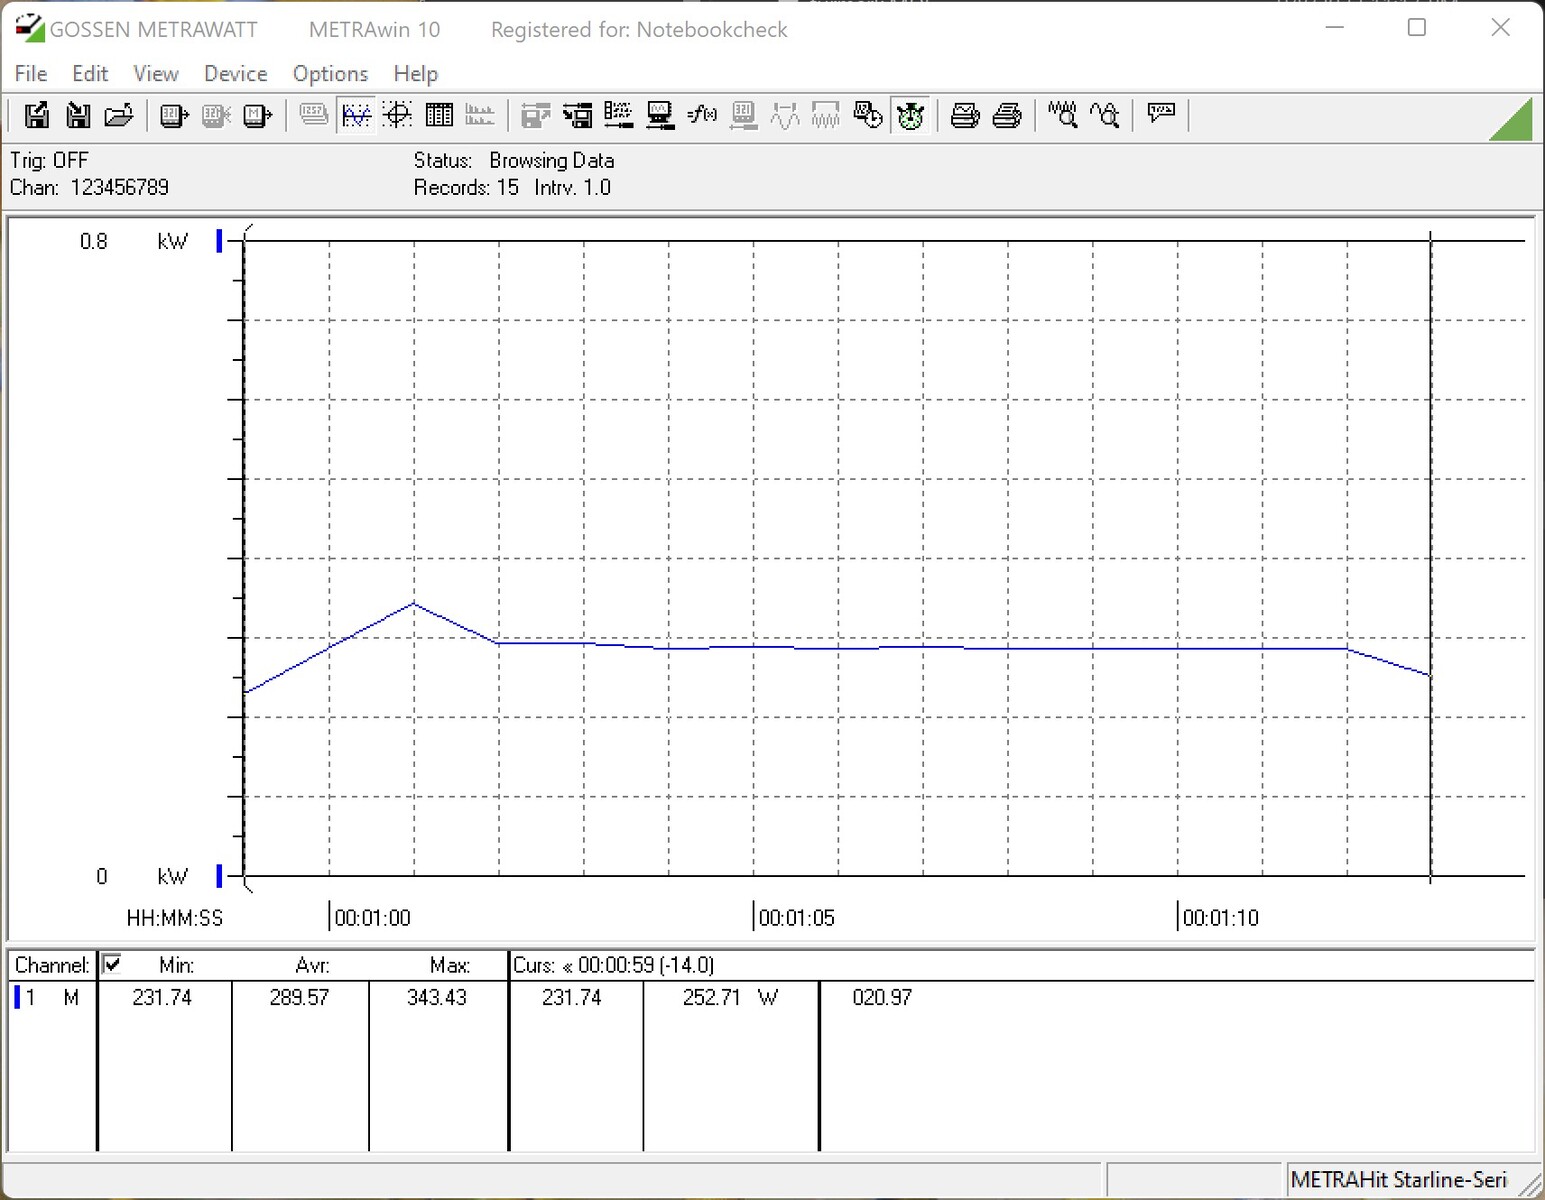
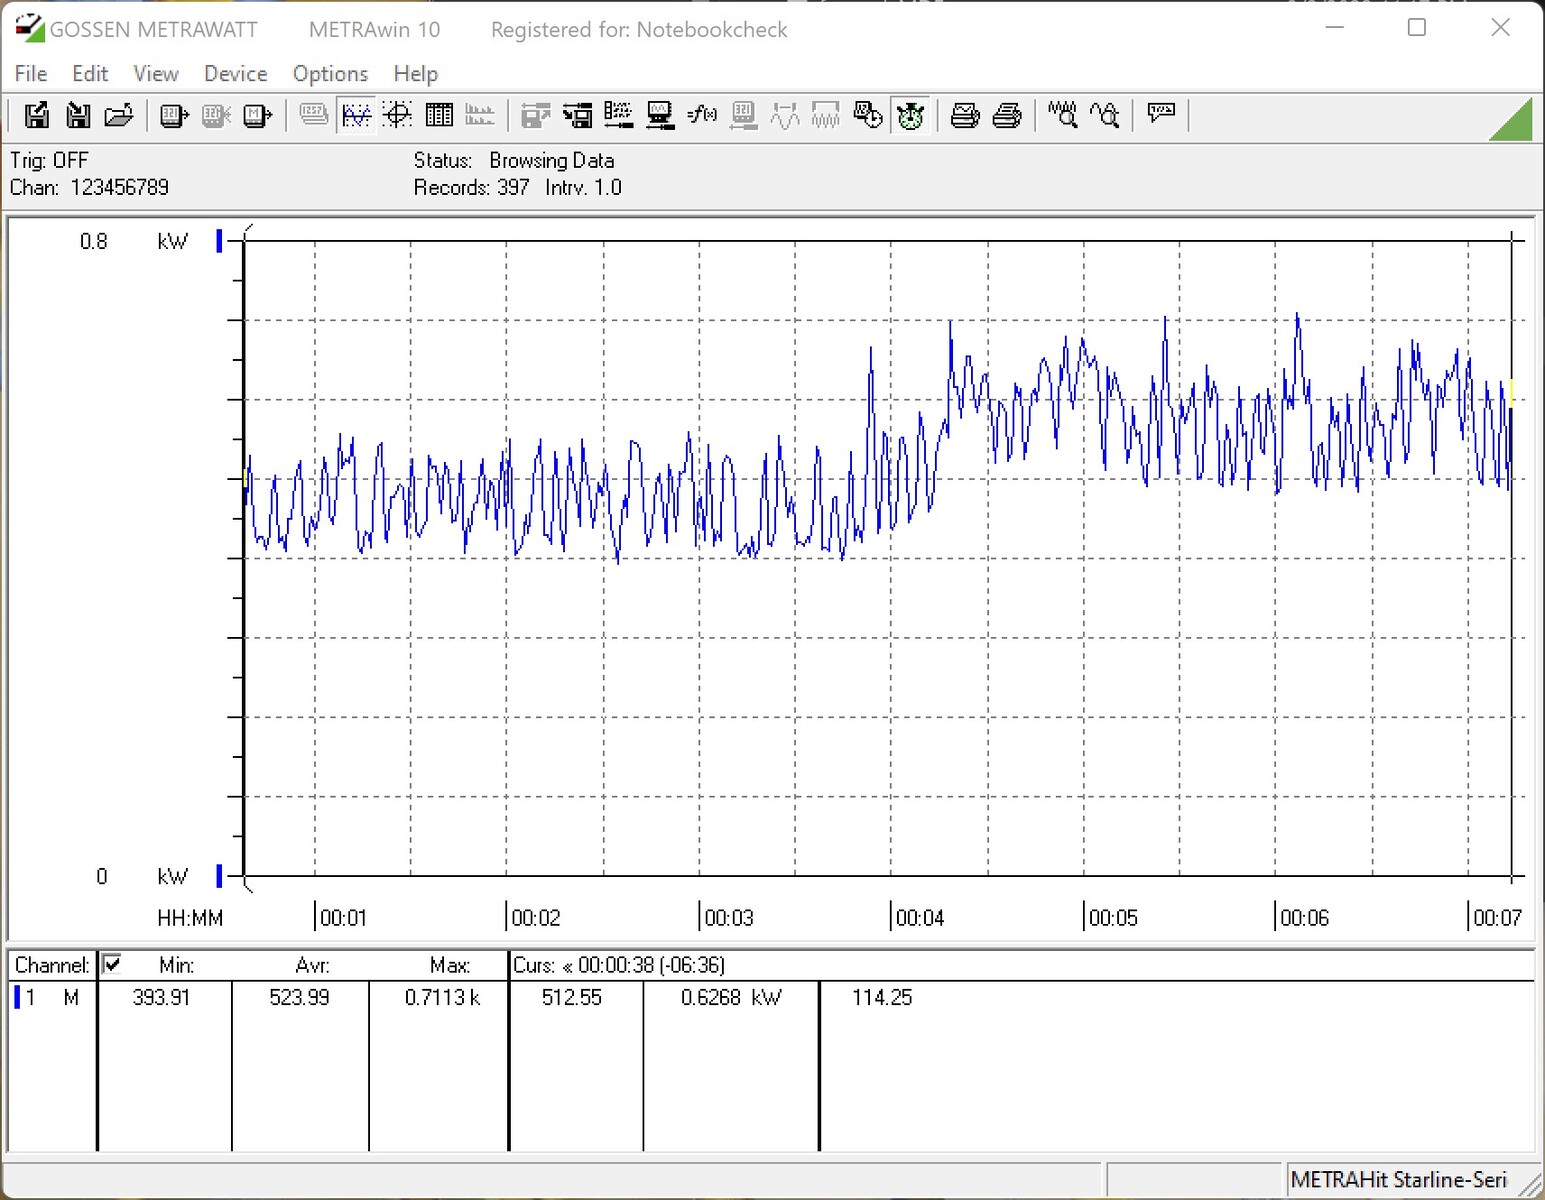
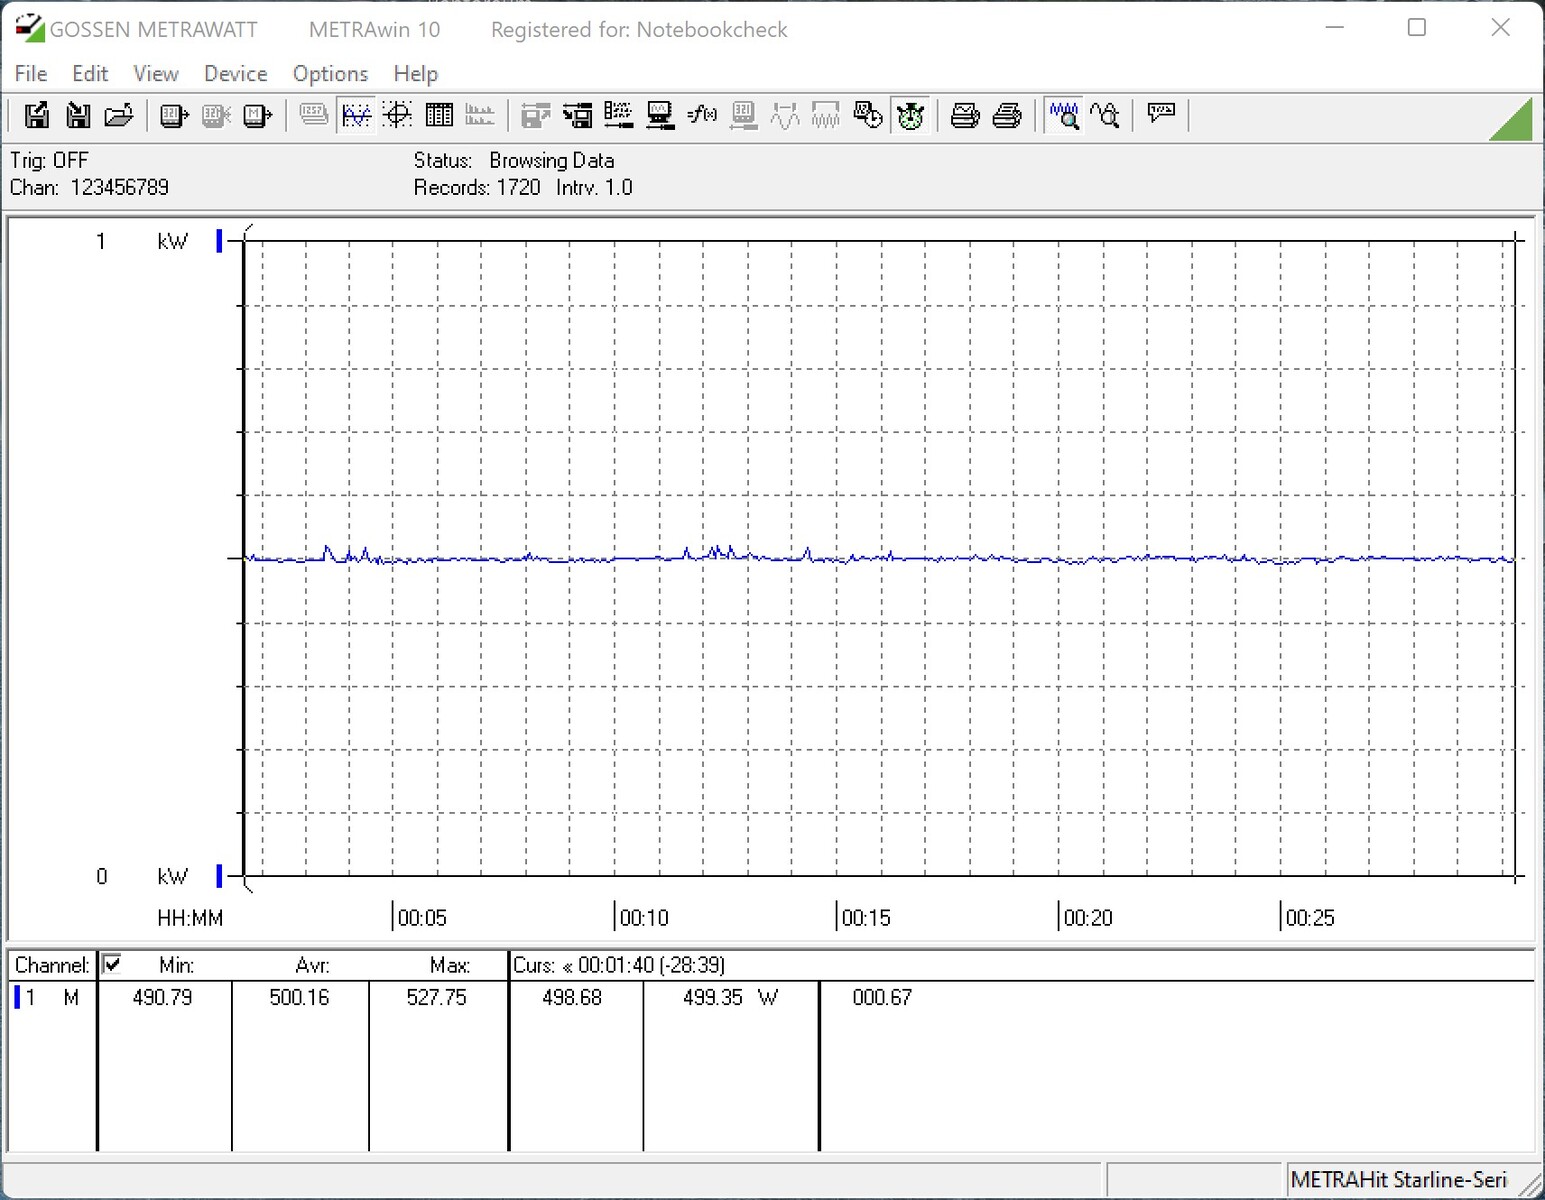
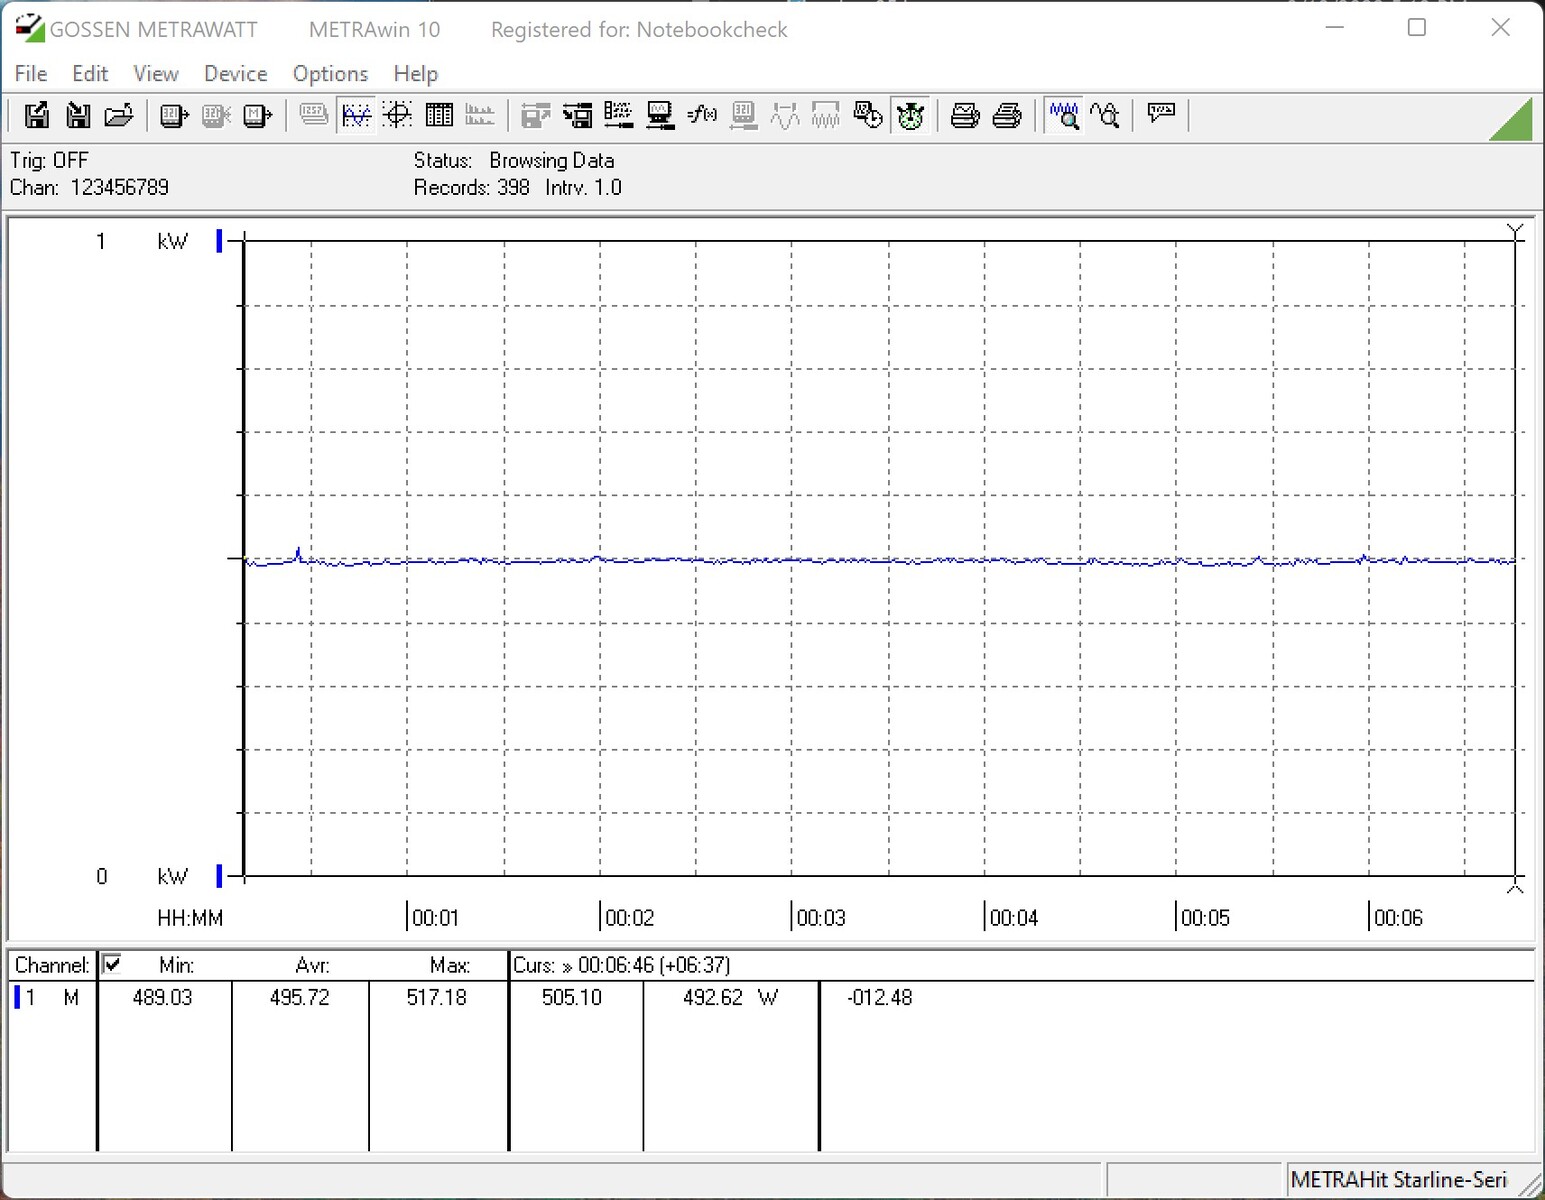
Mit 480 Watt halten wir die Leistungsaufnahme des Testsystems beim Cinebench-R15-Multi-Test fest. Das sind 48 Prozent oder umgerechnet knapp 160 Watt mehr, die das Netzteil im Vergleich zum Intel Core i9-12900K liefern muss. Beim Intel Core i5-13600K ist der Zuwachs mit 39 Prozent - oder anders ausgedrückt plus 80 Watt - ebenfalls nicht von der Hand zu weisen. Beim Spielen relativiert sich der Leistungsverbrauch etwas. Dennoch liegen im Schnitt mindestens 500 Watt an.
Um die Raptor-Lake-Prozessoren zu bändigen, bedarf es einer sehr guten Kühlung. Mit einem Custom-Wasserkühlungs-Kreislauf kann man die neuen Raptoren
auch entfesselt arbeiten lassen, vorausgesetzt man hat kein Problem mit hohen Temperaturen. Wer jedoch auf Nummer sicher gehen will, sollte das PL2 aktivieren. Dann ist bei maximal 253 respektive 181 Watt Schluss. Somit empfehlen wir, auf jeden Fall das Power-Limit der Raptor-Lake-Prozessoren einzuhalten. Ein deutlich geringerer Energiebedarf und niedrige Temperaturen sprechen einfach für sich. Rein leistungstechnisch gibt es ebenfalls keinen Nachteil, wie wir bereits weiter oben im Artikel erwähnt haben.
Intel Core i9-13900K - offenes Power-Limit

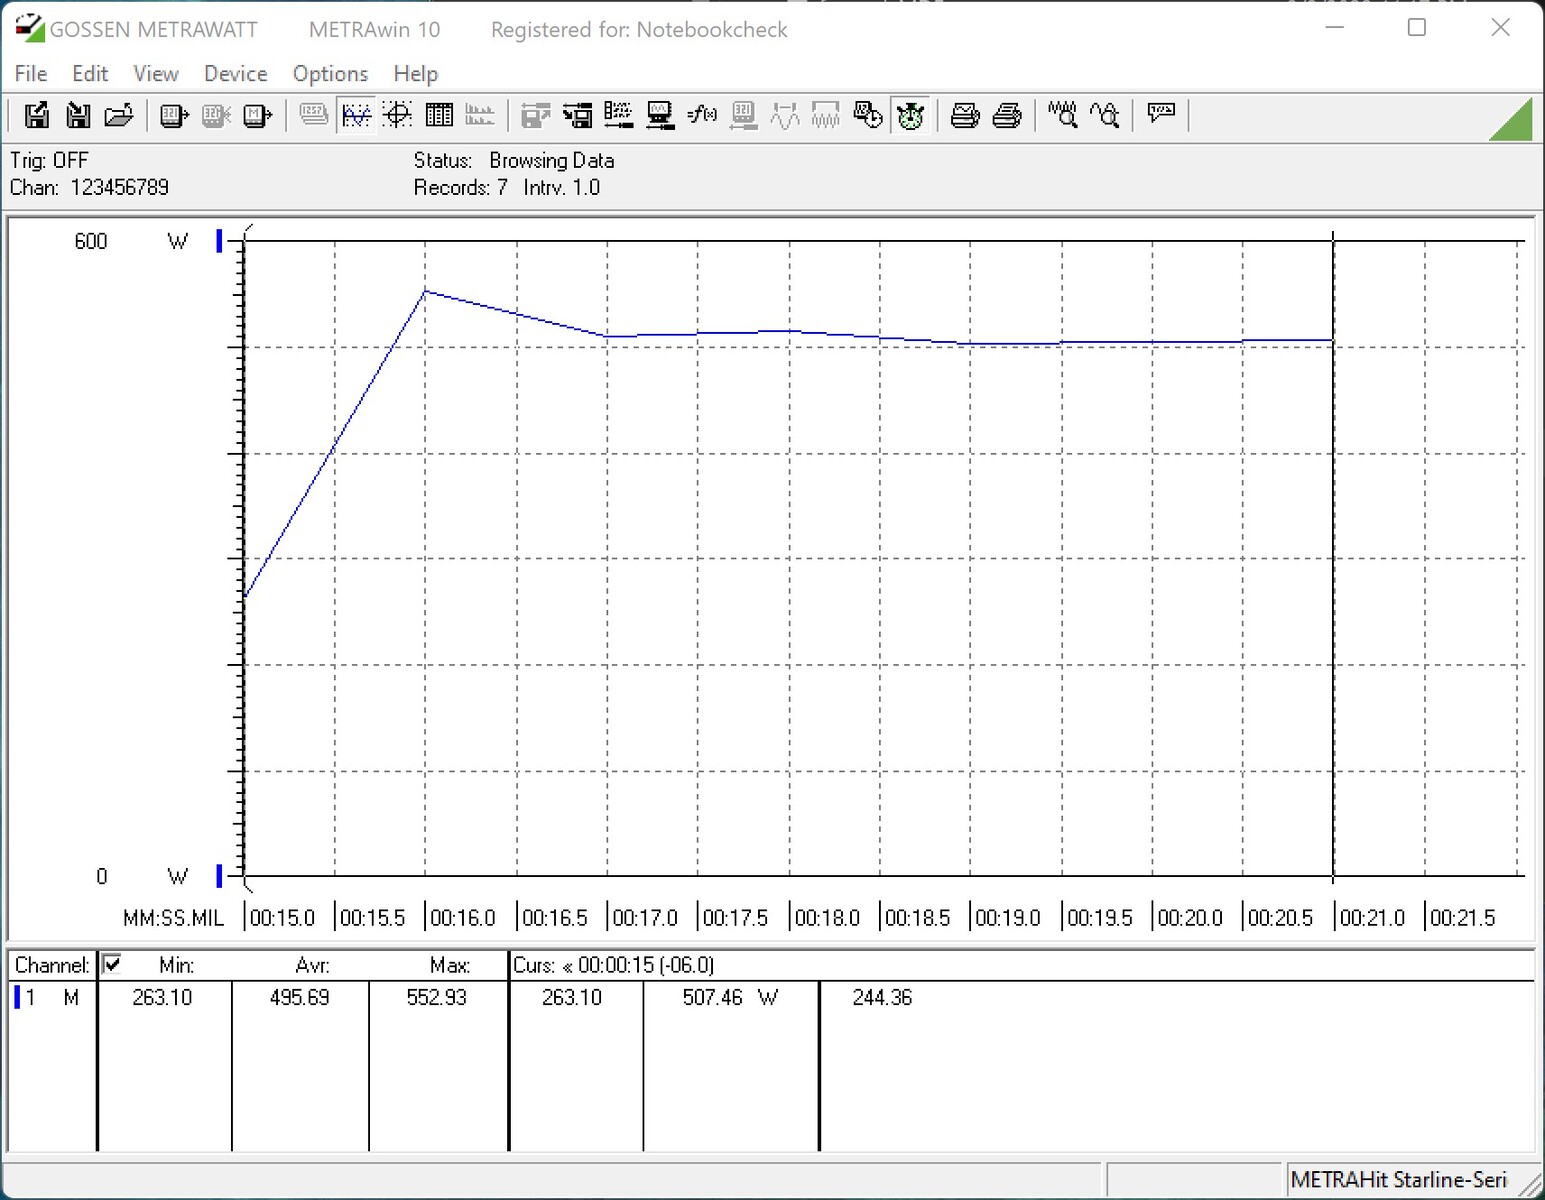
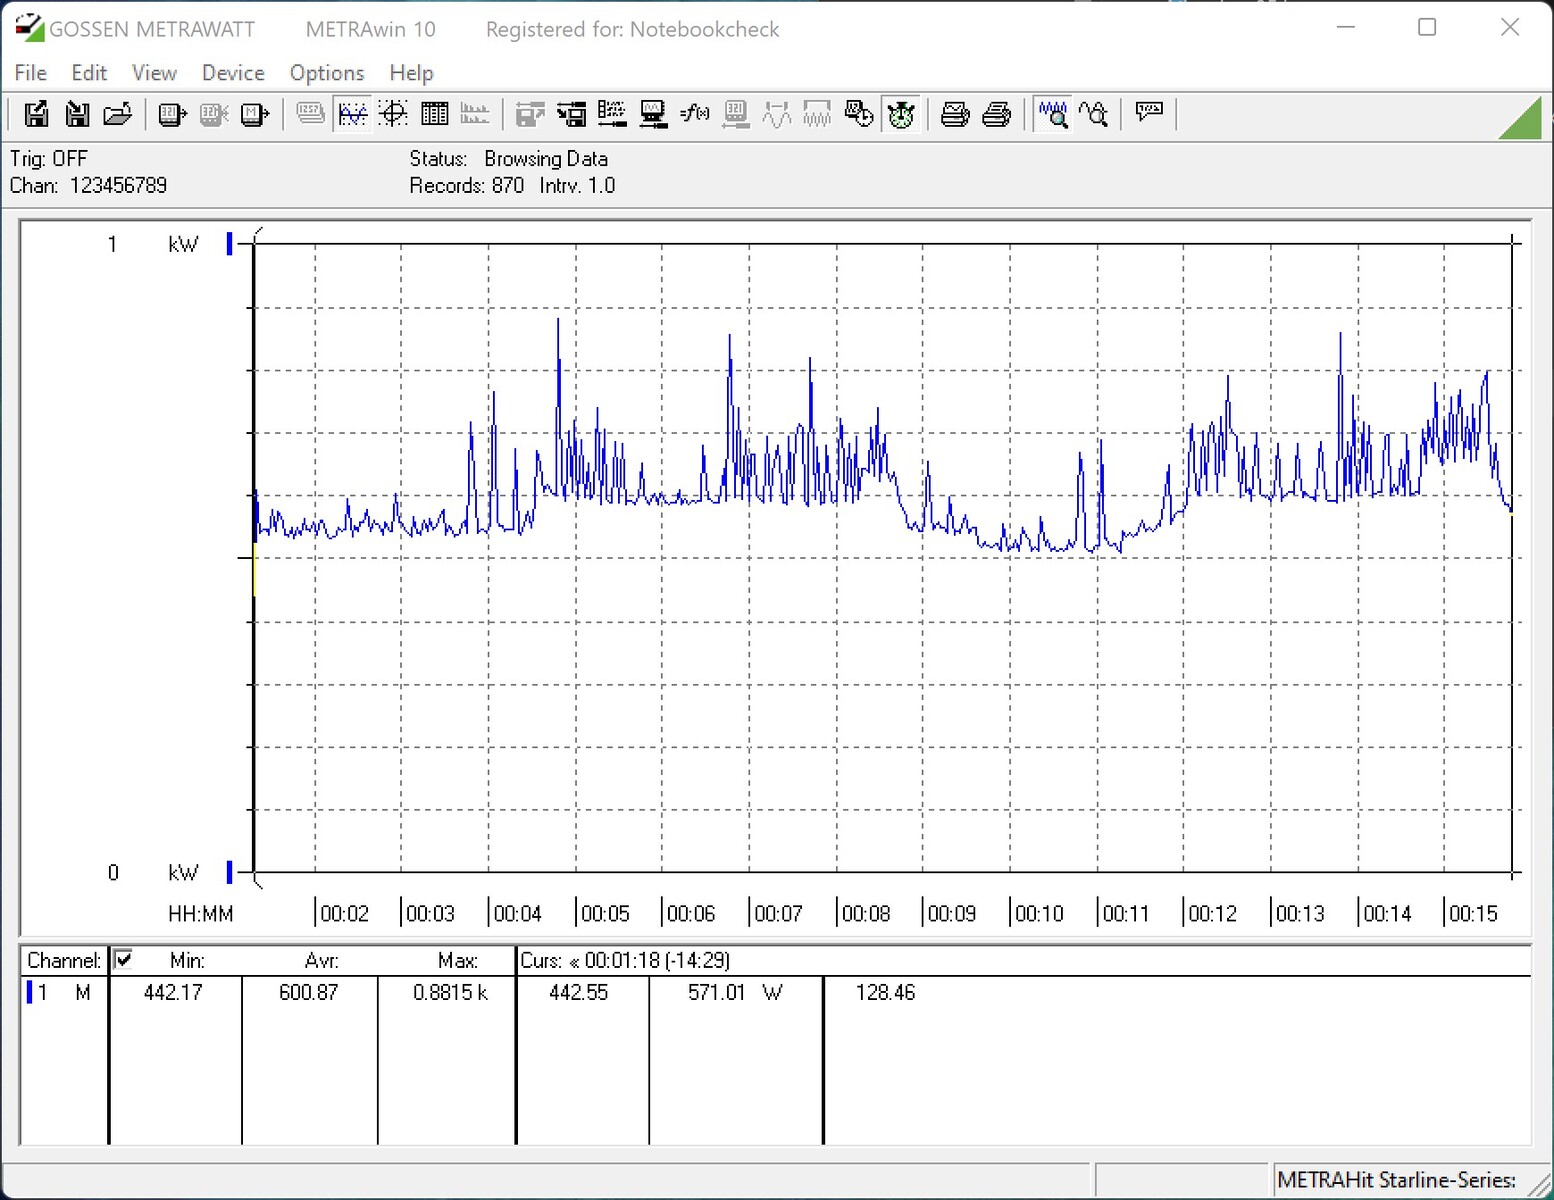
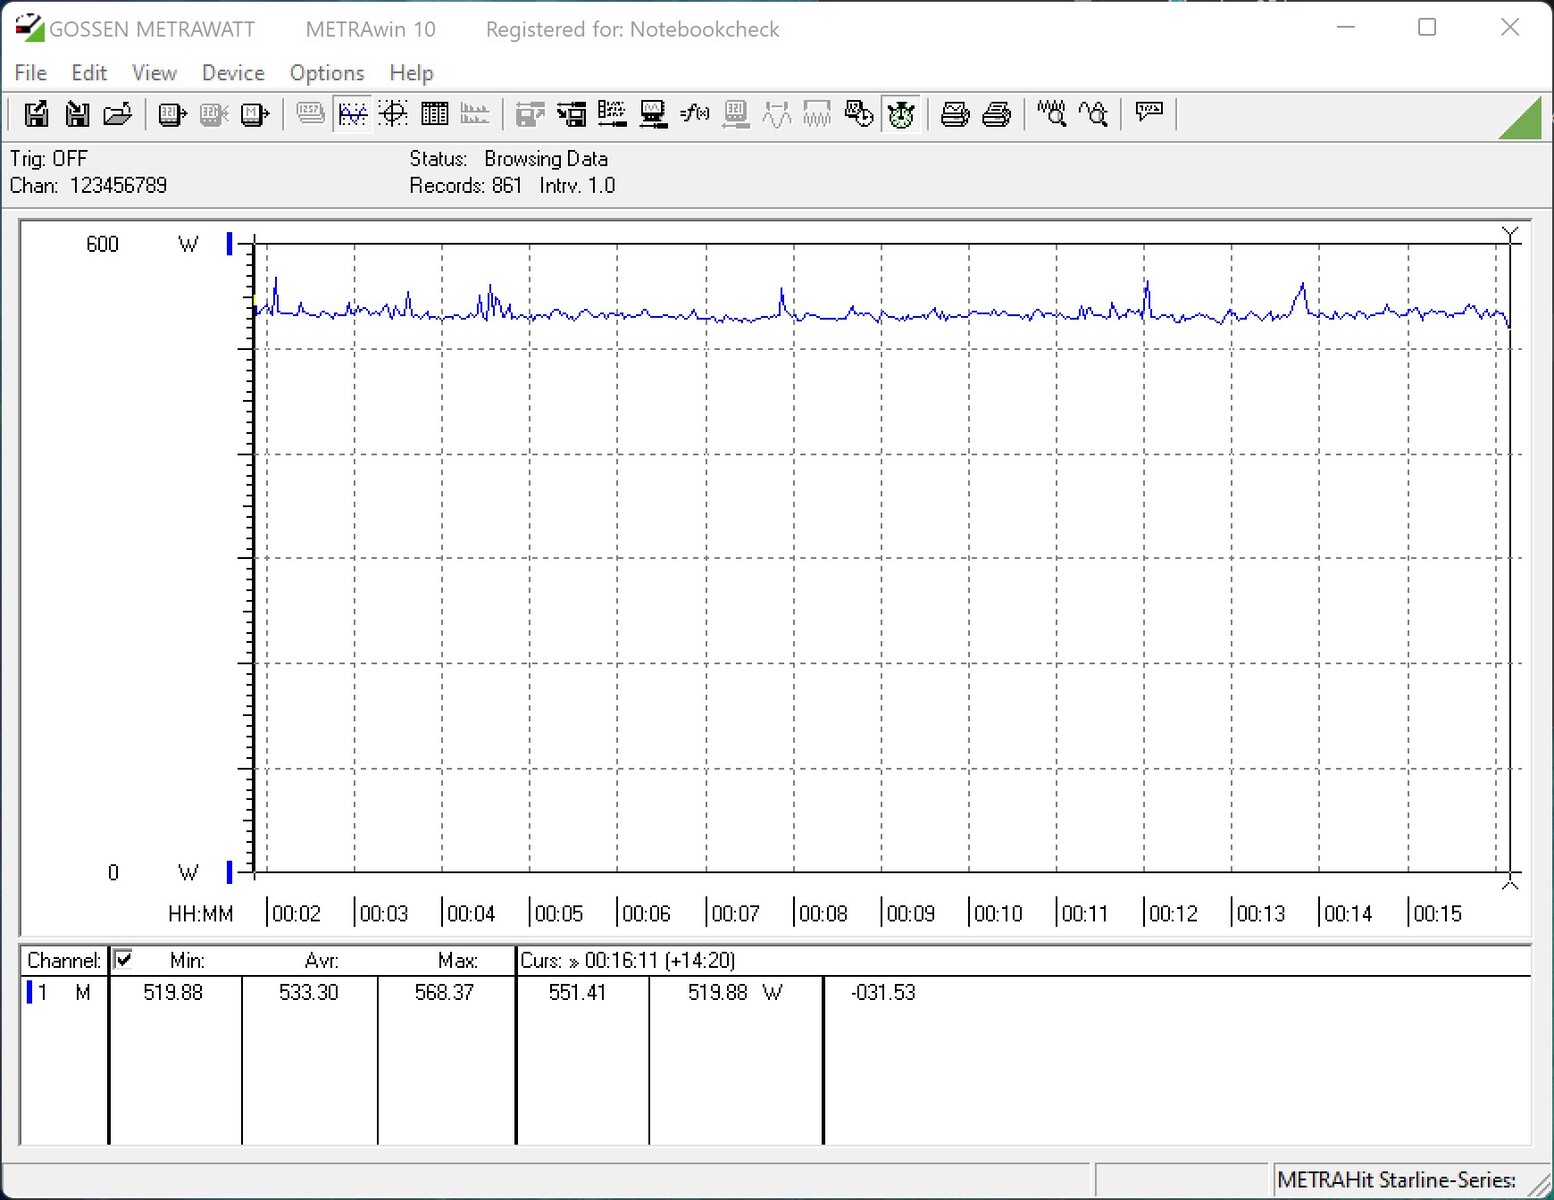
Intel Core i9-13900K - Power-Limit 253 Watt
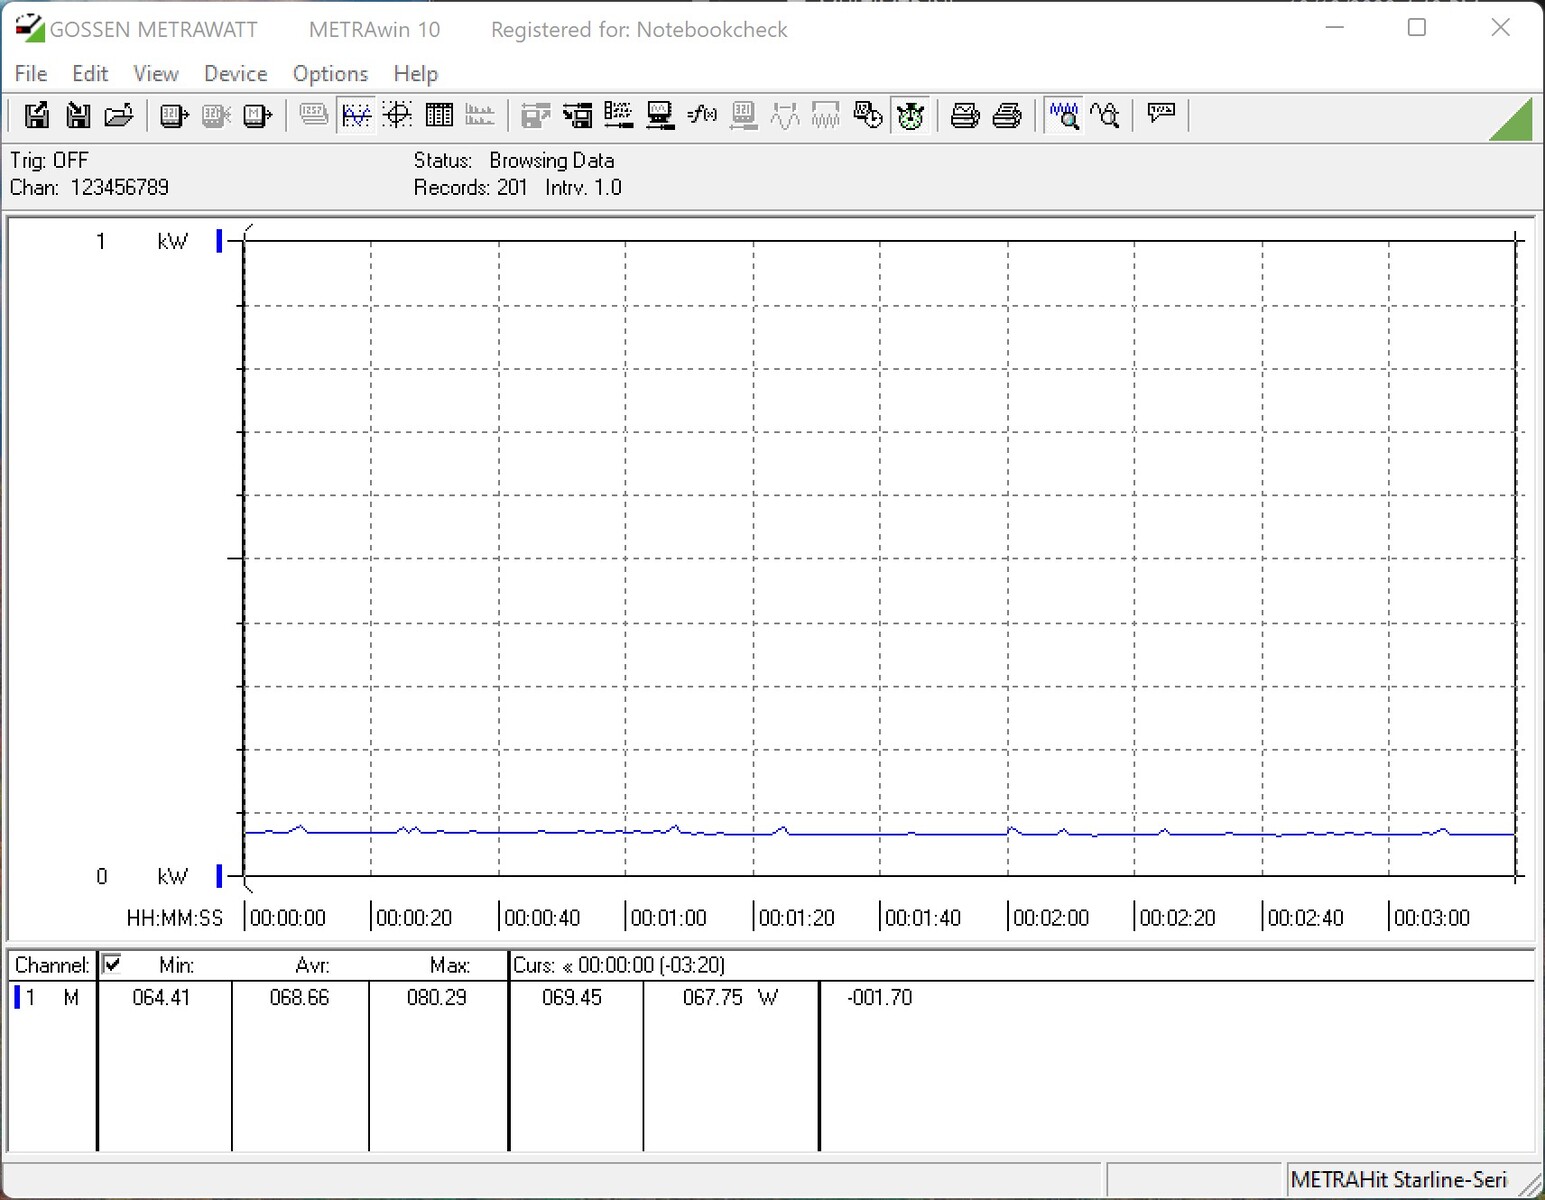
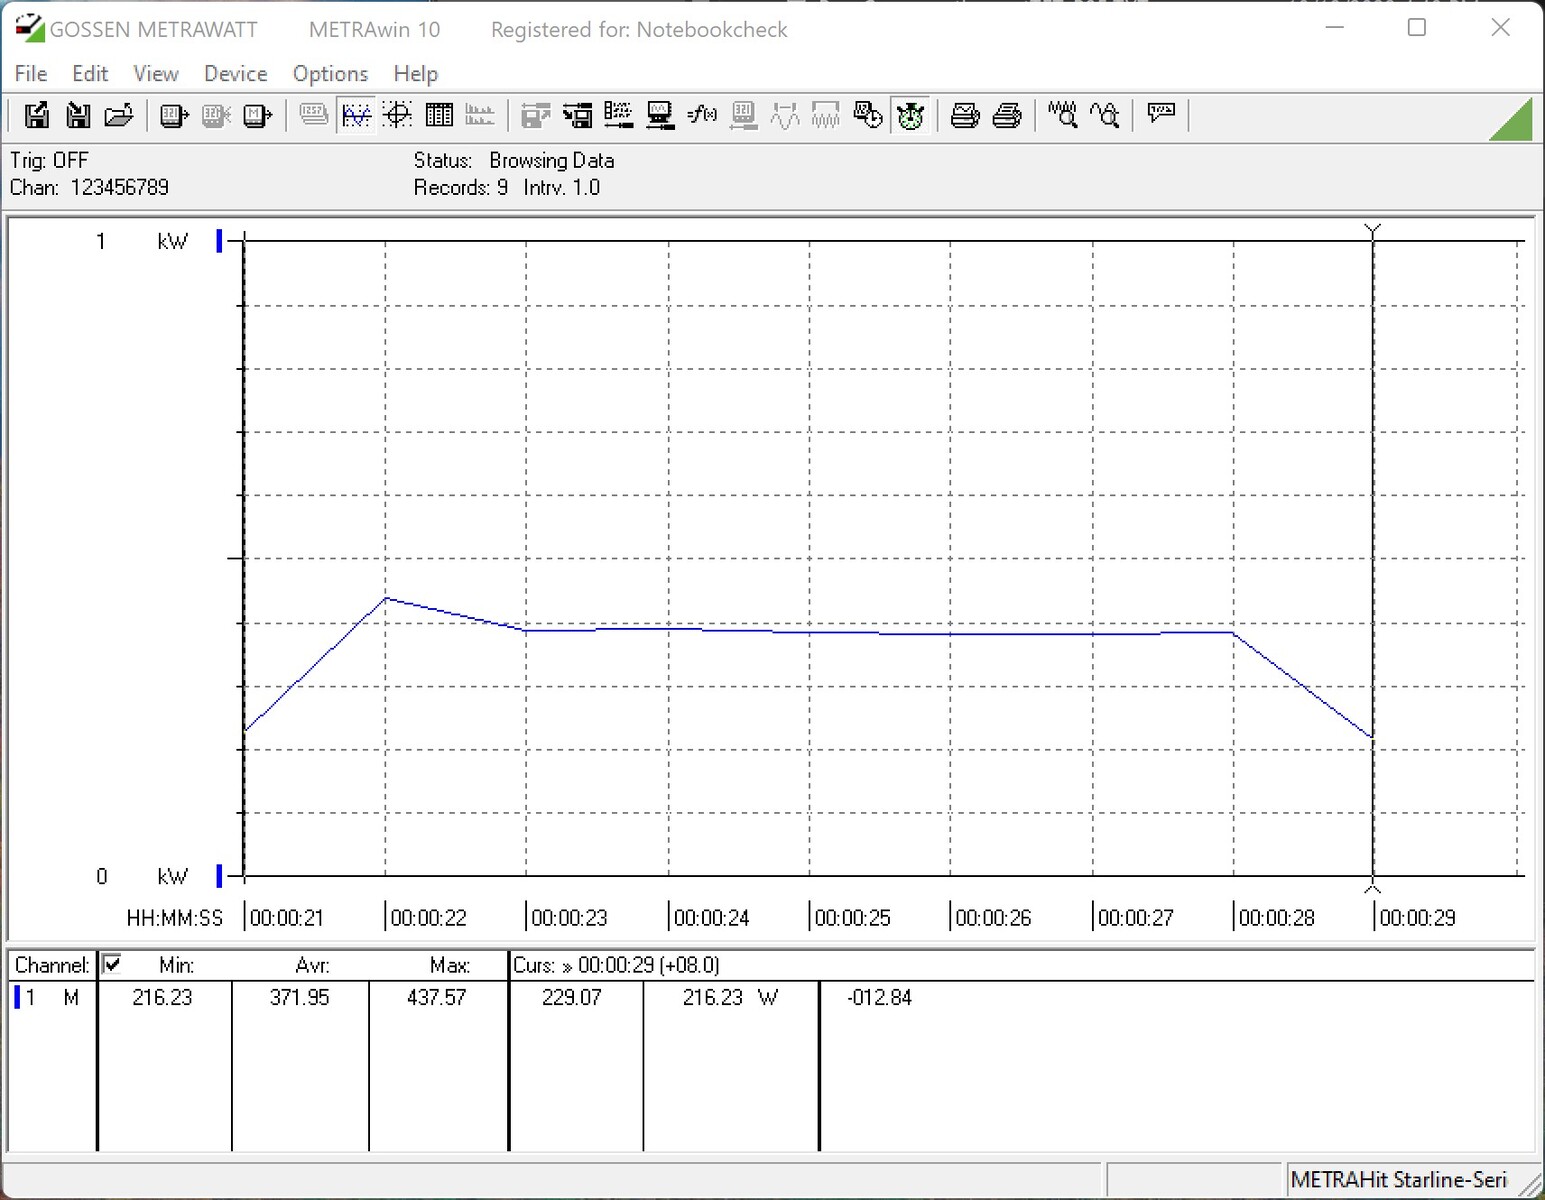
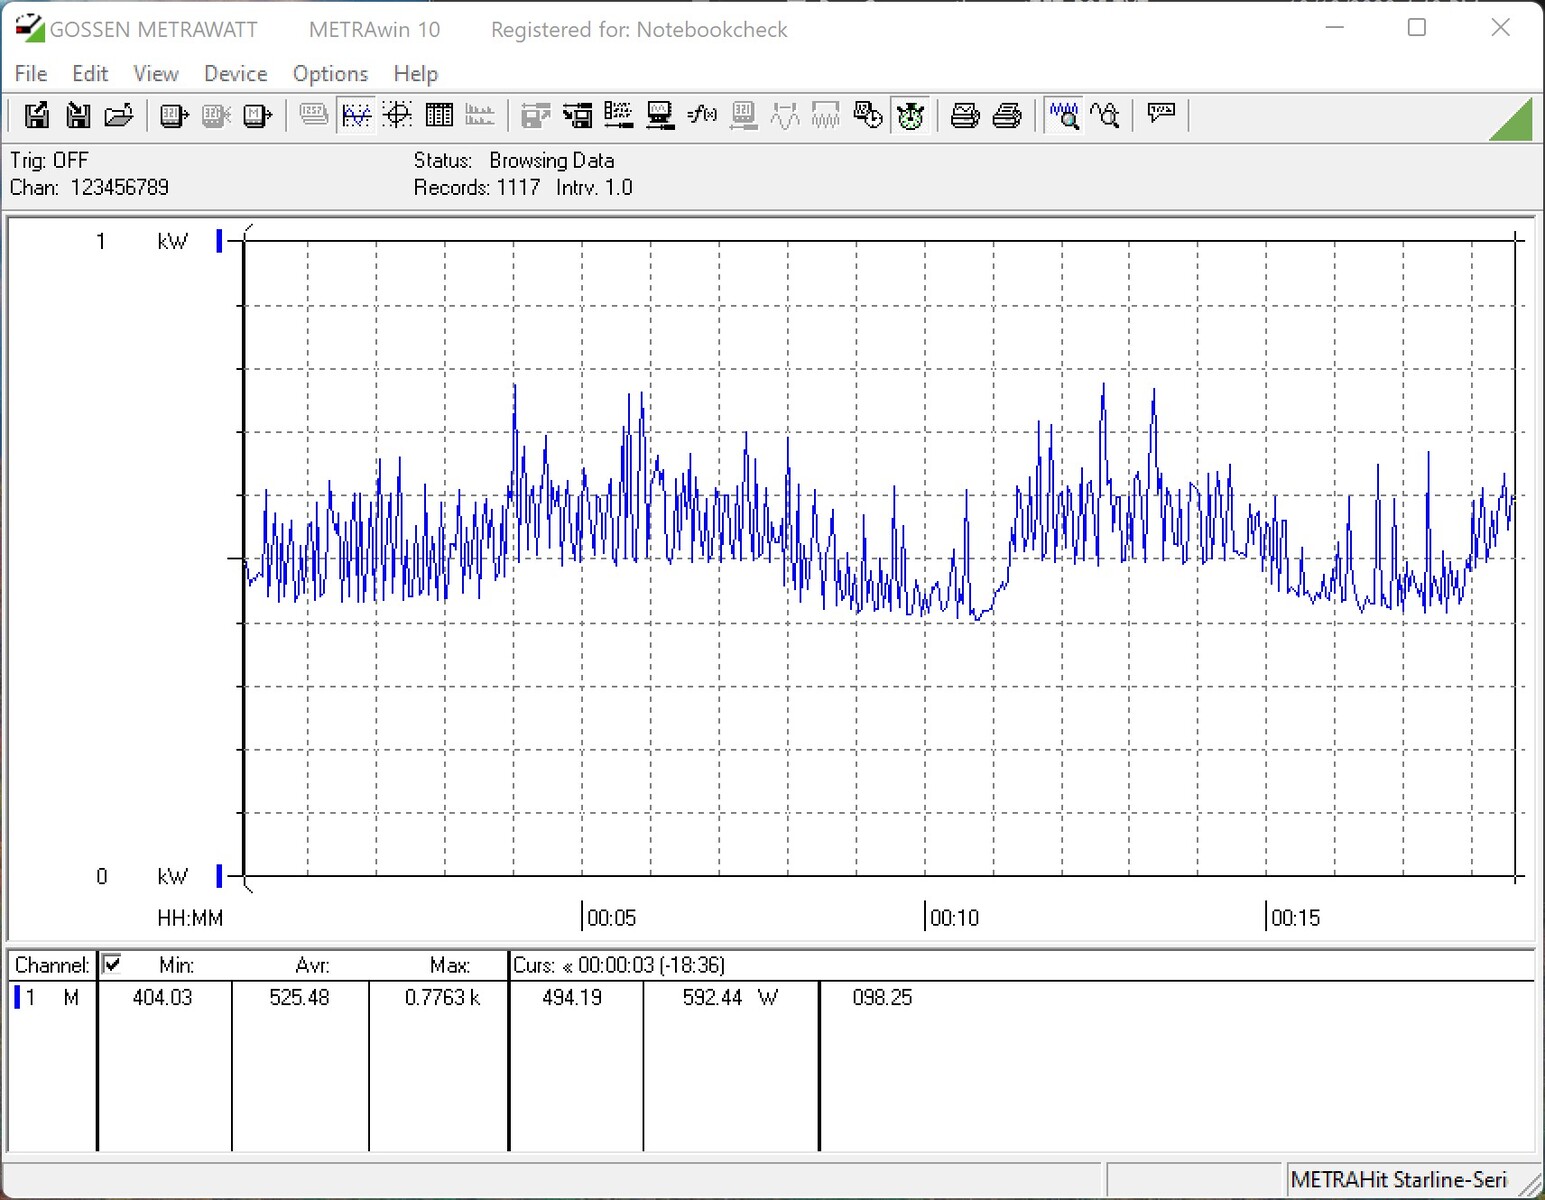
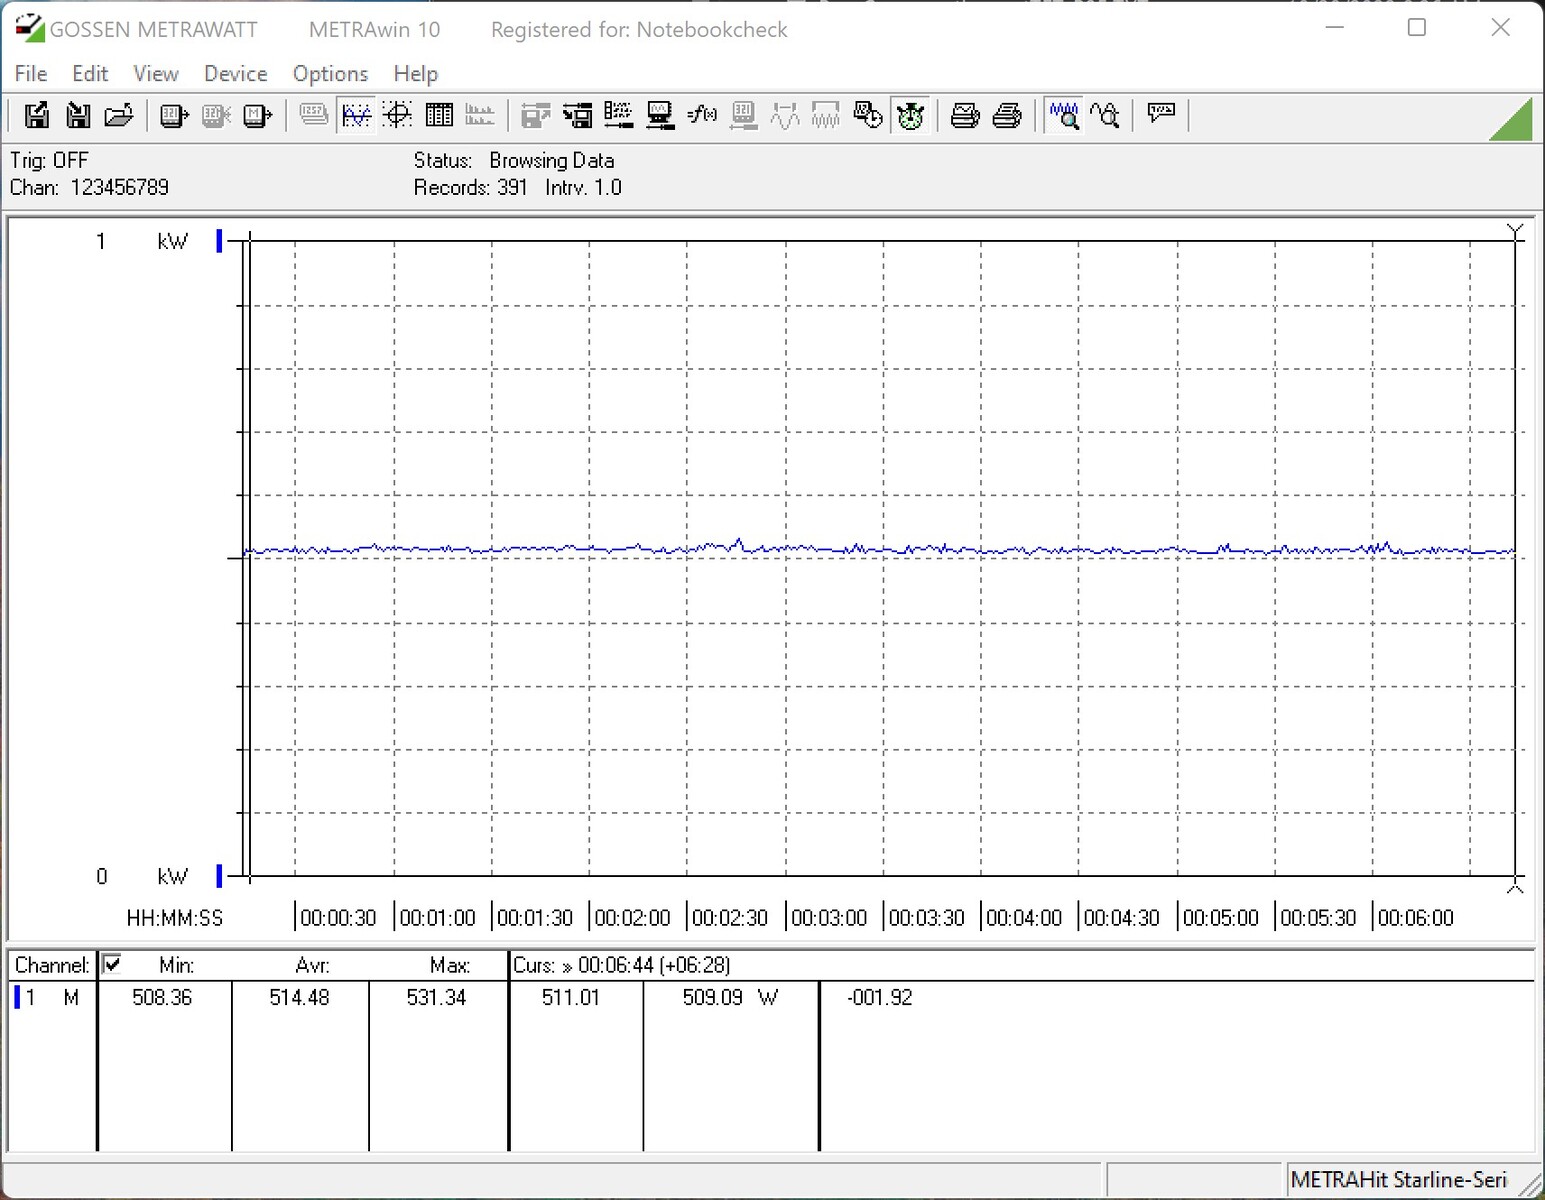
Intel Core i5-13600K - offenes Power-Limit
Intel Core i5-13600K - Power-Limit 181 Watt


| Power Consumption / Cinebench R15 Multi (external Monitor) | |
| Intel Core i9-13900K | |
| Intel Core i9-13900K @253W | |
| Intel Core i9-12900K (Idle: 70.5 W) | |
| NVIDIA GeForce RTX 3090 Founders Edition | |
| AMD Ryzen 9 7900X | |
| Intel Core i5-13600K | |
| Intel Core i5-13600K @181W | |
| AMD Ryzen 5 7600X | |
| Intel Core i5-12600K (Idle: 70.45 W) | |
| Power Consumption / Prime95 V2810 Stress (external Monitor) | |
| Intel Core i9-13900K | |
| Intel Core i9-13900K @253W | |
| Intel Core i5-13600K | |
| NVIDIA GeForce RTX 3090 Founders Edition | |
| AMD Ryzen 9 7900X | |
| Intel Core i9-12900K (Idle: 70.5 W) | |
| Intel Core i5-13600K @181W | |
| Intel Core i5-12600K (Idle: 70.45 W) | |
| AMD Ryzen 5 7600X | |
| Power Consumption / The Witcher 3 ultra (external Monitor) | |
| AMD Ryzen 9 7900X | |
| NVIDIA GeForce RTX 3090 Founders Edition | |
| Intel Core i9-13900K | |
| AMD Ryzen 5 7600X | |
| Intel Core i9-13900K @253W | |
| Intel Core i5-13600K | |
| Intel Core i5-13600K @181W | |
| Intel Core i9-12900K (Idle: 70.5 W) | |
| Intel Core i5-12600K (Idle: 70.45 W) | |
* ... kleinere Werte sind besser
Pro
Contra
Fazit - Extrem leistungshungrig

Mit Raptor Lake schickt Intel einen ehrwürdigen Nachfolger der Alder-Lake-Generation ins Rennen. Zeit wurde es auch, denn AMD ist mit seinem aktuellen Line-up den Alder-Lake-Prozessoren förmlich davongezogen. Komplett in den Schatten stellen kann Intel die Konkurrenz mit den aktuellen Prozessoren nicht. Gleichziehen kann Intel allerdings, wenngleich oftmals die Konkurrenz nur leicht übertroffen wird. Die Unterschiede zwischen den beiden Topmodellen sind sehr gering und nicht wirklich als spürbar einzuordnen. Wenn wir allerdings die aktuellen UVPs als Grundlage für den Leistungsvergleich nehmen, dann ist der Intel Core i9-13900K dem AMD Ryzen 9 7900X in vielen Benchmarks überlegen.
Mit mehr Takt, mehr Kernen und einem höheren Stromverbrauch erkämpft sich Intel diesen Stand. Letzteres ist ein Ansatz, den auch AMD verfolgt, wenngleich die TDP des Intel Core i9-13900K mit 253 Watt (PL2) einen neuen Höchststand beziffert. Beim kleineren Intel Core i5-13600K sind es immerhin noch 181 Watt unter Volllast. Das bedeutet, eine sehr gute Kühlung ist Voraussetzung, wenn das Topmodell auf der Wunschliste steht.
Die aktuellen Intel-Raptor-Lake-Prozessoren bieten eine sehr gute Gaming- und Anwendungs-Leistung. Der Intel Core i9-13900K ist aufgrund der sehr hohen Leistung die optimale CPU für Content Creators.
Beim Unterbau kann man getrost auf einen 600er-Chipsatz setzen, denn Raptor Lake ist nach einem BIOS-Update kompatibel. Das belastet den Geldbeutel bei einem Upgrade nicht zu stark. Dennoch wird es neue Mainboards mit dem neuen 700er-Chipsatz geben. Man sollte sich allerdings bewusst sein, dass für den aktuellen Sockel 1700 keine neue CPU-Generation erscheinen wird. Die Gerüchteküche besagt, dass mit Meteor Lake der Sockel 1851 Einzug halten soll, womit die aktuellen Platinen nicht mehr kompatibel wären.
Preise und Verfügbarkeit
Erste Shops listen die neuen Raptor-Lake-Prozessoren bereits. So gibt es den Intel Core i5-13600K bei Amazon für 465 Euro, wenngleich für das Topmodell, dem Intel Core i9-13900K, 749 Euro bei Caseking fällig werden.
