Fazit - Extrem leicht, aber nicht ohne einige Opfer
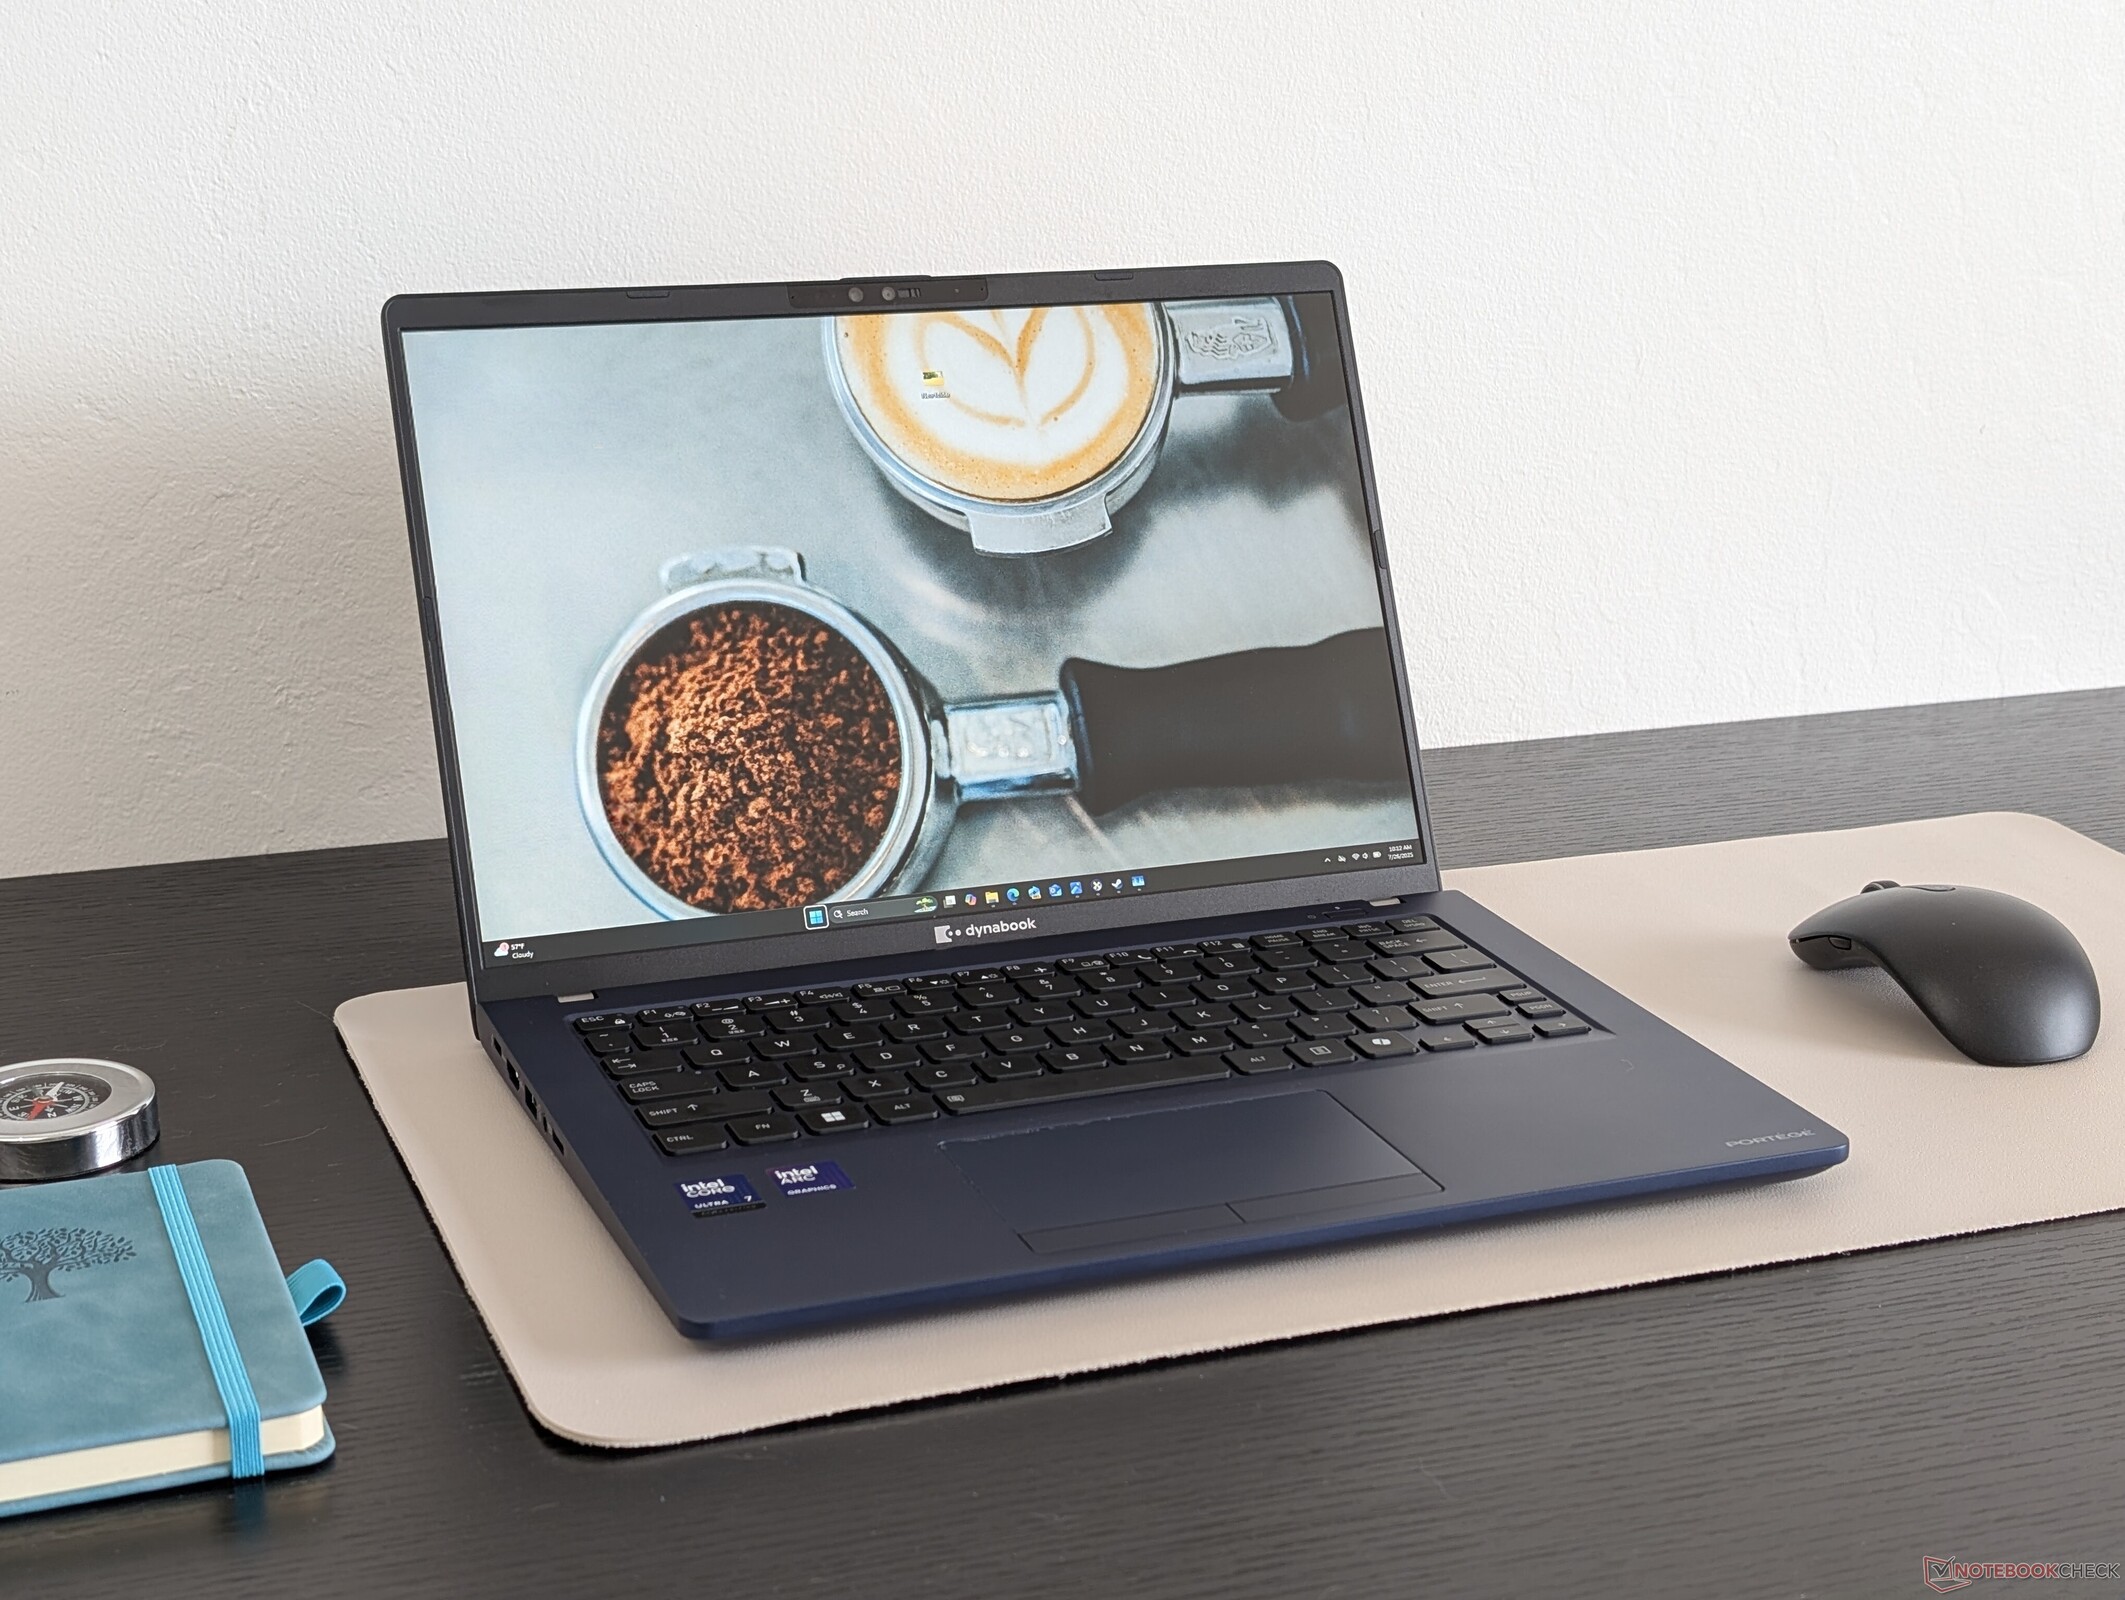
Das Dynabook Portege Z40L-N zeichnet sich dadurch aus, dass es eines der leichtesten 14-Zoll-Windows-Notebooks auf dem Markt ist. Während eine solche Leistung normalerweise mit großen Nachteilen verbunden ist, schafft es das Dynabook, eine gesunde Anzahl von Ports, eine austauschbare M.2-2280-SSD, volle sRGB-Farben und eine komfortable Tastatur und ein Touchpad trotz des geringen Gewichts zu vereinen. Wir können gar nicht genug betonen, wie viel einfacher es ist, das Dynabook unterwegs zu benutzen, verglichen mit schwereren 14-Zoll-Notebooks wie dem Samsung Galaxy Book Pro 14 oder dem HP EliteBook X G1i 14 AI.
Dennoch gibt es auch Nachteile: Abgesehen von der offenkundig fehlenden WAN-Unterstützung sind insbesondere die CPU und die SSD anfälliger für Leistungsdrosselung als bei vielen anderen Subnotebooks mit ähnlichen Konfigurationsoptionen. Das Gehäuse oder Skelett lässt sich auch leichter biegen und verdrehen als ein steiferes MacBook Air oder Dell XPS. Anspruchsvollere Benutzer sollten daher wegen der zusätzlichen Leistung und Steifigkeit auch schwerere Laptops in Betracht ziehen.
Pro
Contra
Preis und Verfügbarkeit
Das Dynabook Z40L-N ist nicht in großem Umfang bei Drittanbietern oder in Geschäften erhältlich und wird bisher nicht auf dem deutschsprachigen Markt angeboten. Die Systeme können direkt beim Hersteller erworben werden ab 1.700 US-Dollar für die Core-Ultra-5-Konfiguration bis zu 2.200 US-Dollar für unsere Testkonfiguration. (Nicht in Europa verfügbar)
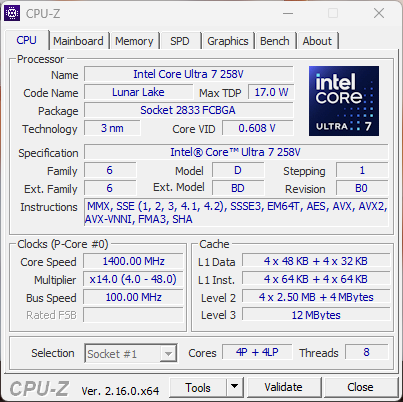
Die Portege-Z-Serie konzentriert sich auf ultraleichte Business-Notebooks. Das 14 Zoll Portege Z40L-N ist das neueste Modell der Familie. Bei unserem Testgerät handelt es sich um die High-End-Konfiguration mit dem Lunar Lake Core Ultra 7 258V für ca. 2.200 US-Dollar, während eine Core-Ultra-5-Option mit der Hälfte des RAM für 1.700 US-Dollar erhältlich ist. Alle Optionen sind mit dem gleichen 1.200p-IPS-Display und 3 Jahren Standard-Garantie ausgestattet.
Zu den Alternativen zum Portege Z40L-N gehören andere ultraleichte 14-Zoll-Business-Notebooks wie die LG-Gram-Serie oder die Samsung-Galaxy-Book-Serie.
Weitere Dynabook Testberichte:
Spezifikationen
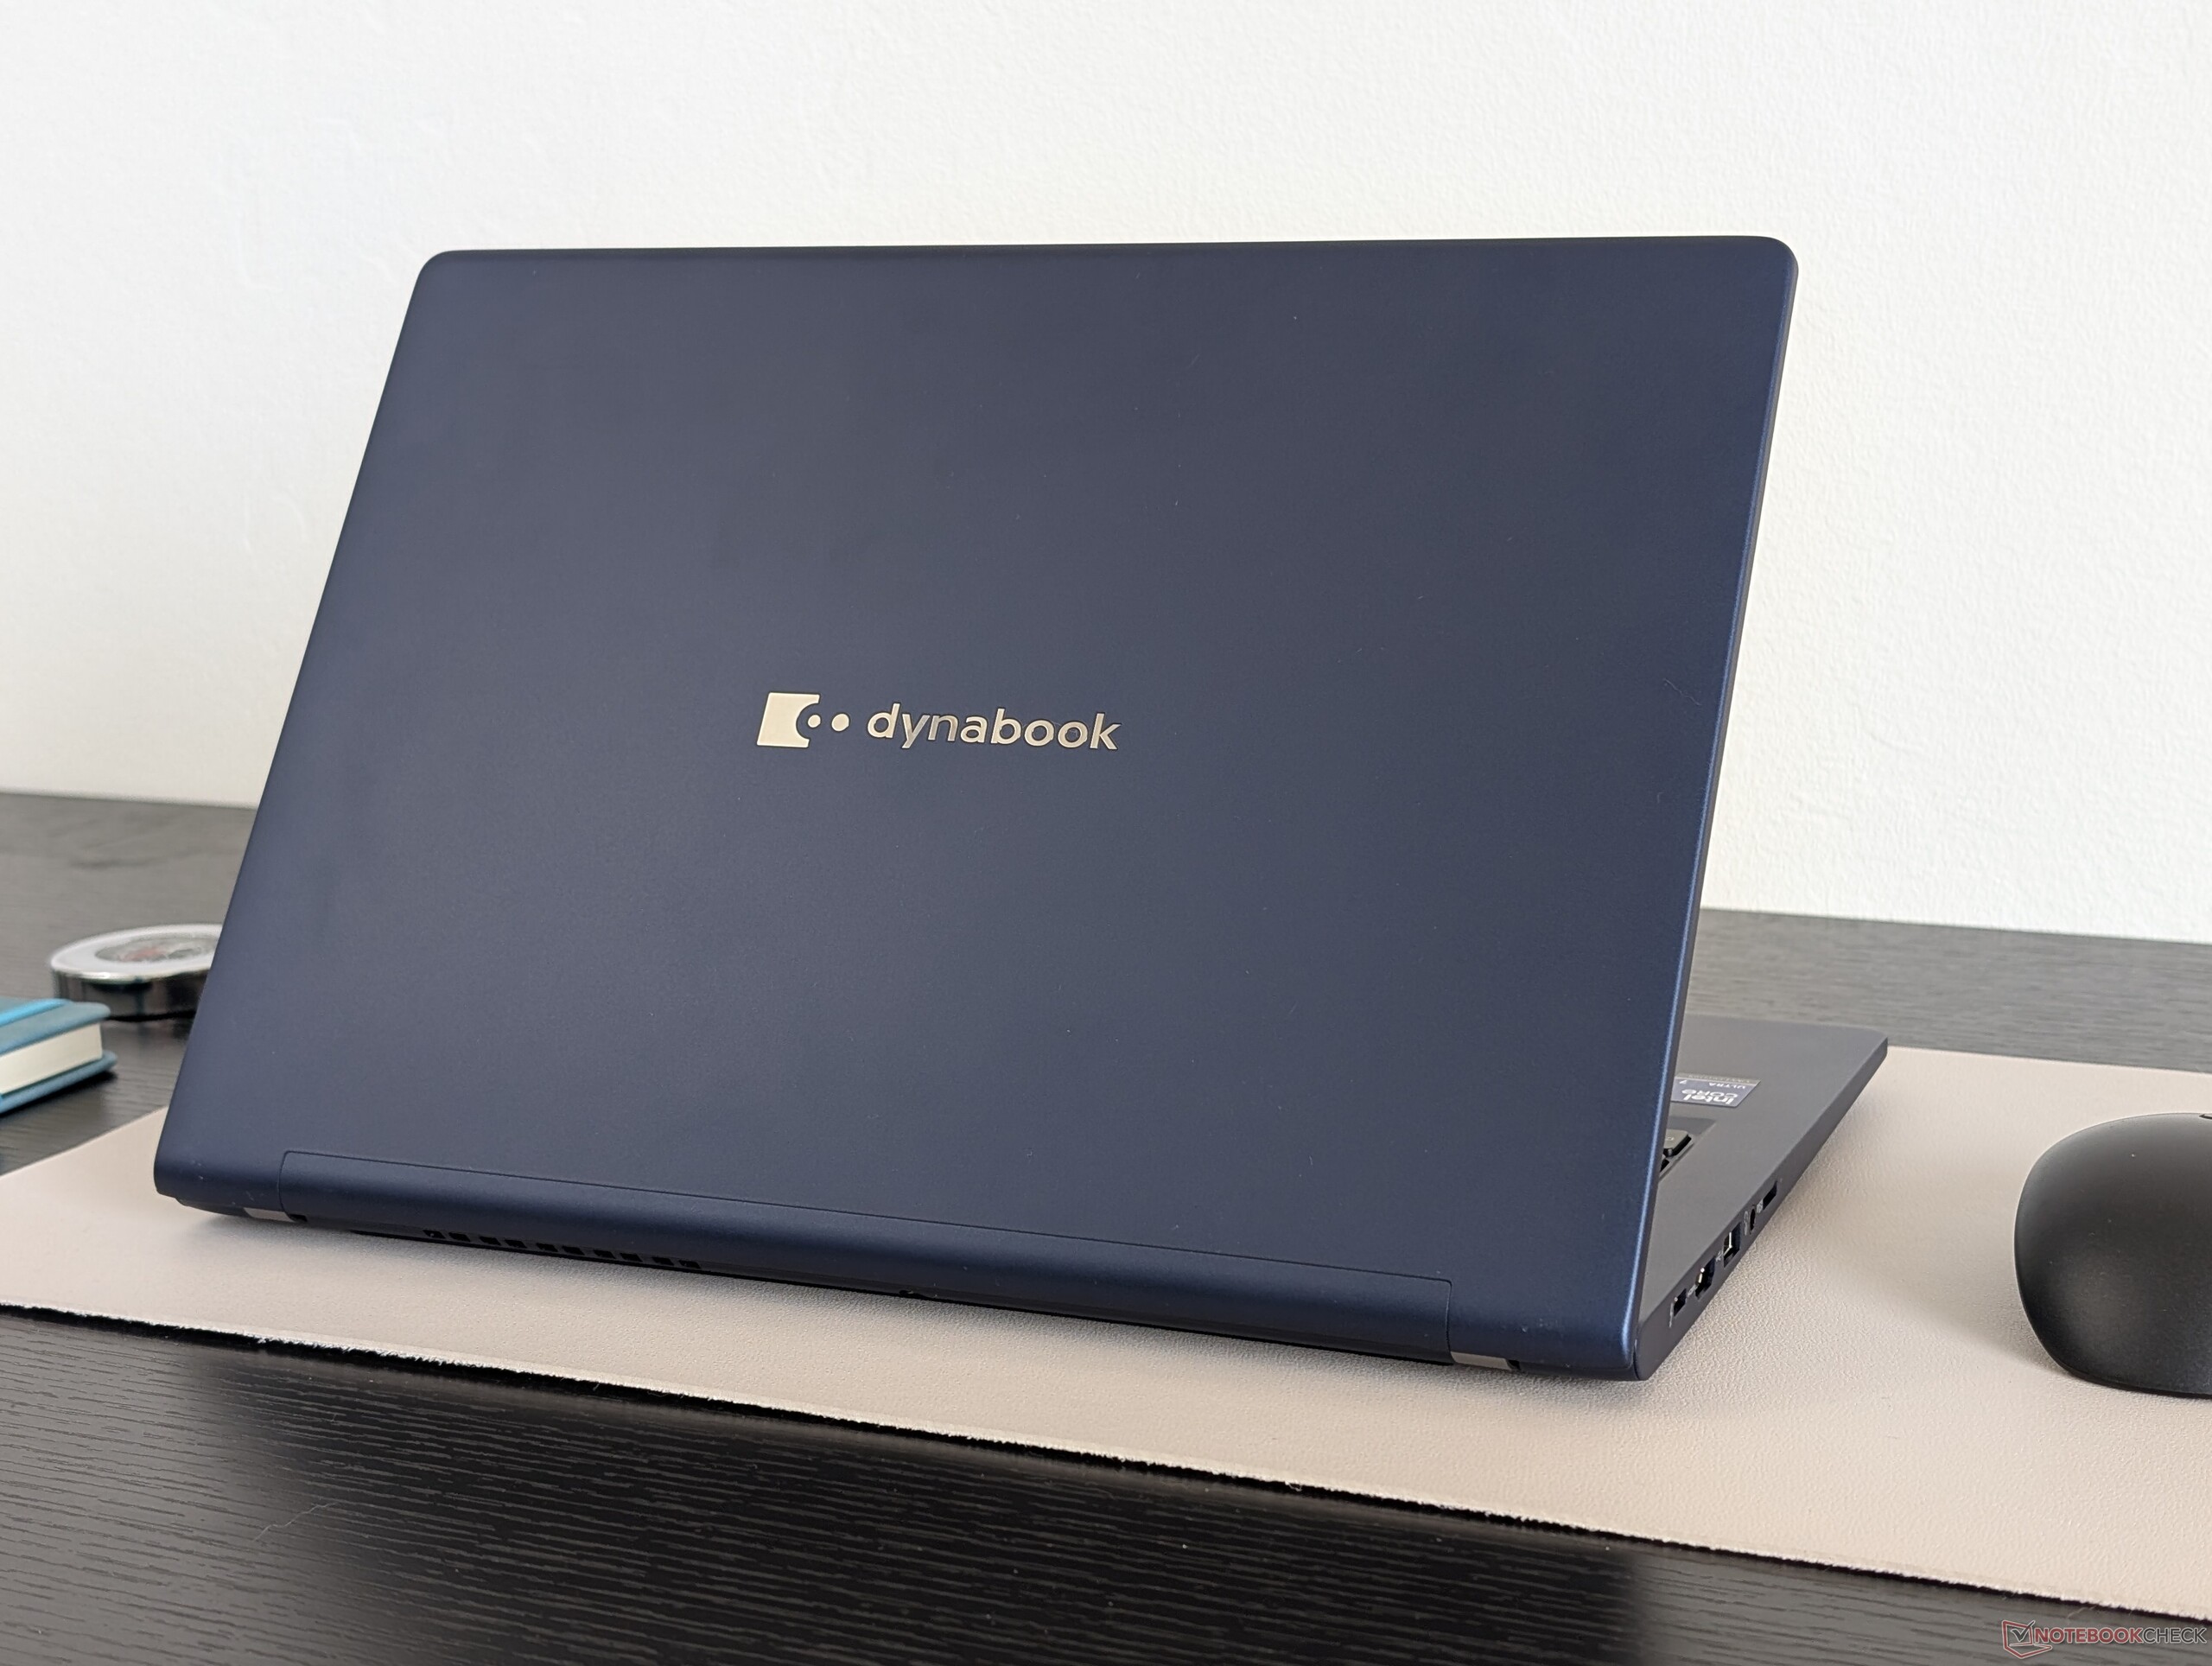
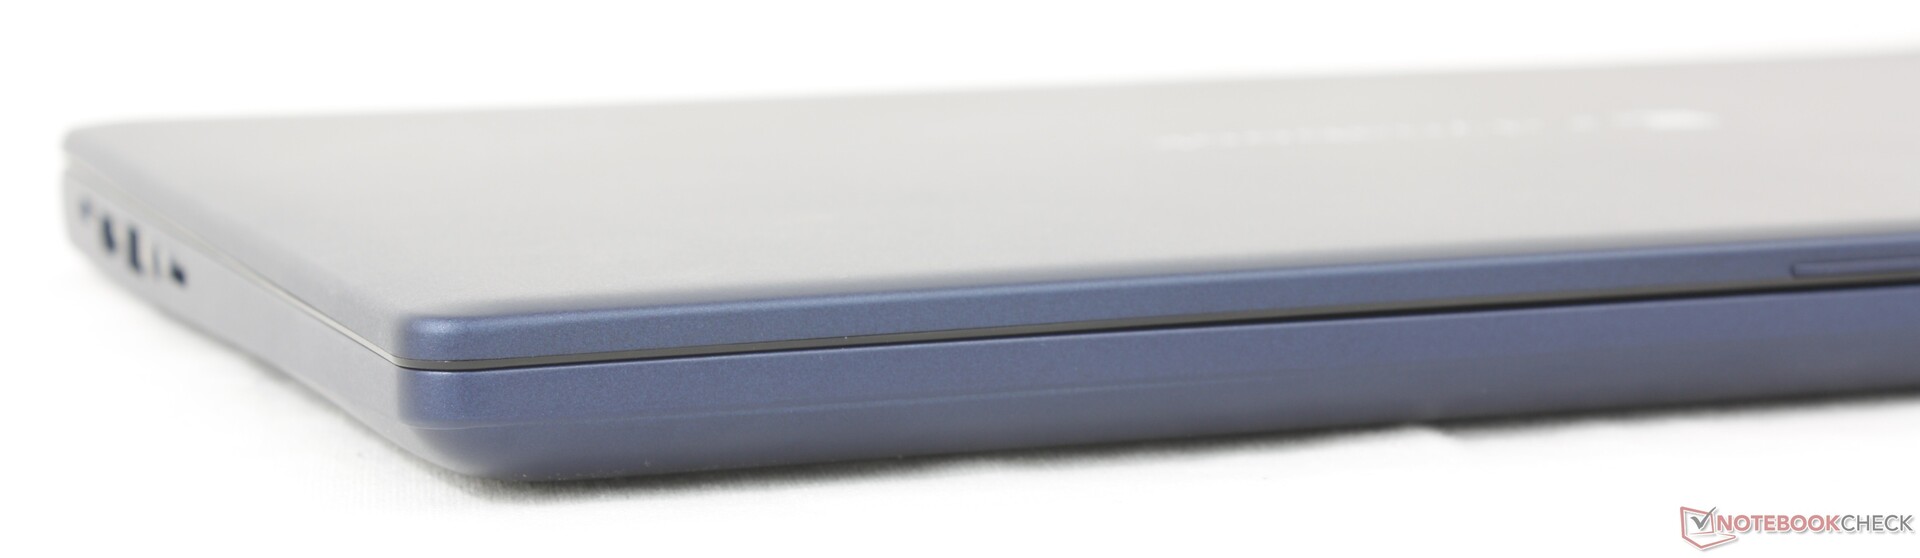
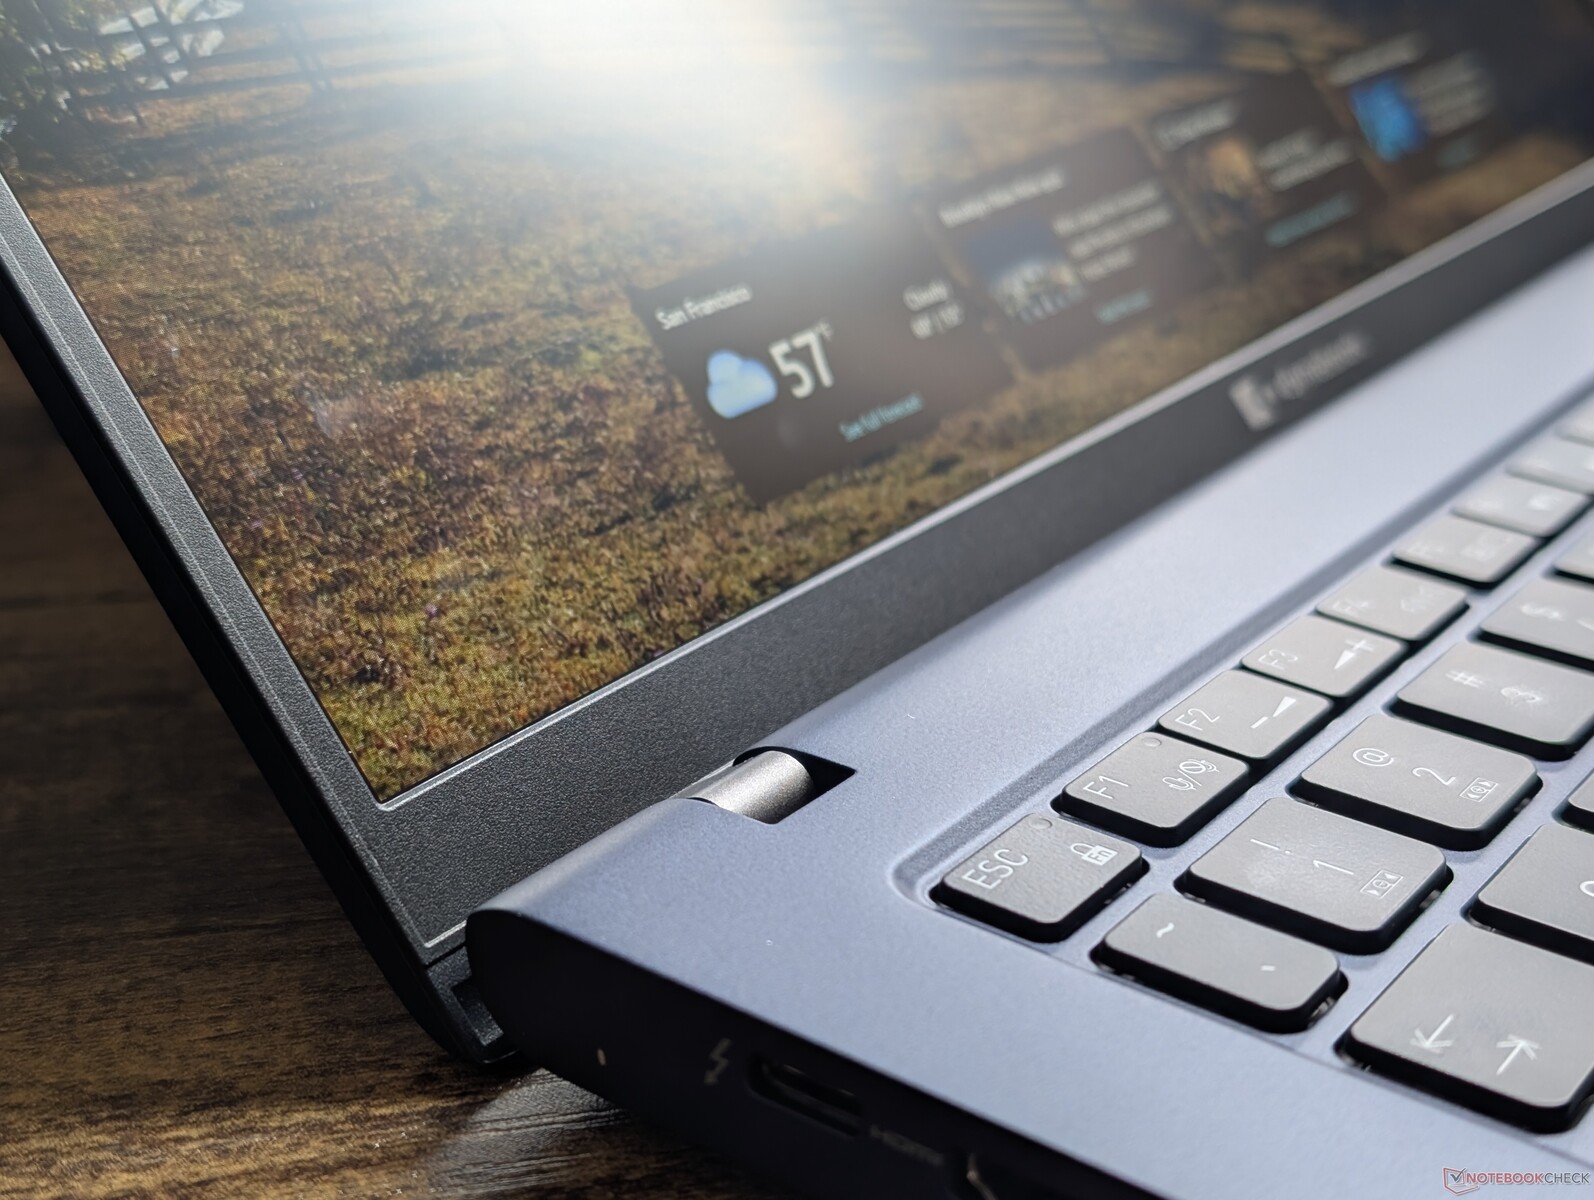
Gehäuse
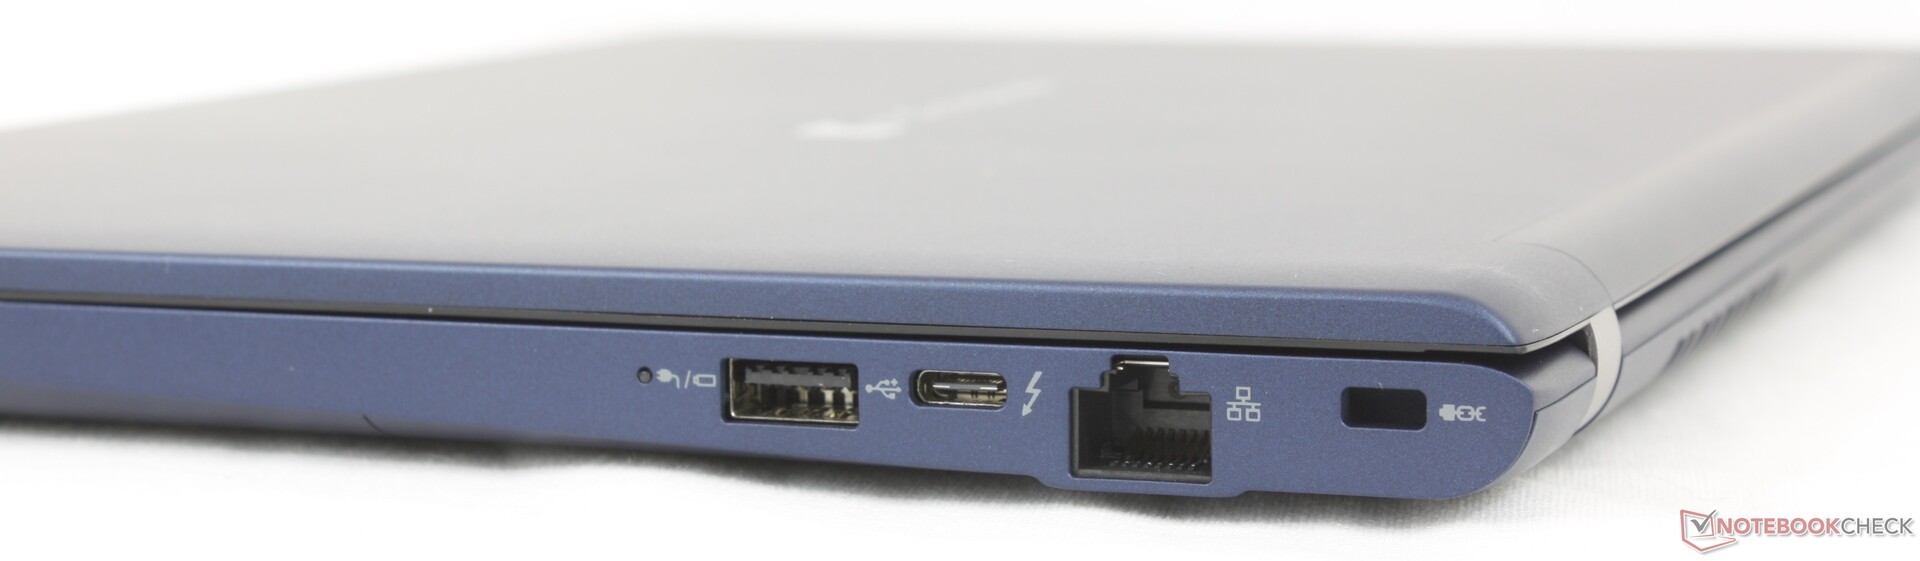
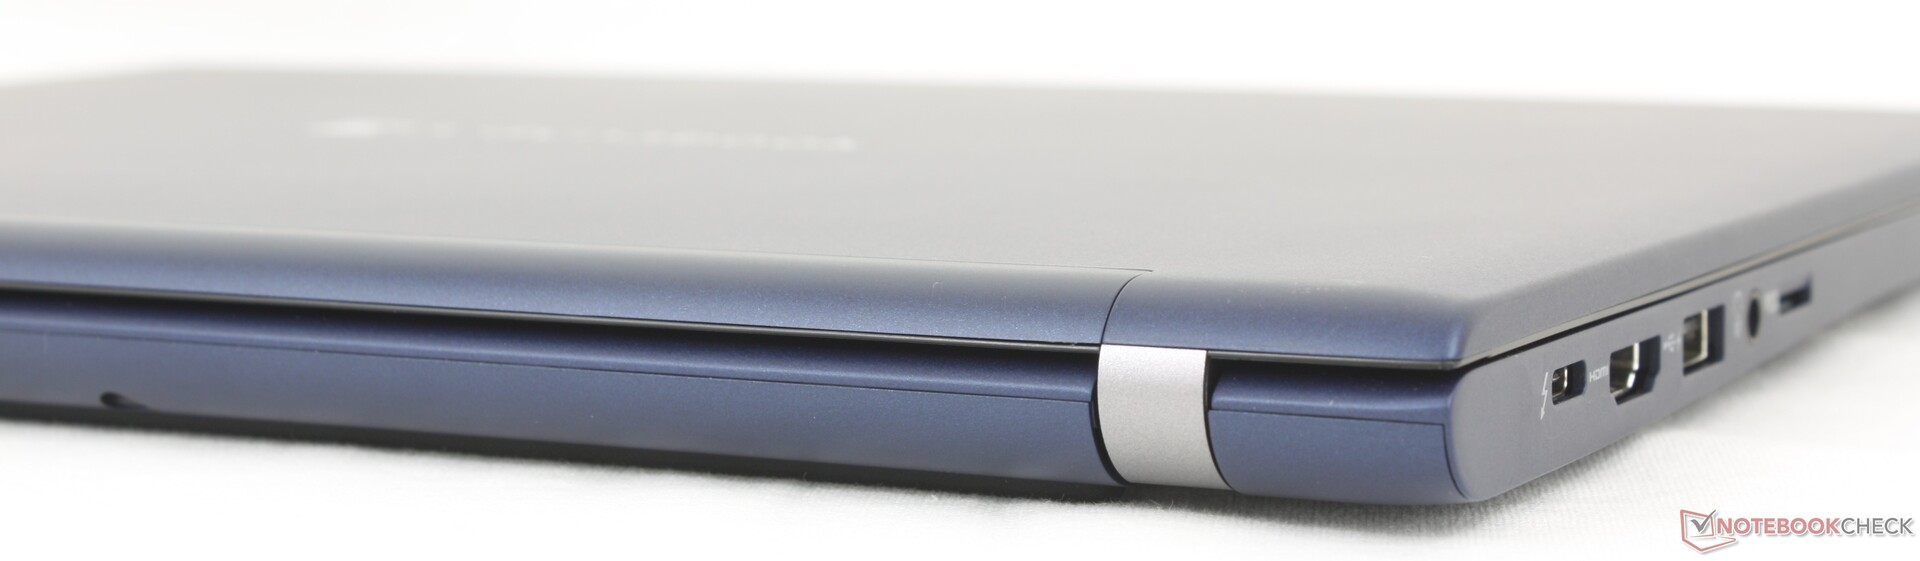
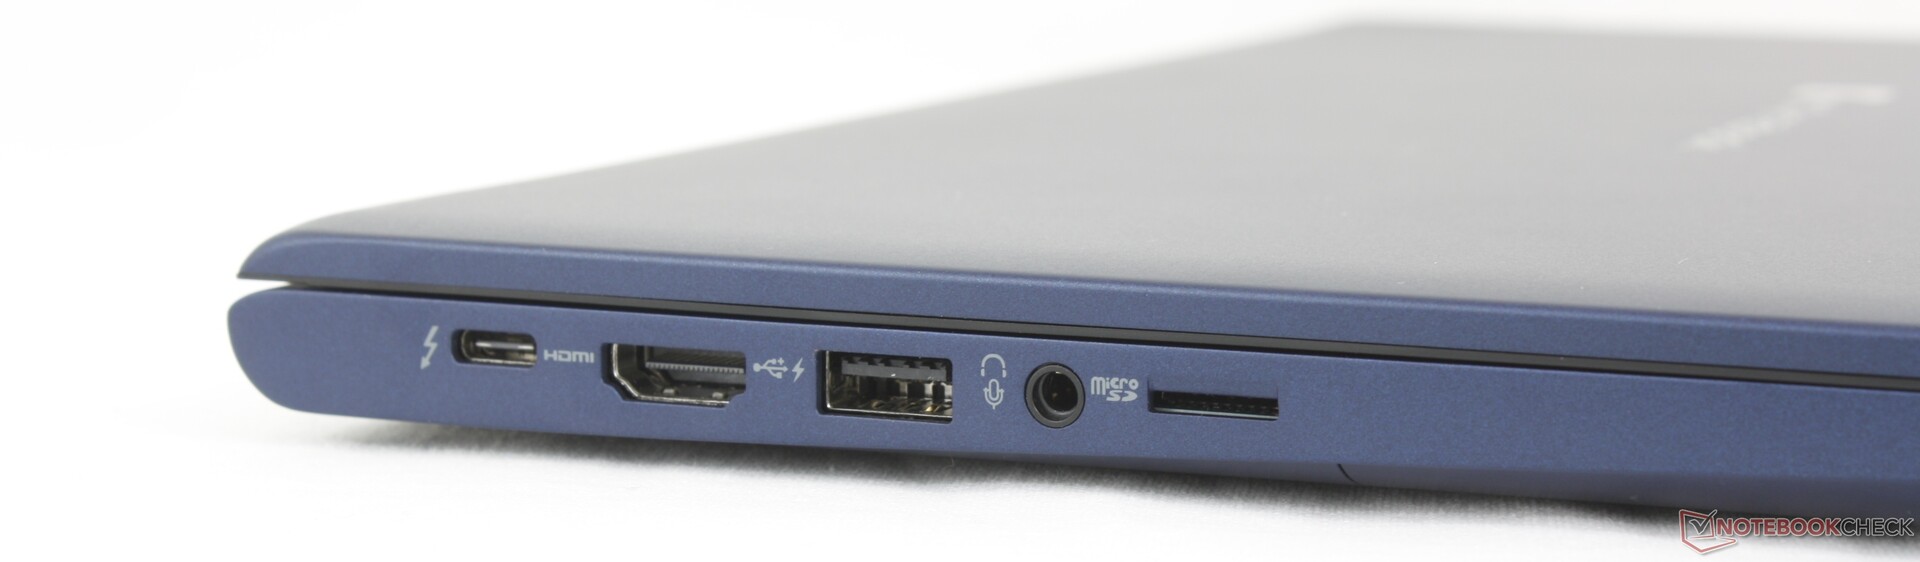
Anschlussausstattung
SD-Kartenleser
| SD Card Reader | |
| average JPG Copy Test (av. of 3 runs) | |
| LG Gram Style 14Z90RS-G.AD7AG (AV PRO microSD 128 GB V60) | |
| Dynabook Portégé X40-K (AV Pro SD microSD V60) | |
| Lenovo ThinkBook 14 Gen 8 21SJ007SGE | |
| Dynabook Portege Z40L-N (AV PRO microSD 128 GB V60) | |
| maximum AS SSD Seq Read Test (1GB) | |
| Lenovo ThinkBook 14 Gen 8 21SJ007SGE | |
| Dynabook Portege Z40L-N (AV PRO microSD 128 GB V60) | |
| LG Gram Style 14Z90RS-G.AD7AG (AV PRO microSD 128 GB V60) | |
| Dynabook Portégé X40-K (AV Pro SD microSD V60) | |
Kommunikation
Webcam


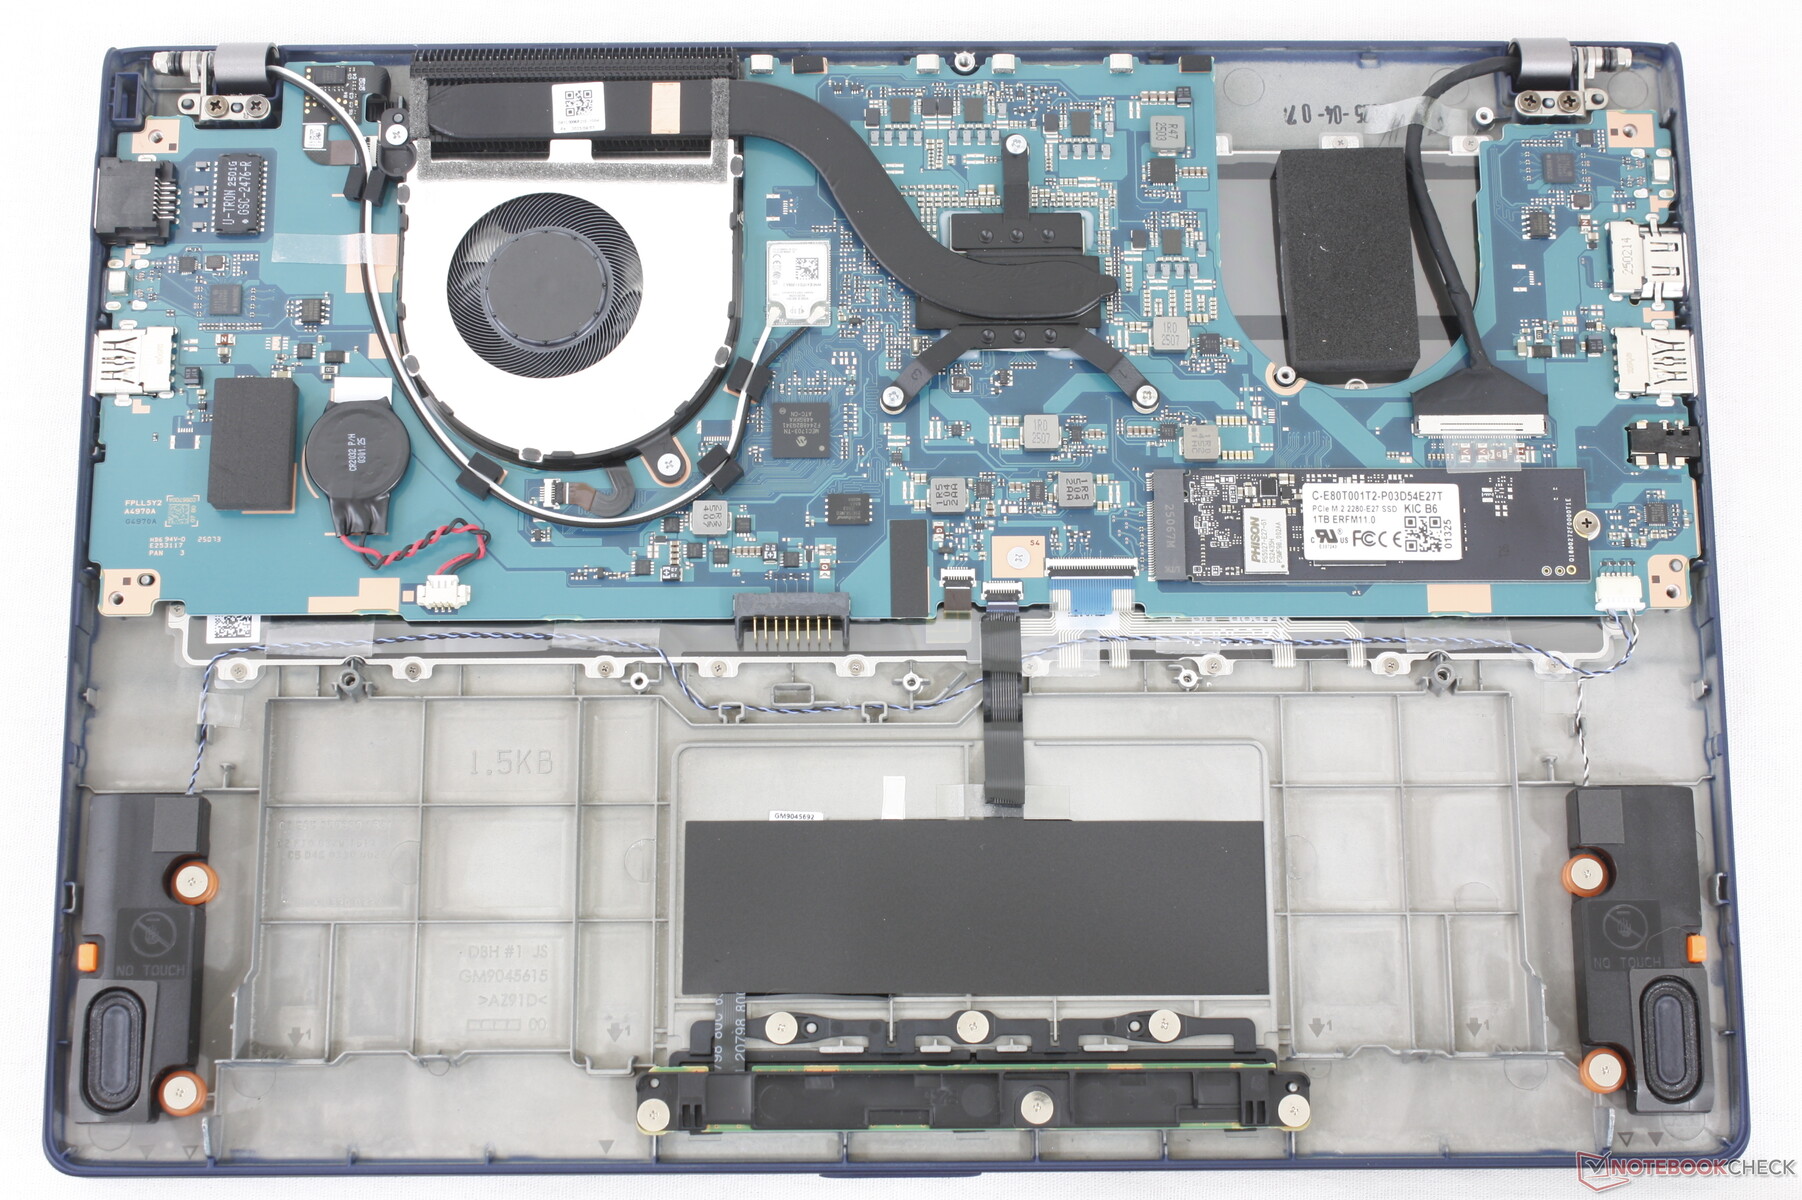
Wartung
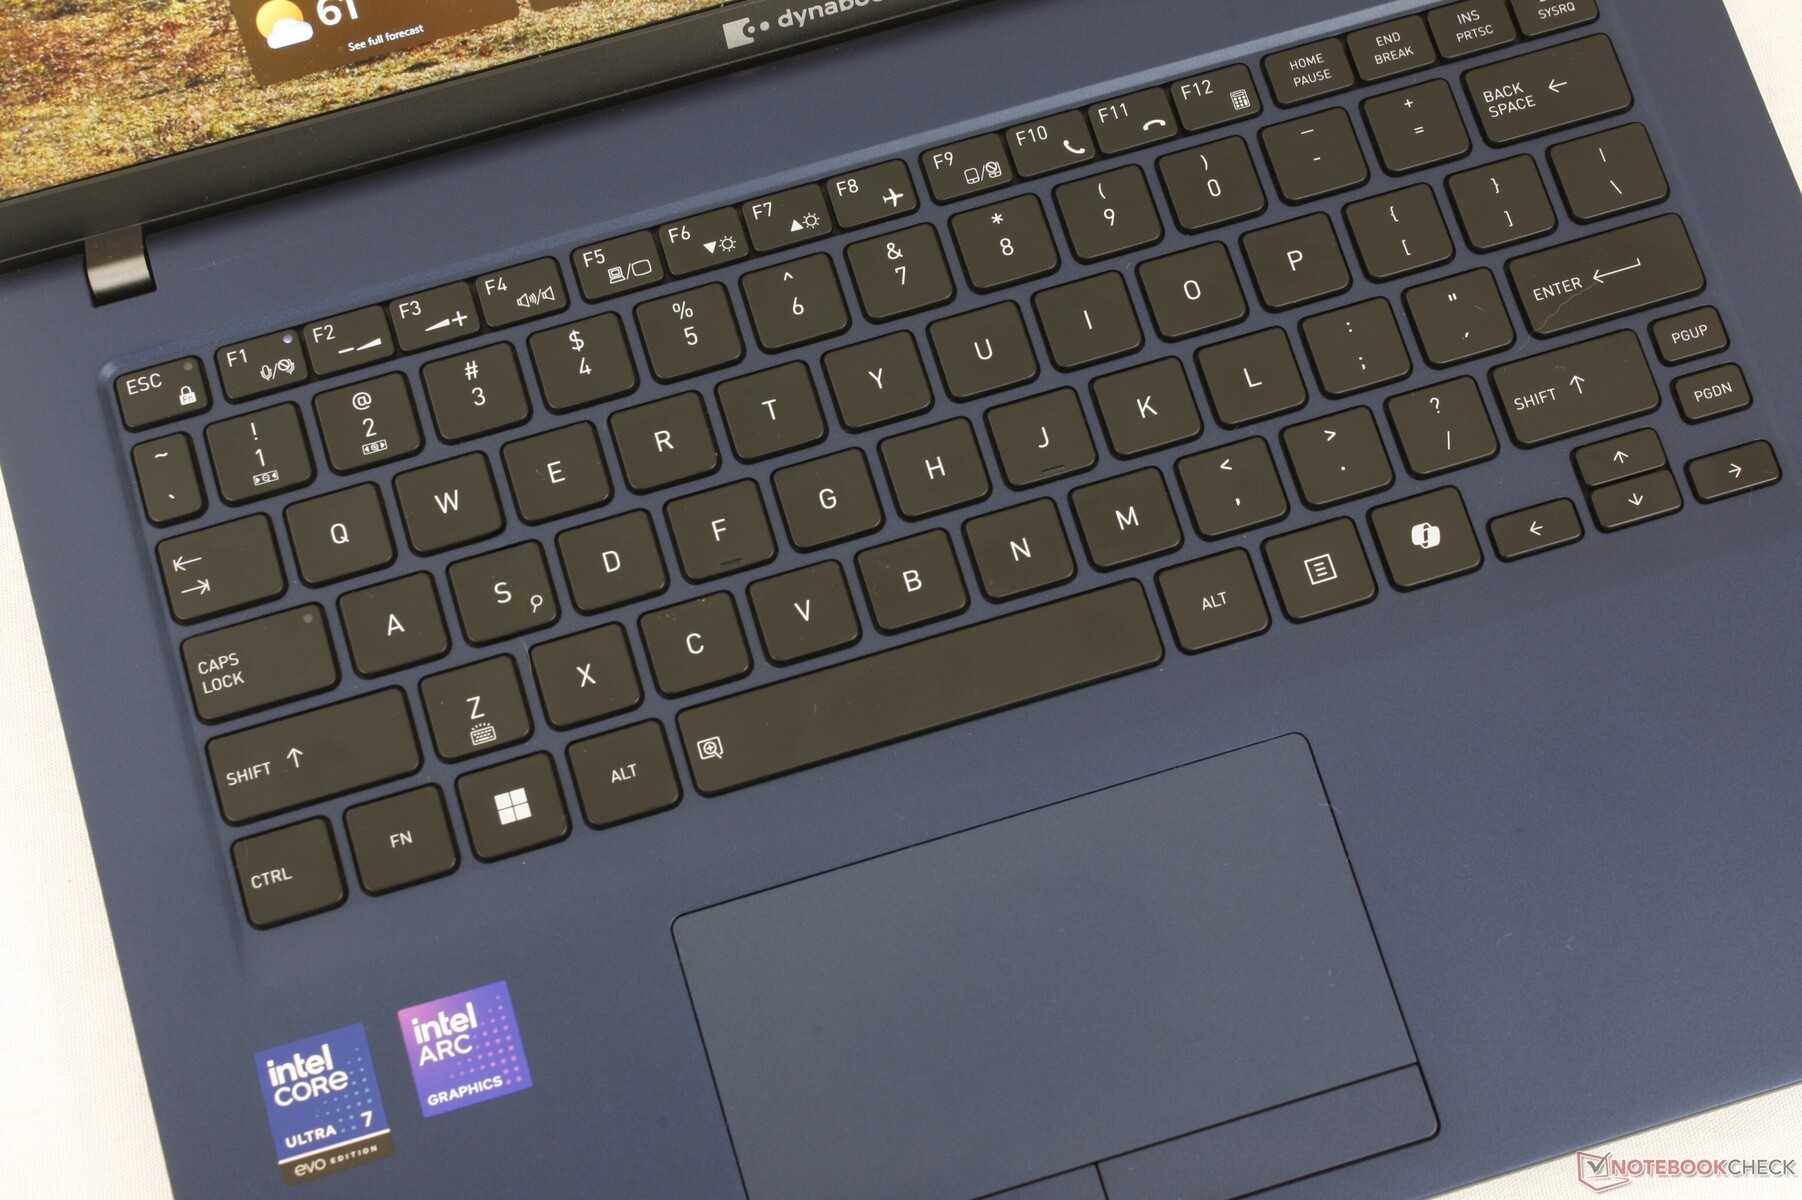
Eingabegeräte
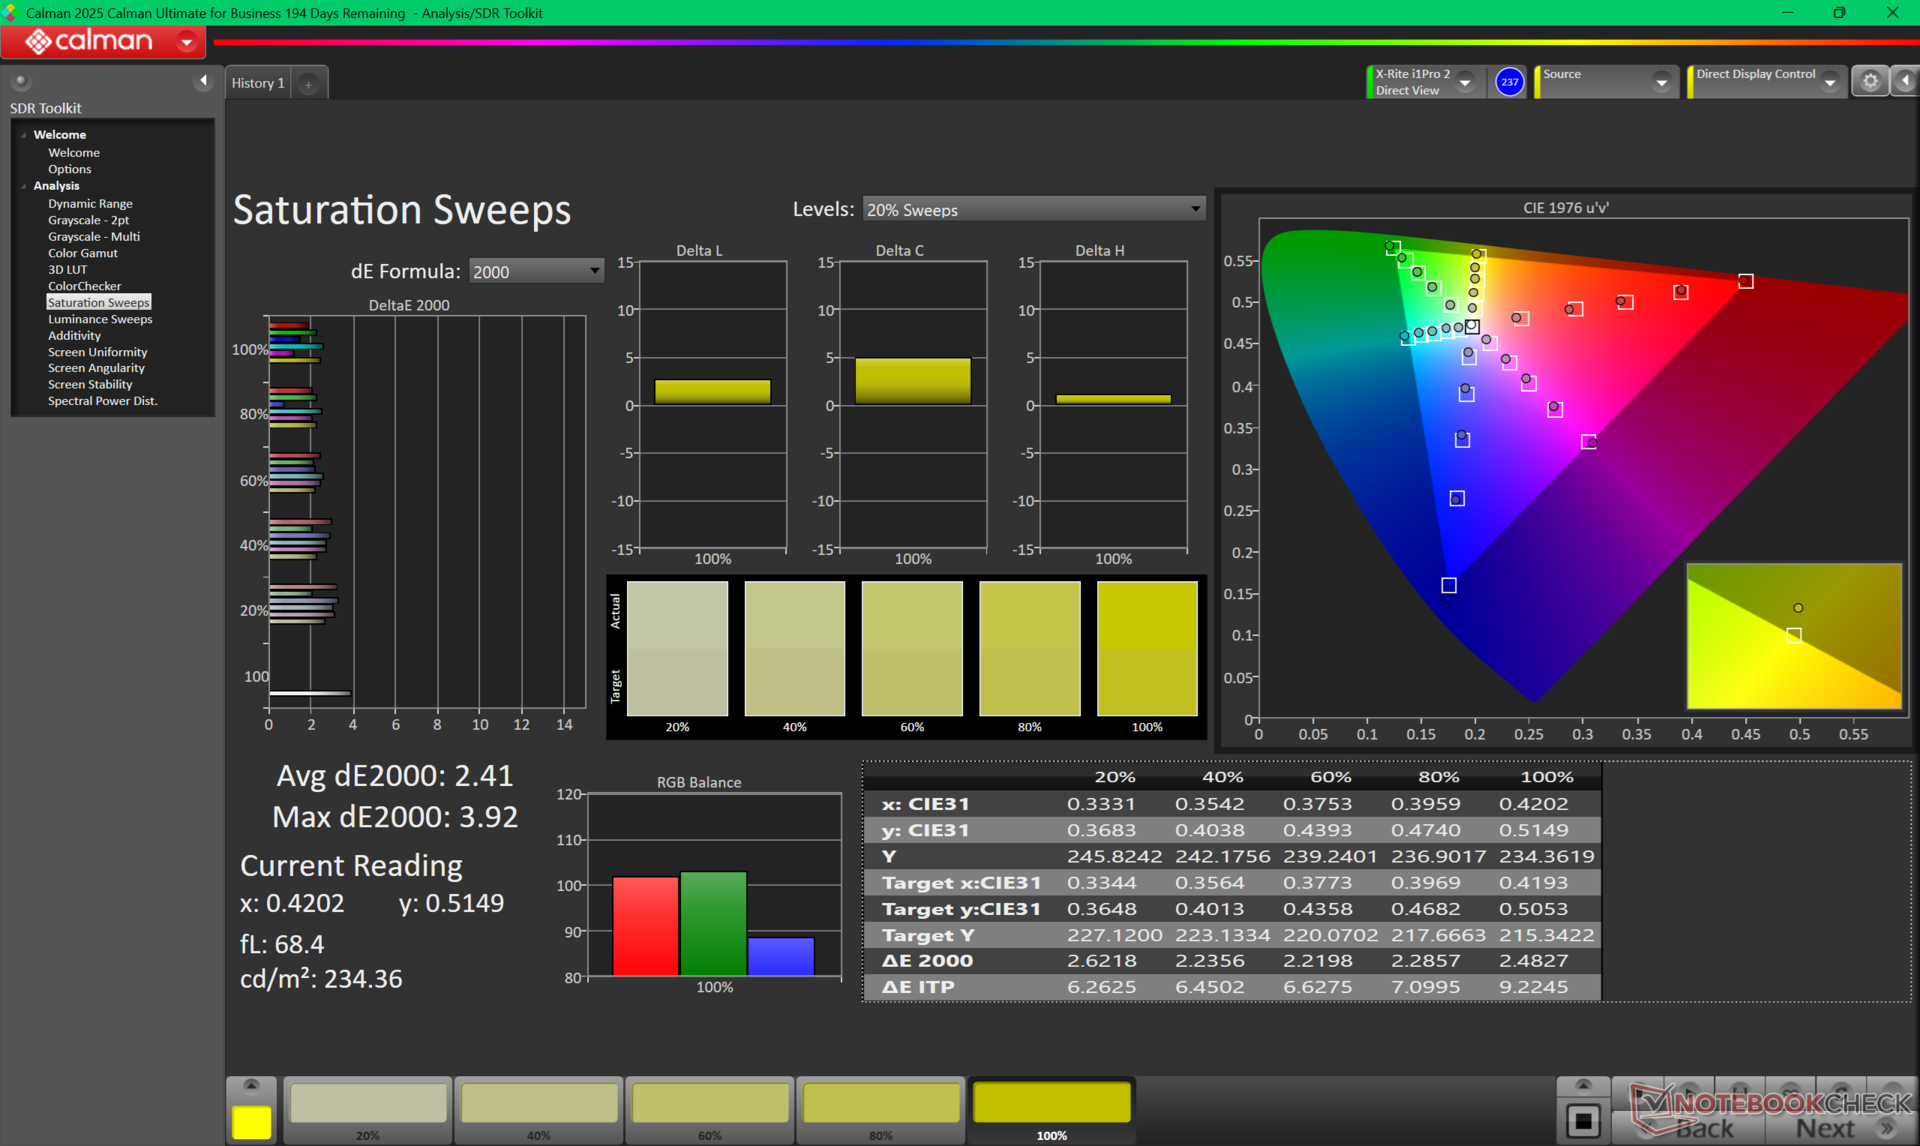
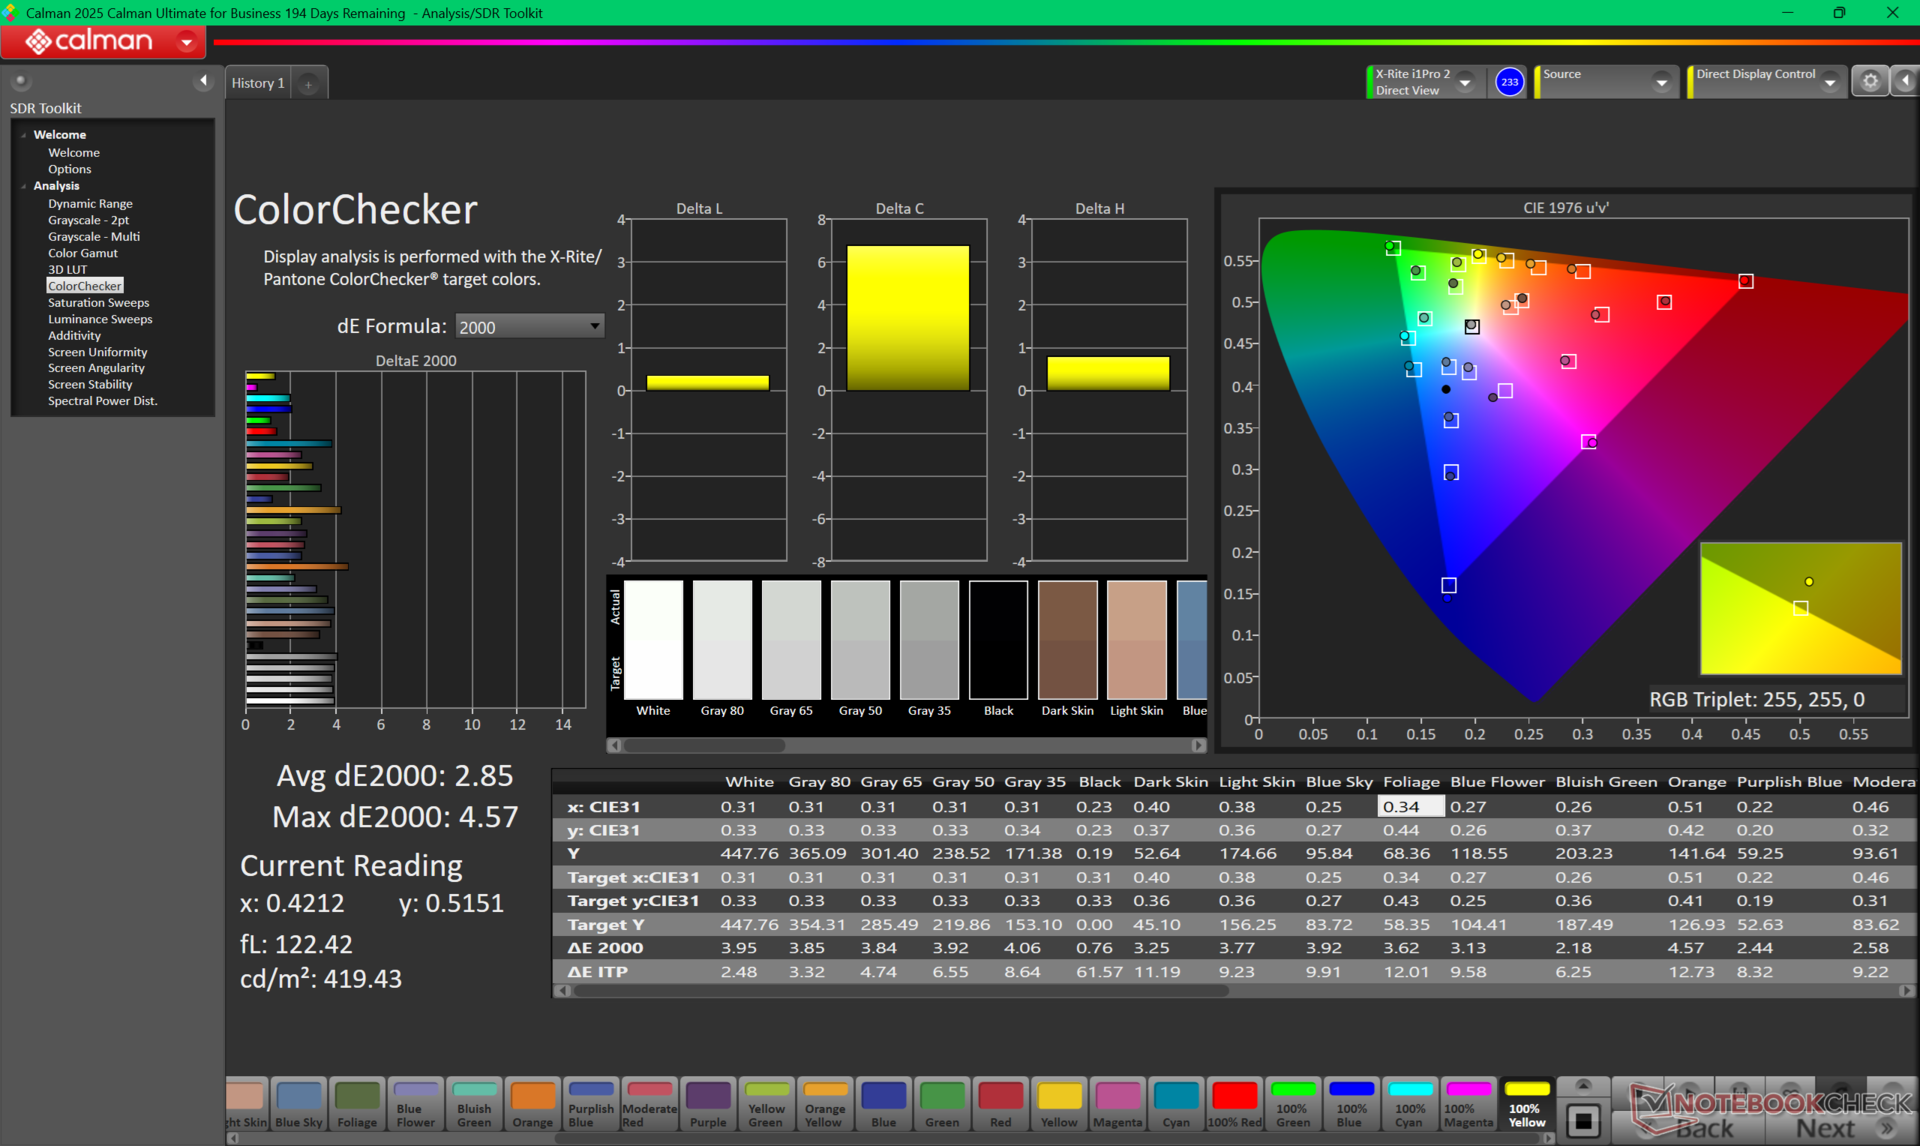
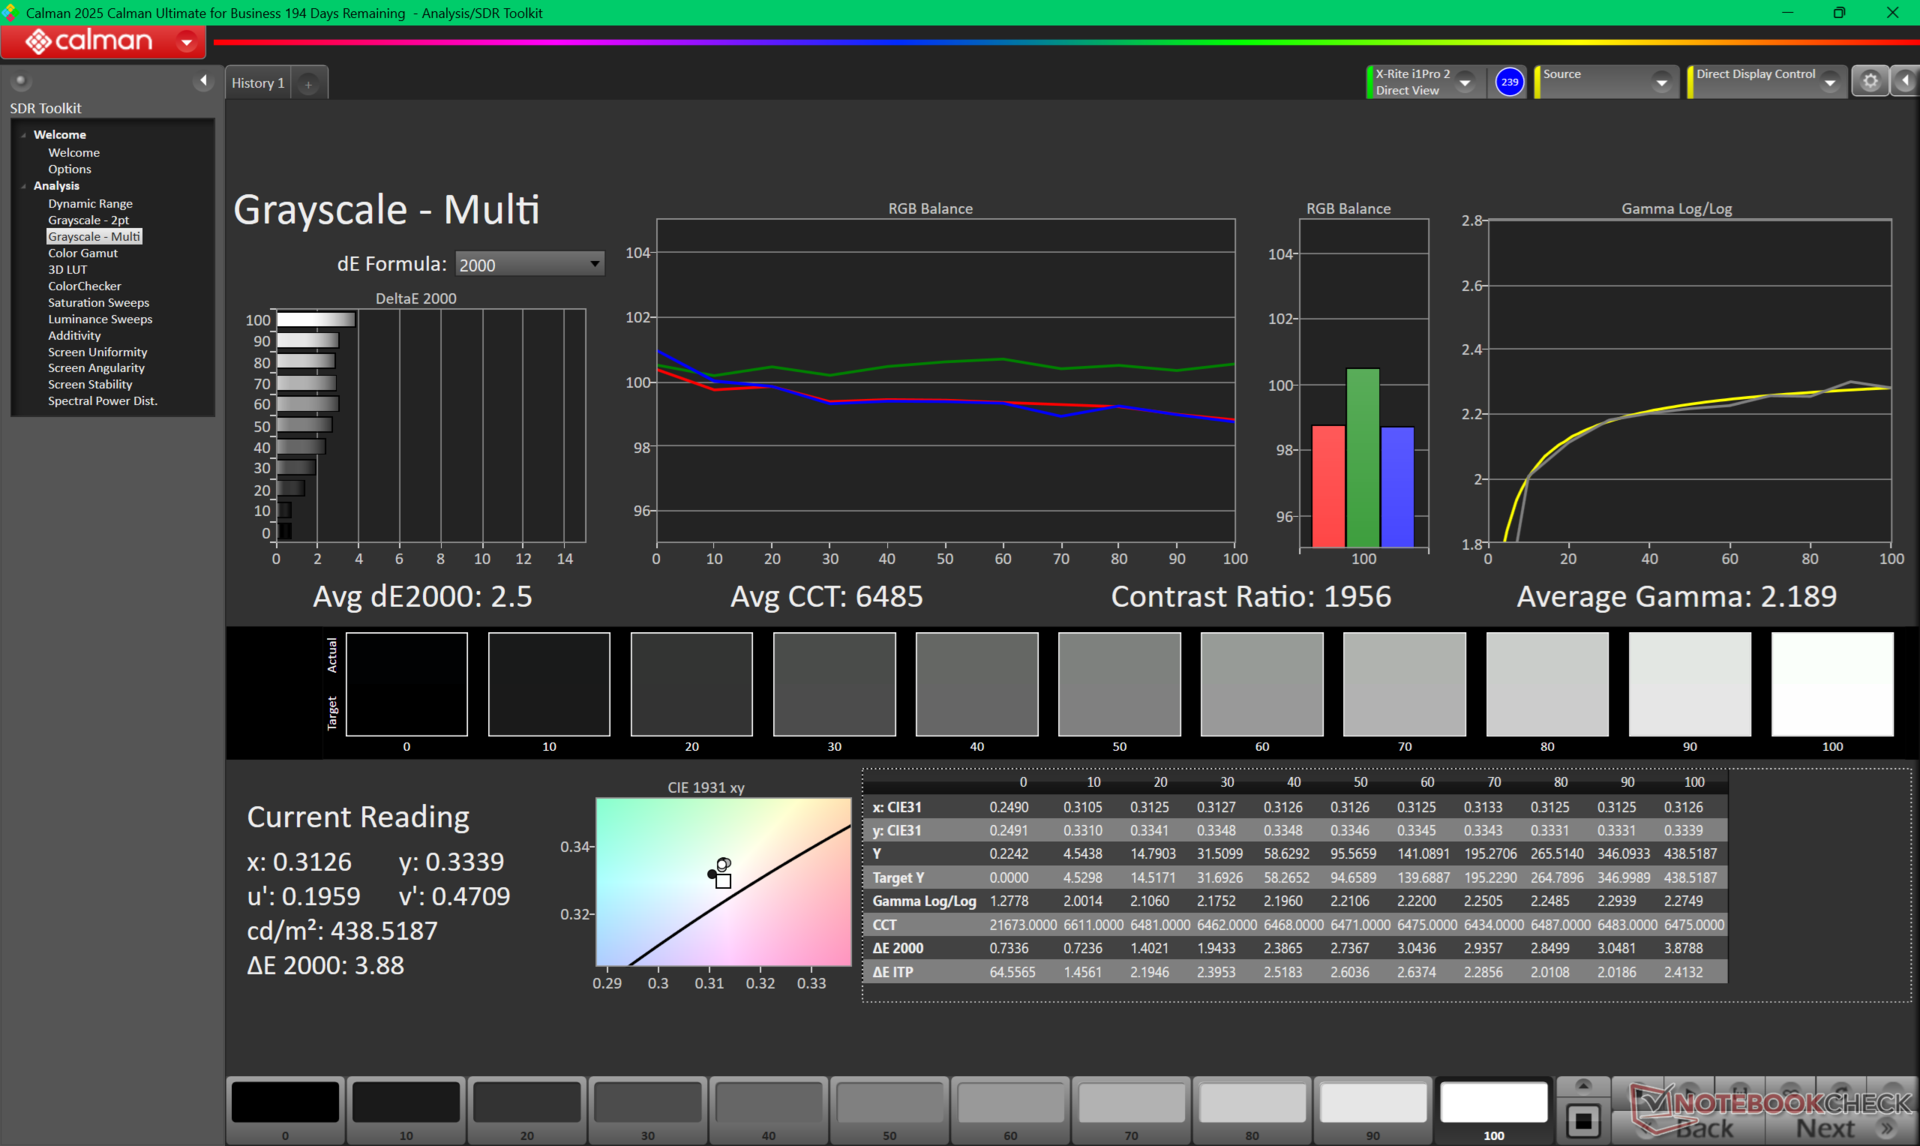
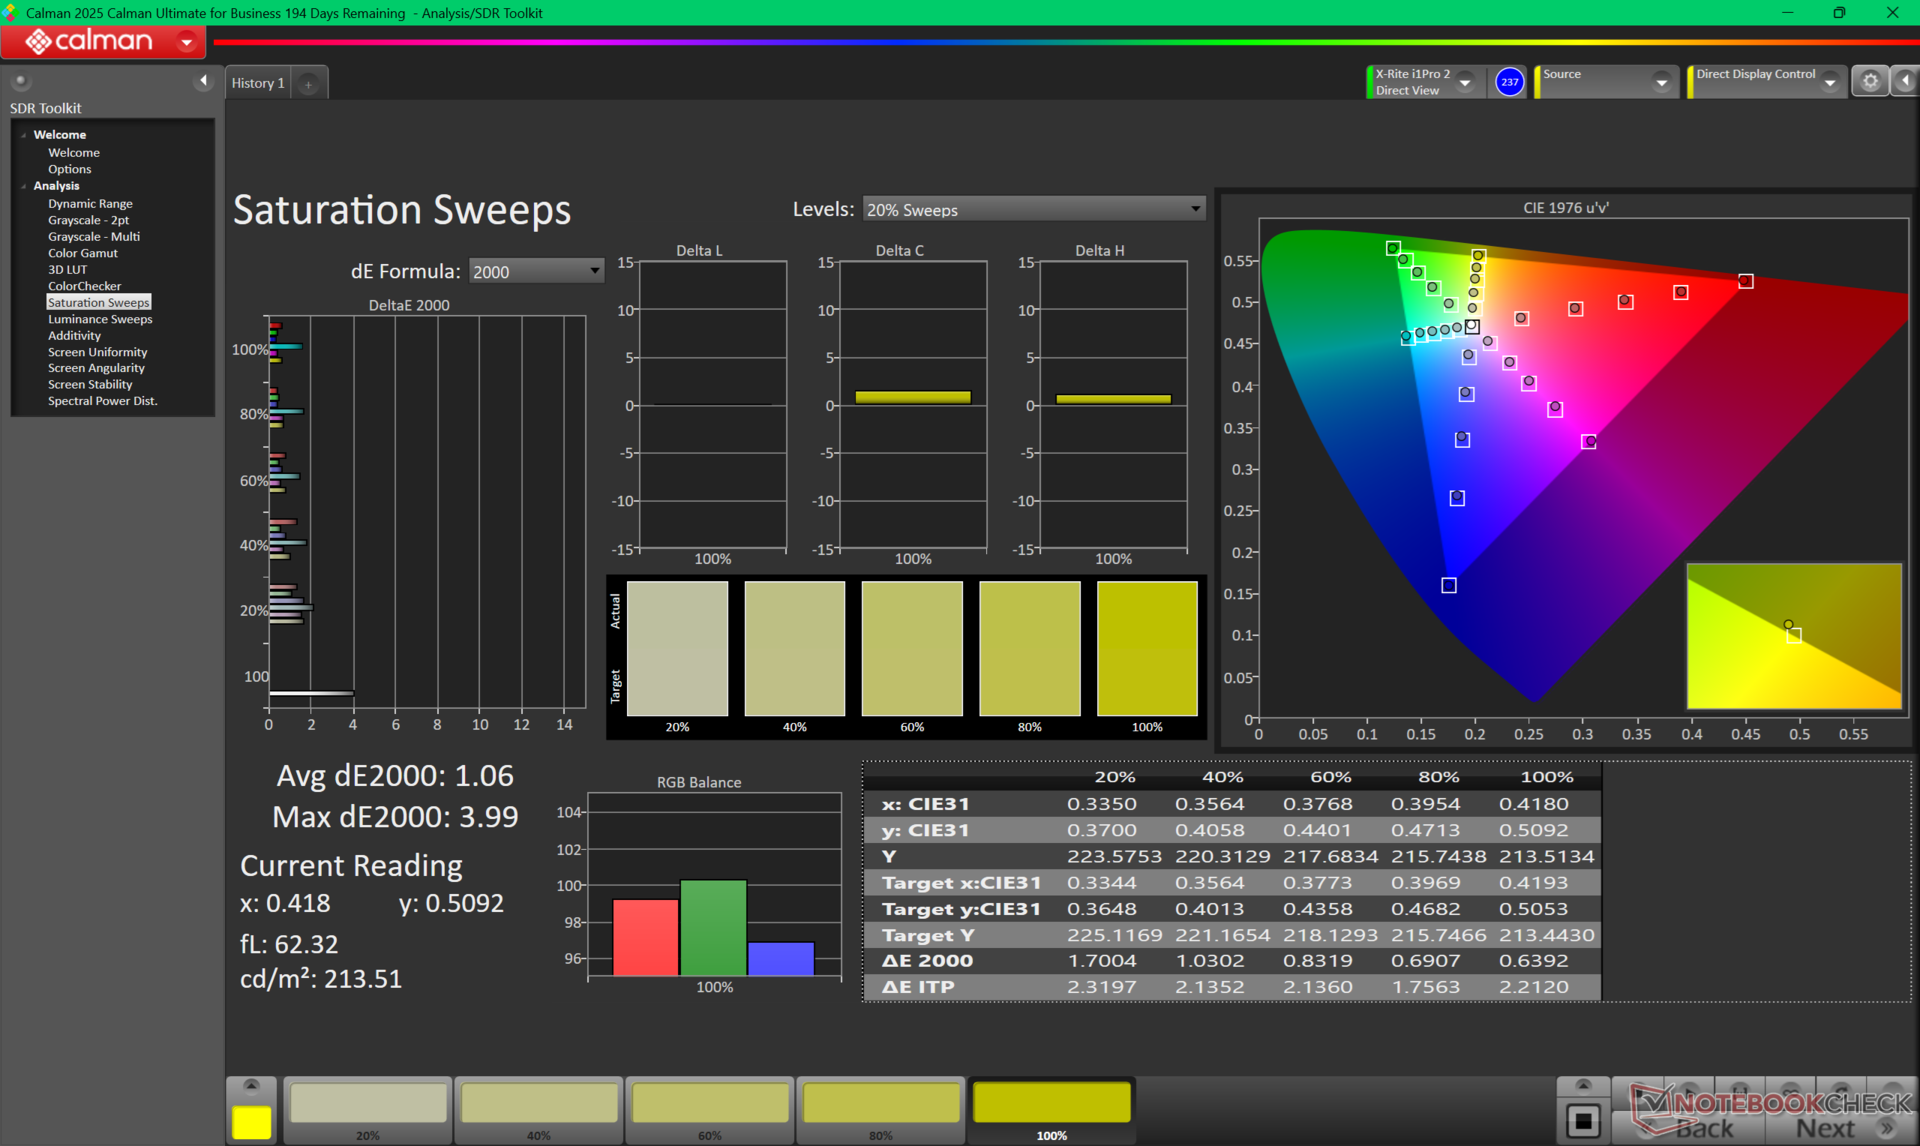
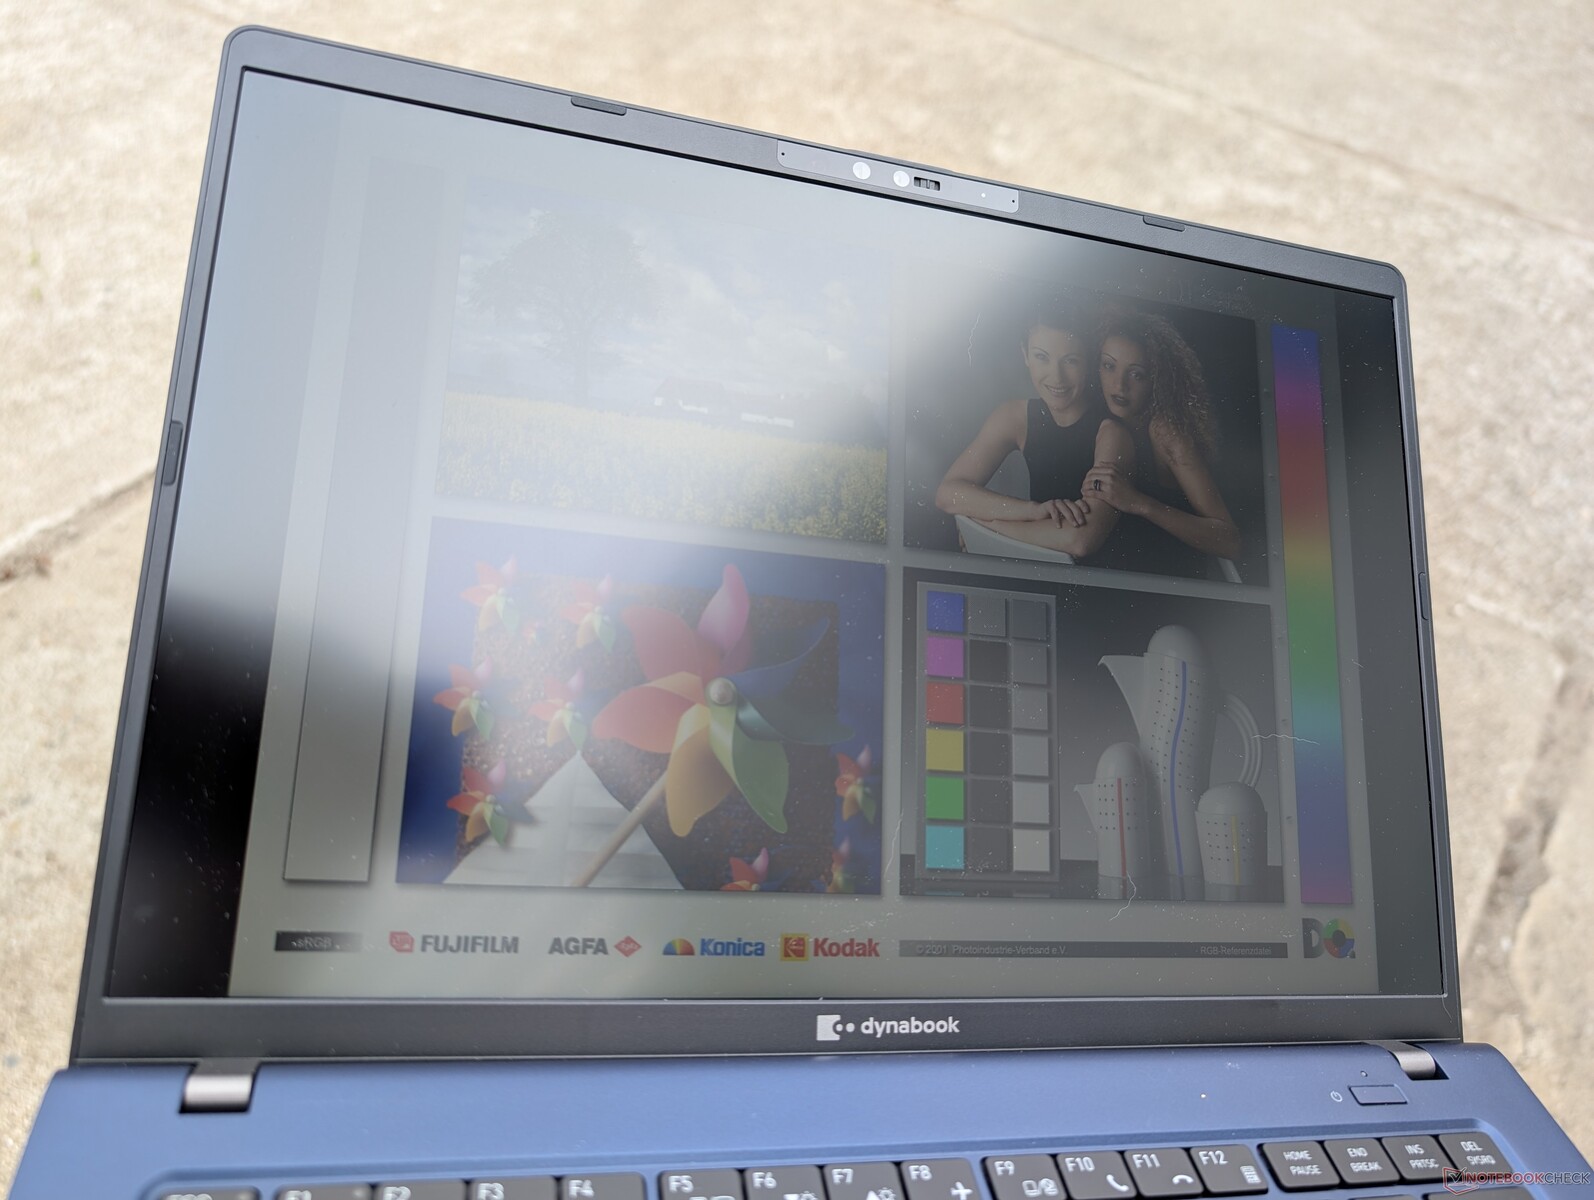
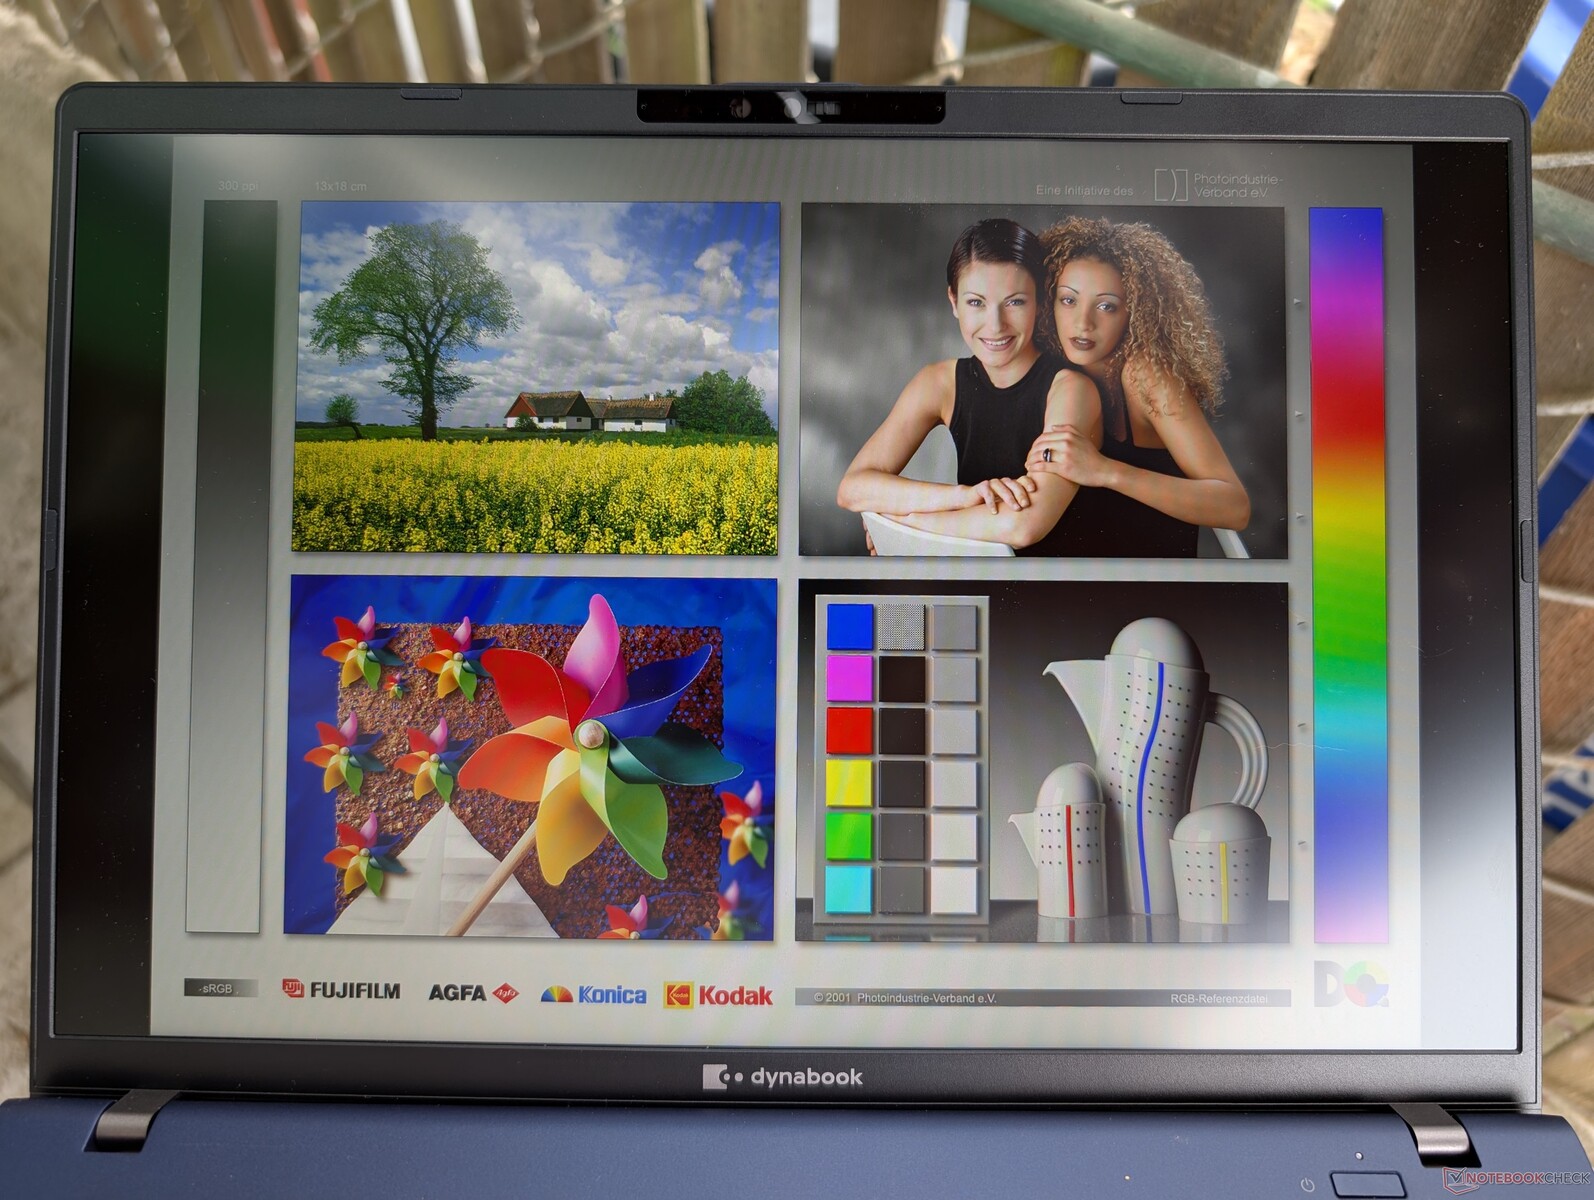
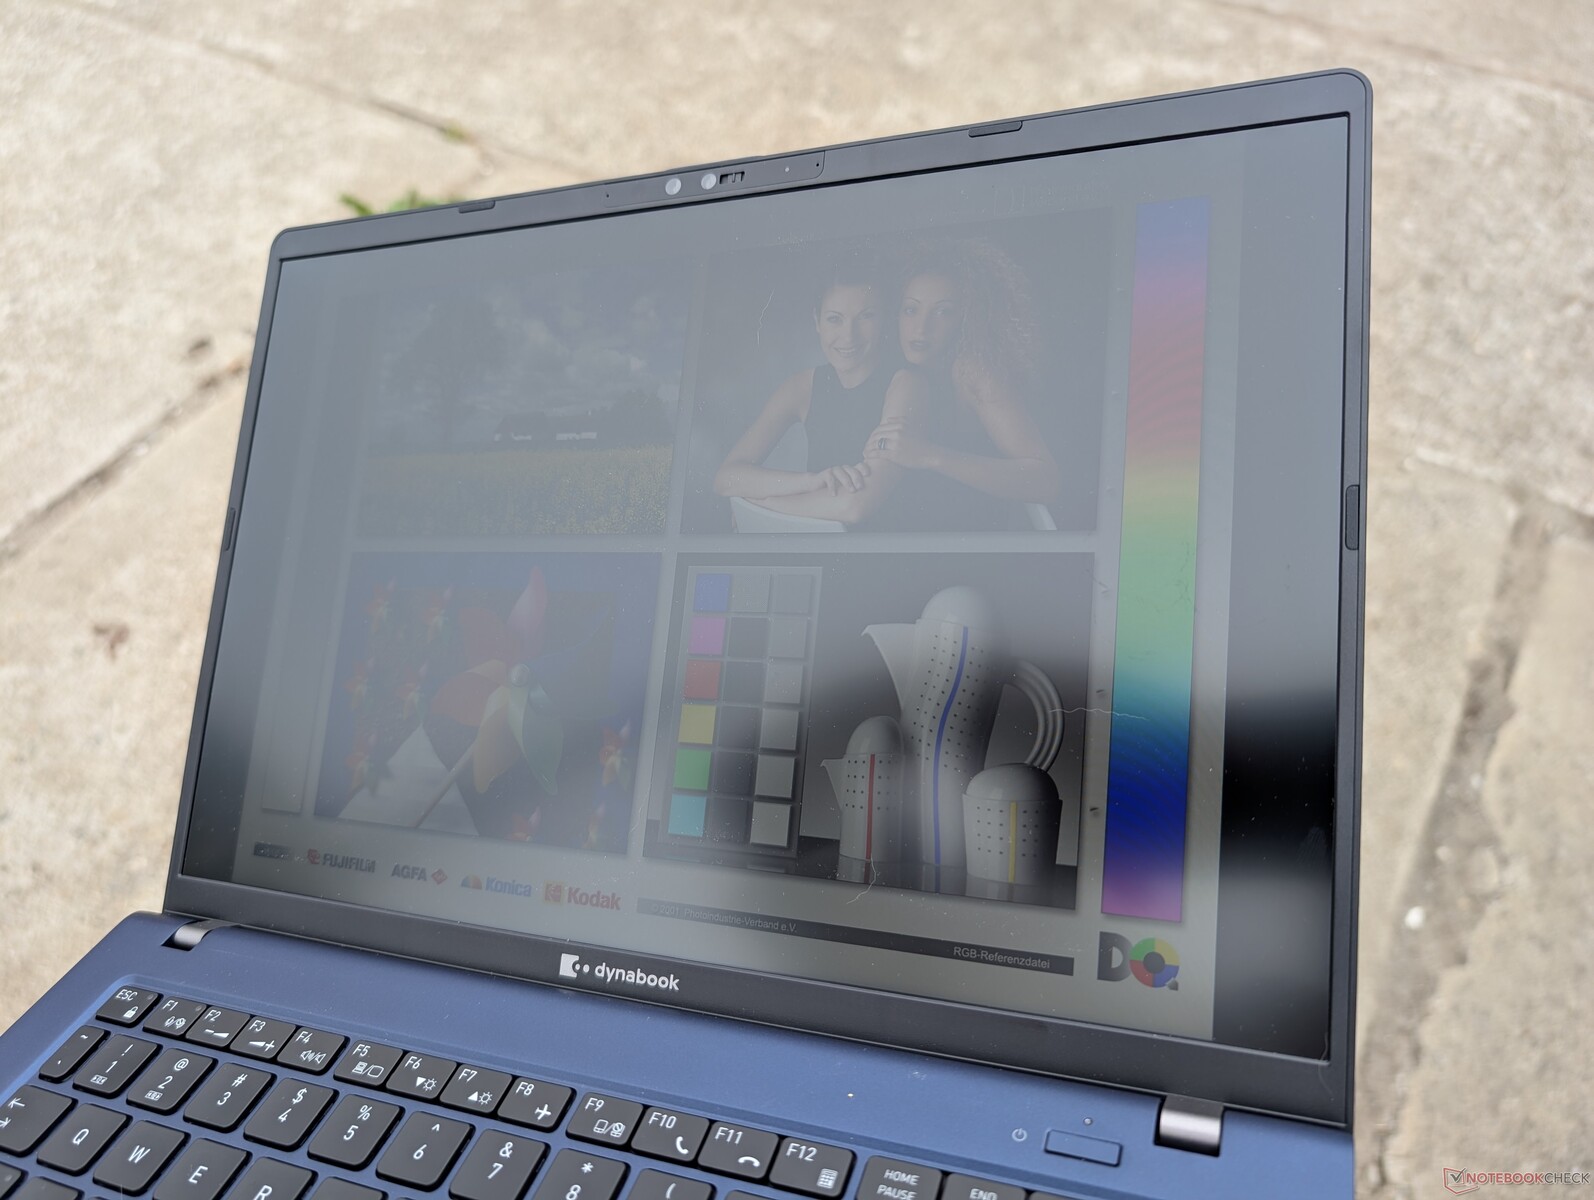
Display


| |||||||||||||||||||||||||
Ausleuchtung: 91 %
Helligkeit Akku: 445.4 cd/m²
Kontrast: 1937:1 (Schwarzwert: 0.23 cd/m²)
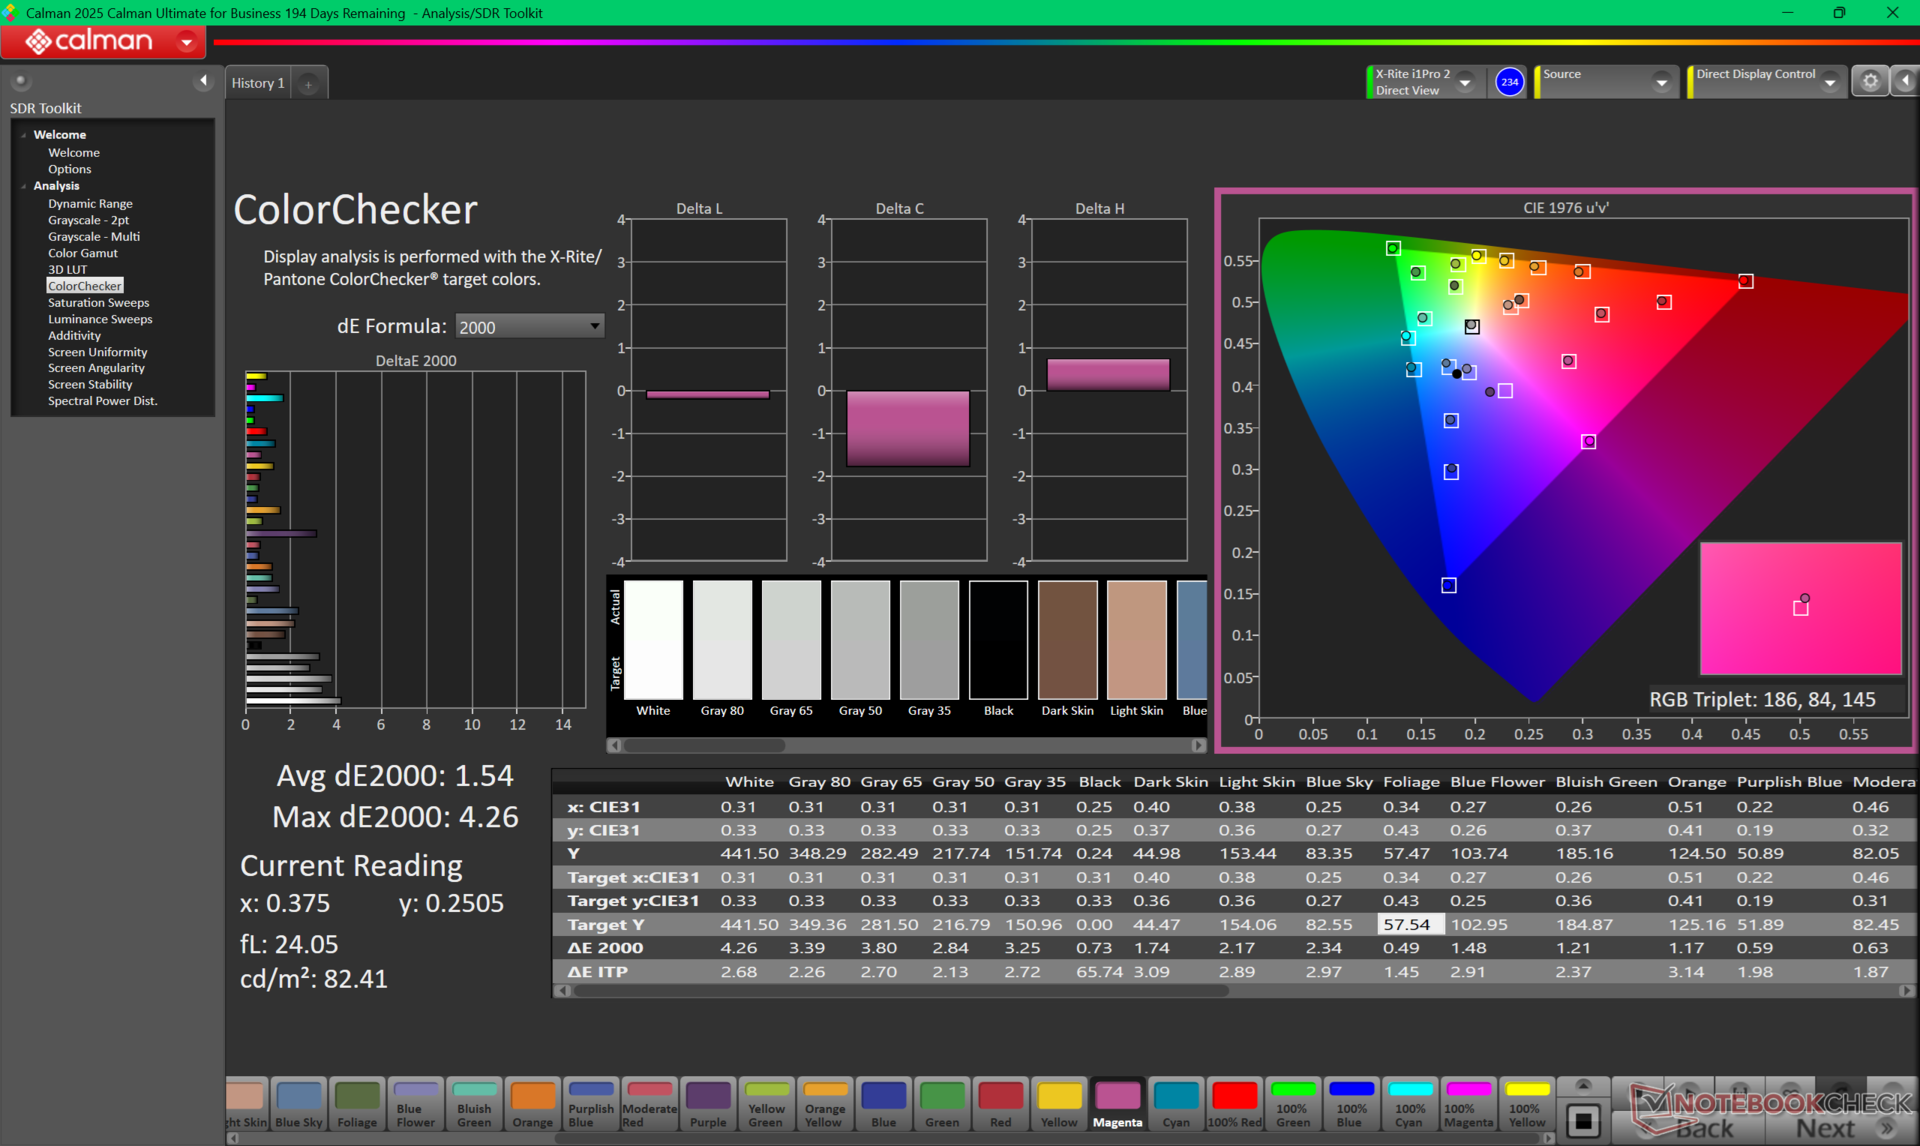
ΔE ColorChecker Calman: 2.85 | ∀{0.5-29.43 Ø4.72}
calibrated: 1.54
ΔE Greyscale Calman: 3.3 | ∀{0.09-98 Ø4.97}
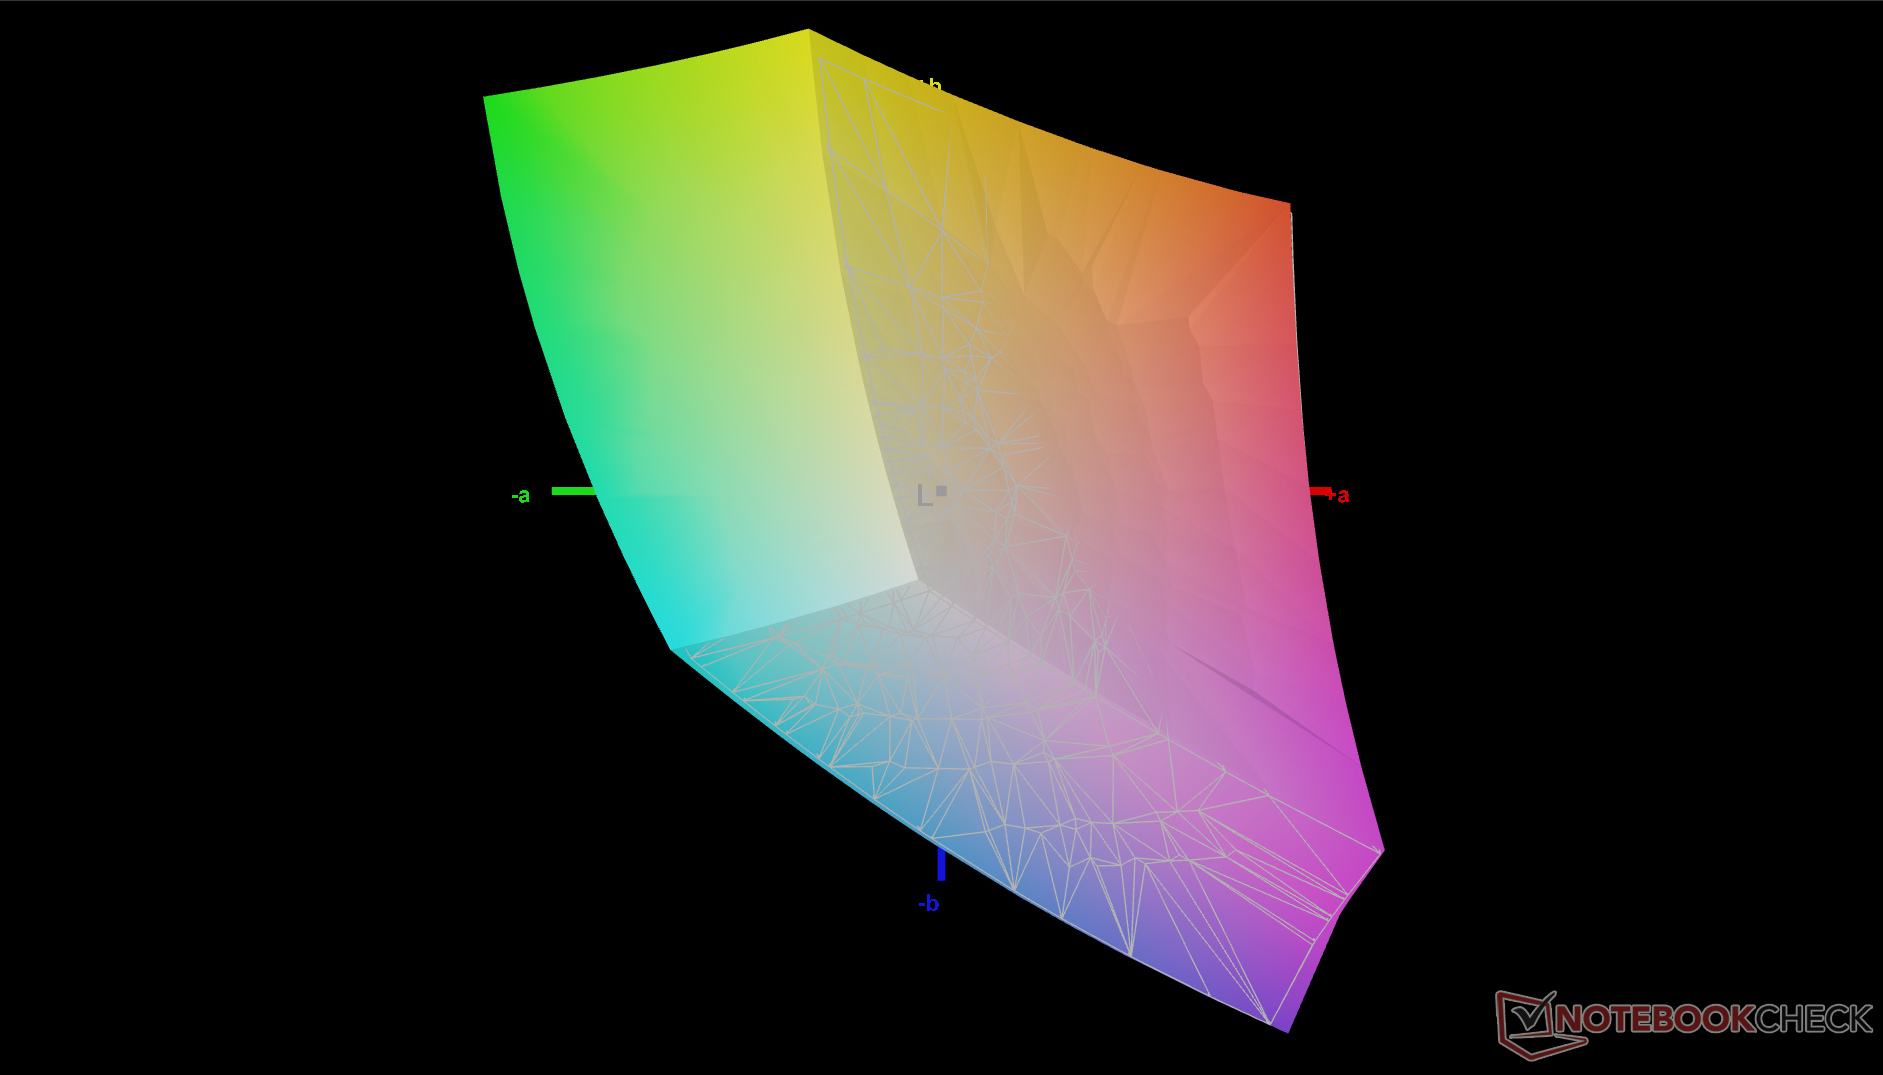
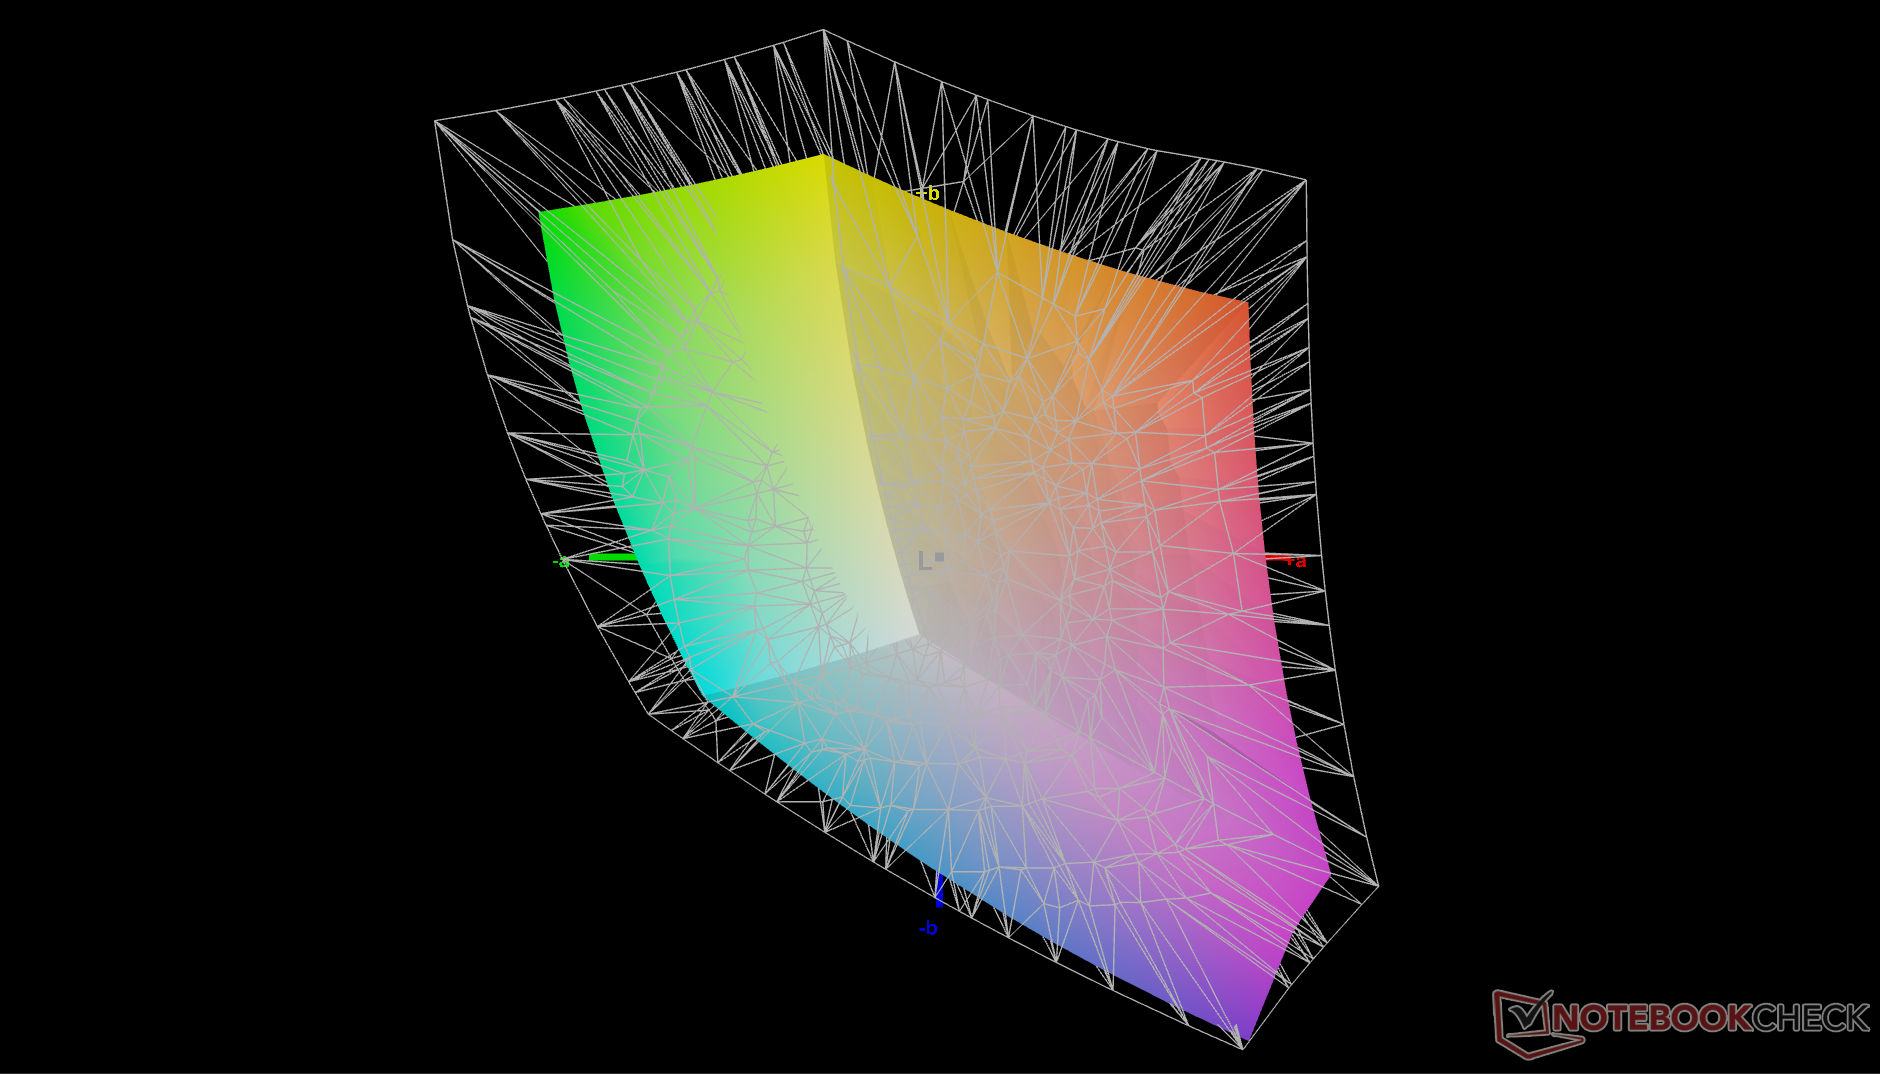
71.8% AdobeRGB 1998 (Argyll 3D)
99% sRGB (Argyll 3D)
70.1% Display P3 (Argyll 3D)
Gamma: 2.03
CCT: 6497 K
| Dynabook Portege Z40L-N BOE NE140WUM-N6K, IPS, 1920x1200, 14", 60 Hz | Dynabook Portégé X40-K Chi Mei N140HCA-EAC, IPS, 1920x1080, 14", 60 Hz | LG Gram Style 14Z90RS-G.AD7AG Samsung SDC417F ATNA40YK10-1, OLED, 2880x1800, 14", 90 Hz | Lenovo ThinkBook 14 Gen 8 21SJ007SGE LEN140WUXGA, IPS LED, 1920x1200, 14", 60 Hz | Dell Pro 14 Premium LG Phillips 140WT1, OLED, 2880x1800, 14", 60 Hz | HP EliteBook X G1i 14 AI IPS, 1920x1200, 14", 60 Hz | |
|---|---|---|---|---|---|---|
| Display | -37% | 25% | -40% | 25% | -0% | |
| Display P3 Coverage (%) | 70.1 | 43.4 -38% | 99.92 43% | 41.5 -41% | 99 41% | 69.9 0% |
| sRGB Coverage (%) | 99 | 64.6 -35% | 100 1% | 60.3 -39% | 100 1% | 98.4 -1% |
| AdobeRGB 1998 Coverage (%) | 71.8 | 44.9 -37% | 94.71 32% | 42.9 -40% | 95.8 33% | 71.6 0% |
| Response Times | 22% | 94% | 48% | 85% | -3% | |
| Response Time Grey 50% / Grey 80% * (ms) | 42.1 ? | 33.6 ? 20% | 2 ? 95% | 19.3 ? 54% | 1.4 ? 97% | 42.3 ? -0% |
| Response Time Black / White * (ms) | 26.7 ? | 20.4 ? 24% | 2 ? 93% | 15.8 ? 41% | 2.7 ? 90% | 28 ? -5% |
| PWM Frequency (Hz) | 350 | 241.1 ? | ||||
| PWM Amplitude * (%) | 100 | 32 68% | ||||
| Bildschirm | -92% | 32% | -97% | 4% | 3% | |
| Helligkeit Bildmitte (cd/m²) | 445.4 | 246.4 -45% | 384 -14% | 271 -39% | 392.3 -12% | 487.5 9% |
| Brightness (cd/m²) | 424 | 237 -44% | 388 -8% | 276 -35% | 392 -8% | 469 11% |
| Brightness Distribution (%) | 91 | 88 -3% | 97 7% | 89 -2% | 95 4% | 91 0% |
| Schwarzwert * (cd/m²) | 0.23 | 0.41 -78% | 0.054 77% | 0.29 -26% | 0.26 -13% | |
| Kontrast (:1) | 1937 | 601 -69% | 7111 267% | 934 -52% | 1875 -3% | |
| Delta E Colorchecker * | 2.85 | 6 -111% | 2.47 13% | 6.4 -125% | 3.39 -19% | 2.37 17% |
| Colorchecker dE 2000 max. * | 4.57 | 21.16 -363% | 4.33 5% | 20.7 -353% | 6.53 -43% | 5.77 -26% |
| Colorchecker dE 2000 calibrated * | 1.54 | 1.86 -21% | 2.81 -82% | 5.1 -231% | 0.99 36% | 0.86 44% |
| Delta E Graustufen * | 3.3 | 6.4 -94% | 2.63 20% | 3.6 -9% | 1.1 67% | 3.8 -15% |
| Gamma | 2.03 108% | 2.01 109% | 2.18 101% | 1.99 111% | 2.23 99% | 2.14 103% |
| CCT | 6497 100% | 6738 96% | 6279 104% | 6576 99% | 6502 100% | 6540 99% |
| Durchschnitt gesamt (Programm / Settings) | -36% /
-64% | 50% /
39% | -30% /
-64% | 38% /
27% | 0% /
1% |
* ... kleinere Werte sind besser

Reaktionszeiten (Response Times) des Displays
| ↔ Reaktionszeiten Schwarz zu Weiß | ||
|---|---|---|
| 26.7 ms ... steigend ↗ und fallend ↘ kombiniert | ↗ 12 ms steigend | 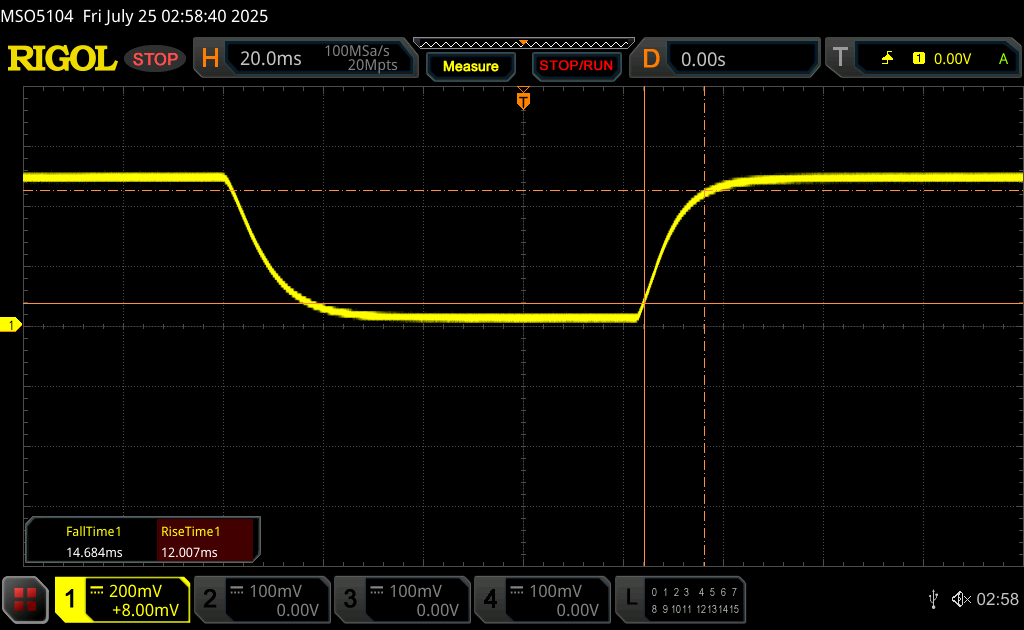 |
| ↘ 14.7 ms fallend | ||
| Die gemessenen Reaktionszeiten sind mittelmäßig und dadurch für Spieler eventuell zu langsam. Im Vergleich rangierten die bei uns getesteten Geräte von 0.1 (Minimum) zu 240 (Maximum) ms. » 67 % aller Screens waren schneller als der getestete. Daher sind die gemessenen Reaktionszeiten schlechter als der Durchschnitt aller vermessenen Geräte (19.8 ms). | ||
| ↔ Reaktionszeiten 50% Grau zu 80% Grau | ||
| 42.1 ms ... steigend ↗ und fallend ↘ kombiniert | ↗ 19.6 ms steigend | 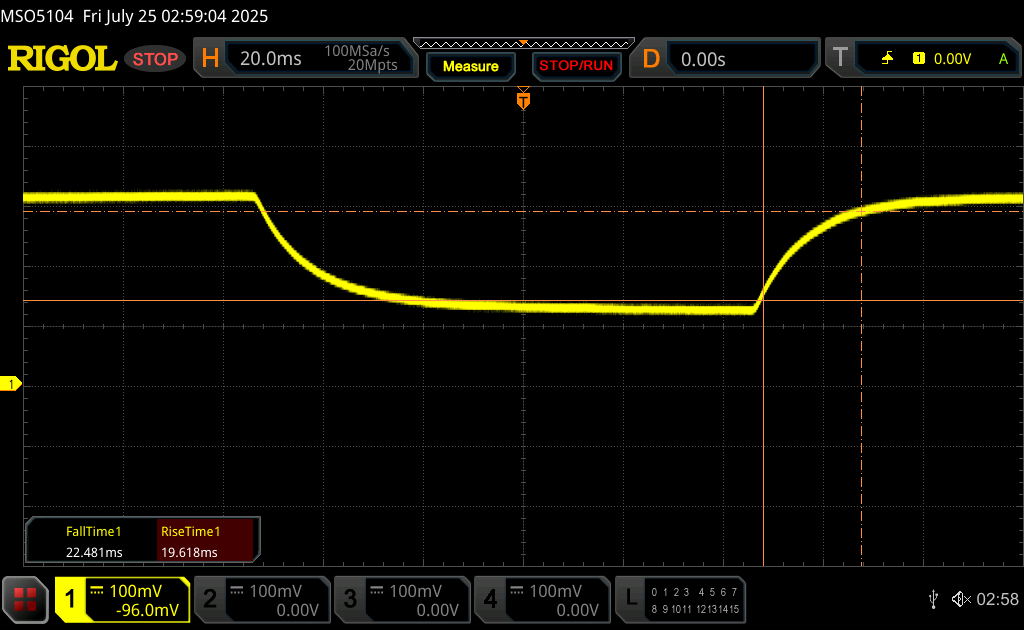 |
| ↘ 22.5 ms fallend | ||
| Die gemessenen Reaktionszeiten sind langsam und dadurch für viele Spieler wahrscheinlich zu langsam. Im Vergleich rangierten die bei uns getesteten Geräte von 0.165 (Minimum) zu 636 (Maximum) ms. » 70 % aller Screens waren schneller als der getestete. Daher sind die gemessenen Reaktionszeiten schlechter als der Durchschnitt aller vermessenen Geräte (31 ms). | ||
Bildschirm-Flackern / PWM (Pulse-Width Modulation)
| Flackern / PWM nicht festgestellt | 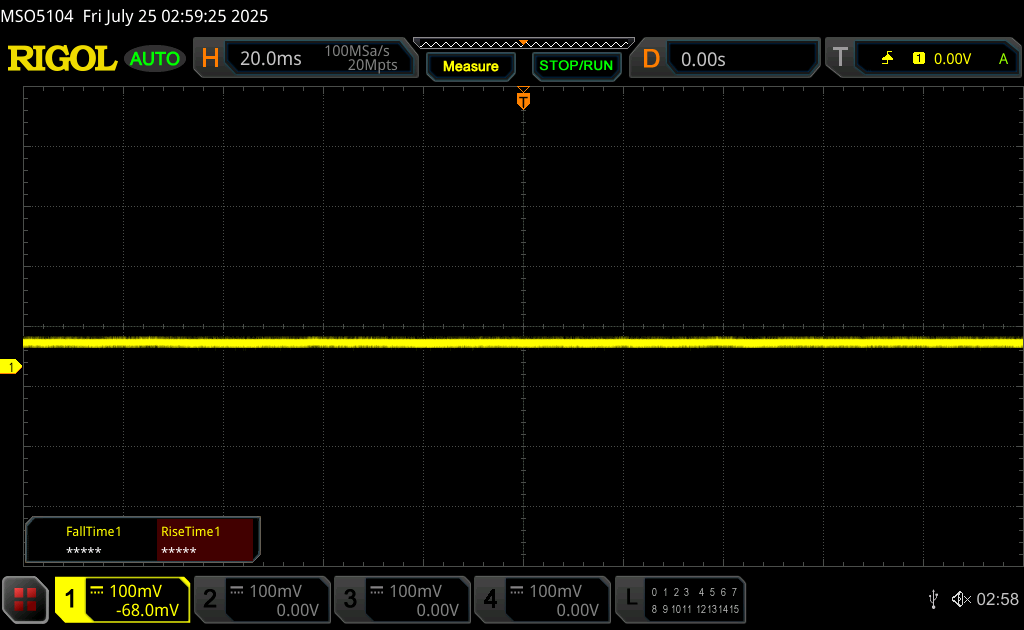 | ||
Im Vergleich: 52 % aller getesteten Geräte nutzten kein PWM um die Helligkeit zu reduzieren. Wenn PWM eingesetzt wurde, dann bei einer Frequenz von durchschnittlich 7778 (Minimum 5, Maximum 343500) Hz. | |||


Performance
Testbedingungen
Wir haben Windows in den Modus Performance versetzt, bevor wir die folgenden Benchmarks durchgeführt haben.
Prozessor
Cinebench R15 Multi Loop
Cinebench R23: Multi Core | Single Core
Cinebench R20: CPU (Multi Core) | CPU (Single Core)
Cinebench R15: CPU Multi 64Bit | CPU Single 64Bit
Blender: v2.79 BMW27 CPU
7-Zip 18.03: 7z b 4 | 7z b 4 -mmt1
Geekbench 6.7: Multi-Core | Single-Core
Geekbench 5.5: Multi-Core | Single-Core
HWBOT x265 Benchmark v2.2: 4k Preset
LibreOffice : 20 Documents To PDF
R Benchmark 2.5: Overall mean
* ... kleinere Werte sind besser
AIDA64: FP32 Ray-Trace | FPU Julia | CPU SHA3 | CPU Queen | FPU SinJulia | FPU Mandel | CPU AES | CPU ZLib | FP64 Ray-Trace | CPU PhotoWorxx
| Performance Rating | |
| Lenovo ThinkBook 14 Gen 8 21SJ007SGE | |
| HP EliteBook X G1i 14 AI | |
| Dell Pro 14 Premium | |
| Durchschnittliche Intel Core Ultra 7 258V | |
| Dynabook Portégé X40-K | |
| LG Gram Style 14Z90RS-G.AD7AG | |
| Dynabook Portege Z40L-N | |
| AIDA64 / FP32 Ray-Trace | |
| Lenovo ThinkBook 14 Gen 8 21SJ007SGE | |
| HP EliteBook X G1i 14 AI | |
| Dell Pro 14 Premium | |
| Durchschnittliche Intel Core Ultra 7 258V (8454 - 12781, n=26) | |
| Dynabook Portégé X40-K | |
| Dynabook Portege Z40L-N | |
| LG Gram Style 14Z90RS-G.AD7AG | |
| AIDA64 / FPU Julia | |
| Lenovo ThinkBook 14 Gen 8 21SJ007SGE | |
| HP EliteBook X G1i 14 AI | |
| Dell Pro 14 Premium | |
| Durchschnittliche Intel Core Ultra 7 258V (40875 - 63401, n=26) | |
| Dynabook Portégé X40-K | |
| Dynabook Portege Z40L-N | |
| LG Gram Style 14Z90RS-G.AD7AG | |
| AIDA64 / CPU SHA3 | |
| Lenovo ThinkBook 14 Gen 8 21SJ007SGE | |
| HP EliteBook X G1i 14 AI | |
| Dell Pro 14 Premium | |
| Durchschnittliche Intel Core Ultra 7 258V (1930 - 2817, n=26) | |
| Dynabook Portégé X40-K | |
| Dynabook Portege Z40L-N | |
| LG Gram Style 14Z90RS-G.AD7AG | |
| AIDA64 / CPU Queen | |
| Dynabook Portégé X40-K | |
| LG Gram Style 14Z90RS-G.AD7AG | |
| Lenovo ThinkBook 14 Gen 8 21SJ007SGE | |
| Dell Pro 14 Premium | |
| Durchschnittliche Intel Core Ultra 7 258V (48816 - 49818, n=24) | |
| HP EliteBook X G1i 14 AI | |
| Dynabook Portege Z40L-N | |
| AIDA64 / FPU SinJulia | |
| Lenovo ThinkBook 14 Gen 8 21SJ007SGE | |
| Dynabook Portégé X40-K | |
| LG Gram Style 14Z90RS-G.AD7AG | |
| Dell Pro 14 Premium | |
| HP EliteBook X G1i 14 AI | |
| Durchschnittliche Intel Core Ultra 7 258V (3817 - 4440, n=26) | |
| Dynabook Portege Z40L-N | |
| AIDA64 / FPU Mandel | |
| Lenovo ThinkBook 14 Gen 8 21SJ007SGE | |
| HP EliteBook X G1i 14 AI | |
| Dell Pro 14 Premium | |
| Durchschnittliche Intel Core Ultra 7 258V (21670 - 33565, n=26) | |
| Dynabook Portege Z40L-N | |
| Dynabook Portégé X40-K | |
| LG Gram Style 14Z90RS-G.AD7AG | |
| AIDA64 / CPU AES | |
| Lenovo ThinkBook 14 Gen 8 21SJ007SGE | |
| Dynabook Portégé X40-K | |
| Dell Pro 14 Premium | |
| HP EliteBook X G1i 14 AI | |
| Durchschnittliche Intel Core Ultra 7 258V (30957 - 40753, n=26) | |
| LG Gram Style 14Z90RS-G.AD7AG | |
| Dynabook Portege Z40L-N | |
| AIDA64 / CPU ZLib | |
| Lenovo ThinkBook 14 Gen 8 21SJ007SGE | |
| Dynabook Portégé X40-K | |
| HP EliteBook X G1i 14 AI | |
| Dell Pro 14 Premium | |
| Durchschnittliche Intel Core Ultra 7 258V (422 - 632, n=26) | |
| LG Gram Style 14Z90RS-G.AD7AG | |
| Dynabook Portege Z40L-N | |
| AIDA64 / FP64 Ray-Trace | |
| Lenovo ThinkBook 14 Gen 8 21SJ007SGE | |
| HP EliteBook X G1i 14 AI | |
| Dell Pro 14 Premium | |
| Durchschnittliche Intel Core Ultra 7 258V (4258 - 6930, n=26) | |
| Dynabook Portege Z40L-N | |
| Dynabook Portégé X40-K | |
| LG Gram Style 14Z90RS-G.AD7AG | |
| AIDA64 / CPU PhotoWorxx | |
| HP EliteBook X G1i 14 AI | |
| Dell Pro 14 Premium | |
| Durchschnittliche Intel Core Ultra 7 258V (44223 - 59245, n=26) | |
| Lenovo ThinkBook 14 Gen 8 21SJ007SGE | |
| Dynabook Portege Z40L-N | |
| LG Gram Style 14Z90RS-G.AD7AG | |
| Dynabook Portégé X40-K | |
Stresstest
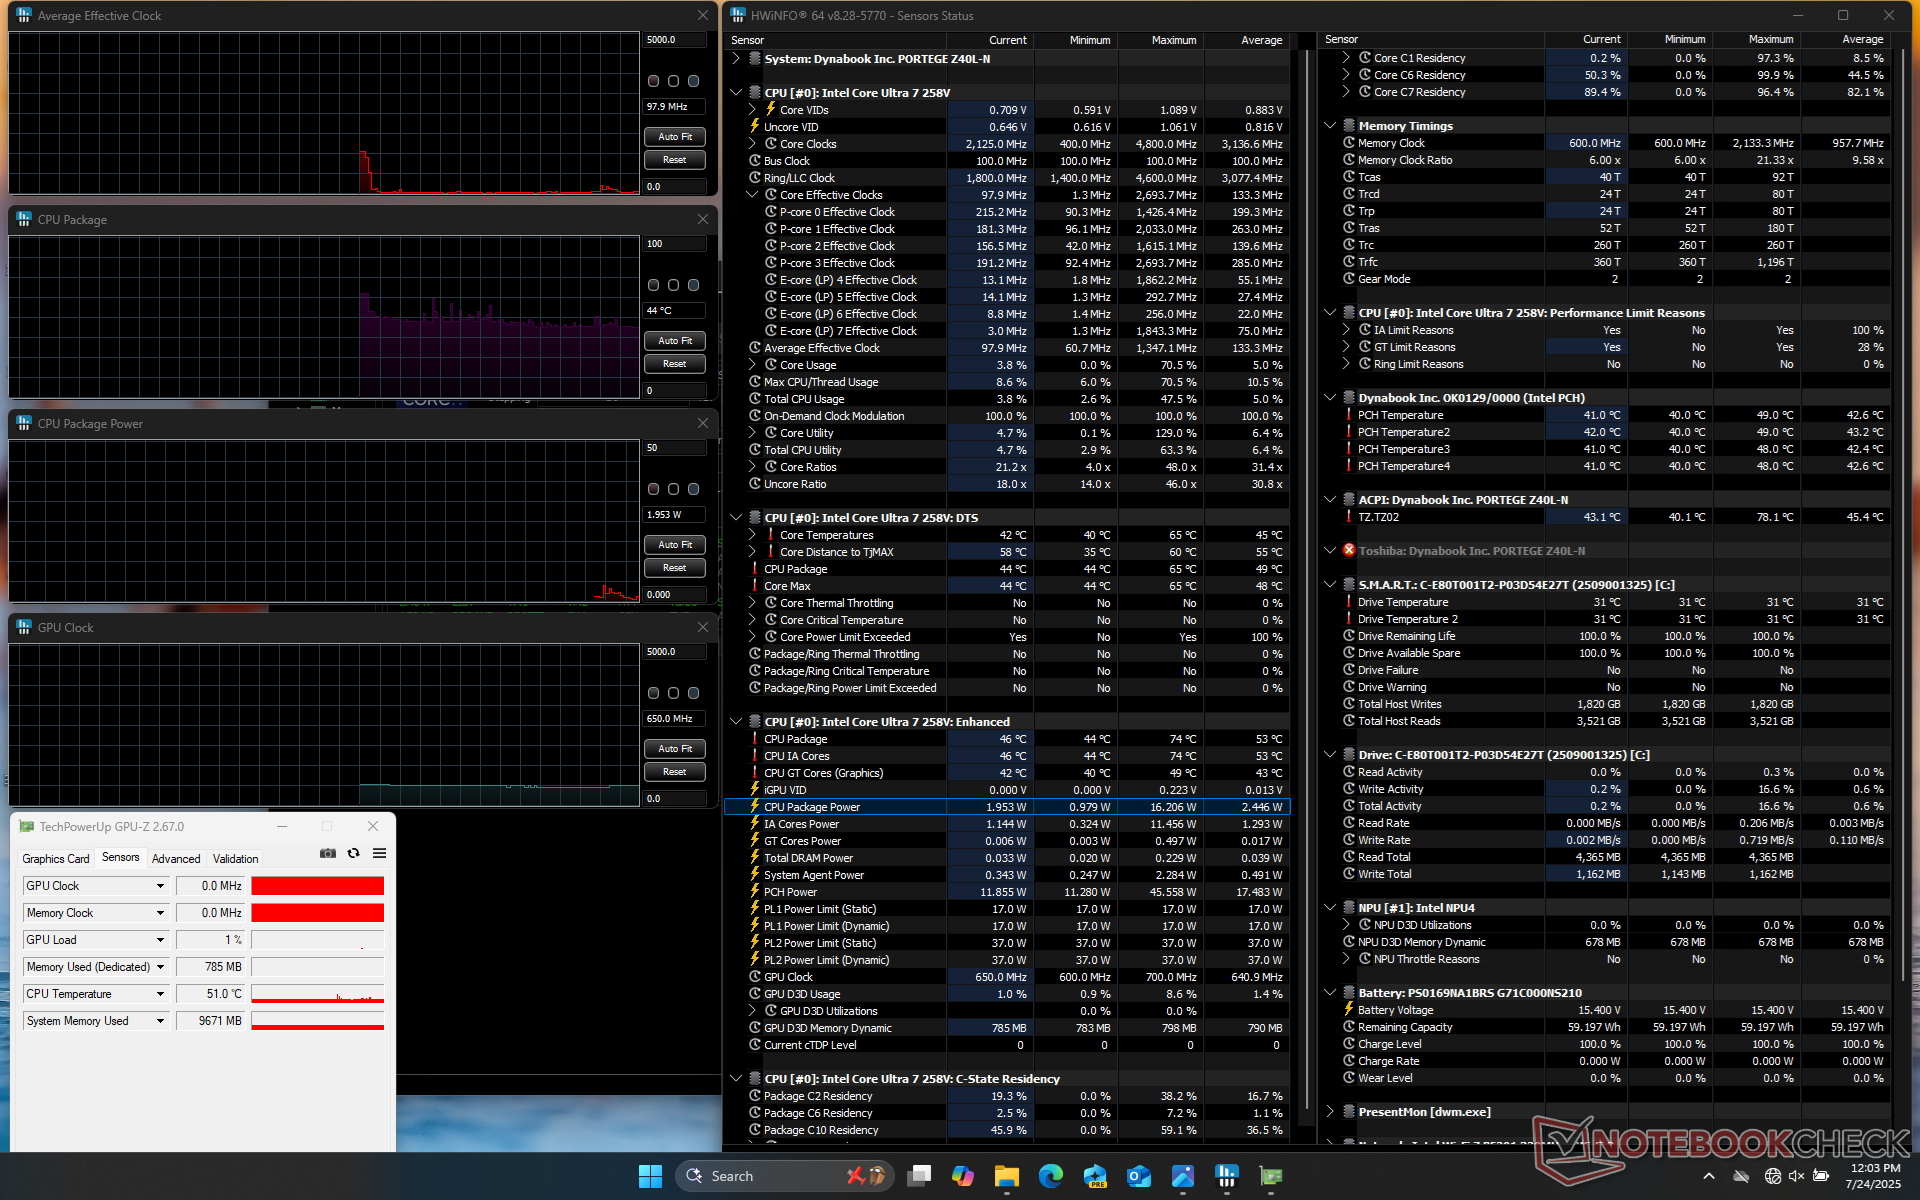
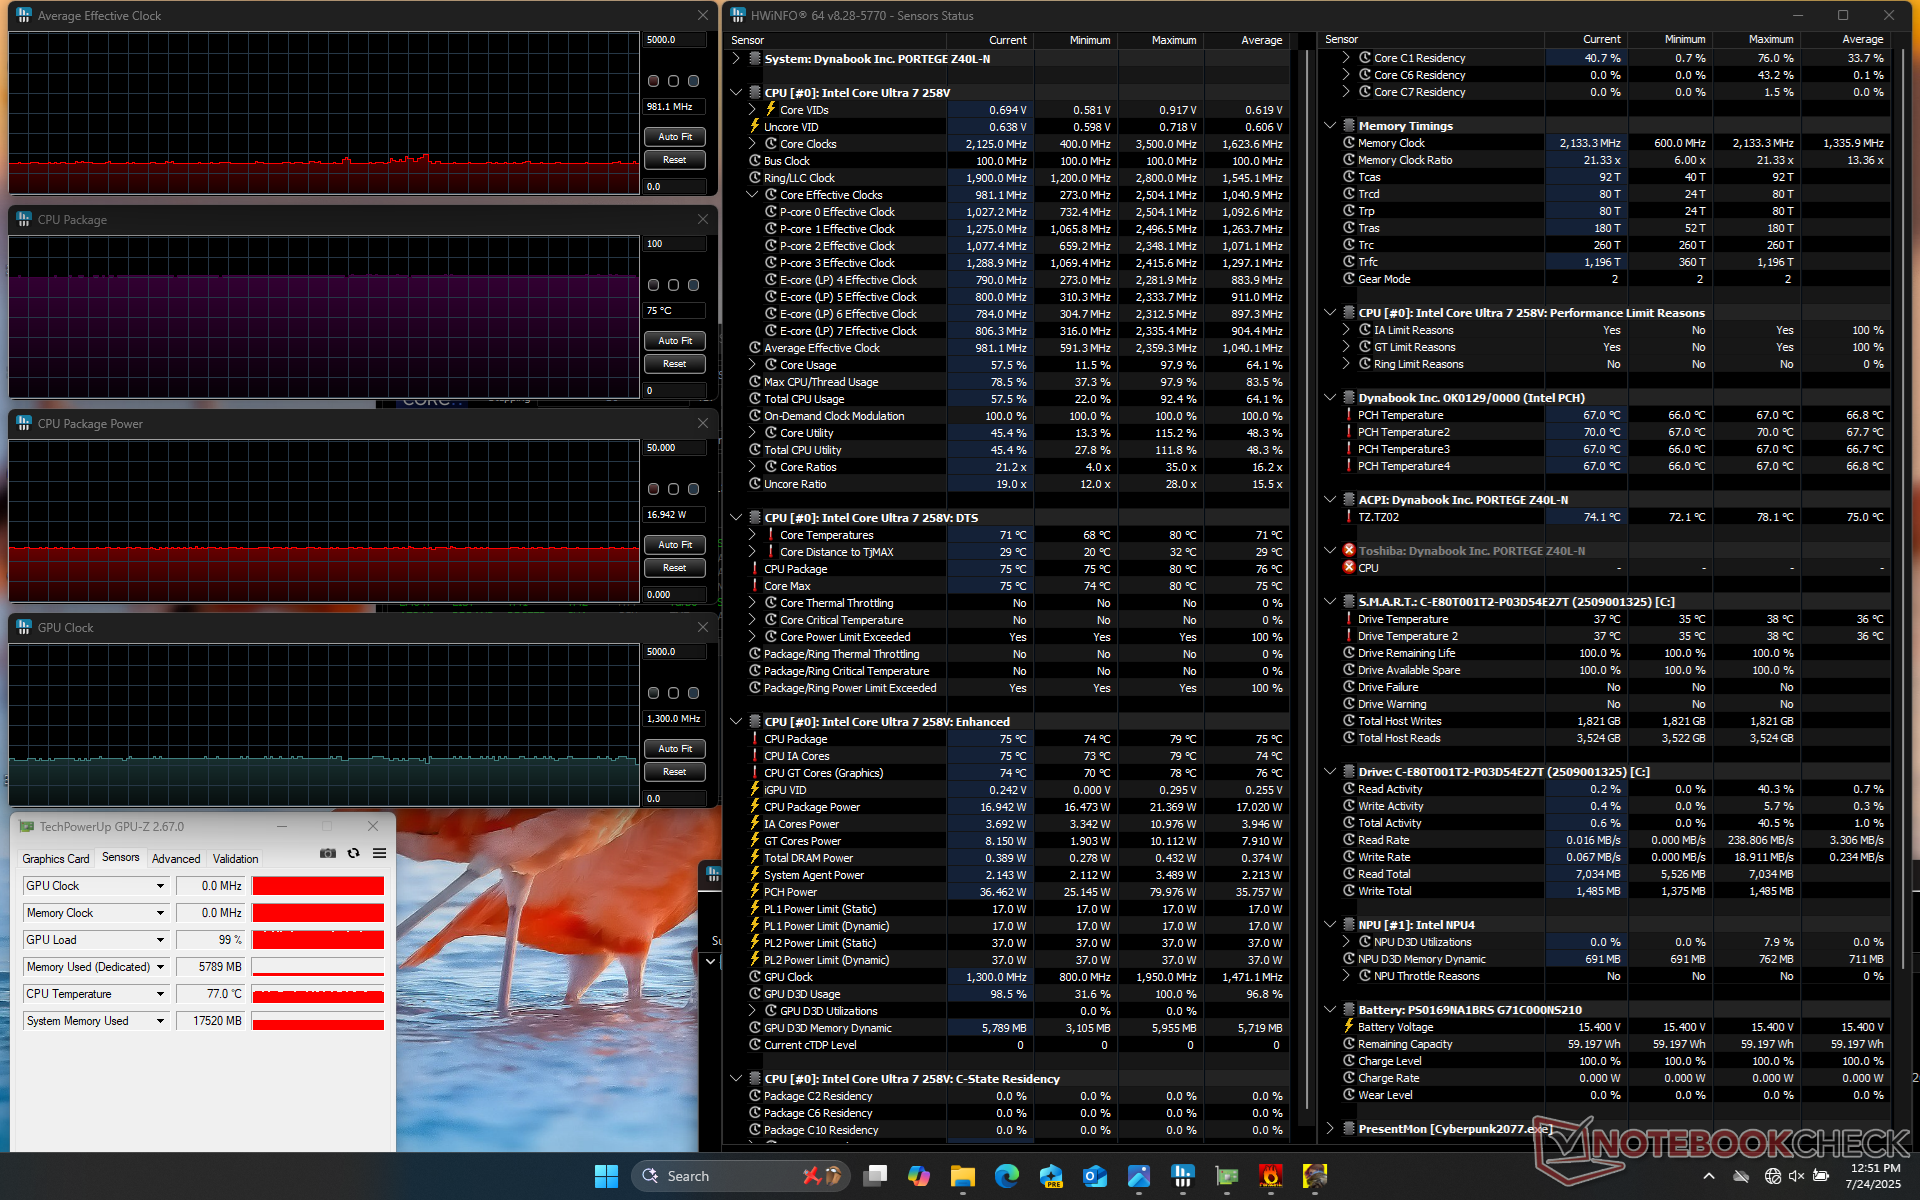
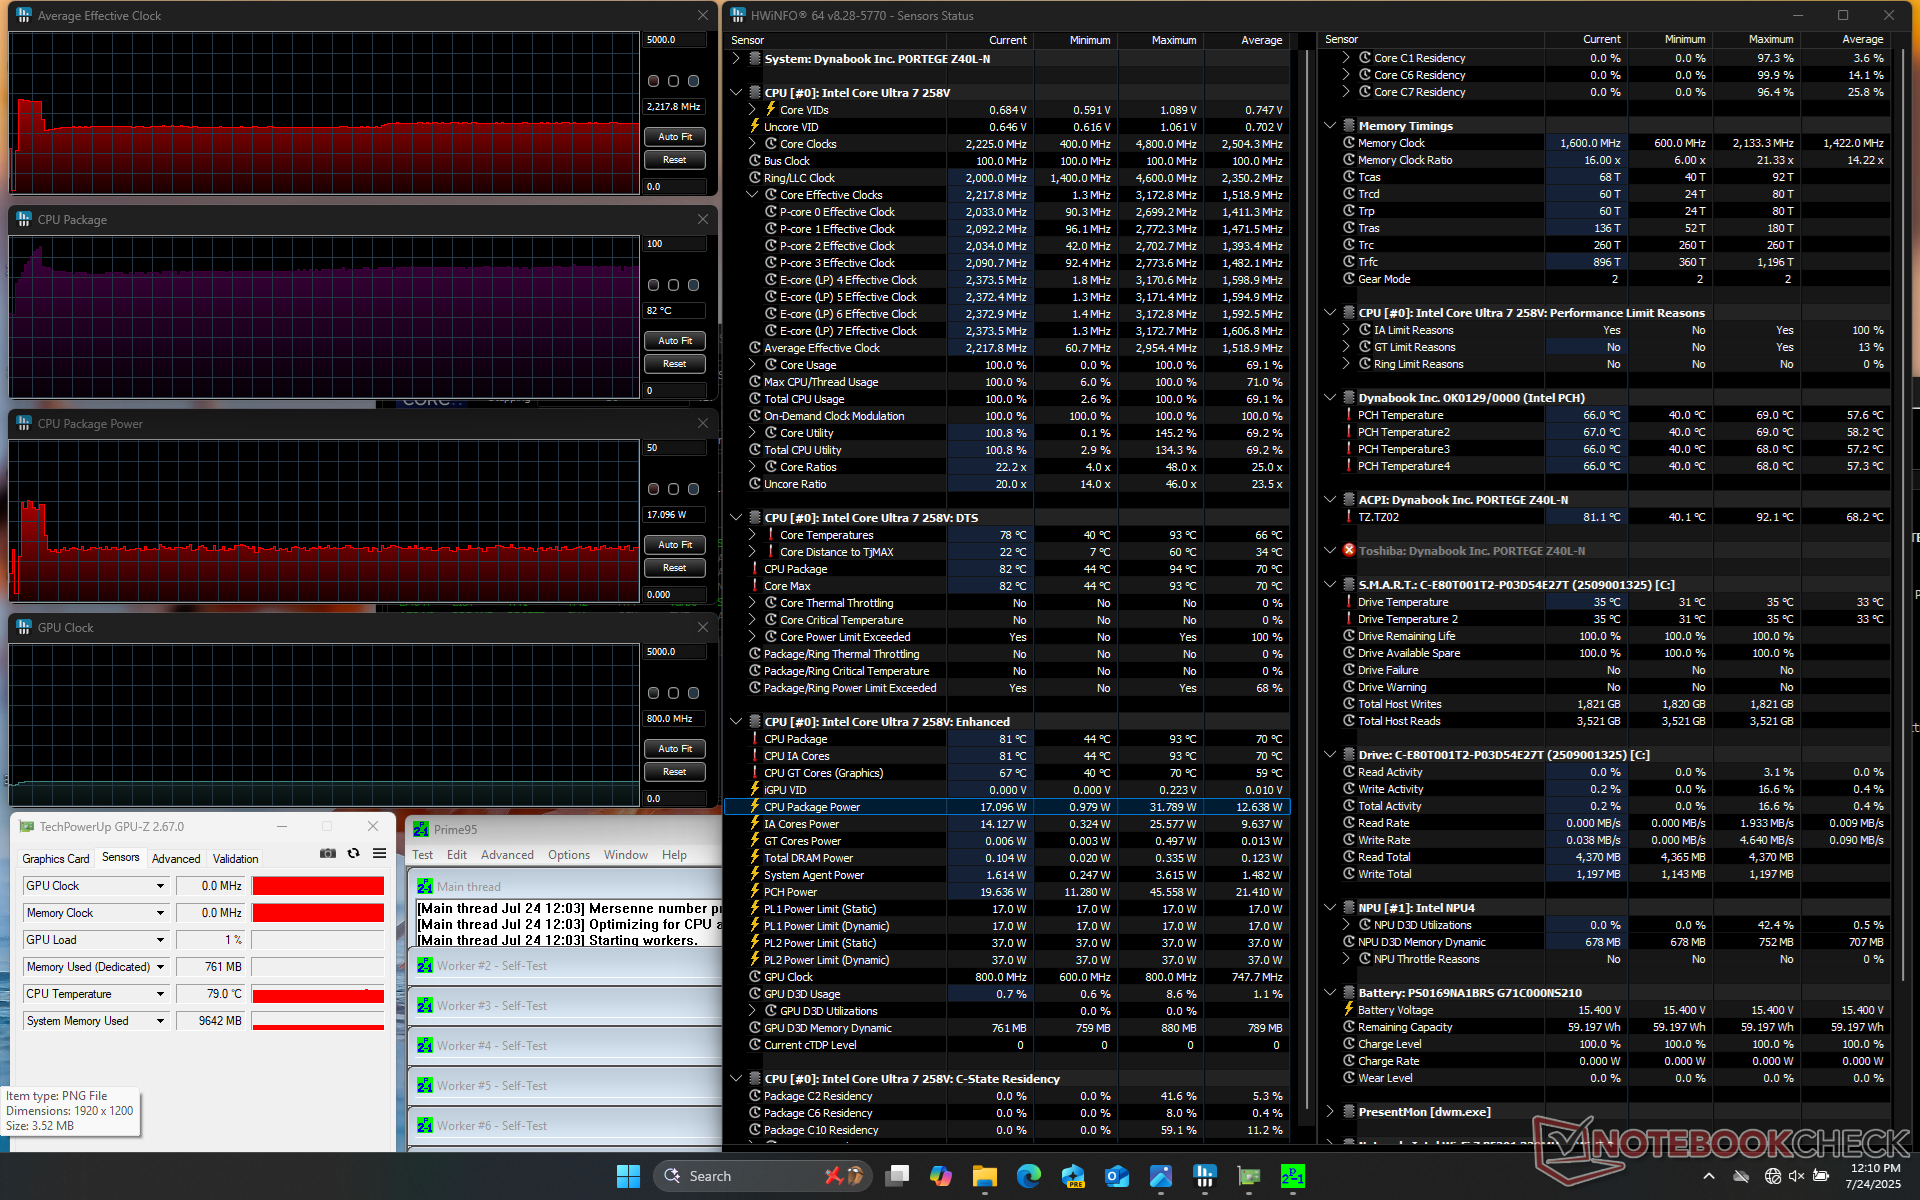
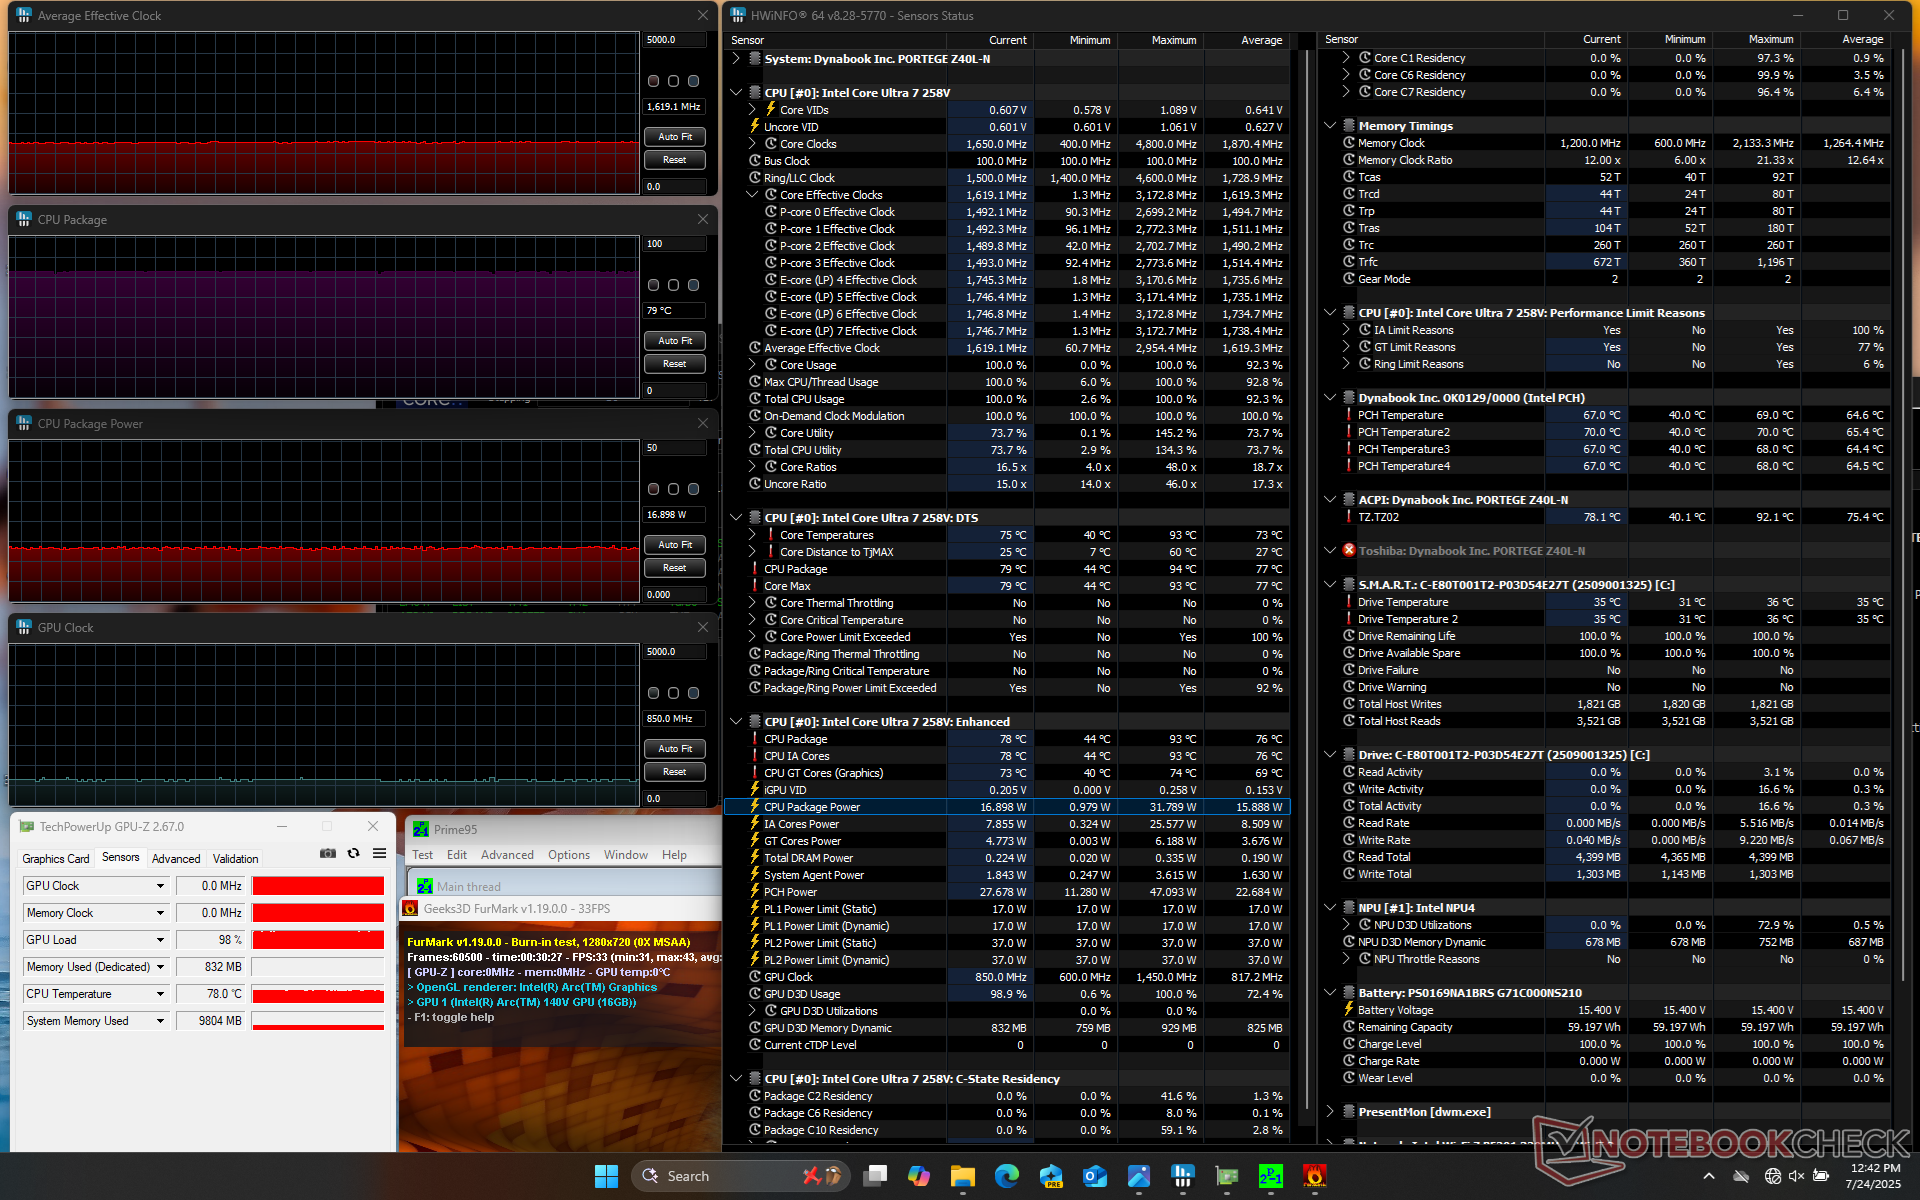
| durchschnittlicher CPU-Takt (GHz) | GPU-Takt (MHz) | durchschnittliche CPU-Temperatur (°C) | |
| System Leerlauf | -- | -- | 44 |
| Prime95 Stress | 2,2 | 800 | 82 |
| Prime95 + FurMark Stress | 1,6 | 850 | 79 |
| Cyberpunk 2077 Stress | 0,98 | 1.300 | 75 |
System Performance
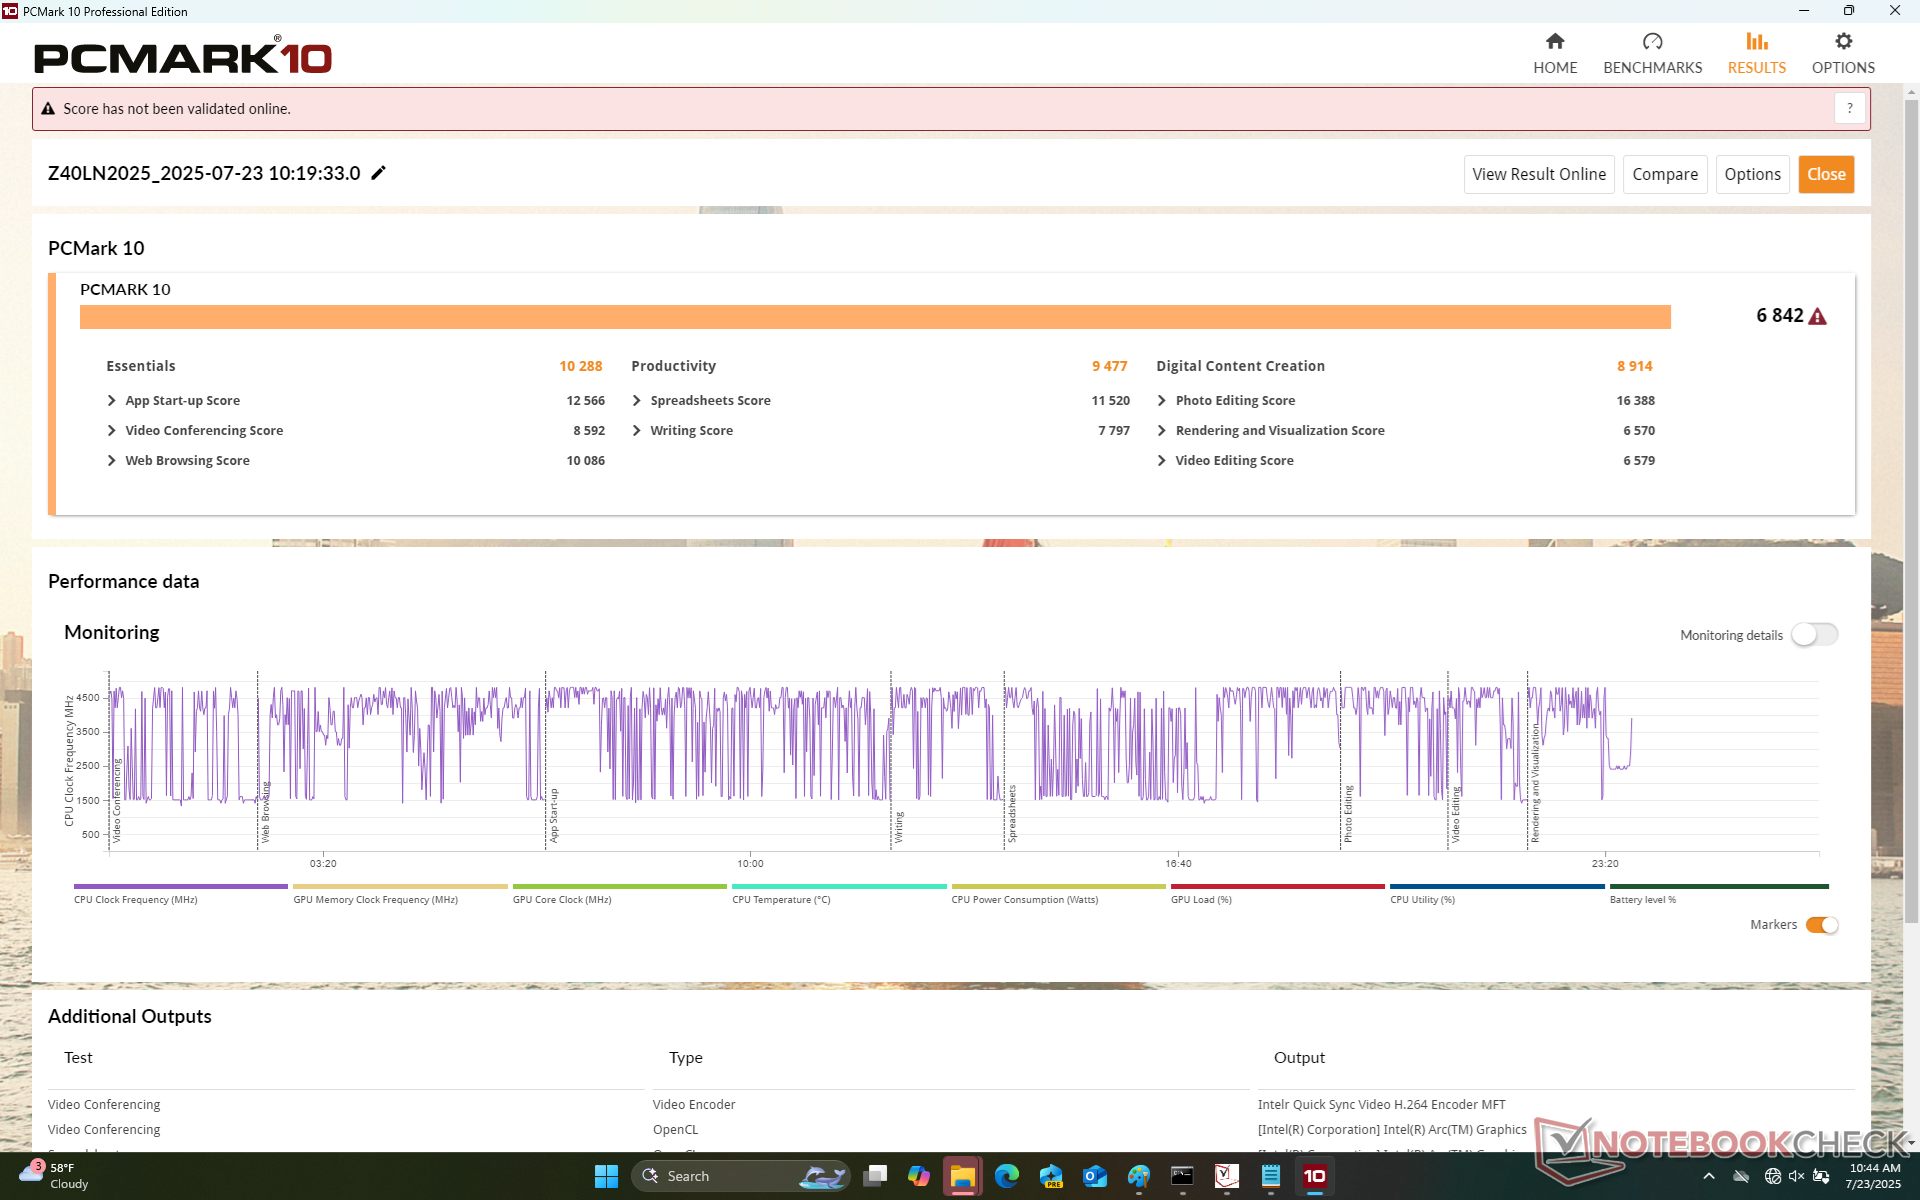
PCMark 10: Score | Essentials | Productivity | Digital Content Creation
CrossMark: Overall | Productivity | Creativity | Responsiveness
WebXPRT 3: Overall
WebXPRT 4: Overall
Mozilla Kraken 1.1: Total
| Performance Rating | |
| Lenovo ThinkBook 14 Gen 8 21SJ007SGE | |
| Dell Pro 14 Premium | |
| HP EliteBook X G1i 14 AI | |
| Durchschnittliche Intel Core Ultra 7 258V, Intel Arc Graphics 140V | |
| Dynabook Portege Z40L-N | |
| LG Gram Style 14Z90RS-G.AD7AG | |
| Dynabook Portégé X40-K | |
| PCMark 10 / Score | |
| Lenovo ThinkBook 14 Gen 8 21SJ007SGE | |
| Dell Pro 14 Premium | |
| HP EliteBook X G1i 14 AI | |
| Durchschnittliche Intel Core Ultra 7 258V, Intel Arc Graphics 140V (6265 - 7420, n=23) | |
| Dynabook Portege Z40L-N | |
| LG Gram Style 14Z90RS-G.AD7AG | |
| Dynabook Portégé X40-K | |
| PCMark 10 / Essentials | |
| Lenovo ThinkBook 14 Gen 8 21SJ007SGE | |
| LG Gram Style 14Z90RS-G.AD7AG | |
| Dell Pro 14 Premium | |
| HP EliteBook X G1i 14 AI | |
| Durchschnittliche Intel Core Ultra 7 258V, Intel Arc Graphics 140V (9295 - 11467, n=23) | |
| Dynabook Portege Z40L-N | |
| Dynabook Portégé X40-K | |
| PCMark 10 / Productivity | |
| Lenovo ThinkBook 14 Gen 8 21SJ007SGE | |
| Dynabook Portege Z40L-N | |
| Dell Pro 14 Premium | |
| HP EliteBook X G1i 14 AI | |
| Durchschnittliche Intel Core Ultra 7 258V, Intel Arc Graphics 140V (7357 - 13600, n=23) | |
| LG Gram Style 14Z90RS-G.AD7AG | |
| Dynabook Portégé X40-K | |
| PCMark 10 / Digital Content Creation | |
| Lenovo ThinkBook 14 Gen 8 21SJ007SGE | |
| HP EliteBook X G1i 14 AI | |
| Dell Pro 14 Premium | |
| Durchschnittliche Intel Core Ultra 7 258V, Intel Arc Graphics 140V (8160 - 10308, n=23) | |
| Dynabook Portege Z40L-N | |
| Dynabook Portégé X40-K | |
| LG Gram Style 14Z90RS-G.AD7AG | |
| CrossMark / Overall | |
| Lenovo ThinkBook 14 Gen 8 21SJ007SGE | |
| Dell Pro 14 Premium | |
| Durchschnittliche Intel Core Ultra 7 258V, Intel Arc Graphics 140V (1275 - 1742, n=22) | |
| HP EliteBook X G1i 14 AI | |
| LG Gram Style 14Z90RS-G.AD7AG | |
| Dynabook Portege Z40L-N | |
| Dynabook Portégé X40-K | |
| CrossMark / Productivity | |
| Lenovo ThinkBook 14 Gen 8 21SJ007SGE | |
| Dell Pro 14 Premium | |
| HP EliteBook X G1i 14 AI | |
| Durchschnittliche Intel Core Ultra 7 258V, Intel Arc Graphics 140V (1267 - 1684, n=22) | |
| Dynabook Portege Z40L-N | |
| LG Gram Style 14Z90RS-G.AD7AG | |
| Dynabook Portégé X40-K | |
| CrossMark / Creativity | |
| Lenovo ThinkBook 14 Gen 8 21SJ007SGE | |
| Dell Pro 14 Premium | |
| HP EliteBook X G1i 14 AI | |
| Durchschnittliche Intel Core Ultra 7 258V, Intel Arc Graphics 140V (1393 - 1977, n=22) | |
| Dynabook Portege Z40L-N | |
| LG Gram Style 14Z90RS-G.AD7AG | |
| Dynabook Portégé X40-K | |
| CrossMark / Responsiveness | |
| Lenovo ThinkBook 14 Gen 8 21SJ007SGE | |
| LG Gram Style 14Z90RS-G.AD7AG | |
| Dell Pro 14 Premium | |
| Durchschnittliche Intel Core Ultra 7 258V, Intel Arc Graphics 140V (999 - 1411, n=22) | |
| Dynabook Portege Z40L-N | |
| Dynabook Portégé X40-K | |
| HP EliteBook X G1i 14 AI | |
| WebXPRT 3 / Overall | |
| Lenovo ThinkBook 14 Gen 8 21SJ007SGE | |
| Dell Pro 14 Premium | |
| HP EliteBook X G1i 14 AI | |
| Dynabook Portege Z40L-N | |
| Durchschnittliche Intel Core Ultra 7 258V, Intel Arc Graphics 140V (219 - 317, n=22) | |
| Dynabook Portégé X40-K | |
| LG Gram Style 14Z90RS-G.AD7AG | |
| WebXPRT 4 / Overall | |
| Lenovo ThinkBook 14 Gen 8 21SJ007SGE | |
| Dell Pro 14 Premium | |
| HP EliteBook X G1i 14 AI | |
| Dynabook Portege Z40L-N | |
| Durchschnittliche Intel Core Ultra 7 258V, Intel Arc Graphics 140V (199.5 - 291, n=22) | |
| Dynabook Portégé X40-K | |
| LG Gram Style 14Z90RS-G.AD7AG | |
| Mozilla Kraken 1.1 / Total | |
| LG Gram Style 14Z90RS-G.AD7AG | |
| Dynabook Portégé X40-K | |
| Durchschnittliche Intel Core Ultra 7 258V, Intel Arc Graphics 140V (468 - 559, n=24) | |
| Dynabook Portege Z40L-N | |
| HP EliteBook X G1i 14 AI | |
| Dell Pro 14 Premium | |
| Lenovo ThinkBook 14 Gen 8 21SJ007SGE | |
* ... kleinere Werte sind besser
| PCMark 10 Score | 6842 Punkte | |
Hilfe | ||
| AIDA64 / Memory Copy | |
| Durchschnittliche Intel Core Ultra 7 258V (104408 - 114336, n=24) | |
| Dell Pro 14 Premium | |
| HP EliteBook X G1i 14 AI | |
| Dynabook Portege Z40L-N | |
| Lenovo ThinkBook 14 Gen 8 21SJ007SGE | |
| LG Gram Style 14Z90RS-G.AD7AG | |
| Dynabook Portégé X40-K | |
| AIDA64 / Memory Read | |
| Dell Pro 14 Premium | |
| Durchschnittliche Intel Core Ultra 7 258V (82846 - 89417, n=24) | |
| Dynabook Portege Z40L-N | |
| HP EliteBook X G1i 14 AI | |
| Lenovo ThinkBook 14 Gen 8 21SJ007SGE | |
| LG Gram Style 14Z90RS-G.AD7AG | |
| Dynabook Portégé X40-K | |
| AIDA64 / Memory Write | |
| Dell Pro 14 Premium | |
| Durchschnittliche Intel Core Ultra 7 258V (108824 - 117989, n=24) | |
| Dynabook Portege Z40L-N | |
| HP EliteBook X G1i 14 AI | |
| LG Gram Style 14Z90RS-G.AD7AG | |
| Lenovo ThinkBook 14 Gen 8 21SJ007SGE | |
| Dynabook Portégé X40-K | |
| AIDA64 / Memory Latency | |
| Lenovo ThinkBook 14 Gen 8 21SJ007SGE | |
| Dell Pro 14 Premium | |
| Dynabook Portege Z40L-N | |
| HP EliteBook X G1i 14 AI | |
| Durchschnittliche Intel Core Ultra 7 258V (95 - 101.7, n=24) | |
| LG Gram Style 14Z90RS-G.AD7AG | |
| Dynabook Portégé X40-K | |
* ... kleinere Werte sind besser
DPC-Latenzzeit
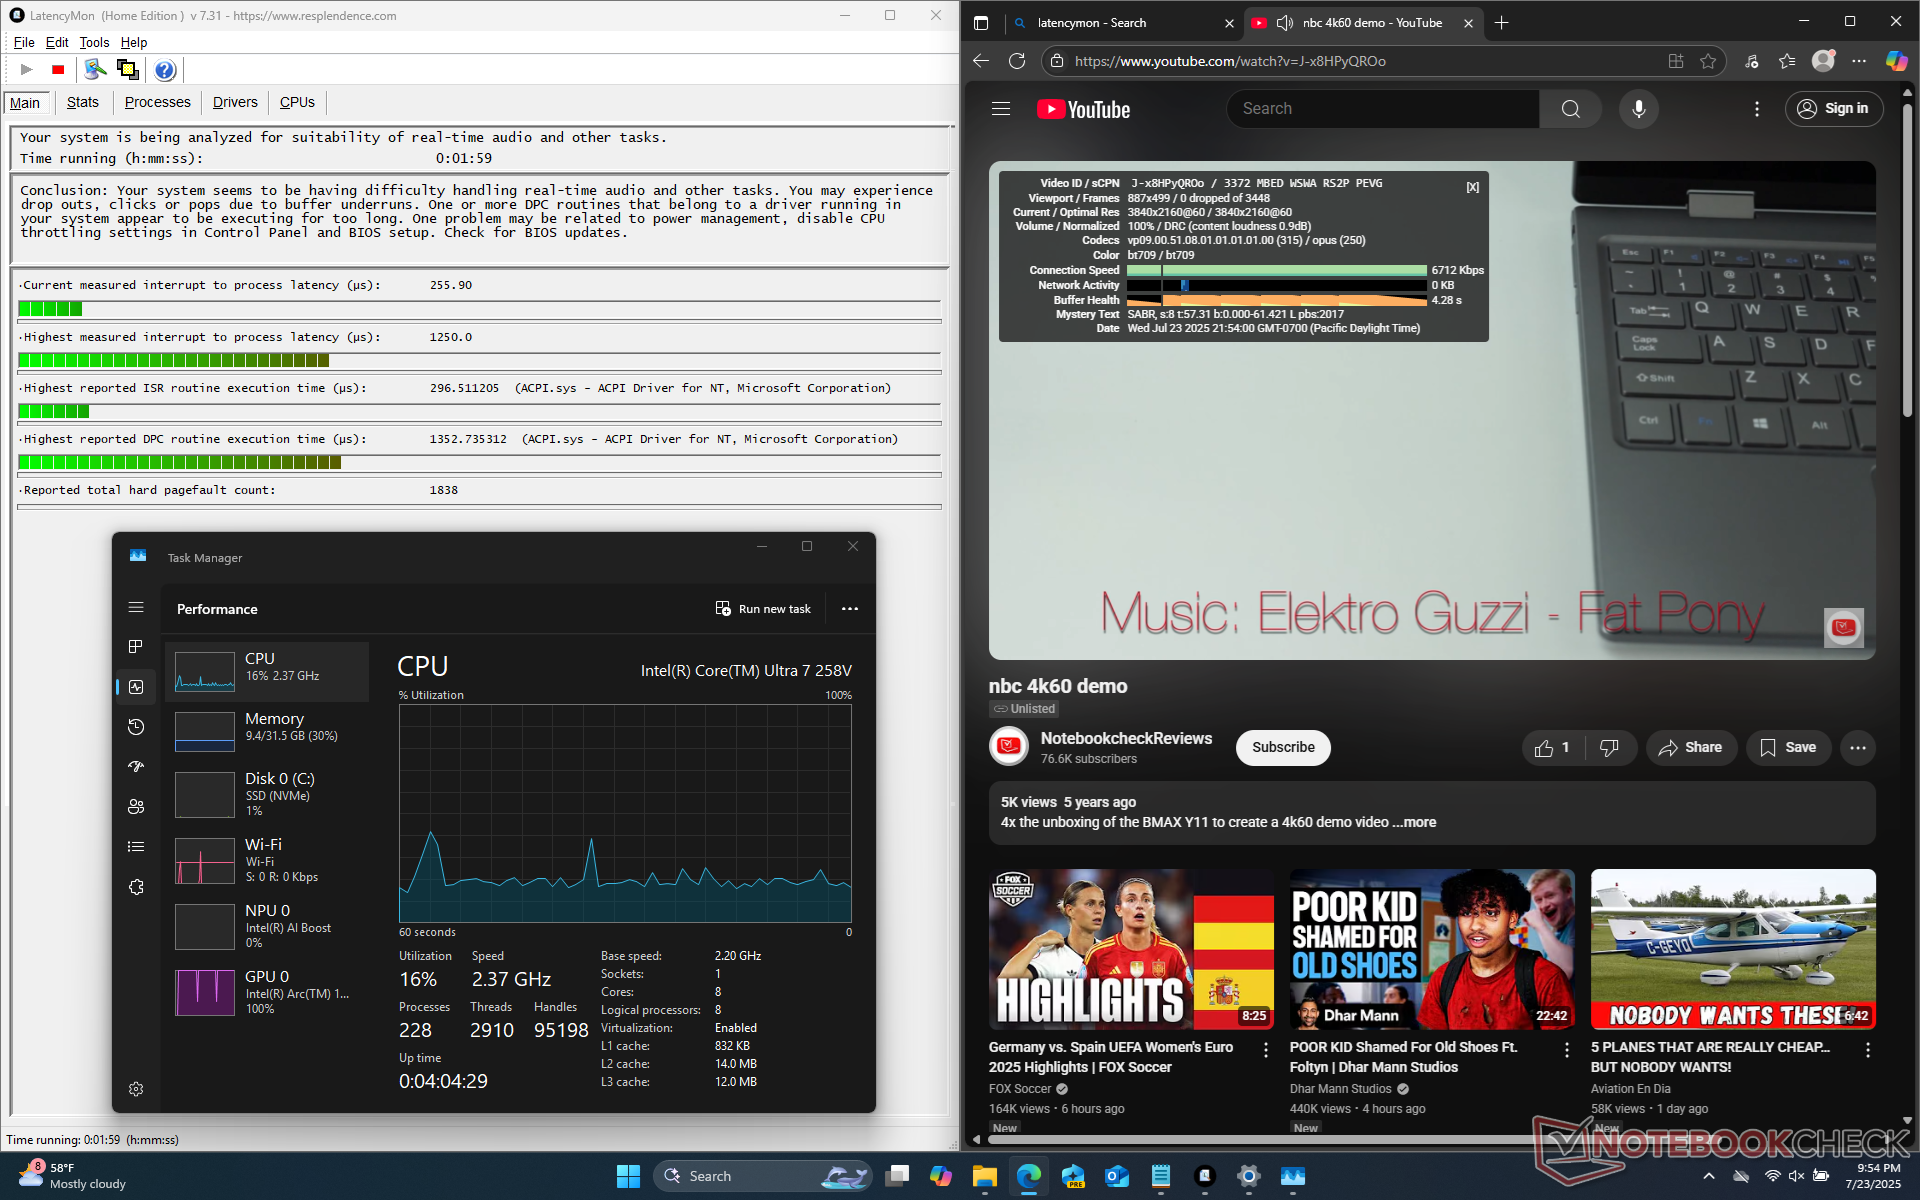
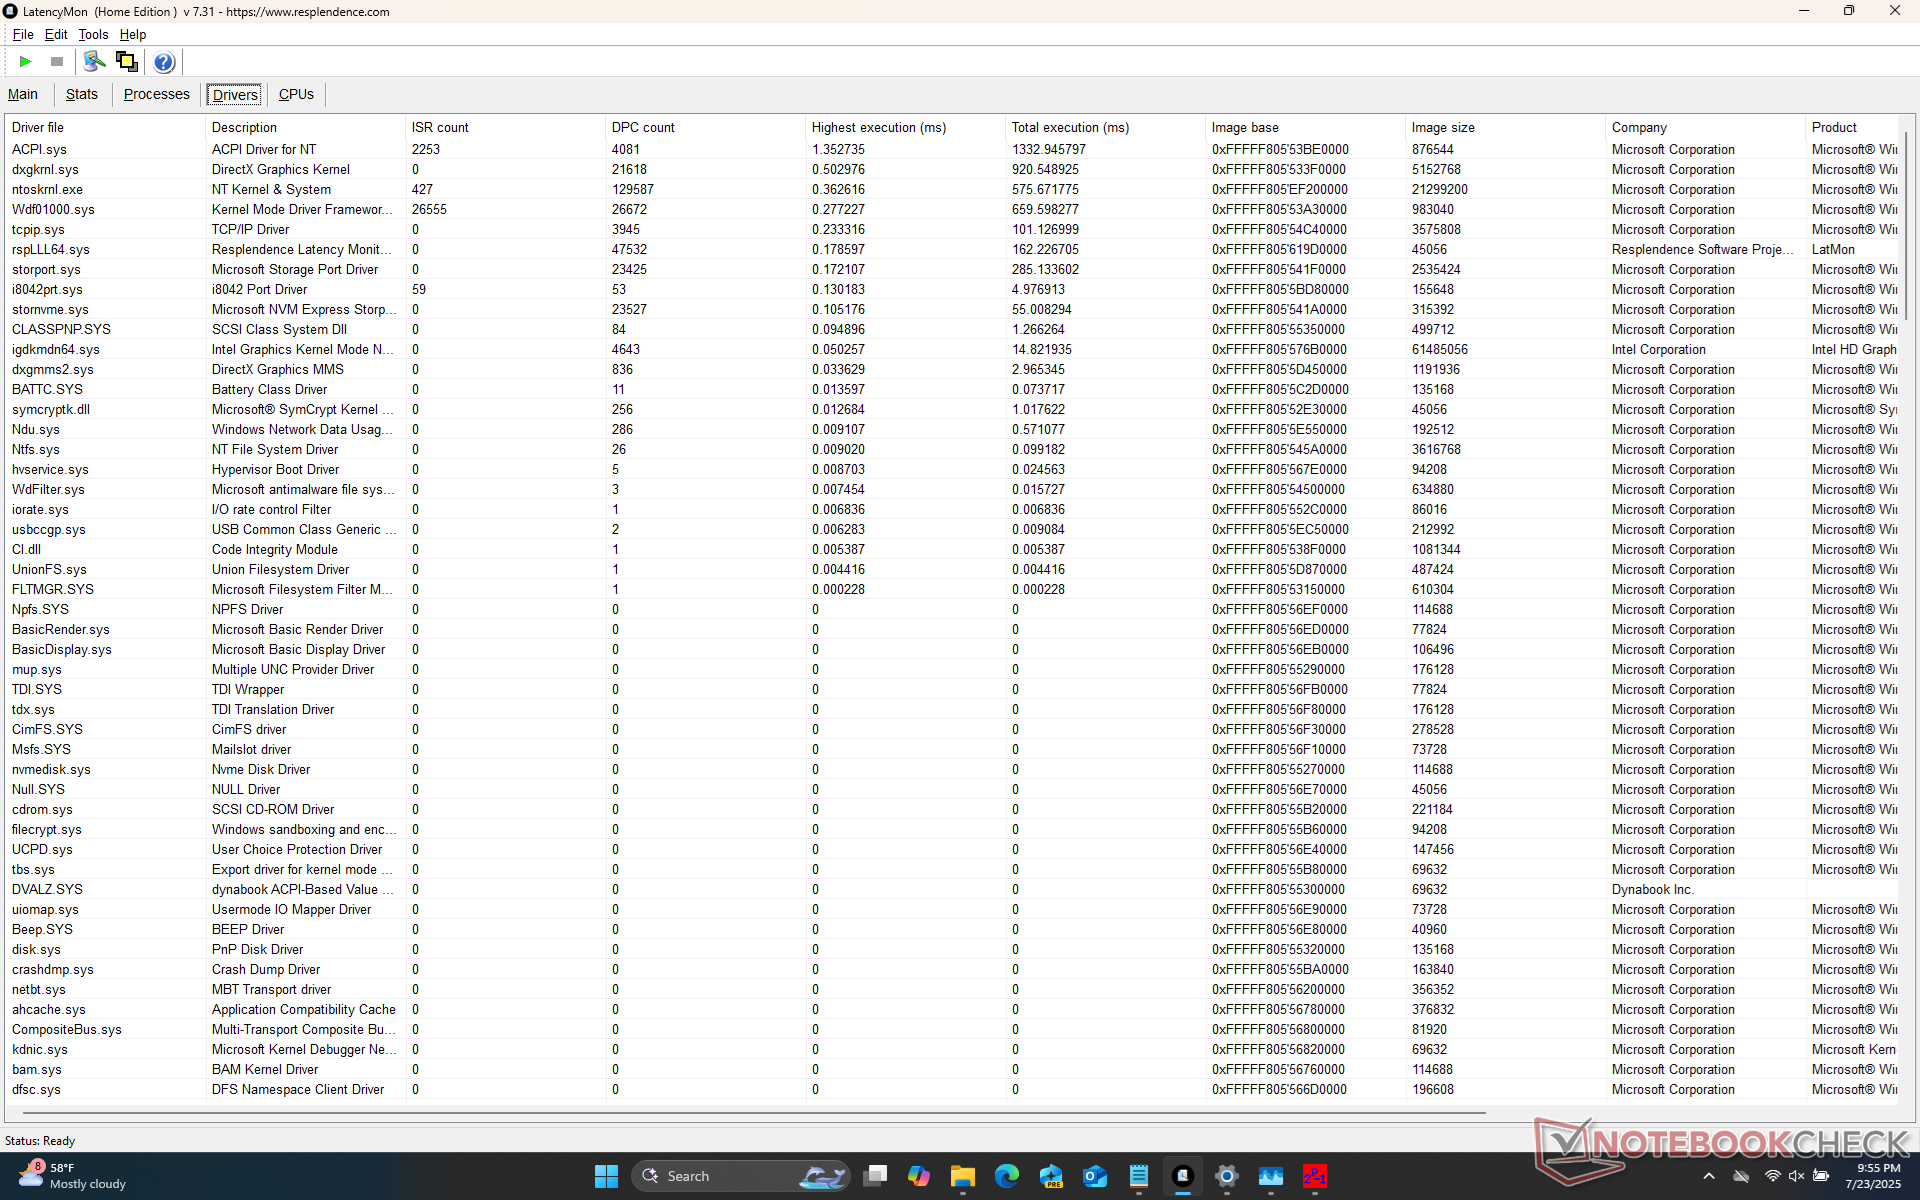
| DPC Latencies / LatencyMon - interrupt to process latency (max), Web, Youtube, Prime95 | |
| Dell Pro 14 Premium | |
| LG Gram Style 14Z90RS-G.AD7AG | |
| Dynabook Portégé X40-K | |
| Dynabook Portege Z40L-N | |
| Lenovo ThinkBook 14 Gen 8 21SJ007SGE | |
| HP EliteBook X G1i 14 AI | |
* ... kleinere Werte sind besser
Speichergeräte

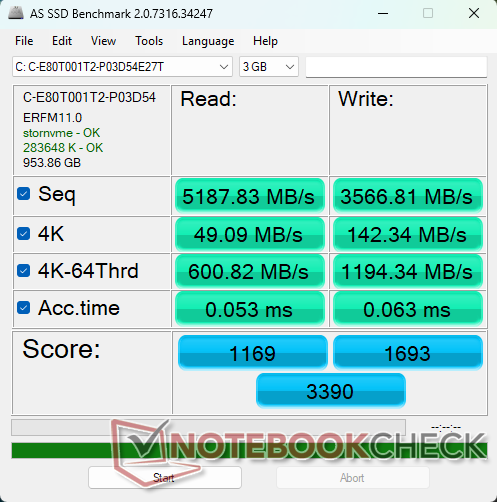

| Drive Performance Rating - Percent | |
| LG Gram Style 14Z90RS-G.AD7AG | |
| Lenovo ThinkBook 14 Gen 8 21SJ007SGE | |
| Dynabook Portege Z40L-N | |
| HP EliteBook X G1i 14 AI | |
| Dell Pro 14 Premium | |
| Dynabook Portégé X40-K | |
* ... kleinere Werte sind besser
Disk Throttling: DiskSpd Read Loop, Queue Depth 8
GPU Performance
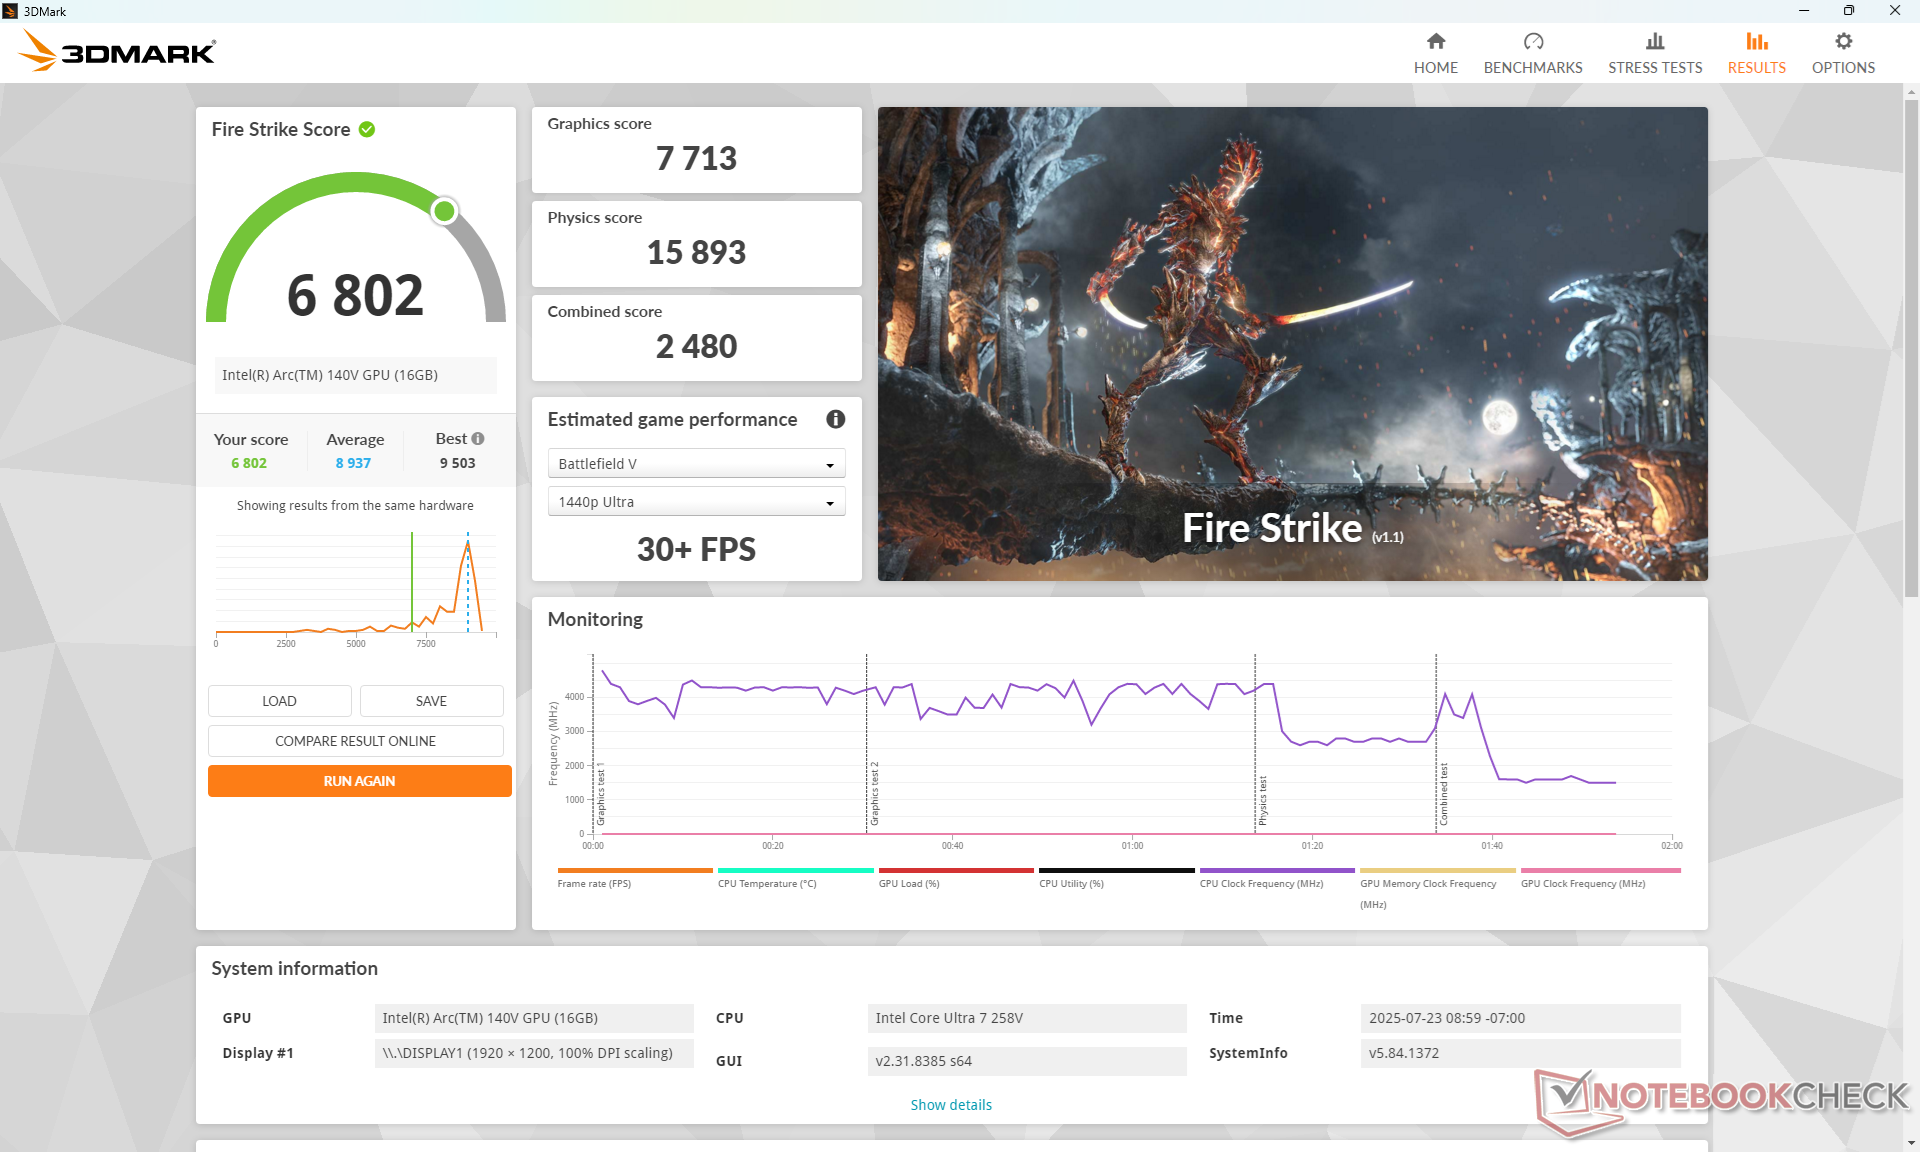
| Leistungsprofil | Grafics-Punktzahl | Physics-Punktzahl | Kombinierte Punktzahl |
| Performance-Modus | 7.713 | 15.893 | 2.480 |
| Ausgeglichener Modus | 8.155 (+6 %) | 15.924 (+0 %) | 2.569 (+4 %) |
| Akku-Leistung | 8.982 (+16 %) | 16.230 (+2 %) | 2.638 (+6 %) |
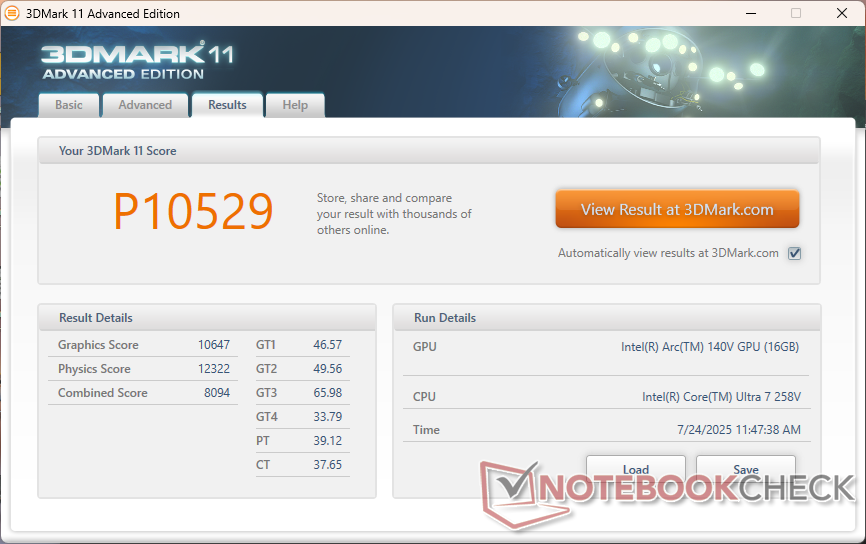
| 3DMark 11 Performance | 10529 Punkte | |
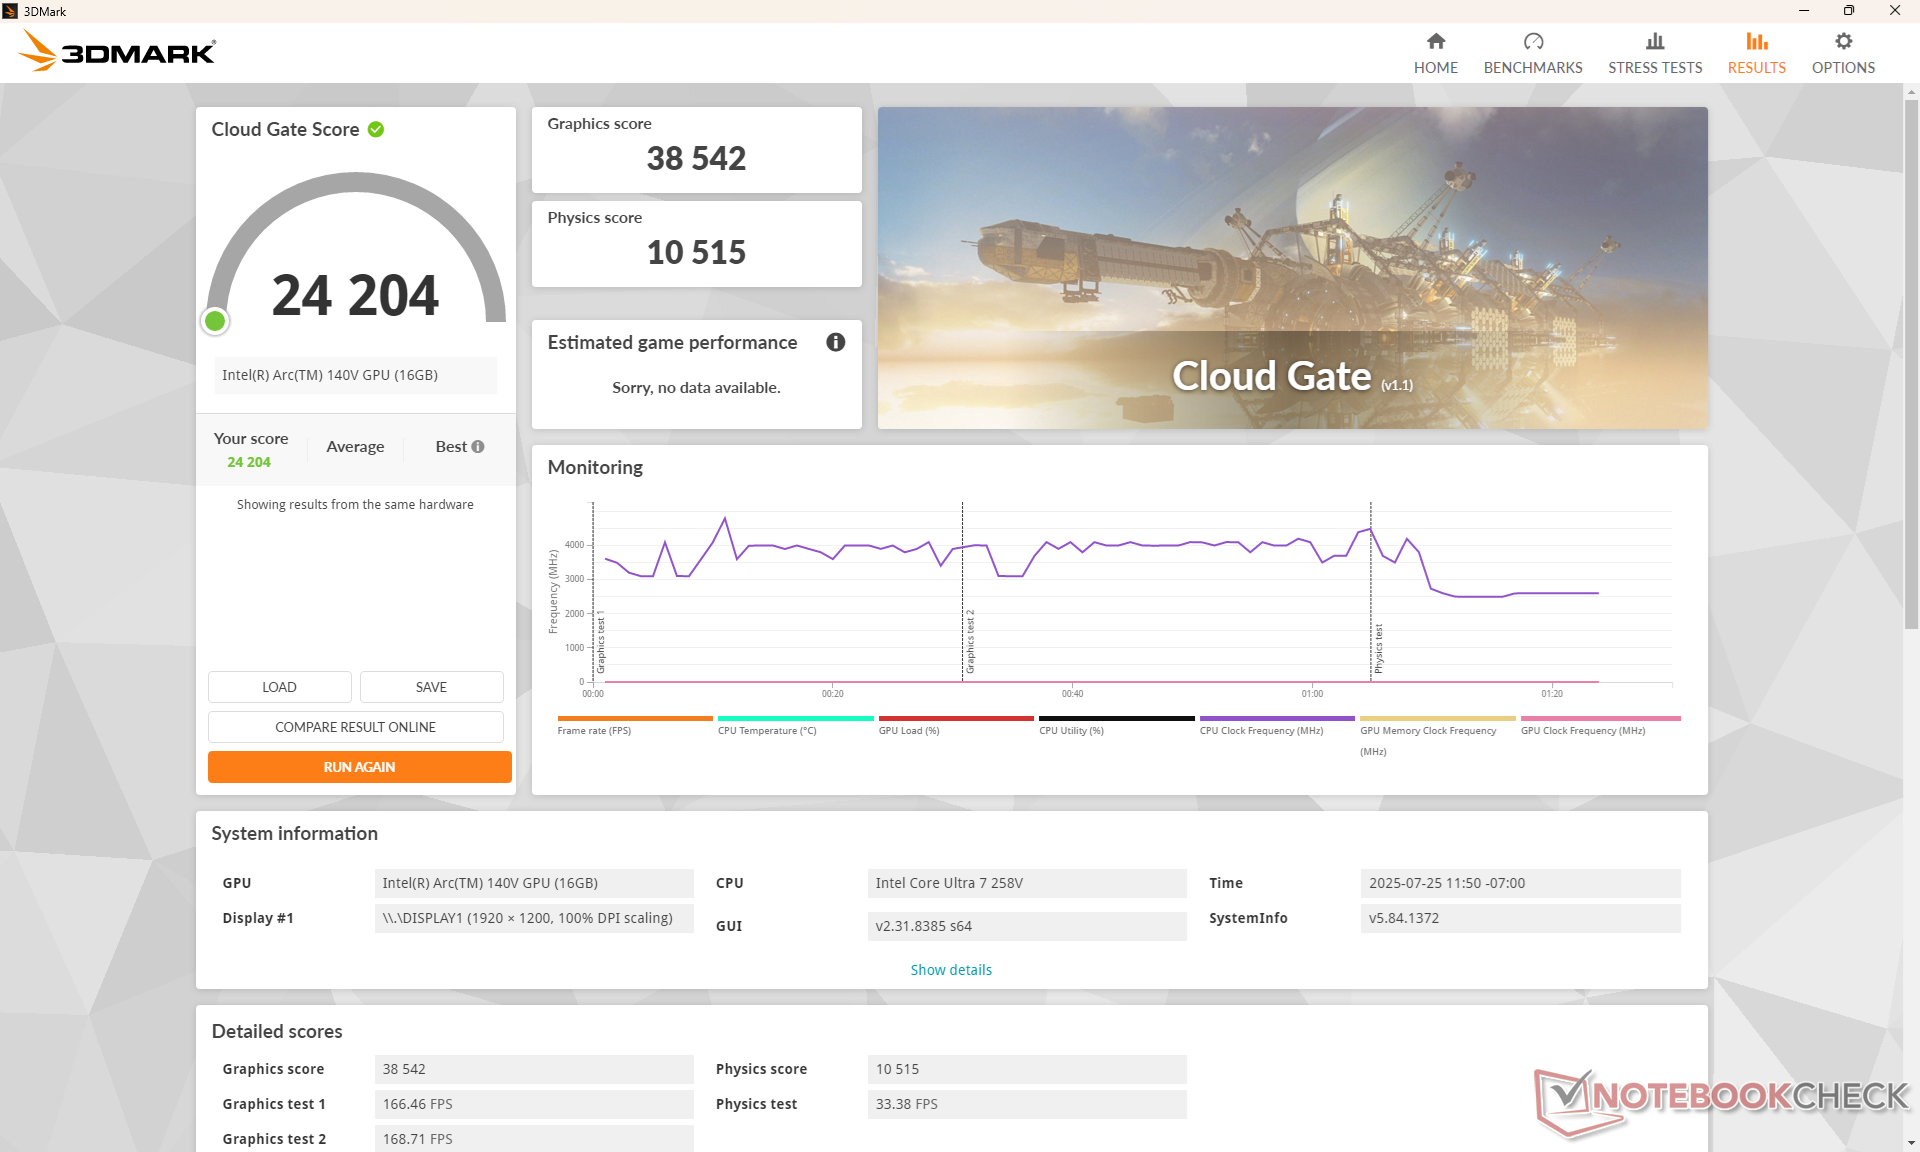
| 3DMark Cloud Gate Standard Score | 24204 Punkte | |
| 3DMark Fire Strike Score | 6802 Punkte | |
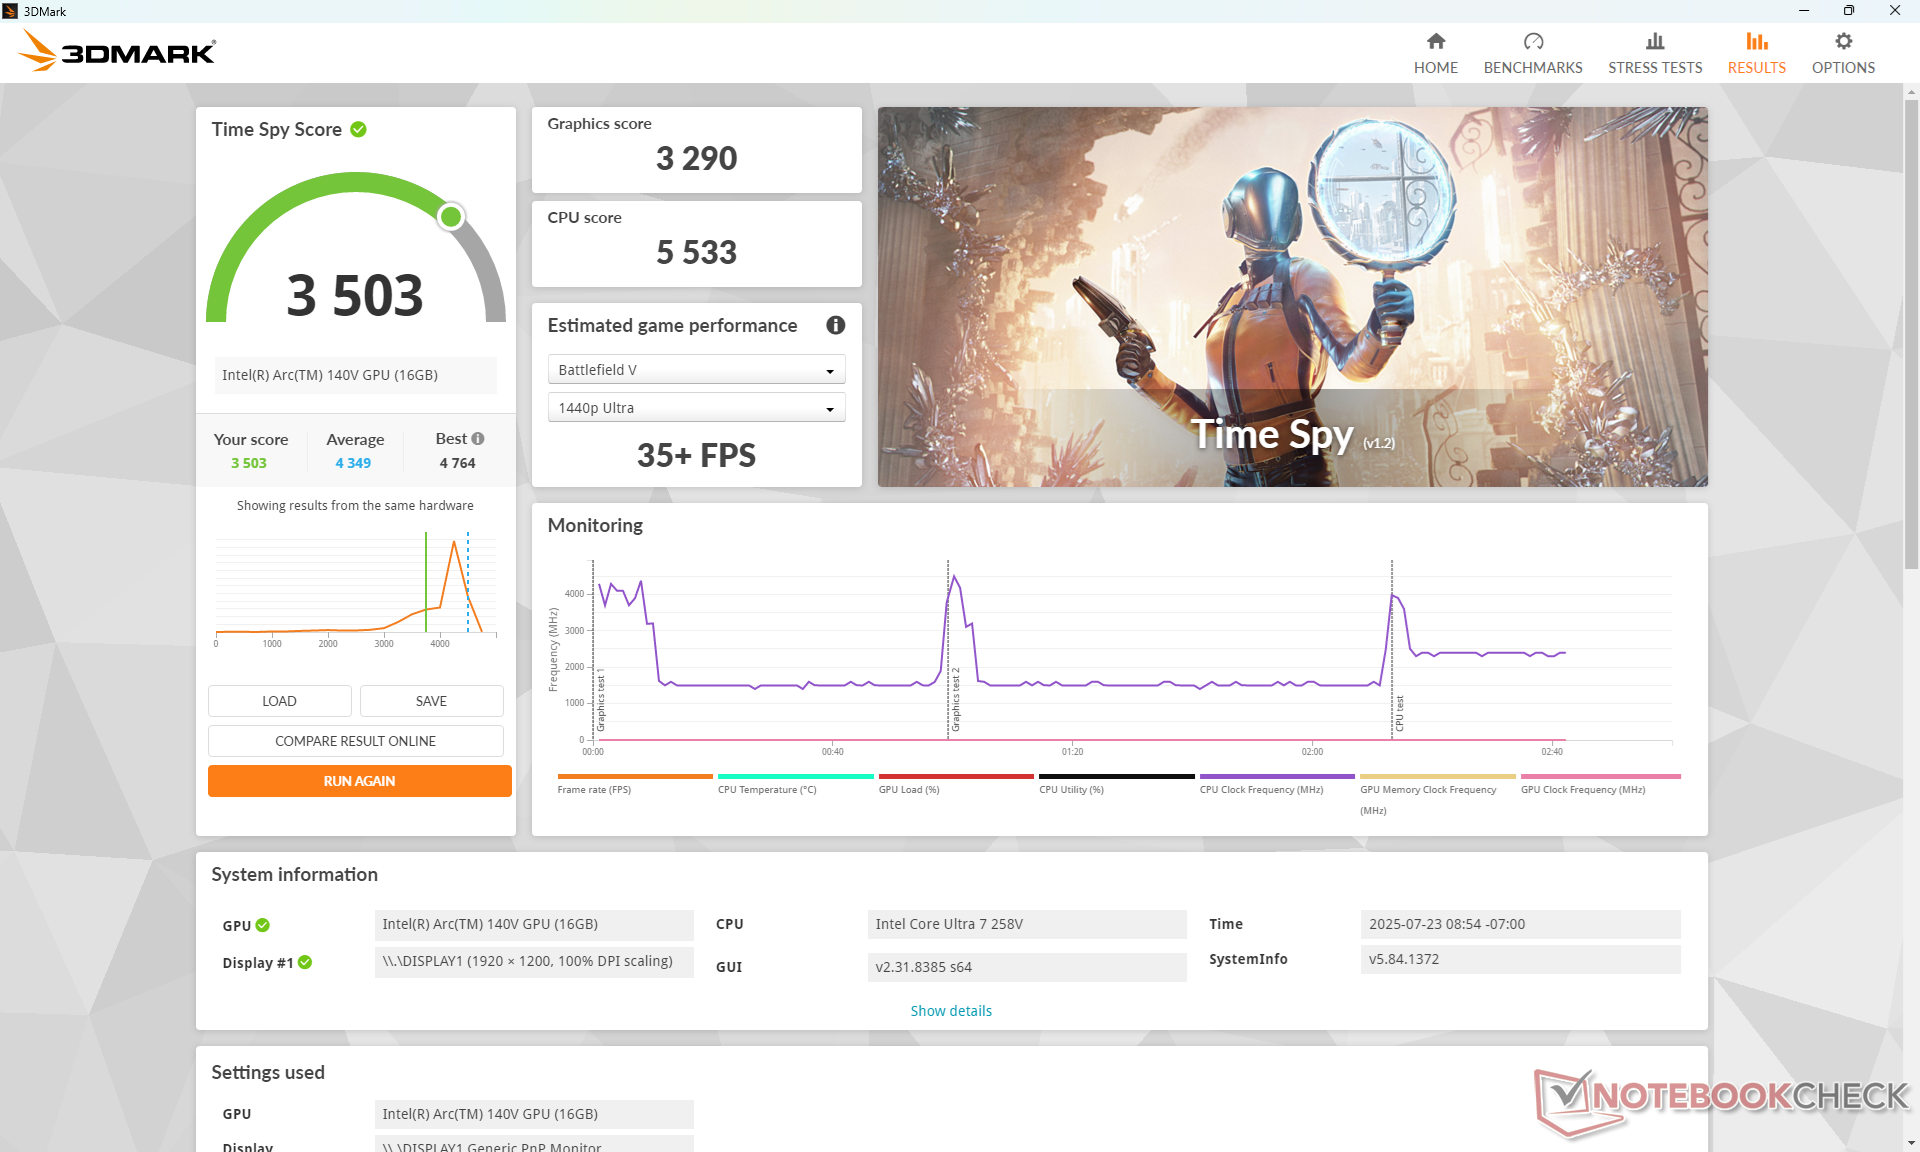
| 3DMark Time Spy Score | 3503 Punkte | |
Hilfe | ||
* ... kleinere Werte sind besser
Cyberpunk 2077 ultra fps-Chart
| min. | mittel | hoch | max. | |
|---|---|---|---|---|
| GTA V (2015) | 123.9 | 115.7 | 50.5 | 21.8 |
| Dota 2 Reborn (2015) | 92.4 | 68.9 | 51.4 | 58.2 |
| Final Fantasy XV Benchmark (2018) | 67.7 | 37.1 | 28.2 | |
| X-Plane 11.11 (2018) | 46.8 | 37 | 32.6 | |
| Strange Brigade (2018) | 179.5 | 56.3 | 49 | 46.3 |
| Baldur's Gate 3 (2023) | 34.3 | 29 | 25.6 | 25 |
| Cyberpunk 2077 (2023) | 35.1 | 28.3 | 24.1 | 21 |
| F1 24 (2024) | 67.4 | 63 | 48.1 | 15.3 |
Emissionen
Systemrauschen
Lautstärkediagramm
| Idle |
| 23.6 / 23.6 / 23.6 dB(A) |
| Last |
| 37 / 39 dB(A) |
 | ||
30 dB leise 40 dB(A) deutlich hörbar 50 dB(A) störend |
||
min: | ||
| Dynabook Portege Z40L-N Arc 140V, Core Ultra 7 258V, Phison C-E80T001T2-P03D54E27T | Dynabook Portégé X40-K Iris Xe G7 96EUs, i7-1260P, Samsung PM991 MZVLQ512HBLU | LG Gram Style 14Z90RS-G.AD7AG Iris Xe G7 96EUs, i7-1360P, SK hynix PC801 HFS001TEJ9X101N | Lenovo ThinkBook 14 Gen 8 21SJ007SGE Arc 140T, Ultra 7 255H, Western Digital PCSN5000S SDEPMSJ-1T00-1101 | Dell Pro 14 Premium Arc 140V, Core Ultra 7 268V, Kioxia BG6 KBG6AZNV1T02 | HP EliteBook X G1i 14 AI Arc 140V, Core Ultra 7 268V, Kioxia XG8 KXG80ZNV512G | |
|---|---|---|---|---|---|---|
| Geräuschentwicklung | 3% | -5% | -7% | -4% | -11% | |
| aus / Umgebung * (dB) | 23.5 | 22.8 3% | 25 -6% | 25.2 -7% | 23.1 2% | 28.2 -20% |
| Idle min * (dB) | 23.6 | 23.4 1% | 25 -6% | 25.2 -7% | 23.1 2% | 28.4 -20% |
| Idle avg * (dB) | 23.6 | 23.4 1% | 25 -6% | 25.2 -7% | 23.1 2% | 28.4 -20% |
| Idle max * (dB) | 23.6 | 23.4 1% | 25 -6% | 25.2 -7% | 23.1 2% | 28.8 -22% |
| Last avg * (dB) | 37 | 31.2 16% | 37 -0% | 32.9 11% | 38.2 -3% | 33.5 9% |
| Cyberpunk 2077 ultra * (dB) | 37.8 | 44.1 -17% | 44.2 -17% | 39.1 -3% | ||
| Last max * (dB) | 39 | 40.5 -4% | 40.62 -4% | 43.9 -13% | 44.2 -13% | 40.4 -4% |
| Witcher 3 ultra * (dB) | 27.1 | 37 |
* ... kleinere Werte sind besser
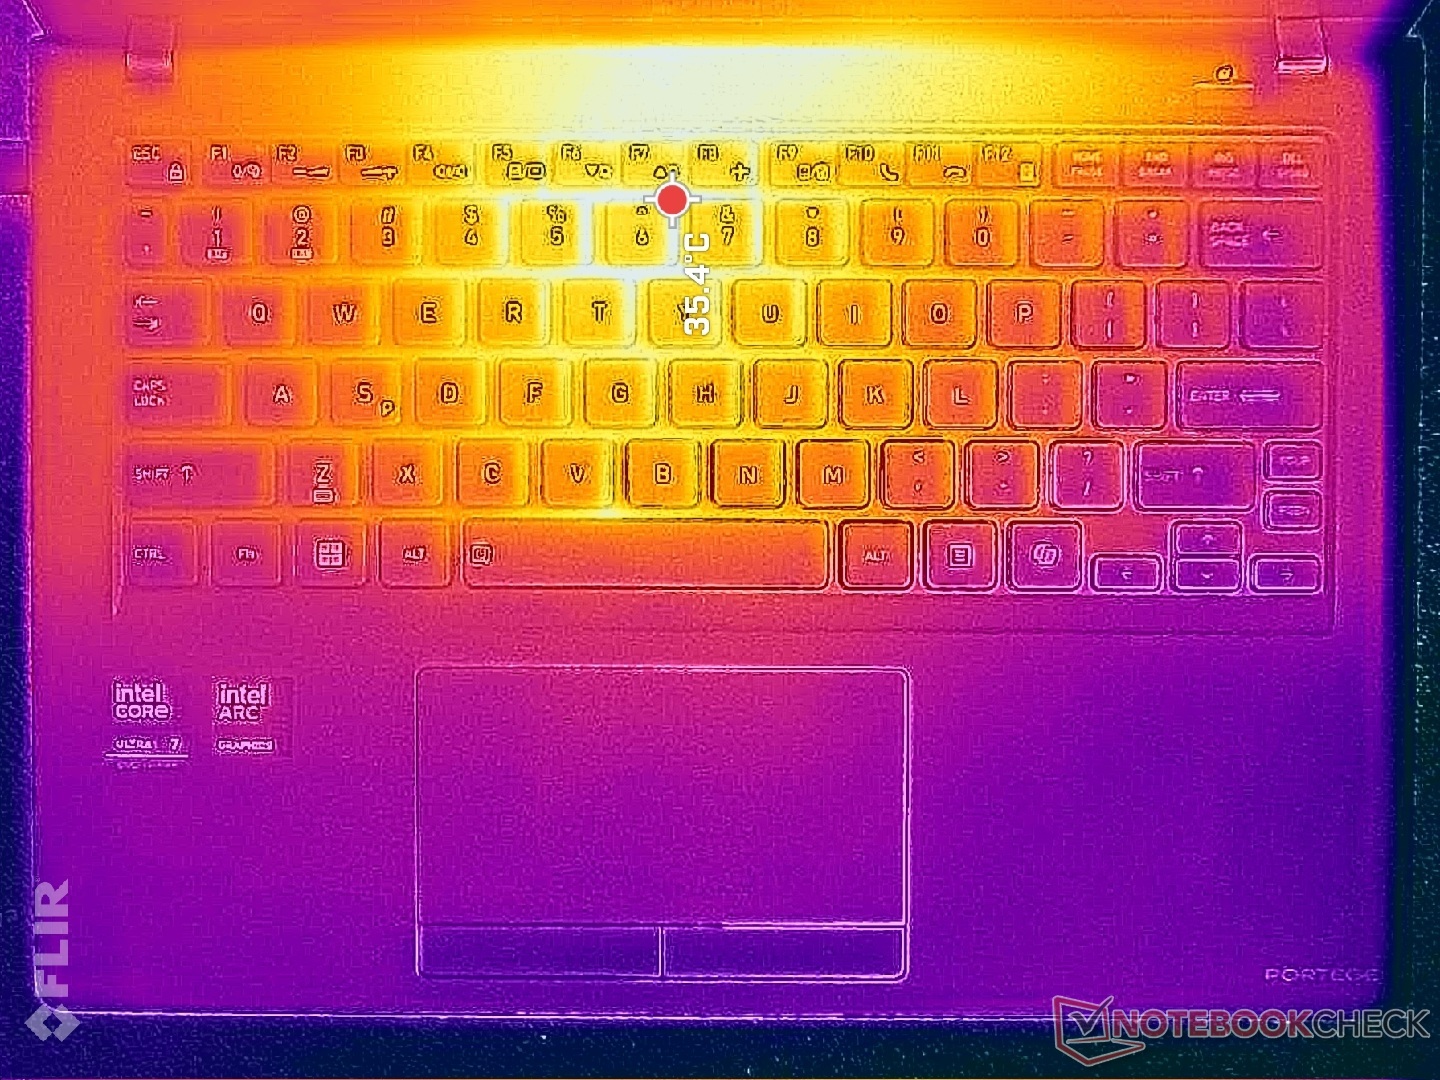
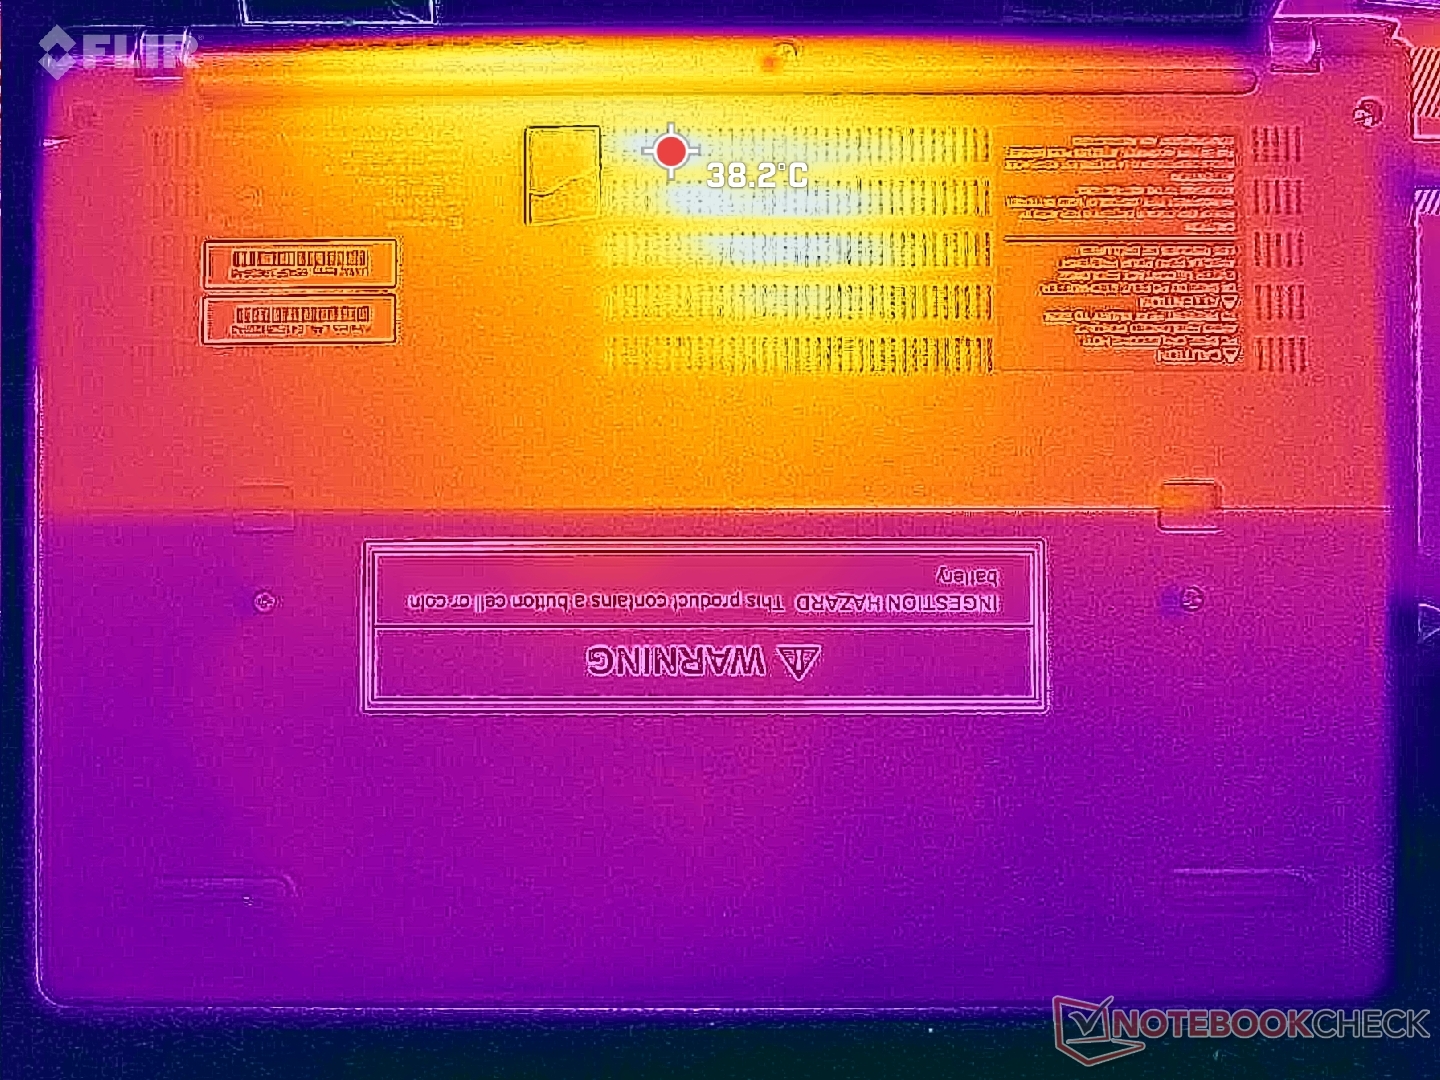
Temperatur
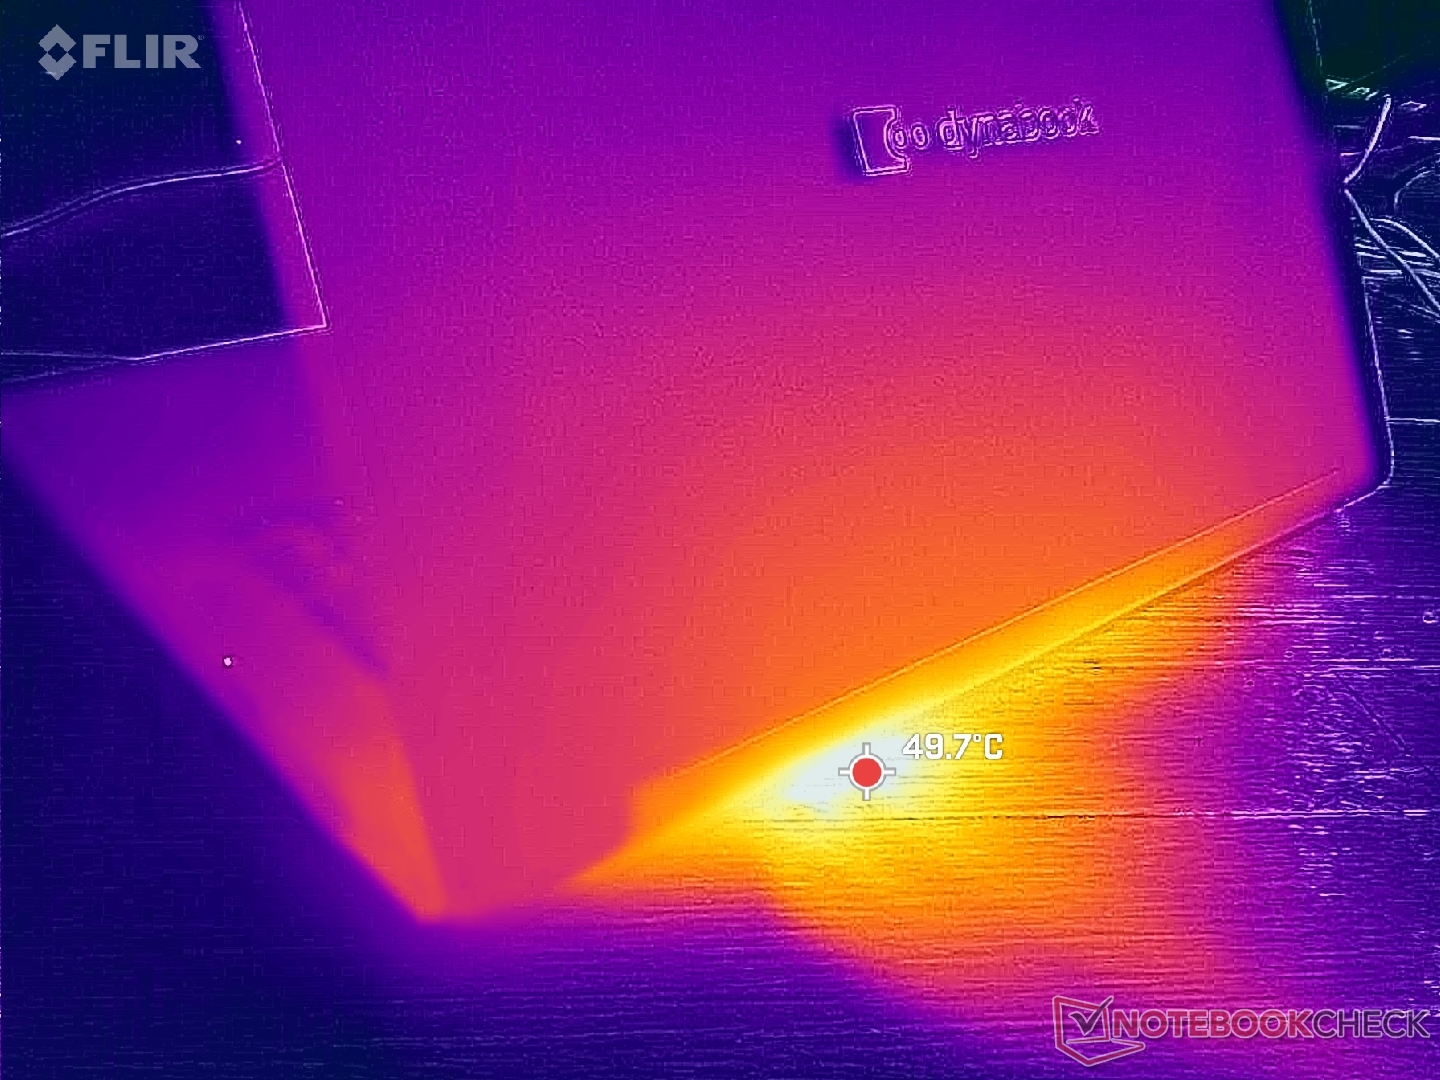
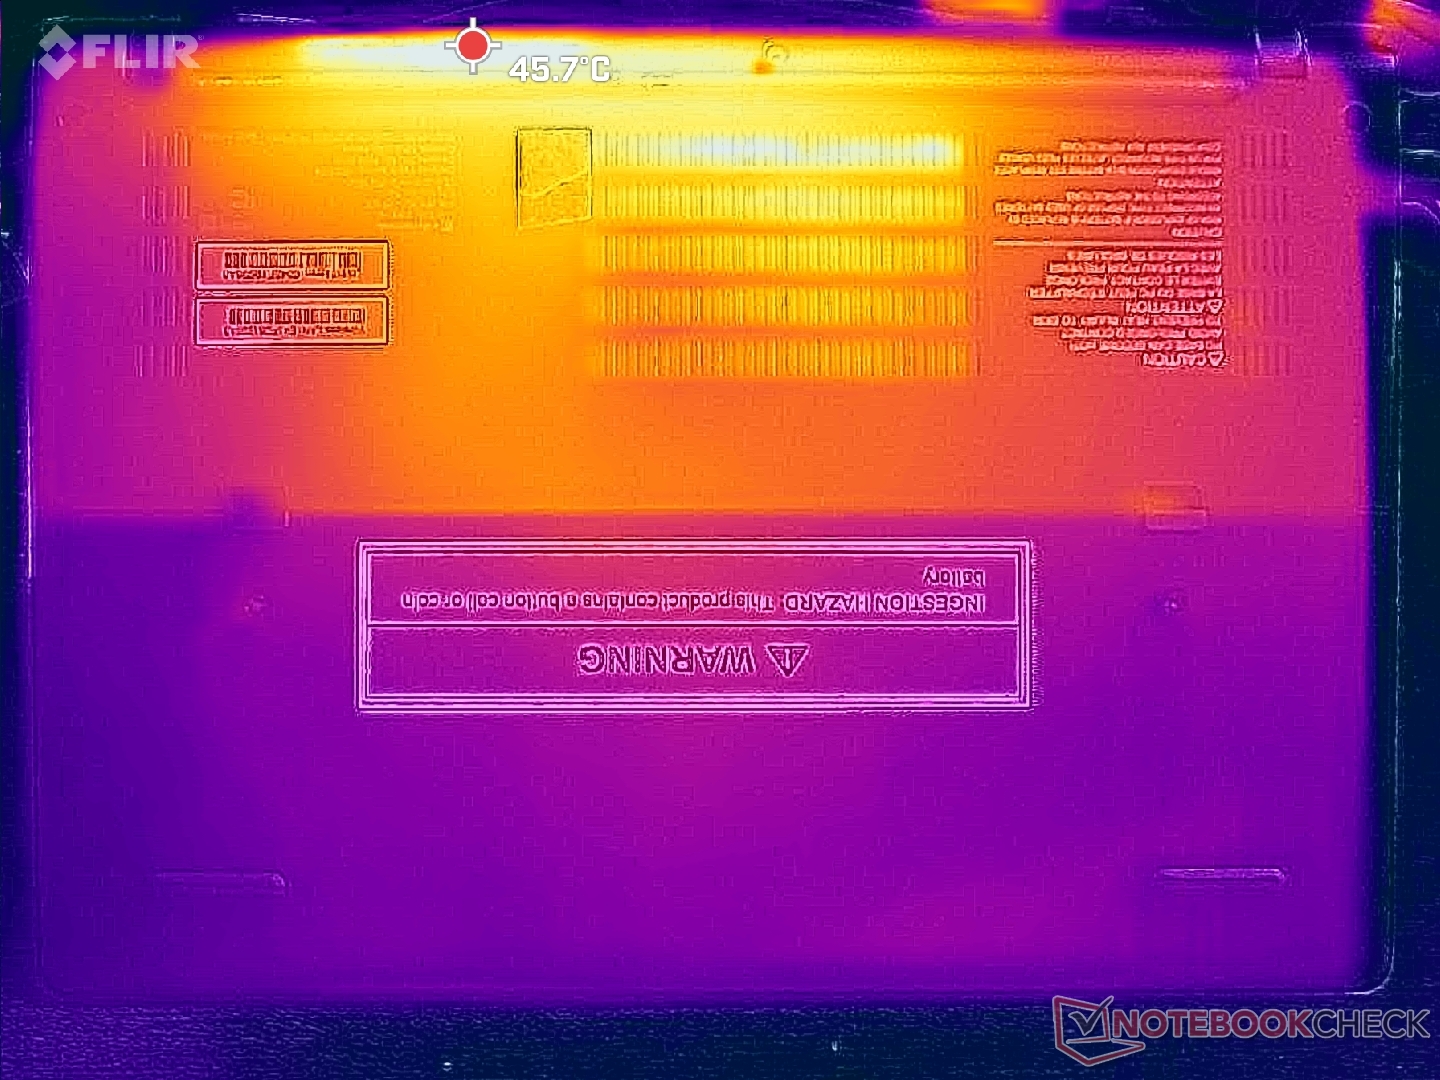
(±) Die maximale Temperatur auf der Oberseite ist 41.2 °C. Im Vergleich liegt der Klassendurchschnitt bei 34.3 °C (von 21.2 bis 62.5 °C für die Klasse Office).
(+) Auf der Unterseite messen wir eine maximalen Wert von 38 °C (im Vergleich zum Durchschnitt von 36.8 °C).
(+) Ohne Last messen wir eine durchschnittliche Temperatur von 30 °C auf der Oberseite. Der Klassendurchschnitt erreicht 29.5 °C.
(+) Die Handballen und der Touchpad-Bereich sind mit gemessenen 27.6 °C kühler als die typische Hauttemperatur und fühlen sich dadurch kühl an.
(±) Die durchschnittliche Handballen-Temperatur anderer getesteter Geräte war 27.5 °C (-0.1 °C).

| Dynabook Portege Z40L-N Intel Core Ultra 7 258V, Intel Arc Graphics 140V | Dynabook Portégé X40-K Intel Core i7-1260P, Intel Iris Xe Graphics G7 96EUs | LG Gram Style 14Z90RS-G.AD7AG Intel Core i7-1360P, Intel Iris Xe Graphics G7 96EUs | Lenovo ThinkBook 14 Gen 8 21SJ007SGE Intel Core Ultra 7 255H, Intel Arc Graphics 140T | Dell Pro 14 Premium Intel Core Ultra 7 268V, Intel Arc Graphics 140V | HP EliteBook X G1i 14 AI Intel Core Ultra 7 268V, Intel Arc Graphics 140V | |
|---|---|---|---|---|---|---|
| Hitze | 27% | 16% | -1% | 24% | 25% | |
| Last oben max * (°C) | 41.2 | 31.6 23% | 36.3 12% | 44.1 -7% | 33 20% | 35 15% |
| Last unten max * (°C) | 38 | 32.8 14% | 36.8 3% | 44.6 -17% | 28 26% | 33.4 12% |
| Idle oben max * (°C) | 35.4 | 24 32% | 29.2 18% | 31.6 11% | 28 21% | 23.8 33% |
| Idle unten max * (°C) | 39.8 | 24.8 38% | 27.4 31% | 35.4 11% | 28.8 28% | 24.2 39% |
* ... kleinere Werte sind besser
Lautsprecher
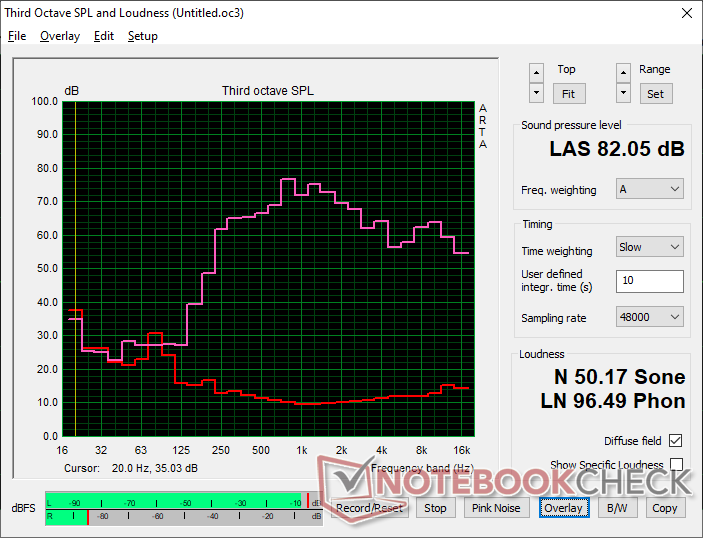
Dynabook Portege Z40L-N Audio Analyse
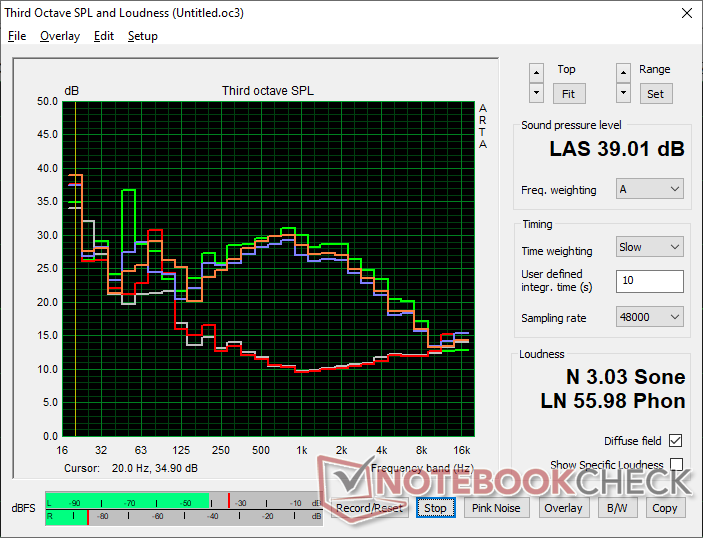
(+) | Die Lautsprecher können relativ laut spielen (82.1 dB)
Bass 100 - 315 Hz
(-) | kaum Bass - 19.3% niedriger als der Median
(±) | durchschnittlich lineare Bass-Wiedergabe (12.3% Delta zum Vorgänger)
Mitteltöne 400 - 2000 Hz
(±) | zu hohe Mitten, vom Median 6.9% abweichend
(+) | lineare Mitten (6.1% Delta zum Vorgänger)
Hochtöne 2 - 16 kHz
(+) | ausgeglichene Hochtöne, vom Median nur 3% abweichend
(+) | sehr lineare Hochtöne (6.8% Delta zum Vorgänger)
Gesamt im hörbaren Bereich 100 - 16.000 Hz
(±) | hörbarer Bereich ist durchschnittlich linear (18.3% Abstand zum Median)
Im Vergleich zu allen Geräten derselben Klasse
» 32% aller getesteten Geräte dieser Klasse waren besser, 6% vergleichbar, 61% schlechter
» Das beste Gerät hat einen Delta-Wert von 7%, durchschnittlich ist 21%, das schlechteste Gerät hat 53%
Im Vergleich zu allen Geräten im Test
» 40% aller getesteten Geräte waren besser, 8% vergleichbar, 52% schlechter
» Das beste Gerät hat einen Delta-Wert von 4%, durchschnittlich ist 24%, das schlechteste Gerät hat 134%
Apple MacBook Pro 16 2021 M1 Pro Audio Analyse
(+) | Die Lautsprecher können relativ laut spielen (84.7 dB)
Bass 100 - 315 Hz
(+) | guter Bass - nur 3.8% Abweichung vom Median
(+) | lineare Bass-Wiedergabe (5.2% Delta zum Vorgänger)
Mitteltöne 400 - 2000 Hz
(+) | ausgeglichene Mitten, vom Median nur 1.3% abweichend
(+) | lineare Mitten (2.1% Delta zum Vorgänger)
Hochtöne 2 - 16 kHz
(+) | ausgeglichene Hochtöne, vom Median nur 1.9% abweichend
(+) | sehr lineare Hochtöne (2.7% Delta zum Vorgänger)
Gesamt im hörbaren Bereich 100 - 16.000 Hz
(+) | hörbarer Bereich ist sehr linear (4.6% Abstand zum Median
Im Vergleich zu allen Geräten derselben Klasse
» 0% aller getesteten Geräte dieser Klasse waren besser, 0% vergleichbar, 100% schlechter
» Das beste Gerät hat einen Delta-Wert von 5%, durchschnittlich ist 17%, das schlechteste Gerät hat 45%
Im Vergleich zu allen Geräten im Test
» 0% aller getesteten Geräte waren besser, 0% vergleichbar, 100% schlechter
» Das beste Gerät hat einen Delta-Wert von 4%, durchschnittlich ist 24%, das schlechteste Gerät hat 134%
Energieverwaltung
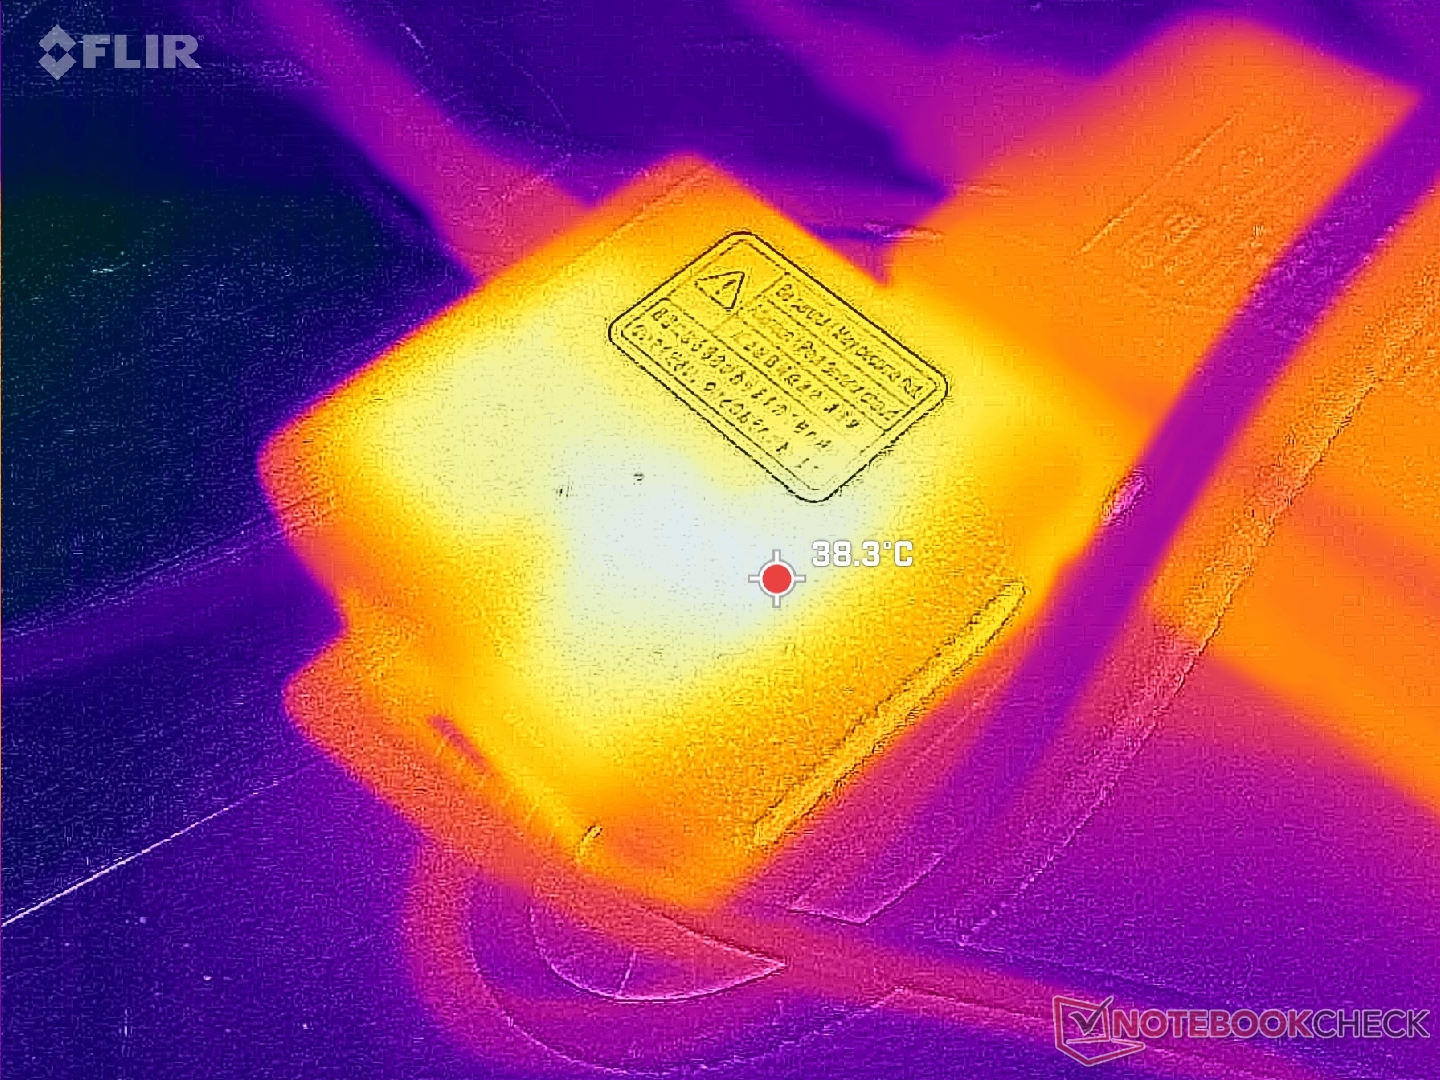
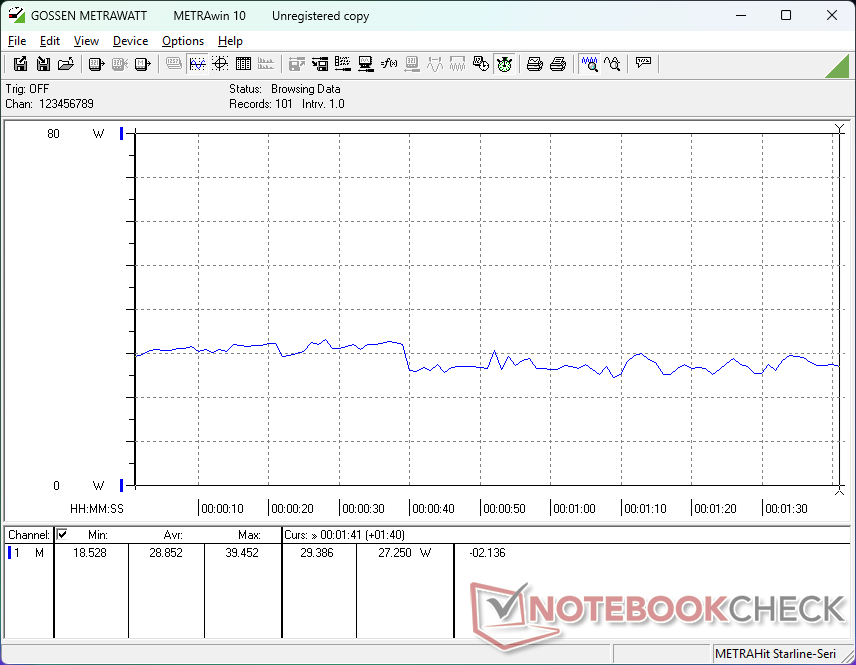
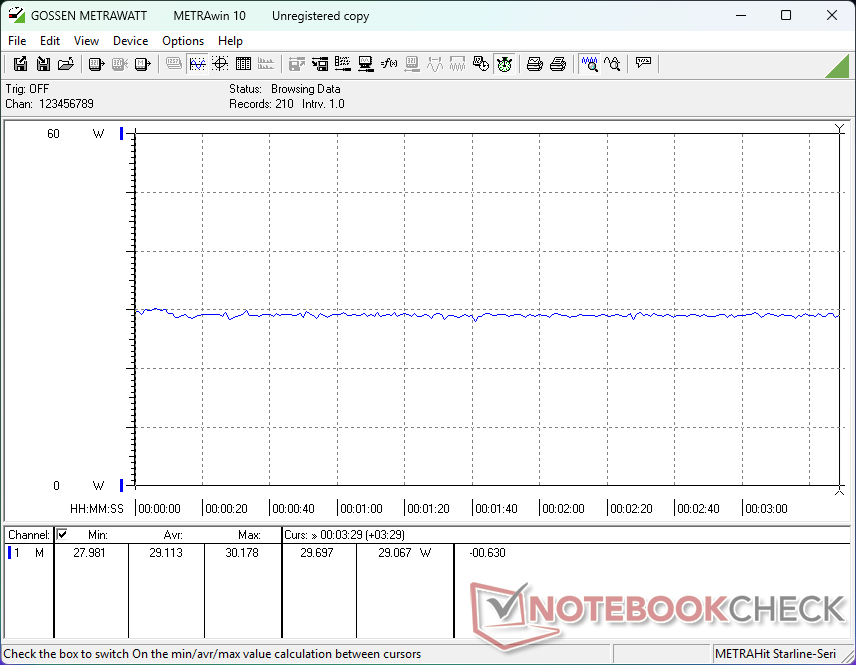
Stromverbrauch
| Aus / Standby | |
| Idle | |
| Last |
|
Legende:
min: | |
| Dynabook Portege Z40L-N Core Ultra 7 258V, Arc 140V, Phison C-E80T001T2-P03D54E27T, IPS, 1920x1200, 14" | Dynabook Portégé X40-K i7-1260P, Iris Xe G7 96EUs, Samsung PM991 MZVLQ512HBLU, IPS, 1920x1080, 14" | LG Gram Style 14Z90RS-G.AD7AG i7-1360P, Iris Xe G7 96EUs, SK hynix PC801 HFS001TEJ9X101N, OLED, 2880x1800, 14" | Lenovo ThinkBook 14 Gen 8 21SJ007SGE Ultra 7 255H, Arc 140T, Western Digital PCSN5000S SDEPMSJ-1T00-1101, IPS LED, 1920x1200, 14" | Dell Pro 14 Premium Core Ultra 7 268V, Arc 140V, Kioxia BG6 KBG6AZNV1T02, OLED, 2880x1800, 14" | HP EliteBook X G1i 14 AI Core Ultra 7 268V, Arc 140V, Kioxia XG8 KXG80ZNV512G, IPS, 1920x1200, 14" | Durchschnittliche Intel Arc Graphics 140V | Durchschnitt der Klasse Office | |
|---|---|---|---|---|---|---|---|---|
| Stromverbrauch | -103% | -89% | -102% | -49% | -42% | -66% | -87% | |
| Idle min * (Watt) | 1.5 | 5.5 -267% | 3.58 -139% | 4.1 -173% | 3.5 -133% | 2.5 -67% | 3.72 ? -148% | 4.41 ? -194% |
| Idle avg * (Watt) | 4.3 | 6 -40% | 7.125 -66% | 7.8 -81% | 4.3 -0% | 5.4 -26% | 6.2 ? -44% | 7.37 ? -71% |
| Idle max * (Watt) | 4.4 | 8.5 -93% | 12.1 -175% | 10.7 -143% | 7.9 -80% | 5.8 -32% | 8.14 ? -85% | 8.58 ? -95% |
| Last avg * (Watt) | 28.9 | 51.8 -79% | 40.67 -41% | 53.1 -84% | 38.9 -35% | 36.9 -28% | 39.2 ? -36% | 43 ? -49% |
| Cyberpunk 2077 ultra external monitor * (Watt) | 27 | 56.7 -110% | 38.7 -43% | 44.9 -66% | ||||
| Cyberpunk 2077 ultra * (Watt) | 29.1 | 56.9 -96% | 39 -34% | 48.5 -67% | ||||
| Last max * (Watt) | 51 | 68.7 -35% | 64.2 -26% | 65.7 -29% | 60.7 -19% | 54.6 -7% | 60.3 ? -18% | 64.6 ? -27% |
| Witcher 3 ultra * (Watt) | 41 |
* ... kleinere Werte sind besser
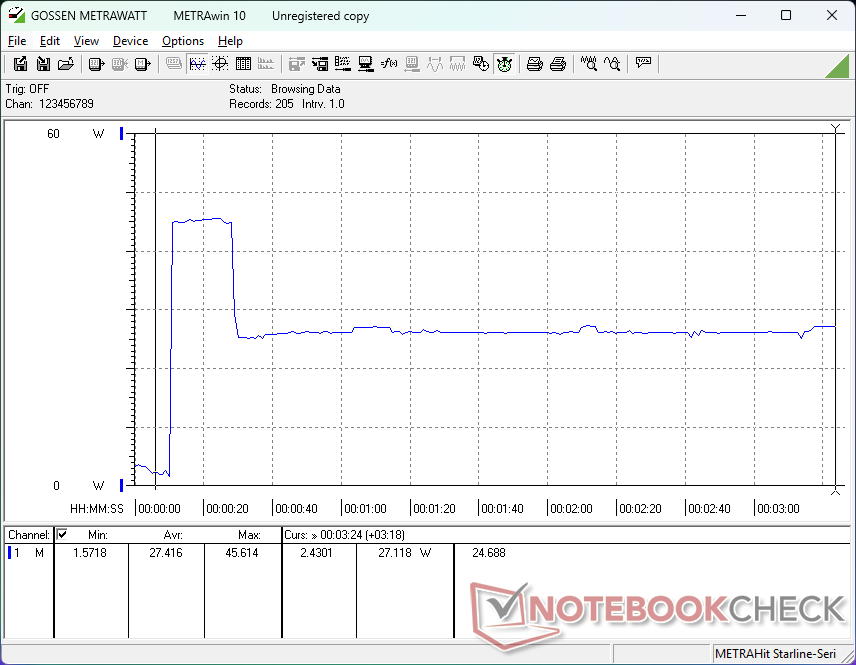
Energieverbrauch Cyberpunk / Stresstest
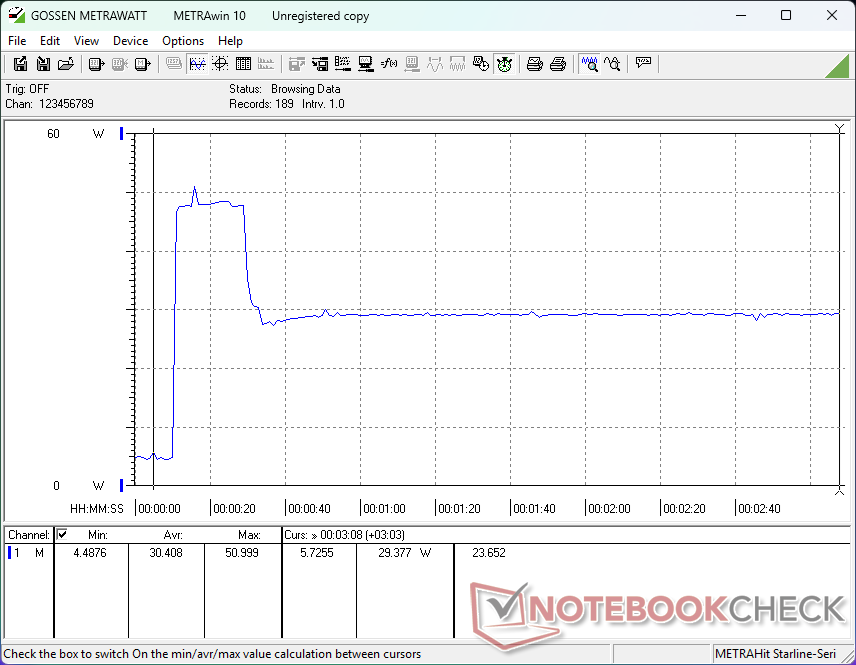
Energieverbrauch externer Monitor
Akkulaufzeit
| Dynabook Portege Z40L-N Core Ultra 7 258V, Arc 140V, 56 Wh | Dynabook Portégé X40-K i7-1260P, Iris Xe G7 96EUs, 53 Wh | LG Gram Style 14Z90RS-G.AD7AG i7-1360P, Iris Xe G7 96EUs, 72 Wh | Lenovo ThinkBook 14 Gen 8 21SJ007SGE Ultra 7 255H, Arc 140T, 45 Wh | Dell Pro 14 Premium Core Ultra 7 268V, Arc 140V, 60 Wh | HP EliteBook X G1i 14 AI Core Ultra 7 268V, Arc 140V, 68 Wh | |
|---|---|---|---|---|---|---|
| Akkulaufzeit | -52% | -39% | -62% | -20% | -3% | |
| WLAN (h) | 19.1 | 9.2 -52% | 11.7 -39% | 7.3 -62% | 15.2 -20% | 18.5 -3% |
| H.264 (h) | 10.1 | |||||
| Last (h) | 2.4 | 0.8 |
Notebookcheck Bewertung
Dynabook Portege Z40L-N
- 29.07.2025 v8
Allen Ngo
 Total Sustainability Score:
 Potenzielle Wettbewerber im Vergleich
Bild | Modell / Test | Preis ab | Gewicht | Dicke | Display |
|---|---|---|---|---|---|
1. 86.2%  | Dynabook Portege Z40L-N Intel Core Ultra 7 258V ⎘ Intel Arc Graphics 140V ⎘ 32 GB RAM, 1024 GB | Amazon: 1. 138,18 € X psblty Kompatibel for Dyna... 2. 27,56 € OEM LITEON 65W USB C Fast Ch... 3. 27,56 € OEM Delta 65W USB C Fast Cha... Listenpreis: 2200 USD | 961 g | 18.9 mm | 14.00" 1920x1200 162 PPI IPS |
2. 84.3% v7 (old)  | Dynabook Portégé X40-K Intel Core i7-1260P ⎘ Intel Iris Xe Graphics G7 96EUs ⎘ 16 GB RAM, 512 GB SSD | Amazon: 1. 47,99 € 48Wh PA5278U-1BRS Laptop Akk... 2. 55,99 € K KYUER 53Wh PS0104UA1BRS La... 3. 58,99 € ANTIEE 53 Wh PS0104UA1BRS La... Listenpreis: 1450 USD | 1.5 kg | 17.9 mm | 14.00" 1920x1080 157 PPI IPS |
3. 90% v7 (old)  | LG Gram Style 14Z90RS-G.AD7AG Intel Core i7-1360P ⎘ Intel Iris Xe Graphics G7 96EUs ⎘ 32 GB RAM, 1024 GB SSD | Amazon: 1. 1.299,00 € LG gram 17 17Z90TL-G.AU79G (... 2. 1.549,99 € LG gram Pro 16 16Z90TS-G.AU8... 3. 1.282,48 € LG Gram 17 Zoll Laptop mit I... Listenpreis: 1700€ | 987 g | 16.5 mm | 14.00" 2880x1800 243 PPI OLED |
4. 83.9%  | Lenovo ThinkBook 14 Gen 8 21SJ007SGE Intel Core Ultra 7 255H ⎘ Intel Arc Graphics 140T ⎘ 32 GB RAM, 1024 GB SSD | Amazon: 1.174,87 € Bestpreis 1071€ TechnikDeals24 2. 1071€ HEINZSOFT 3. 1080€ TechnikDeals24 AT | 1.5 kg | 20.8 mm | 14.00" 1920x1200 162 PPI IPS LED |
5. 86.4%  | Dell Pro 14 Premium Intel Core Ultra 7 268V ⎘ Intel Arc Graphics 140V ⎘ 32 GB RAM, 1024 GB SSD | Bestpreis 2174.64€ XITRA.de 2. 2200€ CNW IT-Systeme 3. 2200€ Easynotebooks.de2500 USD | 1.3 kg | 17.95 mm | 14.00" 2880x1800 243 PPI OLED |
6. 85.1%  | HP EliteBook X G1i 14 AI Intel Core Ultra 7 268V ⎘ Intel Arc Graphics 140V ⎘ 32 GB RAM, 512 GB SSD | Amazon: 1.610,85 € Bestpreis 1899€ MetaComp 2. 2015.8€ 1ashop.at 3. 2039.54€ haym.infotec | 1.2 kg | 15 mm | 14.00" 1920x1200 162 PPI IPS |
Transparenz
Die Auswahl der zu testenden Geräte erfolgt innerhalb der Redaktion. Das vorliegende Testmuster wurde dem Autor vom Hersteller oder einem Shop zu Testzwecken leihweise zur Verfügung gestellt. Eine Einflussnahme des Leihstellers auf den Testbericht gab es nicht, der Hersteller erhielt keine Version des Reviews vor der Veröffentlichung. Es bestand keine Verpflichtung zur Publikation. Als eigenständiges, unabhängiges Unternehmen unterliegt Notebookcheck keiner Diktion von Herstellern, Shops und Verlagen.
So testet Notebookcheck
Pro Jahr werden von Notebookcheck hunderte Laptops und Smartphones unabhängig in von uns standardisierten technischen Verfahren getestet, um eine Vergleichbarkeit aller Testergebnisse zu gewährleisten. Seit rund 20 Jahren entwickeln wir diese Testmethoden kontinuierlich weiter und setzen damit Branchenstandards. In unseren Testlaboren kommt ausschließlich hochwertiges Messequipment in die Hände erfahrener Techniker und Redakteure. Die Tests unterliegen einer mehrstufigen Kontrolle. Unsere komplexe Gesamtbewertung basiert auf hunderten fundierten Messergebnissen und Benchmarks, womit Ihnen Objektivität garantiert ist. Weitere Informationen zu unseren Testmethoden gibt es hier.

