Test Microsoft Surface Pro 4 Core i7 vs. Core i5 vs. Core m3
Nachdem wir drei Surface-Pro-4-Modelle mit allen verfügbare CPU-Varianten begutachtet haben, können wir schlussendlich das lüfterlose Core-m3-Einstiegsmodell, das Core-i5-Mittelklasse-Modell und das stärkste Core-i7-Modell vergleichen. Wir empfehlen unsere vollständigen Tests zum Surface Pro 4 m3 und SP4 mit Core i5 für weitere Details bezüglich Design, Qualität und der entfernbaren Tastatur namens Type Cover.
Siehe auch: Im Vergleich: Microsoft Surface Pro 4 vs. Acer Aspire Switch Alpha 12 vs. HP Elite x2 1012 G1 vs. HP Spectre x2 12 vs. Huawei MateBook
Display
Die Bildschirmmessungen liefern in etwa die gleichen Ergebnisse wie bei unserem Core-m3- und Core-i5-Modell. Am wichtigsten ist wahrscheinlich, dass das Hintergrundlicht bei zirka gleich hohem Kontrast tatsächlich etwas heller ist als bei unserer Core-m3-Konfiguration.
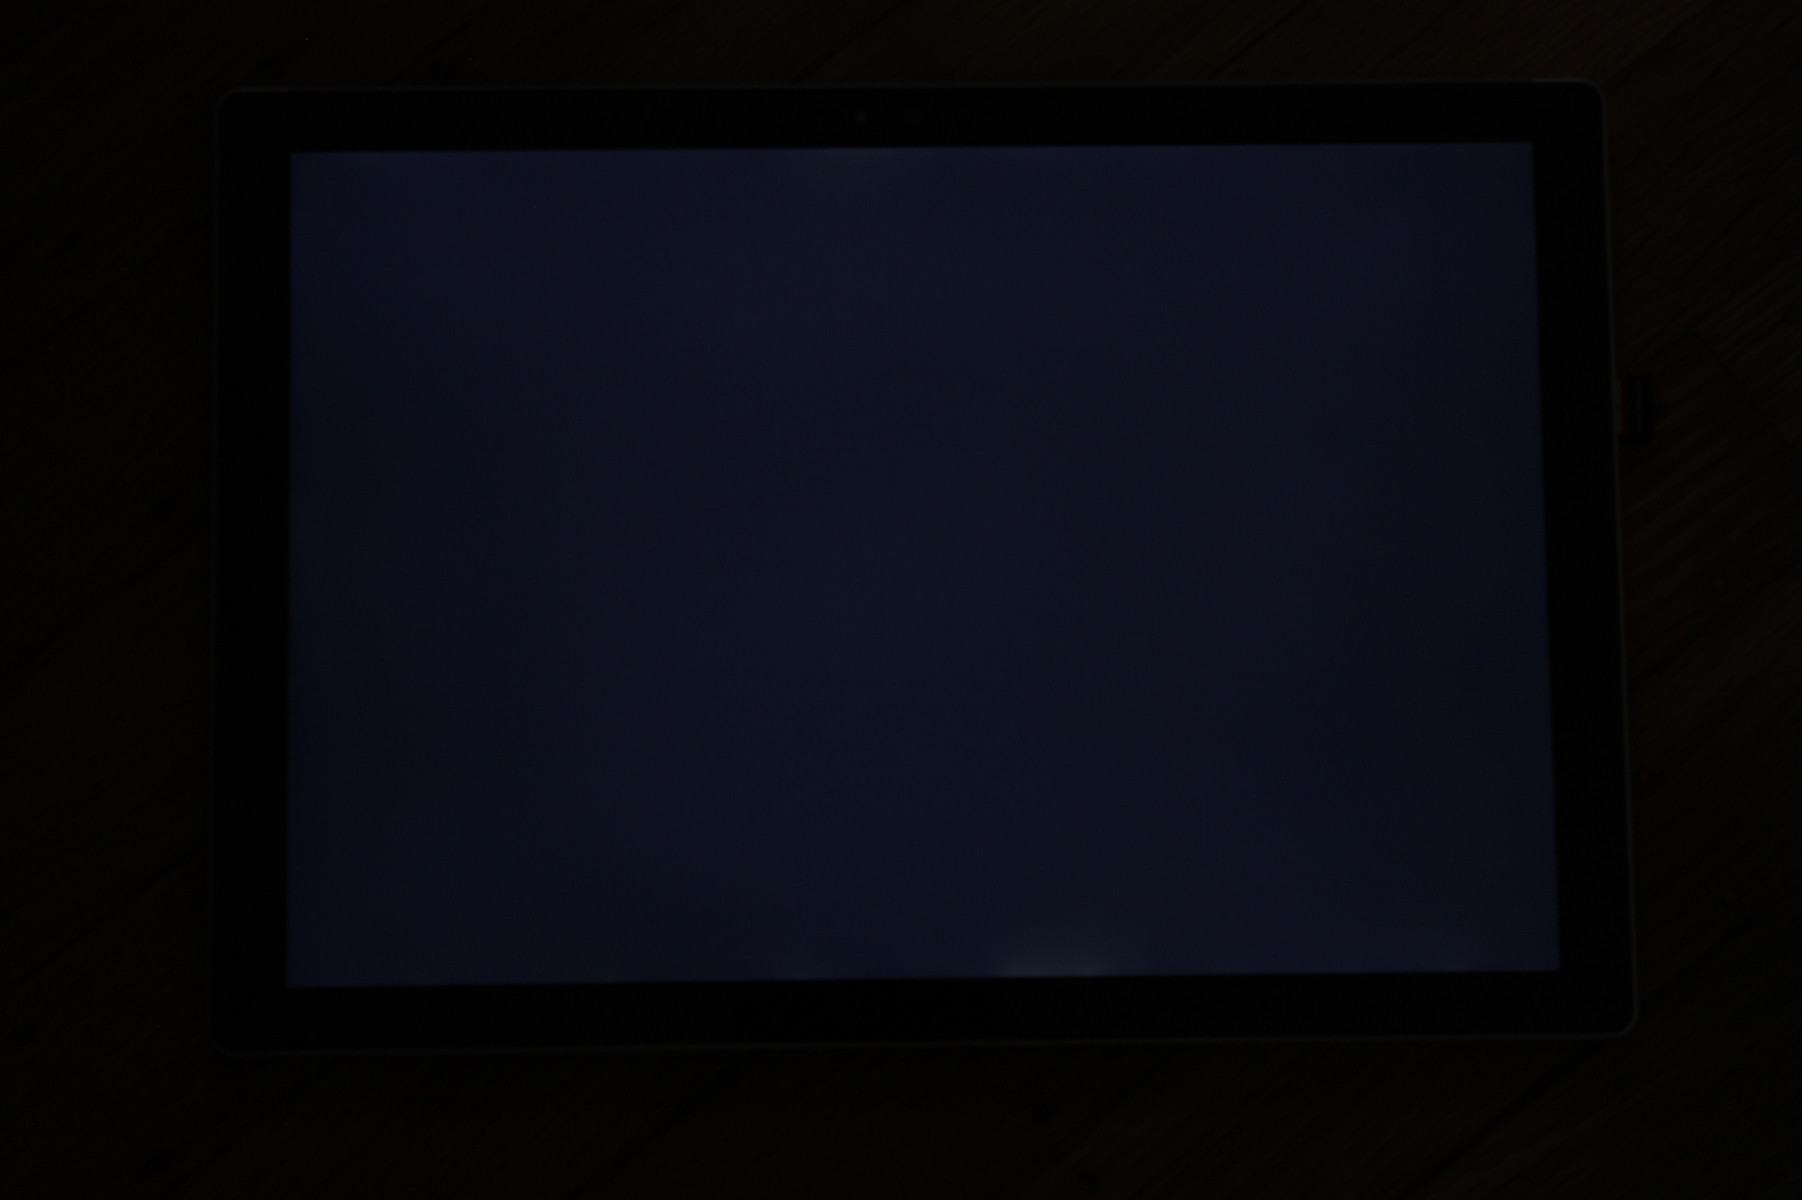
Es gibt immer noch ein minimales,unter Umständen jedoch auch sichtbares Backlight-Bleeding entlang der oberen und unteren Kanten des Tablets, etwa wenn eine dunkles Hintergrundbild gewählt wurde.
| |||||||||||||||||||||||||
Ausleuchtung: 87 %
Helligkeit Akku: 436.7 cd/m²
Kontrast: 1340:1 (Schwarzwert: 0.326 cd/m²)
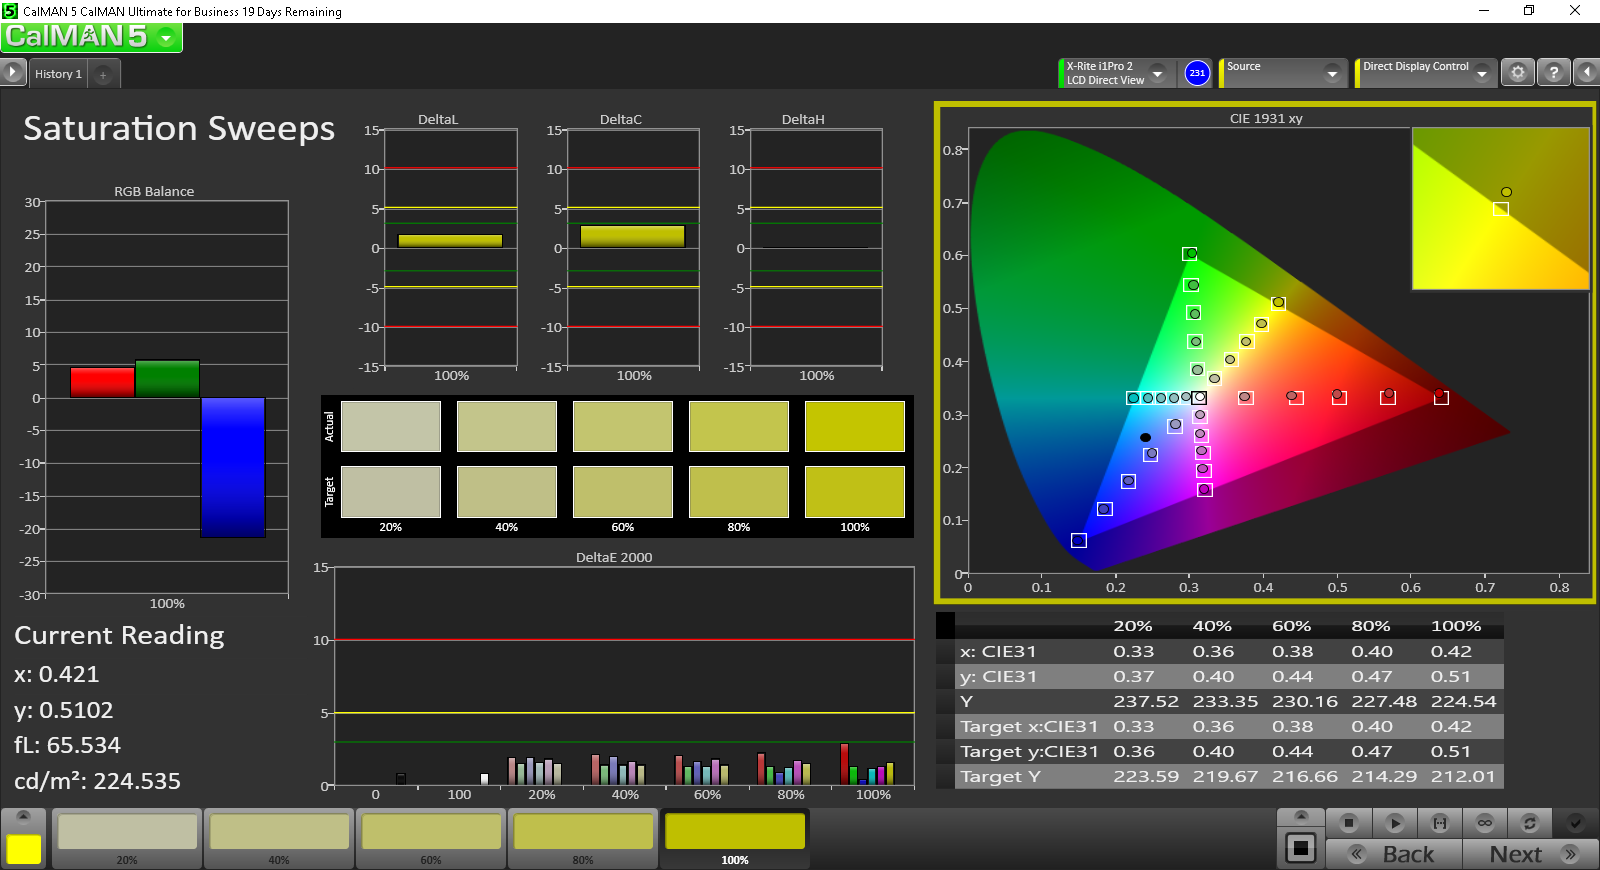
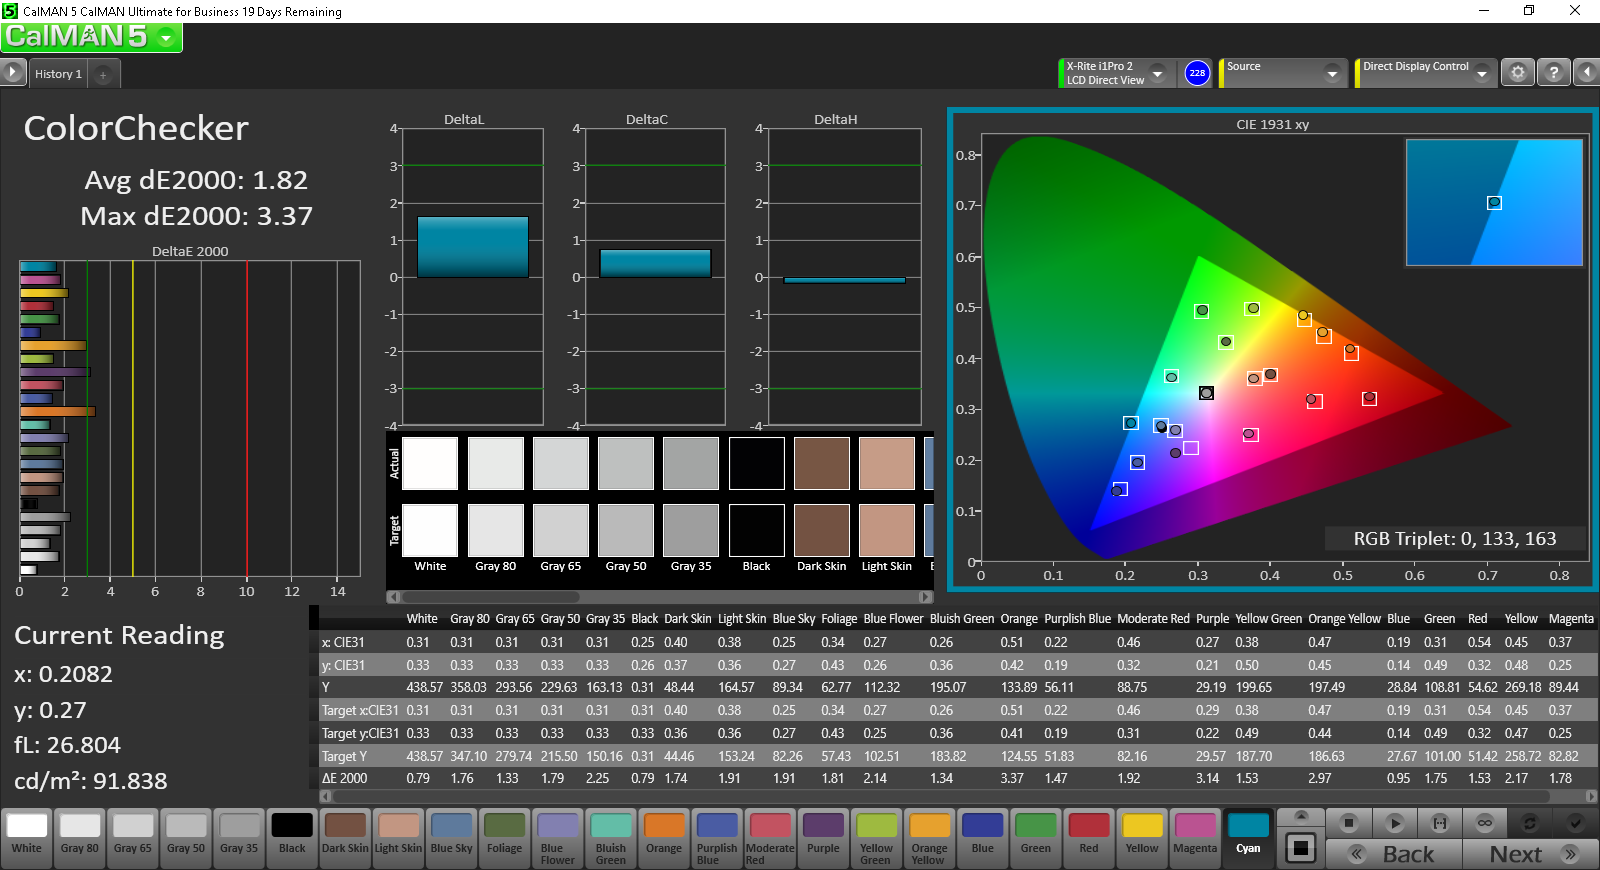
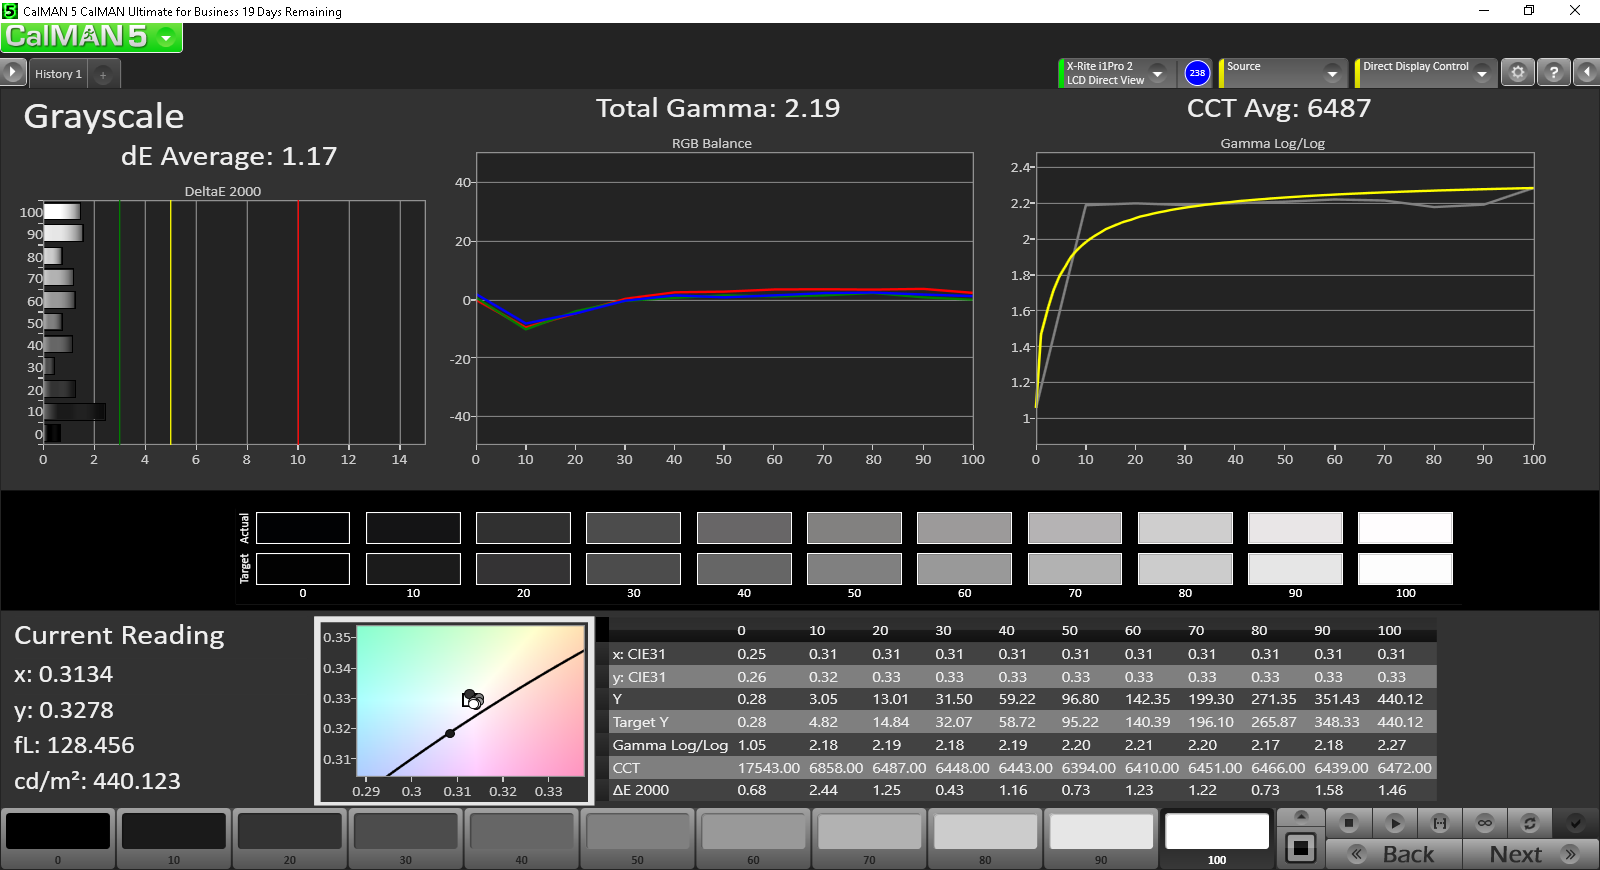
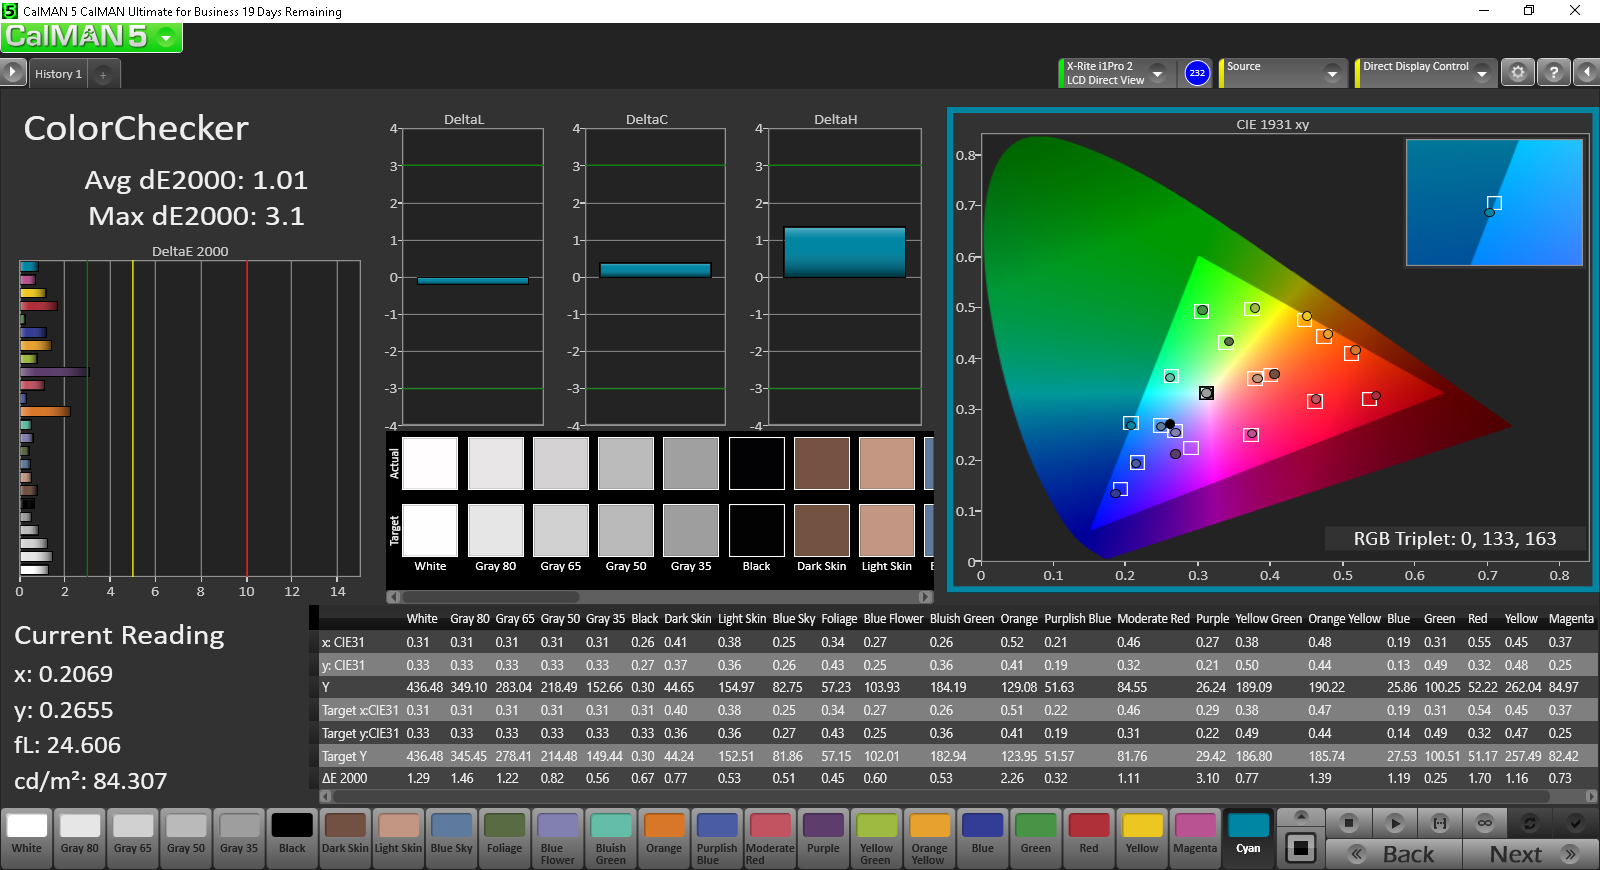
ΔE ColorChecker Calman: 1.82 | ∀{0.5-29.43 Ø4.73}
ΔE Greyscale Calman: 1.44 | ∀{0.09-98 Ø4.97}
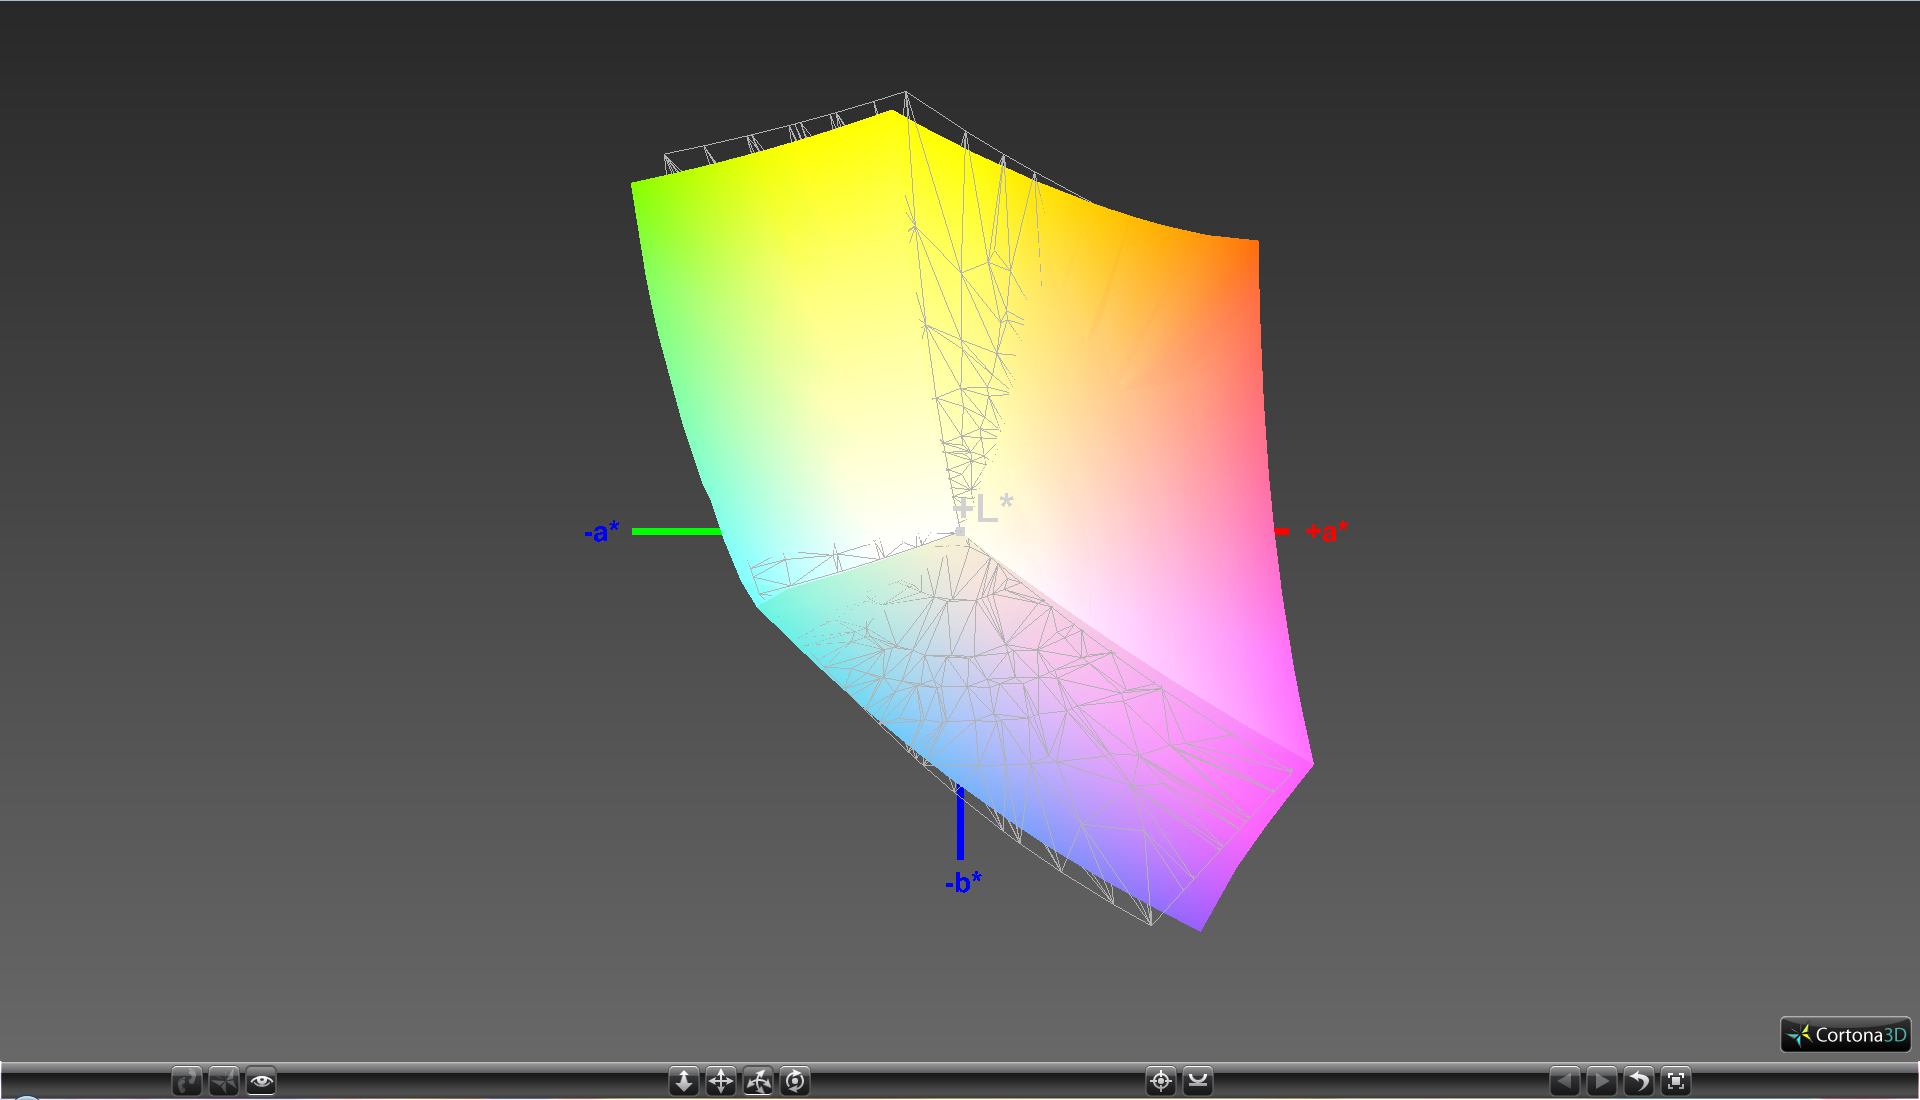
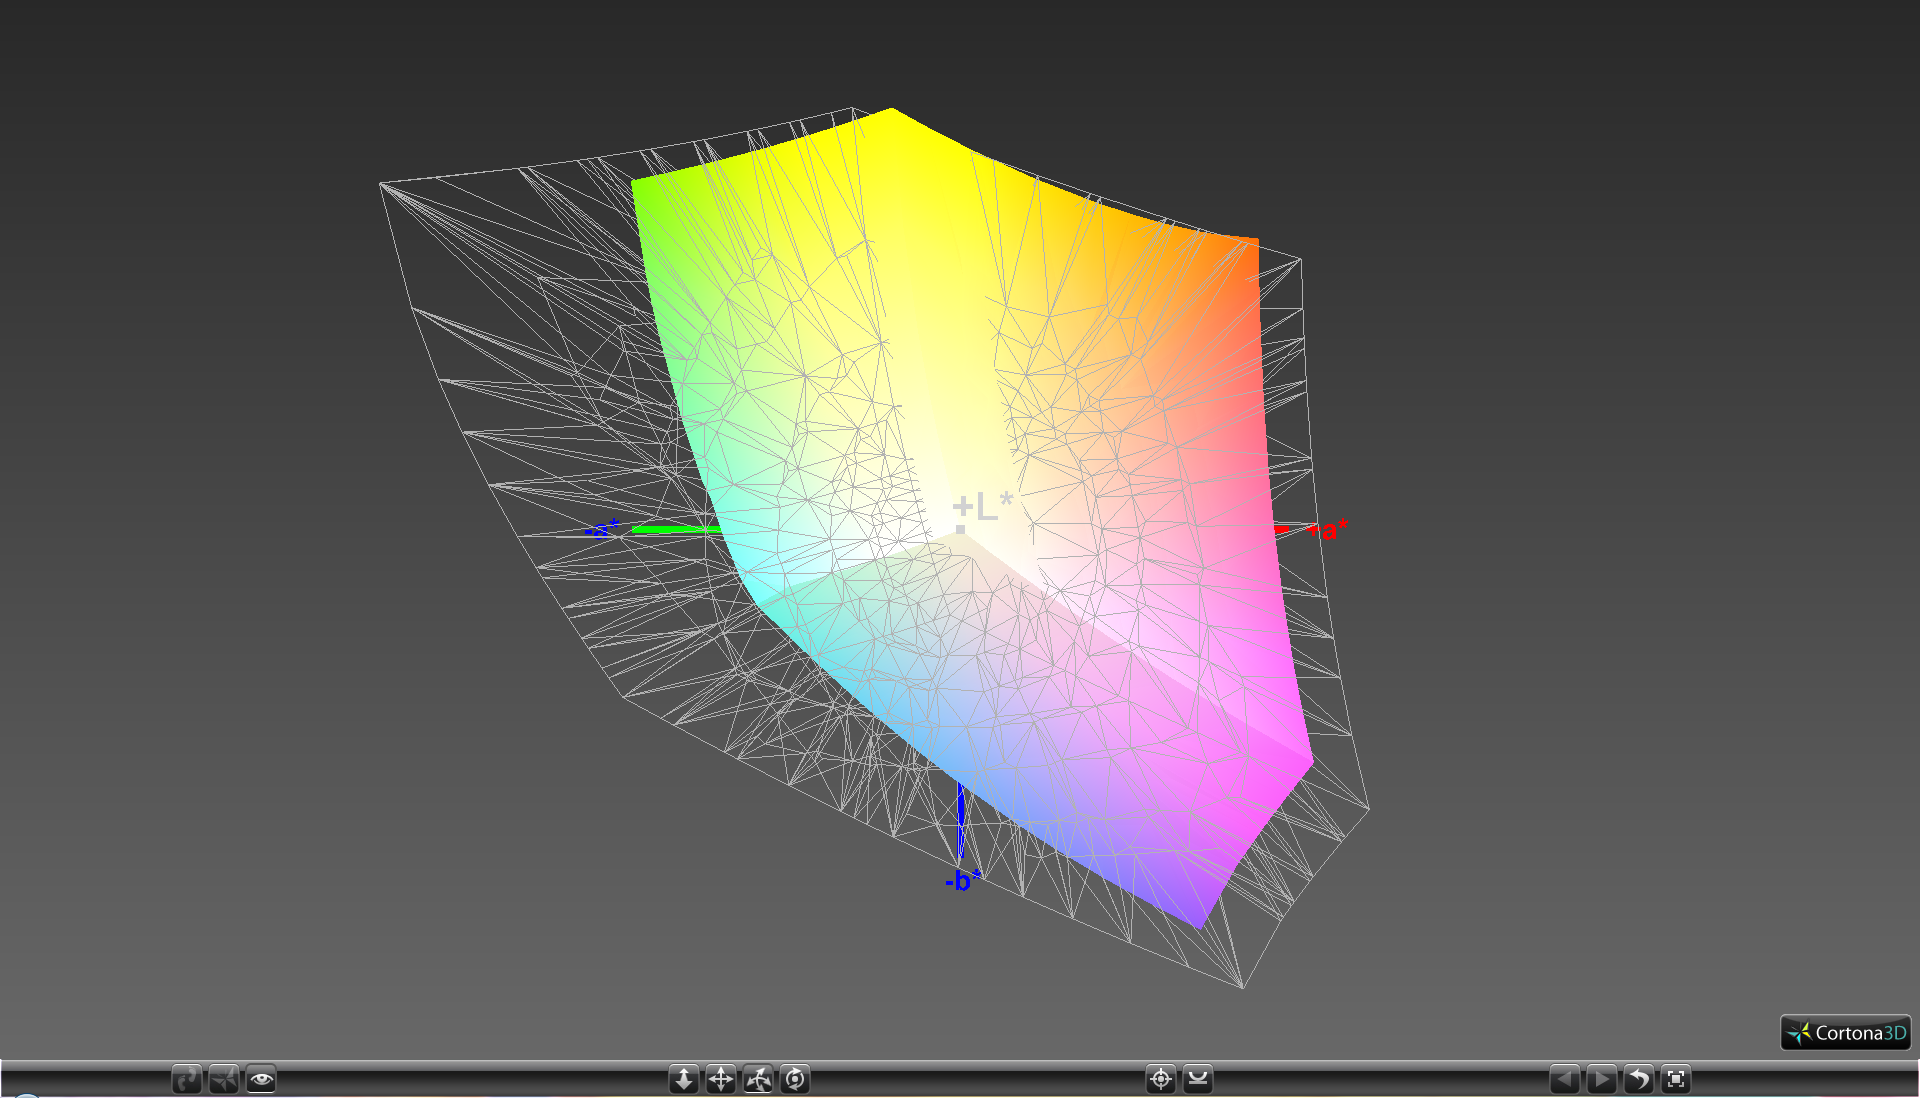
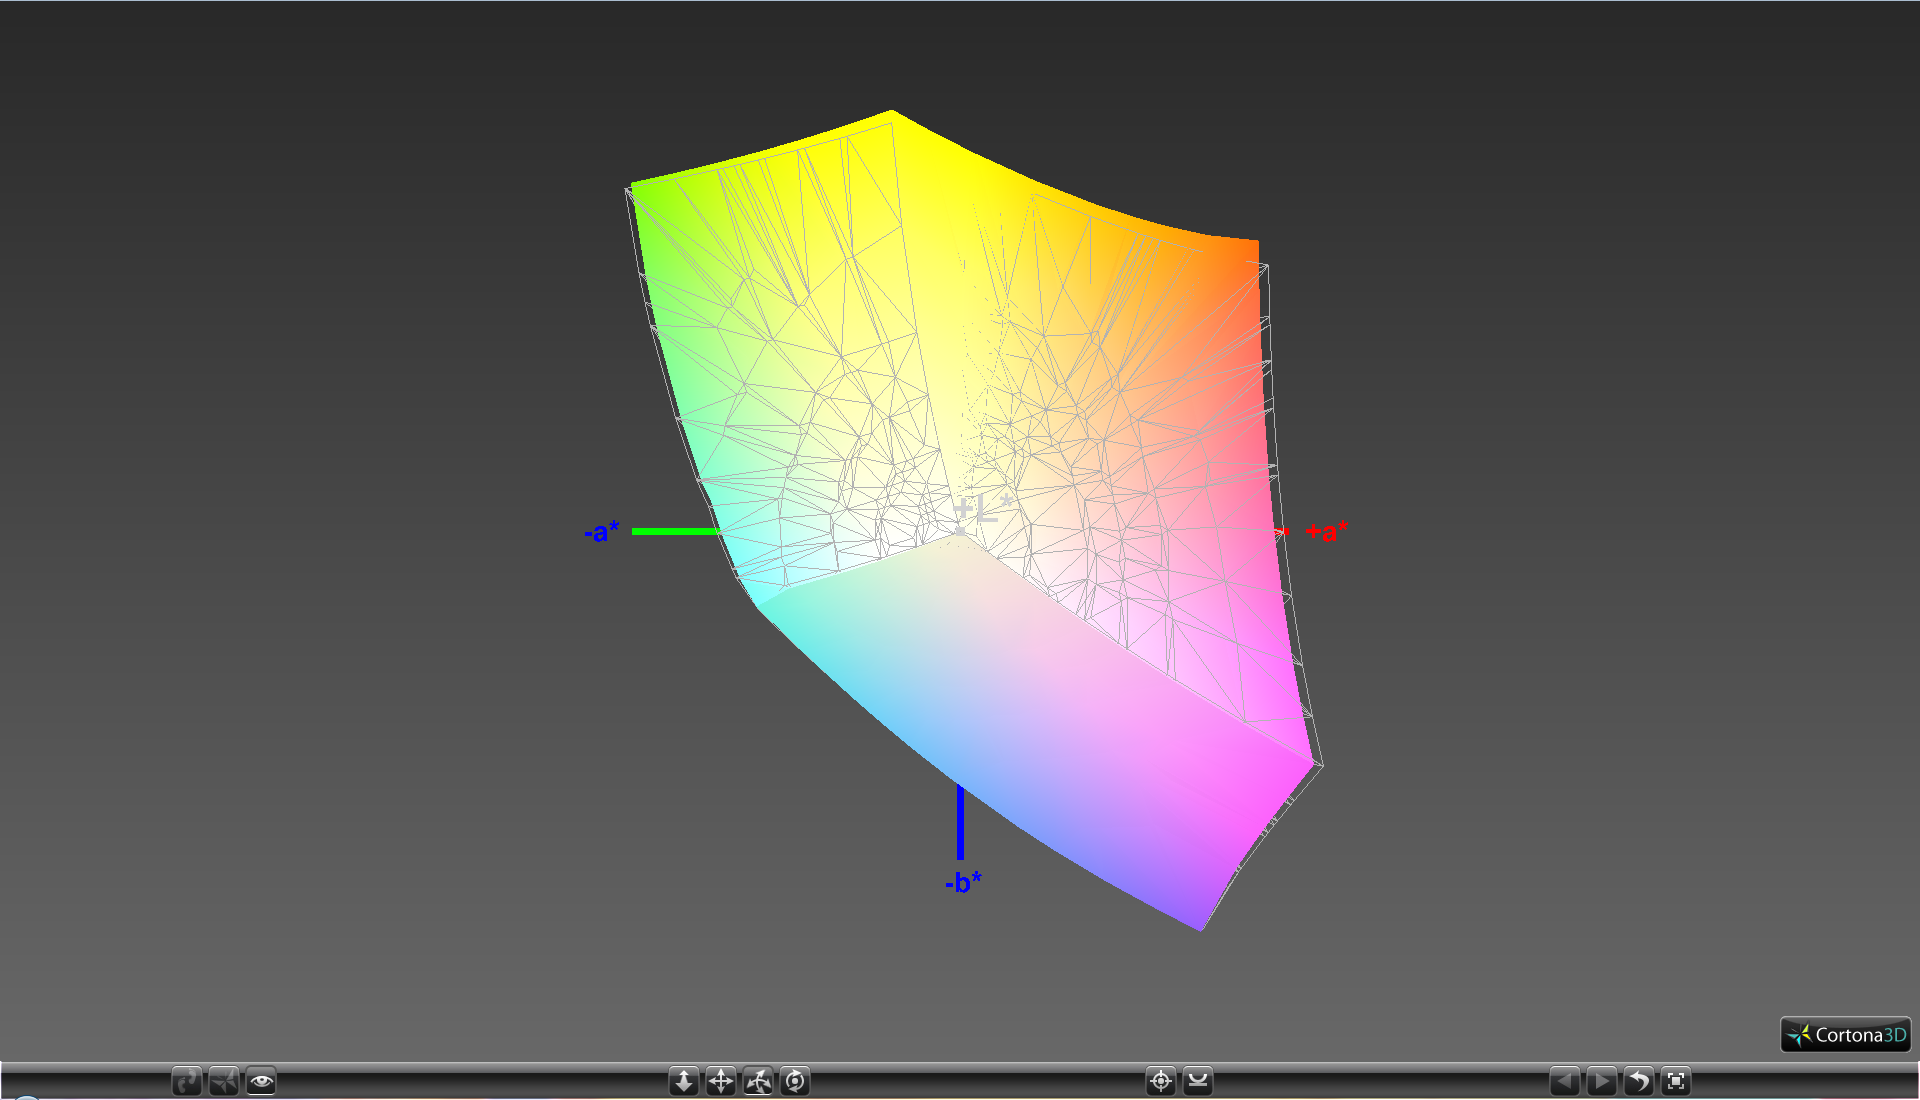
97.5% sRGB (Argyll 1.6.3 3D)
62.3% AdobeRGB 1998 (Argyll 1.6.3 3D)
68.6% AdobeRGB 1998 (Argyll 3D)
97.5% sRGB (Argyll 3D)
66.9% Display P3 (Argyll 3D)
Gamma: 2.1
CCT: 6560 K
| Microsoft Surface Pro 4 Core i7 12.3", 2736x1824 | Microsoft Surface Pro 4, Core i5, 128GB 12.3", 2736x1824 | Microsoft Surface Pro 4, Core m3 12.3", 2736x1824 | Microsoft Surface Pro 3 12", 2160x1440 | Microsoft Surface 3 10.8", 1920x1280 | |
|---|---|---|---|---|---|
| Display | -2% | 0% | -6% | 2% | |
| Display P3 Coverage (%) | 66.9 | 65 -3% | 67.5 1% | 63.6 -5% | 68.8 3% |
| sRGB Coverage (%) | 97.5 | 96.5 -1% | 96.6 -1% | 88.8 -9% | 98.7 1% |
| AdobeRGB 1998 Coverage (%) | 68.6 | 67 -2% | 69 1% | 65.6 -4% | 70.4 3% |
| Response Times | 9% | 9% | |||
| Response Time Grey 50% / Grey 80% * (ms) | 48.4 ? | 46 ? 5% | 46 ? 5% | ||
| Response Time Black / White * (ms) | 35.6 ? | 31.2 ? 12% | 31 ? 13% | ||
| PWM Frequency (Hz) | 10420 | 50 ? | 50 ? | ||
| Bildschirm | -31% | -28% | -72% | -21% | |
| Helligkeit Bildmitte (cd/m²) | 436.7 | 413 -5% | 389.2 -11% | 355.3 -19% | 399 -9% |
| Brightness (cd/m²) | 433 | 396 -9% | 392 -9% | 338 -22% | 380 -12% |
| Brightness Distribution (%) | 87 | 87 0% | 92 6% | 91 5% | 90 3% |
| Schwarzwert * (cd/m²) | 0.326 | 0.36 -10% | 0.27 17% | 0.33 -1% | 0.49 -50% |
| Kontrast (:1) | 1340 | 1147 -14% | 1441 8% | 1077 -20% | 814 -39% |
| Delta E Colorchecker * | 1.82 | 3.09 -70% | 3.61 -98% | 4.72 -159% | 1.66 9% |
| Delta E Graustufen * | 1.44 | 3.92 -172% | 3.8 -164% | 6.53 -353% | 2.75 -91% |
| Gamma | 2.1 105% | 2.3 96% | 2.16 102% | 2.17 101% | 2.22 99% |
| CCT | 6560 99% | 7333 89% | 5969 109% | 6707 97% | 6358 102% |
| Farbraum (Prozent von AdobeRGB 1998) (%) | 62.3 | 61 -2% | 63 1% | 59.37 -5% | 64.4 3% |
| Color Space (Percent of sRGB) (%) | 97.5 | 97 -1% | 97 -1% | 98.8 1% | |
| Colorchecker dE 2000 max. * | 3.24 | ||||
| Durchschnitt gesamt (Programm / Settings) | -8% /
-19% | -6% /
-17% | -39% /
-54% | -10% /
-15% |
* ... kleinere Werte sind besser
Das Samsung 123YL01-001 Panel ist identisch zu jenem im m3- und Core-i5-Modell. Daher ist die Farbraumabdeckung mit 97 bzw. 62 Prozent der sRGB- bzw. AdobeRGB-Standards ebenso in etwa gleich.
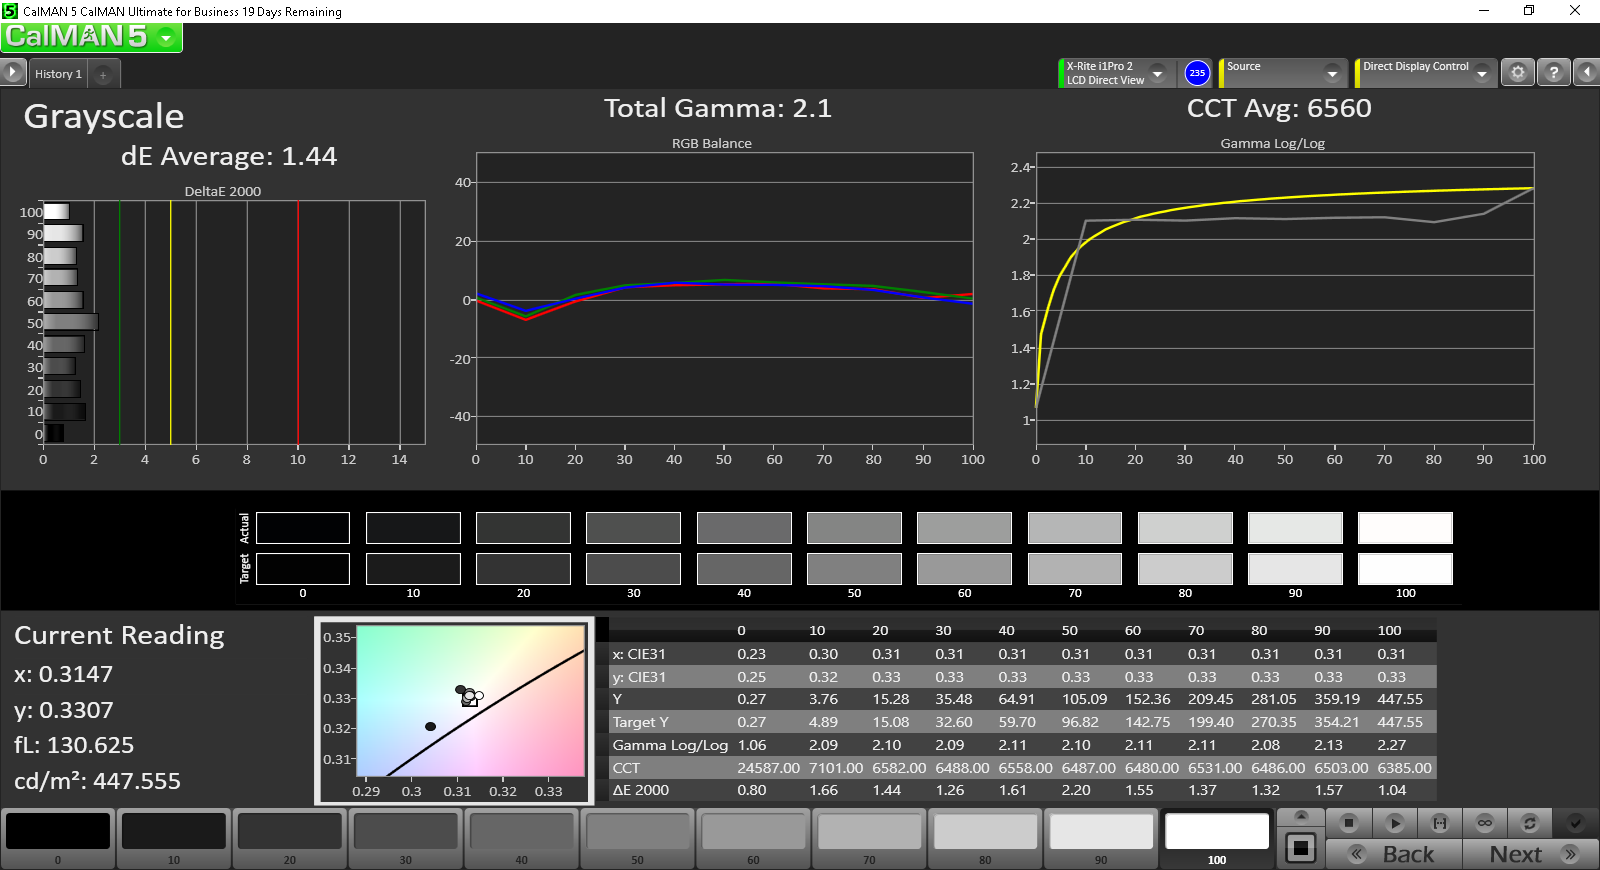
Die Daten werden interessant, sobald man tiefer in die Farbdarstellung des Core-i7-Modelles eintaucht. Der Bildschirm erscheint - anders als beim Core-m3- bzw. Core-i7-Modell - gut kalibriert, bevor er den Endverbraucher erreicht. Graustufen und Farben gehören zu den genauesten, die wir bei einem Windows Tablet gesehen haben. Eine zusätzliche Kalibrierung erhöht die Helligkeit noch mehr, jedoch nicht viel. Dies könnte auch auf ein mögliches Softwareupdate seit den Tests unserer ersten Geräte mit Core m3 und i5 zurückzuführen sein.

Reaktionszeiten (Response Times) des Displays
| ↔ Reaktionszeiten Schwarz zu Weiß | ||
|---|---|---|
| 35.6 ms ... steigend ↗ und fallend ↘ kombiniert | ↗ 8 ms steigend | 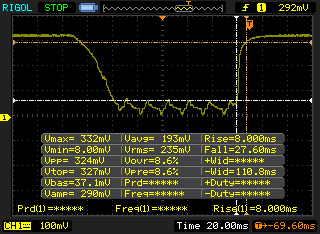 |
| ↘ 27.6 ms fallend | ||
| Die gemessenen Reaktionszeiten sind langsam und dadurch für viele Spieler wahrscheinlich zu langsam. Im Vergleich rangierten die bei uns getesteten Geräte von 0.1 (Minimum) zu 240 (Maximum) ms. » 93 % aller Screens waren schneller als der getestete. Daher sind die gemessenen Reaktionszeiten schlechter als der Durchschnitt aller vermessenen Geräte (19.9 ms). | ||
| ↔ Reaktionszeiten 50% Grau zu 80% Grau | ||
| 48.4 ms ... steigend ↗ und fallend ↘ kombiniert | ↗ 20.4 ms steigend | 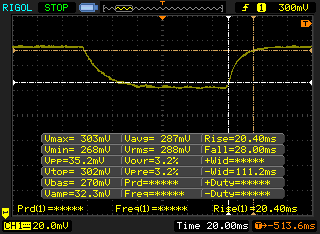 |
| ↘ 28 ms fallend | ||
| Die gemessenen Reaktionszeiten sind langsam und dadurch für viele Spieler wahrscheinlich zu langsam. Im Vergleich rangierten die bei uns getesteten Geräte von 0.165 (Minimum) zu 636 (Maximum) ms. » 84 % aller Screens waren schneller als der getestete. Daher sind die gemessenen Reaktionszeiten schlechter als der Durchschnitt aller vermessenen Geräte (31.1 ms). | ||
Leistung
Der Core i7-6650U gehört zu den schnellsten ULV-Dual-Core-Skylake-Prozessoren. Seine Taktrate von 2,2 GHz ist 1,3 GHz schneller als jene des Core m3-6Y30 und 200 MHz langsamer als die vom Core i5-6300U. Dafür liefert er ein schnelleres Turbo-Boost-Potential von bis zu 3,2 bis 3,4 GHz abhängig von der Systemlast.
Das i7-Modell integriert eine Iris Graphics 540, welche schneller ist als die HD 520 und HD 515 im Core i5 bzw. m3.
Wie üblich verweisen wir auf unsere CPU-Spezialseiten zum i7-6650U, i5-6300U und m3-6Y30 für weitere technische Informationen und Vergleiche.
| Surface Pro 4 Core i7-6650U | Surface Pro 4 Core i5-6300U | Surface Pro 4 Core m3-6Y30 | |
| CPU Basistakt (GHz) | 2,2 | 2,4 | 0,9 |
| theoretischer maximaler Turbo-Boost (GHz) | 3,4 | 3,0 | 2,2 |
| integrierte GPU | Iris Graphics 540 | HD Graphics 520 | HD Graphics 515 |
| GPU-Takt (MHz) | 300-1050 | 300-1050 | 300-850 |
| Execution Units (EU) | 48 | 24 | 24 |
| TDP | 15 W | 15 W | 4,5 W |
Prozessor
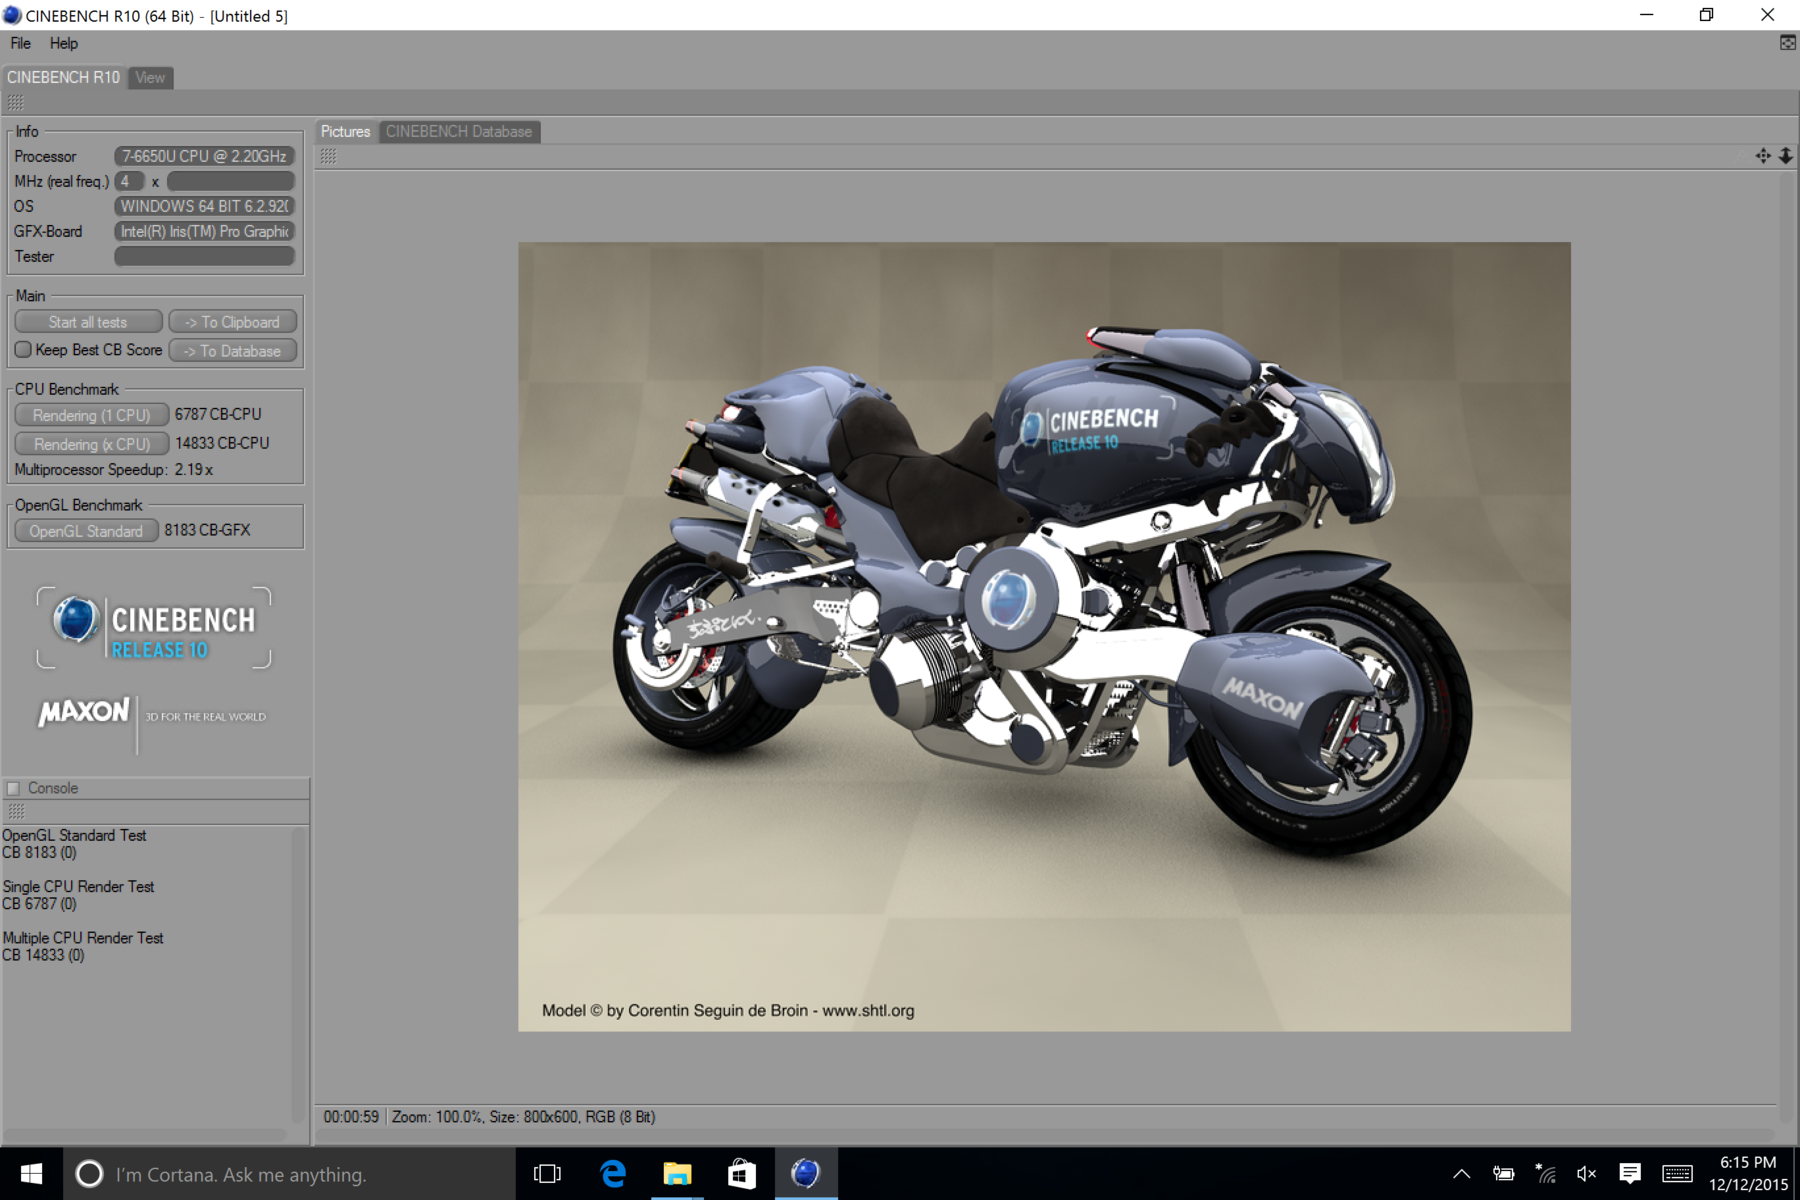
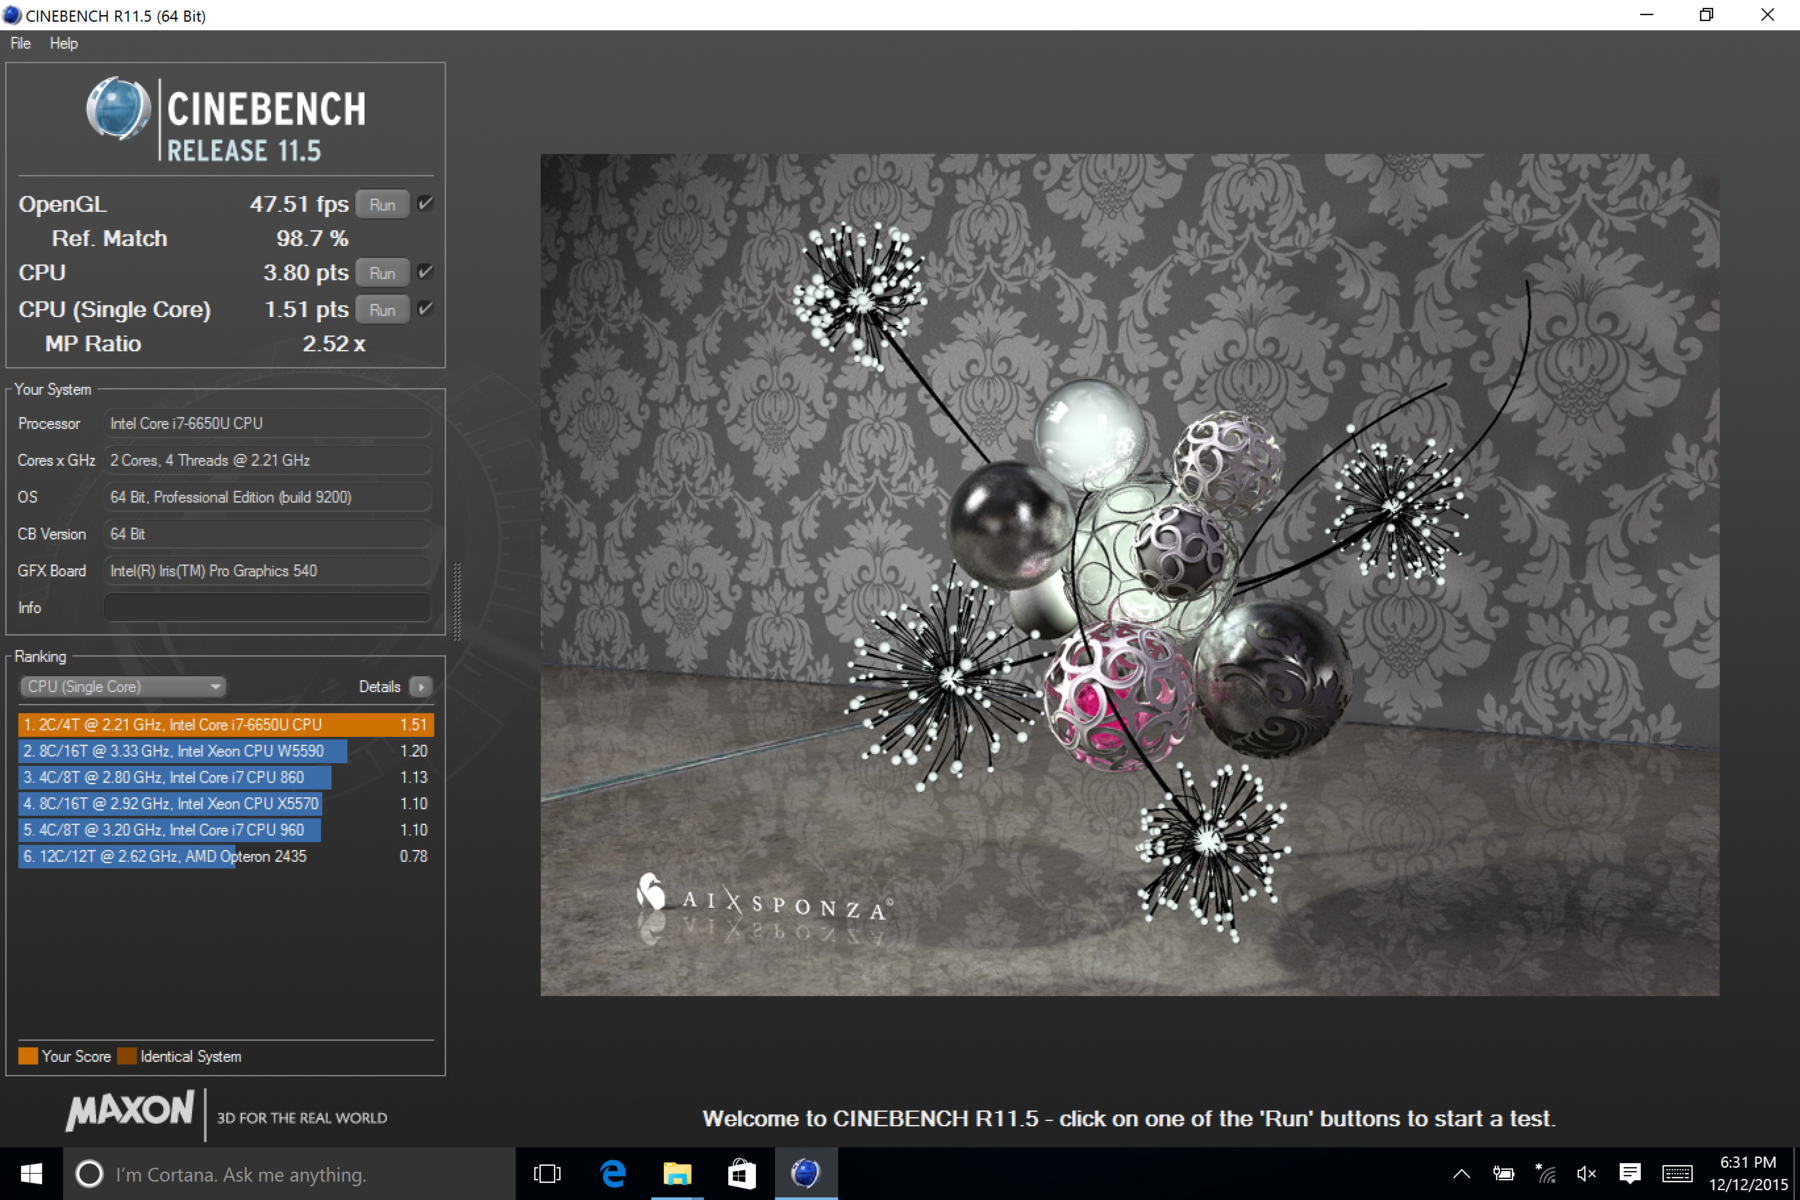
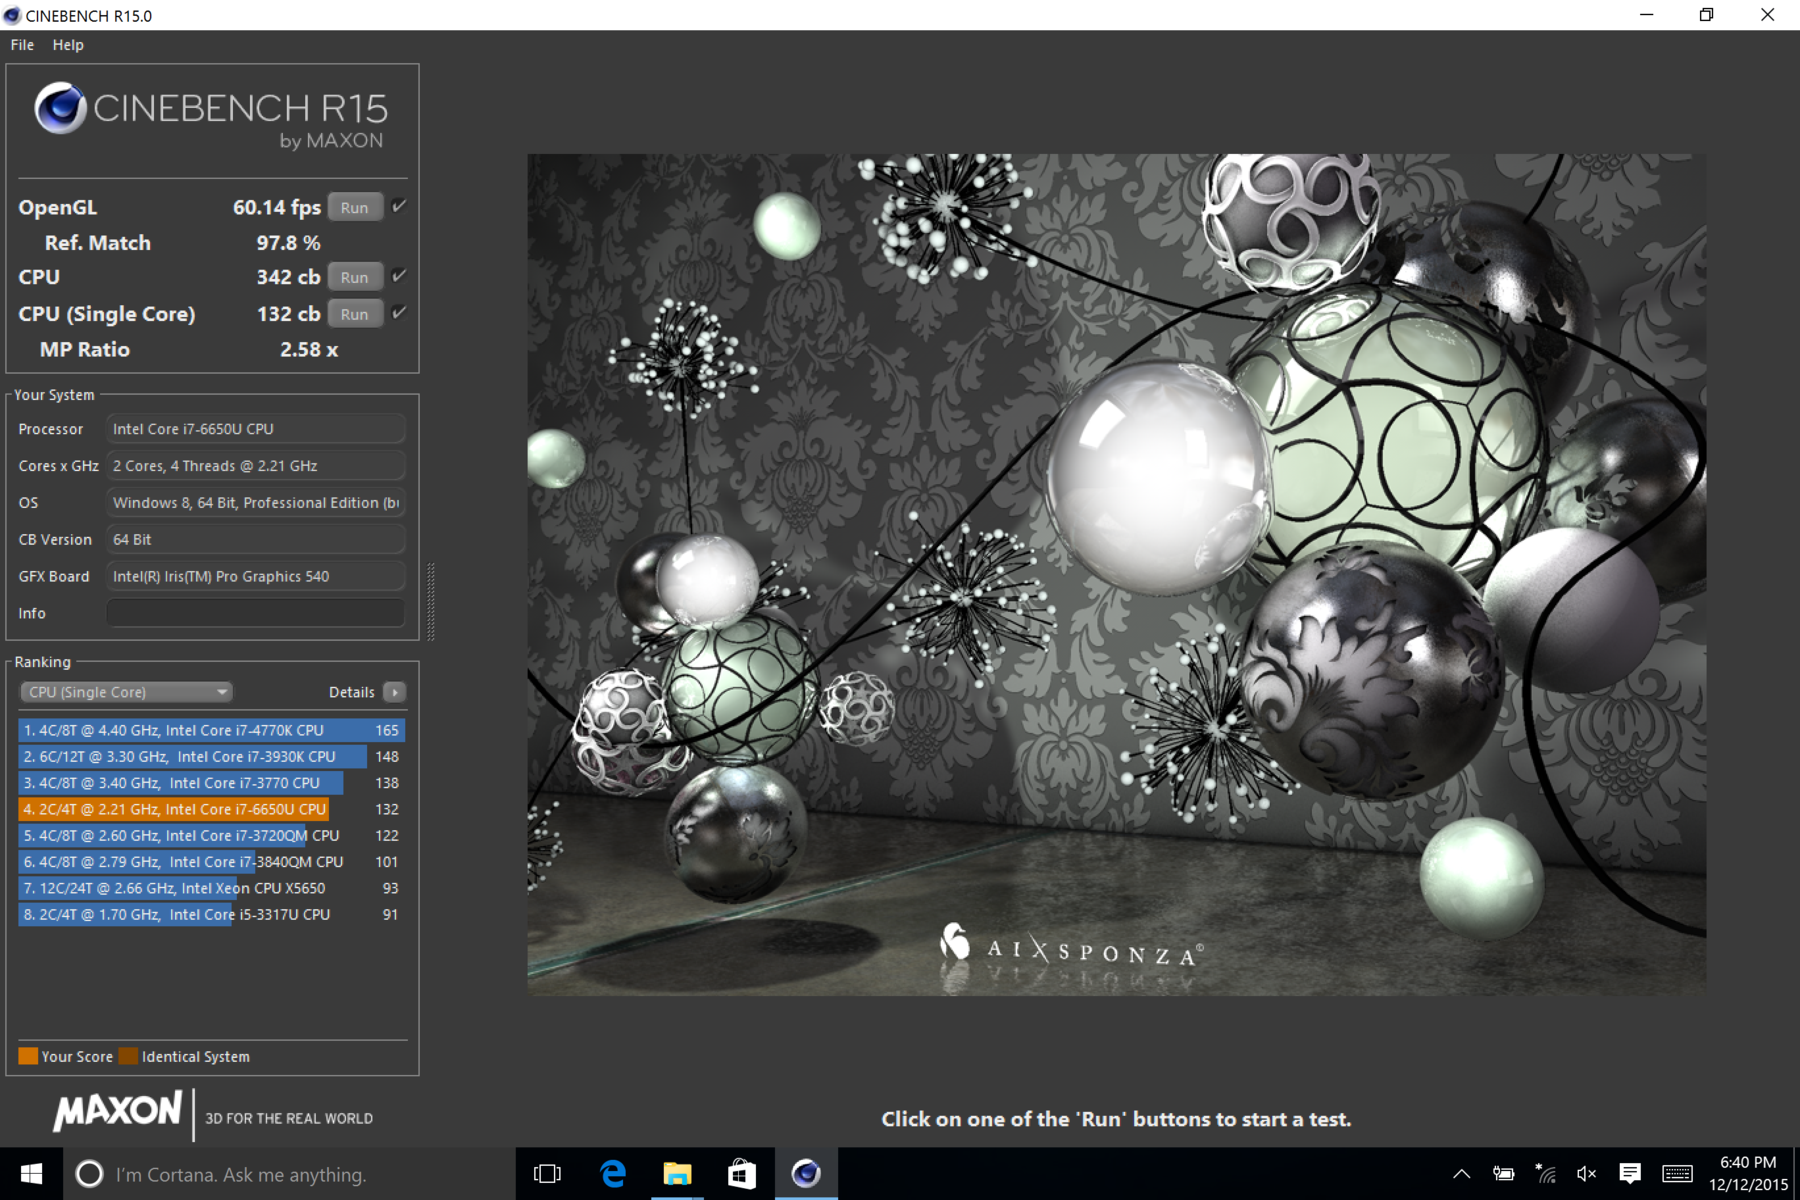
Laut CineBench können sich User gegenüber dem Core-i5-Modell zirka 10 Prozent reinen Leistungsgewinn erwarten und zirka 30 bis 40 Prozent mehr Leistung im Vergleich zum Core-m3-Modell. Während die Vorteile bei der CPU-Leistung gegenüber dem Core i5 klein sind, ist allerdings die Grafikleistung mit zirka 40 Prozent signifikant besser als die des HD Graphics 520 im Core i5.
| wPrime 2.10 - 1024m (nach Ergebnis sortieren) | |
| Microsoft Surface Pro 4 Core i7 | |
| Microsoft Surface Pro 3 | |
| Microsoft Surface Pro 4, Core m3 | |
| Super Pi Mod 1.5 XS 32M - 32M (nach Ergebnis sortieren) | |
| Microsoft Surface Pro 4 Core i7 | |
| Microsoft Surface Pro 3 | |
| Microsoft Surface Pro 4, Core m3 | |
* ... kleinere Werte sind besser
System Performance
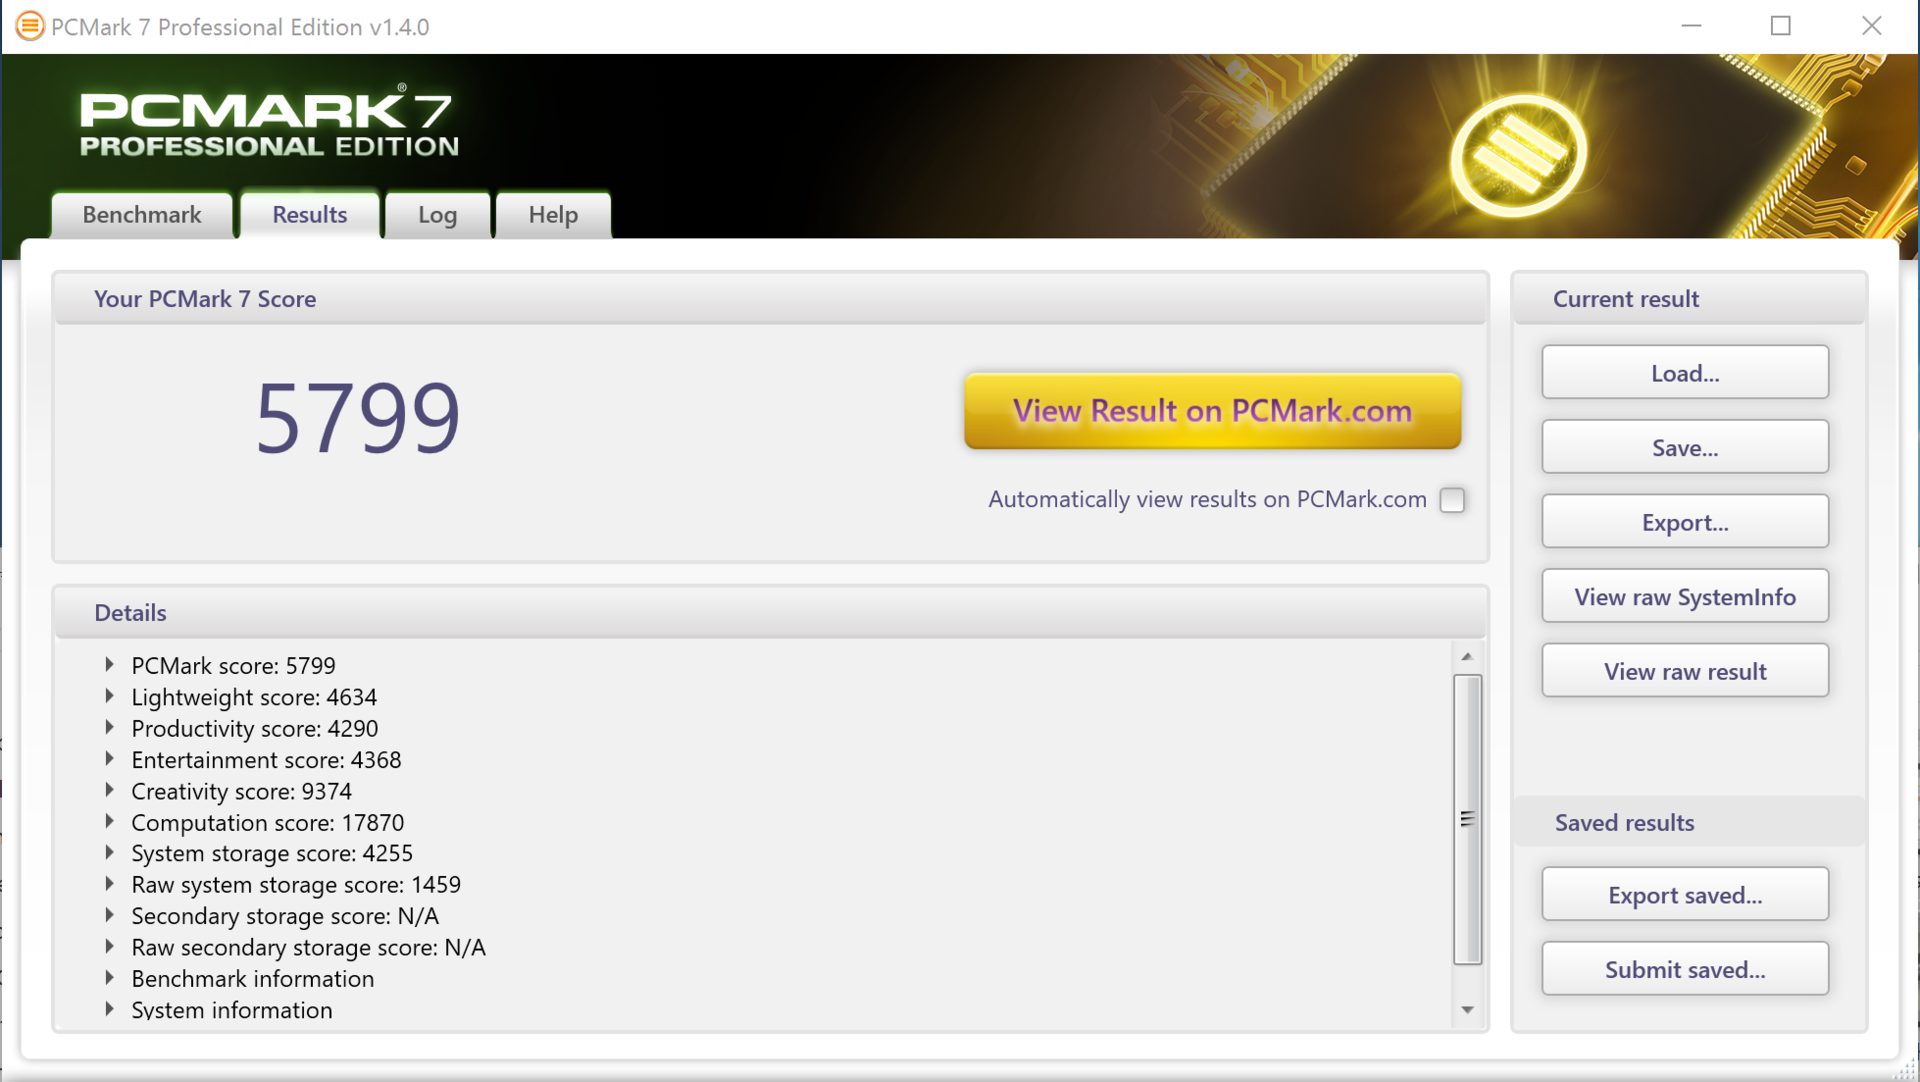
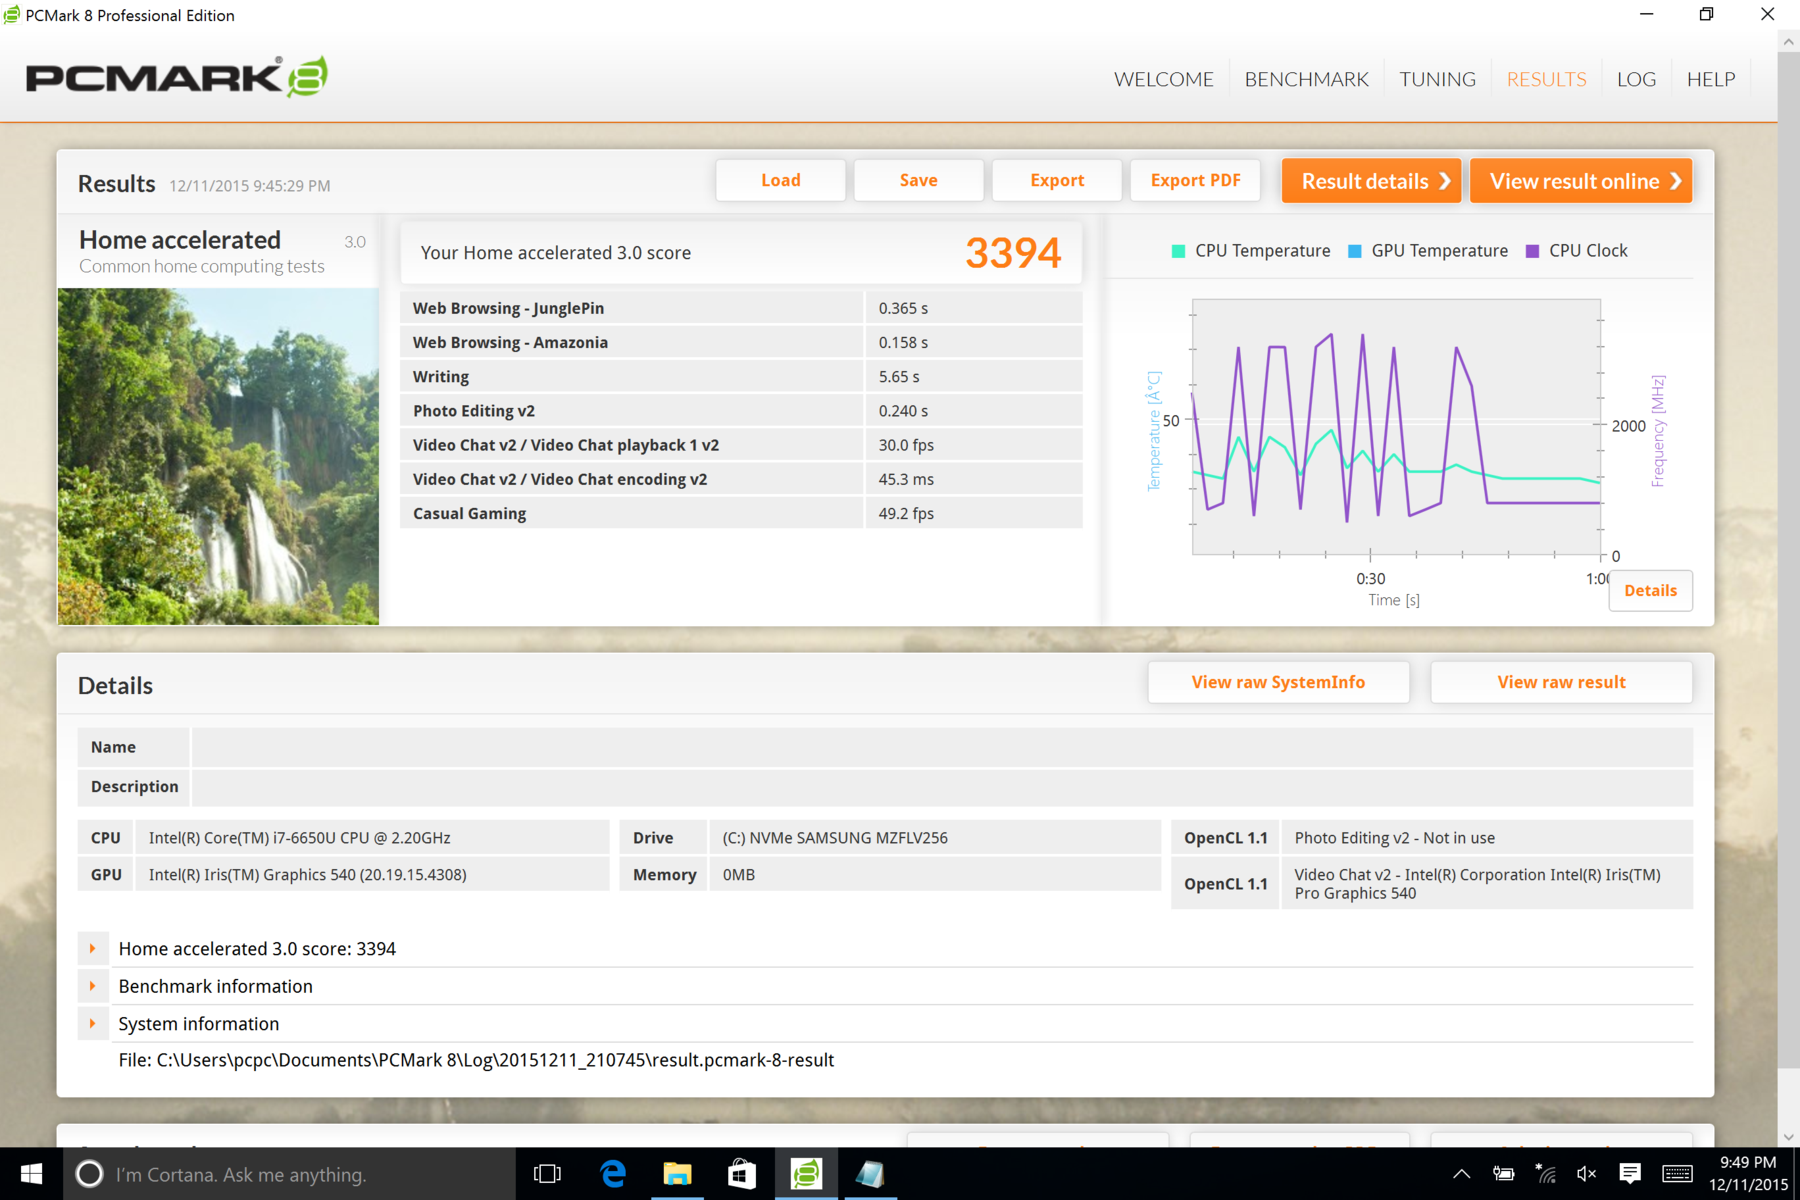
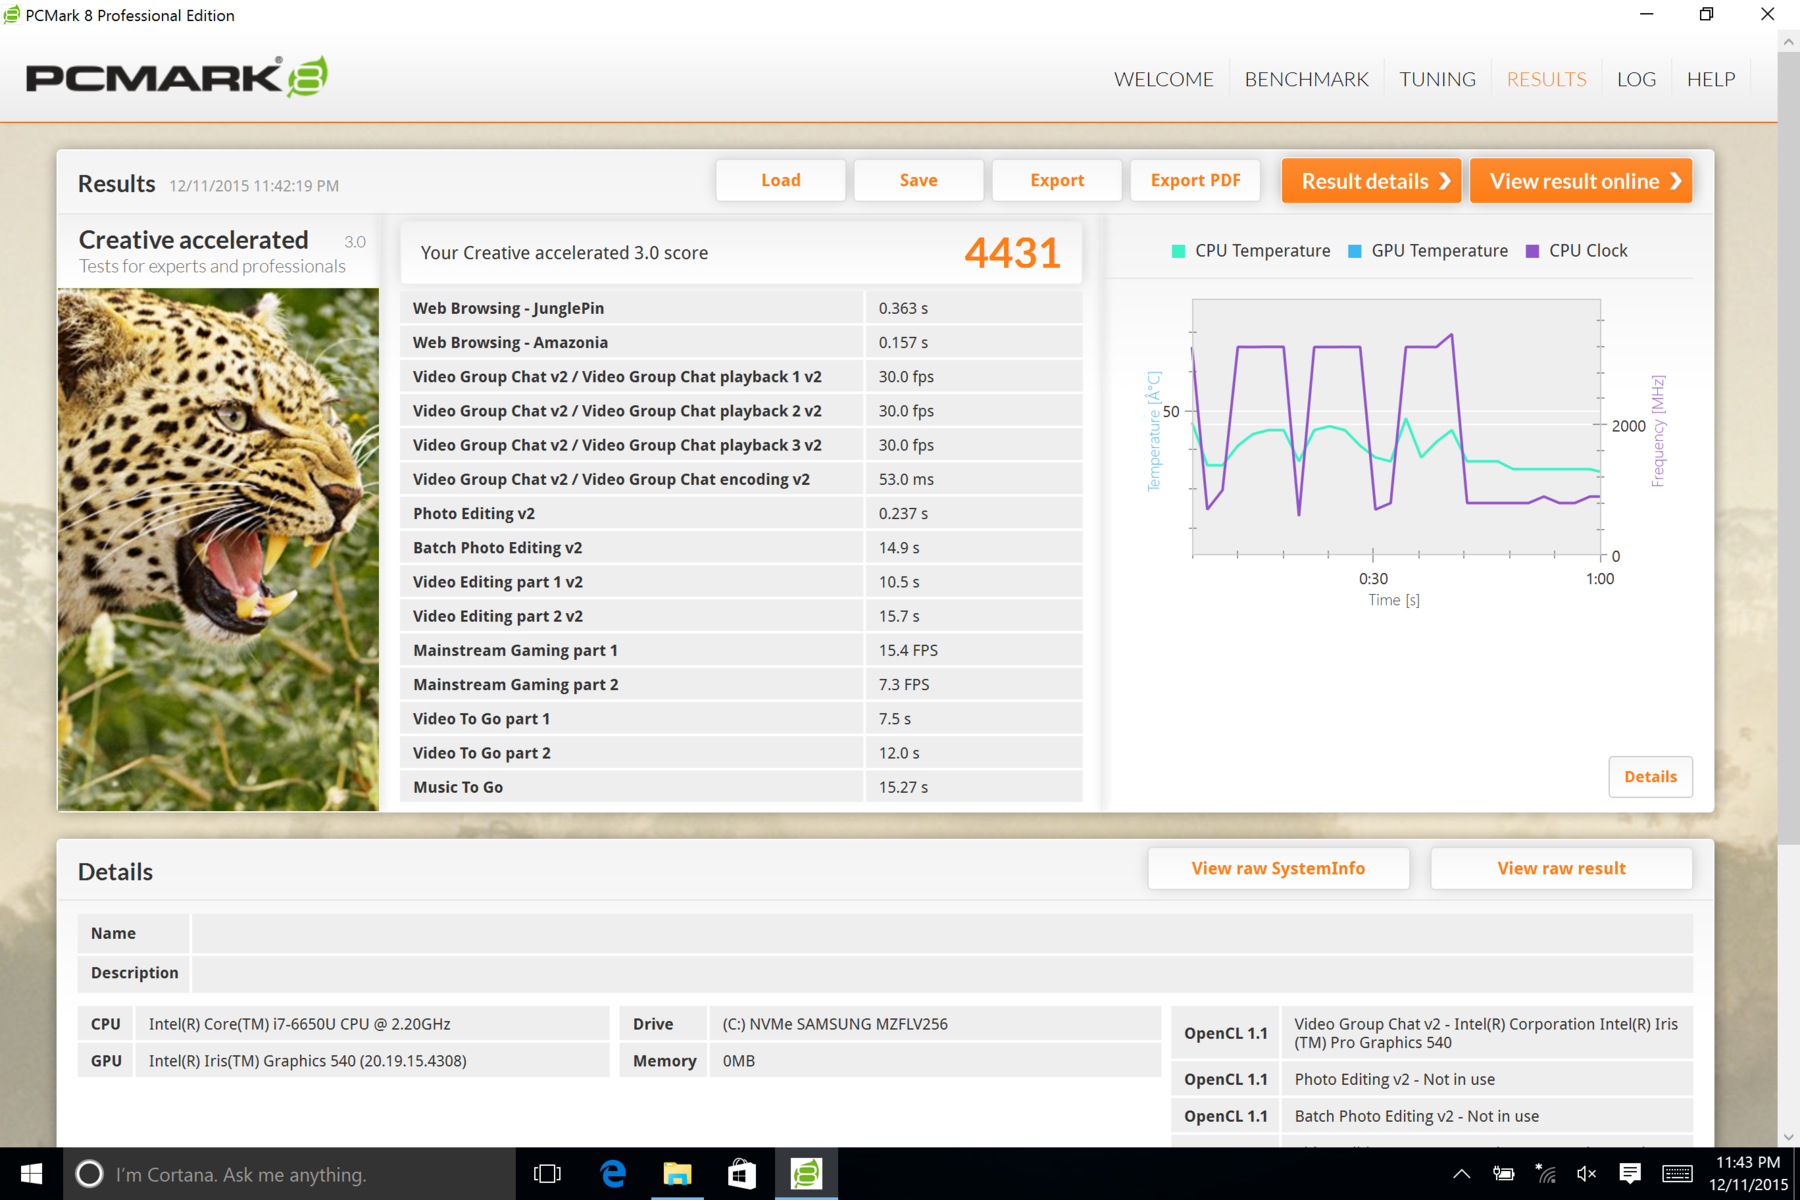
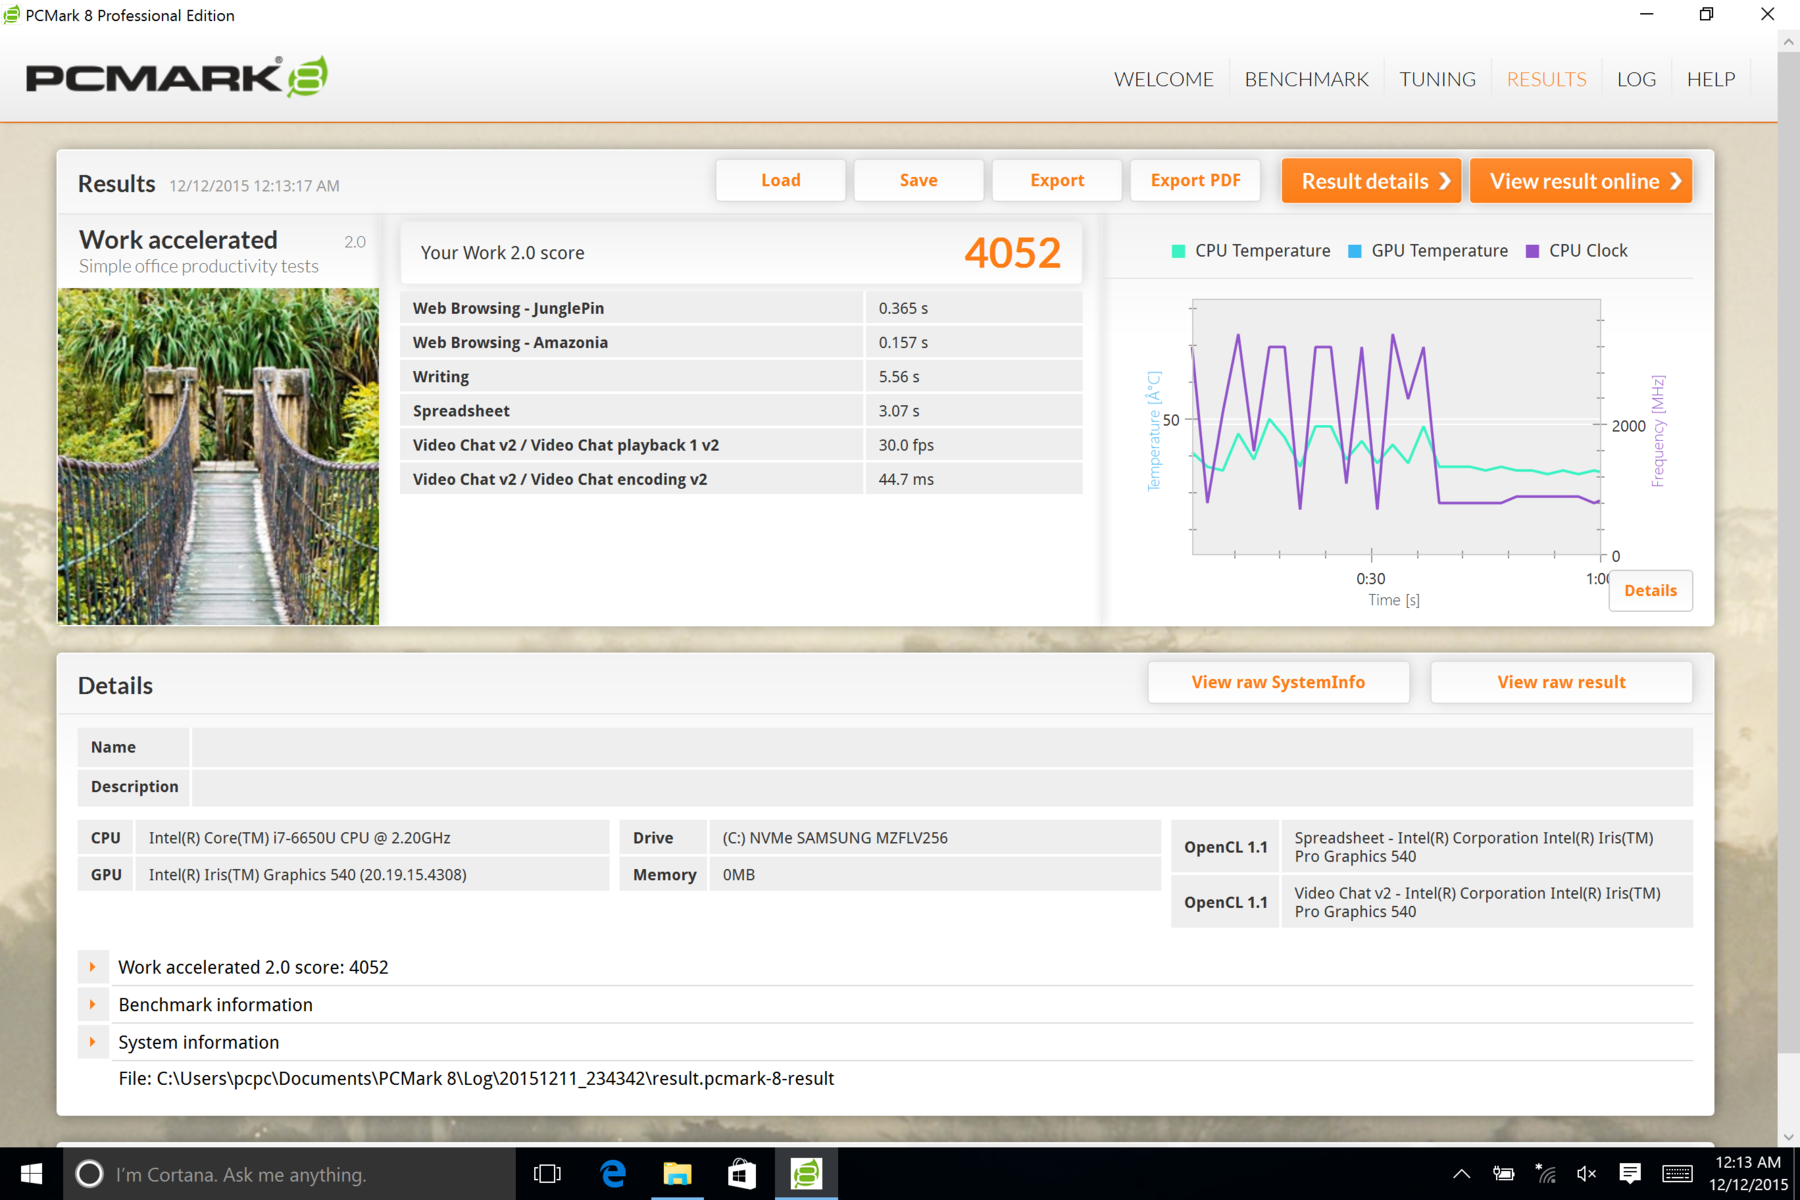
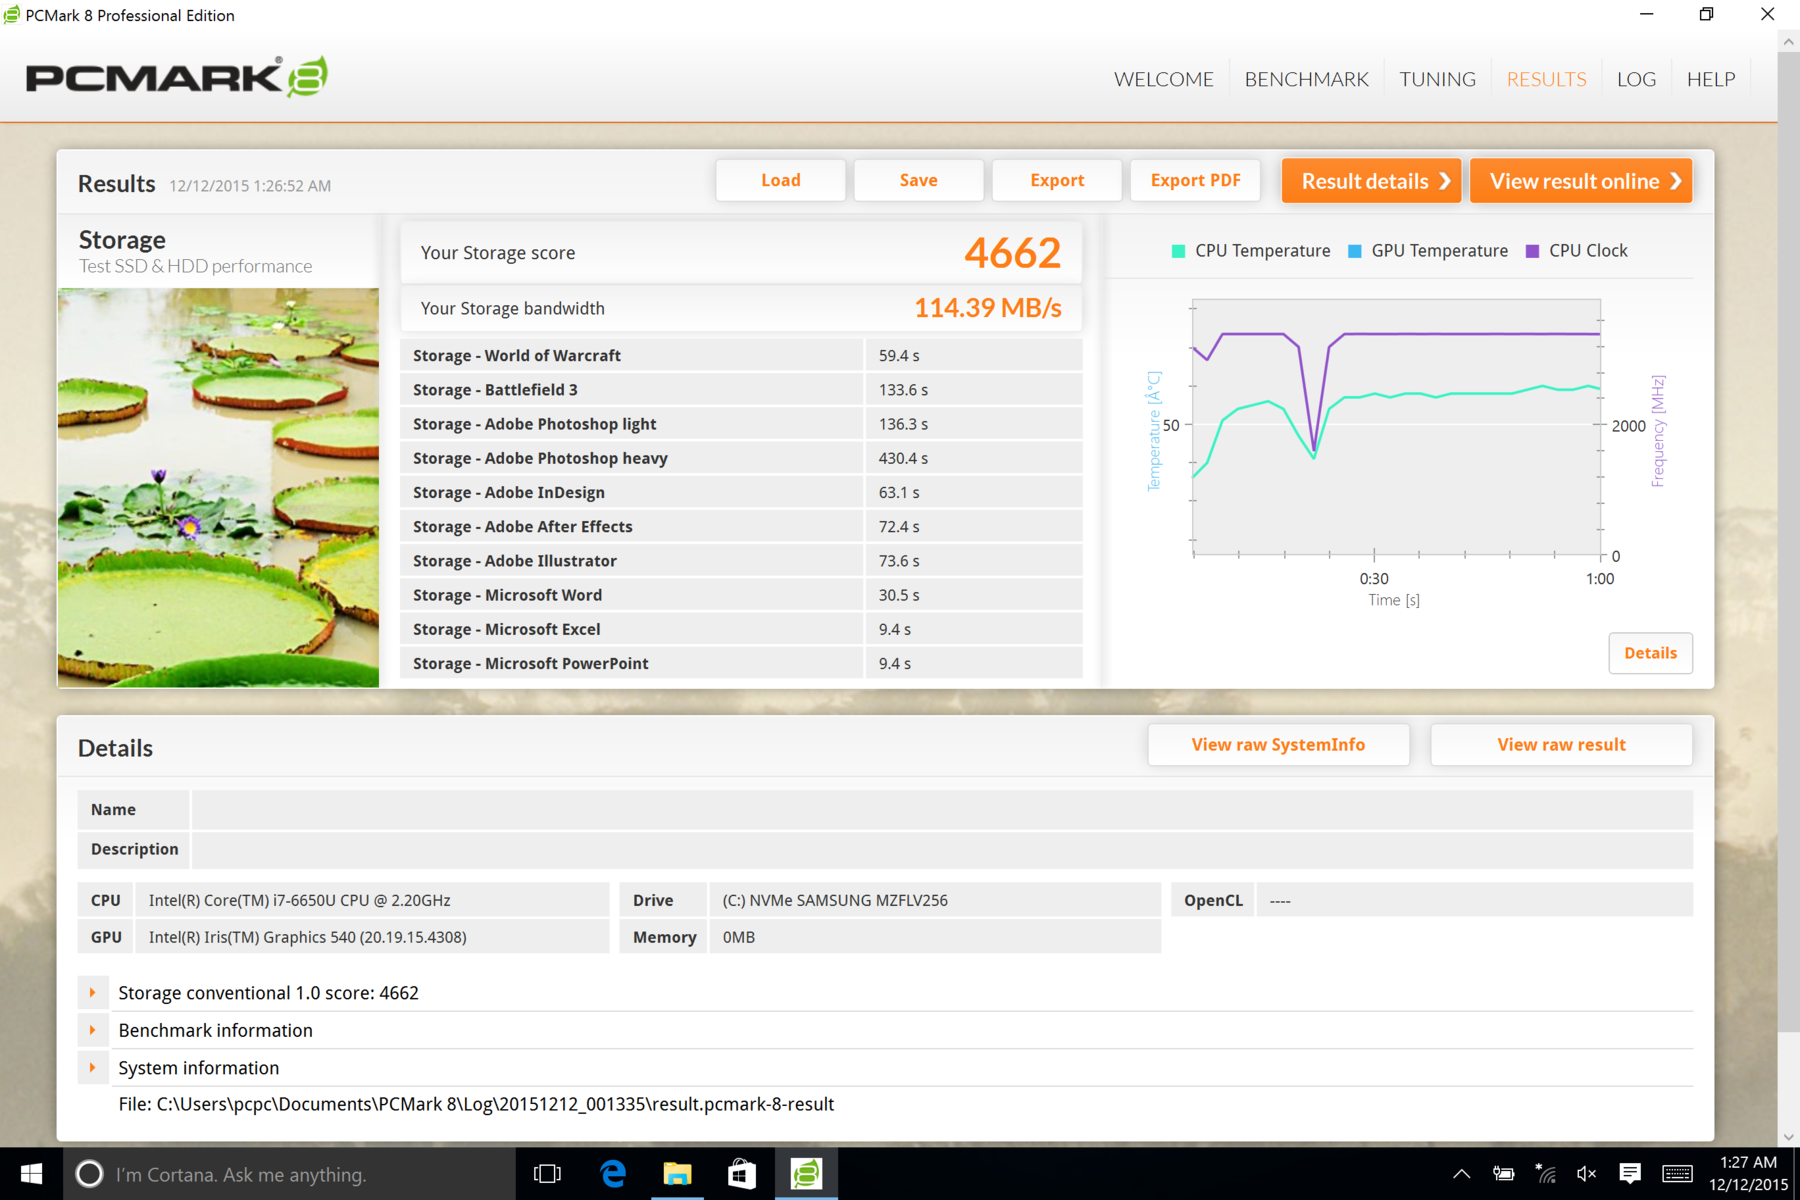
Ebenso ist die Systemleistung laut PCMark 7 zirka 10 Prozent besser als beim Core-i5-Modell und ungefähr 25 Prozent besser als beim Core m3-Modell. Die Unterschiede sind im PCMark 8 sogar noch etwas größer.
Massenspeicher
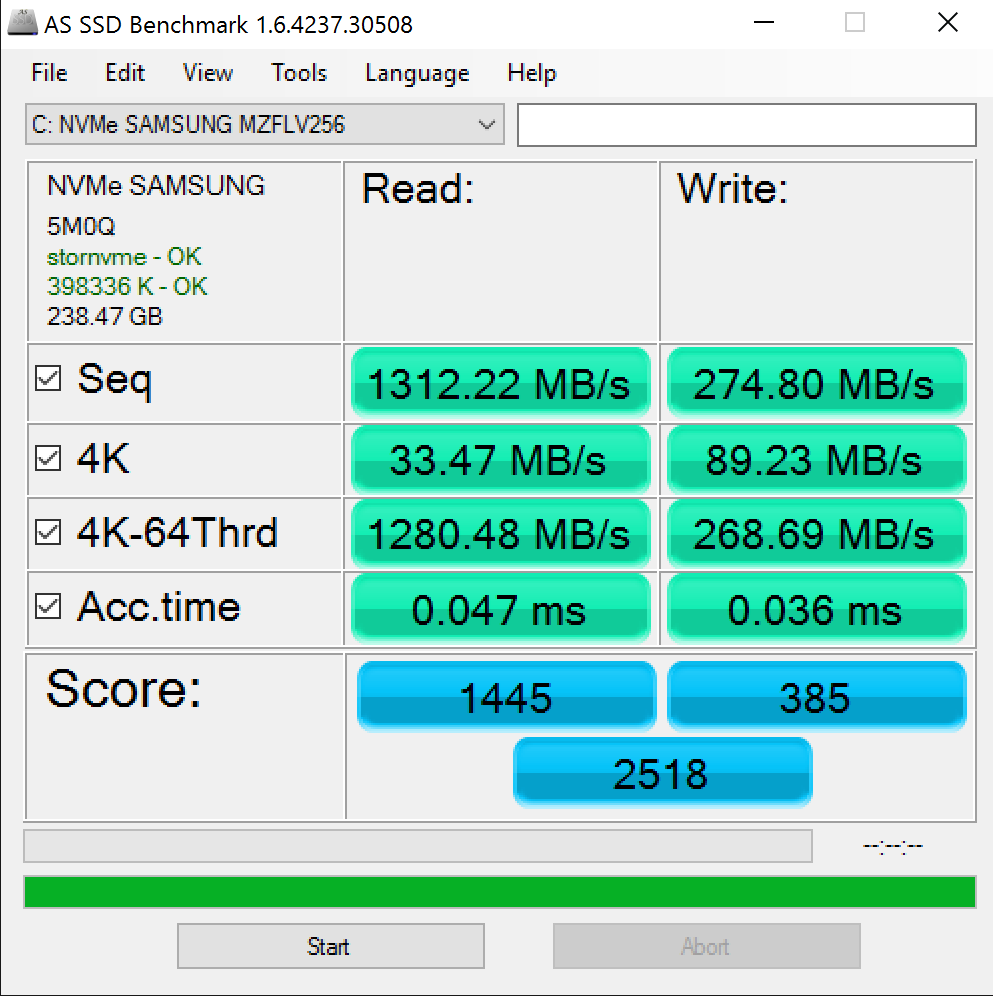
Das 256 GB Samsung MZFLV256 M.2 Laufwerk in unserer Core-i7-Konfiguration übertrifft unsere 128-GB-SSDs in den Core-i5- und m3-Modellen spürbar auf der ganzen Linie. Im Besonderen sind die sequentiellen Schreibraten fast doppelt so hoch laut AS SSD und CDM.

| Microsoft Surface Pro 4 Core i7 | Microsoft Surface Pro 4, Core i5, 128GB | Microsoft Surface Pro 4, Core m3 | Microsoft Surface Pro 3 | Microsoft Surface 3 | |
|---|---|---|---|---|---|
| CrystalDiskMark 3.0 | -30% | -36% | -16% | -84% | |
| Write 4k QD32 (MB/s) | 292.3 | 153.6 -47% | 149.2 -49% | 294.4 1% | 11.2 -96% |
| Read 4k QD32 (MB/s) | 393.1 | 368.3 -6% | 243.7 -38% | 345 -12% | 27.94 -93% |
| Write 4k (MB/s) | 106.3 | 101.5 -5% | 68 -36% | 76.2 -28% | 9.52 -91% |
| Read 4k (MB/s) | 40.75 | 28.51 -30% | 30.14 -26% | 20.81 -49% | 12.64 -69% |
| Write 512 (MB/s) | 304.3 | 154.2 -49% | 158.2 -48% | 324.6 7% | 39.9 -87% |
| Read 512 (MB/s) | 396.7 | 266.3 -33% | 313.1 -21% | 357.8 -10% | 133.7 -66% |
| Write Seq (MB/s) | 304 | 154.2 -49% | 158.2 -48% | 324 7% | 47.99 -84% |
| Read Seq (MB/s) | 834 | 666 -20% | 663 -21% | 501 -40% | 149.3 -82% |
| AS SSD | -44% | -44% | -49% | ||
| Copy Game MB/s (MB/s) | 273.9 | 105.6 -61% | 101.3 -63% | ||
| Copy Program MB/s (MB/s) | 209.8 | 63.5 -70% | 65.8 -69% | ||
| Copy ISO MB/s (MB/s) | 409.9 | 121.9 -70% | 120.9 -71% | ||
| Score Total (Points) | 2518 | 1190 -53% | 1759 -30% | 965 -62% | |
| Score Write (Points) | 385 | 239 -38% | 189 -51% | 319 -17% | |
| Score Read (Points) | 1445 | 645 -55% | 1060 -27% | 430 -70% | |
| Access Time Write * (ms) | 0.036 | 0.037 -3% | 0.043 -19% | 0.075 -108% | |
| Access Time Read * (ms) | 0.047 | 0.079 -68% | 0.083 -77% | 0.087 -85% | |
| 4K-64 Write (MB/s) | 268.7 | 138.5 -48% | 112 -58% | 215 -20% | |
| 4K-64 Read (MB/s) | 1280 | 528 -59% | 944 -26% | 358.3 -72% | |
| 4K Write (MB/s) | 89.2 | 86.5 -3% | 63.2 -29% | 73.7 -17% | |
| 4K Read (MB/s) | 33.47 | 34.24 2% | 31.39 -6% | 22 -34% | |
| Seq Write (MB/s) | 274.8 | 142.5 -48% | 138.1 -50% | 303 10% | |
| Seq Read (MB/s) | 1312 | 832 -37% | 845 -36% | 493.7 -62% | |
| Durchschnitt gesamt (Programm / Settings) | -37% /
-39% | -40% /
-41% | -33% /
-35% | -84% /
-84% |
* ... kleinere Werte sind besser
Grafikleistung
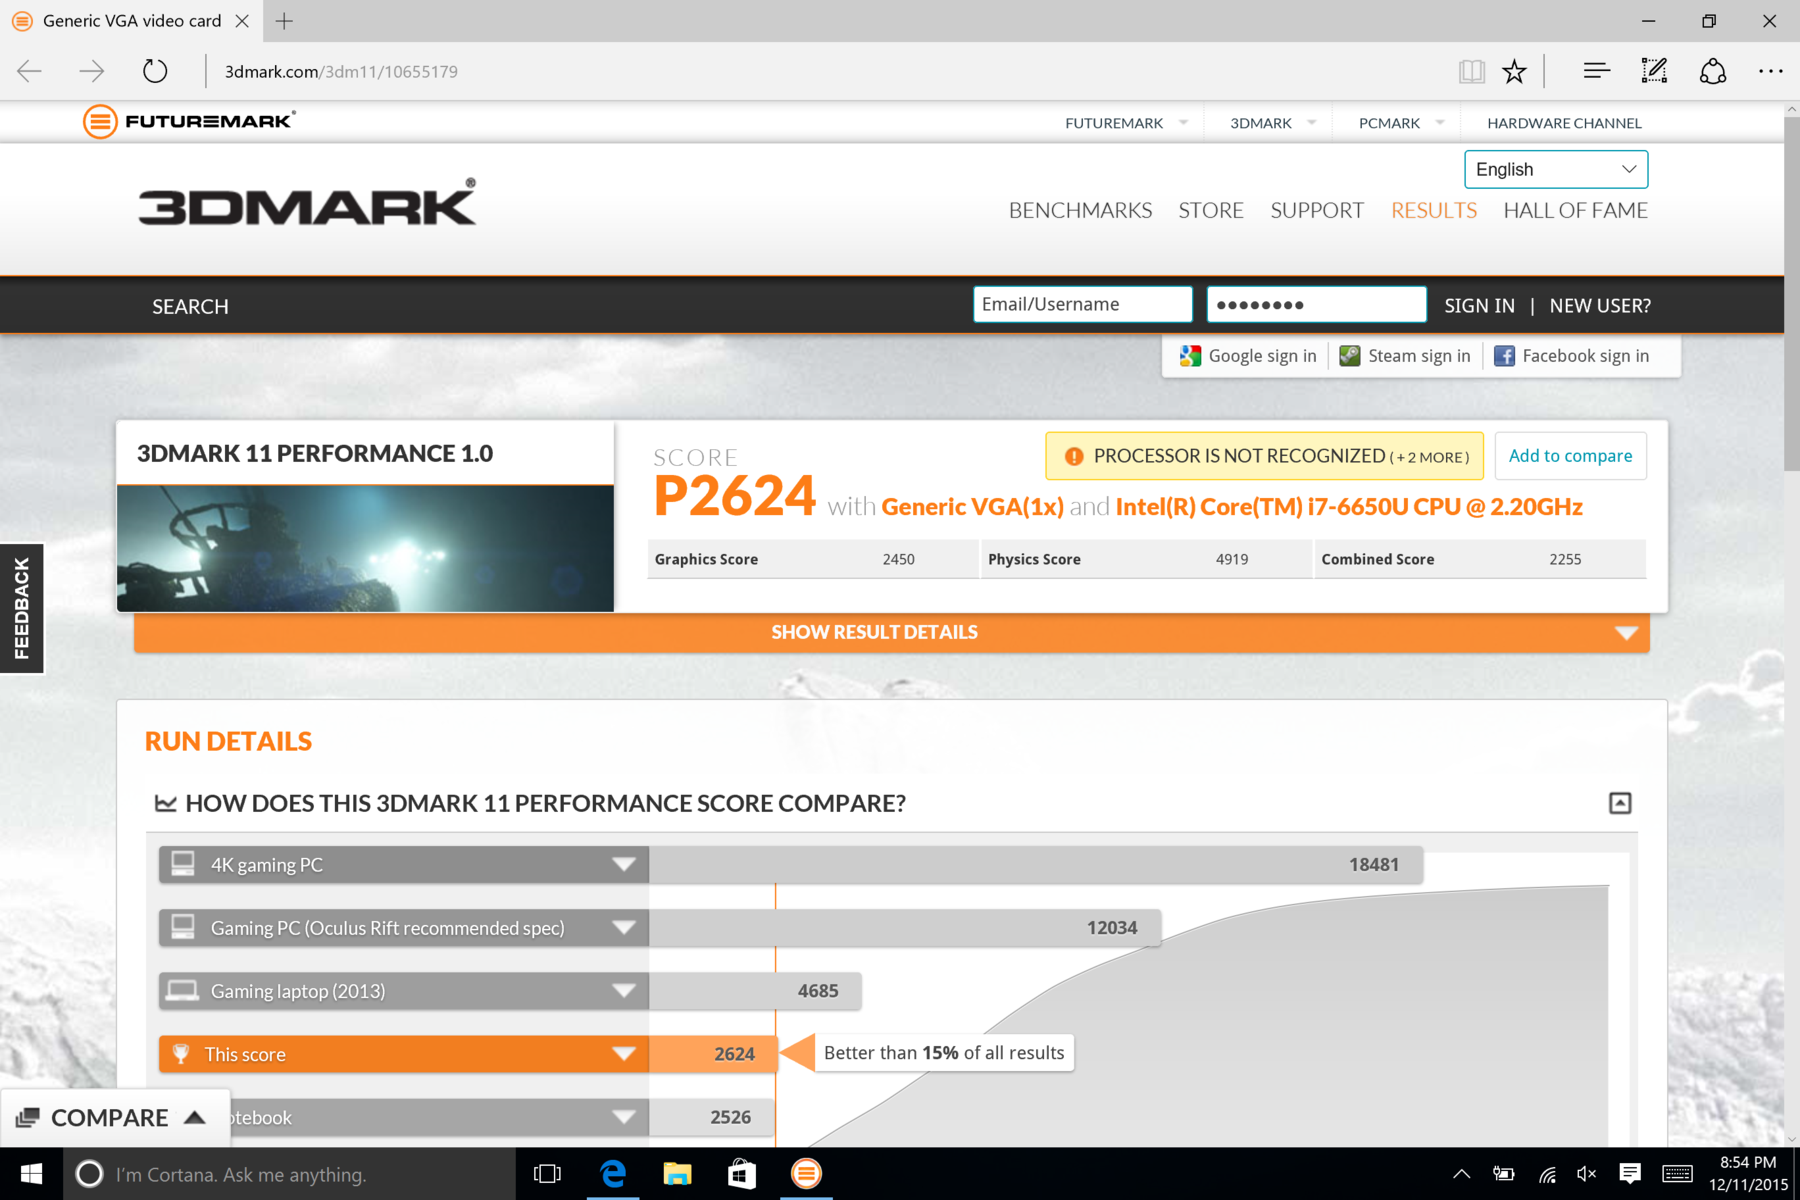
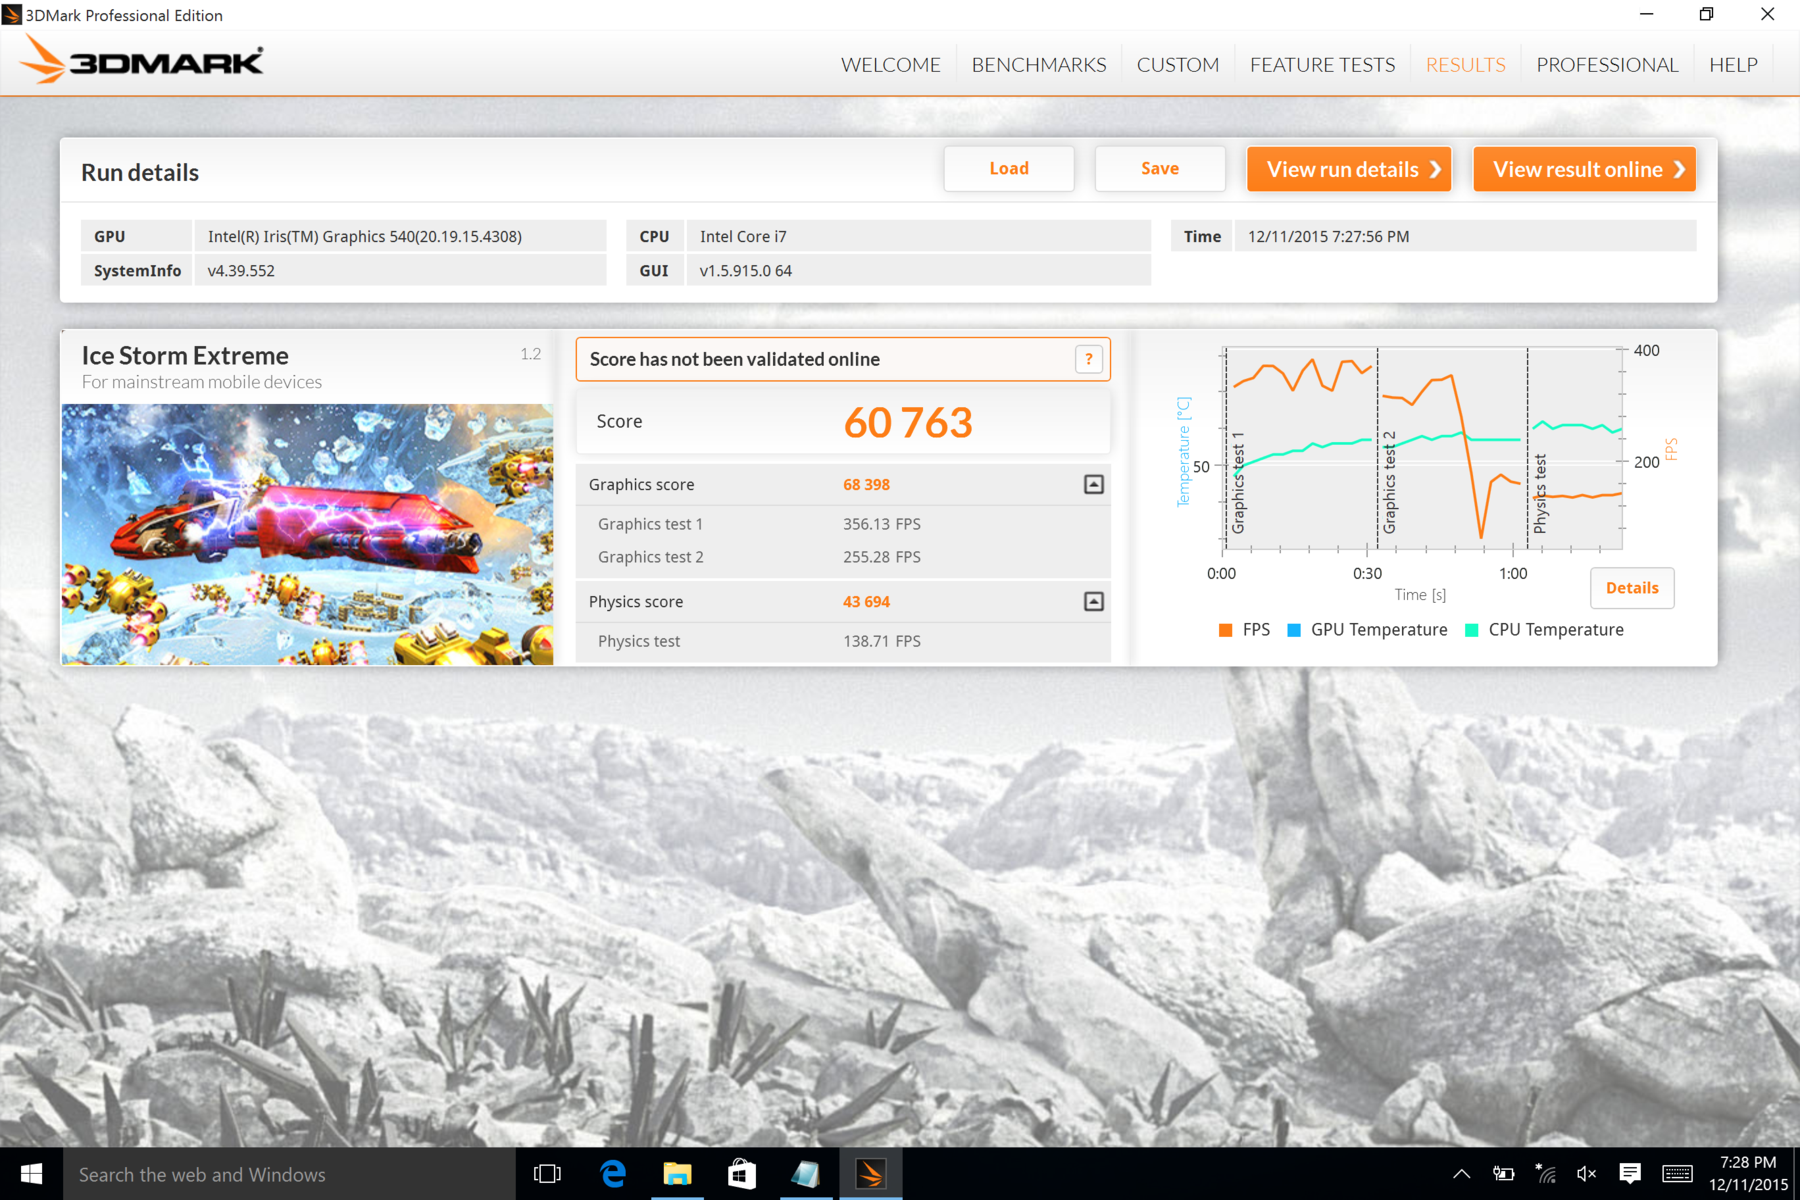
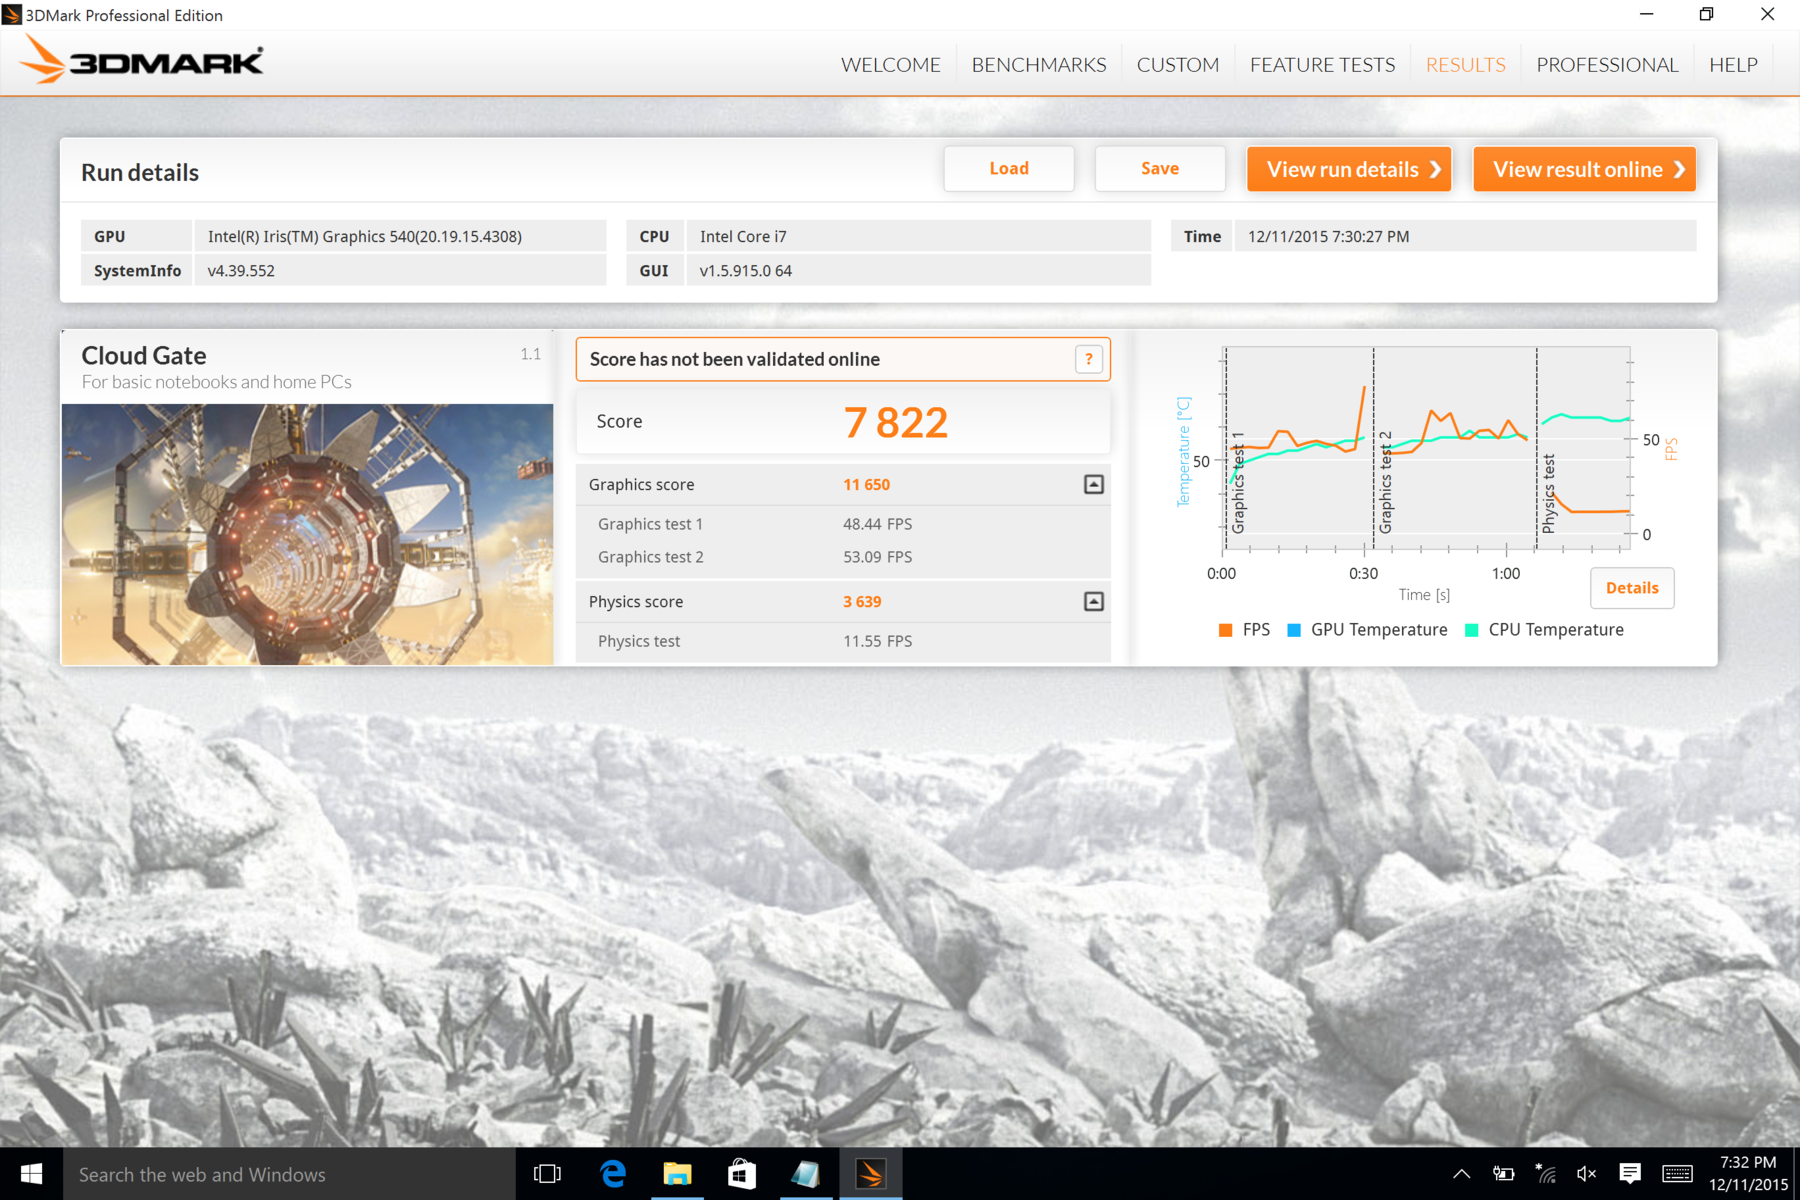
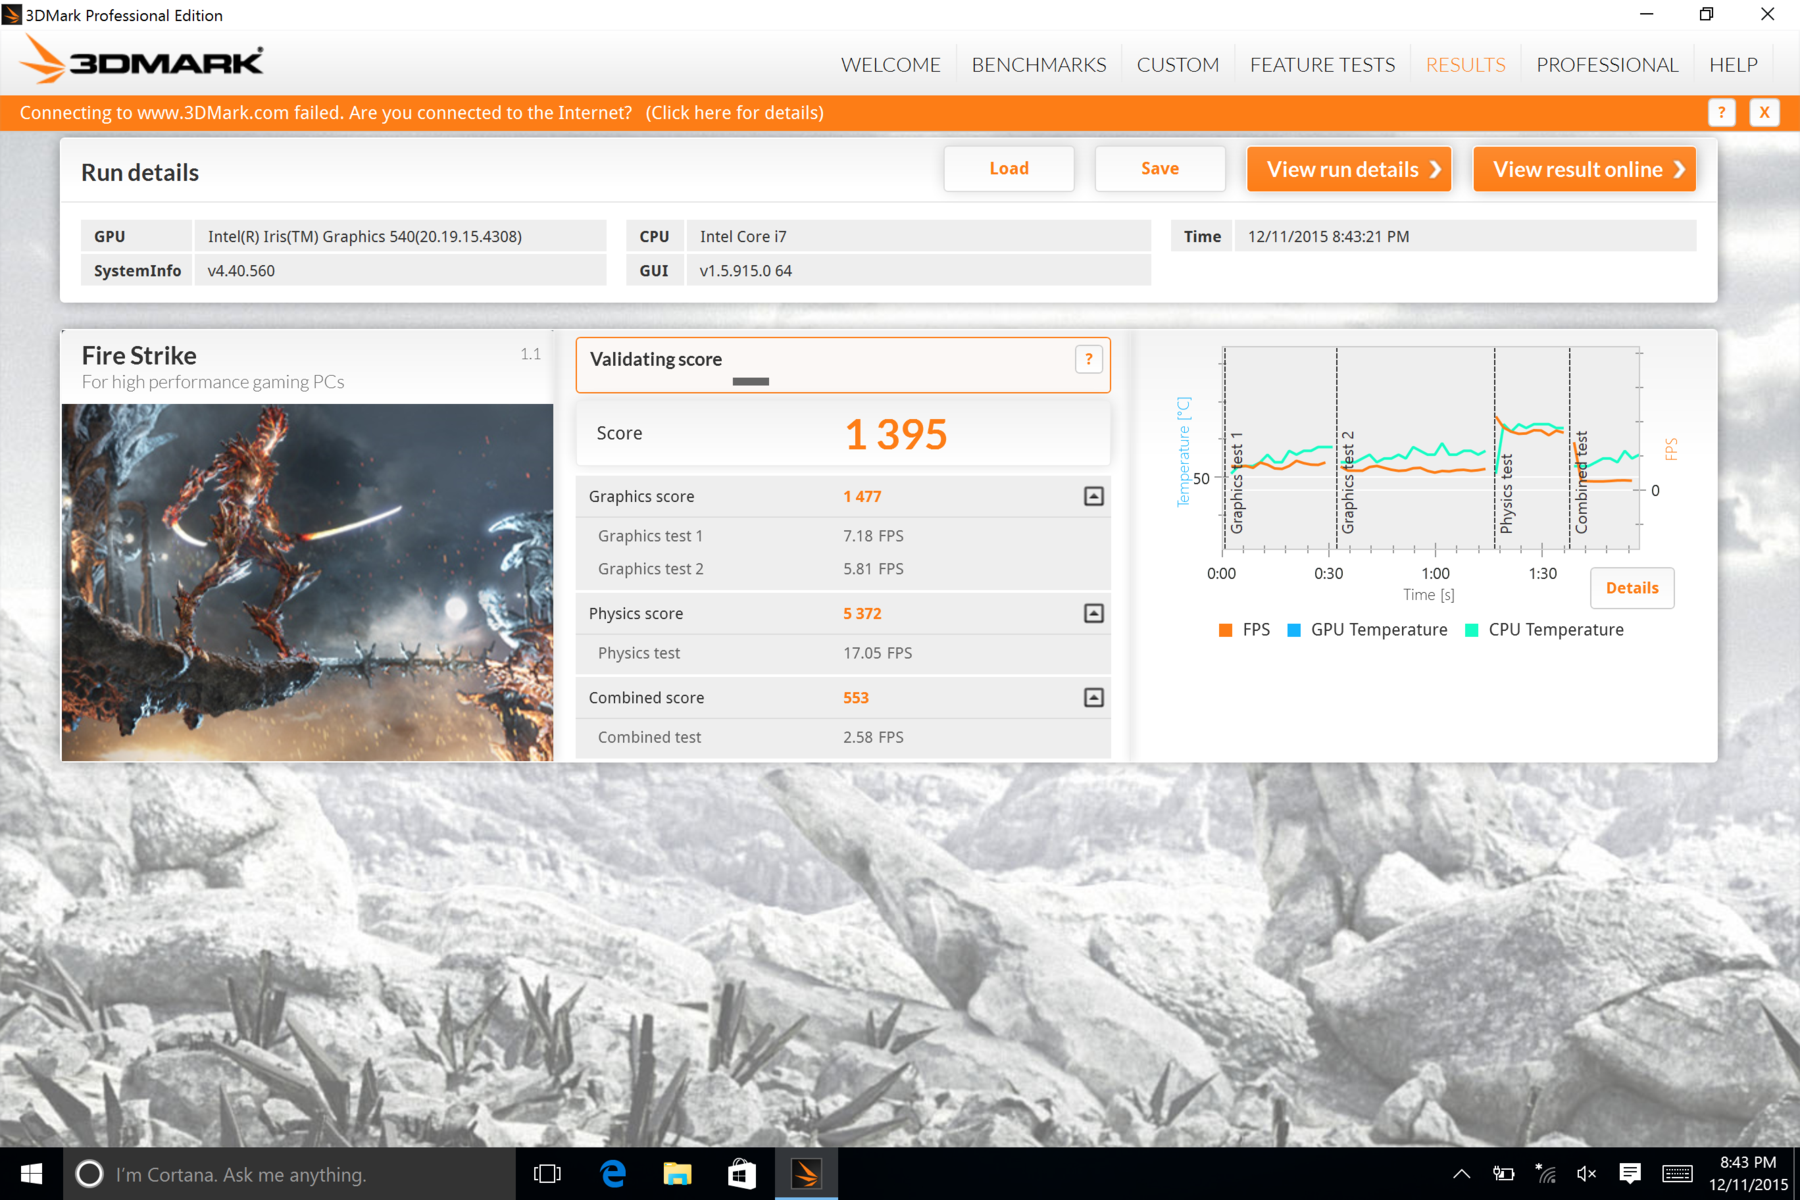
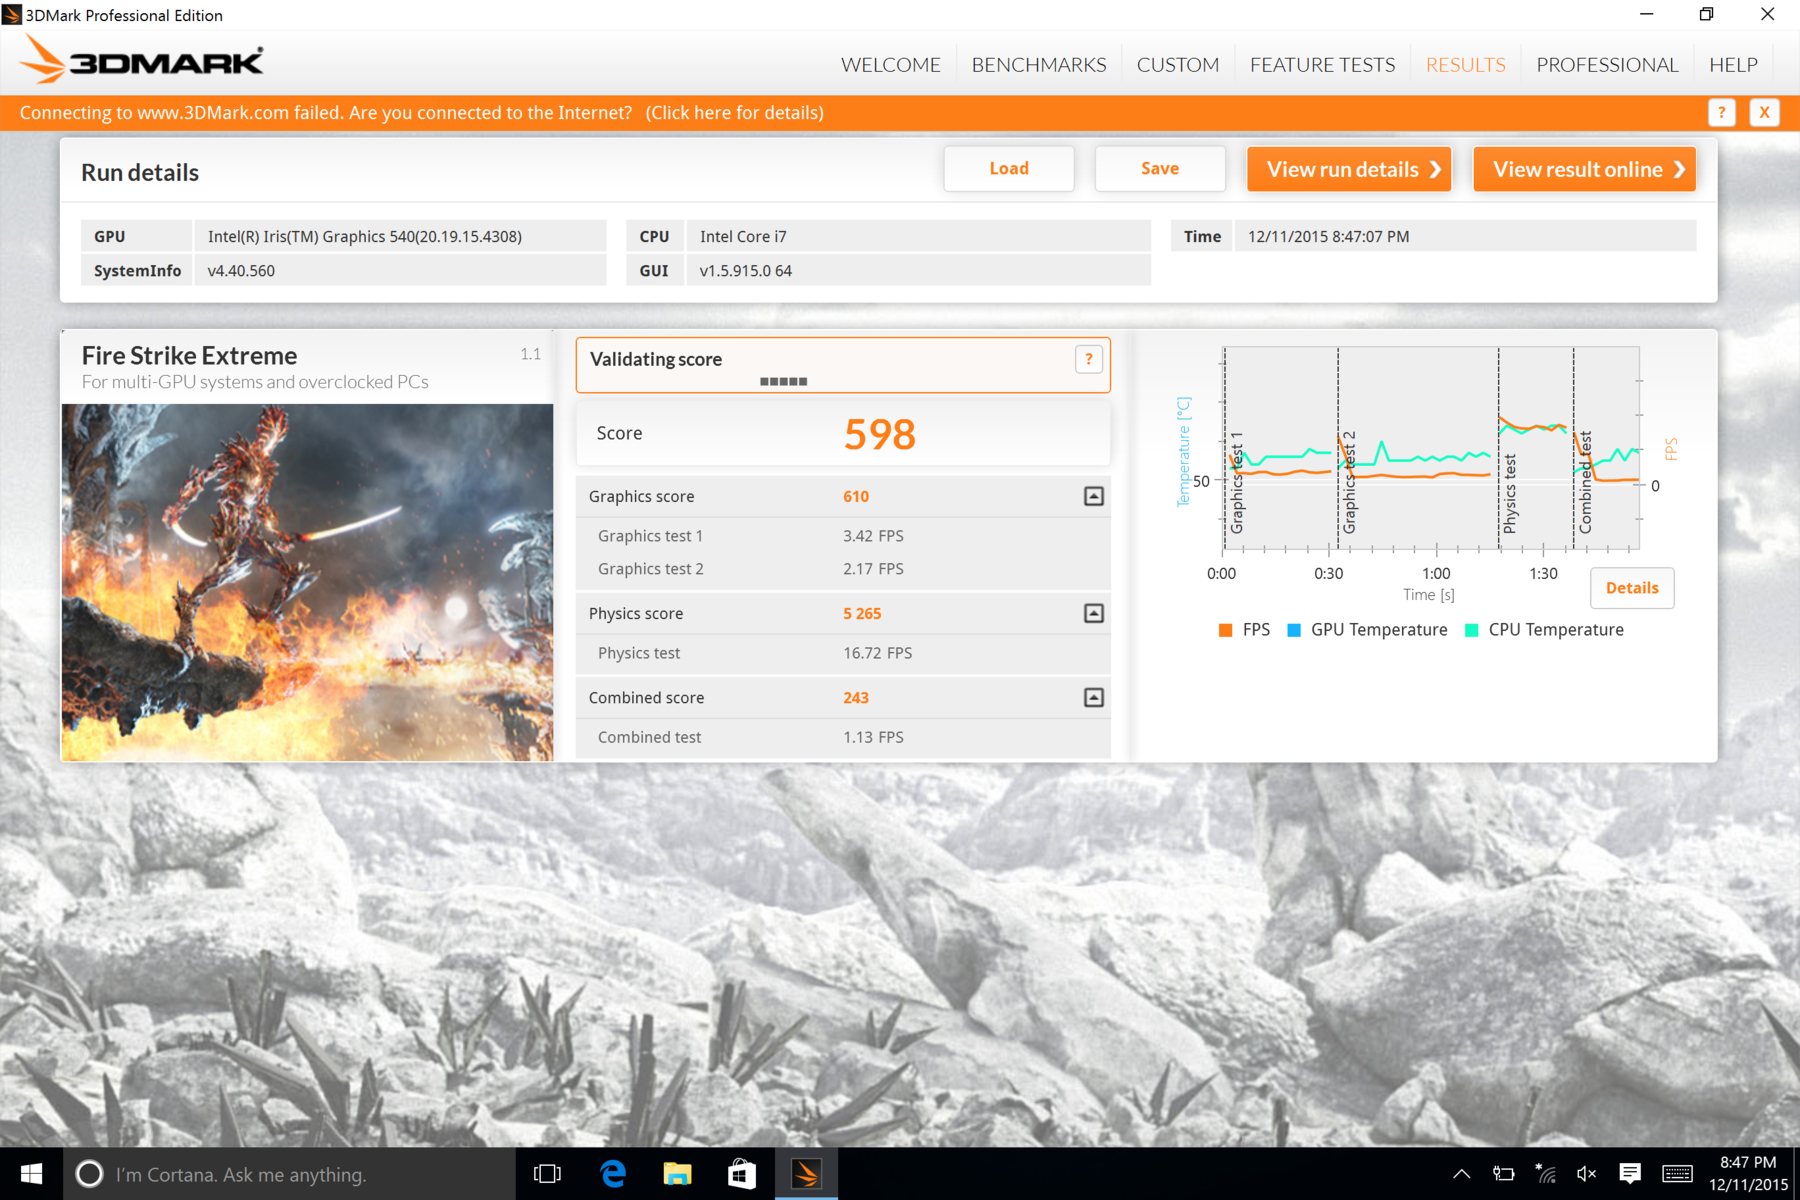
Der Sprung vom Core-i5-Modell auf das Core-i7-Modell bringt einen deutlich höheren Zuwachs bei der Grafikleistung als bei der CPU-Leistung. Synthetische Benchmarks wie 3DMark zeigen, dass die Iris 540 die HD 520 in der Core-i5-Konfiguration um zirka 40 Prozent übertrifft und sogar fast 50 Prozent schneller ist als die HD 515 in der Core-m3-Konfiguration.
| ComputeMark v2.1 - 1024x600 Normal, Score (nach Ergebnis sortieren) | |
| Microsoft Surface Pro 4 Core i7 | |
| Microsoft Surface Book Core i5 | |
| Microsoft Surface Pro 4, Core m3 | |
| 3DMark 11 Performance | 2624 Punkte | |
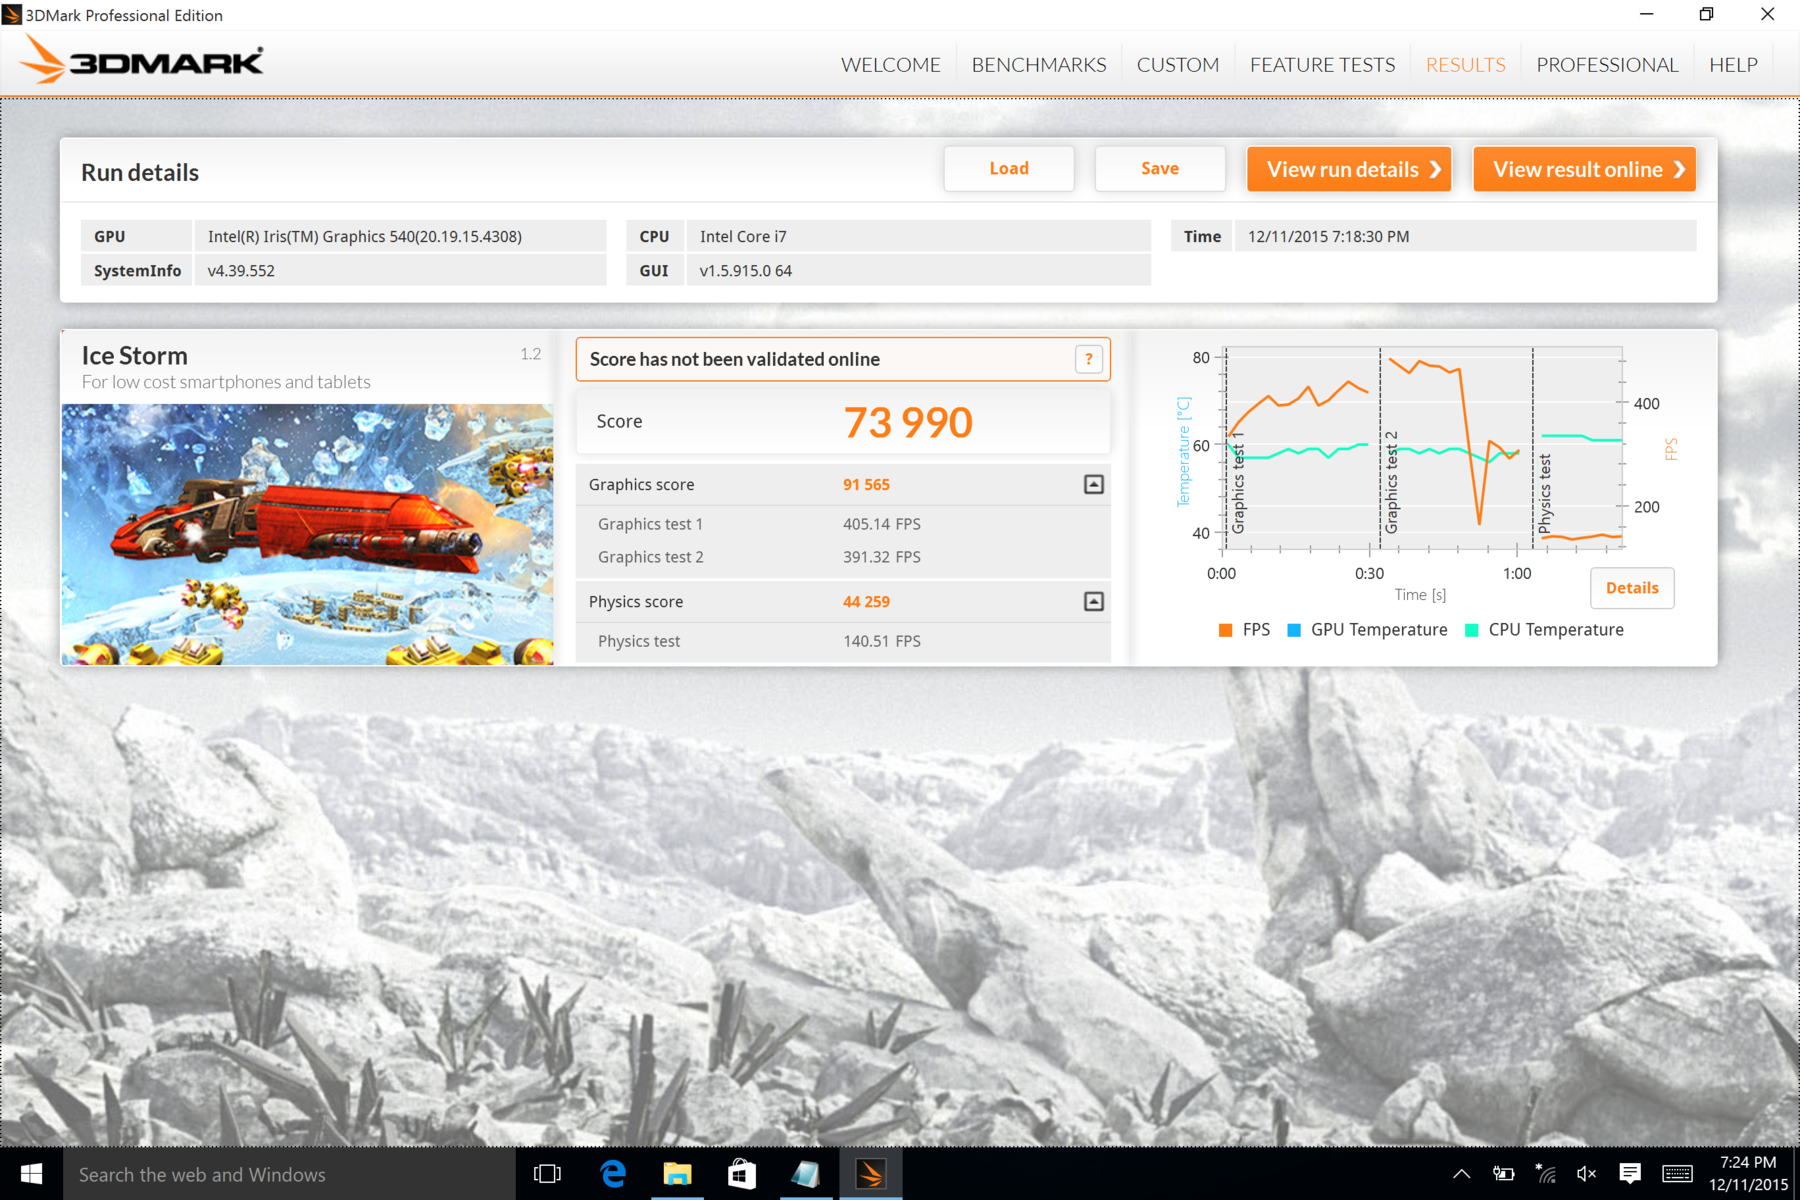
| 3DMark Ice Storm Standard Score | 73990 Punkte | |
| 3DMark Cloud Gate Standard Score | 7822 Punkte | |
| 3DMark Fire Strike Score | 1395 Punkte | |
| 3DMark Fire Strike Extreme Score | 598 Punkte | |
Hilfe | ||
Gaming Performance
Bioshock Infinite zeigt, dass das Surface Pro 4 Core i7 60 bis 80 Prozent höhere Frameraten herausholt als die Core-i5-Konfiguration. Die gesamte Gaming-Leistung liegt gut zwischen der Nvidia 940M GPU im Surface Book und der HD Graphics 520 im Surface Pro 4 Core i5.
Emissionen
Geräuschemissionen
User sollen sich nicht vom Kauf eines Surface Pro 4 abbringen lassen, nur weil es zu den wenigen aktiv gekühlten Tablets gehört. Wie die Core-i5-Version ist auch die Core-i7-Version im Praxisbetrieb überwiegend lautlos, da erst erhebliche andauernde Last notwendig ist, damit der Lüfter zu laufen beginnt. Das Tablet kann einige Zeit unter mittlerer bis schwerer Last wie Gaming durchhalten, bis das Lüftergeräusch sich anzuheben beginnt.
Der Core-i7-Lüfter ist ansonsten in puncto maximales Geräusch und Verhalten sehr ähnlich zum Core-i5-Lüfter.
| Microsoft Surface Pro 4 Core i7 | Microsoft Surface Pro 4, Core i5, 128GB | Microsoft Surface Pro 4, Core m3 | Microsoft Surface Pro 3 | Microsoft Surface Book Core i5 | |
|---|---|---|---|---|---|
| Geräuschentwicklung | -6% | -1% | -0% | ||
| Idle min * (dB) | 28.4 | 31.5 -11% | 30.1 -6% | 29.5 -4% | |
| Idle avg * (dB) | 28.6 | 31.5 -10% | 30.2 -6% | 29.6 -3% | |
| Idle max * (dB) | 28.7 | 31.5 -10% | 30.4 -6% | 29.7 -3% | |
| Last avg * (dB) | 40.8 | 40.5 1% | 31.9 22% | 37.5 8% | |
| Last max * (dB) | 41.4 | 40.7 2% | 44.4 -7% | 40.9 1% |
* ... kleinere Werte sind besser
Lautstärkediagramm
| Idle |
| 28.4 / 28.6 / 28.7 dB(A) |
| Last |
| 40.8 / 41.4 dB(A) |
 | ||
30 dB leise 40 dB(A) deutlich hörbar 50 dB(A) störend |
||
min: | ||
Temperatur
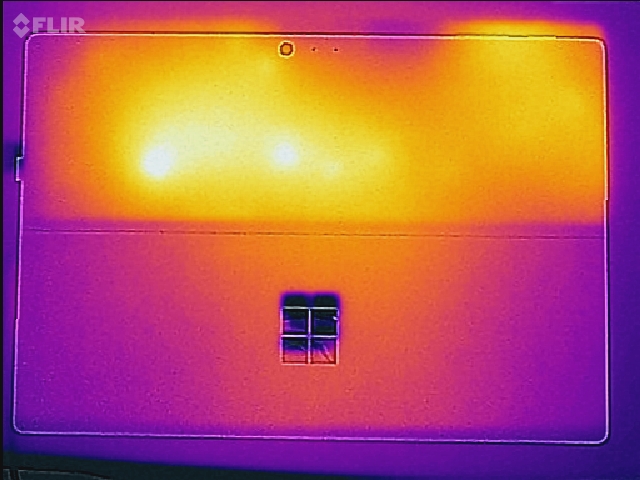
Die Oberflächentemperaturen bleiben an beiden Seiten ohne offensichtliche Hotspots niedrig, wenn das System im Idle-Betrieb den Desktop anzeigt. Maximale Last mit sowohl Prime95 als auch FurMark erhöht die Temperaturen deutlich. Dies betrifft besonders die obere Hälfte des Tablets, wo die Platine (PCB) liegt. Obwohl unser Core-i7-Modell einen Lüfter hat, sind die durchschnittlichen Messwerte höher als bei unserem Core-m3-Modell. Trotzdem sind die gemessenen Temperaturen seltsamerweise viel niedriger als bei unserem Core-i5-Modell.
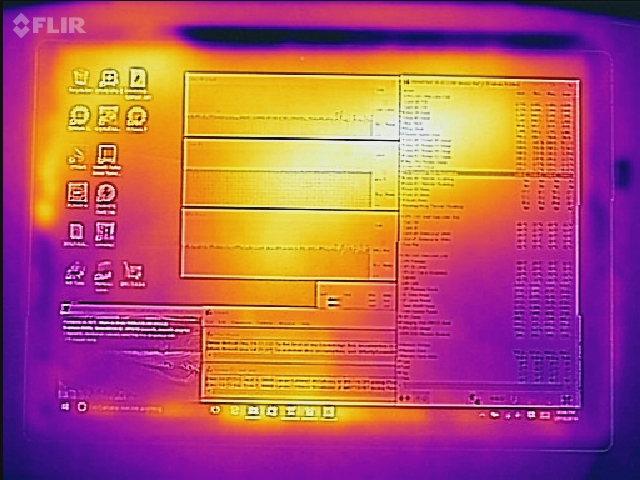
(-) Die maximale Temperatur auf der Oberseite ist 45.4 °C. Im Vergleich liegt der Klassendurchschnitt bei 35.4 °C (von 19.6 bis 60 °C für die Klasse Convertible).
(±) Auf der Unterseite messen wir eine maximalen Wert von 43.2 °C (im Vergleich zum Durchschnitt von 36.9 °C).
(+) Ohne Last messen wir eine durchschnittliche Temperatur von 23.5 °C auf der Oberseite. Der Klassendurchschnitt erreicht 30.3 °C.
(±) Die Handballen und der Touchpad-Bereich können sehr heiß werden mit maximal 39.8 °C.
(-) Die durchschnittliche Handballen-Temperatur anderer getesteter Geräte war 28 °C (-11.8 °C).
Stresstest
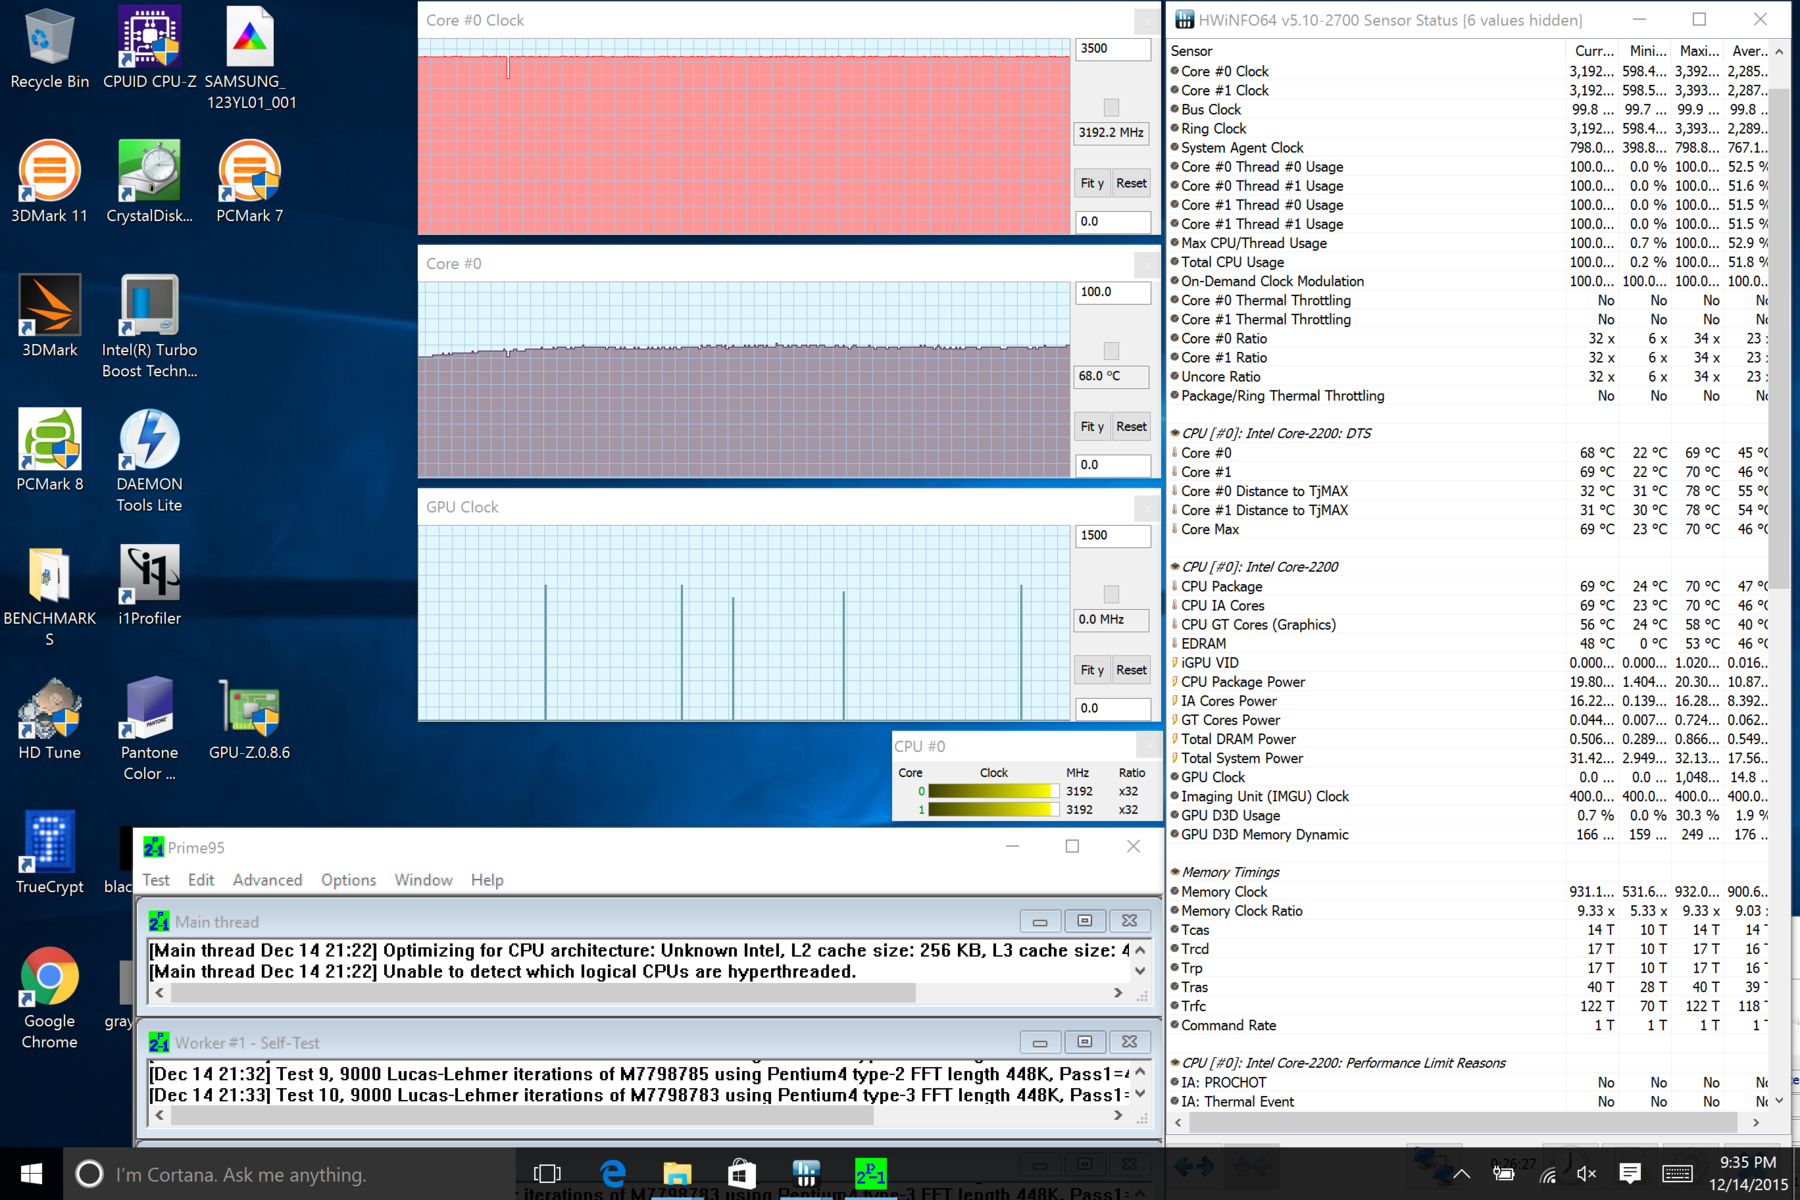
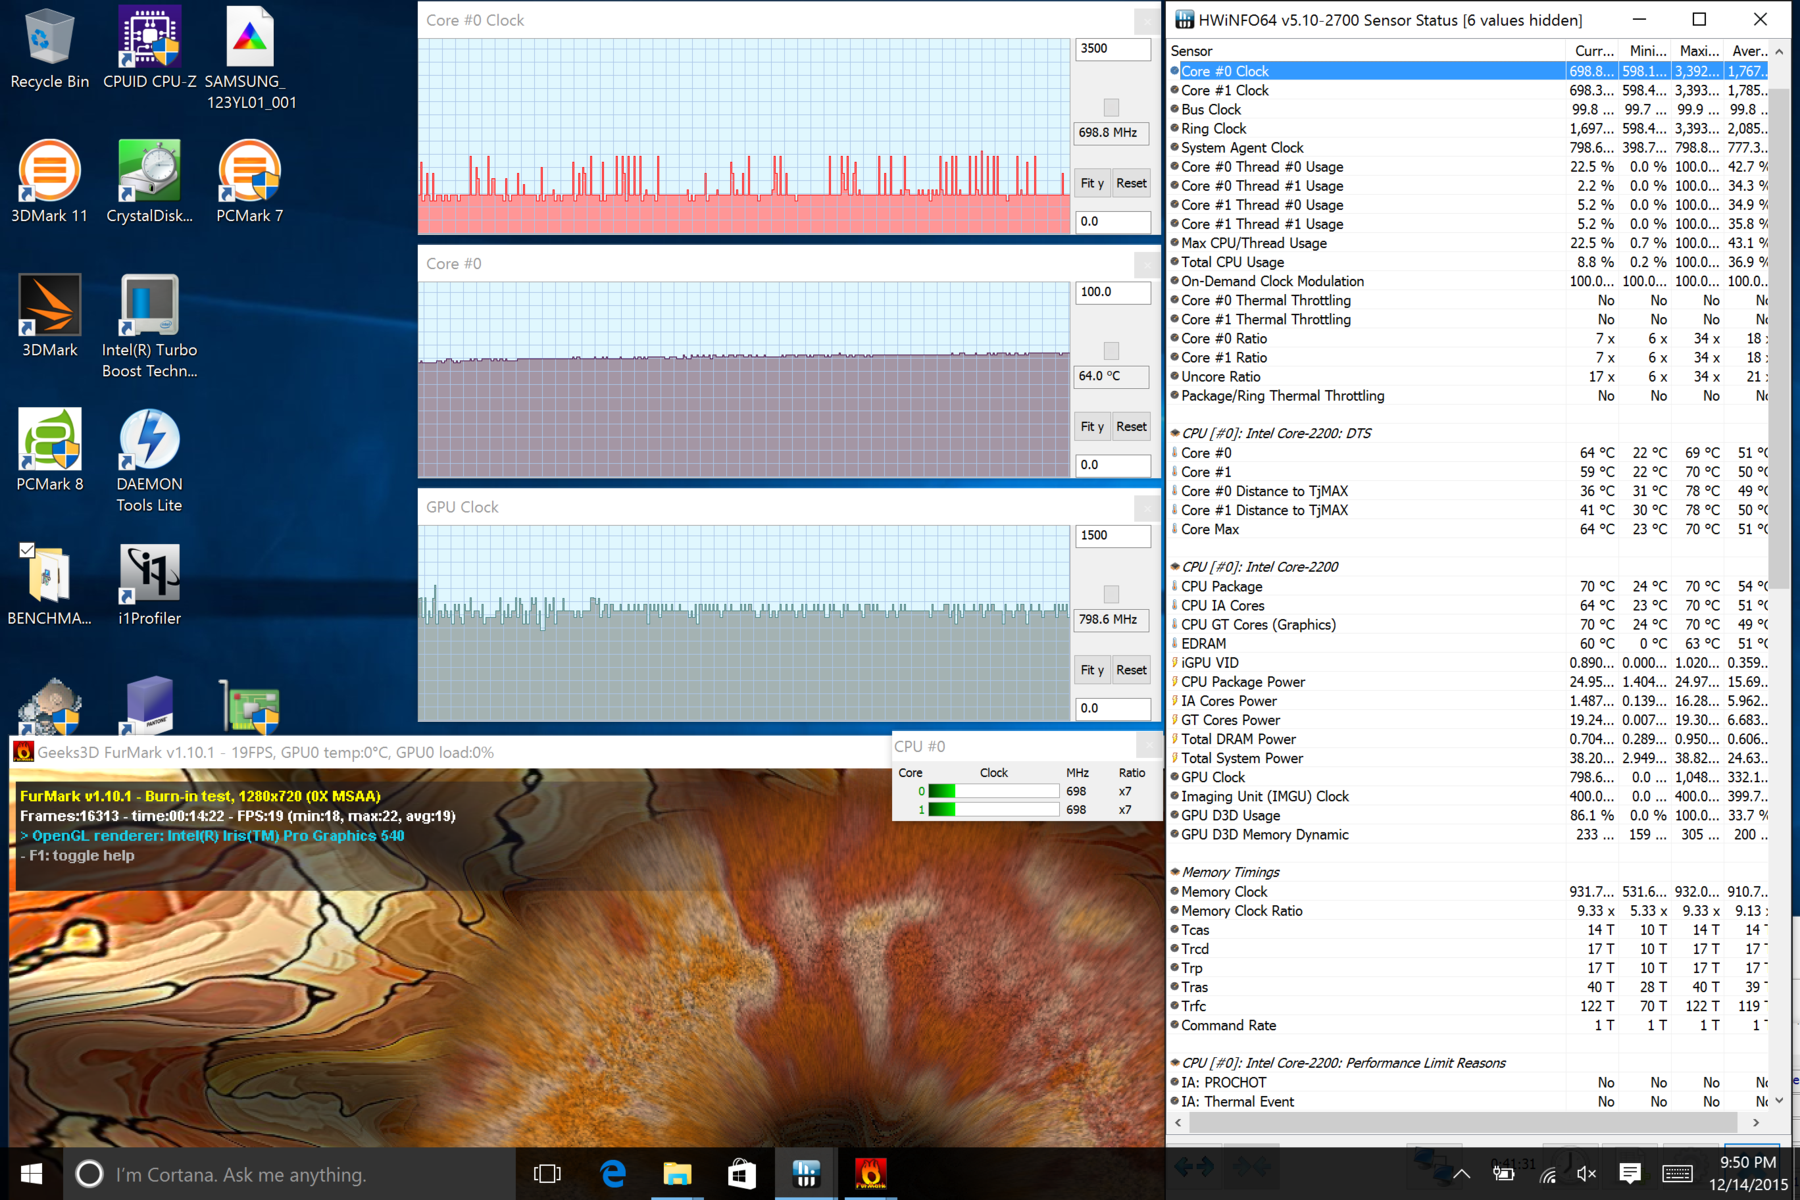
Wir hatten in Anbetracht der Throttling-Probleme des Surface Pro 3 unsere Zweifel an der Leistungsfähigkeit des Surface Pro 4 Core i7. Erfreulicherweise können wir unter Last keine großen Leistungsprobleme beobachten. Das Tablet kann seinen maximalen Turbo Boost von 3,2 GHz für beide Kerne unter Prime95-Last und Unigine-Heaven-Last beibehalten. Die integrierte GPU arbeitet mit steten 950 MHz unter den gleichen Bedingungen. Throttling tritt erst auf, wenn unsere Stresstest-Tools Prime95 als auch FurMark gleichzeitig laufen.
Man beachte, dass der Strom-Adapter nicht genug Leistung liefert, damit das Tablet solch hohe theoretische Rechenlast aufrecht erhalten kann. Daher wird das Tablet im Extremfall, auch wenn es ans Stromnetz angeschlossen ist, langsam, aber sicher den Akku entleeren.
Im Akkubetrieb fallen CPU- und GPU-Leistung nur leicht. Ein 3DMark-11-Lauf bei Akkubetrieb liefert CPU- und GPU-Ergebnisse von 2.370 bzw. 4.761 Punkten verglichen mit 2.450 bzw. 4.919 im Netzbetrieb.
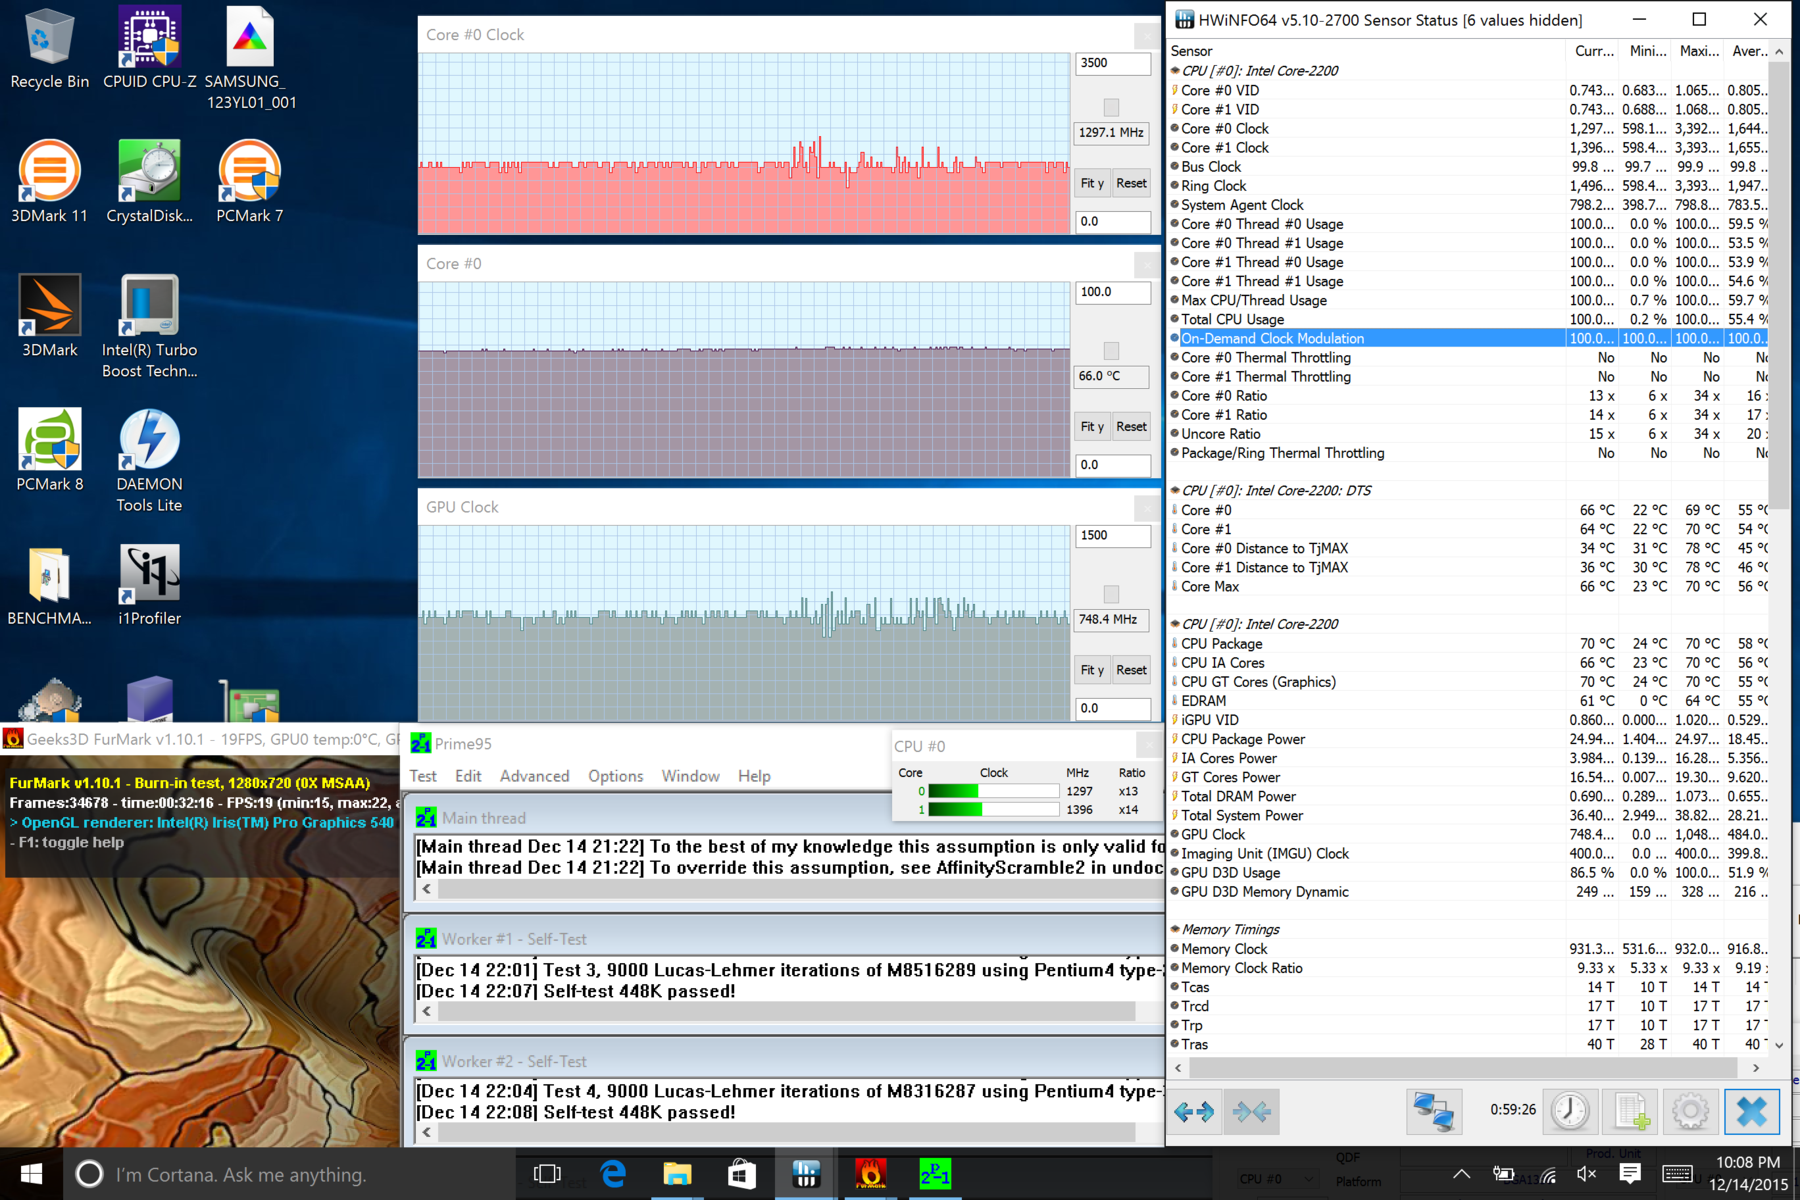
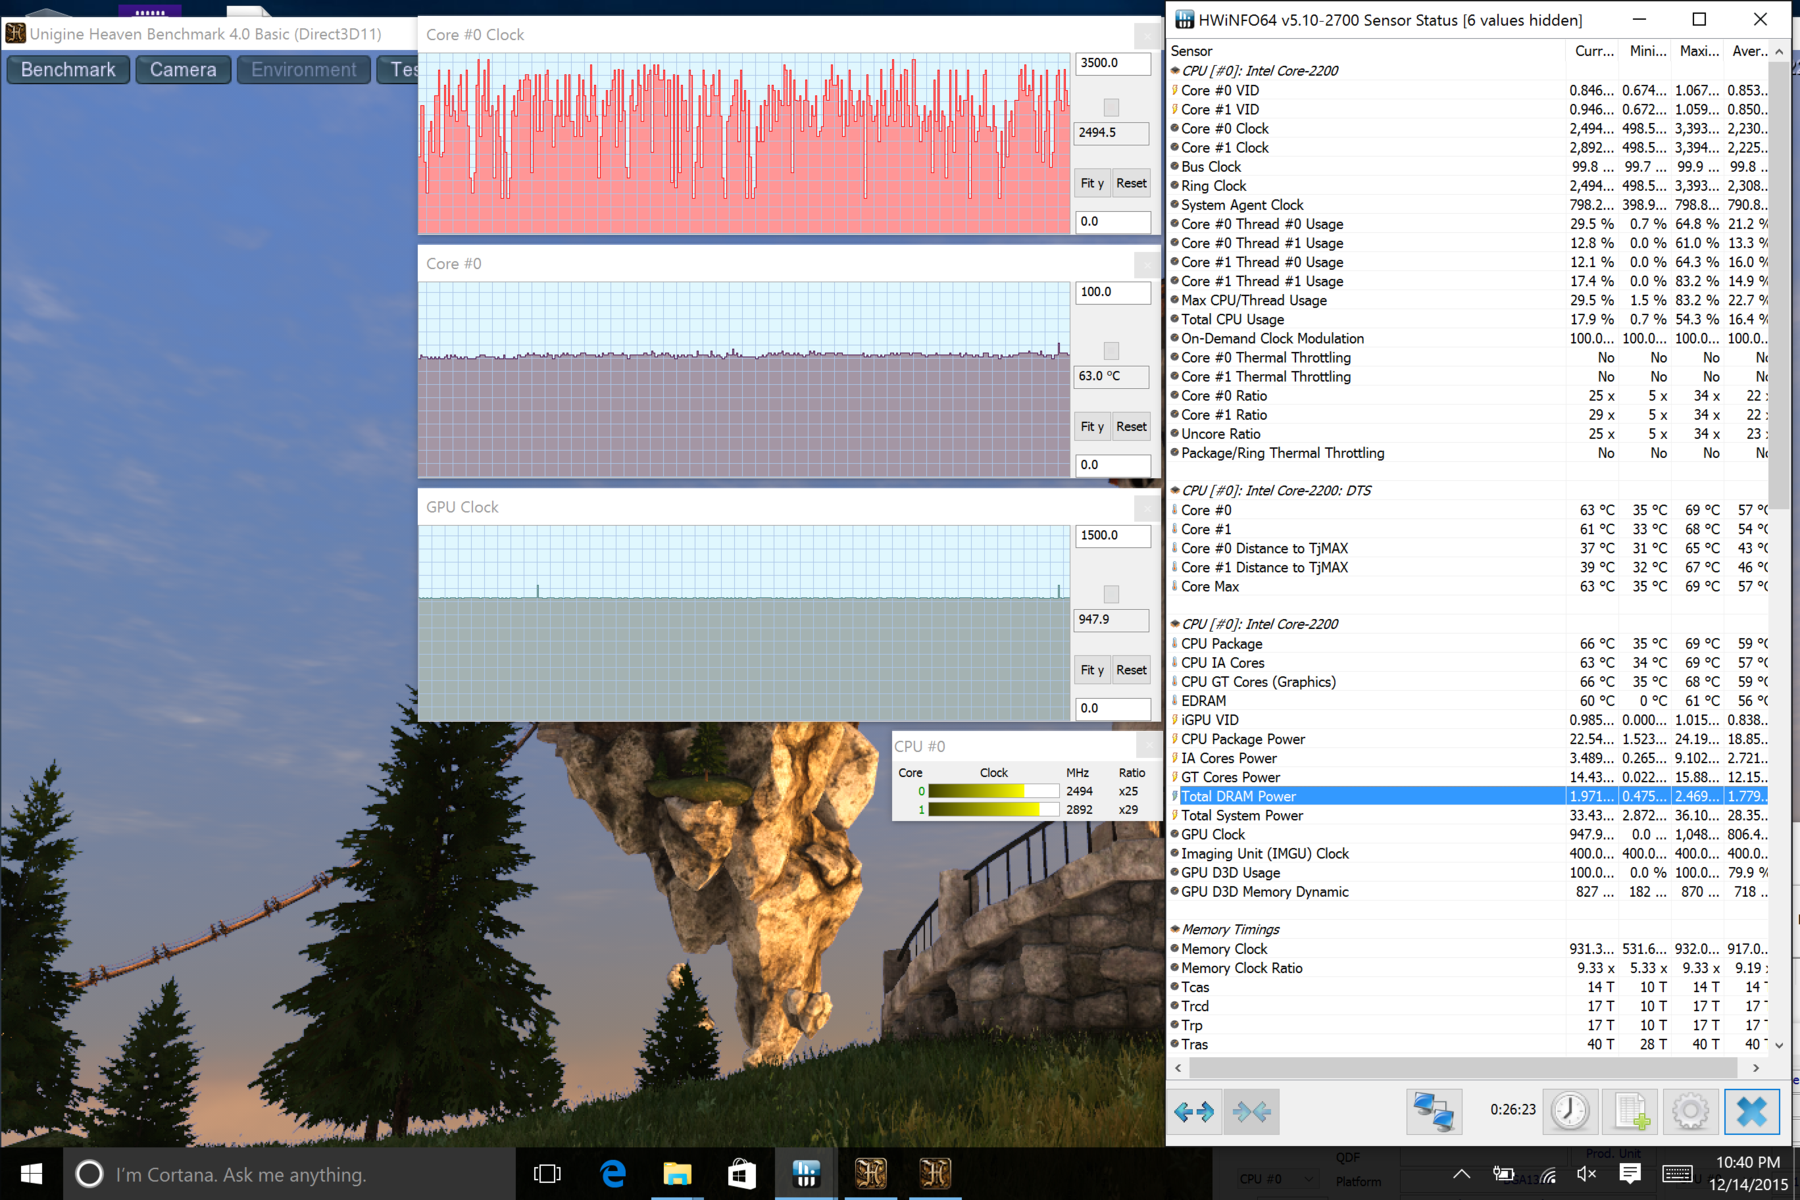
| CPU-Takt (GHz) | GPU-Takt (MHz) | durchschnittliche Kerntemperatur (C) | |
| Prime95 Last | 3,2 | -- | ~68 |
| FurMark Last | -- | 800 | ~64 |
| Prime95 + FurMark Last | 1,3-1,4 | 700-750 | ~66 |
| Unigine Heaven Last | 2,5-3,2 | 950 | ~63 |
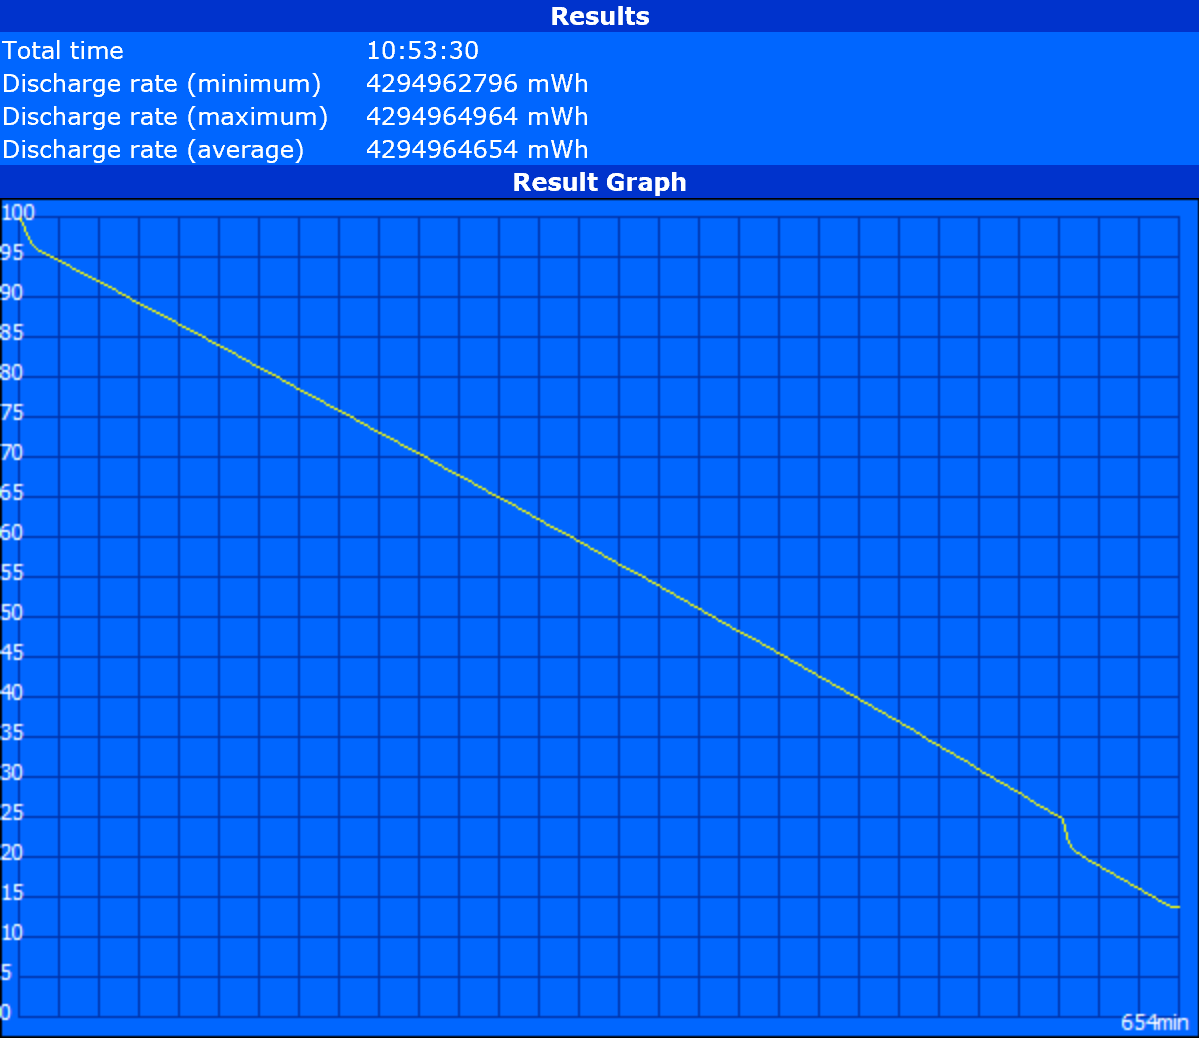
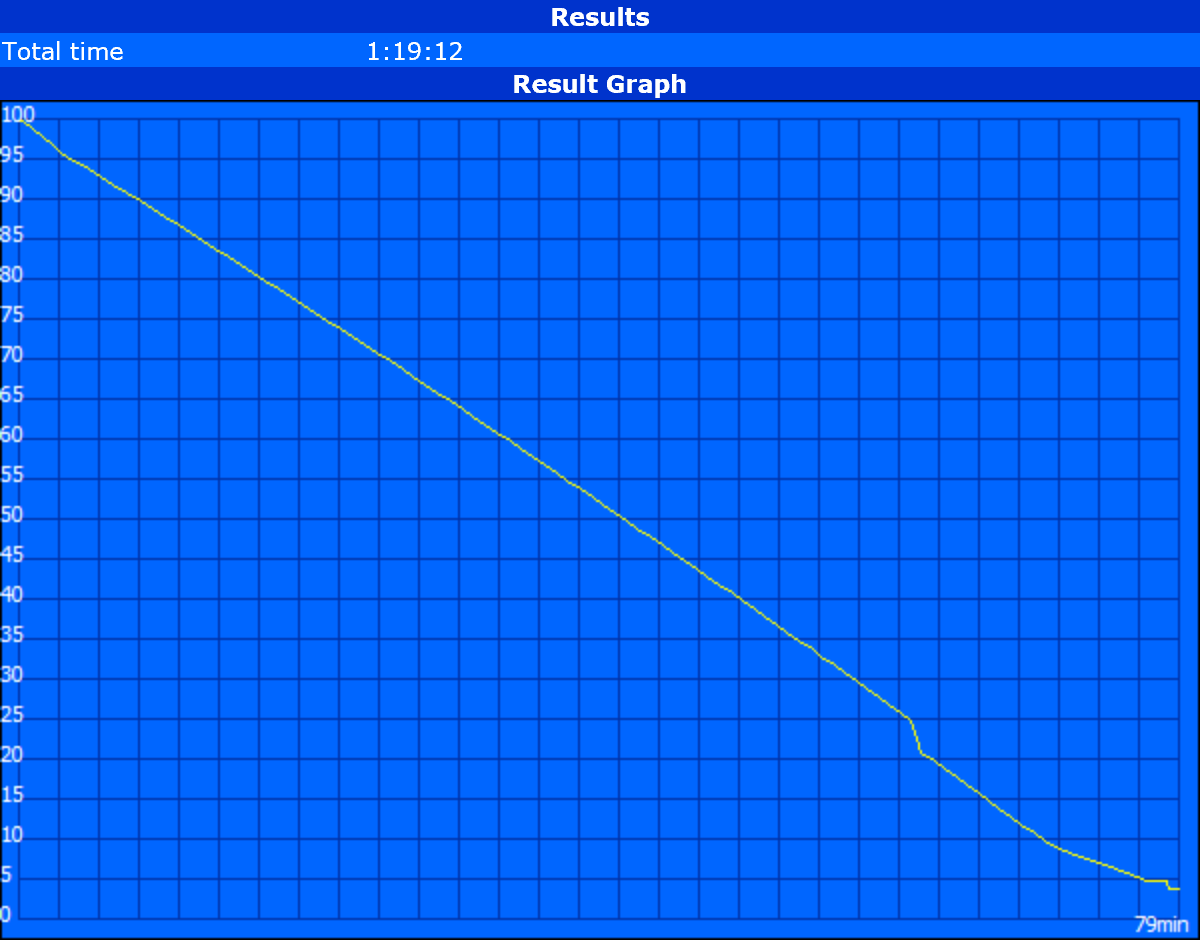
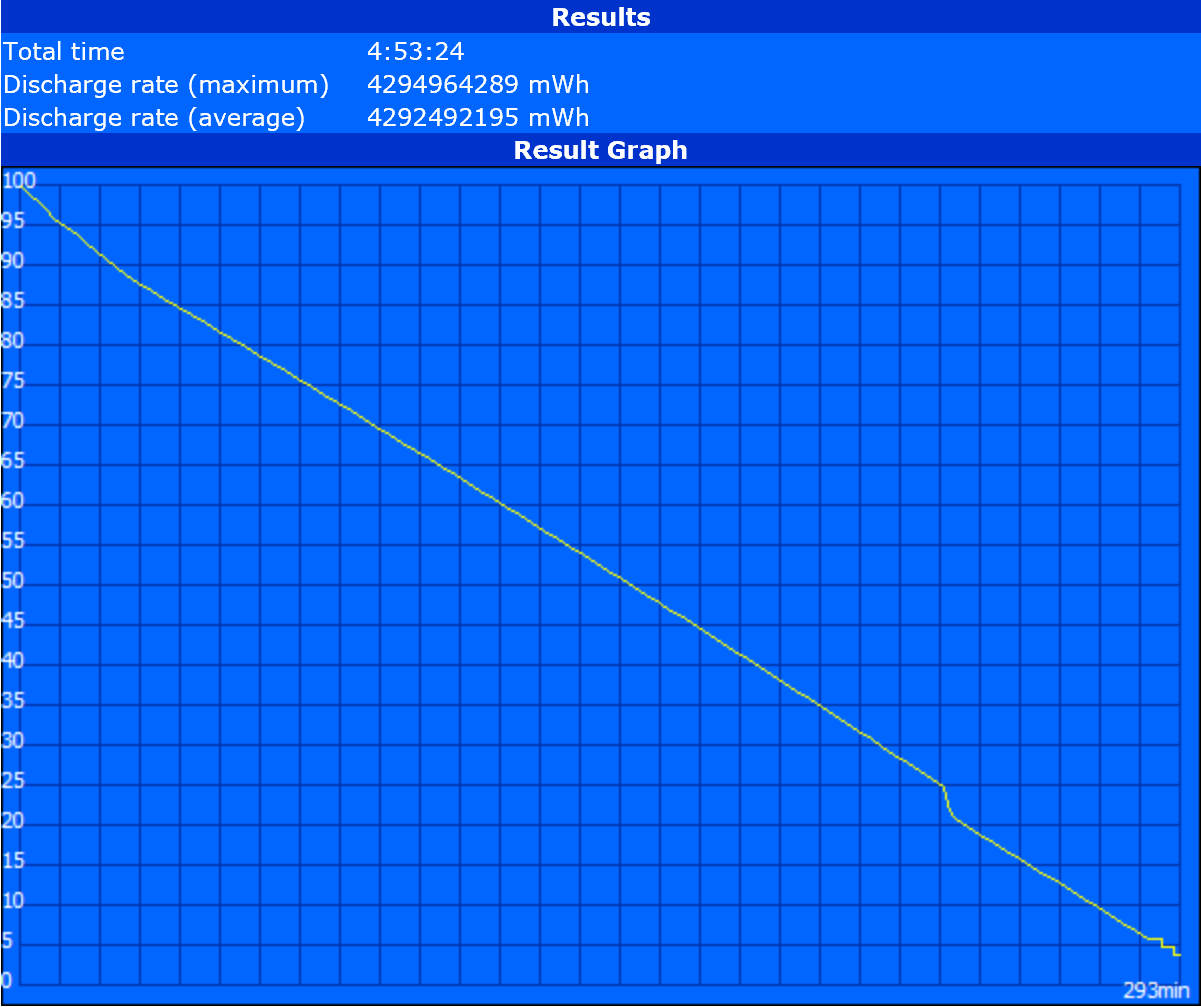
Akkulaufzeit
Es ist zu erwarten, dass leistungsstärkere Komponenten bei gleicher Akkukapazität einen Einfluss auf die Akkulaufzeit haben. Die WLAN-Laufzeit beträgt knapp unter fünf Stunden verglichen mit sieben Stunden beim Core-i5- oder acht Stunden beim Core-m3-Modell. Das ist tatsächlich eines der Surface Pro Tablets mit der kürzesten Akkulaufzeit, die wir getestet haben.
Unter unseren WLAN-Bedingungen läuft unser standardisiertes Browser-Skript bei einer Helligkeit von 150 cd/m² mit Profil Ausgewogen ohne Bildschirm-Timeout in einer Schleife.
| Microsoft Surface Pro 4 Core i7 38 Wh | Microsoft Surface Pro 4, Core i5, 128GB 38 Wh | Microsoft Surface Pro 4, Core m3 38 Wh | Microsoft Surface Pro 3 42 Wh | Microsoft Surface 3 28 Wh | |
|---|---|---|---|---|---|
| Akkulaufzeit | 43% | 54% | 65% | 66% | |
| Idle (h) | 10.9 | 15 38% | 13.2 21% | 18.3 68% | 13.8 27% |
| WLAN (h) | 4.9 | 7.1 45% | 8.1 65% | 7.3 49% | |
| Last (h) | 1.3 | 1.9 46% | 2.3 77% | 2.1 62% | 2.9 123% |
| WLAN (alt) (h) | 8.4 | 7.1 |
Pro
Contra
Fazit
Das Surface Pro 4 Core i7 Modell liefert nur eine marginal schnellere CPU-Leistung als sein Core-i5-Gegenstück. Bei Textverarbeitung oder Surfen ist der Leistungsunterschied für die meisten User vernachlässigbar.
Stattdessen sollte die Core-i7-Konfiguration hauptsächlich für Power User attraktiv sein, die Nutzen aus der höheren GPU-Leistung der Intel Iris 540 gegenüber der HD 520 ziehen können. Die reine Grafikleistung reicht zwar immer noch nicht um damit etwa moderne Spiele flüssig in nativer Auflösung laufen zu lassen, doch die Mehrleistung ist für leichte bis mäßige Photoshop Aufgaben oder Videobearbeitung sicherlich praktisch. Der besser kalibrierte Bildschirm und die schnellere SSD-Leistung des 256-GB-Laufwerks verglichen mit dem Core-i5- oder Core-m3-Modell machen die Core-i7-Variante ebenso einen Tick professioneller.
Den meisten Power Usern wird der genauere Bildschirm, die schnellere SSD-Leistung und das Fehlen von schwerwiegenden Throttling-Problemen gegenüber weniger teureren Konfigurationen gefallen. Für wenig anspruchsvolle Office- und PowerPoint User sind diese jedoch unbedeutend.
Microsoft Surface Pro 4 Core i7
- 18.04.2016 v5.1 (old)
Allen Ngo
Preisvergleich
