 Deutsch
 English
 Español
 Français
 Italiano
 Nederlands
 Polski
 Português
 Русский
 Türkçe
 Svenska
 Chinese
 Magyar
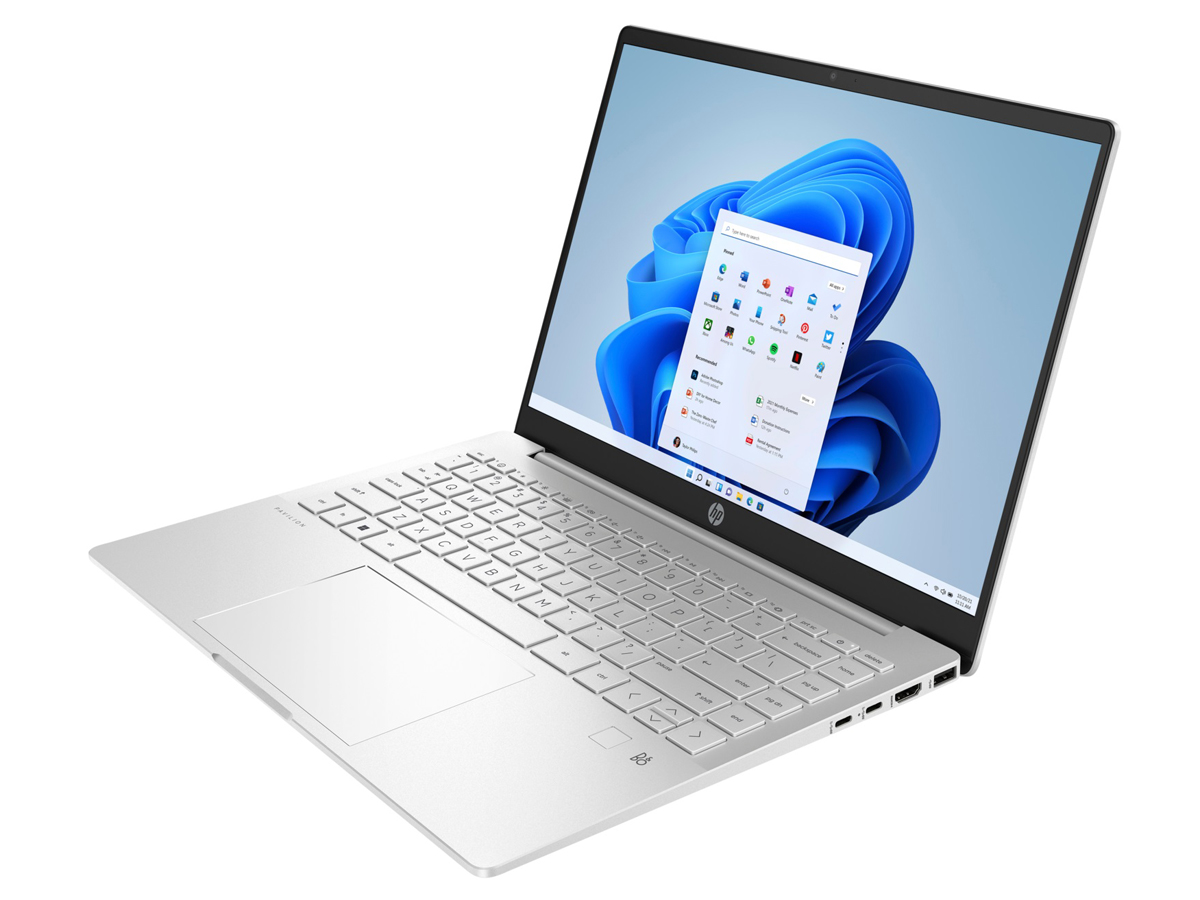
Testbericht: HP Pavilion Plus 14 Laptop: OLED, 90 Hz und Core H der 12. Generation

Das HP Pavilion Plus 14 ist das „Pro“-Modell zum standardmäßigen Pavilion 14. Er ist mit höherwertigen Optionen wie Core H-Serien-CPUs und einem OLED-Display ausgestattet, im Gegensatz zu den typischen Core U-Serien- und IPS-Optionen des standardmäßigen Pavilion 14.
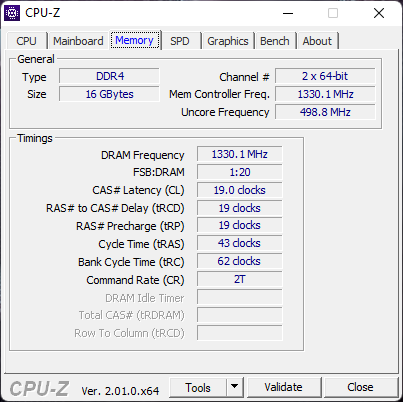
Unser Testgerät kommt mit einer Core i7-12700H-CPU, integrierter Iris Xe-Grafik und einem 90 Hz 16:10 1800p OLED-Display zu einem Einzelhandelspreis von etwa 850 USD. Andere SKUs sind verfügbar, wie in der folgenden Tabelle gezeigt. Der Pavilion Plus 14 konkurriert mit anderen 14-Zoll-Ultrabooks der Mittelklasse oder höher, wie dem Asus VivoBook Pro 14, dem Lenovo Yoga Slim 7i Pro oder der MSI Modern 14-series.
| Core i5-1240P | Core i5-1240P | Core i7-12700H | Core i7-1255U |
| Iris Xe | Iris Xe | Iris Xe | GeForce RTX 2050 |
| 14-inch IPS 2.2k 300-nit | 14-inch IPS 2.2k 300-nit | 14-inch OLED 2.8k 400-nit | 14-inch OLED 2.8k 400-nit |
| 8 GB RAM | 8 GB RAM | 16 GB RAM | 16 GB RAM |
| 256 GB SSD | 512 GB SSD | 256 GB SSD | 512 GB SSD |
Weitere HP-Testberichte:
Mögliche Konkurrenten im Vergleich
Bew | Datum | Modell | Gewicht | Dicke | Größe | Auflösung | Preis ab |
|---|---|---|---|---|---|---|---|
| 85.4 % | 08.2022 | HP Pavilion Plus 14 eh0097nr i7-12700H, Iris Xe G7 96EUs | 1.4 kg | 18.3 mm | 14.00" | 2880x1800 | |
| 86.3 % | 07.2022 | Asus Vivobook Pro 14 M3401QC-KM007T R5 5600H, GeForce RTX 3050 4GB Laptop GPU | 1.5 kg | 19 mm | 14.00" | 2880x1800 | |
| 83.7 % | 06.2022 | Dell Inspiron 14 7420 2-in-1 i7-1255U, Iris Xe G7 96EUs | 1.6 kg | 17.86 mm | 14.00" | 1920x1200 | |
| 87.6 % | 06.2022 | Lenovo Yoga Slim 7i Pro 14IAP G7 i5-1240P, Iris Xe G7 80EUs | 1.3 kg | 14.6 mm | 14.00" | 2880x1800 | |
| 82.2 % | 07.2021 | MSI Modern 14 B11SB-085 i7-1165G7, GeForce MX450 | 1.3 kg | 16.9 mm | 14.00" | 1920x1080 | |
| 84.8 % | 01.2022 | HP Pavilion 14-dv0357ng i5-1135G7, Iris Xe G7 80EUs | 1.4 kg | 19 mm | 14.00" | 1920x1080 |
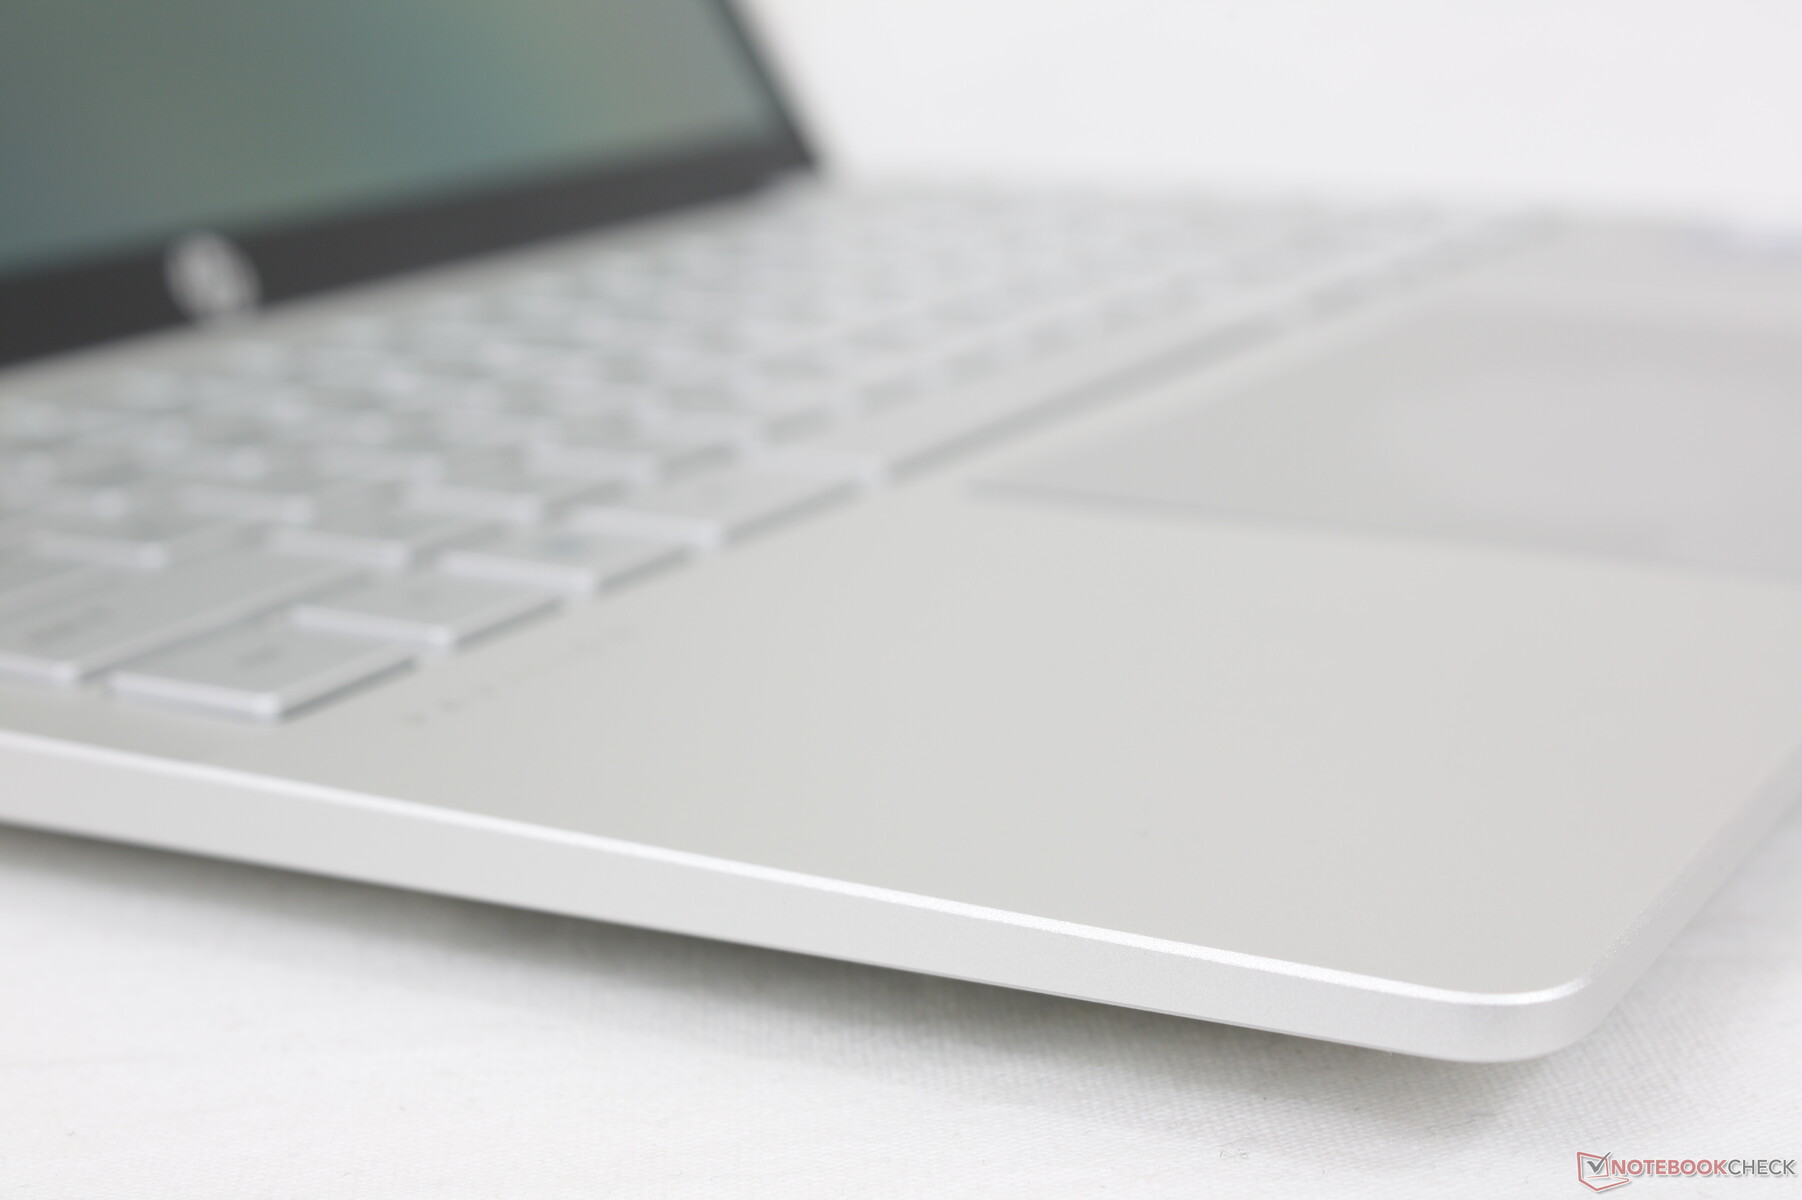
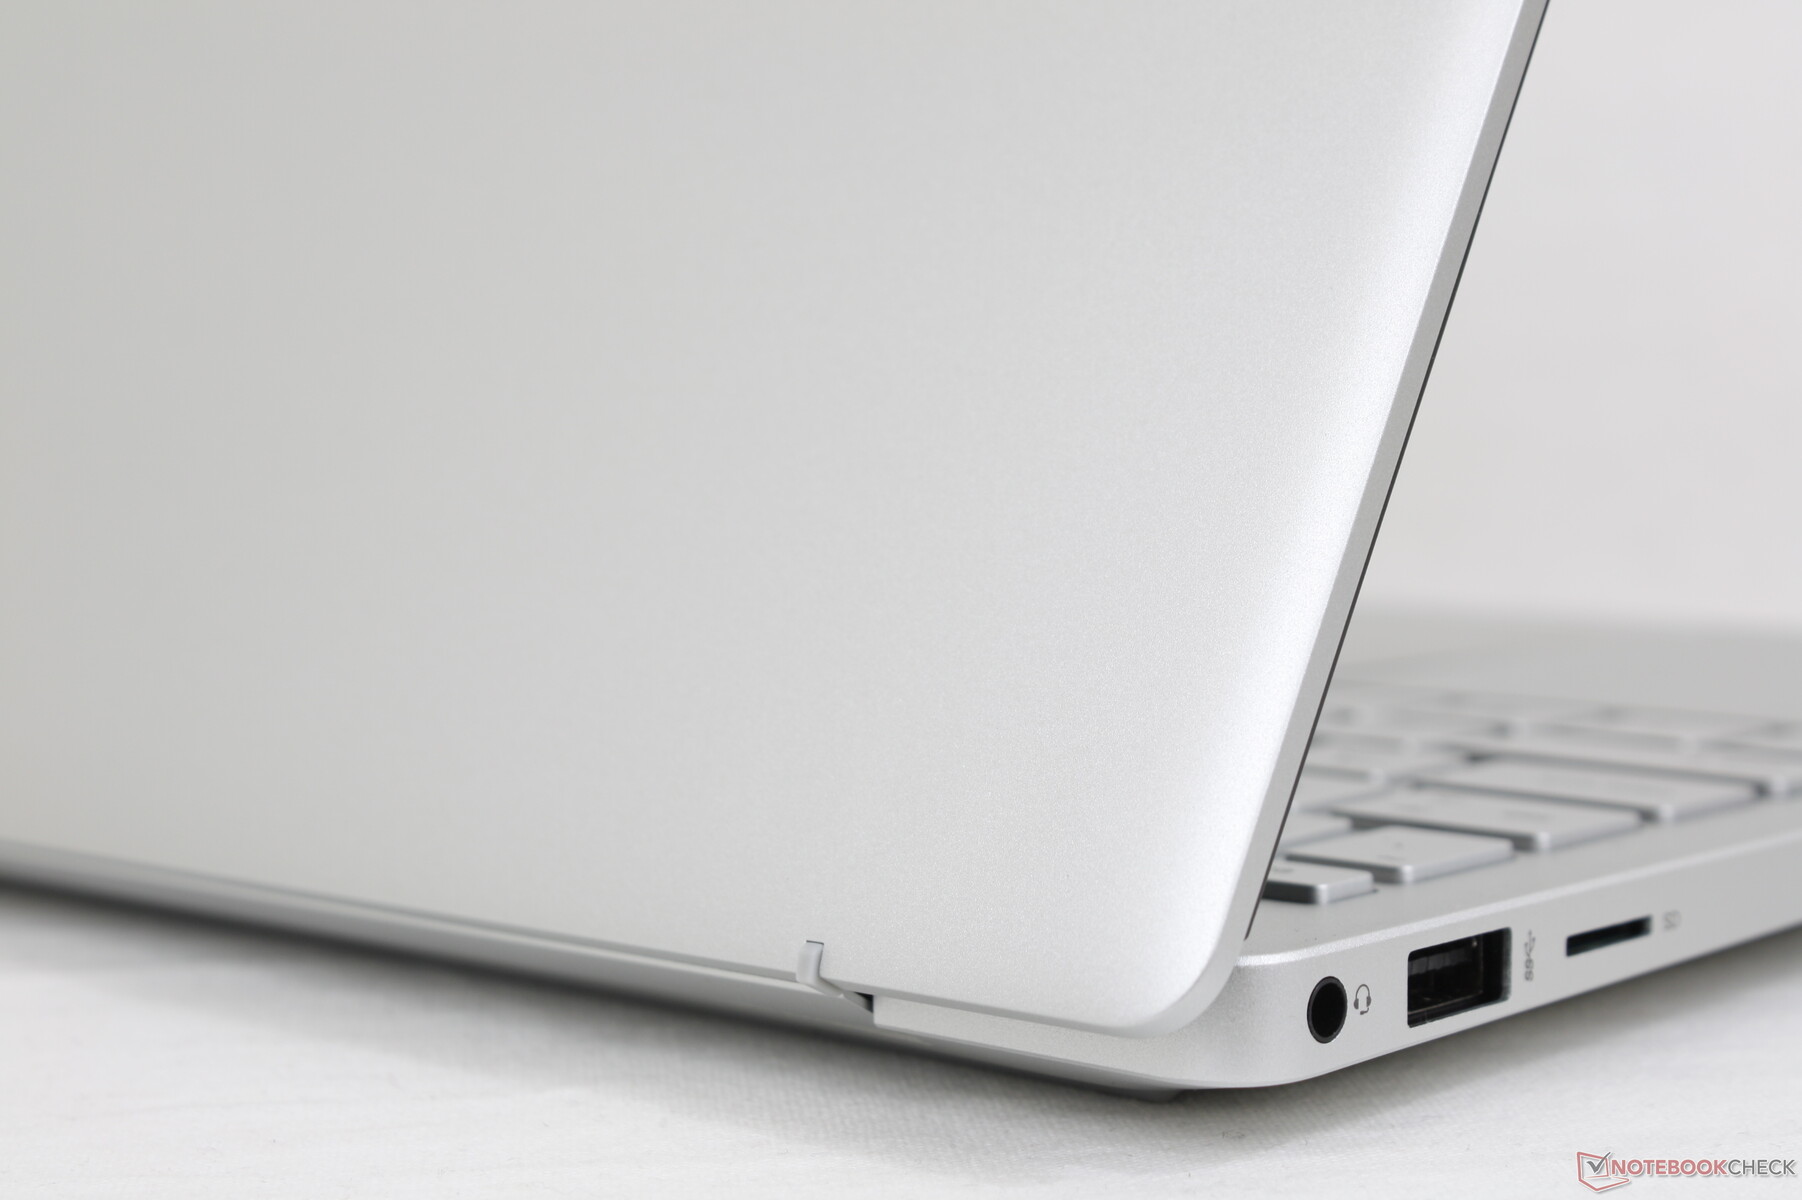
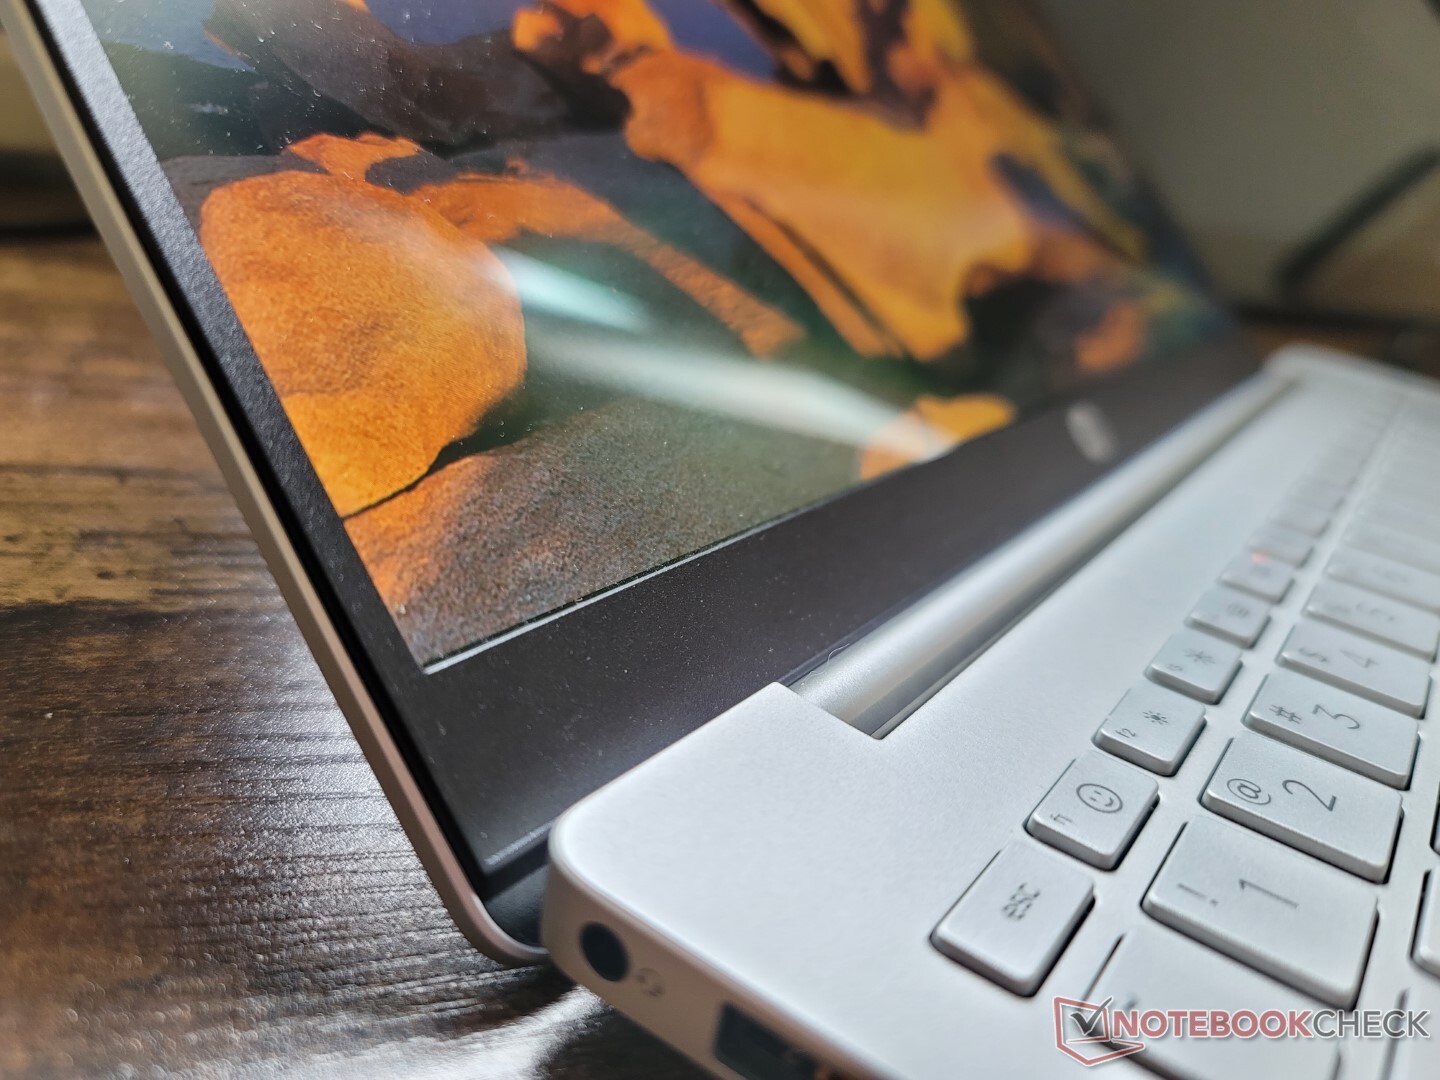
Der Fall – Der Pavillon Pro
Der Pavilion Plus 14 behält trotz aller internen Änderungen, die wahrscheinlich der Kosteneinsparung dienen, den Aluminium-Look und die Haptik des ursprünglichen Pavilion 14 bei. Hätte HP wesentliche Designverbesserungen eingeführt, dann wäre dieses Pavillon Plus-Modell im Wesentlichen ein Envy-Produkt aus der kostspieligeren Serie von HP. Das soll jedoch nicht heißen, dass es keine oberflächlichen Veränderungen gibt: Der Pavilion Plus 14 ist an den Rändern sichtbar flacher und das abgeänderte Design der Bodenplatte führt zu einer etwa 0,7 mm dünneren Gesamtdicke.
Die Steifigkeit des Gehäuses ist rund um die Basis gut, und es biegt sich nur sehr wenig. Der Deckel und die inneren Kunststoffeinfassungen sind jedoch deutlich anfälliger für Verwindungen und Beschädigungen, besonders auch, da keine Option für der Verstärkung der Platte mit Gorillaglas angeboten wird. Die Verarbeitungsqualität ist dennoch vergleichbar mit der der konkurrierenden Vivobook- oder IdeaPad-Serie.
Aufgrund des neuen Seitenverhältnisses von 16:10 sind die Abmessungen in der Breite kürzer, aber in der Länge länger als beim standardmäßigen Pavilion 14. Das Gesamtgewicht bleibt mit etwa 1,4 kg unverändert.
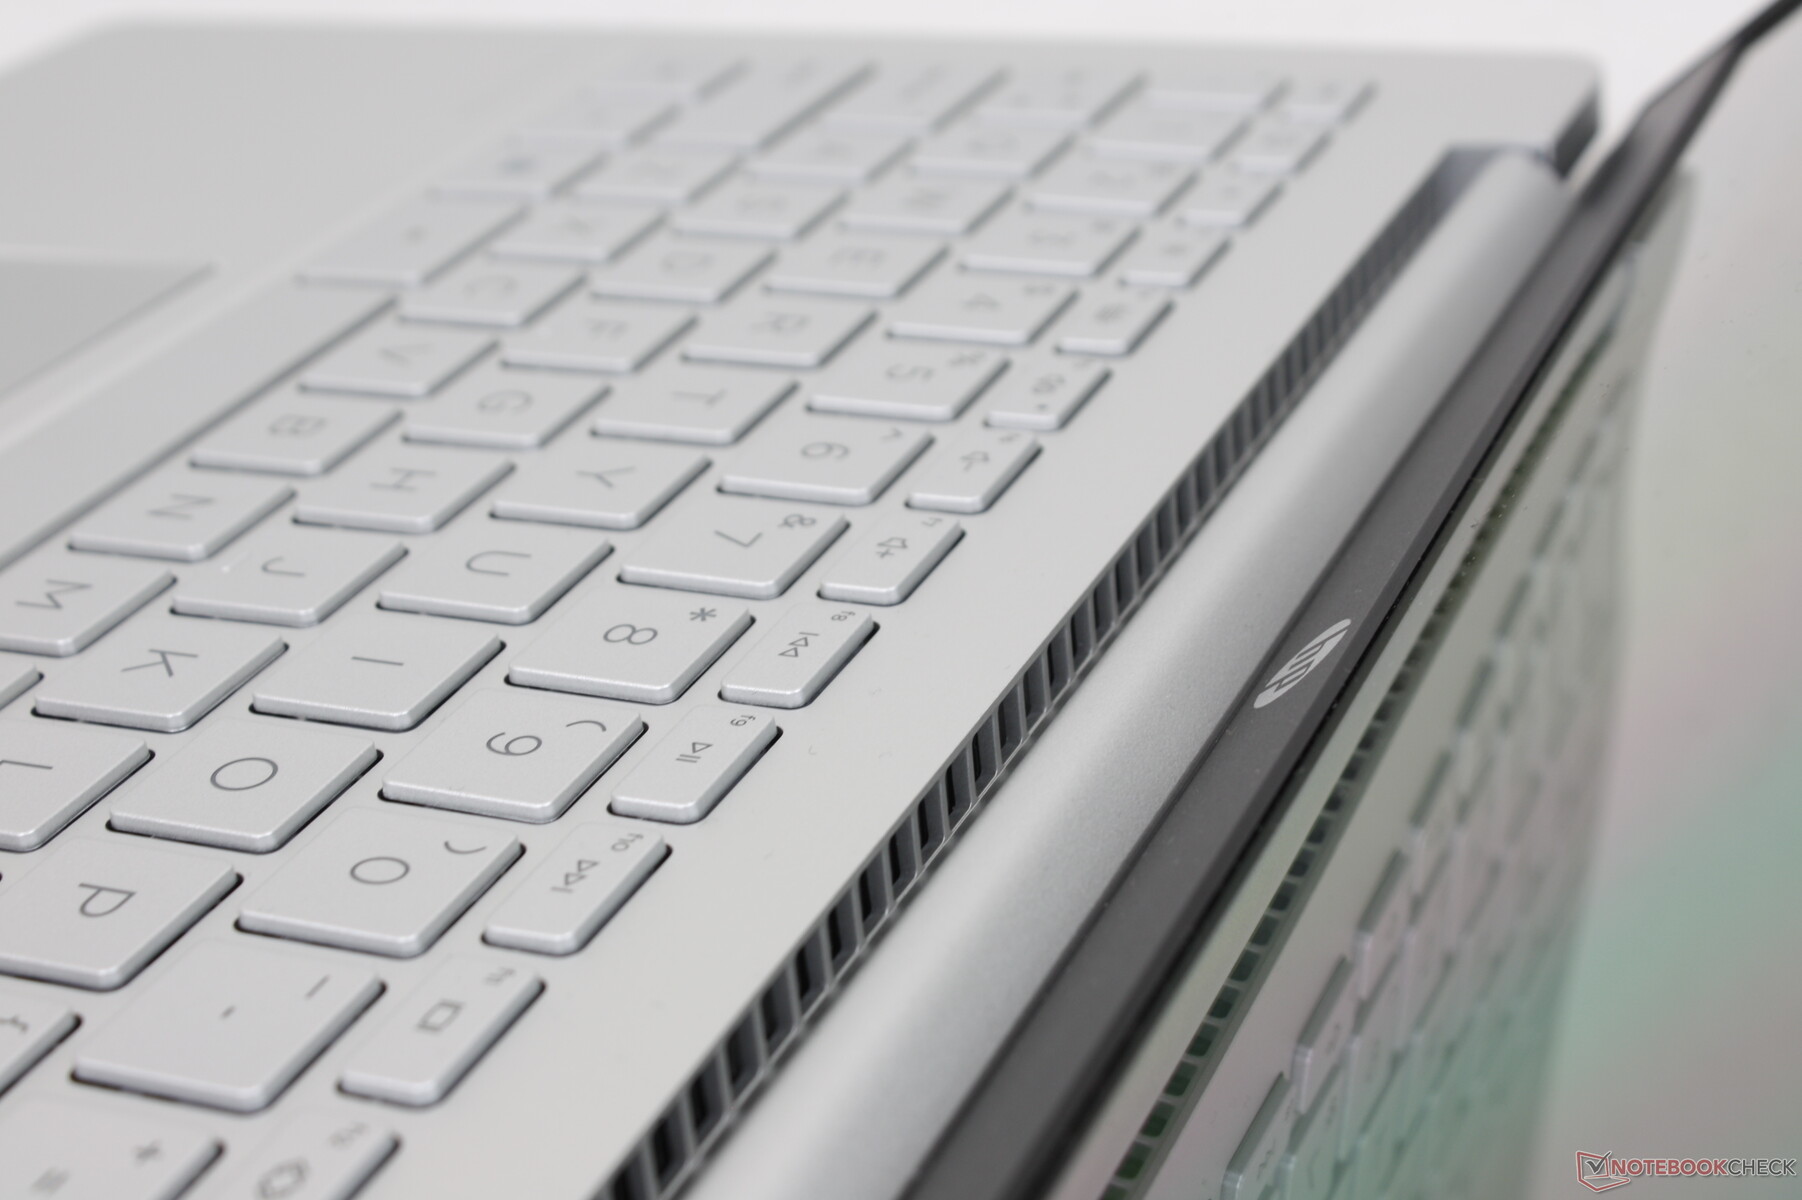


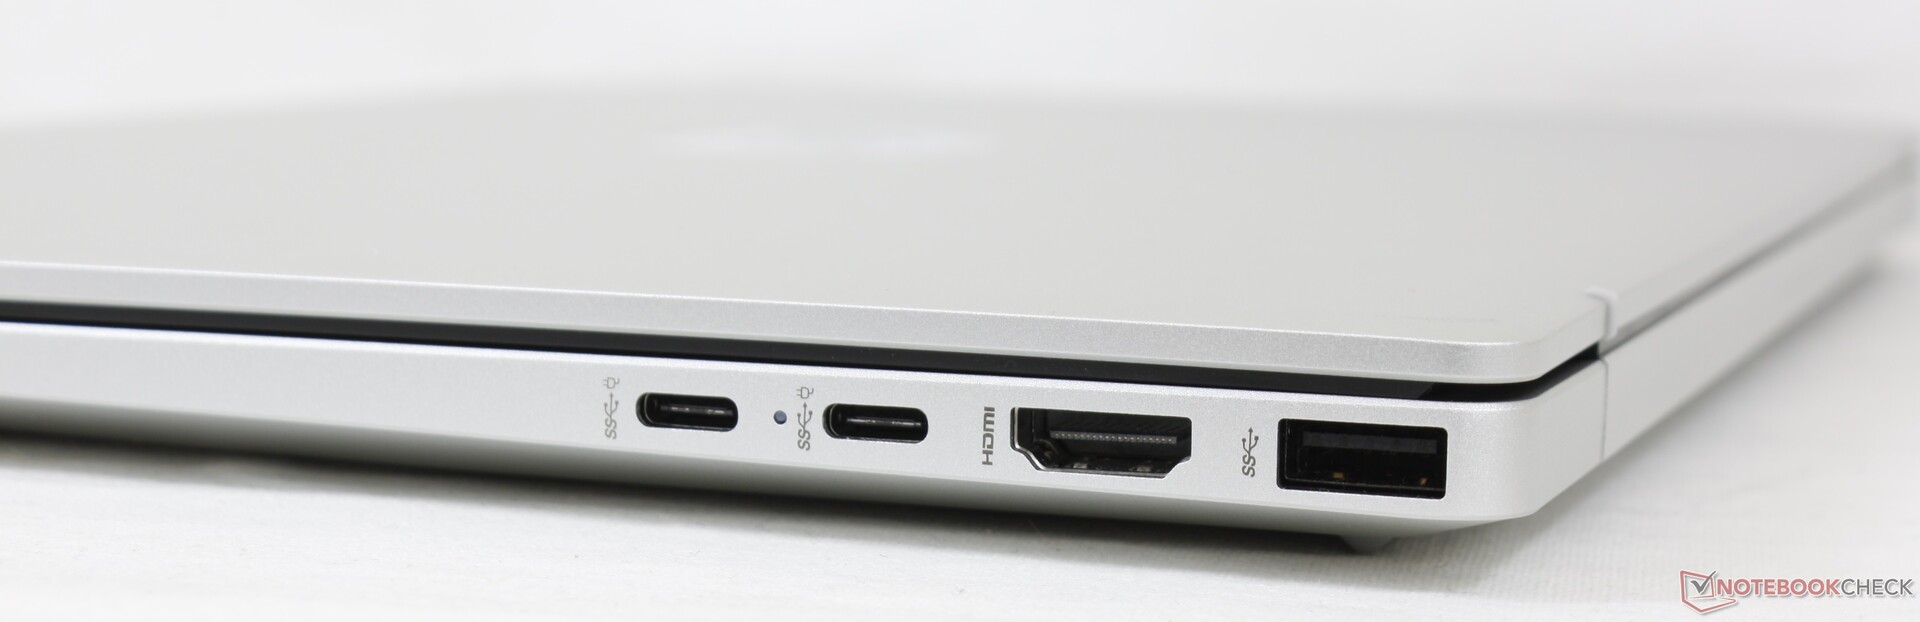
Konnektivität – Keine Thunderbolt-Unterstützung
Die Portoptionen sind größtenteils dieselben wie beim standardmäßigen Pavilion 14, allerdings mit einer großen Änderung: HP hat den proprietären Port für das Netzteil durch einen zweiten USB-C-Port ersetzt. Wir gehen davon aus, dass die meisten, wenn nicht sogar alle Pavilion-Modelle, die nicht speziell für Gaming gedacht sind, in naher Zukunft ebenfalls über USB-C aufgeladen werden.
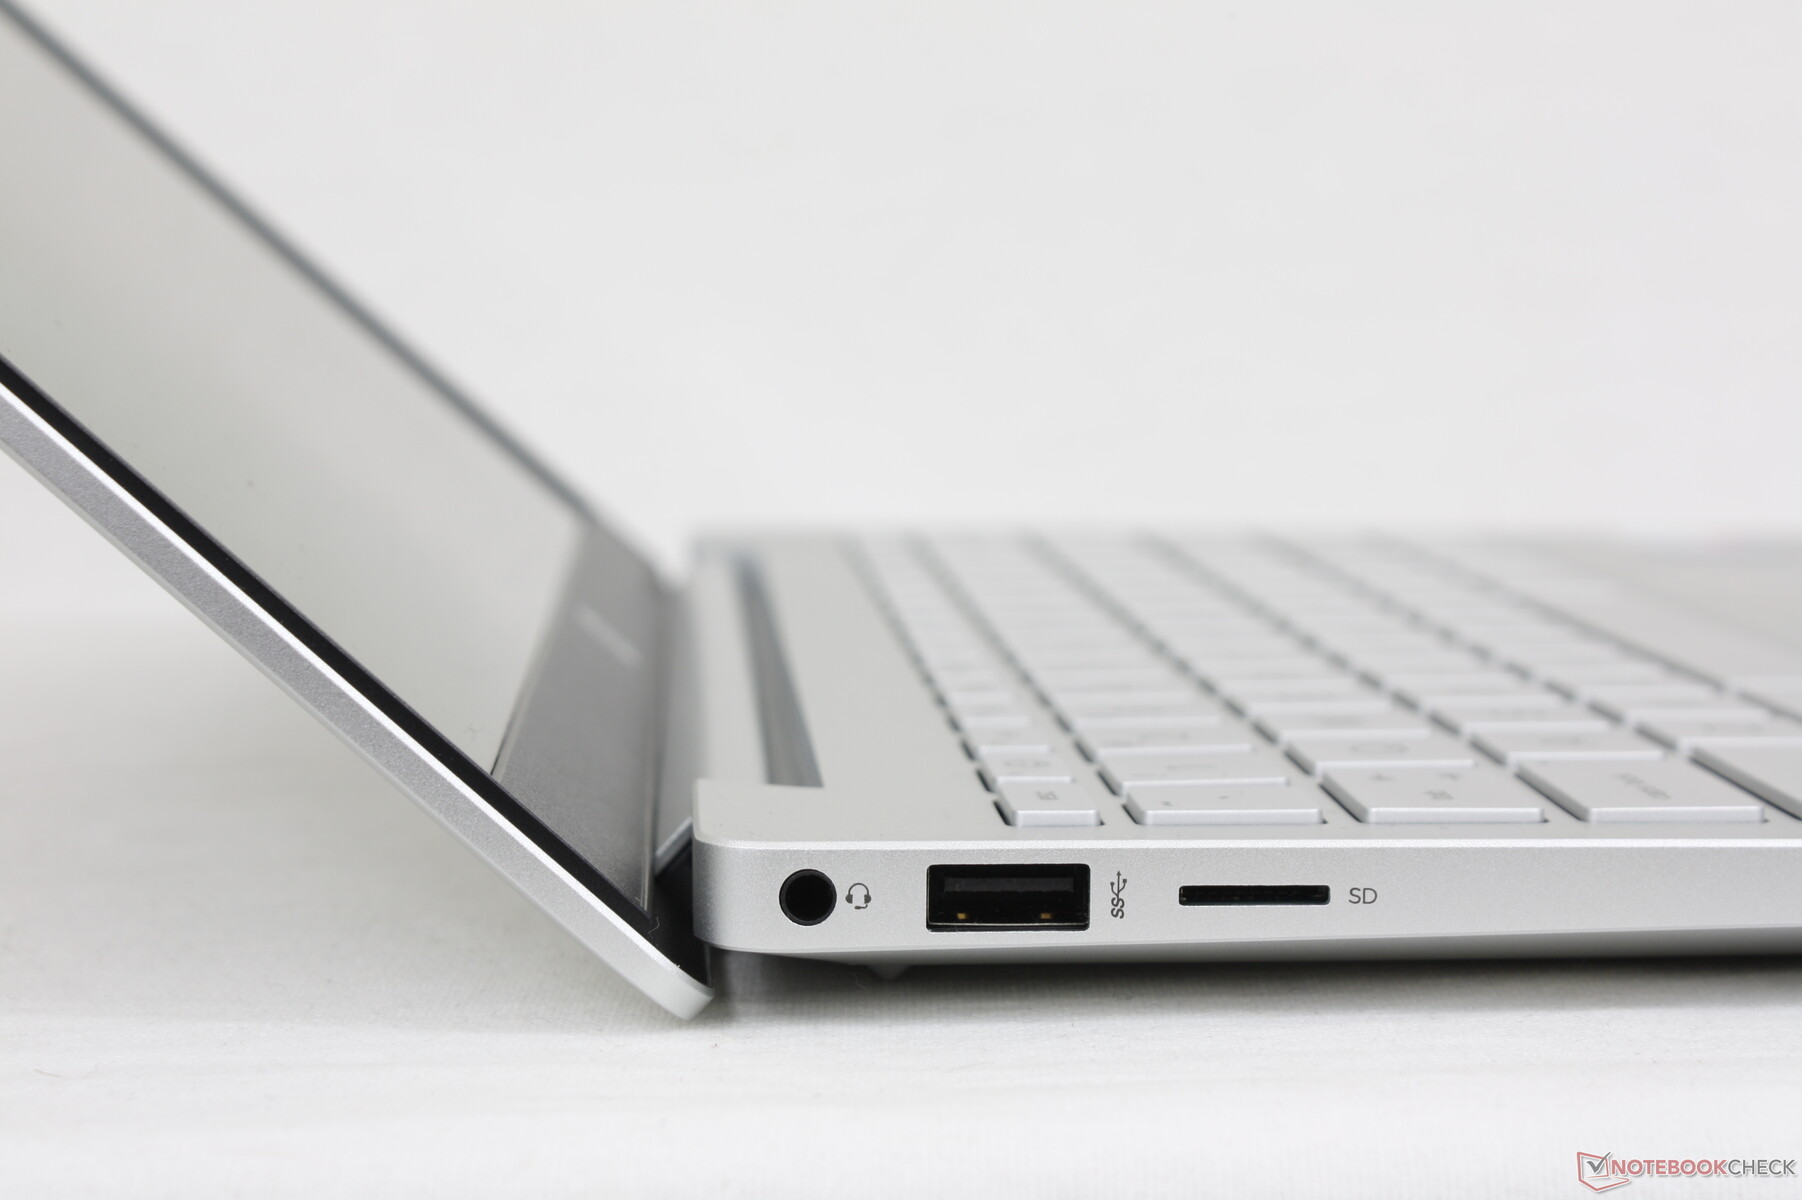
Die Positionen der Ports könnten für einige Benutzer ungünstig sein – die meisten Ports befinden sich an der rechten Seite, was wertvollen Platz auf dem Schreibtisch kosten könnte.
Thunderbolt wird leider nicht unterstützt, da diese Funktion vorerst noch den höherwertigen Modellen wie dem Envy oder Spectre vorbehalten ist.


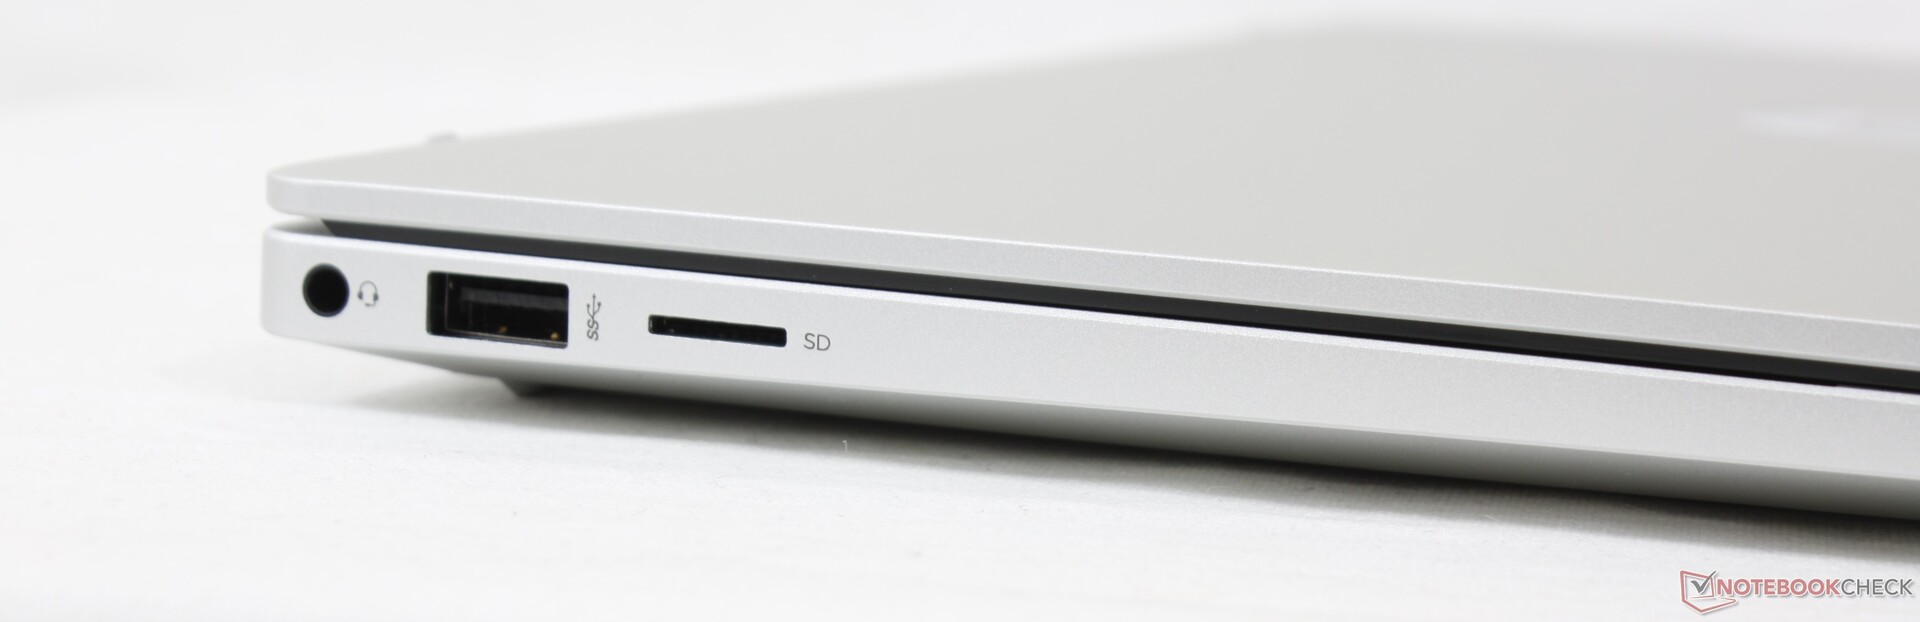
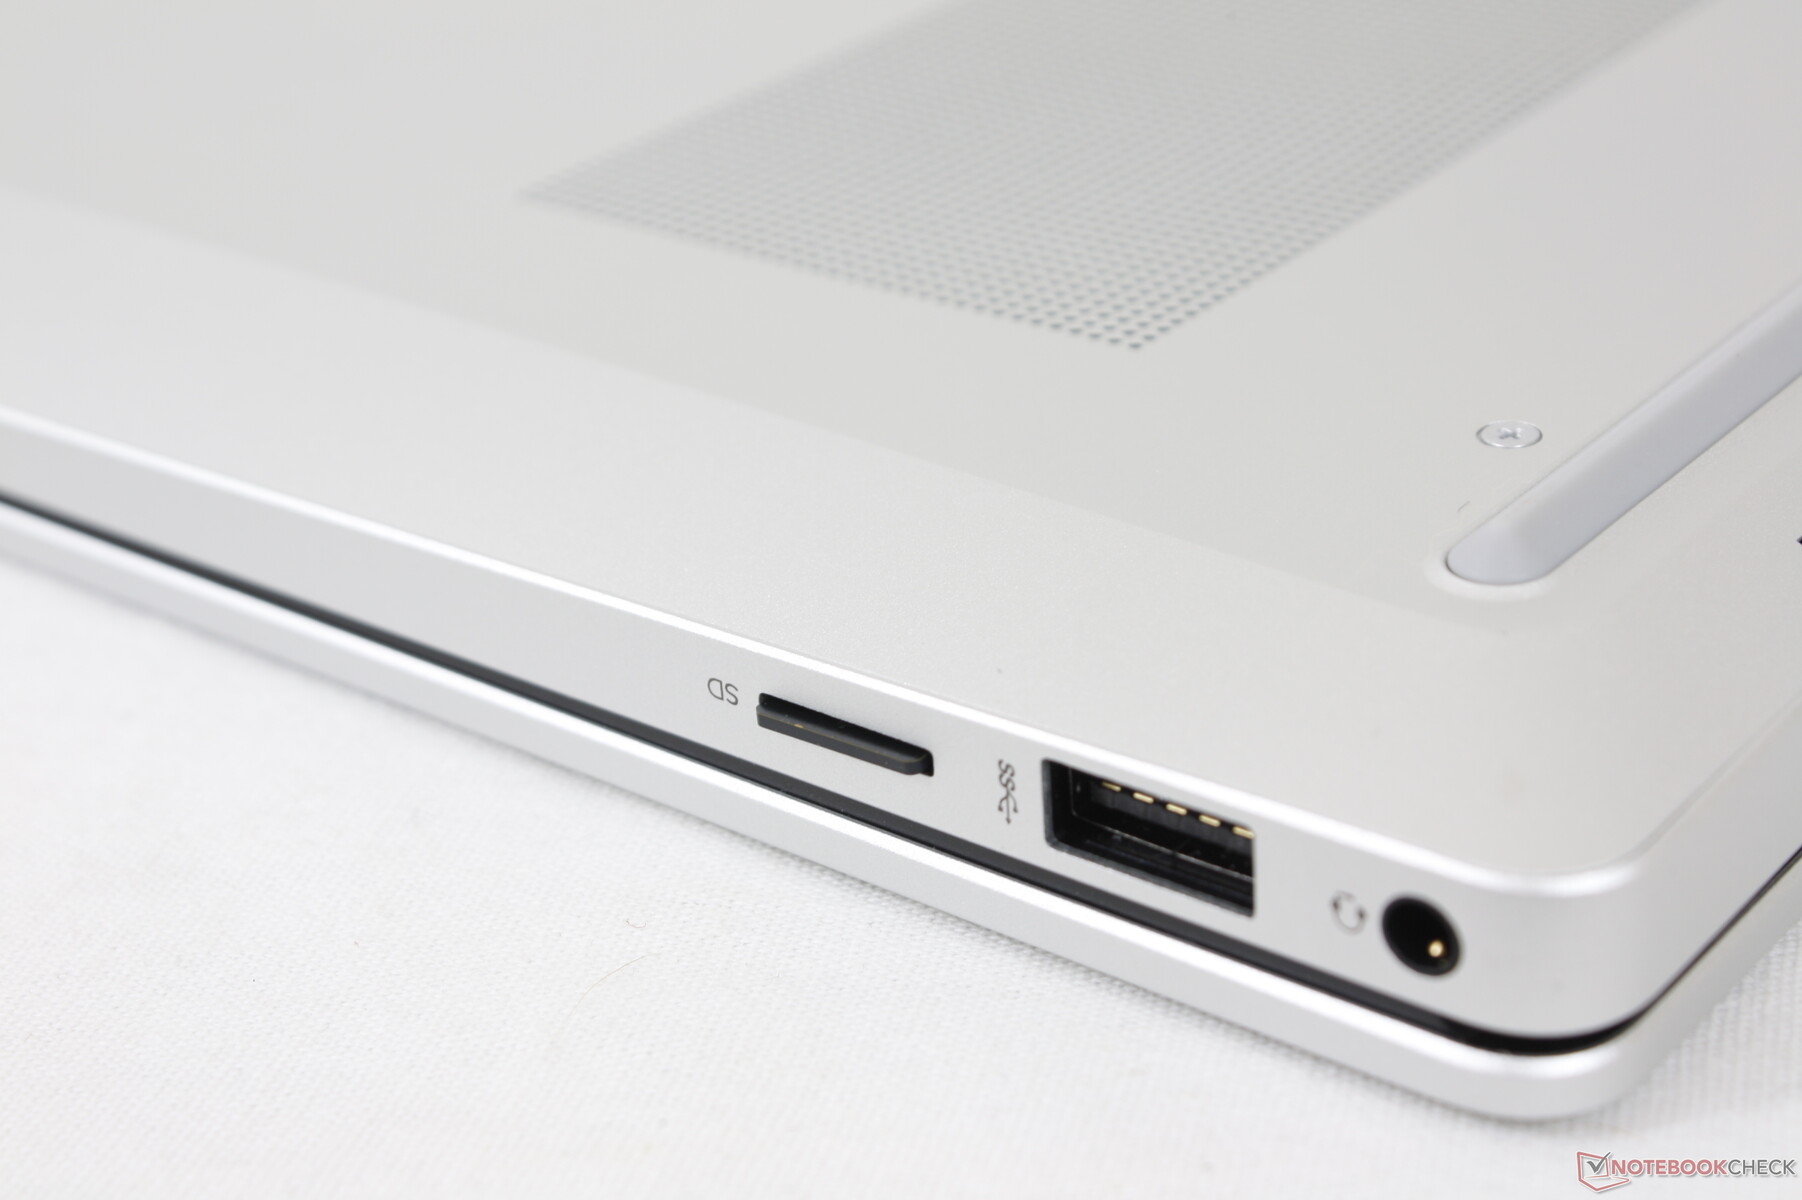
SD-Kartenleser
Der integrierte gefederte MicroSD-Leser bietet angesichts der Preisklasse des Pavilion ordentliche Übertragungsraten von ca. 80 MB/s. Auf teureren Alternativen wie dem Spectre x360 14 können Dateien mit mehr als der dreifachen Geschwindigkeit von der Karte auf den Desktop übertragen werden.
| SD Card Reader | |
| average JPG Copy Test (av. of 3 runs) | |
| HP Spectre x360 14-ea0378ng (Toshiba Exceria Pro M501 microSDXC 64GB) | |
| HP Pavilion 14-dv0357ng | |
| HP Pavilion Plus 14 eh0097nr (AV Pro SD microSD 128 GB V60) | |
| Asus Vivobook Pro 14 M3401QC-KM007T (AV Pro SD microSD 128 GB V60) | |
| MSI Modern 14 B11SB-085 (Toshiba Exceria Pro M501 microSDXC 64GB) | |
| Dell Inspiron 14 7420 2-in-1 (Toshiba Exceria Pro SDXC 64 GB UHS-II) | |
| maximum AS SSD Seq Read Test (1GB) | |
| HP Spectre x360 14-ea0378ng (Toshiba Exceria Pro M501 microSDXC 64GB) | |
| HP Pavilion 14-dv0357ng | |
| HP Pavilion Plus 14 eh0097nr (AV Pro SD microSD 128 GB V60) | |
| Asus Vivobook Pro 14 M3401QC-KM007T (AV Pro SD microSD 128 GB V60) | |
| Dell Inspiron 14 7420 2-in-1 (Toshiba Exceria Pro SDXC 64 GB UHS-II) | |
| MSI Modern 14 B11SB-085 (Toshiba Exceria Pro M501 microSDXC 64GB) | |
Kommunikation – Kein WLAN 6E
Das Gerät wird mit einem preiswerten Realtek RTL8852AE Modul für WLAN 6 und Bluetooth-5-Konnektivität geliefert. Die Übertragungsraten sind zwar konsistent und für Streaming und die meisten Anwendungen brauchbar, aber viel langsamer als mit der gängigeren Intel AX200/201 Serie.
| Networking | |
| iperf3 transmit AX12 | |
| MSI Modern 14 B11SB-085 | |
| HP Pavilion 14-dv0357ng | |
| iperf3 receive AX12 | |
| MSI Modern 14 B11SB-085 | |
| HP Pavilion 14-dv0357ng | |
| iperf3 receive AXE11000 | |
| Lenovo Yoga Slim 7i Pro 14IAP G7 | |
| HP Pavilion Plus 14 eh0097nr | |
| iperf3 transmit AXE11000 | |
| Lenovo Yoga Slim 7i Pro 14IAP G7 | |
| HP Pavilion Plus 14 eh0097nr | |
Webcam – 5-MP- Kamera
Das Modell verfügt über eine 5-MP-Webcam, die im Gegensatz zur 1-MP-Webcam des standardmäßigen Pavilion 14 für schärfere Bilder sorgt. Es gibt jedoch keinen Privacy Shutter oder IR-Sensor für die Unterstützung von Windows Hello.


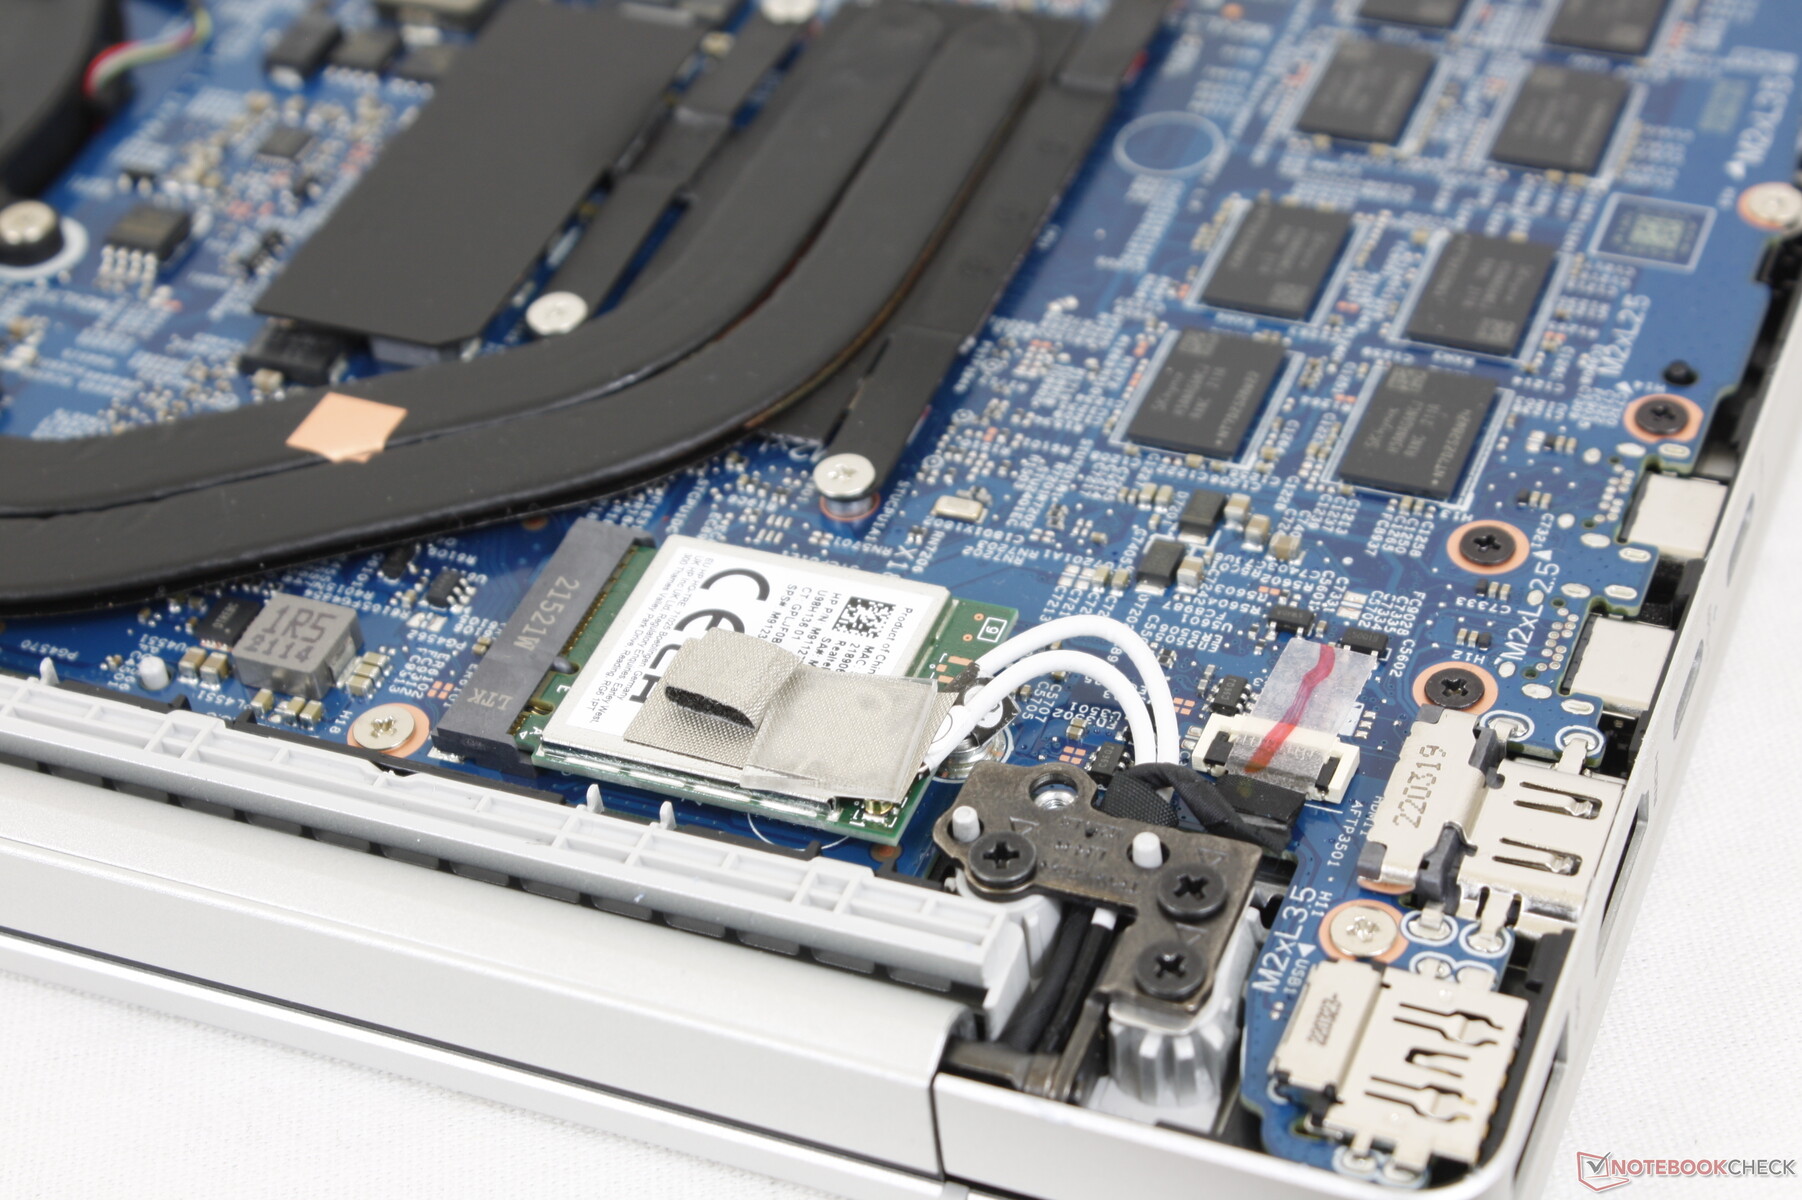
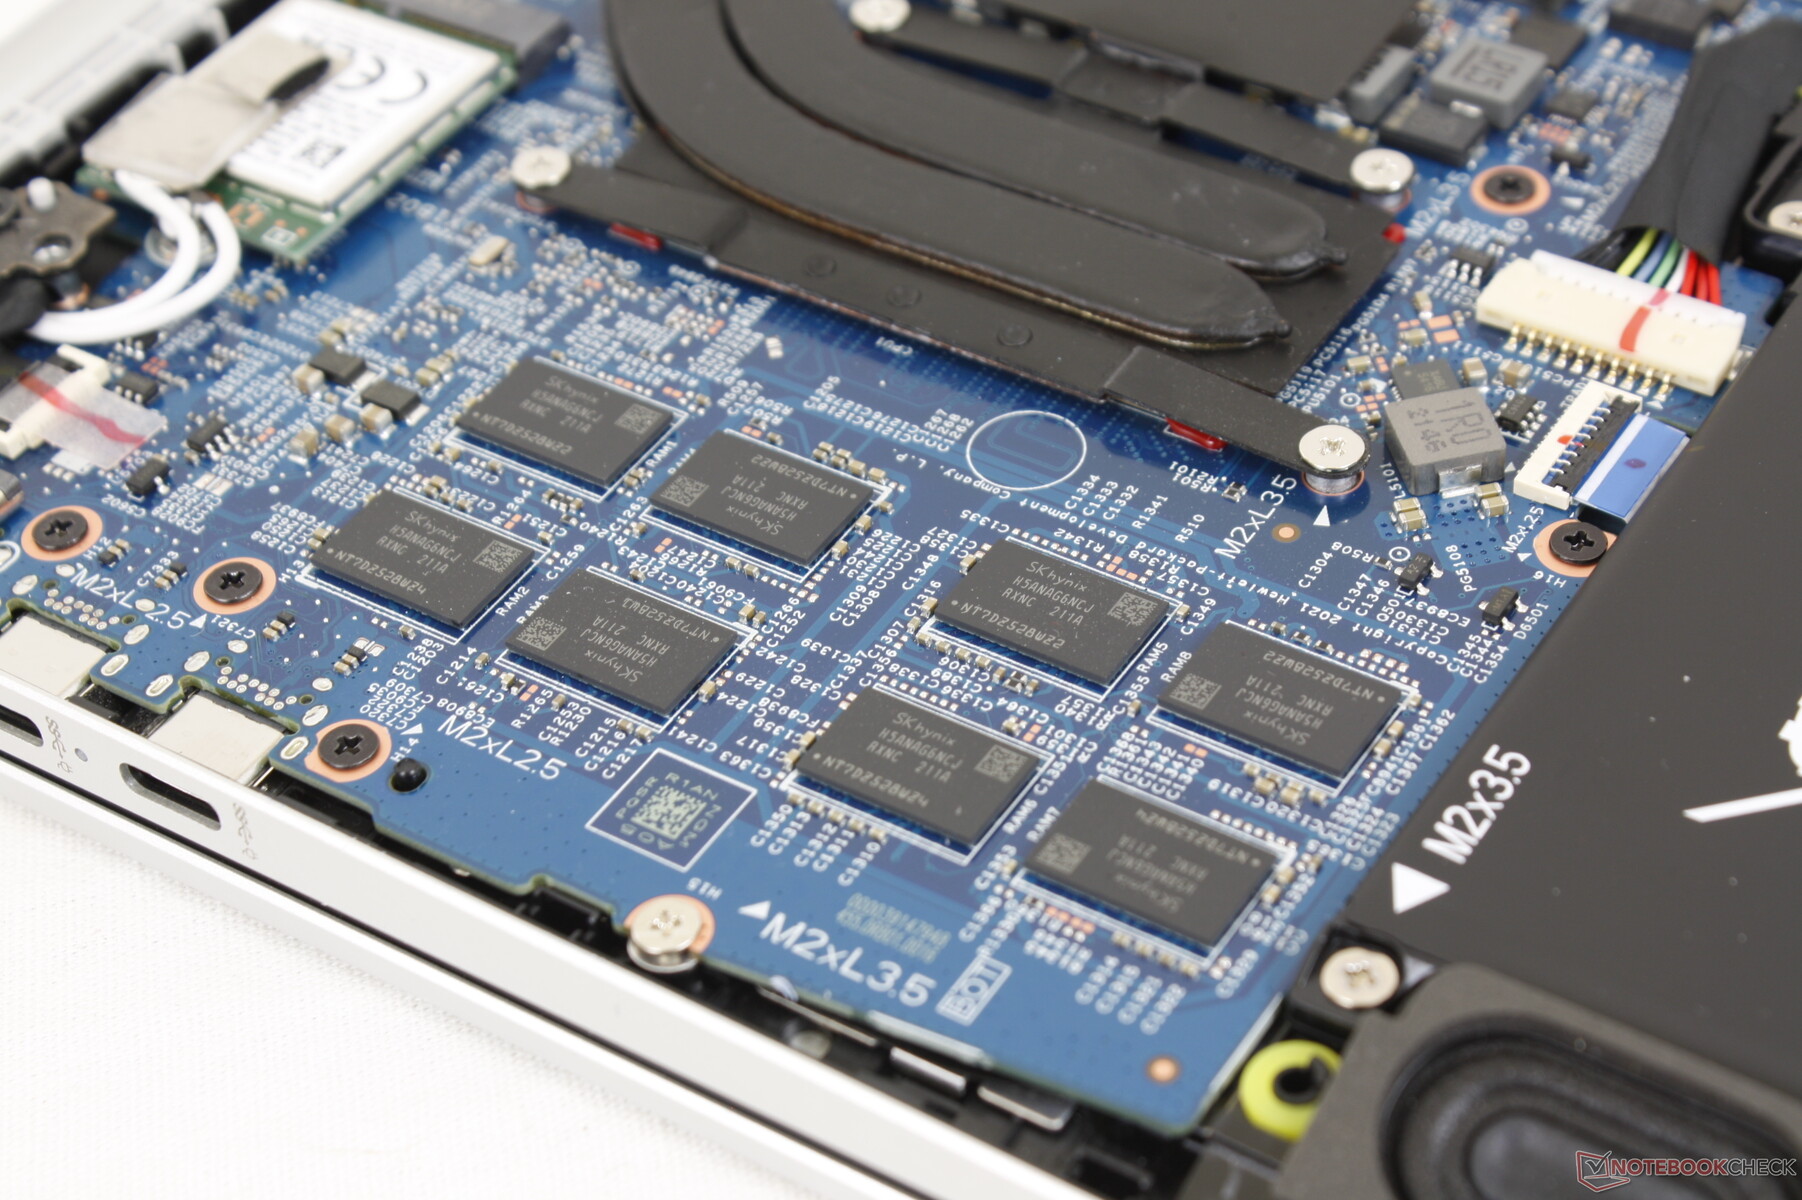
Wartung
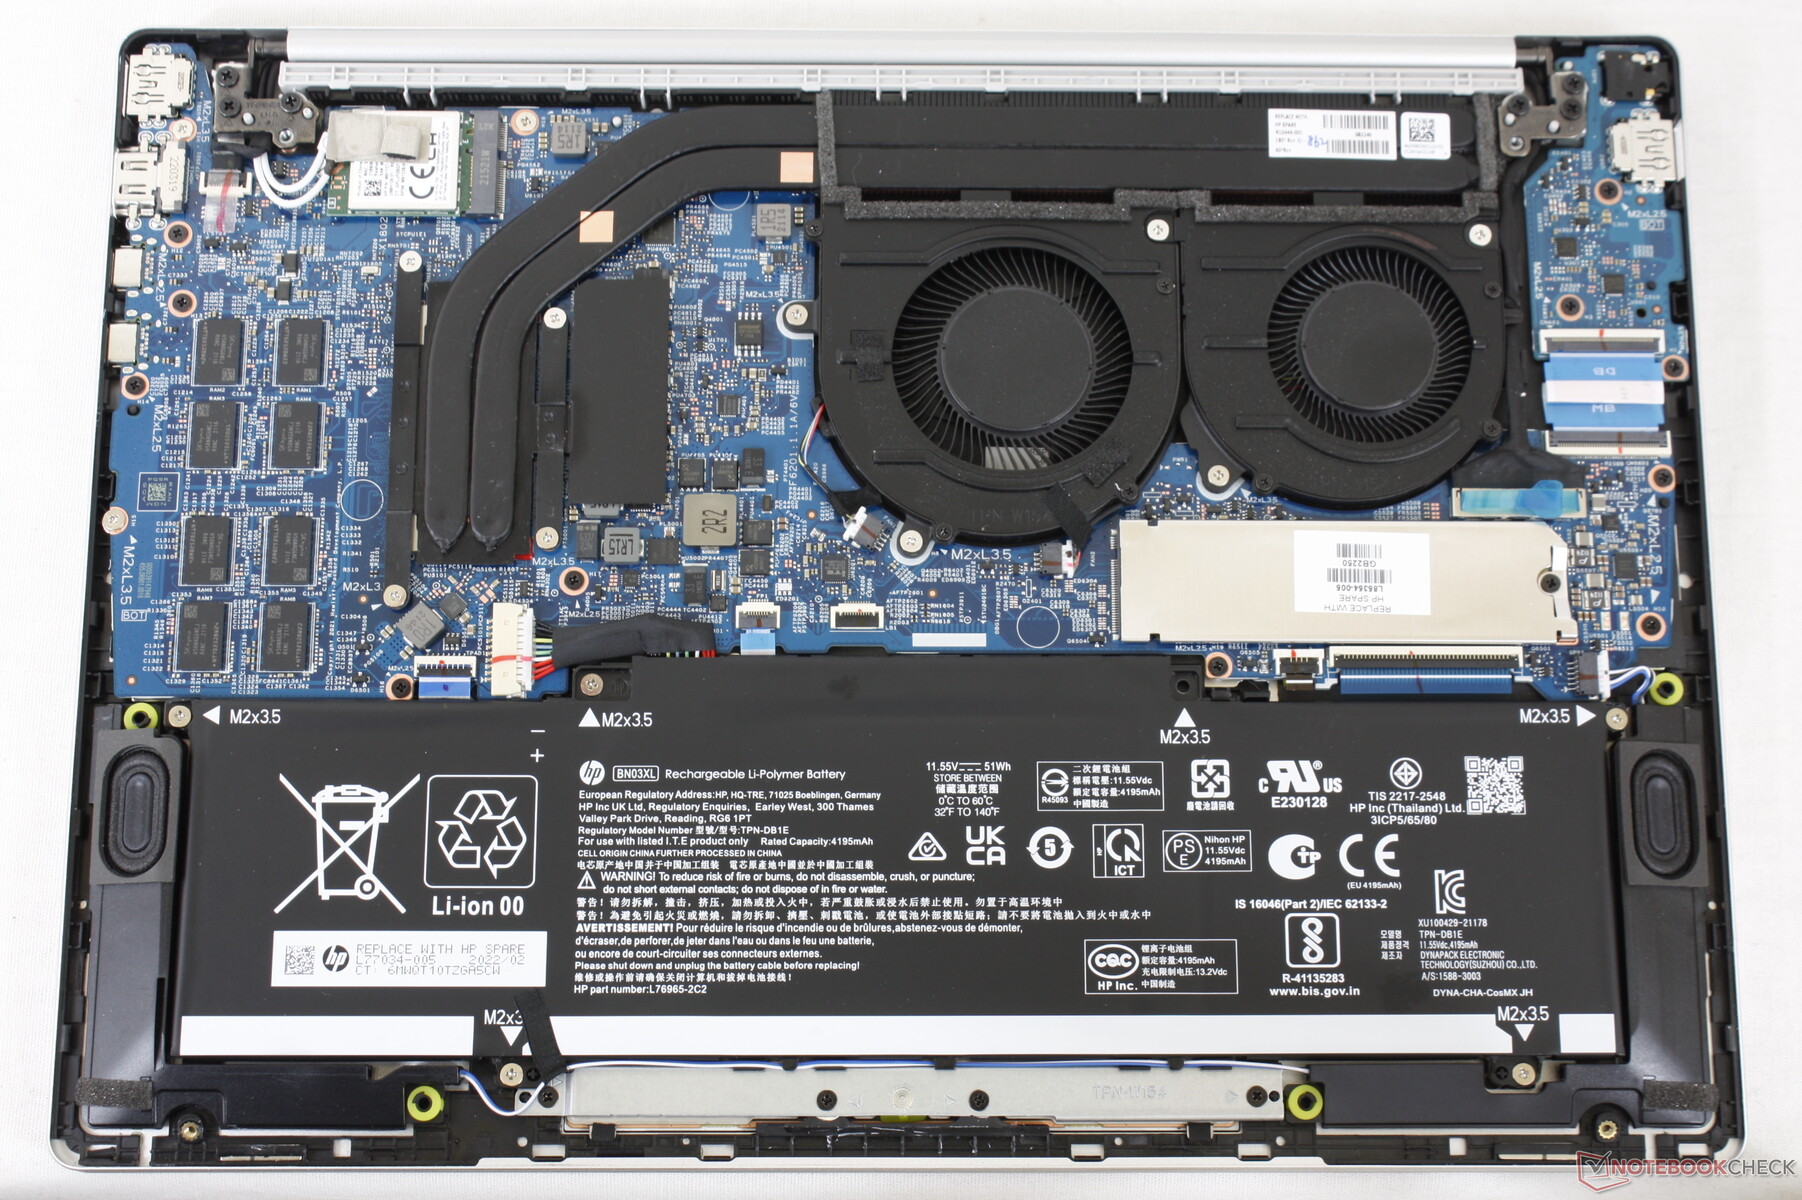
Die Bodenplatte lässt sich mit einem Kreuzschlitzschraubendreher und einer scharfen Kante relativ leicht entfernen. Anders als bei den Pavilion-Modellen der älteren Generation gibt es zum Glück keine unter den Gummifüßen versteckte Schrauben. HP hat sogar ein praktisches Video für Benutzer, die ihren Laptop warten möchten.
Im Inneren können die Benutzer das WLAN-Modul, den Akku oder die M.2-Module nach Bedarf austauschen. Der Arbeitsspeicher ist verlötet und kann nicht vom Benutzer aufgerüstet werden.
Zubehör und Garantie
In der Verpackung befinden sich außer dem Netzteil und den Unterlagen keine weiteren Extras. Beim Kauf in den USA gilt die standardmäßige einjährige beschränkte Herstellergarantie.
Eingabegeräte
Tastatur
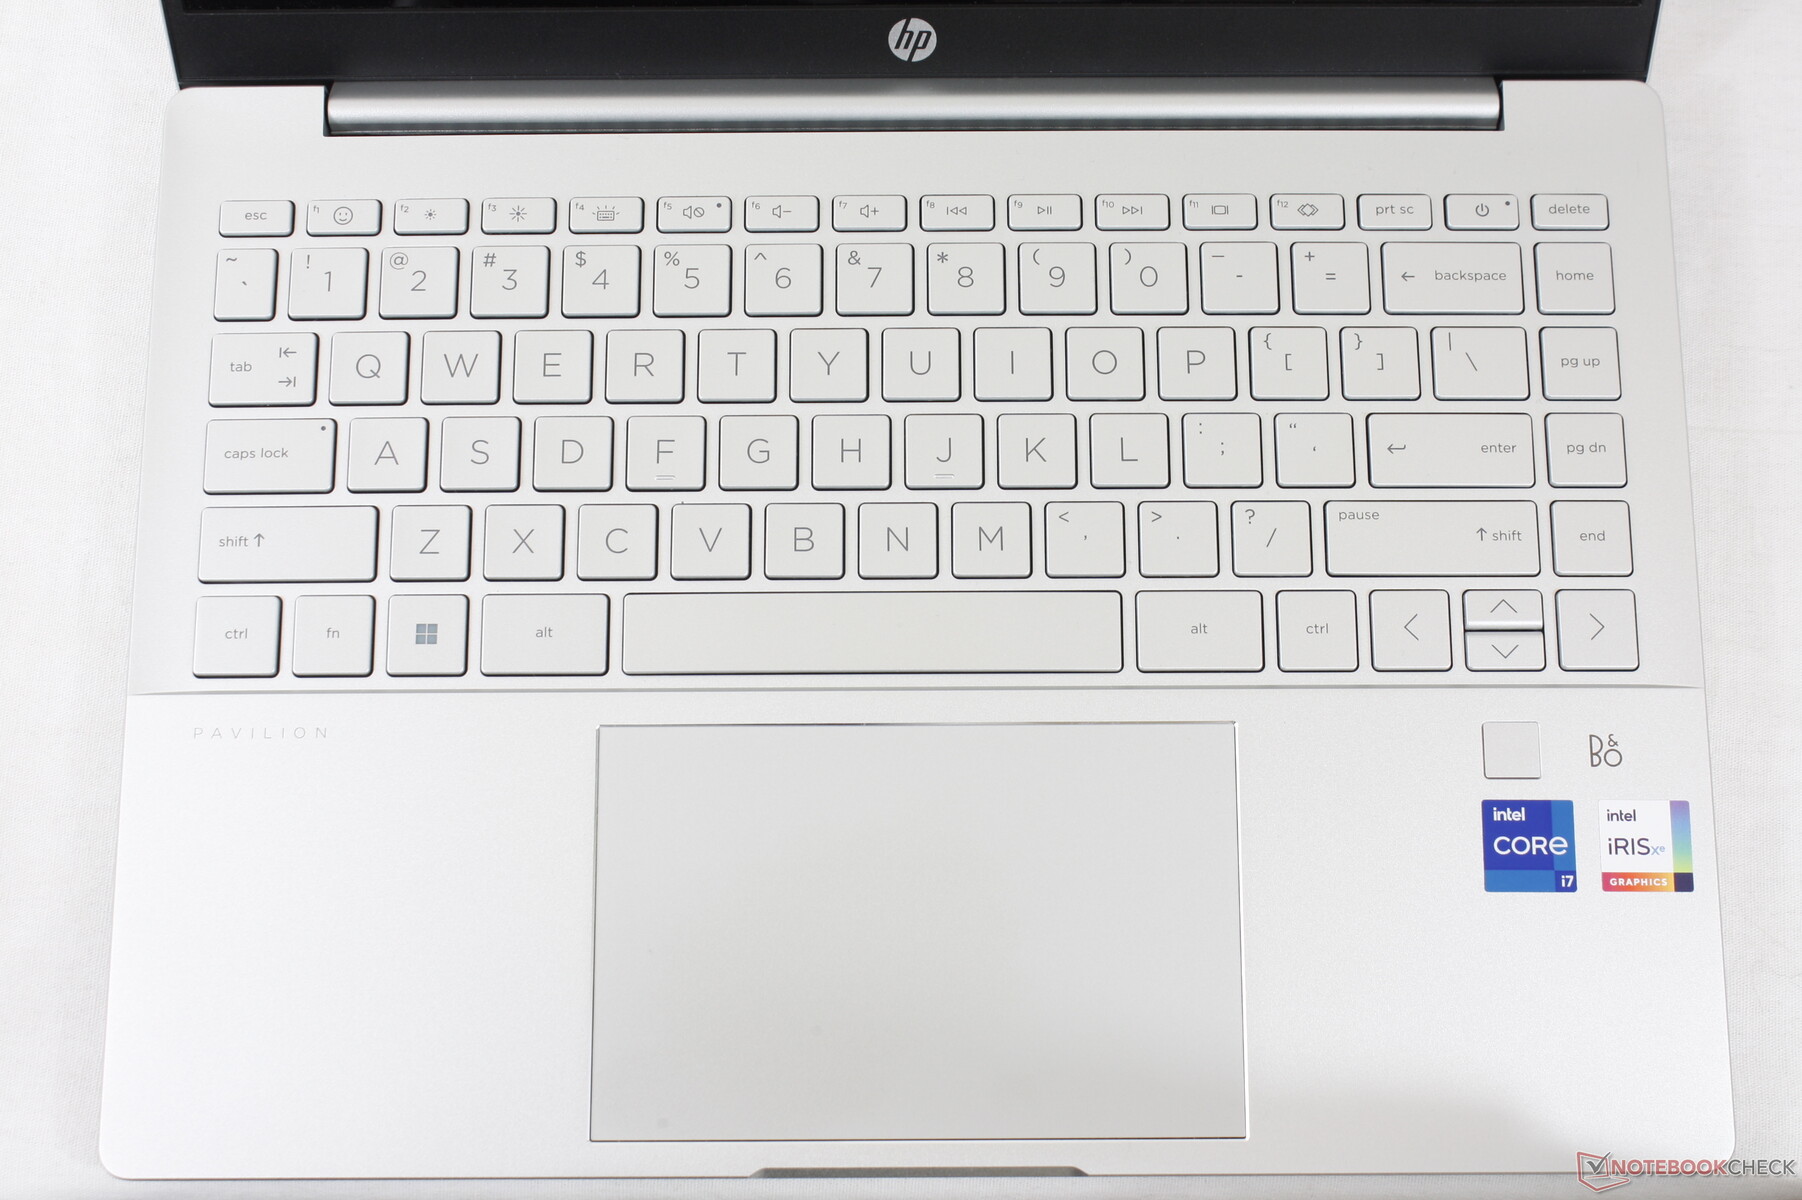
Sowohl die Tastatur als auch das Clickpad bleiben identisch mit dem regulären Pavilion 14 – was jedoch kein Grund zum Murren ist, da wir nach wie vor von der Tastatur des Pavilion 14 begeistert sind. Im Vergleich zu den Tastaturen des Asus Vivobook oder des Lenovo IdeaPad ist die Tastatur des Pavilion erstaunlich knackig und hat einen angenehmen Hub. Unser Hauptkritikpunkt ist nach wie vor die weiße Hintergrundbeleuchtung, die sich schlecht von den weißen Tastenkappen abhebt. Wir vermuten aber, dass dies bei den vier anderen Farboptionen kein Problem sein sollte.
Touchpad
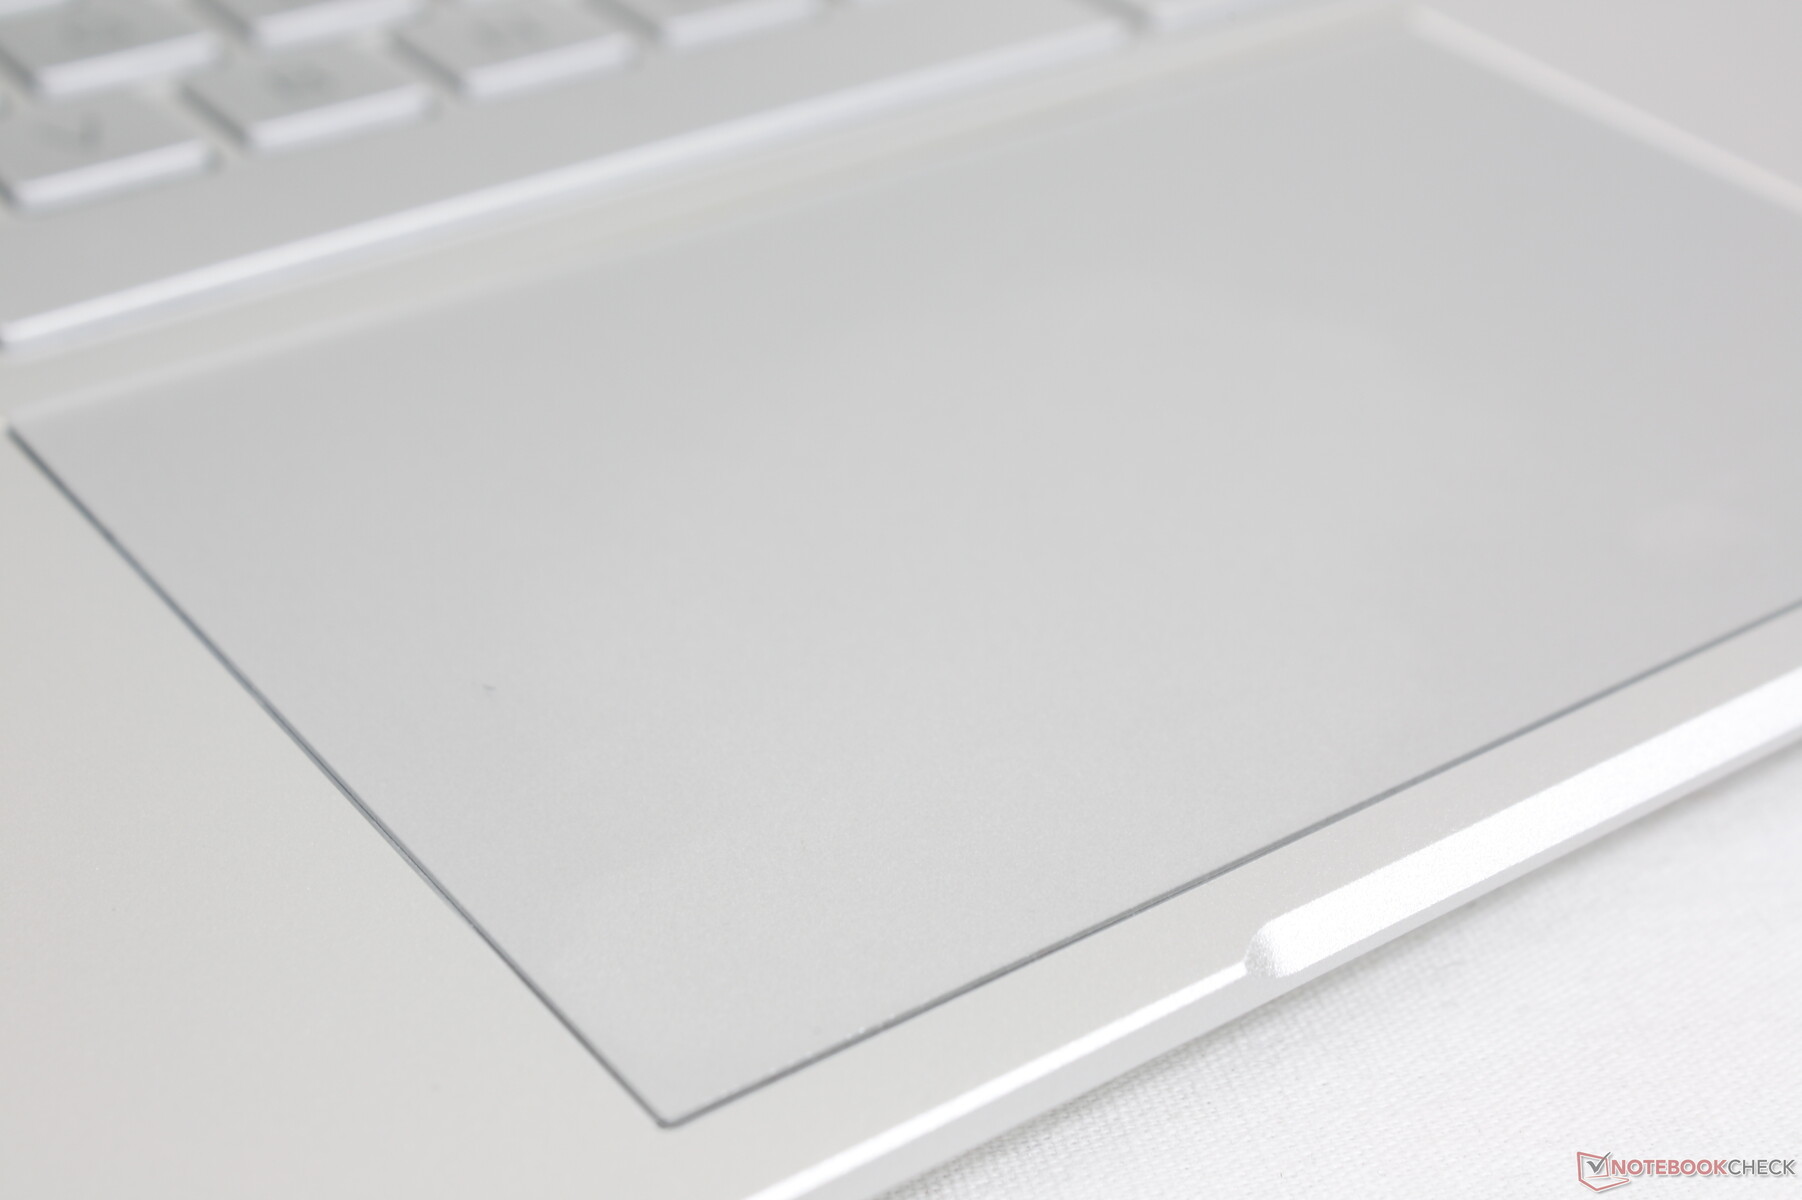
Das Clickpad ist mit 12,5 x 8 cm groß im Vergleich zu den bereits geräumigen 12 x 7,5 cm des konkurrierenden Yoga Slim 7i Pro. Die Cursorsteuerung fühlt sich dadurch großzügig an und ist dank der 90-Hz-Bildwiederholrate des Displays auch sehr flüssig. Die Rückmeldung beim Klicken ist zufriedenstellend, wenn auch leicht schwammig und etwas zu laut. Trotzdem ist es eines der komfortableren Clickpads, die wir auf einem Laptop der Pavilion-Klasse verwendet haben.


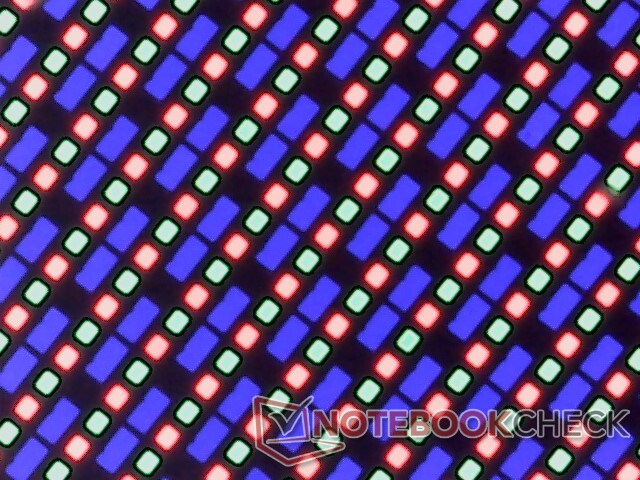
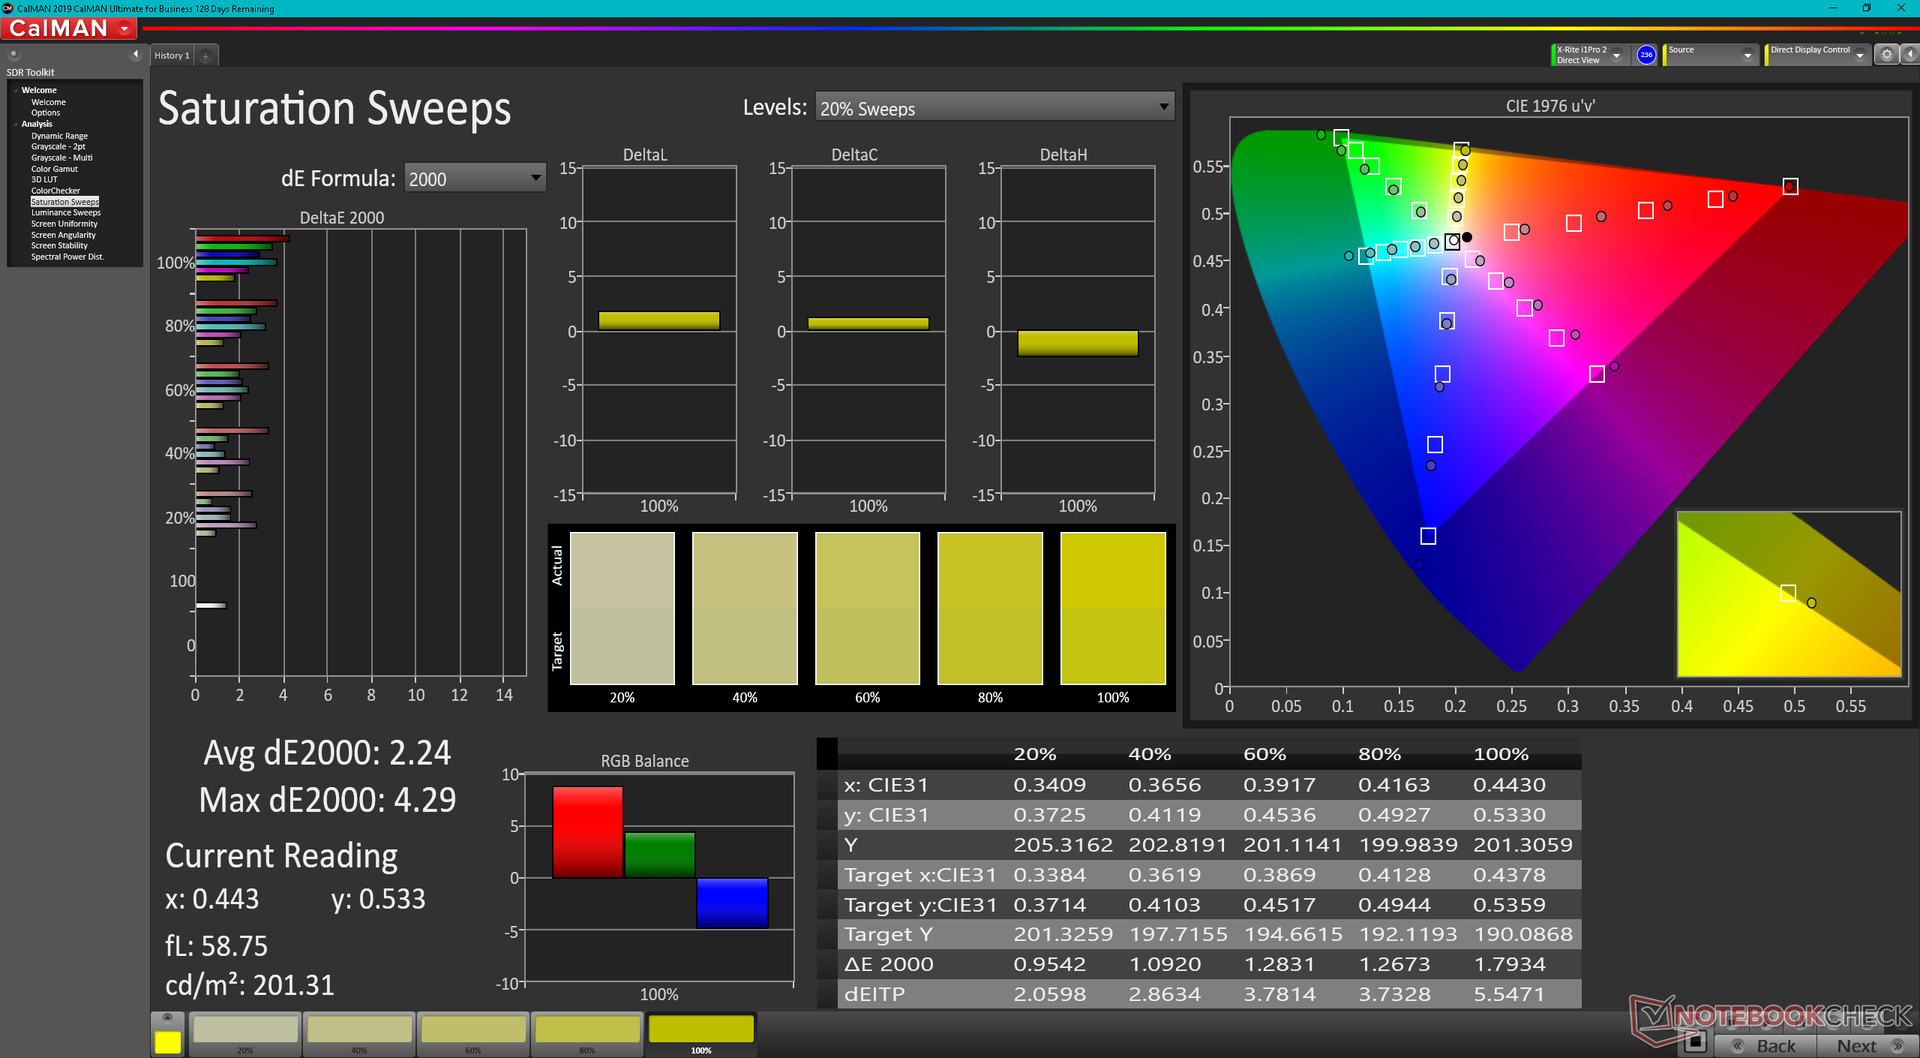
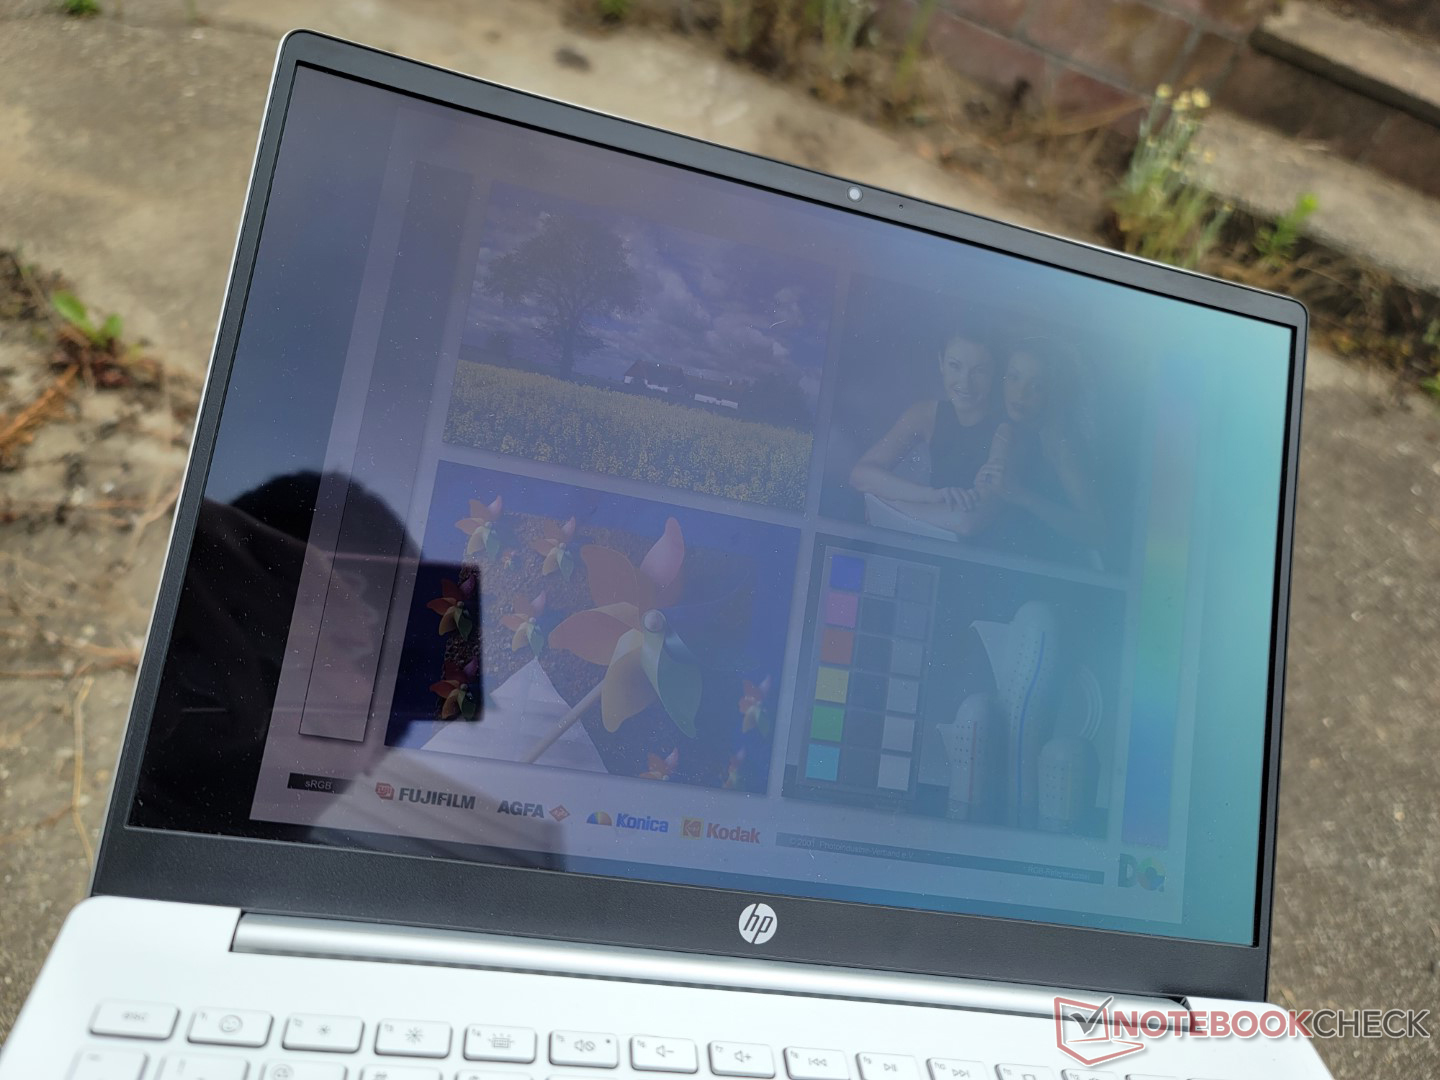
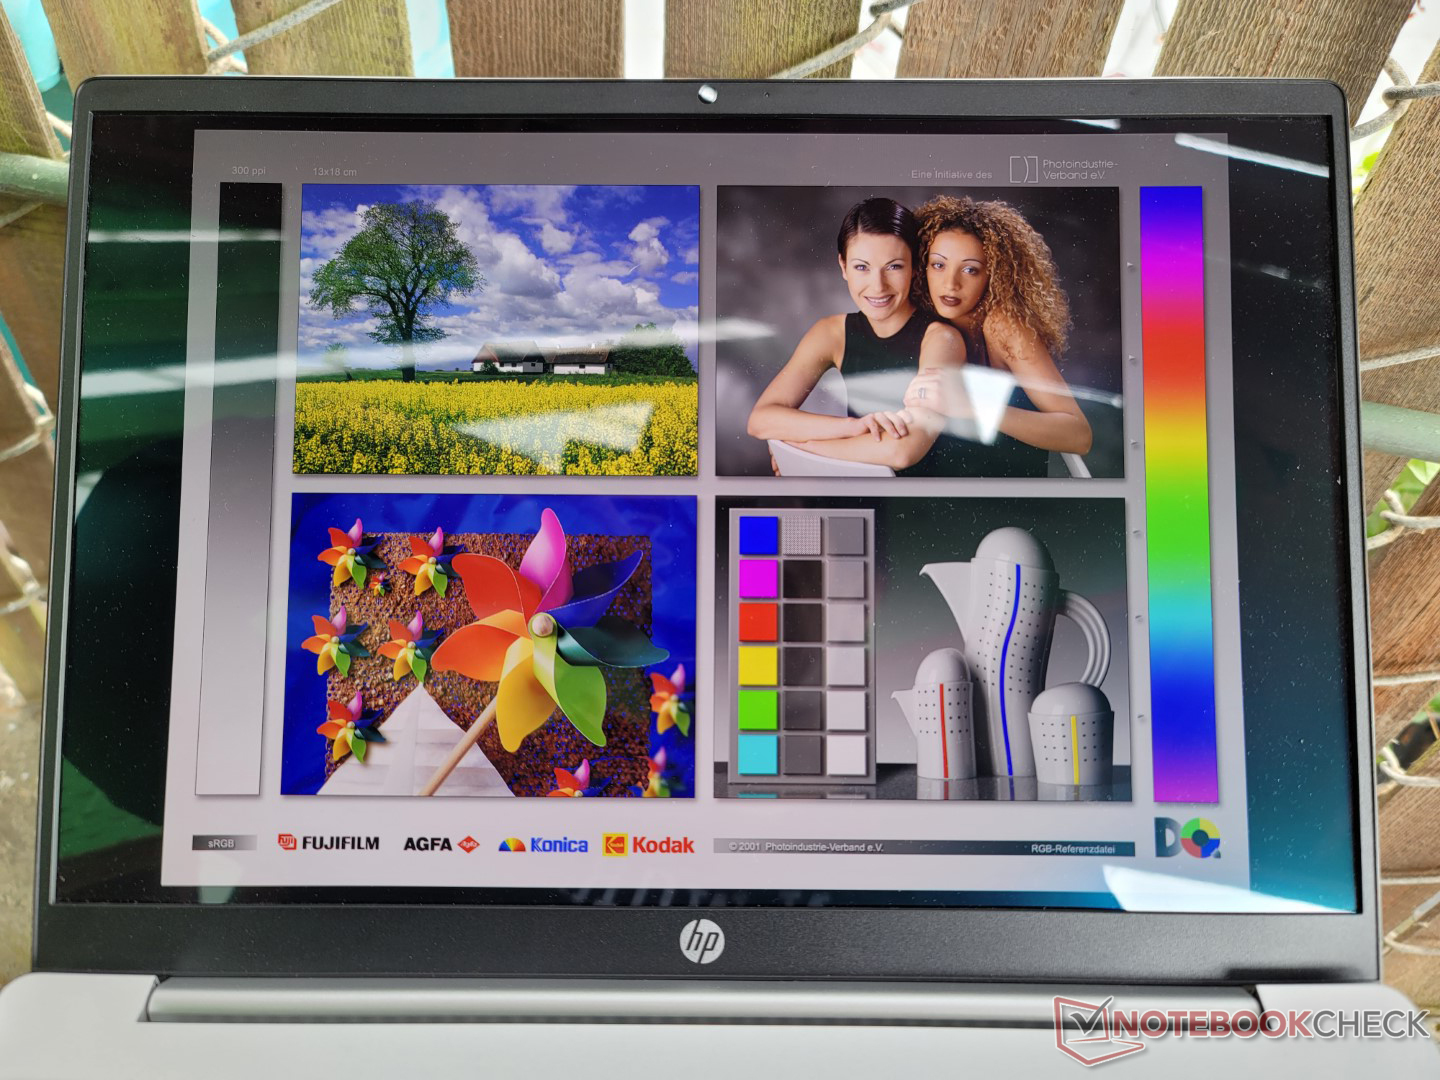
Display – 90 Hz, OLED, 1800p, 100 % DCI-P3
Der Pavilion Plus 14 verwendet das gleiche oder ein ähnliches 1800p-Samsung-OLED-Panel wie das Vivobook Pro 14. Somit bieten beide Laptops ein nahezu identisches Anzeigeerlebnis. Wir müssen jedoch einräumen, dass das Asus Notebook mehr OLED-Pflegefunktionen enthält, die beim HP nicht zu finden sind. Besonders versiertere Benutzer werden Funktionen wie z. B. die Blaulichteinstellungen, Schieberegler zur Flimmerreduzierung, Funktionen zur Verringerung des Einbrennens und die einfacheren Farbraumänderungen vermissen. Wenn man einmal die 90 Hz Bildwiederholfrequenz erlebt hat, fällt es schwer, zu 60 Hz OLED zurückzukehren.
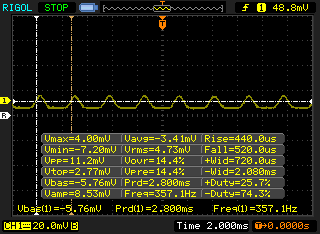
Es ist erwähnenswert, dass das OLED-Panel bei allen Helligkeitseinstellungen einschließlich der maximalen Helligkeit ein Flackern von 357 Hz aufweist. Dies scheint bei vielen der neueren OLED-Panels mit nativen Bildwiederholfrequenzen von über 60 Hz der Fall zu sein. Wenn Sie empfindliche Augen haben, die durch Bildschirmflackern gestört werden, sollten Sie solche OLED-Laptops nicht für längere Zeit verwenden.
| |||||||||||||||||||||||||
Ausleuchtung: 98 %
Helligkeit Akku: 388.3 cd/m²
Kontrast: ∞:1 (Schwarzwert: 0 cd/m²)
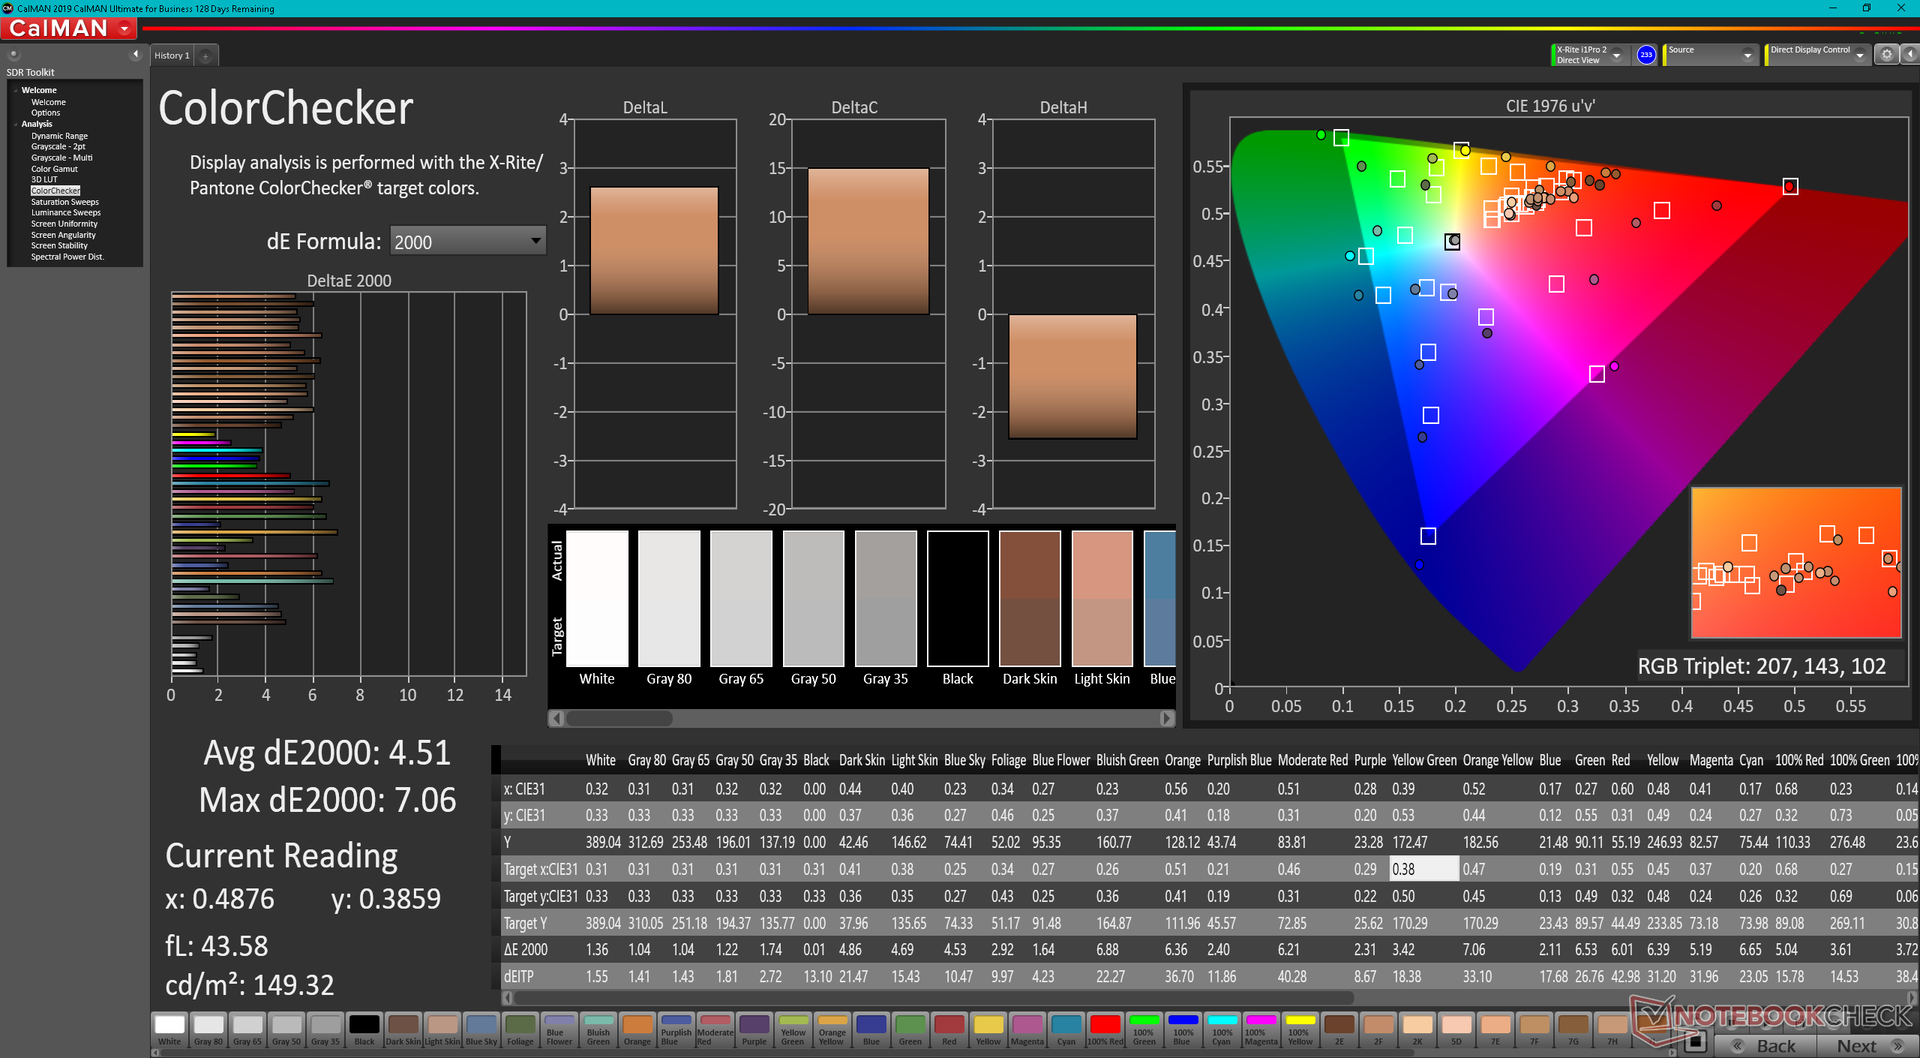
ΔE Color 4.51 | 0.5-29.43 Ø5
ΔE Greyscale 1.2 | 0.57-98 Ø5.3
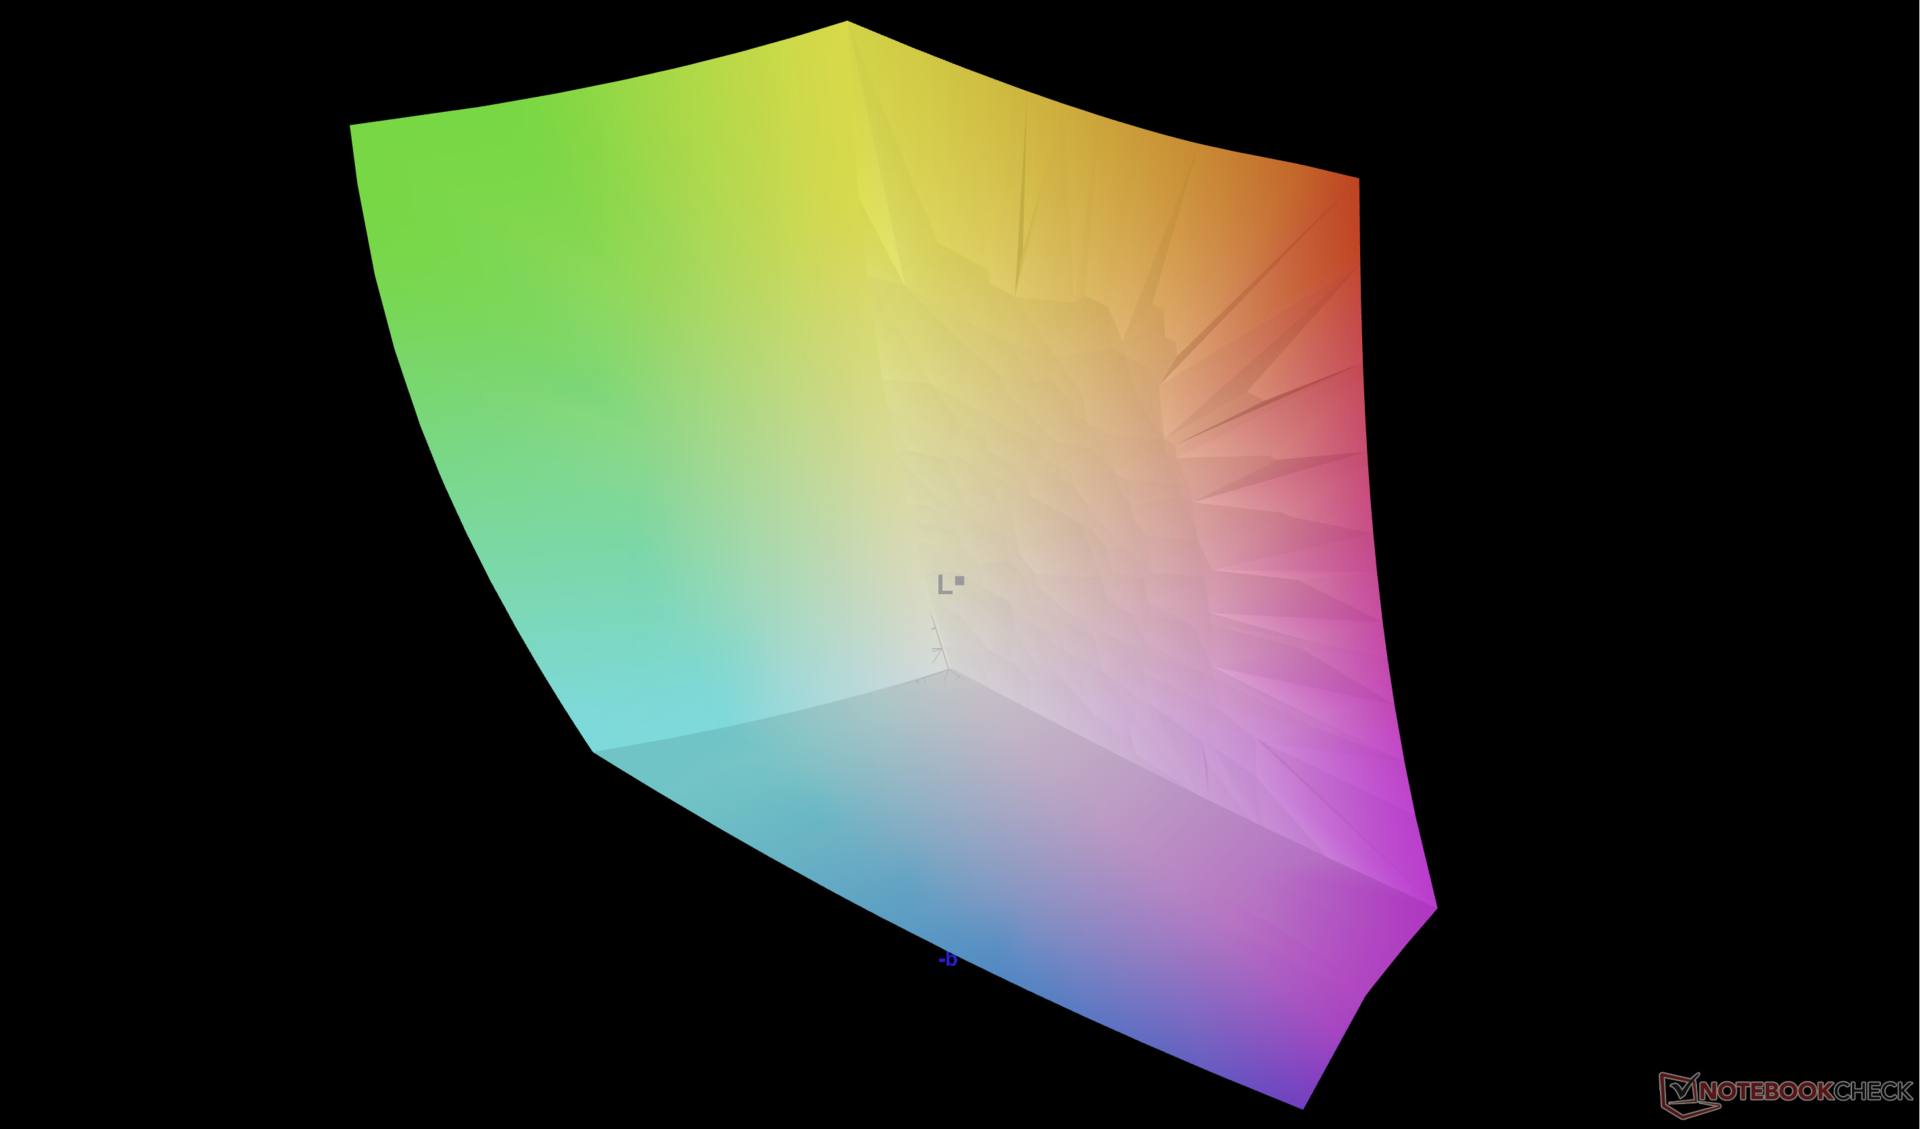
98.9% AdobeRGB 1998 (Argyll 2.2.0 3D)
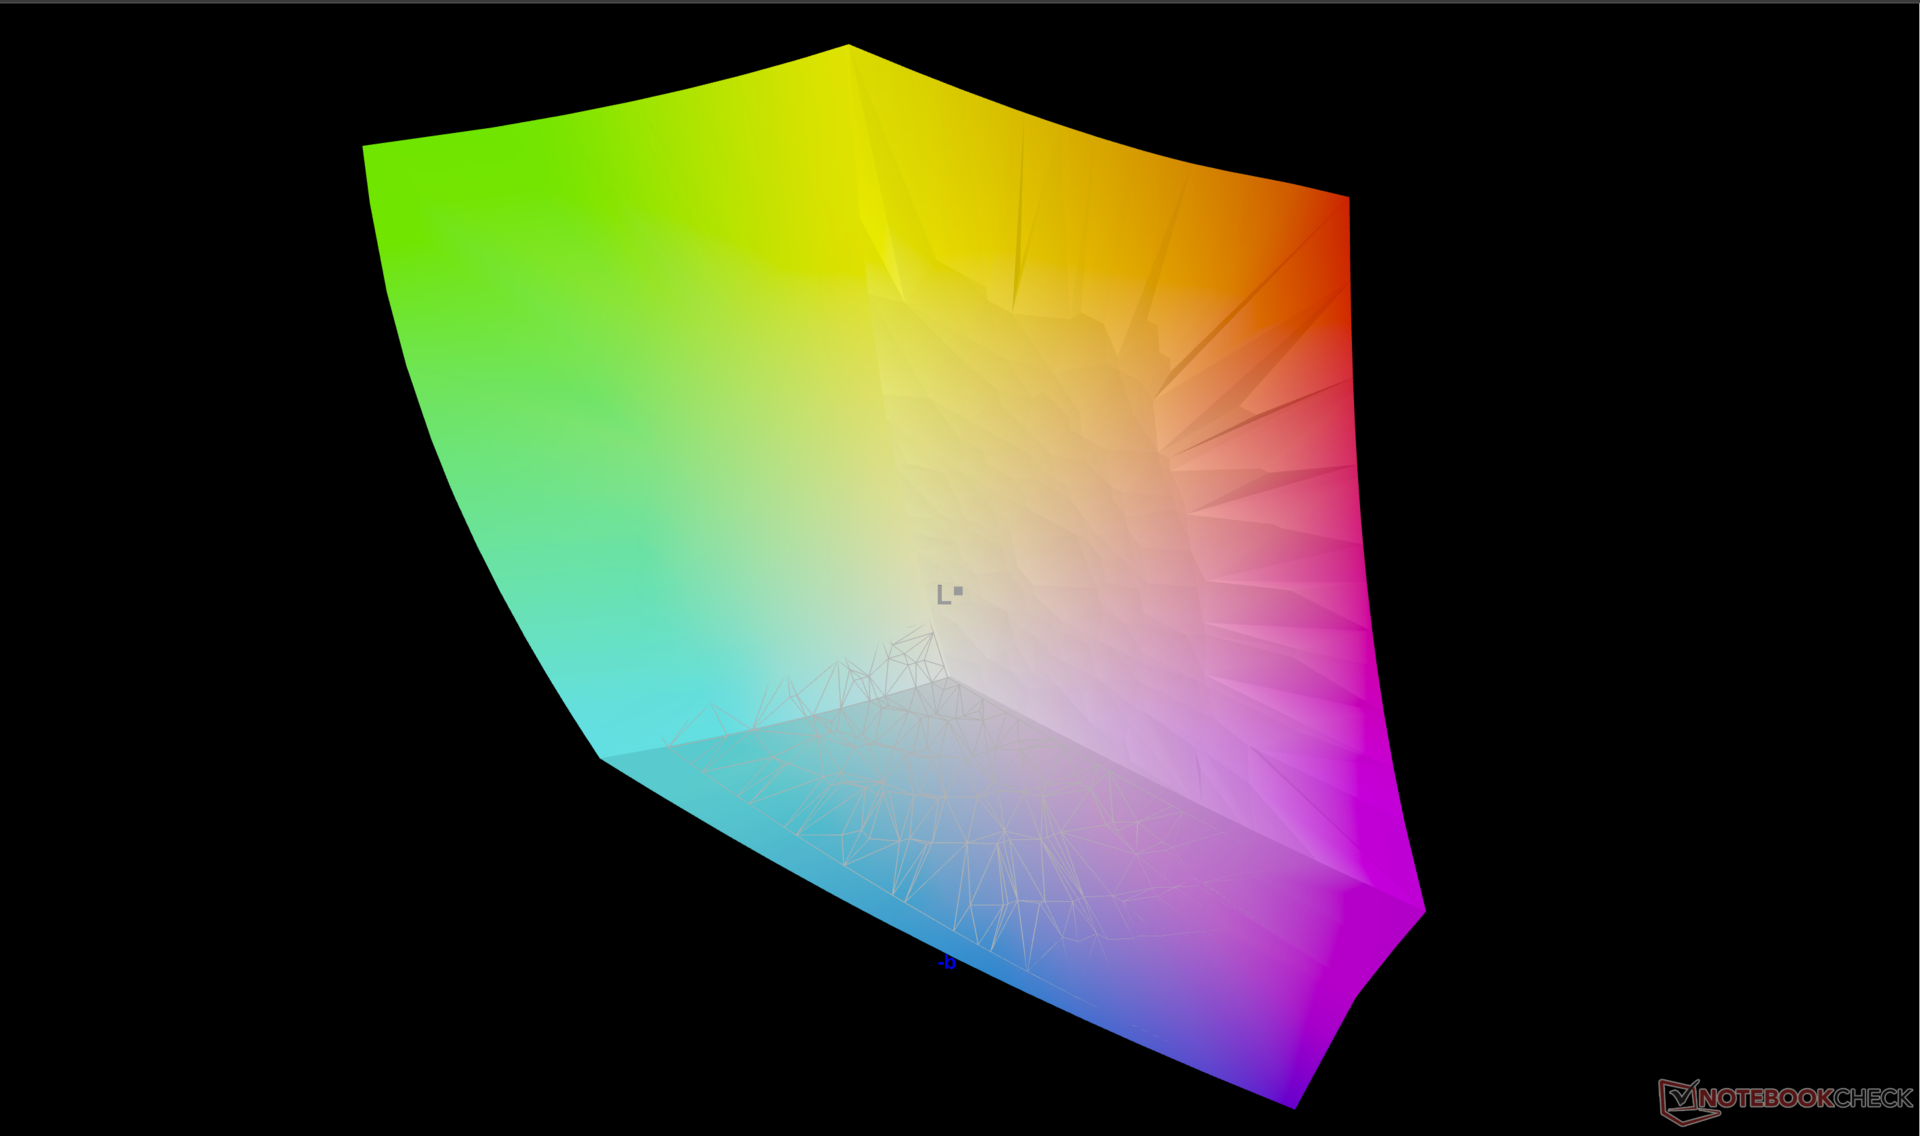
100% sRGB (Argyll 2.2.0 3D)
99.9% Display P3 (Argyll 2.2.0 3D)
Gamma: 2.18
| HP Pavilion Plus 14 eh0097nr Samsung SDC4170, OLED, 2880x1800, 14.00 | Asus Vivobook Pro 14 M3401QC-KM007T SAMSUNG: SDC4171, OLED, 2880x1800, 14.00 | Dell Inspiron 14 7420 2-in-1 BOE NV14N42, IPS, 1920x1200, 14.00 | Lenovo Yoga Slim 7i Pro 14IAP G7 LEN140WQ+, IPS, 2880x1800, 14.00 | MSI Modern 14 B11SB-085 BOE CQ NV140FHM-N4V, IPS, 1920x1080, 14.00 | HP Pavilion 14-dv0357ng LGD0619, IPS, 1920x1080, 14.00 | |
|---|---|---|---|---|---|---|
| Display | -1% | -55% | -14% | -53% | -27% | |
| Display P3 Coverage | 99.9 | 99.41 0% | 38.6 -61% | 77.7 -22% | 39.9 -60% | 62 -38% |
| sRGB Coverage | 100 | 99.94 0% | 56.2 -44% | 100 0% | 58.8 -41% | 92 -8% |
| AdobeRGB 1998 Coverage | 98.9 | 94.79 -4% | 39.9 -60% | 78.4 -21% | 41.2 -58% | 63 -36% |
| Response Times | -88% | -1777% | -1995% | -1033% | -2049% | |
| Response Time Grey 50% / Grey 80% * | 1.2 ? | 3 ? -150% | 27.2 ? -2167% | 35.2 ? -2833% | 25 ? -1983% | 37 ? -2983% |
| Response Time Black / White * | 1.4 ? | 3 ? -114% | 20.8 ? -1386% | 17.6 ? -1157% | 16 ? -1043% | 17 ? -1114% |
| PWM Frequency | 357 ? | 360 1% | 92 ? -74% | |||
| Bildschirm | 20% | -108% | -17% | -40% | -58% | |
| Helligkeit Bildmitte | 388.3 | 384 -1% | 269.4 -31% | 469 21% | 347 -11% | 387 0% |
| Brightness | 391 | 385 -2% | 260 -34% | 445 14% | 311 -20% | 359 -8% |
| Brightness Distribution | 98 | 98 0% | 89 -9% | 90 -8% | 81 -17% | 84 -14% |
| Schwarzwert * | 0.07 | 0.41 | 0.12 | 0.55 | ||
| Delta E Colorchecker * | 4.51 | 1.75 61% | 6.53 -45% | 3.5 22% | 5.05 -12% | 4.04 10% |
| Colorchecker dE 2000 max. * | 7.06 | 3.41 52% | 19.76 -180% | 5.3 25% | 16.98 -141% | 8.28 -17% |
| Delta E Graustufen * | 1.2 | 1.06 12% | 5.4 -350% | 3.3 -175% | 1.63 -36% | 5 -317% |
| Gamma | 2.18 101% | 2.39 92% | 2.05 107% | 1.97 112% | 2.3 96% | 2.62 84% |
| CCT | 6290 103% | 6440 101% | 6007 108% | 6512 100% | 6666 98% | 7123 91% |
| Kontrast | 5486 | 657 | 2892 | 704 | ||
| Colorchecker dE 2000 calibrated * | 2.32 | 3.13 | 1.7 | 1 | ||
| Farbraum (Prozent von AdobeRGB 1998) | 38 | |||||
| Color Space (Percent of sRGB) | 58 | |||||
| Durchschnitt gesamt (Programm / Settings) | -23% /
-12% | -647% /
-397% | -675% /
-376% | -375% /
-291% | -711% /
-411% |
* ... kleinere Werte sind besser
Wir konnten eine 100-prozentige P3-Farbabdeckung aufzeichnen und damit HPs Behauptung der vollen DCI-P3-Farben bestätigen. Die meisten IPS-Displays in dieser Preisklasse versprechen im Vergleich dazu nur eine volle sRGB-Abdeckung, wie z. B. im Yoga Slim 7i Pro 14. Das OLED-Panel auf dem Pavillon ist nicht werkseitig kalibriert, was jedoch wahrscheinlich der Kosteneinsparung dient.

Reaktionszeiten (Response Times) des Displays
| ↔ Reaktionszeiten Schwarz zu Weiß | ||
|---|---|---|
| 1.4 ms ... steigend ↗ und fallend ↘ kombiniert | ↗ 0.6 ms steigend |  |
| ↘ 0.8 ms fallend | ||
| Die gemessenen Reaktionszeiten sind sehr kurz, wodurch sich der Bildschirm auch für schnelle 3D Spiele eignen sollte. Im Vergleich rangierten die bei uns getesteten Geräte von 0.1 (Minimum) zu 240 (Maximum) ms. » 4 % aller Screens waren schneller als der getestete. Daher sind die gemessenen Reaktionszeiten besser als der Durchschnitt aller vermessenen Geräte (21.5 ms). | ||
| ↔ Reaktionszeiten 50% Grau zu 80% Grau | ||
| 1.2 ms ... steigend ↗ und fallend ↘ kombiniert | ↗ 0.6 ms steigend | 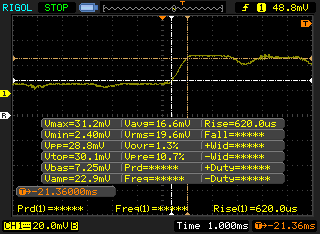 |
| ↘ 0.6 ms fallend | ||
| Die gemessenen Reaktionszeiten sind sehr kurz, wodurch sich der Bildschirm auch für schnelle 3D Spiele eignen sollte. Im Vergleich rangierten die bei uns getesteten Geräte von 0.2 (Minimum) zu 636 (Maximum) ms. » 2 % aller Screens waren schneller als der getestete. Daher sind die gemessenen Reaktionszeiten besser als der Durchschnitt aller vermessenen Geräte (33.7 ms). | ||
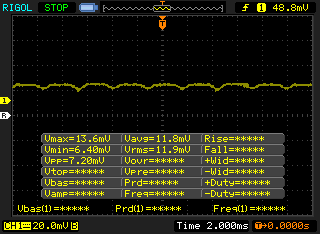
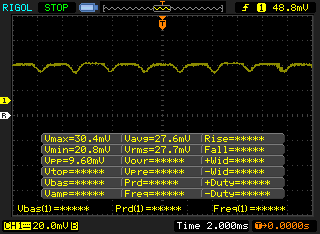
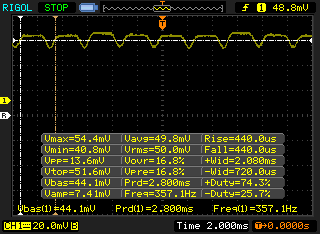
Bildschirm-Flackern / PWM (Pulse-Width Modulation)
| Flackern / PWM festgestellt | 357 Hz | ≤ 100 % Helligkeit | 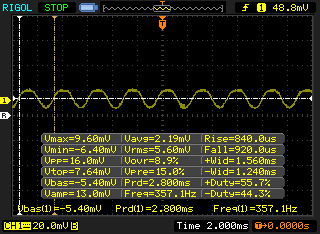 |
Das Display flackert mit 357 Hz (im schlimmsten Fall, eventuell durch Pulsweitenmodulation PWM) bei einer eingestellten Helligkeit von 100 % und darunter. Darüber sollte es zu keinem Flackern kommen. Die Frequenz von 357 Hz ist relativ hoch und sollte daher auch bei den meisten Personen zu keinen Problemen führen. Empfindliche User sollen laut Berichten aber sogar noch bei 500 Hz und darüber ein Flackern wahrnehmen. Im Vergleich: 53 % aller getesteten Geräte nutzten kein PWM um die Helligkeit zu reduzieren. Wenn PWM eingesetzt wurde, dann bei einer Frequenz von durchschnittlich 17903 (Minimum 5, Maximum 3846000) Hz. | |||

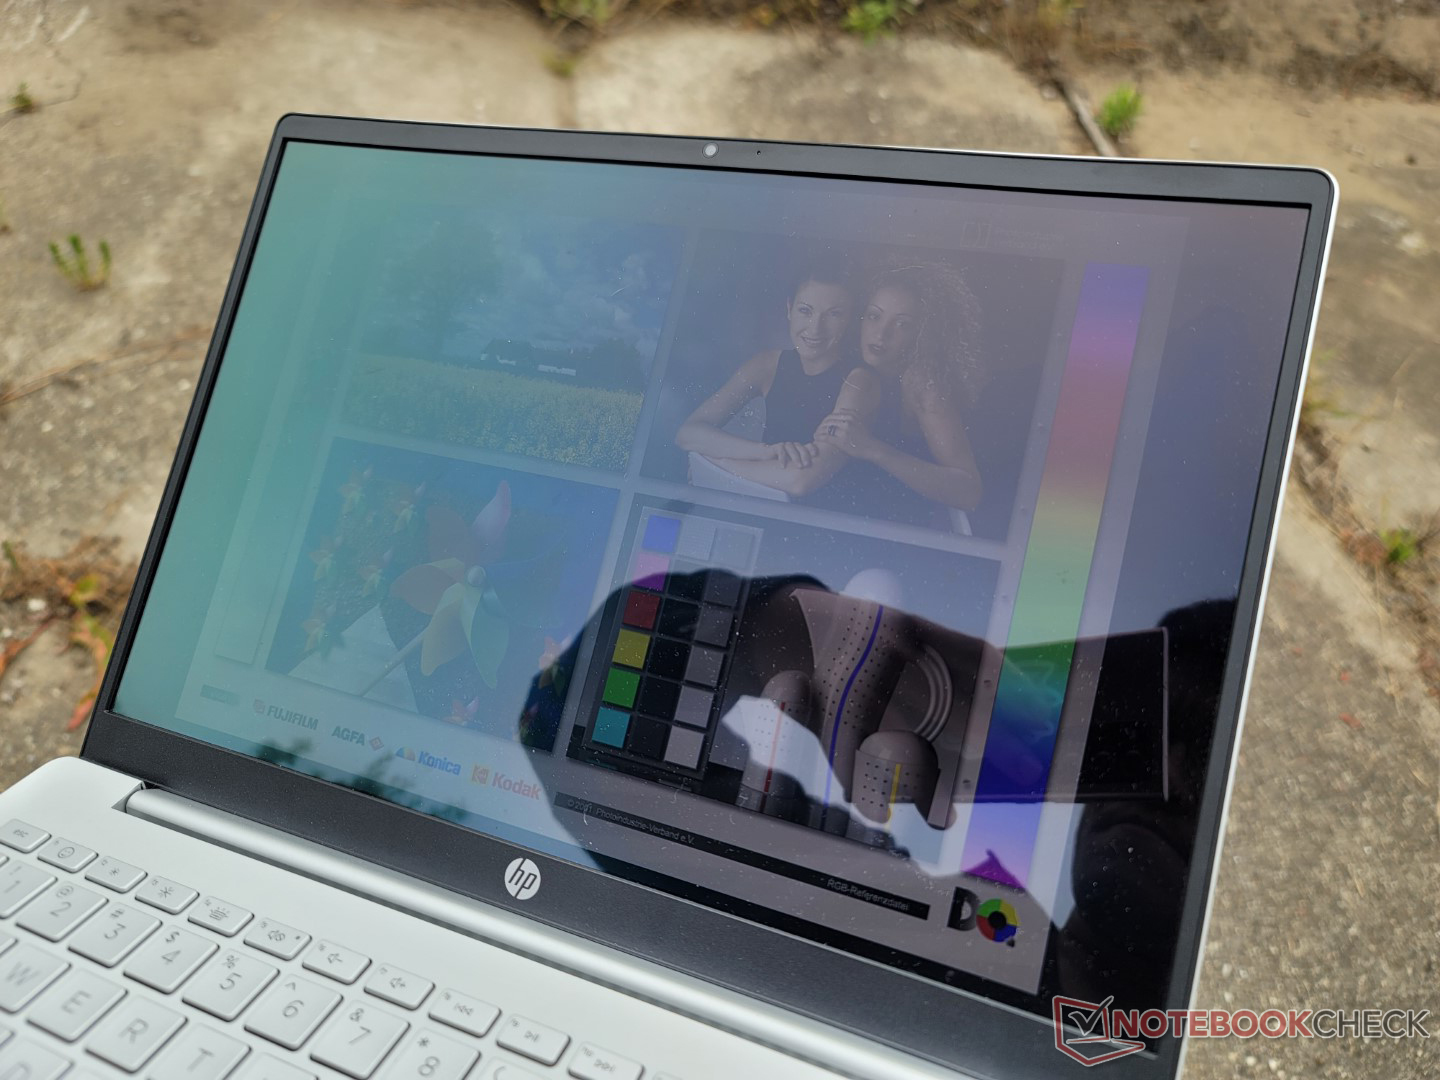
Der hohe Schwarzwert des OLED-Displays macht die Verwendung im Freien im Vergleich zum IPS-Display bei gleicher Helligkeitseinstellung angenehmer. Dennoch kommt es auf unserem glänzenden OLED-Panel unter den meisten Außenbedingungen immer noch zu Blendeffekten. Die maximale Helligkeit liegt ansonsten über dem Durchschnitt für einen Pavilion und ist vergleichbar mit dem Asus Vivobook Pro 14 oder dem Yoga Slim 7i Pro 14.

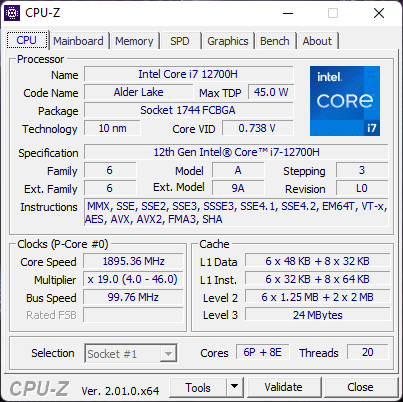
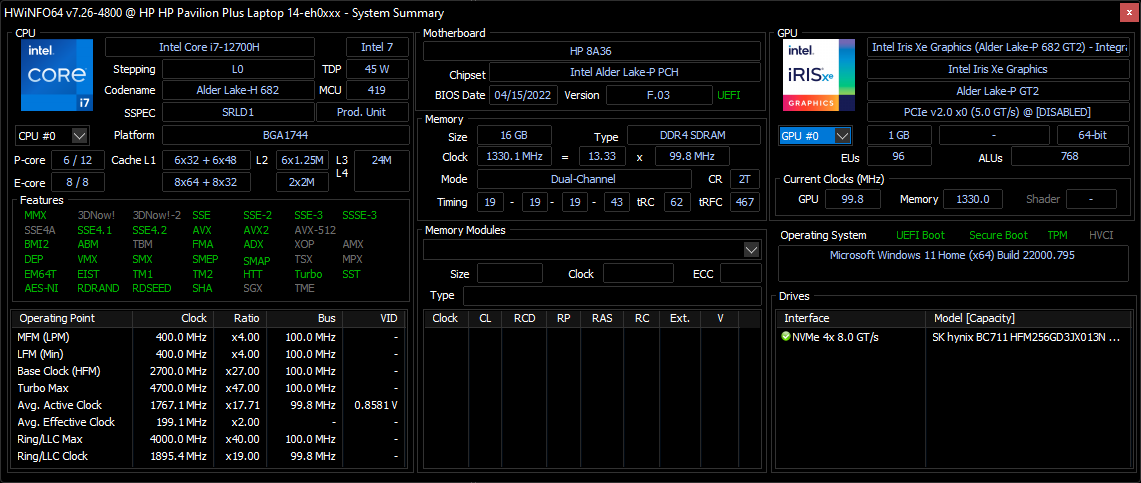
Leistung – Dieselbe CPU wie beim Dell XPS 17 9720

Testbedingungen
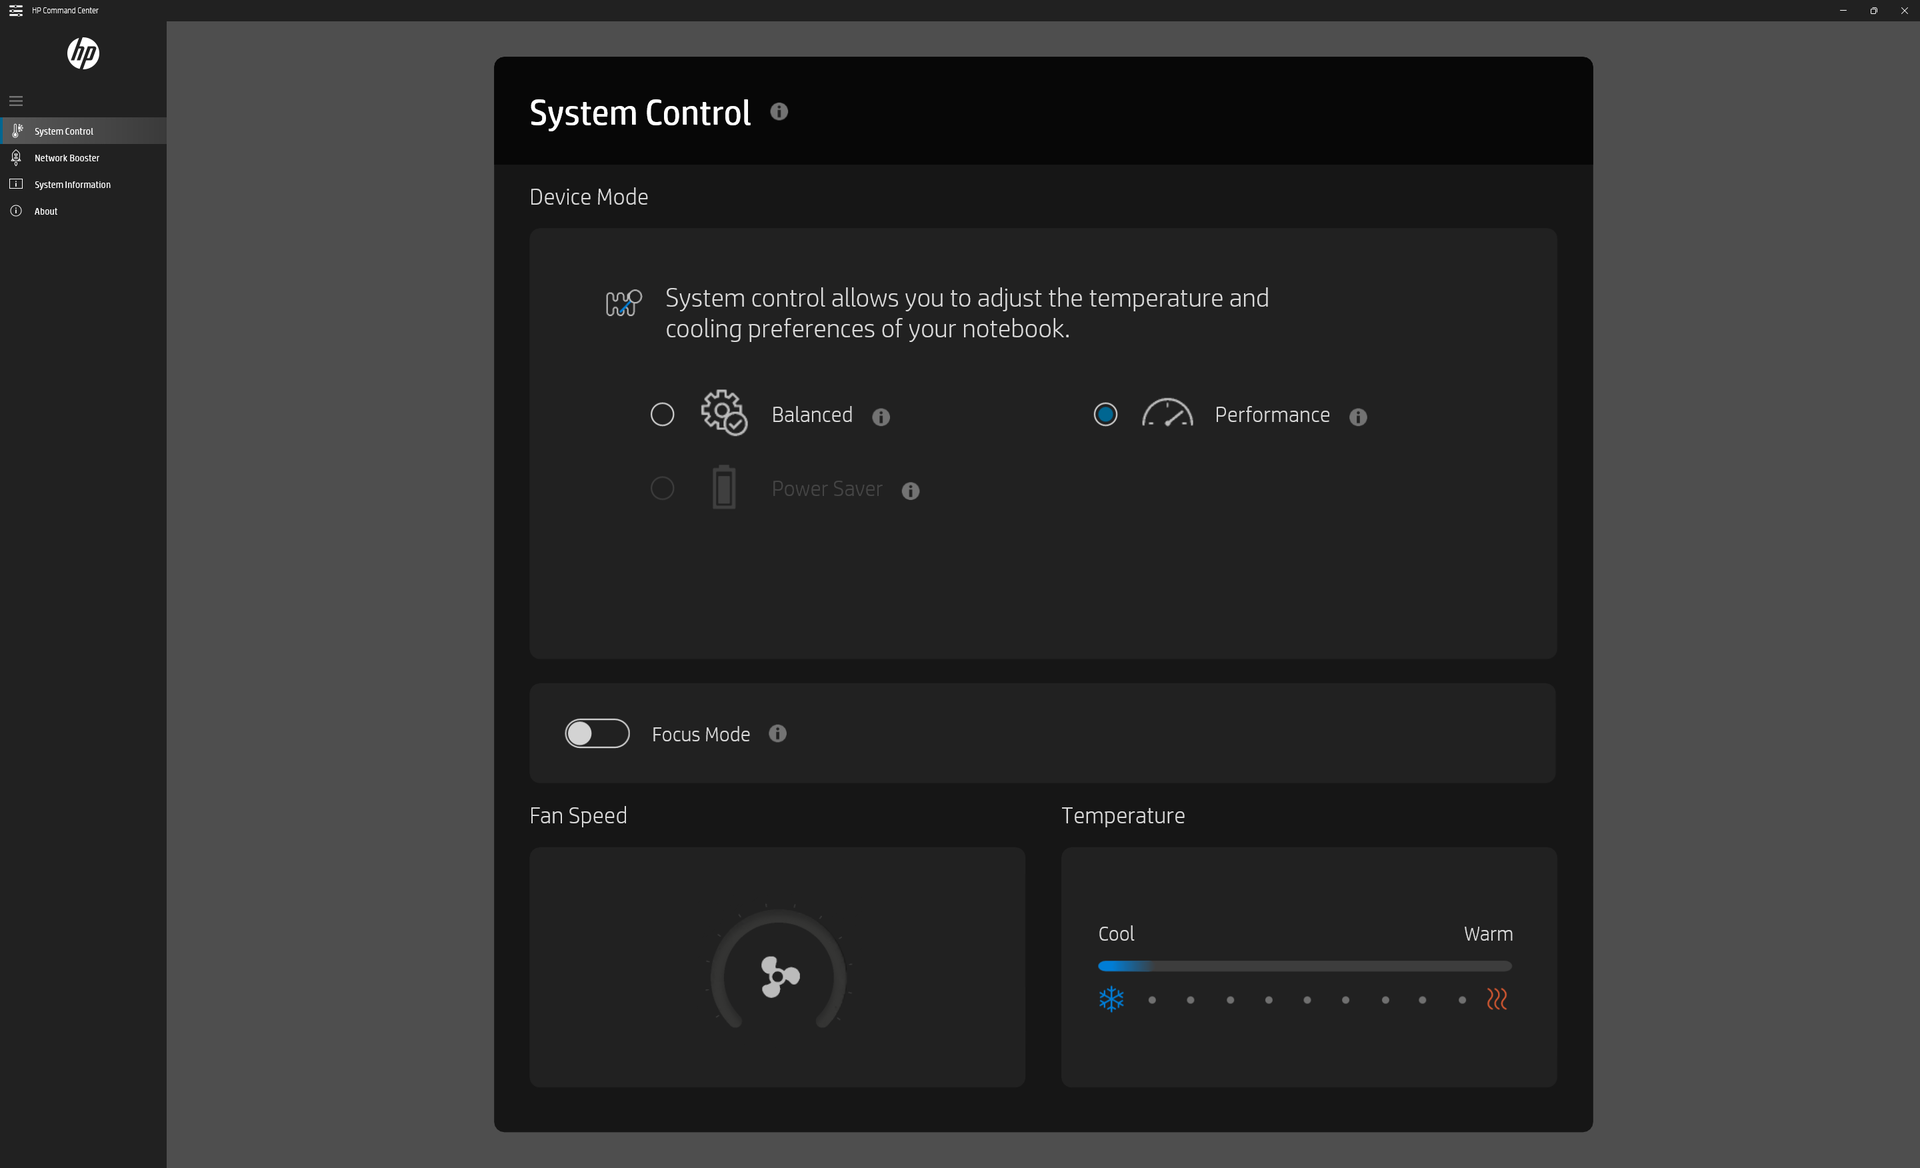
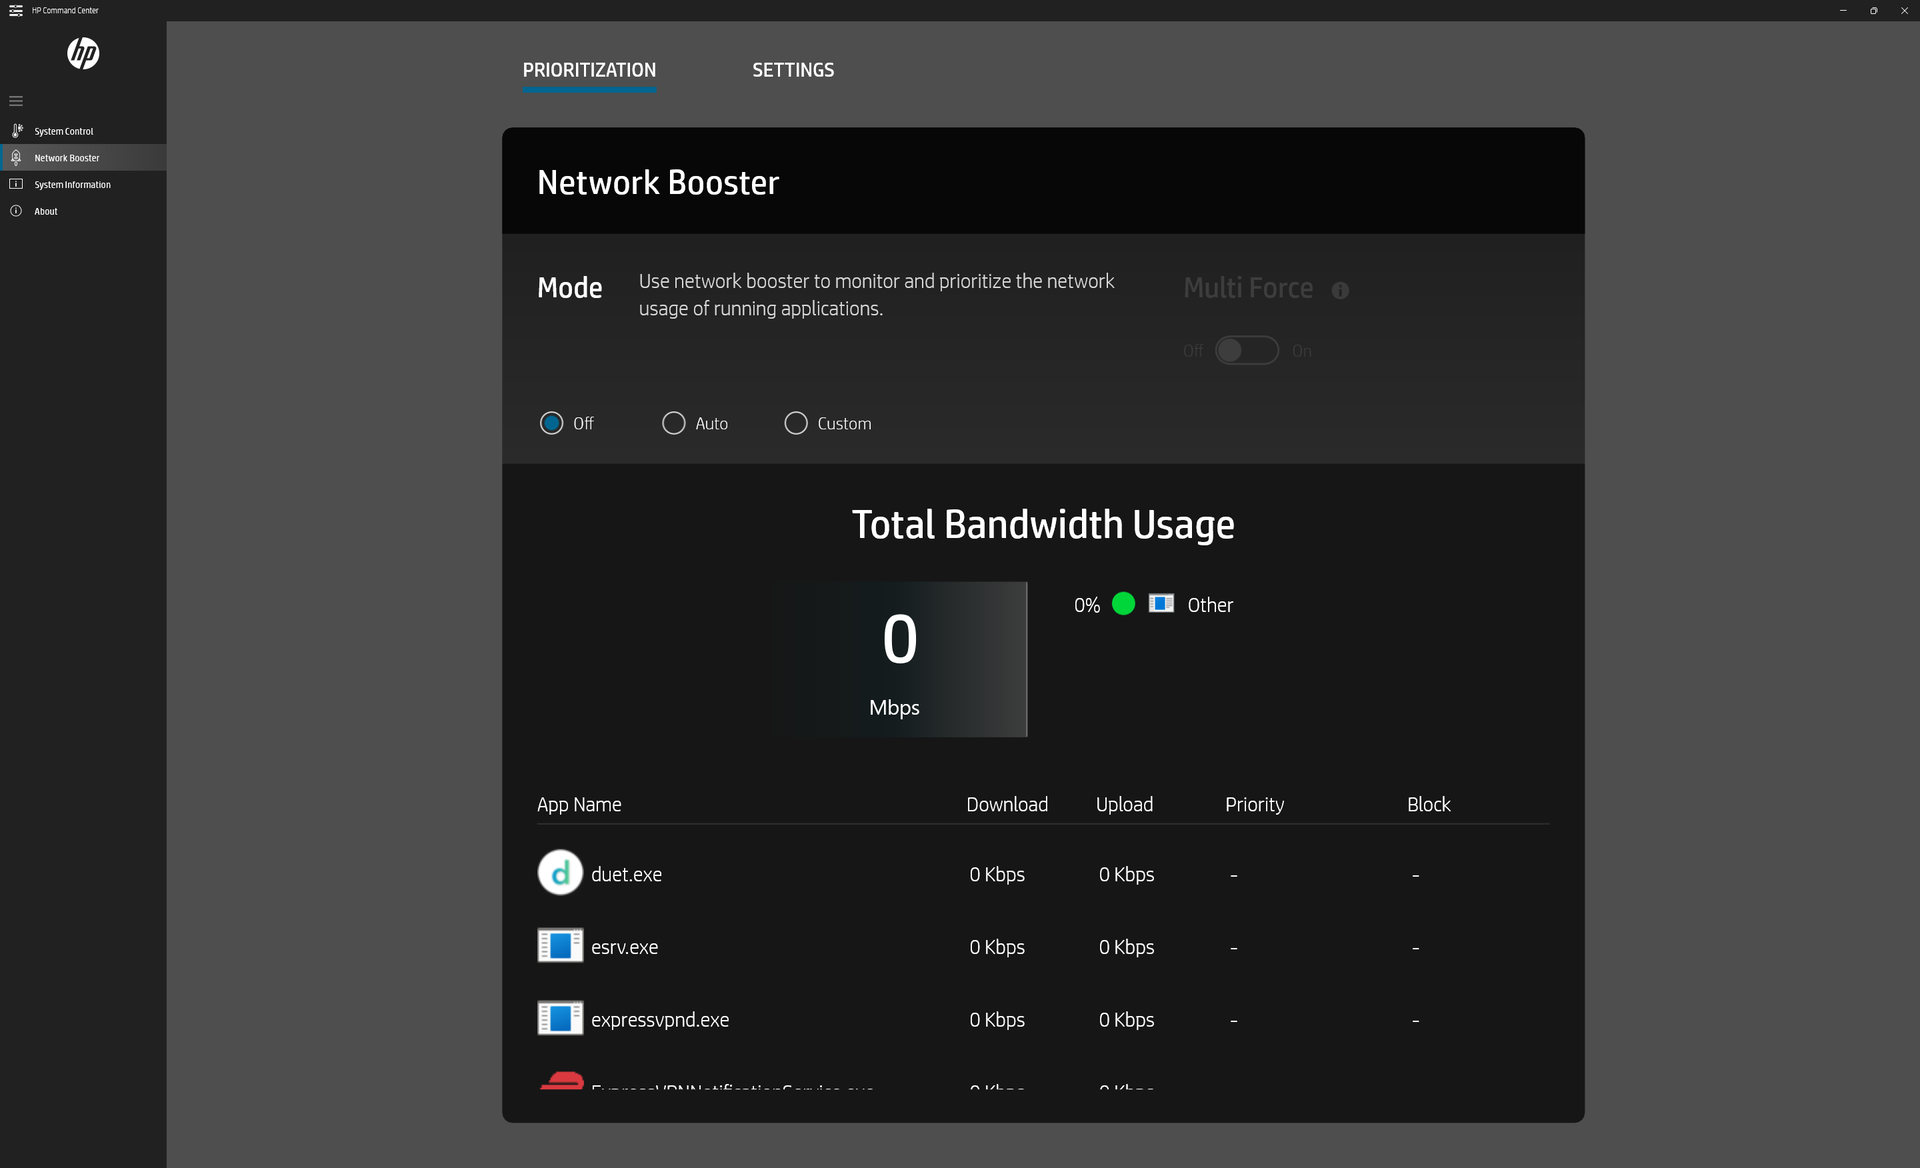
Wir stellen unser Gerät über Windows und die HP Command Center-Software in den Performance-Modus, bevor wir die unten aufgeführten Benchmarks ausführen. Wir empfehlen Benutzern, sich mit dem HP Command Center vertraut zu machen, da hier sowohl die Leistungs- als auch die Netzwerkeinstellungen umgeschaltet werden.
Prozessor
Die rohe Multi-Thread-Leistung ist etwa 20 Prozent langsamer als wir uns von einem Laptop mit Core i7-12700H erwarten würden. Das Dell XPS 17 9720 beispielsweise ist mit der gleichen Core i7-12700H-CPU ausgestattet und bietet dennoch eine 40 bis 45 Prozent schnellere Multi-Thread-Leistung, selbst wenn man die Drosselung berücksichtigt. Der Unterschied ist so groß, dass selbst der energieeffizientere Core i5-1240P nur etwa 10 bis 15 Prozent langsamer ist als unser mit einem Core i7 der H-Serie ausgestatteter HP. Er ist ein schneller Laptop für seine Größe, hätte aber angesichts der Leistung anderer Laptops mit dem gleichen Prozessor sicherlich noch schneller sein können.
Benutzer können auf Wunsch den langsameren Core i5-1240P oder Core i7-1255U konfigurieren. Letzterer ist die einzige SKU mit einer diskreten GeForce RTX 2050 Option, allerdings auf Kosten einer ca. 40 Prozent langsameren Multi-Thread Leistung im Vergleich zu unserem Core i7-12700H. Die Nvidia-Option ist bei den Core-P- oder Core-H-Konfigurationen wahrscheinlich aufgrund von thermischen Einschränkungen nicht verfügbar.
Die Ausführung von CineBench R15 xT in einer Schleife zeigt einen Leistungsabfall von etwa 10 Prozent nach dem ersten Durchlauf, wie die folgende Grafik zeigt.
Cinebench R15 Multi Loop
Cinebench R23: Multi Core | Single Core
Cinebench R15: CPU Multi 64Bit | CPU Single 64Bit
Blender: v2.79 BMW27 CPU
7-Zip 18.03: 7z b 4 | 7z b 4 -mmt1
Geekbench 5.5: Multi-Core | Single-Core
HWBOT x265 Benchmark v2.2: 4k Preset
LibreOffice : 20 Documents To PDF
R Benchmark 2.5: Overall mean
| Cinebench R15 / CPU Single 64Bit | |
| Razer Blade 15 2022 | |
| Durchschnittliche Intel Core i7-12700H (113 - 263, n=64) | |
| Dell Inspiron 14 7420 2-in-1 | |
| Asus VivoBook S 14X S5402Z | |
| MSI Summit E14 Flip Evo A12MT | |
| HP Pavilion Plus 14 eh0097nr | |
| Asus Zenbook S 13 OLED | |
| Lenovo Yoga Slim 7i Pro 14IAP G7 | |
| Asus ZenBook 14X UM5401QA-KN162 | |
| Asus Vivobook Pro 14 M3401QC-KM007T | |
| MSI Modern 14 B11SB-085 | |
| HWBOT x265 Benchmark v2.2 / 4k Preset | |
| Razer Blade 15 2022 | |
| Durchschnittliche Intel Core i7-12700H (4.67 - 21.8, n=63) | |
| HP Pavilion Plus 14 eh0097nr | |
| Asus VivoBook S 14X S5402Z | |
| Asus ZenBook 14X UM5401QA-KN162 | |
| MSI Summit E14 Flip Evo A12MT | |
| Lenovo Yoga Slim 7i Pro 14IAP G7 | |
| Asus Zenbook S 13 OLED | |
| Asus Vivobook Pro 14 M3401QC-KM007T | |
| Dell Inspiron 14 7420 2-in-1 | |
| MSI Modern 14 B11SB-085 | |
| LibreOffice / 20 Documents To PDF | |
| Asus Vivobook Pro 14 M3401QC-KM007T | |
| Asus Zenbook S 13 OLED | |
| Asus ZenBook 14X UM5401QA-KN162 | |
| Lenovo Yoga Slim 7i Pro 14IAP G7 | |
| Razer Blade 15 2022 | |
| MSI Modern 14 B11SB-085 | |
| Dell Inspiron 14 7420 2-in-1 | |
| MSI Summit E14 Flip Evo A12MT | |
| Asus VivoBook S 14X S5402Z | |
| HP Pavilion Plus 14 eh0097nr | |
| Durchschnittliche Intel Core i7-12700H (34.2 - 95.3, n=62) | |
* ... kleinere Werte sind besser
AIDA64: FP32 Ray-Trace | FPU Julia | CPU SHA3 | CPU Queen | FPU SinJulia | FPU Mandel | CPU AES | CPU ZLib | FP64 Ray-Trace | CPU PhotoWorxx
| Performance Rating | |
| HP Pavilion Plus 14 eh0097nr | |
| Durchschnittliche Intel Core i7-12700H | |
| Asus Vivobook Pro 14 M3401QC-KM007T | |
| Lenovo Yoga Slim 7i Pro 14IAP G7 | |
| MSI Modern 14 B11SB-085 | |
| Dell Inspiron 14 7420 2-in-1 | |
| AIDA64 / FP32 Ray-Trace | |
| HP Pavilion Plus 14 eh0097nr | |
| Asus Vivobook Pro 14 M3401QC-KM007T | |
| Durchschnittliche Intel Core i7-12700H (2585 - 17957, n=62) | |
| MSI Modern 14 B11SB-085 | |
| Lenovo Yoga Slim 7i Pro 14IAP G7 | |
| Dell Inspiron 14 7420 2-in-1 | |
| AIDA64 / FPU Julia | |
| Asus Vivobook Pro 14 M3401QC-KM007T | |
| HP Pavilion Plus 14 eh0097nr | |
| Durchschnittliche Intel Core i7-12700H (12439 - 90760, n=62) | |
| MSI Modern 14 B11SB-085 | |
| Lenovo Yoga Slim 7i Pro 14IAP G7 | |
| Dell Inspiron 14 7420 2-in-1 | |
| AIDA64 / CPU SHA3 | |
| Durchschnittliche Intel Core i7-12700H (833 - 4242, n=62) | |
| HP Pavilion Plus 14 eh0097nr | |
| Asus Vivobook Pro 14 M3401QC-KM007T | |
| Lenovo Yoga Slim 7i Pro 14IAP G7 | |
| MSI Modern 14 B11SB-085 | |
| Dell Inspiron 14 7420 2-in-1 | |
| AIDA64 / CPU Queen | |
| Durchschnittliche Intel Core i7-12700H (57923 - 103202, n=62) | |
| HP Pavilion Plus 14 eh0097nr | |
| Lenovo Yoga Slim 7i Pro 14IAP G7 | |
| Asus Vivobook Pro 14 M3401QC-KM007T | |
| Dell Inspiron 14 7420 2-in-1 | |
| MSI Modern 14 B11SB-085 | |
| AIDA64 / FPU SinJulia | |
| Durchschnittliche Intel Core i7-12700H (3249 - 9939, n=62) | |
| Asus Vivobook Pro 14 M3401QC-KM007T | |
| HP Pavilion Plus 14 eh0097nr | |
| Lenovo Yoga Slim 7i Pro 14IAP G7 | |
| MSI Modern 14 B11SB-085 | |
| Dell Inspiron 14 7420 2-in-1 | |
| AIDA64 / FPU Mandel | |
| Asus Vivobook Pro 14 M3401QC-KM007T | |
| HP Pavilion Plus 14 eh0097nr | |
| Durchschnittliche Intel Core i7-12700H (7135 - 44760, n=62) | |
| MSI Modern 14 B11SB-085 | |
| Lenovo Yoga Slim 7i Pro 14IAP G7 | |
| Dell Inspiron 14 7420 2-in-1 | |
| AIDA64 / CPU AES | |
| HP Pavilion Plus 14 eh0097nr | |
| Asus Vivobook Pro 14 M3401QC-KM007T | |
| Durchschnittliche Intel Core i7-12700H (31839 - 144360, n=62) | |
| Lenovo Yoga Slim 7i Pro 14IAP G7 | |
| MSI Modern 14 B11SB-085 | |
| Dell Inspiron 14 7420 2-in-1 | |
| AIDA64 / CPU ZLib | |
| Durchschnittliche Intel Core i7-12700H (305 - 1171, n=62) | |
| HP Pavilion Plus 14 eh0097nr | |
| Lenovo Yoga Slim 7i Pro 14IAP G7 | |
| Asus Vivobook Pro 14 M3401QC-KM007T | |
| Dell Inspiron 14 7420 2-in-1 | |
| MSI Modern 14 B11SB-085 | |
| AIDA64 / FP64 Ray-Trace | |
| HP Pavilion Plus 14 eh0097nr | |
| Durchschnittliche Intel Core i7-12700H (1437 - 9692, n=62) | |
| Asus Vivobook Pro 14 M3401QC-KM007T | |
| MSI Modern 14 B11SB-085 | |
| Lenovo Yoga Slim 7i Pro 14IAP G7 | |
| Dell Inspiron 14 7420 2-in-1 | |
| AIDA64 / CPU PhotoWorxx | |
| Lenovo Yoga Slim 7i Pro 14IAP G7 | |
| Durchschnittliche Intel Core i7-12700H (12863 - 52207, n=62) | |
| Dell Inspiron 14 7420 2-in-1 | |
| HP Pavilion Plus 14 eh0097nr | |
| Asus Vivobook Pro 14 M3401QC-KM007T | |
| MSI Modern 14 B11SB-085 | |
Systemleistung
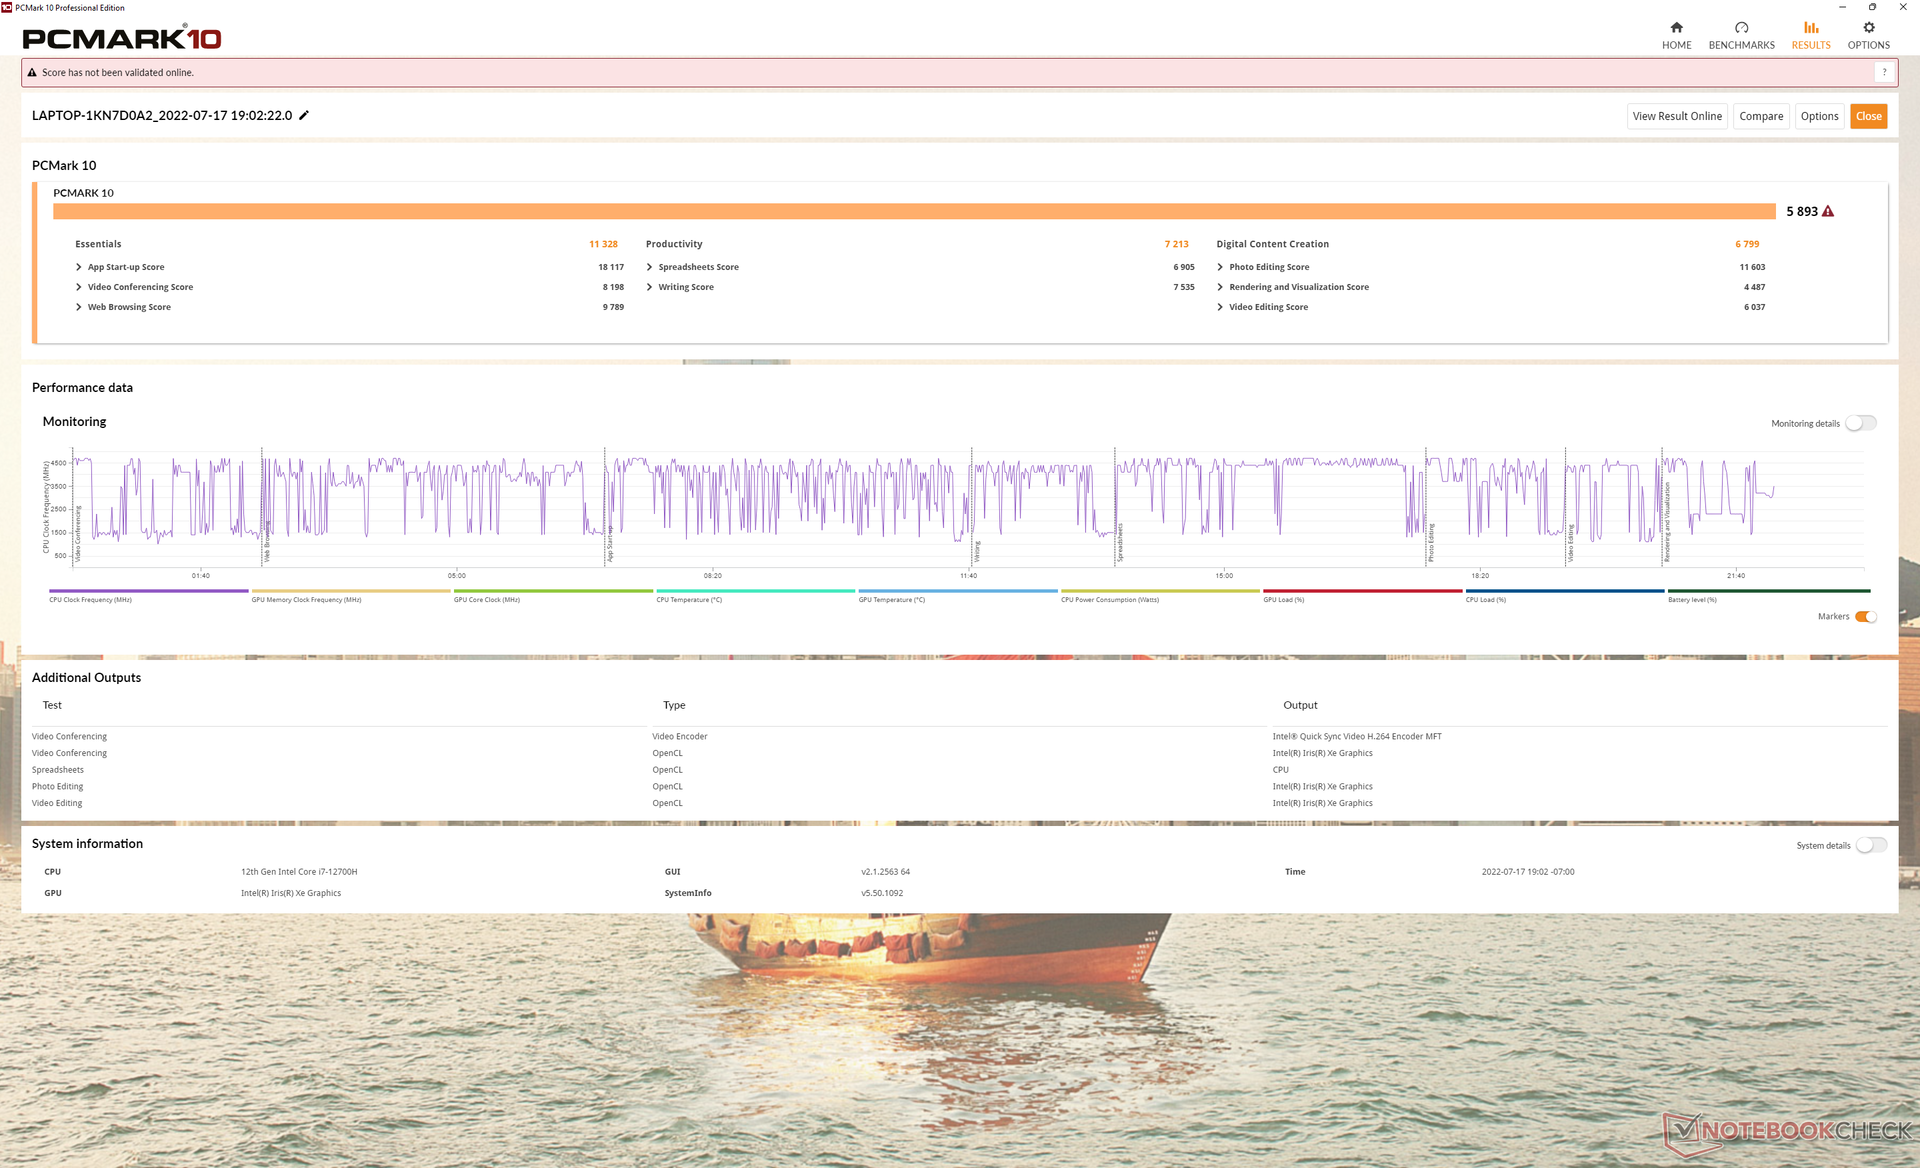
Die PCMark-Ergebnisse sind dort, wo wir sie im Vergleich zu anderen Laptops mit der gleichen Core i7-12700H CPU erwarten, wenn nicht vielleicht ein bisschen langsamer. Insbesondere die CrossMark-Ergebnisse sind langsamer als der Durchschnitt, was wahrscheinlich auf die oben erwähnten langsamen CineBench-Ergebnisse zurückzuführen ist.
CrossMark: Overall | Productivity | Creativity | Responsiveness
| PCMark 10 / Score | |
| Durchschnittliche Intel Core i7-12700H, Intel Iris Xe Graphics G7 96EUs (5541 - 6281, n=7) | |
| HP Pavilion Plus 14 eh0097nr | |
| Asus Vivobook Pro 14 M3401QC-KM007T | |
| Dell Inspiron 14 7420 2-in-1 | |
| Lenovo Yoga Slim 7i Pro 14IAP G7 | |
| MSI Modern 14 B11SB-085 | |
| HP Pavilion 14-dv0357ng | |
| PCMark 10 / Essentials | |
| HP Pavilion Plus 14 eh0097nr | |
| Durchschnittliche Intel Core i7-12700H, Intel Iris Xe Graphics G7 96EUs (10569 - 11699, n=7) | |
| Dell Inspiron 14 7420 2-in-1 | |
| HP Pavilion 14-dv0357ng | |
| Lenovo Yoga Slim 7i Pro 14IAP G7 | |
| Asus Vivobook Pro 14 M3401QC-KM007T | |
| MSI Modern 14 B11SB-085 | |
| PCMark 10 / Productivity | |
| Asus Vivobook Pro 14 M3401QC-KM007T | |
| MSI Modern 14 B11SB-085 | |
| Durchschnittliche Intel Core i7-12700H, Intel Iris Xe Graphics G7 96EUs (6690 - 8038, n=7) | |
| HP Pavilion Plus 14 eh0097nr | |
| HP Pavilion 14-dv0357ng | |
| Dell Inspiron 14 7420 2-in-1 | |
| Lenovo Yoga Slim 7i Pro 14IAP G7 | |
| PCMark 10 / Digital Content Creation | |
| Asus Vivobook Pro 14 M3401QC-KM007T | |
| Durchschnittliche Intel Core i7-12700H, Intel Iris Xe Graphics G7 96EUs (6207 - 7401, n=7) | |
| HP Pavilion Plus 14 eh0097nr | |
| Lenovo Yoga Slim 7i Pro 14IAP G7 | |
| Dell Inspiron 14 7420 2-in-1 | |
| MSI Modern 14 B11SB-085 | |
| HP Pavilion 14-dv0357ng | |
| CrossMark / Overall | |
| Durchschnittliche Intel Core i7-12700H, Intel Iris Xe Graphics G7 96EUs (1492 - 1907, n=7) | |
| HP Pavilion Plus 14 eh0097nr | |
| Lenovo Yoga Slim 7i Pro 14IAP G7 | |
| Dell Inspiron 14 7420 2-in-1 | |
| Asus Vivobook Pro 14 M3401QC-KM007T | |
| CrossMark / Productivity | |
| Durchschnittliche Intel Core i7-12700H, Intel Iris Xe Graphics G7 96EUs (1499 - 1832, n=7) | |
| HP Pavilion Plus 14 eh0097nr | |
| Dell Inspiron 14 7420 2-in-1 | |
| Lenovo Yoga Slim 7i Pro 14IAP G7 | |
| Asus Vivobook Pro 14 M3401QC-KM007T | |
| CrossMark / Creativity | |
| Durchschnittliche Intel Core i7-12700H, Intel Iris Xe Graphics G7 96EUs (1507 - 2016, n=7) | |
| HP Pavilion Plus 14 eh0097nr | |
| Lenovo Yoga Slim 7i Pro 14IAP G7 | |
| Dell Inspiron 14 7420 2-in-1 | |
| Asus Vivobook Pro 14 M3401QC-KM007T | |
| CrossMark / Responsiveness | |
| Durchschnittliche Intel Core i7-12700H, Intel Iris Xe Graphics G7 96EUs (1384 - 1831, n=7) | |
| HP Pavilion Plus 14 eh0097nr | |
| Lenovo Yoga Slim 7i Pro 14IAP G7 | |
| Dell Inspiron 14 7420 2-in-1 | |
| Asus Vivobook Pro 14 M3401QC-KM007T | |
| PCMark 10 Score | 5893 Punkte | |
Hilfe | ||
| AIDA64 / Memory Copy | |
| Lenovo Yoga Slim 7i Pro 14IAP G7 | |
| Durchschnittliche Intel Core i7-12700H (25615 - 80511, n=62) | |
| HP Pavilion Plus 14 eh0097nr | |
| Dell Inspiron 14 7420 2-in-1 | |
| Asus Vivobook Pro 14 M3401QC-KM007T | |
| MSI Modern 14 B11SB-085 | |
| AIDA64 / Memory Read | |
| Lenovo Yoga Slim 7i Pro 14IAP G7 | |
| Durchschnittliche Intel Core i7-12700H (25586 - 79442, n=62) | |
| HP Pavilion Plus 14 eh0097nr | |
| Asus Vivobook Pro 14 M3401QC-KM007T | |
| Dell Inspiron 14 7420 2-in-1 | |
| MSI Modern 14 B11SB-085 | |
| AIDA64 / Memory Write | |
| Lenovo Yoga Slim 7i Pro 14IAP G7 | |
| Durchschnittliche Intel Core i7-12700H (23679 - 88660, n=62) | |
| HP Pavilion Plus 14 eh0097nr | |
| Dell Inspiron 14 7420 2-in-1 | |
| Asus Vivobook Pro 14 M3401QC-KM007T | |
| MSI Modern 14 B11SB-085 | |
| AIDA64 / Memory Latency | |
| Asus Vivobook Pro 14 M3401QC-KM007T | |
| Durchschnittliche Intel Core i7-12700H (76.2 - 133.9, n=60) | |
| HP Pavilion Plus 14 eh0097nr | |
| MSI Modern 14 B11SB-085 | |
| Dell Inspiron 14 7420 2-in-1 | |
* ... kleinere Werte sind besser
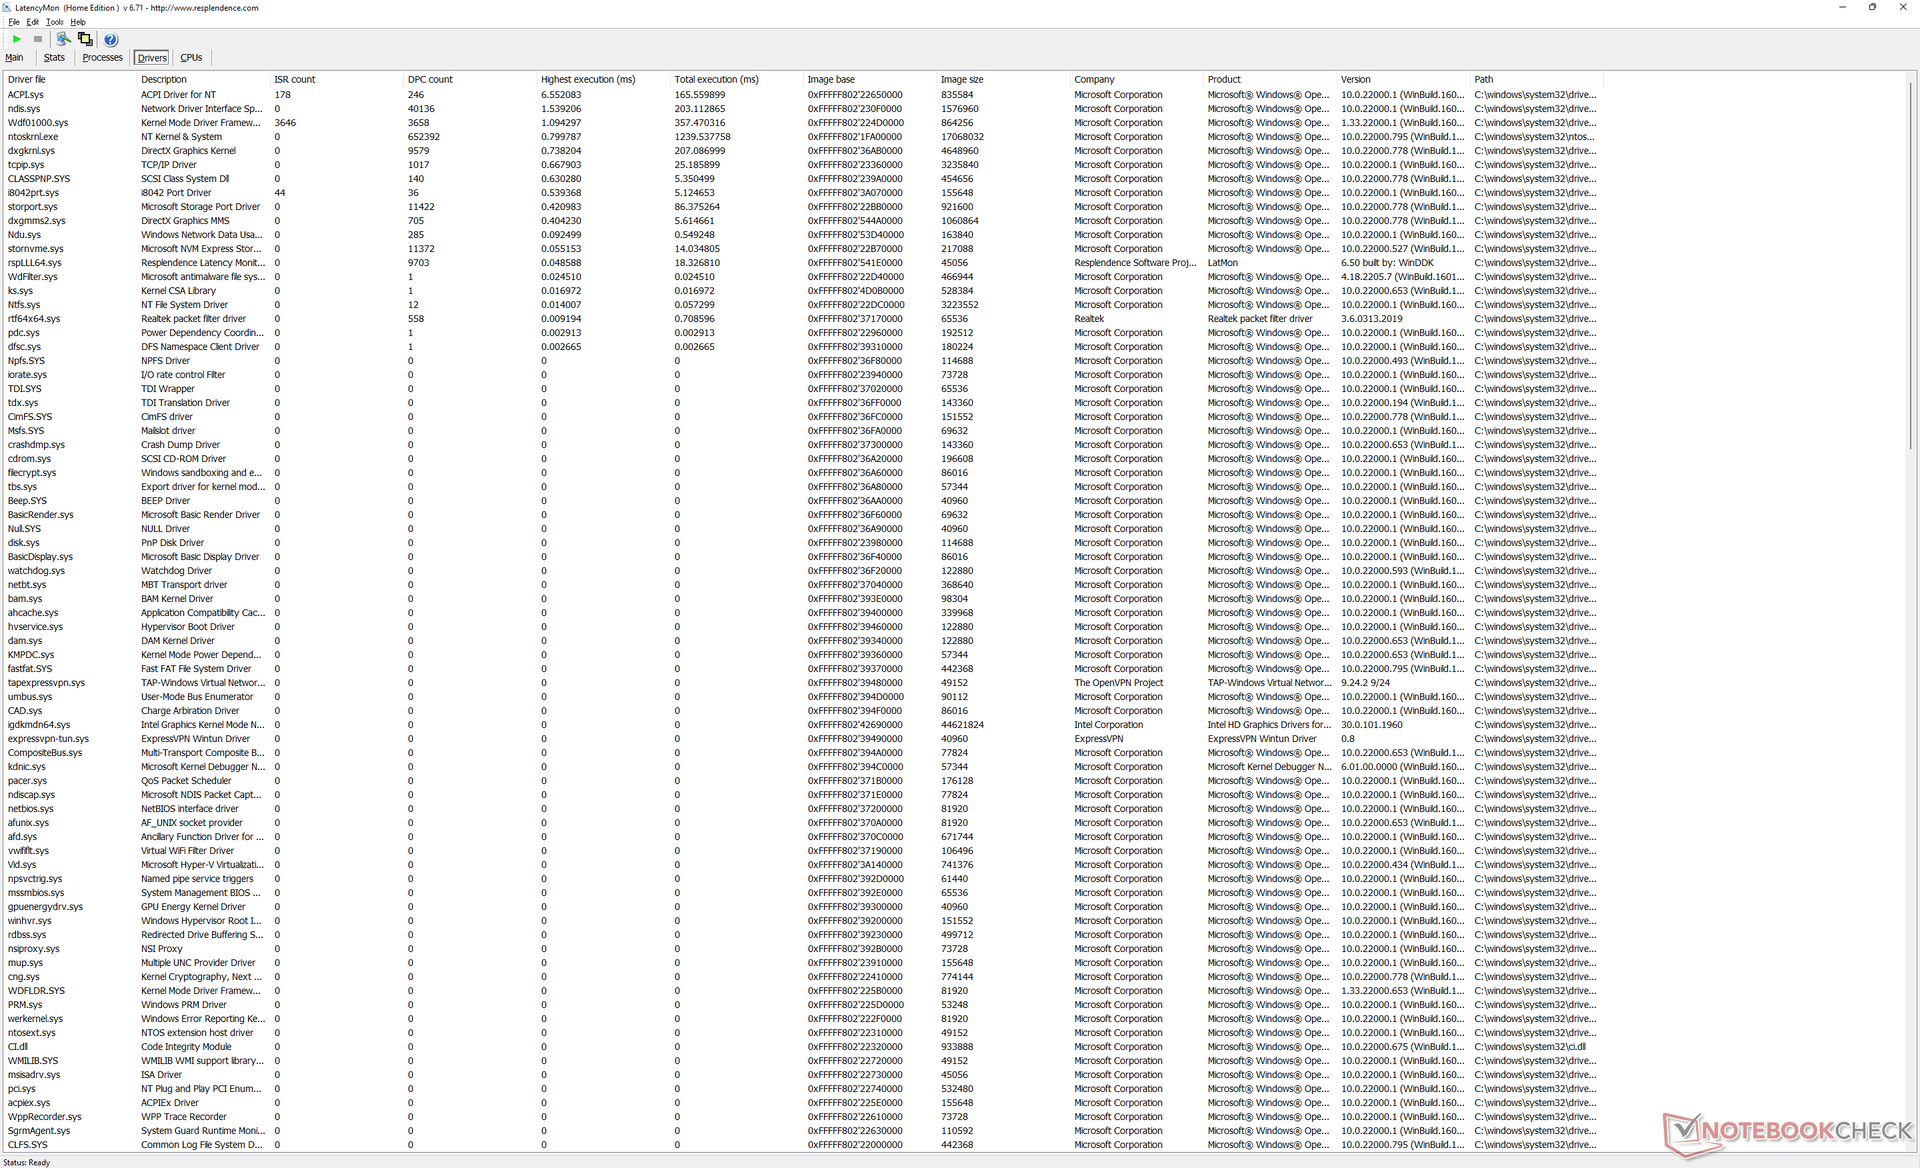
DPC-Latenz
LatencyMon zeigt DPC-Probleme beim Öffnen mehrerer Browser-Tabs auf unserer Homepage. Die 4K-Videowiedergabe ist ansonsten bei geringer Ressourcenauslastung perfekt, wie von einem modernen Prozessor der Core H-Serie erwartet.

| DPC Latencies / LatencyMon - interrupt to process latency (max), Web, Youtube, Prime95 | |
| HP Pavilion 14-dv0357ng | |
| HP Pavilion Plus 14 eh0097nr | |
| Asus Vivobook Pro 14 M3401QC-KM007T | |
| MSI Modern 14 B11SB-085 | |
| Lenovo Yoga Slim 7i Pro 14IAP G7 | |
| Dell Inspiron 14 7420 2-in-1 | |
* ... kleinere Werte sind besser
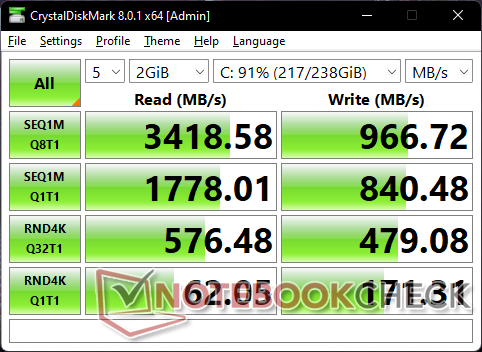
Speichergeräte – nur ein Laufwerk
Unser Gerät wird mit der Mittelklasse-SK Hynix BC711 PCIe3 x4 NVMe SSD mit 256 GB ausgeliefert, die hervorragende sequenzielle Leseraten von etwa 3400 MB/s, aber viel langsamere sequenzielle Schreibraten von nur etwa 1000 MB/s bietet. Höherwertige PCIe3-Laufwerke wie die PM981a-Serie von Samsung können mehr als doppelt so hohe Schreibraten bieten.
Das Laufwerk in unserem Testgerät zeigt keine Drosselung, wenn es DiskSpd in einer Schleife ausgesetzt wird. Allerdings sank die Leistung ab und an auf 2550 MB/s, bevor sie wieder auf 3400 MB/s anstieg, wahrscheinlich aufgrund von störenden Hintergrundaktivitäten. Wir haben darauf geachtet, alle automatischen Backup- und McAfee-Prozesse im Voraus zu deinstallieren, aber die kleinen Einbrüche traten dennoch weiterhin auf.


* ... kleinere Werte sind besser
Dauerleistung Lesen: DiskSpd Read Loop, Queue Depth 8
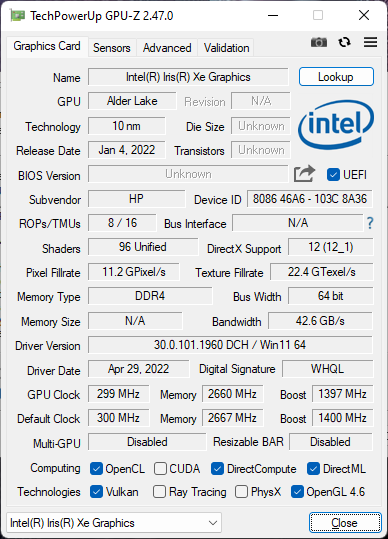
GPU-Leistung – Iris Xe
Die Grafikleistung ist etwas langsamer als erwartet. Die von unserem HP gelieferten Frameraten sind im Vergleich zu einem durchschnittlichen Laptop mit derselben Iris Xe 96 EUs GPU um einige Prozentpunkte niedriger. Das reicht zwar aus, um die meisten Spiele bei niedrigen Einstellungen zu spielen, wird aber von der jüngsten Radeon 680M übertroffen.
Ein Upgrade auf die Option GeForce RTX 2050 sollte die Grafikleistung im Vergleich zur Iris XE voraussichtlich um etwa 150 bis 180 Prozent steigern.
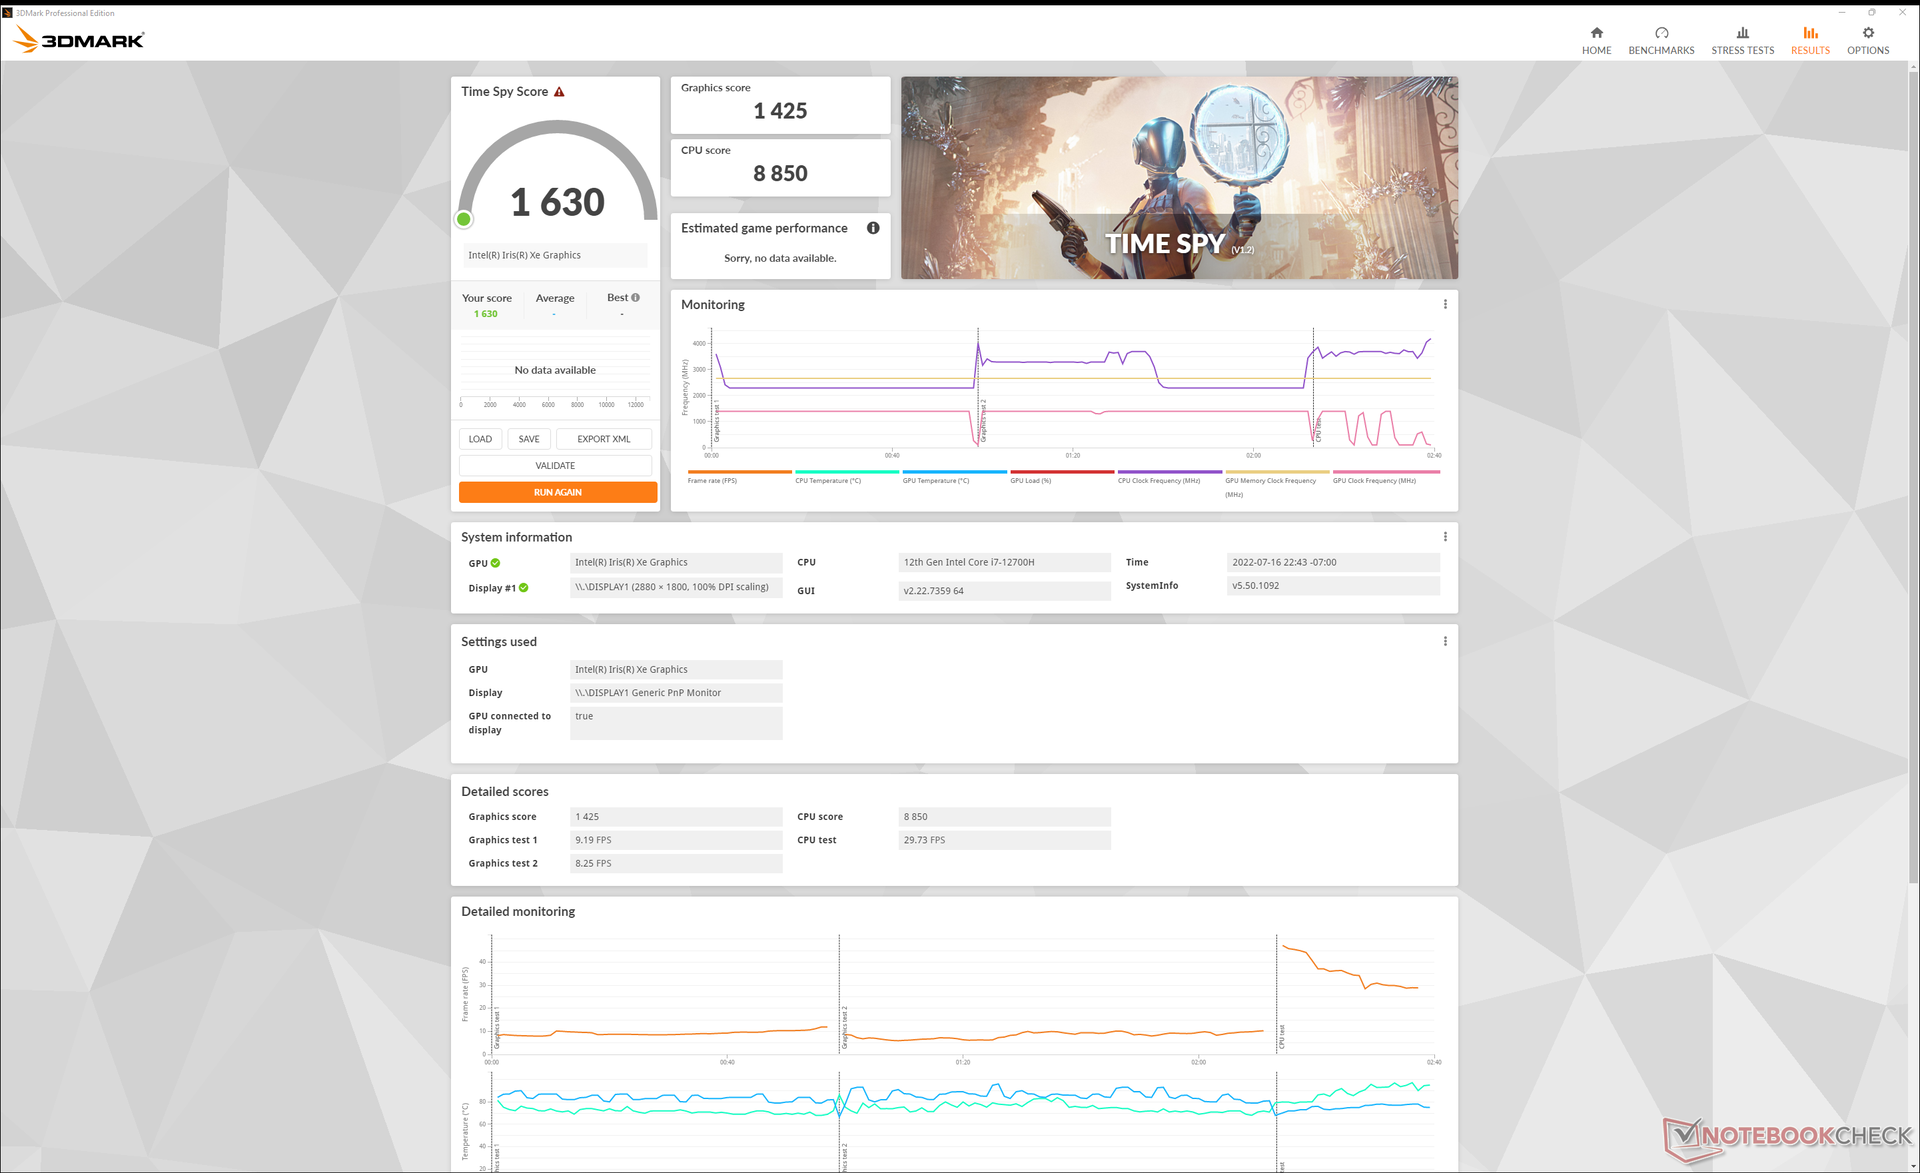
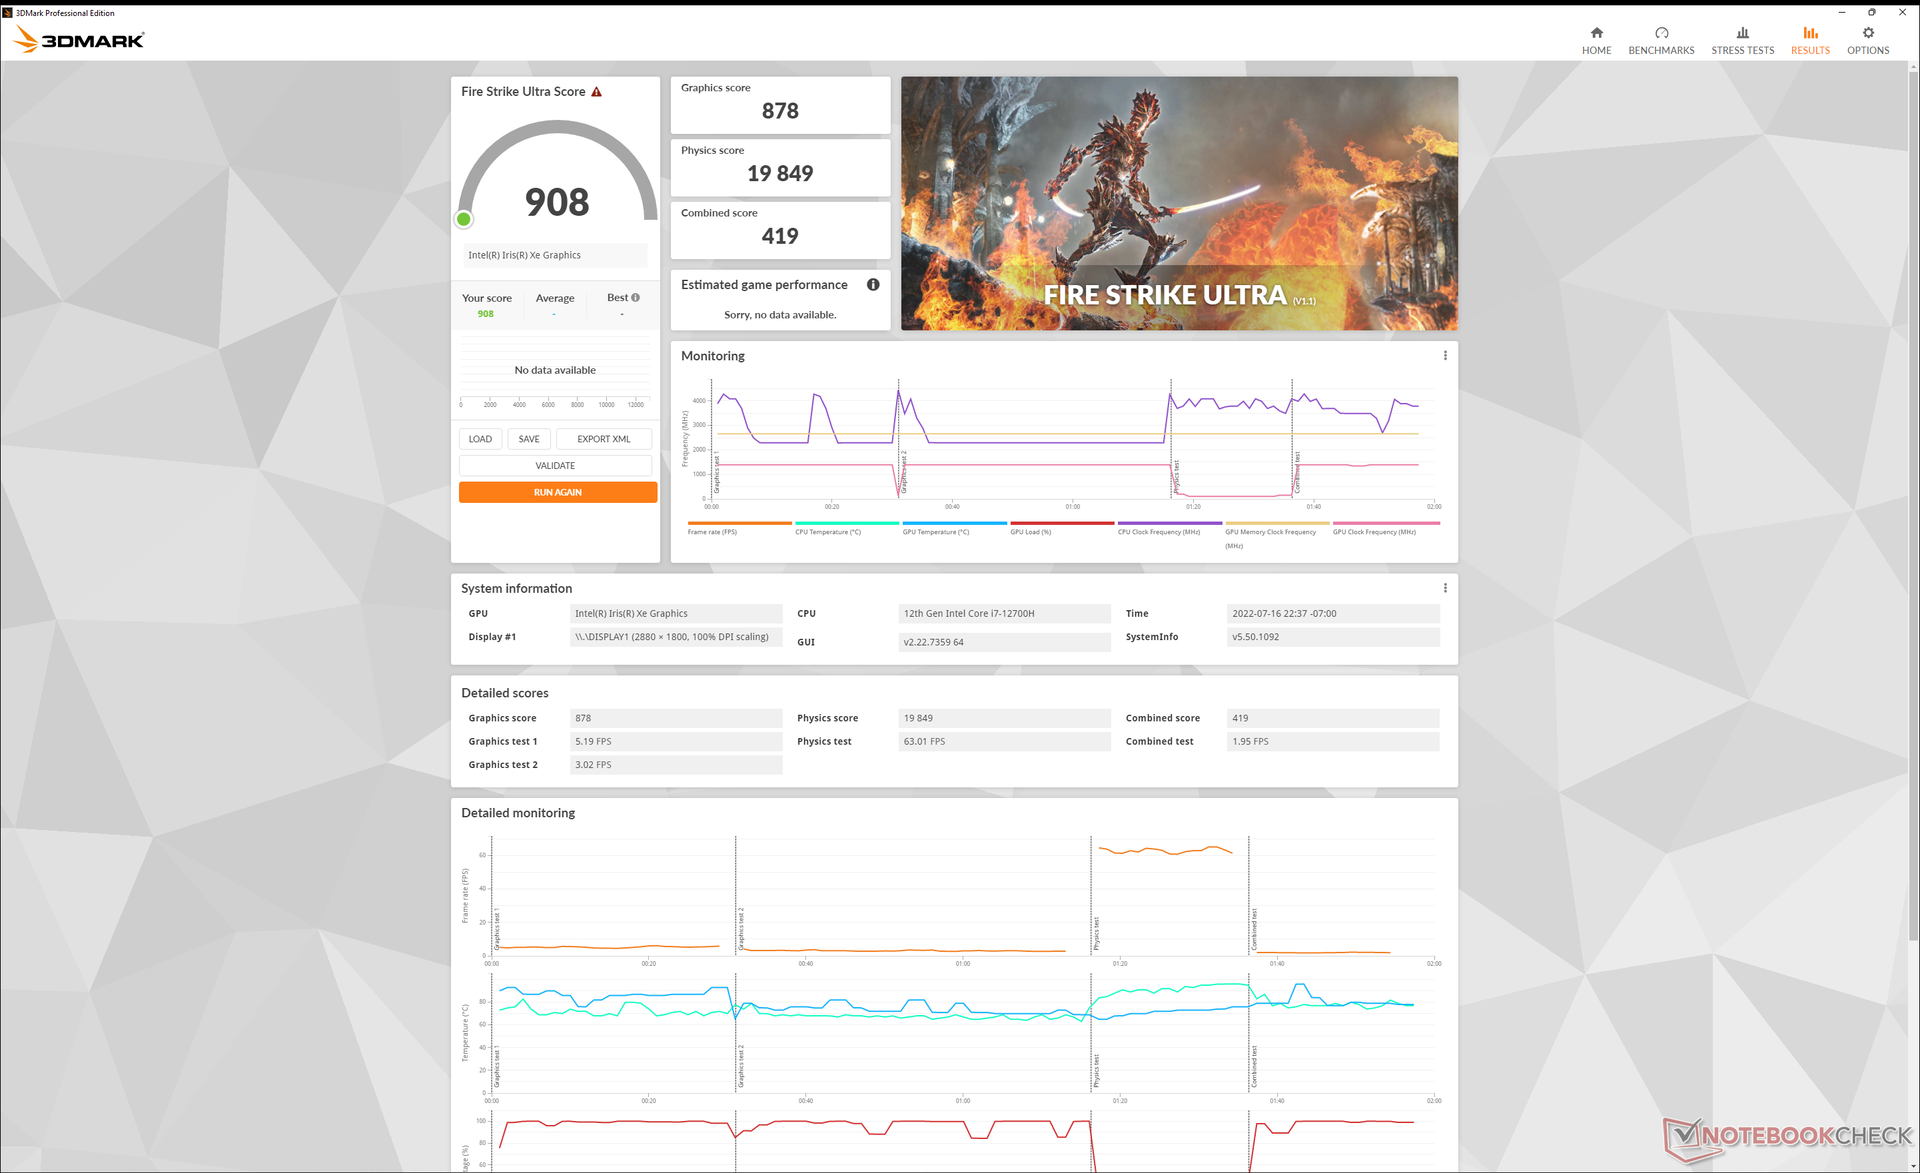
Seltsamerweise sind die 3DMark-Ergebnisse auch nach wiederholten Durchläufen zwischen Balance- und Performance-Modus inkonsistent. Beim Ausführen echter Spiele bemerken wir jedoch die Unterschiede bei den Taktraten und der Leistungsaufnahme, wie in unserem Stresstest unten gezeigt.


| 3DMark 11 Performance | 7081 Punkte | |
| 3DMark Cloud Gate Standard Score | 20292 Punkte | |
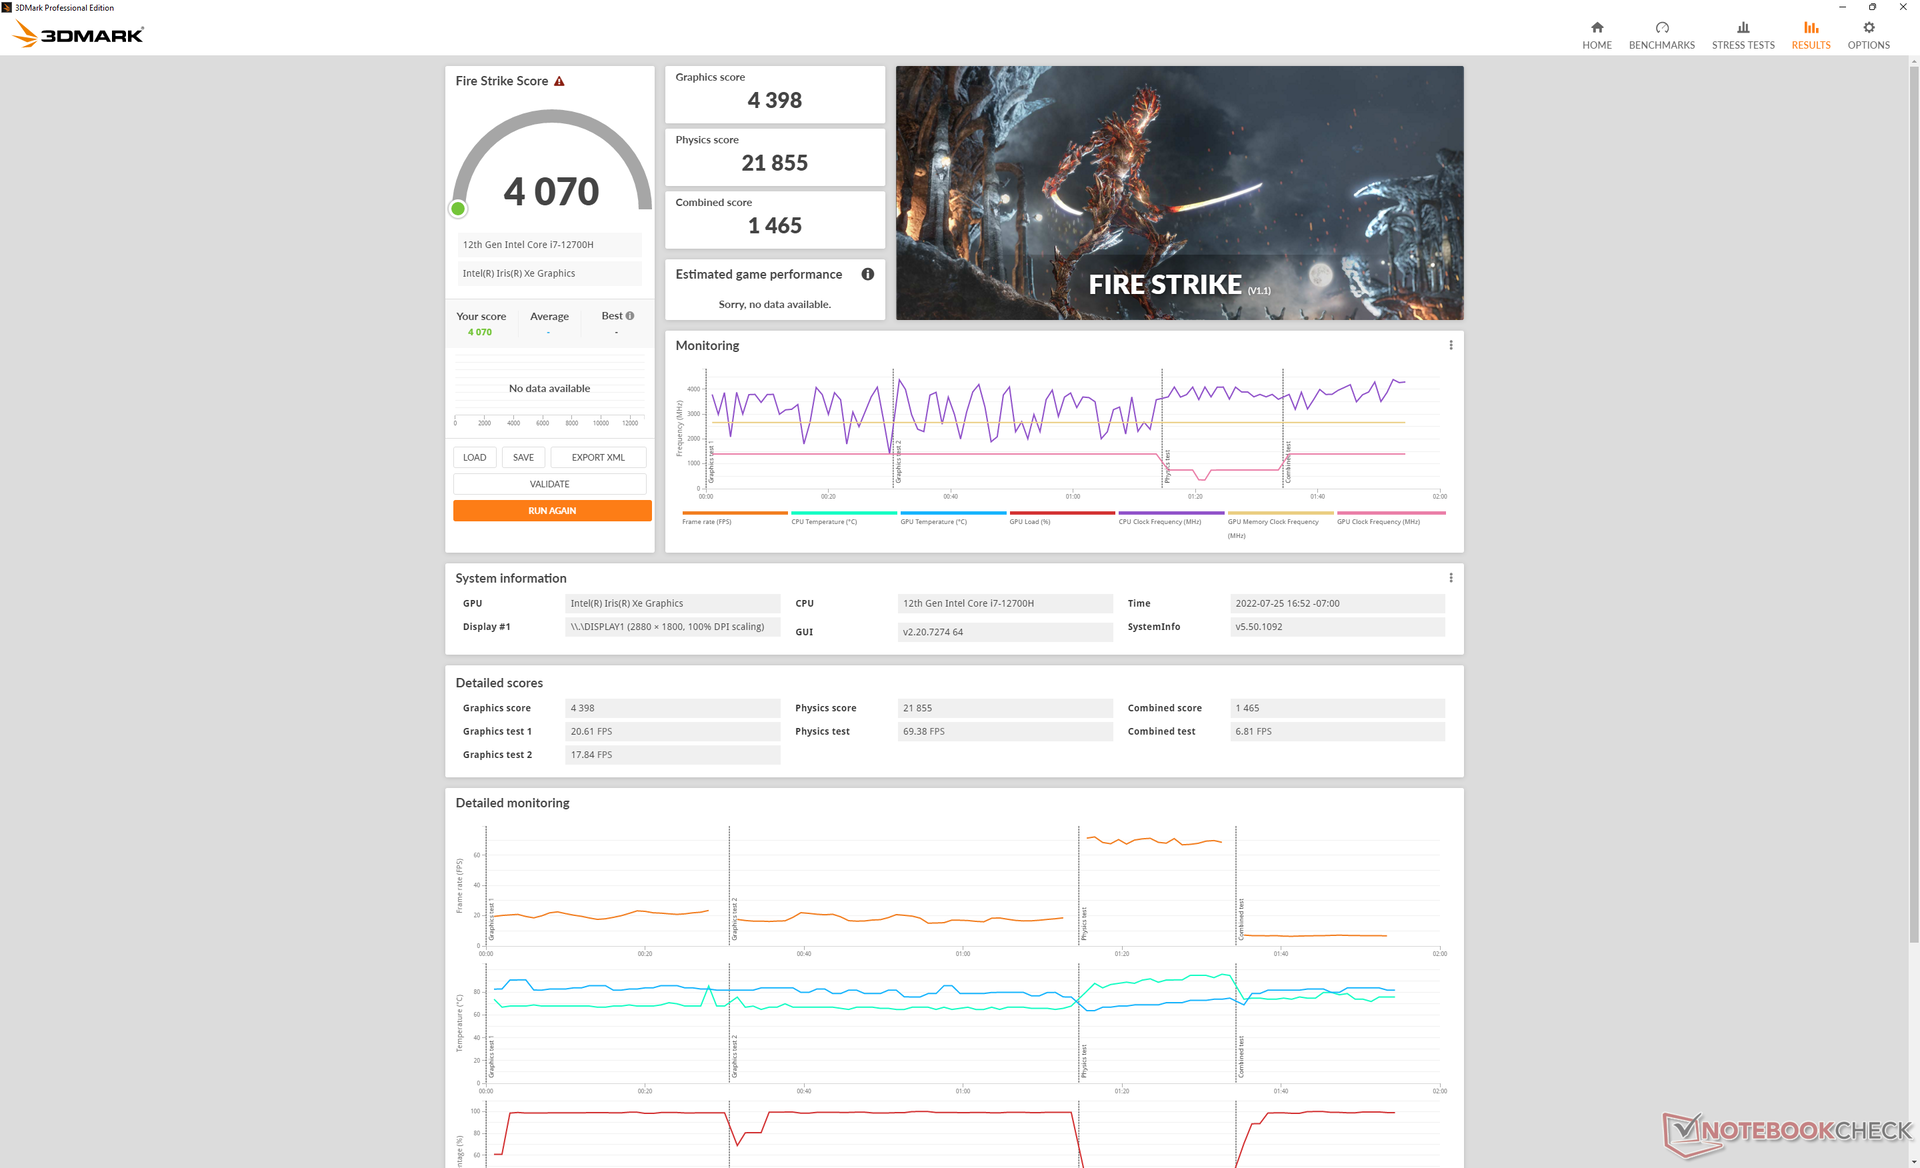
| 3DMark Fire Strike Score | 4044 Punkte | |
| 3DMark Time Spy Score | 1630 Punkte | |
Hilfe | ||
Witcher 3 FPS Chart
| min. | mittel | hoch | max. | |
| GTA V (2015) | 97.5 | 78.7 | 14.9 | 6.65 |
| The Witcher 3 (2015) | 86.7 | 54.1 | 27.1 | 13.5 |
| Dota 2 Reborn (2015) | 109.7 | 80.9 | 54.6 | 50.8 |
| Final Fantasy XV Benchmark (2018) | 37.7 | 20 | 14.4 | |
| X-Plane 11.11 (2018) | 45.5 | 43.4 | 38.5 | |
| Strange Brigade (2018) | 85.9 | 36.2 | 30.2 | 24.1 |
| Cyberpunk 2077 1.6 (2022) | 20.5 | 16.8 | 12.4 |
Emissionen
Systemrauschen – laut beim Spielen, leise bei der Arbeit
Die Lüftergeräusche sind trotz der Verwendung einer Core H-Serien-CPU in einem Gehäuse, das eigentlich für Core U-Serien-Optionen gedacht ist, kein Problem. Beim Surfen im Internet oder beim Videostreaming zum Beispiel wären die Lüftergeräusche im Bereich von 27 bis 28 dB(A) mit einem Hintergrund vom 23,3 dB(A) gerade noch hörbar.
Die Lüftergeräusche nehmen bei anspruchsvolleren Aufgaben, z. B. bei Spielen, erheblich zu und können zwischen 34 und 45 dB(A) erreichen. Dennoch ist dieser Bereich näher an vielen Ultrabooks der Core U-Serie und immer noch leiser als beim MSI Modern 14 oder Asus Vivobook Pro 14, die beide über schnellere diskrete GPUs verfügen.


Lautstärkediagramm
| Idle |
| 23.5 / 23.5 / 23.5 dB(A) |
| Last |
| 32 / 44.3 dB(A) |
 | ||
30 dB leise 40 dB(A) deutlich hörbar 50 dB(A) störend |
||
min: | ||
| HP Pavilion Plus 14 eh0097nr Iris Xe G7 96EUs, i7-12700H, SK Hynix BC711 HFM256GD3GX013N | Asus Vivobook Pro 14 M3401QC-KM007T GeForce RTX 3050 4GB Laptop GPU, R5 5600H, Intel SSD 670p SSDPEKNU512GZ | Dell Inspiron 14 7420 2-in-1 Iris Xe G7 96EUs, i7-1255U, WDC PC SN530 SDBPMPZ-512G | Lenovo Yoga Slim 7i Pro 14IAP G7 Iris Xe G7 80EUs, i5-1240P, Samsung PM9A1 MZVL2512HCJQ | MSI Modern 14 B11SB-085 GeForce MX450, i7-1165G7, Kingston OM8PCP3512F-AB | HP Pavilion 14-dv0357ng Iris Xe G7 80EUs, i5-1135G7, Intel Optane Memory H10 with Solid State Storage 32GB + 1TB HBRPEKNX0203AH(L/H) | |
|---|---|---|---|---|---|---|
| Geräuschentwicklung | -26% | -4% | -5% | -20% | -4% | |
| aus / Umgebung * | 23.3 | 25.4 -9% | 23.1 1% | 23.7 -2% | 26 -12% | 25.4 -9% |
| Idle min * | 23.5 | 25.4 -8% | 24.7 -5% | 23.7 -1% | 26 -11% | 25.4 -8% |
| Idle avg * | 23.5 | 25.4 -8% | 24.7 -5% | 25.1 -7% | 26 -11% | 25.4 -8% |
| Idle max * | 23.5 | 30.9 -31% | 24.7 -5% | 25.1 -7% | 26 -11% | 25.4 -8% |
| Last avg * | 32 | 56 -75% | 27.7 13% | 38.4 -20% | 46.3 -45% | 35.4 -11% |
| Witcher 3 ultra * | 35.3 | 45.1 -28% | 38.4 -9% | 46.3 -31% | ||
| Last max * | 44.3 | 56 -26% | 45.1 -2% | 39.4 11% | 52.9 -19% | 35.5 20% |
* ... kleinere Werte sind besser
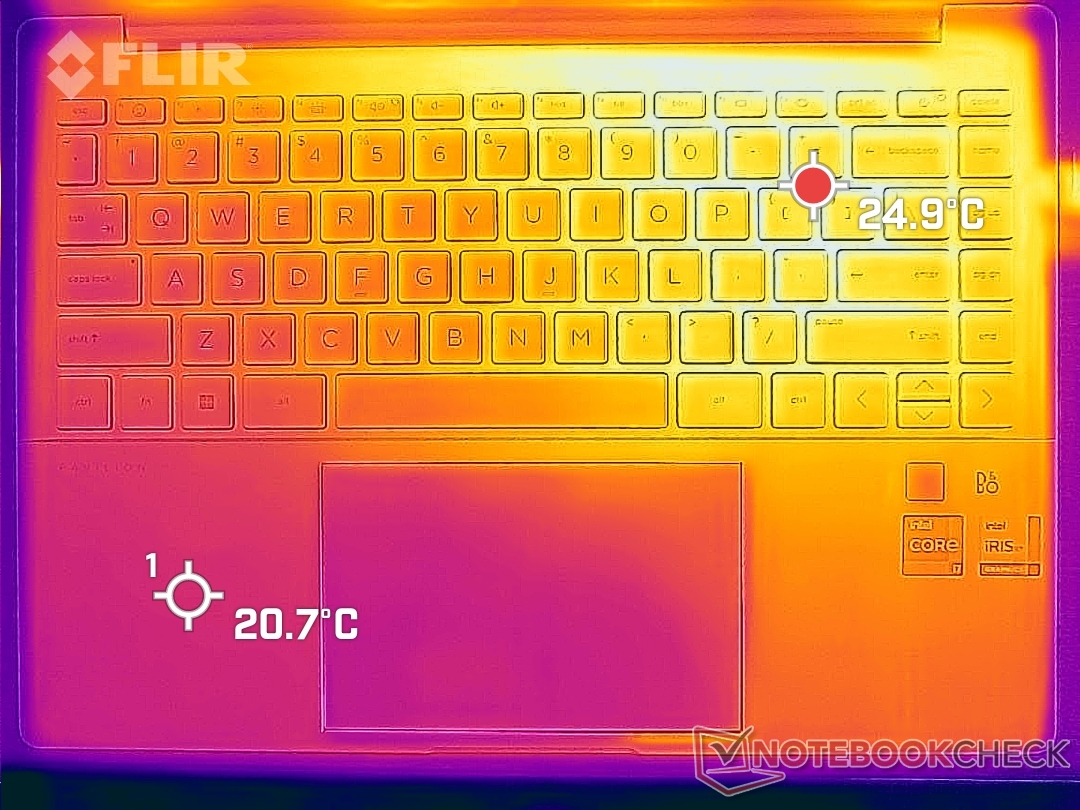
Temperatur
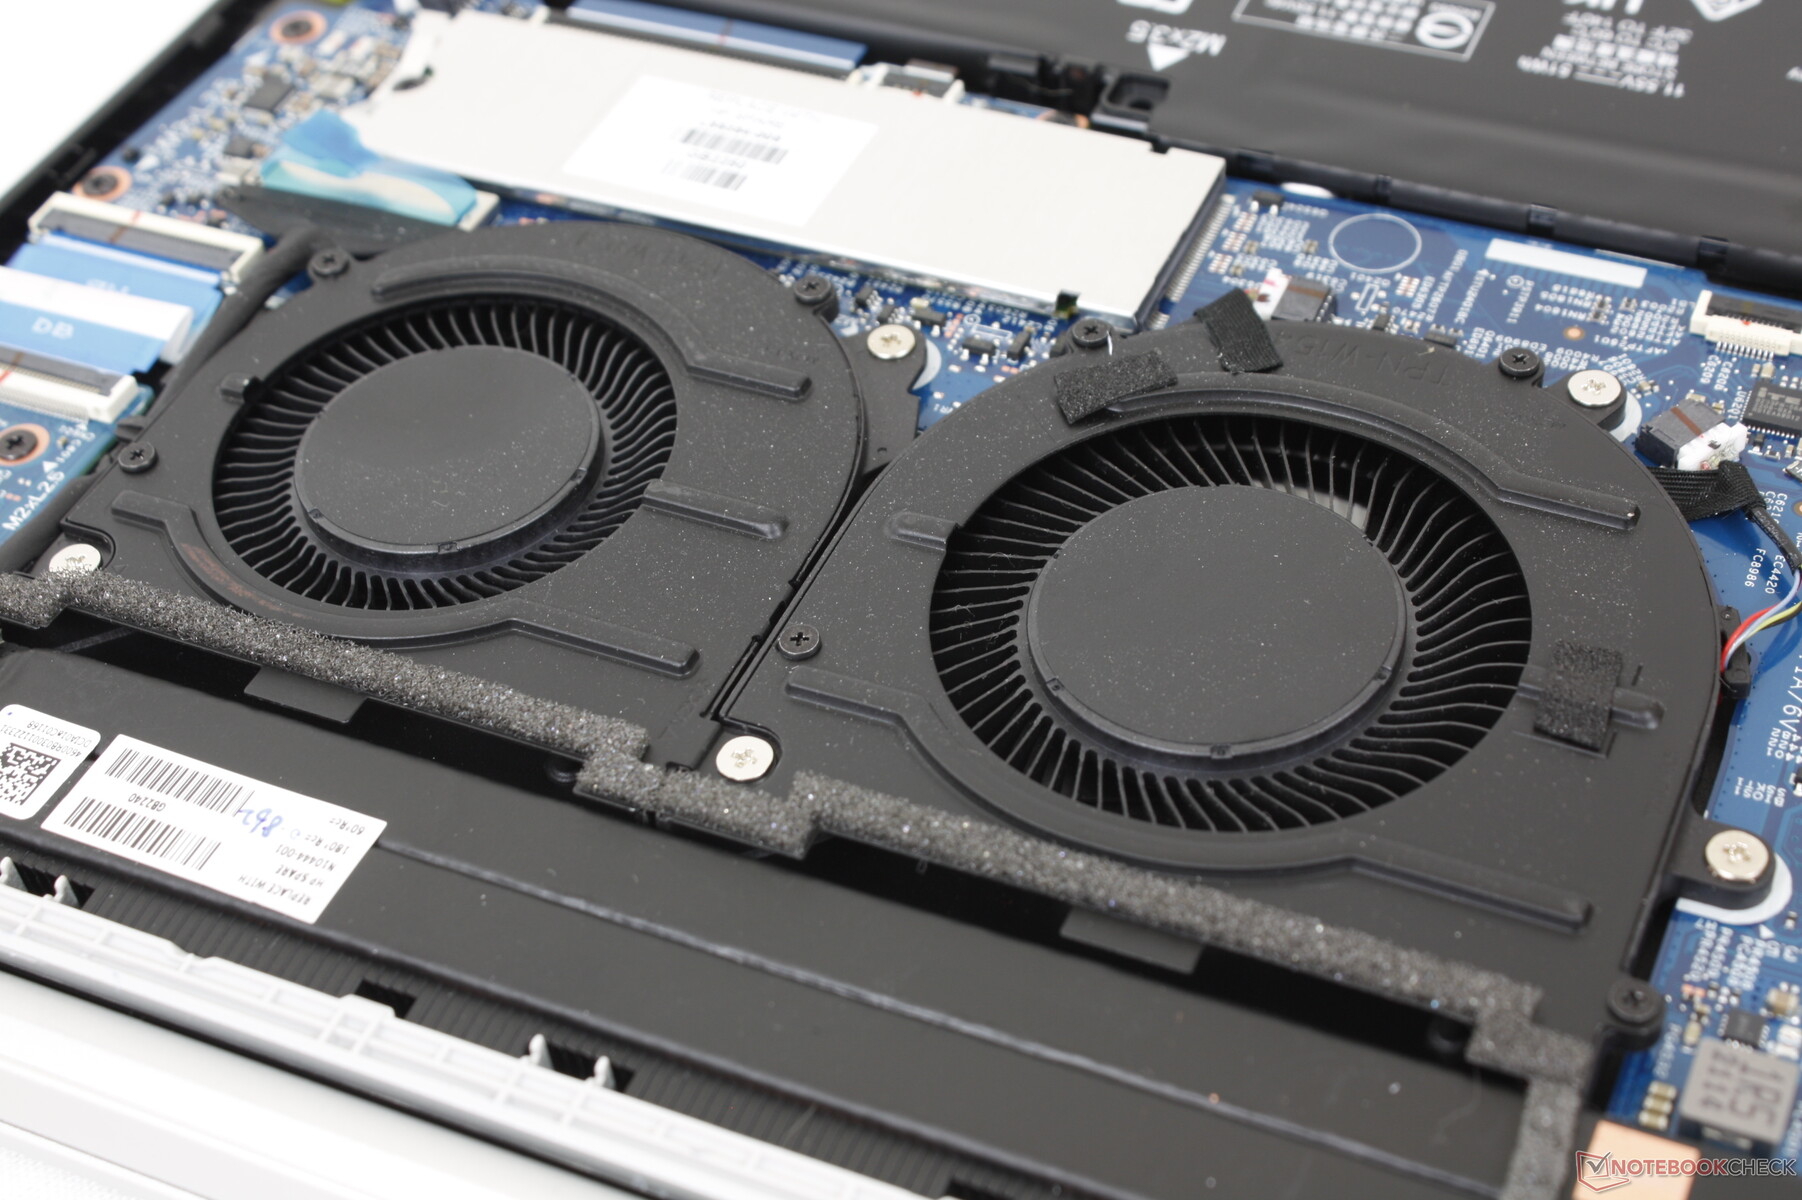
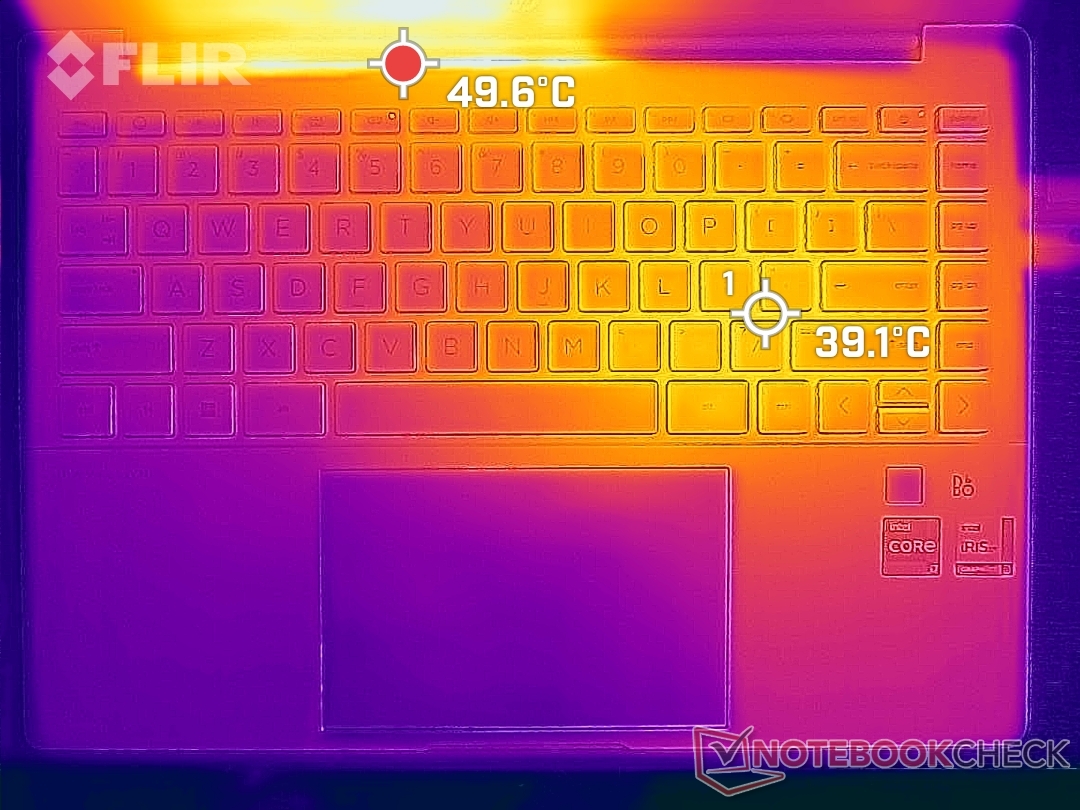
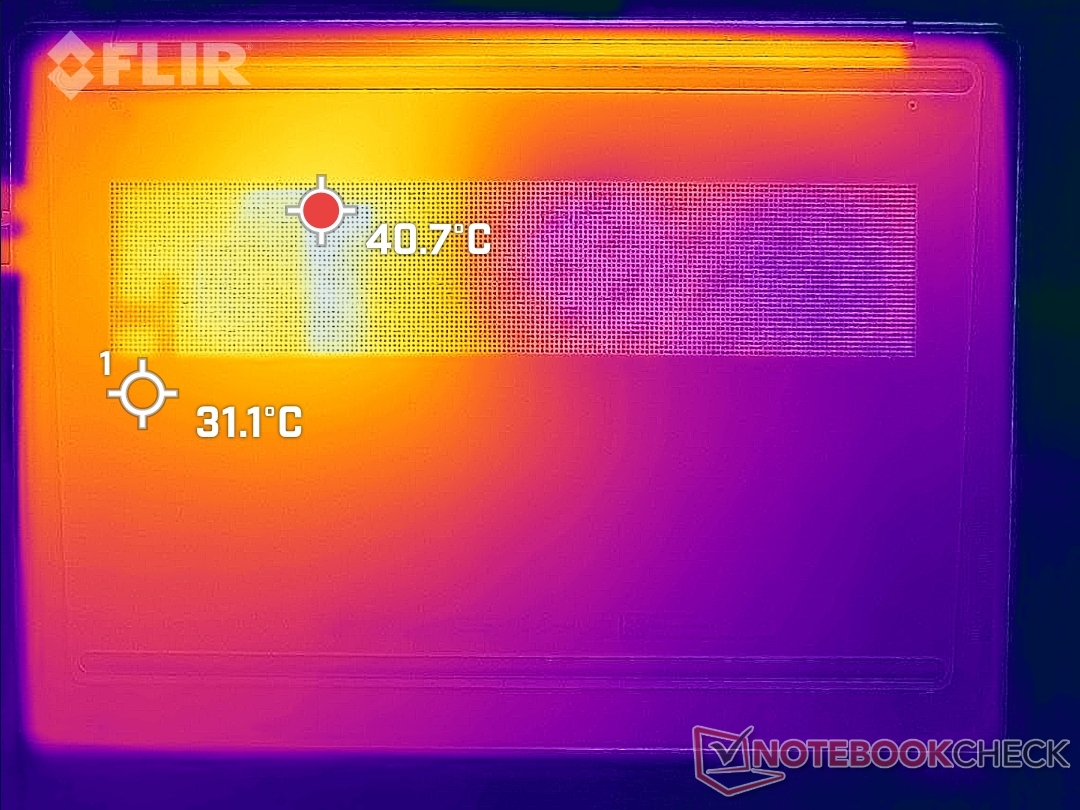
Das Gerät wird auf der rechten Hälfte immer wärmer sein als auf der linken, da sich die Kühllösung im Inneren befindet. Diese Art von Temperaturverhalten ist ungünstig, da sich die rechte Hand manchmal unangenehm warm anfühlen kann. Angenehmer ist im Allgemeinen ein symmetrischerer Temperaturverlauf, wie etwa beim HP Spectre x360 14.
Bei längerer Belastung oder beim Spielen können Hotspots oben und unten Temperaturen von 39 bzw. 36 °C erreichen. Das ist jedoch immer noch kühler als beim Asus Vivobook Pro 14 oder dem Lenovo Yoga Slim 7i Pro 14, bei denen die Temperatur an der Oberseite 43 °C und an der Unterseite 53 °C erreichen kann.

(+) Die maximale Temperatur auf der Oberseite ist 39.4 °C. Im Vergleich liegt der Klassendurchschnitt bei 36.9 °C (von 21.1 bis 71 °C für die Klasse Multimedia v7).
(+) Auf der Unterseite messen wir eine maximalen Wert von 33.8 °C (im Vergleich zum Durchschnitt von 39.1 °C).
(+) Ohne Last messen wir eine durchschnittliche Temperatur von 22.5 °C auf der Oberseite. Der Klassendurchschnitt erreicht 31.2 °C.
(+) Die Handballen und der Touchpad-Bereich sind mit gemessenen 27.8 °C kühler als die typische Hauttemperatur und fühlen sich dadurch kühl an.
(±) Die durchschnittliche Handballen-Temperatur anderer getesteter Geräte war 28.8 °C (+1 °C).

| HP Pavilion Plus 14 eh0097nr Intel Core i7-12700H, Intel Iris Xe Graphics G7 96EUs | Asus Vivobook Pro 14 M3401QC-KM007T AMD Ryzen 5 5600H, NVIDIA GeForce RTX 3050 4GB Laptop GPU | Dell Inspiron 14 7420 2-in-1 Intel Core i7-1255U, Intel Iris Xe Graphics G7 96EUs | Lenovo Yoga Slim 7i Pro 14IAP G7 Intel Core i5-1240P, Intel Iris Xe Graphics G7 80EUs | MSI Modern 14 B11SB-085 Intel Core i7-1165G7, NVIDIA GeForce MX450 | HP Pavilion 14-dv0357ng Intel Core i5-1135G7, Intel Iris Xe Graphics G7 80EUs | |
|---|---|---|---|---|---|---|
| Hitze | -32% | -11% | -19% | -40% | -15% | |
| Last oben max * | 39.4 | 42.3 -7% | 38.2 3% | 42.3 -7% | 55.6 -41% | 40.5 -3% |
| Last unten max * | 33.8 | 49.6 -47% | 45.6 -35% | 52.8 -56% | 67.8 -101% | 39.9 -18% |
| Idle oben max * | 25 | 34.2 -37% | 27.4 -10% | 27.1 -8% | 28.3 -13% | 31.3 -25% |
| Idle unten max * | 27.6 | 37.9 -37% | 28.4 -3% | 29.1 -5% | 28.9 -5% | 31.1 -13% |
* ... kleinere Werte sind besser
Stresstest
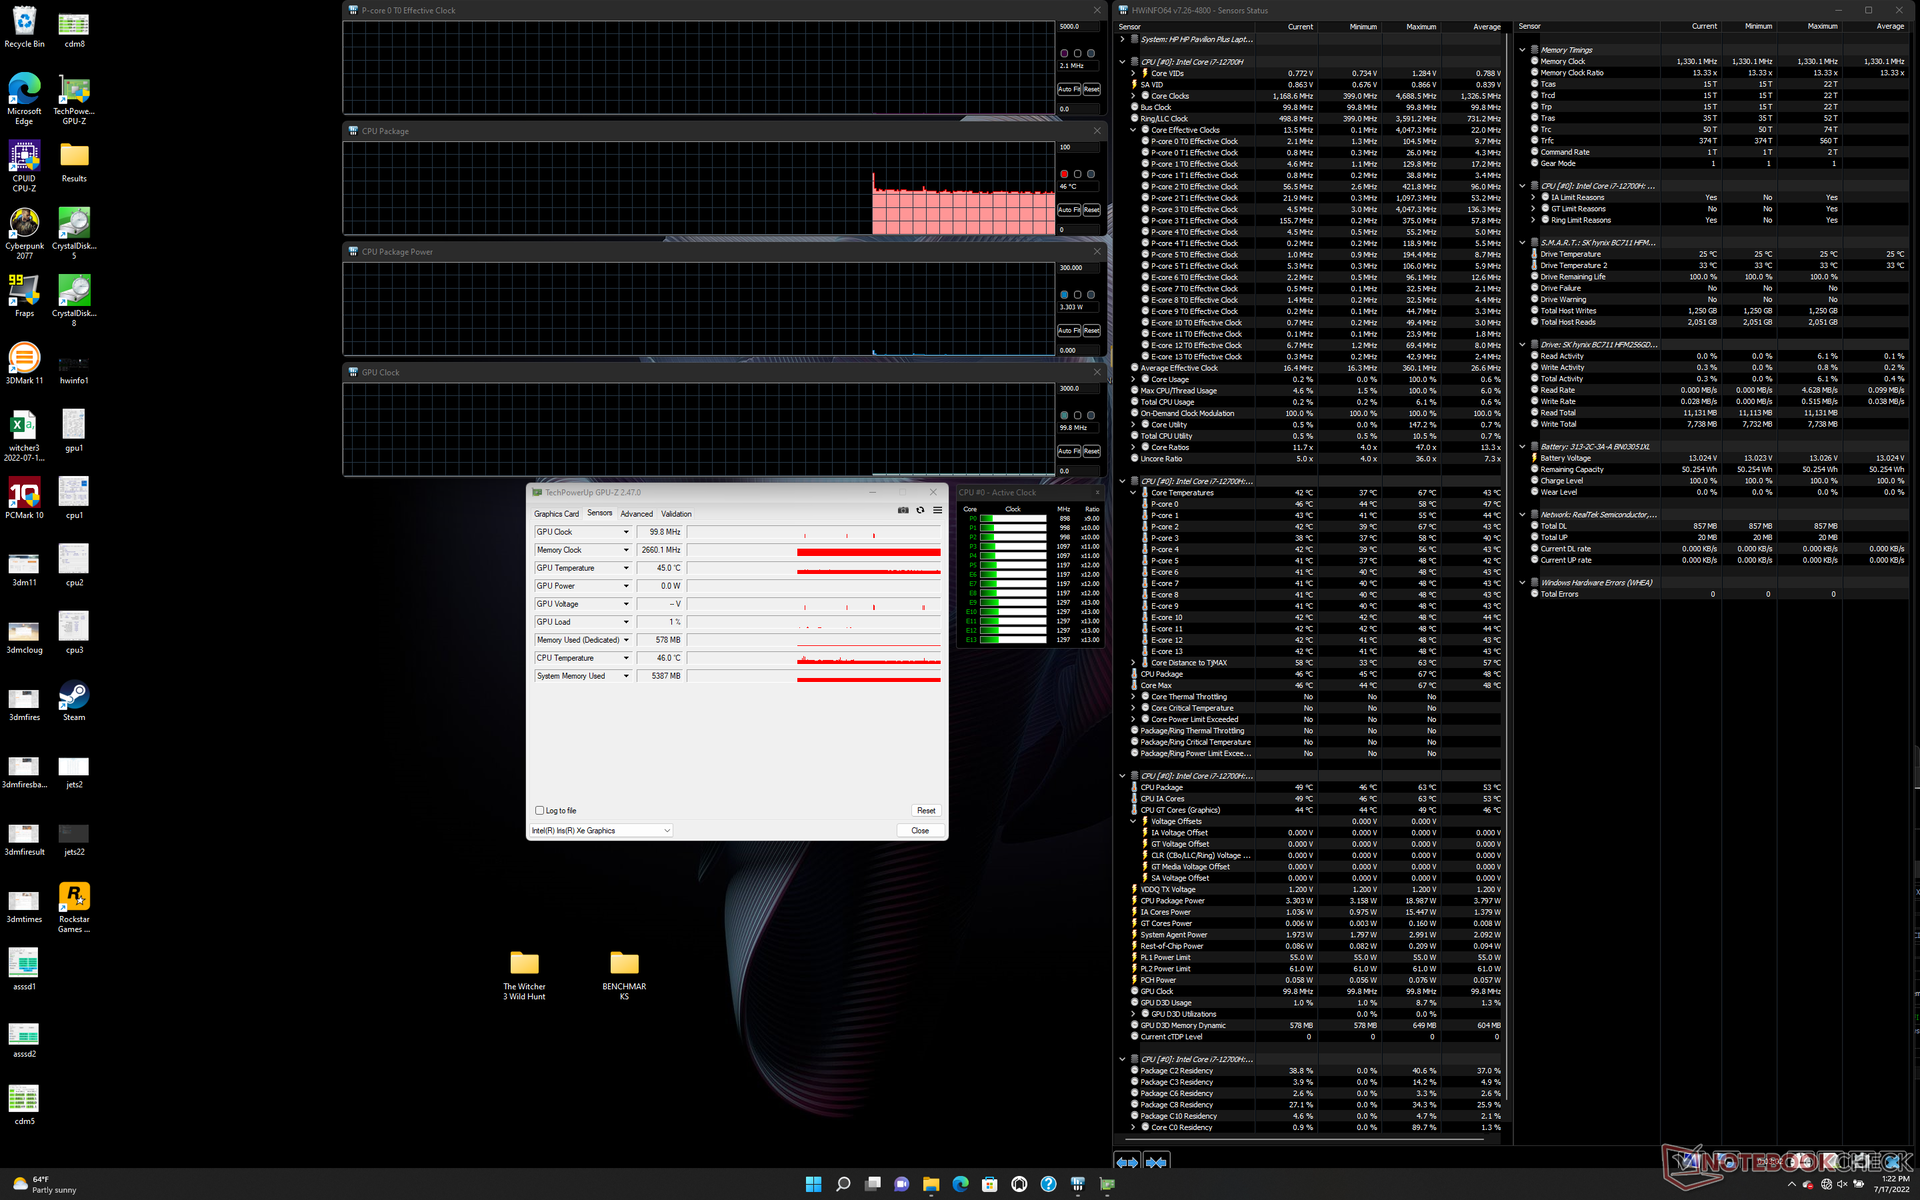
Wenn wir Prime95 ausführen, um die CPU zu belasten, steigen die Taktraten und die Leistungsaufnahme des Gehäuses in den ersten paar Sekunden auf 3,5 GHz bzw. 60 W, bis eine Kerntemperatur von 95 °C erreicht wird. Danach sinken die Taktraten und die Leistungsaufnahme des Gehäuses auf den Bereich von 2,2 bis 2,9 GHz bzw. 45 W bei einer konstanten, etwas kühleren Kerntemperatur von knapp 90 °C. Im Vergleich dazu stabilisieren sich viele 14-Zoll-Laptops mit Core U, wie z. B. der Dell Inspiron 7420, bei deutlich kühleren Temperaturen von etwa 70 °C. Die Auswirkung der anspruchsvolleren Core i7-12700H CPU in unserem HP auf die Temperaturen sind offensichtlich.
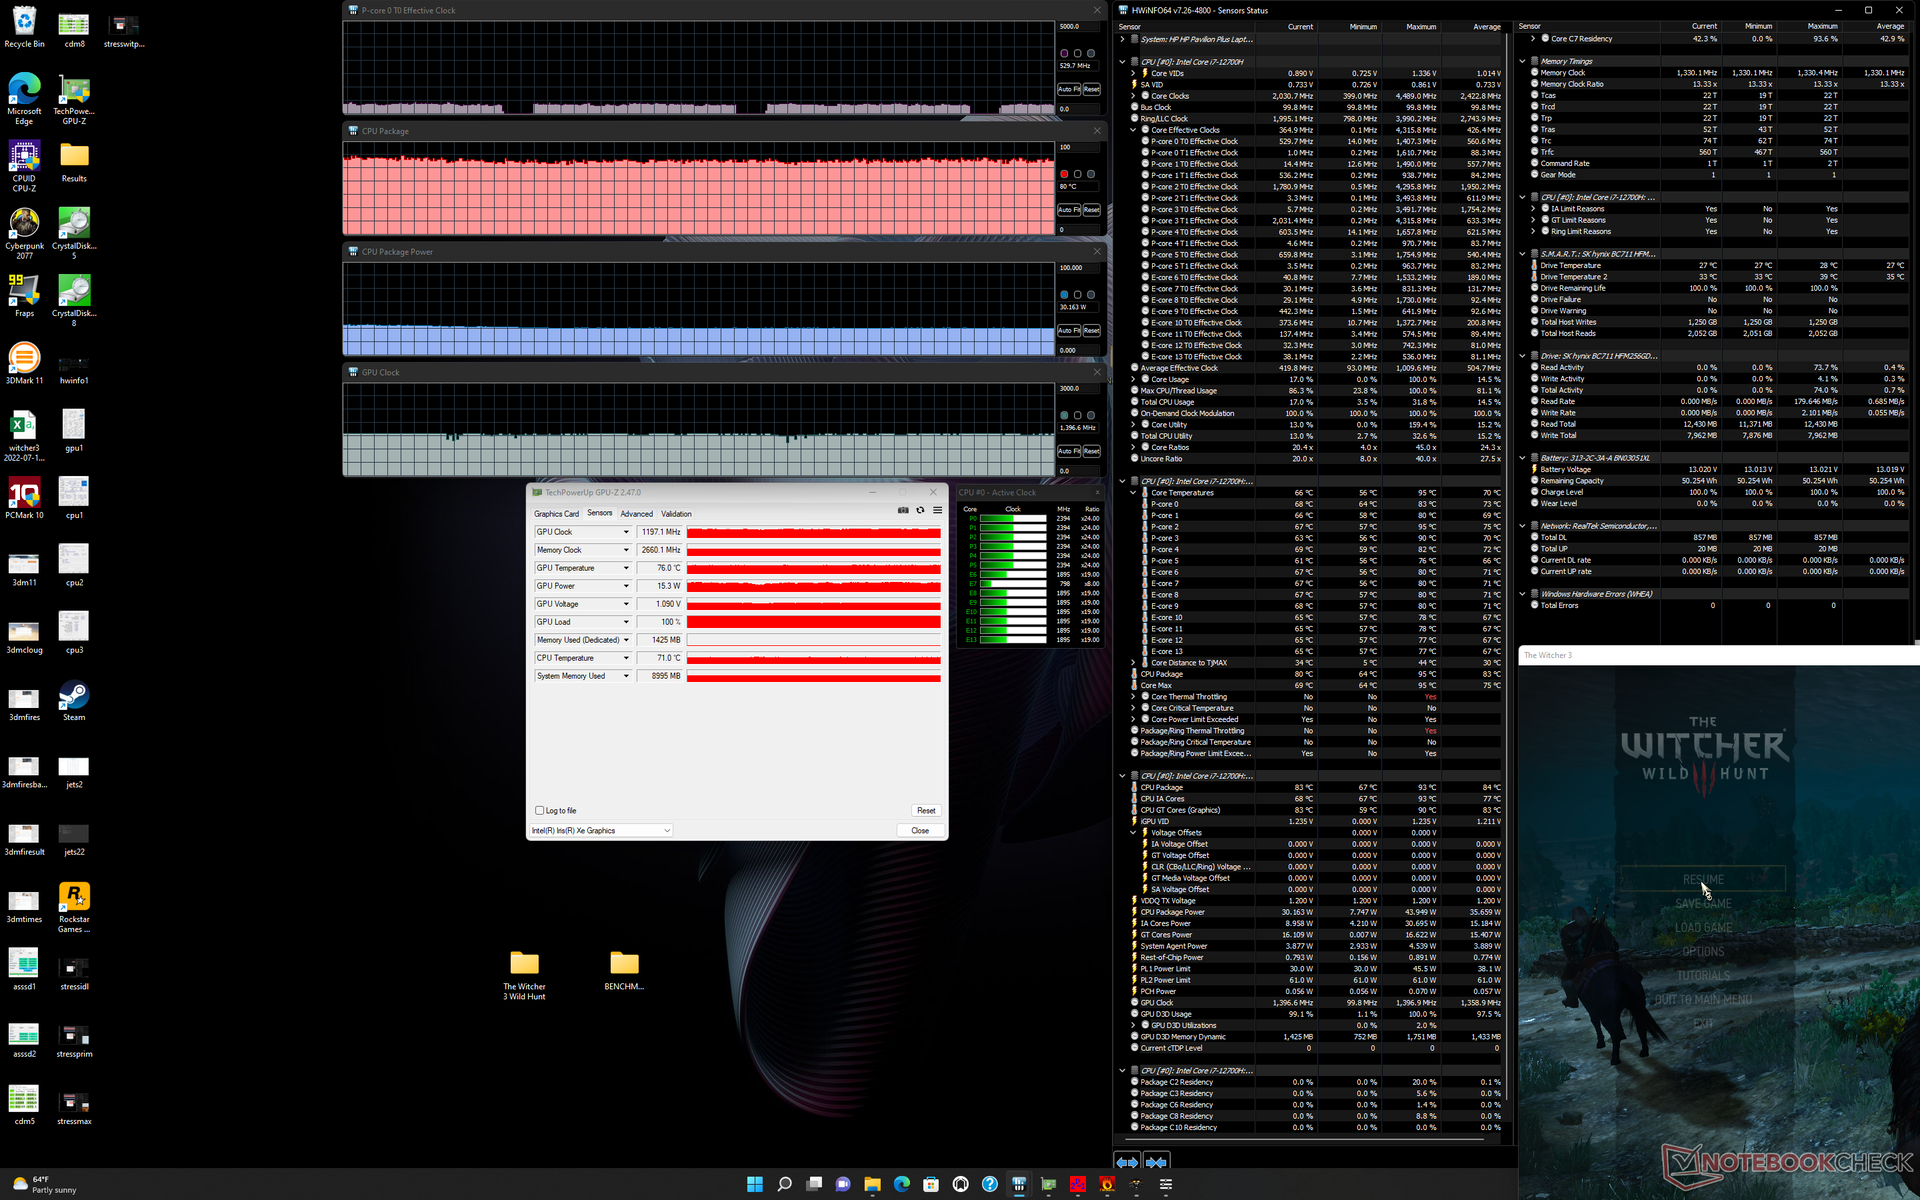
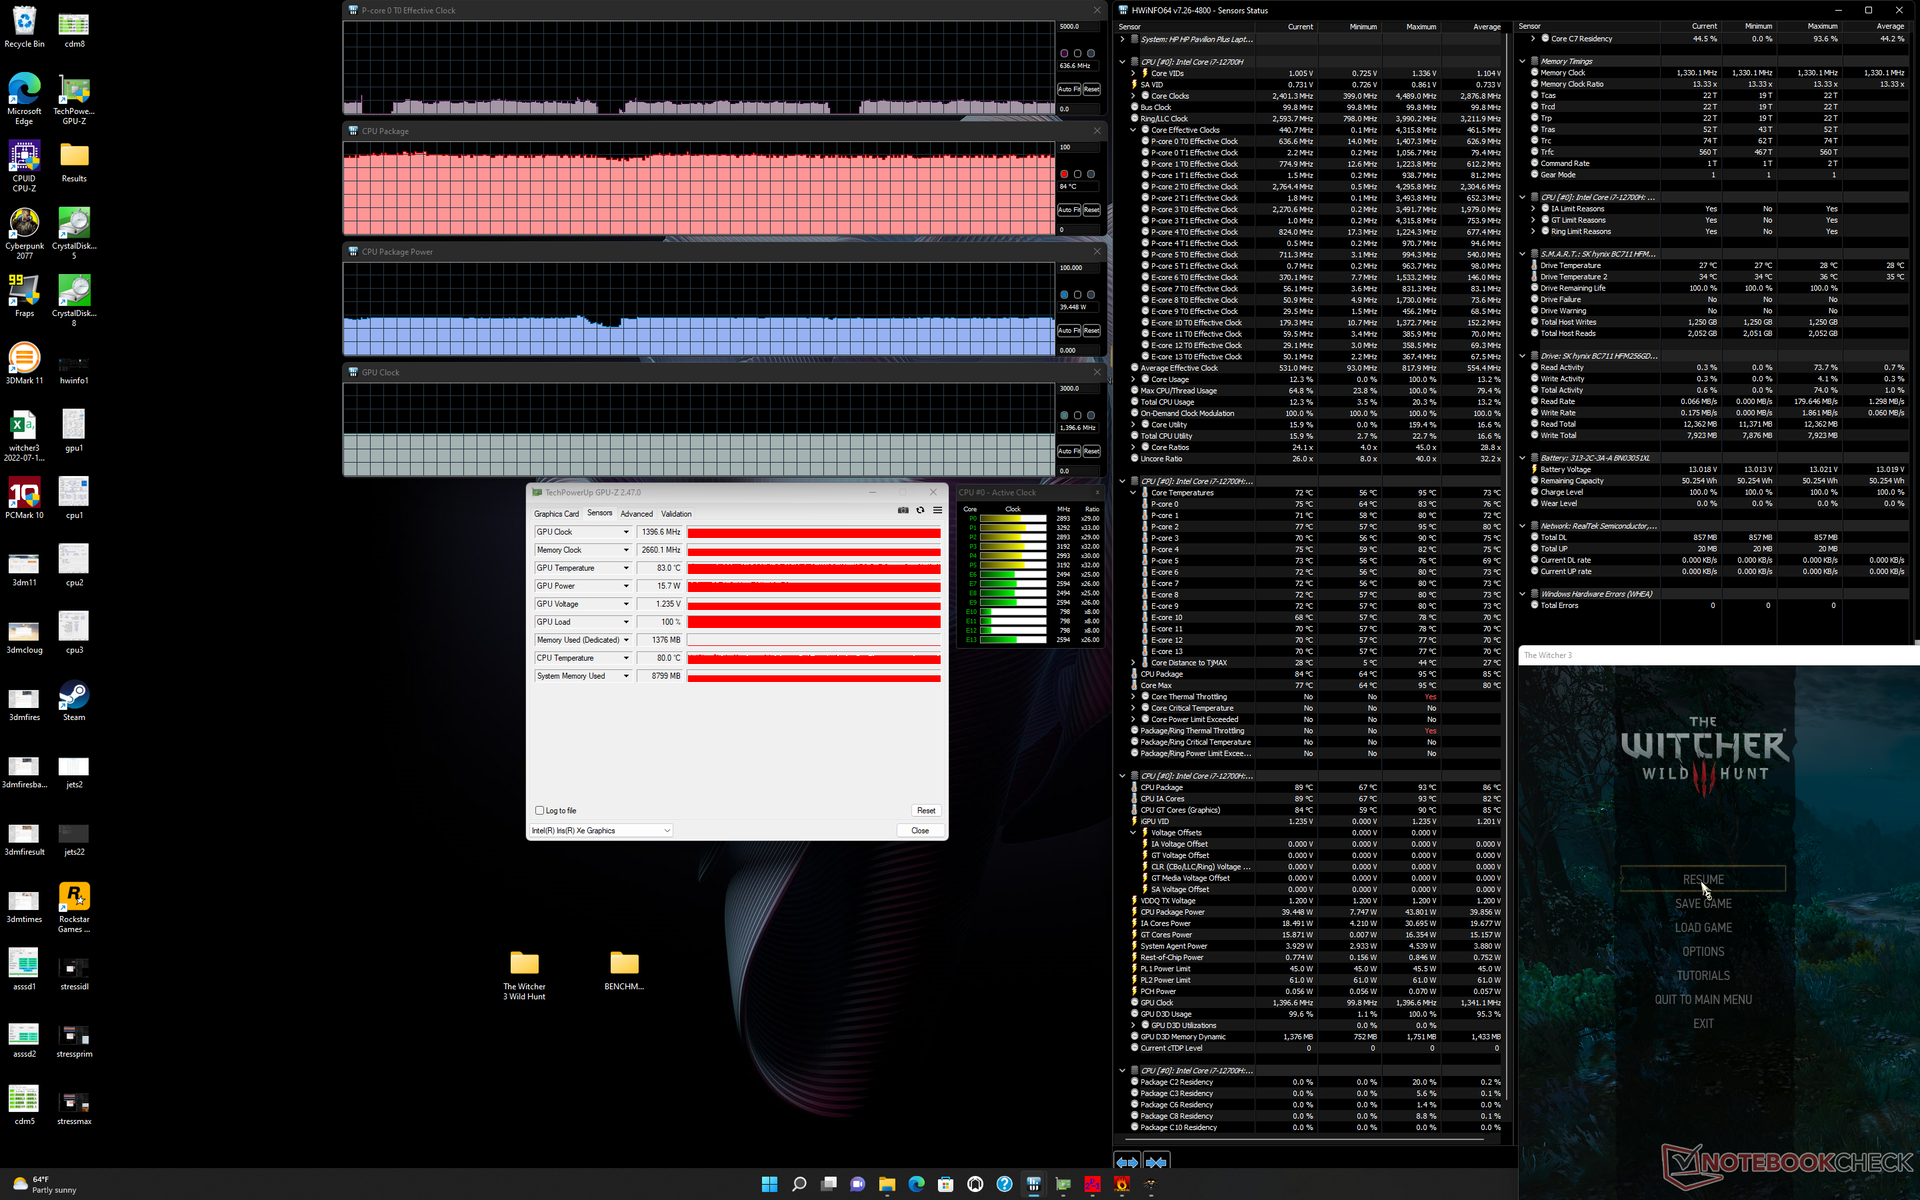
Wenn wir Witcher 3 im Performance-Modus laufen lassen, um eine hohe Belastung darzustellen, stabilisieren sich die GPU-Taktrate und die Temperatur bei 1397 MHz bzw. 84 °C, verglichen mit nur 1197 MHz und 80 °C im Balanced-Modus. Diese Kerntemperaturen sind wiederum wärmer, als wir von einem 14-Zoll-Laptop ohne diskrete Grafikkarte erwarten würden.
Der Akkubetrieb schränkt die Leistung ein. Ein 3DMark 11-Durchlauf im Akkubetrieb ergab Physik- und Grafik-Scores von 12896 bzw. 5591 Punkten, verglichen mit 16077 und 6649 Punkten im Netzbetrieb.
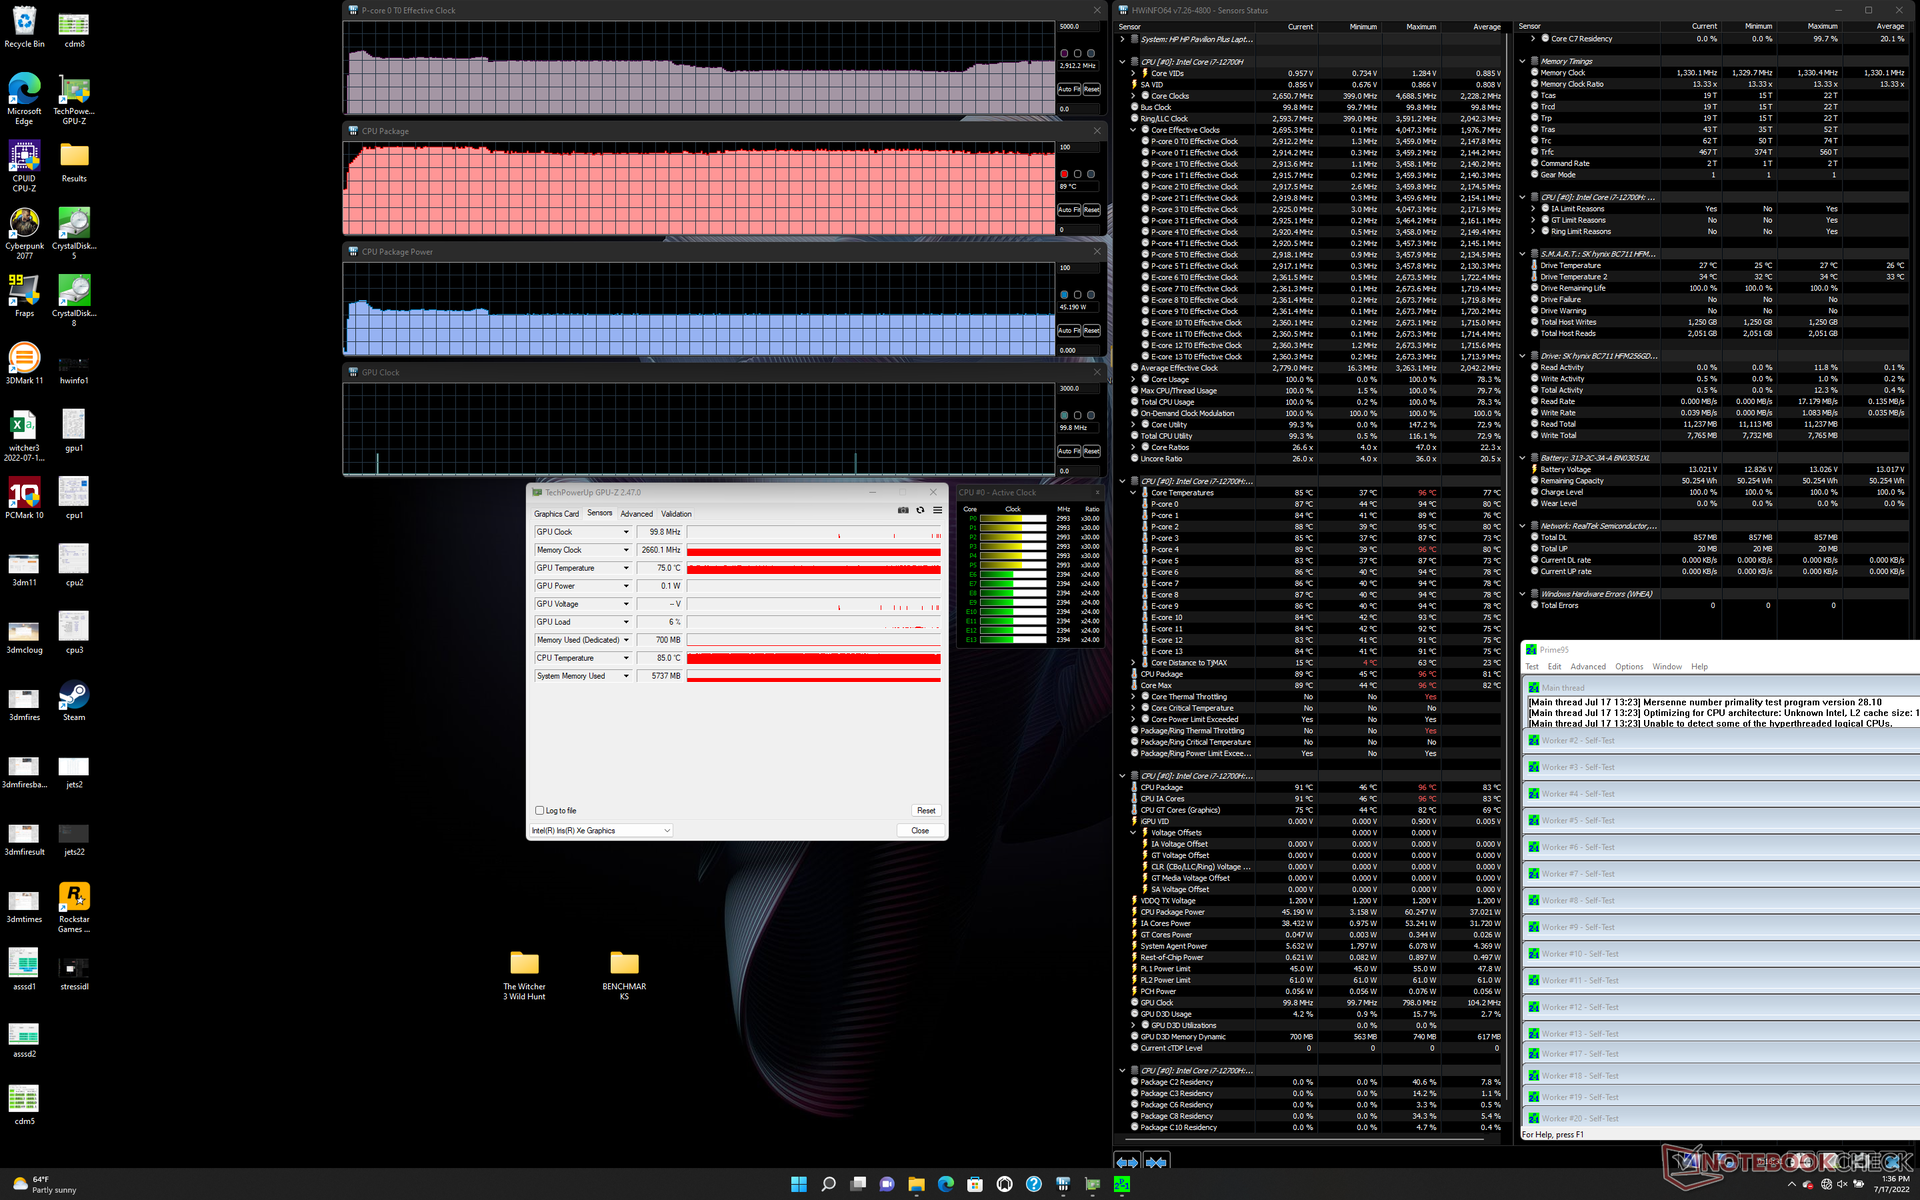

| CPU Clock (GHz) | GPU Clock (MHz) | Durchschnittliche CPU-Temperatur (°C) | |
| System Idle | -- | -- | 46 |
| Prime95 Stress | 2.2 - 2.9 | -- | 89 |
| Prime95 + FurMark Stress | 2.2 - 2.3 | 948 | 88 |
| Witcher 3 Stress (Balance-Modus) | ~0.5 | 1197 | 80 |
| Witcher 3 Stress (Performance-Modus) | ~0.7 | 1397 | 84 |
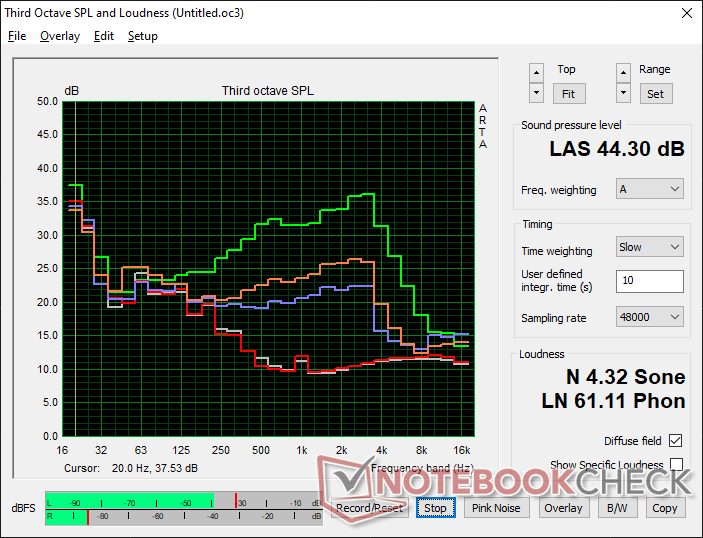
Lautsprecher

HP Pavilion Plus 14 eh0097nr Audio Analyse
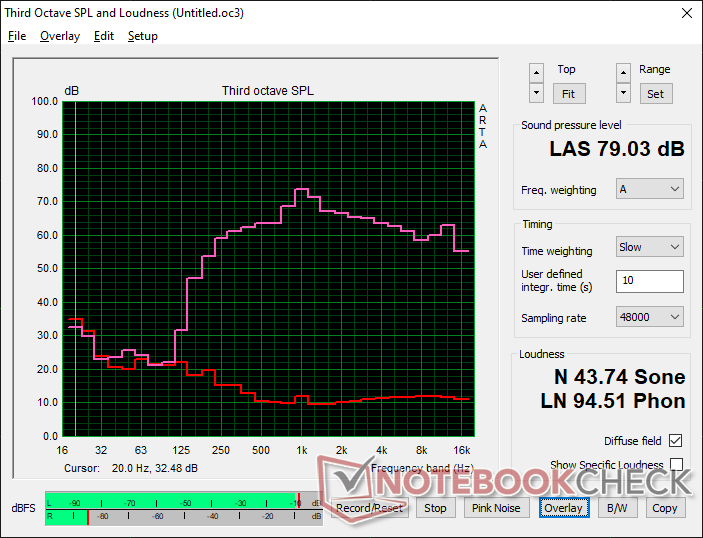
(±) | Mittelmäßig laut spielende Lautsprecher (79 dB)
Bass 100 - 315 Hz
(-) | kaum Bass - 16.8% niedriger als der Median
(±) | durchschnittlich lineare Bass-Wiedergabe (13.1% Delta zum Vorgänger)
Mitteltöne 400 - 2000 Hz
(+) | ausgeglichene Mitten, vom Median nur 4.5% abweichend
(+) | lineare Mitten (4.9% Delta zum Vorgänger)
Hochtöne 2 - 16 kHz
(+) | ausgeglichene Hochtöne, vom Median nur 2% abweichend
(+) | sehr lineare Hochtöne (2.7% Delta zum Vorgänger)
Gesamt im hörbaren Bereich 100 - 16.000 Hz
(±) | hörbarer Bereich ist durchschnittlich linear (15.2% Abstand zum Median)
Im Vergleich zu allen Geräten derselben Klasse
» 30% aller getesteten Geräte dieser Klasse waren besser, 4% vergleichbar, 66% schlechter
» Das beste Gerät hat einen Delta-Wert von 5%, durchschnittlich ist 18%, das schlechteste Gerät hat 45%
Im Vergleich zu allen Geräten im Test
» 17% aller getesteten Geräte waren besser, 4% vergleichbar, 79% schlechter
» Das beste Gerät hat einen Delta-Wert von 4%, durchschnittlich ist 25%, das schlechteste Gerät hat 134%
Apple MacBook Pro 16 2021 M1 Pro Audio Analyse
(+) | Die Lautsprecher können relativ laut spielen (84.7 dB)
Bass 100 - 315 Hz
(+) | guter Bass - nur 3.8% Abweichung vom Median
(+) | lineare Bass-Wiedergabe (5.2% Delta zum Vorgänger)
Mitteltöne 400 - 2000 Hz
(+) | ausgeglichene Mitten, vom Median nur 1.3% abweichend
(+) | lineare Mitten (2.1% Delta zum Vorgänger)
Hochtöne 2 - 16 kHz
(+) | ausgeglichene Hochtöne, vom Median nur 1.9% abweichend
(+) | sehr lineare Hochtöne (2.7% Delta zum Vorgänger)
Gesamt im hörbaren Bereich 100 - 16.000 Hz
(+) | hörbarer Bereich ist sehr linear (4.6% Abstand zum Median
Im Vergleich zu allen Geräten derselben Klasse
» 0% aller getesteten Geräte dieser Klasse waren besser, 0% vergleichbar, 100% schlechter
» Das beste Gerät hat einen Delta-Wert von 5%, durchschnittlich ist 18%, das schlechteste Gerät hat 45%
Im Vergleich zu allen Geräten im Test
» 0% aller getesteten Geräte waren besser, 0% vergleichbar, 100% schlechter
» Das beste Gerät hat einen Delta-Wert von 4%, durchschnittlich ist 25%, das schlechteste Gerät hat 134%
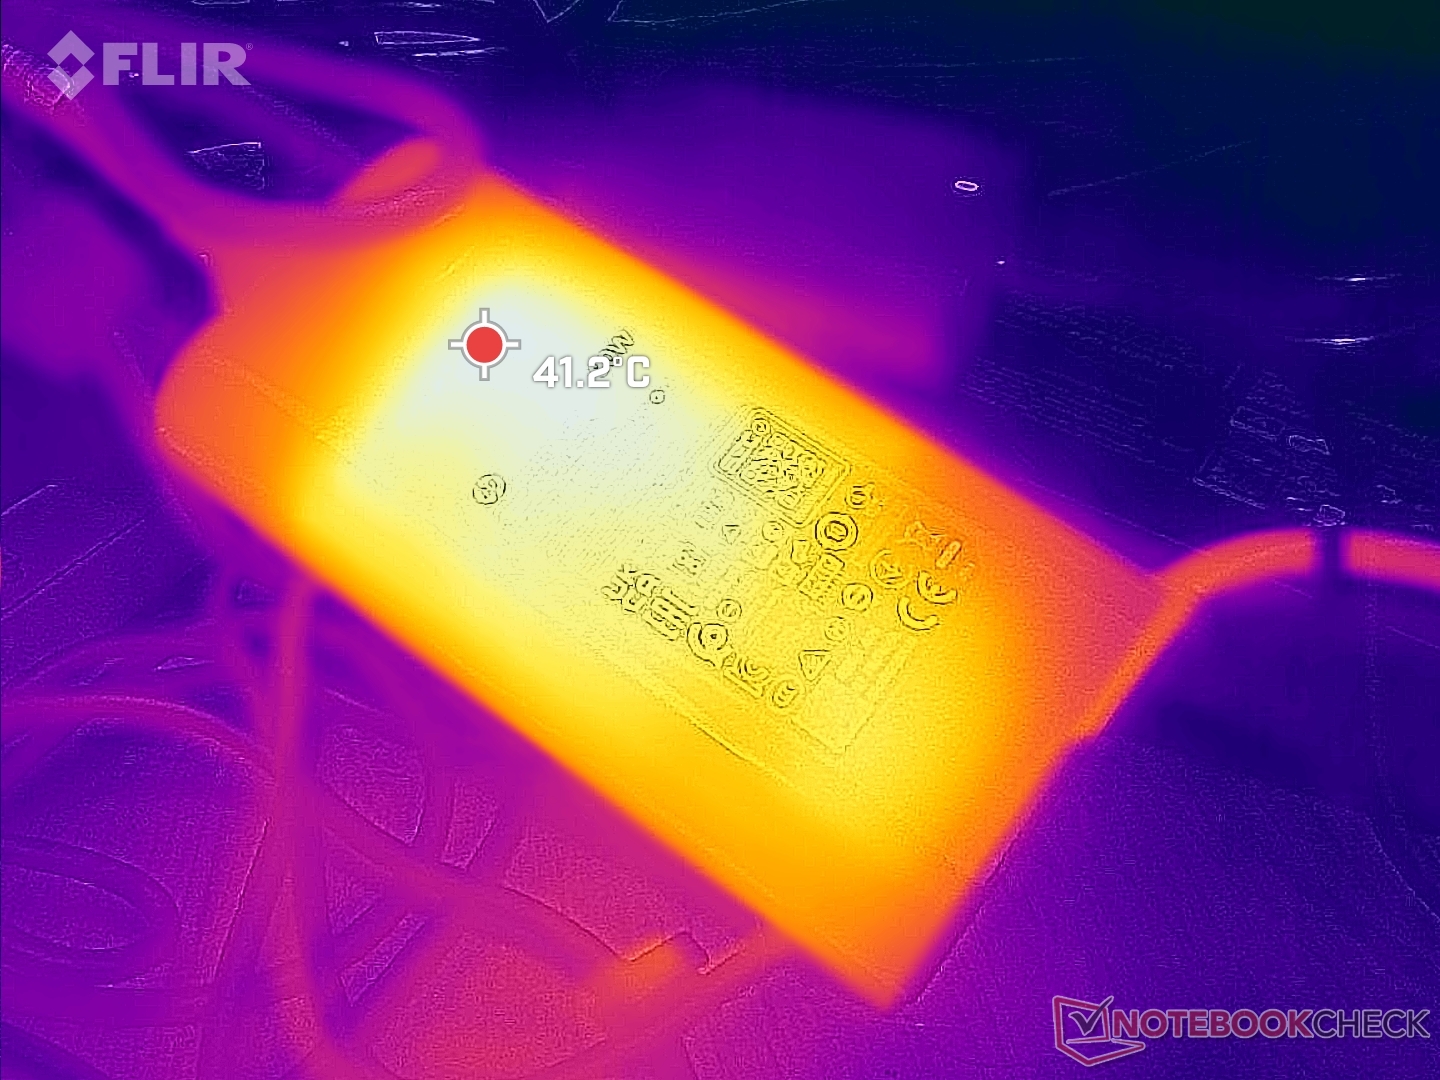
Energiemanagement – anspruchsvolles System
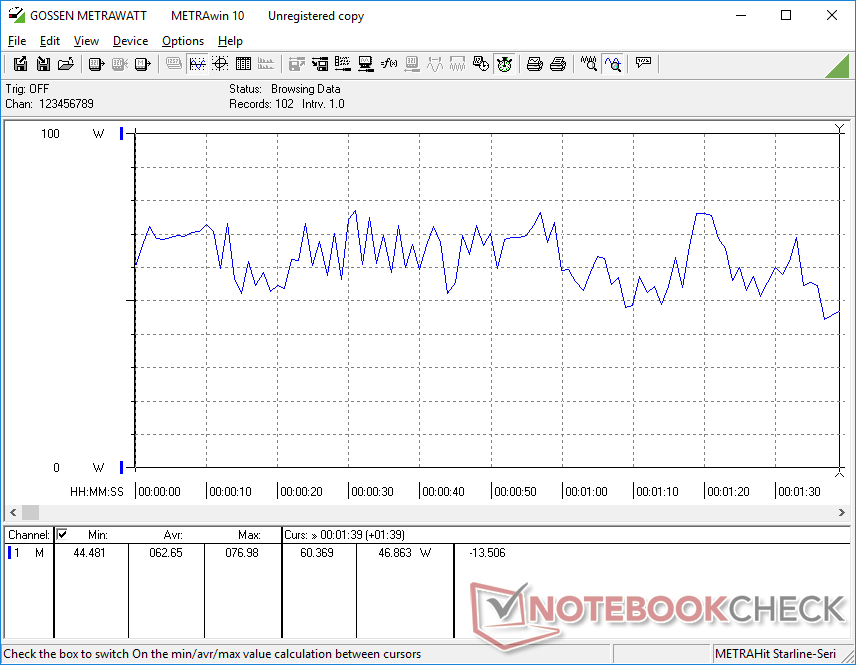
Stromverbrauch
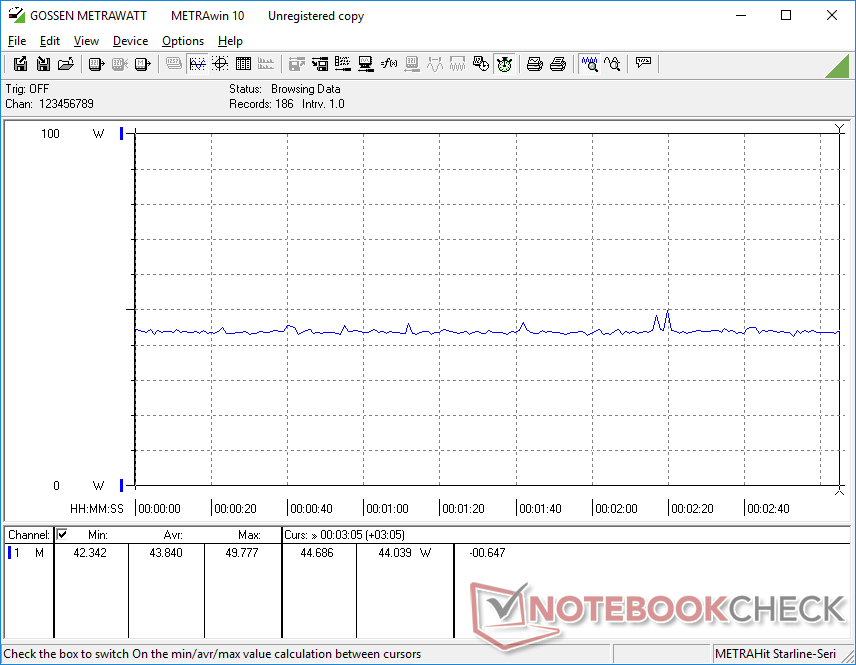
Der Stromverbrauch ist im Allgemeinen höher als bei anderen 14-Zoll-Laptops mit CPUs der Core U-Serie. Der standardmäßige Core i5-1135G7 Pavilion 14 ist zum Beispiel beim Ausführen von Prime95 69 Prozent stromsparender, was mit seiner 65 bis 70 Prozent langsameren Multi-Thread-Leistung korreliert, wie oben beschrieben. Der Stromverbrauch kann auch im Leerlauf auf dem Desktop höher sein, da OLED bei der Darstellung von weißen Farben mehr Strom verbraucht als IPS. Ein überwiegend schwarzer Bildschirm bei maximaler Helligkeit verbraucht im Leerlauf beispielsweise nur 6 W, während ein komplett weißer Bildschirm bei maximaler Helligkeit über 19 W verbraucht. Im Vergleich dazu verbraucht das Lenovo Yoga Slim 7i Pro unter ähnlichen Bedingungen nur 10 W. Es ist wahrscheinlich kein Zufall, dass der voreingestellte Desktop-Hintergrund überwiegend schwarz ist – HP ist sich bewusst, dass diese Option stromsparender ist als ein farbenfroher Hintergrund.
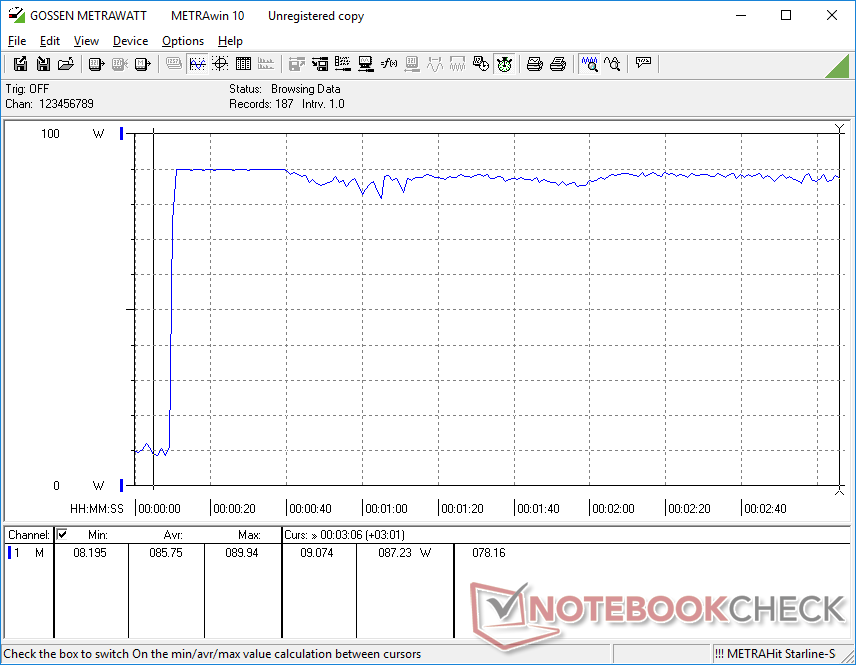
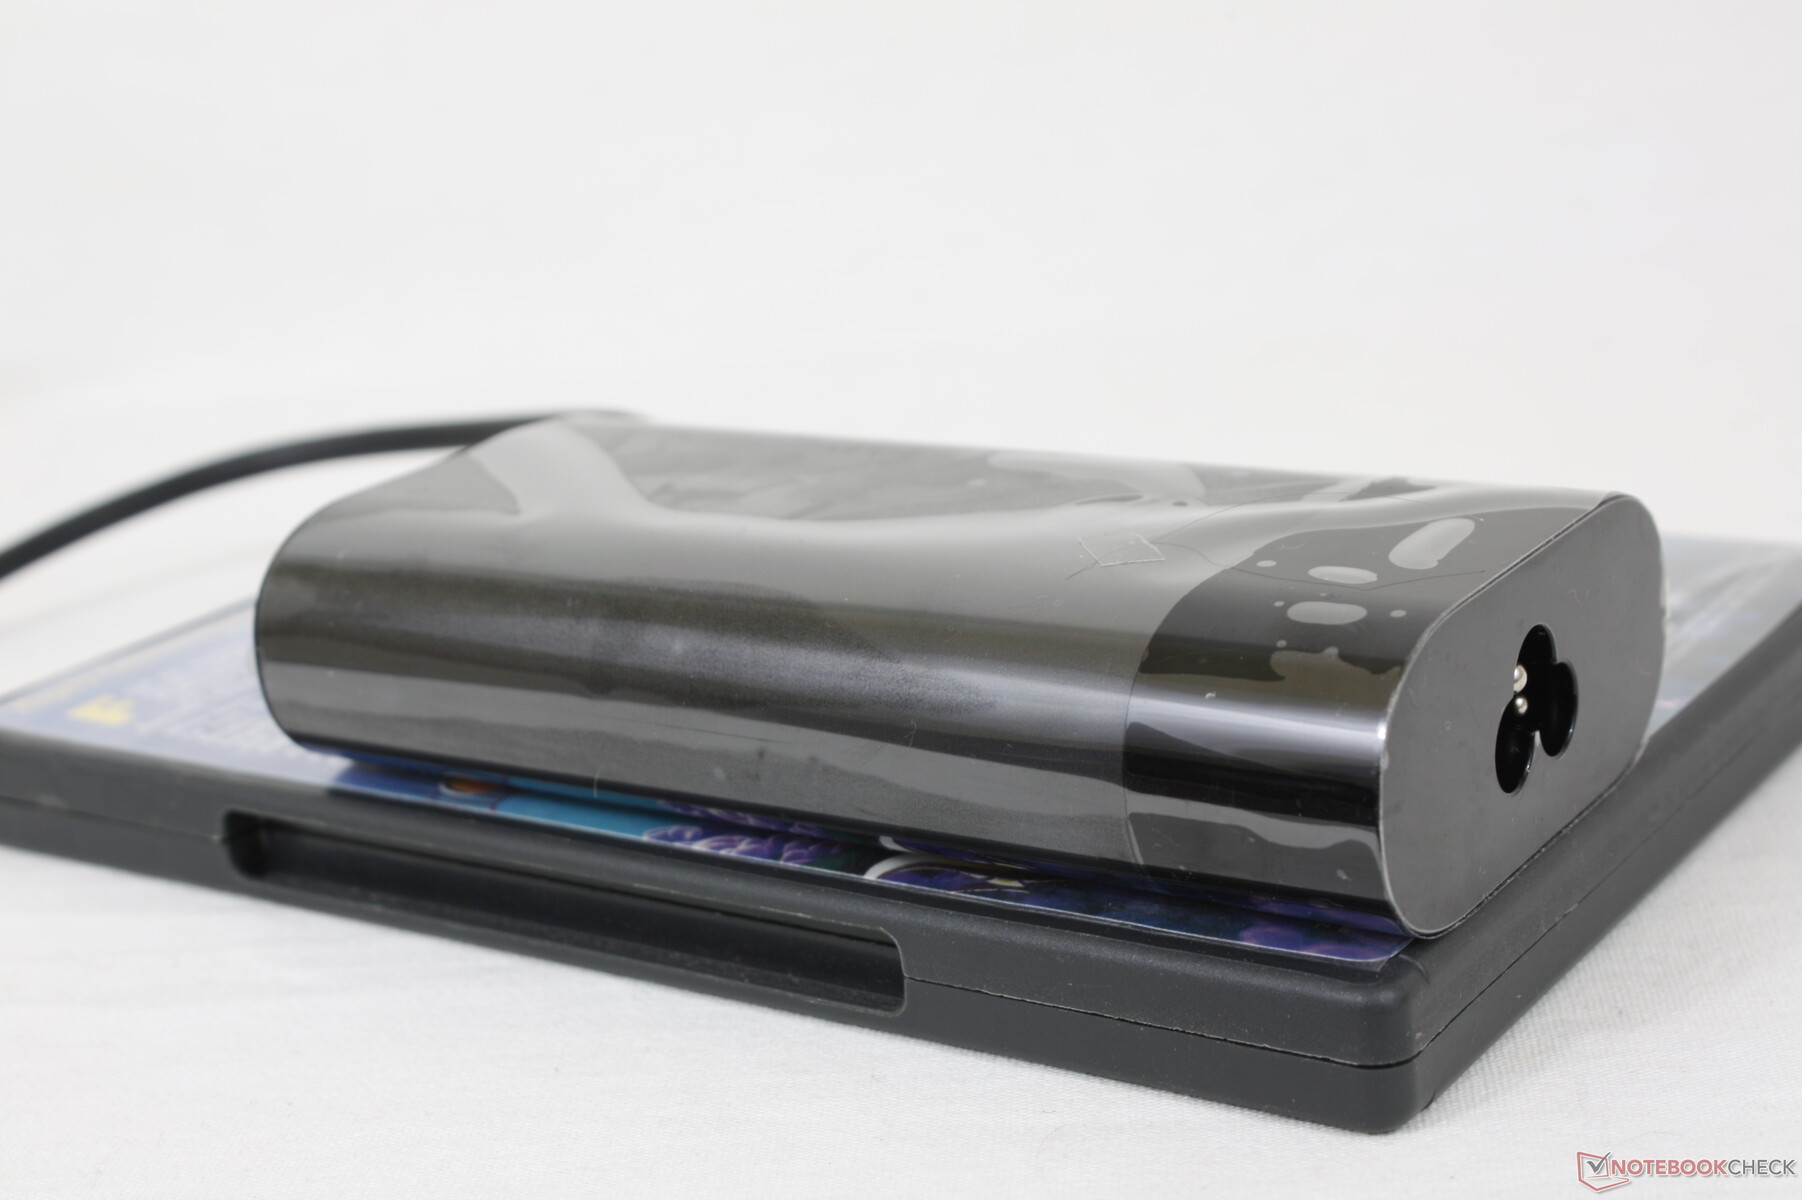
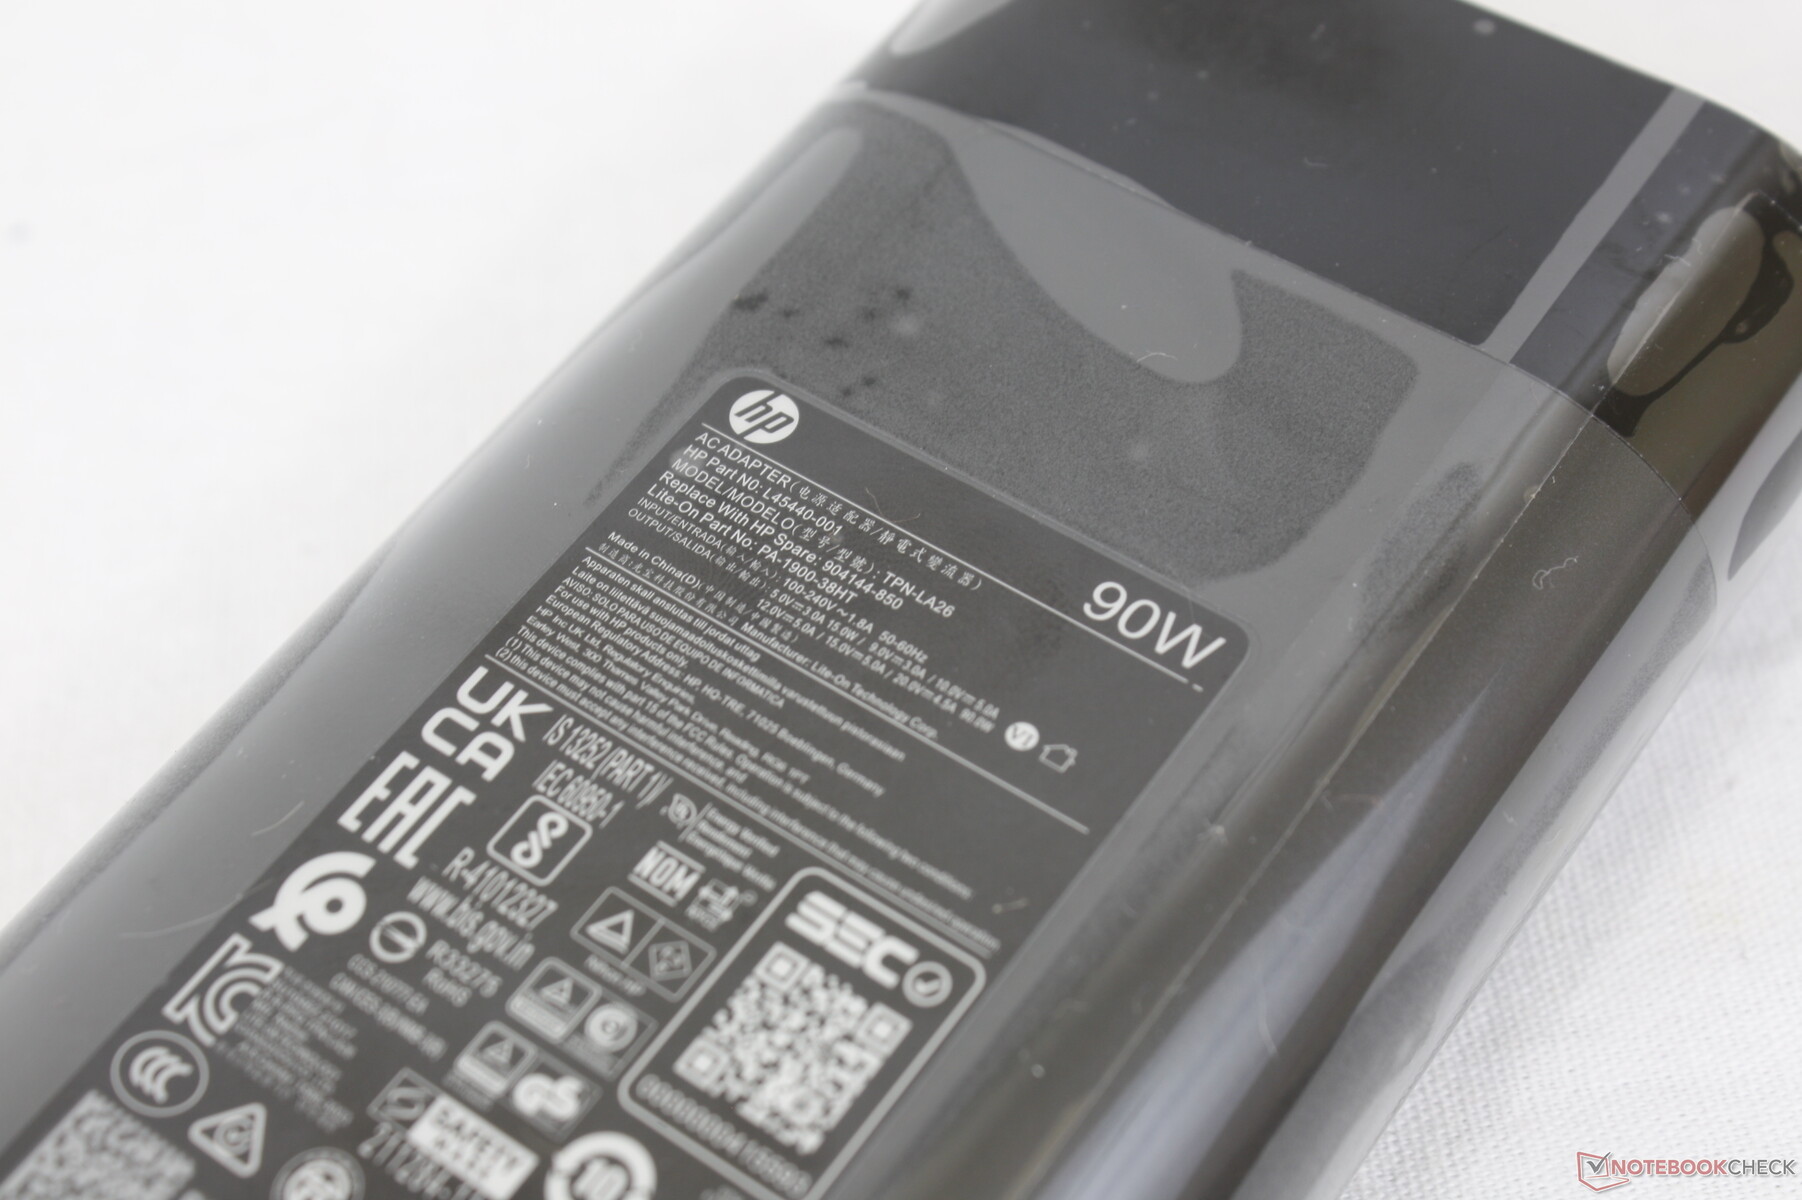
Mit dem mittelgroßen (ca. 13 x 6,5 x 2,9 cm) 90-W-Netzteil konnten wir unter Prime95-Stress eine maximale Leistungsaufnahme von 90 W verzeichnen. Dieser Höchstwert sinkt im Laufe der Zeit nicht besonders stark ab. Benutzer müssen also damit rechnen muss, dass sich die Ladegeschwindigkeit bei anspruchsvolleren Anwendungen verlangsamt.

| Aus / Standby | |
| Idle | |
| Last |
|
Legende:
min: Derzeit nutzen wir das Metrahit Energy, ein professionelles TRMS Leistungs-Multimeter und PQ Analysator, für unsere Messungen. Mehr Details zu dem Messgerät finden Sie hier. Alle unsere Testmethoden beschreiben wir in diesem Artikel. | |
| HP Pavilion Plus 14 eh0097nr i7-12700H, Iris Xe G7 96EUs, SK Hynix BC711 HFM256GD3GX013N, OLED, 2880x1800, 14.00 | Asus Vivobook Pro 14 M3401QC-KM007T R5 5600H, GeForce RTX 3050 4GB Laptop GPU, Intel SSD 670p SSDPEKNU512GZ, OLED, 2880x1800, 14.00 | Dell Inspiron 14 7420 2-in-1 i7-1255U, Iris Xe G7 96EUs, WDC PC SN530 SDBPMPZ-512G, IPS, 1920x1200, 14.00 | Lenovo Yoga Slim 7i Pro 14IAP G7 i5-1240P, Iris Xe G7 80EUs, Samsung PM9A1 MZVL2512HCJQ, IPS, 2880x1800, 14.00 | MSI Modern 14 B11SB-085 i7-1165G7, GeForce MX450, Kingston OM8PCP3512F-AB, IPS, 1920x1080, 14.00 | HP Pavilion 14-dv0357ng i5-1135G7, Iris Xe G7 80EUs, Intel Optane Memory H10 with Solid State Storage 32GB + 1TB HBRPEKNX0203AH(L/H), IPS, 1920x1080, 14.00 | |
|---|---|---|---|---|---|---|
| Stromverbrauch | -22% | 17% | 10% | 5% | 20% | |
| Idle min * | 5.6 | 6.6 -18% | 5.2 7% | 5.6 -0% | 3 46% | 4.8 14% |
| Idle avg * | 6.1 | 9.6 -57% | 8.2 -34% | 9.3 -52% | 6.3 -3% | 8.5 -39% |
| Idle max * | 19.4 | 7.3 62% | 9.9 49% | 9.6 51% | 10.3 47% | 12.4 36% |
| Last avg * | 62.7 | 73 -16% | 44.4 29% | 49 22% | 66 -5% | 37.7 40% |
| Witcher 3 ultra * | 43.8 | 74.4 -70% | 35 20% | 38.2 13% | 66.6 -52% | 35.4 19% |
| Last max * | 90 | 119 -32% | 62.5 31% | 65.2 28% | 90.6 -1% | 45.3 50% |
* ... kleinere Werte sind besser
Energieverbrauch Witcher 3 / Stresstest
Stromverbrauch mit externem Monitor
Akkulaufzeit
Die Laufzeiten sind bestenfalls durchschnittlich, was wahrscheinlich darauf zurückzuführen ist, dass sowohl OLED als auch eine Core-CPU der H-Serie statt der effizienteren U- oder P-Serie verwendet werden. Es hilft auch nicht, dass die meisten Webseiten überwiegend weiß sind, was den Akku noch mehr beansprucht. Beim Surfen im Internet mit dem Balanced-Energieprofil konnten wir nur eine Akkulaufzeit von 4,5 Stunden erreichen, verglichen mit fast dem Doppelten beim MSI Modern 14 oder Lenovo Yoga Slim 7i Pro.
Das Aufladen von der leeren auf die volle Kapazität mit dem mitgelieferten Ladegerät dauert 2 bis 2,5 Stunden.
| HP Pavilion Plus 14 eh0097nr i7-12700H, Iris Xe G7 96EUs, 51 Wh | Asus Vivobook Pro 14 M3401QC-KM007T R5 5600H, GeForce RTX 3050 4GB Laptop GPU, 63 Wh | Dell Inspiron 14 7420 2-in-1 i7-1255U, Iris Xe G7 96EUs, 54 Wh | Lenovo Yoga Slim 7i Pro 14IAP G7 i5-1240P, Iris Xe G7 80EUs, 61 Wh | MSI Modern 14 B11SB-085 i7-1165G7, GeForce MX450, 52.4 Wh | HP Pavilion 14-dv0357ng i5-1135G7, Iris Xe G7 80EUs, 43 Wh | |
|---|---|---|---|---|---|---|
| Akkulaufzeit | 57% | 66% | 29% | 91% | 31% | |
| Idle | 506 | 687 36% | 954 89% | |||
| WLAN | 274 | 569 108% | 455 66% | 517 89% | 523 91% | 360 31% |
| Last | 89 | 112 26% | 127 43% | 61 -31% | ||
| H.264 | 643 | 356 | ||||
| Witcher 3 ultra | 121 |
Pro
Contra
Urteil – Spectre-Leistung ohne den Spectre-Preis
Das Pavilion Plus 14 ist einer der günstigsten Laptops mit einer Core i7 H-Series CPU der 12. Generation und einem 90 Hz OLED-Display auf dem Markt. Dank der schnellen CPU und dem OLED-Panel macht sich das Pavilion-System auch fünf Jahre nach seiner Einführung noch gut. Wir schätzen die einfache Wartung und die komfortable Tastatur, besonders bei einer preiswerten Serie wie dem Pavilion.
Ein ausgewogenes und erschwingliches System mit den neuesten Intel CPUs der 12. Generation und einem 90 Hz OLED-Display.
Es gibt einige Abstriche, die es zu beachten gilt. Zum einen wird die Akkulaufzeit durch die anspruchsvolle CPU und das OLED-Panel beeinträchtigt. Zweitens ist die GeForce RTX 2050 Option nur bei den Core-U SKUs verfügbar, was bedeutet, dass alle Core-H Konfigurationen sich mit der integrierten Grafikkarte begnügen müssen. Im Gegensatz dazu bietet das Asus VivoBook Pro 14 sowohl Ryzen H-Serie und GeForce RTX-Optionen sowie ein OLED-Display. Und schließlich ist die CPU-Leistung angesichts des Formfaktors zwar immer noch großartig, aber langsamer als bei den meisten anderen Laptops mit dem gleichen Core i7-12700H. Ein Kompromiss, der die kleinere Größere ermöglicht, bei leistungshungrigen Benutzern aber wahrscheinlich nicht beliebt sein wird. In Anbetracht des Preises bietet der Pavilion Plus 14 jedoch eine viel bessere Balance aus Erschwinglichkeit, Leistung, Funktionen und Größe als erwartet.
Preis und Verfügbarkeit
Das Pavilion Plus 14 ist ab sofort bei Staples, Walmart, und im offiziellen official HP store in verschiedenen Konfigurationen von 709 bis 1229 USD (~697-1276 Eur) erhältlich.
HP Pavilion Plus 14 eh0097nr
-
30.08.2022 v7
Translated


Preisvergleich

