Das MSI GT76 Titan ist eines der schnellsten — und lautesten — Laptops, die wir je getestet haben
Letztes Jahr wurde das leistungsstarke 17,3 Zoll große MSI GT76 Titan DTR vorgestellt, ausgerüstet mit einem Core i9-9900K und einer GeForce RTX 2080. Durch die Kombination einer vollwertigen Desktop-CPU und einer voll ausgebauten Geforce-GPU war es einer der schnellsten Gaming-Laptops, die man damals kaufen konnte. Das diesjährige Update legt nochmal eine Schippe drauf und tauscht CPU/GPU gegen noch potentere und neuere Komponenten wie dem Core i9-10900K und der mobilen GeForce RTX 2080 Super, vermutlich um sich auch weiterhin den Titel "schnellster Gaming-Laptop" sichern zu können.
Synthetischen Benchmarks wie CineBench und 3DMark zeigen, dass das 2020er GT76 Titan nur wenige Prozentpunkte hinter unserem Referenz-Desktop-PC mit der gleichen CPU/GPU-Kombination rangiert. Angesichts des deutlich engeren Laptop-Gehäuses sind die erreichten Benchmarkwerte und Temperaturen beeindruckend.
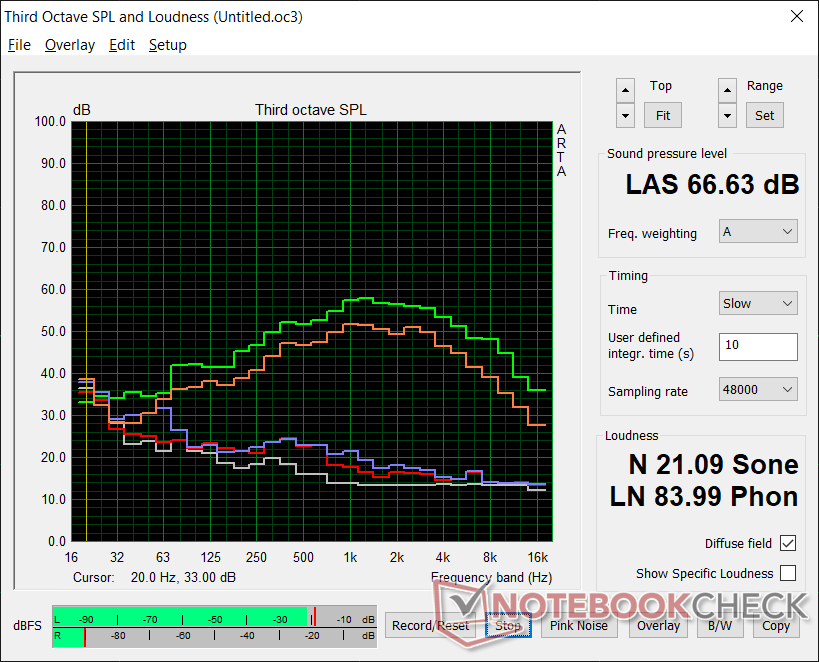
Aber ein großer Nachteil des GT76 — neben seiner gleich zwei sperrigen Netzteile — ist die Lüfterlautstärke. Bei kleineren Aufgaben wie Browsen oder Videostreaming agiert das Kühlsystem sogar leiser als erwartet, aber leider bewahrheitet sich das Gegenteil unter anspruchsvollen Lasten und dem Gaming. In Witcher 3 stellt sich beispielsweise eine Systemlautstärke von stabilen 60.7 dB(A) ein, andere Gaming-Laptops kommen hier "nur" auf ~50 dB(A). Dann hat MSI auch noch einen Turbo-Lüfter-Modus namens "Cooler Boost", welcher, sobald aktiviert, das Lüfterdröhnen sogar auf über 66 dB(A) anschwellen lässt. Andere Laptops erreichen sehr selten überhaupt die 60-dB(A)-Grenze.
Die gute Nachricht: Beim Spielen braucht eigentlich keiner den Cooler Boost. CPU- und GPU-Temperaturen sind mit 59 °C und 83 °C nur geringfügig höher (53 und 77 °C mit Cooler Boost), aber Frame- und Taktraten bleiben identisch, zumal die Lüfter dann leiser sind (60.7 dB(A) vs. 66.6 dB(A)). Der Cooler-Boost-Modus empfiehlt sich nur bei extremen Anwendungen, welche die Prozessoren zu 100 Prozent auslasten.
Natürlich ist die Lüfterlautstärke seit jeher ein Problem von potenten Gaming-Laptops, nicht nur dem GT76, welcher es allerdings auf die Spitze treibt. Wer nach einer extremen Leistung giert, wird unvermeidlich auch mit deutlich hörbaren Lüftern leben müssen. Wir hoffen nur, dass sich die kommende Laptop-Generation in genau diesem Bereich verbessert.
Cinebench R15: CPU Multi 64Bit | CPU Single 64Bit
Blender: v2.79 BMW27 CPU
7-Zip 18.03: 7z b 4 -mmt1 | 7z b 4
Geekbench 5.5: Single-Core | Multi-Core
HWBOT x265 Benchmark v2.2: 4k Preset
LibreOffice : 20 Documents To PDF
R Benchmark 2.5: Overall mean
| Cinebench R20 / CPU (Multi Core) | |
| Durchschnitt der Klasse Gaming (4029 - 16108, n=108, der letzten 2 Jahre) | |
| Intel Core i9-10900K | |
| Schenker XMG Apex 15 NH57AF1 | |
| MSI GT76 Titan DT 10SGS | |
| MSI GT76 Titan DT 9SG | |
| Cinebench R20 / CPU (Single Core) | |
| Durchschnitt der Klasse Gaming (442 - 895, n=108, der letzten 2 Jahre) | |
| Intel Core i9-10900K | |
| MSI GT76 Titan DT 9SG | |
| MSI GT76 Titan DT 10SGS | |
| Schenker XMG Apex 15 NH57AF1 | |
| Cinebench R15 / CPU Multi 64Bit | |
| Durchschnitt der Klasse Gaming (1578 - 6271, n=107, der letzten 2 Jahre) | |
| Schenker XMG Apex 15 NH57AF1 | |
| Intel Core i9-10900K | |
| MSI GT76 Titan DT 10SGS | |
| MSI GT76 Titan DT 9SG | |
| Cinebench R15 / CPU Single 64Bit | |
| Durchschnitt der Klasse Gaming (188.8 - 343, n=108, der letzten 2 Jahre) | |
| Intel Core i9-10900K | |
| MSI GT76 Titan DT 9SG | |
| MSI GT76 Titan DT 10SGS | |
| Schenker XMG Apex 15 NH57AF1 | |
| Blender / v2.79 BMW27 CPU | |
| Schenker XMG Apex 15 NH57AF1 | |
| MSI GT76 Titan DT 10SGS | |
| Intel Core i9-10900K | |
| Durchschnitt der Klasse Gaming (80 - 330, n=106, der letzten 2 Jahre) | |
| 7-Zip 18.03 / 7z b 4 -mmt1 | |
| Durchschnitt der Klasse Gaming (4199 - 7436, n=107, der letzten 2 Jahre) | |
| Intel Core i9-10900K | |
| MSI GT76 Titan DT 10SGS | |
| Schenker XMG Apex 15 NH57AF1 | |
| 7-Zip 18.03 / 7z b 4 | |
| Durchschnitt der Klasse Gaming (33491 - 148086, n=107, der letzten 2 Jahre) | |
| Schenker XMG Apex 15 NH57AF1 | |
| Intel Core i9-10900K | |
| MSI GT76 Titan DT 10SGS | |
| Geekbench 5.5 / Single-Core | |
| Durchschnitt der Klasse Gaming (986 - 2474, n=107, der letzten 2 Jahre) | |
| Intel Core i9-10900K | |
| MSI GT76 Titan DT 10SGS | |
| MSI GT76 Titan DT 9SG | |
| Schenker XMG Apex 15 NH57AF1 | |
| Geekbench 5.5 / Multi-Core | |
| Durchschnitt der Klasse Gaming (6460 - 27010, n=107, der letzten 2 Jahre) | |
| Intel Core i9-10900K | |
| MSI GT76 Titan DT 10SGS | |
| Schenker XMG Apex 15 NH57AF1 | |
| MSI GT76 Titan DT 9SG | |
| HWBOT x265 Benchmark v2.2 / 4k Preset | |
| Durchschnitt der Klasse Gaming (11.5 - 44.3, n=107, der letzten 2 Jahre) | |
| Intel Core i9-10900K | |
| MSI GT76 Titan DT 10SGS | |
| Schenker XMG Apex 15 NH57AF1 | |
| LibreOffice / 20 Documents To PDF | |
| Intel Core i9-10900K | |
| Schenker XMG Apex 15 NH57AF1 | |
| Durchschnitt der Klasse Gaming (33.2 - 88.8, n=107, der letzten 2 Jahre) | |
| MSI GT76 Titan DT 10SGS | |
| R Benchmark 2.5 / Overall mean | |
| MSI GT76 Titan DT 10SGS | |
| Schenker XMG Apex 15 NH57AF1 | |
| Intel Core i9-10900K | |
| Durchschnitt der Klasse Gaming (0.3439 - 0.759, n=108, der letzten 2 Jahre) | |
* ... kleinere Werte sind besser
| 3DMark 11 | |
| 1280x720 Performance GPU | |
| Nvidia GeForce RTX 2080 Super | |
| Alienware m17 R3 P45E | |
| MSI GT76 Titan DT 10SGS | |
| Asus Strix Scar 17 G732LXS | |
| 1280x720 Performance Combined | |
| MSI GT76 Titan DT 10SGS | |
| Asus Strix Scar 17 G732LXS | |
| Alienware m17 R3 P45E | |
| Nvidia GeForce RTX 2080 Super | |
Preisvergleich

