Intel Graphics 4-Cores iGPU (Arc) vs Intel Arc A550M
Intel Graphics 4-Cores iGPU (Arc) ► remove from comparison
Die Intel Graphics iGPU mit 4 Kernen ist eine integrierte Grafikkarte basierend auf die Xe LPG Architektur (ähnlich zu den dedizierten Arc GPUs, jedoch mit Fokus auf Effizienz). Sie bietet 4 Xe Kerne (64 Xe Vector Engines), 4 Raytracing Einheiten, 4 Sampler und 2 Pixel Backends.
Im Gegensatz zu der stärkeren Variante mit 8 Kernen in den H Meteor Lake CPUs, darf die kleine Variante nicht den Arc Namen nutzen.
Die iGPU unterstützt DirectX 12 Ultimate (wahrscheinlich DX 12_2 wie die Desktop Arc GPUs). Weiters unterstützt die Grafikeinheit XeSS AI Super Sampling.
Die Media Engine ist bei Meteor Lake im SOC Tile und unterstützt bis zu 8k60 10-bit HDR Encode und Deccode von MPEG2, AVC, VP9, HEVC und AV1. Die Display Engine ist ebenfalls im SoC Tile und unterstützt HDMI 2.1 und DisplayPort 2.1 20G mit bis zu 8K60 HDR.
Der GPU Tile des Meteor Lake Chips wird bei TSMC in 5nm (5N Prozess) gefertigt.
Intel Arc A550M ► remove from comparison
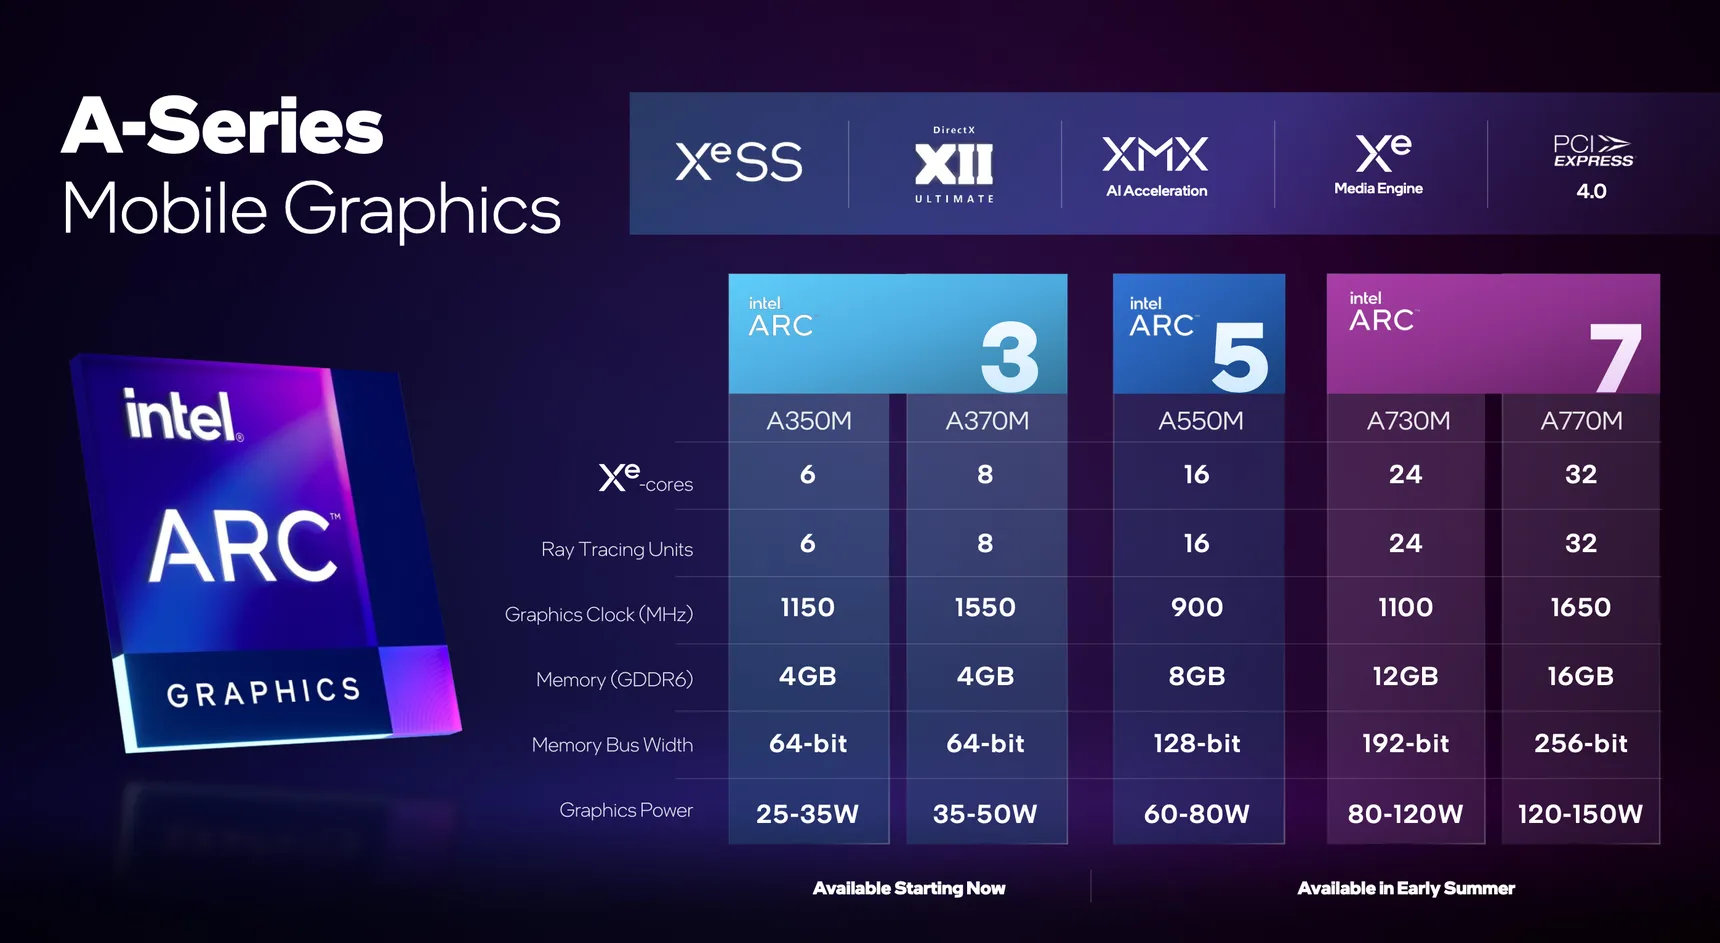
Die Intel Arc A550M (Device ID 5692) ist eine dedizierte Mittelklasse-Grafikkarte von Intel für Notebooks. Sie basiert auf den ACM-G10 Chip und bietet 16 der 32 Xe-Kerne (256 ALUs), 16 Ray-Tracing-Units, 3 MB L1-Cache und 16 MB L2-Cache. Die Kerne takten von 300 MHz über 900 MHz (Gaming) bis zu 2,05 GHz (Turbo). Das Speicherinterface ist 128 Bit breit und unterstützt 8 GB GDDR6 Grafikspeicher mit 14 Gbps. Der TGP ist zwischen 60 und 80 Watt je nach Modell.
Die Performance der A550M liegt in der unteren Mittelklasse von dedizierten Grafikkarten für Notebooks. Damit sollte die Performance wahrscheinlich zwischen Radeon RX 6500M und 6600M liegen und auch anspruchsvolle Spiele mit mittleren bis hohen Detailstufen flüssig darstellen können. Die langsamere Arc A370M basiert auf den kleineren ACM-G11 Chip und bietet eine deutlich schwächere Performance.
Der ACM-G10 Chip wird bei TSMC in 6nm gefertigt (N6 Prozess), nutzt ein BGA2660 Package, bietet 21,7 Mrd. Transistoren und ist 406 mm2 groß. Er integriert zwei Media Engines für VP9, AVC, HEVC, AV1 8k60 12-Bit HDR Dekodierung und 8k 10-Bit HDR Enkodierung. Die integrierten 4 Display Pipes unterstützen 4x 4k120 HDR, HDMI 2.0B, DP 2.0 10G und Adaptive Sync.
Mittels Deep Link kann mit einer CPU der 12. Generation (Alder Lake) Dynamic Power Share genutzt werden.
Intel Graphics 4-Cores iGPU (Arc) Intel Arc A550M Arc Serie Arc A770 4096 @ 2.1 - 2.4 GHz 256 Bit @ 16000 MHz Arc A750 3584 @ 2.05 - 2.4 GHz 256 Bit @ 16000 MHz Arc A580 3072 @ 1.7 - 2 GHz 256 Bit @ 16000 MHz A770M 512 @ 1.65 GHz 256 Bit @ 16000 MHz A730M 384 @ 1.1 GHz 192 Bit @ 14000 MHz A570M 16 @ 0.9 - 1.3 GHz 128 Bit @ 14000 MHz A550M 16 @ 0.9 - 2.01 GHz 128 Bit @ 14000 MHz A530M 12 @ 0.9 - 1.3 GHz 128 Bit @ 14000 MHz A370M 8 @ 1.55 GHz 64 Bit @ 14000 MHz Arc A380 1024 @ 2 GHz 96 Bit @ 15500 MHz A310 6 @ 2 GHz 64 Bit @ 15500 MHz A350M 6 @ 1.15 GHz 64 Bit @ 14000 MHz
Codename Meteor Lake iGPU Alchemist Architektur Xe LPG Xe HPG Pipelines 4 - unified 16 - unified Raytracing Cores 4 16 Kerntakt 1950 (Boost) MHz 900 - 2005 (Boost) MHz Cache L1: 768 KB L1: 3 MB, L2: 16 MB Shared Memory nein nein API DirectX 12_2, OpenGL 4.6, Vulkan 1.3 DirectX 12_2, Shader 6.6, OpenGL 4.6, OpenCL 3.0, Vulkan 1.3 Herstellungsprozess 5 nm 6 nm Displays HDMI 2.1, DisplayPort 2.1 20G 4 Displays (max.), HDMI 2.0b, DisplayPort 2.0 10G Ready Erscheinungsdatum 14.12.2023 30.03.2022 TMUs 128 ROPs 64 Speichertakt 14000 effective = 1750 MHz Speicherbandbreite 128 Bit Speichertyp GDDR6 Max. Speichergröße 8 GB Memory Bandwidth 224 GB/s Stromverbrauch 80 Watt (60 - 80 Watt TGP) Transistors 21.7 Billion Die Size 406 mm² PCIe 4 16x Herstellerseite ark.intel.com
Benchmarks 3DMark - 3DMark Time Spy Score
min: 1876 avg: 2063 median: 1922 (6%) max: 2315 Points
6320 Points (18%)
3DMark - 3DMark Time Spy Graphics
min: 1668 avg: 1840 median: 1712 (5%) max: 2067 Points
5830 Points (15%)
3DMark - 3DMark Cloud Gate Score
min: 20124 avg: 22079 median: 22433.5 (24%) max: 23325 Points
3DMark - 3DMark Cloud Gate Graphics
min: 25786 avg: 28204 median: 28416.5 (7%) max: 30198 Points
3DMark - 3DMark Fire Strike Standard Score
min: 3952 avg: 4756 median: 4975 (9%) max: 5179 Points
12900 Points (23%)
3DMark - 3DMark Fire Strike Standard Graphics
min: 4284 avg: 5085 median: 5390 (6%) max: 5498 Points
14350 Points (16%)
3DMark - 3DMark Wild Life Extreme Unlimited
3681 Points (4%)
3DMark 11 - 3DM11 Performance Score
min: 6340 avg: 7204 median: 7264 (10%) max: 7589 Points
3DMark 11 - 3DM11 Performance GPU
min: 6007 avg: 6724 median: 6741 (6%) max: 7107 Points
Cinebench R15 + Intel Graphics 4-Cores iGPU (Arc) Cinebench R15 - Cinebench R15 OpenGL 64 Bit
min: 98.4 avg: 104.4 median: 104 (6%) max: 112 fps
Cinebench R15 OpenGL Ref. Match 64 Bit + Intel Graphics 4-Cores iGPU (Arc) Cinebench R15 - Cinebench R15 OpenGL Ref. Match 64 Bit
97.8 % (98%)
Basemark GPU 1.2 - Basemark GPU 1.2 Vulkan Official Medium Offscreen 1080
min: 104.6 avg: 165.1 median: 104.6 (1%) max: 315 fps
Basemark GPU 1.2 - Basemark GPU 1.2 Vulkan Official High Offscreen 2160
3.6 fps (1%)
Geekbench 6.2 - Geekbench 6.2 GPU OpenCL
min: 15823 avg: 17078 median: 17437 (5%) max: 17837 Points
Geekbench 6.2 - Geekbench 6.2 GPU Vulkan
min: 15598 avg: 18070 median: 18064 (6%) max: 19667 Points
Power Consumption - Furmark Stress Test Power Consumption - external Monitor *
min: 25.3 avg: 31.6 median: 31.6 (4%) max: 38 Watt
Power Consumption - The Witcher 3 Power Consumption - external Monitor *
min: 24.4 avg: 28.9 median: 30.2 (4%) max: 32.2 Watt
Power Consumption - Witcher 3 Power Consumption *
min: 27.4 avg: 34.1 median: 35.2 (8%) max: 41.5 Watt
Power Consumption - Witcher 3 ultra Power Efficiency
min: 0.4313 avg: 0.5 median: 0.5 (46%) max: 0.504 fps per Watt
Power Consumption - Witcher 3 ultra Power Efficiency - external Monitor
min: 0.4877 avg: 0.5 median: 0.5 (45%) max: 0.556 fps per Watt
Emissions Witcher 3 Fan Noise + Intel Graphics 4-Cores iGPU (Arc) Emissions - Witcher 3 Fan Noise
min: 27.3 avg: 37.9 median: 41.7 (67%) max: 44.9 dB(A)
Average Benchmarks Intel Graphics 4-Cores iGPU (Arc) → 100% n=4 Average Benchmarks Intel Arc A550M → 299% n=4
- Bereich der Benchmarkergebnisse für diese Grafikkarte
- Durchschnittliche Benchmarkergebnisse für diese Grafikkarte
* Smaller numbers mean a higher performance
1 This benchmark is not used for the average calculation
Spiele-Benchmarks Die folgenden Benchmarks basieren auf unseren Spieletests mit Testnotebooks. Die Performance dieser Grafikkarte bei den gelisteten Spielen ist abhängig von der verwendeten CPU, Speicherausstattung, Treiber und auch Betriebssystem. Dadurch müssen die untenstehenden Werte nicht repräsentativ sein. Detaillierte Informationen über das verwendete System sehen Sie nach einem Klick auf den fps-Wert.
100%
Graphics 4-Core:
11 fps
100%
Graphics 4-Core:
10.6 fps
100%
Graphics 4-Core:
43.8 [X] Lenovo ThinkPad X1 2in1 G9 21KE004AGE 1093534
Intel Core Ultra 7 165U 3.8GHz
Graphics 4-Core
min:
37 fps, P1:
36 fps, max:
51 fps
fps
100%
Graphics 4-Core:
39.8 [X] Lenovo ThinkPad X1 2in1 G9 21KE004AGE 1093534
Intel Core Ultra 7 165U 3.8GHz
Graphics 4-Core
min:
35 fps, P1:
33 fps, max:
48 fps
fps
100%
Graphics 4-Core:
26 [X] Lenovo ThinkPad X1 2in1 G9 21KE004AGE 1093534
Intel Core Ultra 7 165U 3.8GHz
Graphics 4-Core
min:
22 fps, P1:
22 fps, max:
29 fps
fps
100%
Graphics 4-Core:
7.1 [X] Lenovo ThinkPad X1 2in1 G9 21KE004AGE 1093534
Intel Core Ultra 7 165U 3.8GHz
Graphics 4-Core
min:
5 fps, P1:
5 fps, max:
8 fps
fps
100%
Graphics 4-Core:
29.5 fps
100%
Graphics 4-Core:
7.6 fps
100%
Graphics 4-Core:
73.7 115 [X] Lenovo ThinkPad X1 2in1 G9 21KE004AGE Intel Core Ultra 7 165U 3.8GHz
Graphics 4-Core
118.1 120.4 121.1 ~ 110 fps
100%
Graphics 4-Core:
32.9 50 50 [X] Lenovo ThinkPad X1 2in1 G9 21KE004AGE Intel Core Ultra 7 165U 3.8GHz
Graphics 4-Core
50.8 52.1 ~ 47 fps
100%
Graphics 4-Core:
26.6 37.7 39.2 40 [X] Lenovo ThinkPad X1 2in1 G9 21KE004AGE Intel Core Ultra 7 165U 3.8GHz
Graphics 4-Core
41.9 ~ 37 fps
100%
Graphics 4-Core:
22.9 30.2 30.3 32 [X] Lenovo ThinkPad X1 2in1 G9 21KE004AGE Intel Core Ultra 7 165U 3.8GHz
Graphics 4-Core
33.3 ~ 30 fps
100%
Graphics 4-Core:
38 46 47 48 48 [X] Lenovo ThinkPad X1 2in1 G9 21KE004AGE Intel Core Ultra 7 165U 3.8GHz
Graphics 4-Core
~ 45 fps
100%
Graphics 4-Core:
20 24 25 25 25 [X] Lenovo ThinkPad X1 2in1 G9 21KE004AGE Intel Core Ultra 7 165U 3.8GHz
Graphics 4-Core
~ 24 fps
100%
Graphics 4-Core:
19 23 23 [X] Lenovo ThinkPad X1 2in1 G9 21KE004AGE Intel Core Ultra 7 165U 3.8GHz
Graphics 4-Core
24 25 ~ 23 fps
100%
Graphics 4-Core:
18 21 21 [X] Lenovo ThinkPad X1 2in1 G9 21KE004AGE Intel Core Ultra 7 165U 3.8GHz
Graphics 4-Core
22 23 ~ 21 fps
100%
Graphics 4-Core:
34.7 36.5 36.8 37.6 40 [X] Lenovo ThinkPad X1 2in1 G9 21KE004AGE Intel Core Ultra 7 165U 3.8GHz
Graphics 4-Core
~ 37 fps
100%
Graphics 4-Core:
28 28.2 28.3 29.7 [X] Lenovo ThinkPad X1 2in1 G9 21KE004AGE Intel Core Ultra 7 165U 3.8GHz
Graphics 4-Core
30.1 ~ 29 fps
100%
Graphics 4-Core:
23.4 23.4 23.6 24.8 [X] Lenovo ThinkPad X1 2in1 G9 21KE004AGE Intel Core Ultra 7 165U 3.8GHz
Graphics 4-Core
25.3 ~ 24 fps
100%
Graphics 4-Core:
35.4 37.4 37.6 48.1 [X] Lenovo ThinkPad X1 2in1 G9 21KE004AGE 1.3
Intel Core Ultra 7 165U 3.8GHz
Graphics 4-Core
48.2 ~ 41 fps
100%
Graphics 4-Core:
19.5 23 23.4 25.9 26 [X] Lenovo ThinkPad X1 2in1 G9 21KE004AGE 1.3
Intel Core Ultra 7 165U 3.8GHz
Graphics 4-Core
~ 24 fps
100%
Graphics 4-Core:
15.7 16.3 16.3 18.2 18.2 [X] Lenovo ThinkPad X1 2in1 G9 21KE004AGE 1.3
Intel Core Ultra 7 165U 3.8GHz
Graphics 4-Core
~ 17 fps
100%
Graphics 4-Core:
82.6 91.4 91.8 [X] Lenovo ThinkPad X1 2in1 G9 21KE004AGE Intel Core Ultra 7 165U 3.8GHz
Graphics 4-Core
min:
62.8 fps, max:
-1 fps
93.8 101.9 ~ 92 fps
100%
Graphics 4-Core:
52.2 59.7 60.7 69 72.2 [X] Lenovo ThinkPad X1 2in1 G9 21KE004AGE Intel Core Ultra 7 165U 3.8GHz
Graphics 4-Core
min:
55.4 fps, max:
-1 fps
~ 63 fps
100%
Graphics 4-Core:
52.8 57.2 60.4 [X] Lenovo ThinkPad X1 2in1 G9 21KE004AGE Intel Core Ultra 7 165U 3.8GHz
Graphics 4-Core
min:
43.9 fps, max:
-1 fps
61 61.1 ~ 59 fps
100%
Graphics 4-Core:
50 54.2 56.9 [X] Lenovo ThinkPad X1 2in1 G9 21KE004AGE Intel Core Ultra 7 165U 3.8GHz
Graphics 4-Core
min:
42.7 fps, max:
-1 fps
57.3 57.6 ~ 55 fps
100%
Graphics 4-Core:
66.5 86.8 91 [X] Lenovo ThinkPad X1 2in1 G9 21KE004AGE Intel Core Ultra 7 165U 3.8GHz
Graphics 4-Core
92.1 92.1 ~ 86 fps
100%
Graphics 4-Core:
41.3 49.6 57 57 57 [X] Lenovo ThinkPad X1 2in1 G9 21KE004AGE Intel Core Ultra 7 165U 3.8GHz
Graphics 4-Core
~ 52 fps
100%
Graphics 4-Core:
21.4 28.4 31 [X] Lenovo ThinkPad X1 2in1 G9 21KE004AGE Intel Core Ultra 7 165U 3.8GHz
Graphics 4-Core
32.4 32.4 ~ 29 fps
100%
Graphics 4-Core:
11.9 15 16.3 [X] Lenovo ThinkPad X1 2in1 G9 21KE004AGE Intel Core Ultra 7 165U 3.8GHz
Graphics 4-Core
min:
15 fps, P1:
15 fps, max:
18 fps
17.9 17.9 ~ 16 fps
100%
Graphics 4-Core:
139.1 [X] Lenovo ThinkPad X1 2in1 G9 21KE004AGE Intel Core Ultra 7 165U 3.8GHz
Graphics 4-Core
min:
5.53 fps, P1:
76.9 fps, max:
276 fps
fps
100%
Graphics 4-Core:
123.9 [X] Lenovo ThinkPad X1 2in1 G9 21KE004AGE Intel Core Ultra 7 165U 3.8GHz
Graphics 4-Core
min:
8.51 fps, P1:
71.4 fps, max:
244 fps
fps
100%
Graphics 4-Core:
21.9 [X] Lenovo ThinkPad X1 2in1 G9 21KE004AGE Intel Core Ultra 7 165U 3.8GHz
Graphics 4-Core
min:
1.866 fps, P1:
14.9 fps, max:
91.7 fps
fps
100%
Graphics 4-Core:
9 [X] Lenovo ThinkPad X1 2in1 G9 21KE004AGE Intel Core Ultra 7 165U 3.8GHz
Graphics 4-Core
min:
1.588 fps, P1:
6.54 fps, max:
84.7 fps
fps
Average Gaming Intel Graphics 4-Cores iGPU (Arc) → 100% Average Gaming 30-70 fps → 100%
Intel Graphics 4-Cores iGPU (Arc) low med. high ultra QHD 4K Cyberpunk 2077 2.1 Phantom Liberty 20 17 14 12 Baldur's Gate 3 16 13 11 10.6 F1 23 43.8 39.8 26 7.14 F1 22 43 40 29.5 7.62 Tiny Tina's Wonderlands 29 23 16 13 Strange Brigade 110 47 37 30 Far Cry 5 45 24 23 21 X-Plane 11.11 37 29 24 Final Fantasy XV Benchmark 41 24 17 Dota 2 Reborn 92 63 59 55 The Witcher 3 86 52 29 16 GTA V 139.1 123.9 21.9 9 < 30 fps < 60 fps < 120 fps ≥ 120 fps 3 5 3 1 6 4 1 1 10 2 8 2
v1.26
log 02. 14:07:48
#0 checking url part for id 12259 +0s ... 0s
#1 checking url part for id 11309 +0s ... 0s
#2 not redirecting to Ajax server +0s ... 0s
#3 did not recreate cache, as it is less than 5 days old! Created at Sat, 01 Jun 2024 05:39:27 +0200 +0.001s ... 0.001s
#4 composed specs +0.095s ... 0.096s
#5 did output specs +0s ... 0.096s
#6 start showIntegratedCPUs +0s ... 0.096s
#7 getting avg benchmarks for device 12259 +0.031s ... 0.127s
#8 got single benchmarks 12259 +0.028s ... 0.155s
#9 getting avg benchmarks for device 11309 +0.002s ... 0.157s
#10 got single benchmarks 11309 +0.006s ... 0.163s
#11 got avg benchmarks for devices +0s ... 0.163s
#12 min, max, avg, median took s +0.09s ... 0.253s
#13 before gaming benchmark output +0s ... 0.253s
#14 Got 165 rows for game benchmarks. +0.032s ... 0.285s
#15 composed SQL query for gamebenchmarks +0s ... 0.285s
#16 got data and put it in $dataArray +0.01s ... 0.294s
#17 benchmarks composed for output. +0.03s ... 0.324s
#18 calculated avg scores. +0s ... 0.324s
#19 return log +0.05s ... 0.374s
Teilen Sie diesen Artikel, um uns zu unterstützen. Jeder Link hilft!
Autor: Klaus Hinum, 8.09.2017 (Update: 1.07.2023)
 Deutsch
 English
 Español
 Français
 Italiano
 Nederlands
 Polski
 Português
 Русский
 Türkçe
 Svenska
 Chinese
 Magyar