Fazit - Schneidet im Vergleich zu Dell etwas schlechter ab
Das HP ZBook Fury G1i 18 hat einige bemerkenswerte Vorteile gegenüber dem Dell Pro Max 18 Plus: Es läuft kühler, ist etwas dünner und leichter, verfügt über eine RGB-Beleuchtung pro Taste und echte Maustasten und wird mit einem schnelleren 165-Hz-Display mit weniger auffälligen Ghosting ausgeliefert. Die Hardware ist genauso robust, wenn nicht sogar vielseitiger, mit breiteren Scharnieren und einer "werkzeuglosen" Unterseite für einfachere Wartung.
Leider gibt es einige Nachteile, die das HP davon abhalten, die ultimative mobile 18-Zoll-Workstation zu sein. Am auffälligsten ist vielleicht, dass CPU und GPU etwas langsamer laufen als beim Dell, wenn beide mit identischen Prozessoren konfiguriert sind. Das Dell Pro Max 18 Plus läuft wärmer und zielt auf einen höheren TGP von 175 W für mehr Leistung ab. Die Akkulaufzeit und das Lüftergeräusch des HP sind nicht unbedingt länger bzw. leiser, trotz der Leistungsunterschiede zwischen den beiden Modellen. Der Dell Rechner ist auch besser für KI-Arbeitslasten optimiert, da er über einen CAMM2-RAM mit höherer Kapazität und einen austauschbaren DGFF-Speicher verfügt, der gegen eine diskrete Qualcomm-Inferenz-NPU ausgetauscht werden kann. Performance-Jäger können daher mehr Nutzen aus dem Dell Rechner ziehen.
Pro
Contra
Preis und Verfügbarkeit
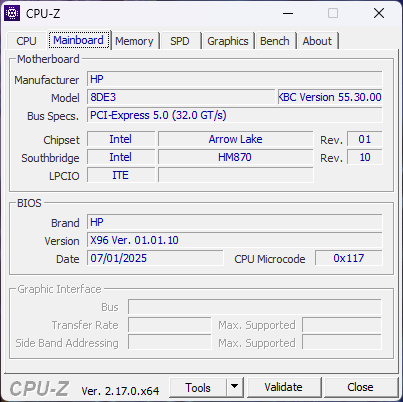
Das HP ZBook Fury G1i 18 gibt es ab 2.879 Euro in der Basiskonfiguration, z. B. bei Cyclotron. HP liefert es ab 3.939 Euro in der einfachsten Variante bis 5.349 Euro, wenn es mit dem Core Ultra 9 285HX und Nvidia RTX Pro 4000 Blackwell konfiguriert ist.
Inhaltsverzeichnis
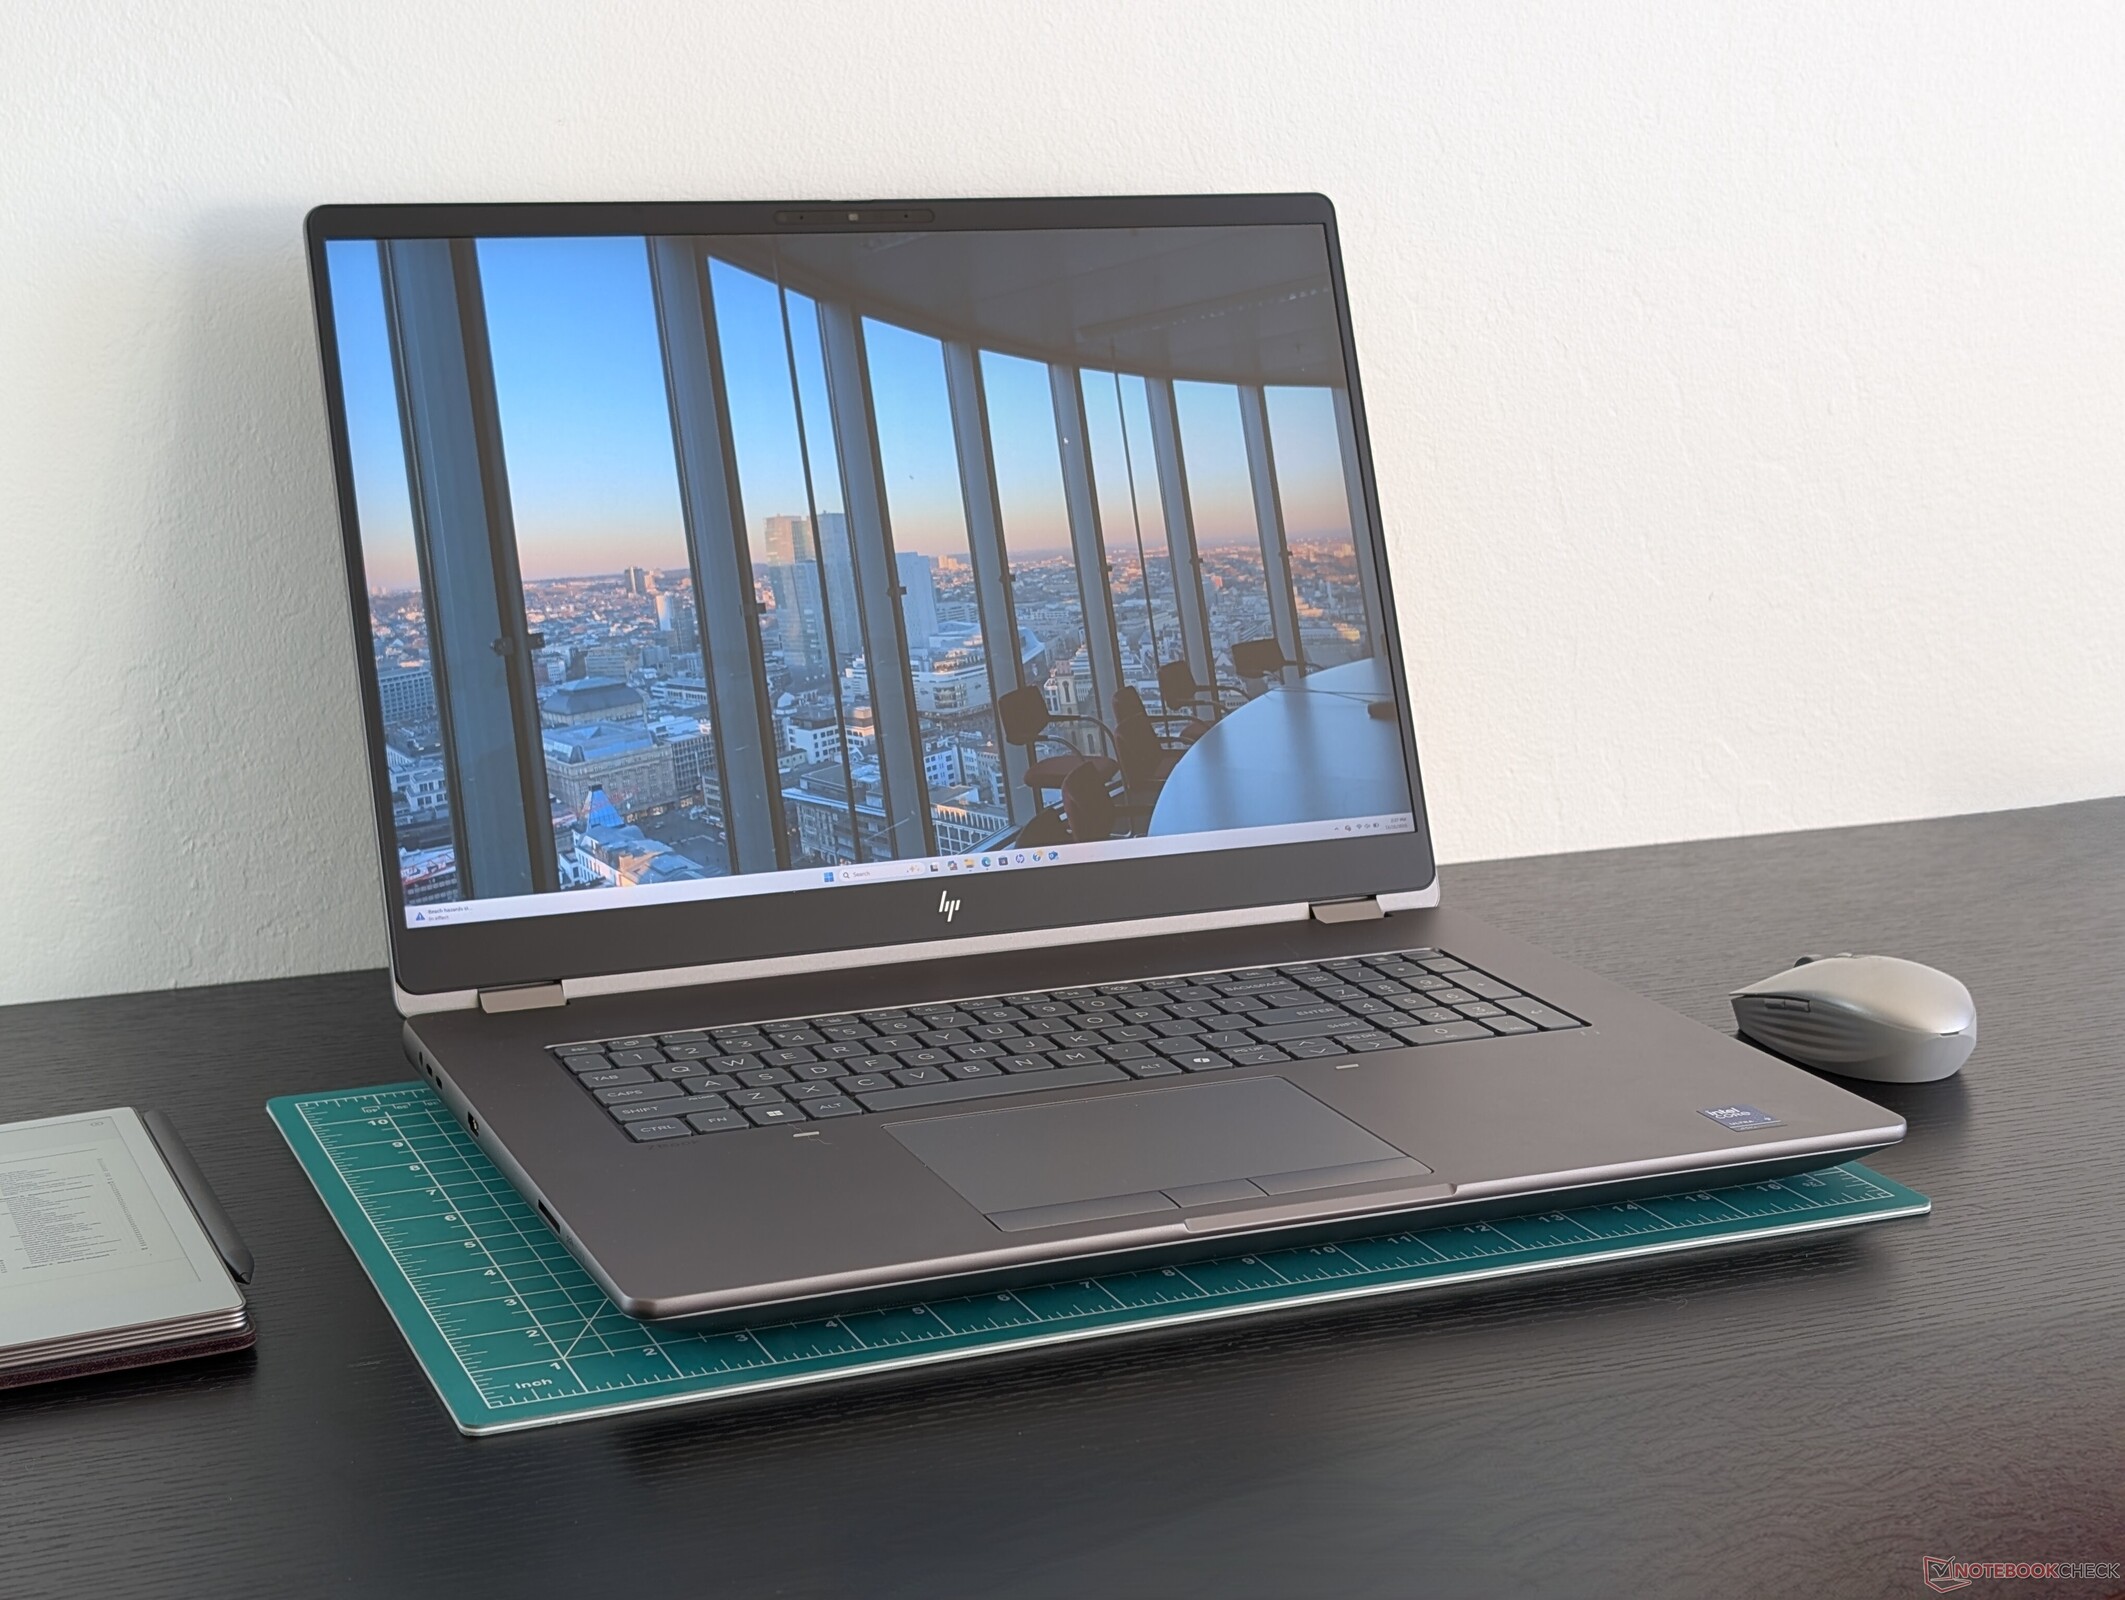
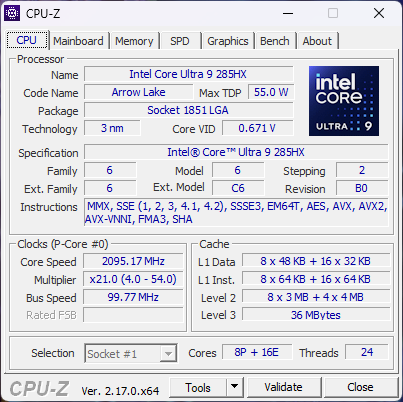
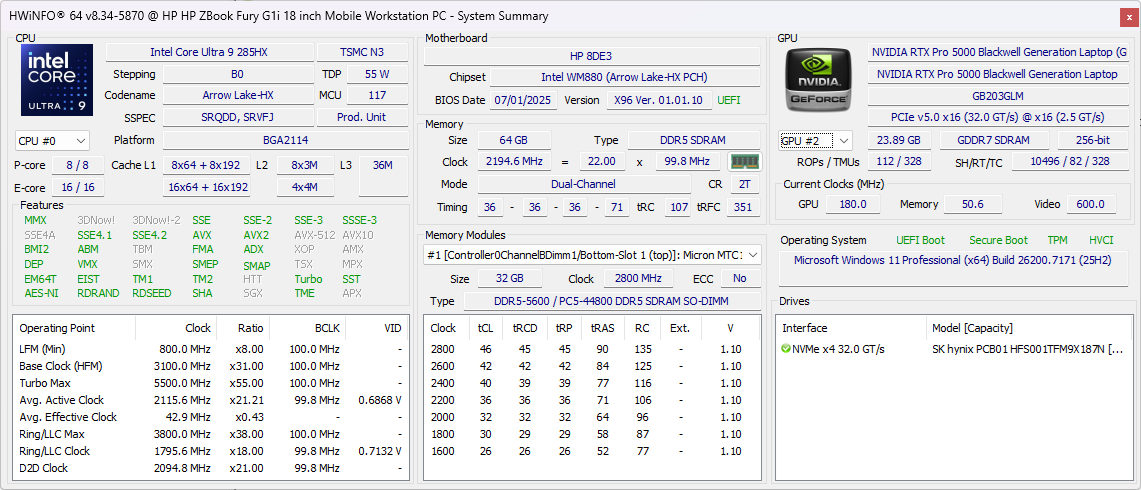
Das ZBook Fury G1i 18 ist das erste 18-Zoll-Modell der Fury Familie der mobilen Hochleistungs-Workstations. Es ist mit den neuesten Intel-Arrow-Lake-HX-CPUs und Nvidia-Pro-Blackwell-GPUs ausgestattet und gehört damit zu den leistungsstärksten Geräten in dieser Kategorie.
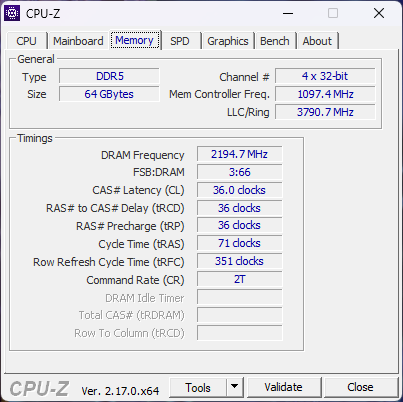
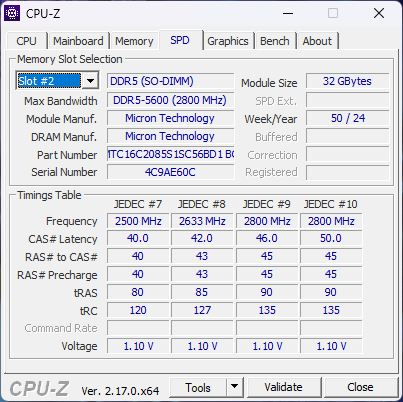
Unser spezielles Testgerät wurde mit der Core Ultra 9 285HX CPU, der 150 W Nvidia RTX Pro 5000 Blackwell GPU und 64 GB DDR5-5600 RAM für ca. 9.000+ US-Dollar im Einzelhandel voll ausgestattet. Alle SKUs werden derzeit mit dem gleichen 2.560 x 1.600p 165 Hz IPS-Display ausgeliefert.
Konkurrierende 18-Zoll-Workstations sind rar gesät: Das Dell Pro Max 18 Plus ist zum Zeitpunkt der Erstellung dieses Artikels der einzige direkte Konkurrent. Lenovo zum Beispiel bietet noch kein 18-Zoll-ThinkPad mit professionellen Nvidia-GPU-Optionen an.
Weitere HP Testberichte:
Spezifikationen
Preisvergleich
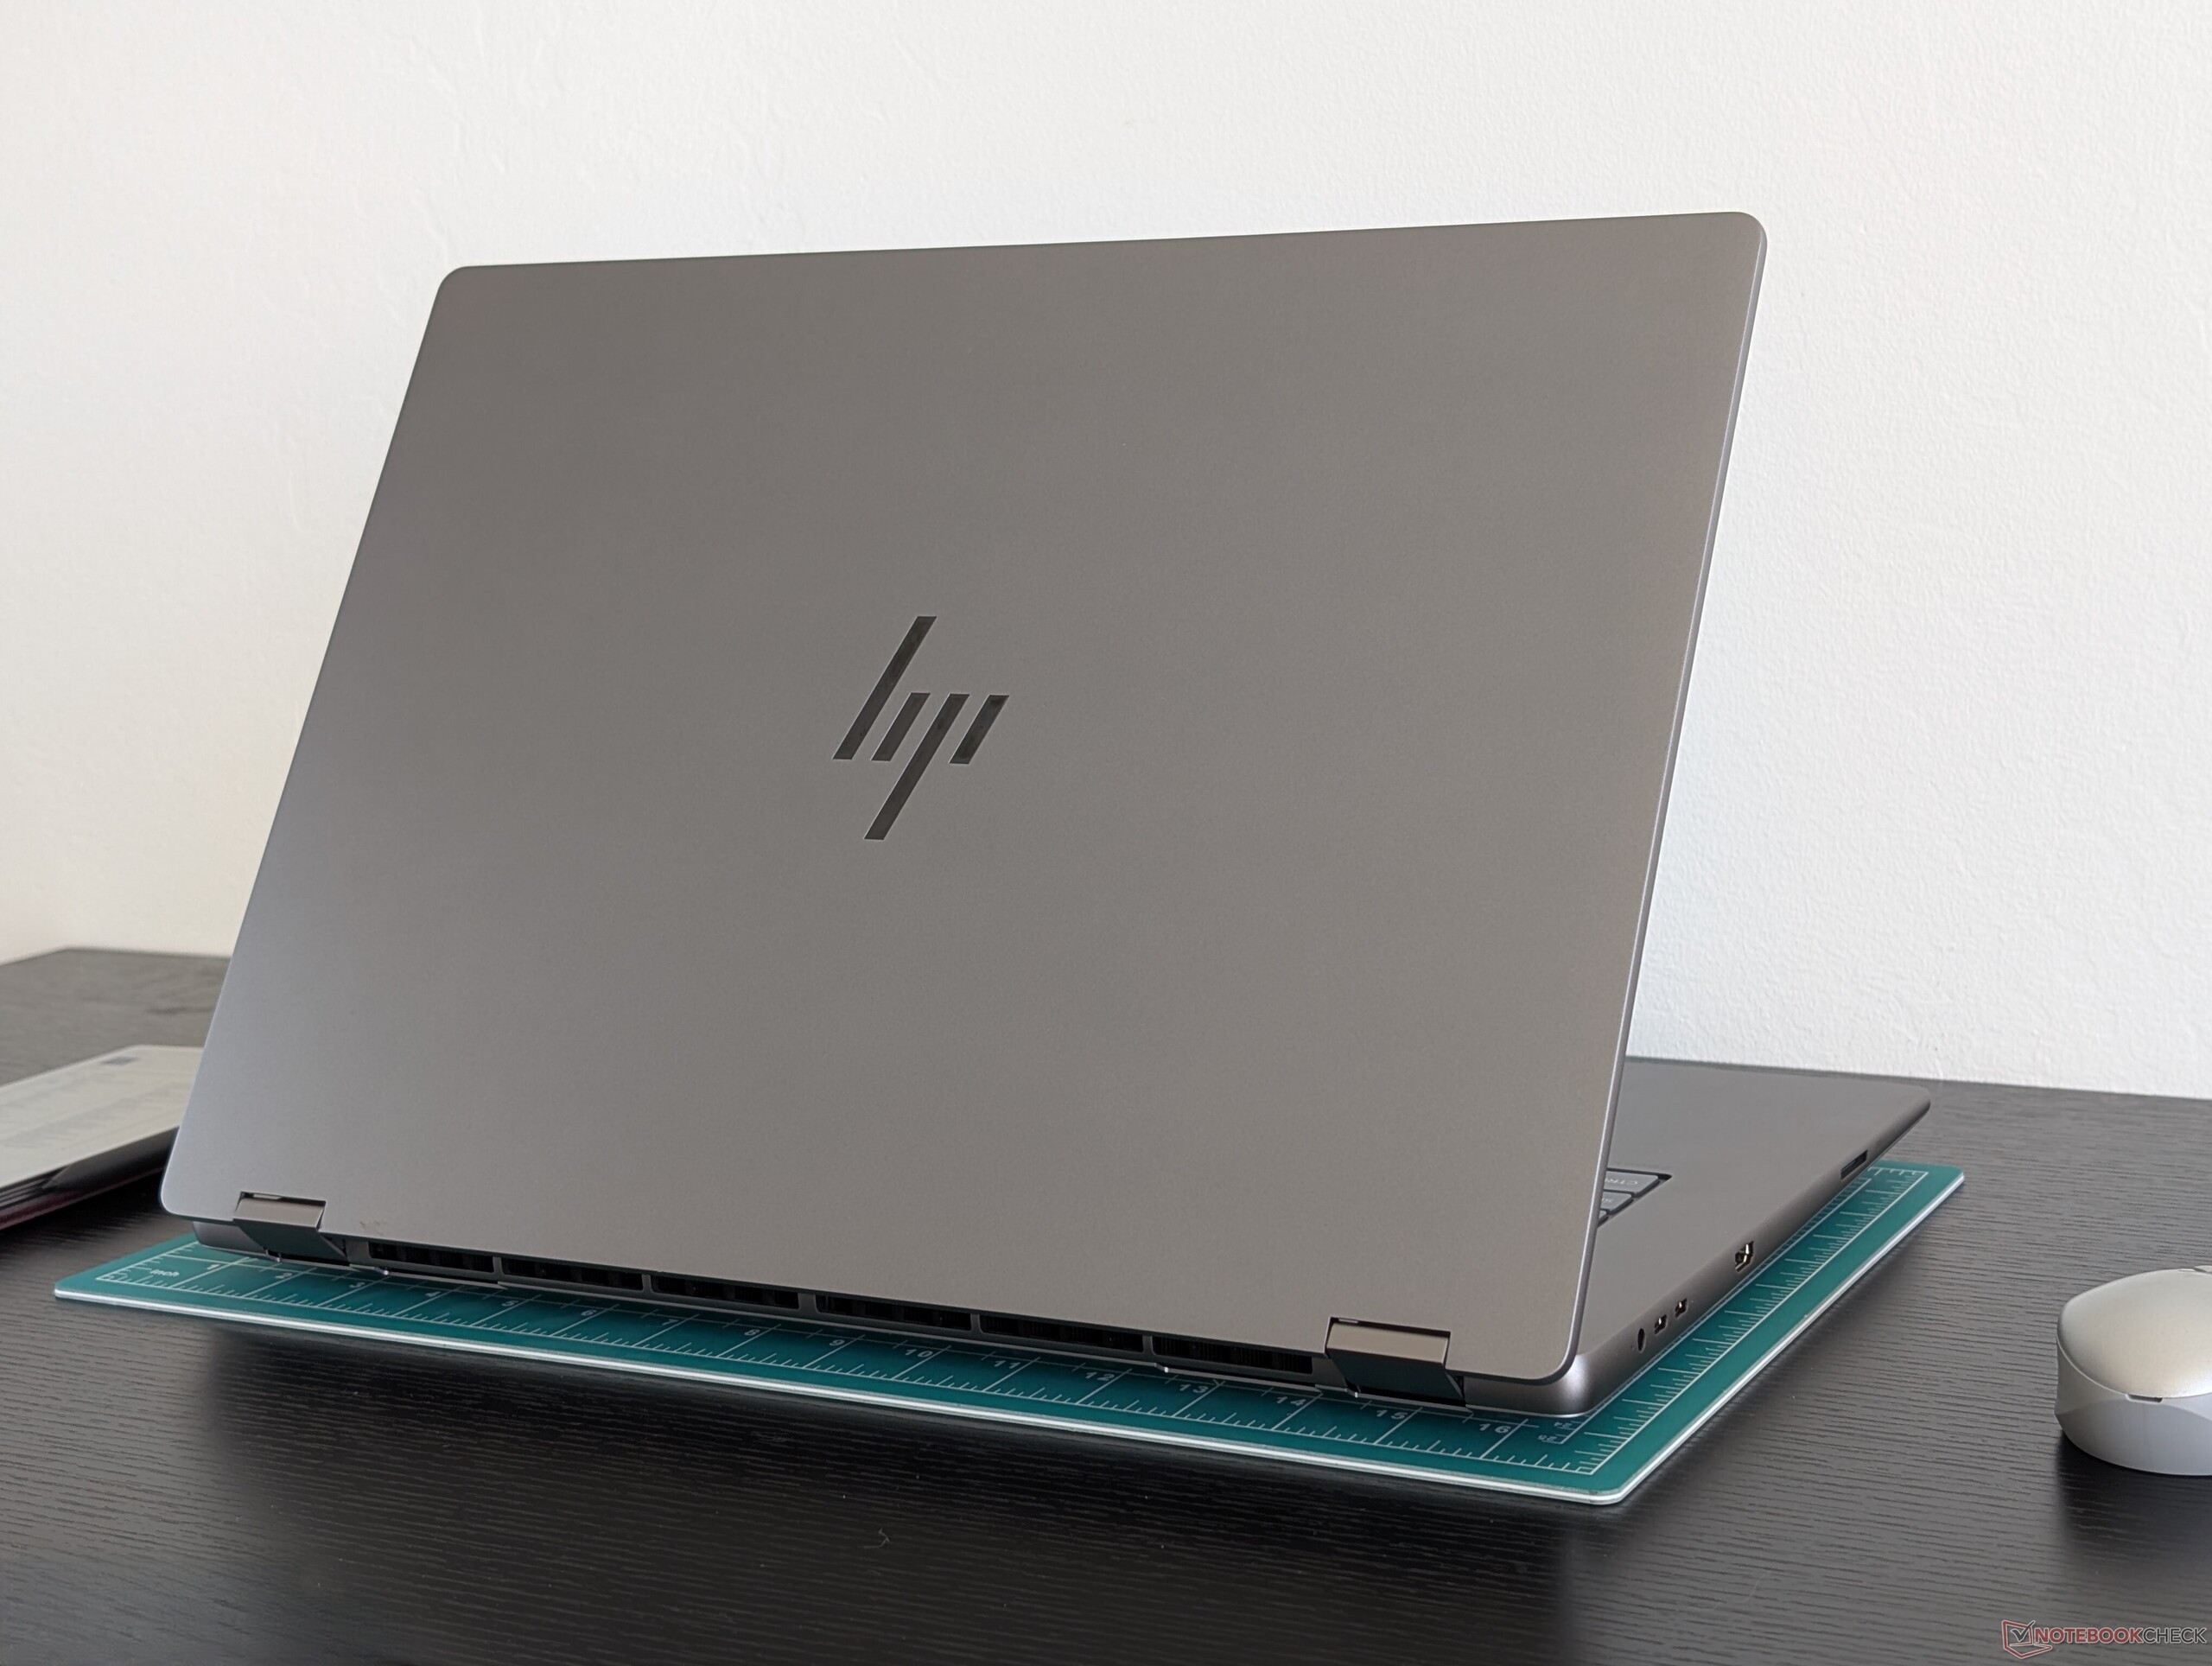
Gehäuse
Während das Gehäuse aus Aluminiumlegierung nicht spürbar schwächer oder stabiler ist als beim Dell Pro Max 18 Plus, ist es etwas dünner und leichter als das Dell Modell, dabei aber in Länge und Breite größer. Ein bemerkenswerter Vorteil des HP ist jedoch, dass sich das Display um 180 Grad aufklappen lässt, was die Vielseitigkeit erhöht.
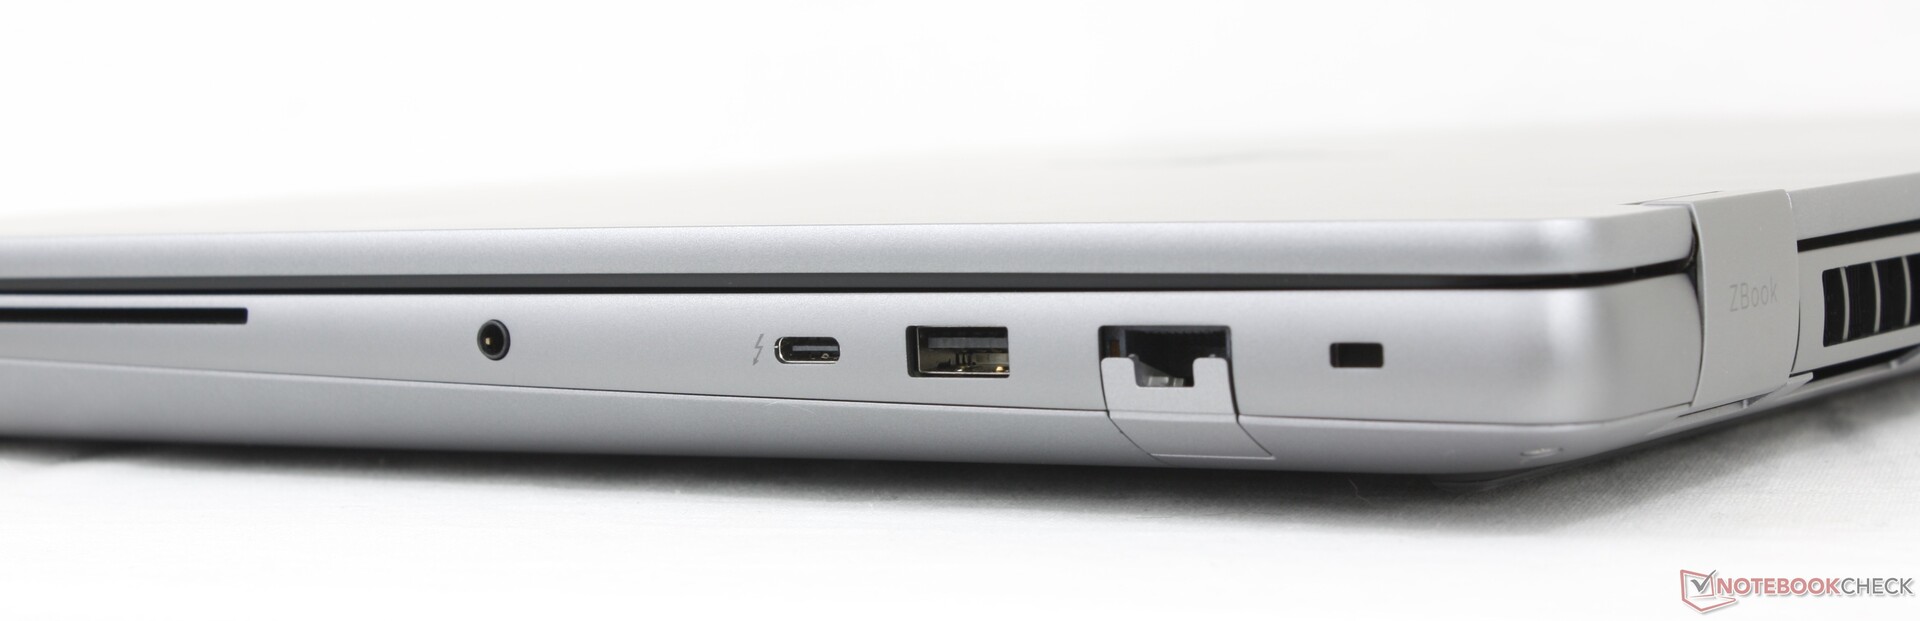
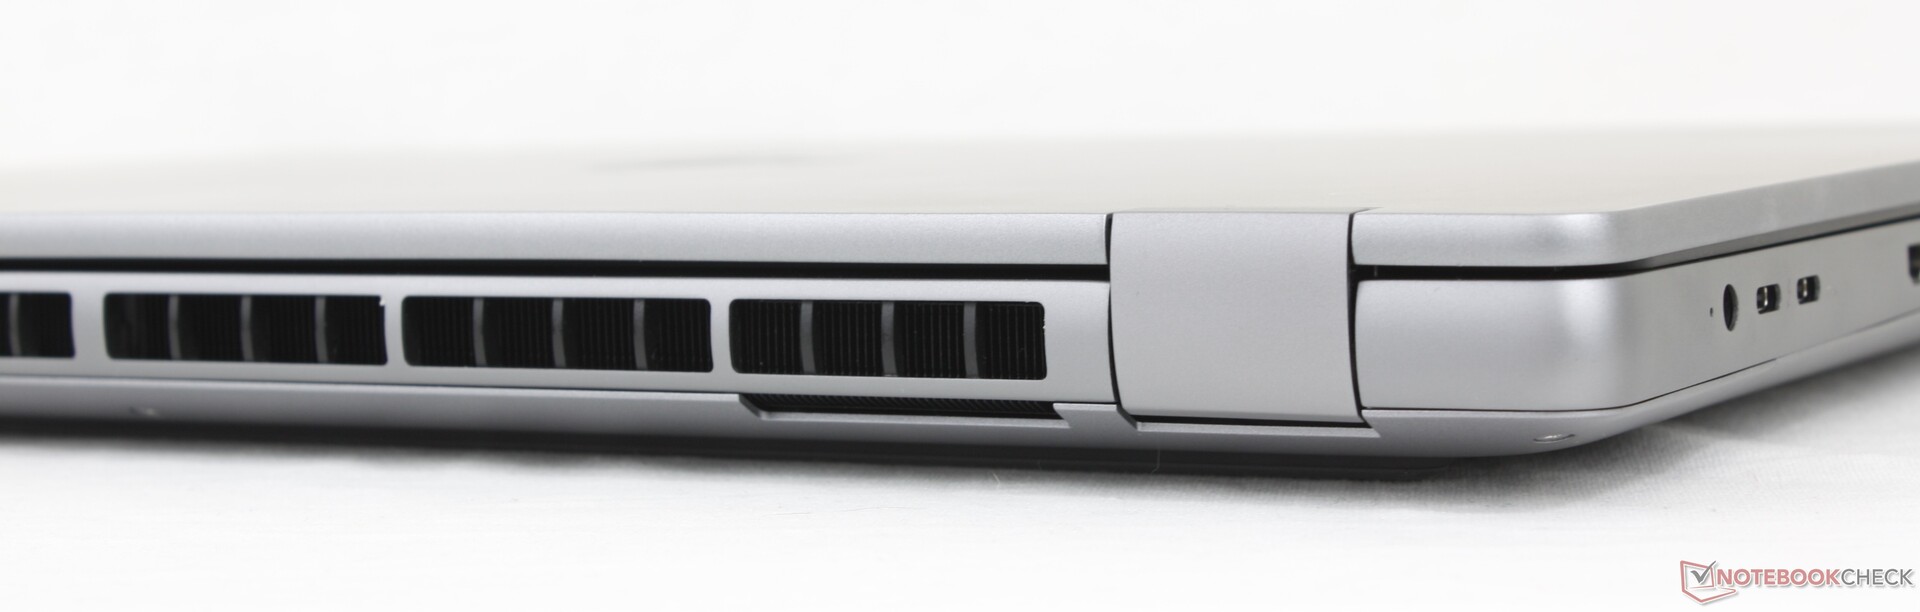
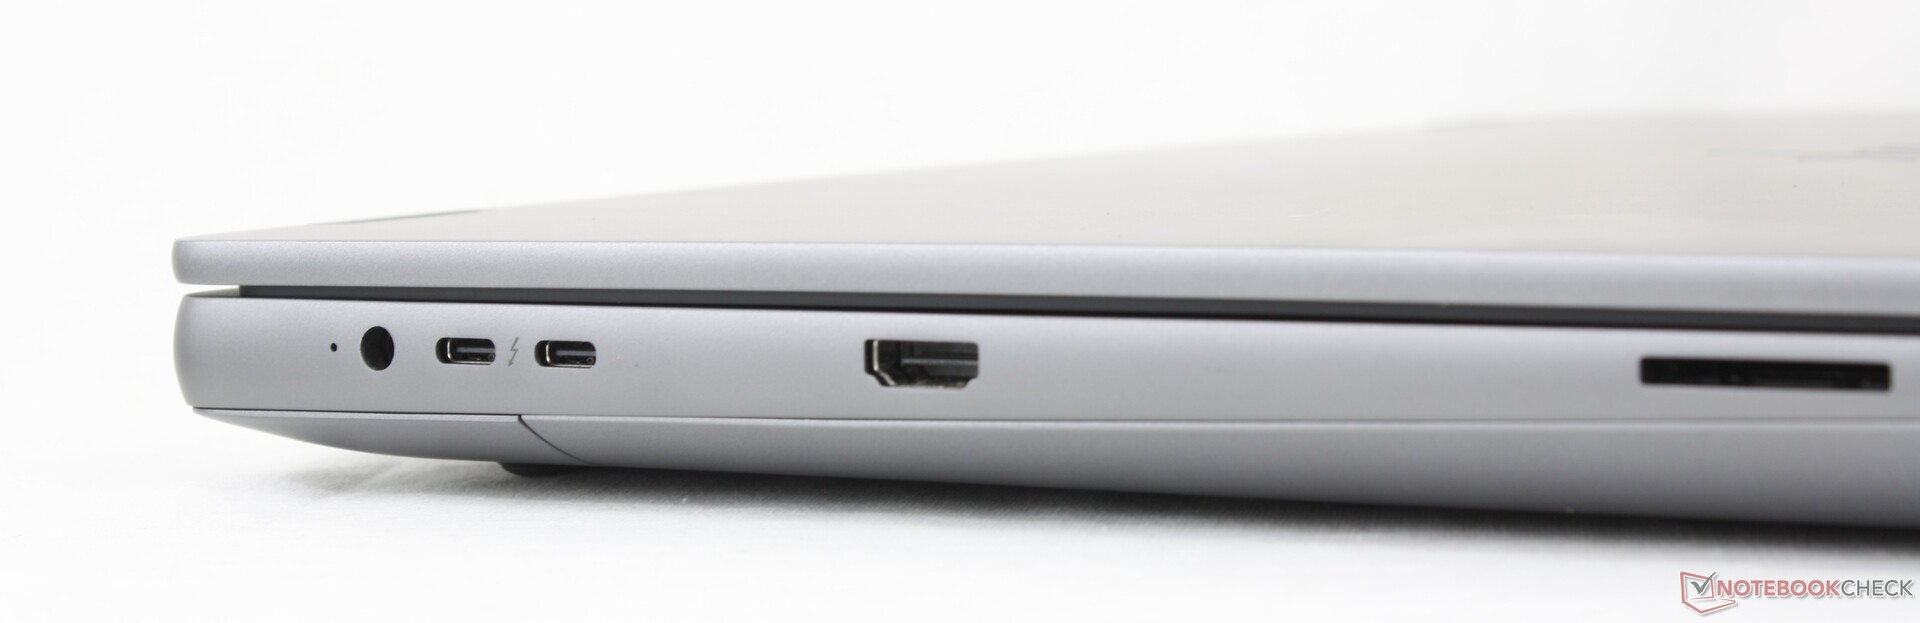
Anschlussausstattung
Das Modell verfügt über alle Ports wie beim Dell Pro Max 18 Plus, allerdings mit einem USB-A-Anschluss weniger. Unser Hauptkritikpunkt ist, dass die beiden USB-C-Ports entlang der linken Kante zu nah am Anschluss des Netzteils liegen. Dadurch kann es beim Anschließen mehrerer Kabel zu Engpässen kommen.
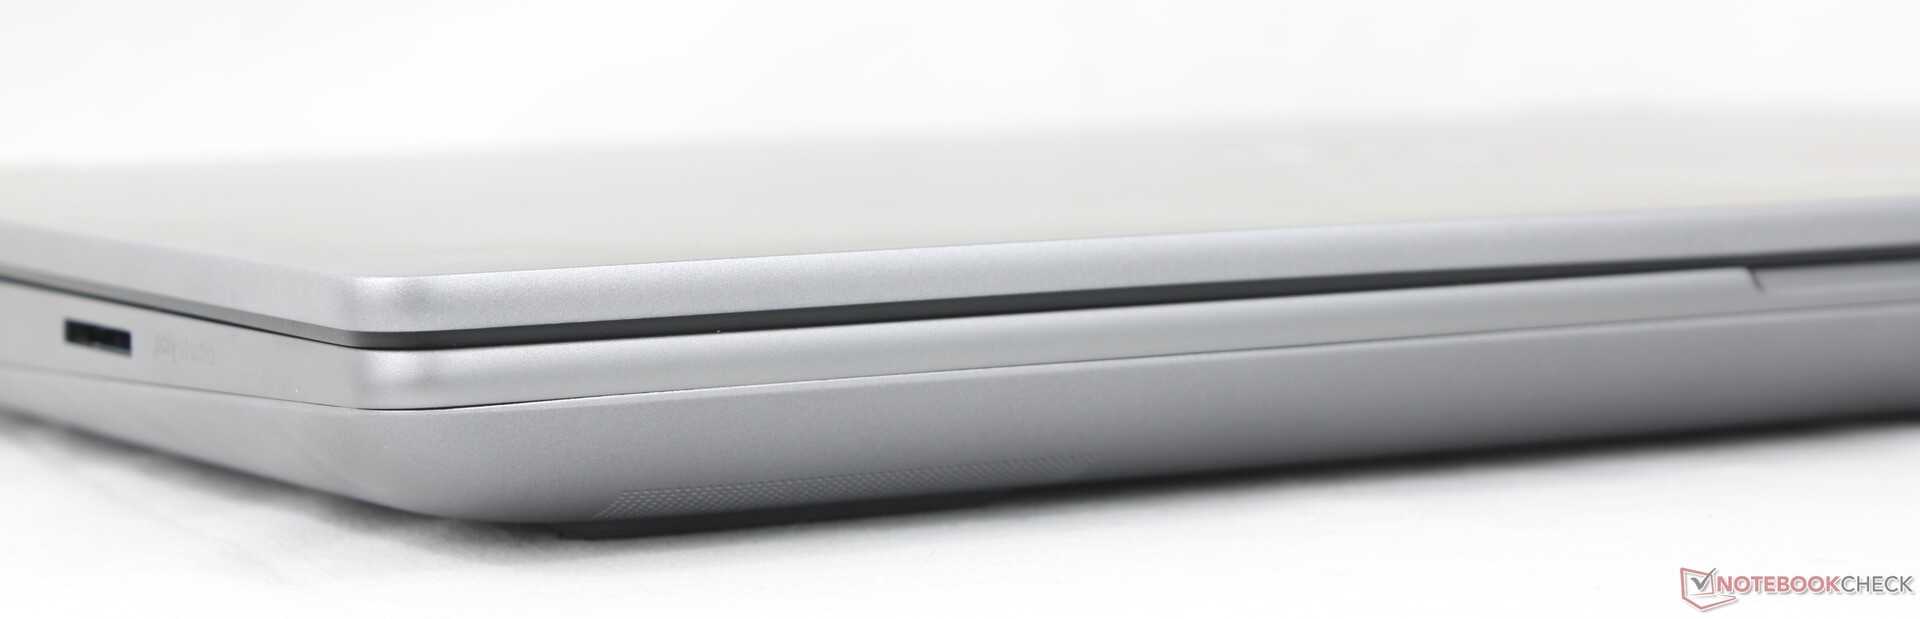
SD-Kartenleser
| SD Card Reader | |
| average JPG Copy Test (av. of 3 runs) | |
| HP ZBook X G1i 16 (Toshiba Exceria Pro SDXC 64 GB UHS-II) | |
| Dell Pro Max 18 Plus MB18250 (Toshiba Exceria Pro SDXC 64 GB UHS-II) | |
| HP ZBook Fury G1i 18 (Toshiba Exceria Pro SDXC 64 GB UHS-II) | |
| Lenovo ThinkPad P16 Gen 2 (Toshiba Exceria Pro SDXC 64 GB UHS-II) | |
| Schenker Key 18 Pro M25 RTX 5090 (Angelbird AV Pro V60) | |
| maximum AS SSD Seq Read Test (1GB) | |
| HP ZBook X G1i 16 (Toshiba Exceria Pro SDXC 64 GB UHS-II) | |
| Dell Pro Max 18 Plus MB18250 (Toshiba Exceria Pro SDXC 64 GB UHS-II) | |
| HP ZBook Fury G1i 18 (Toshiba Exceria Pro SDXC 64 GB UHS-II) | |
| Schenker Key 18 Pro M25 RTX 5090 (Angelbird AV Pro V60) | |
| Lenovo ThinkPad P16 Gen 2 (Toshiba Exceria Pro SDXC 64 GB UHS-II) | |
Kommunikation
Webcam
Eine 5-MP-Kamera ist im Lieferumfang enthalten genauso wie ein IR- und ein physischer Auslöser. Die Poly Camera Pro Software, die auch auf den meisten anderen HP Laptops enthalten ist, ist auf dem ZBook Fury für zusätzliche Videokonferenzfunktionen vorinstalliert.


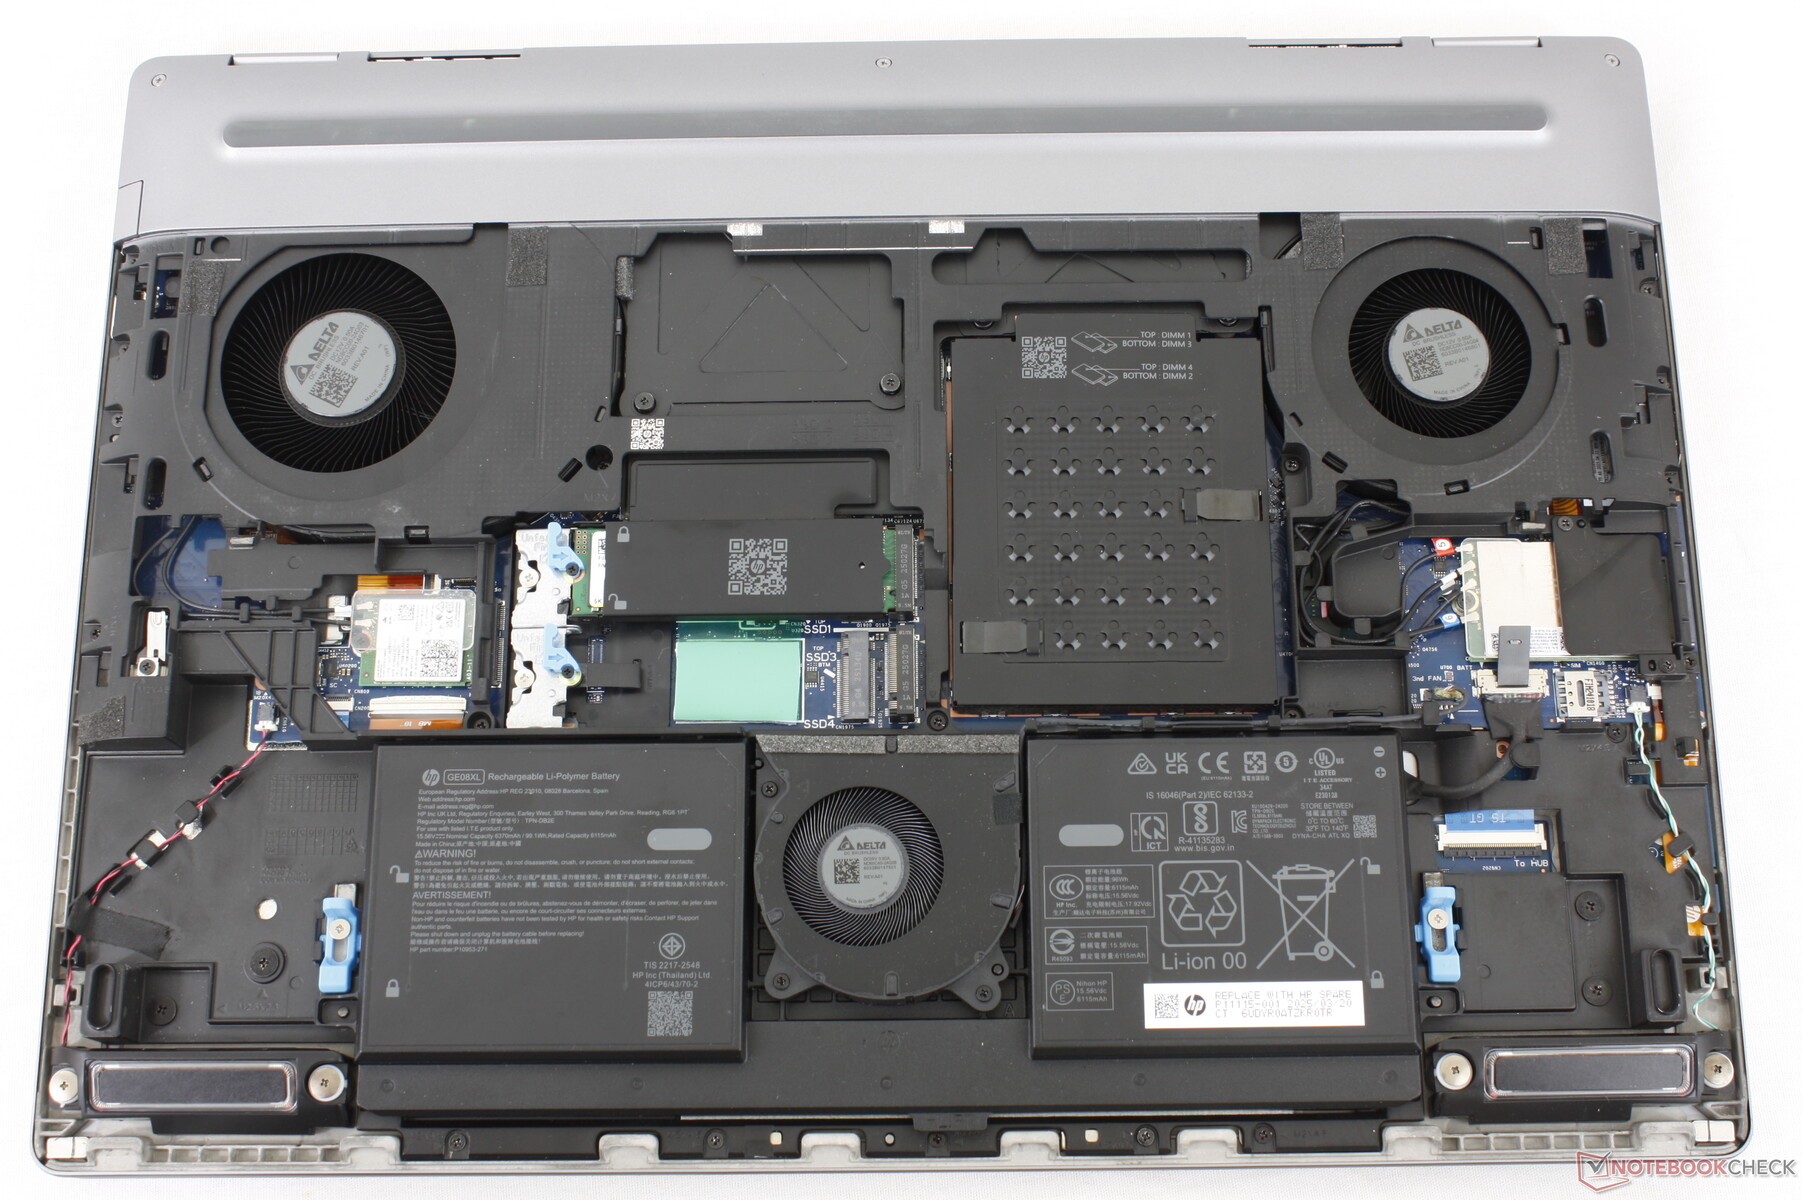
Wartung
Die Bodenplatte ist "werkzeuglos" und kann ohne Schraubendreher entfernt werden. Dennoch sind die meisten Komponenten auf der Hauptplatine verschraubt, so dass für Wartungsarbeiten ein Schraubendreher erforderlich ist.
Nachhaltigkeit
40 Prozent der Kunststoffe rund um das Gehäuse stammen aus Post-Consumer-Recycling, während die Verpackung größtenteils aus Papierzellstoff besteht und das Netzteil in Kunststoff eingepackt ist.
Zubehör und Garantie
Außer dem Netzteil und dem Papierkram befinden sich keine weiteren Extras in der Verpackung. Enttäuschend ist, dass das System nur mit einer einjährigen Herstellergarantie geliefert wird, wenn man es auf der offiziellen HP Website bestellt, anstatt der für High-End-Workstations üblichen drei Jahre.
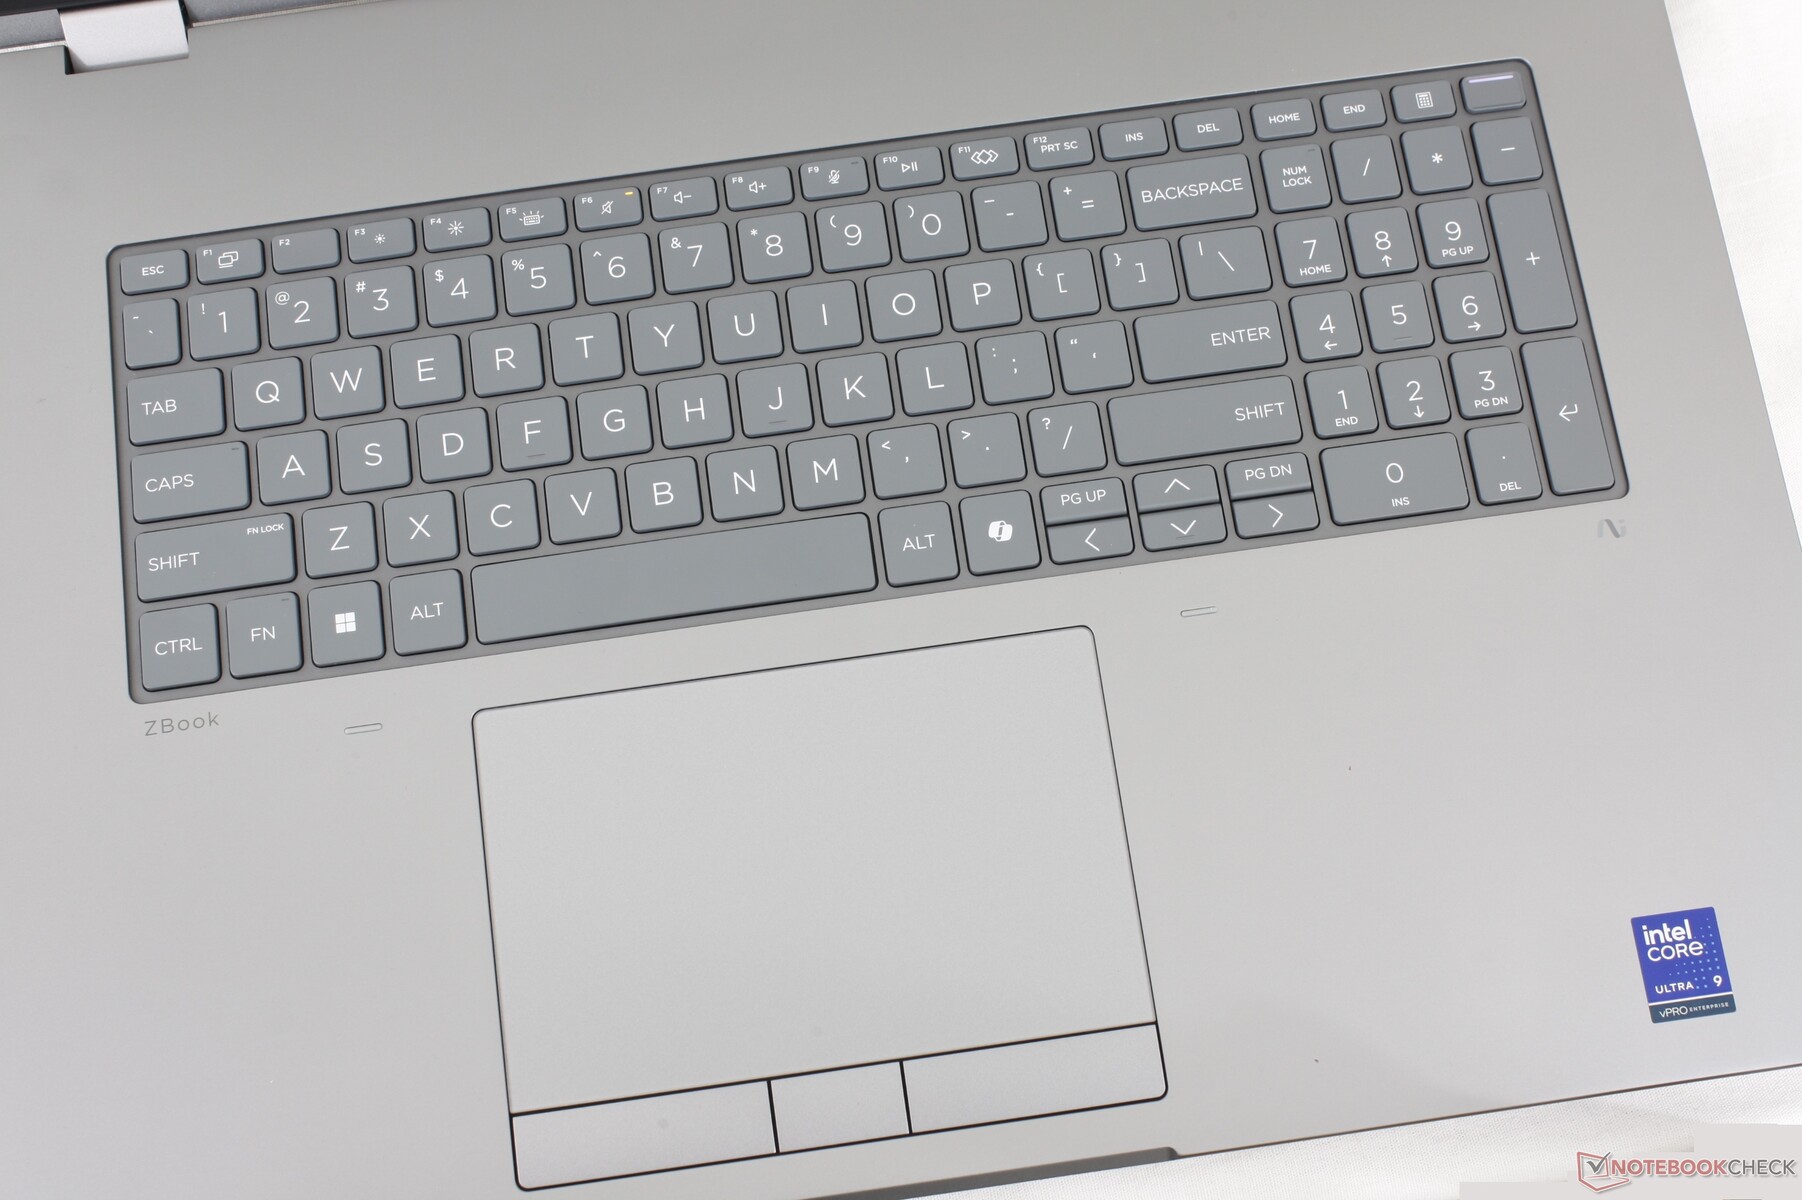
Eingabegeräte
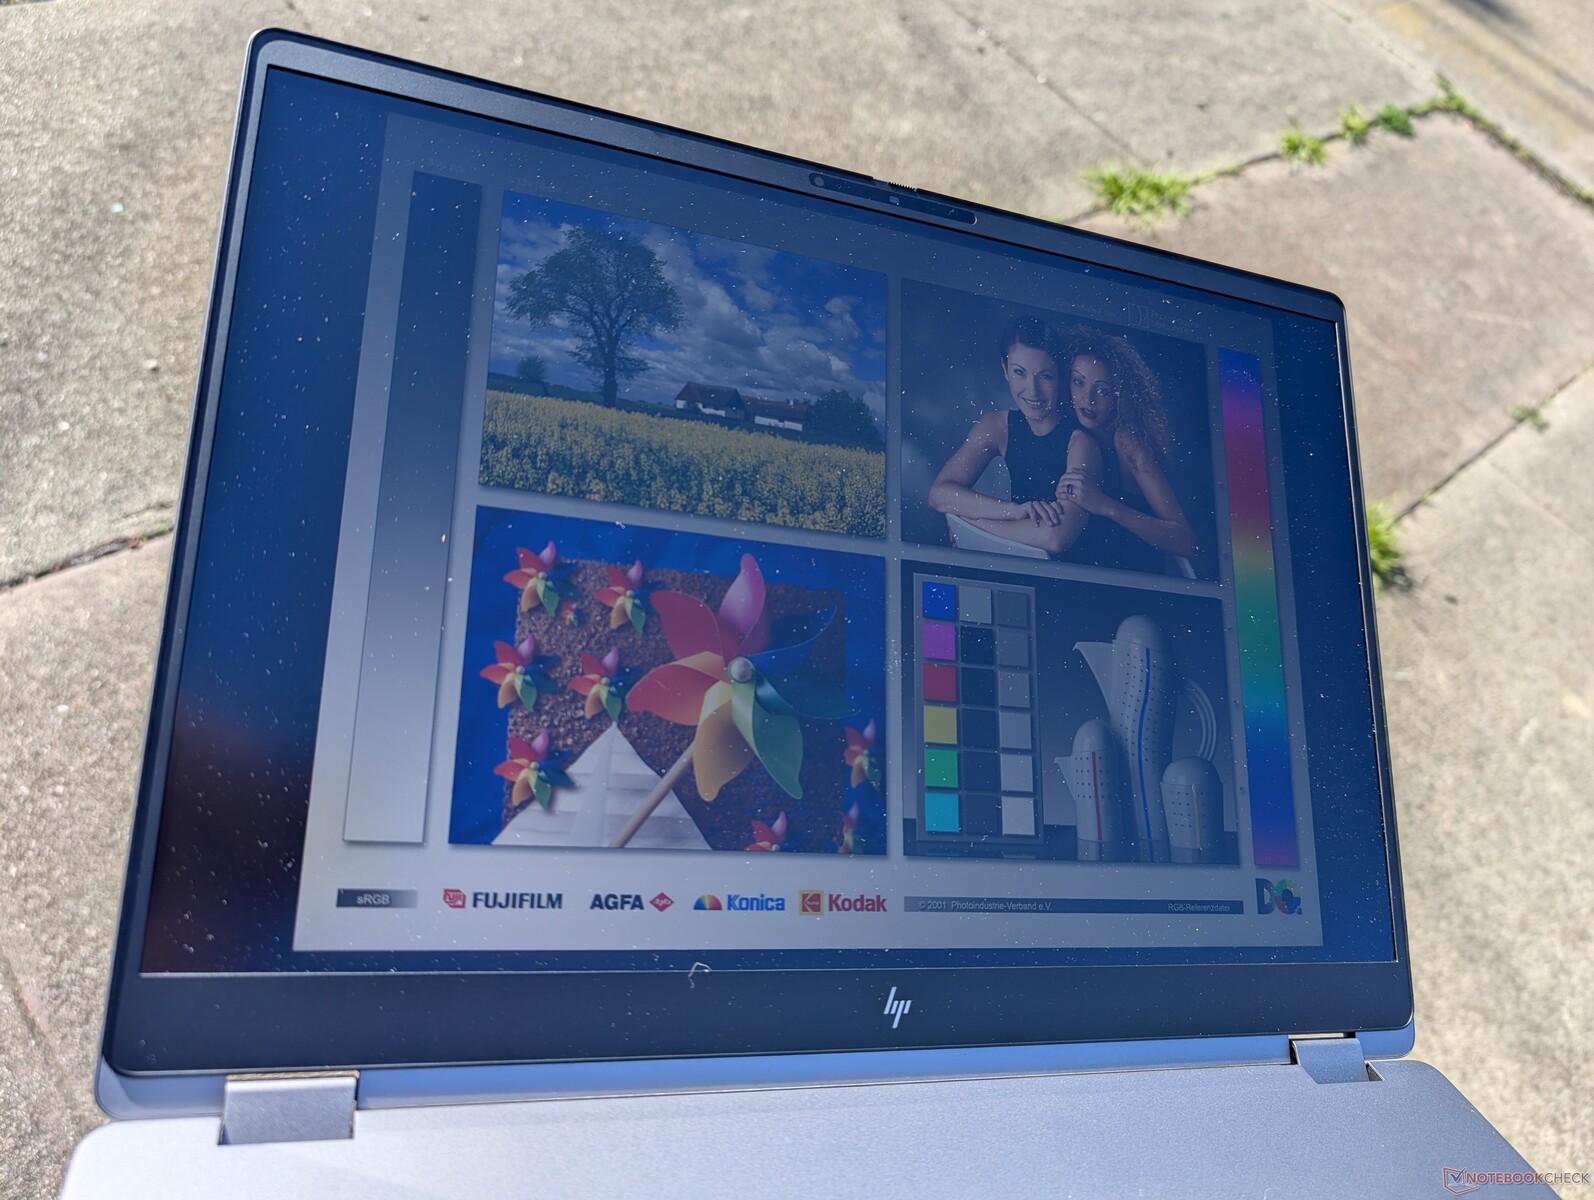
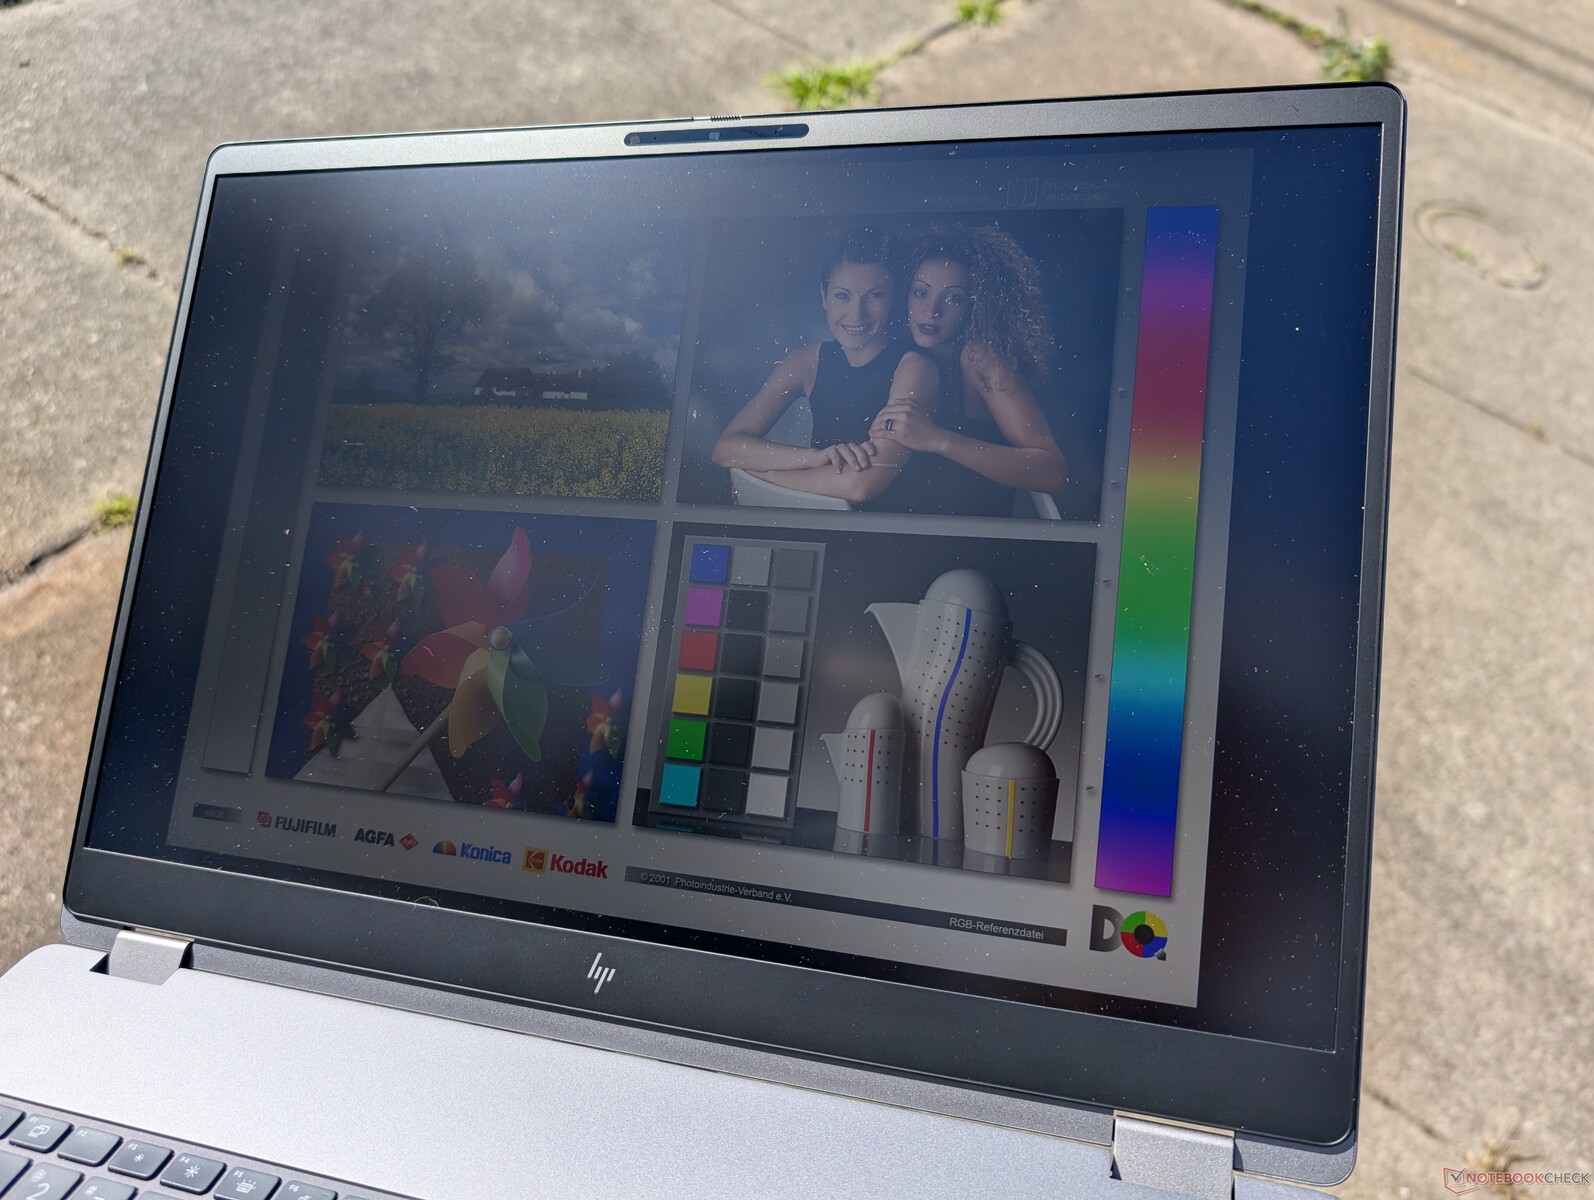
Display - Vorerst kein 4K oder OLED
Wie das Dell Pro Max 18 Plus ist auch unser HP ZBook Fury G1i 18 auf eine einzige 2.560-x-1.600-IPS-Non-Touch-Option beschränkt. Allerdings verwendet HP ein anderes Panel von AU Optronics anstelle von BOE, das ähnliche P3-Farben und Helligkeitswerte bietet, aber auch schnellere Schwarz-Weiß-Reaktionszeiten, eine schnellere native Bildwiederholrate, PSR2-Unterstützung und etwas niedrigere Kontrastwerte.
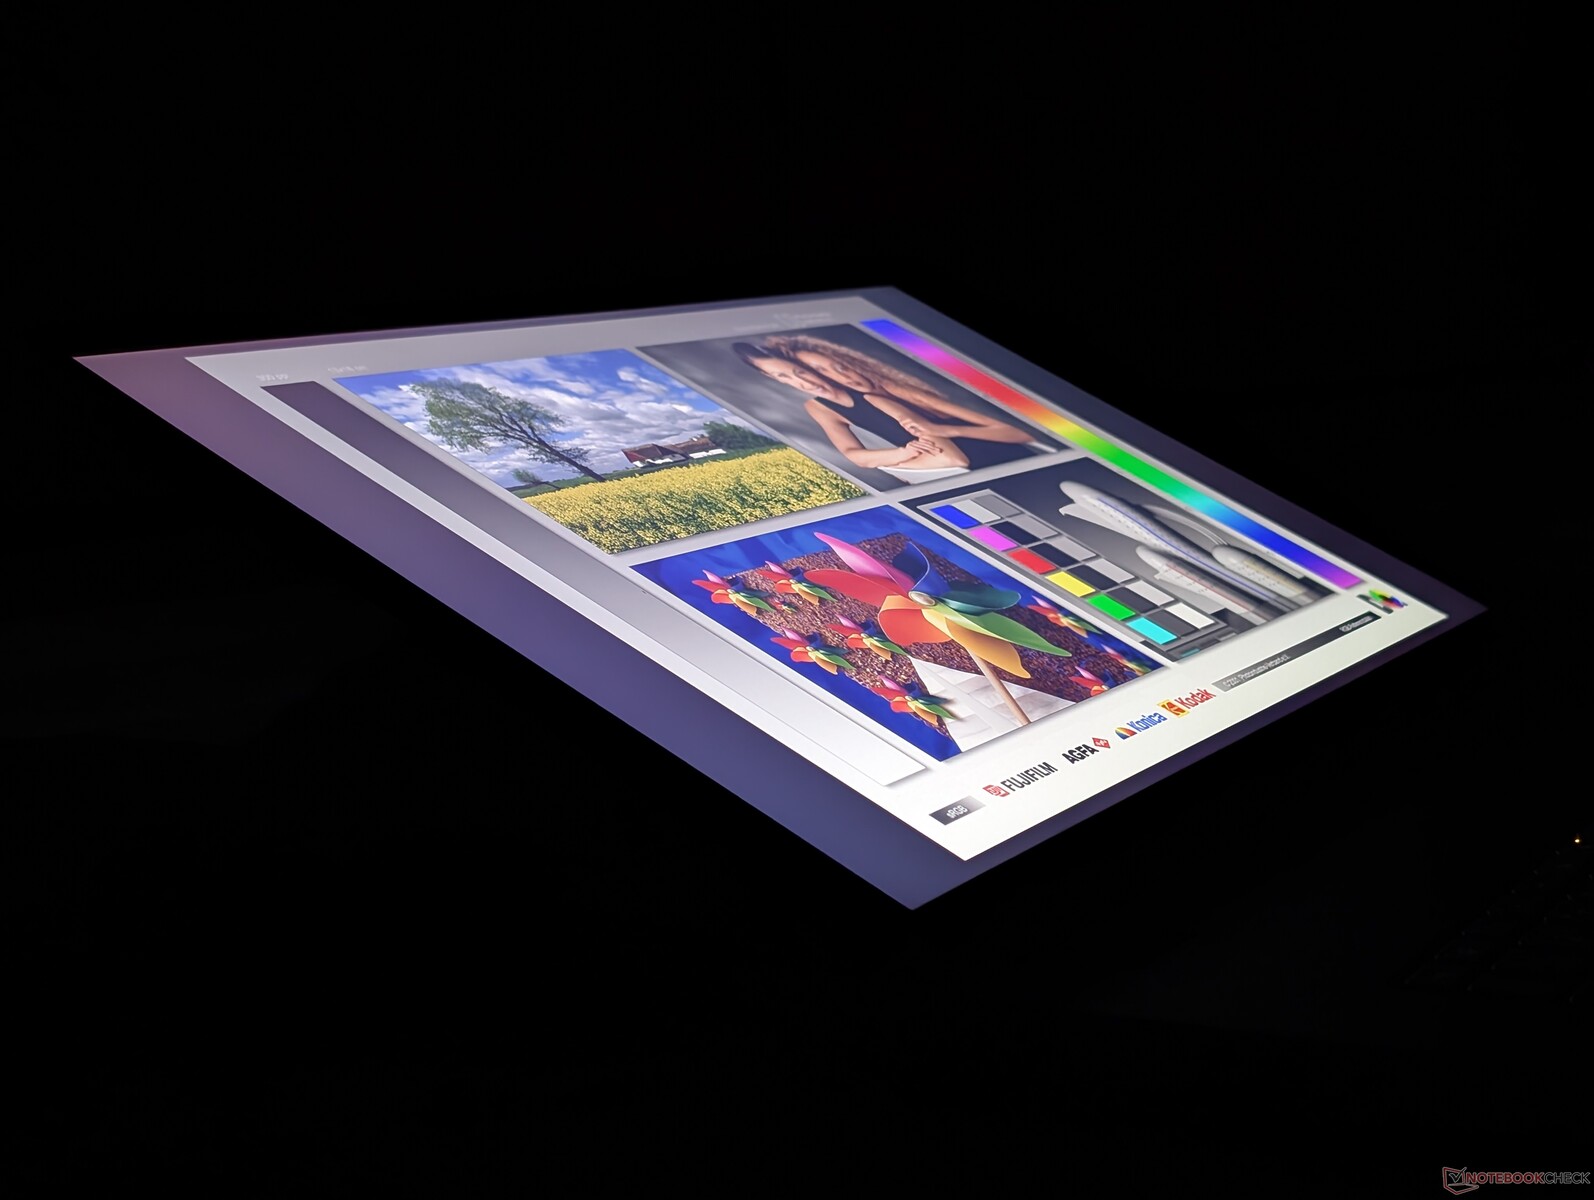
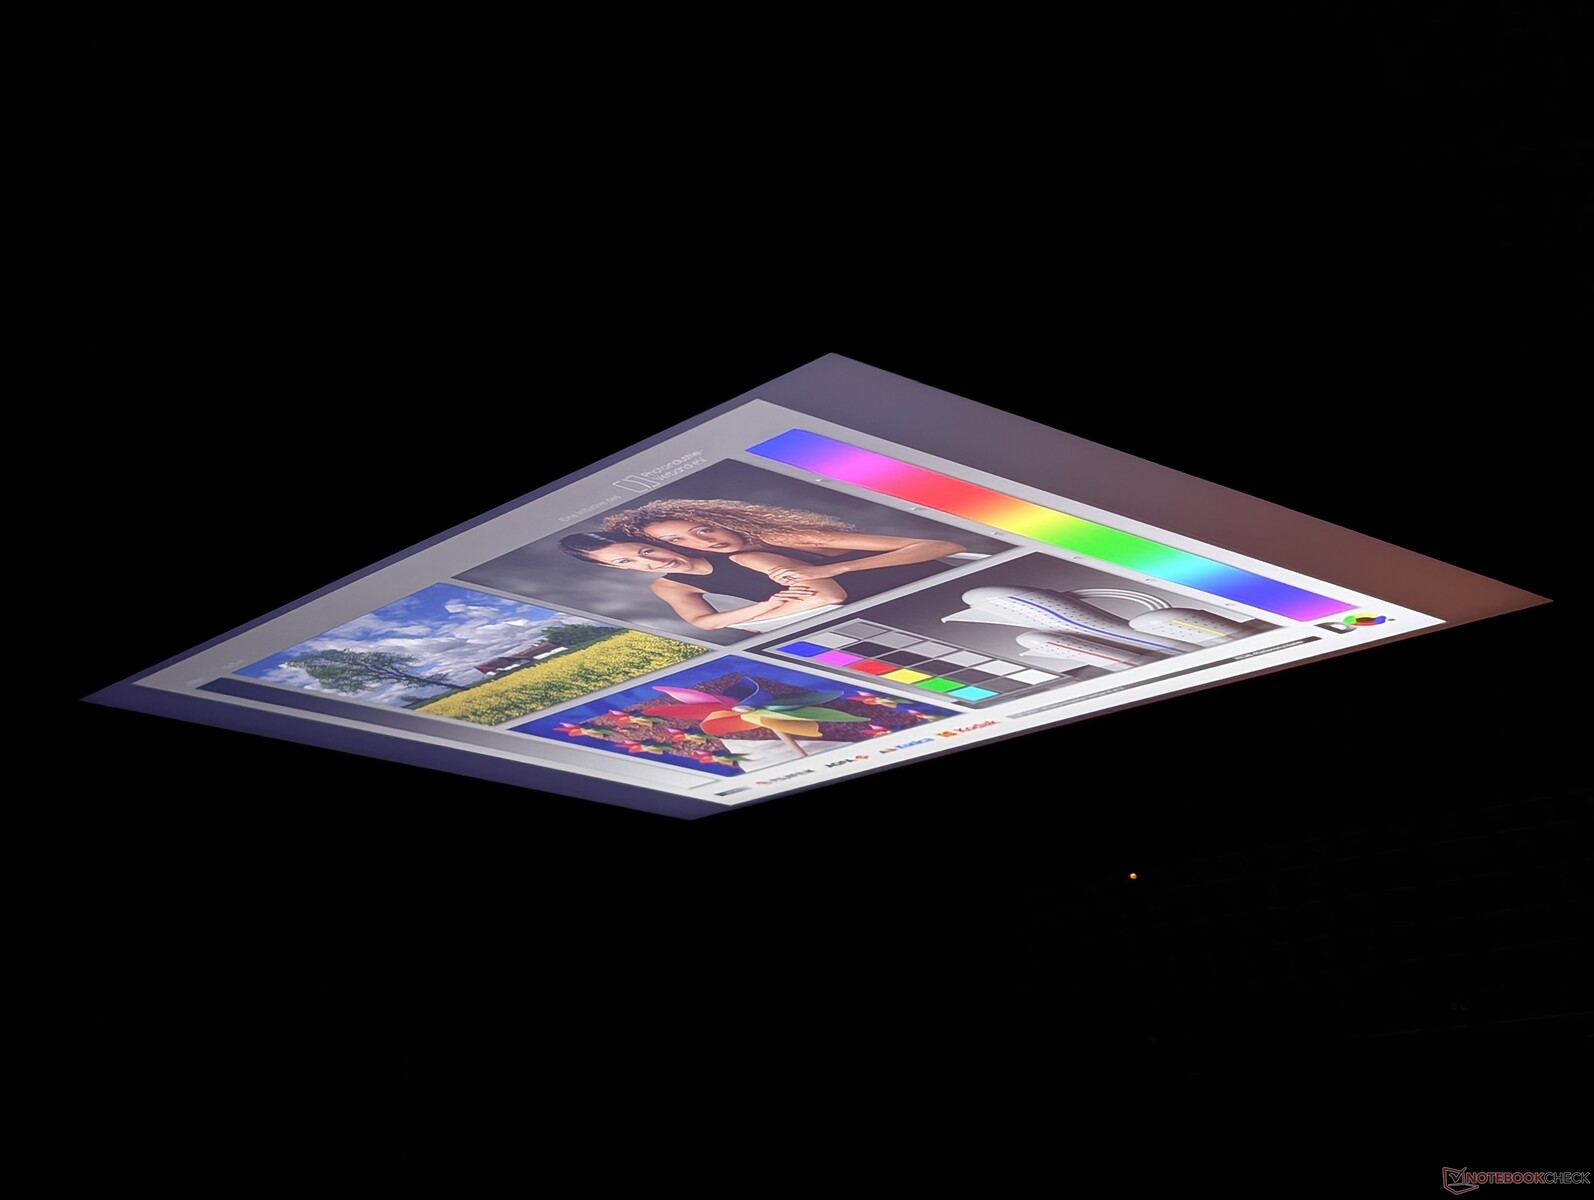
Unser Testgerät leidet unter mäßig unebenem Backlight Bleeding in den Ecken, wie das Bild unten zeigt. Während dies bei billigeren Laptops akzeptabel ist, ist das Clouding bei einer erstklassigen Workstation wie dem ZBook ein wenig enttäuschend.


| |||||||||||||||||||||||||
Ausleuchtung: 92 %
Helligkeit Akku: 517.5 cd/m²
Kontrast: 1617:1 (Schwarzwert: 0.32 cd/m²)
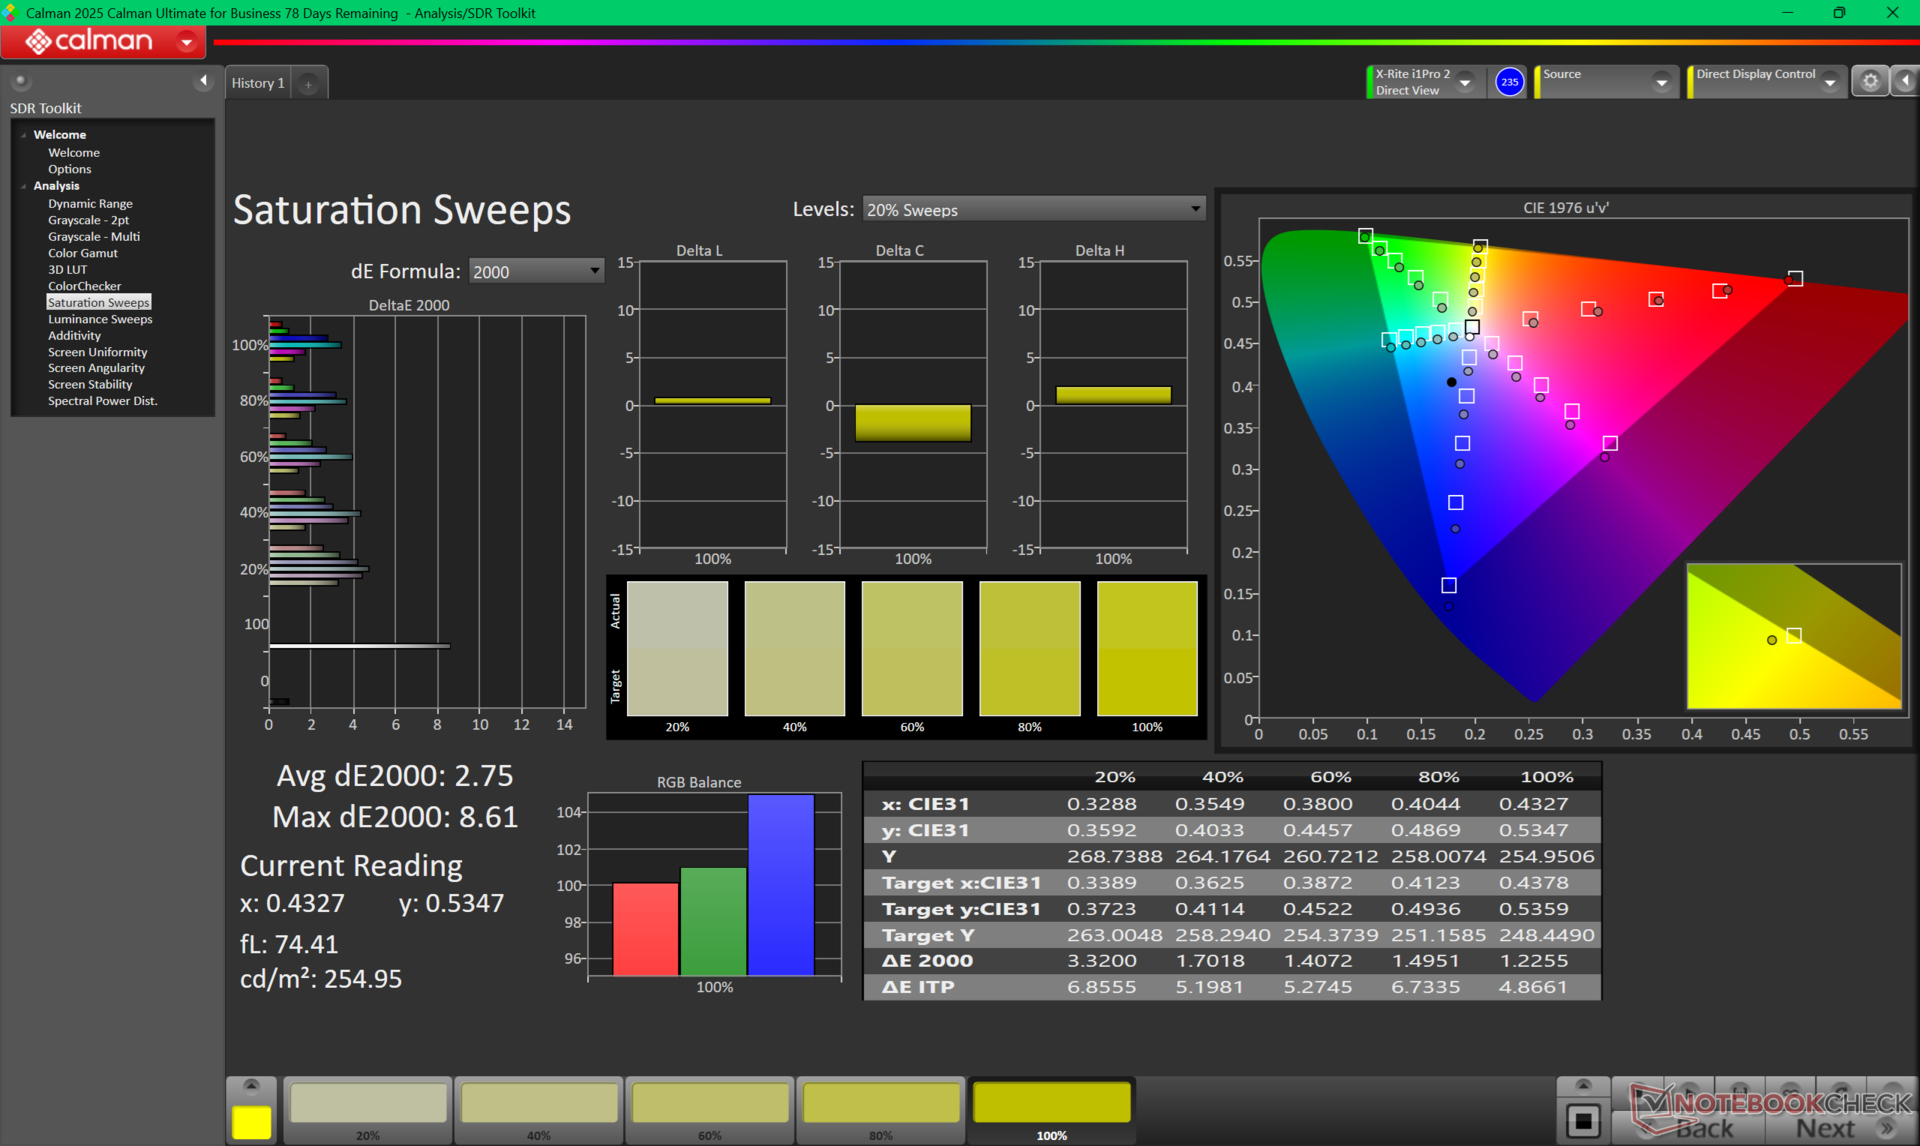
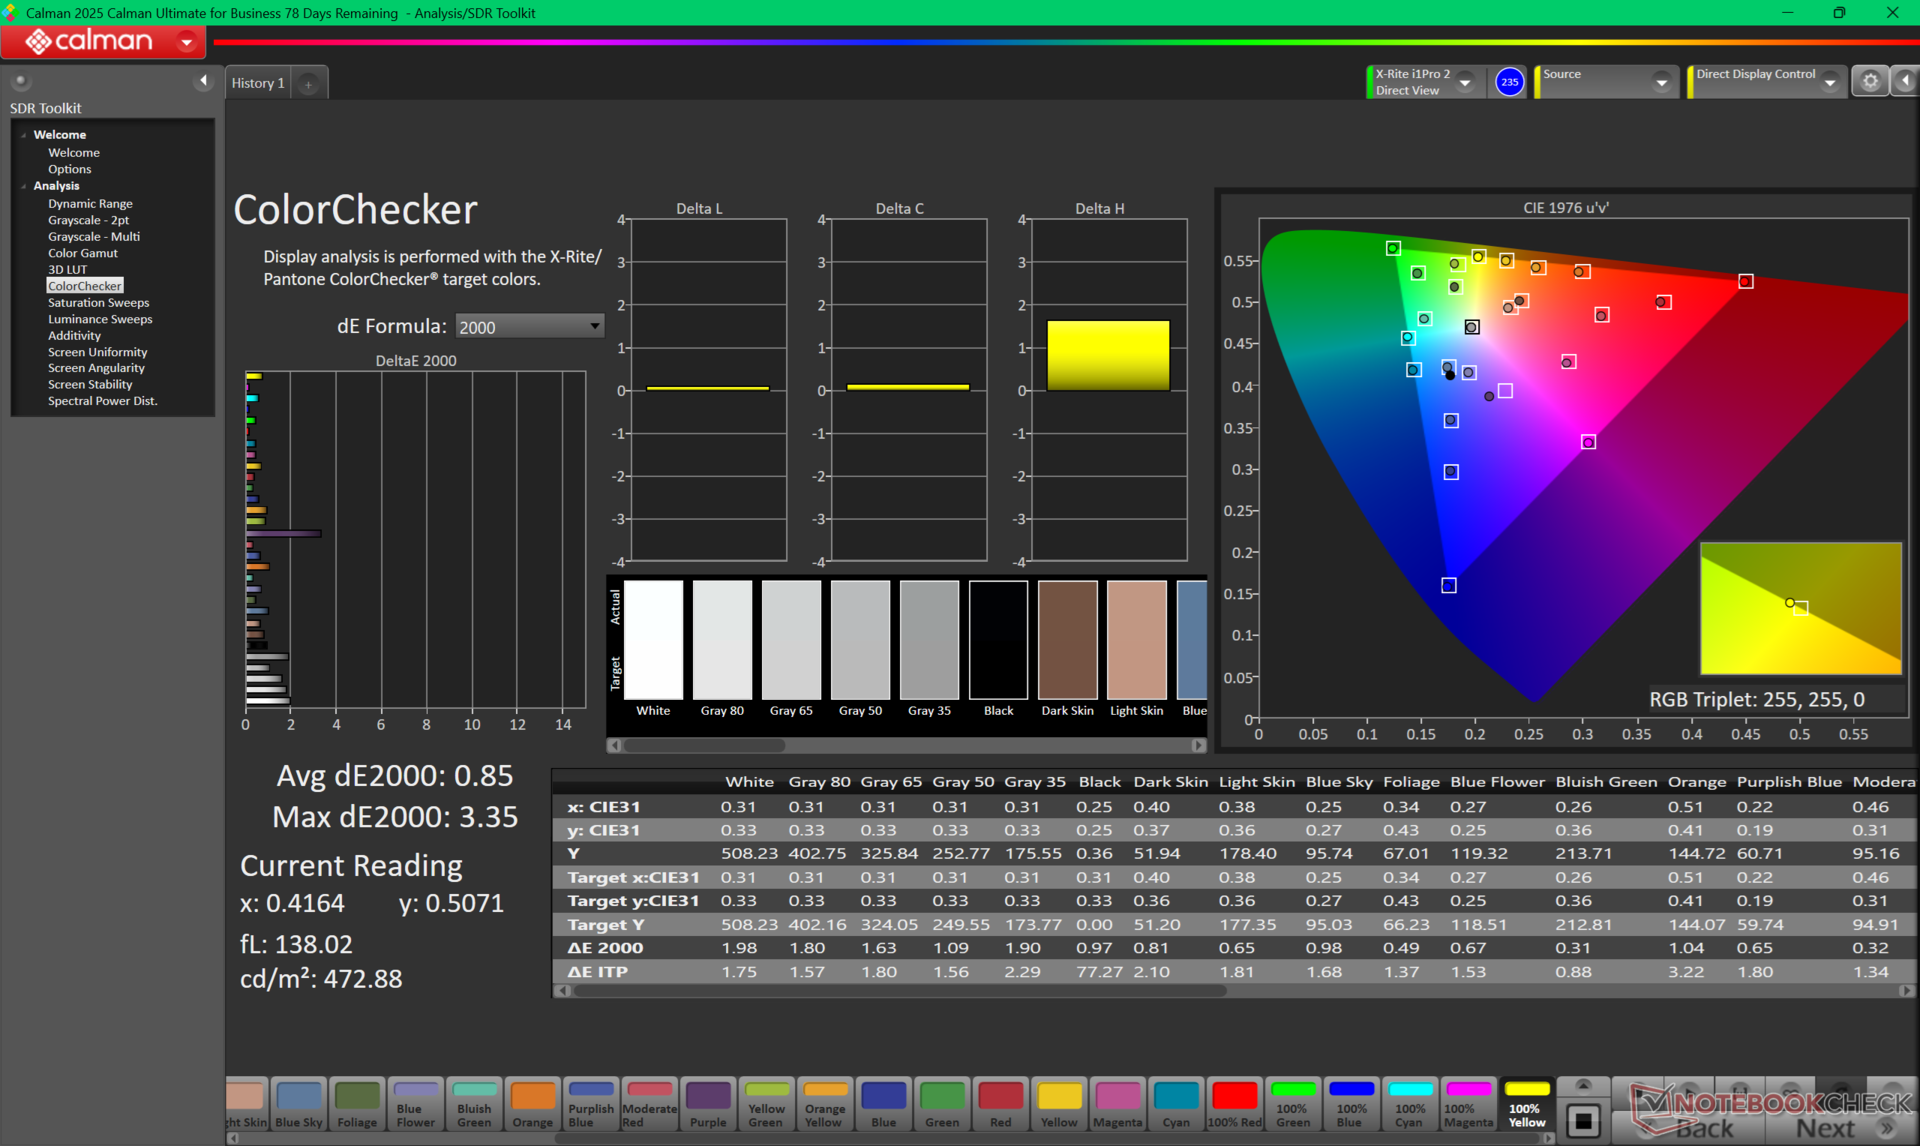
ΔE ColorChecker Calman: 3.62 | ∀{0.5-29.43 Ø4.73}
calibrated: 0.85
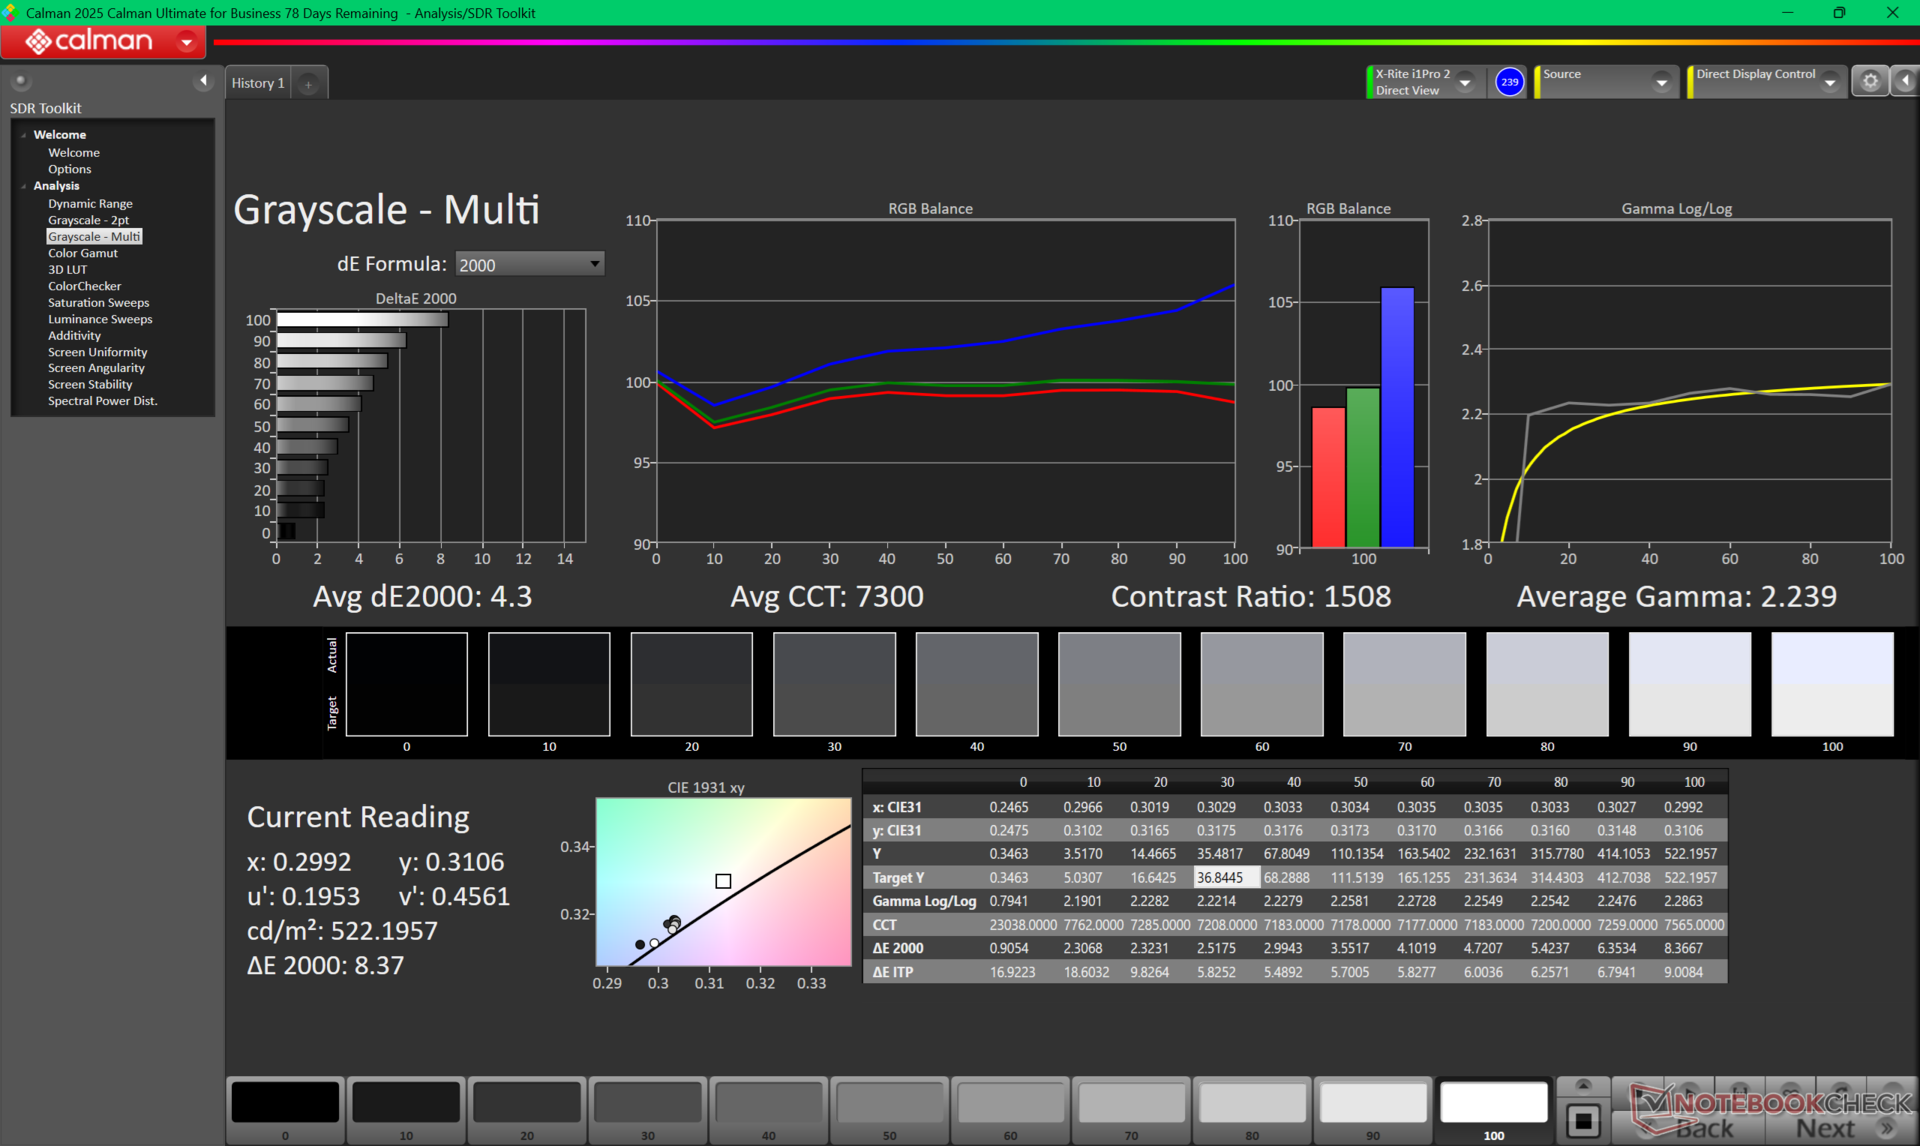
ΔE Greyscale Calman: 4.3 | ∀{0.09-98 Ø4.97}
87.7% AdobeRGB 1998 (Argyll 3D)
100% sRGB (Argyll 3D)
96.6% Display P3 (Argyll 3D)
Gamma: 2.24
CCT: 7300 K
| HP ZBook Fury G1i 18 AUO12B6, IPS, 2560x1600, 18", 165 Hz | Dell Pro Max 18 Plus MB18250 BOE NE18NZ7, IPS, 2560x1600, 18", 120 Hz | Schenker Key 18 Pro M25 RTX 5090 LQ180D1JW01, IPS, 3840x2400, 18", 200 Hz | Lenovo ThinkPad P16 Gen 2 NE160QDM-NY1, IPS, 2560x1600, 16", 165 Hz | HP ZBook X G1i 16 LG Philips LGD07B3, IPS, 2560x1600, 16", 120 Hz | HP ZBook Studio 16 G11 AUO87A8, IPS, 3840x2400, 16", 120 Hz | |
|---|---|---|---|---|---|---|
| Display | -0% | -2% | -17% | 5% | -0% | |
| Display P3 Coverage (%) | 96.6 | 97.7 1% | 90.5 -6% | 68.4 -29% | 97.2 1% | 97.7 1% |
| sRGB Coverage (%) | 100 | 99.9 0% | 100 0% | 96.9 -3% | 100 0% | 99.9 0% |
| AdobeRGB 1998 Coverage (%) | 87.7 | 85.9 -2% | 87.4 0% | 70.6 -19% | 99.9 14% | 85.7 -2% |
| Response Times | -225% | 55% | -12% | -229% | -17% | |
| Response Time Grey 50% / Grey 80% * (ms) | 12.5 ? | 39.9 ? -219% | 5.2 ? 58% | 14.1 ? -13% | 45.5 ? -264% | 14.2 ? -14% |
| Response Time Black / White * (ms) | 8.9 ? | 29.4 ? -230% | 4.3 ? 52% | 9.9 ? -11% | 26.1 ? -193% | 10.6 ? -19% |
| PWM Frequency (Hz) | 26536 ? | |||||
| PWM Amplitude * (%) | 47 | |||||
| Bildschirm | 27% | 5% | 19% | -10% | 2% | |
| Helligkeit Bildmitte (cd/m²) | 517.5 | 528.8 2% | 529 2% | 531.5 3% | 461.8 -11% | 404.3 -22% |
| Brightness (cd/m²) | 497 | 515 4% | 513 3% | 499 0% | 427 -14% | 405 -19% |
| Brightness Distribution (%) | 92 | 91 -1% | 95 3% | 89 -3% | 88 -4% | 92 0% |
| Schwarzwert * (cd/m²) | 0.32 | 0.22 31% | 0.31 3% | 0.38 -19% | 0.46 -44% | 0.28 12% |
| Kontrast (:1) | 1617 | 2404 49% | 1706 6% | 1399 -13% | 1004 -38% | 1444 -11% |
| Delta E Colorchecker * | 3.62 | 2.76 24% | 2.7 25% | 1.82 50% | 4.08 -13% | 2.63 27% |
| Colorchecker dE 2000 max. * | 8.75 | 5.38 39% | 7.8 11% | 4.1 53% | 8.1 7% | 4.48 49% |
| Colorchecker dE 2000 calibrated * | 0.85 | 0.47 45% | 0.8 6% | 0.63 26% | 0.75 12% | 1.46 -72% |
| Delta E Graustufen * | 4.3 | 2.2 49% | 4.9 -14% | 1.2 72% | 3.5 19% | 2.1 51% |
| Gamma | 2.24 98% | 2.14 103% | 2.23 99% | 2.15 102% | 2.15 102% | 2.3 96% |
| CCT | 7300 89% | 2584 252% | 6997 93% | 6484 100% | 6715 97% | 6810 95% |
| Durchschnitt gesamt (Programm / Settings) | -66% /
-15% | 19% /
11% | -3% /
7% | -78% /
-38% | -5% /
-1% |
* ... kleinere Werte sind besser
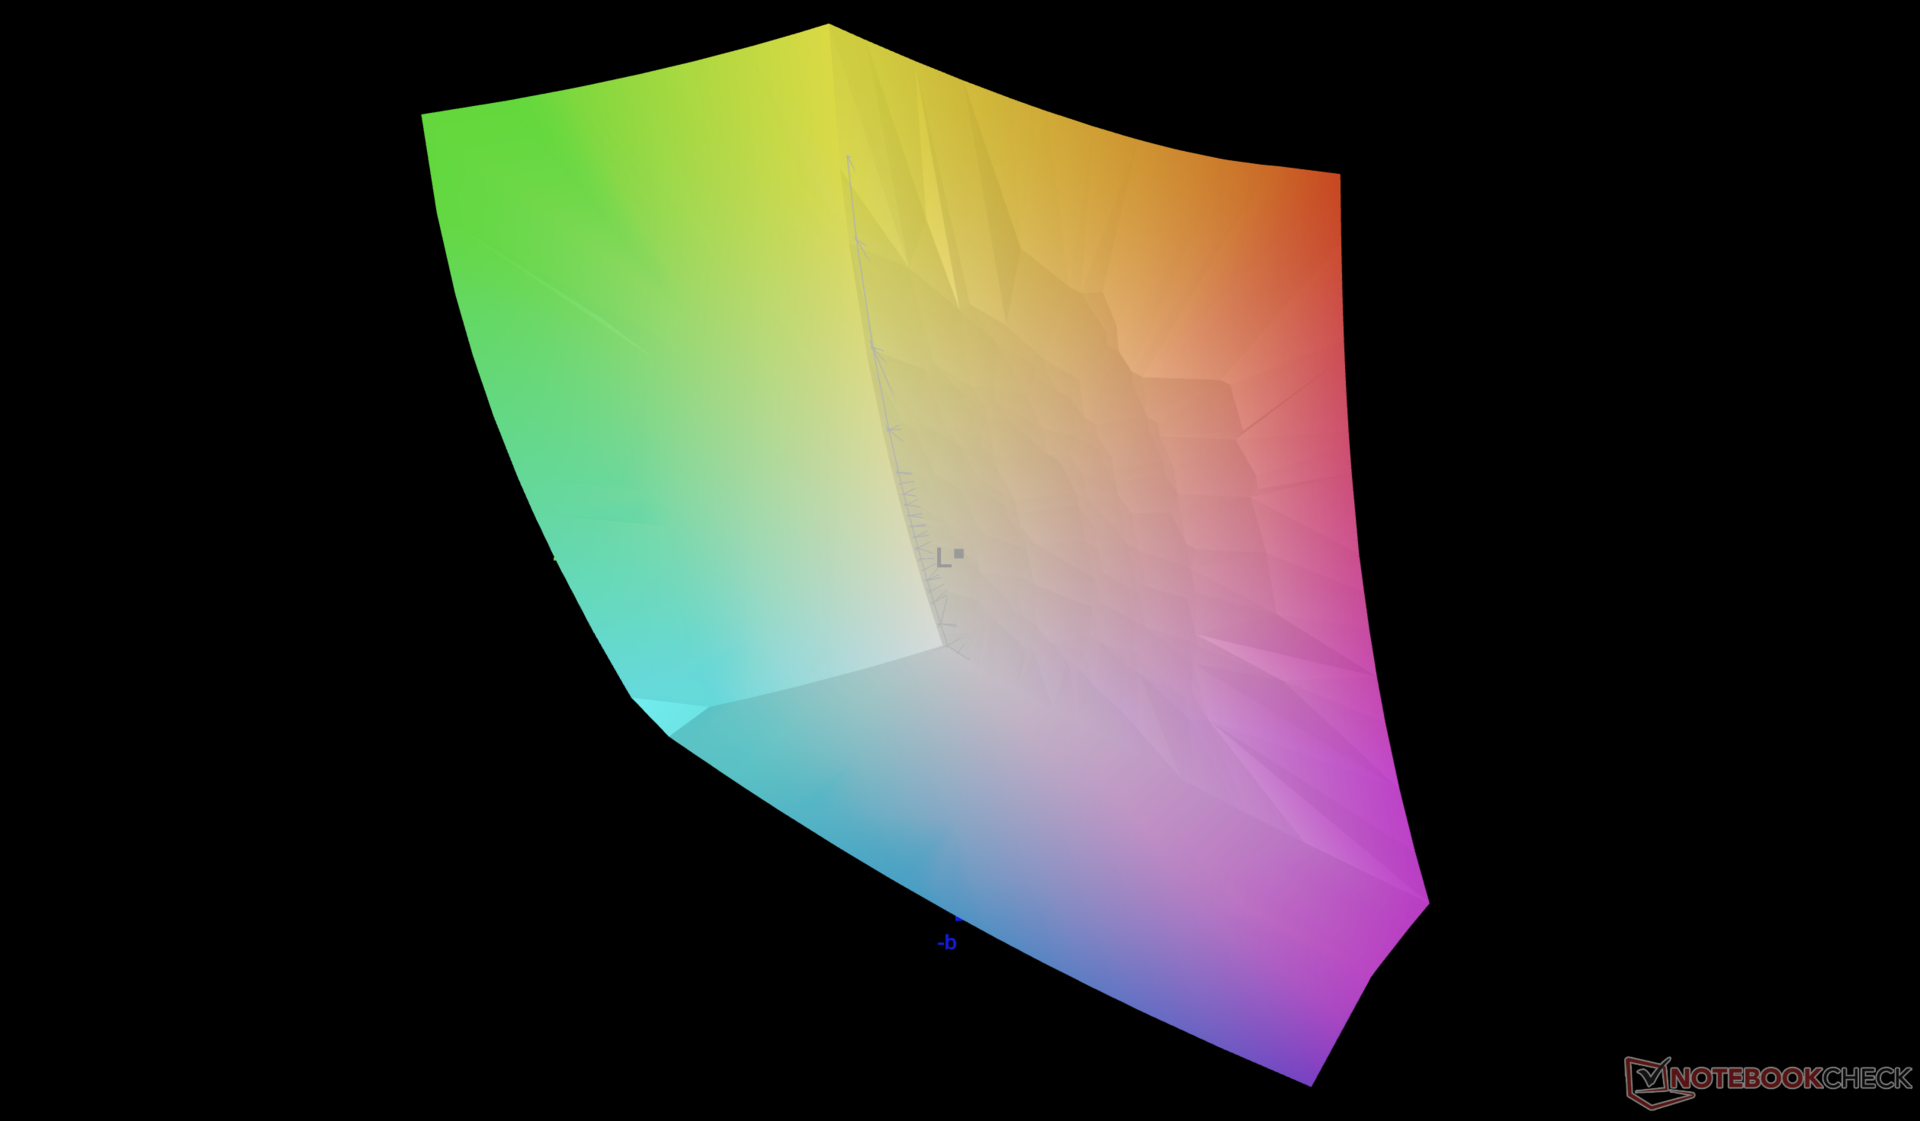
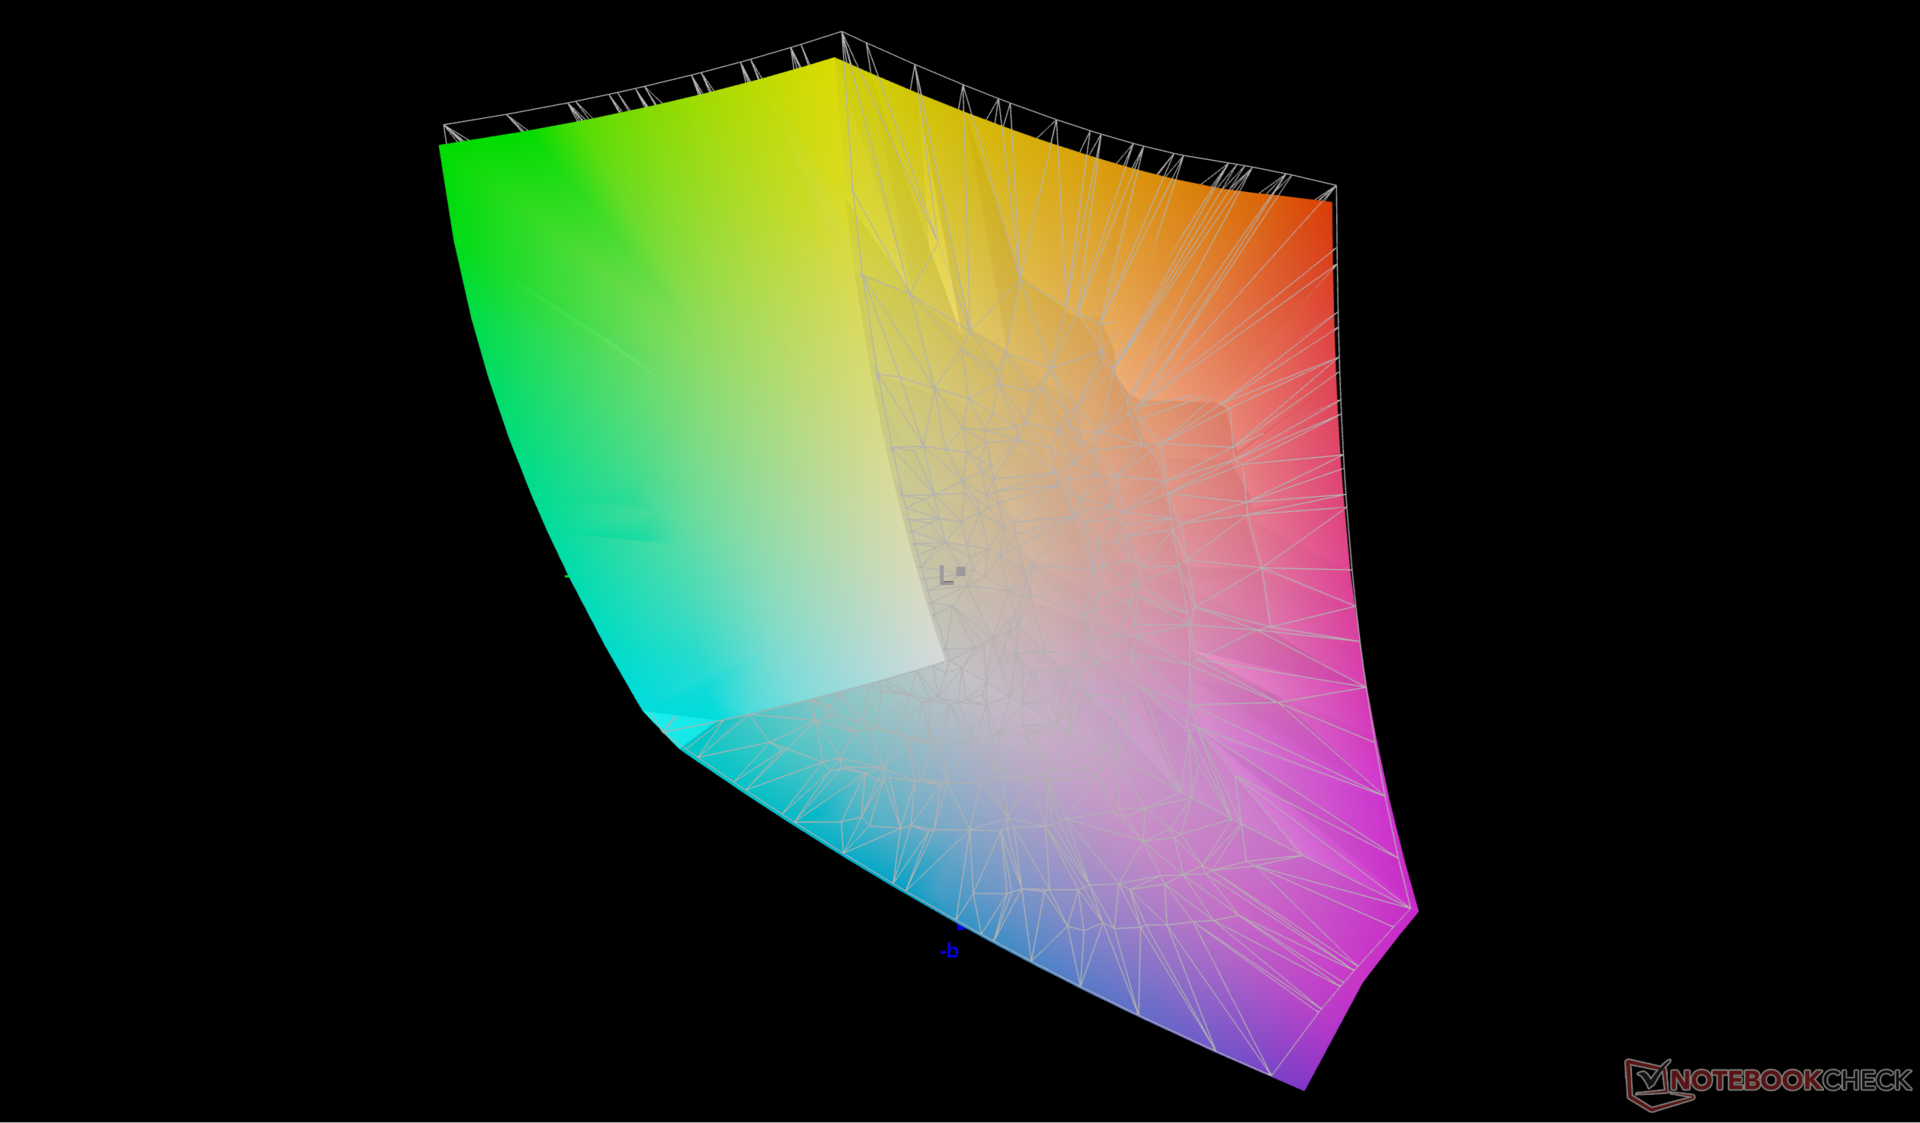
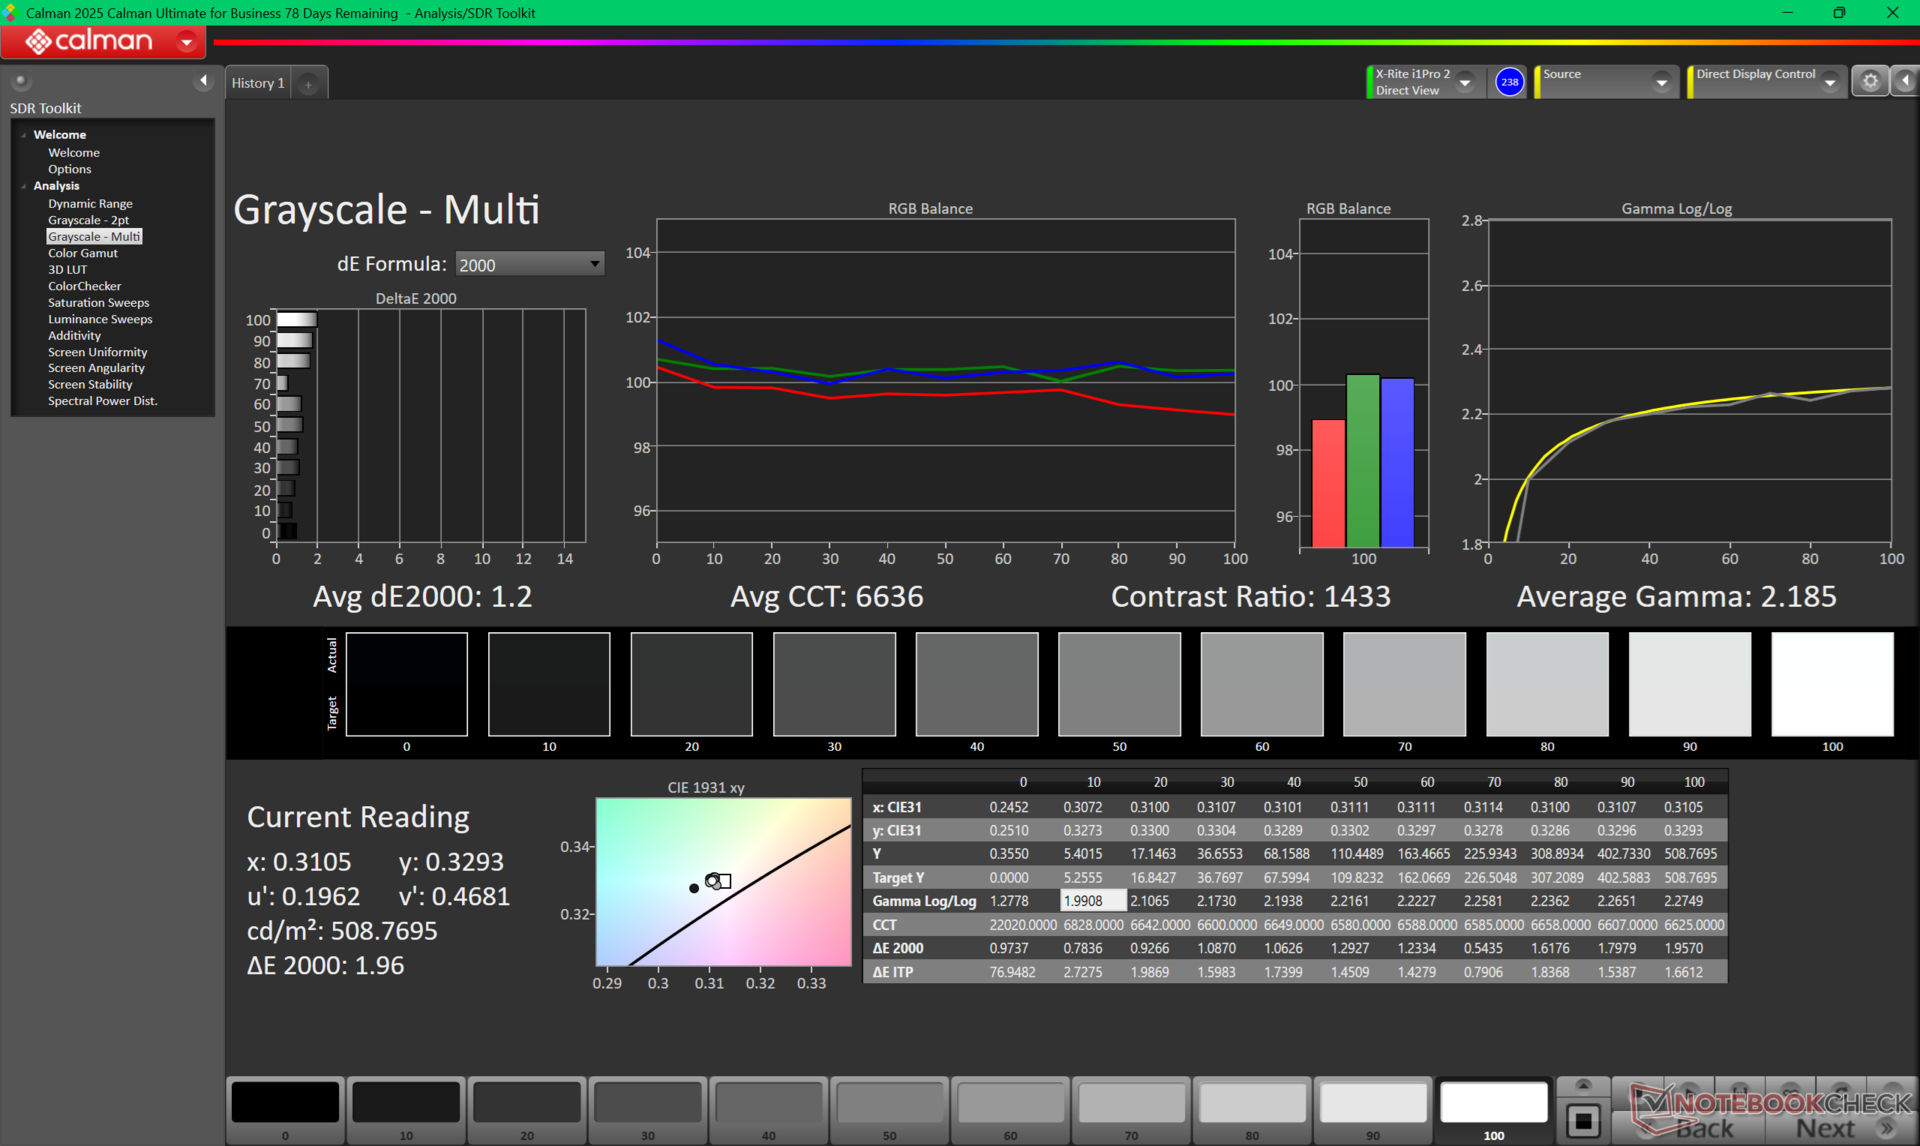
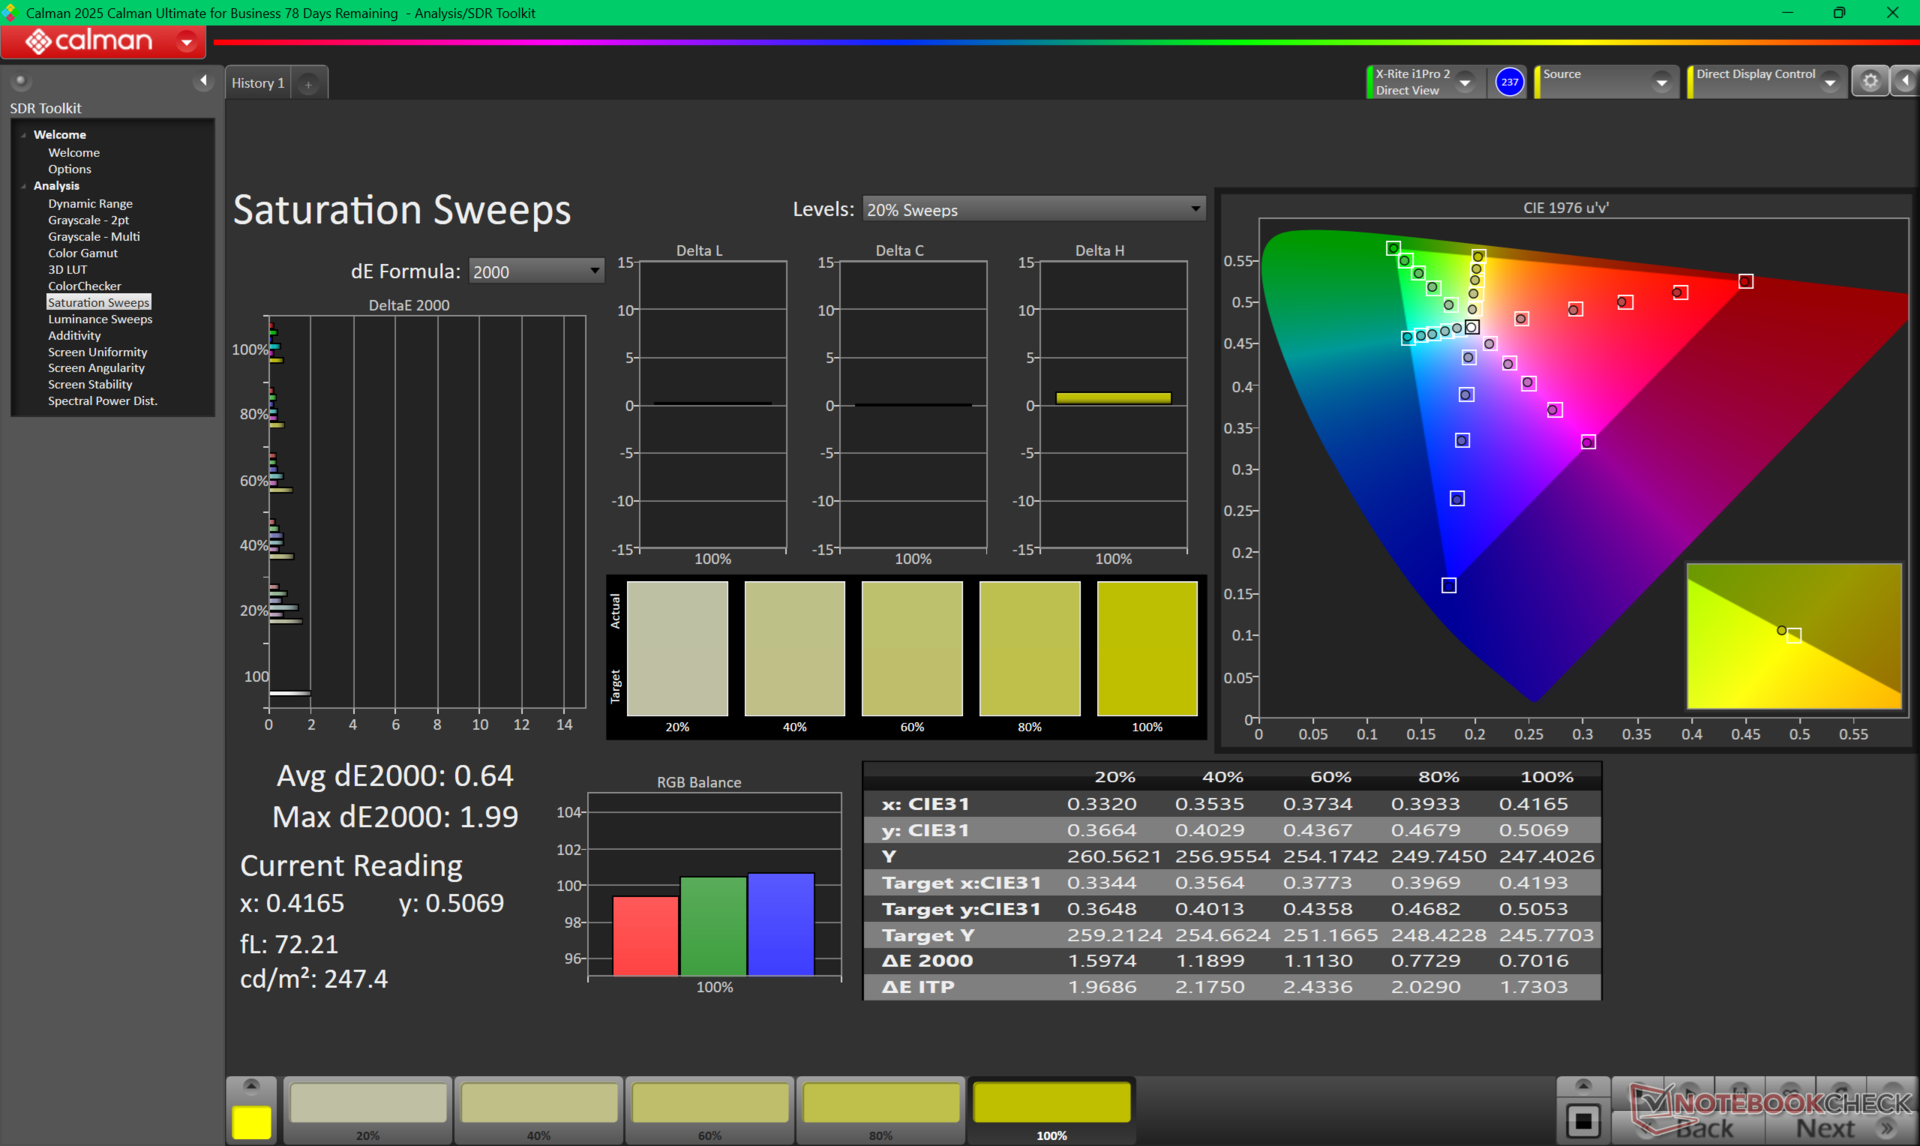
Die Farbtemperatur ist mit 7300 K auf der kühlen Seite ab Werk. Das Display ist ansonsten anständig auf den P3 Standard kalibriert.

Reaktionszeiten (Response Times) des Displays
| ↔ Reaktionszeiten Schwarz zu Weiß | ||
|---|---|---|
| 8.9 ms ... steigend ↗ und fallend ↘ kombiniert | ↗ 4.5 ms steigend | 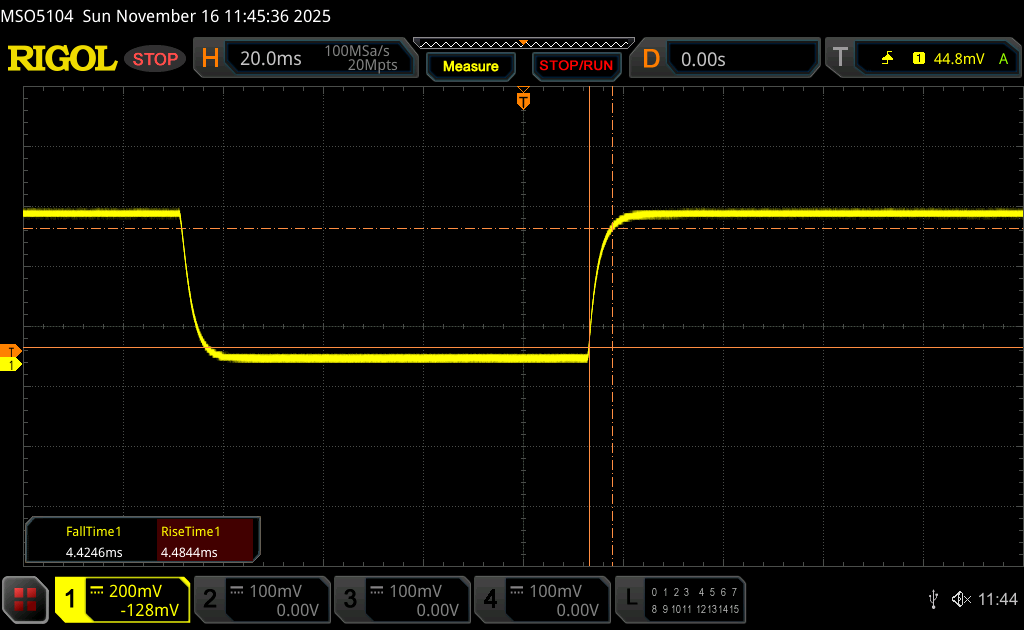 |
| ↘ 4.4 ms fallend | ||
| Die gemessenen Reaktionszeiten sind kurz wodurch sich der Bildschirm auch für Spiele gut eignen sollte. Im Vergleich rangierten die bei uns getesteten Geräte von 0.1 (Minimum) zu 240 (Maximum) ms. » 25 % aller Screens waren schneller als der getestete. Daher sind die gemessenen Reaktionszeiten besser als der Durchschnitt aller vermessenen Geräte (19.9 ms). | ||
| ↔ Reaktionszeiten 50% Grau zu 80% Grau | ||
| 12.5 ms ... steigend ↗ und fallend ↘ kombiniert | ↗ 6.1 ms steigend | 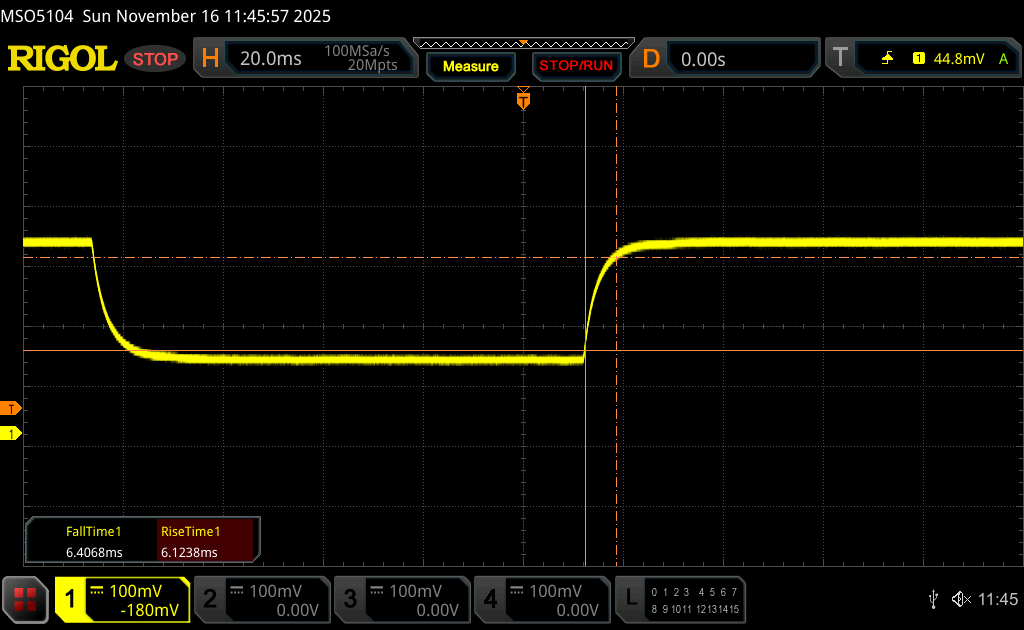 |
| ↘ 6.4 ms fallend | ||
| Die gemessenen Reaktionszeiten sind gut, für anspruchsvolle Spieler könnten der Bildschirm jedoch zu langsam sein. Im Vergleich rangierten die bei uns getesteten Geräte von 0.165 (Minimum) zu 636 (Maximum) ms. » 26 % aller Screens waren schneller als der getestete. Daher sind die gemessenen Reaktionszeiten besser als der Durchschnitt aller vermessenen Geräte (31.1 ms). | ||
Bildschirm-Flackern / PWM (Pulse-Width Modulation)
| Flackern / PWM nicht festgestellt | 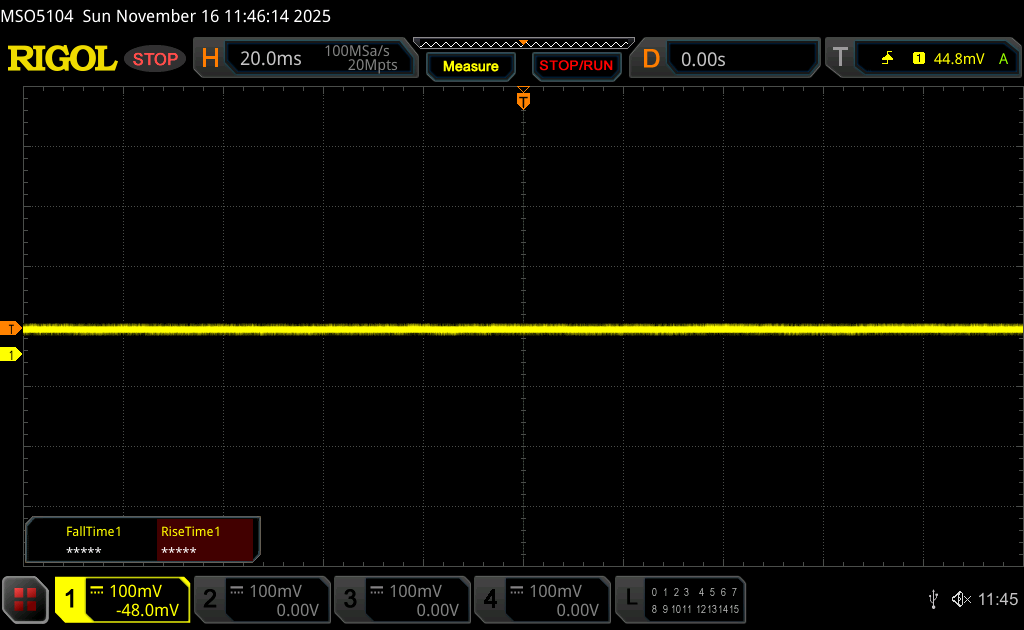 | ||
Im Vergleich: 52 % aller getesteten Geräte nutzten kein PWM um die Helligkeit zu reduzieren. Wenn PWM eingesetzt wurde, dann bei einer Frequenz von durchschnittlich 7801 (Minimum 5, Maximum 343500) Hz. | |||


Performance - Arrow Lake-HX und Nvidia Blackwell
Testbedingungen
Wir haben Windows in den Modus Performance versetzt und die diskrete GPU aktiviert, bevor wir die folgenden Benchmarks durchgeführt haben. Advanced Optimus wird nicht unterstützt, anders als beim Dell Pro Max 18 Plus der Konkurrenz.
Prozessor
Der Core Ultra 9 285HX in unserem HP ist durchweg ein paar Prozentpunkte langsamer als die gleiche CPU im Dell Pro Max 18 Plus. Der Turbo Boost scheint auf dem HP schwächer zu sein, wie unsere CineBench-R15-xT-Schleifenergebnisse unten zeigen, aber beide Geräte pendeln sich bei fast den gleichen Taktraten ein, sobald die Vorteile des Turbo Boosts abklingen.
Eine Konfigurieren mit dem Core Ultra 7 255HX anstelle des Core Ultra 9 285HX, dürfte die Leistung des Prozessors nur um fünf Prozent beeinträchtigen, basierend auf unserer Zeit mit dem Lenovo Legion Pro 5 16IAX10. Benutzer sollten daher die Option mit der günstigeren CPU in Betracht ziehen, um Kosten zu sparen.
Cinebench R15 Mehrfachschleife
Cinebench R23: Multi Core | Single Core
Cinebench R20: CPU (Multi Core) | CPU (Single Core)
Cinebench R15: CPU Multi 64Bit | CPU Single 64Bit
Blender: v2.79 BMW27 CPU
7-Zip 18.03: 7z b 4 | 7z b 4 -mmt1
Geekbench 6.7: Multi-Core | Single-Core
Geekbench 5.5: Multi-Core | Single-Core
HWBOT x265 Benchmark v2.2: 4k Preset
LibreOffice : 20 Documents To PDF
R Benchmark 2.5: Overall mean
* ... kleinere Werte sind besser
AIDA64: FP32 Ray-Trace | FPU Julia | CPU SHA3 | CPU Queen | FPU SinJulia | FPU Mandel | CPU AES | CPU ZLib | FP64 Ray-Trace | CPU PhotoWorxx
| Performance Rating | |
| Dell Pro Max 18 Plus MB18250 | |
| Schenker Key 18 Pro M25 RTX 5090 | |
| Durchschnittliche Intel Core Ultra 9 285HX | |
| HP ZBook Fury G1i 18 | |
| Lenovo ThinkPad P16 Gen 2 | |
| HP ZBook Studio 16 G11 | |
| AIDA64 / FP32 Ray-Trace | |
| Schenker Key 18 Pro M25 RTX 5090 | |
| Dell Pro Max 18 Plus MB18250 | |
| Durchschnittliche Intel Core Ultra 9 285HX (29076 - 42341, n=6) | |
| HP ZBook Fury G1i 18 | |
| Lenovo ThinkPad P16 Gen 2 | |
| HP ZBook Studio 16 G11 | |
| AIDA64 / FPU Julia | |
| Schenker Key 18 Pro M25 RTX 5090 | |
| Durchschnittliche Intel Core Ultra 9 285HX (161276 - 210885, n=6) | |
| Dell Pro Max 18 Plus MB18250 | |
| HP ZBook Fury G1i 18 | |
| Lenovo ThinkPad P16 Gen 2 | |
| HP ZBook Studio 16 G11 | |
| AIDA64 / CPU SHA3 | |
| Schenker Key 18 Pro M25 RTX 5090 | |
| Dell Pro Max 18 Plus MB18250 | |
| Durchschnittliche Intel Core Ultra 9 285HX (7757 - 9815, n=6) | |
| HP ZBook Fury G1i 18 | |
| Lenovo ThinkPad P16 Gen 2 | |
| HP ZBook Studio 16 G11 | |
| AIDA64 / CPU Queen | |
| Lenovo ThinkPad P16 Gen 2 | |
| Durchschnittliche Intel Core Ultra 9 285HX (134345 - 141681, n=6) | |
| Dell Pro Max 18 Plus MB18250 | |
| Schenker Key 18 Pro M25 RTX 5090 | |
| HP ZBook Fury G1i 18 | |
| HP ZBook Studio 16 G11 | |
| AIDA64 / FPU SinJulia | |
| Schenker Key 18 Pro M25 RTX 5090 | |
| Dell Pro Max 18 Plus MB18250 | |
| Lenovo ThinkPad P16 Gen 2 | |
| Durchschnittliche Intel Core Ultra 9 285HX (12559 - 14431, n=6) | |
| HP ZBook Fury G1i 18 | |
| HP ZBook Studio 16 G11 | |
| AIDA64 / FPU Mandel | |
| Schenker Key 18 Pro M25 RTX 5090 | |
| Durchschnittliche Intel Core Ultra 9 285HX (84053 - 108922, n=6) | |
| Dell Pro Max 18 Plus MB18250 | |
| HP ZBook Fury G1i 18 | |
| Lenovo ThinkPad P16 Gen 2 | |
| HP ZBook Studio 16 G11 | |
| AIDA64 / CPU AES | |
| Schenker Key 18 Pro M25 RTX 5090 | |
| Dell Pro Max 18 Plus MB18250 | |
| HP ZBook Fury G1i 18 | |
| Durchschnittliche Intel Core Ultra 9 285HX (119553 - 134195, n=6) | |
| Lenovo ThinkPad P16 Gen 2 | |
| HP ZBook Studio 16 G11 | |
| AIDA64 / CPU ZLib | |
| Dell Pro Max 18 Plus MB18250 | |
| Schenker Key 18 Pro M25 RTX 5090 | |
| Durchschnittliche Intel Core Ultra 9 285HX (1886 - 2267, n=6) | |
| HP ZBook Fury G1i 18 | |
| Lenovo ThinkPad P16 Gen 2 | |
| HP ZBook Studio 16 G11 | |
| AIDA64 / FP64 Ray-Trace | |
| Schenker Key 18 Pro M25 RTX 5090 | |
| Durchschnittliche Intel Core Ultra 9 285HX (15059 - 22312, n=6) | |
| Dell Pro Max 18 Plus MB18250 | |
| HP ZBook Fury G1i 18 | |
| Lenovo ThinkPad P16 Gen 2 | |
| HP ZBook Studio 16 G11 | |
| AIDA64 / CPU PhotoWorxx | |
| Dell Pro Max 18 Plus MB18250 | |
| HP ZBook Studio 16 G11 | |
| Durchschnittliche Intel Core Ultra 9 285HX (39232 - 62611, n=6) | |
| Lenovo ThinkPad P16 Gen 2 | |
| HP ZBook Fury G1i 18 | |
| Schenker Key 18 Pro M25 RTX 5090 | |
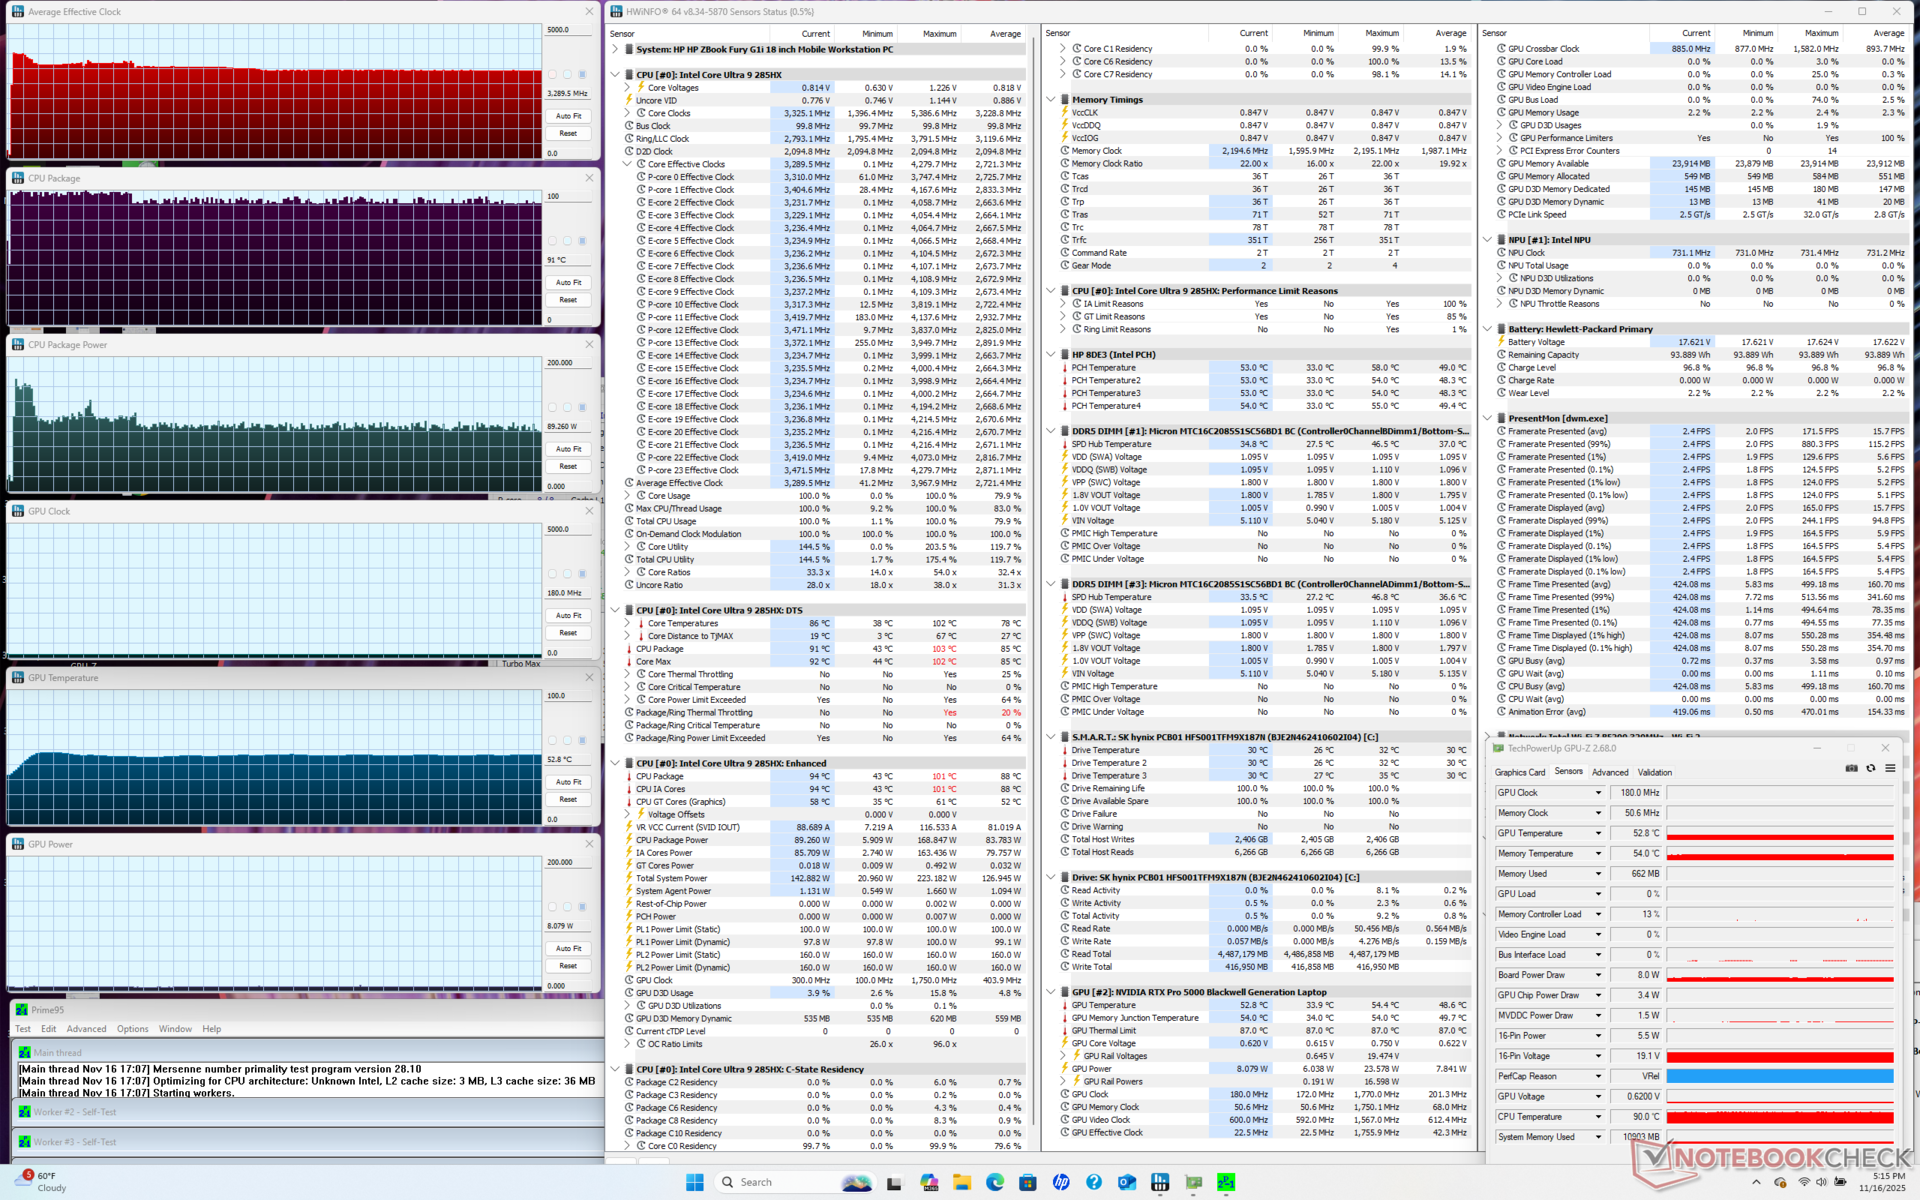
Stresstest
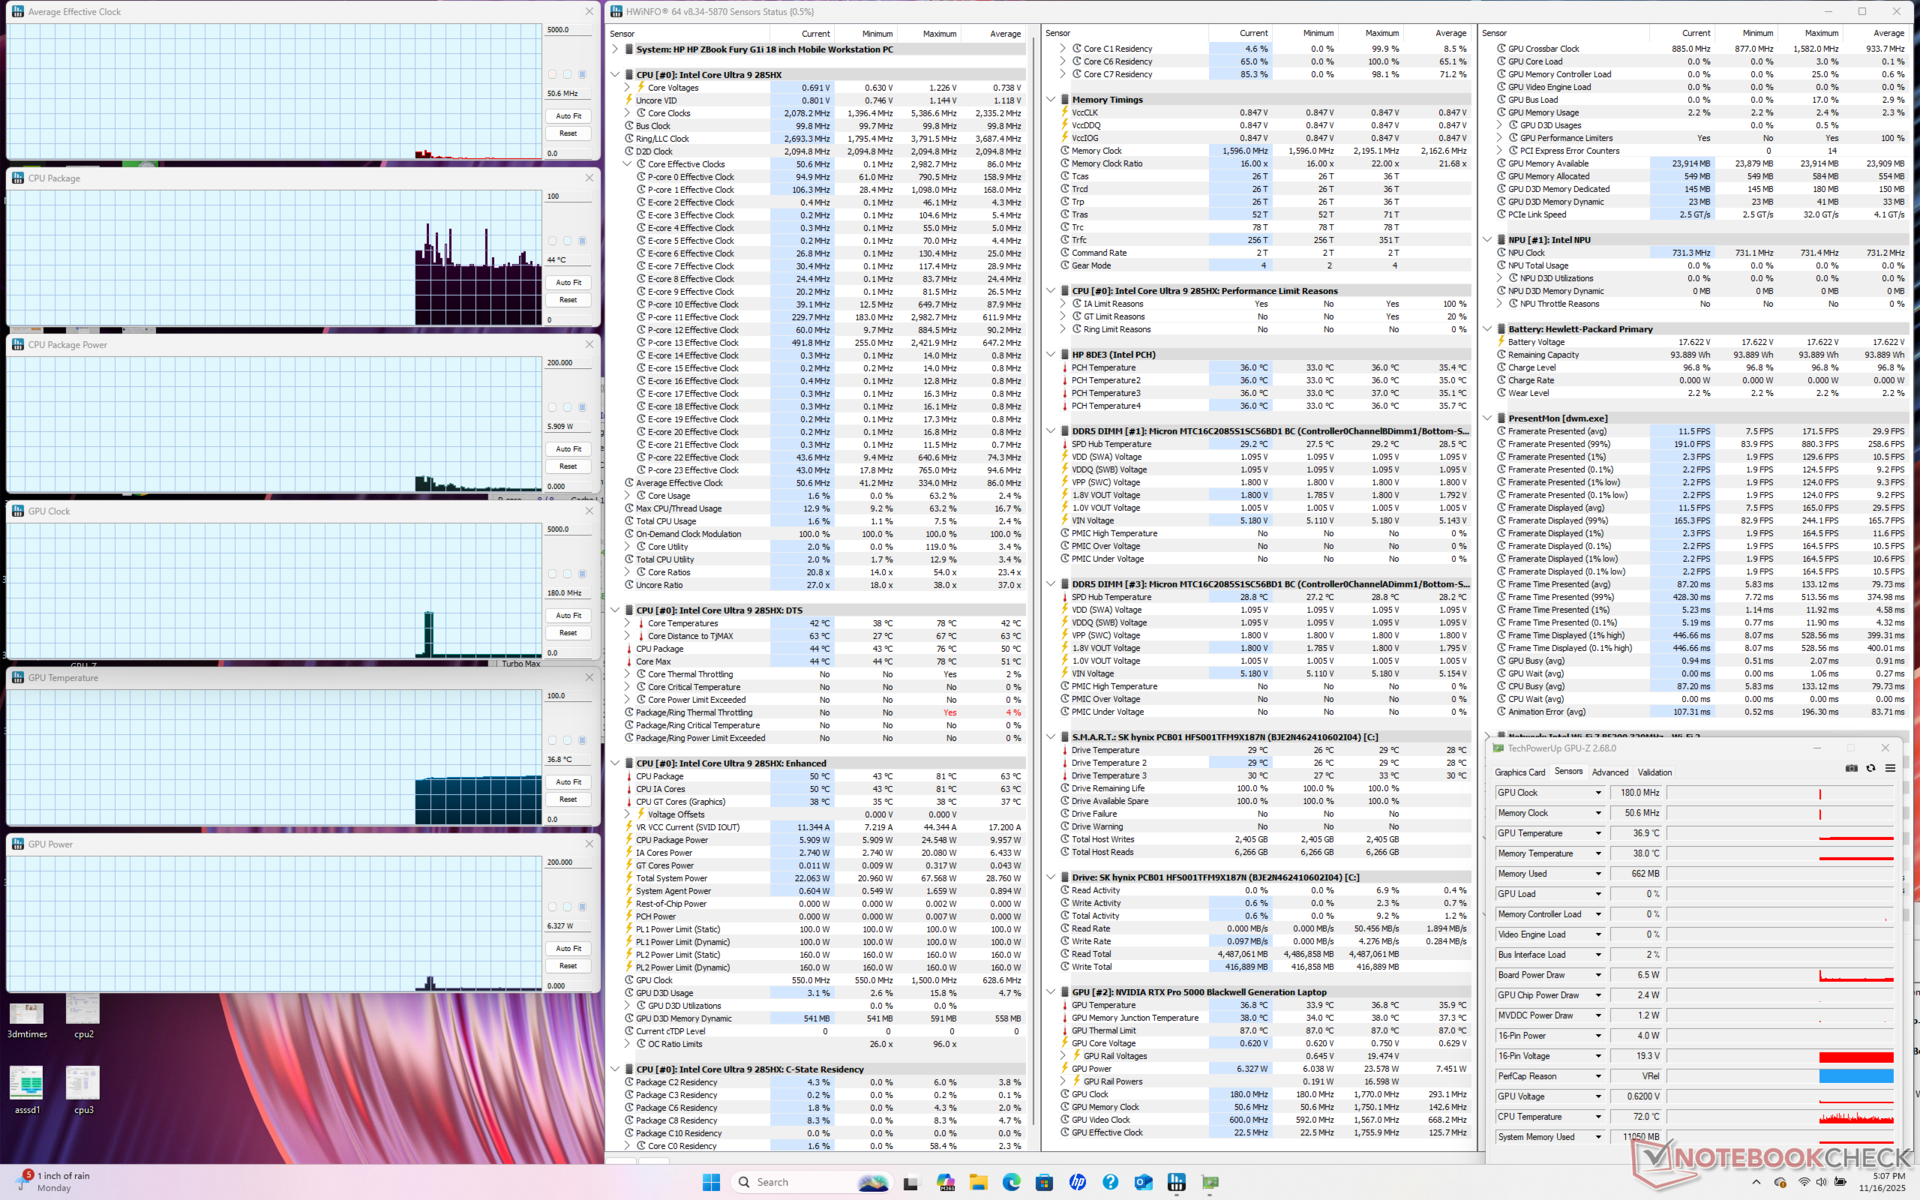
Wenn Prime95 Stress auf der CPU ausgeführt wird, steigen die durchschnittlichen Taktraten für ein paar Sekunden auf 3,9 GHz, 99 °C und 160 W, bevor sie abfallen und sich bei 3,3 GHz, 91 °C und 89 W stabilisieren. Dieses Verhalten ähnelt dem, das wir beim Dell Pro Max 18 Plus beobachtet haben, wenn auch mit etwas niedrigeren Taktraten im Durchschnitt beim HP.
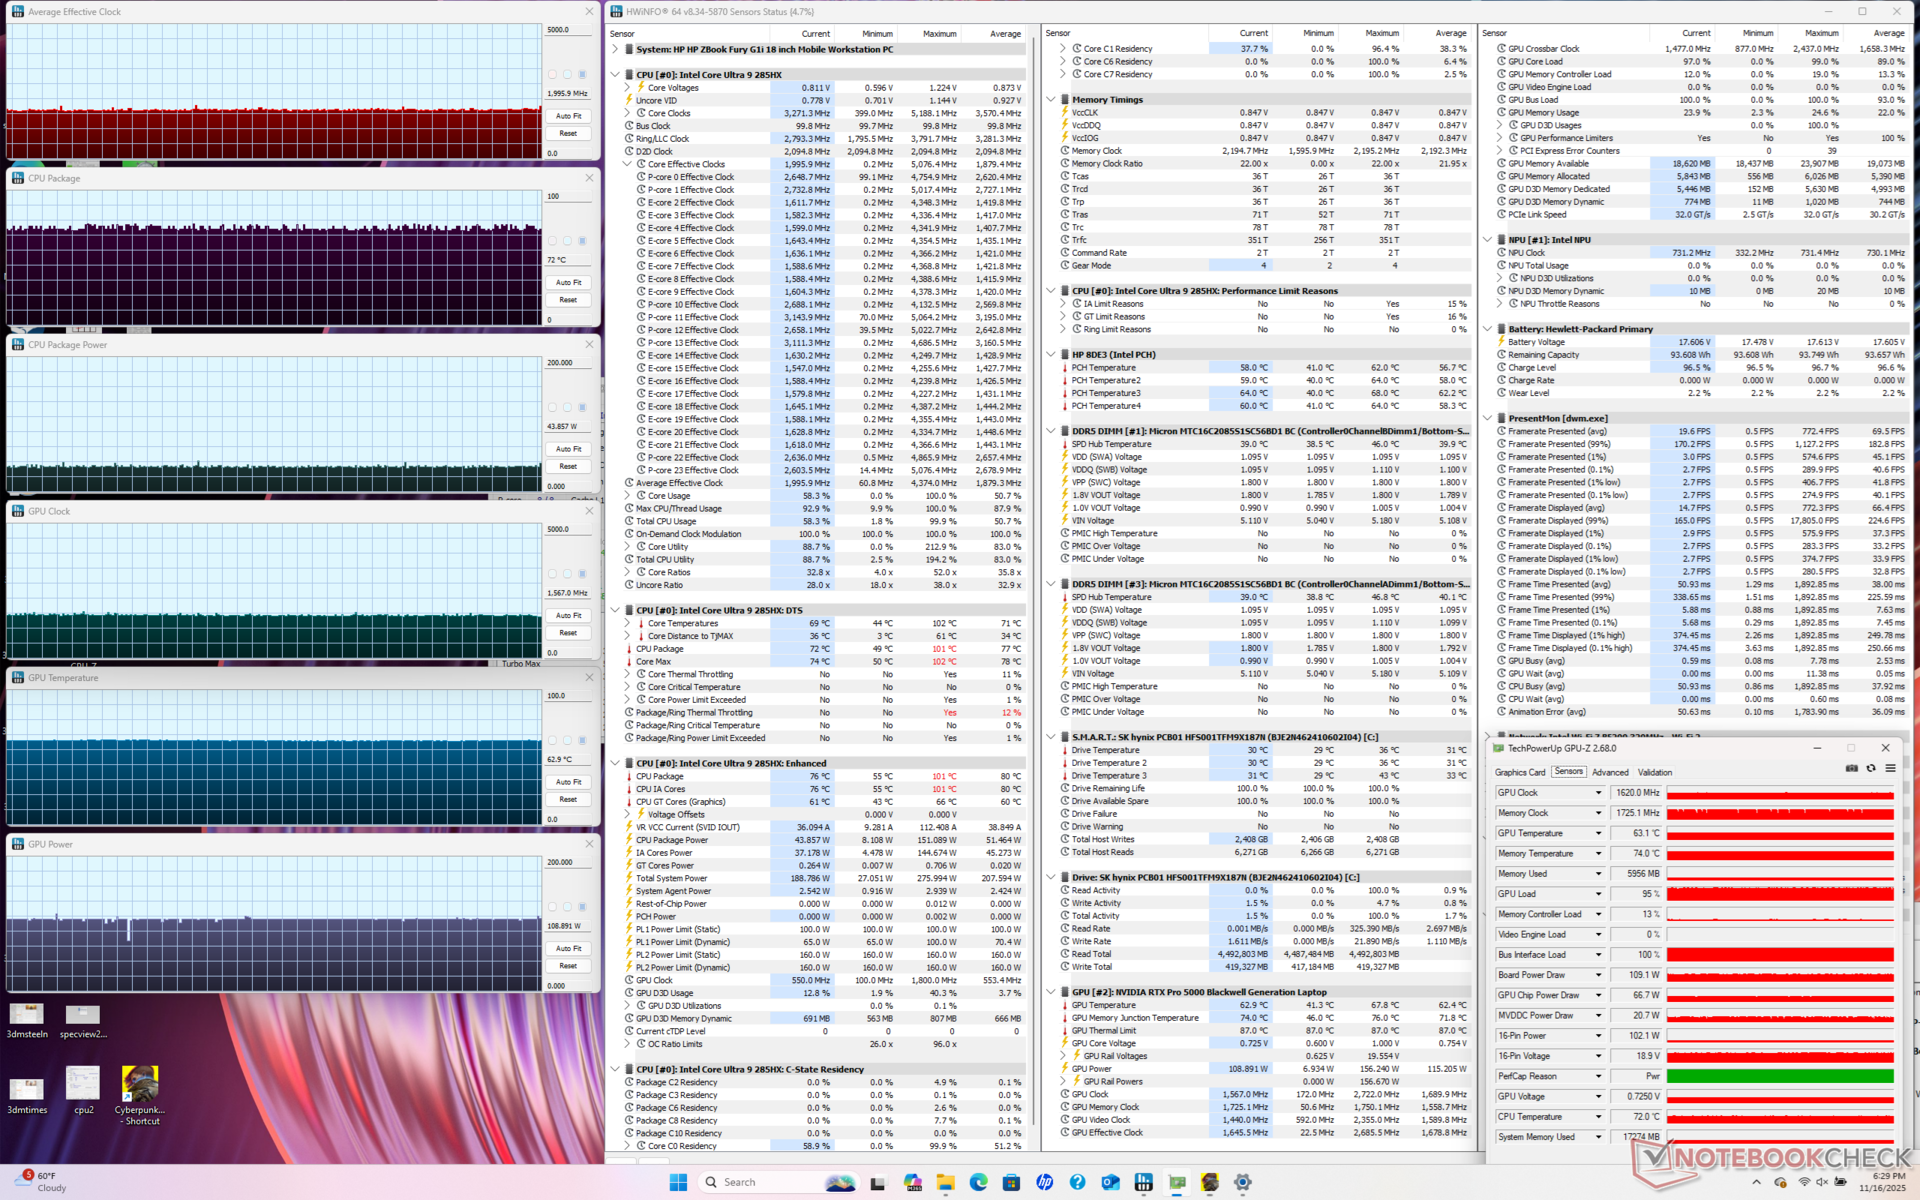
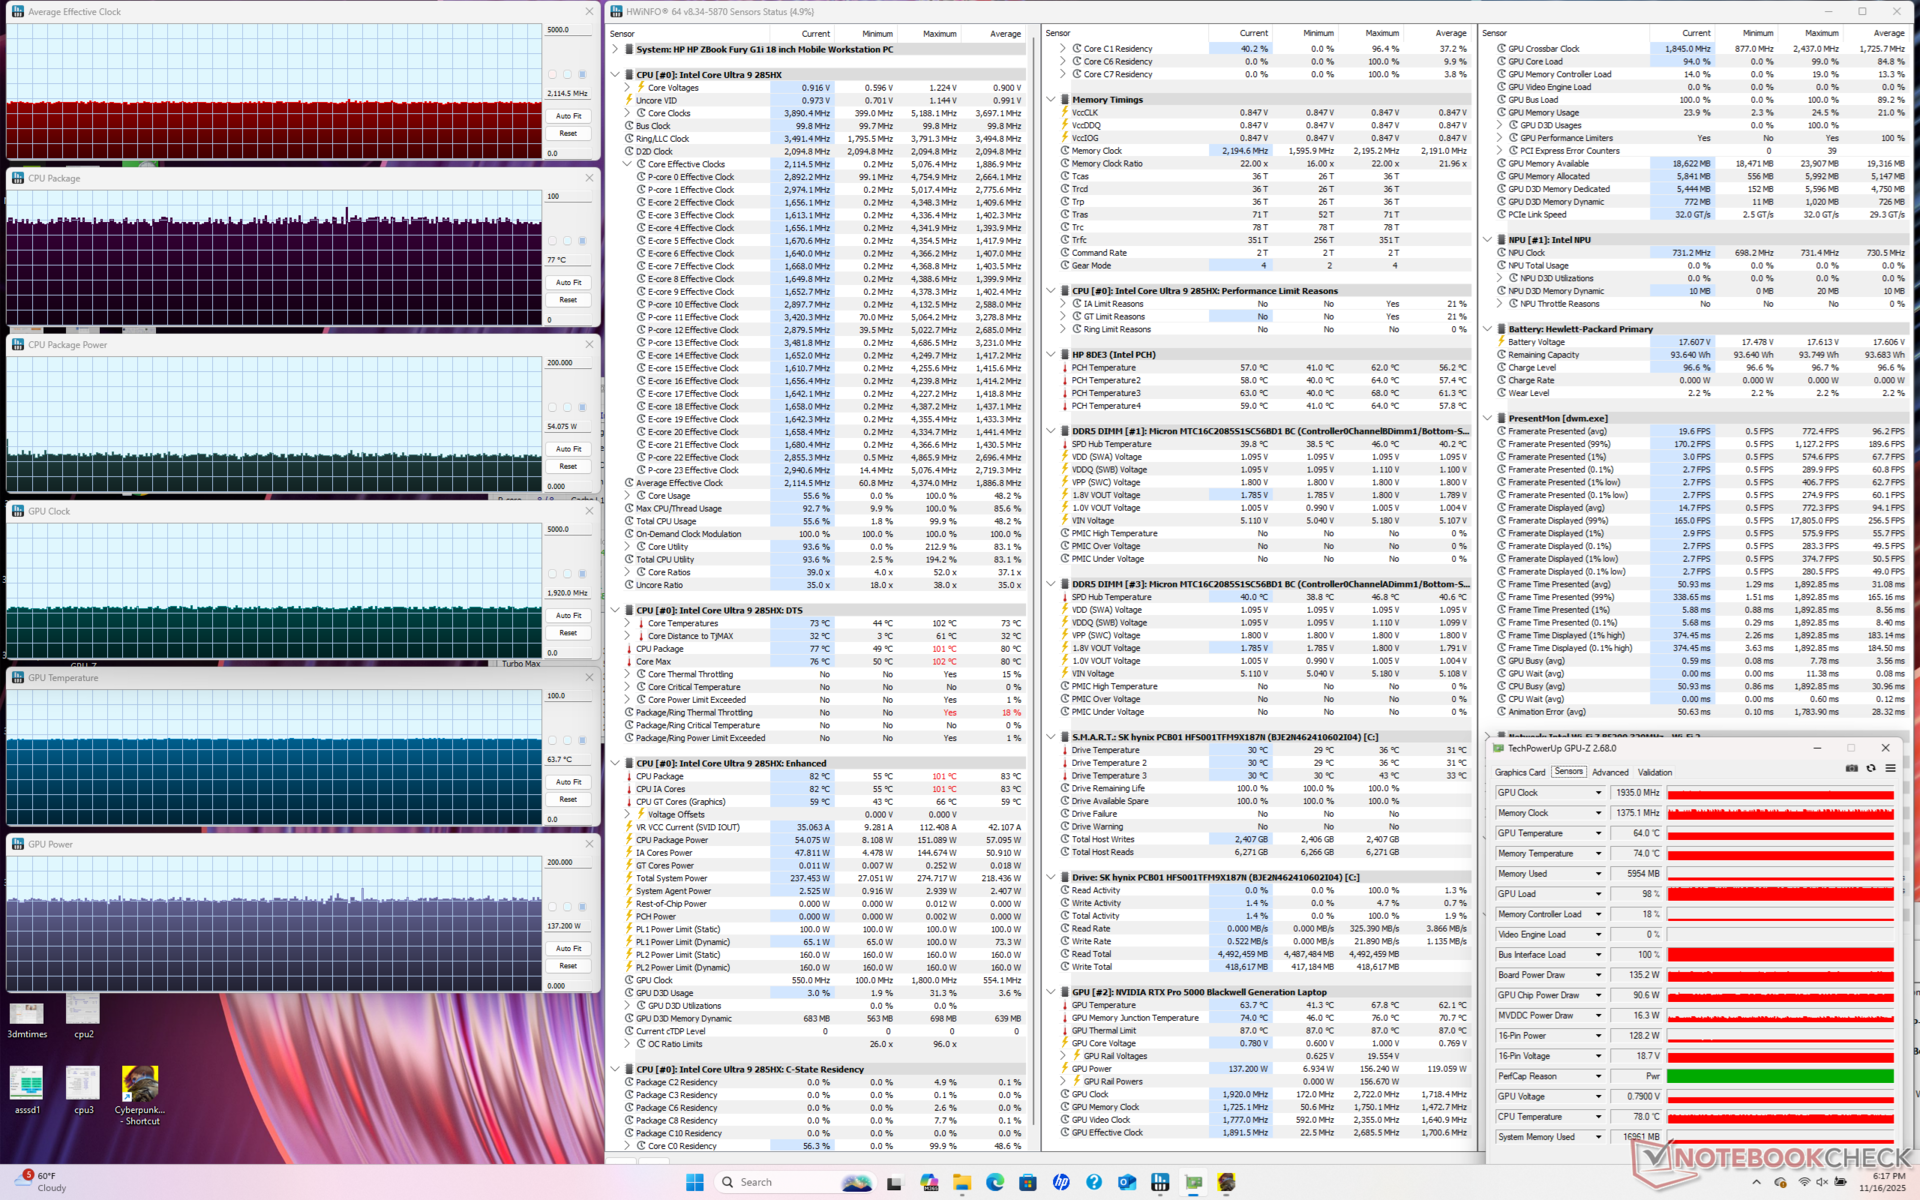
Die CPU- und GPU-Temperaturen stabilisieren sich bei Cyberpunk 2077 bei 77 bzw. 64 °C, verglichen mit 104 bzw. 75 °C auf dem Dell Pro Max 18 Plus. Allerdings ist die Leistung auf dem HP etwas geringer, da die durchschnittliche Leistungsaufnahme der GPU nur 135 W beträgt, verglichen mit 163 W auf dem Dell, wenn beide Systeme auf den Modus Performance eingestellt sind.

| durchschnittlicher CPU-Takt (GHz) | GPU-Takt (MHz) | durchschnittliche CPU-Temperatur (°C) | durchschnittliche GPU-Temperatur (°C) | |
| System Leerlauf | -- | -- | 44 | 37 |
| Prime95 Stress | 3,3 | -- | 91 | 53 |
| Prime95 + FurMark Stress | 3,0 | 1.882 | 86 | 65 |
| Cyberpunk 2077 Stress (Ausgeglichener Modus) | 2,0 | 1.567 | 72 | 63 |
| Cyberpunk 2077 Stress (Performance-Modus) | 2,1 | 1.920 | 77 | 64 |
Systemleistung
Der PCMark 10 konnte unabhängig von den GPU-Einstellungen nicht zu Ende geführt werden und wird daher im Folgenden nicht aufgeführt. Man beachte, dass die AIDA64-Speicherergebnisse deutlich langsamer sind als beim Dell Pro Max 18 Plus, da die RAM-Technologie einer der wichtigsten Unterscheidungsfaktoren zwischen den beiden Modellen ist.
CrossMark: Overall | Productivity | Creativity | Responsiveness
WebXPRT 3: Overall
WebXPRT 4: Overall
Mozilla Kraken 1.1: Total
Geekbench AI: Quantized GPU 1.7 | Half Precision GPU 1.7 | Single Precision GPU 1.7
| Performance Rating | |
| Dell Pro Max 18 Plus MB18250 | |
| Durchschnittliche Intel Core Ultra 9 285HX, NVIDIA RTX PRO 5000 Blackwell Generation Laptop | |
| HP ZBook Fury G1i 18 | |
| Schenker Key 18 Pro M25 RTX 5090 | |
| Lenovo ThinkPad P16 Gen 2 -3! | |
| HP ZBook X G1i 16 | |
| HP ZBook Studio 16 G11 -3! | |
| CrossMark / Overall | |
| Dell Pro Max 18 Plus MB18250 | |
| Durchschnittliche Intel Core Ultra 9 285HX, NVIDIA RTX PRO 5000 Blackwell Generation Laptop (2142 - 2267, n=3) | |
| HP ZBook Fury G1i 18 | |
| Schenker Key 18 Pro M25 RTX 5090 | |
| Lenovo ThinkPad P16 Gen 2 | |
| HP ZBook X G1i 16 | |
| HP ZBook Studio 16 G11 | |
| CrossMark / Productivity | |
| HP ZBook Fury G1i 18 | |
| Durchschnittliche Intel Core Ultra 9 285HX, NVIDIA RTX PRO 5000 Blackwell Generation Laptop (2016 - 2028, n=3) | |
| Dell Pro Max 18 Plus MB18250 | |
| Schenker Key 18 Pro M25 RTX 5090 | |
| HP ZBook X G1i 16 | |
| Lenovo ThinkPad P16 Gen 2 | |
| HP ZBook Studio 16 G11 | |
| CrossMark / Creativity | |
| Dell Pro Max 18 Plus MB18250 | |
| Durchschnittliche Intel Core Ultra 9 285HX, NVIDIA RTX PRO 5000 Blackwell Generation Laptop (2395 - 2725, n=3) | |
| HP ZBook Fury G1i 18 | |
| Lenovo ThinkPad P16 Gen 2 | |
| HP ZBook X G1i 16 | |
| Schenker Key 18 Pro M25 RTX 5090 | |
| HP ZBook Studio 16 G11 | |
| CrossMark / Responsiveness | |
| Schenker Key 18 Pro M25 RTX 5090 | |
| Dell Pro Max 18 Plus MB18250 | |
| Durchschnittliche Intel Core Ultra 9 285HX, NVIDIA RTX PRO 5000 Blackwell Generation Laptop (1806 - 1858, n=3) | |
| HP ZBook Fury G1i 18 | |
| Lenovo ThinkPad P16 Gen 2 | |
| HP ZBook X G1i 16 | |
| HP ZBook Studio 16 G11 | |
| WebXPRT 3 / Overall | |
| HP ZBook Fury G1i 18 | |
| Dell Pro Max 18 Plus MB18250 | |
| Durchschnittliche Intel Core Ultra 9 285HX, NVIDIA RTX PRO 5000 Blackwell Generation Laptop (327 - 360, n=3) | |
| Schenker Key 18 Pro M25 RTX 5090 | |
| Lenovo ThinkPad P16 Gen 2 | |
| HP ZBook X G1i 16 | |
| HP ZBook Studio 16 G11 | |
| WebXPRT 4 / Overall | |
| HP ZBook Fury G1i 18 | |
| Schenker Key 18 Pro M25 RTX 5090 | |
| Durchschnittliche Intel Core Ultra 9 285HX, NVIDIA RTX PRO 5000 Blackwell Generation Laptop (306 - 323, n=3) | |
| Dell Pro Max 18 Plus MB18250 | |
| Lenovo ThinkPad P16 Gen 2 | |
| HP ZBook X G1i 16 | |
| HP ZBook Studio 16 G11 | |
| Mozilla Kraken 1.1 / Total | |
| HP ZBook Studio 16 G11 | |
| HP ZBook X G1i 16 | |
| Lenovo ThinkPad P16 Gen 2 | |
| Dell Pro Max 18 Plus MB18250 | |
| Durchschnittliche Intel Core Ultra 9 285HX, NVIDIA RTX PRO 5000 Blackwell Generation Laptop (411 - 439, n=3) | |
| Schenker Key 18 Pro M25 RTX 5090 | |
| HP ZBook Fury G1i 18 | |
| Geekbench AI / Quantized GPU 1.7 | |
| Dell Pro Max 18 Plus MB18250 | |
| Schenker Key 18 Pro M25 RTX 5090 | |
| Durchschnittliche Intel Core Ultra 9 285HX, NVIDIA RTX PRO 5000 Blackwell Generation Laptop (22519 - 24656, n=3) | |
| HP ZBook Fury G1i 18 | |
| HP ZBook X G1i 16 | |
| Geekbench AI / Half Precision GPU 1.7 | |
| Dell Pro Max 18 Plus MB18250 | |
| Durchschnittliche Intel Core Ultra 9 285HX, NVIDIA RTX PRO 5000 Blackwell Generation Laptop (51812 - 55275, n=3) | |
| Schenker Key 18 Pro M25 RTX 5090 | |
| HP ZBook Fury G1i 18 | |
| HP ZBook X G1i 16 | |
| Geekbench AI / Single Precision GPU 1.7 | |
| Dell Pro Max 18 Plus MB18250 | |
| Schenker Key 18 Pro M25 RTX 5090 | |
| Durchschnittliche Intel Core Ultra 9 285HX, NVIDIA RTX PRO 5000 Blackwell Generation Laptop (28665 - 32028, n=3) | |
| HP ZBook Fury G1i 18 | |
| HP ZBook X G1i 16 | |
* ... kleinere Werte sind besser
| AIDA64 / Memory Copy | |
| Dell Pro Max 18 Plus MB18250 | |
| Durchschnittliche Intel Core Ultra 9 285HX (63431 - 93933, n=6) | |
| HP ZBook Studio 16 G11 | |
| HP ZBook Fury G1i 18 | |
| Lenovo ThinkPad P16 Gen 2 | |
| Schenker Key 18 Pro M25 RTX 5090 | |
| AIDA64 / Memory Read | |
| Dell Pro Max 18 Plus MB18250 | |
| Durchschnittliche Intel Core Ultra 9 285HX (67084 - 97565, n=6) | |
| HP ZBook Studio 16 G11 | |
| Lenovo ThinkPad P16 Gen 2 | |
| HP ZBook Fury G1i 18 | |
| Schenker Key 18 Pro M25 RTX 5090 | |
| AIDA64 / Memory Write | |
| Dell Pro Max 18 Plus MB18250 | |
| Durchschnittliche Intel Core Ultra 9 285HX (64112 - 89691, n=6) | |
| HP ZBook Studio 16 G11 | |
| HP ZBook Fury G1i 18 | |
| Lenovo ThinkPad P16 Gen 2 | |
| Schenker Key 18 Pro M25 RTX 5090 | |
| AIDA64 / Memory Latency | |
| Schenker Key 18 Pro M25 RTX 5090 | |
| HP ZBook Fury G1i 18 | |
| Durchschnittliche Intel Core Ultra 9 285HX (104.8 - 151.7, n=6) | |
| HP ZBook Studio 16 G11 | |
| Dell Pro Max 18 Plus MB18250 | |
| Lenovo ThinkPad P16 Gen 2 | |
* ... kleinere Werte sind besser
DPC-Latenzzeit
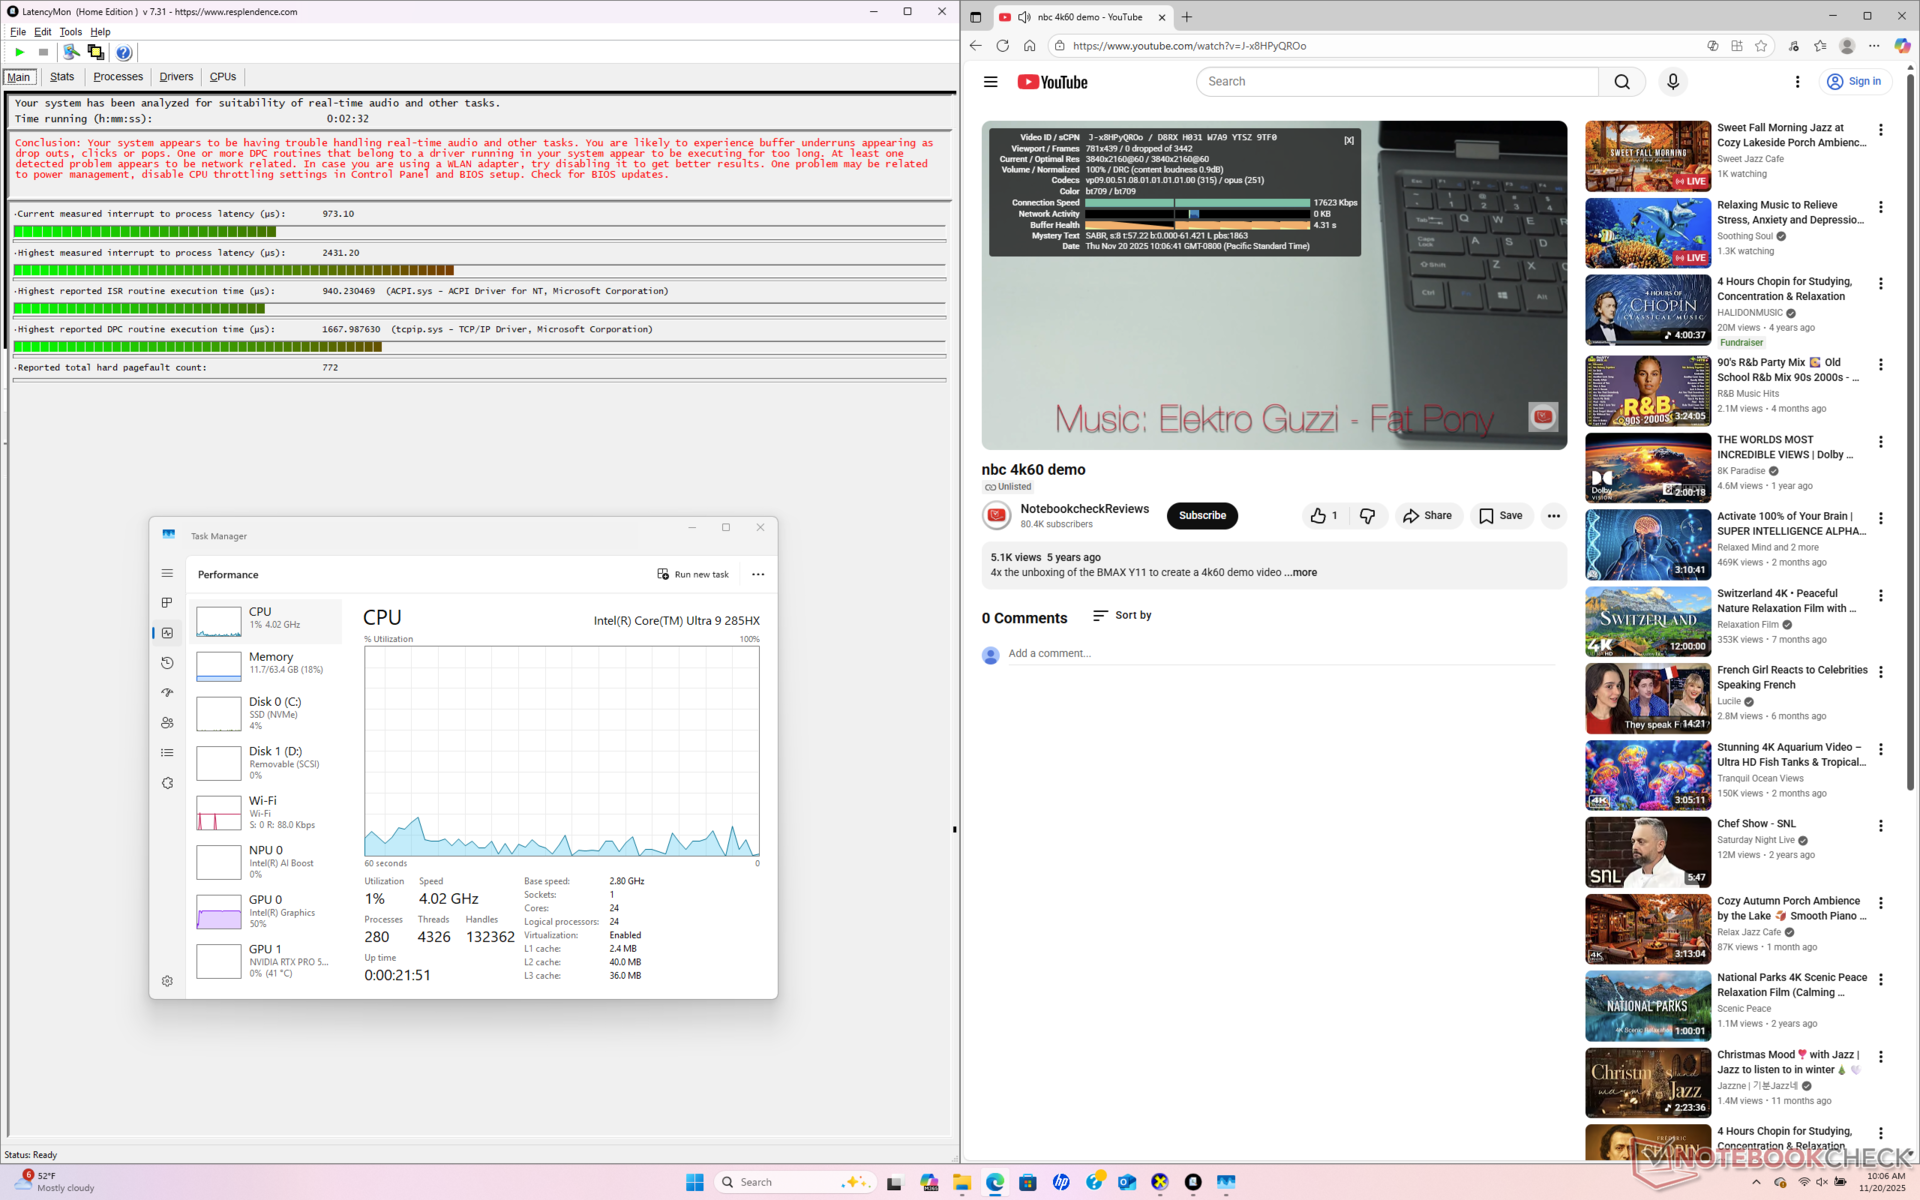
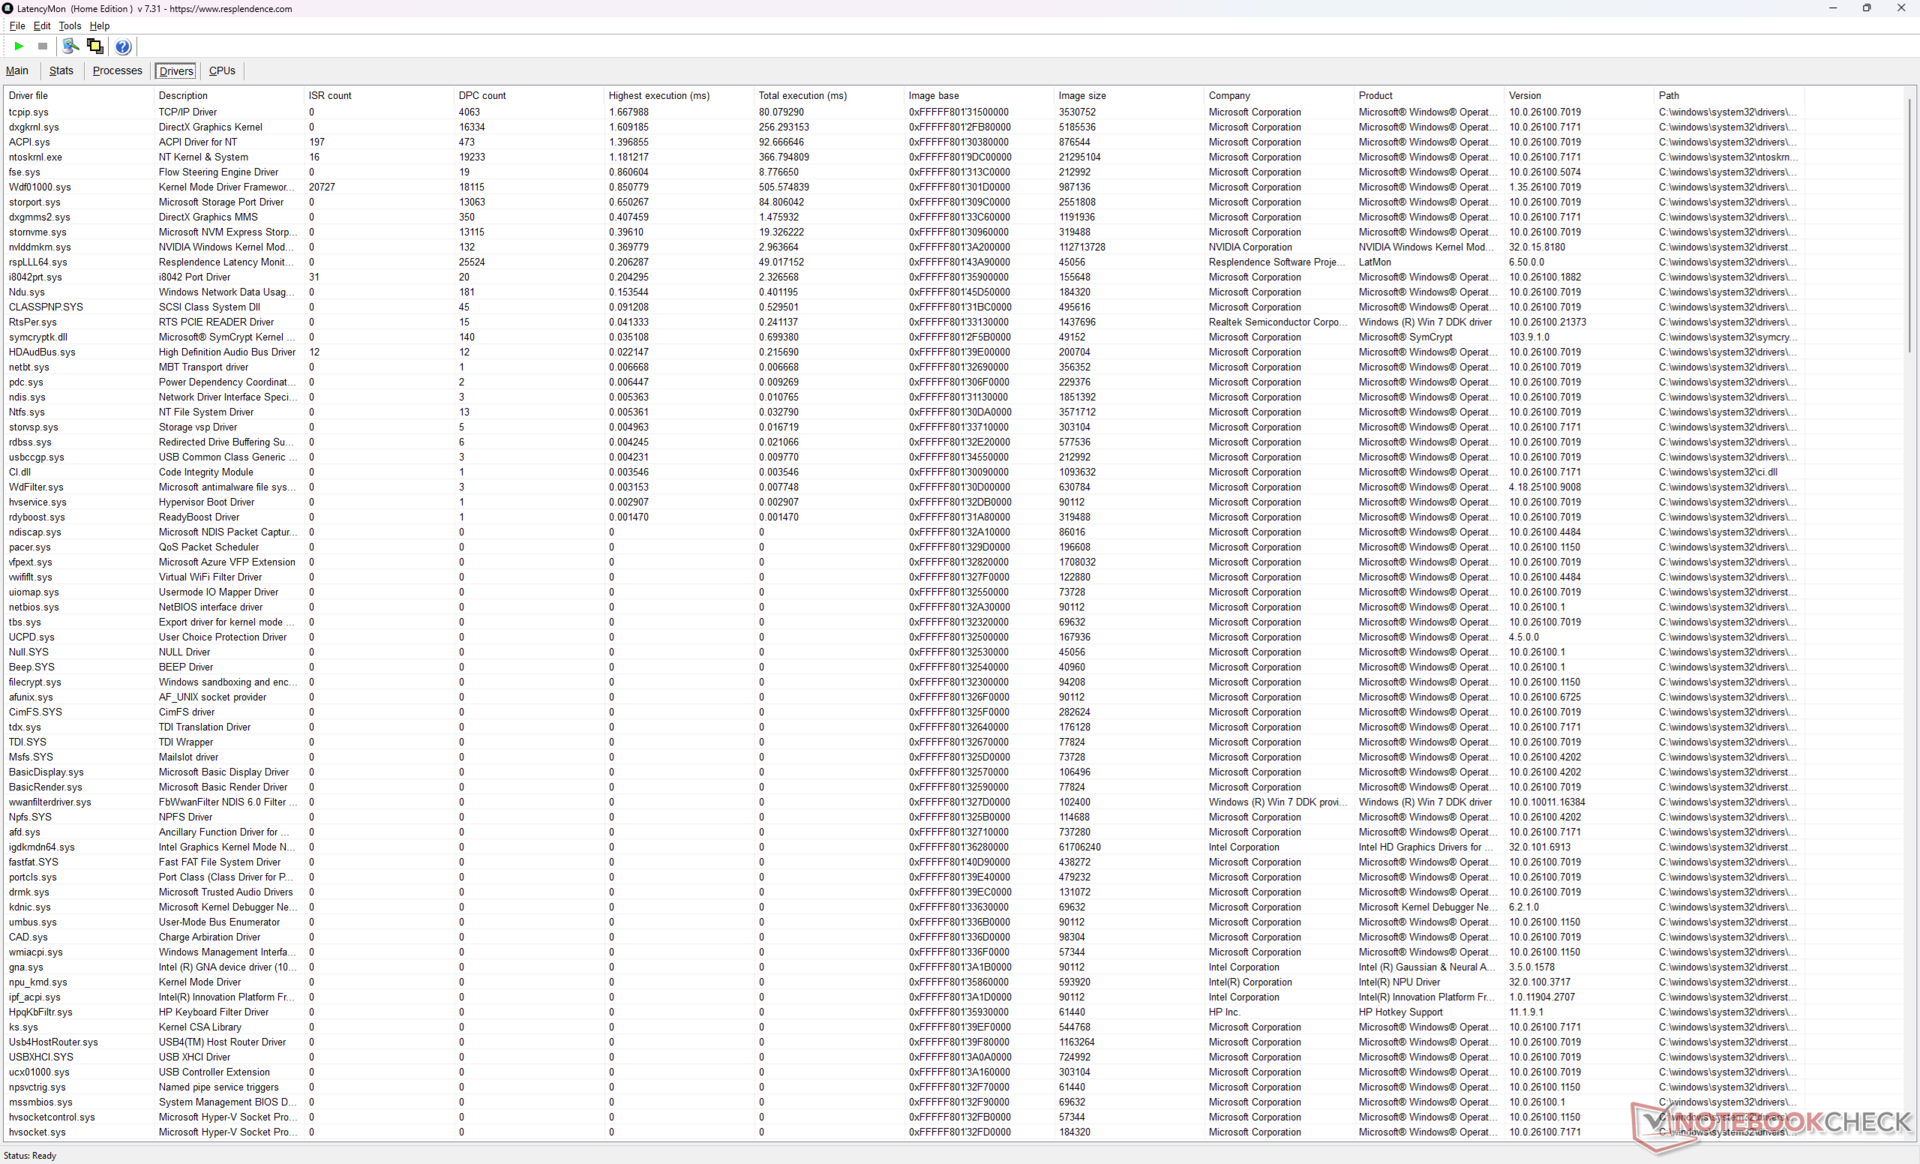
| DPC Latencies / LatencyMon - interrupt to process latency (max), Web, Youtube, Prime95 | |
| Schenker Key 18 Pro M25 RTX 5090 | |
| HP ZBook Fury G1i 18 | |
| HP ZBook Studio 16 G11 | |
| Dell Pro Max 18 Plus MB18250 | |
| Lenovo ThinkPad P16 Gen 2 | |
| HP ZBook X G1i 16 | |
* ... kleinere Werte sind besser
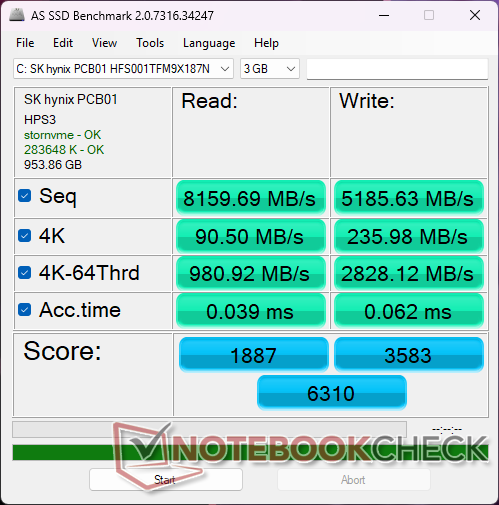
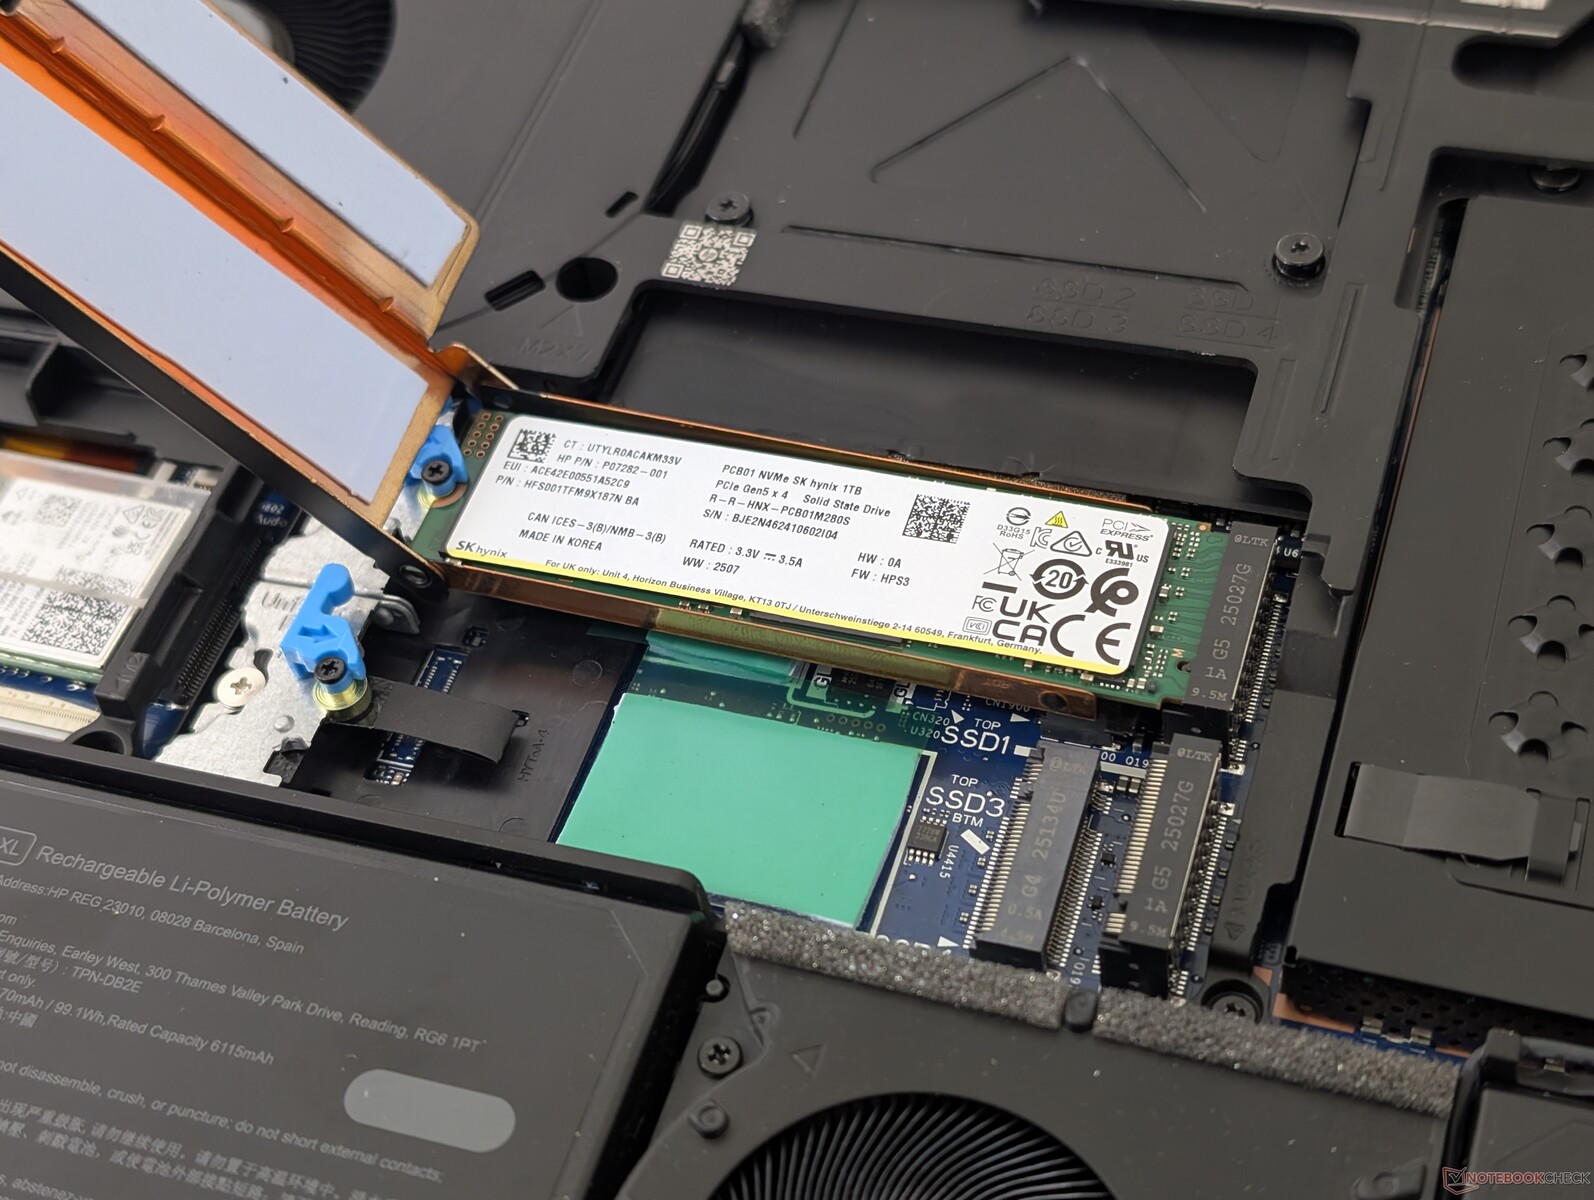
Speichergeräte
Unser Gerät wird mit der SK Hynix PCB01 PCIe5 x4 NVMe SSD für konstante Übertragungsraten von etwa 12.000 MB/s ausgeliefert. Das HP unterstützt bis zu vier einzelne M.2-2280-SSDs, während das Dell Pro Max 18 Plus nur bis zu zwei unterstützen kann.
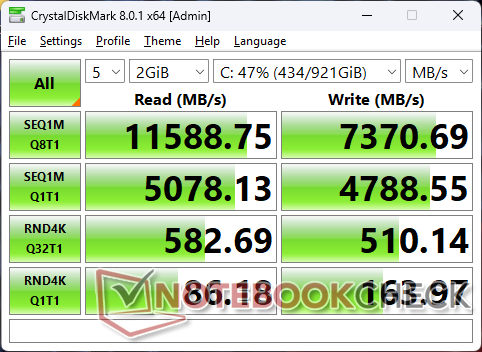

| Drive Performance Rating - Percent | |
| Schenker Key 18 Pro M25 RTX 5090 | |
| HP ZBook Fury G1i 18 | |
| HP ZBook X G1i 16 | |
| Dell Pro Max 18 Plus MB18250 | |
| Lenovo ThinkPad P16 Gen 2 | |
| HP ZBook Studio 16 G11 | |
* ... kleinere Werte sind besser
Disk Throttling: DiskSpd Read Loop, Queue Depth 8
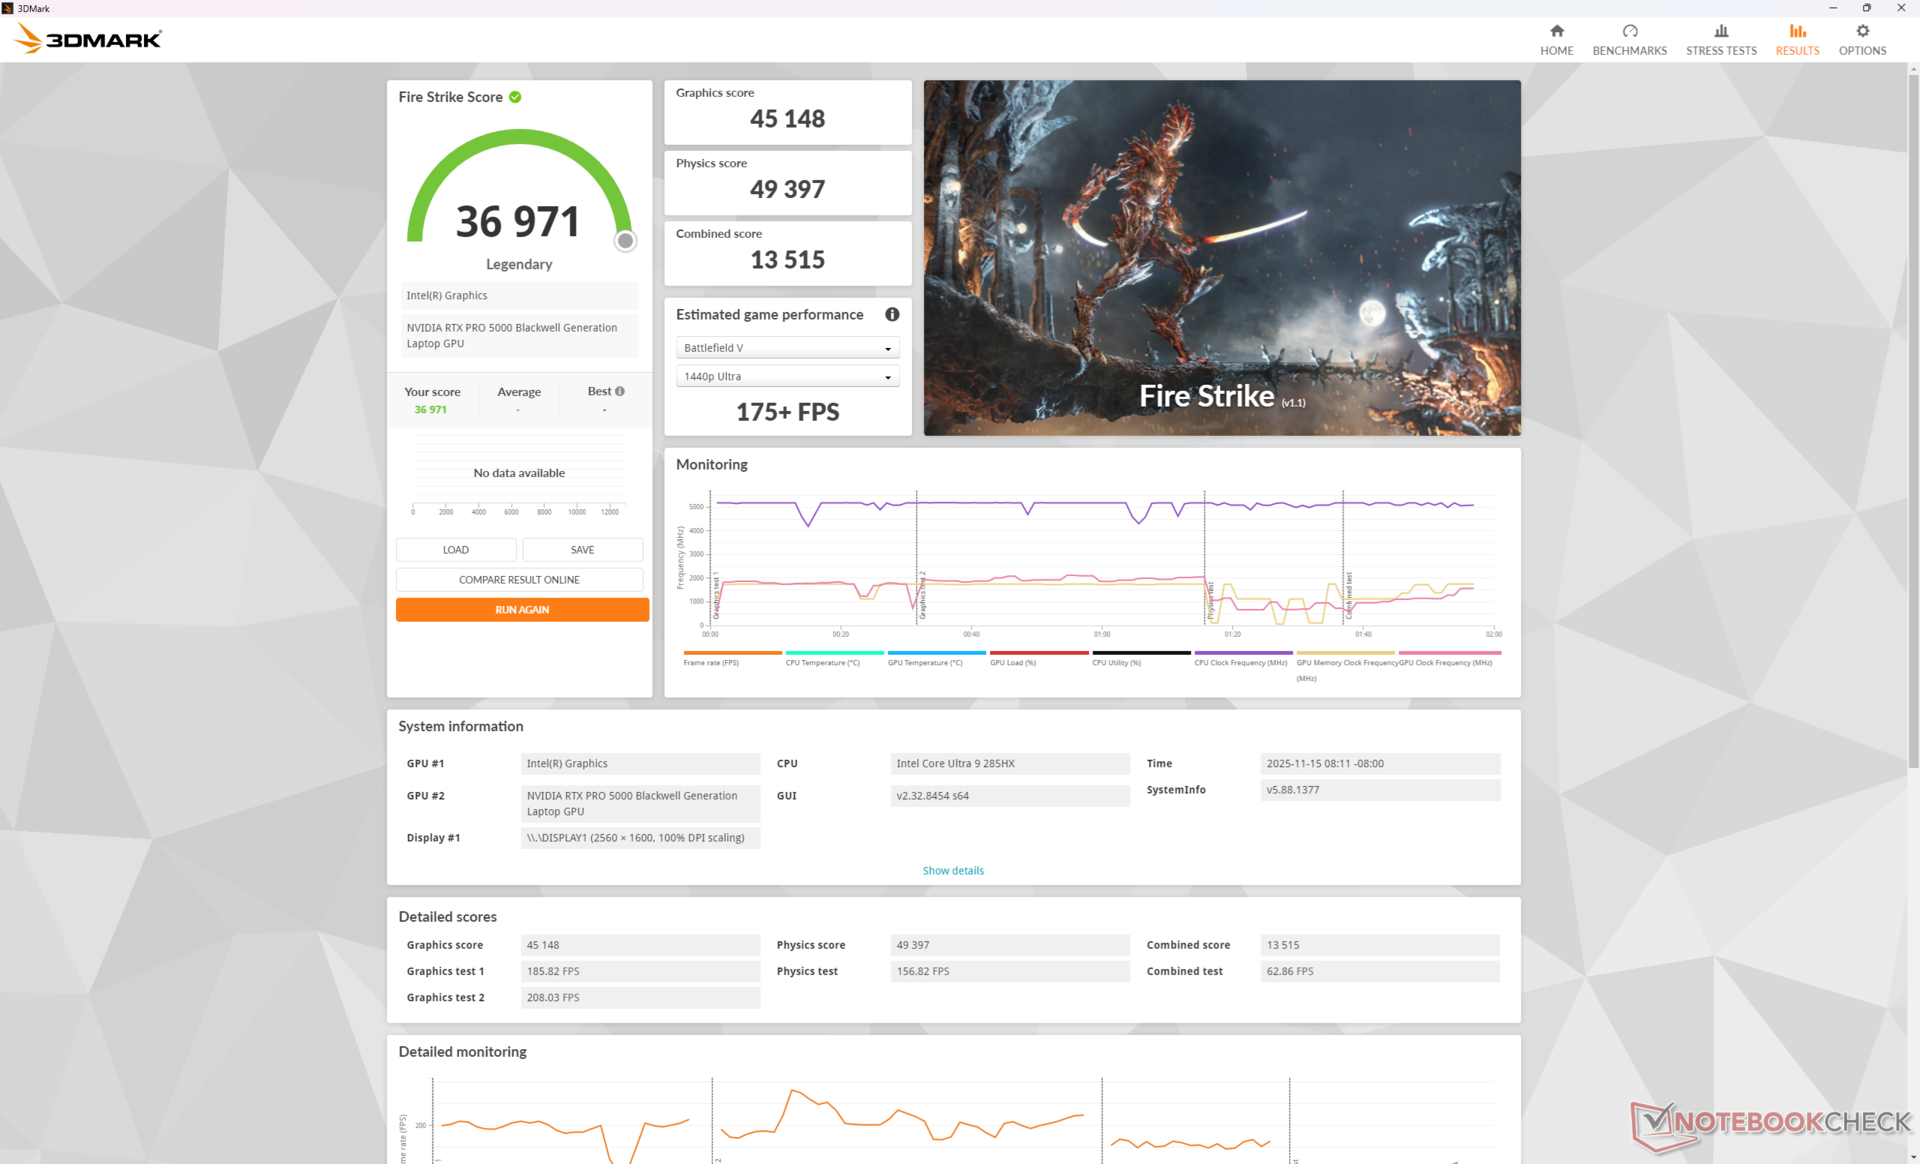
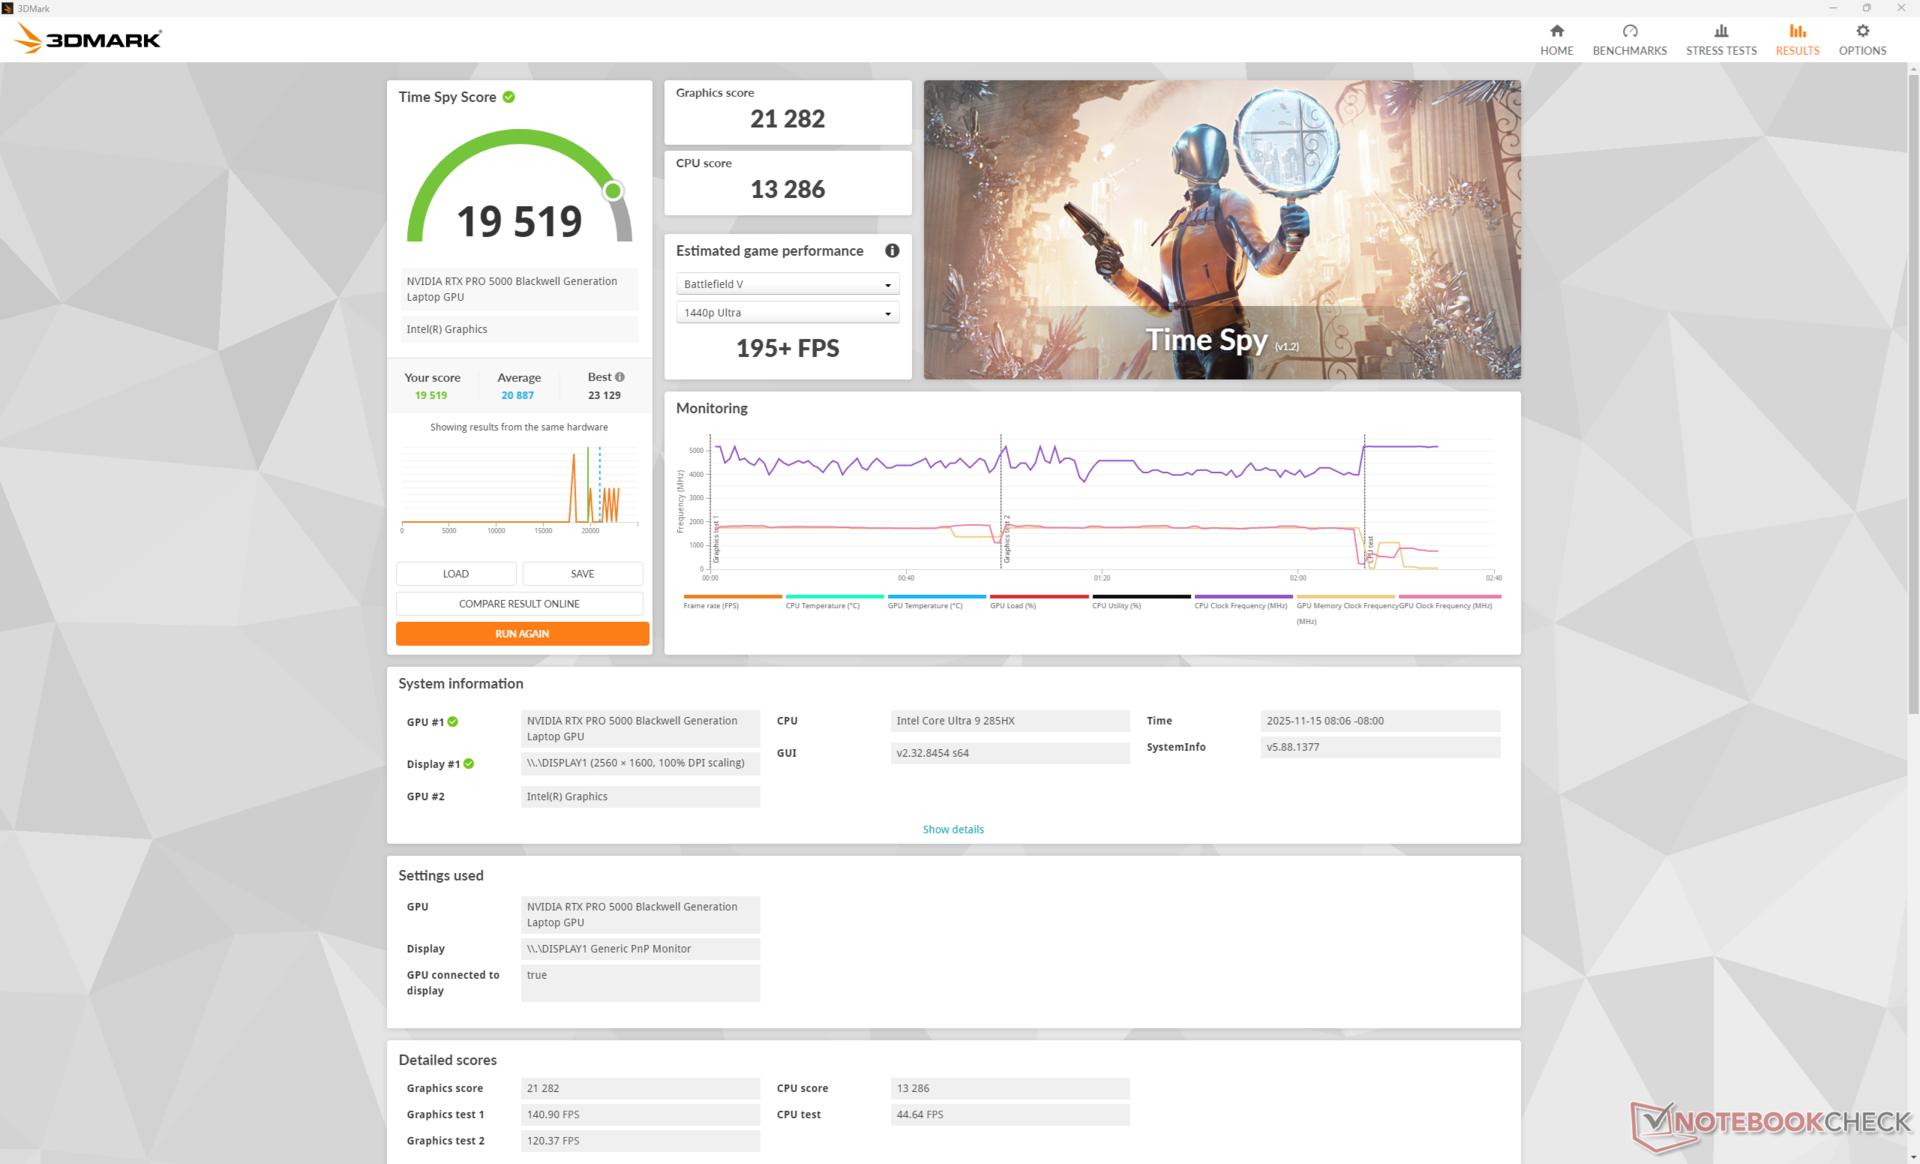
GPU-Leistung
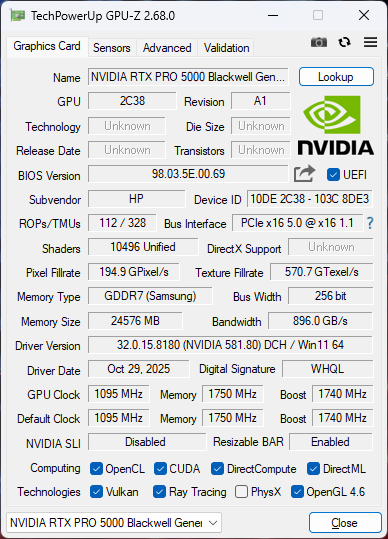
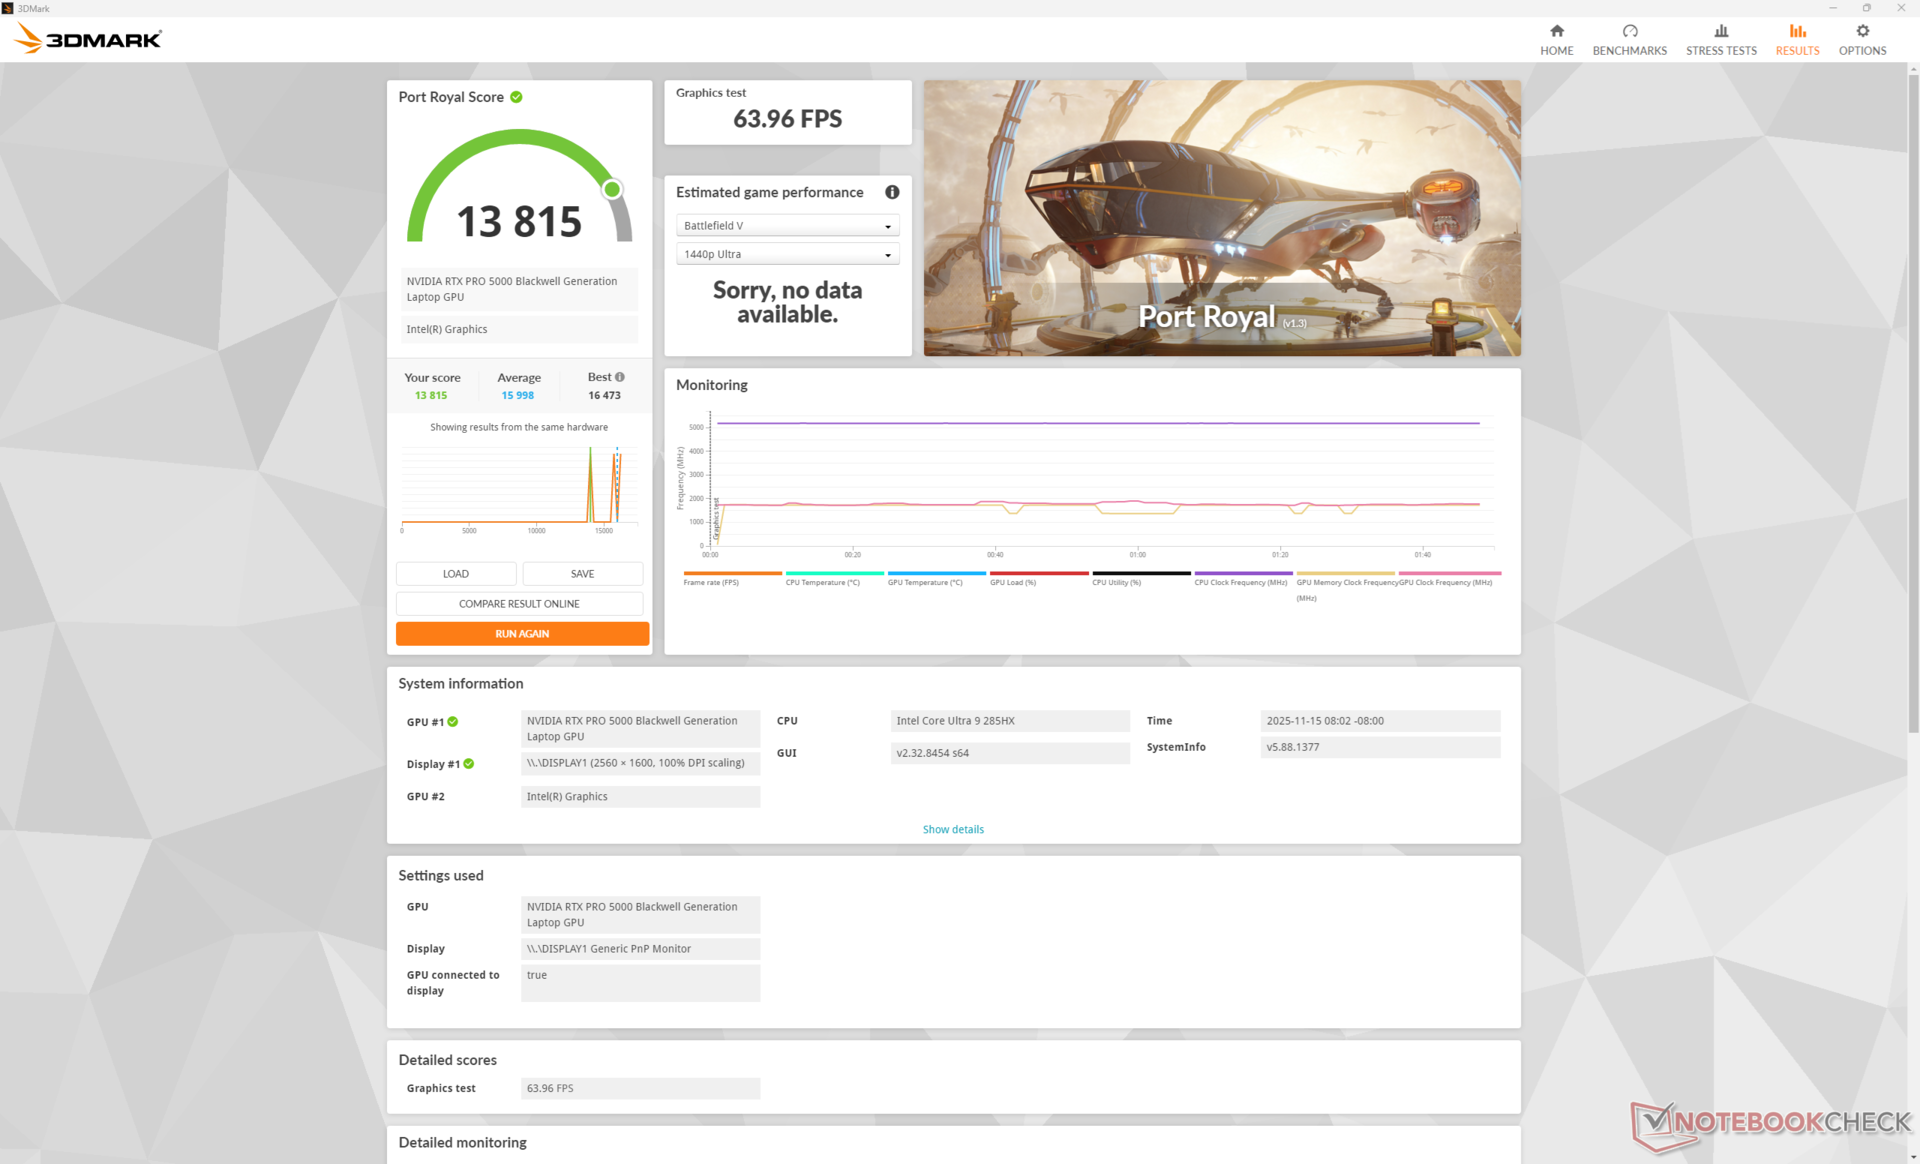
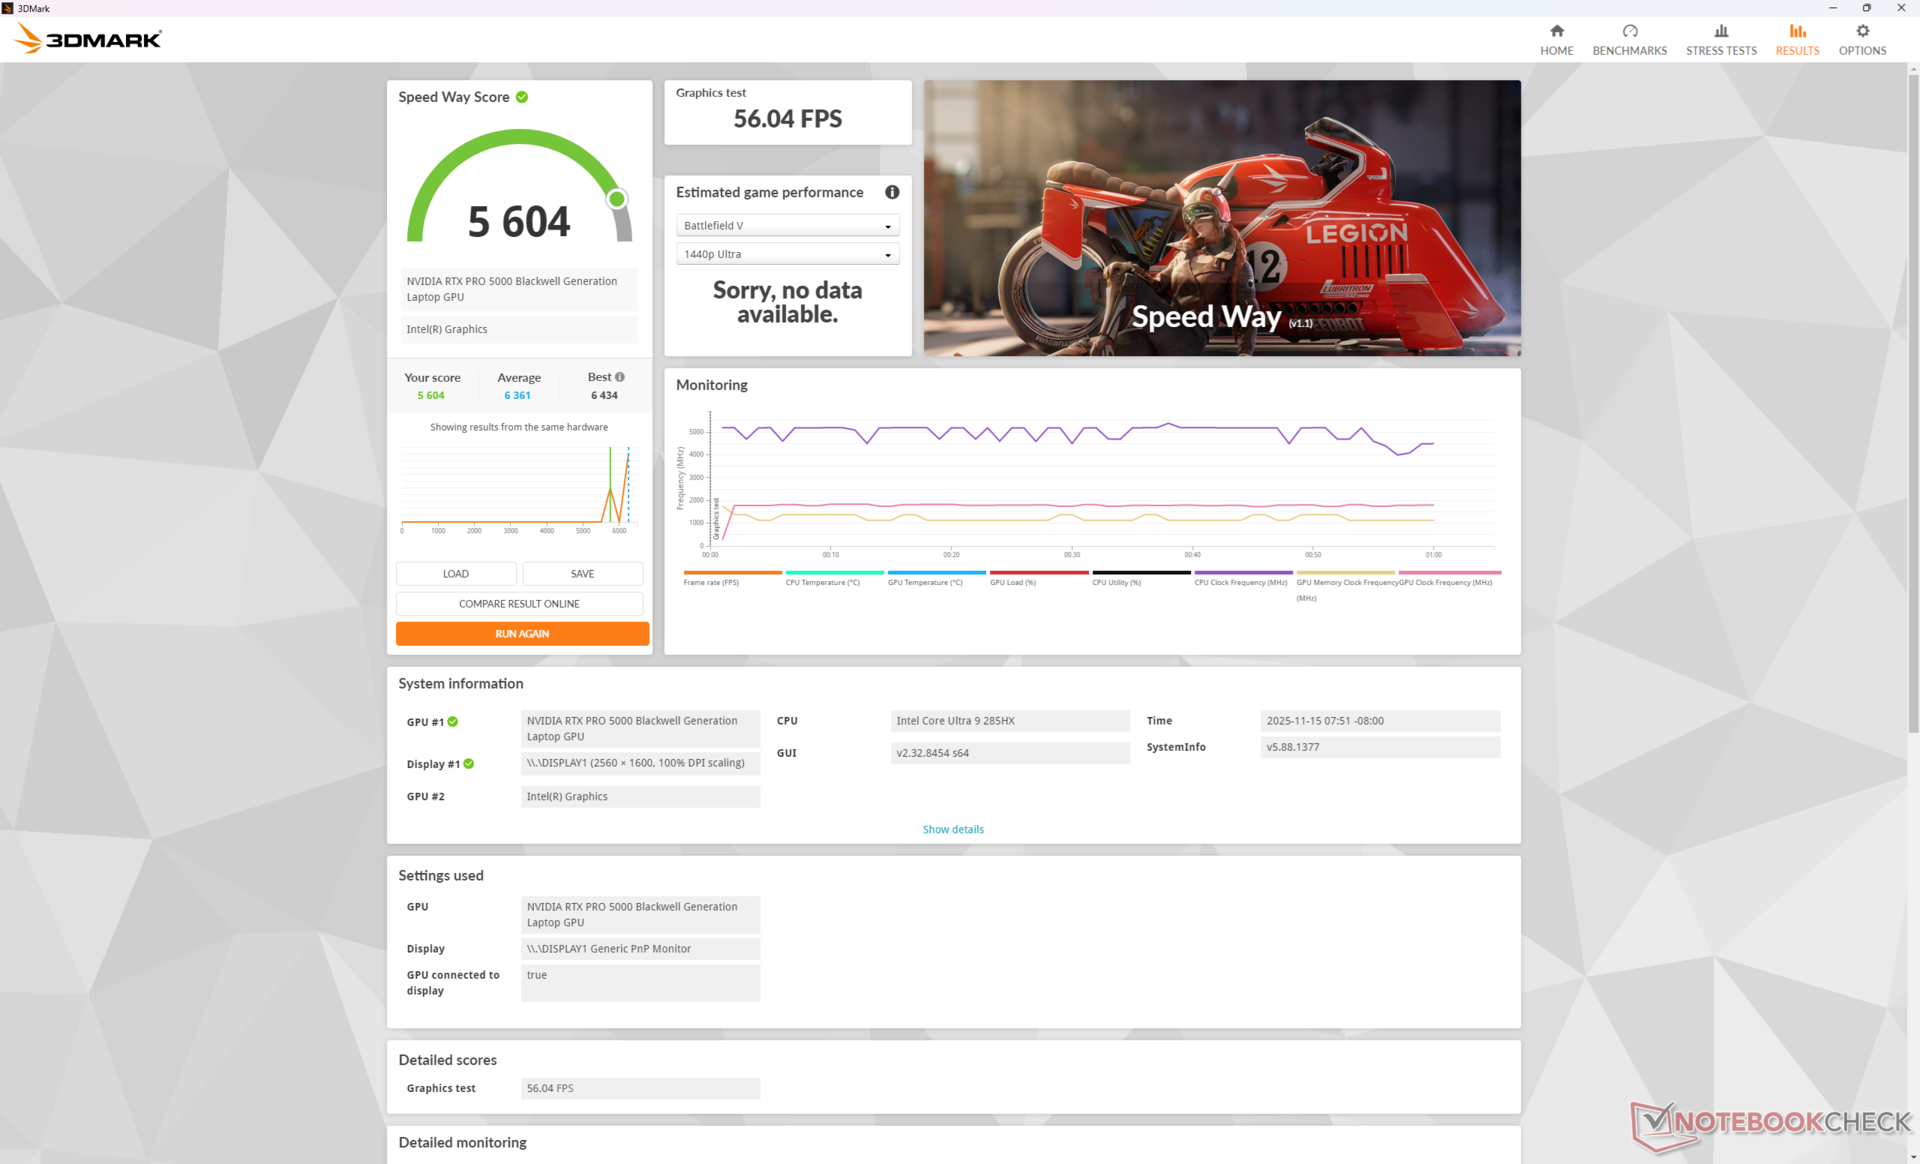
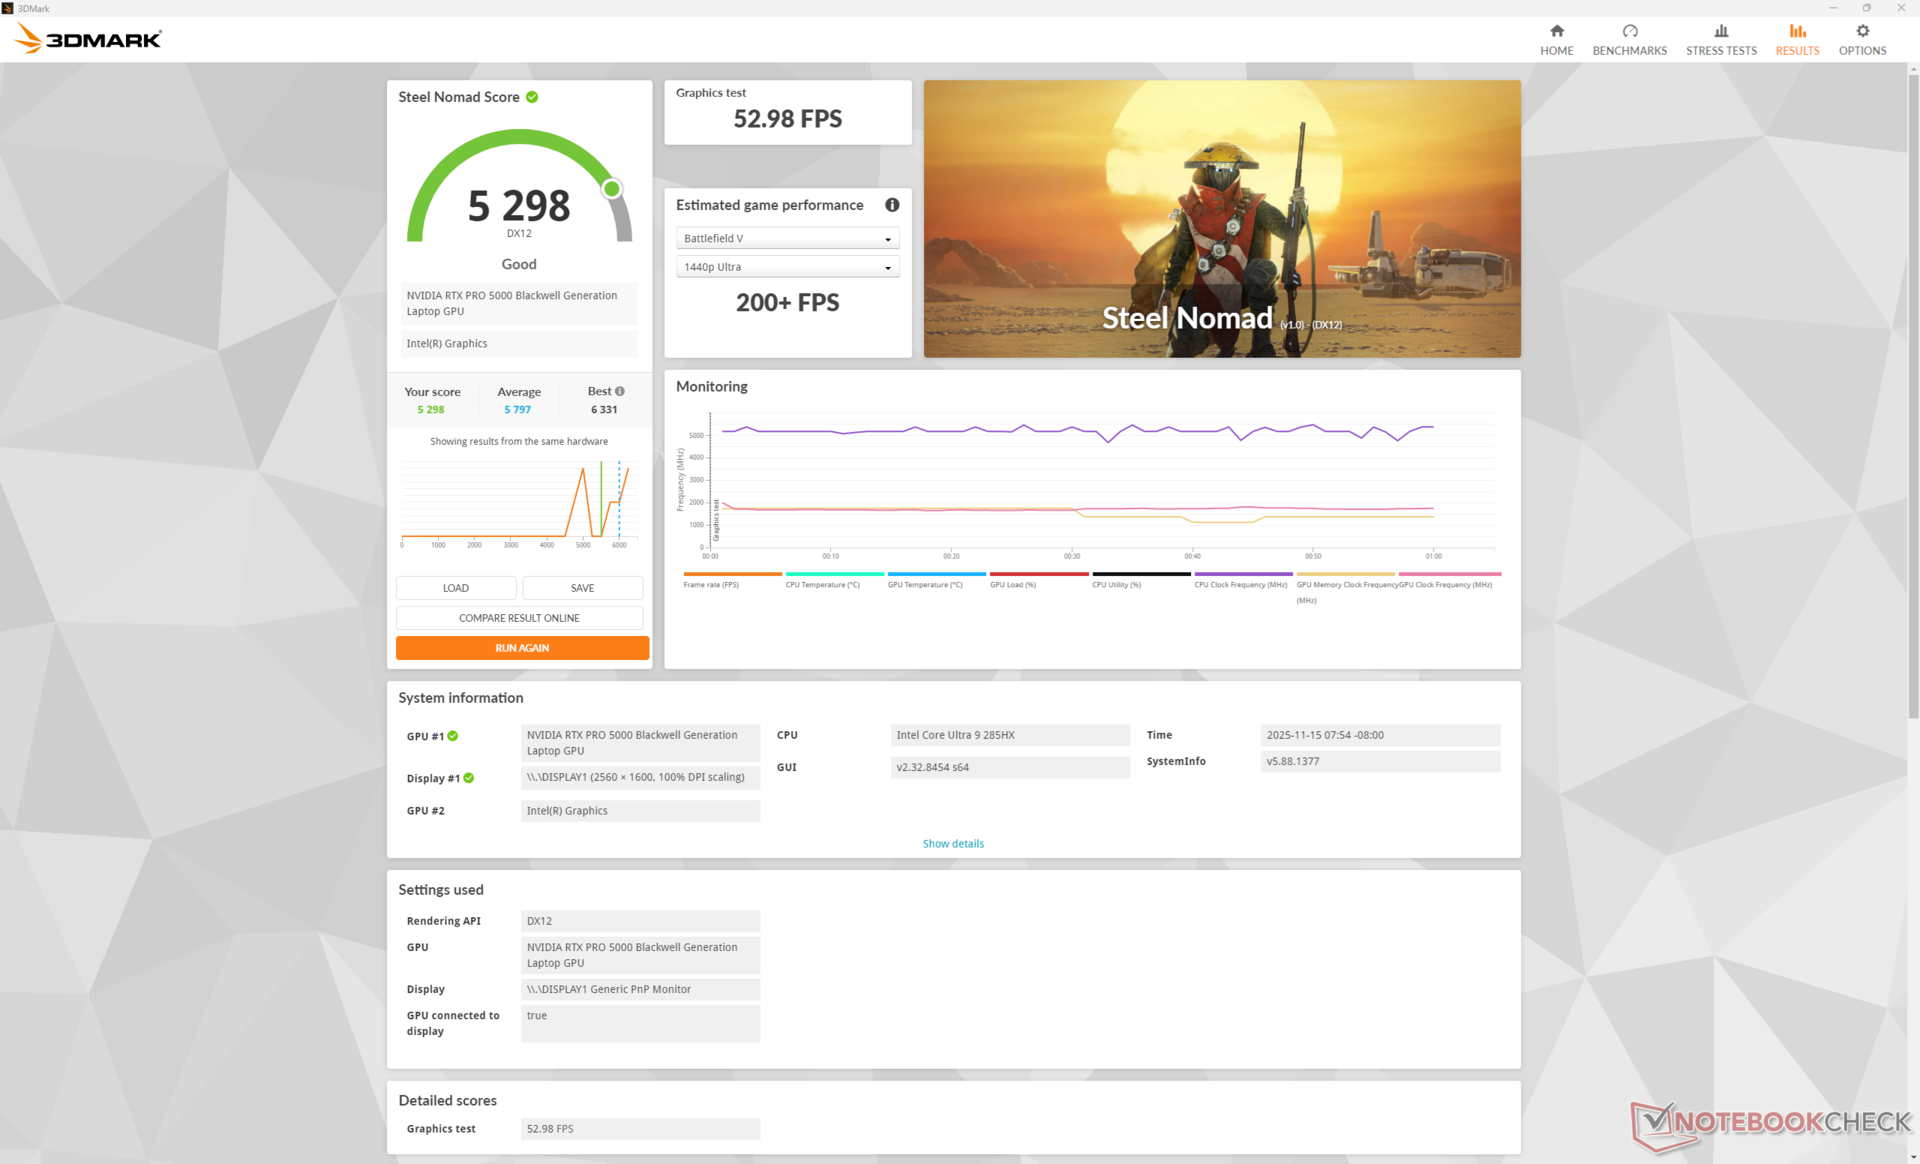
Die Nvidia RTX Pro 5000 Blackwell in unserem HP läuft durchweg langsamer als die gleiche GPU im Dell Pro Max 18 Plus. Das liegt vor allem daran, dass die GPU im HP auf 150 W ausgelegt ist, während die GPU im Dell auf 175 W ausgelegt ist und damit etwas schneller arbeitet. Die Leistungsvorteile gegenüber den Ada Optionen der letzten Generation sind jedoch deutlicher.
| Energie-Profil | Grafics-Punktzahl | Physics-Wertung | kombinierte Punktzahl |
| Performance-Modus | 45.148 | 49.397 | 13.515 |
| Ausgeglichener Modus | 43.709 (-3 %) | 48.299 (-2 %) | 11.177 (-17 %) |
| Akku-Leistung | 28.042 (-38 %) | 21.361 (-57 %) | 7.409 (-45 %) |
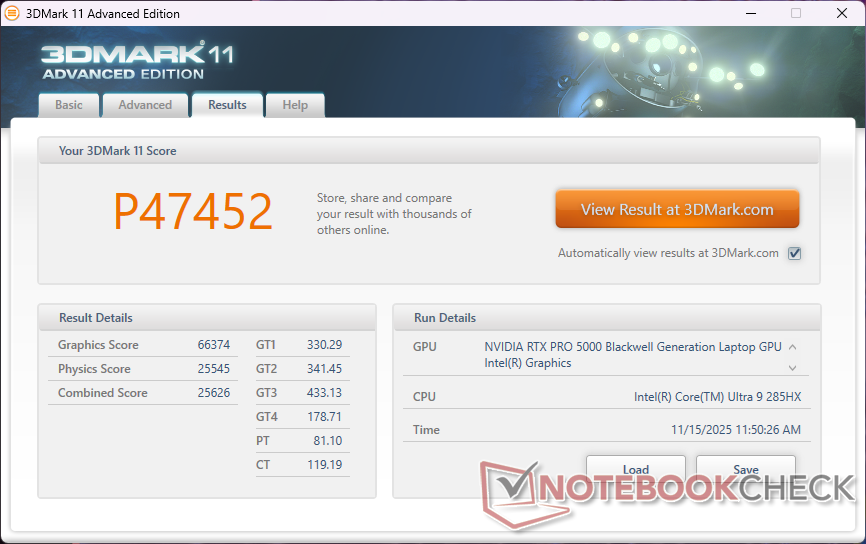
| 3DMark 11 Performance | 47452 Punkte | |
| 3DMark Cloud Gate Standard Score | 51342 Punkte | |
| 3DMark Fire Strike Score | 36971 Punkte | |
| 3DMark Time Spy Score | 19519 Punkte | |
| 3DMark Steel Nomad Score | 5298 Punkte | |
Hilfe | ||
* ... kleinere Werte sind besser
| Performance Rating - Percent | |
| Dell Pro Max 18 Plus MB18250 | |
| Schenker Key 18 Pro M25 RTX 5090 | |
| HP ZBook Fury G1i 18 | |
| Lenovo ThinkPad P16 Gen 2 | |
| HP ZBook X G1i 16 | |
| HP ZBook Studio 16 G11 | |
| Cyberpunk 2077 - 1920x1080 Ultra Preset (FSR off) | |
| Dell Pro Max 18 Plus MB18250 | |
| Schenker Key 18 Pro M25 RTX 5090 | |
| HP ZBook Fury G1i 18 | |
| Lenovo ThinkPad P16 Gen 2 | |
| HP ZBook X G1i 16 | |
| HP ZBook Studio 16 G11 | |
| Baldur's Gate 3 - 1920x1080 Ultra Preset AA:T | |
| Dell Pro Max 18 Plus MB18250 | |
| Schenker Key 18 Pro M25 RTX 5090 | |
| HP ZBook Fury G1i 18 | |
| Lenovo ThinkPad P16 Gen 2 | |
| HP ZBook Studio 16 G11 | |
| HP ZBook X G1i 16 | |
| GTA V - 1920x1080 Highest AA:4xMSAA + FX AF:16x | |
| Dell Pro Max 18 Plus MB18250 | |
| Schenker Key 18 Pro M25 RTX 5090 | |
| HP ZBook Fury G1i 18 | |
| Lenovo ThinkPad P16 Gen 2 | |
| HP ZBook X G1i 16 | |
| HP ZBook Studio 16 G11 | |
| Final Fantasy XV Benchmark - 1920x1080 High Quality | |
| Dell Pro Max 18 Plus MB18250 | |
| HP ZBook Fury G1i 18 | |
| Schenker Key 18 Pro M25 RTX 5090 | |
| Lenovo ThinkPad P16 Gen 2 | |
| HP ZBook X G1i 16 | |
| HP ZBook Studio 16 G11 | |
| Strange Brigade - 1920x1080 ultra AA:ultra AF:16 | |
| Dell Pro Max 18 Plus MB18250 | |
| HP ZBook Fury G1i 18 | |
| Schenker Key 18 Pro M25 RTX 5090 | |
| Lenovo ThinkPad P16 Gen 2 | |
| HP ZBook Studio 16 G11 | |
| HP ZBook X G1i 16 | |
| Dota 2 Reborn - 1920x1080 ultra (3/3) best looking | |
| Lenovo ThinkPad P16 Gen 2 | |
| Dell Pro Max 18 Plus MB18250 | |
| HP ZBook Fury G1i 18 | |
| Schenker Key 18 Pro M25 RTX 5090 | |
| HP ZBook Studio 16 G11 | |
| HP ZBook X G1i 16 | |
| X-Plane 11.11 - 1920x1080 high (fps_test=3) | |
| Lenovo ThinkPad P16 Gen 2 | |
| Dell Pro Max 18 Plus MB18250 | |
| Schenker Key 18 Pro M25 RTX 5090 | |
| HP ZBook Fury G1i 18 | |
| HP ZBook Studio 16 G11 | |
| HP ZBook X G1i 16 | |
| F1 24 | |
| 3840x2160 Ultra High Preset AA:T AF:16x | |
| Dell Pro Max 18 Plus MB18250 | |
| Durchschnittliche NVIDIA RTX PRO 5000 Blackwell Generation Laptop (43.2 - 50.2, n=3) | |
| HP ZBook Fury G1i 18 | |
| Schenker Key 18 Pro M25 RTX 5090 | |
| 3840x2160 Ultra High Preset + Quality DLSS AF:16x | |
| Dell Pro Max 18 Plus MB18250 | |
| Durchschnittliche NVIDIA RTX PRO 5000 Blackwell Generation Laptop (71.8 - 85.7, n=3) | |
| HP ZBook Fury G1i 18 | |
| Schenker Key 18 Pro M25 RTX 5090 | |
| 2560x1440 Ultra High Preset + Quality DLSS AF:16x | |
| Dell Pro Max 18 Plus MB18250 | |
| Durchschnittliche NVIDIA RTX PRO 5000 Blackwell Generation Laptop (126.8 - 148.6, n=3) | |
| HP ZBook Fury G1i 18 | |
| Schenker Key 18 Pro M25 RTX 5090 | |
| HP ZBook X G1i 16 | |
| GTA V | |
| 3840x2160 High/On (Advanced Graphics Off) AA:FX AF:8x | |
| Durchschnittliche NVIDIA RTX PRO 5000 Blackwell Generation Laptop (165.3 - 170.3, n=2) | |
| HP ZBook Fury G1i 18 | |
| Lenovo Legion Pro 5 16IAX10, RTX 5070 | |
| 3840x2160 Highest AA:4xMSAA + FX AF:16x | |
| Schenker Key 18 Pro M25 RTX 5090 | |
| Durchschnittliche NVIDIA RTX PRO 5000 Blackwell Generation Laptop (101.6 - 105.5, n=2) | |
| HP ZBook Fury G1i 18 | |
| Lenovo Legion Pro 5 16IAX10, RTX 5070 | |
| Lenovo Legion Pro 5 16IAX10, RTX 5070 | |
Cyberpunk 2077 ultra fps-Grafik
| min. | mittel | hoch | max. | QHD DLSS | QHD | 4K DLSS | 4K | |
|---|---|---|---|---|---|---|---|---|
| GTA V (2015) | 186.5 | 181.3 | 175.3 | 133.6 | 130.5 | 165.3 | ||
| Dota 2 Reborn (2015) | 215 | 187.2 | 175 | 162 | 143.9 | |||
| Final Fantasy XV Benchmark (2018) | 232 | 222 | 183.8 | 145.7 | 88.4 | |||
| X-Plane 11.11 (2018) | 137.3 | 114.9 | 92 | 74.2 | ||||
| Strange Brigade (2018) | 619 | 493 | 440 | 396 | 303 | 165.7 | ||
| Baldur's Gate 3 (2023) | 245 | 208 | 182 | 177 | 179.4 | 129.5 | 114.3 | 74.1 |
| Cyberpunk 2077 (2023) | 171.8 | 173.3 | 157.7 | 143.7 | 109 | 98 | 46.1 | |
| F1 24 (2024) | 281 | 297 | 272 | 125.7 | 126.8 | 84.4 | 71.8 | 43.2 |
Emissionen
Systemgeräusch
Die internen Lüfter sind im Leerlauf oder bei anspruchslosen Aufgaben wie Browsern oder Excel nicht zu hören. Bei höherer Belastung werden sie jedoch recht schnell lauter. Tatsächlich läuft das System nicht leiser als das Dell, obwohl beide Modelle mit der gleichen CPU und GPU ausgestattet sind.
Lautstärkediagramm
| Idle |
| 25.7 / 25.7 / 25.7 dB(A) |
| Last |
| 48.3 / 56.5 dB(A) |
 | ||
30 dB leise 40 dB(A) deutlich hörbar 50 dB(A) störend |
||
min: | ||
| HP ZBook Fury G1i 18 Ultra 9 285HX, RTX PRO 5000 Blackwell Generation Laptop | Dell Pro Max 18 Plus MB18250 Ultra 9 285HX, RTX PRO 5000 Blackwell Generation Laptop | Schenker Key 18 Pro M25 RTX 5090 Ultra 9 275HX, GeForce RTX 5090 Laptop | Lenovo ThinkPad P16 Gen 2 i7-14700HX, RTX 4000 Ada Generation Laptop | HP ZBook X G1i 16 Ultra 7 265H, RTX PRO 2000 Blackwell Generation Laptop | HP ZBook Studio 16 G11 Ultra 9 185H, RTX 3000 Ada Generation Laptop | |
|---|---|---|---|---|---|---|
| Geräuschentwicklung | 4% | 2% | -1% | 13% | 9% | |
| aus / Umgebung * (dB) | 24.9 | 23.1 7% | 23.9 4% | 23.9 4% | 23.7 5% | 23.8 4% |
| Idle min * (dB) | 25.7 | 27.1 -5% | 25.2 2% | 29.1 -13% | 23.7 8% | 23.8 7% |
| Idle avg * (dB) | 25.7 | 27.1 -5% | 25.2 2% | 29.1 -13% | 23.7 8% | 26.4 -3% |
| Idle max * (dB) | 25.7 | 27.1 -5% | 25.2 2% | 29.1 -13% | 23.7 8% | 26.4 -3% |
| Last avg * (dB) | 48.3 | 38 21% | 47.8 1% | 41 15% | 32.7 32% | 33.7 30% |
| Cyberpunk 2077 ultra * (dB) | 58.2 | 53.8 8% | 54.4 7% | 52.8 9% | 50.9 13% | 46.1 21% |
| Last max * (dB) | 56.5 | 53.8 5% | 58.6 -4% | 52.9 6% | 48 15% | 53.2 6% |
* ... kleinere Werte sind besser
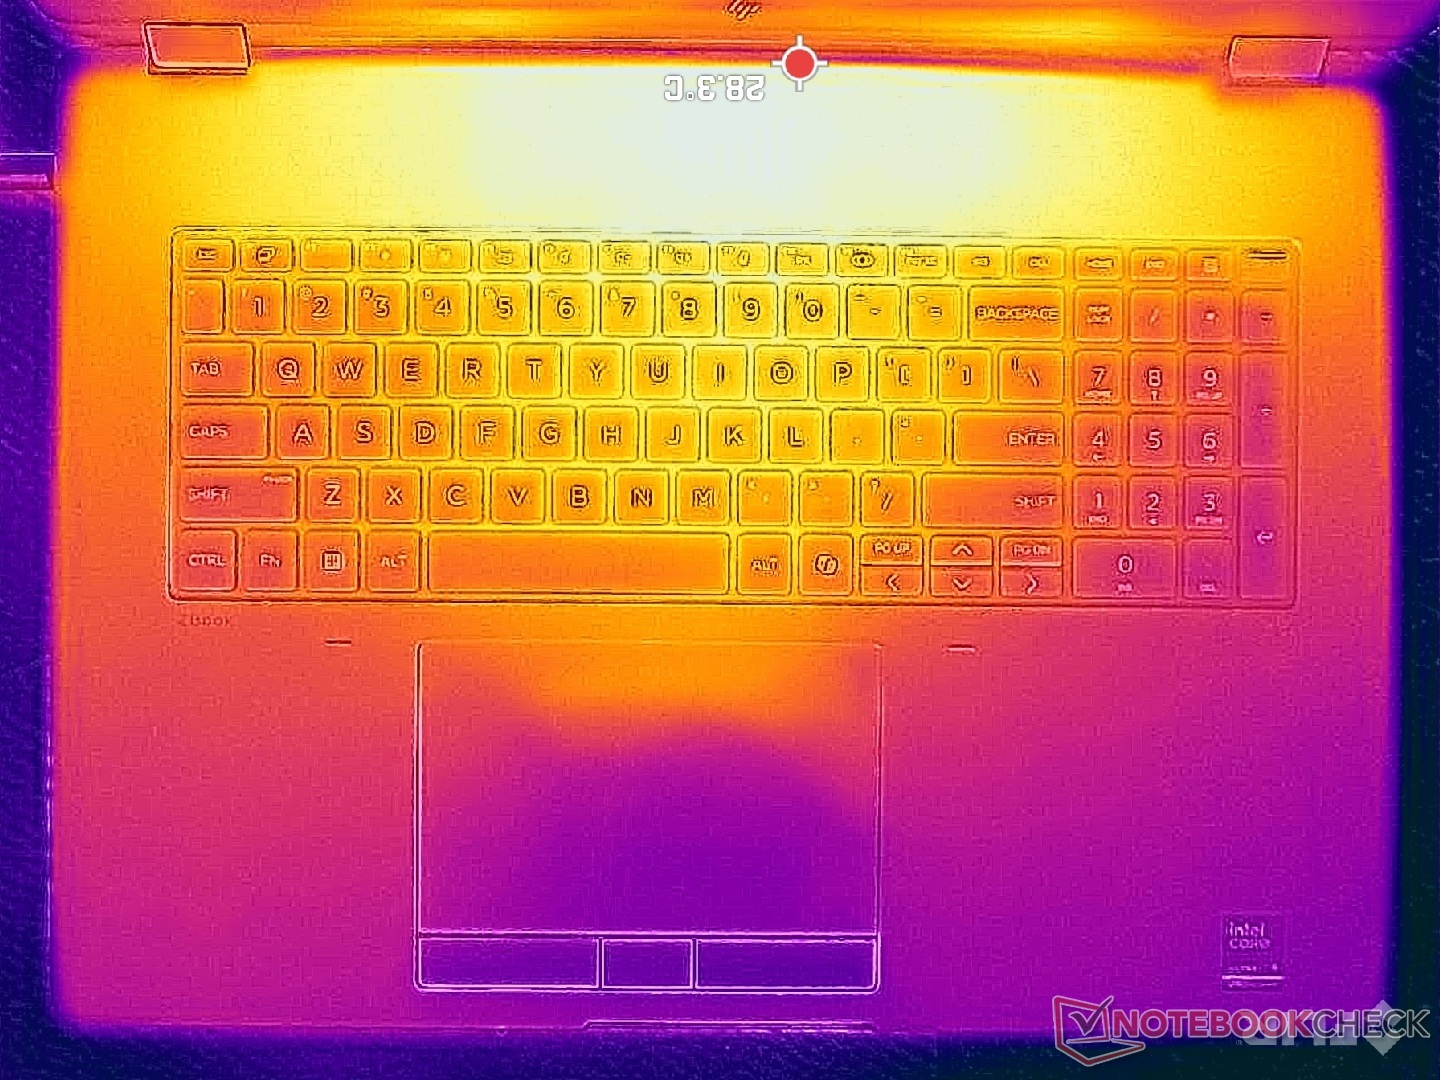
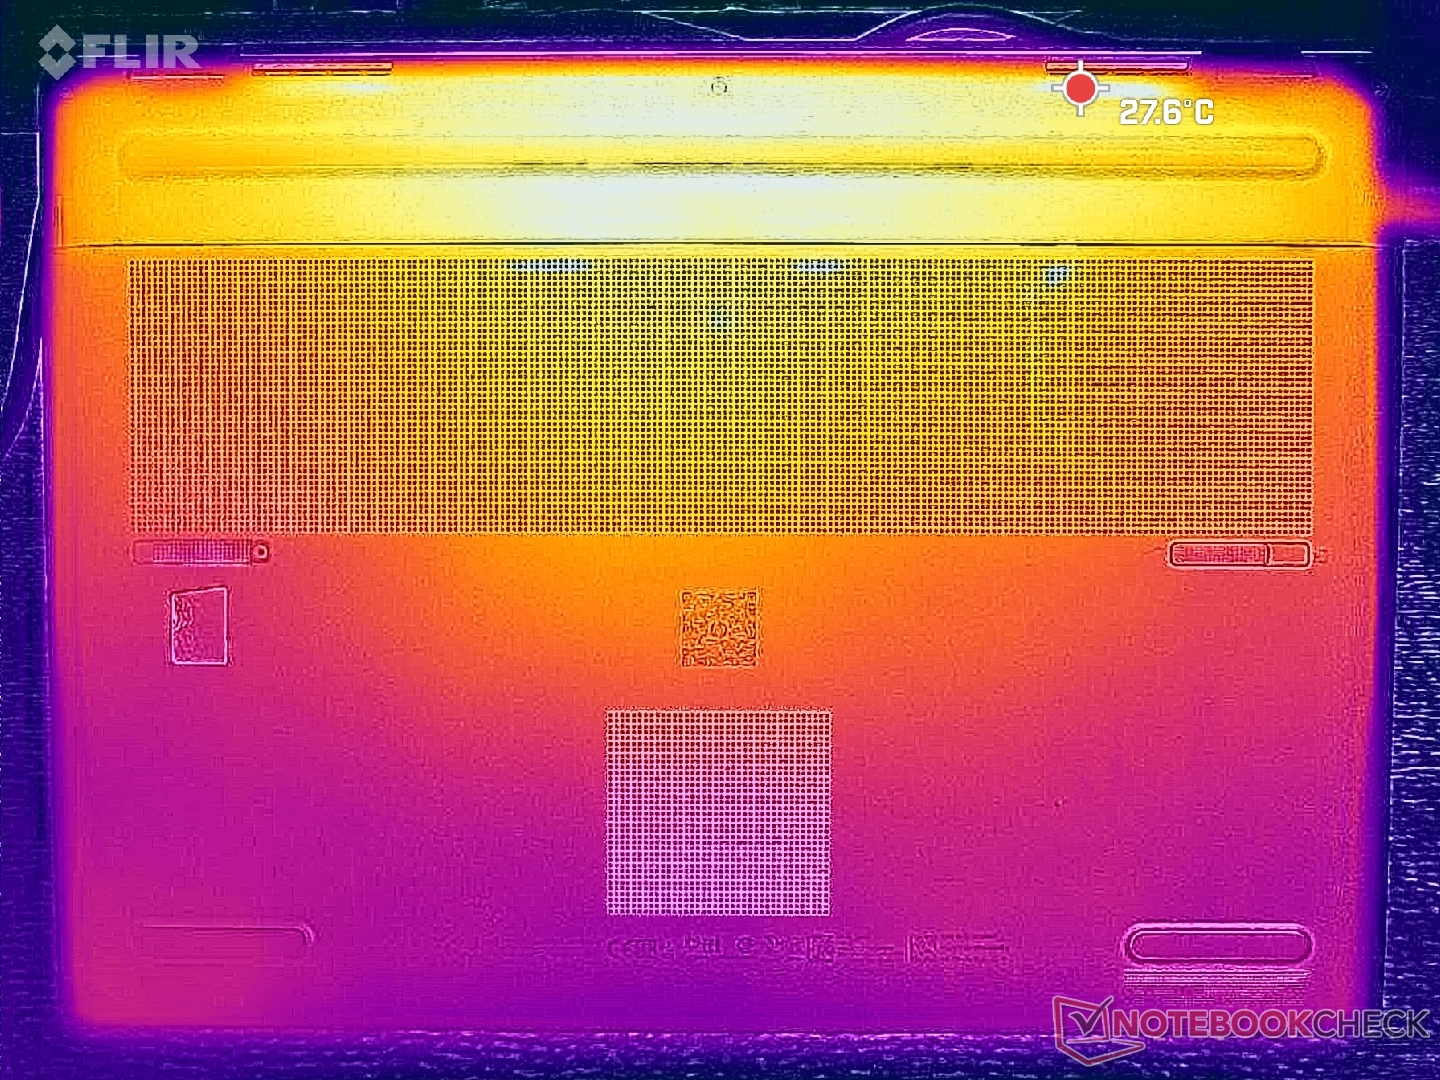
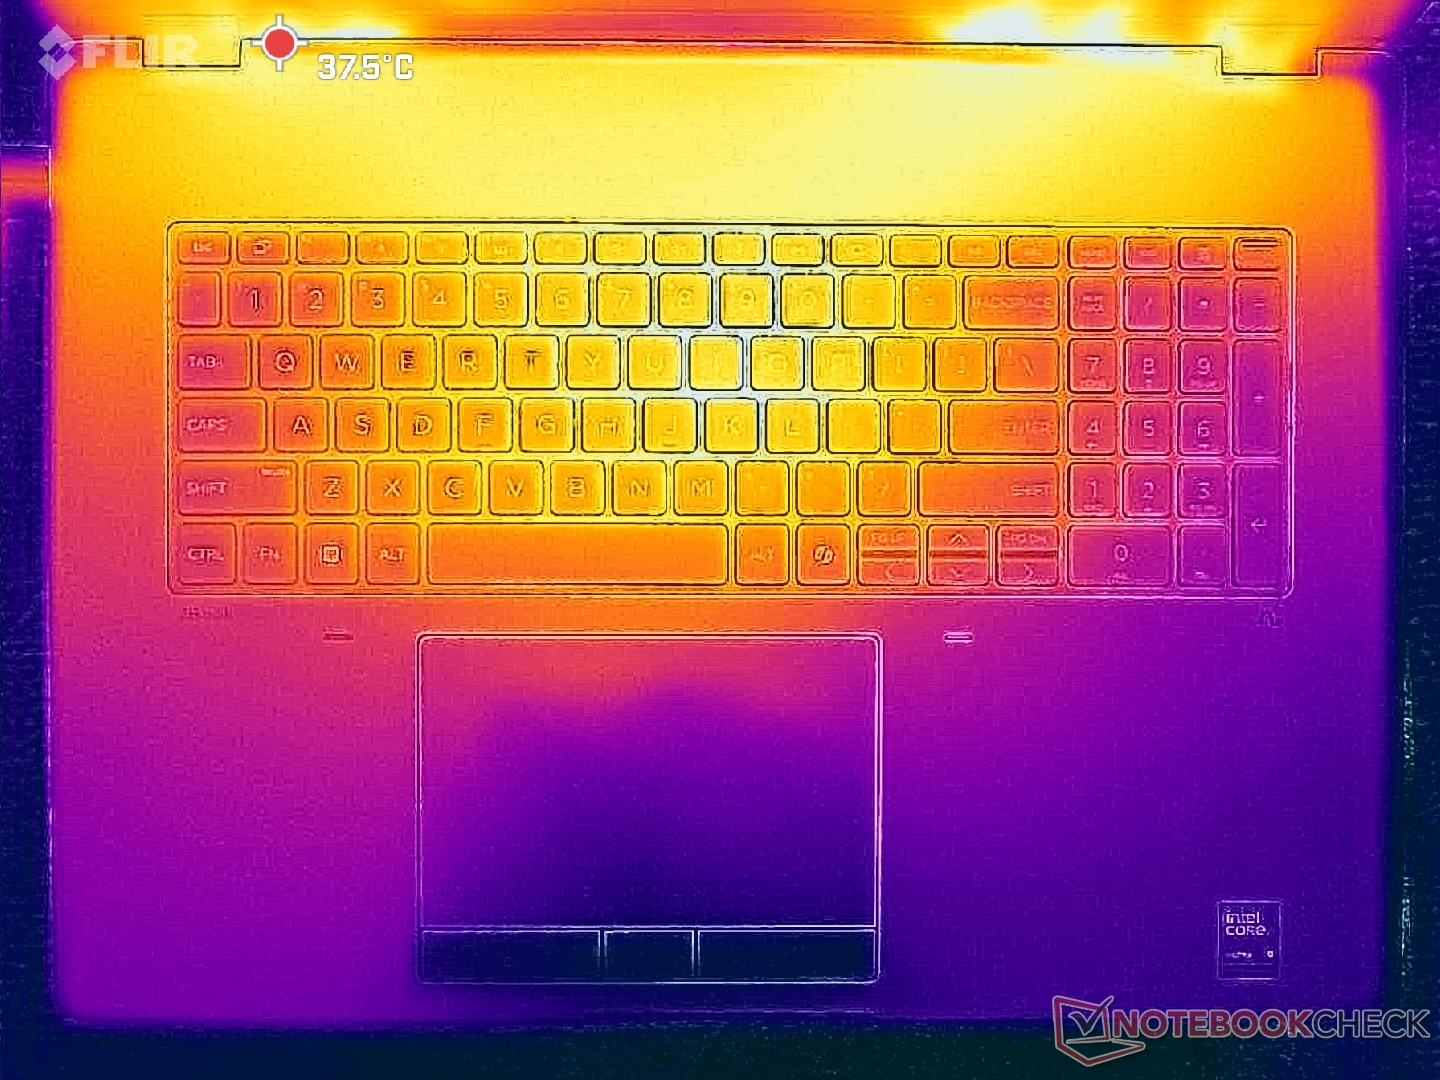
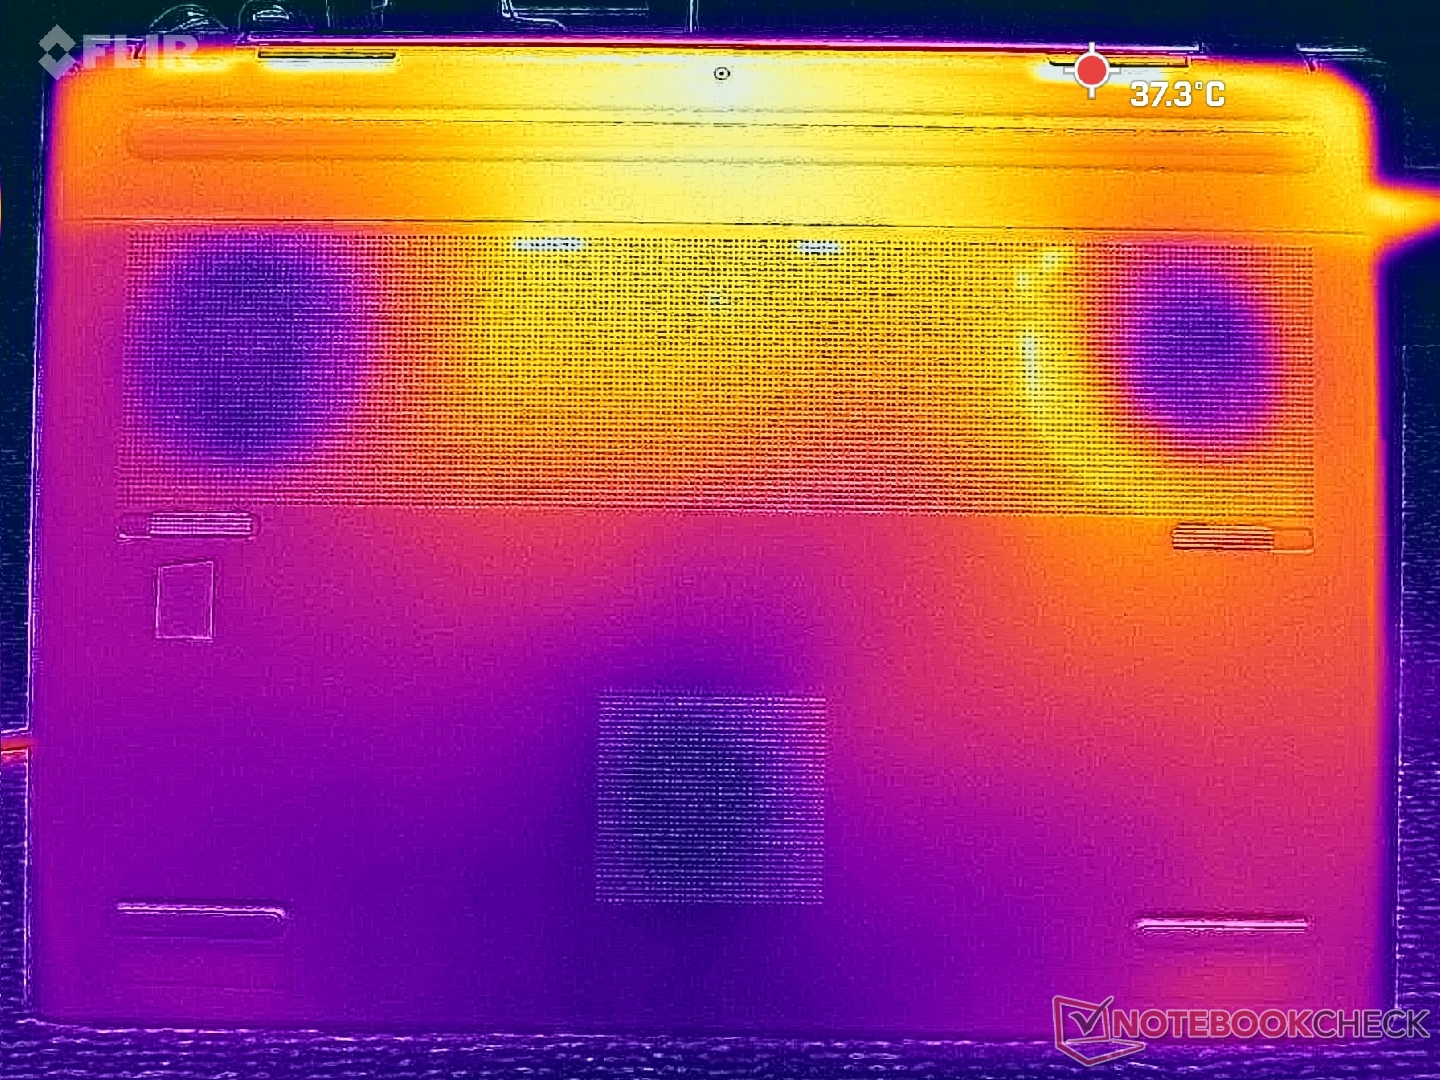
Temperatur
Die Oberflächentemperaturen bleiben auch bei anspruchsvoller Last relativ kühl. Heiße Stellen auf dem Tastaturdeck und der unteren Abdeckung erreichen bis zu 40 bzw. 36 °C, verglichen mit fast 50 °C beim Schenker Key 18 Pro.
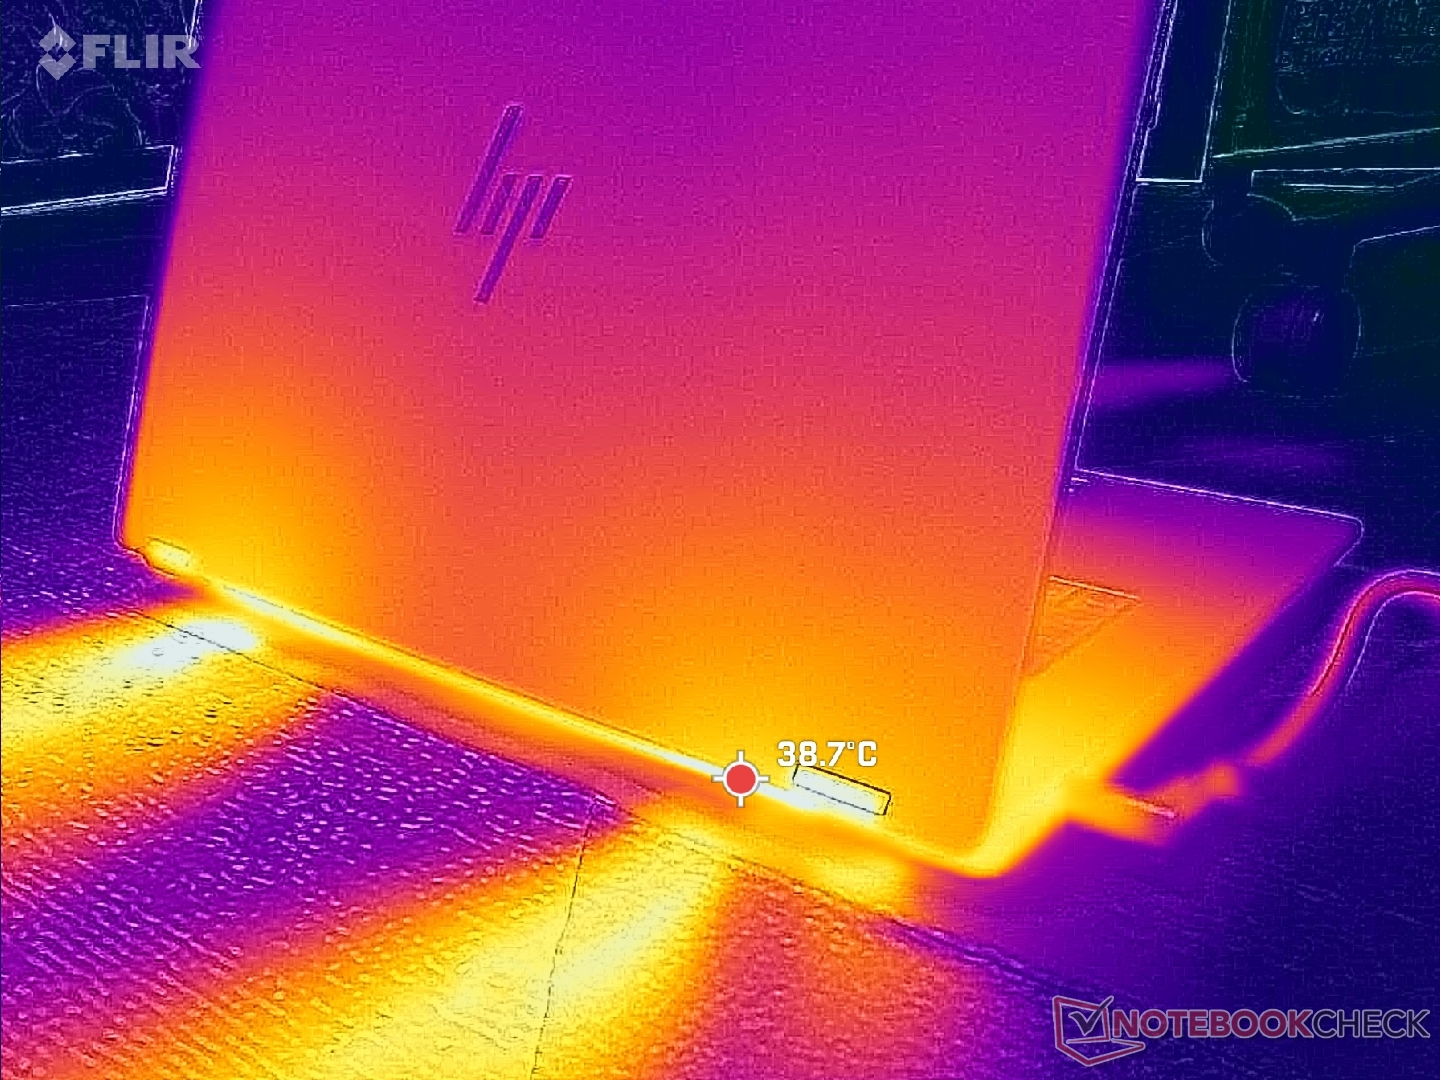
(+) Die maximale Temperatur auf der Oberseite ist 39.6 °C. Im Vergleich liegt der Klassendurchschnitt bei 38.2 °C (von 22.2 bis 69.8 °C für die Klasse Workstation).
(+) Auf der Unterseite messen wir eine maximalen Wert von 35.4 °C (im Vergleich zum Durchschnitt von 41.1 °C).
(+) Ohne Last messen wir eine durchschnittliche Temperatur von 28.4 °C auf der Oberseite. Der Klassendurchschnitt erreicht 32 °C.
(+) Die Handballen und der Touchpad-Bereich sind mit gemessenen 26 °C kühler als die typische Hauttemperatur und fühlen sich dadurch kühl an.
(±) Die durchschnittliche Handballen-Temperatur anderer getesteter Geräte war 27.8 °C (+1.8 °C).
| HP ZBook Fury G1i 18 Ultra 9 285HX, RTX PRO 5000 Blackwell Generation Laptop | Dell Pro Max 18 Plus MB18250 Ultra 9 285HX, RTX PRO 5000 Blackwell Generation Laptop | Schenker Key 18 Pro M25 RTX 5090 Ultra 9 275HX, GeForce RTX 5090 Laptop | Lenovo ThinkPad P16 Gen 2 i7-14700HX, RTX 4000 Ada Generation Laptop | HP ZBook X G1i 16 Ultra 7 265H, RTX PRO 2000 Blackwell Generation Laptop | HP ZBook Studio 16 G11 Ultra 9 185H, RTX 3000 Ada Generation Laptop | |
|---|---|---|---|---|---|---|
| Hitze | -12% | -14% | -6% | 0% | -10% | |
| Last oben max * (°C) | 39.6 | 44.8 -13% | 47.5 -20% | 46.6 -18% | 36 9% | 36.6 8% |
| Last unten max * (°C) | 35.4 | 47 -33% | 52.8 -49% | 51 -44% | 39.4 -11% | 47.8 -35% |
| Idle oben max * (°C) | 31.6 | 31.8 -1% | 28.5 10% | 24.8 22% | 30.4 4% | 31.4 1% |
| Idle unten max * (°C) | 31.2 | 31.4 -1% | 30.1 4% | 25.6 18% | 31.8 -2% | 35.6 -14% |
* ... kleinere Werte sind besser
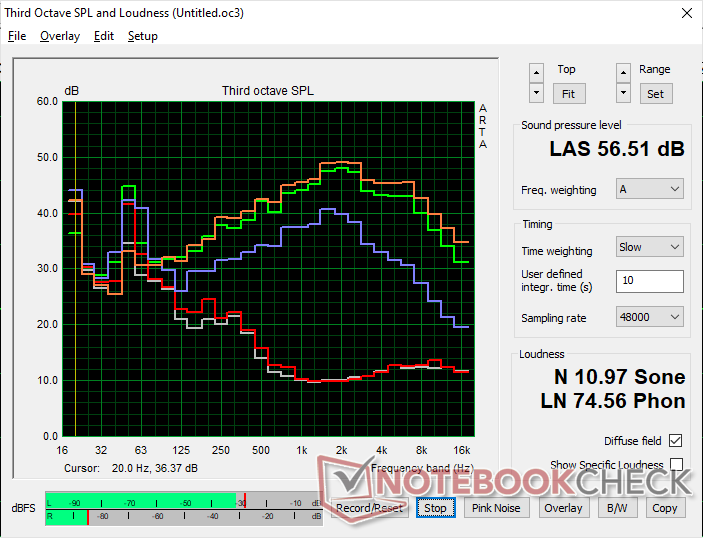
Lautsprecher
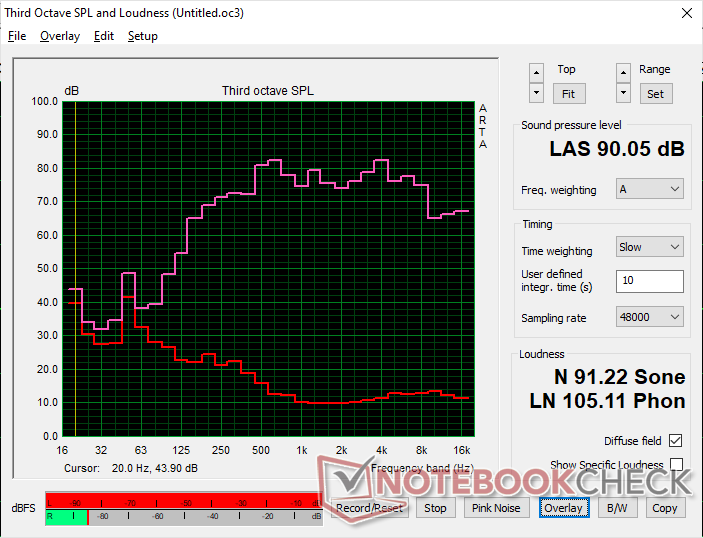
HP ZBook Fury G1i 18 Audio Analyse
(+) | Die Lautsprecher können relativ laut spielen (90.1 dB)
Bass 100 - 315 Hz
(±) | abgesenkter Bass - 11.4% geringer als der Median
(±) | durchschnittlich lineare Bass-Wiedergabe (8.9% Delta zum Vorgänger)
Mitteltöne 400 - 2000 Hz
(+) | ausgeglichene Mitten, vom Median nur 3.2% abweichend
(+) | lineare Mitten (5.6% Delta zum Vorgänger)
Hochtöne 2 - 16 kHz
(+) | ausgeglichene Hochtöne, vom Median nur 3.7% abweichend
(+) | sehr lineare Hochtöne (6.5% Delta zum Vorgänger)
Gesamt im hörbaren Bereich 100 - 16.000 Hz
(+) | hörbarer Bereich ist sehr linear (10.8% Abstand zum Median
Im Vergleich zu allen Geräten derselben Klasse
» 10% aller getesteten Geräte dieser Klasse waren besser, 4% vergleichbar, 86% schlechter
» Das beste Gerät hat einen Delta-Wert von 7%, durchschnittlich ist 17%, das schlechteste Gerät hat 35%
Im Vergleich zu allen Geräten im Test
» 6% aller getesteten Geräte waren besser, 2% vergleichbar, 92% schlechter
» Das beste Gerät hat einen Delta-Wert von 4%, durchschnittlich ist 24%, das schlechteste Gerät hat 134%
Apple MacBook Pro 16 2021 M1 Pro Audio Analyse
(+) | Die Lautsprecher können relativ laut spielen (84.7 dB)
Bass 100 - 315 Hz
(+) | guter Bass - nur 3.8% Abweichung vom Median
(+) | lineare Bass-Wiedergabe (5.2% Delta zum Vorgänger)
Mitteltöne 400 - 2000 Hz
(+) | ausgeglichene Mitten, vom Median nur 1.3% abweichend
(+) | lineare Mitten (2.1% Delta zum Vorgänger)
Hochtöne 2 - 16 kHz
(+) | ausgeglichene Hochtöne, vom Median nur 1.9% abweichend
(+) | sehr lineare Hochtöne (2.7% Delta zum Vorgänger)
Gesamt im hörbaren Bereich 100 - 16.000 Hz
(+) | hörbarer Bereich ist sehr linear (4.6% Abstand zum Median
Im Vergleich zu allen Geräten derselben Klasse
» 0% aller getesteten Geräte dieser Klasse waren besser, 0% vergleichbar, 100% schlechter
» Das beste Gerät hat einen Delta-Wert von 5%, durchschnittlich ist 17%, das schlechteste Gerät hat 45%
Im Vergleich zu allen Geräten im Test
» 0% aller getesteten Geräte waren besser, 0% vergleichbar, 100% schlechter
» Das beste Gerät hat einen Delta-Wert von 4%, durchschnittlich ist 24%, das schlechteste Gerät hat 134%
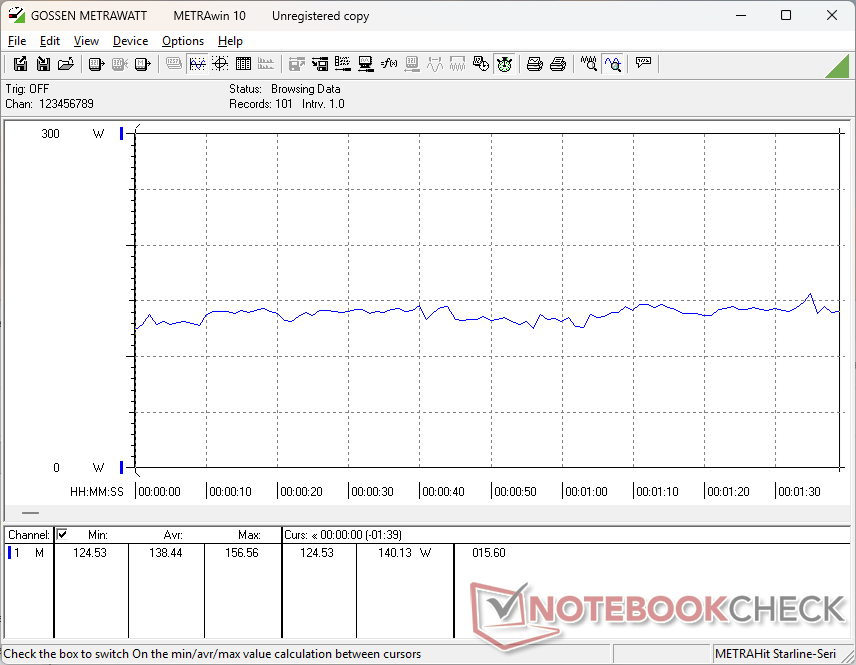
Energieverwaltung
Stromverbrauch
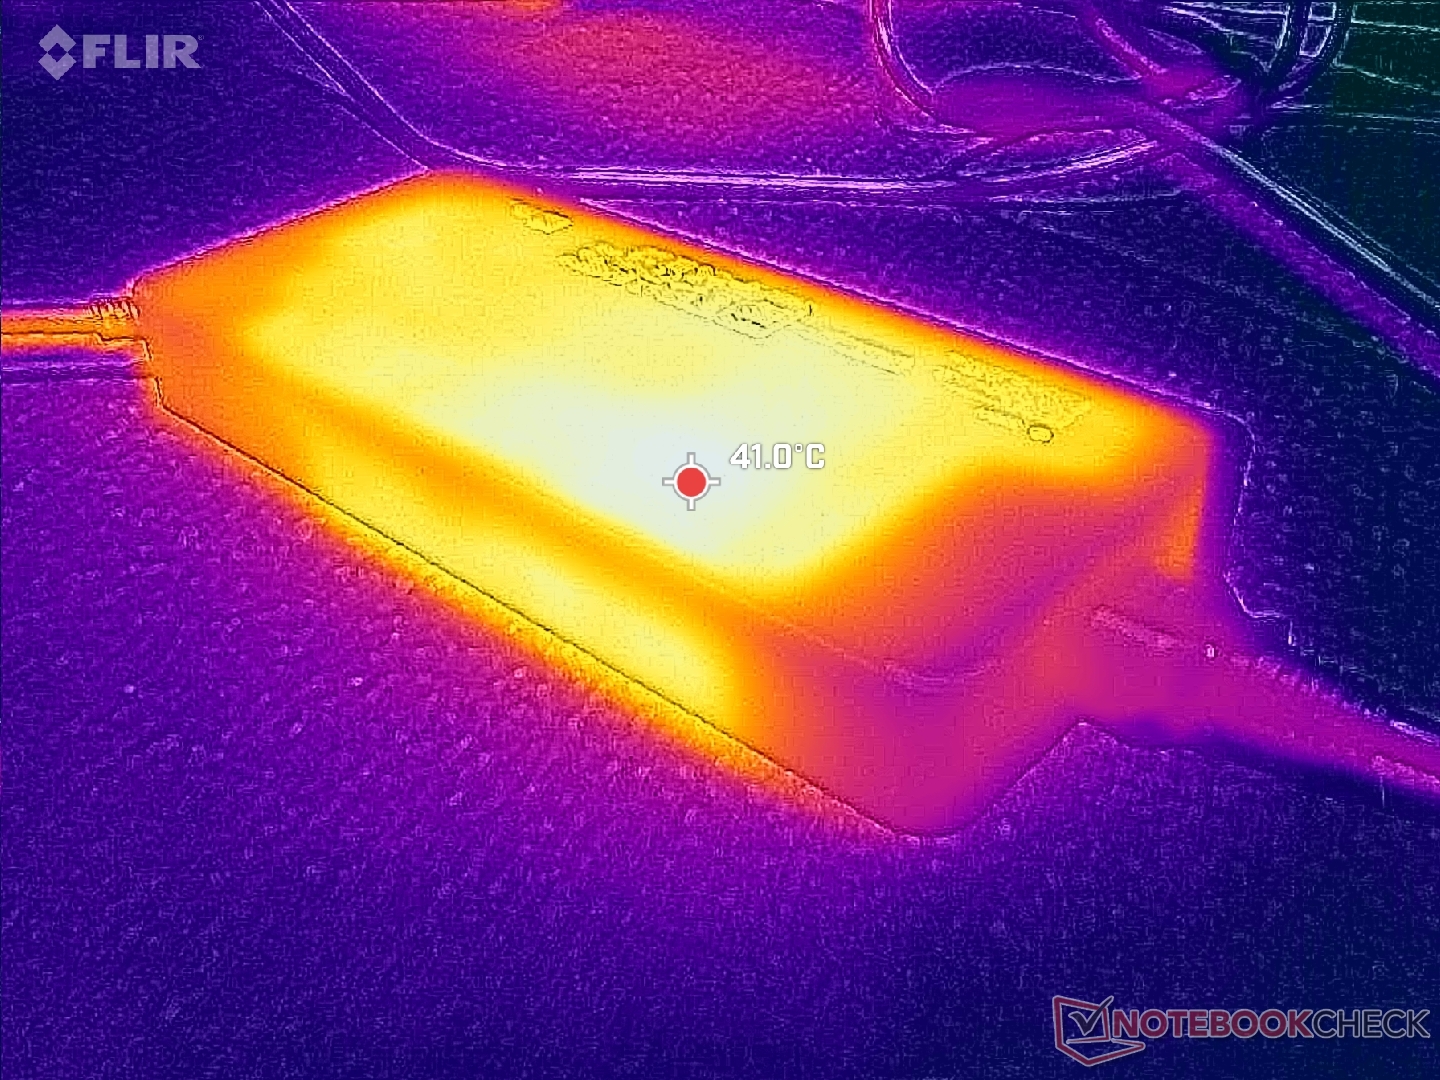
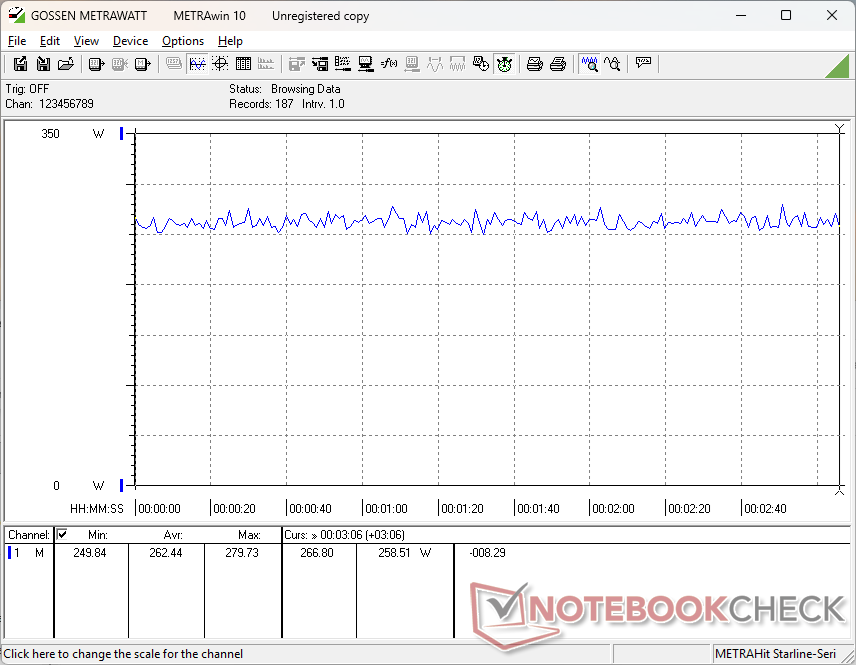
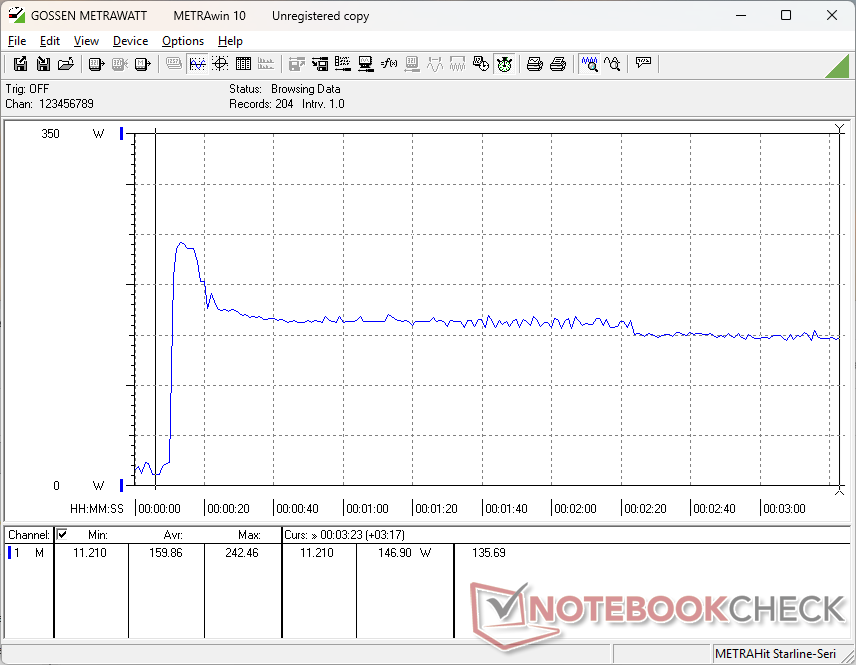
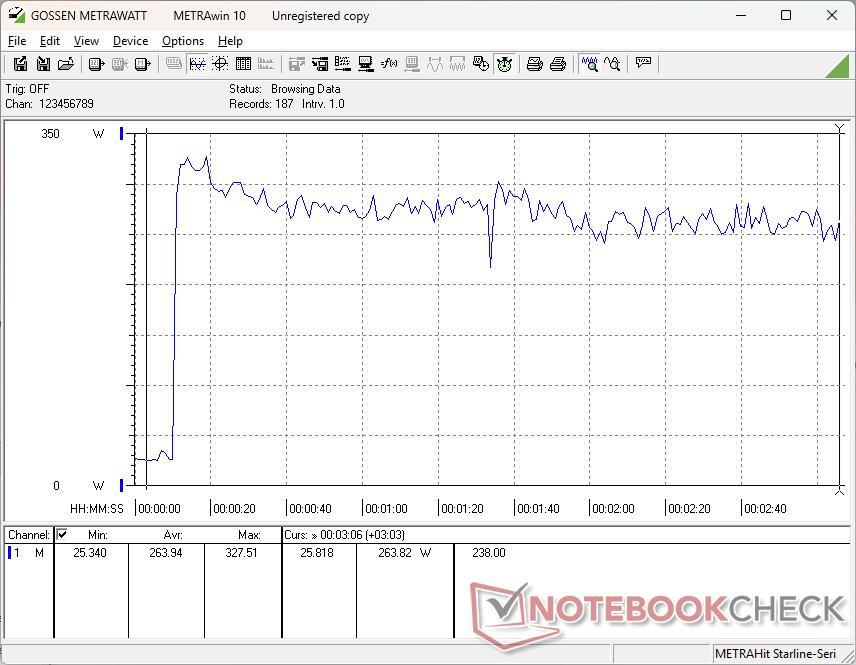
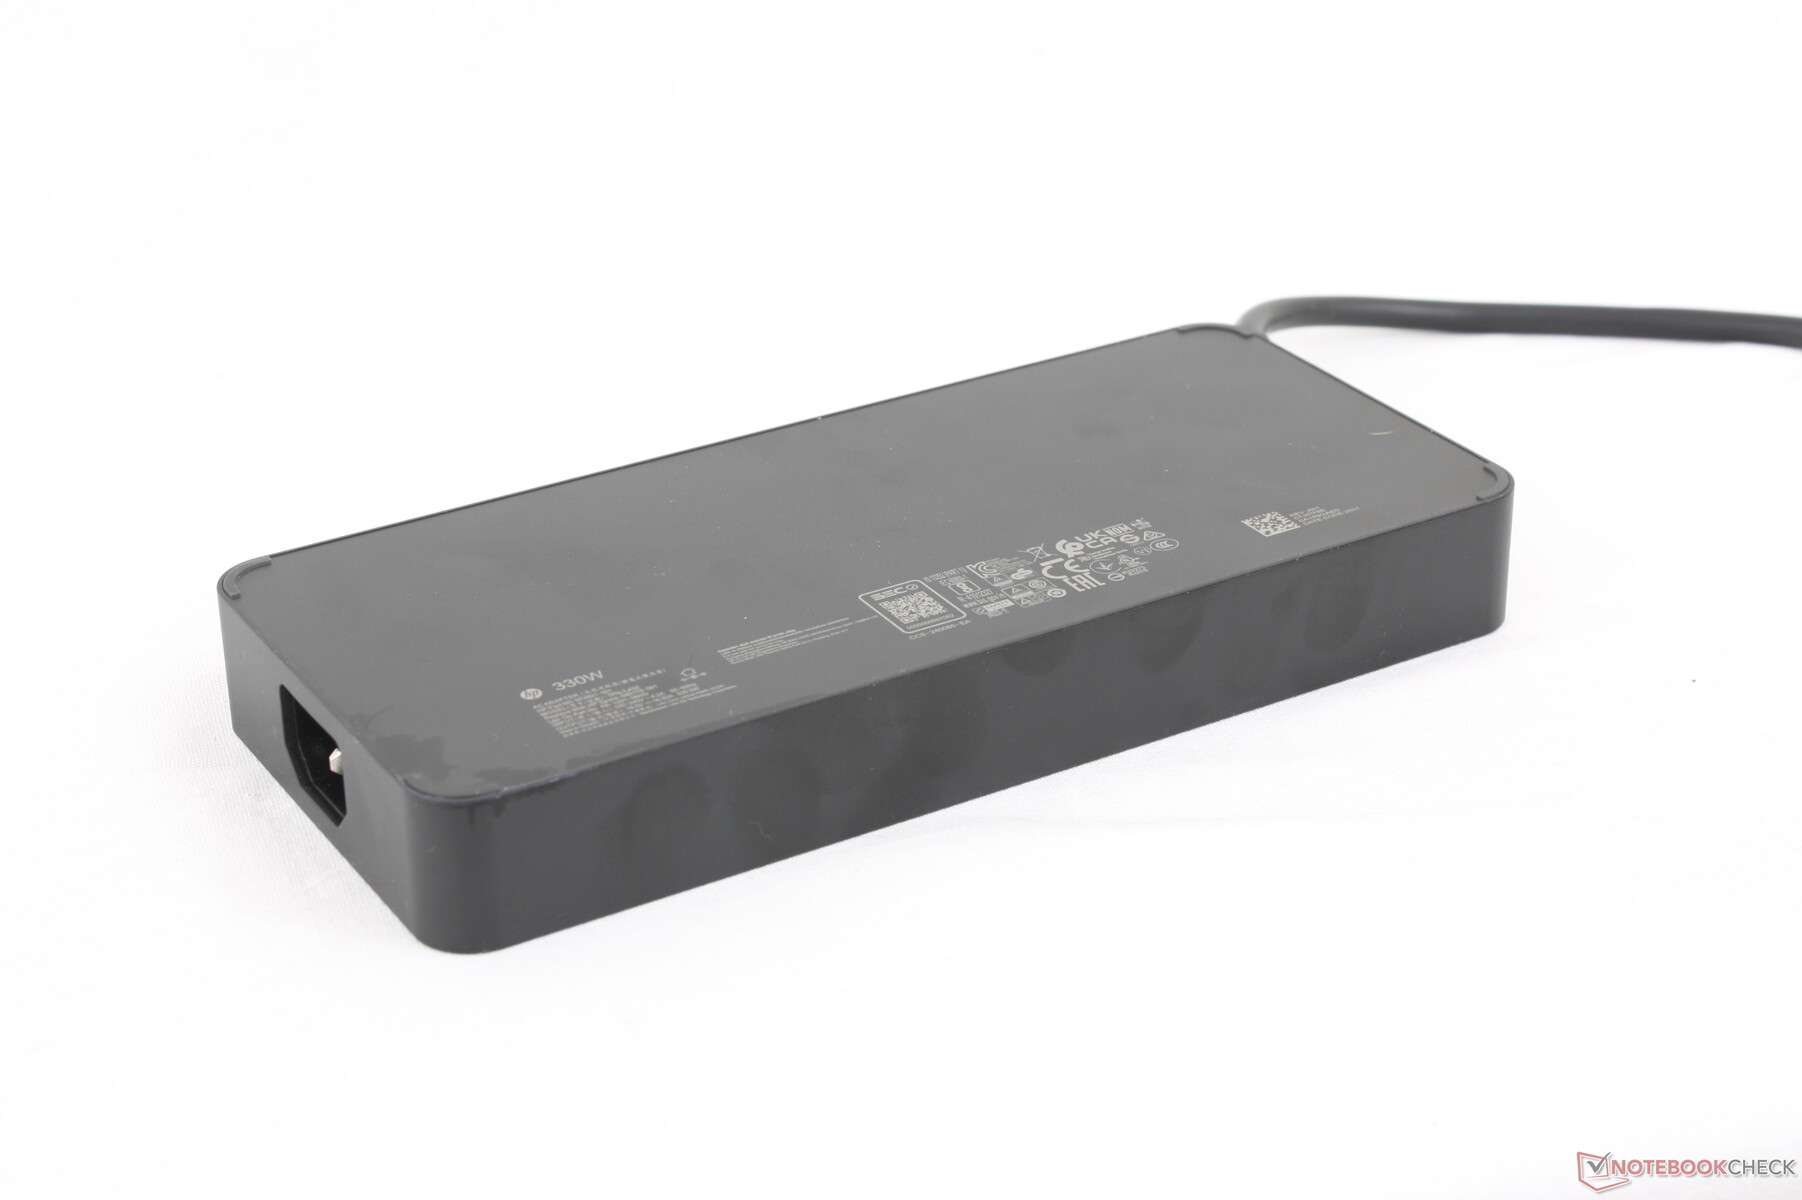
Das HP wird mit einem 330-W-Netzteil geliefert, während das Dell mit einem 280-W-USB-C-Netzteil daherkommt. Der maximale Verbrauch ist daher beim HP höher und erreicht in unseren Tests bis zu 328 W im Vergleich zu 281 W beim Dell, aber dieser hohe Verbrauch ist aufgrund thermischer Beschränkungen oder vorgegebener Obergrenzen nur von kurzer Dauer. Bei der gleichzeitigen Ausführung von Prime95 und FurMark erreichte der Verbrauch beispielsweise einen Spitzenwert von 328 W, bevor er sich schnell auf etwa 265 W stabilisierte, ähnlich wie wir es beim Dell beobachtet haben. Für die Leistung spielt das größere Netzteil mit 330 W also kaum eine Rolle.
| Aus / Standby | |
| Idle | |
| Last |
|
Legende:
min: | |
| HP ZBook Fury G1i 18 Ultra 9 285HX, RTX PRO 5000 Blackwell Generation Laptop, , IPS, 2560x1600, 18" | Dell Pro Max 18 Plus MB18250 Ultra 9 285HX, RTX PRO 5000 Blackwell Generation Laptop, , IPS, 2560x1600, 18" | Schenker Key 18 Pro M25 RTX 5090 Ultra 9 275HX, GeForce RTX 5090 Laptop, Samsung 9100 Pro 4 TB, IPS, 3840x2400, 18" | Lenovo ThinkPad P16 Gen 2 i7-14700HX, RTX 4000 Ada Generation Laptop, SK hynix PC801 HFS001TEJ9X162N, IPS, 2560x1600, 16" | HP ZBook X G1i 16 Ultra 7 265H, RTX PRO 2000 Blackwell Generation Laptop, Samsung PM9A1 MZVL22T0HBLB, IPS, 2560x1600, 16" | HP ZBook Studio 16 G11 Ultra 9 185H, RTX 3000 Ada Generation Laptop, Kioxia XG8 KXG80ZNV1T02, IPS, 3840x2400, 16" | |
|---|---|---|---|---|---|---|
| Stromverbrauch | 11% | -11% | 21% | 58% | 28% | |
| Idle min * (Watt) | 16.1 | 6.1 62% | 14 13% | 7.9 51% | 4.1 75% | 14 13% |
| Idle avg * (Watt) | 20.3 | 15.2 25% | 21.9 -8% | 13.1 35% | 9 56% | 22.4 -10% |
| Idle max * (Watt) | 25 | 32.4 -30% | 22.3 11% | 24.2 3% | 9.4 62% | 25.7 -3% |
| Last avg * (Watt) | 138.5 | 130.1 6% | 149.5 -8% | 127.4 8% | 86.7 37% | 90.2 35% |
| Cyberpunk 2077 ultra external monitor * (Watt) | 255 | 252 1% | 336 -32% | 219 14% | 102 60% | 120.3 53% |
| Cyberpunk 2077 ultra * (Watt) | 262 | 256 2% | 333 -27% | 225 14% | 106.1 60% | 125.4 52% |
| Last max * (Watt) | 327.5 | 280.9 14% | 415.4 -27% | 248.5 24% | 152.9 53% | 142 57% |
* ... kleinere Werte sind besser
Stromverbrauch Cyberpunk/Stresstest
Stromverbrauch externer Monitor
Akkulaufzeit
Die WLAN-Laufzeit ist für die Größe immer noch sehr gut, wenn auch etwas kürzer als beim Dell Pro Max 18 Plus. Das Display unterstützt PSR2 oder Panel Self Refresh 2 zur Energieeinsparung anstelle von Advanced Optimus.
| HP ZBook Fury G1i 18 Ultra 9 285HX, RTX PRO 5000 Blackwell Generation Laptop, 99 Wh | Dell Pro Max 18 Plus MB18250 Ultra 9 285HX, RTX PRO 5000 Blackwell Generation Laptop, 96 Wh | Schenker Key 18 Pro M25 RTX 5090 Ultra 9 275HX, GeForce RTX 5090 Laptop, 98 Wh | Lenovo ThinkPad P16 Gen 2 i7-14700HX, RTX 4000 Ada Generation Laptop, 94 Wh | HP ZBook X G1i 16 Ultra 7 265H, RTX PRO 2000 Blackwell Generation Laptop, 83 Wh | HP ZBook Studio 16 G11 Ultra 9 185H, RTX 3000 Ada Generation Laptop, 86 Wh | |
|---|---|---|---|---|---|---|
| Akkulaufzeit | ||||||
| WLAN (h) | 8 | 9.3 16% | 5.8 -27% | 2.5 -69% | 12.5 56% | 4.8 -40% |
Notebookcheck Bewertung
Das HP ZBook Fury G1i 18 klingt auf dem Papier hervorragend, aber die konservative CPU- und GPU-Leistung und der allgemeine Mangel an Innovationen machen das Dell Pro Max 18 Plus zu einer deutlich attraktiveren Option.
HP ZBook Fury G1i 18
- 22.11.2025 v8
Allen Ngo
 Total Sustainability Score:
 Potenzielle Wettbewerber im Vergleich
Bild | Modell / Test | Preis ab | Gewicht | Dicke | Display |
|---|---|---|---|---|---|
1. 89.5%  | HP ZBook Fury G1i 18 Intel Core Ultra 9 285HX ⎘ NVIDIA RTX PRO 5000 Blackwell Generation Laptop ⎘ 64 GB RAM | Amazon: Bestpreis 5576.59€ XITRA.de 2. 5698.91€ electronis.de 3. 5746.85€ Easynotebooks.de | 3.4 kg | 27 mm | 18.00" 2560x1600 168 PPI IPS |
2. 88.9%  | Dell Pro Max 18 Plus MB18250 Intel Core Ultra 9 285HX ⎘ NVIDIA RTX PRO 5000 Blackwell Generation Laptop ⎘ 128 GB RAM | Amazon: 2.387,32 € Bestpreis 2700.69€ electronis.de 2. 2700.88€ Jacob Elektronik direkt 3. 2700.9€ XITRA.de | 3.6 kg | 30.2 mm | 18.00" 2560x1600 168 PPI IPS |
3. 84.6%  | Schenker Key 18 Pro M25 RTX 5090 Intel Core Ultra 9 275HX ⎘ NVIDIA GeForce RTX 5090 Laptop ⎘ 256 GB RAM, 4096 GB SSD | Amazon: Bestpreis 4659€ Cyberport.de 2. 4659€ computeruniverse.net 3. 4698.15€ computeruniverse.at | 4.1 kg | 29.5 mm | 18.00" 3840x2400 252 PPI IPS |
4. 85.9%  | Lenovo ThinkPad P16 Gen 2 Intel Core i7-14700HX ⎘ NVIDIA RTX 4000 Ada Generation Laptop ⎘ 32 GB RAM, 1024 GB SSD | Amazon: 2.561,66 € Geizhals Suche | 3.1 kg | 30.23 mm | 16.00" 2560x1600 189 PPI IPS |
5. 87.4%  | HP ZBook X G1i 16 Intel Core Ultra 7 265H ⎘ NVIDIA RTX PRO 2000 Blackwell Generation Laptop ⎘ 64 GB RAM, 2048 GB SSD | Amazon: 4.724,29 € Bestpreis 3862.56€ ITboost.de 2. 4183.03€ electronis.de 3. 4183.04€ XITRA.de | 2.2 kg | 23 mm | 16.00" 2560x1600 189 PPI IPS |
6. 84.2%  | HP ZBook Studio 16 G11 Intel Core Ultra 9 185H ⎘ NVIDIA RTX 3000 Ada Generation Laptop ⎘ 64 GB RAM, 1024 GB SSD | Amazon: 3.037,92 € Geizhals Suche | 1.8 kg | 19 mm | 16.00" 3840x2400 283 PPI IPS |
Transparenz
Die Auswahl der zu testenden Geräte erfolgt innerhalb der Redaktion. Das vorliegende Testmuster wurde dem Autor vom Hersteller oder einem Shop zu Testzwecken leihweise zur Verfügung gestellt. Eine Einflussnahme des Leihstellers auf den Testbericht gab es nicht, der Hersteller erhielt keine Version des Reviews vor der Veröffentlichung. Es bestand keine Verpflichtung zur Publikation. Als eigenständiges, unabhängiges Unternehmen unterliegt Notebookcheck keiner Diktion von Herstellern, Shops und Verlagen.
So testet Notebookcheck
Pro Jahr werden von Notebookcheck hunderte Laptops und Smartphones unabhängig in von uns standardisierten technischen Verfahren getestet, um eine Vergleichbarkeit aller Testergebnisse zu gewährleisten. Seit rund 20 Jahren entwickeln wir diese Testmethoden kontinuierlich weiter und setzen damit Branchenstandards. In unseren Testlaboren kommt ausschließlich hochwertiges Messequipment in die Hände erfahrener Techniker und Redakteure. Die Tests unterliegen einer mehrstufigen Kontrolle. Unsere komplexe Gesamtbewertung basiert auf hunderten fundierten Messergebnissen und Benchmarks, womit Ihnen Objektivität garantiert ist. Weitere Informationen zu unseren Testmethoden gibt es hier.

