Notebookcheck Logo
Teaser

Vzmore iX9 Max Mini-PC im Test: Mehr als ein Mac-Mini-Doppelgänger

Hochwertig und professionell mit zahlreichen Anschlüssen.

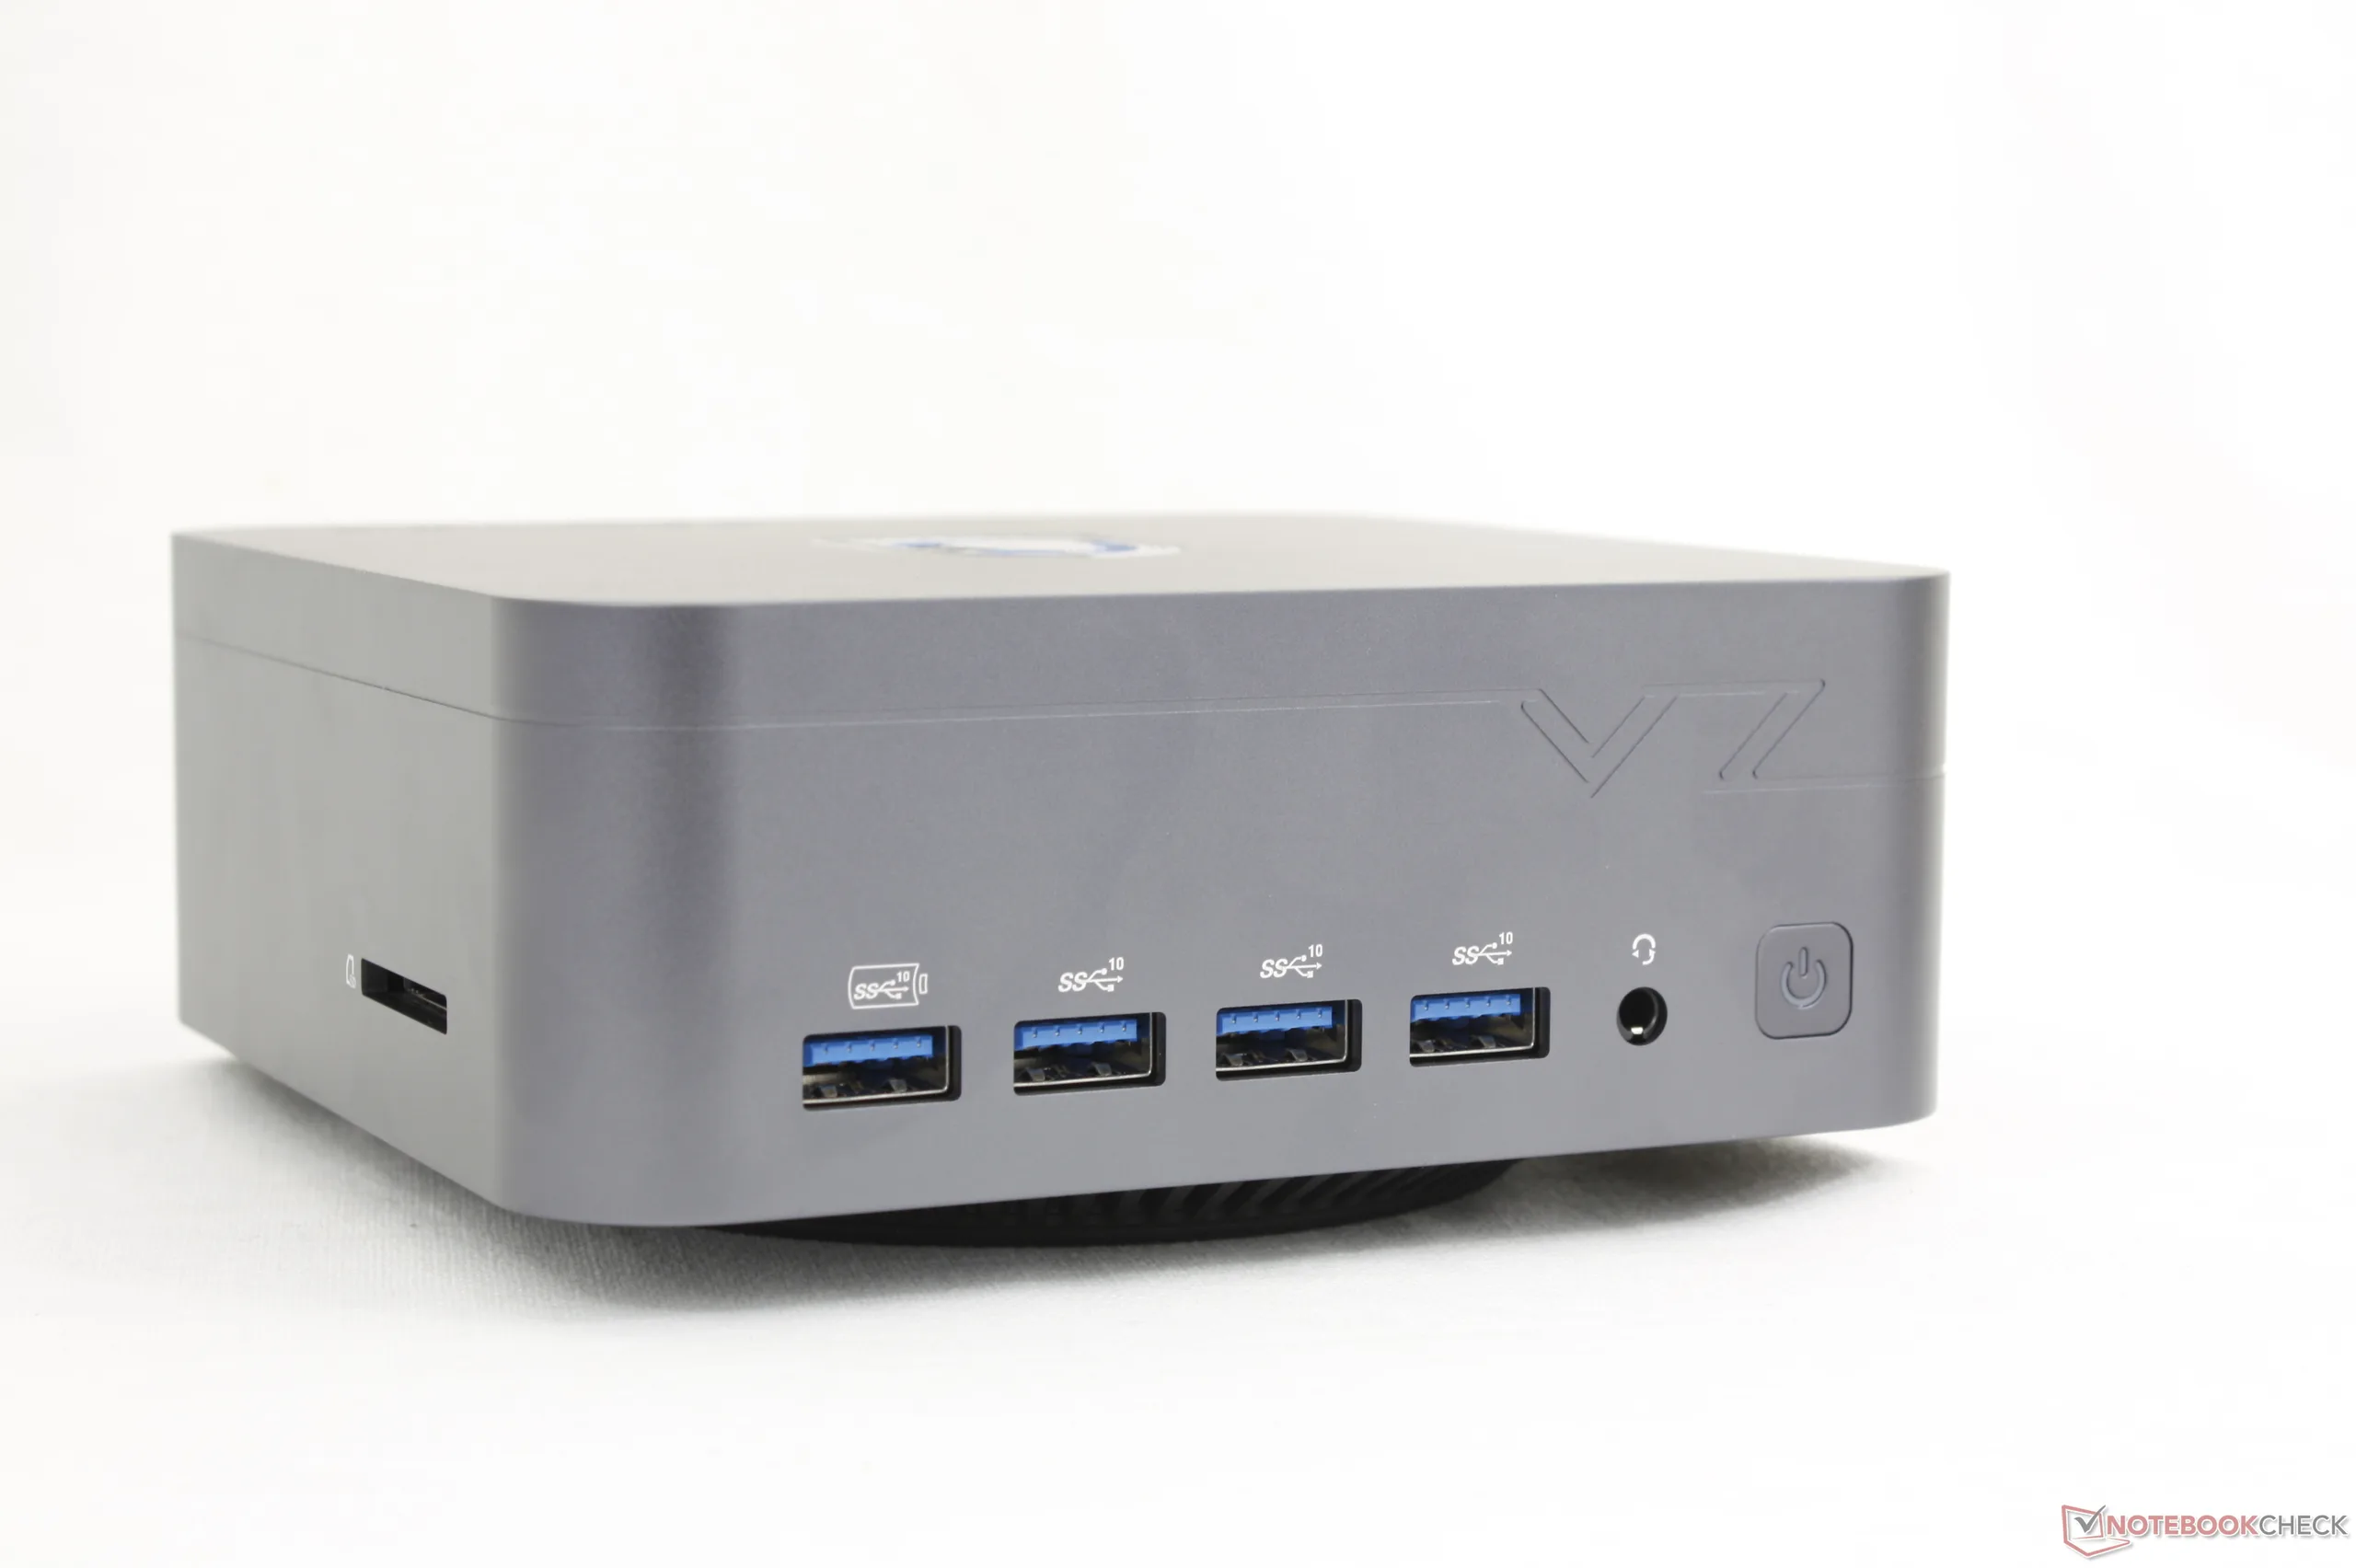
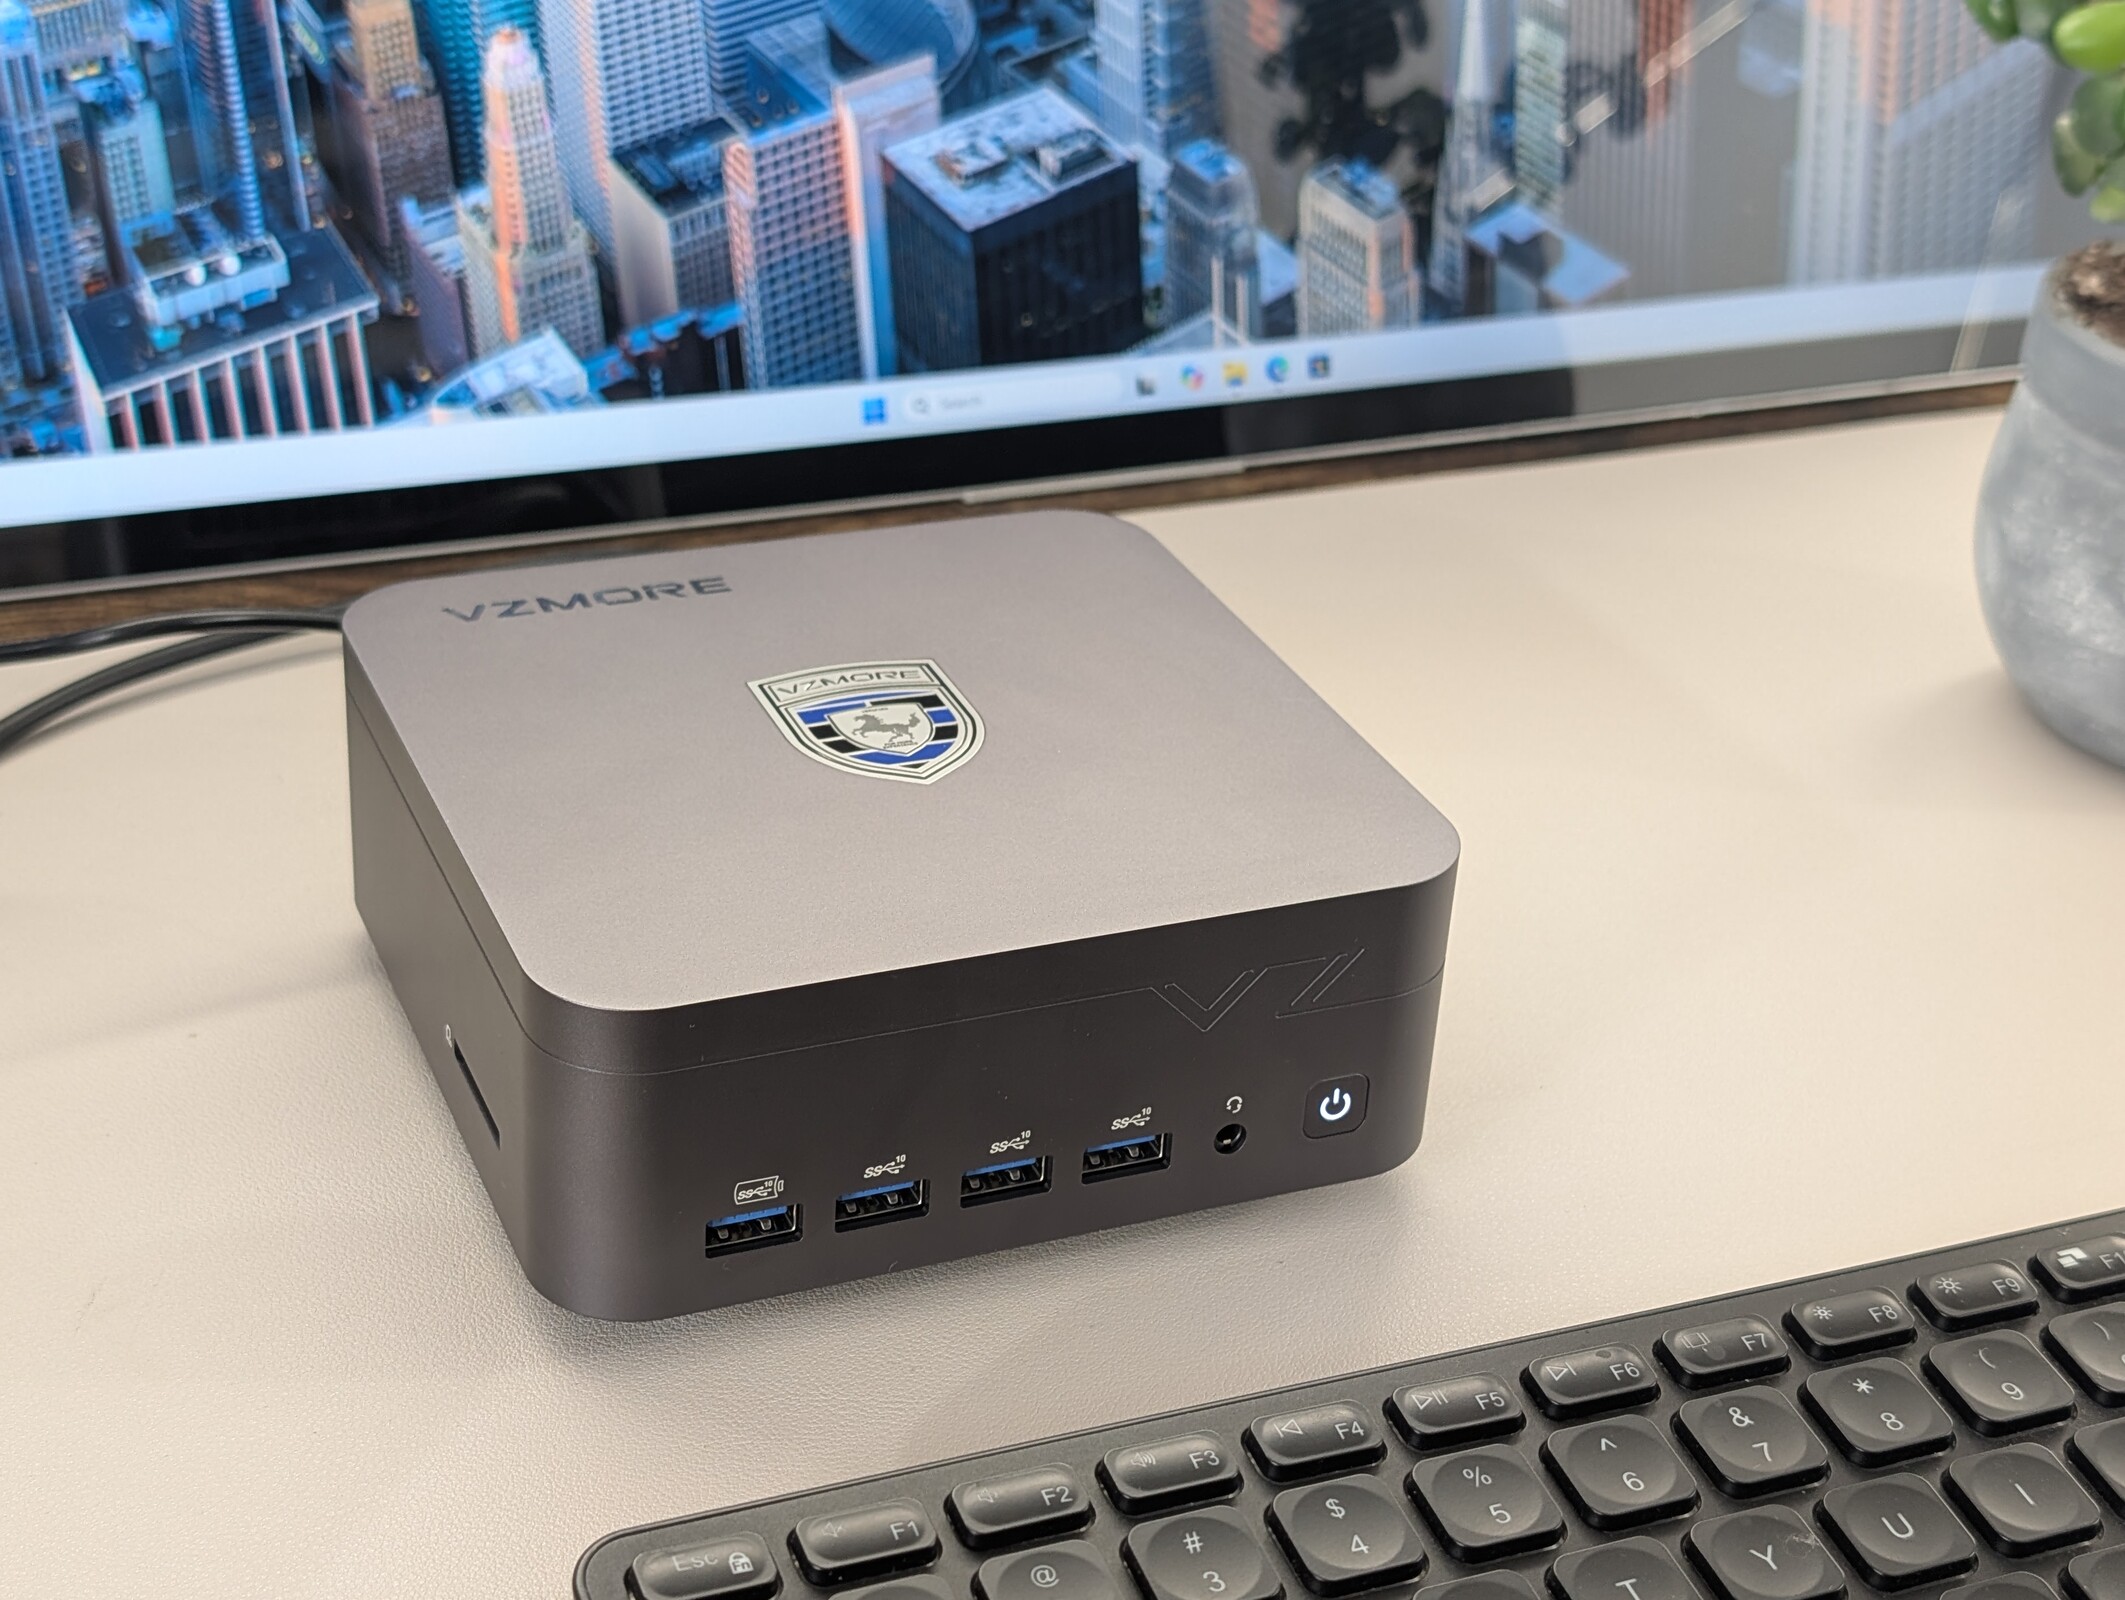
Mit dem Lamborghini-ähnlichen Logo und dem von Apple inspirierten Design weckt Vzmore hohe Erwartungen. Nachdem wir einige Zeit mit dem Modell verbracht haben, können wir sagen: Der iX9 Max fühlt sich so robust an, wie er aussieht.
Allen Ngo (übersetzt von Falk Hinrichs) Veröffentlicht am 🇺🇸 🇪🇸 ...
Mini PC Intel Meteor Lake Business

Fazit – Eleganter und unkomplizierter Mini-PC

Der Vzmore iX9 Max kostet derzeit 35 Prozent weniger als der AX9 Max mit AMD-Prozessor. Dafür fallen die Multi-Thread-CPU-Leistung und die Grafikleistung rund 30 beziehungsweise 25 Prozent niedriger aus als beim AMD-Modell; auch die integrierten KI-Funktionen sind noch langsamer. Wer weder die zusätzliche Leistung noch den aufrüstbaren Arbeitsspeicher des AX9 Max benötigt, findet im günstigeren und effizienteren iX9 Max eine passende Alternative. Schließlich verfügen beide über dieselben Anschlüsse und das gleiche elegante, hochwertig verarbeitete Metallgehäuse.

Im Vergleich zu Konkurrenten wie dem Beelink GTi15 Ultra gefallen uns die kompakteren Abmessungen und die einfachere Wartung. Der Vzmore verzichtet dafür auf integrierte Lautsprecher, ein integriertes Netzteil und einen PCIe-5-Erweiterungssteckplatz. Die leichtere Bauweise bedeutet allerdings auch weniger aufrüstbare Komponenten: Die zweite M.2-SSD darf nur 42 mm lang sein, während größere Konkurrenten wie der Bosgame VTA-439 oder der erwähnte Beelink jeweils mehrere 80-mm-SSDs aufnehmen können. Diese schwereren Alternativen sind bei längerer anspruchsvoller Belastung zudem etwas leiser.

Pro

+ viele USB-A- und USB-C-Anschlüsse
+ schneller integrierter SD-Kartenleser
+ unterstützt bis zu zwei M.2-SSDs
+ hochwertiges Metallgehäuse
+ VESA-kompatibel

Contra

- kein integrierter Kensington-Lock-Anschluss, Lautsprecher oder Fingerabdruckleser
- kann unter Dauerlast etwas laut werden
- begrenzte TOPS- und GPU-Leistung
- benötigt ein externes Netzteil
- Arbeitsspeicher nicht vom Nutzer aufrüstbar

Preis und Verfügbarkeit

Der Hersteller liefert den iX9 Max direkt für 950 US-Dollar beziehungsweise im Angebot für 900 US-Dollar. Dasselbe Modell ist auch bei Amazon erhältlich. Mit dem Rabattcode IX9NOTEBOOK gibt es 15 % Nachlass (gültig bis zum 30. Dezember).

Amazon Logo

Vzmore bietet derzeit einige Mini-PCs der professionellen Max-Serie mit AMD- und Intel-Prozessoren an. Der AX9 Max mit Zen-5-Prozessor hat uns überzeugt, aber lohnt sich auch der iX9 Max?

Der iX9 Max ist für etwa 900 bis 1.000 US-Dollar mit einer Core-Ultra-9-185H-Meteor-Lake-CPU und 24 GB verlötetem LPDDR5-RAM ausgestattet. Äußerlich entspricht sein Gehäuse genau dem des AX9 Max, ist aber in einem dunkleren Grau gehalten.

Zu den Konkurrenten des Vzmore zählen andere hochwertige Mini-PCs wie der Beelink GTi Ultra, der Bosgame M2 oder die Apple-Mac-Mini-Serie.

Technische Daten

Vzmore iX9 Max
Prozessor
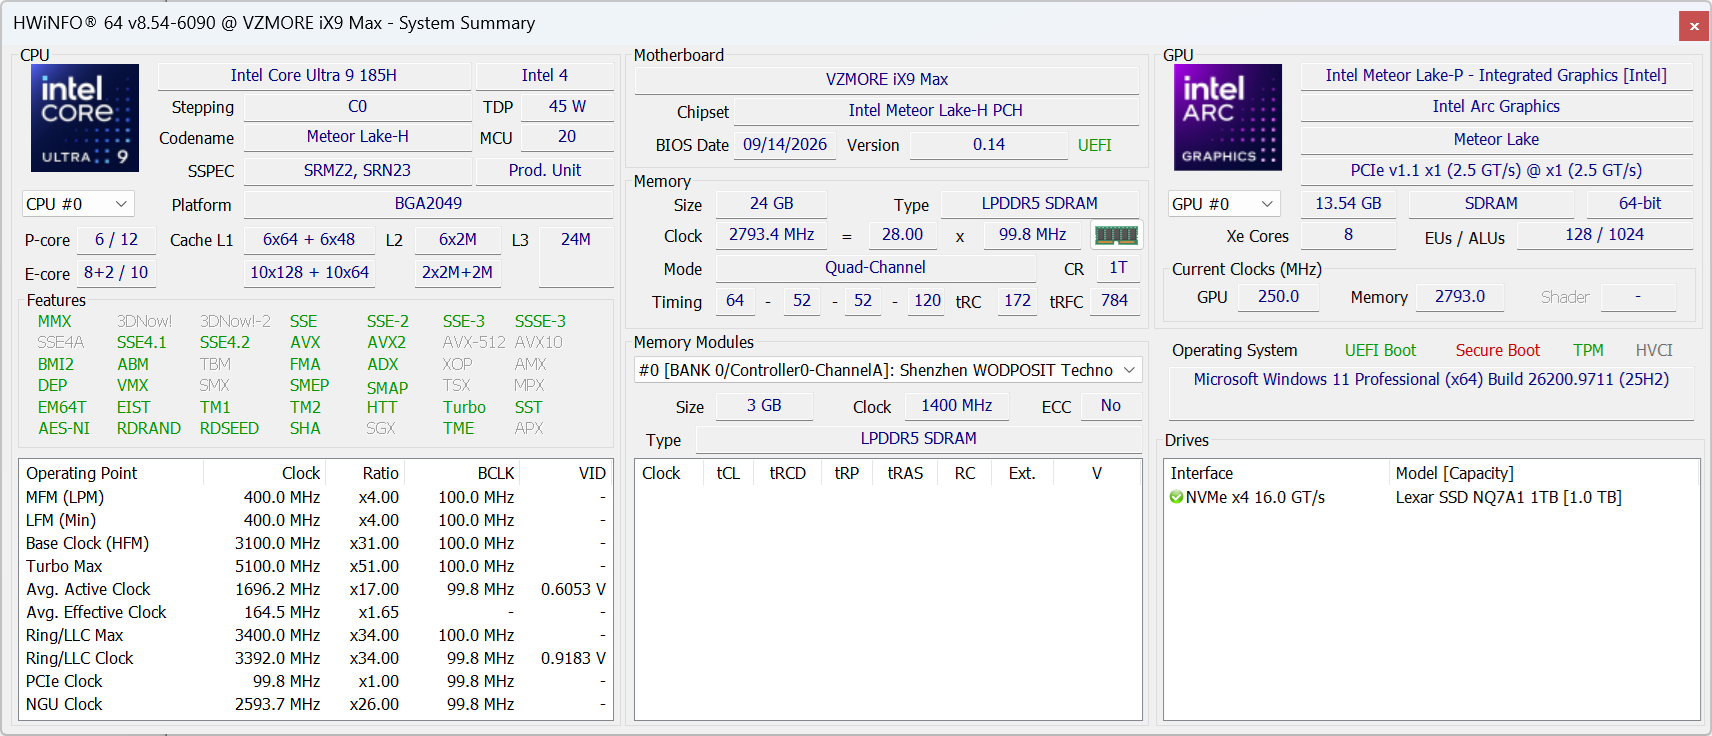
Intel Core Ultra 9 185H 16c/22t, 6 x 4.8 GHz Intel Redwood Cove P-Core, 8 x 3.8 GHz Intel Crestmont E-Core, 2 x 2.5 GHz Intel Crestmont E-Core, 70 W PL2 / Short Burst, 45 W PL1 / Sustained, Meteor Lake-H
Grafikkarte
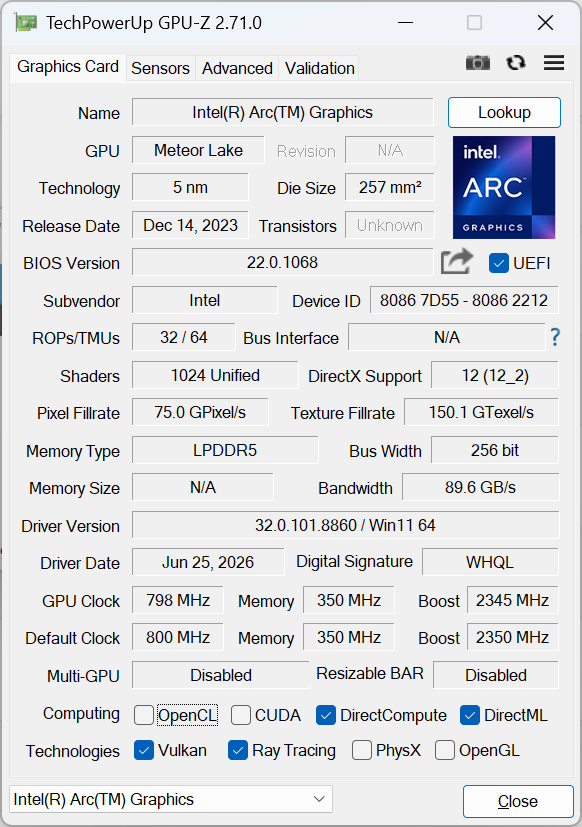
Intel Arc 8-Core iGPU, Kerntakt: 2345 MHz, Speichertakt: 350 MHz, LPDDR5, 32.0.101.8860
RAM
24 GB 
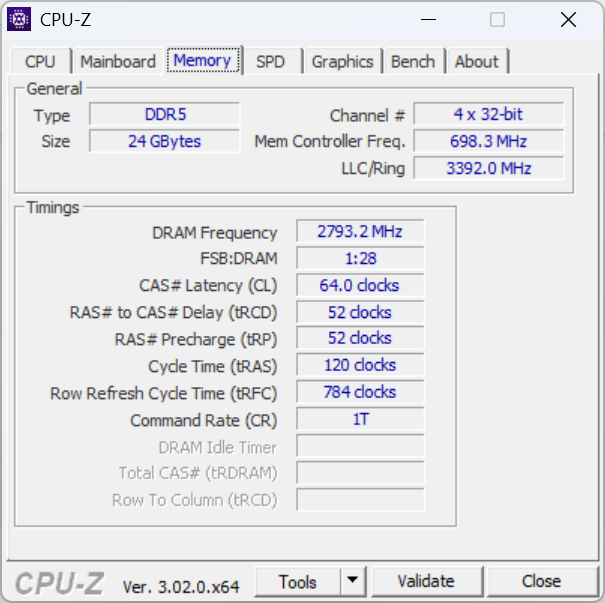
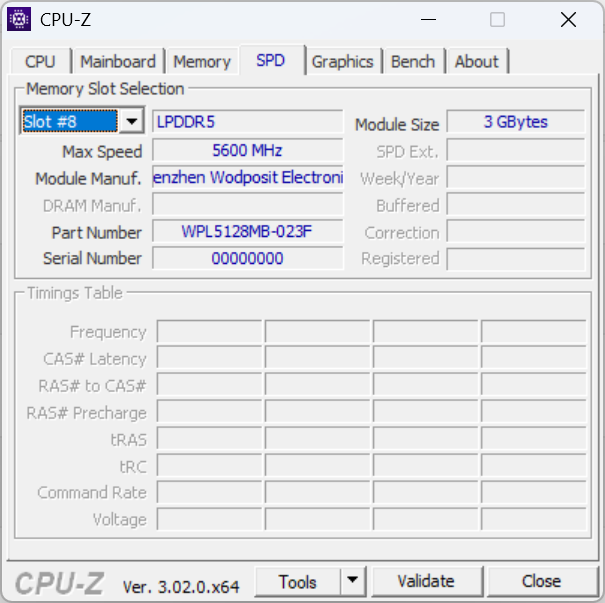
, LPDDR5, 4200 MHz, Dual-Channel, Soldered
Mainboard
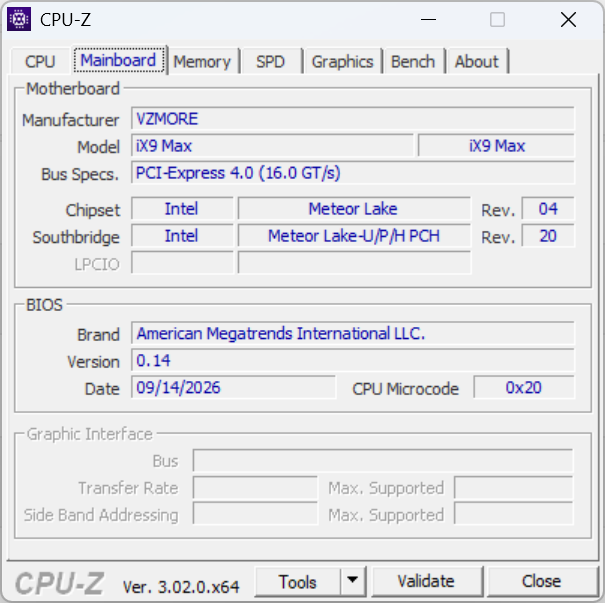
Intel Meteor Lake-U/P/H PCH
Massenspeicher
Lexar NQ7A1, 2048 GB 
Soundkarte
Intel Meteor Lake-U/P/H PCH - cAVS (Audio, Voice, Speech)
Anschlüsse
1 USB 2.0, 5 USB 3.1 Gen2, 2 USB4 40 Gbps, USB-C Power Delivery (PD), 2 HDMI, 2 DisplayPort, Audio Anschlüsse: 3.5 mm combo, Card Reader: SD
Netzwerk
Intel Ethernet Controller I226-V (10/2500MBit/s), Mediatek Wi-Fi 7 MT7925 Wireless LAN Card (a/b/g/ac = Wi-Fi 5/ax = Wi-Fi 6/ Wi-Fi 6E 6 GHz be = Wi-Fi 7), Bluetooth 5.4
Abmessungen
Höhe x Breite x Tiefe (in mm): 57.7 x 135 x 132
Betriebssystem
Microsoft Windows 11 Pro
Sonstiges
Tastatur-Beleuchtung: nein, 36 Monate Garantie
Gewicht
785 g, Netzteil: 385 g
Preis
950 USD
Hinweis: Der Hersteller kann abweichende Bauteile wie Bildschirme, Laufwerke und Speicherriegel mit ähnlichen Spezifikationen unter dem gleichen Modellnamen einsetzen.


Gehäuse

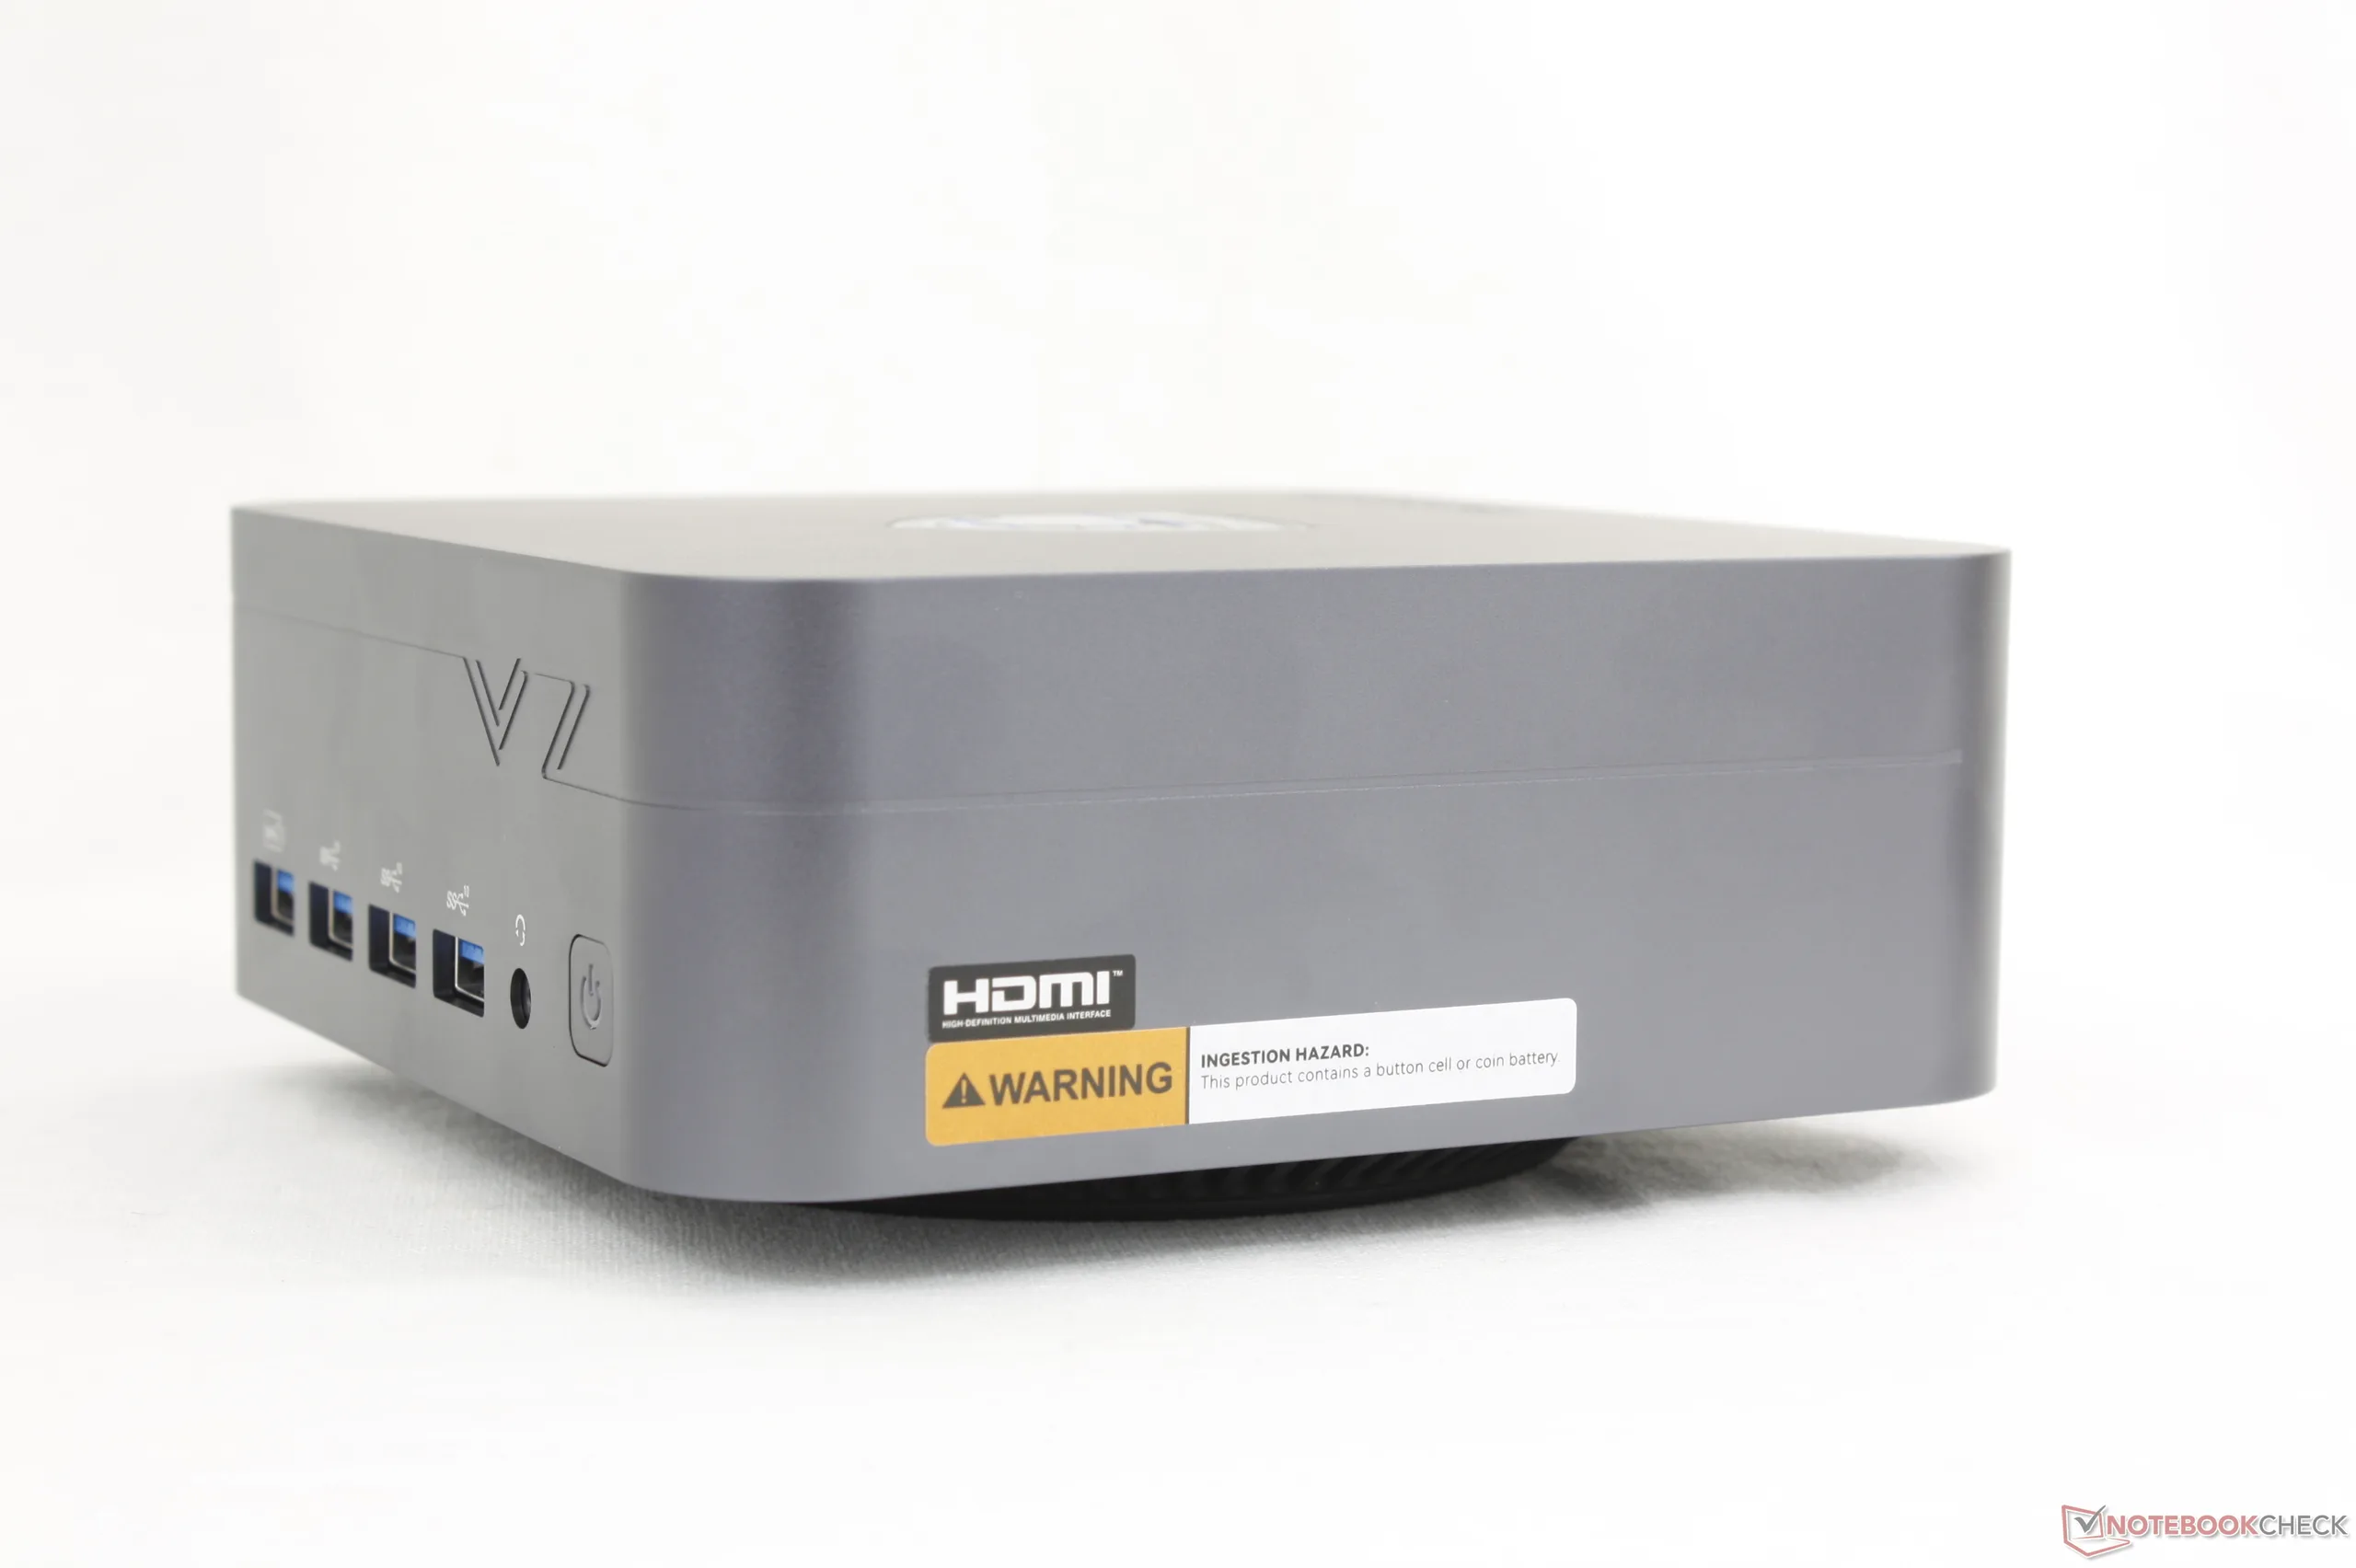
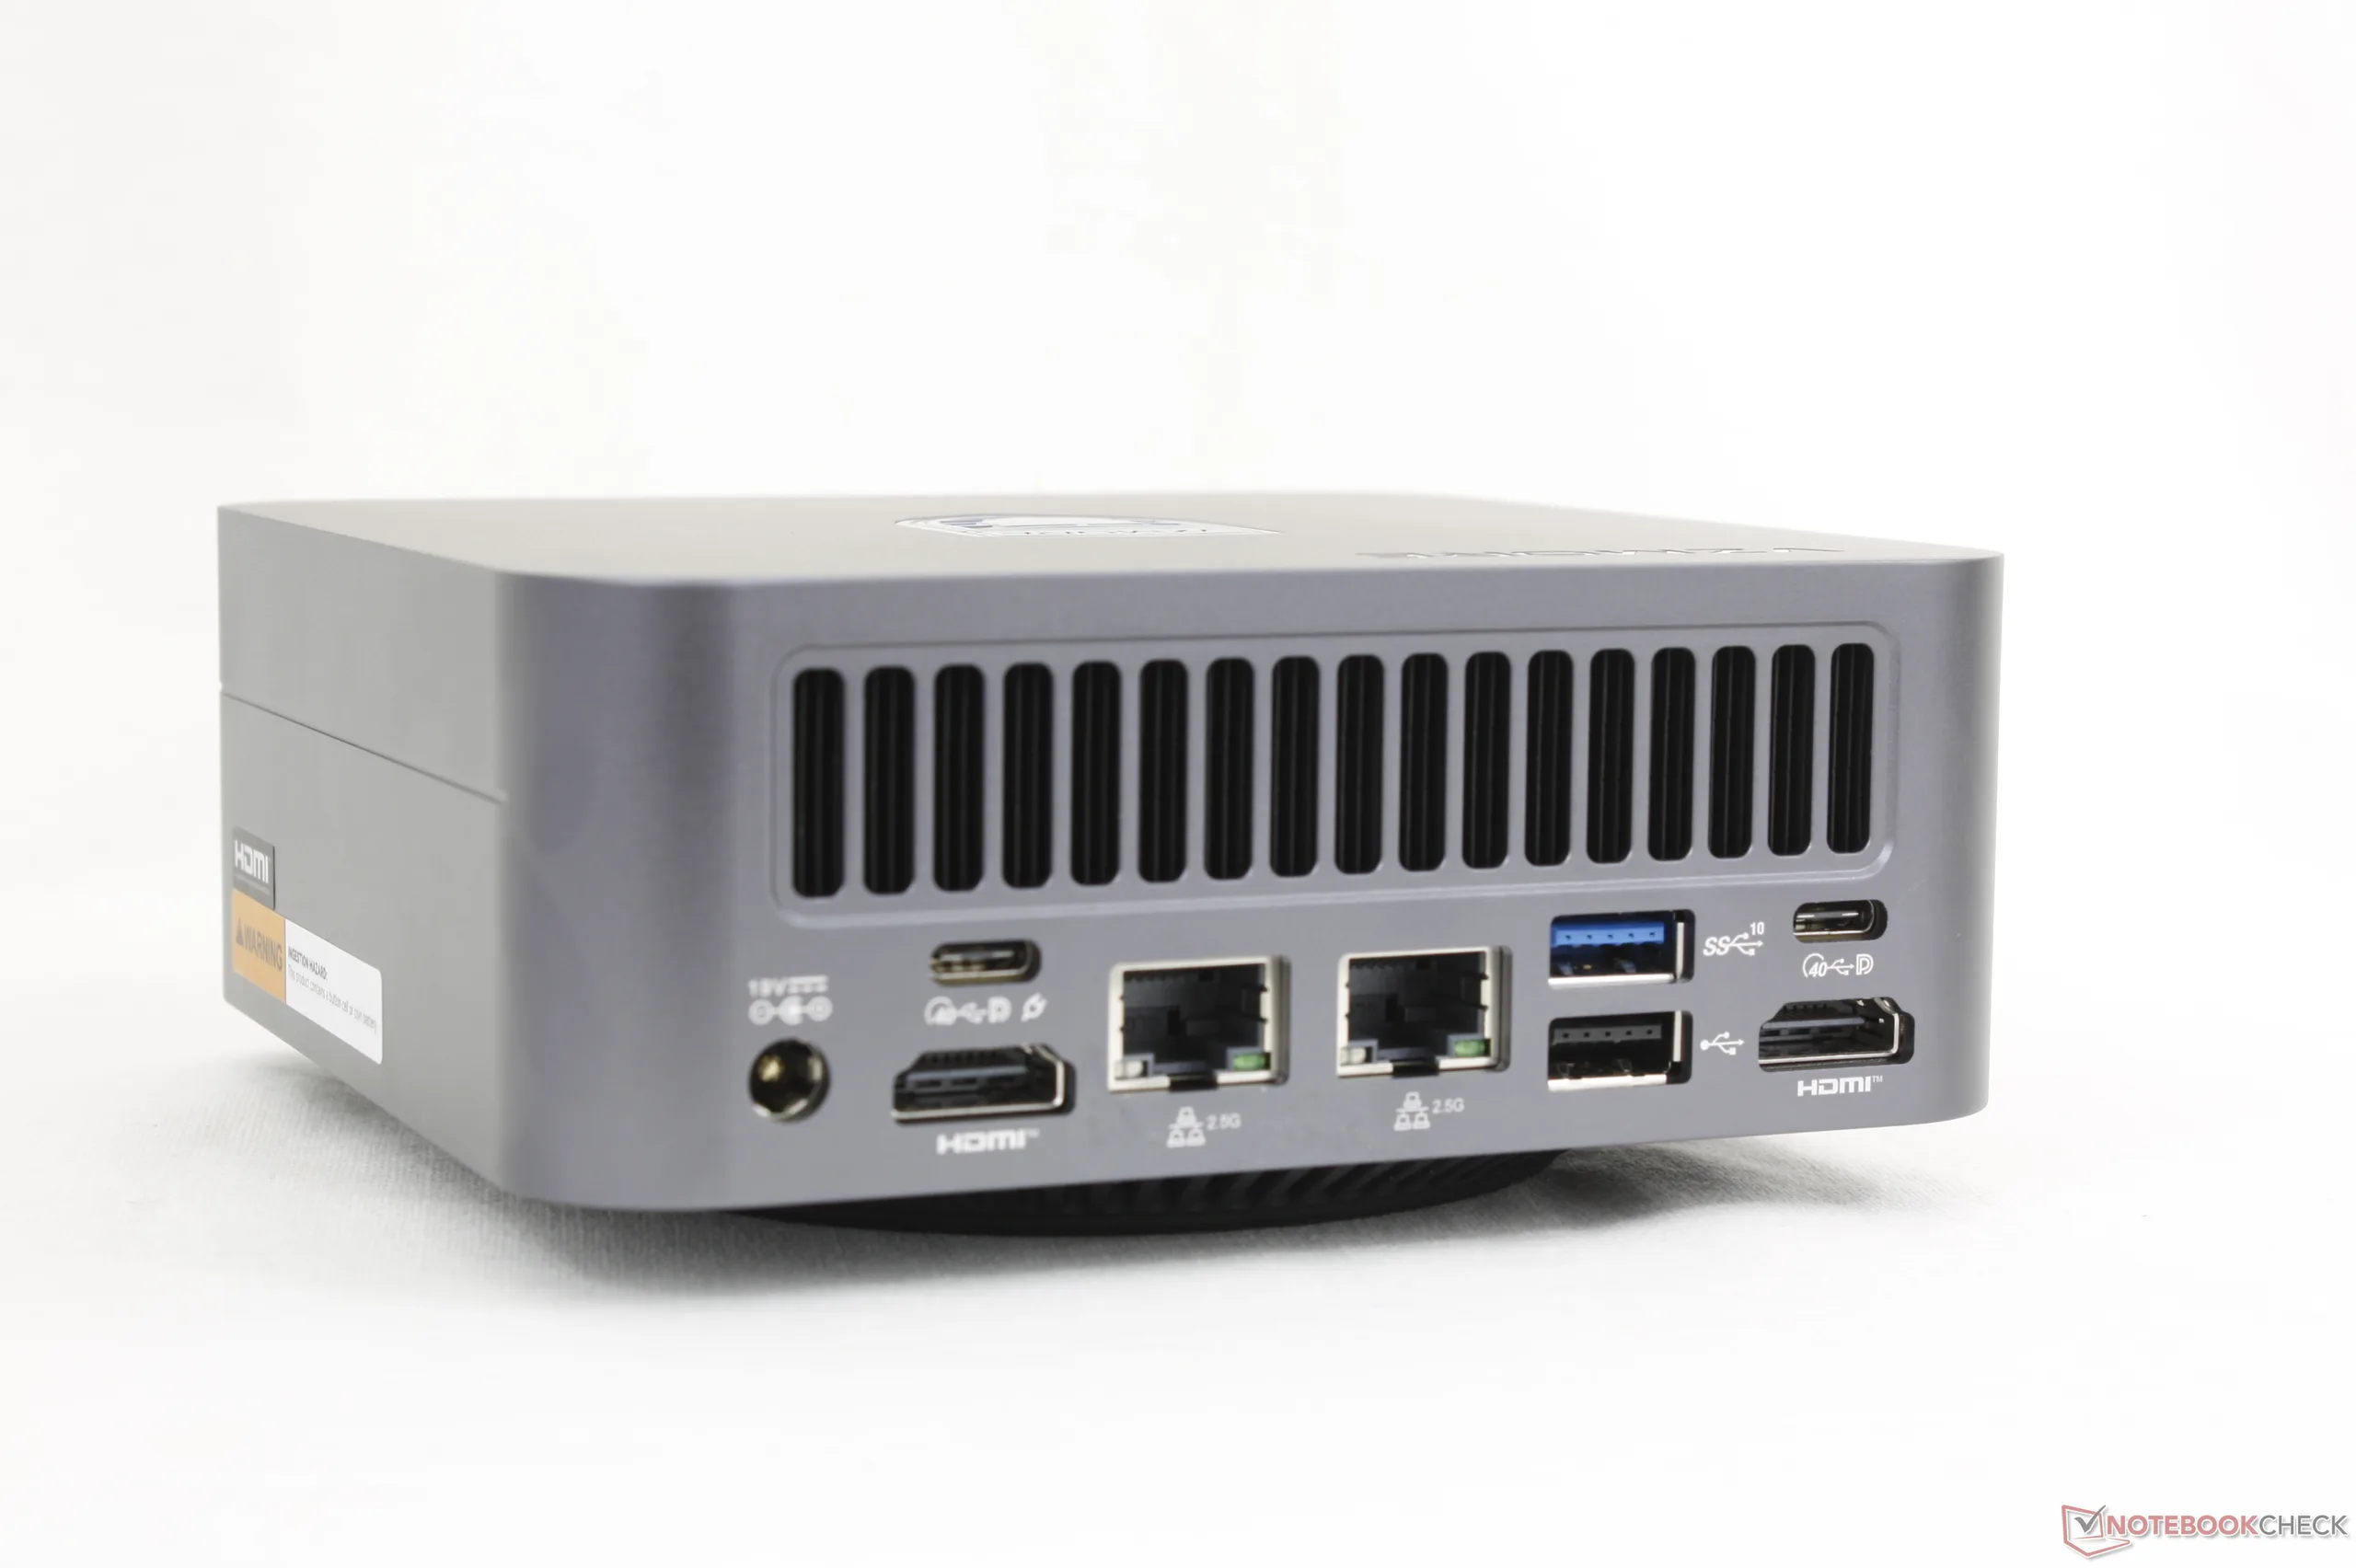
Das Gehäuse ist eindeutig vom Mac Mini inspiriert, bis hin zu den runden Lüftungsgittern an der Unterseite. Die Verarbeitungsqualität des stabilen Gehäuses aus matter Aluminiumlegierung ist dennoch ausgezeichnet.
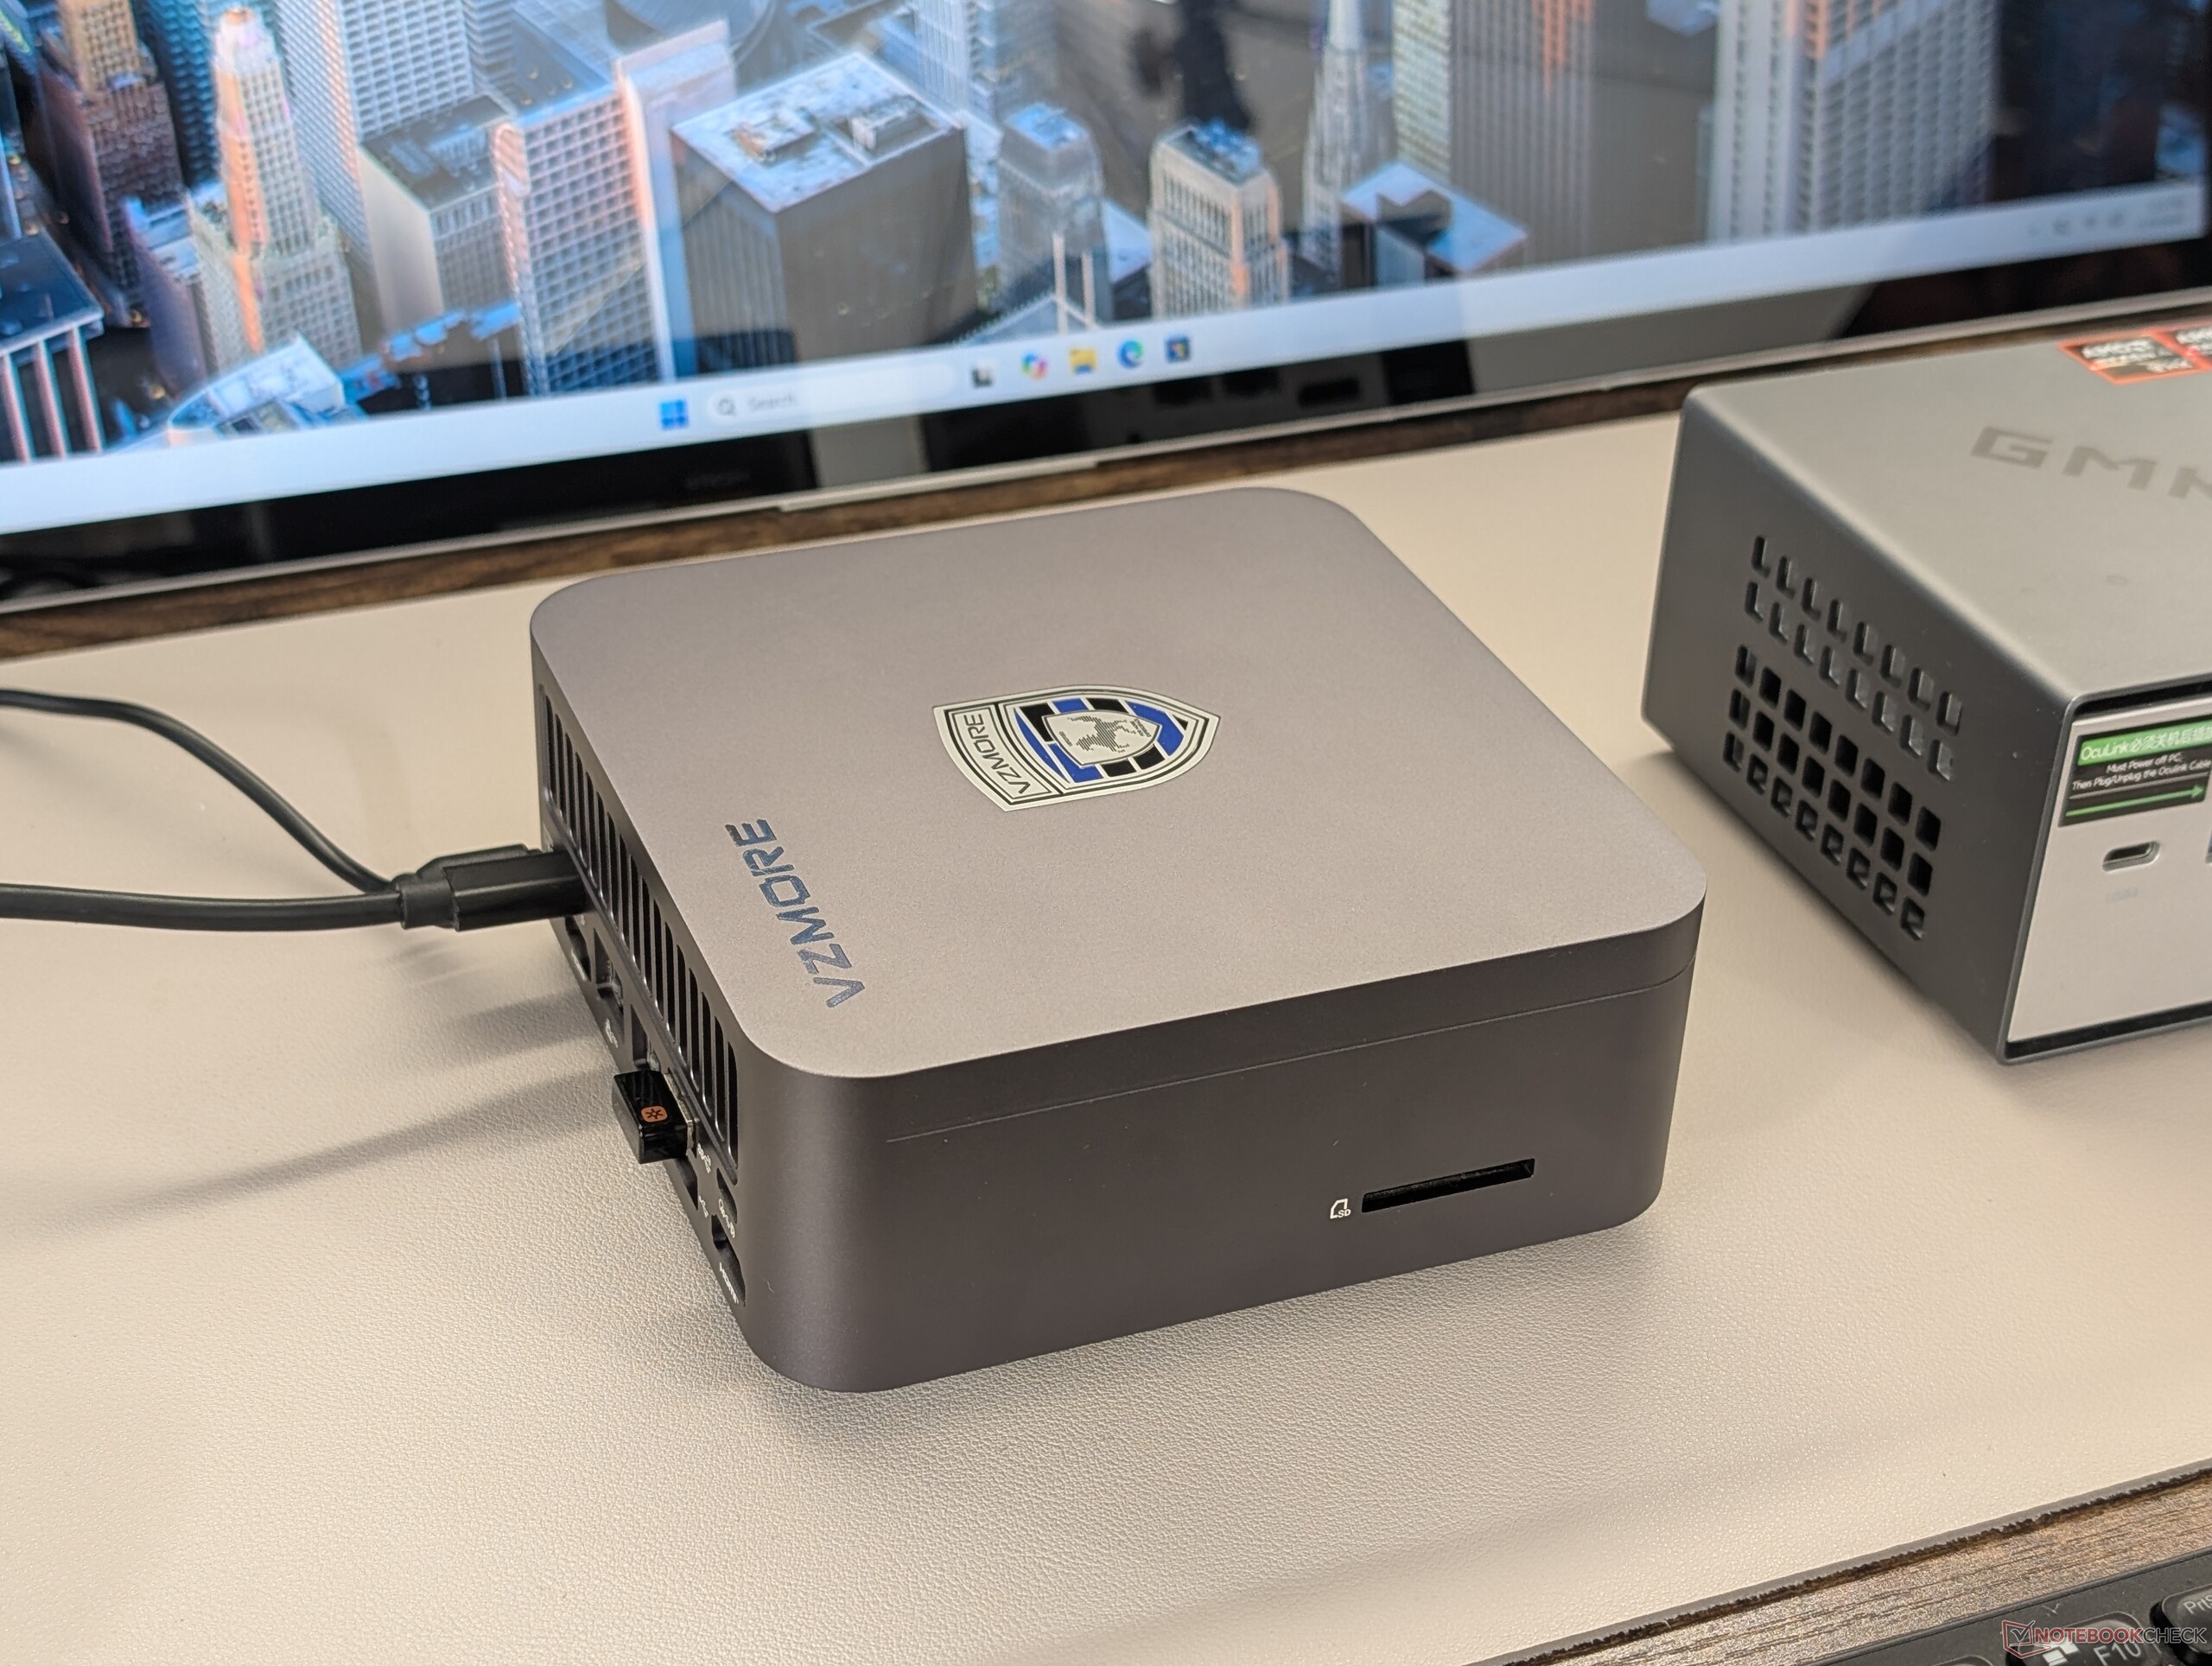
Größenvergleich

❌
187 mm 185 mm 44.5 mm 461 g158 mm 158 mm 55.8 mm 1.3 kg154 mm 152 mm 50 mm 764 g135 mm 132 mm 57.7 mm 785 g135 mm 131.8 mm 57.7 mm 805 g127 mm 127 mm 50 mm 653 g297 mm 210 mm 1 mm 5.7 g

Ausstattung

Vorne: 4x USB-A 3.2 Gen. 2 (10 Gbit/s), 3,5-mm-Headsetanschluss, Einschalttaste
Rechts: keine Anschlüsse
Hinten: Netzteilanschluss, 2x USB-C 4.0 mit DisplayPort 2.0 und 1x 100 W Power Delivery, 2x HDMI 2.0, 2x RJ-45 (2,5 Gbit/s), USB-A 2.0, USB-A 3.2 Gen. 2 (10 Gbit/s)
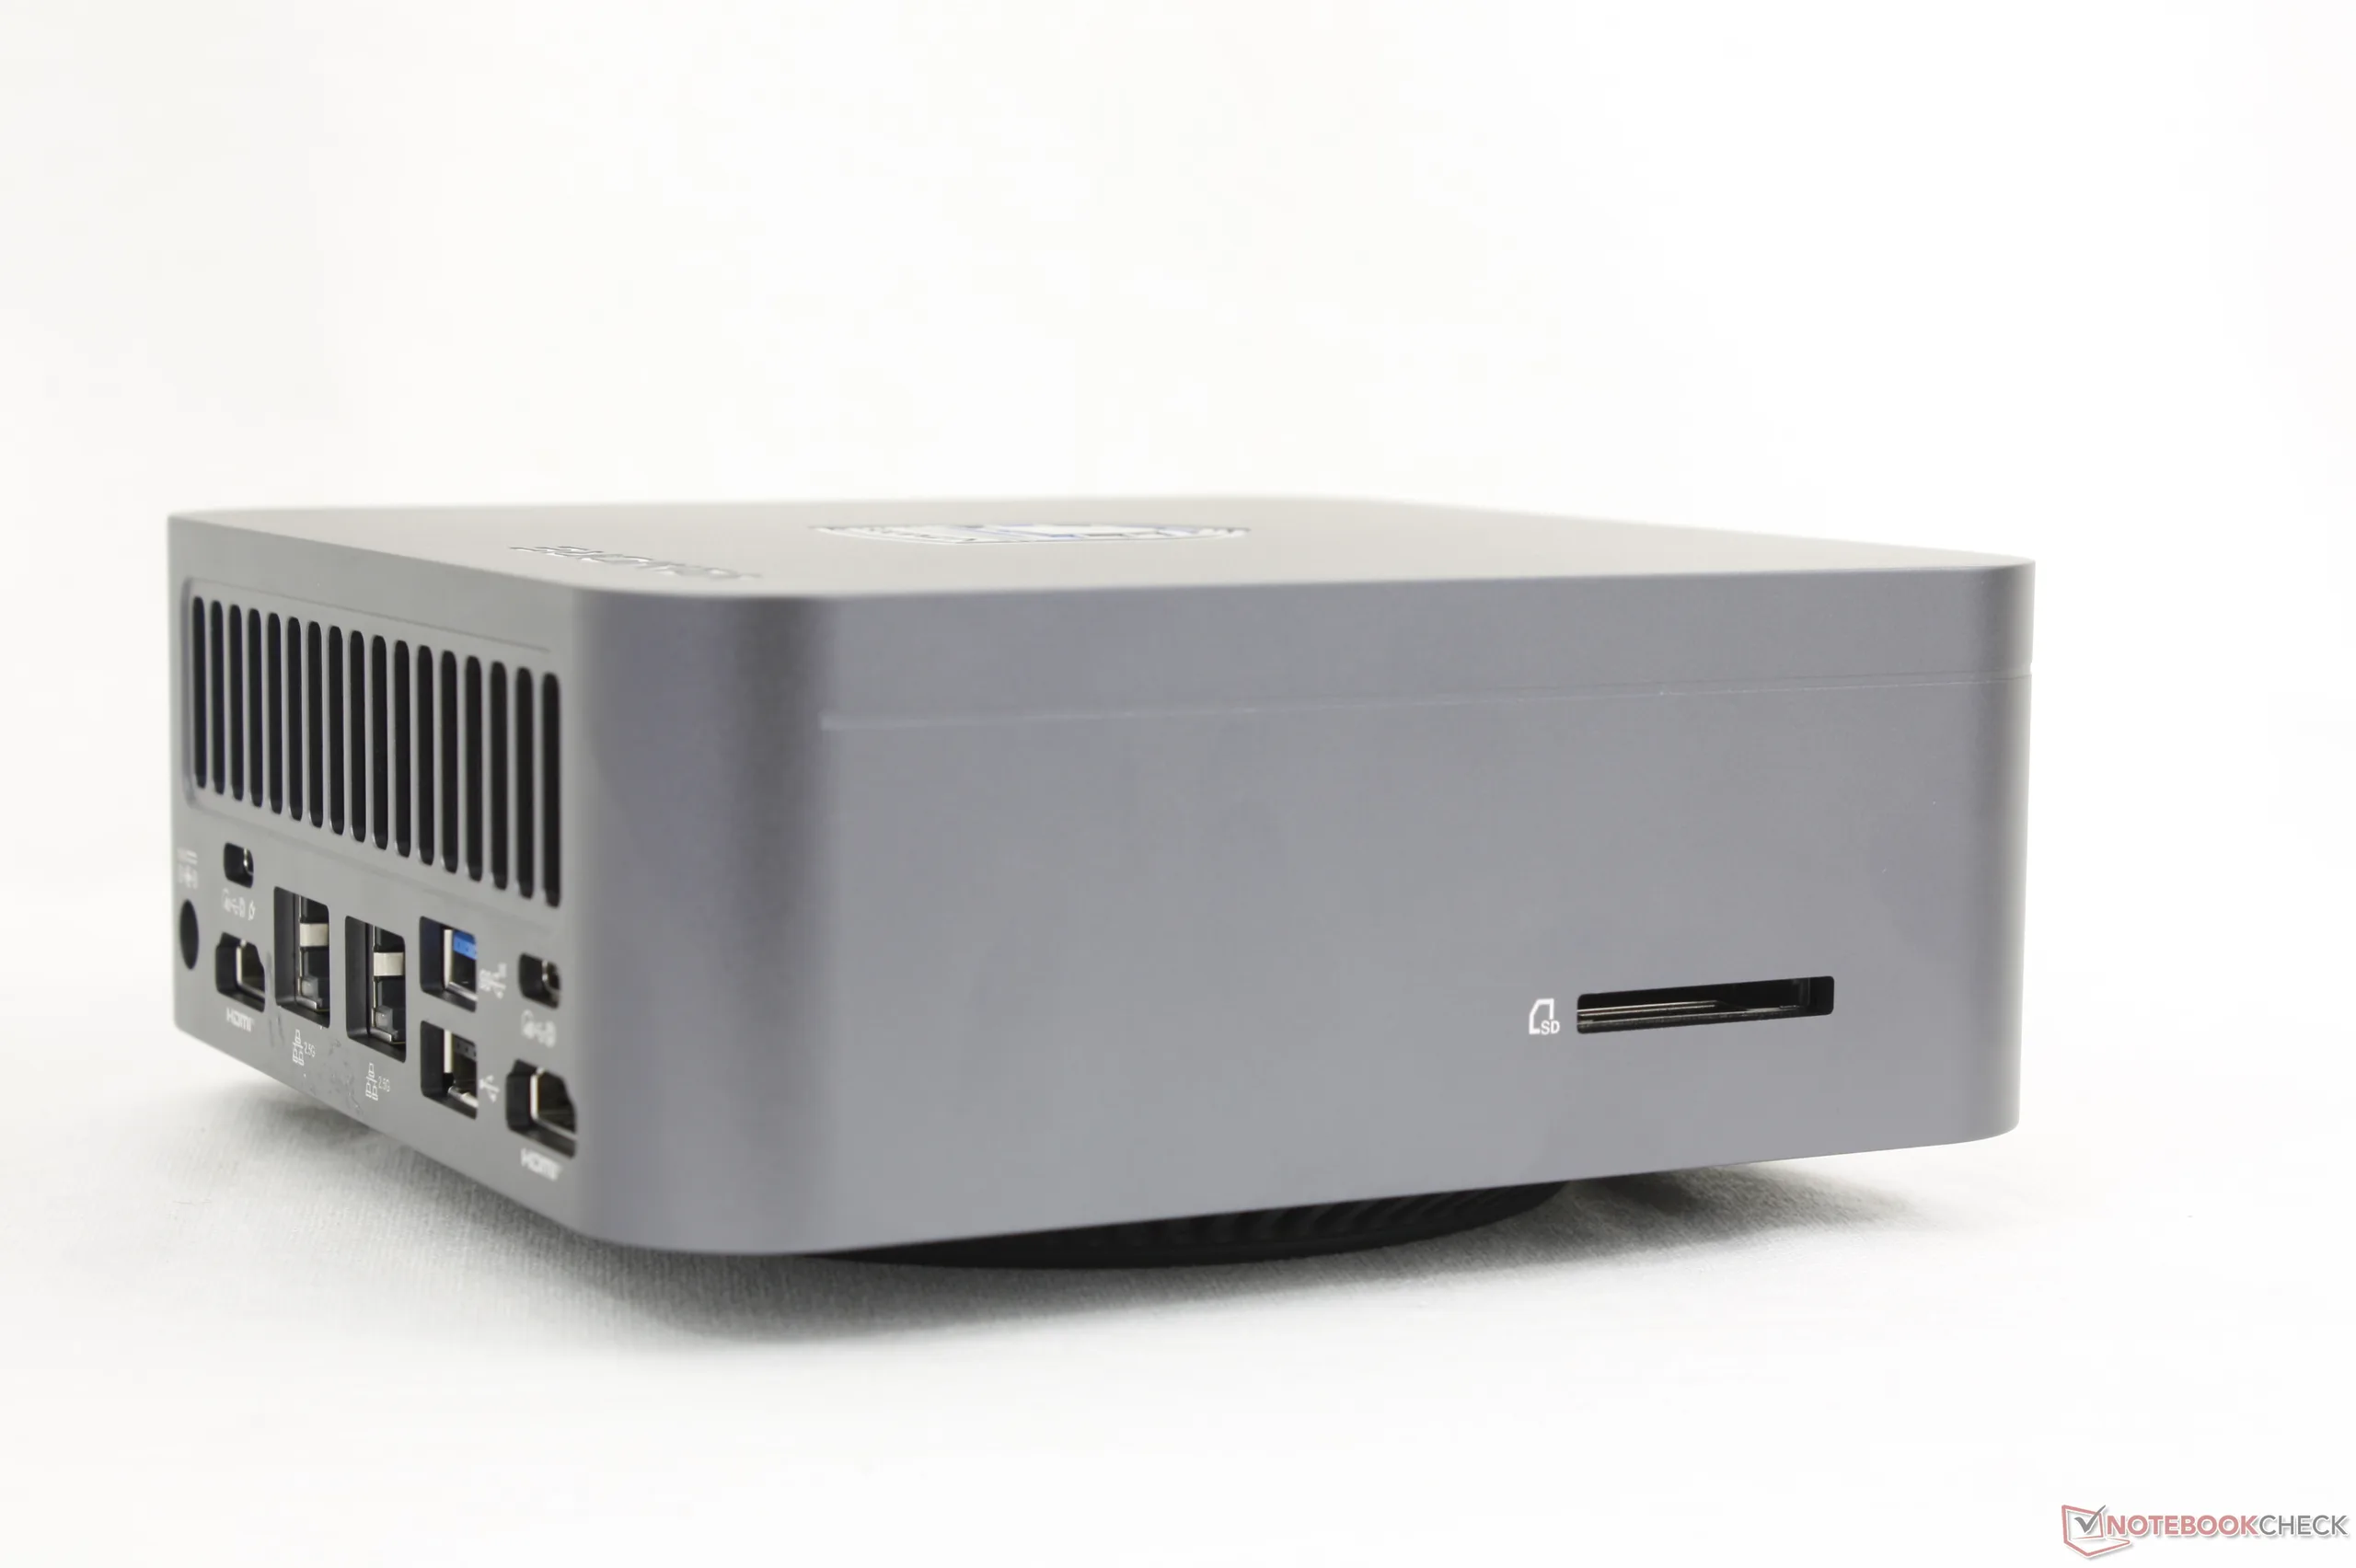
Links: SD-Kartenleser

SD-Kartenleser

SD Card Reader
average JPG Copy Test (av. of 3 runs)
Beelink GTI15 Ultra
Intel Core Ultra 9 285H (Toshiba Exceria Pro SDXC 64 GB UHS-II)
206 MB/s +15%
Vzmore iX9 Max
Intel Core Ultra 9 185H (Toshiba Exceria Pro SDXC 64 GB UHS-II)
178.4 MB/s
Vzmore AX9 Max
AMD Ryzen AI 9 HX 470 (AV Pro SD microSD 128 GB V60)
169.6 MB/s -5%
maximum AS SSD Seq Read Test (1GB)
Beelink GTI15 Ultra
Intel Core Ultra 9 285H (Toshiba Exceria Pro SDXC 64 GB UHS-II)
249.6 MB/s +9%
Vzmore iX9 Max
Intel Core Ultra 9 185H (Toshiba Exceria Pro SDXC 64 GB UHS-II)
229.6 MB/s
Vzmore AX9 Max
AMD Ryzen AI 9 HX 470 (AV Pro SD microSD 128 GB V60)
200.05 MB/s -13%

Kommunikation

Networking
iperf3 transmit Wi-Fi6/7 RT-BE96U
Vzmore iX9 Max
Mediatek Wi-Fi 7 MT7925 Wireless LAN Card
2126 (1042min - 2211max) MBit/s
Vzmore AX9 Max
Mediatek Wi-Fi 7 MT7925 Wireless LAN Card
2097 (2033min - 2173max) MBit/s -1%
Apple Mac Mini M6
Apple N1 160MHz Wi-Fi 7
1813 (1640min, 1651.89P1 - 1848max) MBit/s -15%
GMK NucBox K17
MediaTek Wi-Fi 6E MT7922 160MHz Wireless LAN Card
973 (922min - 1011max) MBit/s -54%
iperf3 receive Wi-Fi6/7 RT-BE96U
Apple Mac Mini M6
Apple N1 160MHz Wi-Fi 7
1960 (1892min, 1897.51P1 - 1995max) MBit/s +7%
Vzmore AX9 Max
Mediatek Wi-Fi 7 MT7925 Wireless LAN Card
1859 (1742min - 1965max) MBit/s +1%
Vzmore iX9 Max
Mediatek Wi-Fi 7 MT7925 Wireless LAN Card
1834 (1689min - 1875max) MBit/s
GMK NucBox K17
MediaTek Wi-Fi 6E MT7922 160MHz Wireless LAN Card
1827 (1808min - 1845max) MBit/s 0%
iperf3 receive AXE11000 6GHz
BOSGAME VTA-439
Mediatek RZ717 WiFi 7 160 MHz
1655 (1615min - 1720max) MBit/s
Beelink GTI15 Ultra
Intel Wi-Fi 7 BE200 320MHz
1090 (1026min - 1157max) MBit/s
iperf3 transmit AXE11000 6GHz
BOSGAME VTA-439
Mediatek RZ717 WiFi 7 160 MHz
1807 (1722min - 1884max) MBit/s
Beelink GTI15 Ultra
Intel Wi-Fi 7 BE200 320MHz
984 (805min - 1153max) MBit/s
01002003004005006007008009001000110012001300140015001600170018001900200021002200Tooltip
Vzmore iX9 Max; iperf3 transmit Wi-Fi6/7 RT-BE96U; iperf 3.1.3: Ø2091 (1042-2211) MBit/s
Vzmore iX9 Max; iperf3 receive Wi-Fi6/7 RT-BE96U; iperf 3.1.3: Ø1833 (1689-1875) MBit/s

Wartung

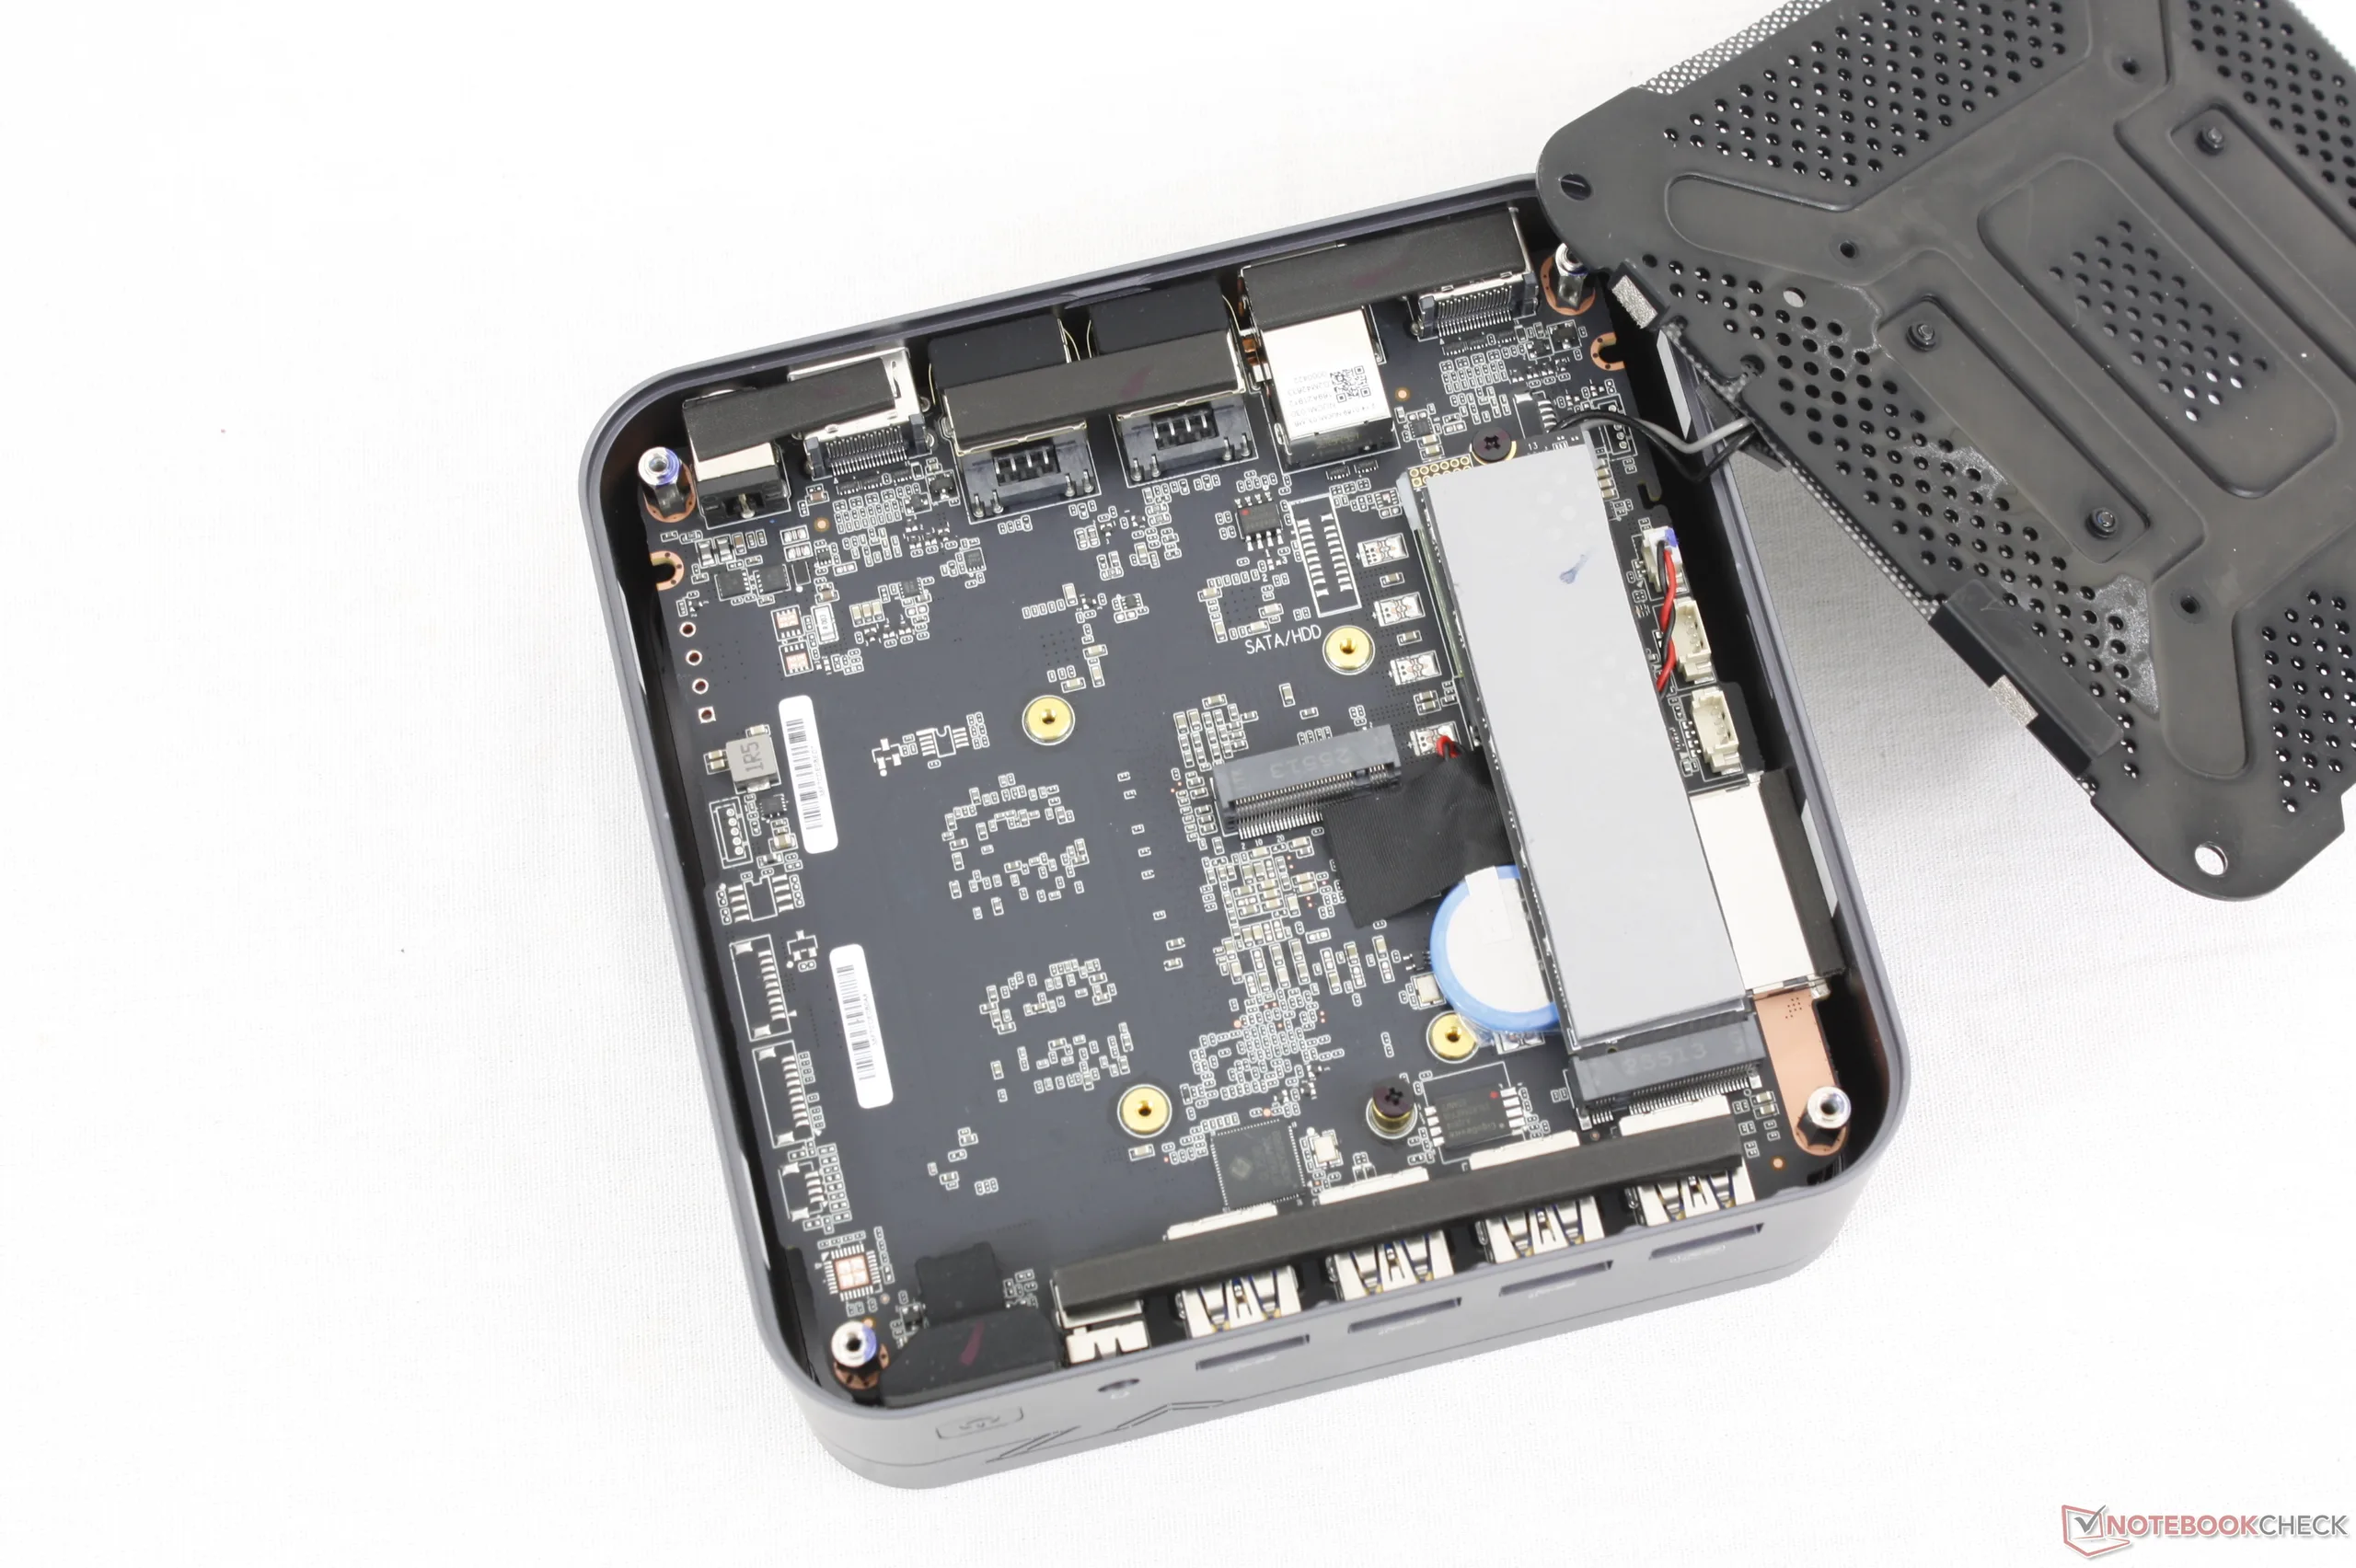
Unterstützt bis zu zwei M.2-PCIe-4-x4-SSDs (2280 + 2242)

Zubehör und Garantie

Im Lieferumfang befinden sich eine VESA-Halterung und ein HDMI-Kabel. Standardmäßig gilt eine eingeschränkte Herstellergarantie von drei Jahren, die deutlich länger ist als bei den meisten anderen Mini-PCs in den USA.

Leistung
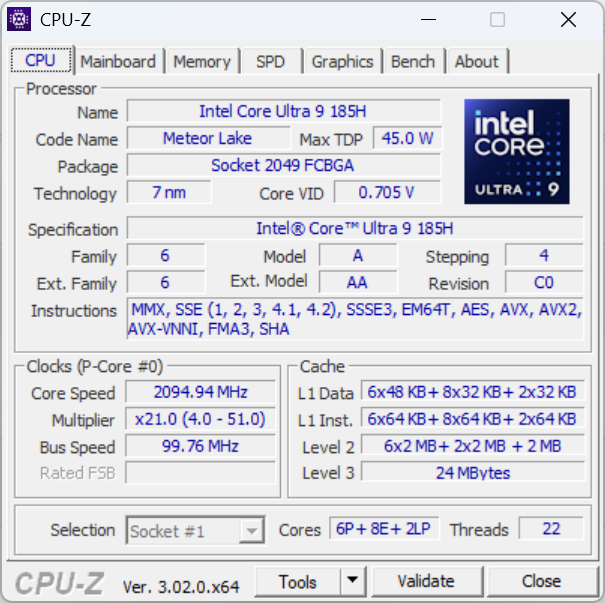
Testbedingungen

Das System wird standardmäßig im ausgeglichenen Modus ausgeliefert. Über das BIOS stehen zusätzlich die Modi 'Performance' und 'Power Saver' zur Verfügung.

Prozessorleistung

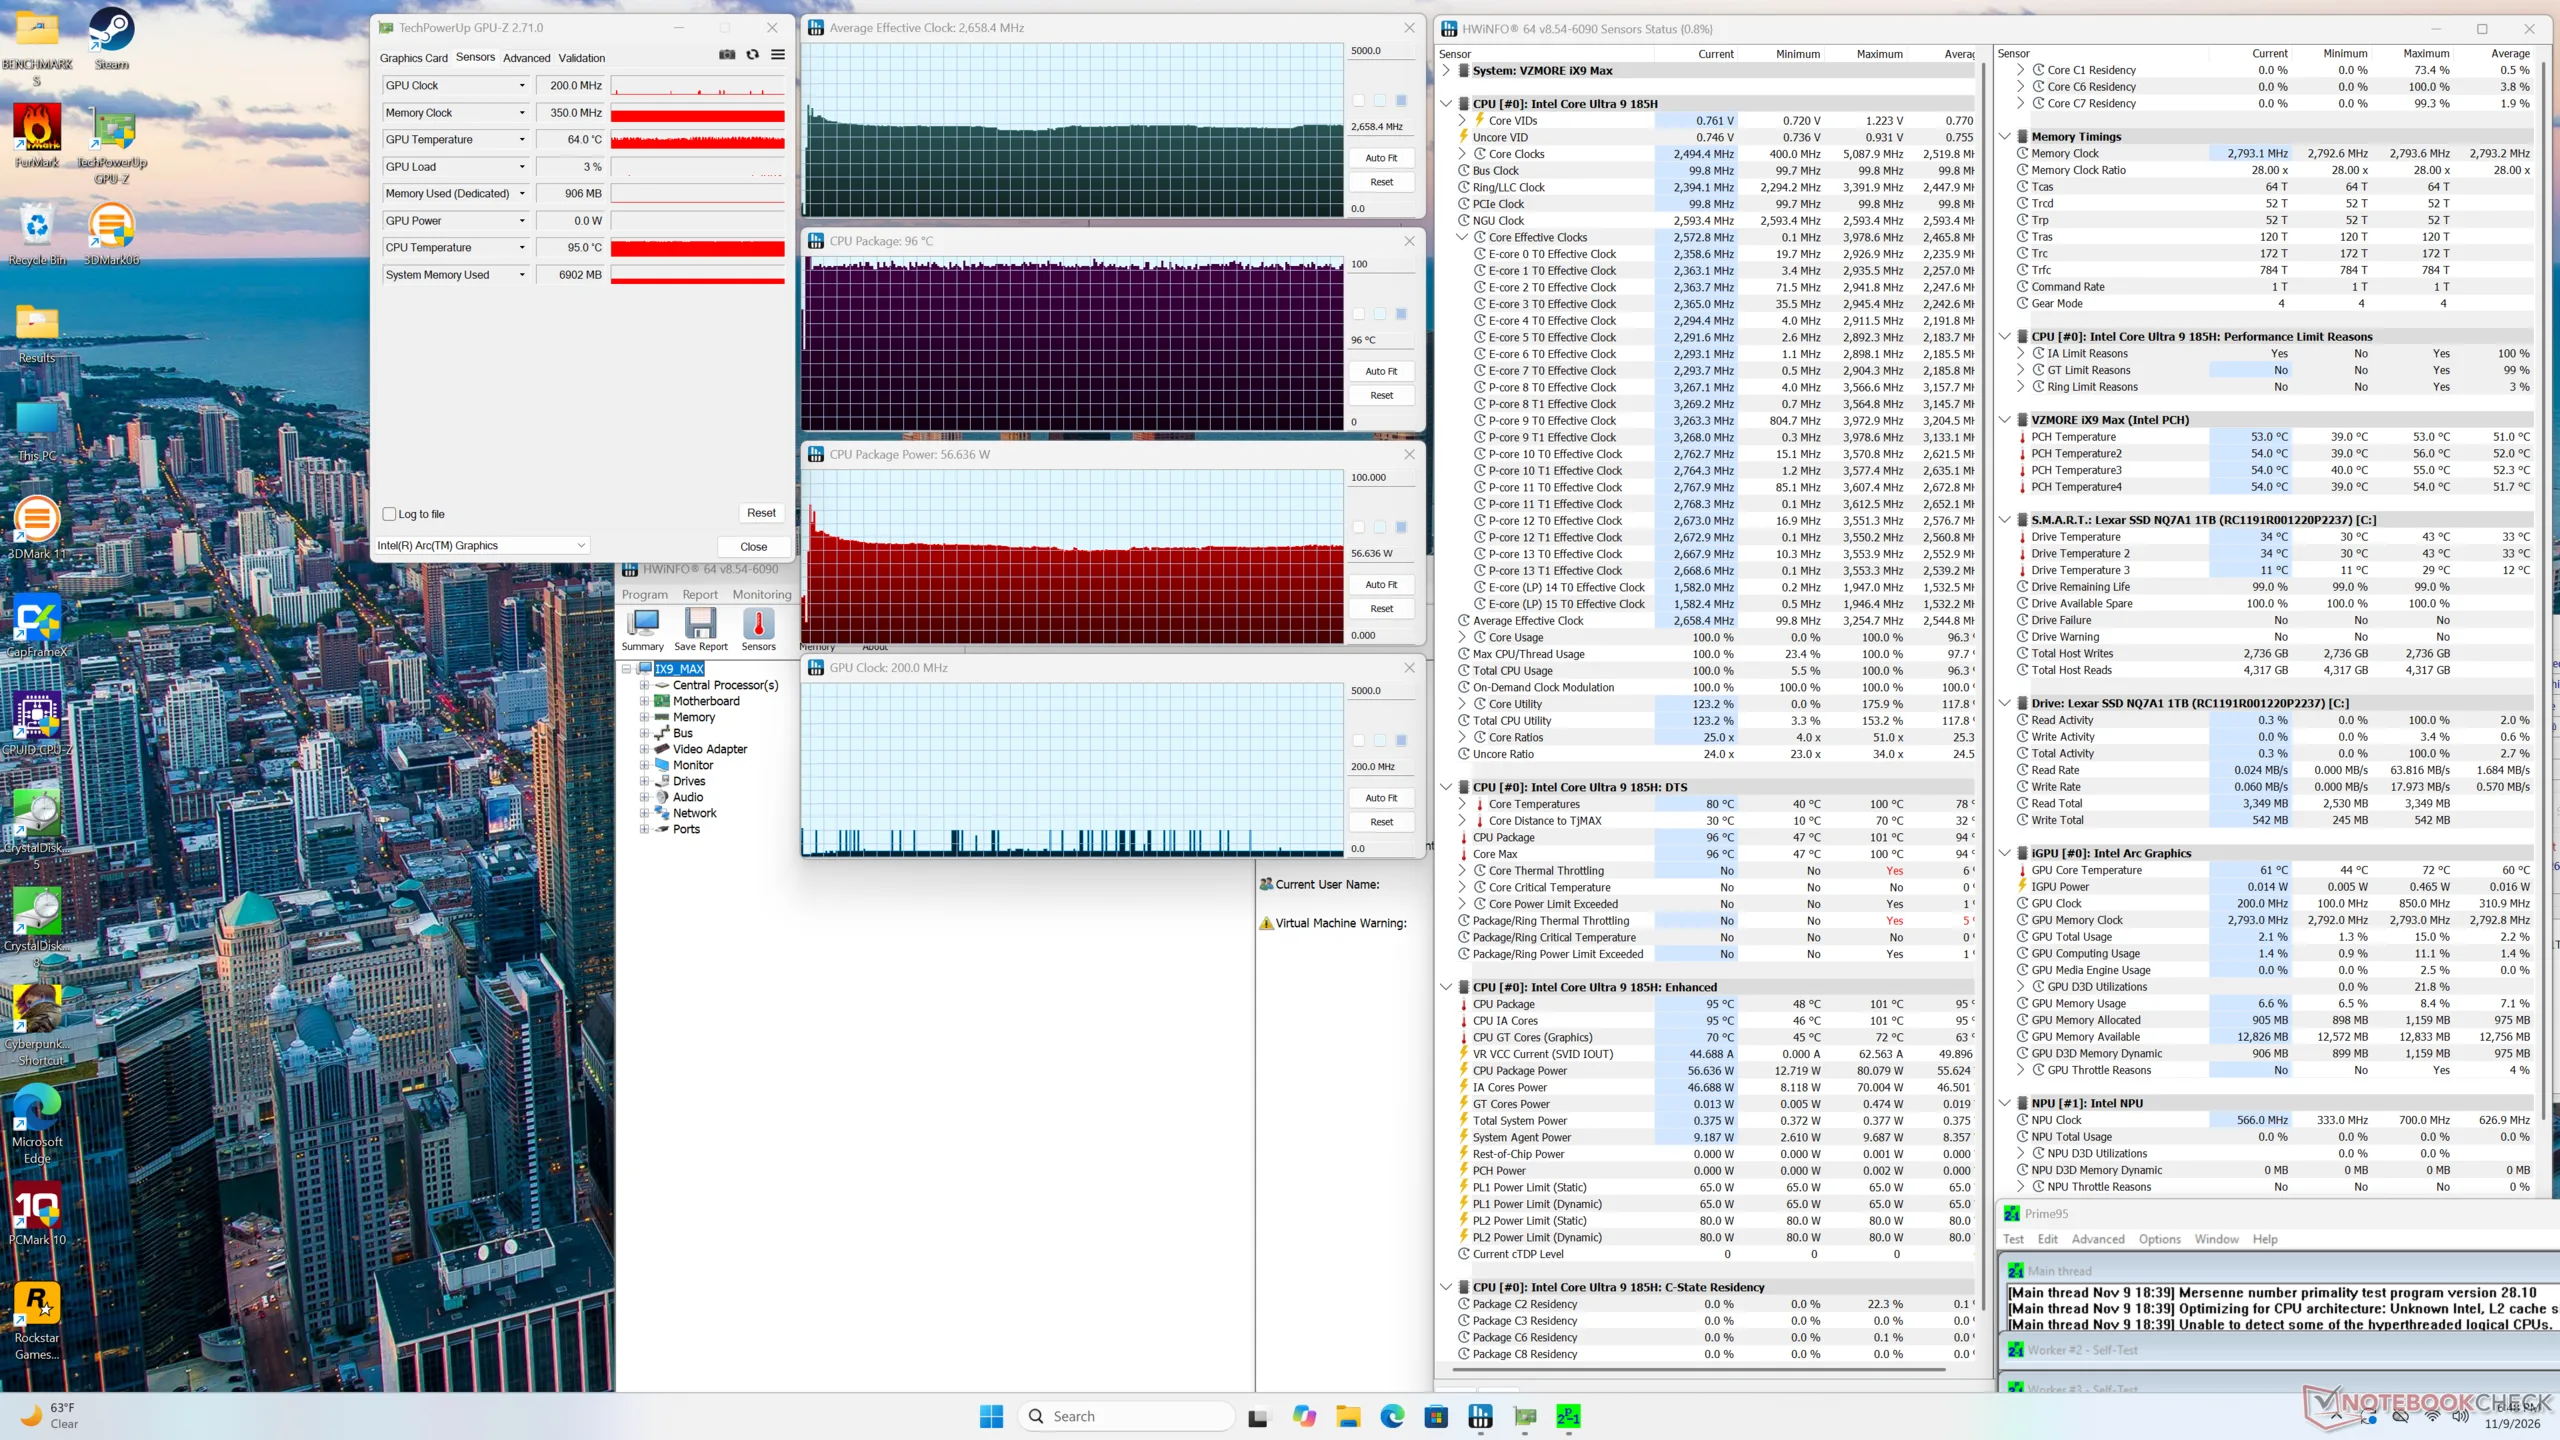
Bei anspruchsvoller Dauerlast im standardmäßigen ausgeglichenen Profil sinkt die Multi-Thread-Leistung mit der Zeit um fast 15 Prozent. Im Performance-Modus beträgt der Rückgang dagegen nur wenige Prozentpunkte, sodass der Turbo-Boost besser aufrechterhalten wird.

Cinebench R15 Multi-Dauerschleife

07515022530037545052560067575082590097510501125120012751350142515001575165017251800187519502025210021752250232524002475255026252700277528502925300030753150322533003375345035253600Tooltip
Vzmore iX9 Max Intel Core Ultra 9 185H: Ø2423 (2358.21-2804.66) Points
Vzmore AX9 Max AMD Ryzen AI 9 HX 470: Ø3405 (3205.9-3482.5) Points
Apple Mac Mini M6 Apple M6: Ø2668 (2614.55-2689.98) Points
GMK NucBox K17 Intel Core Ultra 5 226V: Ø1226 (1212.75-1232.63) Points
BOSGAME VTA-439 AMD Ryzen AI 9 HX 470: Ø3284 (3227.37-3606.53) Points
Beelink GTI15 Ultra Intel Core Ultra 9 285H: Ø2582 (2556.24-2596.05) Points
CPU Performance Rating: Percent
Cinebench 2024: CPU Multi Core | CPU Single Core
Cinebench 2026: CPU Multi | CPU Single Thread
Cinebench R23: Multi Core | Single Core
Cinebench R20: CPU (Multi Core) | CPU (Single Core)
Cinebench R15: CPU Multi 64Bit | CPU Single 64Bit
Blender: v2.79 BMW27 CPU
7-Zip 18.03: 7z b 4 | 7z b 4 -mmt1
Geekbench 7.0: Multi-Core | Single-Core
Geekbench 6.7: Multi-Core | Single-Core
HWBOT x265 Benchmark v2.2: 4k Preset
LibreOffice : 20 Documents To PDF
R Benchmark 2.5: Overall mean
CPU Performance Rating
Apple Mac Mini M6 -6!
Apple M6
82.9 pt
Minisforum MS-02 Ultra -2!
Intel Core Ultra 9 285HX
81 pt
Vzmore AX9 Max
AMD Ryzen AI 9 HX 470
64.9 pt
Minisforum M2 Pro
Intel Core Ultra X7 358H
60.5 pt
Beelink GTI15 Ultra -4!
Intel Core Ultra 9 285H
58.5 pt
MSI Cubi NUC AI+ 3MG -2!
Intel Core Ultra 9 386H
53.8 pt
Vzmore iX9 Max
Intel Core Ultra 9 185H
53.1 pt
Durchschnittliche Intel Core Ultra 9 185H
 
52.4 pt
Geekom A7 Max, R9 7940HS -2!
AMD Ryzen 9 7940HS
51.1 pt
Alliwava GH8, R9 8945HS -2!
AMD Ryzen 9 8945HS
48.5 pt
GMK NucBox K17
Intel Core Ultra 5 226V
35.5 pt
Cinebench 2024 / CPU Multi Core
Minisforum MS-02 Ultra
Intel Core Ultra 9 285HX
1936 Points +119%
Apple Mac Mini M6
Apple M6
1468 Points +66%
Vzmore AX9 Max
AMD Ryzen AI 9 HX 470
1228 Points +39%
Minisforum M2 Pro
Intel Core Ultra X7 358H
1093 Points +24%
Beelink GTI15 Ultra
Intel Core Ultra 9 285H
1031 Points +16%
Durchschnittliche Intel Core Ultra 9 185H
  (642 - 1096, n=14)
947 Points +7%
MSI Cubi NUC AI+ 3MG
Intel Core Ultra 9 386H
940 Points +6%
Vzmore iX9 Max
Intel Core Ultra 9 185H
885 Points
Geekom A7 Max, R9 7940HS
AMD Ryzen 9 7940HS
849 Points -4%
Alliwava GH8, R9 8945HS
AMD Ryzen 9 8945HS
838 Points -5%
GMK NucBox K17
Intel Core Ultra 5 226V
523 Points -41%
Cinebench 2024 / CPU Single Core
Apple Mac Mini M6
Apple M6
221 Points +108%
Minisforum MS-02 Ultra
Intel Core Ultra 9 285HX
135 Points +27%
Beelink GTI15 Ultra
Intel Core Ultra 9 285H
124.8 Points +17%
Minisforum M2 Pro
Intel Core Ultra X7 358H
123 Points +16%
Vzmore AX9 Max
AMD Ryzen AI 9 HX 470
121 Points +14%
MSI Cubi NUC AI+ 3MG
Intel Core Ultra 9 386H
118.1 Points +11%
GMK NucBox K17
Intel Core Ultra 5 226V
115 Points +8%
Durchschnittliche Intel Core Ultra 9 185H
  (98 - 112.2, n=14)
106.6 Points 0%
Vzmore iX9 Max
Intel Core Ultra 9 185H
106.3 Points
Geekom A7 Max, R9 7940HS
AMD Ryzen 9 7940HS
106 Points 0%
Alliwava GH8, R9 8945HS
AMD Ryzen 9 8945HS
101 Points -5%
Cinebench 2026 / CPU Multi
Minisforum MS-02 Ultra
Intel Core Ultra 9 285HX
7738 Points +109%
Apple Mac Mini M6
Apple M6
5636 Points +52%
Vzmore AX9 Max
AMD Ryzen AI 9 HX 470
5048 Points +37%
Minisforum M2 Pro
Intel Core Ultra X7 358H
4406 Points +19%
MSI Cubi NUC AI+ 3MG
Intel Core Ultra 9 386H
3799 Points +3%
Vzmore iX9 Max
Intel Core Ultra 9 185H
3696 Points
Geekom A7 Max, R9 7940HS
AMD Ryzen 9 7940HS
3478 Points -6%
Alliwava GH8, R9 8945HS
AMD Ryzen 9 8945HS
3419 Points -7%
Durchschnittliche Intel Core Ultra 9 185H
  (2733 - 3696, n=4)
3370 Points -9%
GMK NucBox K17
Intel Core Ultra 5 226V
1470 Points -60%
Cinebench 2026 / CPU Single Thread
Apple Mac Mini M6
Apple M6
814 Points +91%
Minisforum MS-02 Ultra
Intel Core Ultra 9 285HX
529 Points +24%
Minisforum M2 Pro
Intel Core Ultra X7 358H
506 Points +19%
Vzmore AX9 Max
AMD Ryzen AI 9 HX 470
494 Points +16%
MSI Cubi NUC AI+ 3MG
Intel Core Ultra 9 386H
486 Points +14%
Geekom A7 Max, R9 7940HS
AMD Ryzen 9 7940HS
435 Points +2%
Vzmore iX9 Max
Intel Core Ultra 9 185H
427 Points
Durchschnittliche Intel Core Ultra 9 185H
  (395 - 429, n=4)
415 Points -3%
Alliwava GH8, R9 8945HS
AMD Ryzen 9 8945HS
410 Points -4%
GMK NucBox K17
Intel Core Ultra 5 226V
209 Points -51%
Cinebench R23 / Multi Core
Minisforum MS-02 Ultra
Intel Core Ultra 9 285HX
37694 Points +113%
Vzmore AX9 Max
AMD Ryzen AI 9 HX 470
23415 Points +32%
Apple Mac Mini M6
Apple M6
20239 Points +14%
Minisforum M2 Pro
Intel Core Ultra X7 358H
19916 Points +13%
Beelink GTI15 Ultra
Intel Core Ultra 9 285H
17995 (17785.9min - 17994.8max) Points +2%
Vzmore iX9 Max
Intel Core Ultra 9 185H
17700 (14982.2min - 17699.9max) Points
Durchschnittliche Intel Core Ultra 9 185H
  (11072 - 19851, n=23)
17273 Points -2%
MSI Cubi NUC AI+ 3MG
Intel Core Ultra 9 386H
17015 (15002.4min - 17015.3max) Points -4%
Geekom A7 Max, R9 7940HS
AMD Ryzen 9 7940HS
16142 Points -9%
Alliwava GH8, R9 8945HS
AMD Ryzen 9 8945HS
14816 Points -16%
GMK NucBox K17
Intel Core Ultra 5 226V
8665 Points -51%
Cinebench R23 / Single Core
Apple Mac Mini M6
Apple M6
2697 Points +51%
Minisforum MS-02 Ultra
Intel Core Ultra 9 285HX
2303 Points +29%
Vzmore AX9 Max
AMD Ryzen AI 9 HX 470
2078 Points +16%
Beelink GTI15 Ultra
Intel Core Ultra 9 285H
2071 Points +16%
Minisforum M2 Pro
Intel Core Ultra X7 358H
2045 Points +14%
MSI Cubi NUC AI+ 3MG
Intel Core Ultra 9 386H
2010 Points +12%
GMK NucBox K17
Intel Core Ultra 5 226V
1859 Points +4%
Geekom A7 Max, R9 7940HS
AMD Ryzen 9 7940HS
1794 Points 0%
Vzmore iX9 Max
Intel Core Ultra 9 185H
1788 Points
Durchschnittliche Intel Core Ultra 9 185H
  (1166 - 1912, n=23)
1778 Points -1%
Alliwava GH8, R9 8945HS
AMD Ryzen 9 8945HS
1691 Points -5%
Cinebench R20 / CPU (Multi Core)
Minisforum MS-02 Ultra
Intel Core Ultra 9 285HX
14915 Points +122%
Vzmore AX9 Max
AMD Ryzen AI 9 HX 470
8899 Points +32%
Minisforum M2 Pro
Intel Core Ultra X7 358H
7729 Points +15%
Beelink GTI15 Ultra
Intel Core Ultra 9 285H
7014 Points +4%
Vzmore iX9 Max
Intel Core Ultra 9 185H
6733 Points
MSI Cubi NUC AI+ 3MG
Intel Core Ultra 9 386H
6724 Points 0%
Durchschnittliche Intel Core Ultra 9 185H
  (4198 - 7651, n=23)
6662 Points -1%
Geekom A7 Max, R9 7940HS
AMD Ryzen 9 7940HS
6486 Points -4%
Alliwava GH8, R9 8945HS
AMD Ryzen 9 8945HS
5812 Points -14%
Apple Mac Mini M6
Apple M6
5223 Points -22%
GMK NucBox K17
Intel Core Ultra 5 226V
3380 Points -50%
Cinebench R20 / CPU (Single Core)
Minisforum MS-02 Ultra
Intel Core Ultra 9 285HX
884 Points +27%
Vzmore AX9 Max
AMD Ryzen AI 9 HX 470
814 Points +17%
Beelink GTI15 Ultra
Intel Core Ultra 9 285H
793 Points +14%
Minisforum M2 Pro
Intel Core Ultra X7 358H
770 Points +10%
MSI Cubi NUC AI+ 3MG
Intel Core Ultra 9 386H
767 Points +10%
GMK NucBox K17
Intel Core Ultra 5 226V
714 Points +2%
Vzmore iX9 Max
Intel Core Ultra 9 185H
698 Points
Geekom A7 Max, R9 7940HS
AMD Ryzen 9 7940HS
690 Points -1%
Durchschnittliche Intel Core Ultra 9 185H
  (442 - 735, n=23)
684 Points -2%
Apple Mac Mini M6
Apple M6
672 Points -4%
Alliwava GH8, R9 8945HS
AMD Ryzen 9 8945HS
652 Points -7%
Cinebench R15 / CPU Multi 64Bit
Minisforum MS-02 Ultra
Intel Core Ultra 9 285HX
5686 Points +103%
Vzmore AX9 Max
AMD Ryzen AI 9 HX 470
3501 Points +25%
Minisforum M2 Pro
Intel Core Ultra X7 358H
3058 Points +9%
Vzmore iX9 Max
Intel Core Ultra 9 185H
2805 (2358.21min - 2804.66max) Points
MSI Cubi NUC AI+ 3MG
Intel Core Ultra 9 386H
2792 (2352.8min - 2791.74max) Points 0%
Apple Mac Mini M6
Apple M6
2694 (2615min - 2694max) Points -4%
Durchschnittliche Intel Core Ultra 9 185H
  (1582 - 3165, n=25)
2684 Points -4%
Geekom A7 Max, R9 7940HS
AMD Ryzen 9 7940HS
2608 Points -7%
Beelink GTI15 Ultra
Intel Core Ultra 9 285H
2596 (2556.24min - 2596.05max) Points -7%
Alliwava GH8, R9 8945HS
AMD Ryzen 9 8945HS
2293 Points -18%
GMK NucBox K17
Intel Core Ultra 5 226V
1253 Points -55%
Cinebench R15 / CPU Single 64Bit
Apple Mac Mini M6
Apple M6
371 Points +39%
Minisforum MS-02 Ultra
Intel Core Ultra 9 285HX
340 Points +27%
Vzmore AX9 Max
AMD Ryzen AI 9 HX 470
317 Points +19%
Beelink GTI15 Ultra
Intel Core Ultra 9 285H
309 Points +16%
Minisforum M2 Pro
Intel Core Ultra X7 358H
295 Points +10%
Geekom A7 Max, R9 7940HS
AMD Ryzen 9 7940HS
282 Points +6%
GMK NucBox K17
Intel Core Ultra 5 226V
282 Points +6%
MSI Cubi NUC AI+ 3MG
Intel Core Ultra 9 386H
276 Points +3%
Alliwava GH8, R9 8945HS
AMD Ryzen 9 8945HS
268 Points 0%
Vzmore iX9 Max
Intel Core Ultra 9 185H
267 Points
Durchschnittliche Intel Core Ultra 9 185H
  (191.9 - 281, n=23)
262 Points -2%
Blender / v2.79 BMW27 CPU
GMK NucBox K17
Intel Core Ultra 5 226V
387 Seconds * -96%
Alliwava GH8, R9 8945HS
AMD Ryzen 9 8945HS
220 Seconds * -12%
MSI Cubi NUC AI+ 3MG
Intel Core Ultra 9 386H
210 Seconds * -7%
Geekom A7 Max, R9 7940HS
AMD Ryzen 9 7940HS
201 Seconds * -2%
Vzmore iX9 Max
Intel Core Ultra 9 185H
197 Seconds *
Durchschnittliche Intel Core Ultra 9 185H
  (163 - 285, n=23)
196.3 Seconds * -0%
Beelink GTI15 Ultra
Intel Core Ultra 9 285H
185 Seconds * +6%
Minisforum M2 Pro
Intel Core Ultra X7 358H
181 Seconds * +8%
Vzmore AX9 Max
AMD Ryzen AI 9 HX 470
149 Seconds * +24%
Minisforum MS-02 Ultra
Intel Core Ultra 9 285HX
94 Seconds * +52%
7-Zip 18.03 / 7z b 4
Minisforum MS-02 Ultra
Intel Core Ultra 9 285HX
109822 MIPS +68%
Vzmore AX9 Max
AMD Ryzen AI 9 HX 470
83307 MIPS +27%
Durchschnittliche Intel Core Ultra 9 185H
  (51289 - 76331, n=23)
67835 MIPS +4%
Minisforum M2 Pro
Intel Core Ultra X7 358H
67406 MIPS +3%
Vzmore iX9 Max
Intel Core Ultra 9 185H
65474 MIPS
Alliwava GH8, R9 8945HS
AMD Ryzen 9 8945HS
63882 MIPS -2%
Geekom A7 Max, R9 7940HS
AMD Ryzen 9 7940HS
63459 MIPS -3%
Beelink GTI15 Ultra
Intel Core Ultra 9 285H
61940 MIPS -5%
MSI Cubi NUC AI+ 3MG
Intel Core Ultra 9 386H
57560 MIPS -12%
GMK NucBox K17
Intel Core Ultra 5 226V
31083 MIPS -53%
7-Zip 18.03 / 7z b 4 -mmt1
Minisforum MS-02 Ultra
Intel Core Ultra 9 285HX
6666 MIPS +22%
Geekom A7 Max, R9 7940HS
AMD Ryzen 9 7940HS
6619 MIPS +21%
Vzmore AX9 Max
AMD Ryzen AI 9 HX 470
6518 MIPS +19%
Alliwava GH8, R9 8945HS
AMD Ryzen 9 8945HS
6287 MIPS +15%
Beelink GTI15 Ultra
Intel Core Ultra 9 285H
6164 MIPS +13%
Minisforum M2 Pro
Intel Core Ultra X7 358H
6140 MIPS +12%
MSI Cubi NUC AI+ 3MG
Intel Core Ultra 9 386H
5488 MIPS 0%
Vzmore iX9 Max
Intel Core Ultra 9 185H
5462 MIPS
GMK NucBox K17
Intel Core Ultra 5 226V
5452 MIPS 0%
Durchschnittliche Intel Core Ultra 9 185H
  (4199 - 5781, n=23)
5411 MIPS -1%
Geekbench 7.0 / Multi-Core
Apple Mac Mini M6
Apple M6
22569 Points +53%
Minisforum M2 Pro
Intel Core Ultra X7 358H
17804 Points +20%
Vzmore AX9 Max
AMD Ryzen AI 9 HX 470
17336 Points +17%
Vzmore iX9 Max
Intel Core Ultra 9 185H
14780 Points
Durchschnittliche Intel Core Ultra 9 185H
  (14628 - 14780, n=2)
14704 Points -1%
GMK NucBox K17
Intel Core Ultra 5 226V
6196 Points -58%
Geekbench 7.0 / Single-Core
Apple Mac Mini M6
Apple M6
4091 Points +89%
Vzmore AX9 Max
AMD Ryzen AI 9 HX 470
2661 Points +23%
Minisforum M2 Pro
Intel Core Ultra X7 358H
2576 Points +19%
Durchschnittliche Intel Core Ultra 9 185H
  (2170 - 2222, n=2)
2196 Points +1%
Vzmore iX9 Max
Intel Core Ultra 9 185H
2170 Points
GMK NucBox K17
Intel Core Ultra 5 226V
1106 Points -49%
Geekbench 6.7 / Multi-Core
Apple Mac Mini M6
Apple M6
21302 Points +59%
Minisforum MS-02 Ultra
Intel Core Ultra 9 285HX
18328 Points +37%
Minisforum M2 Pro
Intel Core Ultra X7 358H
16338 Points +22%
Vzmore AX9 Max
AMD Ryzen AI 9 HX 470
15499 Points +16%
Beelink GTI15 Ultra
Intel Core Ultra 9 285H
15284 Points +14%
MSI Cubi NUC AI+ 3MG
Intel Core Ultra 9 386H
14323 Points +7%
Durchschnittliche Intel Core Ultra 9 185H
  (9140 - 14540, n=23)
13459 Points 0%
Vzmore iX9 Max
Intel Core Ultra 9 185H
13408 Points
Alliwava GH8, R9 8945HS
AMD Ryzen 9 8945HS
11516 Points -14%
Geekom A7 Max, R9 7940HS
AMD Ryzen 9 7940HS
9922 Points -26%
GMK NucBox K17
Intel Core Ultra 5 226V
9100 Points -32%
Geekbench 6.7 / Single-Core
Apple Mac Mini M6
Apple M6
4698 Points +92%
Minisforum MS-02 Ultra
Intel Core Ultra 9 285HX
3046 Points +25%
Vzmore AX9 Max
AMD Ryzen AI 9 HX 470
2920 Points +19%
Beelink GTI15 Ultra
Intel Core Ultra 9 285H
2878 Points +18%
Minisforum M2 Pro
Intel Core Ultra X7 358H
2848 Points +16%
MSI Cubi NUC AI+ 3MG
Intel Core Ultra 9 386H
2778 Points +14%
GMK NucBox K17
Intel Core Ultra 5 226V
2619 Points +7%
Geekom A7 Max, R9 7940HS
AMD Ryzen 9 7940HS
2607 Points +7%
Alliwava GH8, R9 8945HS
AMD Ryzen 9 8945HS
2534 Points +4%
Vzmore iX9 Max
Intel Core Ultra 9 185H
2445 Points
Durchschnittliche Intel Core Ultra 9 185H
  (1490 - 2573, n=23)
2420 Points -1%
HWBOT x265 Benchmark v2.2 / 4k Preset
Minisforum MS-02 Ultra
Intel Core Ultra 9 285HX
36.8 fps +89%
Vzmore AX9 Max
AMD Ryzen AI 9 HX 470
26.7 fps +37%
Minisforum M2 Pro
Intel Core Ultra X7 358H
22.4 fps +15%
Beelink GTI15 Ultra
Intel Core Ultra 9 285H
21.4 fps +10%
MSI Cubi NUC AI+ 3MG
Intel Core Ultra 9 386H
19.5 fps 0%
Vzmore iX9 Max
Intel Core Ultra 9 185H
19.5 fps
Durchschnittliche Intel Core Ultra 9 185H
  (13.7 - 22.7, n=23)
19.5 fps 0%
Geekom A7 Max, R9 7940HS
AMD Ryzen 9 7940HS
18.5 fps -5%
Alliwava GH8, R9 8945HS
AMD Ryzen 9 8945HS
17.8 fps -9%
GMK NucBox K17
Intel Core Ultra 5 226V
10.9 fps -44%
LibreOffice / 20 Documents To PDF
GMK NucBox K17
Intel Core Ultra 5 226V
62.1 s * -43%
Alliwava GH8, R9 8945HS
AMD Ryzen 9 8945HS
55.8 s * -29%
Geekom A7 Max, R9 7940HS
AMD Ryzen 9 7940HS
54.4 s * -26%
MSI Cubi NUC AI+ 3MG
Intel Core Ultra 9 386H
54.3 s * -25%
Vzmore AX9 Max
AMD Ryzen AI 9 HX 470
52.9 s * -22%
Minisforum M2 Pro
Intel Core Ultra X7 358H
50.1 s * -16%
Minisforum MS-02 Ultra
Intel Core Ultra 9 285HX
49.1 s * -13%
Durchschnittliche Intel Core Ultra 9 185H
  (34.5 - 73.5, n=23)
47.2 s * -9%
Vzmore iX9 Max
Intel Core Ultra 9 185H
43.3 s *
Beelink GTI15 Ultra
Intel Core Ultra 9 285H
40.8 s * +6%
R Benchmark 2.5 / Overall mean
Alliwava GH8, R9 8945HS
AMD Ryzen 9 8945HS
0.4798 sec * -2%
GMK NucBox K17
Intel Core Ultra 5 226V
0.4746 sec * -0%
Vzmore iX9 Max
Intel Core Ultra 9 185H
0.4725 sec *
Durchschnittliche Intel Core Ultra 9 185H
  (0.4313 - 0.759, n=24)
0.4713 sec * -0%
Minisforum MS-02 Ultra
Intel Core Ultra 9 285HX
0.4444 sec * +6%
Geekom A7 Max, R9 7940HS
AMD Ryzen 9 7940HS
0.4429 sec * +6%
Beelink GTI15 Ultra
Intel Core Ultra 9 285H
0.4372 sec * +7%
MSI Cubi NUC AI+ 3MG
Intel Core Ultra 9 386H
0.4326 sec * +8%
Minisforum M2 Pro
Intel Core Ultra X7 358H
0.4237 sec * +10%
Vzmore AX9 Max
AMD Ryzen AI 9 HX 470
0.4011 sec * +15%

* ... kleinere Werte sind besser

Cinebench R15 CPU Multi 64Bit
2805 Points
Cinebench R15 OpenGL 64Bit
142.2 fps
Cinebench R15 Ref. Match 64Bit
97.8 %
Cinebench R15 CPU Single 64Bit
267 Points
Cinebench R20 CPU (Multi Core)
6733 Points
Cinebench R20 CPU (Single Core)
698 Points
Cinebench R23 Multi Core
17700 Points
Cinebench R23 Single Core
1788 Points
Cinebench 2024 CPU Single Core
106.3 Points
Cinebench 2024 CPU Multi Core
885 Points
Cinebench 2026 CPU Multi
3696 Points
Cinebench 2026 CPU Single Thread
427 Points
Hilfe
Performance Rating
Vzmore AX9 Max
AMD Ryzen AI 9 HX 470, Radeon 890M
97.1 pt
BOSGAME VTA-439 -1!
AMD Ryzen AI 9 HX 470, Radeon 890M
92.4 pt
Durchschnittliche Intel Core Ultra 9 185H
 
66.4 pt
Beelink GTI15 Ultra
Intel Core Ultra 9 285H, Arc 140T
65.3 pt
Vzmore iX9 Max -1!
Intel Core Ultra 9 185H, Arc 8-Core
61.6 pt
GMK NucBox K17
Intel Core Ultra 5 226V, Arc 130V
38.6 pt
AIDA64 / FP32 Ray-Trace
Vzmore AX9 Max
AMD Ryzen AI 9 HX 470, Radeon 890M (v6.92.6600)
36728 KRay/s +147%
Vzmore AX9 Max
AMD Ryzen AI 9 HX 470, Radeon 890M (v8.20.8100)
36672 KRay/s +147%
BOSGAME VTA-439
AMD Ryzen AI 9 HX 470, Radeon 890M (v8.20.8100)
34100 KRay/s +129%
Beelink GTI15 Ultra
Intel Core Ultra 9 285H, Arc 140T (v6.92.6600)
18930 KRay/s +27%
Durchschnittliche Intel Core Ultra 9 185H
  (9220 - 18676, n=25)
15702 KRay/s +6%
Vzmore iX9 Max
Intel Core Ultra 9 185H, Arc 8-Core (v8.20.8100)
14865 KRay/s
GMK NucBox K17
Intel Core Ultra 5 226V, Arc 130V (v6.92.6600)
9508 KRay/s -36%
GMK NucBox K17
Intel Core Ultra 5 226V, Arc 130V (v8.20.8100)
9335 KRay/s -37%
AIDA64 / FPU Julia
Vzmore AX9 Max
AMD Ryzen AI 9 HX 470, Radeon 890M (v8.20.8100)
150506 Points +101%
Vzmore AX9 Max
AMD Ryzen AI 9 HX 470, Radeon 890M (v6.92.6600)
142204 Points +90%
BOSGAME VTA-439
AMD Ryzen AI 9 HX 470, Radeon 890M (v8.20.8100)
137653 Points +84%
Beelink GTI15 Ultra
Intel Core Ultra 9 285H, Arc 140T (v6.92.6600)
95675 Points +28%
Durchschnittliche Intel Core Ultra 9 185H
  (48865 - 96463, n=25)
81944 Points +10%
Vzmore iX9 Max
Intel Core Ultra 9 185H, Arc 8-Core (v8.20.8100)
74730 Points
GMK NucBox K17
Intel Core Ultra 5 226V, Arc 130V (v8.20.8100)
48424 Points -35%
GMK NucBox K17
Intel Core Ultra 5 226V, Arc 130V (v6.92.6600)
48320 Points -35%
AIDA64 / CPU SHA3
Vzmore AX9 Max
AMD Ryzen AI 9 HX 470, Radeon 890M (v6.92.6600)
5702 MB/s +57%
Vzmore AX9 Max
AMD Ryzen AI 9 HX 470, Radeon 890M (v8.20.8100)
5542 MB/s +52%
BOSGAME VTA-439
AMD Ryzen AI 9 HX 470, Radeon 890M (v8.20.8100)
5313 MB/s +46%
Beelink GTI15 Ultra
Intel Core Ultra 9 285H, Arc 140T (v6.92.6600)
4397 MB/s +21%
Durchschnittliche Intel Core Ultra 9 185H
  (2394 - 4534, n=25)
3862 MB/s +6%
Vzmore iX9 Max
Intel Core Ultra 9 185H, Arc 8-Core (v8.20.8100)
3638 MB/s
GMK NucBox K17
Intel Core Ultra 5 226V, Arc 130V (v8.20.8100)
2202 MB/s -39%
GMK NucBox K17
Intel Core Ultra 5 226V, Arc 130V (v6.92.6600)
2197 MB/s -40%
AIDA64 / CPU Queen
Vzmore AX9 Max
AMD Ryzen AI 9 HX 470, Radeon 890M (v6.92.6600)
100099 Points
Durchschnittliche Intel Core Ultra 9 185H
  (66785 - 95241, n=22)
87074 Points
Beelink GTI15 Ultra
Intel Core Ultra 9 285H, Arc 140T (v6.92.6600)
53557 Points
GMK NucBox K17
Intel Core Ultra 5 226V, Arc 130V (v6.92.6600)
47070 Points
AIDA64 / FPU SinJulia
Vzmore AX9 Max
AMD Ryzen AI 9 HX 470, Radeon 890M (v8.20.8100)
19100 Points +87%
Vzmore AX9 Max
AMD Ryzen AI 9 HX 470, Radeon 890M (v6.92.6600)
18420 Points +80%
BOSGAME VTA-439
AMD Ryzen AI 9 HX 470, Radeon 890M (v8.20.8100)
18758 Points +84%
Durchschnittliche Intel Core Ultra 9 185H
  (7255 - 11392, n=25)
10316 Points +1%
Vzmore iX9 Max
Intel Core Ultra 9 185H, Arc 8-Core (v8.20.8100)
10209 Points
Beelink GTI15 Ultra
Intel Core Ultra 9 285H, Arc 140T (v6.92.6600)
8187 Points -20%
GMK NucBox K17
Intel Core Ultra 5 226V, Arc 130V (v8.20.8100)
3921 Points -62%
GMK NucBox K17
Intel Core Ultra 5 226V, Arc 130V (v6.92.6600)
3915 Points -62%
AIDA64 / FPU Mandel
Vzmore AX9 Max
AMD Ryzen AI 9 HX 470, Radeon 890M (v6.92.6600)
75934 Points +93%
Vzmore AX9 Max
AMD Ryzen AI 9 HX 470, Radeon 890M (v8.20.8100)
75678 Points +92%
BOSGAME VTA-439
AMD Ryzen AI 9 HX 470, Radeon 890M (v8.20.8100)
66899 Points +70%
Beelink GTI15 Ultra
Intel Core Ultra 9 285H, Arc 140T (v6.92.6600)
50451 Points +28%
Durchschnittliche Intel Core Ultra 9 185H
  (24004 - 48020, n=25)
40438 Points +3%
Vzmore iX9 Max
Intel Core Ultra 9 185H, Arc 8-Core (v8.20.8100)
39336 Points
GMK NucBox K17
Intel Core Ultra 5 226V, Arc 130V (v6.92.6600)
25349 Points -36%
GMK NucBox K17
Intel Core Ultra 5 226V, Arc 130V (v8.20.8100)
25323 Points -36%
AIDA64 / CPU AES
Durchschnittliche Intel Core Ultra 9 185H
  (53116 - 154066, n=25)
86557 MB/s +12%
Vzmore AX9 Max
AMD Ryzen AI 9 HX 470, Radeon 890M (v8.20.8100)
82029 MB/s +6%
Vzmore AX9 Max
AMD Ryzen AI 9 HX 470, Radeon 890M (v6.92.6600)
81071 MB/s +5%
BOSGAME VTA-439
AMD Ryzen AI 9 HX 470, Radeon 890M (v8.20.8100)
80897 MB/s +5%
Vzmore iX9 Max
Intel Core Ultra 9 185H, Arc 8-Core (v8.20.8100)
77333 MB/s
Beelink GTI15 Ultra
Intel Core Ultra 9 285H, Arc 140T (v6.92.6600)
64670 MB/s -16%
GMK NucBox K17
Intel Core Ultra 5 226V, Arc 130V (v6.92.6600)
34228 MB/s -56%
GMK NucBox K17
Intel Core Ultra 5 226V, Arc 130V (v8.20.8100)
34222 MB/s -56%
AIDA64 / CPU ZLib
Vzmore AX9 Max
AMD Ryzen AI 9 HX 470, Radeon 890M (v6.92.6600)
1497 MB/s +34%
Vzmore AX9 Max
AMD Ryzen AI 9 HX 470, Radeon 890M (v8.20.8100)
1483 MB/s +33%
BOSGAME VTA-439
AMD Ryzen AI 9 HX 470, Radeon 890M (v8.20.8100)
1434 MB/s +28%
Durchschnittliche Intel Core Ultra 9 185H
  (678 - 1341, n=25)
1131 MB/s +1%
Vzmore iX9 Max
Intel Core Ultra 9 185H, Arc 8-Core (v8.20.8100)
1119 MB/s
Beelink GTI15 Ultra
Intel Core Ultra 9 285H, Arc 140T (v6.92.6600)
1057 MB/s -6%
GMK NucBox K17
Intel Core Ultra 5 226V, Arc 130V (v6.92.6600)
521 MB/s -53%
GMK NucBox K17
Intel Core Ultra 5 226V, Arc 130V (v8.20.8100)
516 MB/s -54%
AIDA64 / FP64 Ray-Trace
Vzmore AX9 Max
AMD Ryzen AI 9 HX 470, Radeon 890M (v6.92.6600)
19973 KRay/s +150%
Vzmore AX9 Max
AMD Ryzen AI 9 HX 470, Radeon 890M (v8.20.8100)
18903 KRay/s +137%
BOSGAME VTA-439
AMD Ryzen AI 9 HX 470, Radeon 890M (v8.20.8100)
17949 KRay/s +125%
Beelink GTI15 Ultra
Intel Core Ultra 9 285H, Arc 140T (v6.92.6600)
10447 KRay/s +31%
Durchschnittliche Intel Core Ultra 9 185H
  (4428 - 10078, n=25)
8243 KRay/s +3%
Vzmore iX9 Max
Intel Core Ultra 9 185H, Arc 8-Core (v8.20.8100)
7990 KRay/s
GMK NucBox K17
Intel Core Ultra 5 226V, Arc 130V (v6.92.6600)
5165 KRay/s -35%
GMK NucBox K17
Intel Core Ultra 5 226V, Arc 130V (v8.20.8100)
5133 KRay/s -36%
AIDA64 / CPU PhotoWorxx
Beelink GTI15 Ultra
Intel Core Ultra 9 285H, Arc 140T (v6.92.6600)
55590 MPixel/s +10%
GMK NucBox K17
Intel Core Ultra 5 226V, Arc 130V (v8.20.8100)
51770 MPixel/s +3%
GMK NucBox K17
Intel Core Ultra 5 226V, Arc 130V (v6.92.6600)
46620 MPixel/s -8%
Vzmore iX9 Max
Intel Core Ultra 9 185H, Arc 8-Core (v8.20.8100)
50433 MPixel/s
BOSGAME VTA-439
AMD Ryzen AI 9 HX 470, Radeon 890M (v8.20.8100)
49148 MPixel/s -3%
Durchschnittliche Intel Core Ultra 9 185H
  (44547 - 53918, n=25)
48786 MPixel/s -3%
Vzmore AX9 Max
AMD Ryzen AI 9 HX 470, Radeon 890M (v8.20.8100)
48679 MPixel/s -3%
Vzmore AX9 Max
AMD Ryzen AI 9 HX 470, Radeon 890M (v6.92.6600)
47464 MPixel/s -6%

Systemleistung

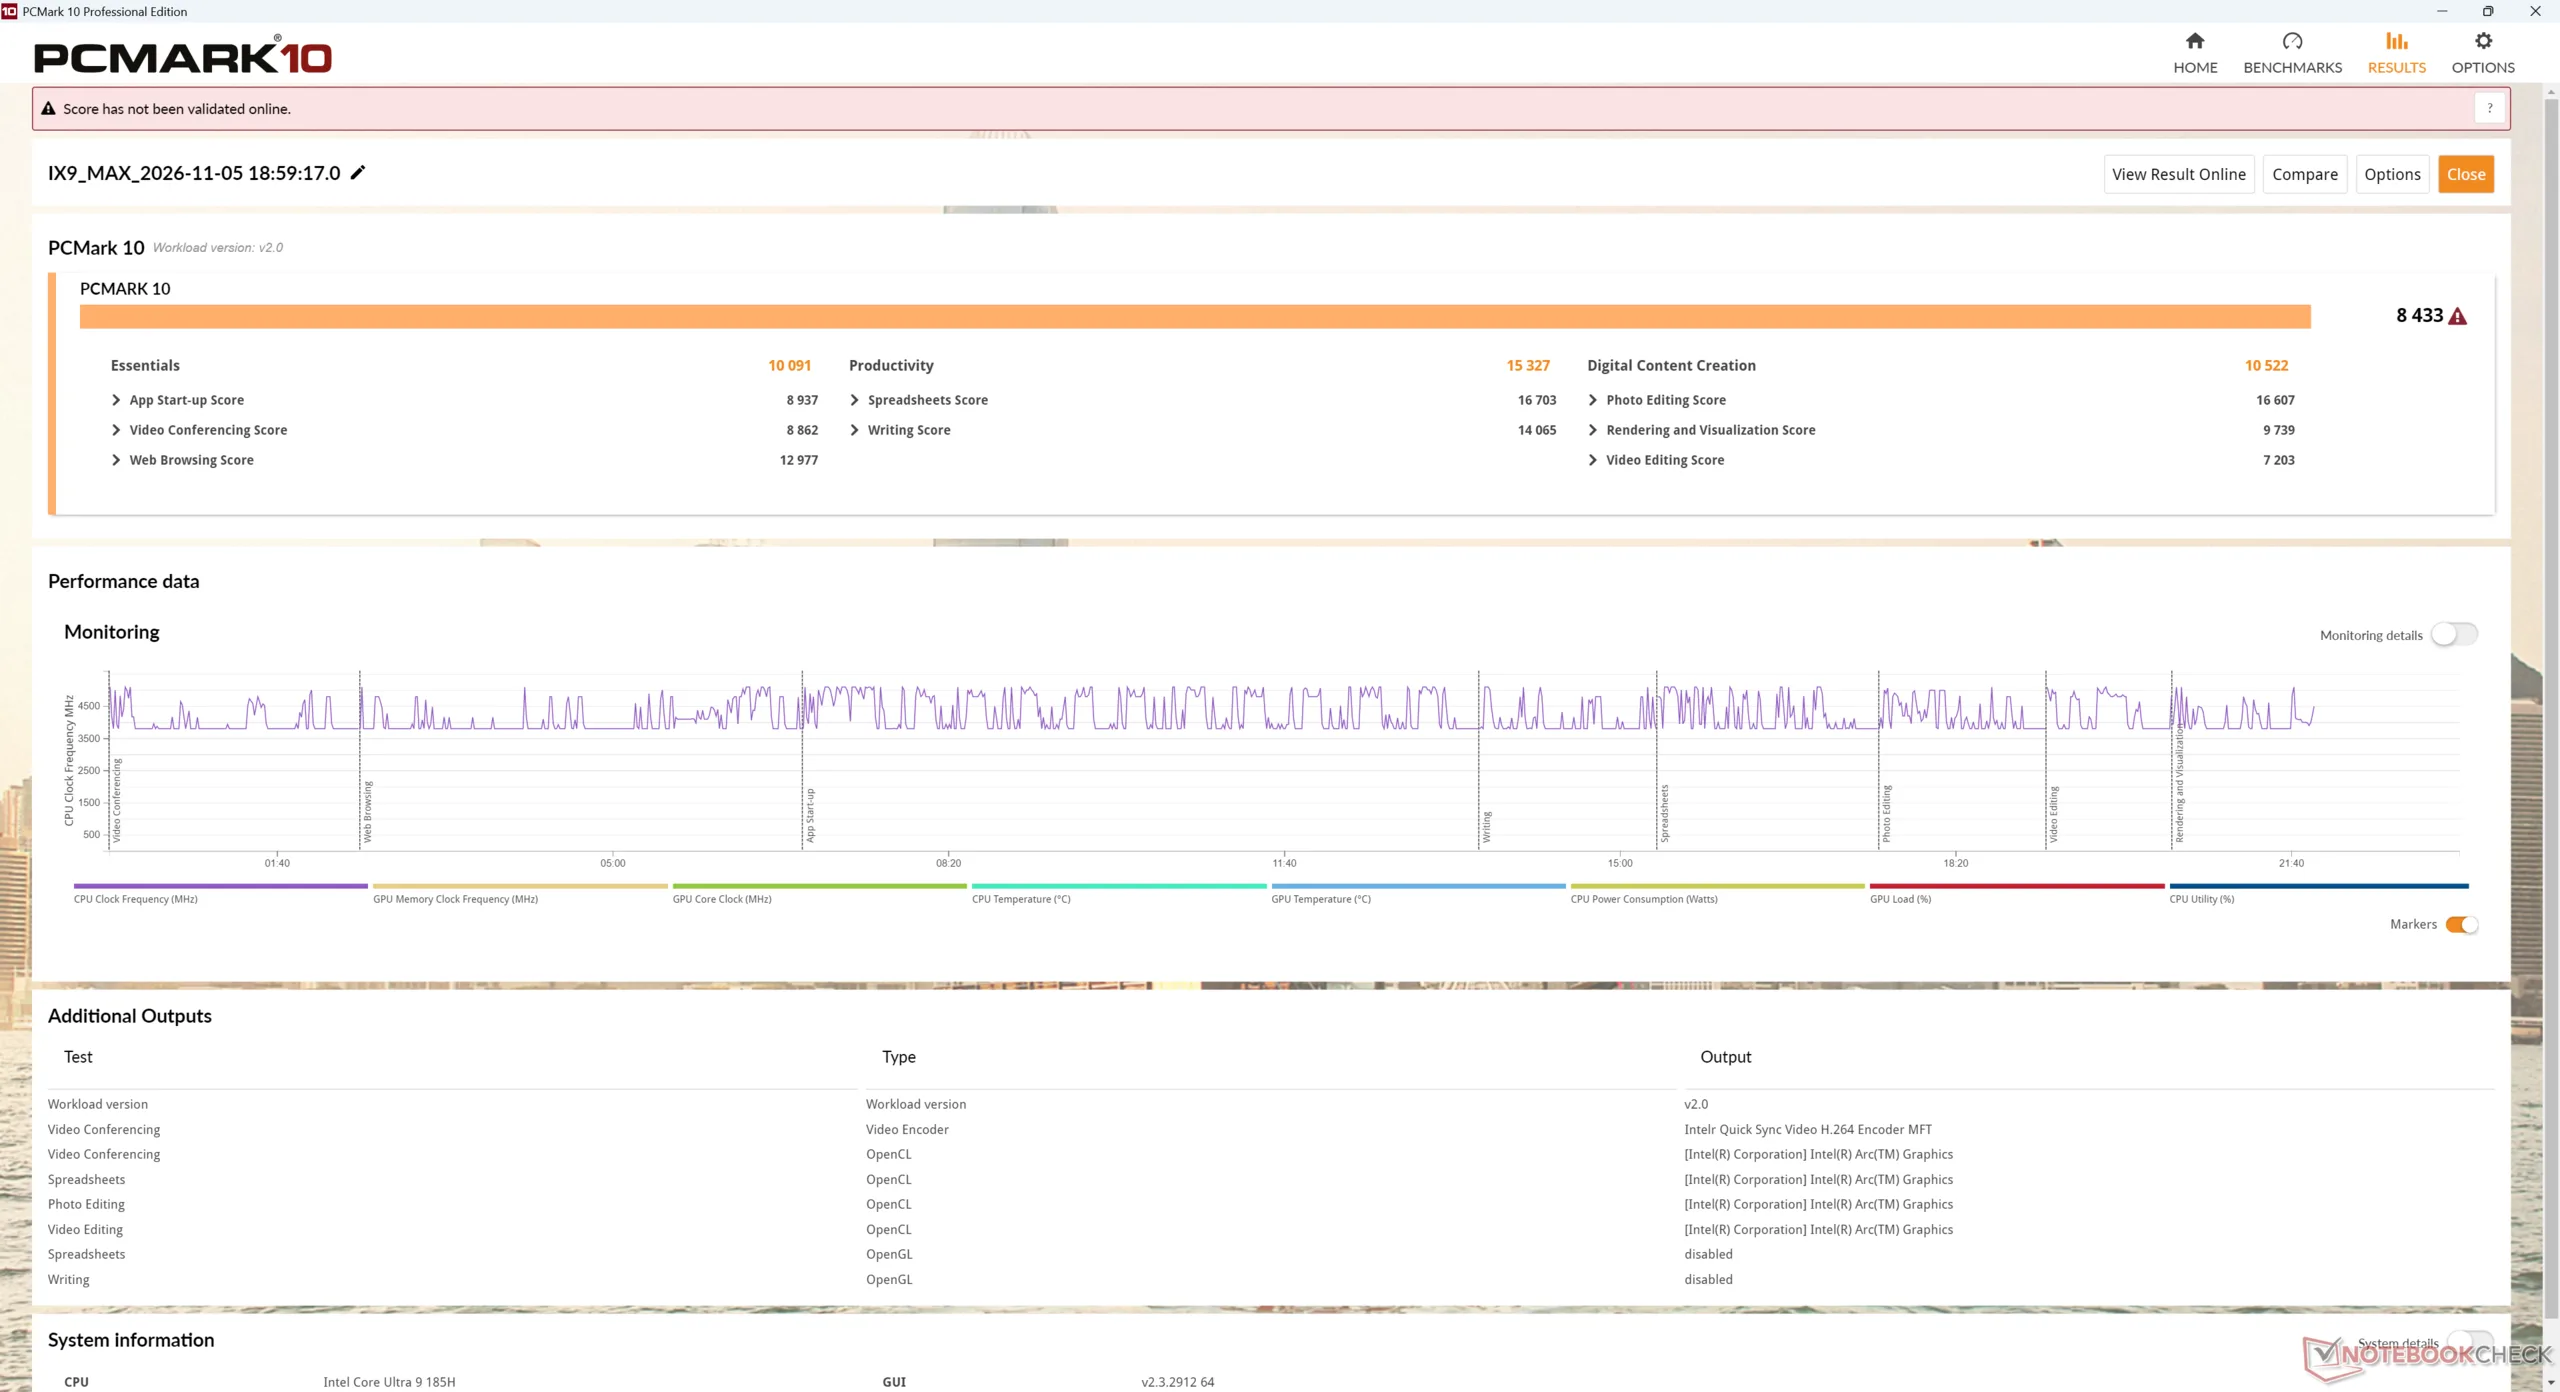
Die Ergebnisse in PCMark 10 und GeekBench AI liegen durchweg unter denen des AX9 Max
Performance Rating
Apple Mac Mini M6 -4!
M6 12-Core GPU, M6, Apple SSD AP0512Z
95.9 pt
Vzmore AX9 Max
Radeon 890M, Ryzen AI 9 HX 470, Lexar NQ7A1
68.6 pt
Beelink GTI15 Ultra -1!
Arc 140T, Ultra 9 285H
64.6 pt
BOSGAME VTA-439
Radeon 890M, Ryzen AI 9 HX 470, Kingston OM8TAP41024K1-A00
62.9 pt
Vzmore iX9 Max
Arc 8-Core, Ultra 9 185H, Lexar NQ7A1
60.6 pt
GMK NucBox K17
Arc 130V, Core Ultra 5 226V, Huawei eKitStor Xtreme 200e 1 TB
57 pt
Durchschnittliche Intel Core Ultra 9 185H, Intel Arc 8-Core iGPU
 
56.3 pt
PCMark 10 / Score
Vzmore AX9 Max
Radeon 890M, Ryzen AI 9 HX 470, Lexar NQ7A1
9105 Points +8%
BOSGAME VTA-439
Radeon 890M, Ryzen AI 9 HX 470, Kingston OM8TAP41024K1-A00
8791 Points +4%
Vzmore iX9 Max
Arc 8-Core, Ultra 9 185H, Lexar NQ7A1
8433 Points
Beelink GTI15 Ultra
Arc 140T, Ultra 9 285H
7492 Points -11%
GMK NucBox K17
Arc 130V, Core Ultra 5 226V, Huawei eKitStor Xtreme 200e 1 TB
7481 Points -11%
Durchschnittliche Intel Core Ultra 9 185H, Intel Arc 8-Core iGPU
  (6268 - 8433, n=9)
7442 Points -12%
PCMark 10 / Essentials
Beelink GTI15 Ultra
Arc 140T, Ultra 9 285H
11218 Points +11%
BOSGAME VTA-439
Radeon 890M, Ryzen AI 9 HX 470, Kingston OM8TAP41024K1-A00
10491 Points +4%
Vzmore AX9 Max
Radeon 890M, Ryzen AI 9 HX 470, Lexar NQ7A1
10468 Points +4%
Durchschnittliche Intel Core Ultra 9 185H, Intel Arc 8-Core iGPU
  (9268 - 11331, n=9)
10313 Points +2%
Vzmore iX9 Max
Arc 8-Core, Ultra 9 185H, Lexar NQ7A1
10091 Points
GMK NucBox K17
Arc 130V, Core Ultra 5 226V, Huawei eKitStor Xtreme 200e 1 TB
9312 Points -8%
PCMark 10 / Productivity
Vzmore AX9 Max
Radeon 890M, Ryzen AI 9 HX 470, Lexar NQ7A1
16394 Points +7%
Vzmore iX9 Max
Arc 8-Core, Ultra 9 185H, Lexar NQ7A1
15327 Points
BOSGAME VTA-439
Radeon 890M, Ryzen AI 9 HX 470, Kingston OM8TAP41024K1-A00
14636 Points -5%
GMK NucBox K17
Arc 130V, Core Ultra 5 226V, Huawei eKitStor Xtreme 200e 1 TB
13840 Points -10%
Durchschnittliche Intel Core Ultra 9 185H, Intel Arc 8-Core iGPU
  (8263 - 15629, n=9)
11200 Points -27%
Beelink GTI15 Ultra
Arc 140T, Ultra 9 285H
9444 Points -38%
PCMark 10 / Digital Content Creation
BOSGAME VTA-439
Radeon 890M, Ryzen AI 9 HX 470, Kingston OM8TAP41024K1-A00
12005 Points +14%
Vzmore AX9 Max
Radeon 890M, Ryzen AI 9 HX 470, Lexar NQ7A1
11934 Points +13%
Beelink GTI15 Ultra
Arc 140T, Ultra 9 285H
10773 Points +2%
Vzmore iX9 Max
Arc 8-Core, Ultra 9 185H, Lexar NQ7A1
10522 Points
Durchschnittliche Intel Core Ultra 9 185H, Intel Arc 8-Core iGPU
  (8729 - 10781, n=9)
9935 Points -6%
GMK NucBox K17
Arc 130V, Core Ultra 5 226V, Huawei eKitStor Xtreme 200e 1 TB
8815 Points -16%
CrossMark / Overall
Apple Mac Mini M6
M6 12-Core GPU, M6, Apple SSD AP0512Z
2706 Points +43%
Beelink GTI15 Ultra
Arc 140T, Ultra 9 285H
2085 Points +11%
Vzmore AX9 Max
Radeon 890M, Ryzen AI 9 HX 470, Lexar NQ7A1
1898 Points +1%
Vzmore iX9 Max
Arc 8-Core, Ultra 9 185H, Lexar NQ7A1
1886 Points
Durchschnittliche Intel Core Ultra 9 185H, Intel Arc 8-Core iGPU
  (1645 - 1971, n=9)
1789 Points -5%
BOSGAME VTA-439
Radeon 890M, Ryzen AI 9 HX 470, Kingston OM8TAP41024K1-A00
1611 Points -15%
GMK NucBox K17
Arc 130V, Core Ultra 5 226V, Huawei eKitStor Xtreme 200e 1 TB
1558 Points -17%
CrossMark / Productivity
Apple Mac Mini M6
M6 12-Core GPU, M6, Apple SSD AP0512Z
2535 Points +43%
Beelink GTI15 Ultra
Arc 140T, Ultra 9 285H
2032 Points +15%
Vzmore iX9 Max
Arc 8-Core, Ultra 9 185H, Lexar NQ7A1
1768 Points
Vzmore AX9 Max
Radeon 890M, Ryzen AI 9 HX 470, Lexar NQ7A1
1751 Points -1%
Durchschnittliche Intel Core Ultra 9 185H, Intel Arc 8-Core iGPU
  (1491 - 1875, n=9)
1681 Points -5%
GMK NucBox K17
Arc 130V, Core Ultra 5 226V, Huawei eKitStor Xtreme 200e 1 TB
1529 Points -14%
BOSGAME VTA-439
Radeon 890M, Ryzen AI 9 HX 470, Kingston OM8TAP41024K1-A00
1449 Points -18%
CrossMark / Creativity
Apple Mac Mini M6
M6 12-Core GPU, M6, Apple SSD AP0512Z
3301 Points +58%
Beelink GTI15 Ultra
Arc 140T, Ultra 9 285H
2216 Points +6%
Vzmore AX9 Max
Radeon 890M, Ryzen AI 9 HX 470, Lexar NQ7A1
2167 Points +4%
BOSGAME VTA-439
Radeon 890M, Ryzen AI 9 HX 470, Kingston OM8TAP41024K1-A00
2143 Points +3%
Vzmore iX9 Max
Arc 8-Core, Ultra 9 185H, Lexar NQ7A1
2083 Points
Durchschnittliche Intel Core Ultra 9 185H, Intel Arc 8-Core iGPU
  (1883 - 2102, n=9)
2001 Points -4%
GMK NucBox K17
Arc 130V, Core Ultra 5 226V, Huawei eKitStor Xtreme 200e 1 TB
1710 Points -18%
CrossMark / Responsiveness
Beelink GTI15 Ultra
Arc 140T, Ultra 9 285H
1876 Points +10%
Apple Mac Mini M6
M6 12-Core GPU, M6, Apple SSD AP0512Z
1815 Points +7%
Vzmore iX9 Max
Arc 8-Core, Ultra 9 185H, Lexar NQ7A1
1700 Points
Vzmore AX9 Max
Radeon 890M, Ryzen AI 9 HX 470, Lexar NQ7A1
1626 Points -4%
Durchschnittliche Intel Core Ultra 9 185H, Intel Arc 8-Core iGPU
  (1290 - 1889, n=9)
1550 Points -9%
GMK NucBox K17
Arc 130V, Core Ultra 5 226V, Huawei eKitStor Xtreme 200e 1 TB
1244 Points -27%
BOSGAME VTA-439
Radeon 890M, Ryzen AI 9 HX 470, Kingston OM8TAP41024K1-A00
942 Points -45%
WebXPRT 4 / Overall
Apple Mac Mini M6
M6 12-Core GPU, M6, Apple SSD AP0512Z
380 Points +50%
Beelink GTI15 Ultra
Arc 140T, Ultra 9 285H
321 Points +26%
GMK NucBox K17
Arc 130V, Core Ultra 5 226V, Huawei eKitStor Xtreme 200e 1 TB
273 Points +7%
Vzmore iX9 Max
Arc 8-Core, Ultra 9 185H, Lexar NQ7A1
254 Points
Durchschnittliche Intel Core Ultra 9 185H, Intel Arc 8-Core iGPU
  (239 - 267, n=9)
253 Points 0%
BOSGAME VTA-439
Radeon 890M, Ryzen AI 9 HX 470, Kingston OM8TAP41024K1-A00
241 Points -5%
Vzmore AX9 Max
Radeon 890M, Ryzen AI 9 HX 470, Lexar NQ7A1
241 Points -5%
WebXPRT 5 / Overall
Apple Mac Mini M6
M6 12-Core GPU, M6, Apple SSD AP0512Z
143 Points +54%
Vzmore AX9 Max
Radeon 890M, Ryzen AI 9 HX 470, Lexar NQ7A1
122 Points +31%
BOSGAME VTA-439
Radeon 890M, Ryzen AI 9 HX 470, Kingston OM8TAP41024K1-A00
115 Points +24%
GMK NucBox K17
Arc 130V, Core Ultra 5 226V, Huawei eKitStor Xtreme 200e 1 TB
112 Points +20%
Vzmore iX9 Max
Arc 8-Core, Ultra 9 185H, Lexar NQ7A1
93 Points
Durchschnittliche Intel Core Ultra 9 185H, Intel Arc 8-Core iGPU
  (86 - 93, n=3)
90.7 Points -2%
Mozilla Kraken 1.1 / Total
Durchschnittliche Intel Core Ultra 9 185H, Intel Arc 8-Core iGPU
  (508 - 594, n=9)
534 ms * -1%
Vzmore iX9 Max
Arc 8-Core, Ultra 9 185H, Lexar NQ7A1
531 ms *
GMK NucBox K17
Arc 130V, Core Ultra 5 226V, Huawei eKitStor Xtreme 200e 1 TB
494 ms * +7%
Vzmore AX9 Max
Radeon 890M, Ryzen AI 9 HX 470, Lexar NQ7A1
431 ms * +19%
Beelink GTI15 Ultra
Arc 140T, Ultra 9 285H
430 ms * +19%
BOSGAME VTA-439
Radeon 890M, Ryzen AI 9 HX 470, Kingston OM8TAP41024K1-A00
423 ms * +20%
Apple Mac Mini M6
M6 12-Core GPU, M6, Apple SSD AP0512Z
202.3 ms * +62%
Geekbench AI / Single Precision GPU 1.7
Apple Mac Mini M6
M6 12-Core GPU, M6, Apple SSD AP0512Z
17838 Points +279%
Vzmore AX9 Max
Radeon 890M, Ryzen AI 9 HX 470, Lexar NQ7A1
8507 Points +81%
BOSGAME VTA-439
Radeon 890M, Ryzen AI 9 HX 470, Kingston OM8TAP41024K1-A00
8277 Points +76%
Beelink GTI15 Ultra
Arc 140T, Ultra 9 285H
7262 Points +54%
GMK NucBox K17
Arc 130V, Core Ultra 5 226V, Huawei eKitStor Xtreme 200e 1 TB
6296 Points +34%
Vzmore iX9 Max
Arc 8-Core, Ultra 9 185H, Lexar NQ7A1
4710 Points
Durchschnittliche Intel Core Ultra 9 185H, Intel Arc 8-Core iGPU
  (2942 - 5163, n=6)
4538 Points -4%
Geekbench AI / Half Precision GPU 1.7
Apple Mac Mini M6
M6 12-Core GPU, M6, Apple SSD AP0512Z
33502 Points +323%
Vzmore AX9 Max
Radeon 890M, Ryzen AI 9 HX 470, Lexar NQ7A1
14441 Points +82%
BOSGAME VTA-439
Radeon 890M, Ryzen AI 9 HX 470, Kingston OM8TAP41024K1-A00
13854 Points +75%
GMK NucBox K17
Arc 130V, Core Ultra 5 226V, Huawei eKitStor Xtreme 200e 1 TB
11517 Points +45%
Beelink GTI15 Ultra
Arc 140T, Ultra 9 285H
9377 Points +18%
Vzmore iX9 Max
Arc 8-Core, Ultra 9 185H, Lexar NQ7A1
7923 Points
Durchschnittliche Intel Core Ultra 9 185H, Intel Arc 8-Core iGPU
  (7060 - 8378, n=6)
7730 Points -2%
Geekbench AI / Quantized GPU 1.7
Apple Mac Mini M6
M6 12-Core GPU, M6, Apple SSD AP0512Z
35670 Points +933%
BOSGAME VTA-439
Radeon 890M, Ryzen AI 9 HX 470, Kingston OM8TAP41024K1-A00
6037 Points +75%
Vzmore AX9 Max
Radeon 890M, Ryzen AI 9 HX 470, Lexar NQ7A1
5962 Points +73%
Beelink GTI15 Ultra
Arc 140T, Ultra 9 285H
4803 Points +39%
GMK NucBox K17
Arc 130V, Core Ultra 5 226V, Huawei eKitStor Xtreme 200e 1 TB
4133 Points +20%
Vzmore iX9 Max
Arc 8-Core, Ultra 9 185H, Lexar NQ7A1
3452 Points
Durchschnittliche Intel Core Ultra 9 185H, Intel Arc 8-Core iGPU
  (2262 - 3660, n=6)
3309 Points -4%

* ... kleinere Werte sind besser

PCMark 10 Score
8433 Punkte
Hilfe
AIDA64 / Memory Copy
GMK NucBox K17
Intel Core Ultra 5 226V, Arc 130V
102045 MB/s +35%
GMK NucBox K17
Intel Core Ultra 5 226V, Arc 130V
100830 MB/s +33%
Durchschnittliche Intel Core Ultra 9 185H
  (69929 - 95718, n=25)
83142 MB/s +10%
Beelink GTI15 Ultra
Intel Core Ultra 9 285H, Arc 140T
80559 MB/s +7%
Vzmore AX9 Max
AMD Ryzen AI 9 HX 470, Radeon 890M
76058 MB/s +1%
Vzmore AX9 Max
AMD Ryzen AI 9 HX 470, Radeon 890M
75630 MB/s 0%
Vzmore iX9 Max
Intel Core Ultra 9 185H, Arc 8-Core
75551 MB/s
BOSGAME VTA-439
AMD Ryzen AI 9 HX 470, Radeon 890M
75070 MB/s -1%
AIDA64 / Memory Read
Vzmore AX9 Max
AMD Ryzen AI 9 HX 470, Radeon 890M
86181 MB/s +18%
Vzmore AX9 Max
AMD Ryzen AI 9 HX 470, Radeon 890M
81592 MB/s +12%
GMK NucBox K17
Intel Core Ultra 5 226V, Arc 130V
85847 MB/s +18%
GMK NucBox K17
Intel Core Ultra 5 226V, Arc 130V
84874 MB/s +17%
Beelink GTI15 Ultra
Intel Core Ultra 9 285H, Arc 140T
79808 MB/s +10%
Durchschnittliche Intel Core Ultra 9 185H
  (64619 - 87768, n=25)
78702 MB/s +8%
BOSGAME VTA-439
AMD Ryzen AI 9 HX 470, Radeon 890M
78342 MB/s +8%
Vzmore iX9 Max
Intel Core Ultra 9 185H, Arc 8-Core
72728 MB/s
AIDA64 / Memory Write
GMK NucBox K17
Intel Core Ultra 5 226V, Arc 130V
111489 MB/s +49%
GMK NucBox K17
Intel Core Ultra 5 226V, Arc 130V
111430 MB/s +49%
Vzmore AX9 Max
AMD Ryzen AI 9 HX 470, Radeon 890M
86010 MB/s +15%
Vzmore AX9 Max
AMD Ryzen AI 9 HX 470, Radeon 890M
85575 MB/s +14%
BOSGAME VTA-439
AMD Ryzen AI 9 HX 470, Radeon 890M
83992 MB/s +12%
Beelink GTI15 Ultra
Intel Core Ultra 9 285H, Arc 140T
80726 MB/s +8%
Vzmore iX9 Max
Intel Core Ultra 9 185H, Arc 8-Core
74769 MB/s
Durchschnittliche Intel Core Ultra 9 185H
  (51114 - 93871, n=25)
73145 MB/s -2%
AIDA64 / Memory Latency
Vzmore iX9 Max
Intel Core Ultra 9 185H, Arc 8-Core
172.4 ns *
Durchschnittliche Intel Core Ultra 9 185H
  (121.4 - 259, n=25)
149.8 ns * +13%
Beelink GTI15 Ultra
Intel Core Ultra 9 285H, Arc 140T
108.4 ns * +37%
BOSGAME VTA-439
AMD Ryzen AI 9 HX 470, Radeon 890M
104.5 ns * +39%
Vzmore AX9 Max
AMD Ryzen AI 9 HX 470, Radeon 890M
91.3 ns * +47%
Vzmore AX9 Max
AMD Ryzen AI 9 HX 470, Radeon 890M
90.1 ns * +48%
GMK NucBox K17
Intel Core Ultra 5 226V, Arc 130V
89.5 ns * +48%
GMK NucBox K17
Intel Core Ultra 5 226V, Arc 130V
88.2 ns * +49%

* ... kleinere Werte sind besser

DPC-Latenzen
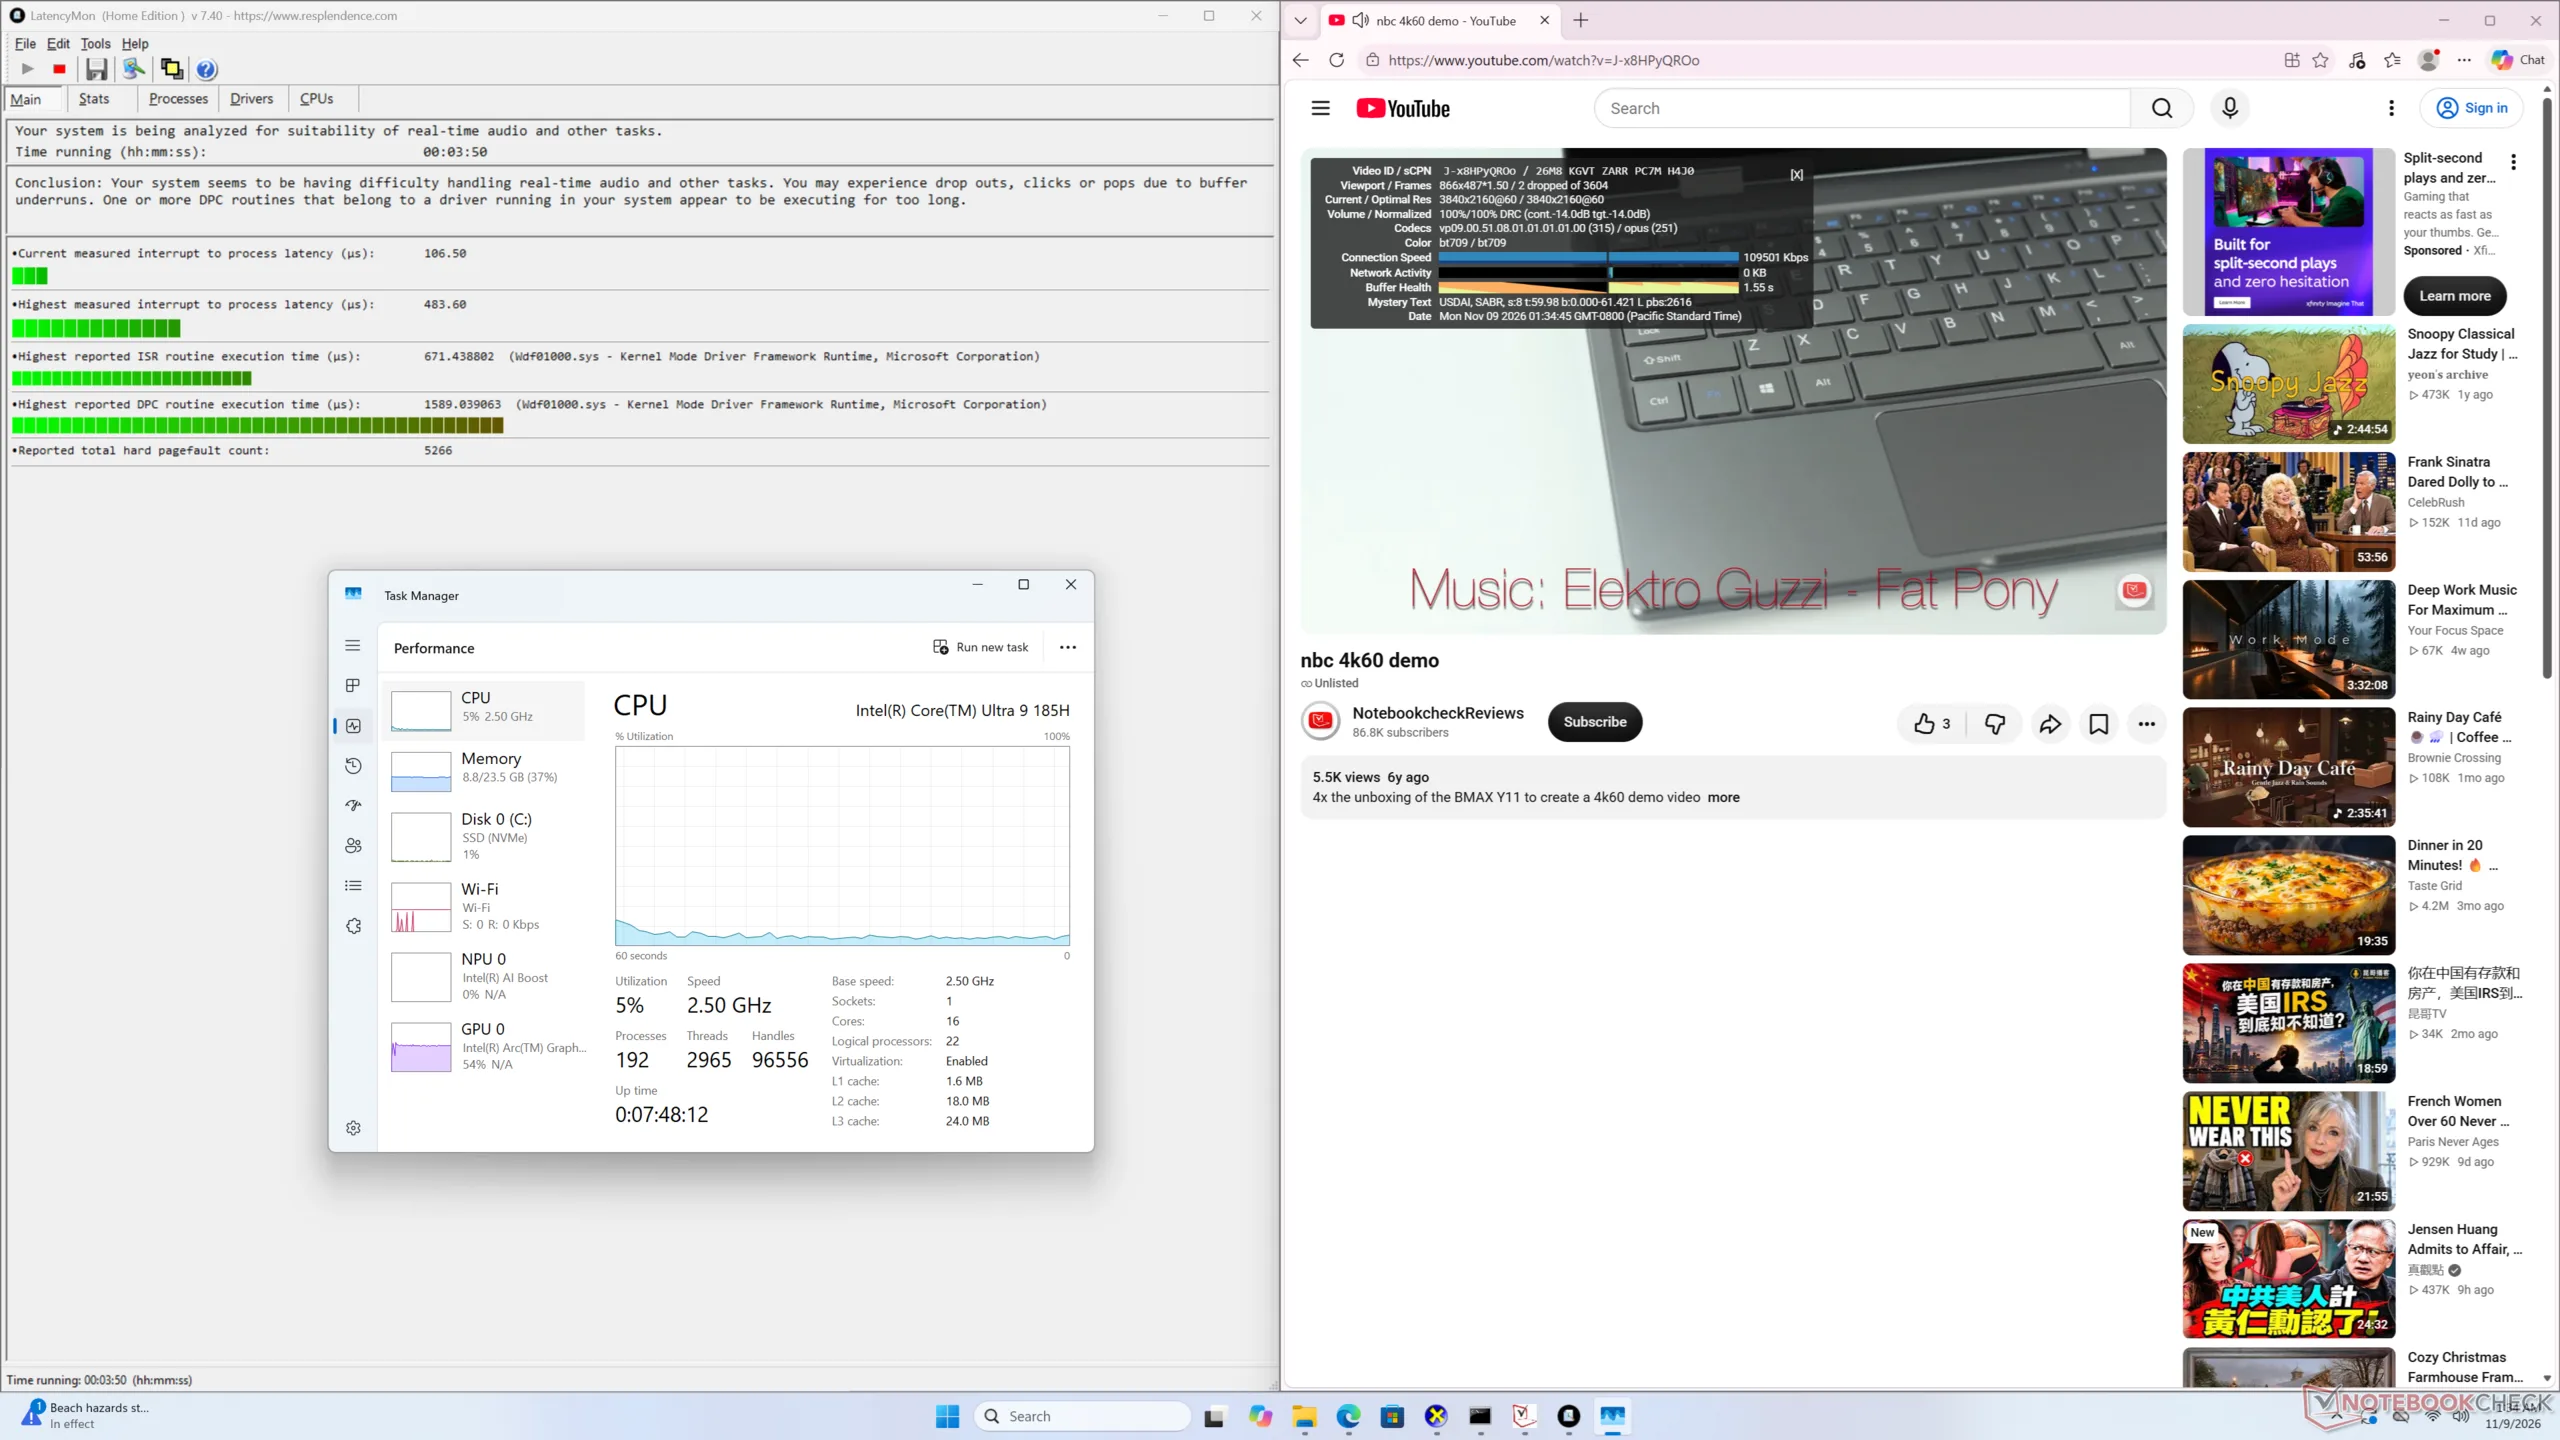
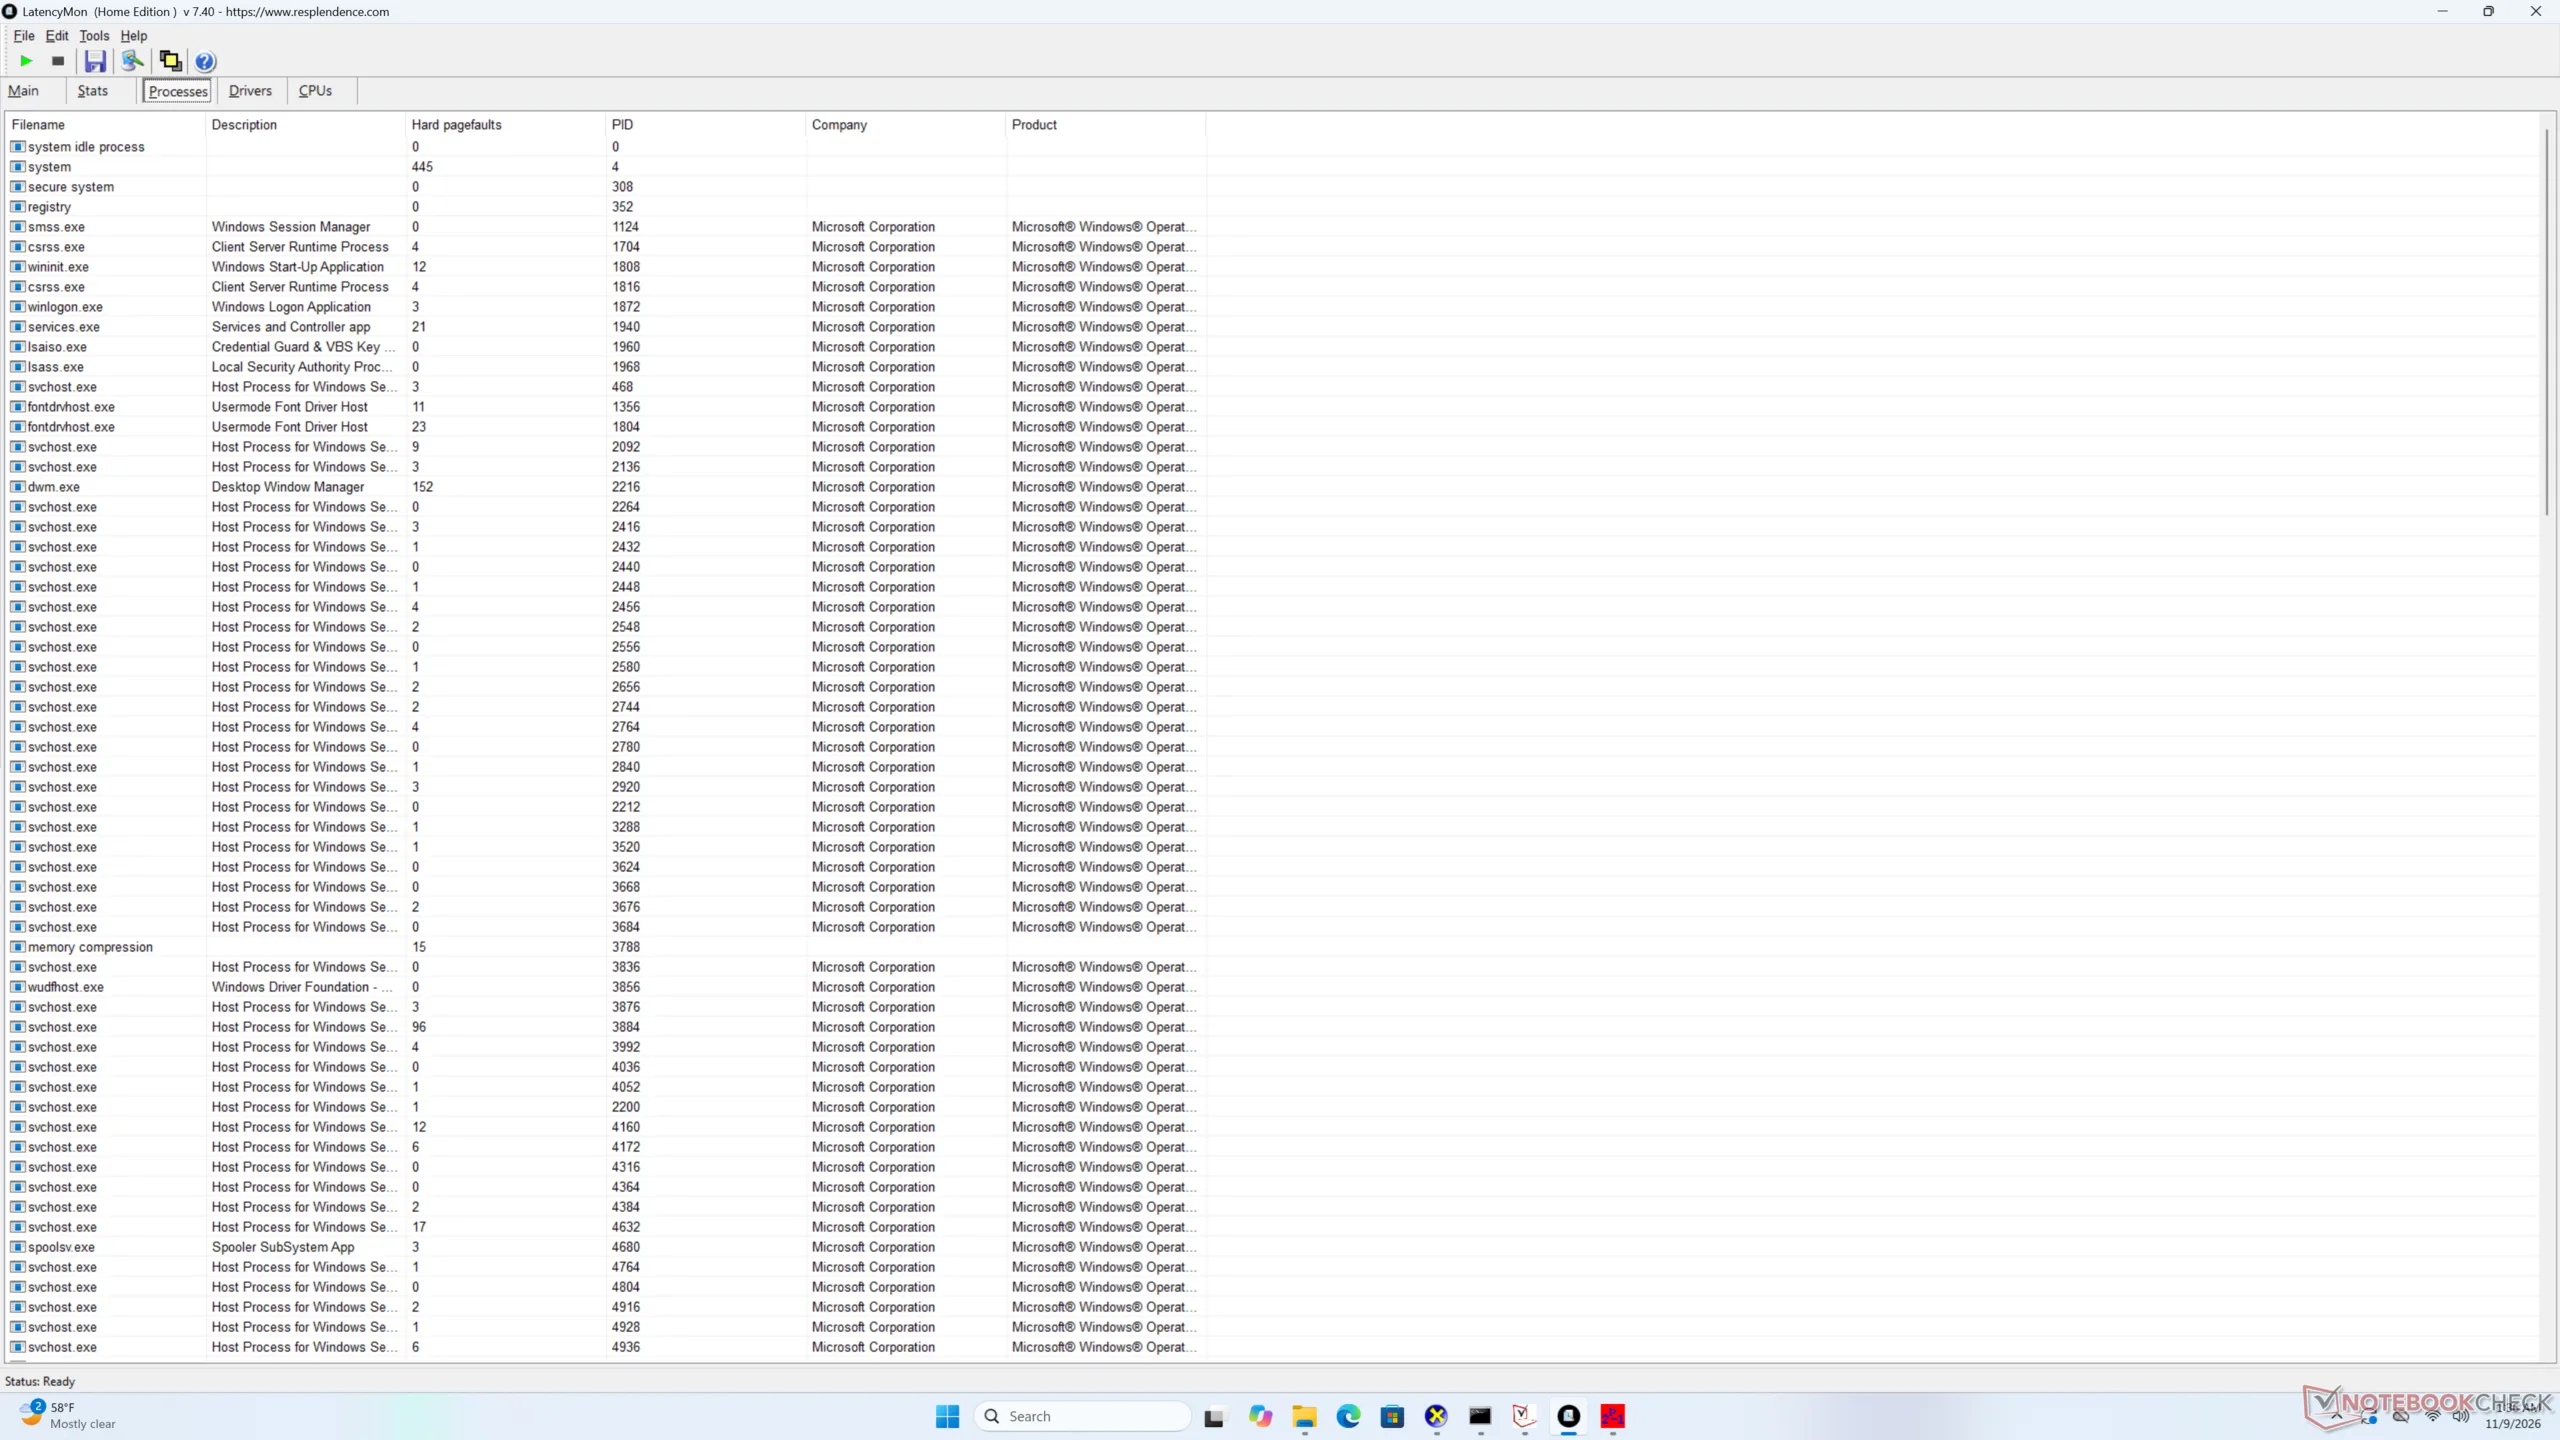
Geringfügige DPC-Probleme mit zwei ausgelassenen Bildern innerhalb von 60 Sekunden
Treiberliste
Treiberliste
DPC Latencies / LatencyMon - interrupt to process latency (max), Web, Youtube, Prime95
Vzmore AX9 Max
Radeon 890M, Ryzen AI 9 HX 470, Lexar NQ7A1
6195 μs * -1181%
Beelink GTI15 Ultra
Arc 140T, Ultra 9 285H
3050.8 μs * -531%
GMK NucBox K17
Arc 130V, Core Ultra 5 226V, Huawei eKitStor Xtreme 200e 1 TB
1200 μs * -148%
BOSGAME VTA-439
Radeon 890M, Ryzen AI 9 HX 470, Kingston OM8TAP41024K1-A00
1120.8 μs * -132%
Vzmore iX9 Max
Arc 8-Core, Ultra 9 185H, Lexar NQ7A1
483.6 μs *

* ... kleinere Werte sind besser

Massenspeicher
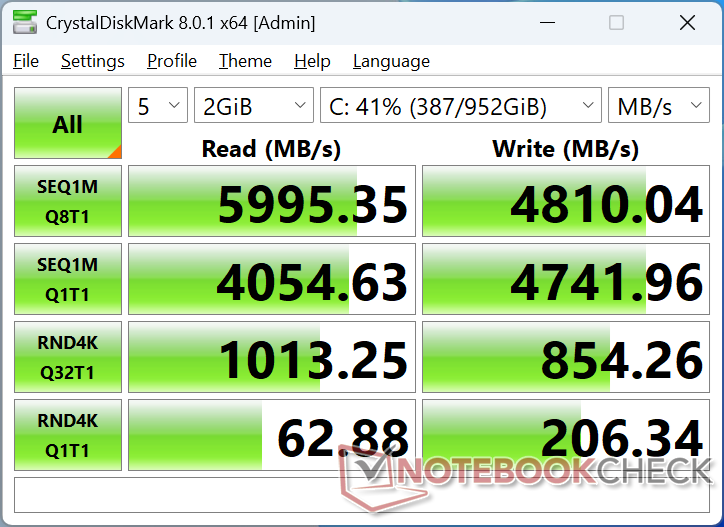
CDM 8
CDM 8
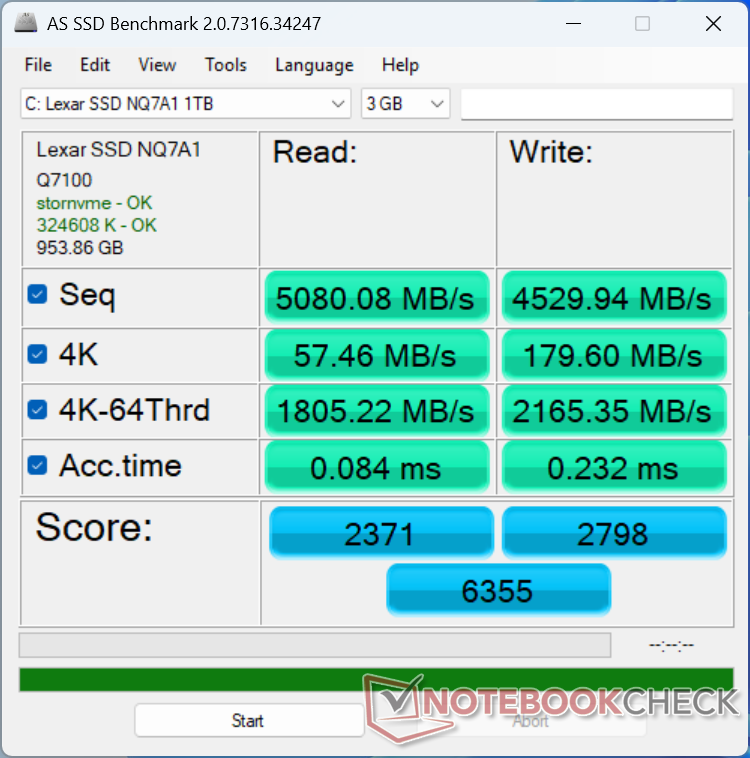
AS SSD
AS SSD
Lexar NQ7A1
CDM 5/6 Read Seq Q32T1: 5990 MB/s
CDM 5/6 Write Seq Q32T1: 4848 MB/s
CDM 5/6 Read 4K Q32T1: 1031 MB/s
CDM 5/6 Write 4K Q32T1: 857.1 MB/s
CDM 5 Read Seq: 4519 MB/s
CDM 5 Write Seq: 4810 MB/s
CDM 5/6 Read 4K: 67.06 MB/s
CDM 5/6 Write 4K: 192.6 MB/s
Drive Performance Rating - Percent
Vzmore iX9 Max
Lexar NQ7A1
83.4 pt
Durchschnittliche Lexar NQ7A1
 
80.4 pt
Beelink GTI15 Ultra
 
78.3 pt
Vzmore AX9 Max
Lexar NQ7A1
75.7 pt
GMK NucBox K17
Huawei eKitStor Xtreme 200e 1 TB
53.5 pt
BOSGAME VTA-439
Kingston OM8TAP41024K1-A00
53 pt
DiskSpd
seq read
Vzmore iX9 Max
Lexar NQ7A1
4780 (4551.24min - 4780.25max) MB/s
Beelink GTI15 Ultra
 
4684 (4668.68min - 4684.06max) MB/s -2%
Durchschnittliche Lexar NQ7A1
  (3103 - 4780, n=4)
3675 MB/s -23%
GMK NucBox K17
Huawei eKitStor Xtreme 200e 1 TB
3437 (2671.77min - 3436.65max) MB/s -28%
Vzmore AX9 Max
Lexar NQ7A1
3324 (3280.37min - 3323.57max) MB/s -30%
BOSGAME VTA-439
Kingston OM8TAP41024K1-A00
3186 (3144.68min - 3186.33max) MB/s -33%
seq write
Vzmore iX9 Max
Lexar NQ7A1
5043 (4959.07min - 5043.23max) MB/s
Durchschnittliche Lexar NQ7A1
  (3887 - 5043, n=4)
4405 MB/s -13%
Vzmore AX9 Max
Lexar NQ7A1
4222 (58.39min - 4221.93max) MB/s -16%
BOSGAME VTA-439
Kingston OM8TAP41024K1-A00
3331 (3192.28min - 3331.16max) MB/s -34%
Beelink GTI15 Ultra
 
2678 (1205.44min - 2677.64max) MB/s -47%
GMK NucBox K17
Huawei eKitStor Xtreme 200e 1 TB
1945 (1600.49min - 1945.32max) MB/s -61%
seq q8 t1 read
Beelink GTI15 Ultra
 
7027 (6531.58min - 7026.93max) MB/s +27%
GMK NucBox K17
Huawei eKitStor Xtreme 200e 1 TB
6829 (5502.51min - 6829.17max) MB/s +23%
BOSGAME VTA-439
Kingston OM8TAP41024K1-A00
5990 (5485.31min - 5990.1max) MB/s +8%
Durchschnittliche Lexar NQ7A1
  (5305 - 5850, n=4)
5582 MB/s +1%
Vzmore iX9 Max
Lexar NQ7A1
5550 (5086.85min - 5549.9max) MB/s
Vzmore AX9 Max
Lexar NQ7A1
5305 (4583.8min - 5305.29max) MB/s -4%
seq q8 t1 write
Beelink GTI15 Ultra
 
6409 (2562.3min - 6408.9max) MB/s +28%
BOSGAME VTA-439
Kingston OM8TAP41024K1-A00
5321 (4879.54min - 5320.63max) MB/s +6%
Vzmore iX9 Max
Lexar NQ7A1
5013 (4892.31min - 5013.49max) MB/s
Durchschnittliche Lexar NQ7A1
  (4463 - 5013, n=4)
4711 MB/s -6%
Vzmore AX9 Max
Lexar NQ7A1
4463 (2902.67min - 4462.53max) MB/s -11%
GMK NucBox K17
Huawei eKitStor Xtreme 200e 1 TB
3082 (2929.93min - 3081.85max) MB/s -39%
4k q1 t1 read
Beelink GTI15 Ultra
 
88.3 (87.81min - 88.25max) MB/s +41%
Vzmore iX9 Max
Lexar NQ7A1
62.5 (61.54min - 62.53max) MB/s
GMK NucBox K17
Huawei eKitStor Xtreme 200e 1 TB
61.8 (59.37min - 61.83max) MB/s -1%
Vzmore AX9 Max
Lexar NQ7A1
61.1 (59.84min - 61.07max) MB/s -2%
Durchschnittliche Lexar NQ7A1
  (36.7 - 62.5, n=4)
54.9 MB/s -12%
BOSGAME VTA-439
Kingston OM8TAP41024K1-A00
52.1 (49.21min - 52.06max) MB/s -17%
4k q1 t1 write
Beelink GTI15 Ultra
 
297 (295.94min - 296.5max) MB/s +33%
Vzmore AX9 Max
Lexar NQ7A1
247 (236.42min - 247.31max) MB/s +11%
Vzmore iX9 Max
Lexar NQ7A1
223 (222.12min - 223.45max) MB/s
Durchschnittliche Lexar NQ7A1
  (134 - 247, n=4)
207 MB/s -7%
GMK NucBox K17
Huawei eKitStor Xtreme 200e 1 TB
103.5 (100.16min - 103.46max) MB/s -54%
BOSGAME VTA-439
Kingston OM8TAP41024K1-A00
92.1 (87.46min - 92.07max) MB/s -59%
4k q32 t16 read
Beelink GTI15 Ultra
 
4349 (4343.6min - 4349.02max) MB/s +59%
Durchschnittliche Lexar NQ7A1
  (2416 - 3576, n=4)
2867 MB/s +5%
Vzmore iX9 Max
Lexar NQ7A1
2736 (2719.45min - 2735.54max) MB/s
Vzmore AX9 Max
Lexar NQ7A1
2416 (2356.43min - 2416.2max) MB/s -12%
BOSGAME VTA-439
Kingston OM8TAP41024K1-A00
661 (631.61min - 661.21max) MB/s -76%
GMK NucBox K17
Huawei eKitStor Xtreme 200e 1 TB
581 (564.79min - 581.34max) MB/s -79%
4k q32 t16 write
Vzmore iX9 Max
Lexar NQ7A1
2679 (2485.49min - 2679.35max) MB/s
Durchschnittliche Lexar NQ7A1
  (1345 - 3100, n=4)
2268 MB/s -15%
Vzmore AX9 Max
Lexar NQ7A1
1947 (807.98min - 1947.37max) MB/s -27%
Beelink GTI15 Ultra
 
1937 (1313.65min - 1936.81max) MB/s -28%
BOSGAME VTA-439
Kingston OM8TAP41024K1-A00
394 (301.27min - 394.3max) MB/s -85%
GMK NucBox K17
Huawei eKitStor Xtreme 200e 1 TB
245 (194.02min - 244.8max) MB/s -91%
AS SSD
Score Total
Durchschnittliche Lexar NQ7A1
  (5906 - 6785, n=4)
6412 Points +1%
Vzmore iX9 Max
Lexar NQ7A1
6355 Points
Vzmore AX9 Max
Lexar NQ7A1
5906 Points -7%
Beelink GTI15 Ultra
 
4085 Points -36%
BOSGAME VTA-439
Kingston OM8TAP41024K1-A00
3444 Points -46%
GMK NucBox K17
Huawei eKitStor Xtreme 200e 1 TB
3171 Points -50%
Score Read
Durchschnittliche Lexar NQ7A1
  (2346 - 2641, n=4)
2433 Points +3%
Vzmore iX9 Max
Lexar NQ7A1
2371 Points
Vzmore AX9 Max
Lexar NQ7A1
2346 Points -1%
Beelink GTI15 Ultra
 
1915 Points -19%
BOSGAME VTA-439
Kingston OM8TAP41024K1-A00
1178 Points -50%
GMK NucBox K17
Huawei eKitStor Xtreme 200e 1 TB
1169 Points -51%
Score Write
Vzmore iX9 Max
Lexar NQ7A1
2798 Points
Durchschnittliche Lexar NQ7A1
  (2374 - 3028, n=4)
2753 Points -2%
Vzmore AX9 Max
Lexar NQ7A1
2374 Points -15%
BOSGAME VTA-439
Kingston OM8TAP41024K1-A00
1744 Points -38%
GMK NucBox K17
Huawei eKitStor Xtreme 200e 1 TB
1494 Points -47%
Beelink GTI15 Ultra
 
1313 Points -53%
Seq Read
Vzmore iX9 Max
Lexar NQ7A1
5080.08 MB/s
GMK NucBox K17
Huawei eKitStor Xtreme 200e 1 TB
5056 MB/s 0%
Durchschnittliche Lexar NQ7A1
  (4833 - 5080, n=4)
4969 MB/s -2%
Vzmore AX9 Max
Lexar NQ7A1
4833 MB/s -5%
BOSGAME VTA-439
Kingston OM8TAP41024K1-A00
4432.66 MB/s -13%
Beelink GTI15 Ultra
 
3811.12 MB/s -25%
Seq Write
Durchschnittliche Lexar NQ7A1
  (4530 - 4813, n=4)
4650 MB/s +3%
Vzmore AX9 Max
Lexar NQ7A1
4571 MB/s +1%
Vzmore iX9 Max
Lexar NQ7A1
4529.94 MB/s
GMK NucBox K17
Huawei eKitStor Xtreme 200e 1 TB
2883 MB/s -36%
BOSGAME VTA-439
Kingston OM8TAP41024K1-A00
2643.15 MB/s -42%
Beelink GTI15 Ultra
 
980.9 MB/s -78%
4K Read
Beelink GTI15 Ultra
 
80.76 MB/s +41%
GMK NucBox K17
Huawei eKitStor Xtreme 200e 1 TB
63.9 MB/s +11%
Vzmore iX9 Max
Lexar NQ7A1
57.46 MB/s
Vzmore AX9 Max
Lexar NQ7A1
52.6 MB/s -8%
Durchschnittliche Lexar NQ7A1
  (43.9 - 57.5, n=4)
51.8 MB/s -10%
BOSGAME VTA-439
Kingston OM8TAP41024K1-A00
44.48 MB/s -23%
4K Write
Beelink GTI15 Ultra
 
263.64 MB/s +47%
Vzmore AX9 Max
Lexar NQ7A1
199.1 MB/s +11%
BOSGAME VTA-439
Kingston OM8TAP41024K1-A00
181.12 MB/s +1%
Vzmore iX9 Max
Lexar NQ7A1
179.6 MB/s
Durchschnittliche Lexar NQ7A1
  (100.2 - 199.1, n=4)
163.6 MB/s -9%
GMK NucBox K17
Huawei eKitStor Xtreme 200e 1 TB
118.3 MB/s -34%
4K-64 Read
Durchschnittliche Lexar NQ7A1
  (1805 - 2093, n=4)
1884 MB/s +4%
Vzmore AX9 Max
Lexar NQ7A1
1810 MB/s 0%
Vzmore iX9 Max
Lexar NQ7A1
1805.22 MB/s
Beelink GTI15 Ultra
 
1453.09 MB/s -20%
BOSGAME VTA-439
Kingston OM8TAP41024K1-A00
690.16 MB/s -62%
GMK NucBox K17
Huawei eKitStor Xtreme 200e 1 TB
599 MB/s -67%
4K-64 Write
Vzmore iX9 Max
Lexar NQ7A1
2165.35 MB/s
Durchschnittliche Lexar NQ7A1
  (1718 - 2384, n=4)
2125 MB/s -2%
Vzmore AX9 Max
Lexar NQ7A1
1718 MB/s -21%
BOSGAME VTA-439
Kingston OM8TAP41024K1-A00
1298.72 MB/s -40%
GMK NucBox K17
Huawei eKitStor Xtreme 200e 1 TB
1088 MB/s -50%
Beelink GTI15 Ultra
 
951.67 MB/s -56%
Access Time Read
Vzmore AX9 Max
Lexar NQ7A1
0.236 ms * -181%
GMK NucBox K17
Huawei eKitStor Xtreme 200e 1 TB
0.137 ms * -63%
Durchschnittliche Lexar NQ7A1
  (0.077 - 0.236, n=4)
0.1298 ms * -55%
BOSGAME VTA-439
Kingston OM8TAP41024K1-A00
0.101 ms * -20%
Vzmore iX9 Max
Lexar NQ7A1
0.084 ms *
Beelink GTI15 Ultra
 
0.042 ms * +50%
Access Time Write
BOSGAME VTA-439
Kingston OM8TAP41024K1-A00
0.308 ms * -33%
Vzmore iX9 Max
Lexar NQ7A1
0.232 ms *
Durchschnittliche Lexar NQ7A1
  (0.073 - 0.232, n=4)
0.113 ms * +51%
GMK NucBox K17
Huawei eKitStor Xtreme 200e 1 TB
0.084 ms * +64%
Beelink GTI15 Ultra
 
0.077 ms * +67%
Vzmore AX9 Max
Lexar NQ7A1
0.073 ms * +69%

* ... kleinere Werte sind besser

SSD-Drosselung: DiskSpd-Leseschleife, Warteschlangentiefe 8

01152303454605756908059201035115012651380149516101725184019552070218523002415253026452760287529903105322033353450356536803795391040254140425543704485460047154830494550605175529054055520Tooltip
Vzmore iX9 Max Lexar NQ7A1; diskspd 2.0.17 f: Ø5561 (4842.99-5592.06) MB/s
Beelink GTI15 Ultra  ; diskspd 2.0.17 f: Ø4627 (4156.56-4864.26) MB/s

GPU-Leistung

3DMark 11
3DMark 11
Cloud Gate
Cloud Gate
Fire Strike
Fire Strike
Speed Way
Speed Way
Steel Nomad
Steel Nomad
Time Spy
Time Spy
3DMark Performance Rating - Percent
Minisforum M2 Pro
Intel Arc B390 12 Xe3 Panther Lake iGPU, Intel Core Ultra X7 358H
100 pt
Vzmore AX9 Max
AMD Radeon 890M, AMD Ryzen AI 9 HX 470
61.8 pt
Durchschnittliche Intel Arc 8-Core iGPU
 
51.5 pt
Vzmore iX9 Max
Intel Arc 8-Core iGPU, Intel Core Ultra 9 185H
51.1 pt
Beelink GTI15 Ultra
Intel Arc Graphics 140T, Intel Core Ultra 9 285H
50.1 pt
GMK NucBox K17
Intel Arc Graphics 130V, Intel Core Ultra 5 226V
49.5 pt
Alliwava GH8, R9 8945HS
AMD Radeon 780M, AMD Ryzen 9 8945HS
43.3 pt
MSI Cubi NUC AI+ 3MG
Intel Graphics 4 Xe3 Panther Lake iGPU, Intel Core Ultra 9 386H
40.9 pt
Geekom A7 Max, R9 7940HS
AMD Radeon 780M, AMD Ryzen 9 7940HS
30.6 pt
Minisforum MS-02 Ultra
Intel Graphics 4-Core iGPU (Meteor / Arrow Lake), Intel Core Ultra 9 285HX
29.7 pt
3DMark
1920x1080 Fire Strike Graphics
Minisforum M2 Pro
Intel Arc B390 12 Xe3 Panther Lake iGPU, Intel Core Ultra X7 358H
17052 Points +106%
Vzmore AX9 Max
AMD Radeon 890M, AMD Ryzen AI 9 HX 470
9398 Points +14%
GMK NucBox K17
Intel Arc Graphics 130V, Intel Core Ultra 5 226V
8463 Points +2%
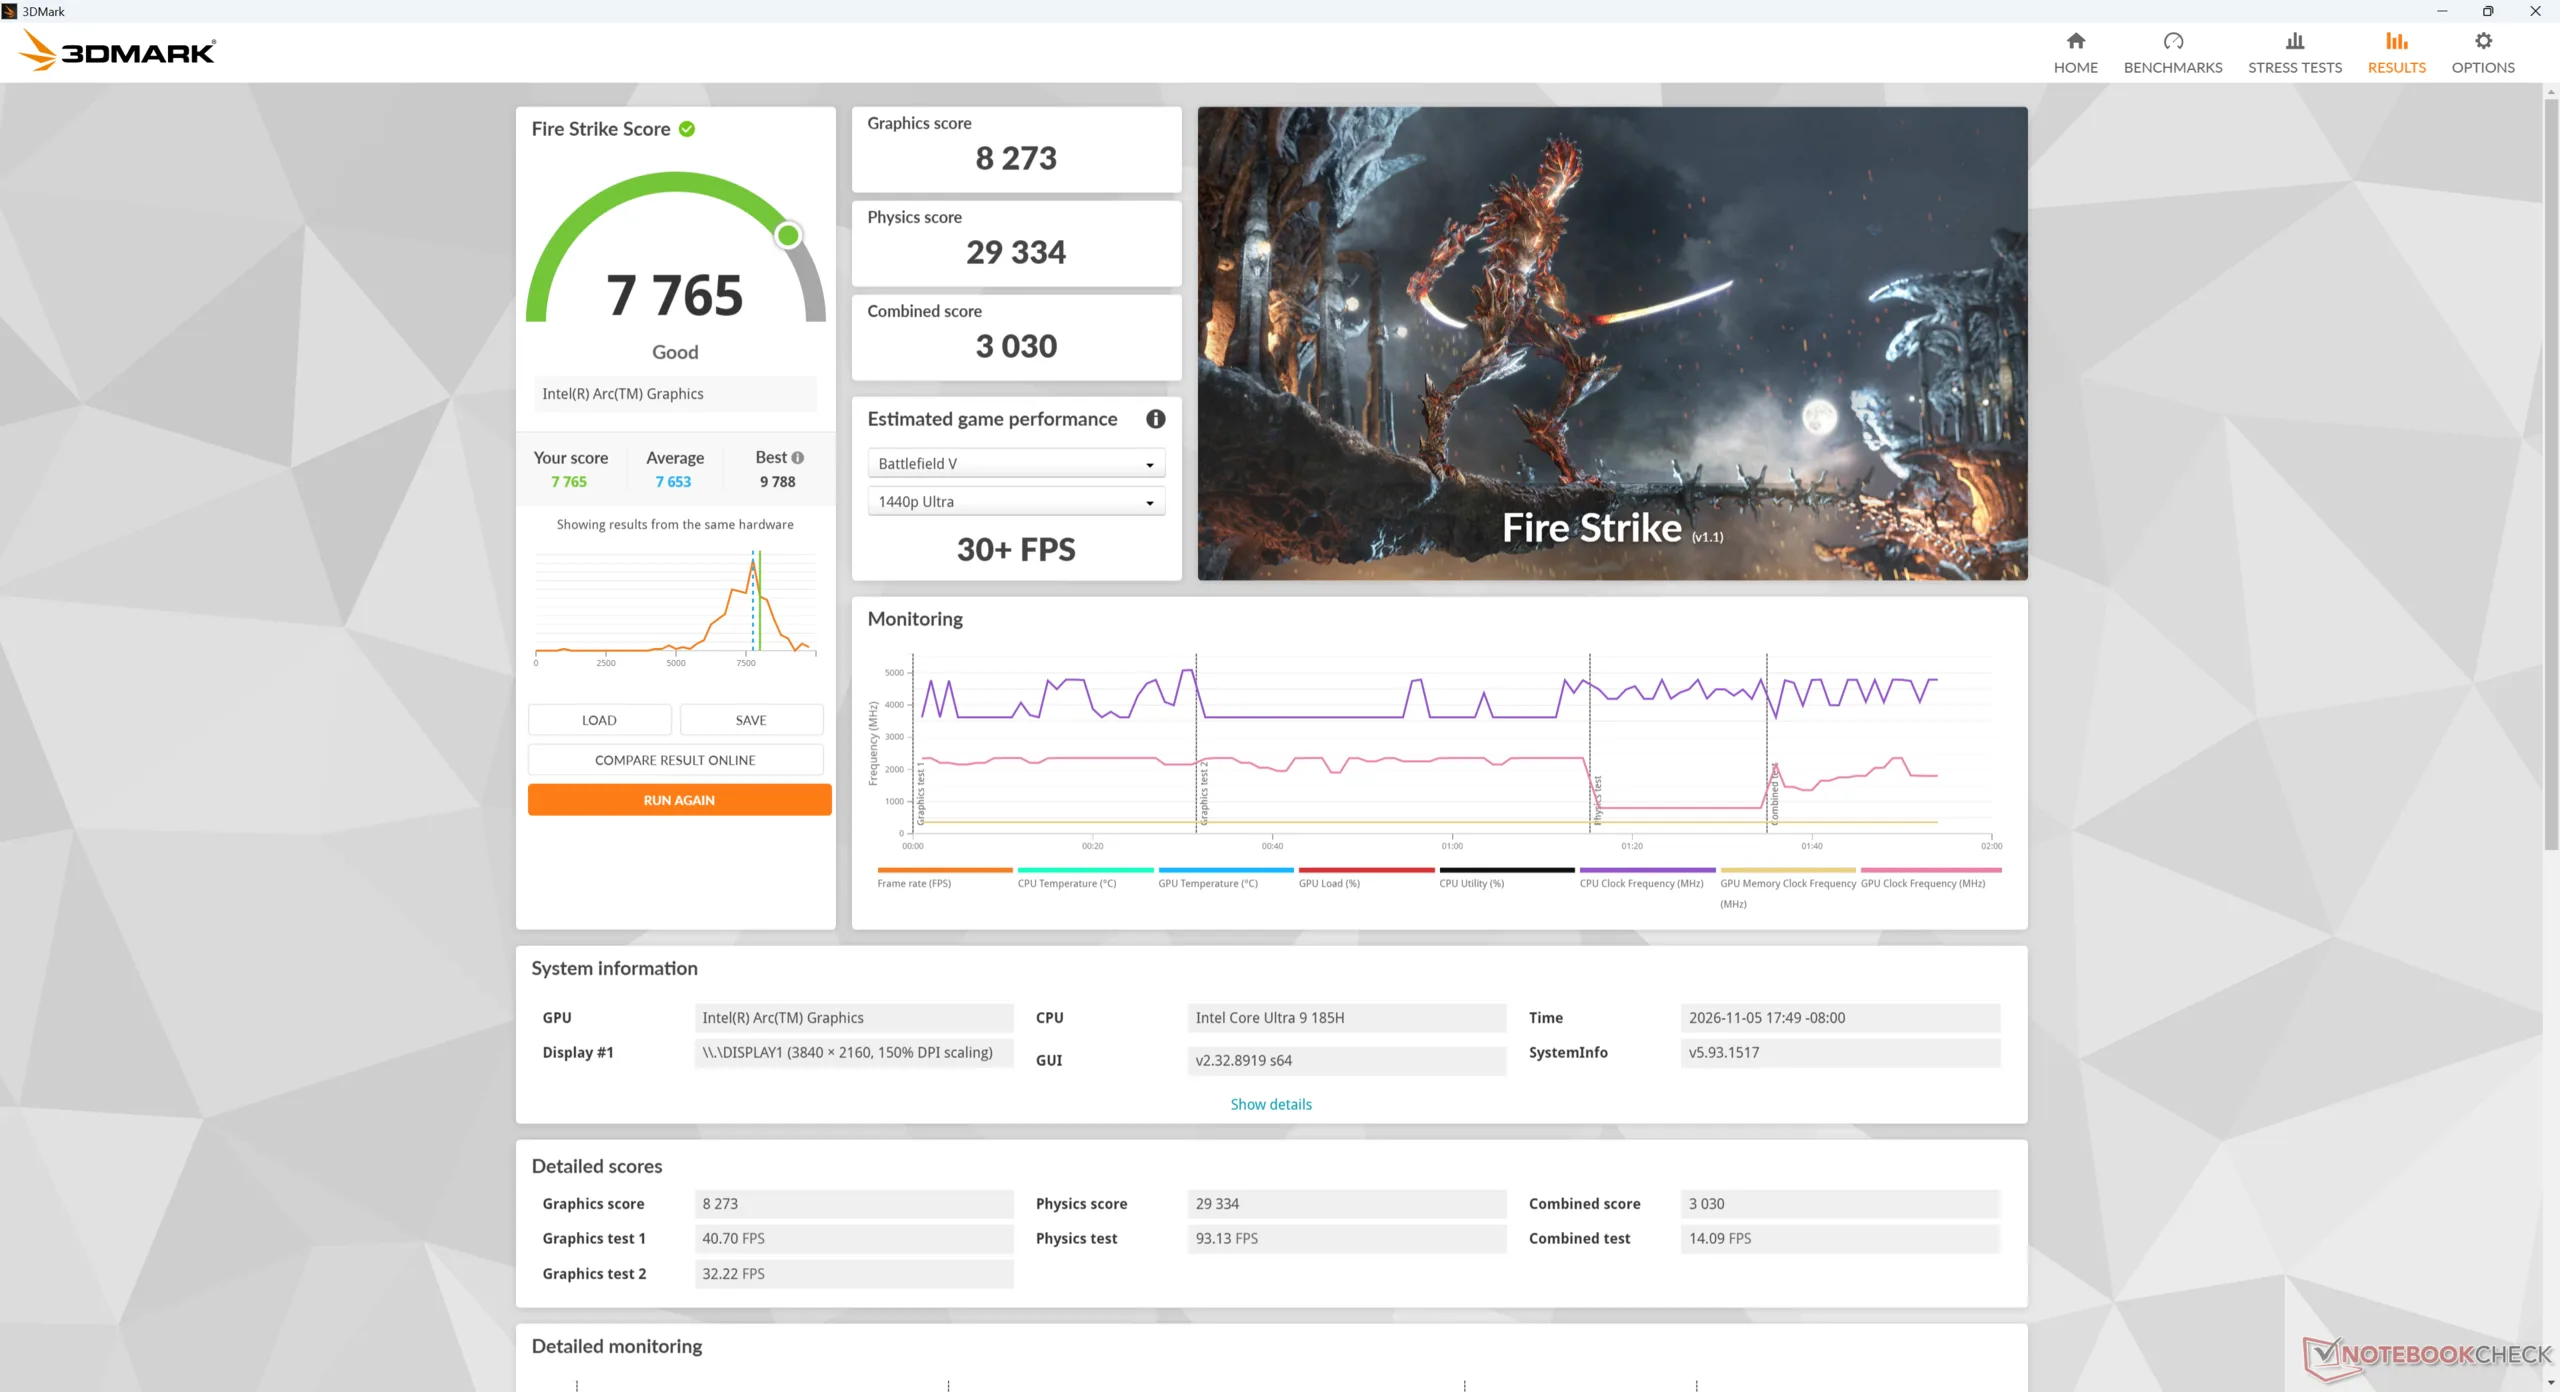
Vzmore iX9 Max
Intel Arc 8-Core iGPU, Intel Core Ultra 9 185H
8273 Points
Durchschnittliche Intel Arc 8-Core iGPU
  (5568 - 9692, n=46)
8217 Points -1%
Beelink GTI15 Ultra
Intel Arc Graphics 140T, Intel Core Ultra 9 285H
7696 Points -7%
Alliwava GH8, R9 8945HS
AMD Radeon 780M, AMD Ryzen 9 8945HS
7106 Points -14%
MSI Cubi NUC AI+ 3MG
Intel Graphics 4 Xe3 Panther Lake iGPU, Intel Core Ultra 9 386H
6665 Points -19%
Geekom A7 Max, R9 7940HS
AMD Radeon 780M, AMD Ryzen 9 7940HS
4892 Points -41%
Minisforum MS-02 Ultra
Intel Graphics 4-Core iGPU (Meteor / Arrow Lake), Intel Core Ultra 9 285HX
4730 Points -43%
2560x1440 Time Spy Graphics
Minisforum M2 Pro
Intel Arc B390 12 Xe3 Panther Lake iGPU, Intel Core Ultra X7 358H
6532 Points +89%
Vzmore AX9 Max
AMD Radeon 890M, AMD Ryzen AI 9 HX 470
3603 Points +4%
Vzmore iX9 Max
Intel Arc 8-Core iGPU, Intel Core Ultra 9 185H
3453 Points
Beelink GTI15 Ultra
Intel Arc Graphics 140T, Intel Core Ultra 9 285H
3312 Points -4%
Durchschnittliche Intel Arc 8-Core iGPU
  (2018 - 3770, n=49)
3230 Points -6%
GMK NucBox K17
Intel Arc Graphics 130V, Intel Core Ultra 5 226V
3148 Points -9%
MSI Cubi NUC AI+ 3MG
Intel Graphics 4 Xe3 Panther Lake iGPU, Intel Core Ultra 9 386H
2865 Points -17%
Alliwava GH8, R9 8945HS
AMD Radeon 780M, AMD Ryzen 9 8945HS
2429 Points -30%
Minisforum MS-02 Ultra
Intel Graphics 4-Core iGPU (Meteor / Arrow Lake), Intel Core Ultra 9 285HX
2005 Points -42%
Geekom A7 Max, R9 7940HS
AMD Radeon 780M, AMD Ryzen 9 7940HS
1635 Points -53%
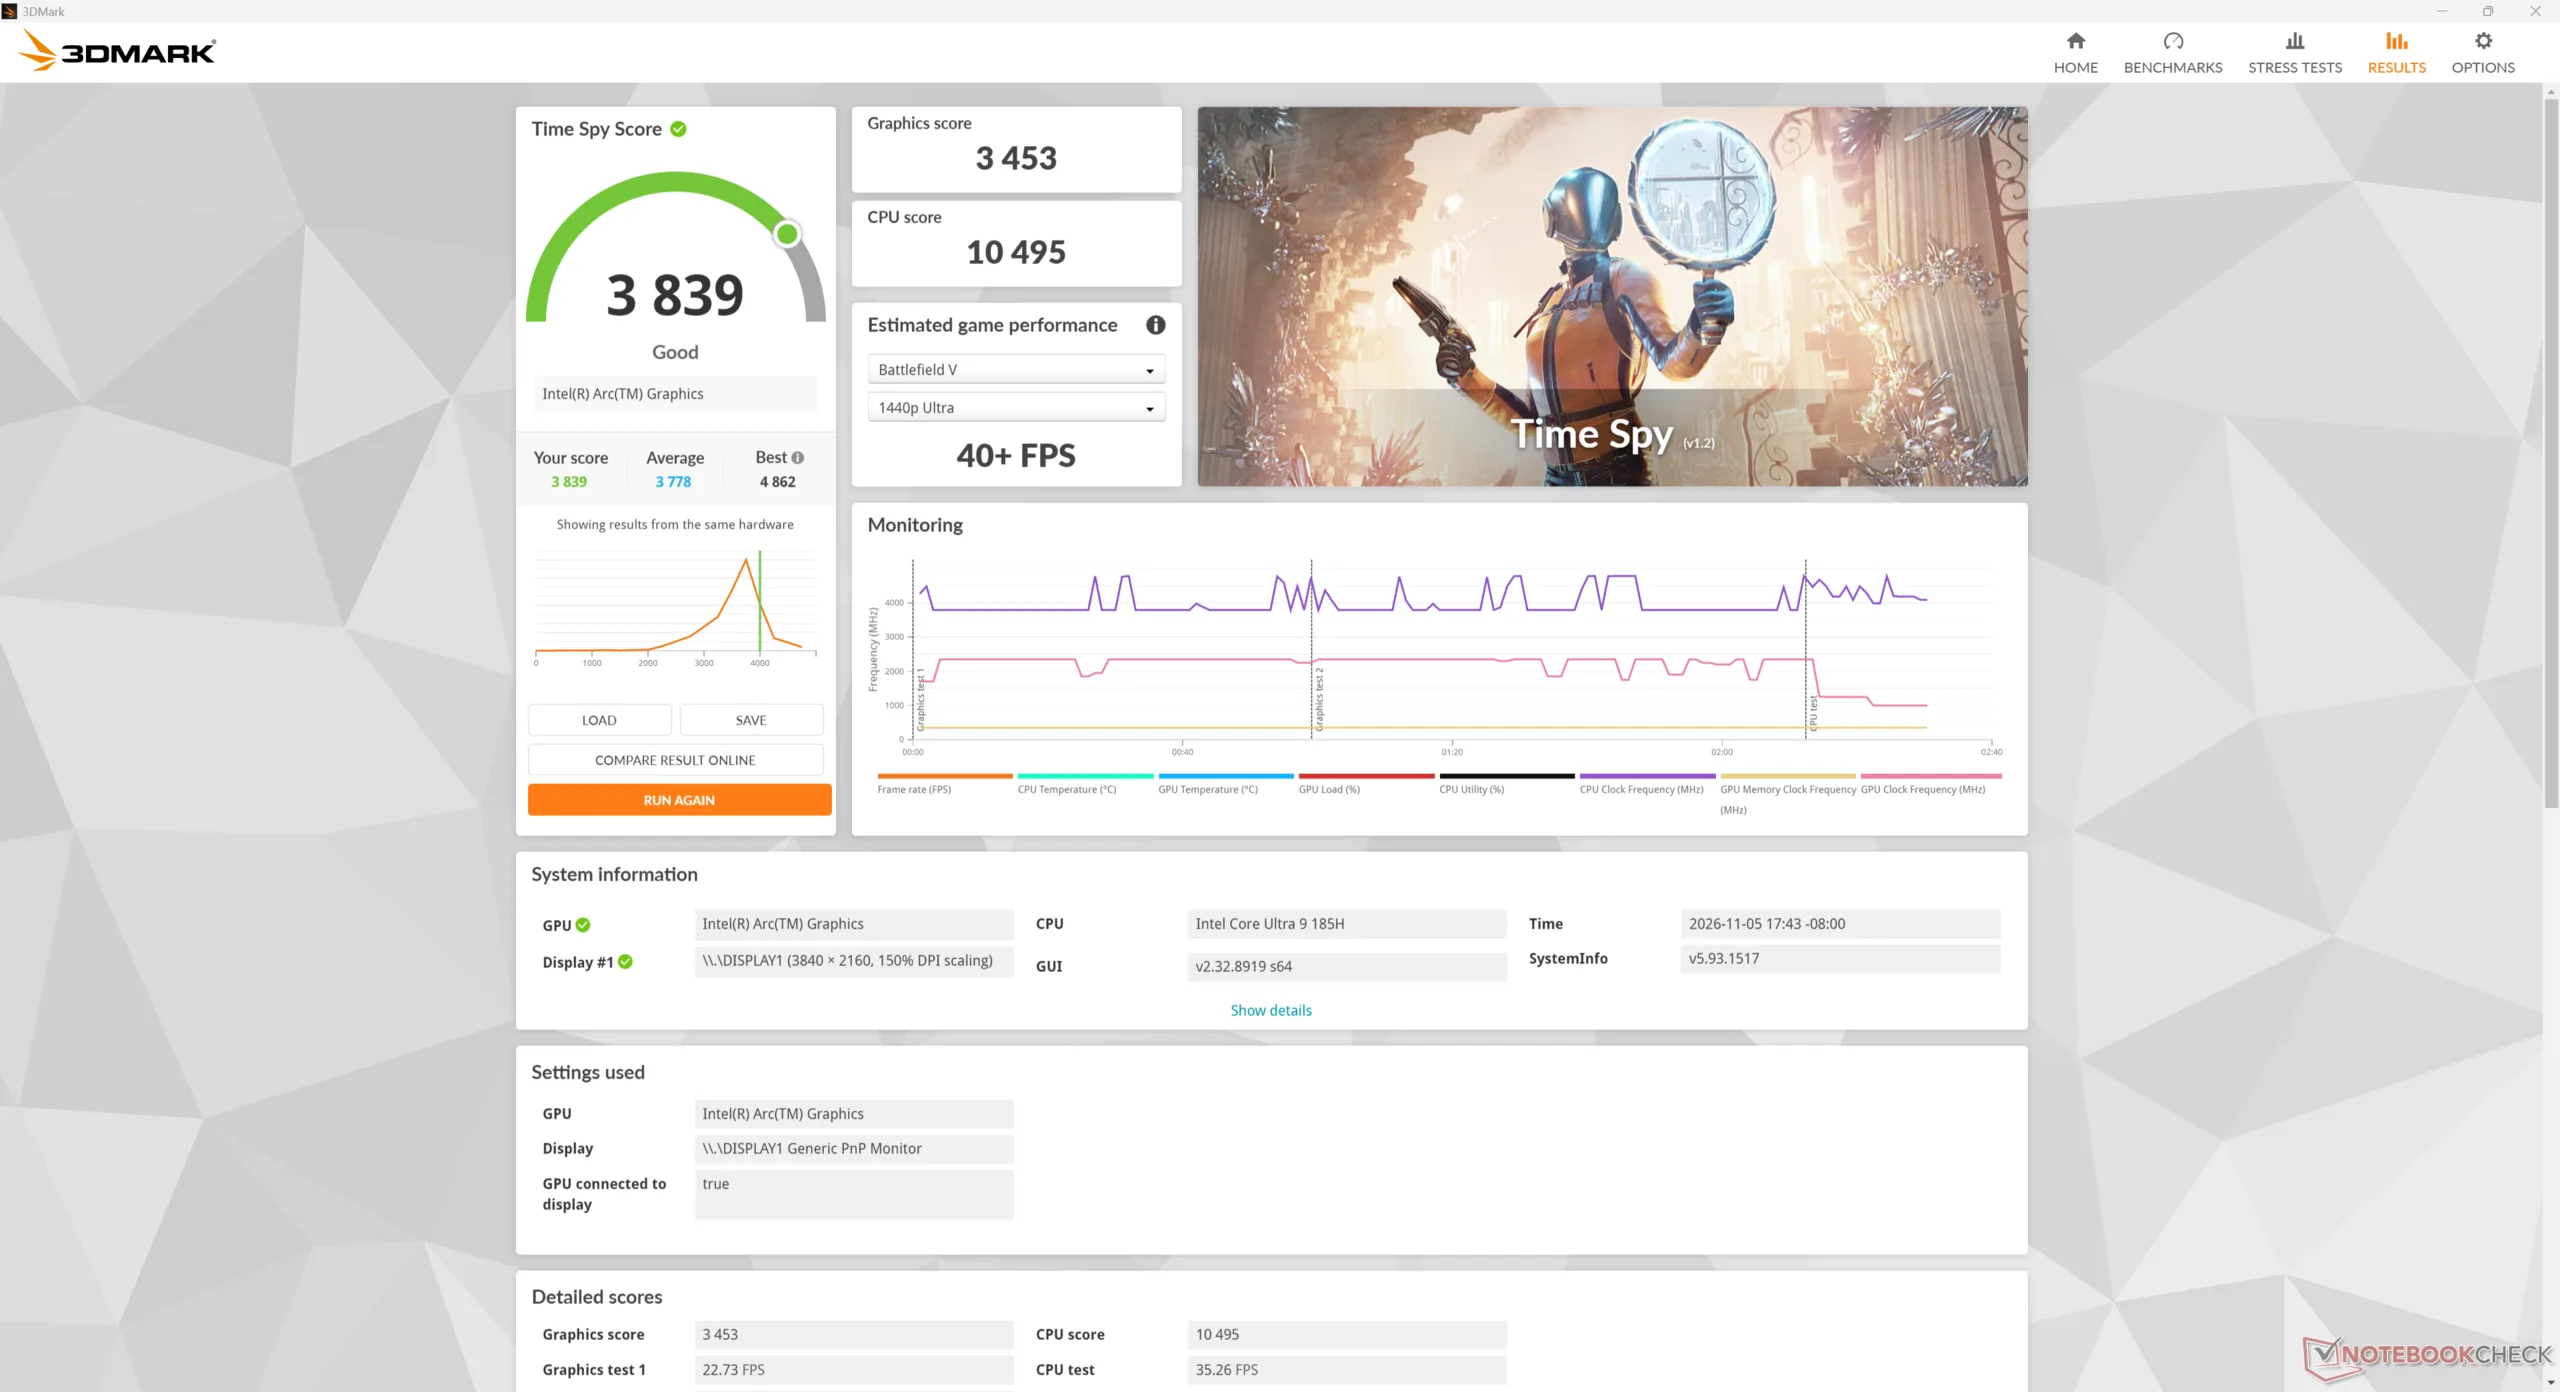
2560x1440 Time Spy Score
Minisforum M2 Pro
Intel Arc B390 12 Xe3 Panther Lake iGPU, Intel Core Ultra X7 358H
7109 Points +85%
Vzmore AX9 Max
AMD Radeon 890M, AMD Ryzen AI 9 HX 470
4002 Points +4%
Vzmore iX9 Max
Intel Arc 8-Core iGPU, Intel Core Ultra 9 185H
3839 Points
Beelink GTI15 Ultra
Intel Arc Graphics 140T, Intel Core Ultra 9 285H
3705 Points -3%
Durchschnittliche Intel Arc 8-Core iGPU
  (2178 - 4176, n=47)
3553 Points -7%
GMK NucBox K17
Intel Arc Graphics 130V, Intel Core Ultra 5 226V
3415 Points -11%
MSI Cubi NUC AI+ 3MG
Intel Graphics 4 Xe3 Panther Lake iGPU, Intel Core Ultra 9 386H
3237 Points -16%
Alliwava GH8, R9 8945HS
AMD Radeon 780M, AMD Ryzen 9 8945HS
2744 Points -29%
Minisforum MS-02 Ultra
Intel Graphics 4-Core iGPU (Meteor / Arrow Lake), Intel Core Ultra 9 285HX
2291 Points -40%
Geekom A7 Max, R9 7940HS
AMD Radeon 780M, AMD Ryzen 9 7940HS
1862 Points -51%
3DMark 11 - 1280x720 Performance GPU
Minisforum M2 Pro
Intel Arc B390 12 Xe3 Panther Lake iGPU, Intel Core Ultra X7 358H
19804 Points +104%
Vzmore AX9 Max
AMD Radeon 890M, AMD Ryzen AI 9 HX 470
16000 Points +65%
Durchschnittliche Intel Arc 8-Core iGPU
  (8064 - 13716, n=42)
11560 Points +19%
Alliwava GH8, R9 8945HS
AMD Radeon 780M, AMD Ryzen 9 8945HS
11003 Points +13%
Beelink GTI15 Ultra
Intel Arc Graphics 140T, Intel Core Ultra 9 285H
10381 Points +7%
GMK NucBox K17
Intel Arc Graphics 130V, Intel Core Ultra 5 226V
10312 Points +6%
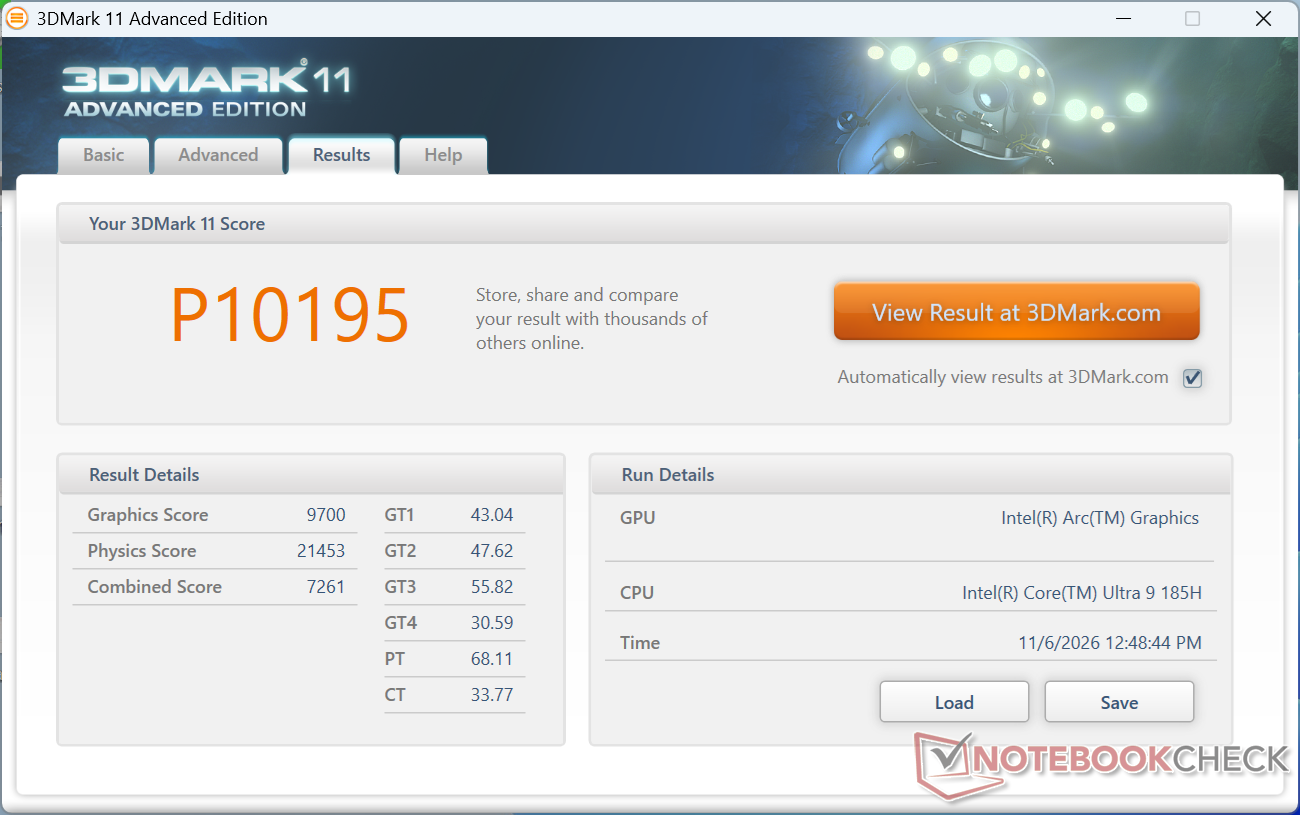
Vzmore iX9 Max
Intel Arc 8-Core iGPU, Intel Core Ultra 9 185H
9700 Points
Geekom A7 Max, R9 7940HS
AMD Radeon 780M, AMD Ryzen 9 7940HS
8417 Points -13%
MSI Cubi NUC AI+ 3MG
Intel Graphics 4 Xe3 Panther Lake iGPU, Intel Core Ultra 9 386H
6917 Points -29%
Minisforum MS-02 Ultra
Intel Graphics 4-Core iGPU (Meteor / Arrow Lake), Intel Core Ultra 9 285HX
5538 Points -43%
3DMark 11 Performance
10195 Punkte
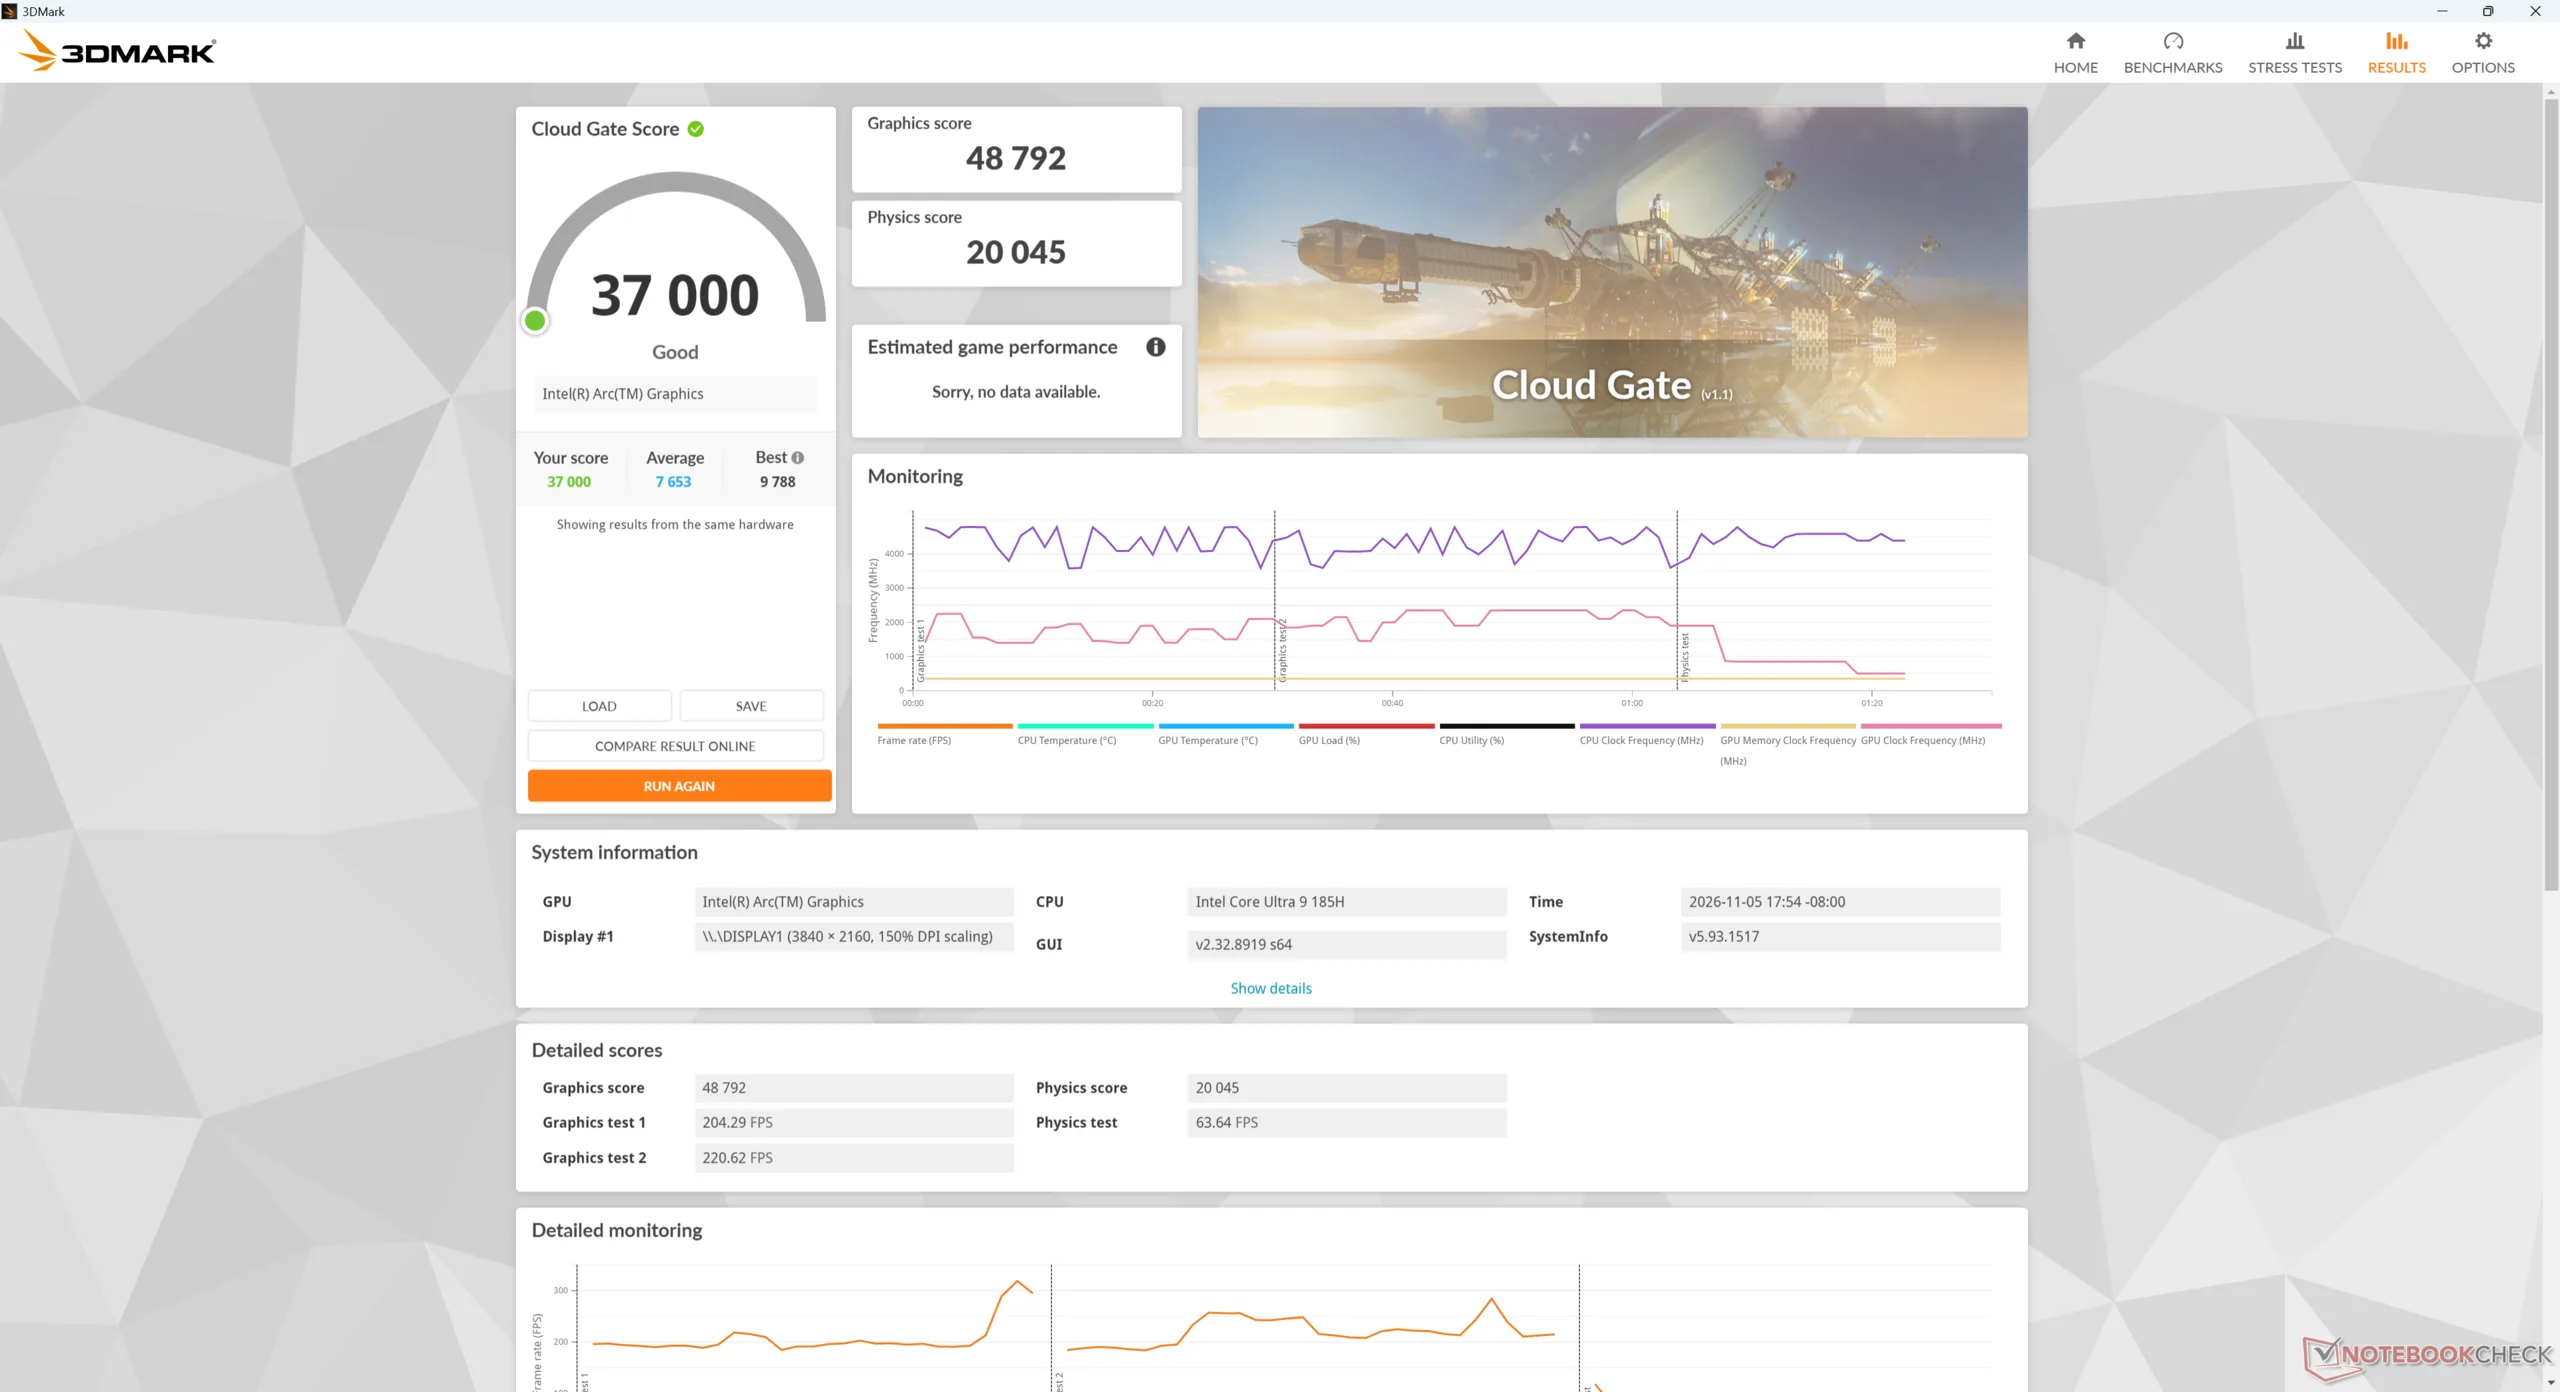
3DMark Cloud Gate Standard Score
37000 Punkte
3DMark Fire Strike Score
7765 Punkte
3DMark Time Spy Score
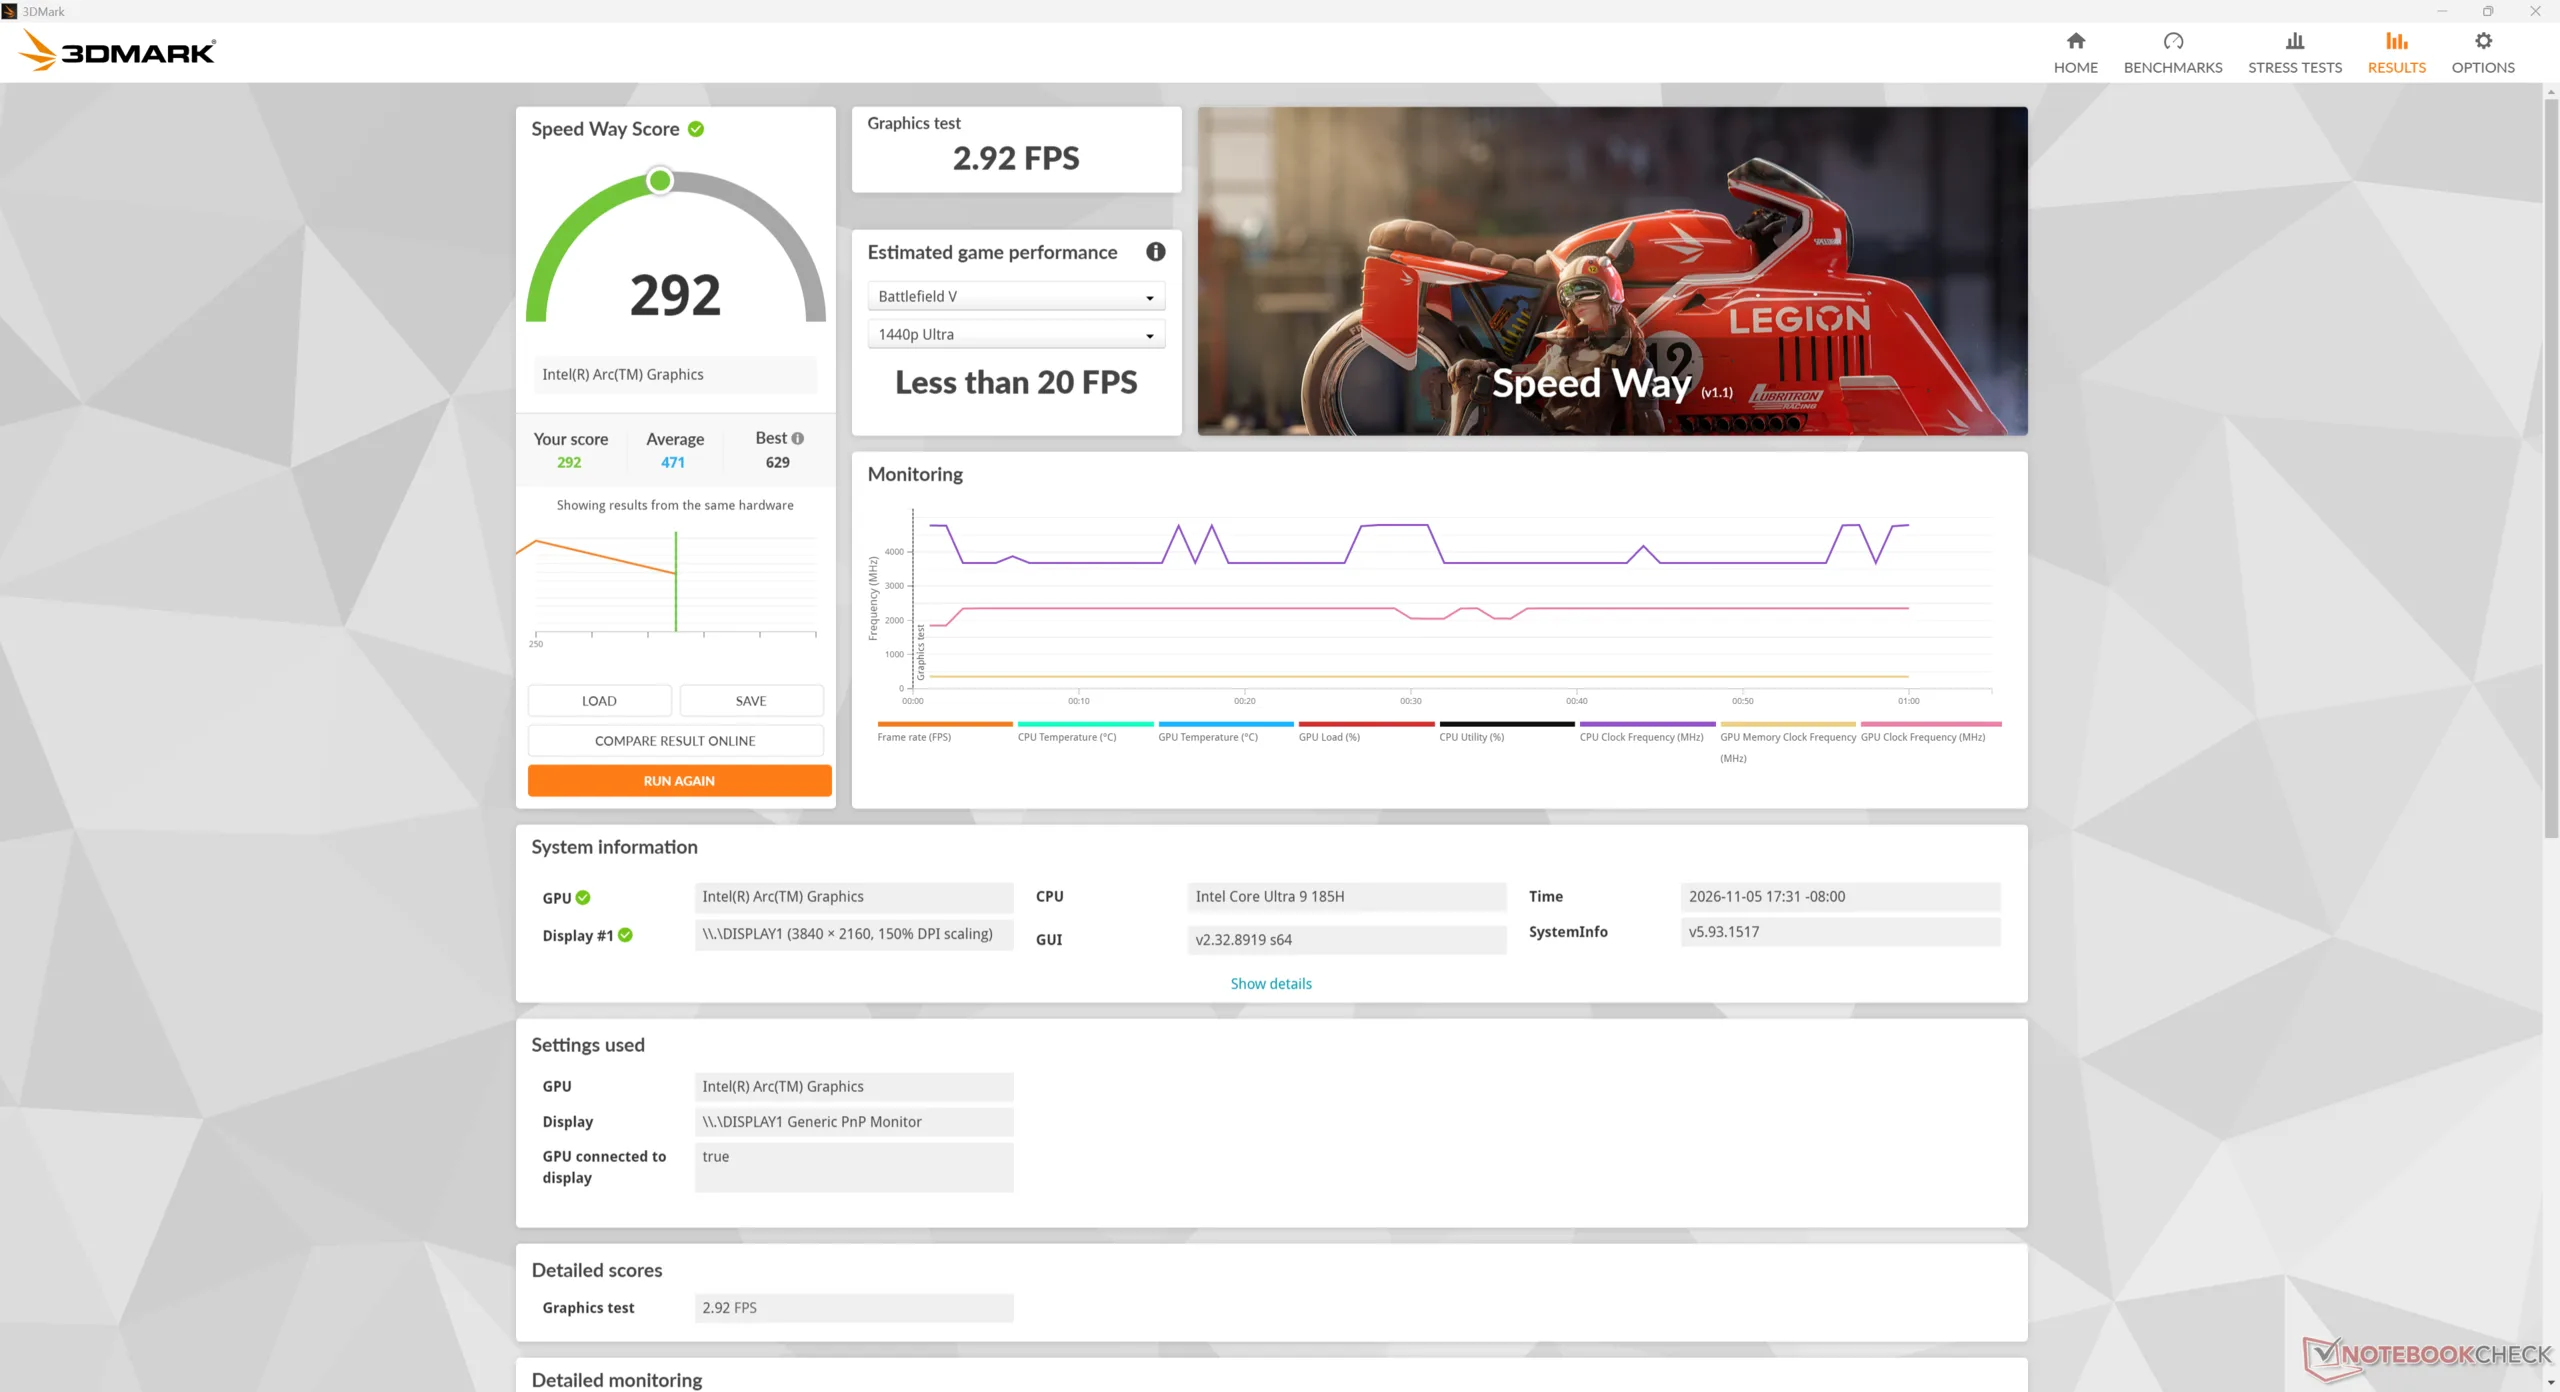
3839 Punkte
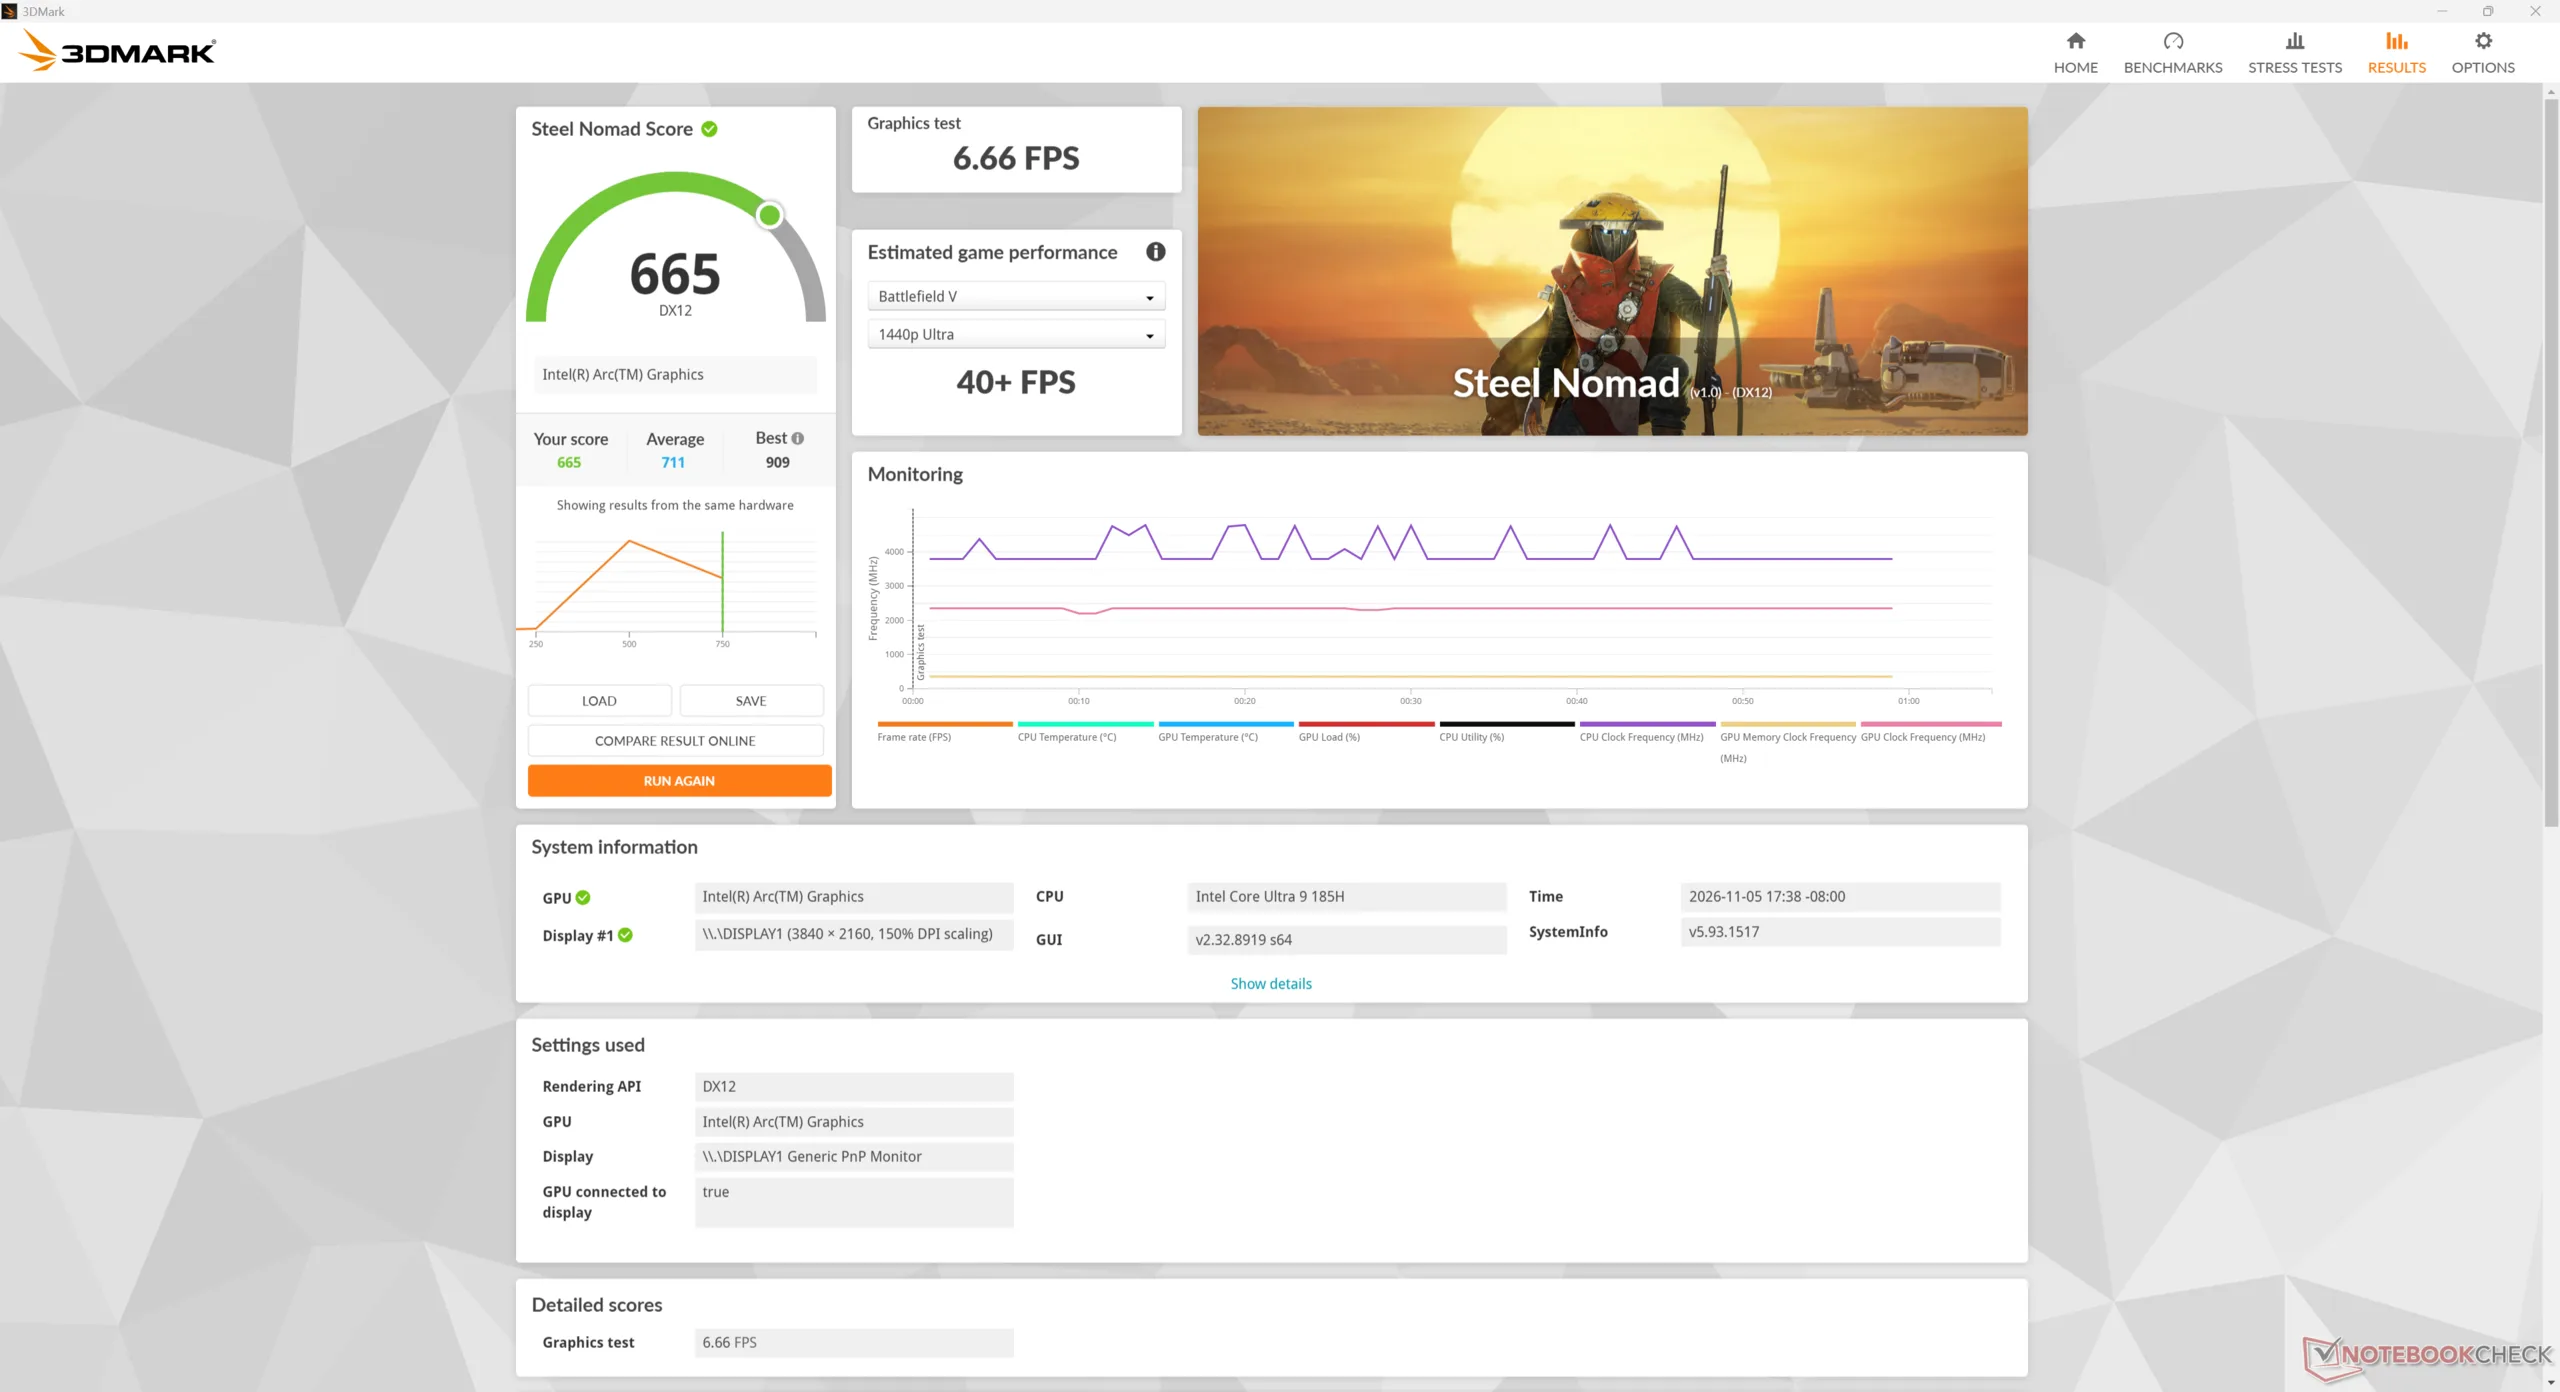
3DMark Steel Nomad Score
665 Punkte
Hilfe
Blender
v3.3 Classroom METAL
Apple Mac Mini M6
Apple M6 12-Core GPU, Apple M6
49 Seconds *
v3.3 Classroom CPU
GMK NucBox K17
Intel Arc Graphics 130V, Intel Core Ultra 5 226V
642 Seconds * -86%
Durchschnittliche Intel Arc 8-Core iGPU
  (294 - 692, n=45)
429 Seconds * -24%
Alliwava GH8, R9 8945HS
AMD Radeon 780M, AMD Ryzen 9 8945HS
357 Seconds * -3%
MSI Cubi NUC AI+ 3MG
Intel Graphics 4 Xe3 Panther Lake iGPU, Intel Core Ultra 9 386H
345 Seconds * -0%
Vzmore iX9 Max
Intel Arc 8-Core iGPU, Intel Core Ultra 9 185H
345 Seconds *
Geekom A7 Max, R9 7940HS
AMD Radeon 780M, AMD Ryzen 9 7940HS
327 Seconds * +5%
Beelink GTI15 Ultra
Intel Arc Graphics 140T, Intel Core Ultra 9 285H
302 Seconds * +12%
Minisforum M2 Pro
Intel Arc B390 12 Xe3 Panther Lake iGPU, Intel Core Ultra X7 358H
299 Seconds * +13%
Apple Mac Mini M6
Apple M6 12-Core GPU, Apple M6
231 Seconds * +33%
Vzmore AX9 Max
AMD Radeon 890M, AMD Ryzen AI 9 HX 470
225 Seconds * +35%
Minisforum MS-02 Ultra
Intel Graphics 4-Core iGPU (Meteor / Arrow Lake), Intel Core Ultra 9 285HX
152 Seconds * +56%
v3.3 Classroom oneAPI/Intel
MSI Cubi NUC AI+ 3MG
Intel Graphics 4 Xe3 Panther Lake iGPU, Intel Core Ultra 9 386H
252 Seconds * -25%
Durchschnittliche Intel Arc 8-Core iGPU
  (202 - 309, n=18)
233 Seconds * -15%
Vzmore iX9 Max
Intel Arc 8-Core iGPU, Intel Core Ultra 9 185H
202 Seconds *
Beelink GTI15 Ultra
Intel Arc Graphics 140T, Intel Core Ultra 9 285H
169 Seconds * +16%
v4.3 Barbershop CPU
GMK NucBox K17
Intel Arc Graphics 130V, Intel Core Ultra 5 226V
3291 Seconds * -88%
Durchschnittliche Intel Arc 8-Core iGPU
  (1454 - 2787, n=9)
1954 Seconds * -11%
Vzmore iX9 Max
Intel Arc 8-Core iGPU, Intel Core Ultra 9 185H
1754 Seconds *
Alliwava GH8, R9 8945HS
AMD Radeon 780M, AMD Ryzen 9 8945HS
1732 Seconds * +1%
MSI Cubi NUC AI+ 3MG
Intel Graphics 4 Xe3 Panther Lake iGPU, Intel Core Ultra 9 386H
1709 Seconds * +3%
Geekom A7 Max, R9 7940HS
AMD Radeon 780M, AMD Ryzen 9 7940HS
1616 Seconds * +8%
Beelink GTI15 Ultra
Intel Arc Graphics 140T, Intel Core Ultra 9 285H
1498 Seconds * +15%
Minisforum M2 Pro
Intel Arc B390 12 Xe3 Panther Lake iGPU, Intel Core Ultra X7 358H
1491 Seconds * +15%
Vzmore AX9 Max
AMD Radeon 890M, AMD Ryzen AI 9 HX 470
1133 Seconds * +35%
Apple Mac Mini M6
Apple M6 12-Core GPU, Apple M6
1058 Seconds * +40%
Minisforum MS-02 Ultra
Intel Graphics 4-Core iGPU (Meteor / Arrow Lake), Intel Core Ultra 9 285HX
763 Seconds * +56%
v4.3 Barbershop oneAPI
Durchschnittliche Intel Arc 8-Core iGPU
  (925 - 1176, n=2)
1051 Seconds * -14%
Vzmore iX9 Max
Intel Arc 8-Core iGPU, Intel Core Ultra 9 185H
925 Seconds *
MSI Cubi NUC AI+ 3MG
Intel Graphics 4 Xe3 Panther Lake iGPU, Intel Core Ultra 9 386H
909 Seconds * +2%
Beelink GTI15 Ultra
Intel Arc Graphics 140T, Intel Core Ultra 9 285H
672 Seconds * +27%

* ... kleinere Werte sind besser

Performance Rating - Percent
Apple Mac Mini M6 -5!
Apple M6, Apple M6 12-Core GPU
100 pt
BOSGAME VTA-439
AMD Ryzen AI 9 HX 470, AMD Radeon 890M
89.8 pt
Vzmore AX9 Max -1!
AMD Ryzen AI 9 HX 470, AMD Radeon 890M
88.1 pt
Beelink GTI15 Ultra
Intel Core Ultra 9 285H, Intel Arc Graphics 140T
67.7 pt
Vzmore iX9 Max
Intel Core Ultra 9 185H, Intel Arc 8-Core iGPU
67.6 pt
GMK NucBox K17 -2!
Intel Core Ultra 5 226V, Intel Arc Graphics 130V
59.9 pt
Cyberpunk 2077 - 1920x1080 Ultra Preset (FSR off)
Apple Mac Mini M6
Apple M6, Apple M6 12-Core GPU
37.5 fps +74%
Vzmore AX9 Max
AMD Ryzen AI 9 HX 470, AMD Radeon 890M
28.7 (23.8min, 22.8P1) fps +33%
BOSGAME VTA-439
AMD Ryzen AI 9 HX 470, AMD Radeon 890M
28.2 (23.6min, 22.7P1) fps +31%
GMK NucBox K17
Intel Core Ultra 5 226V, Intel Arc Graphics 130V
21.8 (18.1min, 16.5P1) fps +1%
Beelink GTI15 Ultra
Intel Core Ultra 9 285H, Intel Arc Graphics 140T
21.7 (18.6min, 18P1) fps +1%
Vzmore iX9 Max
Intel Core Ultra 9 185H, Intel Arc 8-Core iGPU
21.5 (18.4min, 17.7P1) fps
Baldur's Gate 3 - 1920x1080 Ultra Preset AA:T
Apple Mac Mini M6
Apple M6, Apple M6 12-Core GPU
58.1 fps +135%
BOSGAME VTA-439
AMD Ryzen AI 9 HX 470, AMD Radeon 890M
32.1 (28.2min, 28.7P0.1, 29.3P1) fps +30%
Vzmore AX9 Max
AMD Ryzen AI 9 HX 470, AMD Radeon 890M
31.5 (28.3min, 28.5P0.1, 28.8P1) fps +28%
Beelink GTI15 Ultra
Intel Core Ultra 9 285H, Intel Arc Graphics 140T
25.3 (23.1min, 23.1P0.1, 23.6P1) fps +2%
Vzmore iX9 Max
Intel Core Ultra 9 185H, Intel Arc 8-Core iGPU
24.7 (22.4min, 22.4P0.1, 22.6P1) fps
GMK NucBox K17
Intel Core Ultra 5 226V, Intel Arc Graphics 130V
22.5 (20min, 20P0.1, 20P1) fps -9%
GTA V - 1920x1080 Highest AA:4xMSAA + FX AF:16x
Vzmore AX9 Max
AMD Ryzen AI 9 HX 470, AMD Radeon 890M
32.1 (7.9min, 23.3P1) fps +104%
BOSGAME VTA-439
AMD Ryzen AI 9 HX 470, AMD Radeon 890M
31.8 (7.6min, 22.7P1) fps +103%
GMK NucBox K17
Intel Core Ultra 5 226V, Intel Arc Graphics 130V
23.6 (4.48min, 18.2P1) fps +50%
Beelink GTI15 Ultra
Intel Core Ultra 9 285H, Intel Arc Graphics 140T
17.1 (9.05min, 13.7P1) fps +9%
Vzmore iX9 Max
Intel Core Ultra 9 185H, Intel Arc 8-Core iGPU
15.7 (6.58min, 12.2P1) fps
Final Fantasy XV Benchmark - 1920x1080 High Quality
Vzmore AX9 Max
AMD Ryzen AI 9 HX 470, AMD Radeon 890M
33 fps +15%
BOSGAME VTA-439
AMD Ryzen AI 9 HX 470, AMD Radeon 890M
32.6 fps +13%
Vzmore iX9 Max
Intel Core Ultra 9 185H, Intel Arc 8-Core iGPU
28.8 fps
Beelink GTI15 Ultra
Intel Core Ultra 9 285H, Intel Arc Graphics 140T
27.2 fps -6%
Strange Brigade - 1920x1080 ultra AA:ultra AF:16
BOSGAME VTA-439
AMD Ryzen AI 9 HX 470, AMD Radeon 890M
56.1 (35.9min, 44P1) fps +6%
Vzmore AX9 Max
AMD Ryzen AI 9 HX 470, AMD Radeon 890M
55.7 (18.5min, 32.6P1) fps +6%
Vzmore iX9 Max
Intel Core Ultra 9 185H, Intel Arc 8-Core iGPU
52.7 (36.2min, 41.7P1) fps
Beelink GTI15 Ultra
Intel Core Ultra 9 285H, Intel Arc Graphics 140T
50.7 (38.7min, 41P1) fps -4%
Dota 2 Reborn - 1920x1080 ultra (3/3) best looking
BOSGAME VTA-439
AMD Ryzen AI 9 HX 470, AMD Radeon 890M
90.6 (79.1min) fps +16%
Vzmore AX9 Max
AMD Ryzen AI 9 HX 470, AMD Radeon 890M
89.5 (78min) fps +14%
Vzmore iX9 Max
Intel Core Ultra 9 185H, Intel Arc 8-Core iGPU
78.2 (53min) fps
Beelink GTI15 Ultra
Intel Core Ultra 9 285H, Intel Arc Graphics 140T
77.9 (46.9min) fps 0%
GMK NucBox K17
Intel Core Ultra 5 226V, Intel Arc Graphics 130V
77.6 (52.8min) fps -1%
X-Plane 11.11 - 1920x1080 high (fps_test=3)
BOSGAME VTA-439
AMD Ryzen AI 9 HX 470, AMD Radeon 890M
58.3 fps +75%
Beelink GTI15 Ultra
Intel Core Ultra 9 285H, Intel Arc Graphics 140T
35.4 fps +6%
Vzmore iX9 Max
Intel Core Ultra 9 185H, Intel Arc 8-Core iGPU
33.3 fps
GMK NucBox K17
Intel Core Ultra 5 226V, Intel Arc Graphics 130V
25.3 fps -24%
F1 24
1920x1080 Low Preset AA:T AF:16x
Minisforum M2 Pro
Intel Core Ultra X7 358H, Intel Arc B390 12 Xe3 Panther Lake iGPU
145.1 (126min, 103P1) fps +122%
Vzmore AX9 Max
AMD Ryzen AI 9 HX 470, AMD Radeon 890M
98.3 (85min, 72P1) fps +50%
Beelink GTI15 Ultra
Intel Core Ultra 9 285H, Intel Arc Graphics 140T
78.9 (67min, 65P1) fps +21%
GMK NucBox K17
Intel Core Ultra 5 226V, Intel Arc Graphics 130V
74.3 (65min, 55P1) fps +14%
Durchschnittliche Intel Arc 8-Core iGPU
  (55 - 84.3, n=13)
69.2 fps +6%
Alliwava GH8, R9 8945HS
AMD Ryzen 9 8945HS, AMD Radeon 780M
67.4 (56min, 54P1) fps +3%
MSI Cubi NUC AI+ 3MG
Intel Core Ultra 9 386H, Intel Graphics 4 Xe3 Panther Lake iGPU
66.9 (57min, 55P1) fps +2%
Vzmore iX9 Max
Intel Core Ultra 9 185H, Intel Arc 8-Core iGPU
65.4 (55min, 53P1) fps
Geekom A7 Max, R9 7940HS
AMD Ryzen 9 7940HS, AMD Radeon 780M
47 (37min, 30P1) fps -28%
Minisforum MS-02 Ultra
Intel Core Ultra 9 285HX, Intel Graphics 4-Core iGPU (Meteor / Arrow Lake)
44.7 (38min, 37P1) fps -32%
1920x1080 Medium Preset AA:T AF:16x
Minisforum M2 Pro
Intel Core Ultra X7 358H, Intel Arc B390 12 Xe3 Panther Lake iGPU
132.1 (115min, 96P1) fps +121%
Vzmore AX9 Max
AMD Ryzen AI 9 HX 470, AMD Radeon 890M
85.9 (75min, 65P1) fps +44%
Beelink GTI15 Ultra
Intel Core Ultra 9 285H, Intel Arc Graphics 140T
72.8 (63min, 61P1) fps +22%
GMK NucBox K17
Intel Core Ultra 5 226V, Intel Arc Graphics 130V
64.3 (56min, 51P1) fps +8%
MSI Cubi NUC AI+ 3MG
Intel Core Ultra 9 386H, Intel Graphics 4 Xe3 Panther Lake iGPU
61.5 (53min, 52P1) fps +3%
Durchschnittliche Intel Arc 8-Core iGPU
  (49.2 - 74, n=14)
61.5 fps +3%
Vzmore iX9 Max
Intel Core Ultra 9 185H, Intel Arc 8-Core iGPU
59.8 (48min, 46P1) fps
Alliwava GH8, R9 8945HS
AMD Ryzen 9 8945HS, AMD Radeon 780M
58.7 (50min, 49P1) fps -2%
Geekom A7 Max, R9 7940HS
AMD Ryzen 9 7940HS, AMD Radeon 780M
41.2 (30min, 25P1) fps -31%
Minisforum MS-02 Ultra
Intel Core Ultra 9 285HX, Intel Graphics 4-Core iGPU (Meteor / Arrow Lake)
40.1 (34min, 34P1) fps -33%
1920x1080 High Preset AA:T AF:16x
Minisforum M2 Pro
Intel Core Ultra X7 358H, Intel Arc B390 12 Xe3 Panther Lake iGPU
102.1 (89min, 76P1) fps +121%
Vzmore AX9 Max
AMD Ryzen AI 9 HX 470, AMD Radeon 890M
65.5 (57min, 54P1) fps +42%
Beelink GTI15 Ultra
Intel Core Ultra 9 285H, Intel Arc Graphics 140T
53.8 (46min, 46P1) fps +16%
GMK NucBox K17
Intel Core Ultra 5 226V, Intel Arc Graphics 130V
47.1 (39min, 37P1) fps +2%
Durchschnittliche Intel Arc 8-Core iGPU
  (38.9 - 54.8, n=13)
46.9 fps +2%
Vzmore iX9 Max
Intel Core Ultra 9 185H, Intel Arc 8-Core iGPU
46.2 (37min, 36P1) fps
MSI Cubi NUC AI+ 3MG
Intel Core Ultra 9 386H, Intel Graphics 4 Xe3 Panther Lake iGPU
45.8 (39min, 38P1) fps -1%
Alliwava GH8, R9 8945HS
AMD Ryzen 9 8945HS, AMD Radeon 780M
41.7 (36min, 33P1) fps -10%
Geekom A7 Max, R9 7940HS
AMD Ryzen 9 7940HS, AMD Radeon 780M
30.9 (10min, 21P1) fps -33%
Minisforum MS-02 Ultra
Intel Core Ultra 9 285HX, Intel Graphics 4-Core iGPU (Meteor / Arrow Lake)
29.8 (26min, 25P1) fps -35%
1920x1080 Ultra High Preset AA:T AF:16x
Minisforum M2 Pro
Intel Core Ultra X7 358H, Intel Arc B390 12 Xe3 Panther Lake iGPU
35.5 (14min, 17P1) fps +150%
Beelink GTI15 Ultra
Intel Core Ultra 9 285H, Intel Arc Graphics 140T
17.1 (14min, 14P1) fps +20%
Vzmore AX9 Max
AMD Ryzen AI 9 HX 470, AMD Radeon 890M
15.3 (11min, 11P1) fps +8%
GMK NucBox K17
Intel Core Ultra 5 226V, Intel Arc Graphics 130V
14.8 (11min, 10P1) fps +4%
MSI Cubi NUC AI+ 3MG
Intel Core Ultra 9 386H, Intel Graphics 4 Xe3 Panther Lake iGPU
14.2 (11min, 11P1) fps 0%
Vzmore iX9 Max
Intel Core Ultra 9 185H, Intel Arc 8-Core iGPU
14.2 (11min, 11P1) fps
Durchschnittliche Intel Arc 8-Core iGPU
  (12 - 14.3, n=6)
13.4 fps -6%
Alliwava GH8, R9 8945HS
AMD Ryzen 9 8945HS, AMD Radeon 780M
9.63 (7min, 7P1) fps -32%
Minisforum MS-02 Ultra
Intel Core Ultra 9 285HX, Intel Graphics 4-Core iGPU (Meteor / Arrow Lake)
8.05 (6min, 6P1) fps -43%
GTA V
1024x768 Lowest Settings possible
Beelink GTI15 Ultra
Intel Core Ultra 9 285H, Intel Arc Graphics 140T
178.3 (3.18min, 125P1) fps +11%
Vzmore AX9 Max
AMD Ryzen AI 9 HX 470, AMD Radeon 890M
177 (3.41min, 100P1) fps +10%
Minisforum MS-02 Ultra
Intel Core Ultra 9 285HX, Intel Graphics 4-Core iGPU (Meteor / Arrow Lake)
168 (3.46min, 100P1) fps +4%
Minisforum M2 Pro
Intel Core Ultra X7 358H, Intel Arc B390 12 Xe3 Panther Lake iGPU
167.9 (2.84min, 100P1) fps +4%
Alliwava GH8, R9 8945HS
AMD Ryzen 9 8945HS, AMD Radeon 780M
162.3 (5.21min, 111.1P1) fps +1%
Vzmore iX9 Max
Intel Core Ultra 9 185H, Intel Arc 8-Core iGPU
160.8 (4.78min, 100P1) fps
MSI Cubi NUC AI+ 3MG
Intel Core Ultra 9 386H, Intel Graphics 4 Xe3 Panther Lake iGPU
157.9 (4.38min, 100P1) fps -2%
Durchschnittliche Intel Arc 8-Core iGPU
  (50.6 - 175, n=41)
145.8 fps -9%
GMK NucBox K17
Intel Core Ultra 5 226V, Intel Arc Graphics 130V
115.9 (16.7min, 71.4P1) fps -28%
Geekom A7 Max, R9 7940HS
AMD Ryzen 9 7940HS, AMD Radeon 780M
107.9 (16.9min, 71.4P1) fps -33%
1920x1080 Lowest Settings possible
Minisforum M2 Pro
Intel Core Ultra X7 358H, Intel Arc B390 12 Xe3 Panther Lake iGPU
163.9 (4.59min, 111.1P1) fps +31%
Vzmore AX9 Max
AMD Ryzen AI 9 HX 470, AMD Radeon 890M
154.5 (4.6min, 111.1P1) fps +24%
Beelink GTI15 Ultra
Intel Core Ultra 9 285H, Intel Arc Graphics 140T
149.2 (4.34min, 100P1) fps +20%
MSI Cubi NUC AI+ 3MG
Intel Core Ultra 9 386H, Intel Graphics 4 Xe3 Panther Lake iGPU
144.6 (4.58min, 90.9P1) fps +16%
Vzmore iX9 Max
Intel Core Ultra 9 185H, Intel Arc 8-Core iGPU
124.8 (9.76min, 83.3P1) fps
Alliwava GH8, R9 8945HS
AMD Ryzen 9 8945HS, AMD Radeon 780M
123.3 (19.6min, 83.3P1) fps -1%
Durchschnittliche Intel Arc 8-Core iGPU
  (45.6 - 167.5, n=25)
122.5 fps -2%
GMK NucBox K17
Intel Core Ultra 5 226V, Intel Arc Graphics 130V
115.3 (22.2min, 71.4P1) fps -8%
Minisforum MS-02 Ultra
Intel Core Ultra 9 285HX, Intel Graphics 4-Core iGPU (Meteor / Arrow Lake)
104.4 (33min, 71.4P1) fps -16%
Geekom A7 Max, R9 7940HS
AMD Ryzen 9 7940HS, AMD Radeon 780M
67.6 (18.1min, 45.5P1) fps -46%
1366x768 Normal/Off AF:4x
Beelink GTI15 Ultra
Intel Core Ultra 9 285H, Intel Arc Graphics 140T
169.3 (3.18min, 111.1P1) fps +14%
Minisforum M2 Pro
Intel Core Ultra X7 358H, Intel Arc B390 12 Xe3 Panther Lake iGPU
162.2 (4.16min, 100P1) fps +9%
Alliwava GH8, R9 8945HS
AMD Ryzen 9 8945HS, AMD Radeon 780M
152.4 (4.71min, 111.1P1) fps +2%
MSI Cubi NUC AI+ 3MG
Intel Core Ultra 9 386H, Intel Graphics 4 Xe3 Panther Lake iGPU
149.5 (4.51min, 90.9P1) fps 0%
Vzmore iX9 Max
Intel Core Ultra 9 185H, Intel Arc 8-Core iGPU
149 (4.59min, 83.3P1) fps
Minisforum MS-02 Ultra
Intel Core Ultra 9 285HX, Intel Graphics 4-Core iGPU (Meteor / Arrow Lake)
141 (4.74min, 90.9P1) fps -5%
Durchschnittliche Intel Arc 8-Core iGPU
  (51.1 - 169.3, n=42)
134.3 fps -10%
GMK NucBox K17
Intel Core Ultra 5 226V, Intel Arc Graphics 130V
111.1 (7.16min, 66.7P1) fps -25%
Geekom A7 Max, R9 7940HS
AMD Ryzen 9 7940HS, AMD Radeon 780M
97.1 (7.78min, 62.5P1) fps -35%
1920x1080 Normal/Off AF:4x
Minisforum M2 Pro
Intel Core Ultra X7 358H, Intel Arc B390 12 Xe3 Panther Lake iGPU
157.4 (4.15min, 83.3P1) fps +42%
Vzmore AX9 Max
AMD Ryzen AI 9 HX 470, AMD Radeon 890M
156.2 (4.22min, 100P1) fps +40%
MSI Cubi NUC AI+ 3MG
Intel Core Ultra 9 386H, Intel Graphics 4 Xe3 Panther Lake iGPU
139.2 (6.59min, 83.3P1) fps +25%
Beelink GTI15 Ultra
Intel Core Ultra 9 285H, Intel Arc Graphics 140T
133.4 (6.17min, 90.9P1) fps +20%
Alliwava GH8, R9 8945HS
AMD Ryzen 9 8945HS, AMD Radeon 780M
126.7 (20.9min, 83.3P1) fps +14%
Durchschnittliche Intel Arc 8-Core iGPU
  (45.1 - 156, n=24)
111.7 fps 0%
Vzmore iX9 Max
Intel Core Ultra 9 185H, Intel Arc 8-Core iGPU
111.2 (40.4min, 76.9P1) fps
GMK NucBox K17
Intel Core Ultra 5 226V, Intel Arc Graphics 130V
108.4 (22.1min, 62.5P1) fps -3%
Minisforum MS-02 Ultra
Intel Core Ultra 9 285HX, Intel Graphics 4-Core iGPU (Meteor / Arrow Lake)
90.8 (6.18min, 62.5P1) fps -18%
Geekom A7 Max, R9 7940HS
AMD Ryzen 9 7940HS, AMD Radeon 780M
71.8 (20.9min, 47.6P1) fps -35%
1920x1080 High/On (Advanced Graphics Off) AA:2xMSAA + FX AF:8x
Minisforum M2 Pro
Intel Core Ultra X7 358H, Intel Arc B390 12 Xe3 Panther Lake iGPU
102 (2.98min, 71.4P1) fps +169%
Vzmore AX9 Max
AMD Ryzen AI 9 HX 470, AMD Radeon 890M
77.5 (7.18min, 52.6P1) fps +104%
Alliwava GH8, R9 8945HS
AMD Ryzen 9 8945HS, AMD Radeon 780M
58.3 (7.99min, 40P1) fps +54%
GMK NucBox K17
Intel Core Ultra 5 226V, Intel Arc Graphics 130V
57.9 (5.01min, 41.7P1) fps +53%
MSI Cubi NUC AI+ 3MG
Intel Core Ultra 9 386H, Intel Graphics 4 Xe3 Panther Lake iGPU
51.1 (6.55min, 40P1) fps +35%
Beelink GTI15 Ultra
Intel Core Ultra 9 285H, Intel Arc Graphics 140T
40.9 (6.4min, 33.3P1) fps +8%
Vzmore iX9 Max
Intel Core Ultra 9 185H, Intel Arc 8-Core iGPU
37.9 (9.02min, 30.3P1) fps
Durchschnittliche Intel Arc 8-Core iGPU
  (19.1 - 51.2, n=43)
36.1 fps -5%
Geekom A7 Max, R9 7940HS
AMD Ryzen 9 7940HS, AMD Radeon 780M
33.7 (4.68min, 22.7P1) fps -11%
Minisforum MS-02 Ultra
Intel Core Ultra 9 285HX, Intel Graphics 4-Core iGPU (Meteor / Arrow Lake)
27 (9min, 21.7P1) fps -29%
1920x1080 Highest AA:4xMSAA + FX AF:16x
Minisforum M2 Pro
Intel Core Ultra X7 358H, Intel Arc B390 12 Xe3 Panther Lake iGPU
41.6 (10.8min, 31.3P1) fps +165%
Vzmore AX9 Max
AMD Ryzen AI 9 HX 470, AMD Radeon 890M
32.1 (7.9min, 23.3P1) fps +104%
Alliwava GH8, R9 8945HS
AMD Ryzen 9 8945HS, AMD Radeon 780M
25.3 (5.49min, 17.9P1) fps +61%
GMK NucBox K17
Intel Core Ultra 5 226V, Intel Arc Graphics 130V
23.6 (4.48min, 18.2P1) fps +50%
MSI Cubi NUC AI+ 3MG
Intel Core Ultra 9 386H, Intel Graphics 4 Xe3 Panther Lake iGPU
20.4 (5.58min, 15.9P1) fps +30%
Beelink GTI15 Ultra
Intel Core Ultra 9 285H, Intel Arc Graphics 140T
17.1 (9.05min, 13.7P1) fps +9%
Vzmore iX9 Max
Intel Core Ultra 9 185H, Intel Arc 8-Core iGPU
15.7 (6.58min, 12.2P1) fps
Durchschnittliche Intel Arc 8-Core iGPU
  (9.59 - 20.6, n=41)
14.7 fps -6%
Geekom A7 Max, R9 7940HS
AMD Ryzen 9 7940HS, AMD Radeon 780M
13.8 (2.14min, 9.26P1) fps -12%
Minisforum MS-02 Ultra
Intel Core Ultra 9 285HX, Intel Graphics 4-Core iGPU (Meteor / Arrow Lake)
11.1 (4.66min, 9.01P1) fps -29%
Dota 2 Reborn
1280x720 min (0/3) fastest
Vzmore AX9 Max
AMD Ryzen AI 9 HX 470, AMD Radeon 890M
180.9 (160min) fps +421%
Alliwava GH8, R9 8945HS
AMD Ryzen 9 8945HS, AMD Radeon 780M
152.2 (128.4min) fps +339%
Geekom A7 Max, R9 7940HS
AMD Ryzen 9 7940HS, AMD Radeon 780M
128.5 (114.3min) fps +270%
Minisforum M2 Pro
Intel Core Ultra X7 358H, Intel Arc B390 12 Xe3 Panther Lake iGPU
126.7 (70.6min) fps +265%
Beelink GTI15 Ultra
Intel Core Ultra 9 285H, Intel Arc Graphics 140T
109.7 (61min) fps +216%
Minisforum MS-02 Ultra
Intel Core Ultra 9 285HX, Intel Graphics 4-Core iGPU (Meteor / Arrow Lake)
108.9 (39.1min) fps +214%
MSI Cubi NUC AI+ 3MG
Intel Core Ultra 9 386H, Intel Graphics 4 Xe3 Panther Lake iGPU
104.1 (69.1min) fps +200%
Durchschnittliche Intel Arc 8-Core iGPU
  (34.7 - 110.5, n=48)
99.4 fps +186%
GMK NucBox K17
Intel Core Ultra 5 226V, Intel Arc Graphics 130V
94.5 (66.9min) fps +172%
Vzmore iX9 Max
Intel Core Ultra 9 185H, Intel Arc 8-Core iGPU
34.7 (8.6min) fps
1366x768 med (1/3)
Vzmore AX9 Max
AMD Ryzen AI 9 HX 470, AMD Radeon 890M
148 (128min) fps +327%
Alliwava GH8, R9 8945HS
AMD Ryzen 9 8945HS, AMD Radeon 780M
109.2 (90.4min) fps +215%
Beelink GTI15 Ultra
Intel Core Ultra 9 285H, Intel Arc Graphics 140T
100.4 (56.3min) fps +189%
Minisforum MS-02 Ultra
Intel Core Ultra 9 285HX, Intel Graphics 4-Core iGPU (Meteor / Arrow Lake)
95.1 (47.2min) fps +174%
Minisforum M2 Pro
Intel Core Ultra X7 358H, Intel Arc B390 12 Xe3 Panther Lake iGPU
94.1 (59.5min) fps +171%
Geekom A7 Max, R9 7940HS
AMD Ryzen 9 7940HS, AMD Radeon 780M
93.3 (80.9min) fps +169%
Durchschnittliche Intel Arc 8-Core iGPU
  (34.7 - 99.9, n=48)
82.6 fps +138%
MSI Cubi NUC AI+ 3MG
Intel Core Ultra 9 386H, Intel Graphics 4 Xe3 Panther Lake iGPU
80.3 (57.7min) fps +131%
GMK NucBox K17
Intel Core Ultra 5 226V, Intel Arc Graphics 130V
78.9 (49.3min) fps +127%
Vzmore iX9 Max
Intel Core Ultra 9 185H, Intel Arc 8-Core iGPU
34.7 (32.2min) fps
1920x1080 high (2/3)
Minisforum M2 Pro
Intel Core Ultra X7 358H, Intel Arc B390 12 Xe3 Panther Lake iGPU
103.9 (72.5min) fps +204%
Vzmore AX9 Max
AMD Ryzen AI 9 HX 470, AMD Radeon 890M
101.8 (89.7min) fps +198%
Alliwava GH8, R9 8945HS
AMD Ryzen 9 8945HS, AMD Radeon 780M
84.8 (74.3min) fps +148%
Beelink GTI15 Ultra
Intel Core Ultra 9 285H, Intel Arc Graphics 140T
82.6 (47.5min) fps +142%
MSI Cubi NUC AI+ 3MG
Intel Core Ultra 9 386H, Intel Graphics 4 Xe3 Panther Lake iGPU
81.2 (53.8min) fps +137%
Durchschnittliche Intel Arc 8-Core iGPU
  (34.2 - 87.8, n=48)
69.9 fps +104%
Minisforum MS-02 Ultra
Intel Core Ultra 9 285HX, Intel Graphics 4-Core iGPU (Meteor / Arrow Lake)
66.7 (32min) fps +95%
Geekom A7 Max, R9 7940HS
AMD Ryzen 9 7940HS, AMD Radeon 780M
65 (58min) fps +90%
GMK NucBox K17
Intel Core Ultra 5 226V, Intel Arc Graphics 130V
52.3 (25.3min) fps +53%
Vzmore iX9 Max
Intel Core Ultra 9 185H, Intel Arc 8-Core iGPU
34.2 (32.8min) fps
1920x1080 ultra (3/3) best looking
Minisforum M2 Pro
Intel Core Ultra X7 358H, Intel Arc B390 12 Xe3 Panther Lake iGPU
100.3 (73.2min) fps +28%
Vzmore AX9 Max
AMD Ryzen AI 9 HX 470, AMD Radeon 890M
89.5 (78min) fps +14%
MSI Cubi NUC AI+ 3MG
Intel Core Ultra 9 386H, Intel Graphics 4 Xe3 Panther Lake iGPU
79.9 (53.3min) fps +2%
Vzmore iX9 Max
Intel Core Ultra 9 185H, Intel Arc 8-Core iGPU
78.2 (53min) fps
Beelink GTI15 Ultra
Intel Core Ultra 9 285H, Intel Arc Graphics 140T
77.9 (46.9min) fps 0%
GMK NucBox K17
Intel Core Ultra 5 226V, Intel Arc Graphics 130V
77.6 (52.8min) fps -1%
Alliwava GH8, R9 8945HS
AMD Ryzen 9 8945HS, AMD Radeon 780M
74.6 (65.7min) fps -5%
Durchschnittliche Intel Arc 8-Core iGPU
  (35.2 - 80.9, n=48)
67.8 fps -13%
Minisforum MS-02 Ultra
Intel Core Ultra 9 285HX, Intel Graphics 4-Core iGPU (Meteor / Arrow Lake)
59.9 (31.7min) fps -23%
Geekom A7 Max, R9 7940HS
AMD Ryzen 9 7940HS, AMD Radeon 780M
58.2 (51.9min) fps -26%
Final Fantasy XV Benchmark
1280x720 Lite Quality
Minisforum M2 Pro
Intel Core Ultra X7 358H, Intel Arc B390 12 Xe3 Panther Lake iGPU
141 fps +115%
Minisforum M2 Pro
Intel Core Ultra X7 358H, Intel Arc B390 12 Xe3 Panther Lake iGPU
134.5 fps +105%
Vzmore AX9 Max
AMD Ryzen AI 9 HX 470, AMD Radeon 890M
90 fps +37%
Beelink GTI15 Ultra
Intel Core Ultra 9 285H, Intel Arc Graphics 140T
74.2 fps +13%
Alliwava GH8, R9 8945HS
AMD Ryzen 9 8945HS, AMD Radeon 780M
66.1 fps +1%
Vzmore iX9 Max
Intel Core Ultra 9 185H, Intel Arc 8-Core iGPU
65.7 fps
MSI Cubi NUC AI+ 3MG
Intel Core Ultra 9 386H, Intel Graphics 4 Xe3 Panther Lake iGPU
64.3 fps -2%
Durchschnittliche Intel Arc 8-Core iGPU
  (35.6 - 85.9, n=45)
63.3 fps -4%
Minisforum MS-02 Ultra
Intel Core Ultra 9 285HX, Intel Graphics 4-Core iGPU (Meteor / Arrow Lake)
51.8 fps -21%
Geekom A7 Max, R9 7940HS
AMD Ryzen 9 7940HS, AMD Radeon 780M
44.4 fps -32%
1920x1080 Standard Quality
Minisforum M2 Pro
Intel Core Ultra X7 358H, Intel Arc B390 12 Xe3 Panther Lake iGPU
76.9 fps +94%
Minisforum M2 Pro
Intel Core Ultra X7 358H, Intel Arc B390 12 Xe3 Panther Lake iGPU
75.9 fps +91%
Vzmore AX9 Max
AMD Ryzen AI 9 HX 470, AMD Radeon 890M
45.9 fps +16%
Vzmore iX9 Max
Intel Core Ultra 9 185H, Intel Arc 8-Core iGPU
39.7 fps
Beelink GTI15 Ultra
Intel Core Ultra 9 285H, Intel Arc Graphics 140T
38.9 fps -2%
Durchschnittliche Intel Arc 8-Core iGPU
  (28 - 45.9, n=47)
36.7 fps -8%
MSI Cubi NUC AI+ 3MG
Intel Core Ultra 9 386H, Intel Graphics 4 Xe3 Panther Lake iGPU
34.6 fps -13%
Alliwava GH8, R9 8945HS
AMD Ryzen 9 8945HS, AMD Radeon 780M
34.4 fps -13%
Minisforum MS-02 Ultra
Intel Core Ultra 9 285HX, Intel Graphics 4-Core iGPU (Meteor / Arrow Lake)
25.5 fps -36%
Geekom A7 Max, R9 7940HS
AMD Ryzen 9 7940HS, AMD Radeon 780M
22.2 fps -44%
1920x1080 High Quality
Minisforum M2 Pro
Intel Core Ultra X7 358H, Intel Arc B390 12 Xe3 Panther Lake iGPU
55.4 fps +92%
Minisforum M2 Pro
Intel Core Ultra X7 358H, Intel Arc B390 12 Xe3 Panther Lake iGPU
54.6 fps +90%
Vzmore AX9 Max
AMD Ryzen AI 9 HX 470, AMD Radeon 890M
33 fps +15%
Vzmore iX9 Max
Intel Core Ultra 9 185H, Intel Arc 8-Core iGPU
28.8 fps
Beelink GTI15 Ultra
Intel Core Ultra 9 285H, Intel Arc Graphics 140T
27.2 fps -6%
MSI Cubi NUC AI+ 3MG
Intel Core Ultra 9 386H, Intel Graphics 4 Xe3 Panther Lake iGPU
25.1 fps -13%
Durchschnittliche Intel Arc 8-Core iGPU
  (14.7 - 31.7, n=48)
25 fps -13%
Alliwava GH8, R9 8945HS
AMD Ryzen 9 8945HS, AMD Radeon 780M
24.2 fps -16%
Minisforum MS-02 Ultra
Intel Core Ultra 9 285HX, Intel Graphics 4-Core iGPU (Meteor / Arrow Lake)
17.9 fps -38%
Geekom A7 Max, R9 7940HS
AMD Ryzen 9 7940HS, AMD Radeon 780M
16.3 fps -43%
X-Plane 11.11
1280x720 low (fps_test=1)
Minisforum M2 Pro
Intel Core Ultra X7 358H, Intel Arc B390 12 Xe3 Panther Lake iGPU
70.4 fps +54%
Minisforum MS-02 Ultra
Intel Core Ultra 9 285HX, Intel Graphics 4-Core iGPU (Meteor / Arrow Lake)
59.3 fps +30%
Geekom A7 Max, R9 7940HS
AMD Ryzen 9 7940HS, AMD Radeon 780M
55.3 fps +21%
Beelink GTI15 Ultra
Intel Core Ultra 9 285H, Intel Arc Graphics 140T
55.2 fps +21%
Durchschnittliche Intel Arc 8-Core iGPU
  (44.6 - 66.6, n=49)
53.3 fps +17%
Alliwava GH8, R9 8945HS
AMD Ryzen 9 8945HS, AMD Radeon 780M
47.1 fps +3%
Vzmore iX9 Max
Intel Core Ultra 9 185H, Intel Arc 8-Core iGPU
45.6 fps
MSI Cubi NUC AI+ 3MG
Intel Core Ultra 9 386H, Intel Graphics 4 Xe3 Panther Lake iGPU
41.7 fps -9%
GMK NucBox K17
Intel Core Ultra 5 226V, Intel Arc Graphics 130V
34.8 fps -24%
1920x1080 med (fps_test=2)
Minisforum M2 Pro
Intel Core Ultra X7 358H, Intel Arc B390 12 Xe3 Panther Lake iGPU
57 fps +57%
Minisforum MS-02 Ultra
Intel Core Ultra 9 285HX, Intel Graphics 4-Core iGPU (Meteor / Arrow Lake)
42.4 fps +17%
Durchschnittliche Intel Arc 8-Core iGPU
  (31.1 - 52.1, n=50)
41.2 fps +13%
Geekom A7 Max, R9 7940HS
AMD Ryzen 9 7940HS, AMD Radeon 780M
40.5 fps +12%
Beelink GTI15 Ultra
Intel Core Ultra 9 285H, Intel Arc Graphics 140T
39.2 fps +8%
Vzmore iX9 Max
Intel Core Ultra 9 185H, Intel Arc 8-Core iGPU
36.3 fps
Alliwava GH8, R9 8945HS
AMD Ryzen 9 8945HS, AMD Radeon 780M
35.2 fps -3%
MSI Cubi NUC AI+ 3MG
Intel Core Ultra 9 386H, Intel Graphics 4 Xe3 Panther Lake iGPU
33.2 fps -9%
GMK NucBox K17
Intel Core Ultra 5 226V, Intel Arc Graphics 130V
29.3 fps -19%
1920x1080 high (fps_test=3)
Minisforum M2 Pro
Intel Core Ultra X7 358H, Intel Arc B390 12 Xe3 Panther Lake iGPU
44.2 fps +33%
Minisforum MS-02 Ultra
Intel Core Ultra 9 285HX, Intel Graphics 4-Core iGPU (Meteor / Arrow Lake)
35.9 fps +8%
Beelink GTI15 Ultra
Intel Core Ultra 9 285H, Intel Arc Graphics 140T
35.4 fps +6%
Geekom A7 Max, R9 7940HS
AMD Ryzen 9 7940HS, AMD Radeon 780M
34.8 fps +5%
Durchschnittliche Intel Arc 8-Core iGPU
  (27.9 - 43.9, n=49)
34.7 fps +4%
Vzmore iX9 Max
Intel Core Ultra 9 185H, Intel Arc 8-Core iGPU
33.3 fps
Alliwava GH8, R9 8945HS
AMD Ryzen 9 8945HS, AMD Radeon 780M
29.6 fps -11%
MSI Cubi NUC AI+ 3MG
Intel Core Ultra 9 386H, Intel Graphics 4 Xe3 Panther Lake iGPU
28.6 fps -14%
GMK NucBox K17
Intel Core Ultra 5 226V, Intel Arc Graphics 130V
25.3 fps -24%
Strange Brigade
1280x720 lowest AF:1
Minisforum M2 Pro
Intel Core Ultra X7 358H, Intel Arc B390 12 Xe3 Panther Lake iGPU
327 (58.9min, 250P1) fps +85%
Vzmore AX9 Max
AMD Ryzen AI 9 HX 470, AMD Radeon 890M
190.5 (51.8min, 161.8P1) fps +8%
Beelink GTI15 Ultra
Intel Core Ultra 9 285H, Intel Arc Graphics 140T
178.7 (82.4min, 153.9P1) fps +1%
Vzmore iX9 Max
Intel Core Ultra 9 185H, Intel Arc 8-Core iGPU
176.7 (72.2min, 150.5P1) fps
MSI Cubi NUC AI+ 3MG
Intel Core Ultra 9 386H, Intel Graphics 4 Xe3 Panther Lake iGPU
172.6 (94.2min, 143.1P1) fps -2%
Durchschnittliche Intel Arc 8-Core iGPU
  (120 - 208, n=43)
161 fps -9%
1920x1080 medium AA:medium AF:4
Minisforum M2 Pro
Intel Core Ultra X7 358H, Intel Arc B390 12 Xe3 Panther Lake iGPU
122.6 (36.9min, 91.9P1) fps +60%
Vzmore AX9 Max
AMD Ryzen AI 9 HX 470, AMD Radeon 890M
76.5 (40.5min, 64P1) fps 0%
Vzmore iX9 Max
Intel Core Ultra 9 185H, Intel Arc 8-Core iGPU
76.4 (42.7min, 64.5P1) fps
Beelink GTI15 Ultra
Intel Core Ultra 9 285H, Intel Arc Graphics 140T
73.1 (60.1min, 63.9P1) fps -4%
Durchschnittliche Intel Arc 8-Core iGPU
  (51.1 - 88, n=43)
69.7 fps -9%
MSI Cubi NUC AI+ 3MG
Intel Core Ultra 9 386H, Intel Graphics 4 Xe3 Panther Lake iGPU
68 (37min, 59.1P1) fps -11%
1920x1080 high AA:high AF:8
Minisforum M2 Pro
Intel Core Ultra X7 358H, Intel Arc B390 12 Xe3 Panther Lake iGPU
102.9 (33min, 72.7P1) fps +59%
Vzmore AX9 Max
AMD Ryzen AI 9 HX 470, AMD Radeon 890M
65.1 (26.6min, 50P1) fps +1%
Vzmore iX9 Max
Intel Core Ultra 9 185H, Intel Arc 8-Core iGPU
64.6 (46.4min, 52.4P1) fps
Beelink GTI15 Ultra
Intel Core Ultra 9 285H, Intel Arc Graphics 140T
60.9 (45.8min, 48.3P1) fps -6%
MSI Cubi NUC AI+ 3MG
Intel Core Ultra 9 386H, Intel Graphics 4 Xe3 Panther Lake iGPU
56.9 (38.5min, 45.8P1) fps -12%
Durchschnittliche Intel Arc 8-Core iGPU
  (39 - 74, n=43)
56.9 fps -12%
1920x1080 ultra AA:ultra AF:16
Minisforum M2 Pro
Intel Core Ultra X7 358H, Intel Arc B390 12 Xe3 Panther Lake iGPU
92 (31.5min, 49.7P1) fps +75%
Vzmore AX9 Max
AMD Ryzen AI 9 HX 470, AMD Radeon 890M
55.7 (18.5min, 32.6P1) fps +6%
Vzmore iX9 Max
Intel Core Ultra 9 185H, Intel Arc 8-Core iGPU
52.7 (36.2min, 41.7P1) fps
Beelink GTI15 Ultra
Intel Core Ultra 9 285H, Intel Arc Graphics 140T
50.7 (38.7min, 41P1) fps -4%
MSI Cubi NUC AI+ 3MG
Intel Core Ultra 9 386H, Intel Graphics 4 Xe3 Panther Lake iGPU
48.5 (33.7min, 37.6P1) fps -8%
Durchschnittliche Intel Arc 8-Core iGPU
  (27.1 - 58.9, n=44)
45 fps -15%
Baldur's Gate 3
1280x720 Low Preset AA:SM
Minisforum M2 Pro
Intel Core Ultra X7 358H, Intel Arc B390 12 Xe3 Panther Lake iGPU
87.3 (68.3min, 72P0.1, 75.1P1) fps +73%
Vzmore AX9 Max
AMD Ryzen AI 9 HX 470, AMD Radeon 890M
75.5 (54min, 57.5P0.1, 63.5P1) fps +50%
Alliwava GH8, R9 8945HS
AMD Ryzen 9 8945HS, AMD Radeon 780M
52.9 (43.8min, 44.6P0.1, 45.9P1) fps +5%
Beelink GTI15 Ultra
Intel Core Ultra 9 285H, Intel Arc Graphics 140T
51.3 (42.4min, 44.5P0.1, 47.6P1) fps +2%
Vzmore iX9 Max
Intel Core Ultra 9 185H, Intel Arc 8-Core iGPU
50.5 (41.2min, 41.7P0.1, 44.4P1) fps
GMK NucBox K17
Intel Core Ultra 5 226V, Intel Arc Graphics 130V
47.7 (29.8min, 29.9P0.1, 30P1) fps -6%
Durchschnittliche Intel Arc 8-Core iGPU
  (31.8 - 57.6, n=17)
47.2 fps -7%
MSI Cubi NUC AI+ 3MG
Intel Core Ultra 9 386H, Intel Graphics 4 Xe3 Panther Lake iGPU
45.3 (38min, 38.7P0.1, 41.3P1) fps -10%
Geekom A7 Max, R9 7940HS
AMD Ryzen 9 7940HS, AMD Radeon 780M
38.5 (27.4min, 28.6P0.1, 31.5P1) fps -24%
Minisforum MS-02 Ultra
Intel Core Ultra 9 285HX, Intel Graphics 4-Core iGPU (Meteor / Arrow Lake)
32.8 (25.1min, 26.5P0.1, 27.8P1) fps -35%
1920x1080 Low Preset AA:SM
Apple Mac Mini M6
Apple M6, Apple M6 12-Core GPU
84.8 fps +135%
Minisforum M2 Pro
Intel Core Ultra X7 358H, Intel Arc B390 12 Xe3 Panther Lake iGPU
64.8 (54.2min, 54.9P0.1, 56.9P1) fps +80%
Vzmore AX9 Max
AMD Ryzen AI 9 HX 470, AMD Radeon 890M
49.7 (42.9min, 43P0.1, 44.1P1) fps +38%
Beelink GTI15 Ultra
Intel Core Ultra 9 285H, Intel Arc Graphics 140T
36.1 (32.2min, 32.3P0.1, 33.8P1) fps 0%
Vzmore iX9 Max
Intel Core Ultra 9 185H, Intel Arc 8-Core iGPU
36.1 (31.9min, 32P0.1, 32.6P1) fps
GMK NucBox K17
Intel Core Ultra 5 226V, Intel Arc Graphics 130V
32.6 (20min, 20P0.1, 20P1) fps -10%
MSI Cubi NUC AI+ 3MG
Intel Core Ultra 9 386H, Intel Graphics 4 Xe3 Panther Lake iGPU
31.6 (27.2min, 27.9P0.1, 29.2P1) fps -12%
Durchschnittliche Intel Arc 8-Core iGPU
  (21 - 40.3, n=29)
31.6 fps -12%
Alliwava GH8, R9 8945HS
AMD Ryzen 9 8945HS, AMD Radeon 780M
30.6 (25.3min, 25.4P0.1, 25.9P1) fps -15%
Geekom A7 Max, R9 7940HS
AMD Ryzen 9 7940HS, AMD Radeon 780M
24.8 (19.5min, 19.8P0.1, 21P1) fps -31%
Minisforum MS-02 Ultra
Intel Core Ultra 9 285HX, Intel Graphics 4-Core iGPU (Meteor / Arrow Lake)
21.9 (18.1min, 18.2P0.1, 19P1) fps -39%
1920x1080 Medium Preset AA:T
Apple Mac Mini M6
Apple M6, Apple M6 12-Core GPU
69.6 fps +138%
Minisforum M2 Pro
Intel Core Ultra X7 358H, Intel Arc B390 12 Xe3 Panther Lake iGPU
49.5 (42.7min, 44P0.1, 44.8P1) fps +70%
Vzmore AX9 Max
AMD Ryzen AI 9 HX 470, AMD Radeon 890M
37.7 (31.3min, 33.1P0.1, 34.3P1) fps +29%
Beelink GTI15 Ultra
Intel Core Ultra 9 285H, Intel Arc Graphics 140T
29.9 (27.2min, 27.3P0.1, 27.7P1) fps +2%
Vzmore iX9 Max
Intel Core Ultra 9 185H, Intel Arc 8-Core iGPU
29.2 (25.5min, 25.7P0.1, 26.4P1) fps
MSI Cubi NUC AI+ 3MG
Intel Core Ultra 9 386H, Intel Graphics 4 Xe3 Panther Lake iGPU
26.3 (24.1min, 24.2P0.1, 24.4P1) fps -10%
GMK NucBox K17
Intel Core Ultra 5 226V, Intel Arc Graphics 130V
25.5 (20min, 20P0.1, 20P1) fps -13%
Durchschnittliche Intel Arc 8-Core iGPU
  (16.3 - 31.1, n=30)
25.4 fps -13%
Alliwava GH8, R9 8945HS
AMD Ryzen 9 8945HS, AMD Radeon 780M
23.5 (20.1min, 20.1P0.1, 20.8P1) fps -20%
Geekom A7 Max, R9 7940HS
AMD Ryzen 9 7940HS, AMD Radeon 780M
19.4 (15.6min, 15.8P0.1, 16.7P1) fps -34%
Minisforum MS-02 Ultra
Intel Core Ultra 9 285HX, Intel Graphics 4-Core iGPU (Meteor / Arrow Lake)
16.4 (14.4min, 14.5P0.1, 14.7P1) fps -44%
1920x1080 High Preset AA:T
Apple Mac Mini M6
Apple M6, Apple M6 12-Core GPU
59.4 fps +134%
Minisforum M2 Pro
Intel Core Ultra X7 358H, Intel Arc B390 12 Xe3 Panther Lake iGPU
44.3 (38.6min, 39.4P0.1, 40.4P1) fps +74%
Vzmore AX9 Max
AMD Ryzen AI 9 HX 470, AMD Radeon 890M
32.1 (26.1min, 26.8P0.1, 29.6P1) fps +26%
Beelink GTI15 Ultra
Intel Core Ultra 9 285H, Intel Arc Graphics 140T
25.7 (23.3min, 23.5P0.1, 23.8P1) fps +1%
Vzmore iX9 Max
Intel Core Ultra 9 185H, Intel Arc 8-Core iGPU
25.4 (22.2min, 22.6P0.1, 23.2P1) fps
MSI Cubi NUC AI+ 3MG
Intel Core Ultra 9 386H, Intel Graphics 4 Xe3 Panther Lake iGPU
23.1 (21.2min, 21.2P0.1, 21.3P1) fps -9%
GMK NucBox K17
Intel Core Ultra 5 226V, Intel Arc Graphics 130V
22.9 (19.8min, 19.8P0.1, 20P1) fps -10%
Durchschnittliche Intel Arc 8-Core iGPU
  (15.4 - 27.7, n=29)
22.2 fps -13%
Alliwava GH8, R9 8945HS
AMD Ryzen 9 8945HS, AMD Radeon 780M
19.9 (17.6min, 17.7P0.1, 17.9P1) fps -22%
Geekom A7 Max, R9 7940HS
AMD Ryzen 9 7940HS, AMD Radeon 780M
15.6 (13.2min, 13.4P0.1, 13.7P1) fps -39%
Minisforum MS-02 Ultra
Intel Core Ultra 9 285HX, Intel Graphics 4-Core iGPU (Meteor / Arrow Lake)
14 (12.6min, 12.6P0.1, 12.7P1) fps -45%
1920x1080 Ultra Preset AA:T
Apple Mac Mini M6
Apple M6, Apple M6 12-Core GPU
58.1 fps +135%
Minisforum M2 Pro
Intel Core Ultra X7 358H, Intel Arc B390 12 Xe3 Panther Lake iGPU
43.3 (38.4min, 38.9P0.1, 39.8P1) fps +75%
Vzmore AX9 Max
AMD Ryzen AI 9 HX 470, AMD Radeon 890M
31.5 (28.3min, 28.5P0.1, 28.8P1) fps +28%
Beelink GTI15 Ultra
Intel Core Ultra 9 285H, Intel Arc Graphics 140T
25.3 (23.1min, 23.1P0.1, 23.6P1) fps +2%
Vzmore iX9 Max
Intel Core Ultra 9 185H, Intel Arc 8-Core iGPU
24.7 (22.4min, 22.4P0.1, 22.6P1) fps
MSI Cubi NUC AI+ 3MG
Intel Core Ultra 9 386H, Intel Graphics 4 Xe3 Panther Lake iGPU
22.8 (21.2min, 21.2P0.1, 21.3P1) fps -8%
GMK NucBox K17
Intel Core Ultra 5 226V, Intel Arc Graphics 130V
22.5 (20min, 20P0.1, 20P1) fps -9%
Durchschnittliche Intel Arc 8-Core iGPU
  (14.2 - 26.2, n=28)
21.4 fps -13%
Alliwava GH8, R9 8945HS
AMD Ryzen 9 8945HS, AMD Radeon 780M
19.2 (16.9min, 17P0.1, 17.3P1) fps -22%
Geekom A7 Max, R9 7940HS
AMD Ryzen 9 7940HS, AMD Radeon 780M
15.2 (13.2min, 13.2P0.1, 13.5P1) fps -38%
Minisforum MS-02 Ultra
Intel Core Ultra 9 285HX, Intel Graphics 4-Core iGPU (Meteor / Arrow Lake)
13.7 (11.9min, 12P0.1, 12.4P1) fps -45%
Cyberpunk 2077
1280x720 Low Preset (FSR off)
Minisforum M2 Pro
Intel Core Ultra X7 358H, Intel Arc B390 12 Xe3 Panther Lake iGPU
116.6 (98.3min, 90.7P1) fps +130%
Vzmore AX9 Max
AMD Ryzen AI 9 HX 470, AMD Radeon 890M
88 (73.8min, 70.8P1) fps +74%
MSI Cubi NUC AI+ 3MG
Intel Core Ultra 9 386H, Intel Graphics 4 Xe3 Panther Lake iGPU
62 (50.9min, 48.7P1) fps +23%
Alliwava GH8, R9 8945HS
AMD Ryzen 9 8945HS, AMD Radeon 780M
61 (50.4min, 47.9P1) fps +21%
GMK NucBox K17
Intel Core Ultra 5 226V, Intel Arc Graphics 130V
53.2 (42min, 38.1P1) fps +5%
Beelink GTI15 Ultra
Intel Core Ultra 9 285H, Intel Arc Graphics 140T
52.9 (45.1min, 43.5P1) fps +5%
Vzmore iX9 Max
Intel Core Ultra 9 185H, Intel Arc 8-Core iGPU
50.6 (42.9min, 39.7P1) fps
Durchschnittliche Intel Arc 8-Core iGPU
  (34.5 - 58, n=22)
45.6 fps -10%
Geekom A7 Max, R9 7940HS
AMD Ryzen 9 7940HS, AMD Radeon 780M
42.1 (35.8min, 27.2P1) fps -17%
Minisforum MS-02 Ultra
Intel Core Ultra 9 285HX, Intel Graphics 4-Core iGPU (Meteor / Arrow Lake)
35 (29.5min, 28.3P1) fps -31%
1920x1080 Low Preset (FSR off)
Minisforum M2 Pro
Intel Core Ultra X7 358H, Intel Arc B390 12 Xe3 Panther Lake iGPU
84.1 (70.6min, 67.2P1) fps +146%
Apple Mac Mini M6
Apple M6, Apple M6 12-Core GPU
72 fps +111%
Vzmore AX9 Max
AMD Ryzen AI 9 HX 470, AMD Radeon 890M
52.9 (45.1min, 43P1) fps +55%
MSI Cubi NUC AI+ 3MG
Intel Core Ultra 9 386H, Intel Graphics 4 Xe3 Panther Lake iGPU
37.1 (31.7min, 30.4P1) fps +8%
Alliwava GH8, R9 8945HS
AMD Ryzen 9 8945HS, AMD Radeon 780M
36.5 (31.2min, 30P1) fps +7%
GMK NucBox K17
Intel Core Ultra 5 226V, Intel Arc Graphics 130V
36.2 (30.3min, 28.8P1) fps +6%
Vzmore iX9 Max
Intel Core Ultra 9 185H, Intel Arc 8-Core iGPU
34.2 (29.8min, 28.4P1) fps
Beelink GTI15 Ultra
Intel Core Ultra 9 285H, Intel Arc Graphics 140T
33.8 (29.3min, 28.4P1) fps -1%
Durchschnittliche Intel Arc 8-Core iGPU
  (11.3 - 38, n=40)
30 fps -12%
Geekom A7 Max, R9 7940HS
AMD Ryzen 9 7940HS, AMD Radeon 780M
25.2 (21.5min, 18.8P1) fps -26%
Minisforum MS-02 Ultra
Intel Core Ultra 9 285HX, Intel Graphics 4-Core iGPU (Meteor / Arrow Lake)
22.2 (19.1min, 18.4P1) fps -35%
1920x1080 Medium Preset (FSR off)
Minisforum M2 Pro
Intel Core Ultra X7 358H, Intel Arc B390 12 Xe3 Panther Lake iGPU
68.1 (59min, 56.9P1) fps +143%
Apple Mac Mini M6
Apple M6, Apple M6 12-Core GPU
55.1 fps +97%
Vzmore AX9 Max
AMD Ryzen AI 9 HX 470, AMD Radeon 890M
42.5 (37.1min, 35.7P1) fps +52%
MSI Cubi NUC AI+ 3MG
Intel Core Ultra 9 386H, Intel Graphics 4 Xe3 Panther Lake iGPU
28.4 (24.9min, 23.9P1) fps +1%
GMK NucBox K17
Intel Core Ultra 5 226V, Intel Arc Graphics 130V
28.2 (23.6min, 22.2P1) fps +1%
Vzmore iX9 Max
Intel Core Ultra 9 185H, Intel Arc 8-Core iGPU
28 (24.5min, 23.6P1) fps
Beelink GTI15 Ultra
Intel Core Ultra 9 285H, Intel Arc Graphics 140T
26.7 (23.2min, 22.4P1) fps -5%
Alliwava GH8, R9 8945HS
AMD Ryzen 9 8945HS, AMD Radeon 780M
25.7 (22.3min, 21.2P1) fps -8%
Durchschnittliche Intel Arc 8-Core iGPU
  (9.42 - 31.4, n=38)
25.4 fps -9%
Geekom A7 Max, R9 7940HS
AMD Ryzen 9 7940HS, AMD Radeon 780M
21 (18min, 16.3P1) fps -25%
Minisforum MS-02 Ultra
Intel Core Ultra 9 285HX, Intel Graphics 4-Core iGPU (Meteor / Arrow Lake)
17.9 (15.9min, 15.4P1) fps -36%
1920x1080 High Preset (FSR off)
Minisforum M2 Pro
Intel Core Ultra X7 358H, Intel Arc B390 12 Xe3 Panther Lake iGPU
57.1 (48.7min, 47.1P1) fps +138%
Apple Mac Mini M6
Apple M6, Apple M6 12-Core GPU
43.8 fps +83%
Vzmore AX9 Max
AMD Ryzen AI 9 HX 470, AMD Radeon 890M
32.5 (27.7min, 25.8P1) fps +35%
GMK NucBox K17
Intel Core Ultra 5 226V, Intel Arc Graphics 130V
25 (21.1min, 20.3P1) fps +4%
MSI Cubi NUC AI+ 3MG
Intel Core Ultra 9 386H, Intel Graphics 4 Xe3 Panther Lake iGPU
24.5 (21.2min, 20.5P1) fps +2%
Vzmore iX9 Max
Intel Core Ultra 9 185H, Intel Arc 8-Core iGPU
24 (20.7min, 19.8P1) fps
Beelink GTI15 Ultra
Intel Core Ultra 9 285H, Intel Arc Graphics 140T
23.8 (20.3min, 19.7P1) fps -1%
Durchschnittliche Intel Arc 8-Core iGPU
  (7.3 - 27.6, n=38)
21.8 fps -9%
Alliwava GH8, R9 8945HS
AMD Ryzen 9 8945HS, AMD Radeon 780M
20.7 (18min, 17.3P1) fps -14%
Geekom A7 Max, R9 7940HS
AMD Ryzen 9 7940HS, AMD Radeon 780M
15.9 (13.5min, 12.6P1) fps -34%
Minisforum MS-02 Ultra
Intel Core Ultra 9 285HX, Intel Graphics 4-Core iGPU (Meteor / Arrow Lake)
15.2 (13.2min, 12.8P1) fps -37%
1920x1080 Ultra Preset (FSR off)
Minisforum M2 Pro
Intel Core Ultra X7 358H, Intel Arc B390 12 Xe3 Panther Lake iGPU
49.8 (41.5min, 39.3P1) fps +132%
Apple Mac Mini M6
Apple M6, Apple M6 12-Core GPU
37.5 fps +74%
Vzmore AX9 Max
AMD Ryzen AI 9 HX 470, AMD Radeon 890M
28.7 (23.8min, 22.8P1) fps +33%
GMK NucBox K17
Intel Core Ultra 5 226V, Intel Arc Graphics 130V
21.8 (18.1min, 16.5P1) fps +1%
Beelink GTI15 Ultra
Intel Core Ultra 9 285H, Intel Arc Graphics 140T
21.7 (18.6min, 18P1) fps +1%
Vzmore iX9 Max
Intel Core Ultra 9 185H, Intel Arc 8-Core iGPU
21.5 (18.4min, 17.7P1) fps
MSI Cubi NUC AI+ 3MG
Intel Core Ultra 9 386H, Intel Graphics 4 Xe3 Panther Lake iGPU
21.1 (18.1min, 17.5P1) fps -2%
Durchschnittliche Intel Arc 8-Core iGPU
  (13 - 24.7, n=30)
20.2 fps -6%
Alliwava GH8, R9 8945HS
AMD Ryzen 9 8945HS, AMD Radeon 780M
17.8 (15.6min, 14.9P1) fps -17%
Geekom A7 Max, R9 7940HS
AMD Ryzen 9 7940HS, AMD Radeon 780M
14.3 (11.8min, 11.1P1) fps -33%
Minisforum MS-02 Ultra
Intel Core Ultra 9 285HX, Intel Graphics 4-Core iGPU (Meteor / Arrow Lake)
13.6 (11.8min, 11.5P1) fps -37%

Cyberpunk 2077 Ultra: FPS-Verlauf

0510152025Tooltip
Vzmore iX9 Max Ultra 9 185H, Arc 8-Core: Ø18.2 (16.7-18.5) fps
Vzmore AX9 Max Ryzen AI 9 HX 470, Radeon 890M: Ø26.2 (25.3-26.5) fps
min.mittelhochmax.
GTA V (2015) 160.8 149 37.9 15.7
Dota 2 Reborn (2015) 34.7 34.7 34.2 78.2
Final Fantasy XV Benchmark (2018) 65.7 39.7 28.8
X-Plane 11.11 (2018) 45.6 36.3 33.3
Strange Brigade (2018) 176.7 76.4 64.6 52.7
Baldur's Gate 3 (2023) 36.1 29.2 25.4 24.7
Cyberpunk 2077 (2023) 34.2 28 24 21.5
F1 24 (2024) 65.4 59.8 46.2 14.2

Emissionen

Geräuschemissionen

Lüftergeräuschprofil (Weiß: Hintergrund, Rot: System im Leerlauf, Blau: 3DMark 06, Orange: Cyberpunk 2077, Grün: Prime95-Stress)

Lautstärkediagramm

Idle
23.8 / 23.8 / 23.8 dB(A)
Last
47.6 / 53.7 dB(A)
  red to green bar
 
 
30 dB
leise
40 dB(A)
deutlich hörbar
50 dB(A)
störend
 
min: dark, med: mid, max: light   Earthworks M23R, Arta (aus 15 cm gemessen)   Umgebungsgeräusche: 23.4 dB(A)
dB(A) 0102030405060708090Deep BassMiddle BassHigh BassLower RangeMidsHigher MidsLower HighsMid HighsUpper HighsSuper Highs2039.938.335.436.936.42533.427.129.83029.6313125.924.628.129.14029.326.621.722.228.25029.827.621.622.2286328.529.623.223.429.78031.127.322.52430.210029.92620.72030.512528.426.219.718.229.216028.226.416.116.929.620028.62714.915.830.425028.727.714.515.730.431529.827.915.11631.84003129.11413.733.450033.330.811.911.636.163036.433.810.710.538.780037.335.210.91140.5100036.734.710.410.14012504339.59.510.145160042.439.69.89.644.7200040.637.89.910.142.9250041.638.810.310.344.5315040.435.810.710.642.8400039.13311.211.344.5500029.926.214.111.734.6630024.921.412.111.828.7800020.117.813.311.7241000014.915.2131216.91250014.616.312.612.515.21600013.413.912.211.313.4SPL50.947.623.823.453.7N6.65.20.50.58.2median 29.9median 27.9median 12.2median 11.7median 33.4Delta6.36.22.12.77.5hearing rangehide median Fan NoiseVzmore iX9 Max
Vzmore iX9 Max
Ultra 9 185H, Arc 8-Core
Vzmore AX9 Max
Ryzen AI 9 HX 470, Radeon 890M
Apple Mac Mini M6
M6, M6 12-Core GPU
GMK NucBox K17
Core Ultra 5 226V, Arc 130V
BOSGAME VTA-439
Ryzen AI 9 HX 470, Radeon 890M
Beelink GTI15 Ultra
Ultra 9 285H, Arc 140T
Geräuschentwicklung
0%
14%
15%
1%
8%
aus / Umgebung * (dB)
23.4
24.5
-5%
24.8
-6%
25.1
-7%
23.1
1%
22.4
4%
Idle min * (dB)
23.8
25.3
-6%
24.8
-4%
25.3
-6%
25.7
-8%
27.9
-17%
Idle avg * (dB)
23.8
25.3
-6%
24.8
-4%
25.4
-7%
25.8
-8%
27.9
-17%
Idle max * (dB)
23.8
25.3
-6%
24.8
-4%
26.1
-10%
25.8
-8%
30.2
-27%
Last avg * (dB)
47.6
47.4
-0%
25.9
46%
27.4
42%
44.4
7%
31.3
34%
Cyberpunk 2077 ultra * (dB)
50.9
45.3
11%
25.9
49%
29.1
43%
44.8
12%
32.1
37%
Last max * (dB)
53.7
47.5
12%
41.7
22%
28.6
47%
47.8
11%
32.5
39%
Witcher 3 ultra * (dB)
45.4
28

* ... kleinere Werte sind besser

Temperatur
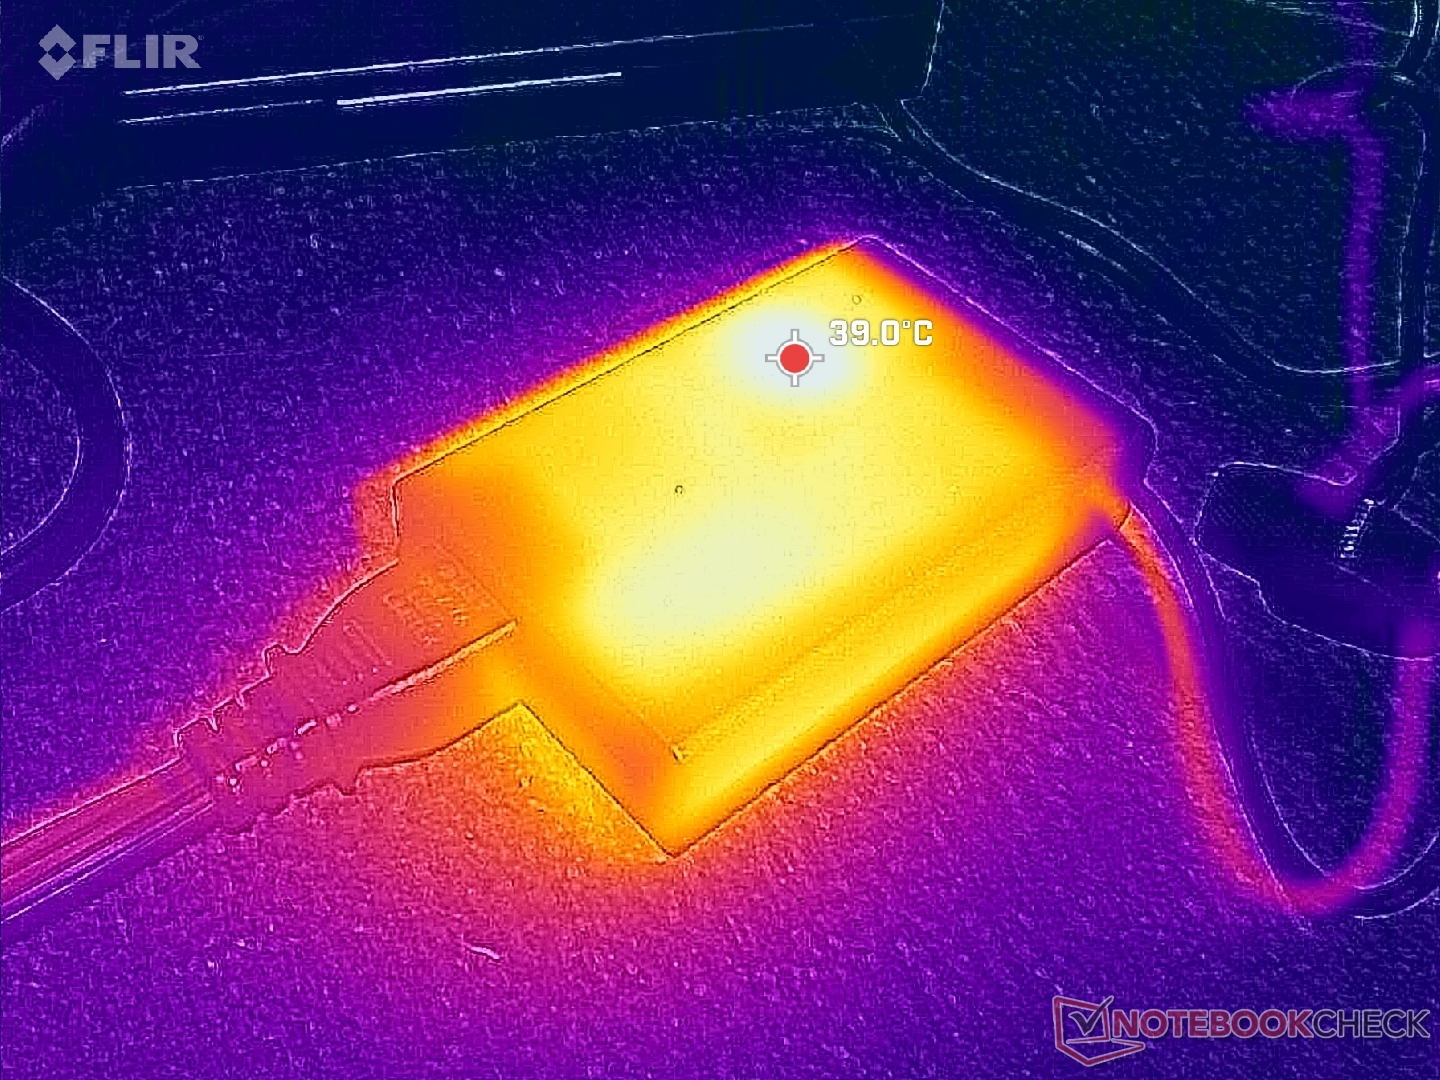
Das kleine 120-W-Netzteil (ca. 9,8 x 6,5 x 2,4 cm) erreicht bei anspruchsvoller Last 40 °C

Die Oberflächentemperaturen bleiben selbst bei anspruchsvoller Belastung relativ niedrig. Tatsächlich kann die Oberseite unter Last aufgrund der Lüfteraktivität kühler sein als im Leerlauf.

Max. Last
28 °C27.8 °C27.6 °C
27.2 °C27.2 °C27 °C
26.8 °C27 °C26.8 °C
Maximal: 28 °C
Durchschnitt: 27.3 °C
23.8 °C23.8 °C23.4 °C
23.2 °C23 °C23.2 °C
23.4 °C23 °C24.8 °C
Maximal: 24.8 °C
Durchschnitt: 23.5 °C
Netzteil (max.)  40.6 °C | Raumtemperatur 20 °C | Fluke 62 Mini IR Thermometer
(+) Die Durchschnittstemperatur auf der Oberseite unter extremer Last ist 27.3 °C. Im Vergleich erhitzte sich der Durchschnitt der Geräteklasse Mini PC auf 32.1 °C.
(+) Die maximale Temperatur auf der Oberseite ist 28 °C. Im Vergleich liegt der Klassendurchschnitt bei 35.2 °C (von 20.6 bis 69.5 °C für die Klasse Mini PC).
(+) Auf der Unterseite messen wir eine maximalen Wert von 24.8 °C (im Vergleich zum Durchschnitt von 35.9 °C).
(+) Ohne Last messen wir eine durchschnittliche Temperatur von 28 °C auf der Oberseite. Der Klassendurchschnitt erreicht 32.1 °C.
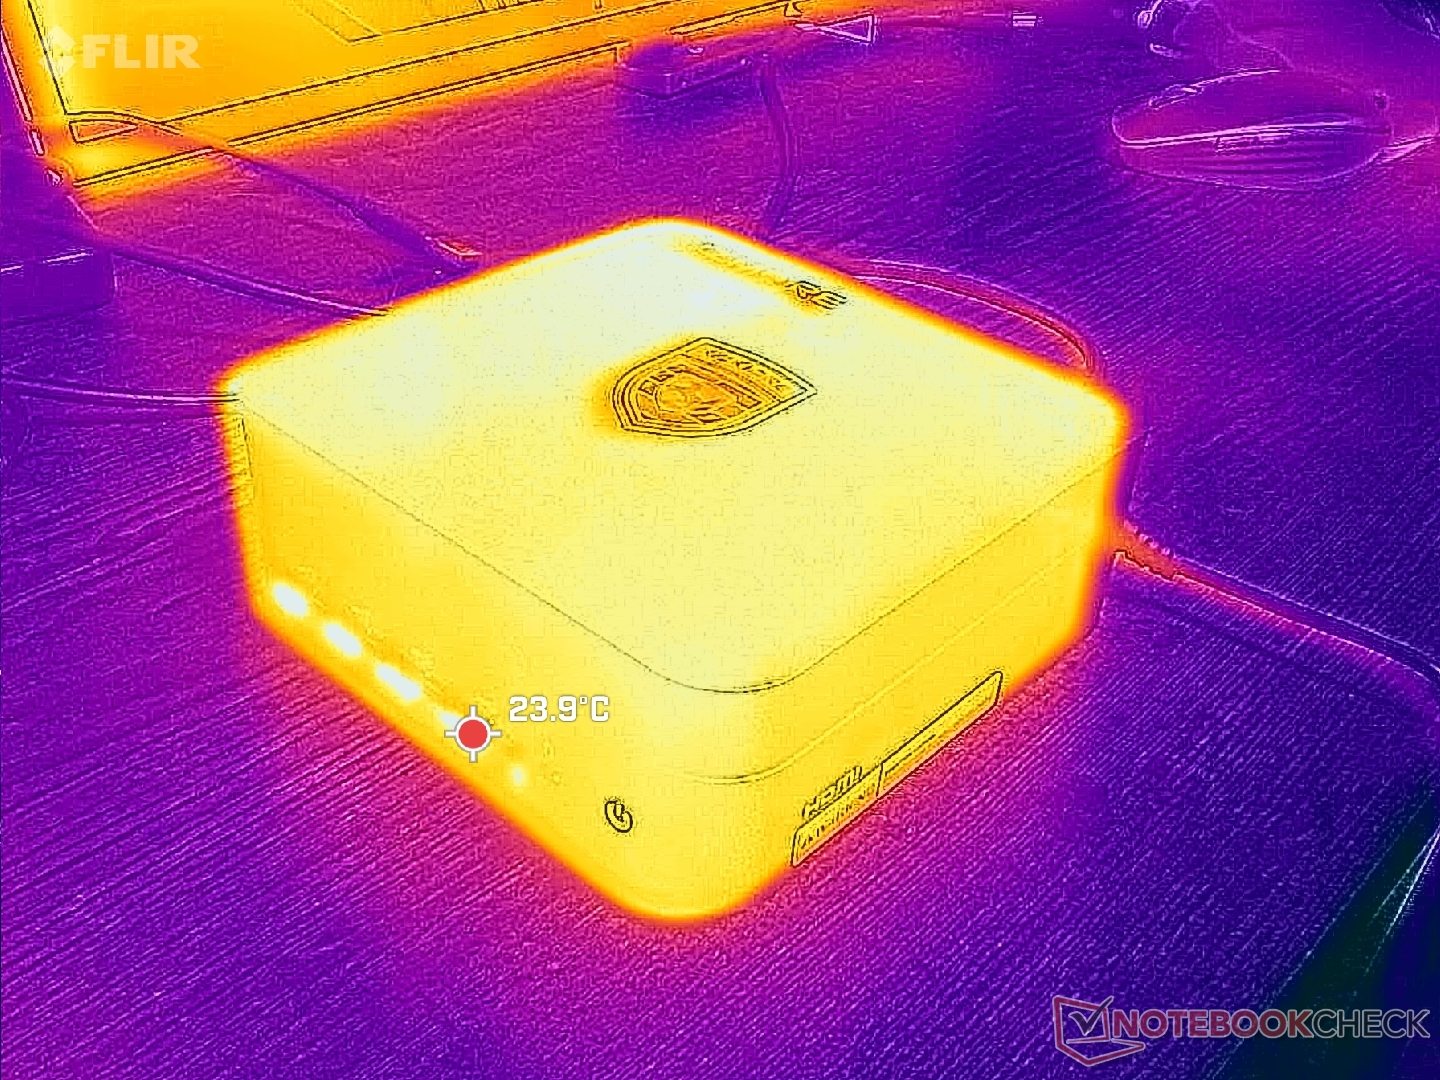
System im Leerlauf (vorne)
System im Leerlauf (hinten)
Prime95-Stress (vorne)
Prime95-Stress (hinten)
Vzmore iX9 Max
Ultra 9 185H, Arc 8-Core
Vzmore AX9 Max
Ryzen AI 9 HX 470, Radeon 890M
Apple Mac Mini M6
M6, M6 12-Core GPU
GMK NucBox K17
Core Ultra 5 226V, Arc 130V
BOSGAME VTA-439
Ryzen AI 9 HX 470, Radeon 890M
Beelink GTI15 Ultra
Ultra 9 285H, Arc 140T
Hitze
-34%
-24%
-28%
-17%
-3%
Last oben max * (°C)
28
38.8
-39%
35.7
-28%
36.3
-30%
31.6
-13%
26.6
5%
Last unten max * (°C)
24.8
33.5
-35%
39.6
-60%
35
-41%
33.4
-35%
26
-5%
Idle oben max * (°C)
28.2
36
-28%
28.8
-2%
32.2
-14%
29.2
-4%
31.6
-12%
Idle unten max * (°C)
27.6
37.2
-35%
28.8
-4%
34.5
-25%
32
-16%
27.6
-0%

* ... kleinere Werte sind besser

Stresstest
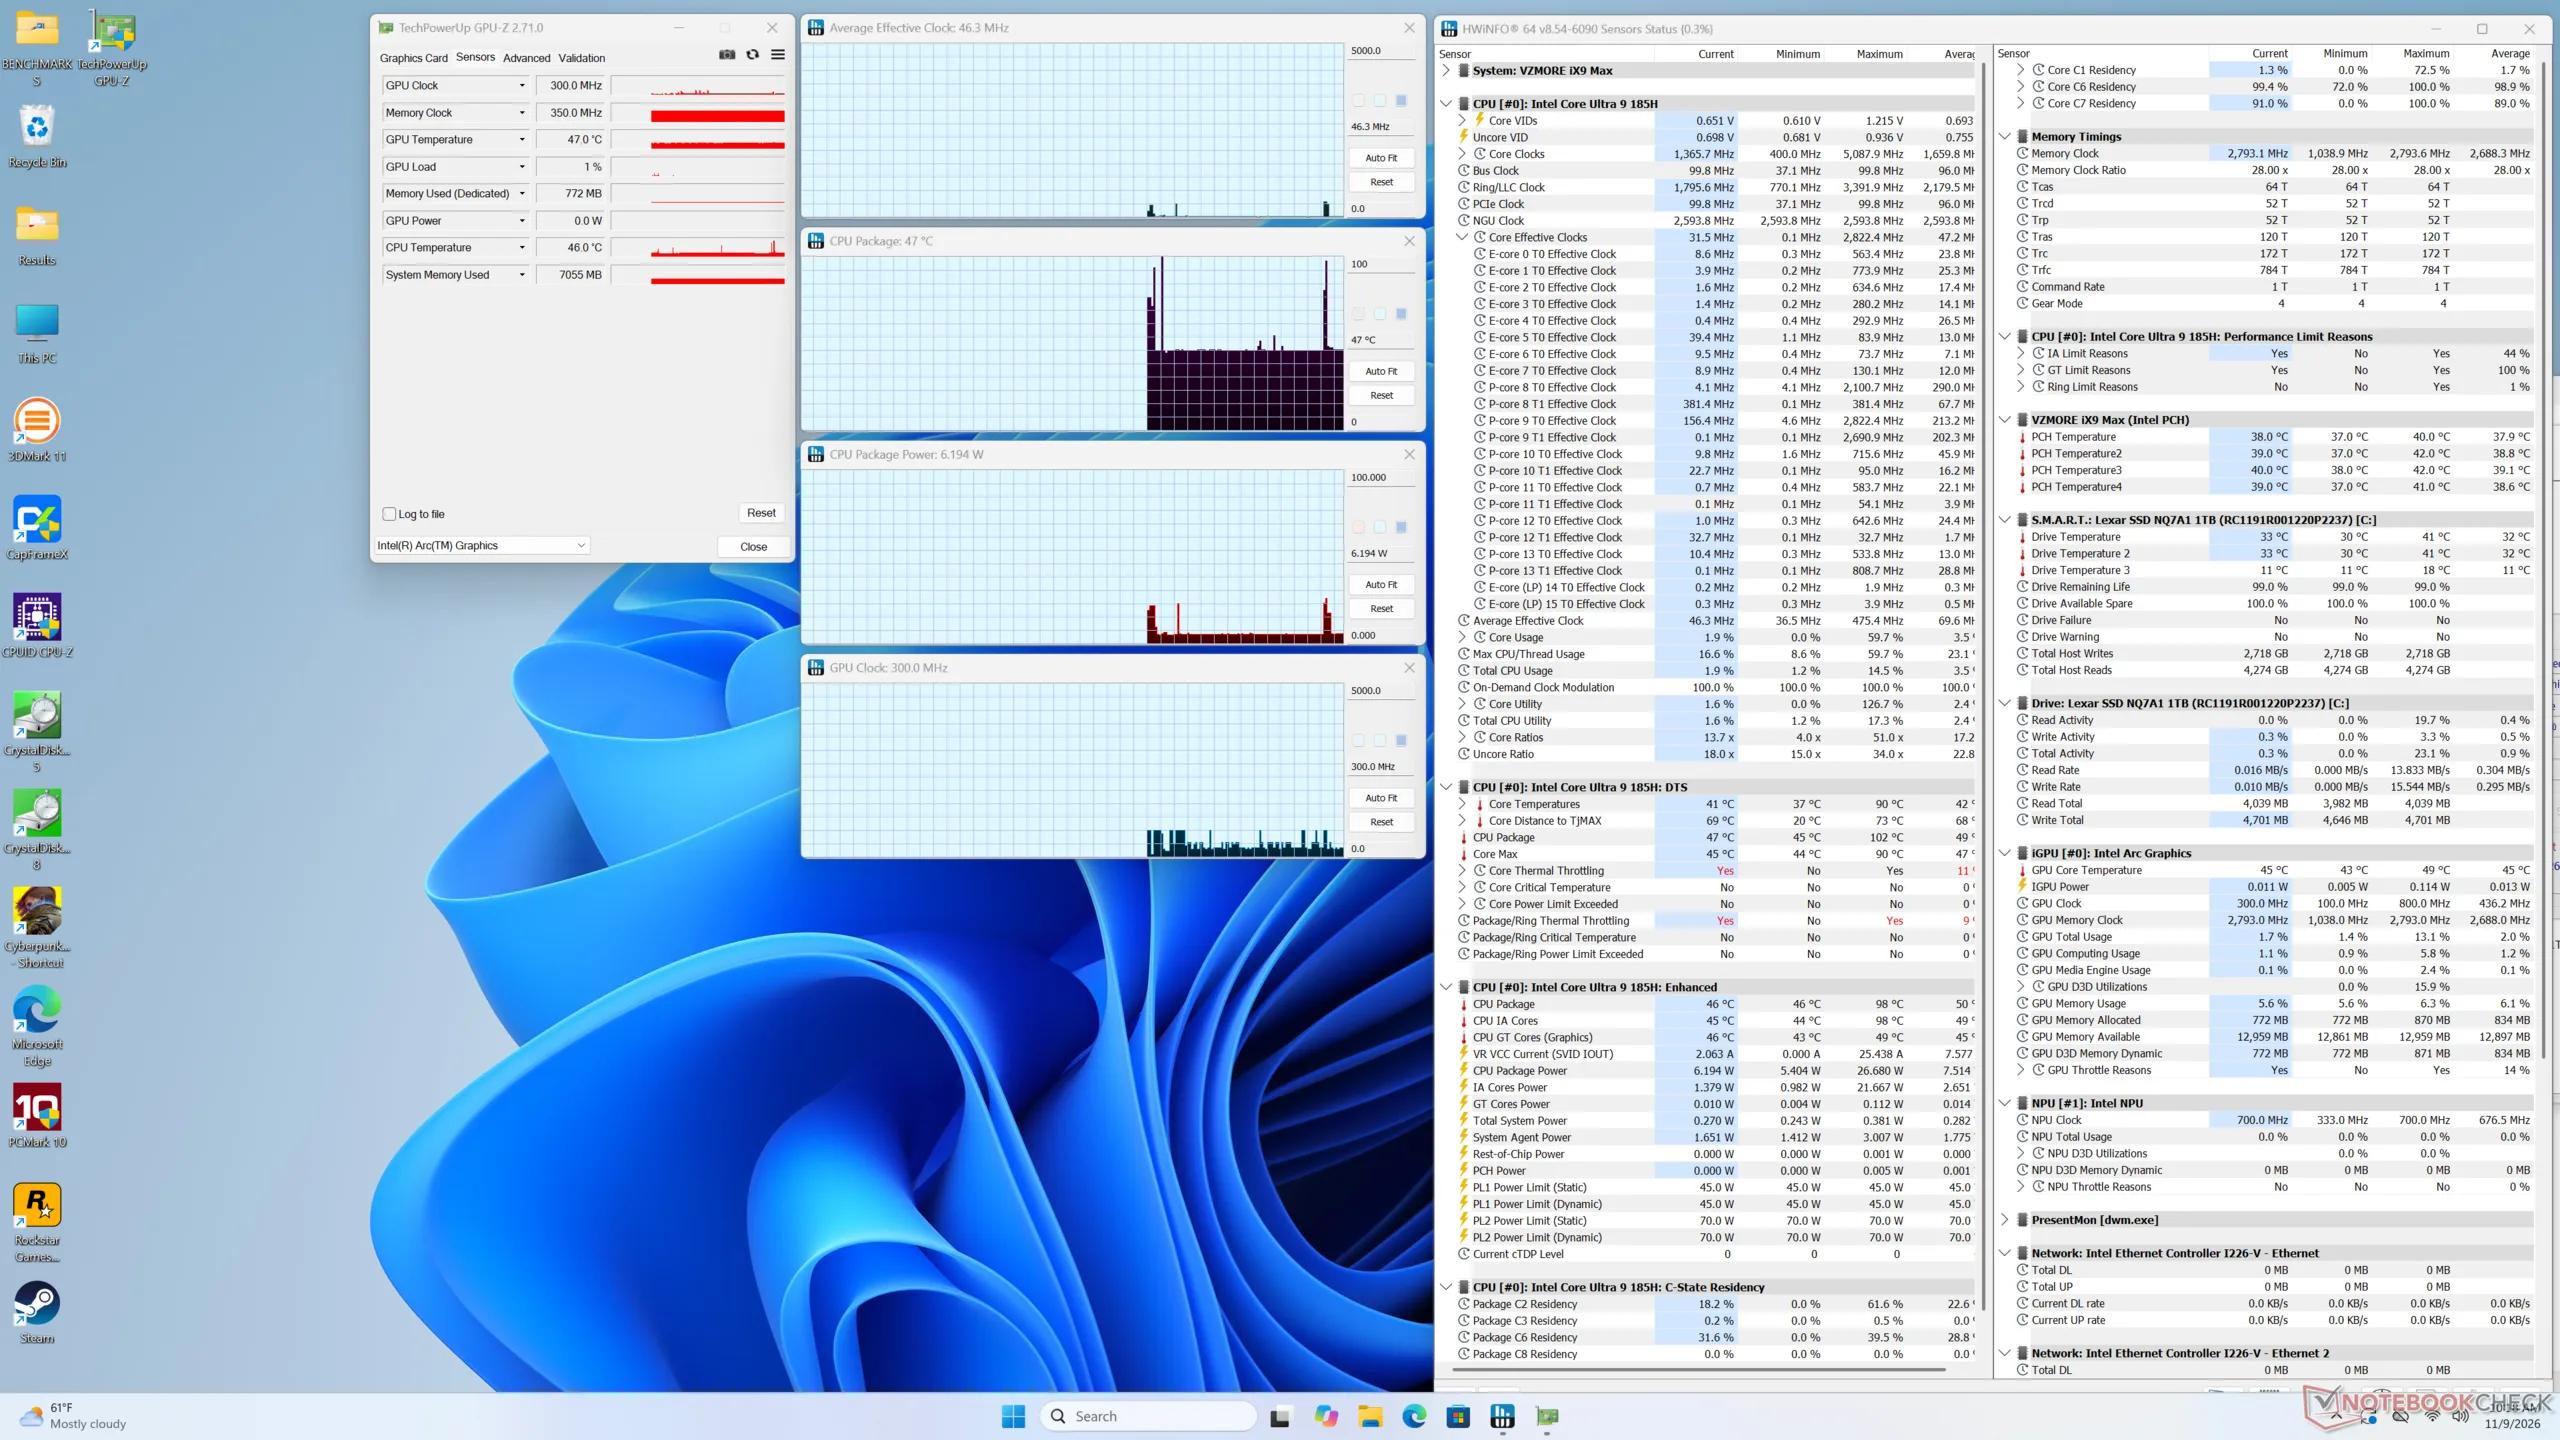
System im Leerlauf
System im Leerlauf

Zu Beginn des Prime95-Stresstests im ausgeglichenen Modus erreicht die CPU per Boost 3,1 GHz bei einer Leistungsaufnahme von 70 W und einer Temperatur von 96 °C. Taktrate und Leistungsaufnahme stabilisieren sich schließlich bei 2,2 GHz beziehungsweise 45 W, um eine niedrigere Kerntemperatur von 79 °C zu halten.

Im Performance-Modus stabilisiert sich die CPU im Prime95-Stresstest dagegen bei 2,7 GHz, 96 °C und 57 W und wird damit deutlich wärmer, wie unsere Screenshots unten zeigen.
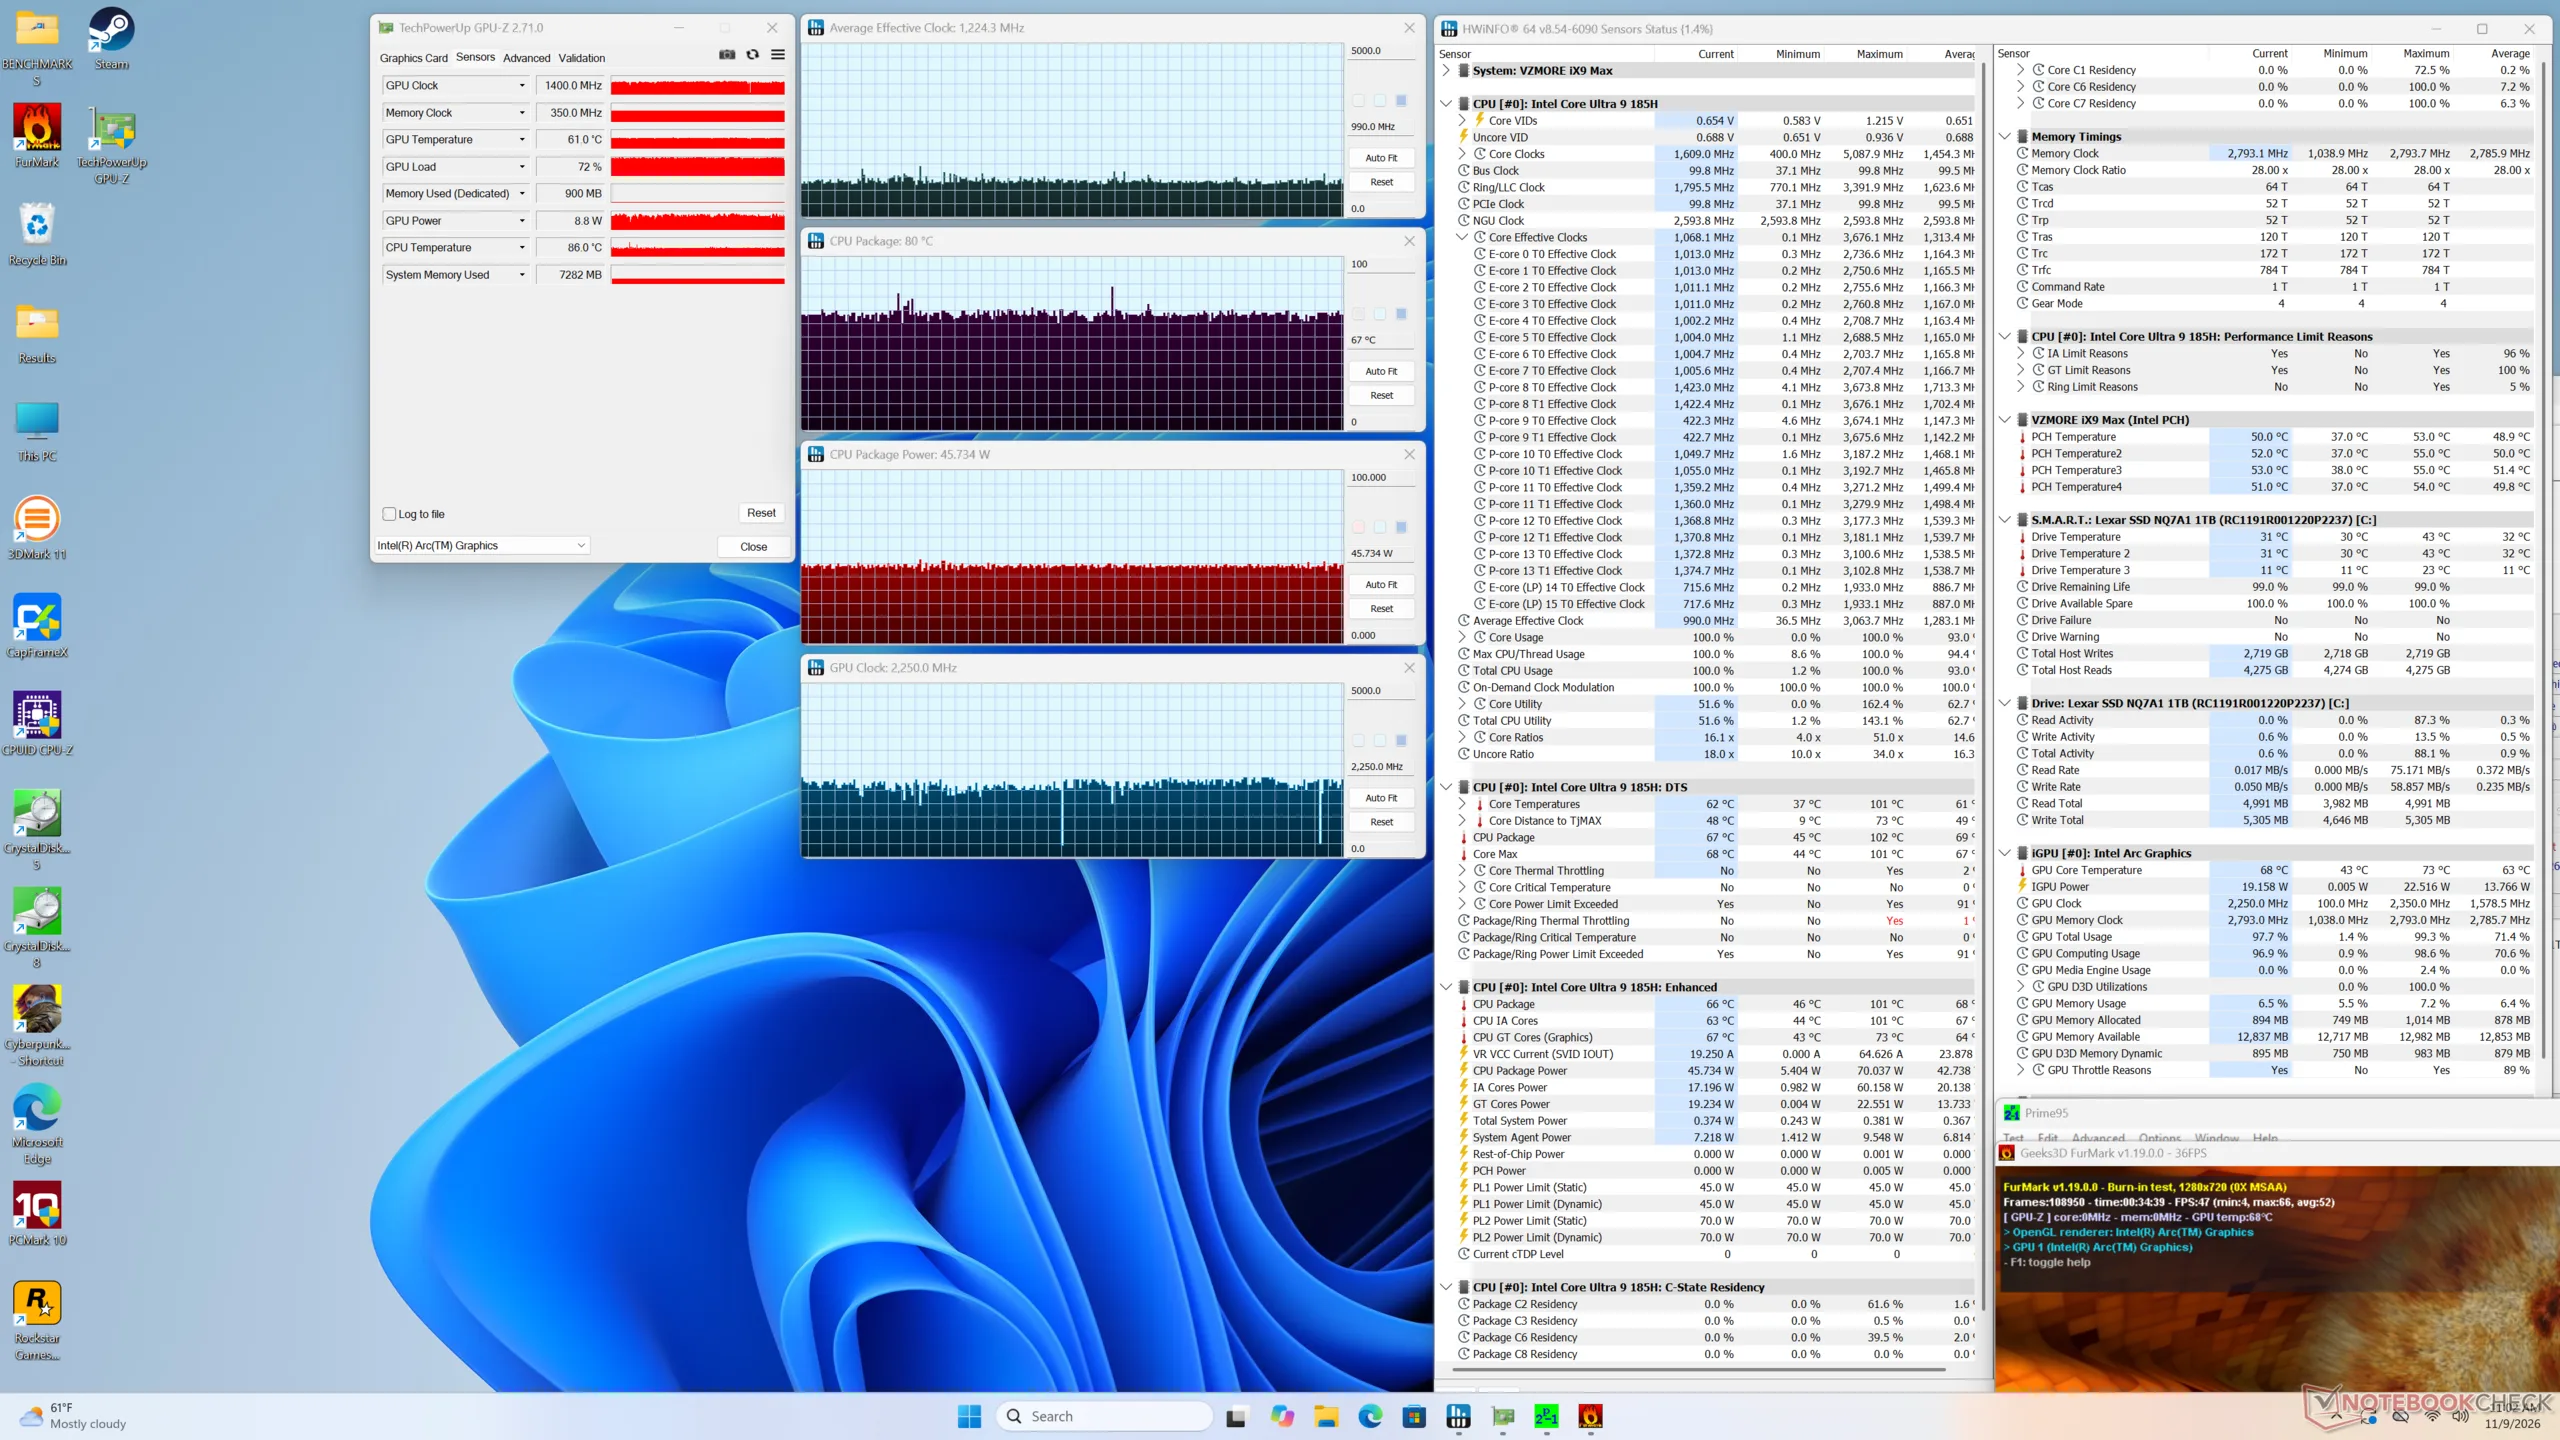
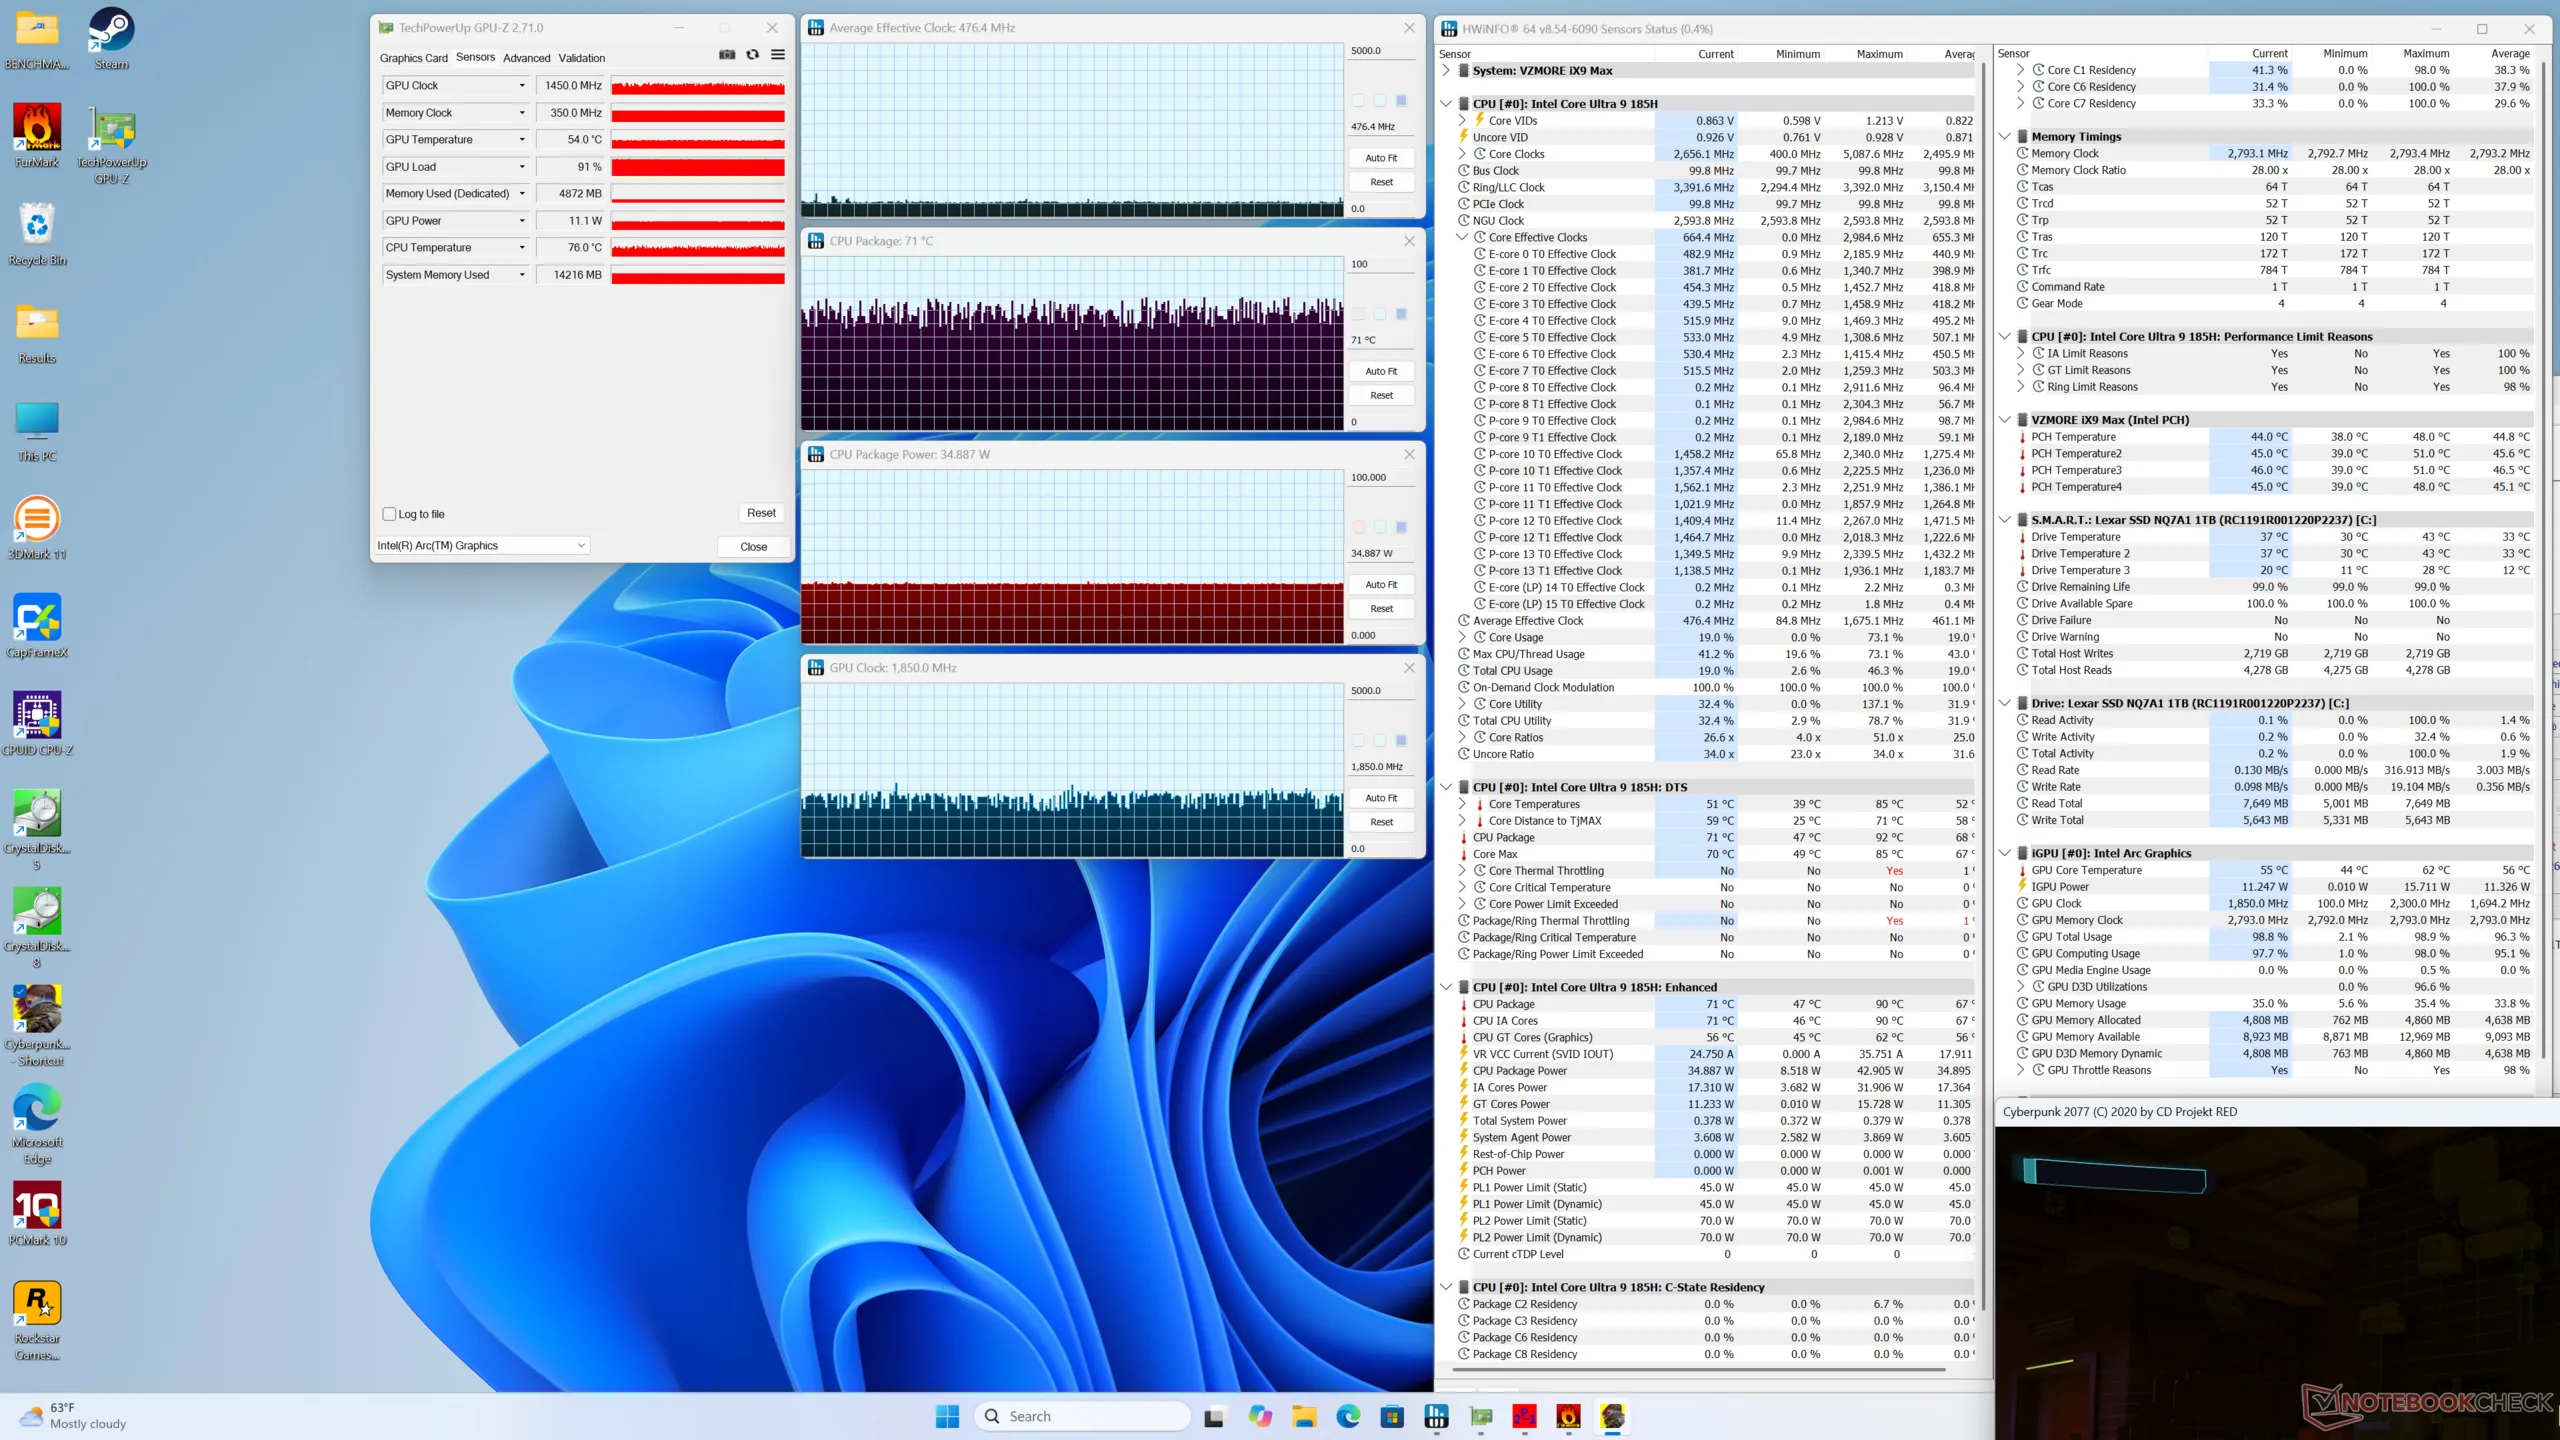
Prime95- und FurMark-Stress
Cyberpunk-2077-Stress
Prime95-Stress (ausgeglichener Modus)
Prime95-Stress (Performance-Modus)
Durchschnittlicher CPU-Takt (GHz) GPU-Takt (MHz) Durchschnittliche CPU-Temperatur (°C)
System im Leerlauf -- 300 47
Prime95-Stress (ausgeglichener Modus) 2.2 -- 79
Prime95-Stress (Performance-Modus) 2.7 -- 96
Prime95- und FurMark-Stress 1.0 2250 67
Cyberpunk-2077-Stress ~0.5 ~1450 - 1850 71

Energieverwaltung

Stromverbrauch

Stromverbrauch bei 3DMark 06
Stromverbrauch bei Cyberpunk 2077 in 1080p Ultra. Das System benötigt deutlich weniger Strom als der leistungsstärkere Vzmore AX9 Max mit AMD-Prozessor
Zu Beginn des Prime95-Stresstests steigt der Verbrauch kurz auf 99 W, bevor er sinkt und sich bei 66 W stabilisiert
Prime95- und FurMark-Stress nach 10 Sekunden im ausgeglichenen Modus gestartet
Stromverbrauch
Aus / Standbydarklight 0.06 / 1.3 Watt
Idledarkmidlight 5.9 / 6.2 / 6.4 Watt
Last midlight 52 / 97.5 Watt
 color bar
Legende: min: dark, med: mid, max: light        Metrahit Energy
Vzmore iX9 Max
Ultra 9 185H, Arc 8-Core, Lexar NQ7A1, , x,
Vzmore AX9 Max
Ryzen AI 9 HX 470, Radeon 890M, Lexar NQ7A1, , x,
Apple Mac Mini M6
M6, M6 12-Core GPU, Apple SSD AP0512Z, , x,
GMK NucBox K17
Core Ultra 5 226V, Arc 130V, Huawei eKitStor Xtreme 200e 1 TB, , x,
BOSGAME VTA-439
Ryzen AI 9 HX 470, Radeon 890M, Kingston OM8TAP41024K1-A00, , x,
Beelink GTI15 Ultra
Ultra 9 285H, Arc 140T, , , x,
Stromverbrauch
-7%
42%
16%
-45%
-170%
Idle min * (Watt)
5.9
3.6
39%
2.1
64%
4.7
20%
7
-19%
18.8
-219%
Idle avg * (Watt)
6.2
4.6
26%
6.1
2%
7.5
-21%
20.1
-224%
Idle max * (Watt)
6.4
6.4
-0%
2.4
63%
9.6
-50%
9
-41%
40.1
-527%
Last avg * (Watt)
52
81.2
-56%
36.6
30%
32.7
37%
90.7
-74%
66.2
-27%
Cyberpunk 2077 ultra external monitor * (Watt)
53.5
79.5
-49%
38.4
28%
39.5
26%
101.2
-89%
72.4
-35%
Last max * (Watt)
97.5
98.1
-1%
74.3
24%
41.3
58%
120.9
-24%
82.4
15%

* ... kleinere Werte sind besser

Stromverbrauch bei Cyberpunk und im Stresstest

05101520253035404550556065707580859095100105110115120Tooltip
Vzmore iX9 Max Ultra 9 185H, Arc 8-Core: Ø74.7 (64.4-97.5) Watt
BOSGAME VTA-439 Ryzen AI 9 HX 470, Radeon 890M: Ø106.4 (102.1-120.9) Watt

Stromverbrauch mit externem Monitor

05101520253035404550556065707580859095100105110115Tooltip
Vzmore iX9 Max Ultra 9 185H, Arc 8-Core; Prime95 V2810 Stress (external Monitor): Ø74.2 (63.8-98.7) Watt
BOSGAME VTA-439 Ryzen AI 9 HX 470, Radeon 890M; Prime95 V2810 Stress (external Monitor): Ø105.7 (103-118.3) Watt
BOSGAME VTA-439 Ryzen AI 9 HX 470, Radeon 890M; Cinebench R15 Multi (external Monitor): Ø111.4 (104.3-114) Watt
Vzmore iX9 Max Ultra 9 185H, Arc 8-Core; Cinebench R23 Single (external Monitor): Ø33.6 (28.4-58.1) Watt
Vzmore iX9 Max Ultra 9 185H, Arc 8-Core; Cinebench R23 Multi (external Monitor): Ø73.1 (68.2-91.5) Watt
BOSGAME VTA-439 Ryzen AI 9 HX 470, Radeon 890M; Cinebench R23 Multi (external Monitor): Ø101.3 (96-111.3) Watt
Vzmore iX9 Max Ultra 9 185H, Arc 8-Core; 1280x720 FurMark 1.19 GPU Stress Test (external Monitor): Ø52.8 (51-61.9) Watt
BOSGAME VTA-439 Ryzen AI 9 HX 470, Radeon 890M; 1280x720 FurMark 1.19 GPU Stress Test (external Monitor): Ø85.6 (79.1-92.8) Watt
Vzmore iX9 Max Ultra 9 185H, Arc 8-Core; Idle 1min (external Monitor): Ø6.05 (5.23-9.67) Watt
BOSGAME VTA-439 Ryzen AI 9 HX 470, Radeon 890M; Idle 1min (external Monitor): Ø7.16 (6.84-9.26) Watt
Vzmore iX9 Max Ultra 9 185H, Arc 8-Core; Cyberpunk 2077 FHD ultra no FSR (external Monitor): Ø53.5 (52.5-57.3) Watt
BOSGAME VTA-439 Ryzen AI 9 HX 470, Radeon 890M; Cyberpunk 2077 FHD ultra no FSR (external Monitor): Ø101.2 (100.5-103.2) Watt

Notebookcheck-Bewertung

Ein eleganter, schnörkelloser Mini-PC mit hochwertigen Komponenten und Anschlüssen, aber weniger aufrüstbaren Bauteilen.

Vzmore iX9 Max - 10.11.2026 v8
Allen Ngo

Gehäuse
87 / 98 → 89%
Konnektivität
79 / 81 → 97%
Gewicht
79 / 10-100 → 76%
Leistung Spiele
49 / 80 → 61%
Leistung Anwendungen
84 / 92 → 92%
AI Performance
86%
Temperatur
95%
Lautstärke
76%
Durchschnitt
57%
81%
Mini PC - gewichteter Durchschnitt
Weitere Informationen über unsere Bewertung finden Sie hier.
CO2 Emissions
No Data
Materials
25%
Packaging
12.5%
Power Use
83.5%
Repairability
30%
Software Updates
39%
Recycle Logo Total Sustainability Score: 31.7%

Mögliche Konkurrenten im Vergleich

Bild
Modell / Test
Preis ab
Gewicht
Dicke
Display
1.
80.7%
Vzmore iX9 Max
Vzmore iX9 Max
Intel Core Ultra 9 185H ⎘
Intel Arc 8-Core iGPU ⎘
24 GB RAM, 2048 GB SSD
Listenpreis 950 USD
Geizhals Suche
785 g57.7 mmx
2.
84.7%
Vzmore AX9 Max
Vzmore AX9 Max
AMD Ryzen AI 9 HX 470 ⎘
AMD Radeon 890M ⎘
32 GB RAM, 2048 GB SSD
Listenpreis: 1549€805 g57.7 mmx
3.
87.7%
Apple Mac Mini M6
Apple Mac Mini M6
Apple M6 ⎘
Apple M6 12-Core GPU ⎘
24 GB RAM, 512 GB SSD
Listenpreis: 1489€653 g50 mmx
4.
81.9%
GMK NucBox K17
GMK NucBox K17
Intel Core Ultra 5 226V ⎘
Intel Arc Graphics 130V ⎘
16 GB RAM, 1024 GB SSD
Bestpreis 652.01€ Proshop.at
2. 659€ galaxus.at
3. 790.13€ Luna-Time569€
461 g44.5 mmx
5.
81.1%
BOSGAME VTA-439
BOSGAME VTA-439
AMD Ryzen AI 9 HX 470 ⎘
AMD Radeon 890M ⎘
32 GB RAM, 1024 GB SSD
Listenpreis: 1050 USD764 g50 mmx
6.
83.7%
Beelink GTI15 Ultra
Beelink GTI15 Ultra
Intel Core Ultra 9 285H ⎘
Intel Arc Graphics 140T ⎘
64 GB RAM
Bestpreis 1903.35€ Proshop.de
2. 1989.34€ galaxus
3. 2094.34€ Luna-Time1200 USD
1.3 kg55.8 mmx

Transparenz

Die Auswahl der zu testenden Geräte erfolgt innerhalb der Redaktion. Das vorliegende Testmuster wurde dem Autor vom Hersteller oder einem Shop zu Testzwecken leihweise zur Verfügung gestellt. Eine Einflussnahme des Leihstellers auf den Testbericht gab es nicht, der Hersteller erhielt keine Version des Reviews vor der Veröffentlichung. Es bestand keine Verpflichtung zur Publikation. Als eigenständiges, unabhängiges Unternehmen unterliegt Notebookcheck keiner Diktion von Herstellern, Shops und Verlagen.

So testet Notebookcheck

Pro Jahr werden von Notebookcheck hunderte Laptops und Smartphones unabhängig in von uns standardisierten technischen Verfahren getestet, um eine Vergleichbarkeit aller Testergebnisse zu gewährleisten. Seit rund 20 Jahren entwickeln wir diese Testmethoden kontinuierlich weiter und setzen damit Branchenstandards. In unseren Testlaboren kommt ausschließlich hochwertiges Messequipment in die Hände erfahrener Techniker und Redakteure. Die Tests unterliegen einer mehrstufigen Kontrolle. Unsere komplexe Gesamtbewertung basiert auf hunderten fundierten Messergebnissen und Benchmarks, womit Ihnen Objektivität garantiert ist. Weitere Informationen zu unseren Testmethoden gibt es hier.

Google LogoAls bevorzugte Quelle auf Google hinzufügen
Mail Logo
> Notebook Test, Laptop Test und News > Tests > Notebook Testberichte > Vzmore iX9 Max Mini-PC im Test: Mehr als ein Mac-Mini-Doppelgänger
Autor: Allen Ngo, 12.11.2026 (Update: 12.11.2026)