 Deutsch
 English
 Español
 Français
 Italiano
 Nederlands
 Polski
 Português
 Русский
 Türkçe
 Svenska
 Chinese
 Magyar
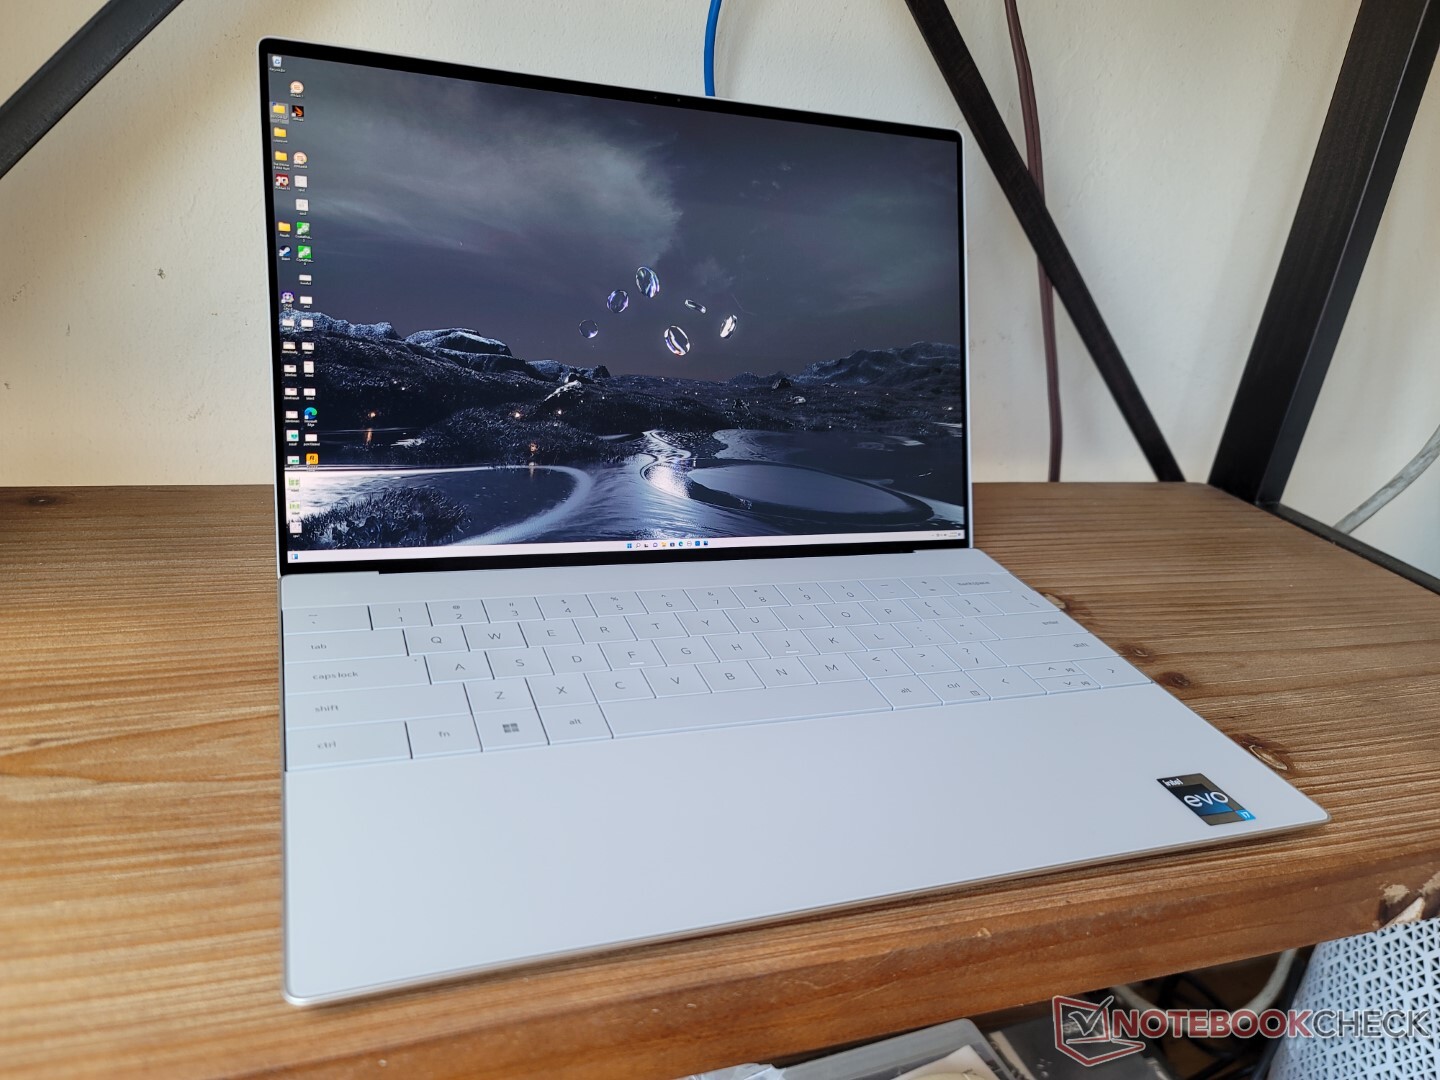
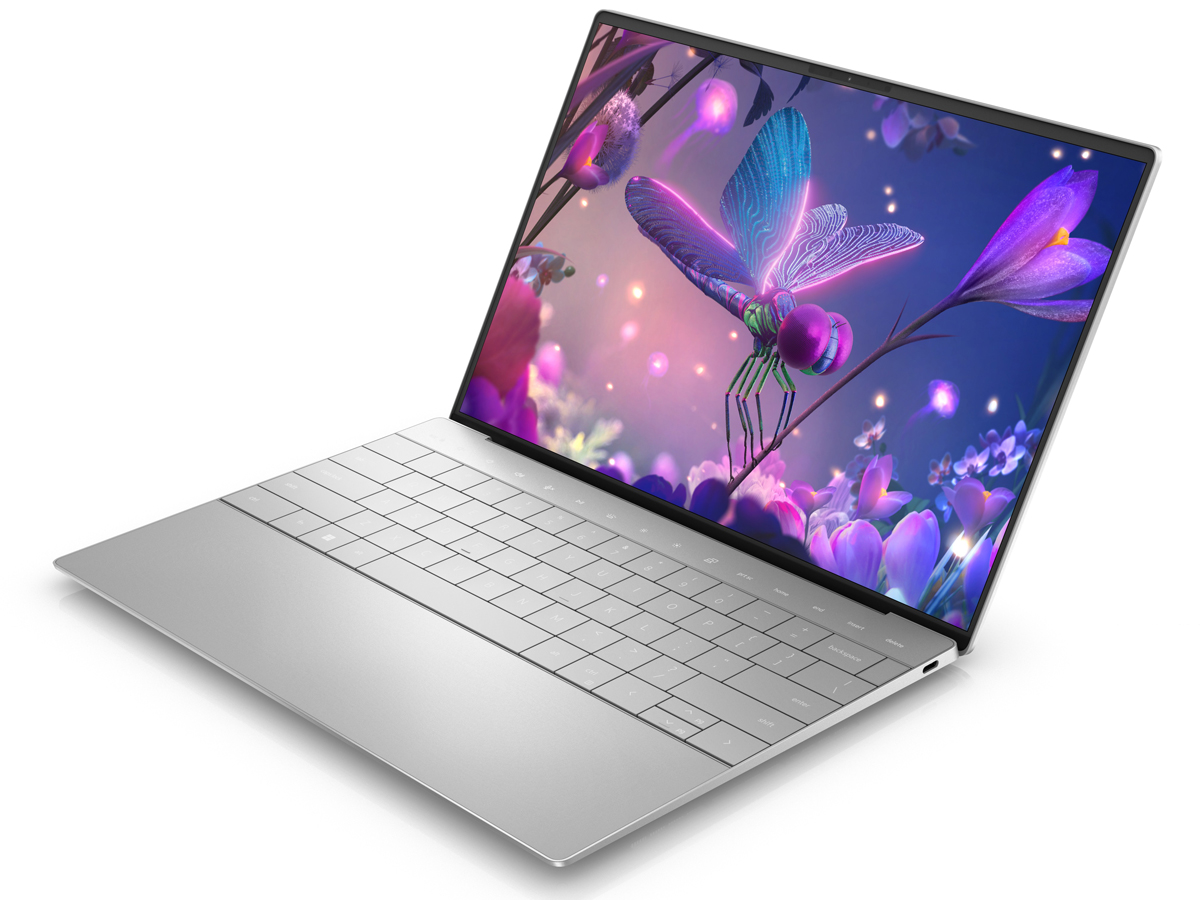
Alle drei Modelle des Dell XPS 13 Plus 9320 im Test: Core i5-1240P, i7-1260P oder i7-1280P mit OLED?

Das XPS 13 Plus 2022 wurde auf der CES 2022 erstmals vorgestellt und ist jetzt mit drei Prozessorvarianten (Core i5-1240P, Core i7-1260P und Core i7-1280P) und drei verschiedenen Displayauflösungen (1.920 x 1.200 IPS, 3.456 x 2.160 OLED und 3.840 x 2.400 IPS) verfügbar. Da wir die Konfigurationen mit dem i5-1240P, i7-1260P, dem 1.200p-IPs und dem 2.400p-IPS-Panel schon getestet haben, ist nur noch das Modell mit dem i7-1280P und dem 2.160p-OLED-Panel übrig.
In diesem Test konzentrieren wir uns also auf die Konfiguration mit dem i7-1280p und dem 2.160p-OLED-Panel und die Unterschiede zwischen diesem und anderen XPS-13-Plus-Optionen. In unserer Konfiguration kostet das Modell ca. 2.400 Euro. Für weitere Informationen zu den physikalischen Merkmalen des Modells empfehlen wir einen Blick auf unsere beiden bestehenden Tests zum XPS 13 Plus.
Weitere Dell-Tests:
Mögliche Konkurrenten im Vergleich
Bew. | Datum | Modell | Gewicht | Dicke | Größe | Auflösung | Preis ab |
|---|---|---|---|---|---|---|---|
| 87.3 % | 09.2022 | Dell XPS 13 Plus 9320 i7-1280P OLED i7-1280P, Iris Xe G7 96EUs | 1.3 kg | 15.28 mm | 13.40" | 3456x2160 | |
| 86.1 % | 08.2022 | Dell XPS 13 Plus 9320 i5-1240p i5-1240P, Iris Xe G7 80EUs | 1.2 kg | 15.3 mm | 13.40" | 1920x1200 | |
| 88.2 % | 08.2022 | Dell XPS 13 9315, i5-1230U i5-1230U, Iris Xe G7 80EUs | 1.2 kg | 14 mm | 13.40" | 1920x1200 | |
| 86.9 % | 07.2022 | Dell XPS 13 Plus 9320 4K i7-1260P, Iris Xe G7 96EUs | 1.2 kg | 15.3 mm | 13.40" | 3840x2400 | |
| 86.7 % | 10.2021 | Dell XPS 13 9310 2-in-1 i7-1165G7, Iris Xe G7 96EUs | 1.3 kg | 14.35 mm | 13.40" | 1920x1200 | |
| 88.3 % | 06.2021 | Dell XPS 13 9310 OLED i7-1185G7, Iris Xe G7 96EUs | 1.2 kg | 14.8 mm | 13.40" | 3456x2160 |
Gehäuse
Display
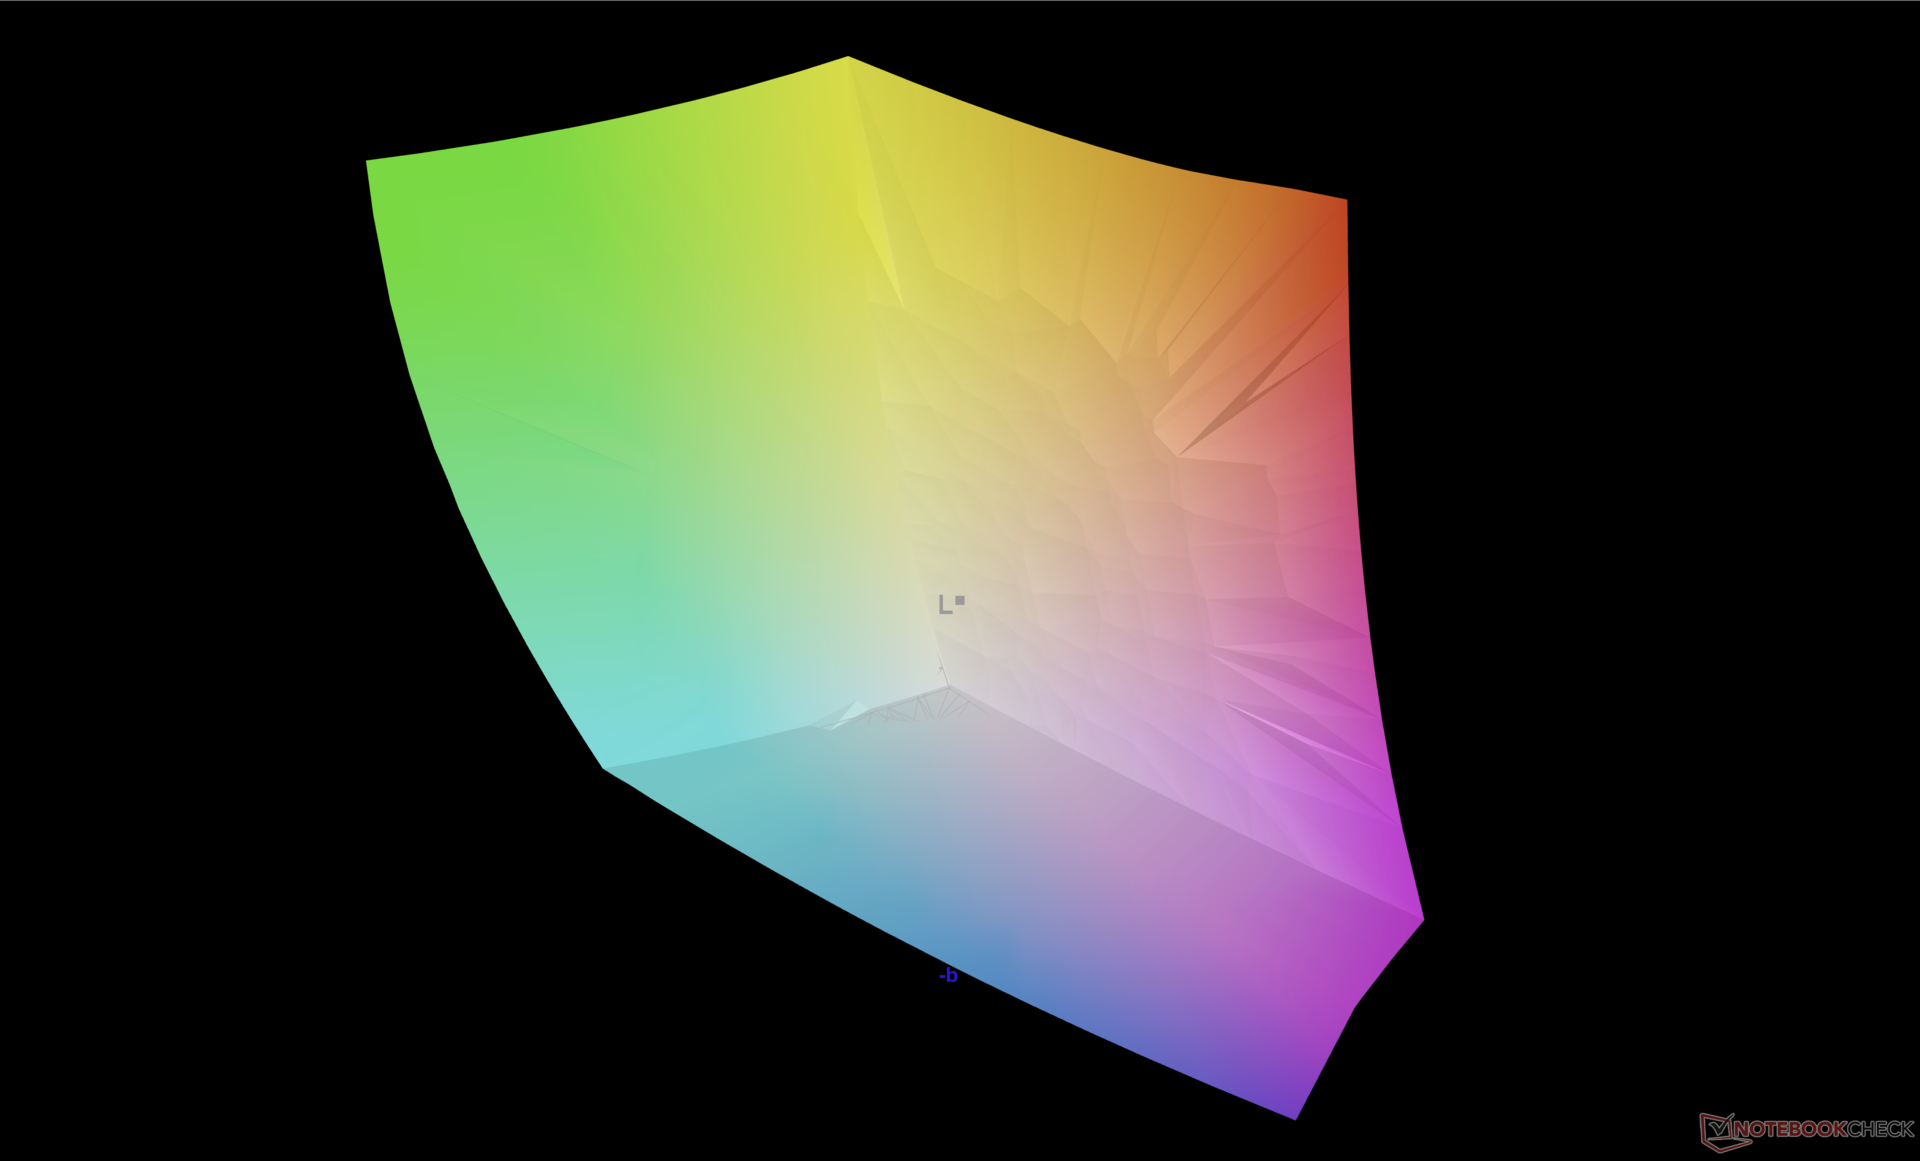
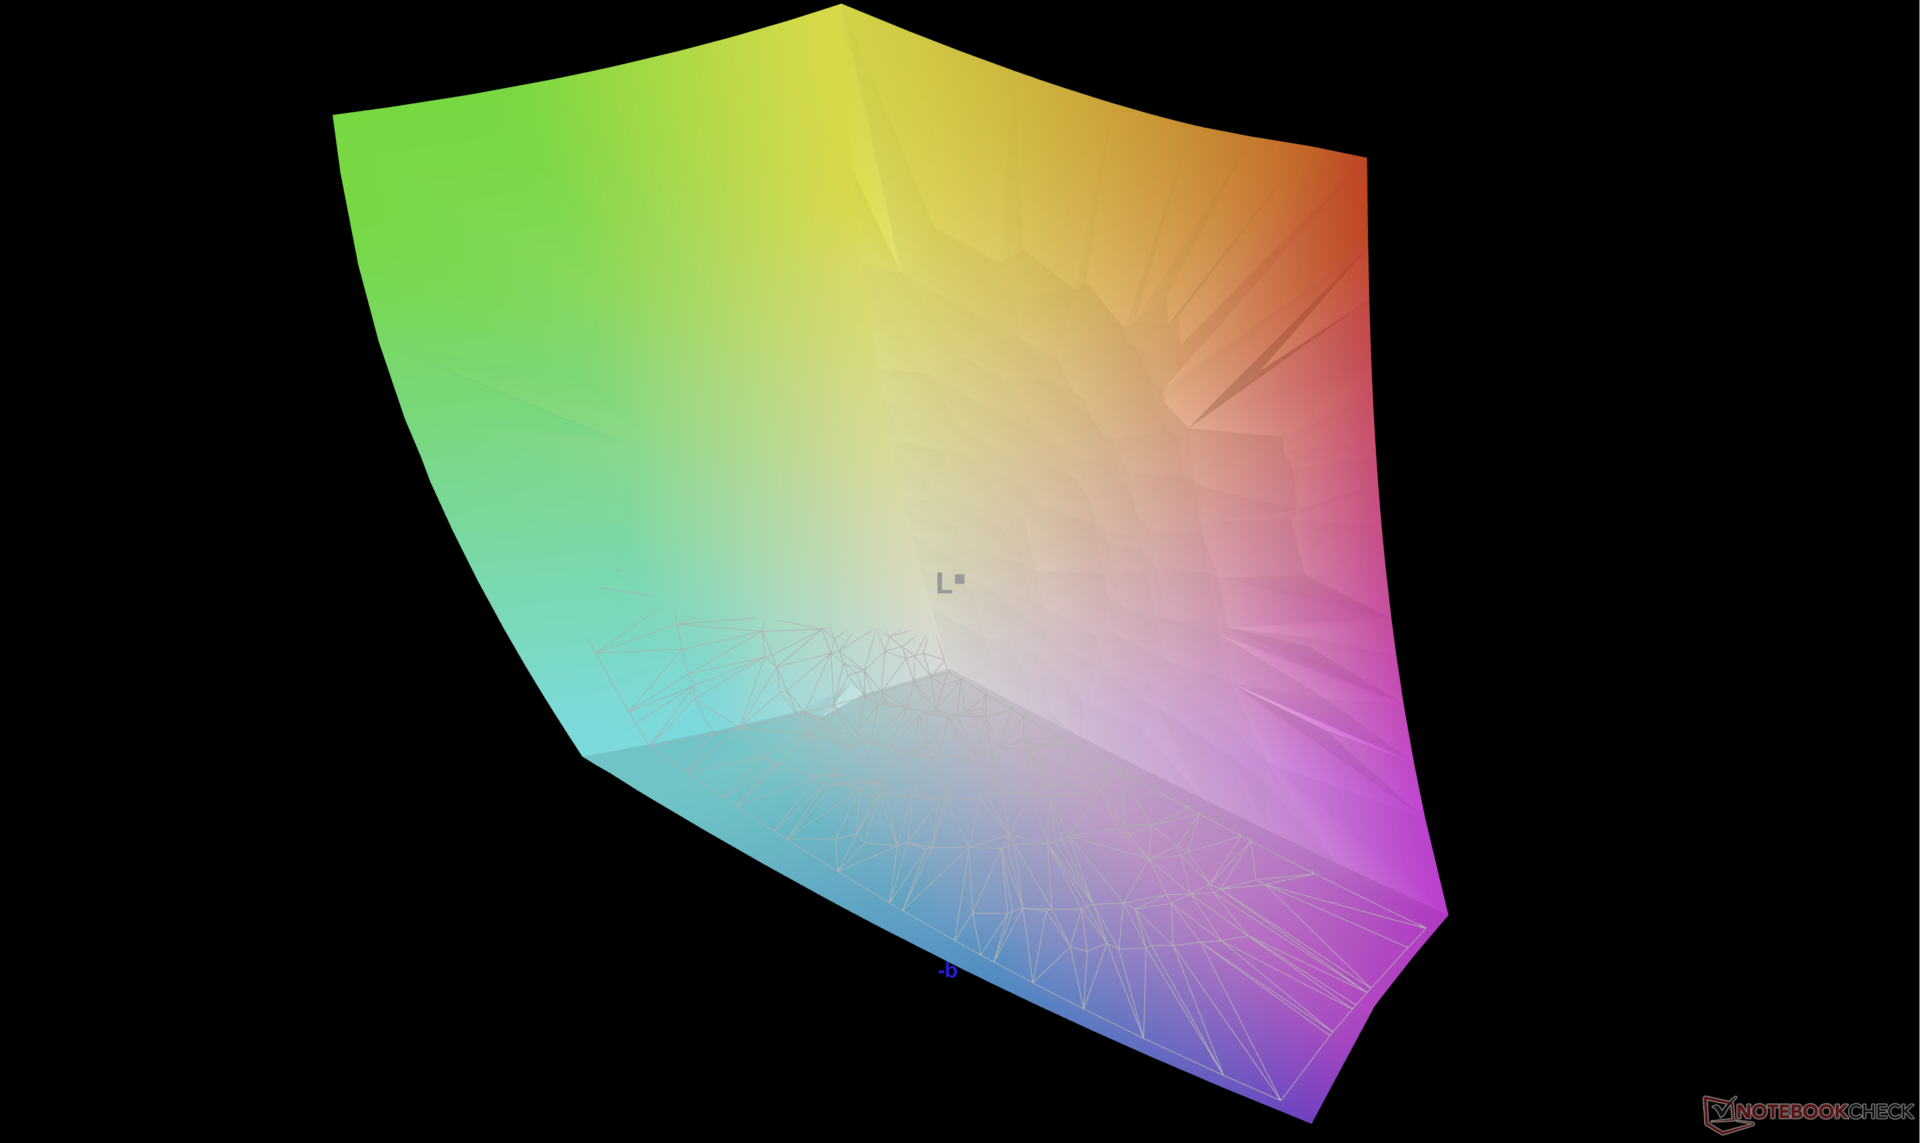
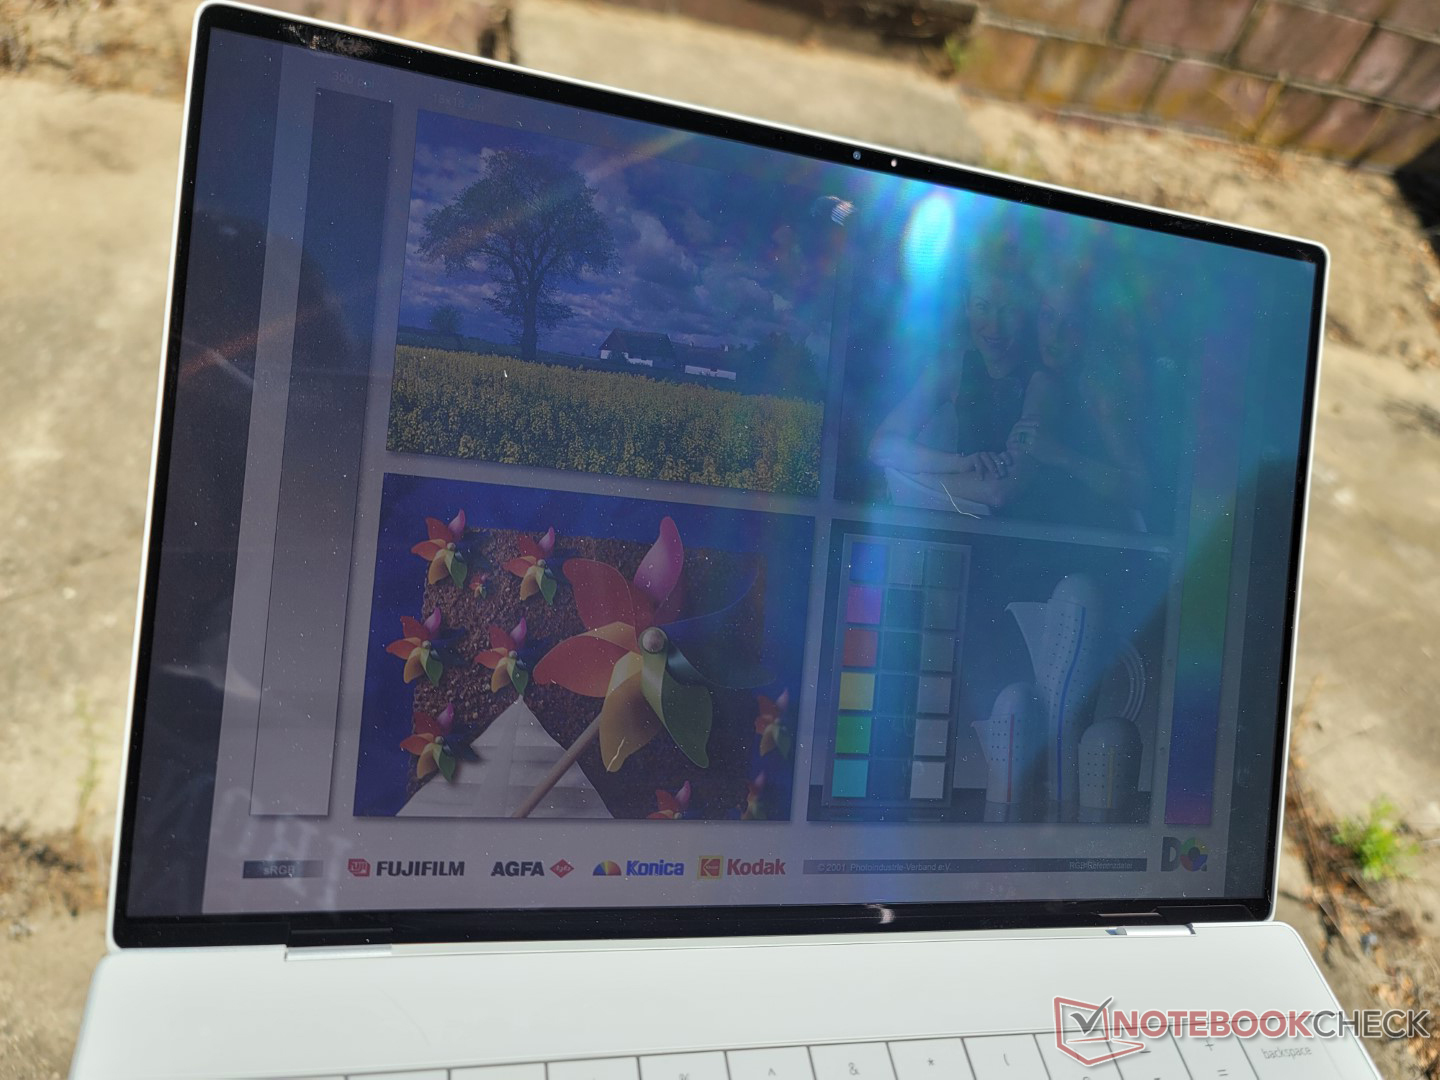
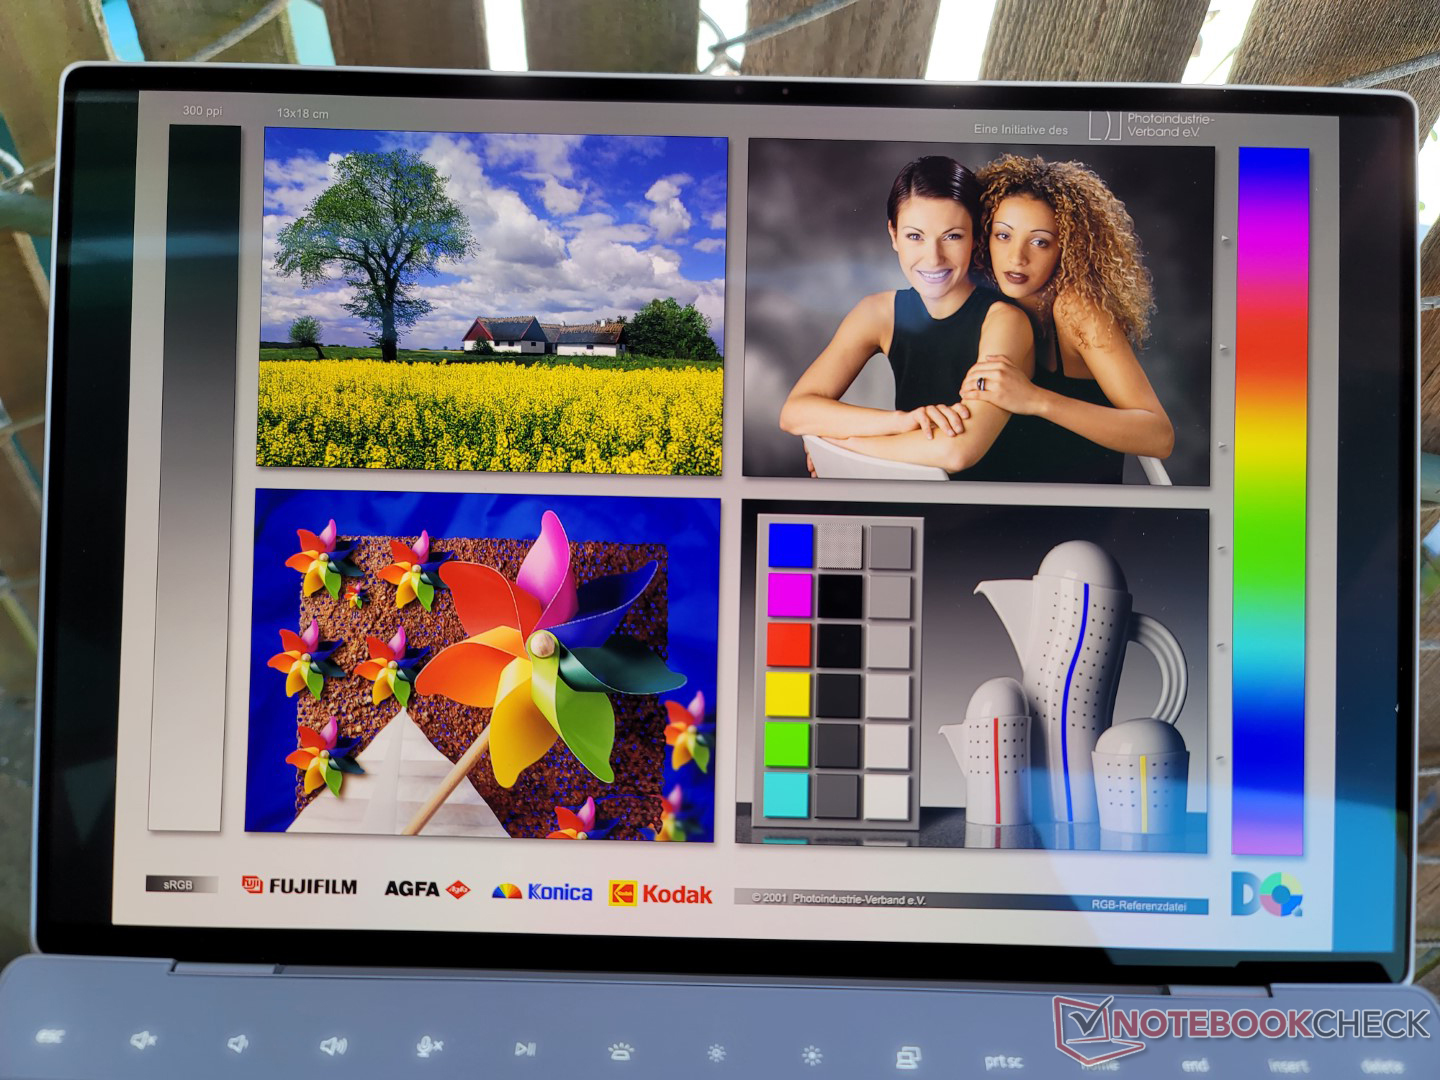
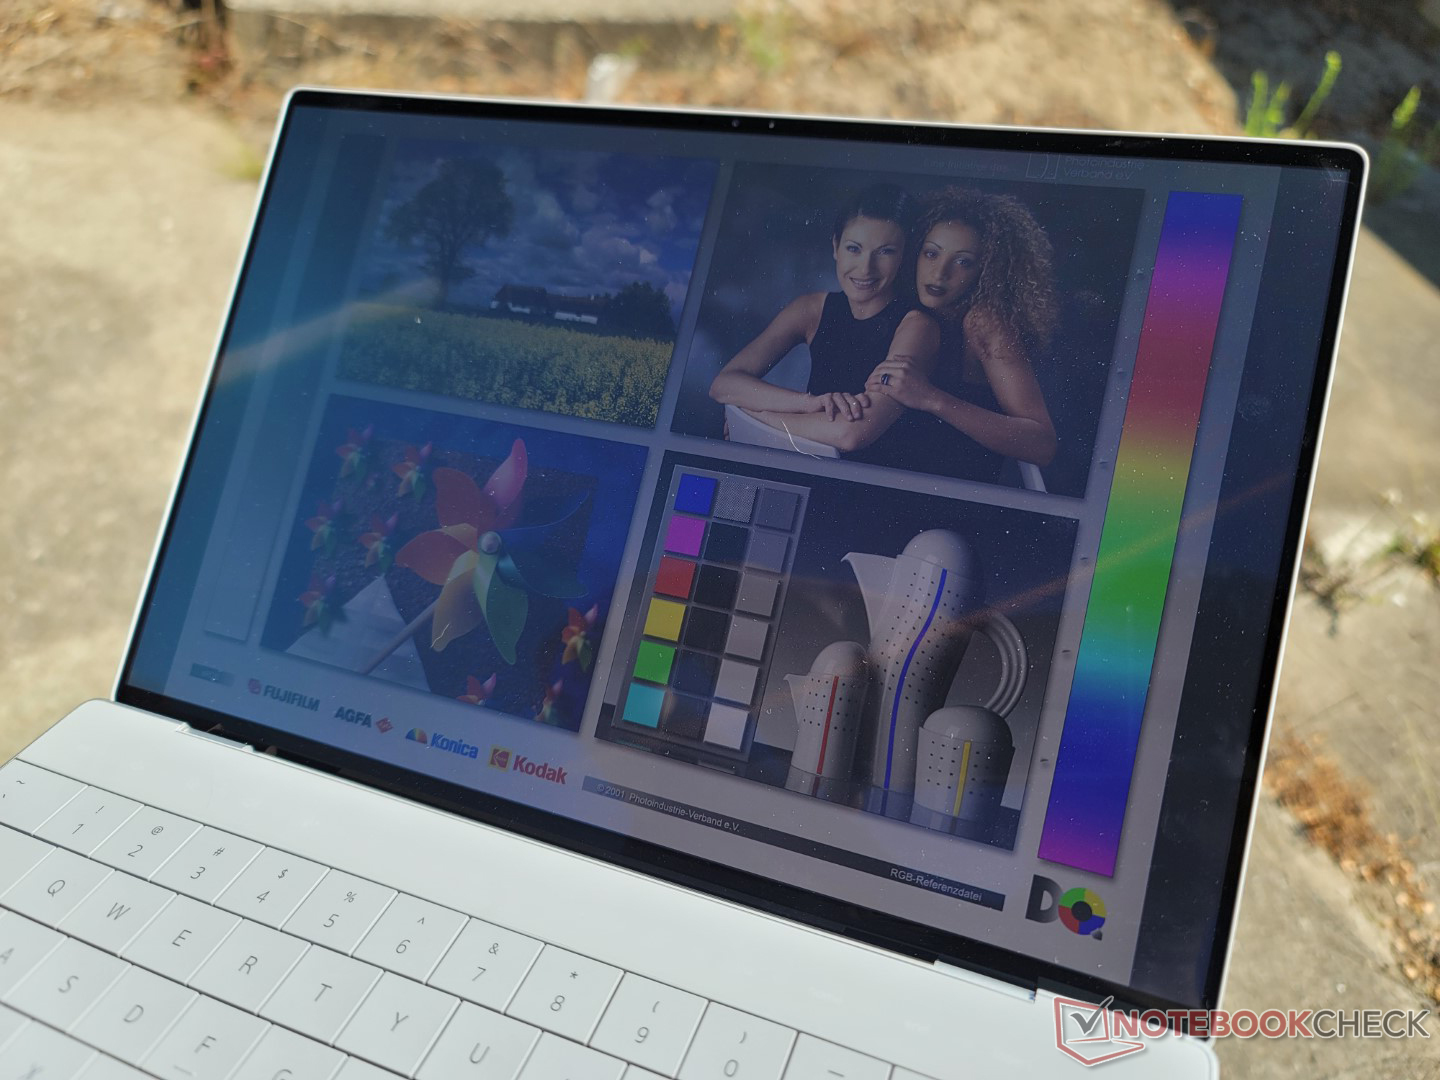
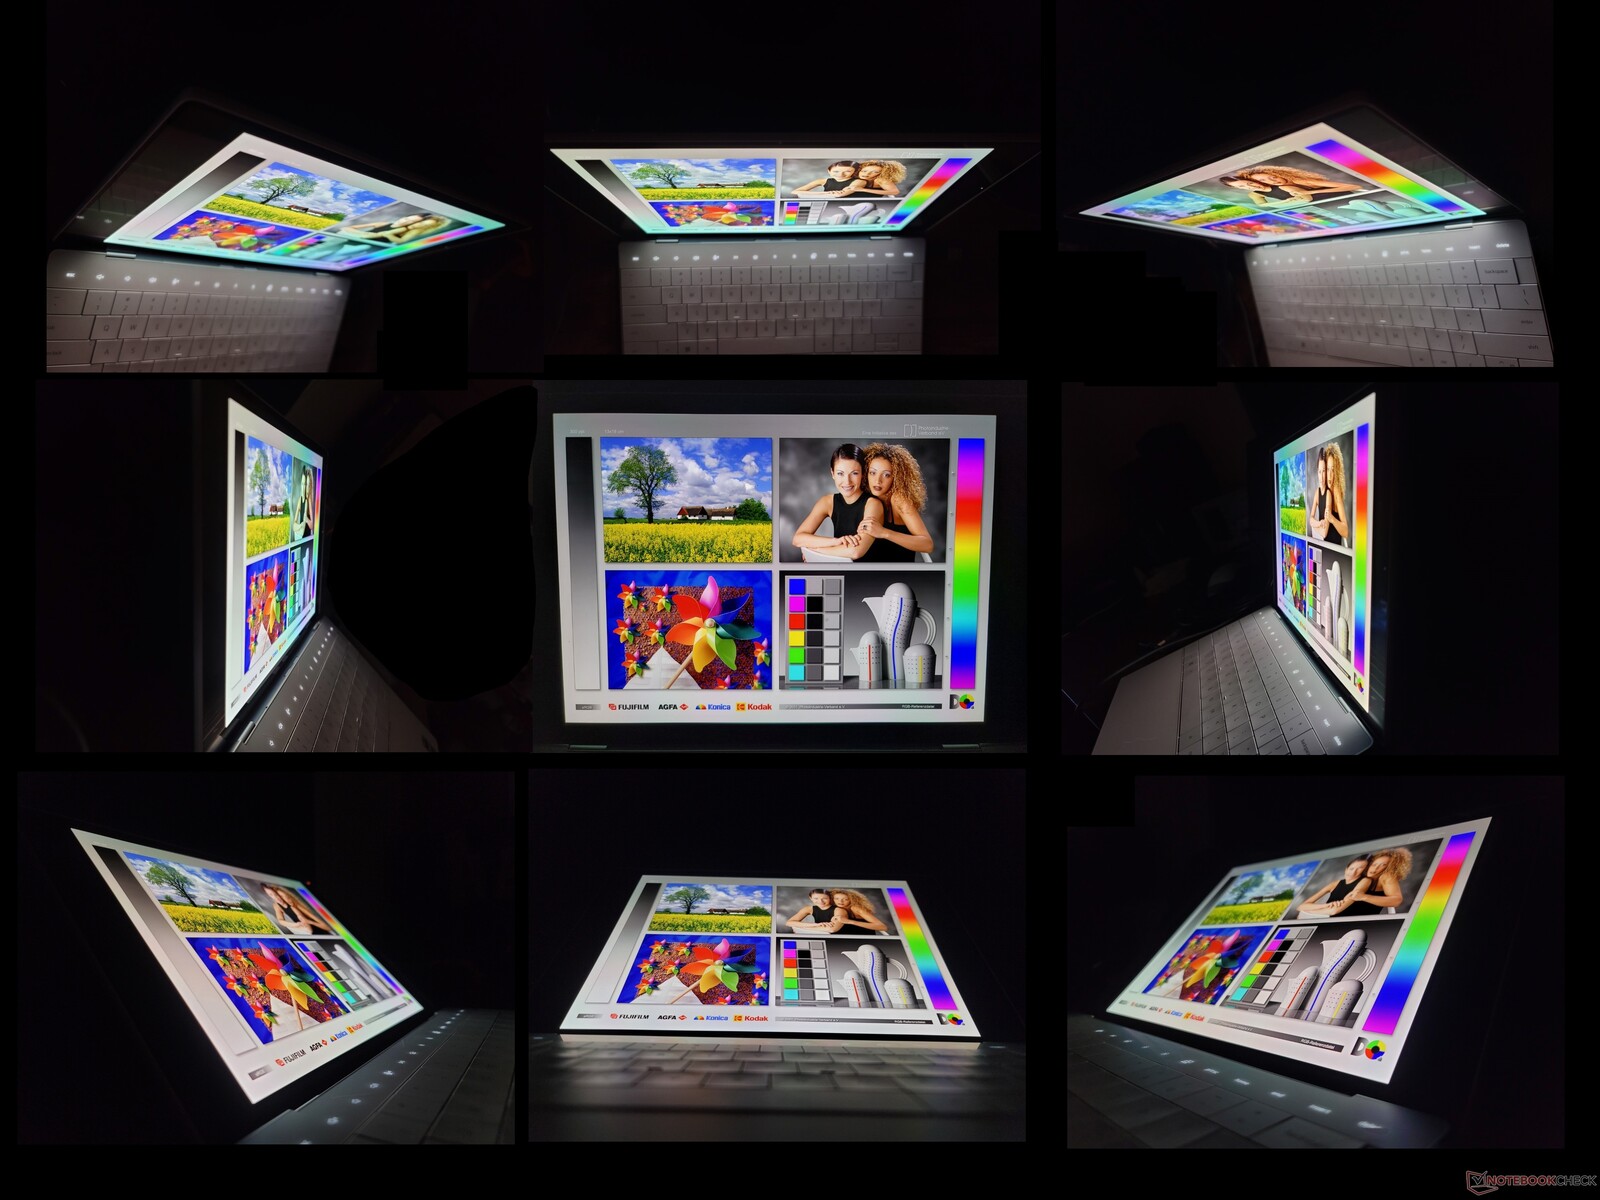
Das OLED-Panel ist nicht die uneingeschränkt beste Option, da sie, relativ zur IPS-Variante, sowohl Vor- als auch Nachteile mit sich bringt. Zu den Vorteilen gehören eine bessere Helligkeitsverteilung, ein tieferes Schwarz, die vollständige P3-Farbraumabdeckung und deutlich schnellere Schwarz-zu-Weiß- und Grau-zu-Grau-Reaktionszeiten. Als Nachteile sind das Bildschirmflackern und die um 100 cd/m² niedrigere, maximale Helligkeit zu nennen. Die Helligkeitsunterschiede fallen in Innenräumen weniger ins Gewicht, wohingegen man im Freien auf den IPS-Panels doch etwas mehr erkennt.
Wir möchten darauf hinweisen, dass es sich hierbei um fast das exakt gleiche OLED-Panel wie beim Vorgänger, dem XPS 13 9310, handelt (Samsung 134XK04 vs. Samsung 134XK01). Wer schon einmal ein XPS 13 9310 OLED gesehen hat, weiß, worauf man sich beim XPS 13 Plus 9320 OLED einstellen kann.

| |||||||||||||||||||||||||
Ausleuchtung: 98 %
Helligkeit Akku: 371.8 cd/m²
Kontrast: ∞:1 (Schwarzwert: 0 cd/m²)
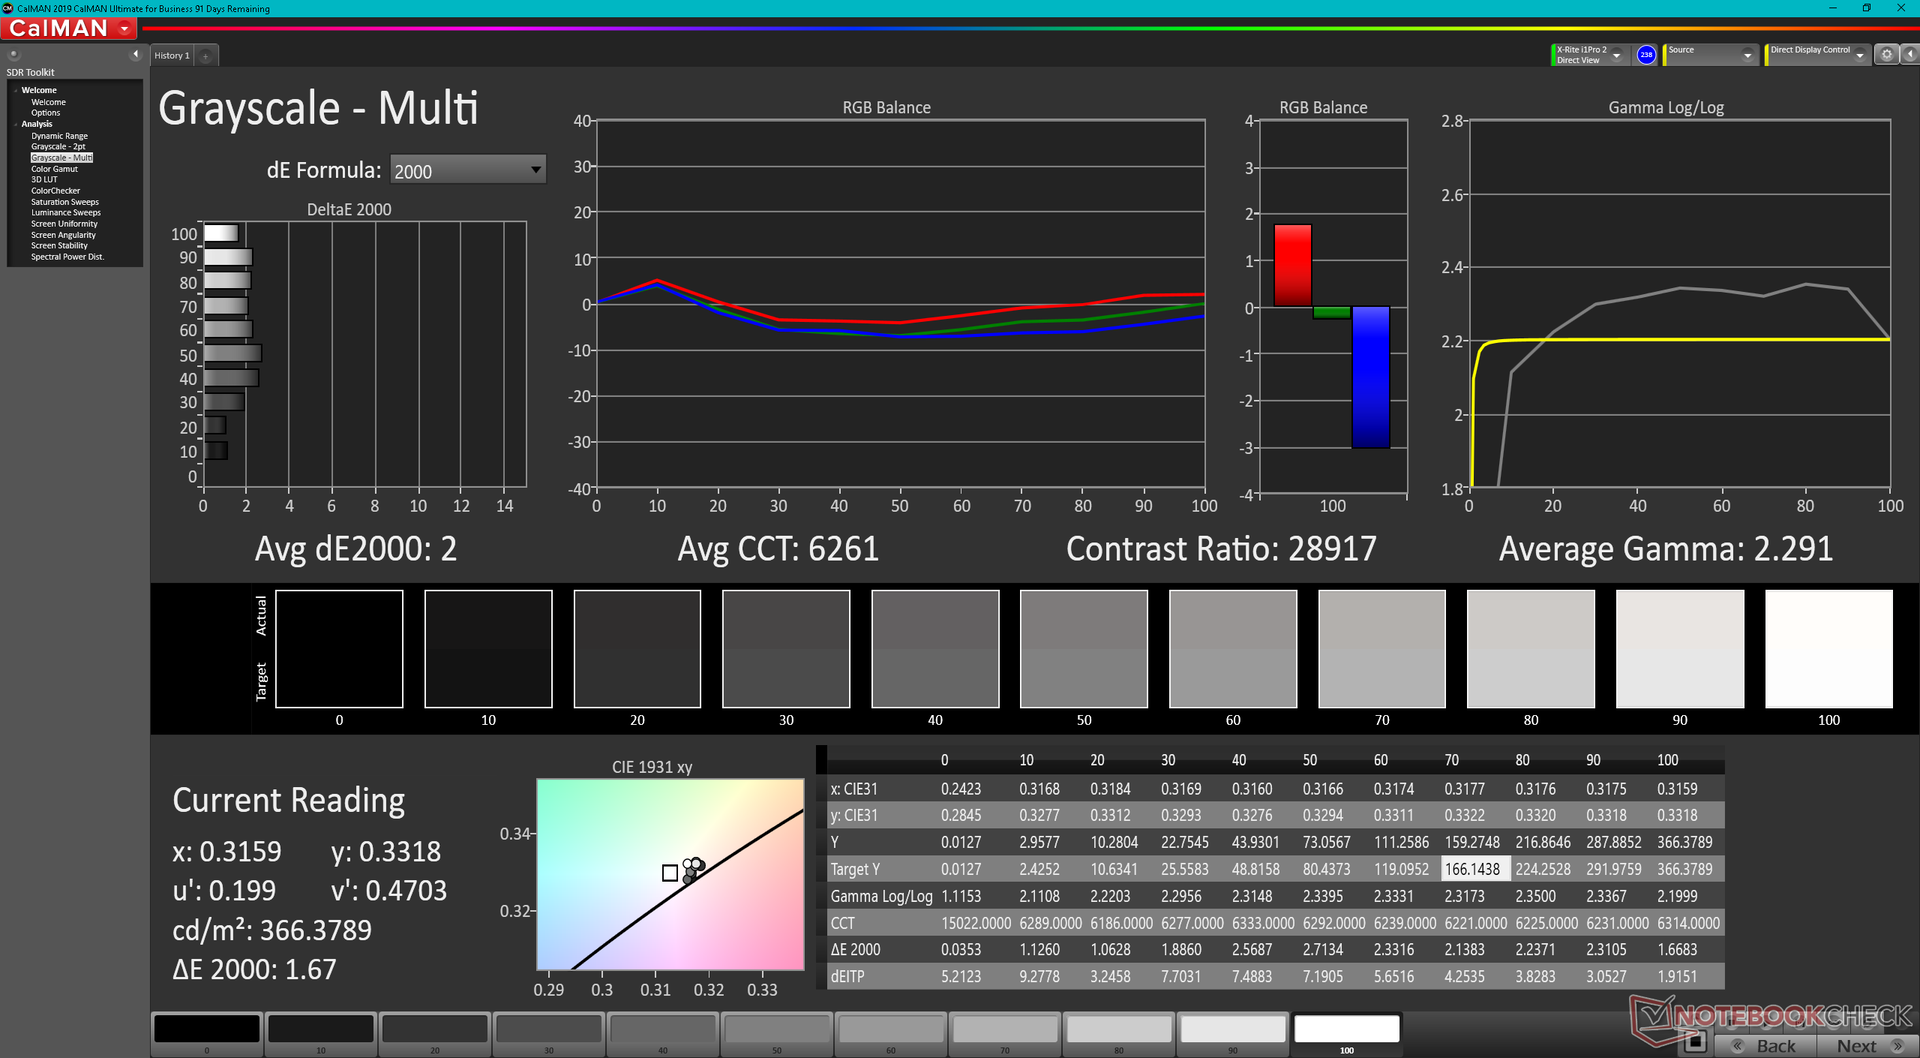
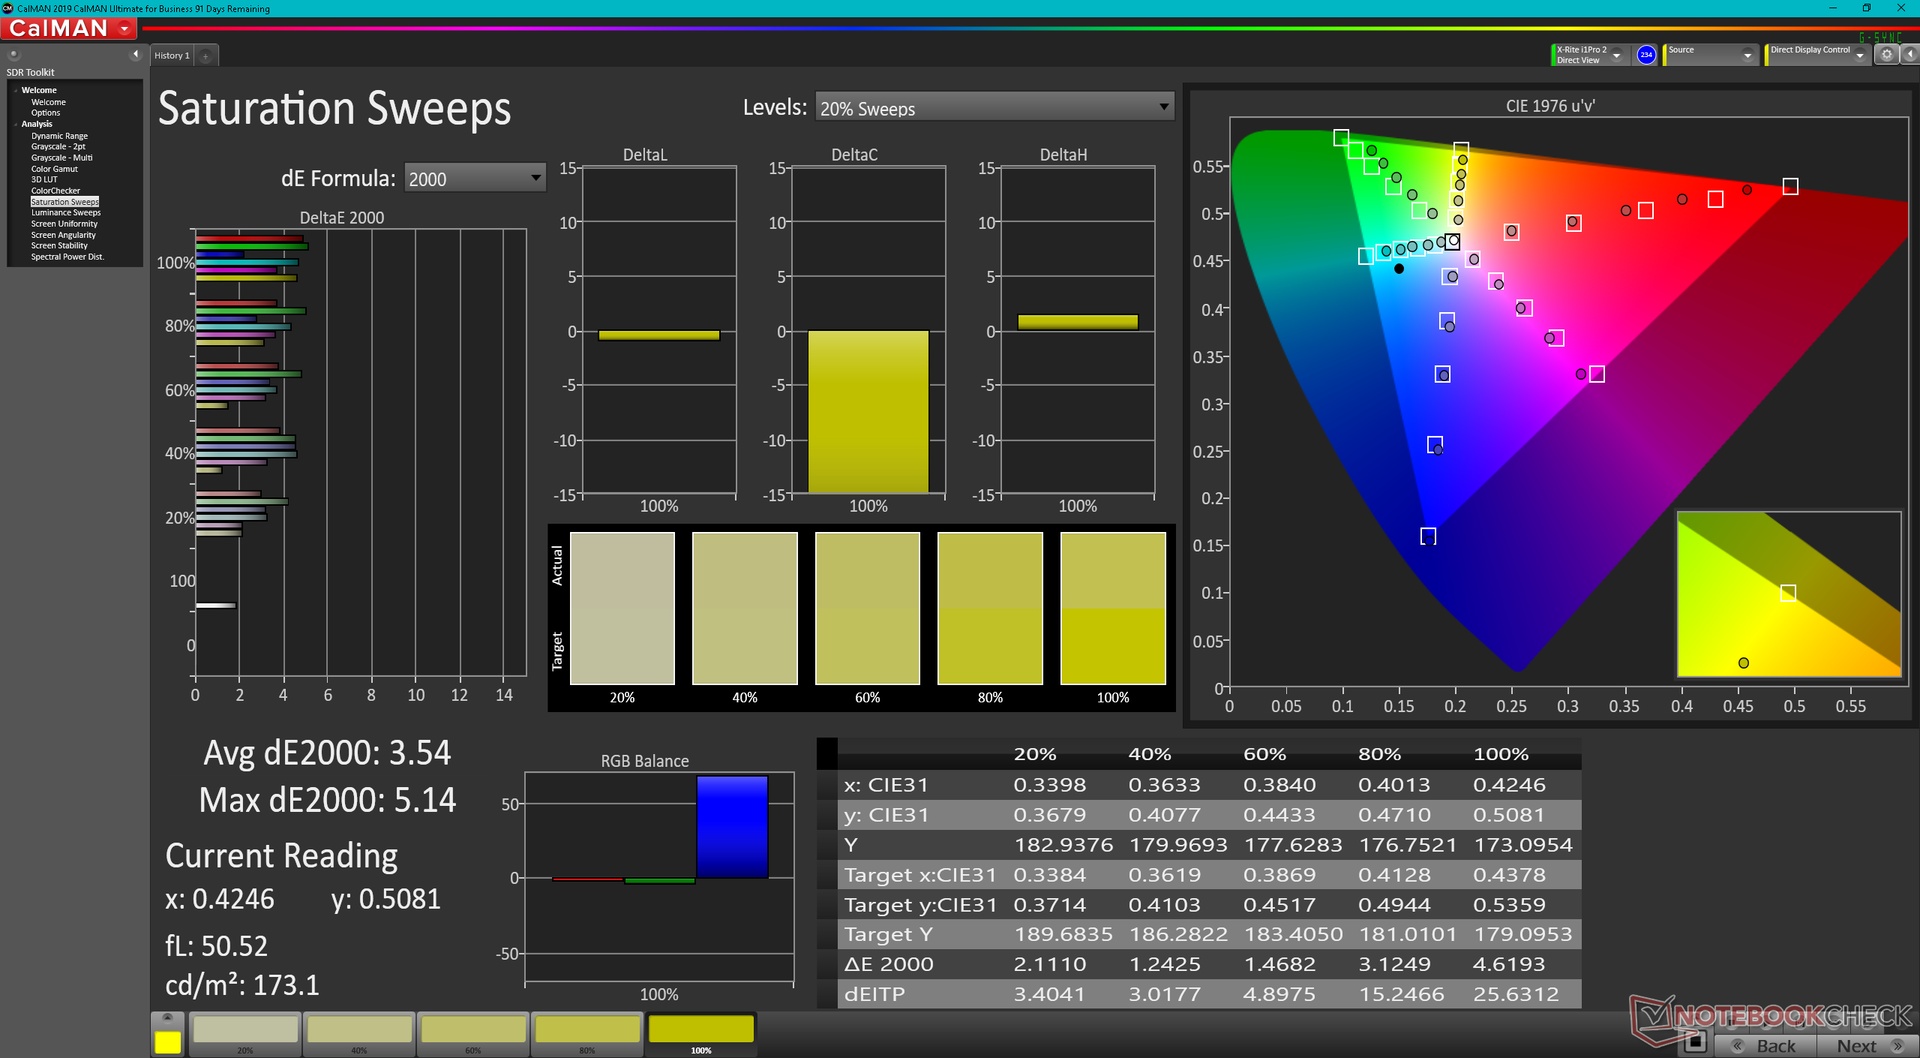
ΔE Color 2.37 | 0.5-29.43 Ø5
ΔE Greyscale 2 | 0.57-98 Ø5.3
98.4% AdobeRGB 1998 (Argyll 2.2.0 3D)
100% sRGB (Argyll 2.2.0 3D)
99.5% Display P3 (Argyll 2.2.0 3D)
Gamma: 2.29
| Dell XPS 13 Plus 9320 i7-1280P OLED Samsung 134XK04, OLED, 3456x2160, 13.40 | Dell XPS 13 Plus 9320 i5-1240p Sharp SHP1548 LQ134N1, IPS, 1920x1200, 13.40 | Dell XPS 13 9315, i5-1230U Sharp SHP1548 LQ134N1, IPS, 1920x1200, 13.40 | Dell XPS 13 Plus 9320 4K LQ134R1, IPS, 3840x2400, 13.40 | Dell XPS 13 9310 2-in-1 Sharp LQ134N1, IPS, 1920x1200, 13.40 | Dell XPS 13 9310 OLED Samsung 134XK01, OLED, 3456x2160, 13.40 | |
|---|---|---|---|---|---|---|
| Display | -20% | -20% | -15% | -19% | -0% | |
| Display P3 Coverage | 99.5 | 69 -31% | 69 -31% | 76.5 -23% | 69.7 -30% | 99.7 0% |
| sRGB Coverage | 100 | 99 -1% | 100 0% | 100 0% | 99 -1% | 100 0% |
| AdobeRGB 1998 Coverage | 98.4 | 71 -28% | 71 -28% | 76 -23% | 71.7 -27% | 97.7 -1% |
| Response Times | -1266% | -1193% | -1170% | 80% | 105% | |
| Response Time Grey 50% / Grey 80% * | 2.6 ? | 45 ? -1631% | 40 ? -1438% | 38.9 ? -1396% | 55.6 ? -2038% | 2.2 ? 15% |
| Response Time Black / White * | 2.1 ? | 21 ? -900% | 22 ? -948% | 21.9 ? -943% | 40.4 ? -1824% | 2.2 ? -5% |
| PWM Frequency | 59.5 | 2500 ? 4102% | 240.4 ? 304% | |||
| Bildschirm | -23% | -10% | -2% | -44% | -14% | |
| Helligkeit Bildmitte | 371.8 | 498 34% | 466 25% | 494 33% | 555.7 49% | 384 3% |
| Brightness | 374 | 460 23% | 442 18% | 474 27% | 528 41% | 387 3% |
| Brightness Distribution | 98 | 85 -13% | 89 -9% | 89 -9% | 90 -8% | 97 -1% |
| Schwarzwert * | 0.53 | 0.4 | 0.28 | 0.35 | ||
| Delta E Colorchecker * | 2.37 | 3.65 -54% | 3.03 -28% | 3.1 -31% | 4.83 -104% | 4.56 -92% |
| Colorchecker dE 2000 max. * | 6.1 | 7.11 -17% | 6.68 -10% | 4.2 31% | 8.46 -39% | 7.27 -19% |
| Delta E Graustufen * | 2 | 4.25 -113% | 3.12 -56% | 3.2 -60% | 6.1 -205% | 1.5 25% |
| Gamma | 2.29 96% | 2.45 90% | 2.41 91% | 2.41 91% | 1.98 111% | 2.26 97% |
| CCT | 6261 104% | 6690 97% | 6418 101% | 6189 105% | 6686 97% | 6219 105% |
| Kontrast | 940 | 1165 | 1764 | 1588 | ||
| Colorchecker dE 2000 calibrated * | 2.16 | 2.34 | 1.5 | 0.76 | 4.52 | |
| Farbraum (Prozent von AdobeRGB 1998) | 87.1 | |||||
| Color Space (Percent of sRGB) | 100 | |||||
| Durchschnitt gesamt (Programm / Settings) | -436% /
-248% | -408% /
-228% | -396% /
-218% | 6% /
-7% | 30% /
19% |
* ... kleinere Werte sind besser

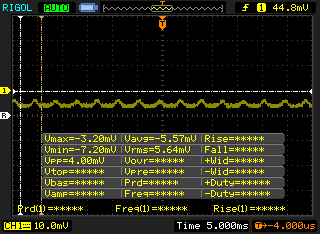
Reaktionszeiten (Response Times) des Displays
| ↔ Reaktionszeiten Schwarz zu Weiß | ||
|---|---|---|
| 2.1 ms ... steigend ↗ und fallend ↘ kombiniert | ↗ 0.8 ms steigend | 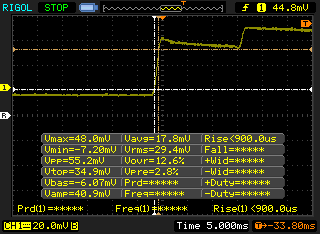 |
| ↘ 1.3 ms fallend | ||
| Die gemessenen Reaktionszeiten sind sehr kurz, wodurch sich der Bildschirm auch für schnelle 3D Spiele eignen sollte. Im Vergleich rangierten die bei uns getesteten Geräte von 0.1 (Minimum) zu 240 (Maximum) ms. » 7 % aller Screens waren schneller als der getestete. Daher sind die gemessenen Reaktionszeiten besser als der Durchschnitt aller vermessenen Geräte (21.5 ms). | ||
| ↔ Reaktionszeiten 50% Grau zu 80% Grau | ||
| 2.6 ms ... steigend ↗ und fallend ↘ kombiniert | ↗ 1.3 ms steigend | 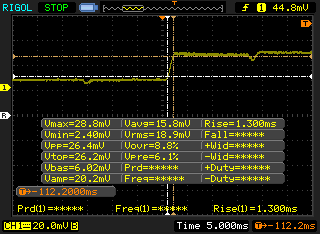 |
| ↘ 1.3 ms fallend | ||
| Die gemessenen Reaktionszeiten sind sehr kurz, wodurch sich der Bildschirm auch für schnelle 3D Spiele eignen sollte. Im Vergleich rangierten die bei uns getesteten Geräte von 0.2 (Minimum) zu 636 (Maximum) ms. » 7 % aller Screens waren schneller als der getestete. Daher sind die gemessenen Reaktionszeiten besser als der Durchschnitt aller vermessenen Geräte (33.7 ms). | ||
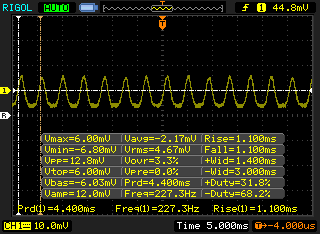
Bildschirm-Flackern / PWM (Pulse-Width Modulation)
| Flackern / PWM festgestellt | 59.5 Hz | 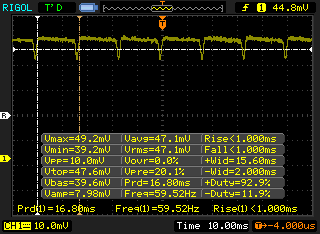 | |
Das Display flackert mit 59.5 Hz (im schlimmsten Fall, eventuell durch Pulsweitenmodulation PWM) . Die Frequenz von 59.5 Hz ist sehr gering und daher kann es bei allen Usern zu sichtbaren Flackern, brennenden Augen oder Kopfweh kommen. Im Vergleich: 53 % aller getesteten Geräte nutzten kein PWM um die Helligkeit zu reduzieren. Wenn PWM eingesetzt wurde, dann bei einer Frequenz von durchschnittlich 17908 (Minimum 5, Maximum 3846000) Hz. | |||
Wie fast jeder andere OLED-Laptop stellen wir auch hier Bildschirmflackern bzw. den Einsatz der Pulsweitenmodulation fest. Die Frequenz liegt bei einer Helligkeitsstufe von 0-52 % bei 227,3 Hz und zwischen 53 und 100 % bei 59,5 Hz. Nutzer, die empfindlich auf Displayflackern reagieren, sind mit einem IPS-Modell möglicherweise besser bedient.


Leistung

Testbedingungen
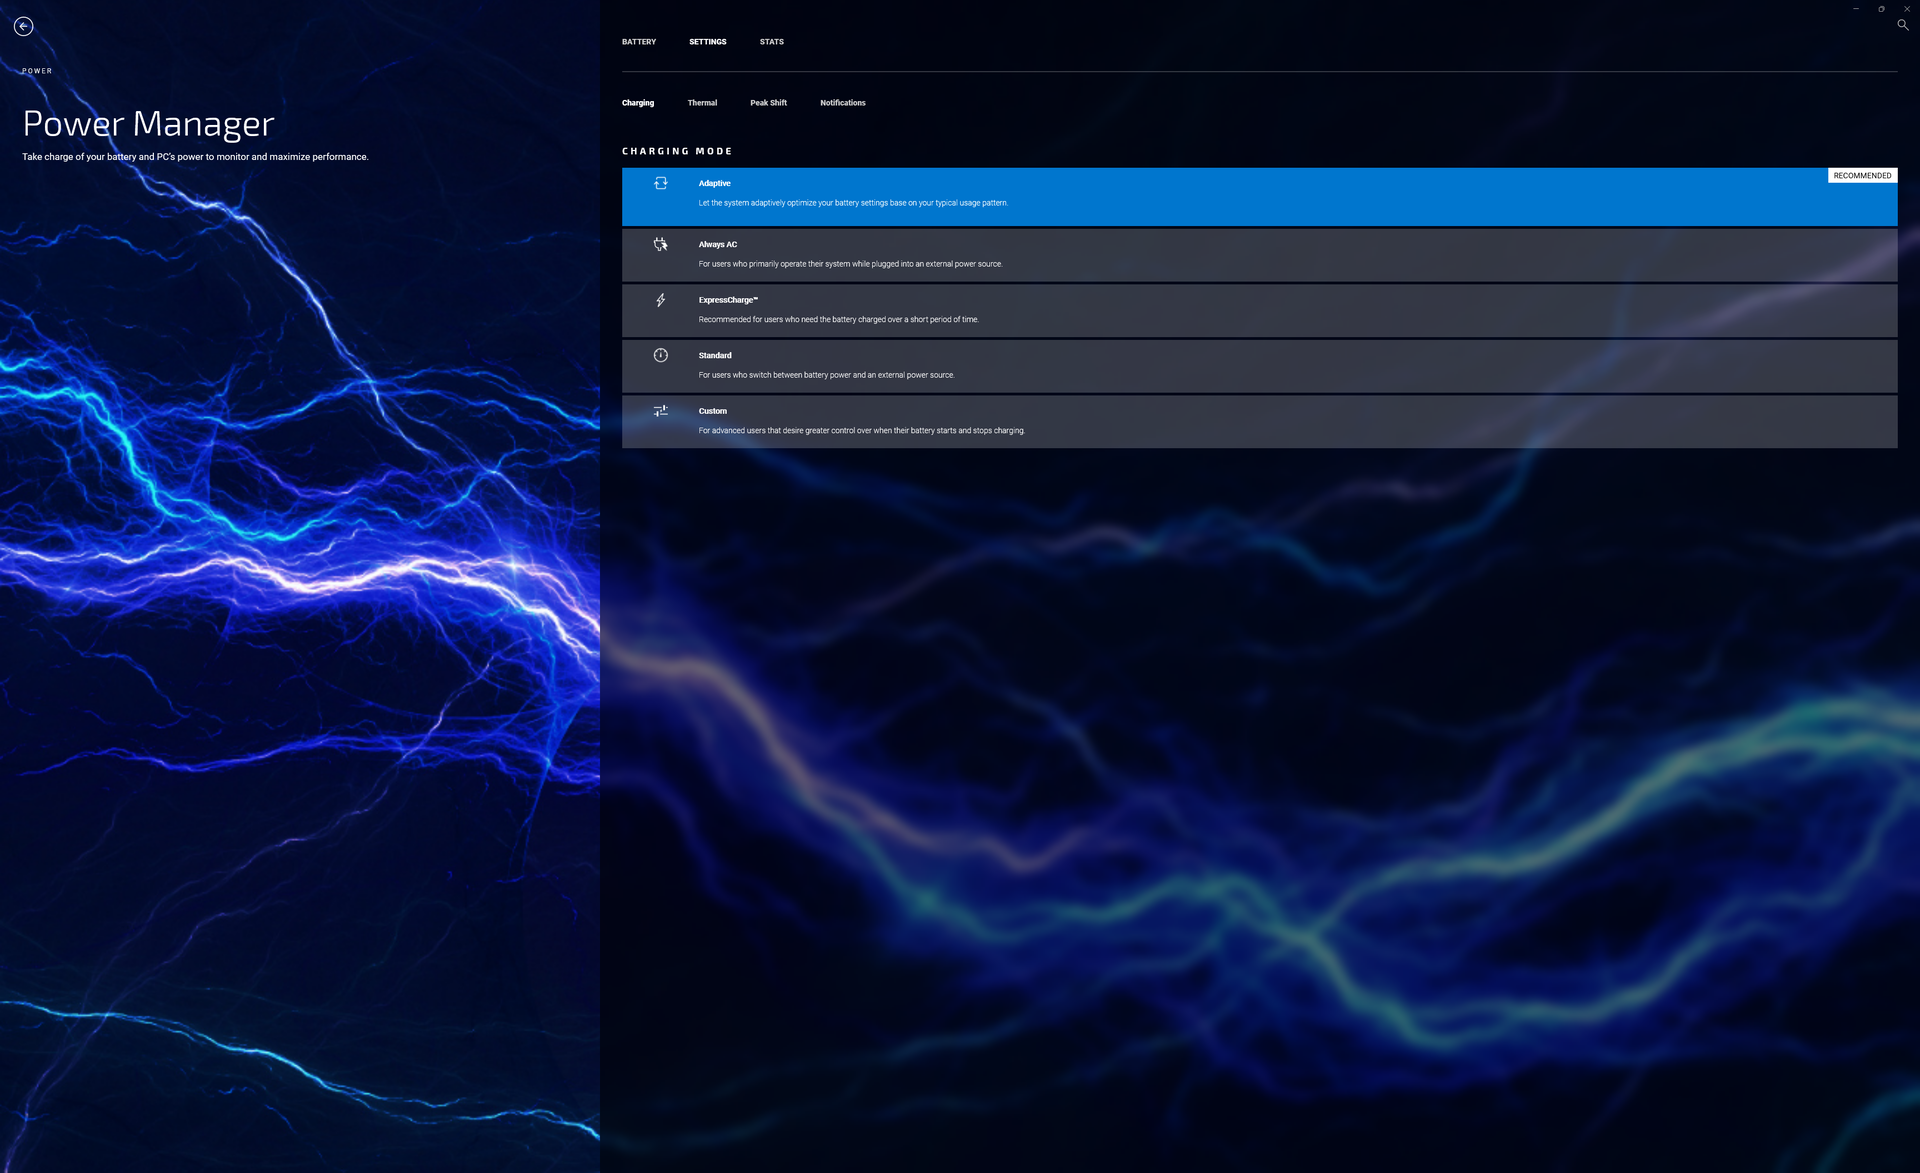
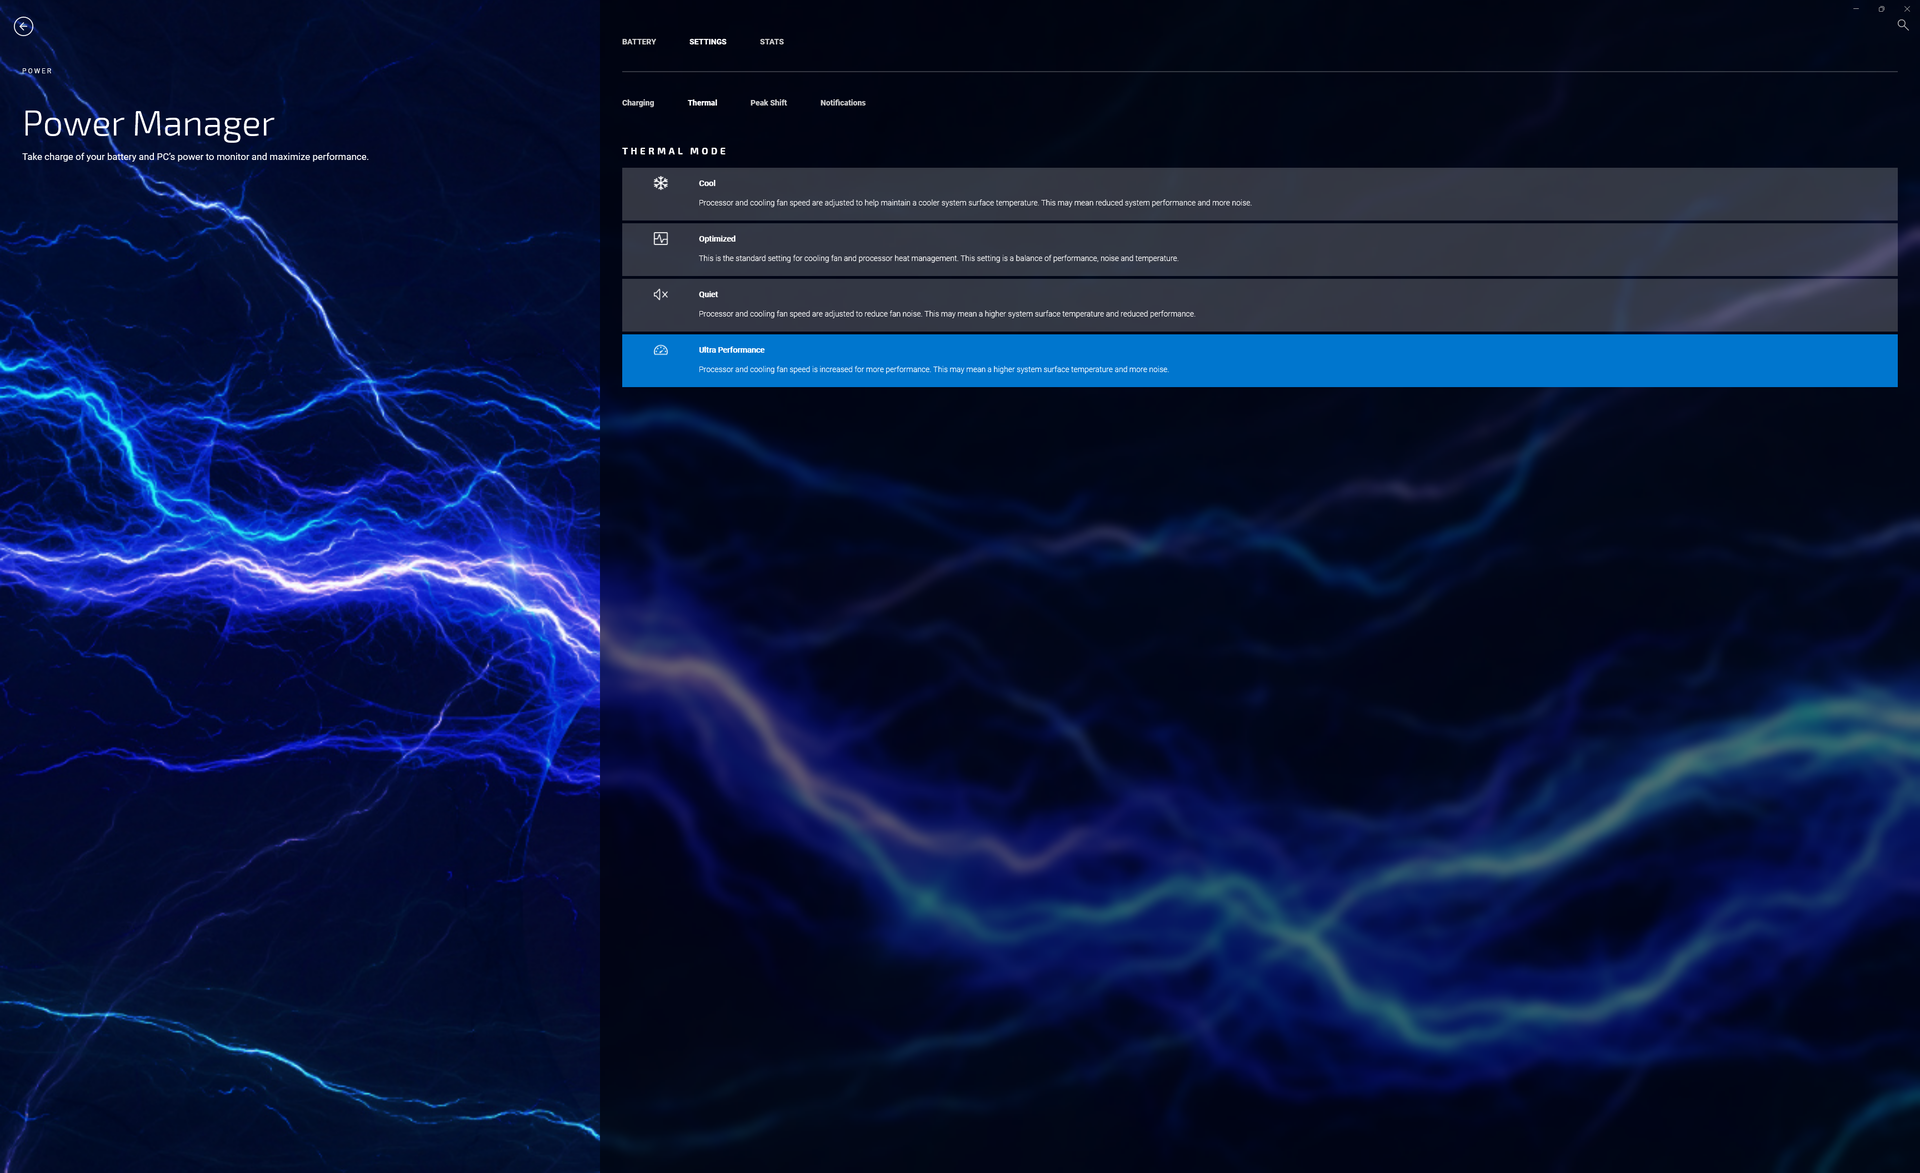
Wir haben bei unserem Testgerät vor dem Durchführen der folgenden Benchmarks in Windows den Hochleistungsmodus und in der My-Dell-Software den Ultrahochleistungsmodus ausgewählt. Wir empfehlen Nutzern, sich mit der My-Dell-Software vertraut zu machen, da uber sie wichtige Funktionen des Laptops gesteuert werden können.
Prozessor
Die Multi-Thread-Leistung ist um 15 % höher als bei der Core-i7-1260P- bzw. um 25-30 % höher als bei der Core-i5-1240P-Konfiguration. Man sollte jedoch beachten, dass die Leistung unseres Core i7-1280P unter Dauerlast unter die des Core i7-1260P fallen kann. In unserem Cinebench-R15-xT-Schleifentest liegen die Punktzahlen unseres i7-1280P in den ersten paar Durchläufen über und schließlich um fast 8 % unter denen des i7-1260P.
Dauertest: Cinebench R15 Multi
Cinebench R23: Multi Core | Single Core
Cinebench R15: CPU Multi 64Bit | CPU Single 64Bit
Blender: v2.79 BMW27 CPU
7-Zip 18.03: 7z b 4 | 7z b 4 -mmt1
Geekbench 5.5: Multi-Core | Single-Core
HWBOT x265 Benchmark v2.2: 4k Preset
LibreOffice : 20 Documents To PDF
R Benchmark 2.5: Overall mean
| Cinebench R20 / CPU (Multi Core) | |
| Durchschnittliche Intel Core i7-1280P (3283 - 5415, n=8) | |
| Dell XPS 13 Plus 9320 i7-1280P OLED | |
| Dell XPS 13 Plus 9320 4K | |
| Dell XPS 13 Plus 9320 i5-1240p | |
| Dell XPS 13 9310 OLED | |
| Dell XPS 13 9315, i5-1230U | |
| Dell XPS 13 9310 2-in-1 | |
| Cinebench R20 / CPU (Single Core) | |
| Dell XPS 13 Plus 9320 4K | |
| Durchschnittliche Intel Core i7-1280P (615 - 701, n=8) | |
| Dell XPS 13 Plus 9320 i7-1280P OLED | |
| Dell XPS 13 Plus 9320 i5-1240p | |
| Dell XPS 13 9310 OLED | |
| Dell XPS 13 9310 2-in-1 | |
| Dell XPS 13 9315, i5-1230U | |
| Cinebench R23 / Multi Core | |
| Dell XPS 13 Plus 9320 i7-1280P OLED | |
| Durchschnittliche Intel Core i7-1280P (8632 - 14803, n=8) | |
| Dell XPS 13 Plus 9320 4K | |
| Dell XPS 13 Plus 9320 i5-1240p | |
| Dell XPS 13 9310 OLED | |
| Dell XPS 13 9310 2-in-1 | |
| Dell XPS 13 9315, i5-1230U | |
| Cinebench R23 / Single Core | |
| Dell XPS 13 Plus 9320 4K | |
| Durchschnittliche Intel Core i7-1280P (1609 - 1787, n=7) | |
| Dell XPS 13 Plus 9320 i5-1240p | |
| Dell XPS 13 Plus 9320 i7-1280P OLED | |
| Dell XPS 13 9310 OLED | |
| Dell XPS 13 9310 2-in-1 | |
| Dell XPS 13 9315, i5-1230U | |
| Cinebench R15 / CPU Multi 64Bit | |
| Durchschnittliche Intel Core i7-1280P (1905 - 2332, n=7) | |
| Dell XPS 13 Plus 9320 i7-1280P OLED | |
| Dell XPS 13 Plus 9320 4K | |
| Dell XPS 13 Plus 9320 4K | |
| Dell XPS 13 Plus 9320 i5-1240p | |
| Dell XPS 13 9310 OLED | |
| Dell XPS 13 9310 2-in-1 | |
| Dell XPS 13 9315, i5-1230U | |
| Cinebench R15 / CPU Single 64Bit | |
| Dell XPS 13 Plus 9320 4K | |
| Durchschnittliche Intel Core i7-1280P (203 - 258, n=7) | |
| Dell XPS 13 Plus 9320 i7-1280P OLED | |
| Dell XPS 13 Plus 9320 i5-1240p | |
| Dell XPS 13 9310 OLED | |
| Dell XPS 13 9315, i5-1230U | |
| Dell XPS 13 9310 2-in-1 | |
| Blender / v2.79 BMW27 CPU | |
| Dell XPS 13 9310 2-in-1 | |
| Dell XPS 13 9310 OLED | |
| Dell XPS 13 Plus 9320 i5-1240p | |
| Dell XPS 13 Plus 9320 4K | |
| Durchschnittliche Intel Core i7-1280P (259 - 309, n=7) | |
| Dell XPS 13 Plus 9320 i7-1280P OLED | |
| 7-Zip 18.03 / 7z b 4 | |
| Durchschnittliche Intel Core i7-1280P (45292 - 53710, n=7) | |
| Dell XPS 13 Plus 9320 i7-1280P OLED | |
| Dell XPS 13 Plus 9320 4K | |
| Dell XPS 13 Plus 9320 i5-1240p | |
| Dell XPS 13 9310 2-in-1 | |
| Dell XPS 13 9315, i5-1230U | |
| Dell XPS 13 9310 OLED | |
| 7-Zip 18.03 / 7z b 4 -mmt1 | |
| Durchschnittliche Intel Core i7-1280P (4995 - 5874, n=7) | |
| Dell XPS 13 Plus 9320 4K | |
| Dell XPS 13 9310 2-in-1 | |
| Dell XPS 13 Plus 9320 i7-1280P OLED | |
| Dell XPS 13 Plus 9320 i5-1240p | |
| Dell XPS 13 9315, i5-1230U | |
| Dell XPS 13 9310 OLED | |
| Geekbench 5.5 / Multi-Core | |
| Dell XPS 13 Plus 9320 i7-1280P OLED | |
| Durchschnittliche Intel Core i7-1280P (9623 - 11811, n=7) | |
| Dell XPS 13 Plus 9320 4K | |
| Dell XPS 13 9315, i5-1230U | |
| Dell XPS 13 9310 OLED | |
| Dell XPS 13 Plus 9320 i5-1240p | |
| Geekbench 5.5 / Single-Core | |
| Dell XPS 13 Plus 9320 i7-1280P OLED | |
| Dell XPS 13 Plus 9320 4K | |
| Durchschnittliche Intel Core i7-1280P (1571 - 1802, n=7) | |
| Dell XPS 13 9315, i5-1230U | |
| Dell XPS 13 Plus 9320 i5-1240p | |
| Dell XPS 13 9310 OLED | |
| HWBOT x265 Benchmark v2.2 / 4k Preset | |
| Dell XPS 13 Plus 9320 i7-1280P OLED | |
| Durchschnittliche Intel Core i7-1280P (9.62 - 14.5, n=5) | |
| Dell XPS 13 Plus 9320 4K | |
| Dell XPS 13 Plus 9320 i5-1240p | |
| Dell XPS 13 9310 OLED | |
| Dell XPS 13 9310 2-in-1 | |
| LibreOffice / 20 Documents To PDF | |
| Dell XPS 13 Plus 9320 i5-1240p | |
| Durchschnittliche Intel Core i7-1280P (41 - 61.6, n=8) | |
| Dell XPS 13 Plus 9320 i7-1280P OLED | |
| Dell XPS 13 Plus 9320 4K | |
| Dell XPS 13 9310 OLED | |
| R Benchmark 2.5 / Overall mean | |
| Dell XPS 13 9310 2-in-1 | |
| Dell XPS 13 9310 OLED | |
| Dell XPS 13 Plus 9320 i5-1240p | |
| Dell XPS 13 Plus 9320 i7-1280P OLED | |
| Dell XPS 13 Plus 9320 4K | |
| Durchschnittliche Intel Core i7-1280P (0.4505 - 0.512, n=7) | |
* ... kleinere Werte sind besser
AIDA64: FP32 Ray-Trace | FPU Julia | CPU SHA3 | CPU Queen | FPU SinJulia | FPU Mandel | CPU AES | CPU ZLib | FP64 Ray-Trace | CPU PhotoWorxx
| Performance Rating | |
| Dell XPS 13 Plus 9320 i7-1280P OLED | |
| Durchschnittliche Intel Core i7-1280P | |
| Dell XPS 13 Plus 9320 4K | |
| Dell XPS 13 Plus 9320 i5-1240p | |
| Dell XPS 13 9310 2-in-1 | |
| Dell XPS 13 9310 OLED | |
| Dell XPS 13 9315, i5-1230U | |
| AIDA64 / FP32 Ray-Trace | |
| Dell XPS 13 Plus 9320 i7-1280P OLED | |
| Durchschnittliche Intel Core i7-1280P (7466 - 13068, n=6) | |
| Dell XPS 13 9310 2-in-1 | |
| Dell XPS 13 9310 OLED | |
| Dell XPS 13 Plus 9320 4K | |
| Dell XPS 13 Plus 9320 i5-1240p | |
| Dell XPS 13 9315, i5-1230U | |
| AIDA64 / FPU Julia | |
| Dell XPS 13 Plus 9320 i7-1280P OLED | |
| Durchschnittliche Intel Core i7-1280P (38904 - 66081, n=6) | |
| Dell XPS 13 9310 2-in-1 | |
| Dell XPS 13 Plus 9320 4K | |
| Dell XPS 13 Plus 9320 i5-1240p | |
| Dell XPS 13 9310 OLED | |
| Dell XPS 13 9315, i5-1230U | |
| AIDA64 / CPU SHA3 | |
| Dell XPS 13 Plus 9320 i7-1280P OLED | |
| Durchschnittliche Intel Core i7-1280P (1826 - 2992, n=6) | |
| Dell XPS 13 9310 2-in-1 | |
| Dell XPS 13 Plus 9320 4K | |
| Dell XPS 13 Plus 9320 i5-1240p | |
| Dell XPS 13 9310 OLED | |
| Dell XPS 13 9315, i5-1230U | |
| AIDA64 / CPU Queen | |
| Durchschnittliche Intel Core i7-1280P (80180 - 100358, n=6) | |
| Dell XPS 13 Plus 9320 i7-1280P OLED | |
| Dell XPS 13 Plus 9320 4K | |
| Dell XPS 13 Plus 9320 i5-1240p | |
| Dell XPS 13 9315, i5-1230U | |
| Dell XPS 13 9310 2-in-1 | |
| Dell XPS 13 9310 OLED | |
| AIDA64 / FPU SinJulia | |
| Dell XPS 13 Plus 9320 i7-1280P OLED | |
| Durchschnittliche Intel Core i7-1280P (5880 - 8571, n=6) | |
| Dell XPS 13 Plus 9320 4K | |
| Dell XPS 13 Plus 9320 i5-1240p | |
| Dell XPS 13 9310 2-in-1 | |
| Dell XPS 13 9310 OLED | |
| Dell XPS 13 9315, i5-1230U | |
| AIDA64 / FPU Mandel | |
| Dell XPS 13 Plus 9320 i7-1280P OLED | |
| Durchschnittliche Intel Core i7-1280P (18907 - 32766, n=6) | |
| Dell XPS 13 9310 2-in-1 | |
| Dell XPS 13 Plus 9320 i5-1240p | |
| Dell XPS 13 Plus 9320 4K | |
| Dell XPS 13 9310 OLED | |
| Dell XPS 13 9315, i5-1230U | |
| AIDA64 / CPU AES | |
| Dell XPS 13 9310 2-in-1 | |
| Durchschnittliche Intel Core i7-1280P (40691 - 99367, n=6) | |
| Dell XPS 13 Plus 9320 i7-1280P OLED | |
| Dell XPS 13 9310 OLED | |
| Dell XPS 13 Plus 9320 i5-1240p | |
| Dell XPS 13 Plus 9320 4K | |
| Dell XPS 13 9315, i5-1230U | |
| AIDA64 / CPU ZLib | |
| Durchschnittliche Intel Core i7-1280P (540 - 880, n=6) | |
| Dell XPS 13 Plus 9320 i7-1280P OLED | |
| Dell XPS 13 Plus 9320 4K | |
| Dell XPS 13 Plus 9320 i5-1240p | |
| Dell XPS 13 9310 2-in-1 | |
| Dell XPS 13 9315, i5-1230U | |
| Dell XPS 13 9310 OLED | |
| AIDA64 / FP64 Ray-Trace | |
| Dell XPS 13 Plus 9320 i7-1280P OLED | |
| Durchschnittliche Intel Core i7-1280P (4006 - 7184, n=6) | |
| Dell XPS 13 9310 2-in-1 | |
| Dell XPS 13 9310 OLED | |
| Dell XPS 13 Plus 9320 4K | |
| Dell XPS 13 Plus 9320 i5-1240p | |
| Dell XPS 13 9315, i5-1230U | |
| AIDA64 / CPU PhotoWorxx | |
| Dell XPS 13 Plus 9320 i7-1280P OLED | |
| Durchschnittliche Intel Core i7-1280P (36663 - 48416, n=6) | |
| Dell XPS 13 Plus 9320 4K | |
| Dell XPS 13 9310 2-in-1 | |
| Dell XPS 13 Plus 9320 i5-1240p | |
| Dell XPS 13 9310 OLED | |
| Dell XPS 13 9315, i5-1230U | |
Systemleistung
CrossMark: Overall | Productivity | Creativity | Responsiveness
| PCMark 10 / Score | |
| Durchschnitt der Klasse Subnotebook (4384 - 7428, n=55, der letzten 2 Jahre) | |
| Dell XPS 13 Plus 9320 i7-1280P OLED | |
| Durchschnittliche Intel Core i7-1280P, Intel Iris Xe Graphics G7 96EUs (5410 - 5994, n=4) | |
| Dell XPS 13 Plus 9320 4K | |
| Dell XPS 13 9310 OLED | |
| Dell XPS 13 9310 2-in-1 | |
| Dell XPS 13 Plus 9320 i5-1240p | |
| Dell XPS 13 9315, i5-1230U | |
| PCMark 10 / Essentials | |
| Dell XPS 13 9310 OLED | |
| Dell XPS 13 9310 2-in-1 | |
| Dell XPS 13 Plus 9320 i7-1280P OLED | |
| Dell XPS 13 Plus 9320 4K | |
| Durchschnittliche Intel Core i7-1280P, Intel Iris Xe Graphics G7 96EUs (9719 - 10920, n=4) | |
| Durchschnitt der Klasse Subnotebook (8890 - 11168, n=55, der letzten 2 Jahre) | |
| Dell XPS 13 9315, i5-1230U | |
| Dell XPS 13 Plus 9320 i5-1240p | |
| PCMark 10 / Productivity | |
| Durchschnitt der Klasse Subnotebook (6213 - 10279, n=55, der letzten 2 Jahre) | |
| Dell XPS 13 9310 OLED | |
| Dell XPS 13 Plus 9320 4K | |
| Dell XPS 13 9310 2-in-1 | |
| Durchschnittliche Intel Core i7-1280P, Intel Iris Xe Graphics G7 96EUs (6301 - 7453, n=4) | |
| Dell XPS 13 Plus 9320 i7-1280P OLED | |
| Dell XPS 13 Plus 9320 i5-1240p | |
| Dell XPS 13 9315, i5-1230U | |
| PCMark 10 / Digital Content Creation | |
| Dell XPS 13 Plus 9320 i7-1280P OLED | |
| Durchschnitt der Klasse Subnotebook (4093 - 9749, n=55, der letzten 2 Jahre) | |
| Durchschnittliche Intel Core i7-1280P, Intel Iris Xe Graphics G7 96EUs (6450 - 7180, n=4) | |
| Dell XPS 13 Plus 9320 4K | |
| Dell XPS 13 Plus 9320 i5-1240p | |
| Dell XPS 13 9310 OLED | |
| Dell XPS 13 9310 2-in-1 | |
| Dell XPS 13 9315, i5-1230U | |
| CrossMark / Overall | |
| Dell XPS 13 Plus 9320 i7-1280P OLED | |
| Durchschnittliche Intel Core i7-1280P, Intel Iris Xe Graphics G7 96EUs (1677 - 1773, n=4) | |
| Dell XPS 13 Plus 9320 4K | |
| Durchschnitt der Klasse Subnotebook (718 - 1876, n=61, der letzten 2 Jahre) | |
| Dell XPS 13 Plus 9320 i5-1240p | |
| Dell XPS 13 9315, i5-1230U | |
| CrossMark / Productivity | |
| Dell XPS 13 Plus 9320 i7-1280P OLED | |
| Durchschnittliche Intel Core i7-1280P, Intel Iris Xe Graphics G7 96EUs (1585 - 1709, n=4) | |
| Dell XPS 13 Plus 9320 4K | |
| Durchschnitt der Klasse Subnotebook (685 - 1829, n=61, der letzten 2 Jahre) | |
| Dell XPS 13 Plus 9320 i5-1240p | |
| Dell XPS 13 9315, i5-1230U | |
| CrossMark / Creativity | |
| Dell XPS 13 Plus 9320 i7-1280P OLED | |
| Durchschnittliche Intel Core i7-1280P, Intel Iris Xe Graphics G7 96EUs (1849 - 1928, n=4) | |
| Dell XPS 13 Plus 9320 4K | |
| Durchschnitt der Klasse Subnotebook (776 - 2210, n=61, der letzten 2 Jahre) | |
| Dell XPS 13 Plus 9320 i5-1240p | |
| Dell XPS 13 9315, i5-1230U | |
| CrossMark / Responsiveness | |
| Durchschnittliche Intel Core i7-1280P, Intel Iris Xe Graphics G7 96EUs (1394 - 1746, n=4) | |
| Dell XPS 13 Plus 9320 i7-1280P OLED | |
| Dell XPS 13 Plus 9320 4K | |
| Durchschnitt der Klasse Subnotebook (652 - 1899, n=61, der letzten 2 Jahre) | |
| Dell XPS 13 Plus 9320 i5-1240p | |
| Dell XPS 13 9315, i5-1230U | |
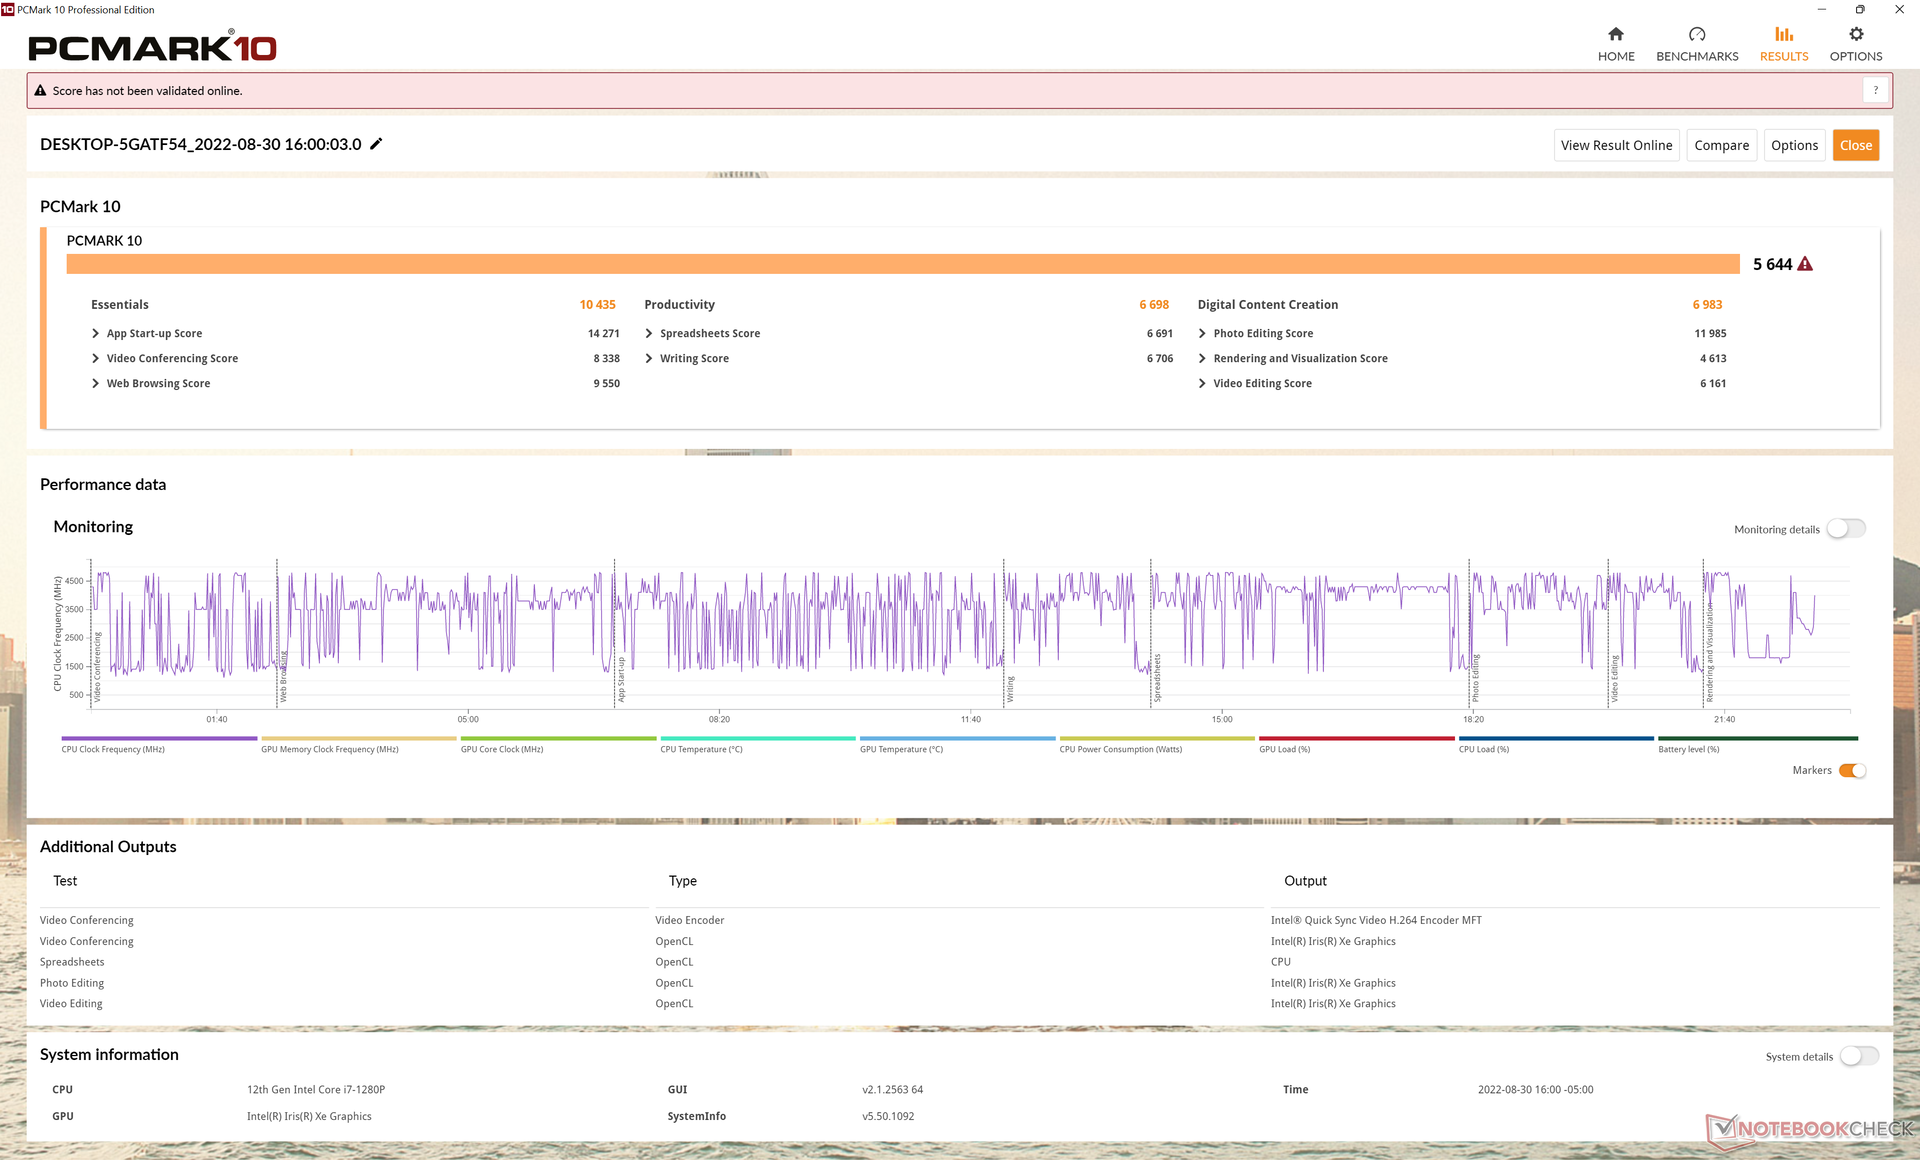
| PCMark 10 Score | 5644 Punkte | |
Hilfe | ||
| AIDA64 / Memory Copy | |
| Dell XPS 13 Plus 9320 i7-1280P OLED | |
| Dell XPS 13 Plus 9320 4K | |
| Durchschnittliche Intel Core i7-1280P (56337 - 73486, n=6) | |
| Dell XPS 13 Plus 9320 i5-1240p | |
| Dell XPS 13 9310 2-in-1 | |
| Dell XPS 13 9310 OLED | |
| Dell XPS 13 9315, i5-1230U | |
| AIDA64 / Memory Read | |
| Dell XPS 13 Plus 9320 i7-1280P OLED | |
| Dell XPS 13 Plus 9320 i5-1240p | |
| Durchschnittliche Intel Core i7-1280P (63221 - 73719, n=6) | |
| Dell XPS 13 Plus 9320 4K | |
| Dell XPS 13 9315, i5-1230U | |
| Dell XPS 13 9310 2-in-1 | |
| Dell XPS 13 9310 OLED | |
| AIDA64 / Memory Write | |
| Dell XPS 13 9310 OLED | |
| Dell XPS 13 9310 2-in-1 | |
| Dell XPS 13 Plus 9320 i7-1280P OLED | |
| Durchschnittliche Intel Core i7-1280P (58729 - 68247, n=6) | |
| Dell XPS 13 Plus 9320 4K | |
| Dell XPS 13 9315, i5-1230U | |
| Dell XPS 13 Plus 9320 i5-1240p | |
| AIDA64 / Memory Latency | |
| Dell XPS 13 9310 OLED | |
| Durchschnittliche Intel Core i7-1280P (93.1 - 153.3, n=6) | |
| Dell XPS 13 Plus 9320 i7-1280P OLED | |
| Dell XPS 13 9310 2-in-1 | |
| Dell XPS 13 9315, i5-1230U | |
* ... kleinere Werte sind besser
DPC-Latenzen
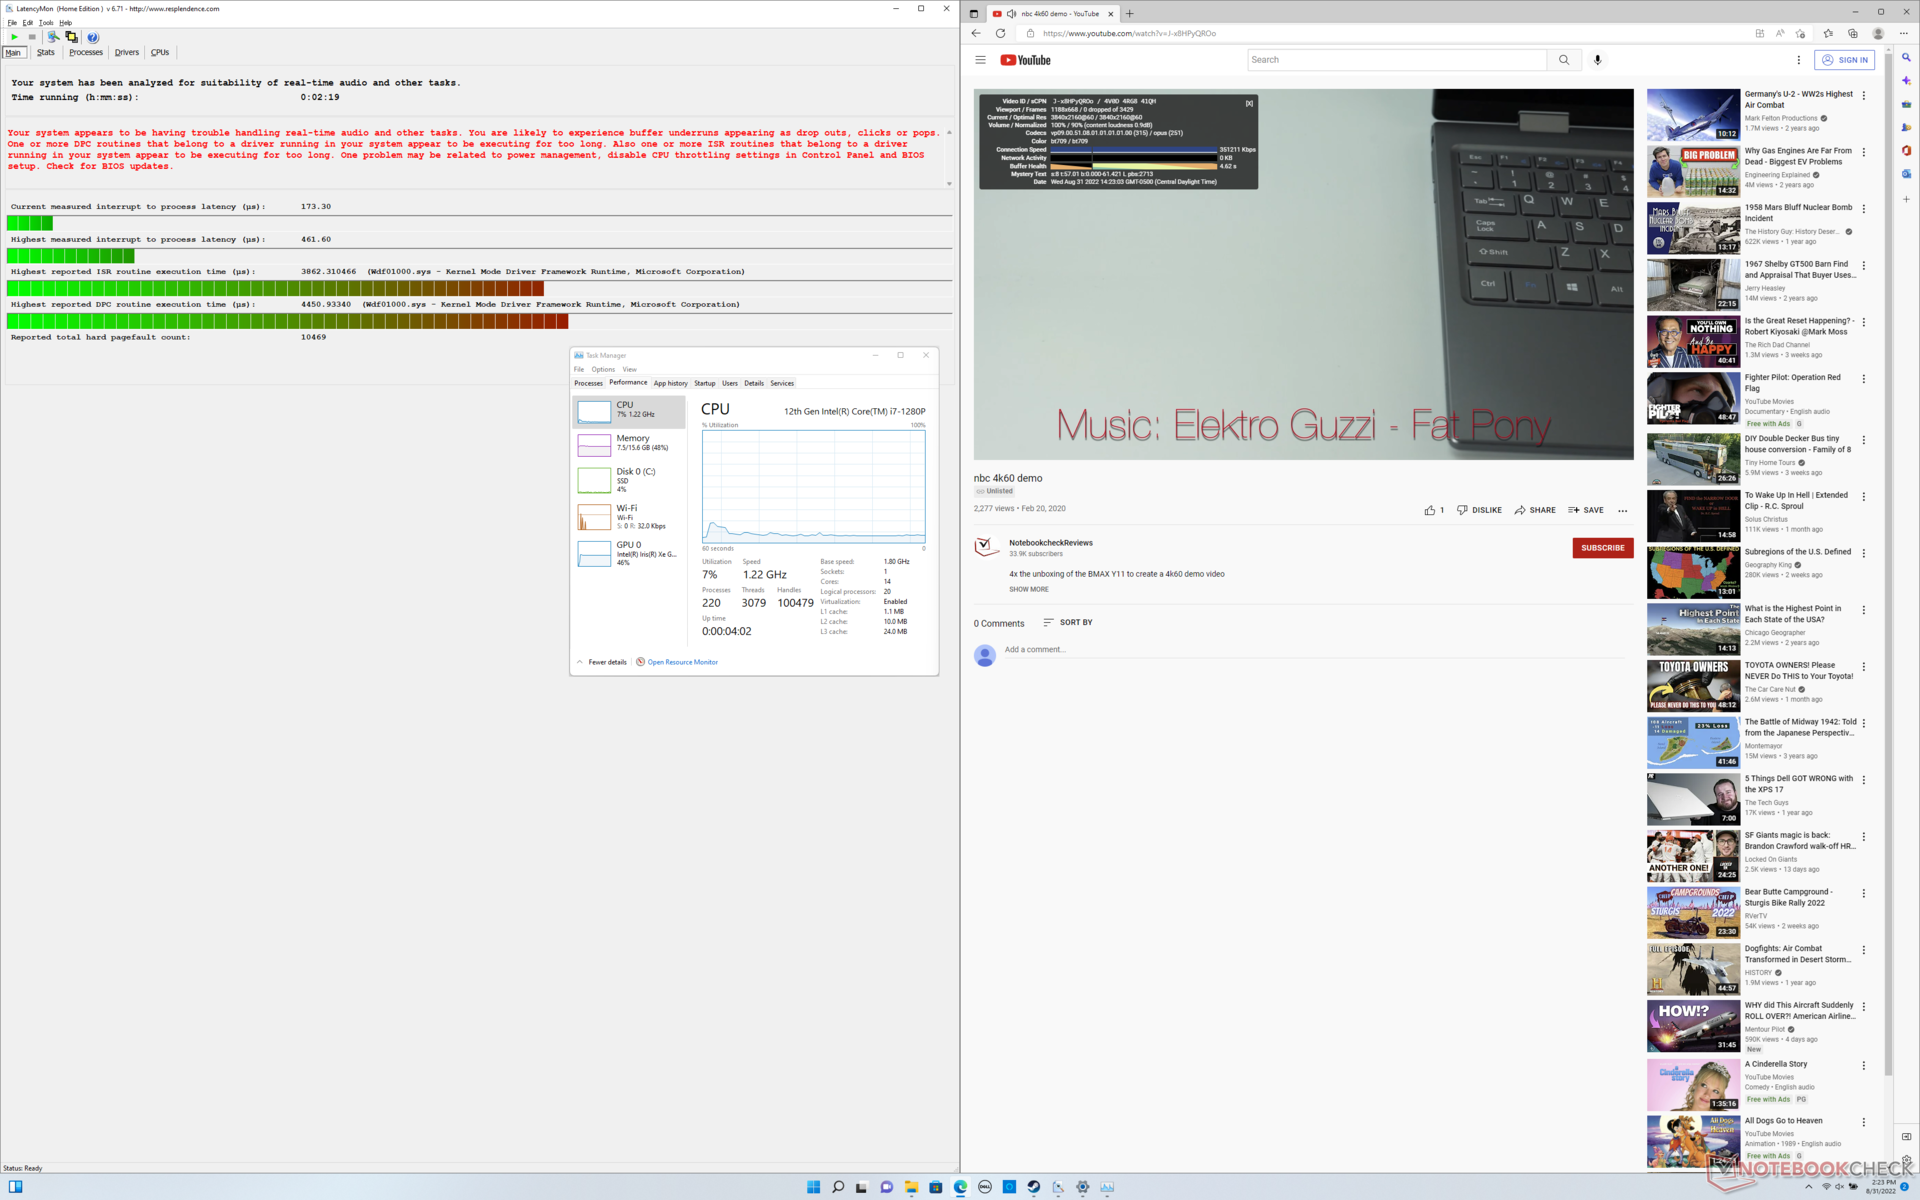
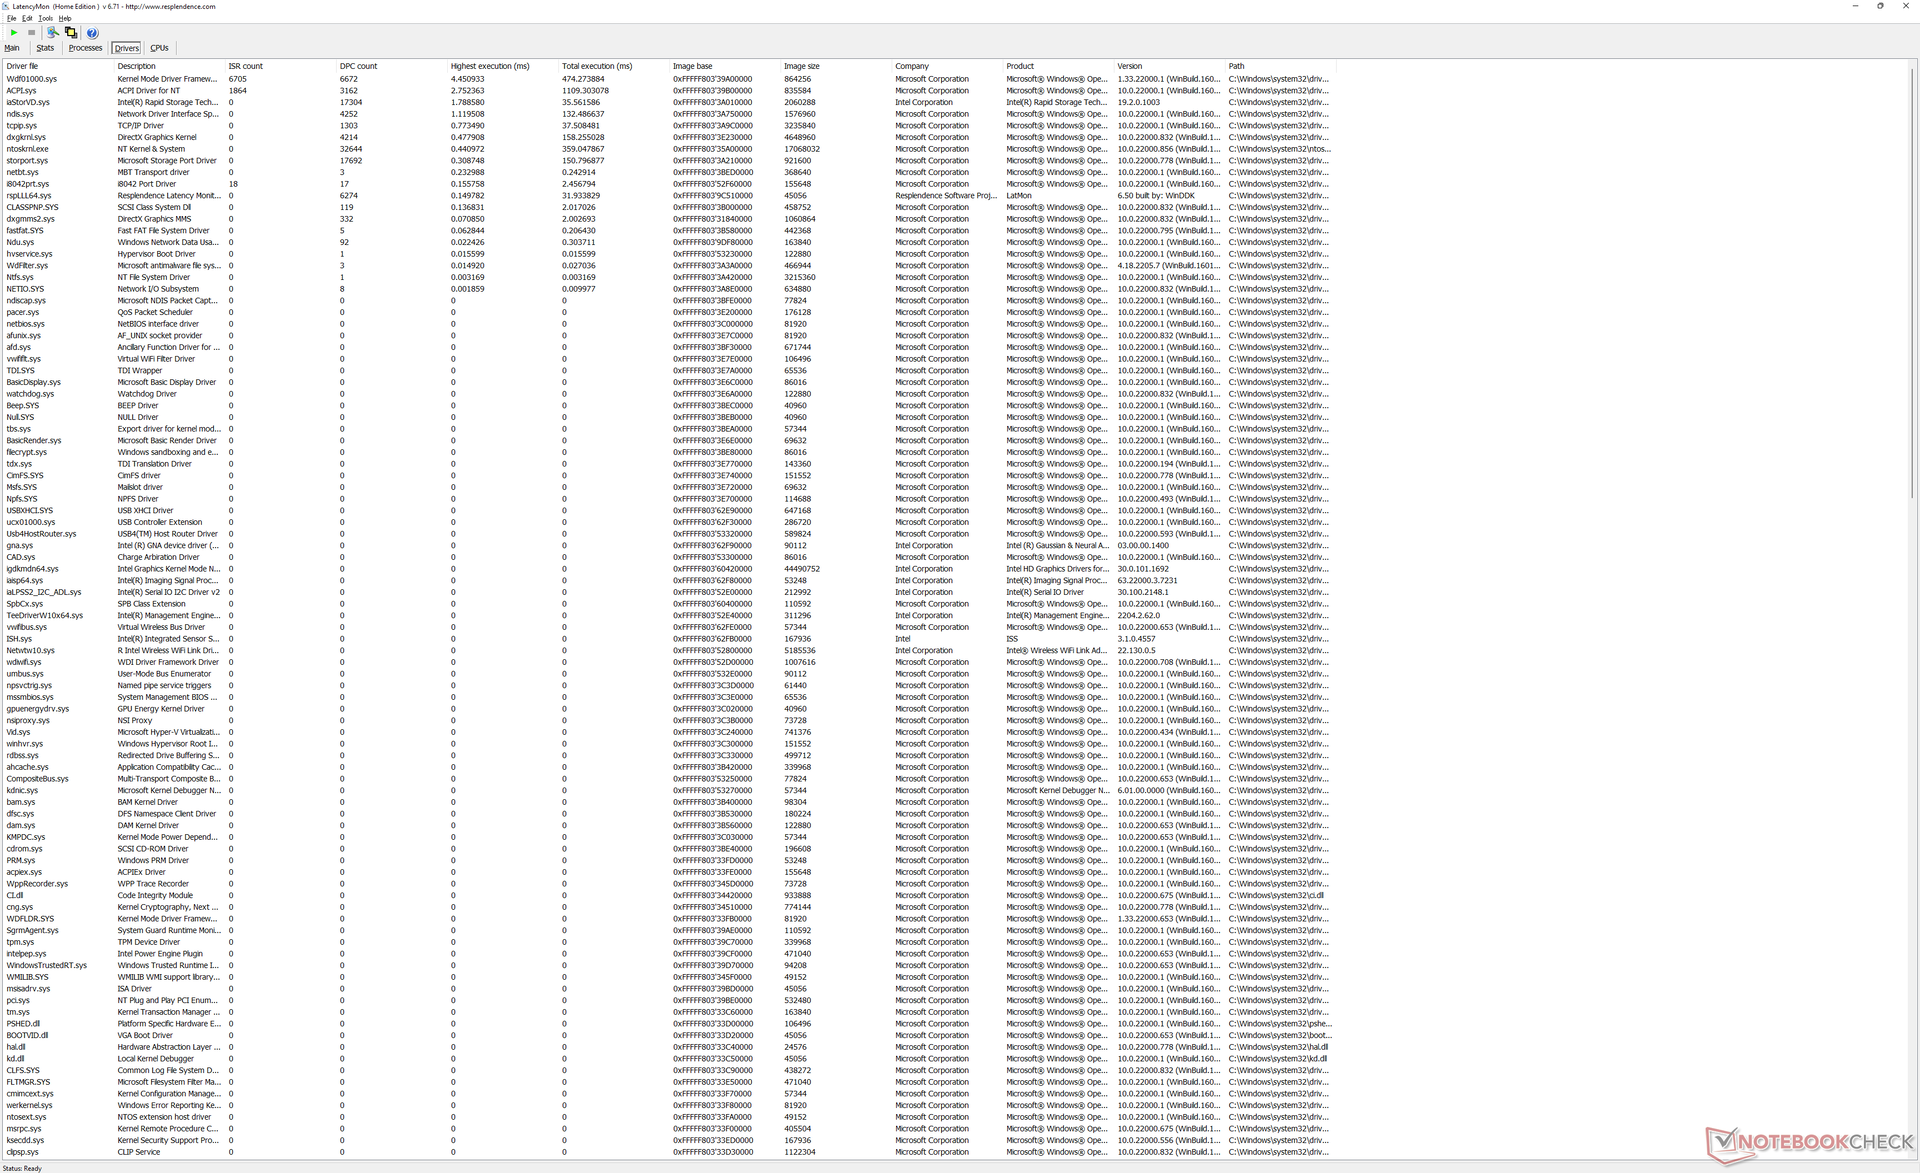
| DPC Latencies / LatencyMon - interrupt to process latency (max), Web, Youtube, Prime95 | |
| Dell XPS 13 9315, i5-1230U | |
| Dell XPS 13 Plus 9320 i5-1240p | |
| Dell XPS 13 9310 OLED | |
| Dell XPS 13 Plus 9320 4K | |
| Dell XPS 13 9310 2-in-1 | |
| Dell XPS 13 Plus 9320 i7-1280P OLED | |
* ... kleinere Werte sind besser
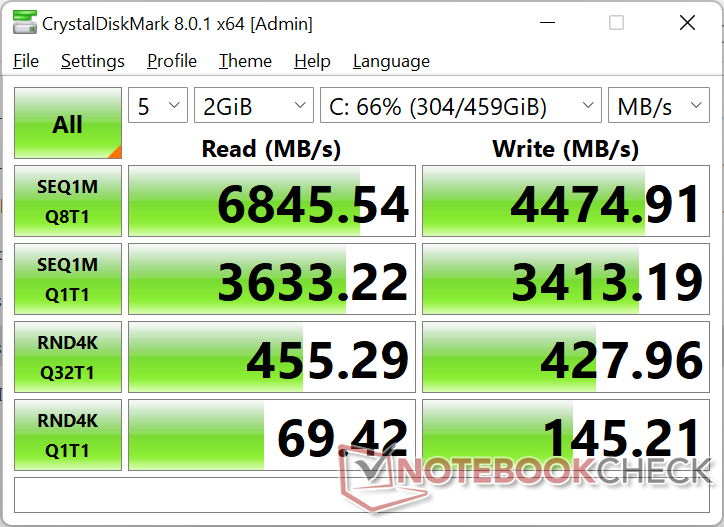
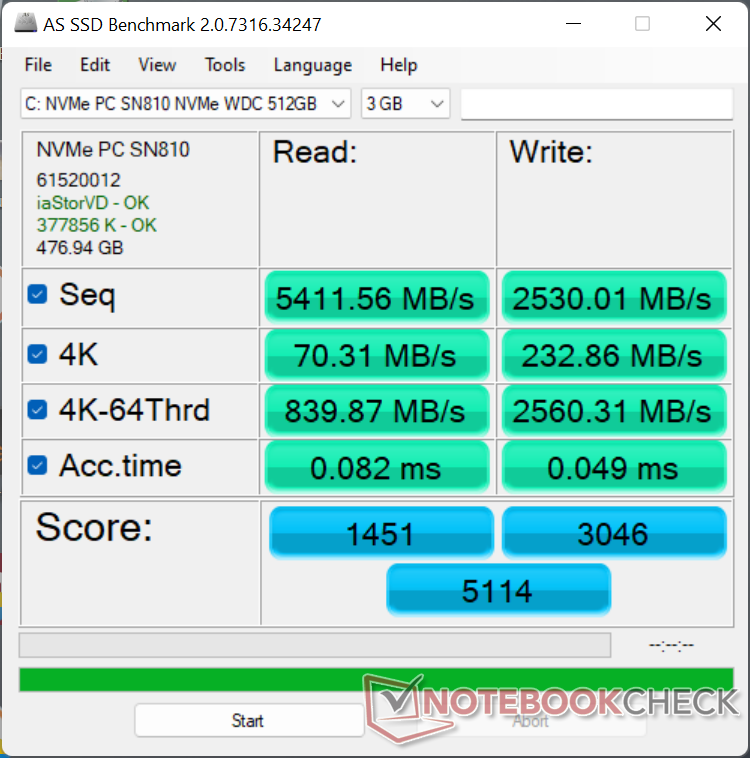
Massenspeicher
Dell scheint für das XPS 13 Plus SSDs von verschiedenen Herstellern zu beziehen. Während unsere zwei vorherigen Testgerät mit der Micron 3400 bzw. der PCIe4-x4-NVMe-SSD PM9A1 ausgestattet waren, befindet sich in unserem heutigen XPS 13 Plus stattdessen eine Western Digital SN810. Mit einer in unserem Diskspd-Schleifentest auf nur 3.000 MB/s gedrosselten Transferrate schneidet das WD-Laufwerk jedoch leider schlechter ab als die Samsung- und Micron-SSDs, wie das Diagramm unten zeigt. Dagegen beobachteten wir beim Samsung- und Micron-Laufwerk im gleichen Stresstest konstante Übertragungsraten.

| Drive Performance Rating - Percent | |
| Dell XPS 13 Plus 9320 i7-1280P OLED | |
| Dell XPS 13 Plus 9320 4K | |
| Dell XPS 13 9310 OLED | |
| Dell XPS 13 Plus 9320 i5-1240p | |
| Dell XPS 13 9315, i5-1230U | |
| Dell XPS 13 9310 2-in-1 | |
* ... kleinere Werte sind besser
Laufwerksdrosseln: DiskSpd-Leseschleife, Warteschlangentiefe 8
Grafikkarte
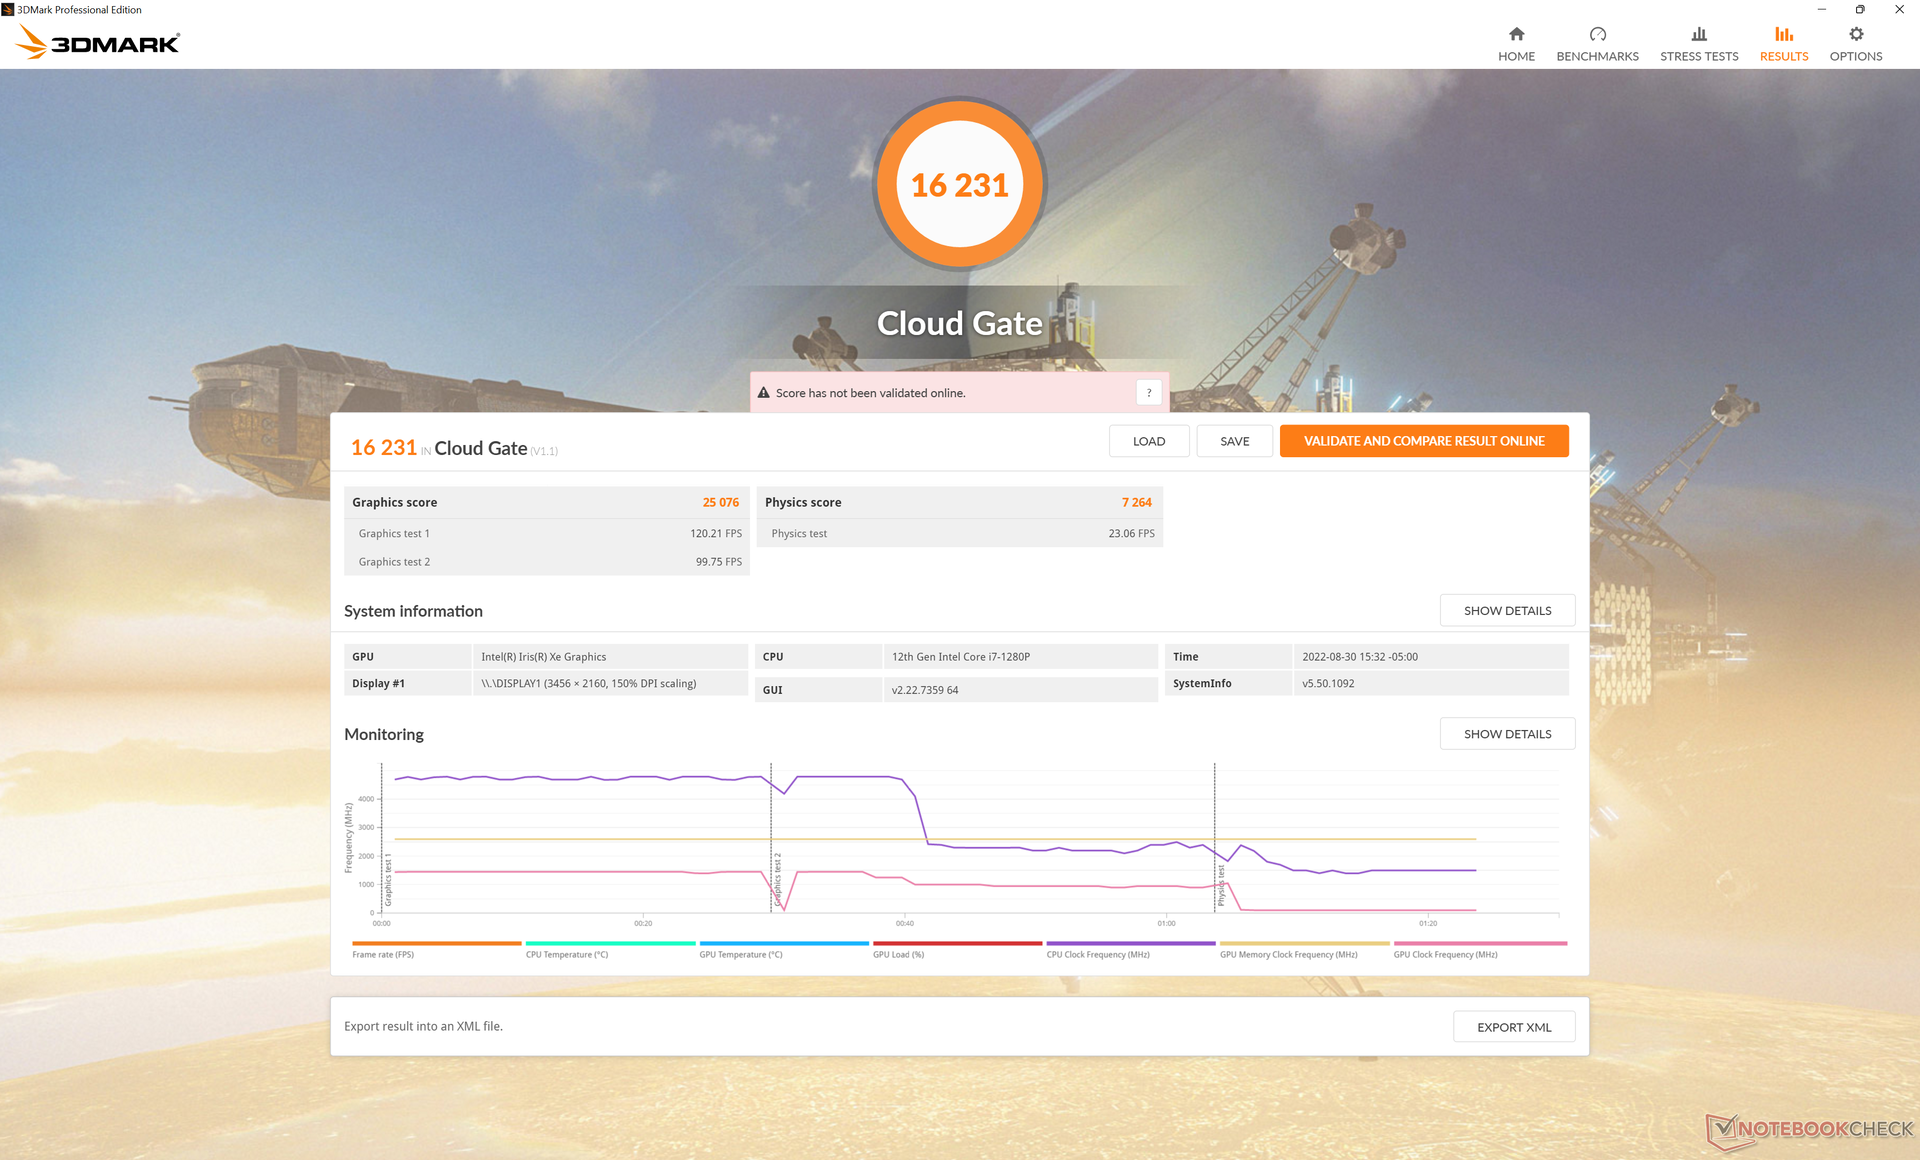
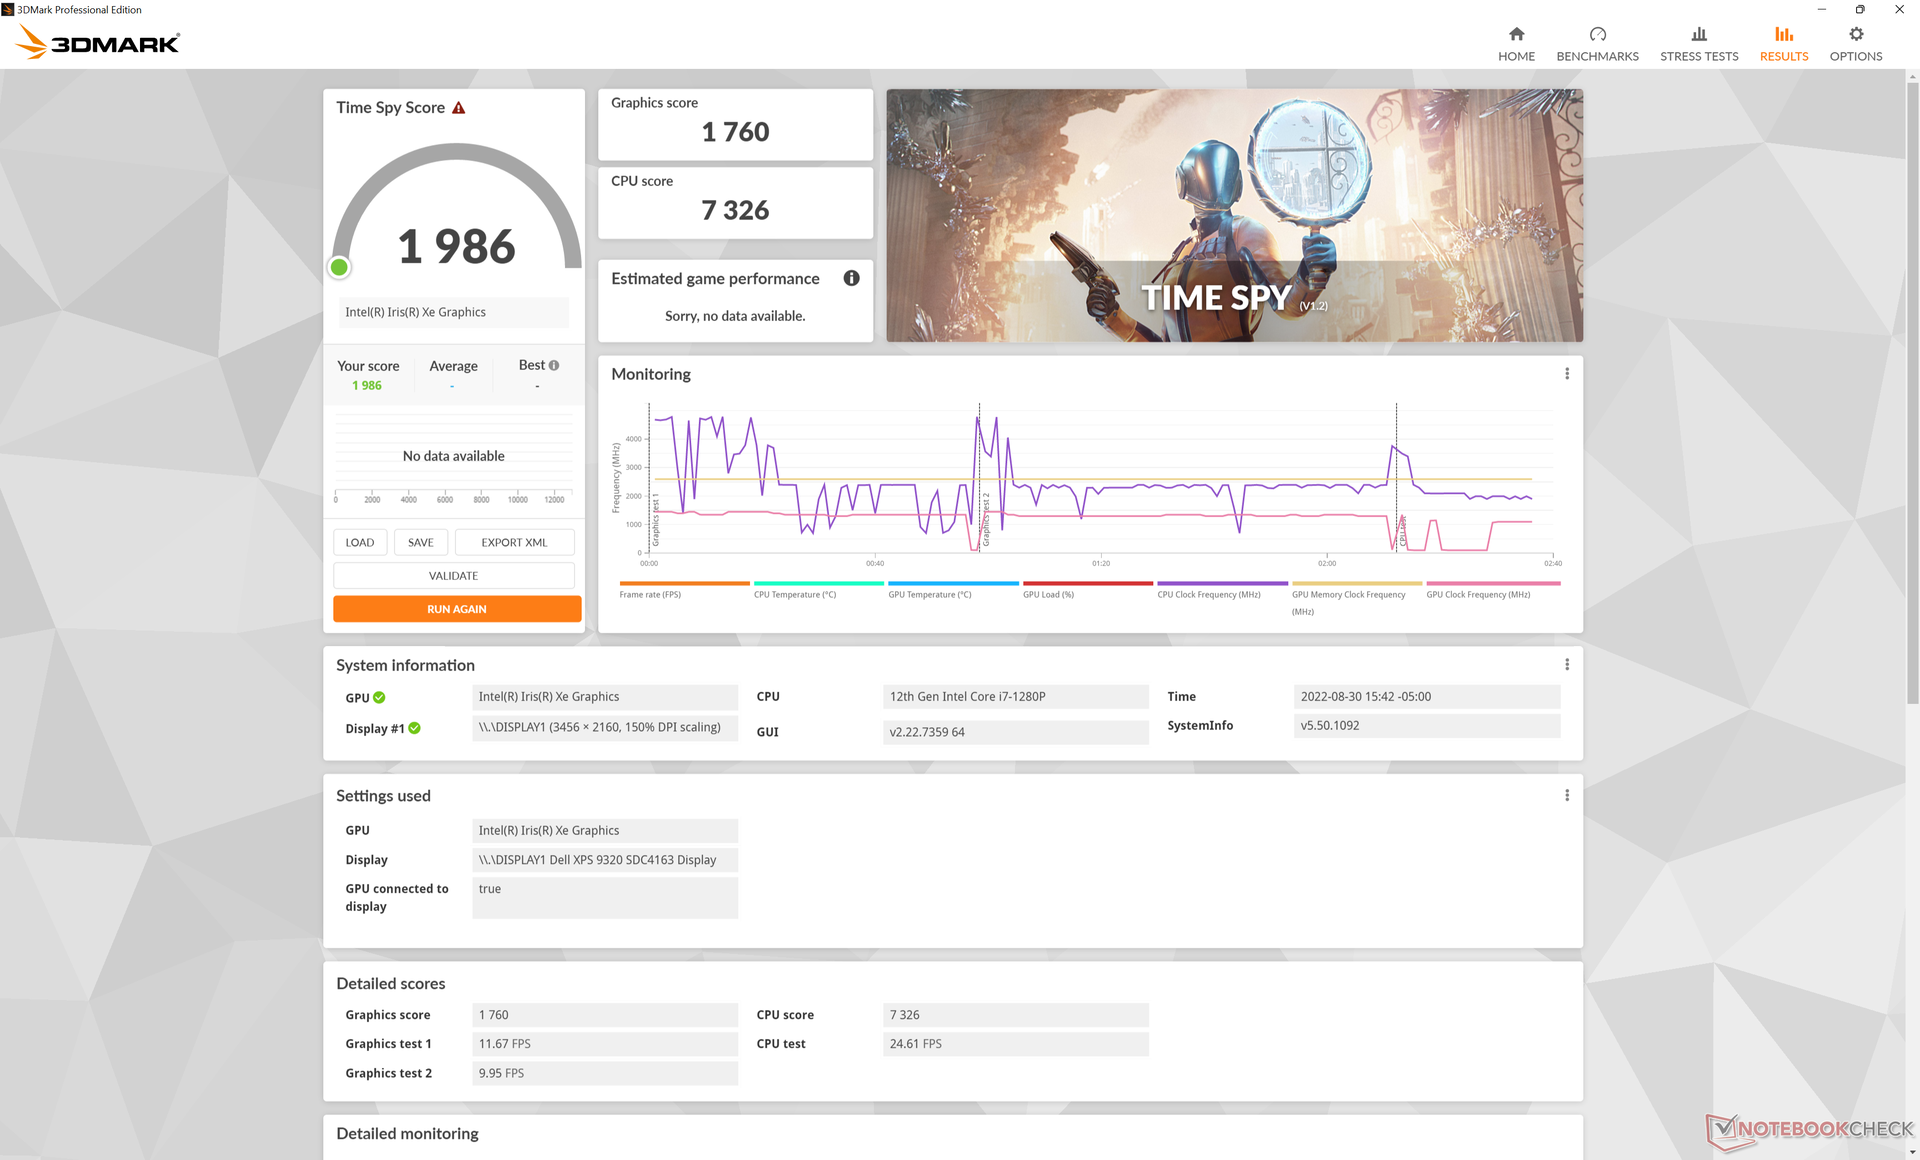
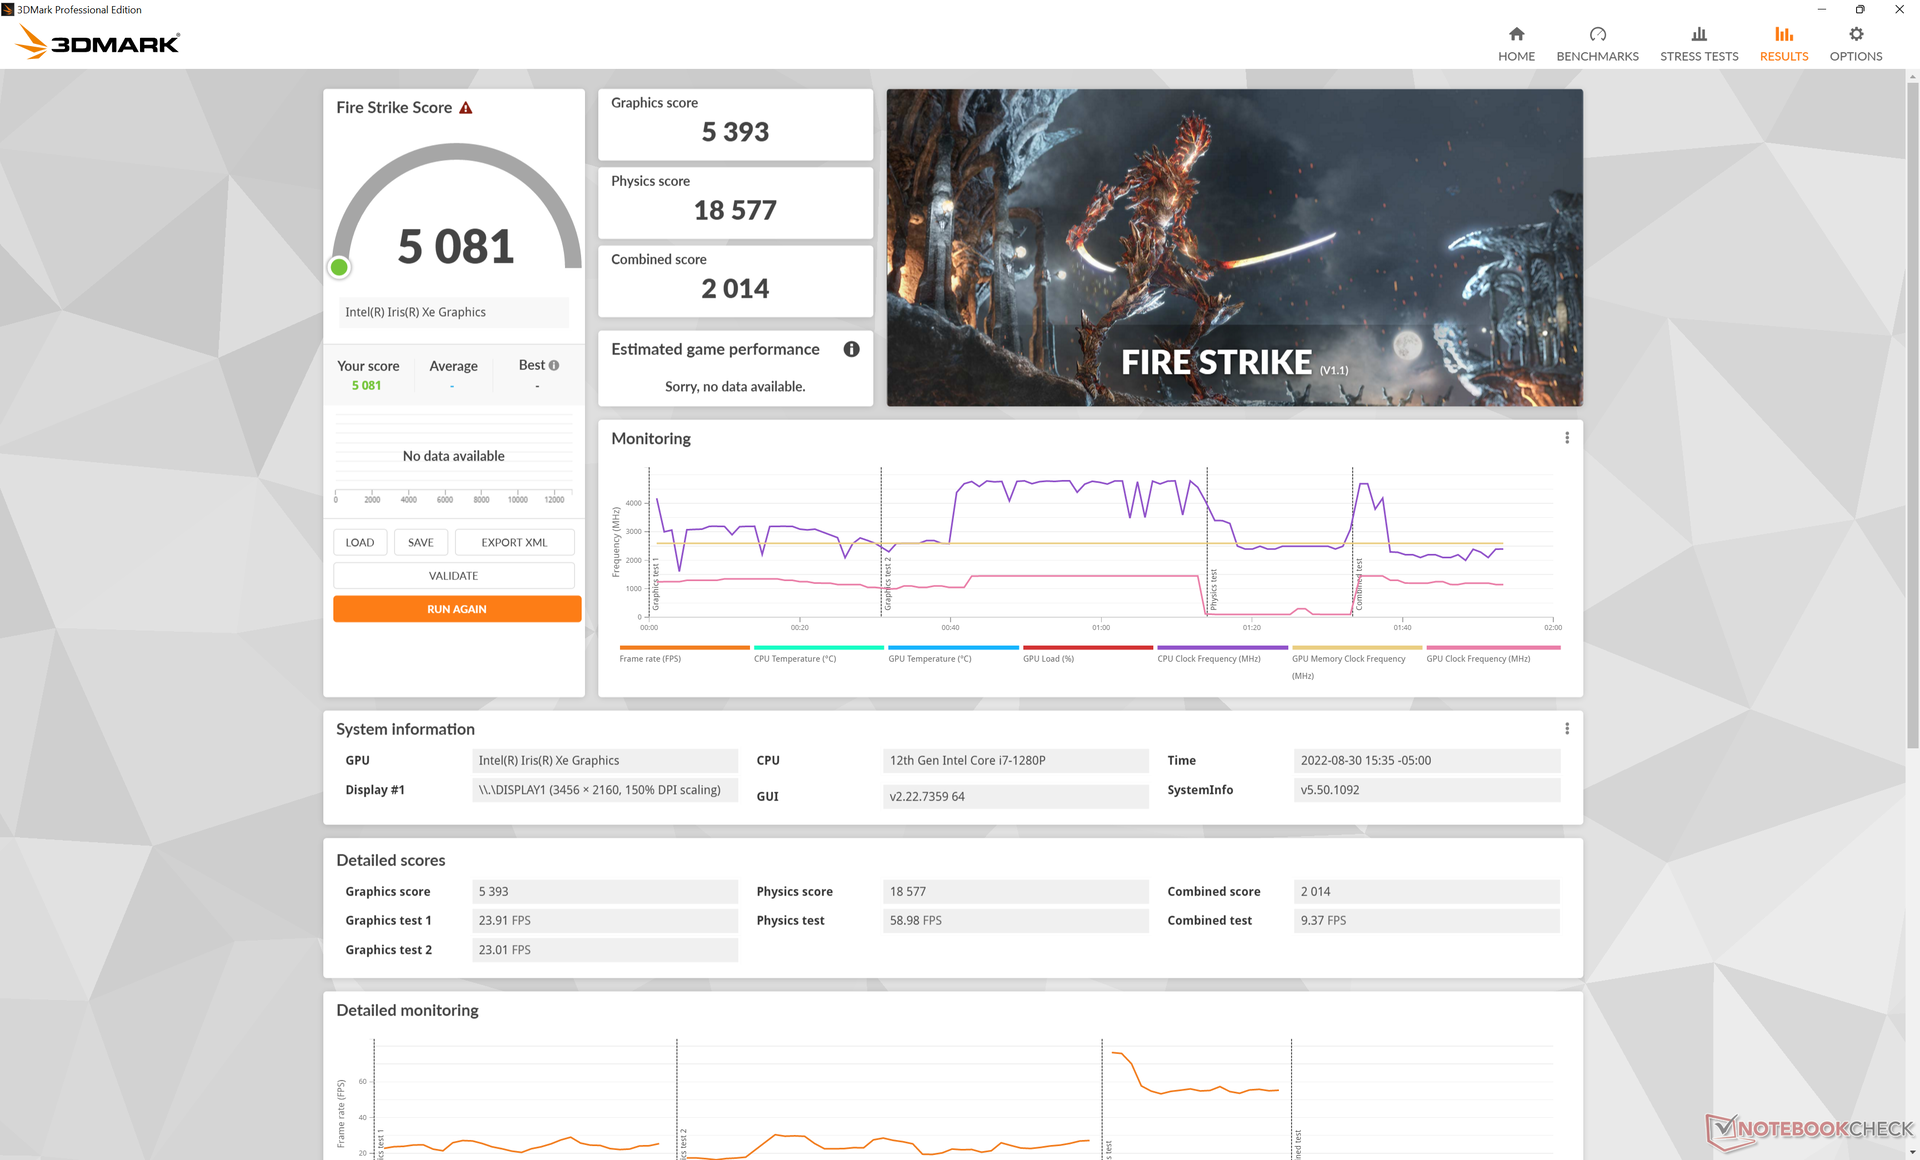
Die Grafikleistung ist mit der des Core-i7-1260P-Modells im Prinzip identisch. Relativ zur Core-i5-1240P-Option mit 8 GB RAM und der Iris Xe 80 EUs ist unsere Iris Xe 96 EUs jedoch um ca. 30 bis 65 % schneller. Wer die maximale Grafikleistung erzielen will, sollte eine Konfiguration mit mindestens 16 GB RAM und einer Core-i7-CPU wählen.
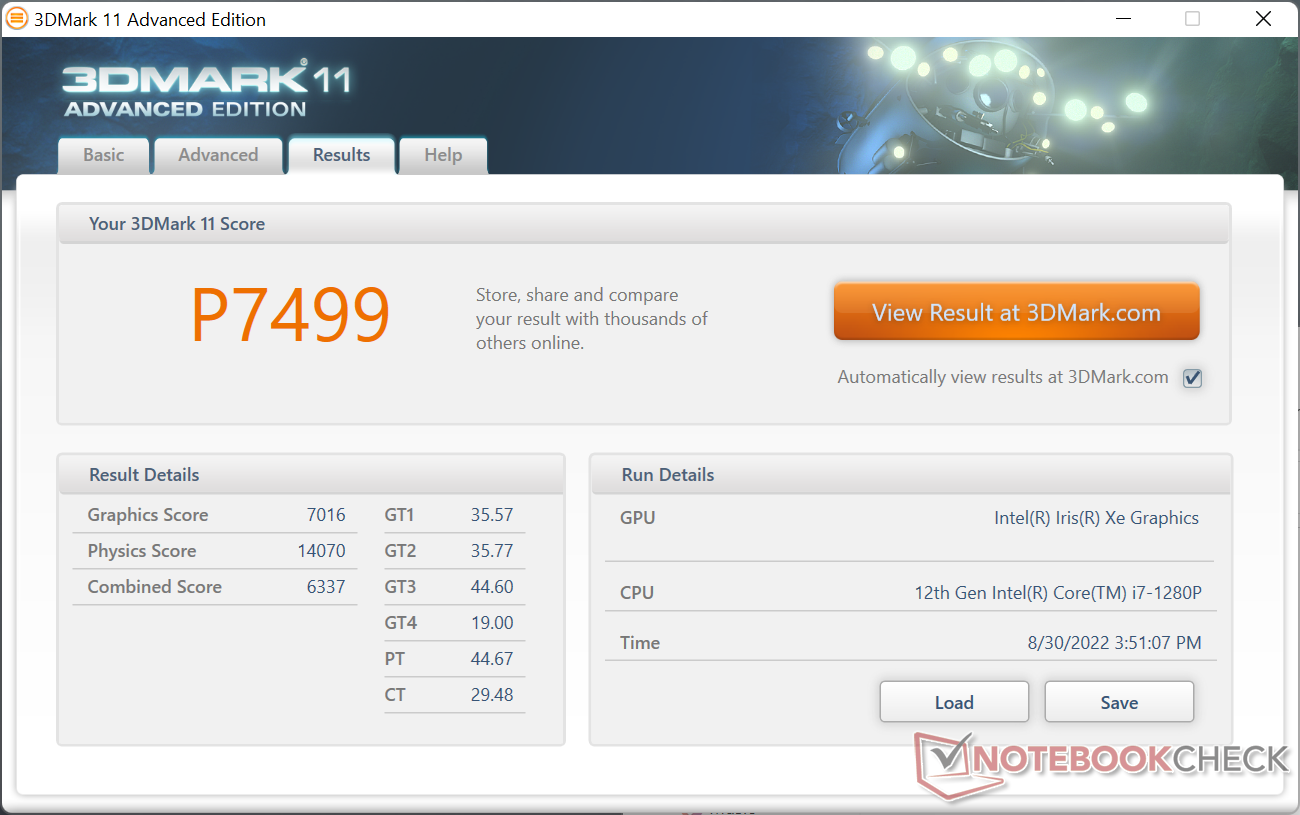
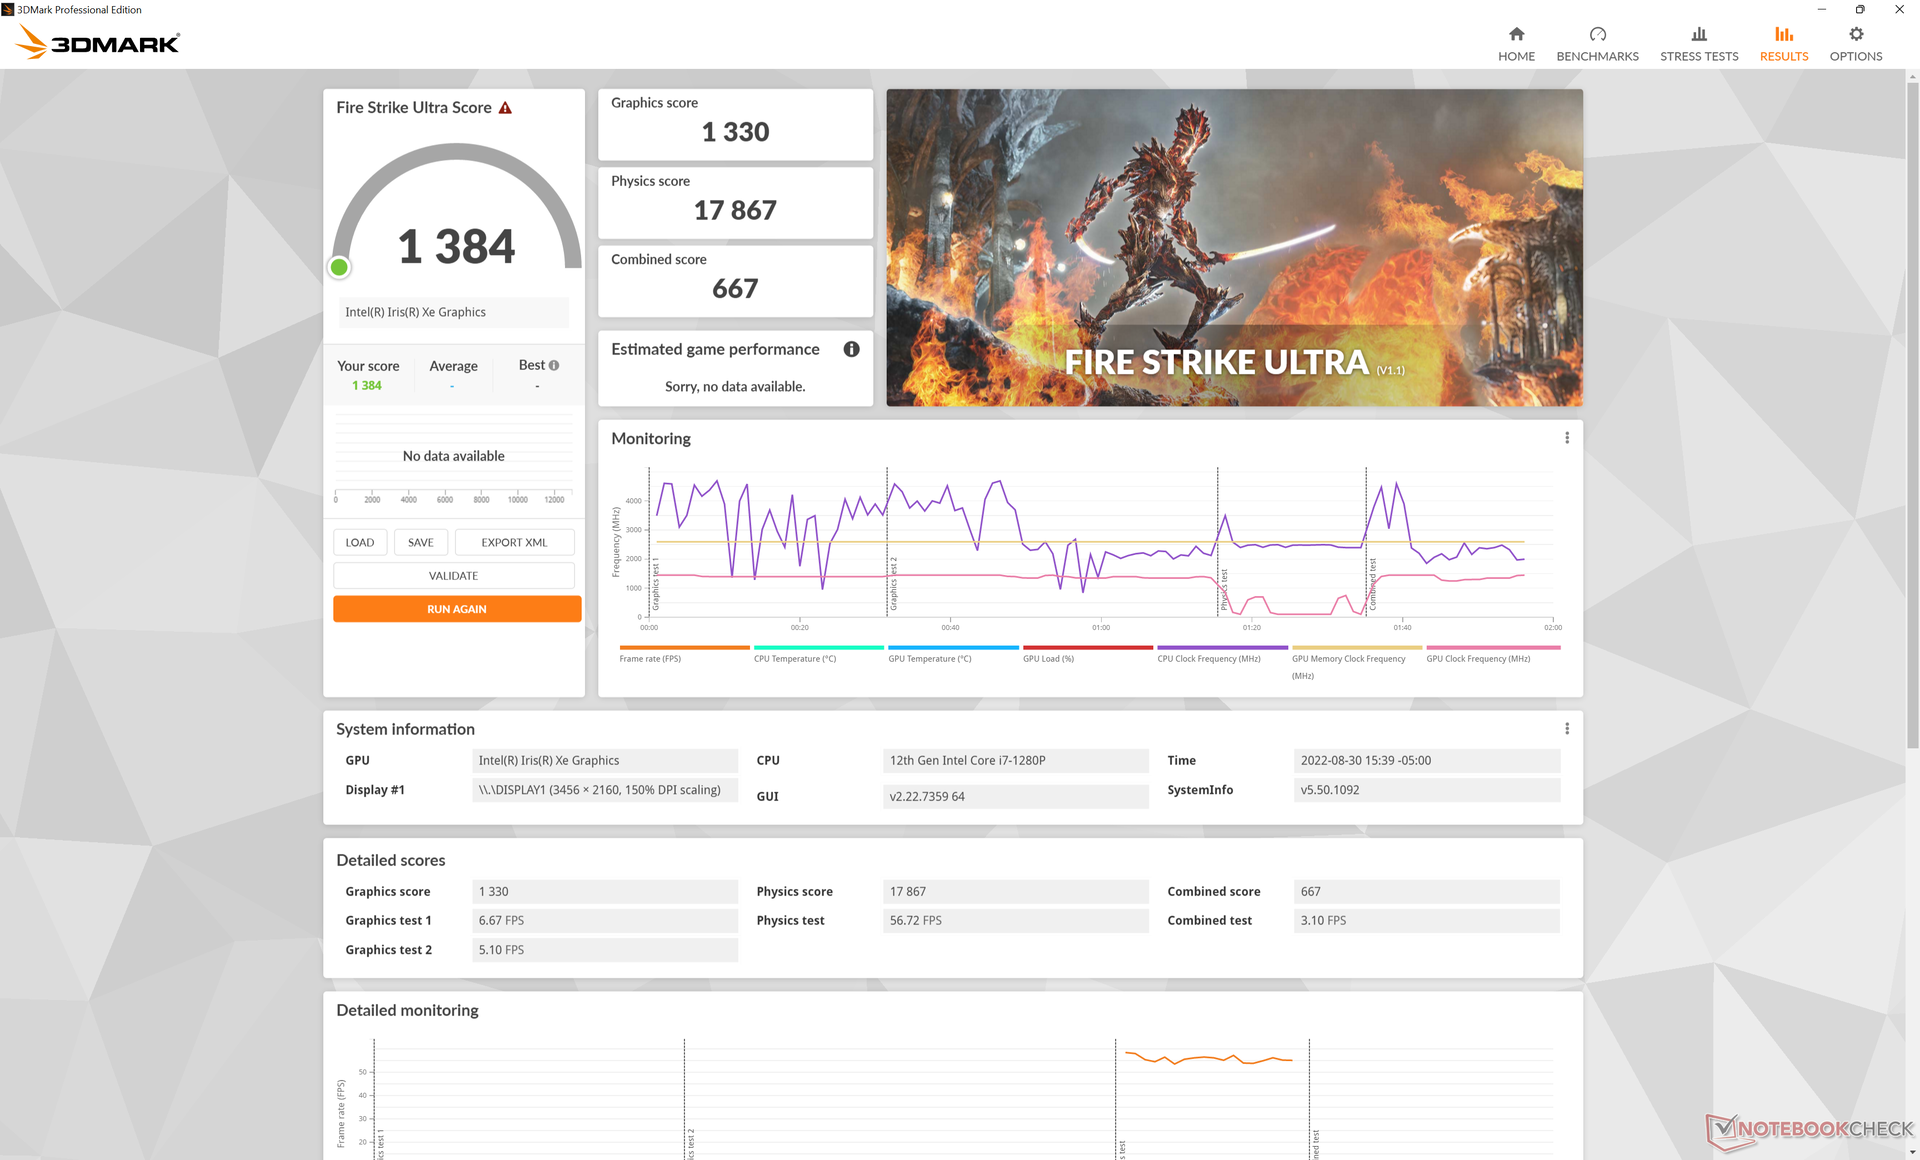
| 3DMark 11 Performance | 7499 Punkte | |
| 3DMark Cloud Gate Standard Score | 16231 Punkte | |
| 3DMark Fire Strike Score | 5081 Punkte | |
| 3DMark Time Spy Score | 1986 Punkte | |
Hilfe | ||
| Cyberpunk 2077 1.6 | |
| 1920x1080 Low Preset | |
| Dell XPS 13 Plus 9320 i7-1280P OLED | |
| Durchschnittliche Intel Iris Xe Graphics G7 96EUs (13 - 25.9, n=42) | |
| 1920x1080 Medium Preset | |
| Dell XPS 13 Plus 9320 i7-1280P OLED | |
| Durchschnittliche Intel Iris Xe Graphics G7 96EUs (10.8 - 21.7, n=37) | |
| 1920x1080 High Preset | |
| Dell XPS 13 Plus 9320 i7-1280P OLED | |
| Durchschnittliche Intel Iris Xe Graphics G7 96EUs (9.8 - 16.9, n=34) | |
| 1920x1080 Ultra Preset | |
| Dell XPS 13 Plus 9320 i7-1280P OLED | |
| Durchschnittliche Intel Iris Xe Graphics G7 96EUs (7.4 - 16.8, n=32) | |
Witcher 3 FPS-Diagramm
| min. | mittel | hoch | max. | |
| GTA V (2015) | 123.7 | 108.7 | 27.6 | 11.5 |
| The Witcher 3 (2015) | 104.8 | 65.7 | 36.9 | 16.4 |
| Dota 2 Reborn (2015) | 110.3 | 86.8 | 68.1 | 58.7 |
| Final Fantasy XV Benchmark (2018) | 46.1 | 25.3 | 17.6 | |
| X-Plane 11.11 (2018) | 55.2 | 40.7 | 37.6 | |
| Strange Brigade (2018) | 100.2 | 45.4 | 36.5 | 29.6 |
| Cyberpunk 2077 1.6 (2022) | 20.9 | 17.9 | 13.9 | 11.2 |
Emissionen
Geräuschemissionen
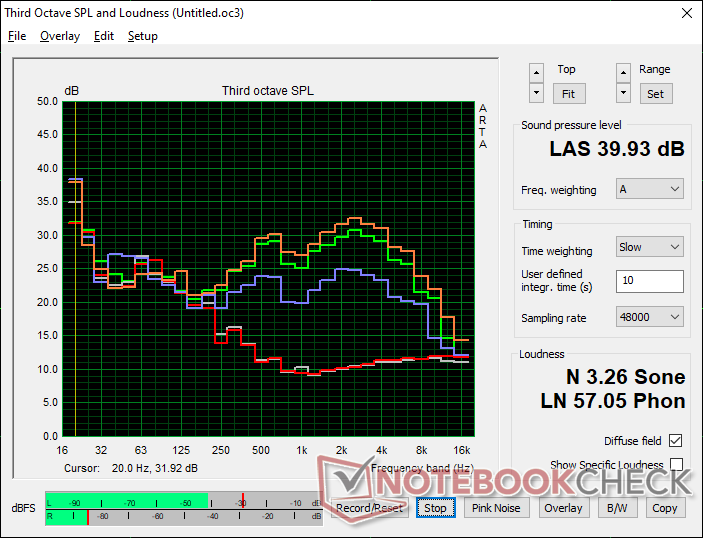
Die beiden internen Lüfter bleiben unter niedriger bis mittlerer Last mit einem Geräuschpegel von 25,4 dB(A) bei einem stillen Hintergrund von 23,4 dB(A) beim Surfen und Videostreaming ausgesprochen leise. Höhere Last wie Spiele zu spielen resultiert in einem Geräuschniveau im 35-bis-42-dB(A)-Bereich. Eigenartigerweise erreichen wir jedoch selbst im Ultrahochleistungsmodus nicht den 45,5-dB(A)-Spitzenwert, die wir beim Core i7-1260P messen konnten. Insgesamt entsprechen die Ergebnisse eher dem älteren XPS 13 9310 2-in-1.
Lautstärkediagramm
| Idle |
| 23.4 / 23.4 / 23.4 dB(A) |
| Last |
| 35 / 39.9 dB(A) |
 | ||
30 dB leise 40 dB(A) deutlich hörbar 50 dB(A) störend |
||
min: | ||
| Dell XPS 13 Plus 9320 i7-1280P OLED Iris Xe G7 96EUs, i7-1280P, WDC PC SN810 512GB | Dell XPS 13 Plus 9320 i5-1240p Iris Xe G7 80EUs, i5-1240P, Micron 3400 MTFDKBA512TFH 512GB | Dell XPS 13 9315, i5-1230U Iris Xe G7 80EUs, i5-1230U, Micron 3460 256 GB Soldered | Dell XPS 13 Plus 9320 4K Iris Xe G7 96EUs, i7-1260P, Samsung PM9A1 MZVL21T0HCLR | Dell XPS 13 9310 2-in-1 Iris Xe G7 96EUs, i7-1165G7, Toshiba BG4 KBG40ZPZ512G | Dell XPS 13 9310 OLED Iris Xe G7 96EUs, i7-1185G7, Toshiba XG6 KXG60ZNV512G | |
|---|---|---|---|---|---|---|
| Geräuschentwicklung | -13% | -8% | -8% | -4% | 4% | |
| aus / Umgebung * | 23.4 | 26 -11% | 26 -11% | 24.4 -4% | 24.3 -4% | 24.8 -6% |
| Idle min * | 23.4 | 26.2 -12% | 26 -11% | 24.4 -4% | 24.8 -6% | 25 -7% |
| Idle avg * | 23.4 | 26.2 -12% | 26 -11% | 24.4 -4% | 24.8 -6% | 25 -7% |
| Idle max * | 23.4 | 26.2 -12% | 27.5 -18% | 25.5 -9% | 24.8 -6% | 25 -7% |
| Last avg * | 35 | 38.4 -10% | 39.5 -13% | 40.4 -15% | 38 -9% | 25.3 28% |
| Witcher 3 ultra * | 41.6 | 39.6 5% | 45.5 -9% | 38 9% | 35.8 14% | |
| Last max * | 39.9 | 47.1 -18% | 39.6 1% | 45.5 -14% | 41.5 -4% | 35.8 10% |
* ... kleinere Werte sind besser
Stresstest
Nach dem Initialisieren von Prime95 steigen die CPU-Taktfrequenz, -Temperatur und der Gesamtverbrauch (Board Power Draw) auf 2,9 GHz, 100 °C bzw. 64 W und verharren fast 3 Minuten lang auf diesem Niveau. Darauf fallen die Werte und stabilisieren sich bei 1,5 GHz, 85 °C und 28 W, wie die Screenshots unten zeigen. Diese Ergebnisse decken sich mit unseren Beobachtungen im Cinebench-R15-xT-Stresstest, in dem die ursprüngliche Höchstpunktzahl aufgrund des eingeschränkten Turbo-Boost-Potenzials des Laptops nicht dauerhaft aufrechterhalten werden konnte. Interessant ist, dass das stabile TDP-Ziel mit 28 W hier niedriger ist als beim i7-1260P-Modells (34 W), was auch die etwas besseren Cinebench-R15-xT-Ergebnisse des i7-1260P-Testgeräts erklärt.
Während dem Spielen von The Witcher 3, um ein anspruchsvolles, grafiklastiges Szenario zu repräsentieren, stabilisieren sich die GPU-Taktfrequenz und die GPU-Temperatur bei 1.147 MHz bzw. 81 °C.
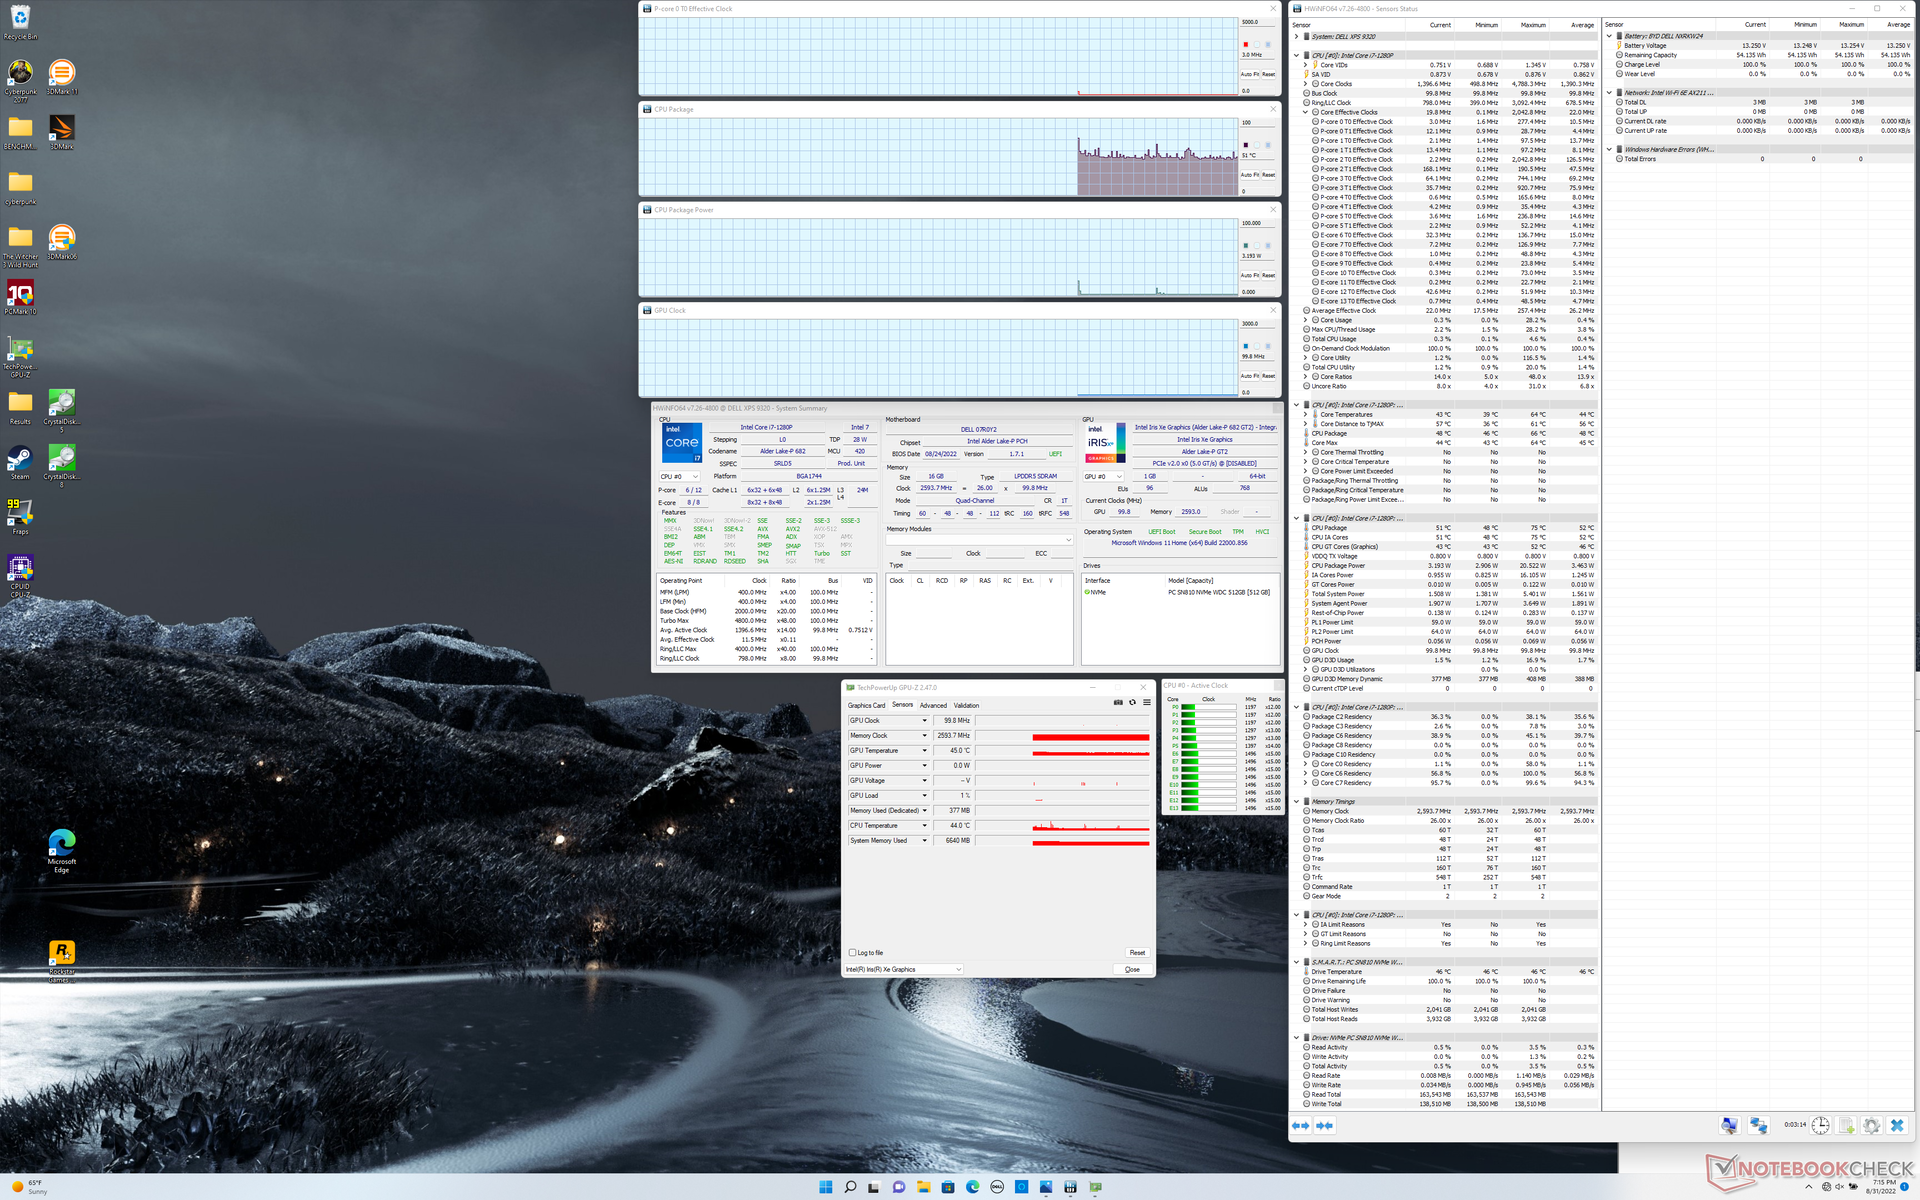
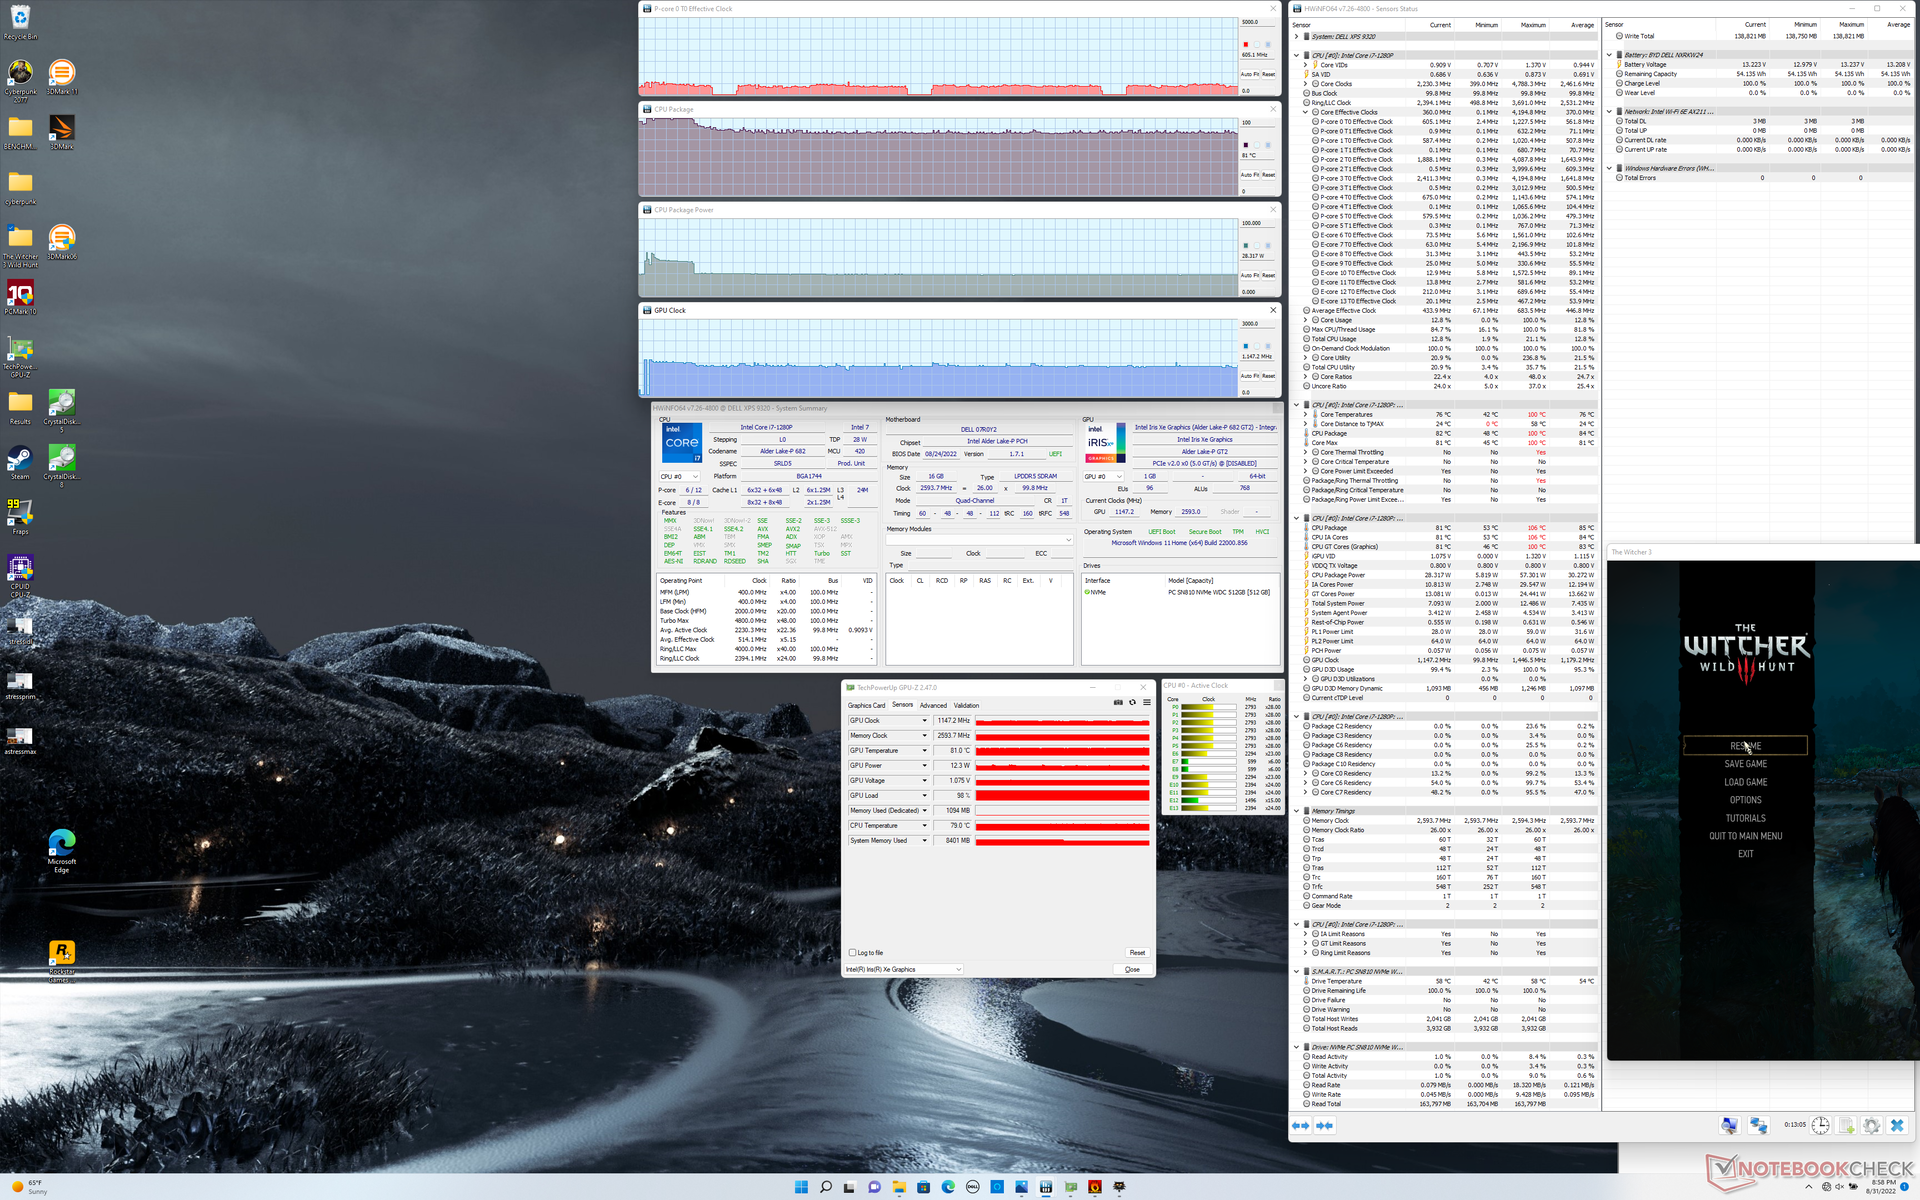
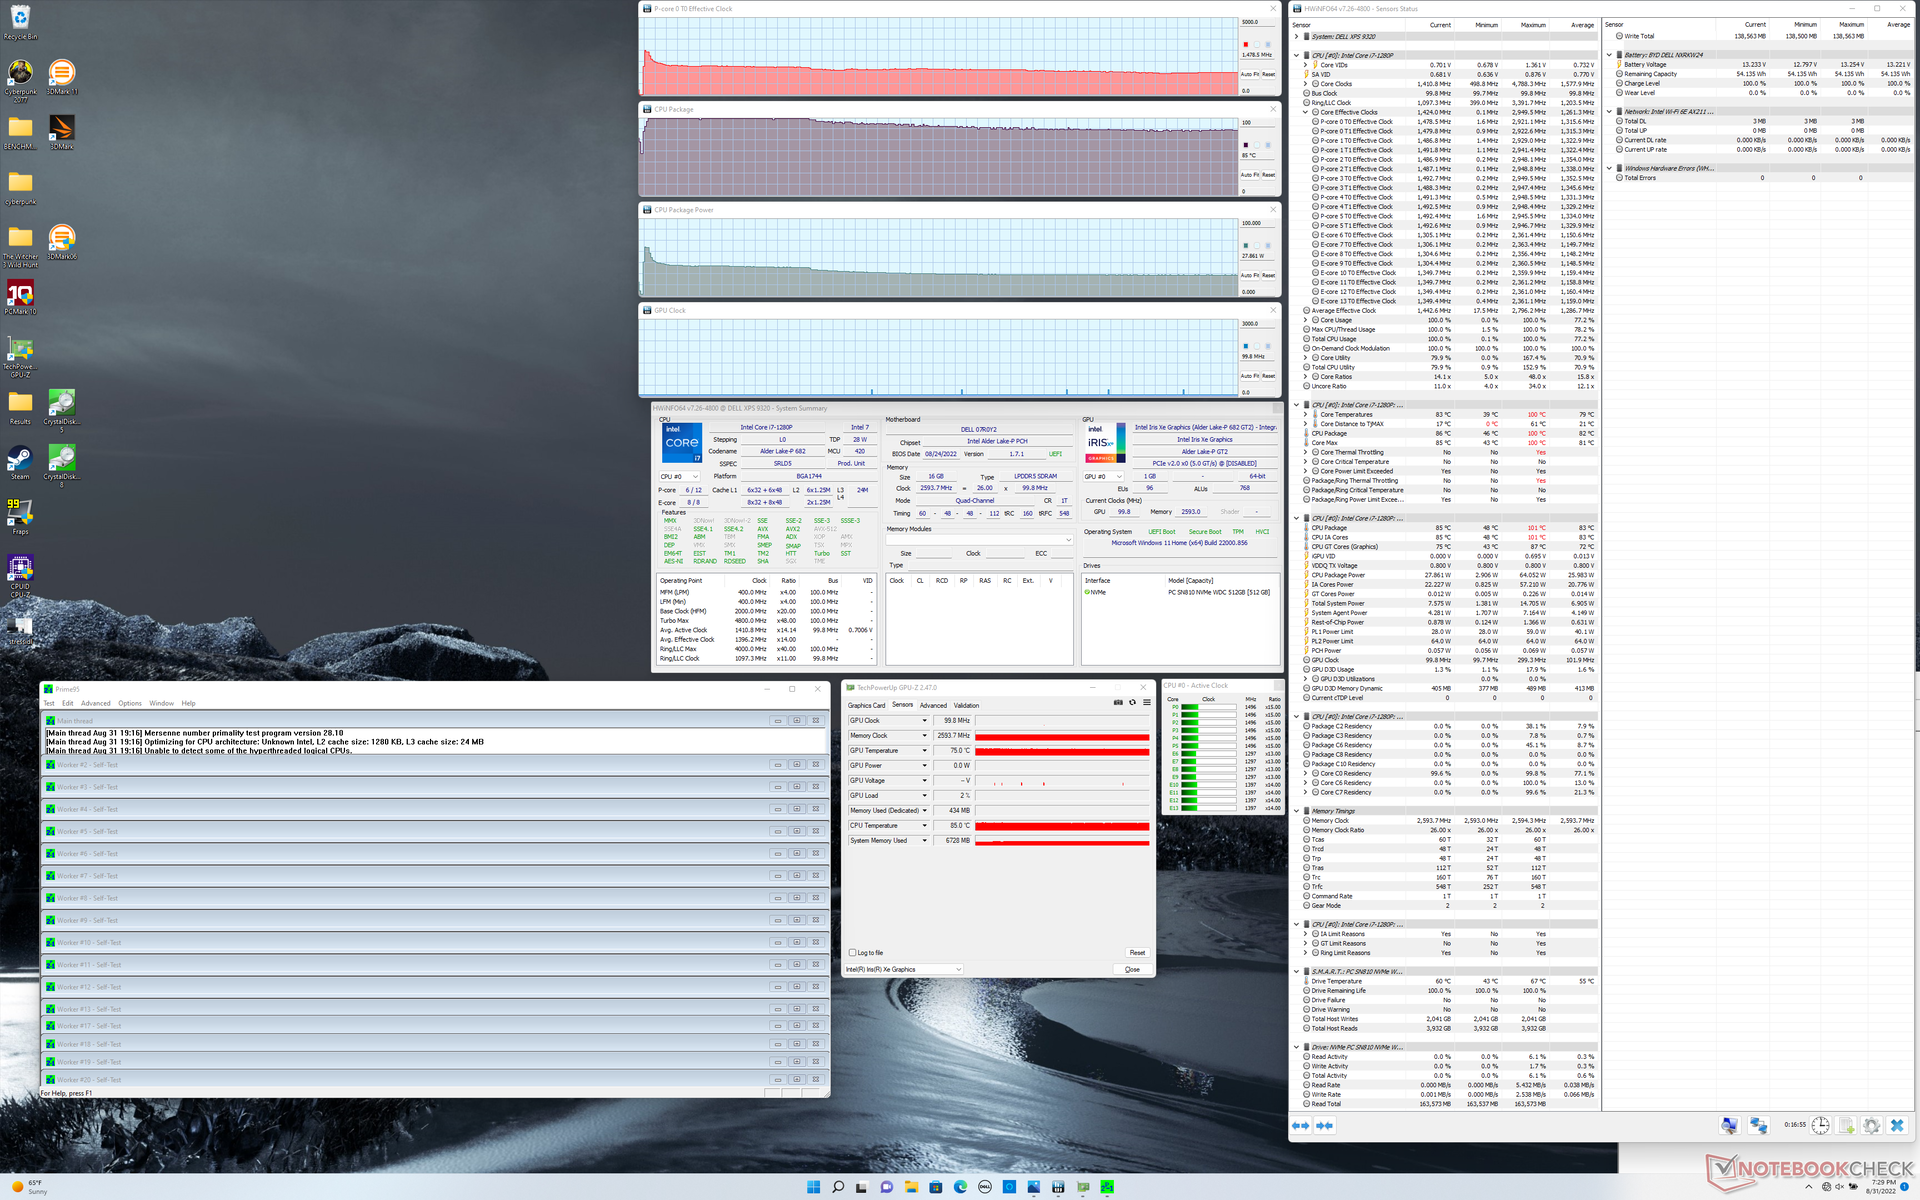

| CPU-Takt (GHz) | GPU-Takt (MHz) | Durchschnittliche CPU-Temperatur (°C) | |
| Leerlauf | -- | -- | 51 |
| Prime95-Stress | 1,5 | -- | 85 |
| Prime95-+FurMark-Stress | 1,2 | 549 | 85 |
| Witcher-3-Stress | ~0,6 | 1.147 | 81 |
Energieverwaltung
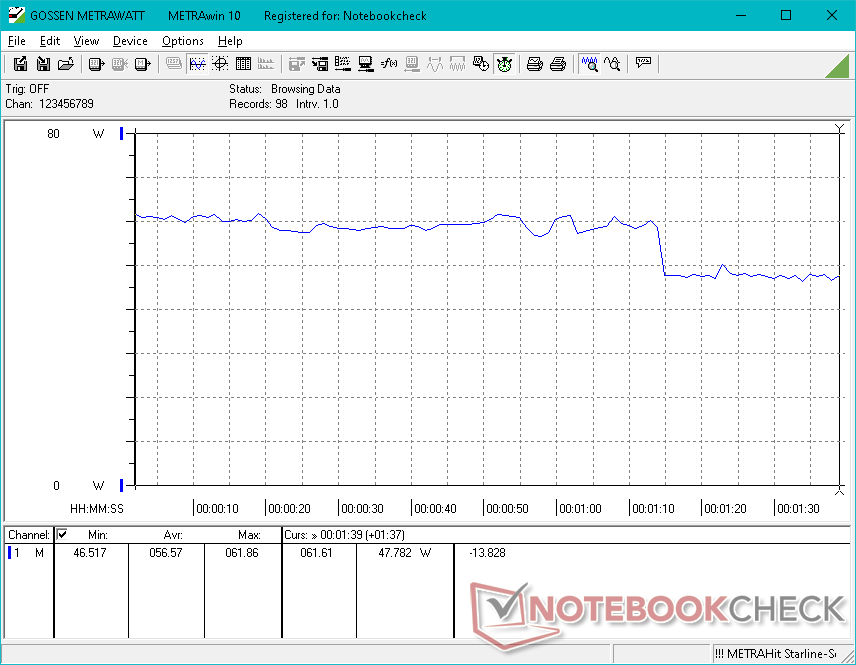
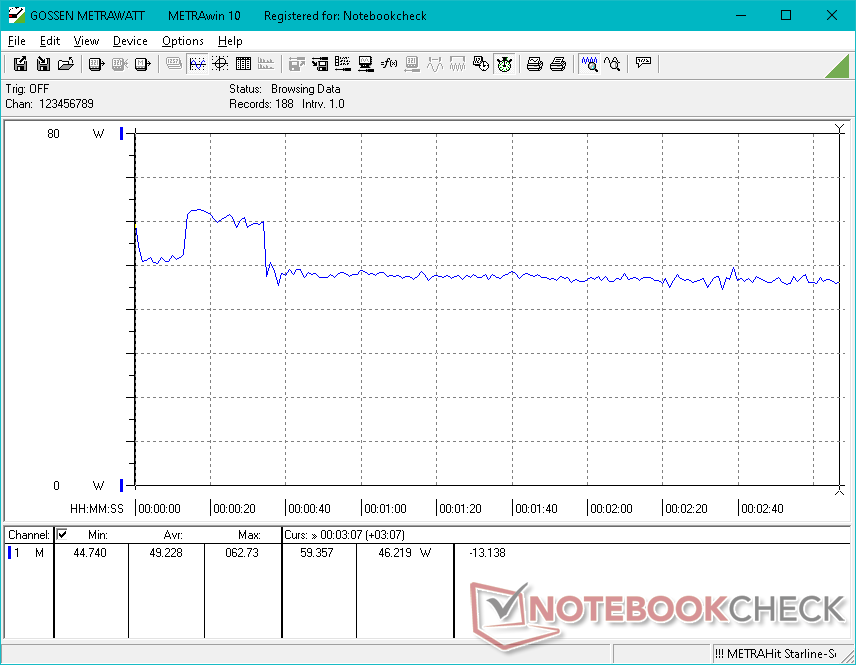
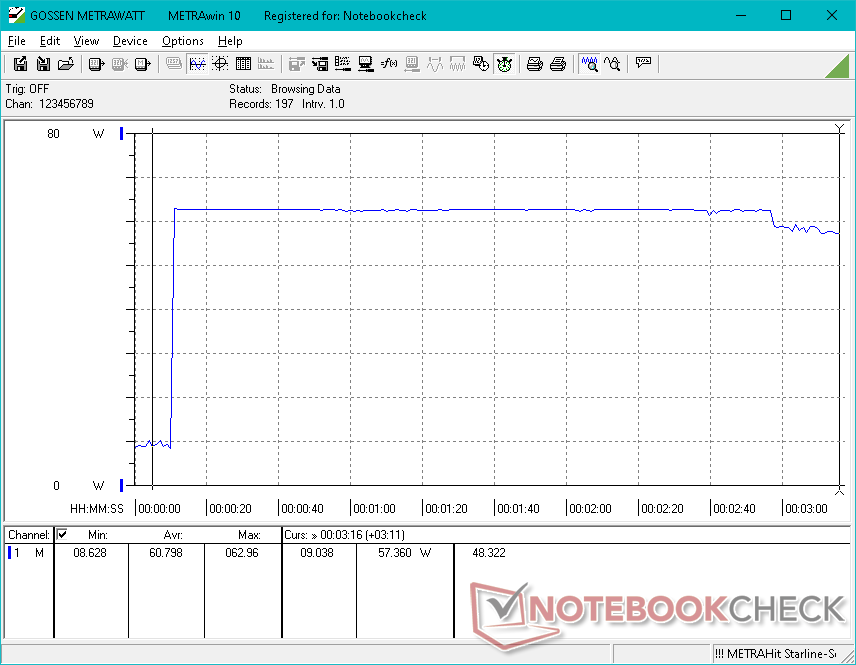
Energieaufnahme
Die Energieaufnahme liegt zwischen 6 W beim Darstellen eines vollständig schwarzen Bildes und 13 W beim Darstellen eines vollständig weißen Bildes auf der maximalen Helligkeitsstufe. Dagegen liegt die Verbrauchsdifferenz zwischen der minimalen und maximalen Helligkeitsstufe der XPS-13-Plus-Modelle mit einem IPS-Panel nur bei 2-4 W. Unsere früheren Beobachtungen zum Zusammenhang zwischen dem Verbrauch und dem Einsatz von OLED-Panels treffen auch auf diese XPS-13-Plus-Konfigurationen zu. Zusammengefasst sind IPS-Displays in den meisten Szenarien energiesparender, vor allem, da die meisten Webseiten, Tabellen und Texteditoren einen weißen Hintergrund nutzen.
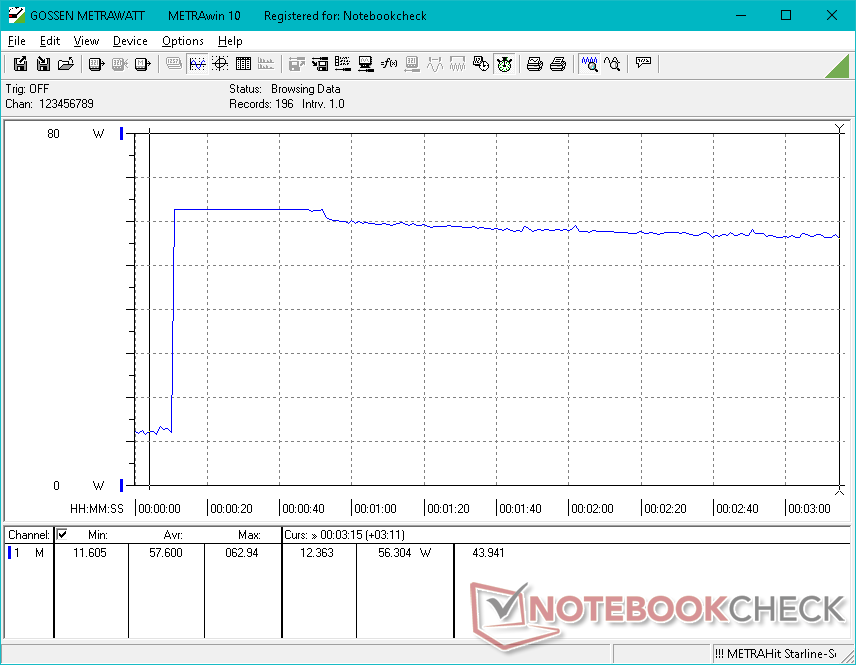
Unter höherer Last wie zum Beispiel im Gaming-Betrieb ist der Verbrauch um ca. 15-55 % höher als bei der 8-GB-Core-i5-1240P-Konfiguration, was sich mit der höheren Grafikleistung unserer 16-GB-i7-1280P-Konfiguration in etwa deckt. Abgesehen von den ersten paar Minuten in CPU-lastigen Szenarien wie zum Beispiel in Prime95 sind die Ergebnisse denen der Core-i7-1260P-Konfiguration sehr ähnlich, wie das Diagramm unten zeigt.
| Aus / Standby | |
| Idle | |
| Last |
|
Legende:
min: Derzeit nutzen wir das Metrahit Energy, ein professionelles TRMS Leistungs-Multimeter und PQ Analysator, für unsere Messungen. Mehr Details zu dem Messgerät finden Sie hier. Alle unsere Testmethoden beschreiben wir in diesem Artikel. | |
| Dell XPS 13 Plus 9320 i7-1280P OLED i7-1280P, Iris Xe G7 96EUs, WDC PC SN810 512GB, OLED, 3456x2160, 13.40 | Dell XPS 13 Plus 9320 i5-1240p i5-1240P, Iris Xe G7 80EUs, Micron 3400 MTFDKBA512TFH 512GB, IPS, 1920x1200, 13.40 | Dell XPS 13 9315, i5-1230U i5-1230U, Iris Xe G7 80EUs, Micron 3460 256 GB Soldered, IPS, 1920x1200, 13.40 | Dell XPS 13 Plus 9320 4K i7-1260P, Iris Xe G7 96EUs, Samsung PM9A1 MZVL21T0HCLR, IPS, 3840x2400, 13.40 | Dell XPS 13 9310 2-in-1 i7-1165G7, Iris Xe G7 96EUs, Toshiba BG4 KBG40ZPZ512G, IPS, 1920x1200, 13.40 | Dell XPS 13 9310 OLED i7-1185G7, Iris Xe G7 96EUs, Toshiba XG6 KXG60ZNV512G, OLED, 3456x2160, 13.40 | |
|---|---|---|---|---|---|---|
| Stromverbrauch | -16% | 40% | -7% | 38% | 19% | |
| Idle min * | 6.5 | 10 -54% | 3.6 45% | 7 -8% | 2.6 60% | 5.7 12% |
| Idle avg * | 7.8 | 12.3 -58% | 6.8 13% | 11 -41% | 6.4 18% | 6 23% |
| Idle max * | 13 | 15.5 -19% | 6.8 48% | 11.4 12% | 7.7 41% | 12.3 5% |
| Last avg * | 56.6 | 43 24% | 24 58% | 59.7 -5% | 29.9 47% | 44.4 22% |
| Witcher 3 ultra * | 49.2 | 43.1 12% | 23.6 52% | 49.4 -0% | 32.2 35% | 36.5 26% |
| Last max * | 63 | 62.8 -0% | 47 25% | 63 -0% | 47.5 25% | 47.8 24% |
* ... kleinere Werte sind besser
Verbrauch Witcher 3 / Stresstest
Verbrauch externer Monitor
Akkulaufzeit
Mit nur 5,5 Stunden praxisnaher WLAN-Laufzeit im ausbalancierten Modus sind die Laufzeiten kürzer als bei jeder anderen Konfiguration des XPS 13 Plus, was hauptsächlich auf das OLED-Panel zurückzuführen ist. Die IPS-Modelle halten ungefähr 1 bis 2 Stunden länger durch.
| Dell XPS 13 Plus 9320 i7-1280P OLED i7-1280P, Iris Xe G7 96EUs, 55 Wh | Dell XPS 13 Plus 9320 i5-1240p i5-1240P, Iris Xe G7 80EUs, 55 Wh | Dell XPS 13 9315, i5-1230U i5-1230U, Iris Xe G7 80EUs, 51 Wh | Dell XPS 13 Plus 9320 4K i7-1260P, Iris Xe G7 96EUs, 55 Wh | Dell XPS 13 9310 2-in-1 i7-1165G7, Iris Xe G7 96EUs, 51 Wh | Dell XPS 13 9310 OLED i7-1185G7, Iris Xe G7 96EUs, 52 Wh | |
|---|---|---|---|---|---|---|
| Akkulaufzeit | 39% | 157% | 20% | 86% | 13% | |
| WLAN | 346 | 480 39% | 888 157% | 414 20% | 643 86% | 391 13% |
| Last | 96 | 157 | 76 | 205 | ||
| H.264 | 657 | |||||
| Idle | 1525 |
Pro
Contra
Fazit — Schneller, aber nicht unbedingt besser
Die Top-Konfiguration mit dem Core i7-1280P und dem OLED-Display richtet sich an eine ganz bestimmte Zielgruppe. Wer P3-Farben und eine sehr hohe Multitasking-Leistung in mehreren, simultan ausgeführten Anwendungen benötigt, kann aus dem höheren, temporären Turbo Boost der CPU und dem OLED-Panel gegenüber der günstigeren Core-i7-1260P- und IPS-Optionen möglicherweise einen echten Mehrwert ziehen. Für die übrigen Nutzer sind die Vorteile die mit ihnen einhergehenden Nachteile jedoch möglicherweise nicht wert. Das OLED-Panel flackert im Gegensatz zu den IPS-Panels, ist weniger hell und führt zu einer niedrigeren Akkulaufzeit. Außerdem ist die i7-1280P-CPU nach der ursprünglichen Turbo-Boost-Leistungsspitze nicht unbedingt schneller als der i7-1260P.
Wir waren außerdem überrascht davon, dass die WD-SN810-SSD in unserem Testgerät unter Last drosseln musste. Wer Modelle mit der Micron 3400 oder einer Samsung PM9A1 findet, kann hier möglicherweise mit einem konstanteren Leistungsniveau rechnen.
Für die meisten Nutzer bietet das Modell mit dem Core i7-1260P und dem IPS-Display ein besseres Preis-Leistungs-Verhältnis als die i7-1280P-Konfiguration mit dem OLED-Panel. Trotz des niedrigeren Preises darf man sich bei Ersterem nämlich über eine längere Akkulaufzeit und ein helleres Display freuen.
In Bezug auf die Leistung der integrierten GPU sind die Unterschiede zwischen dem i7-1260P- und dem i7-1280P-Modell sind geringer als beim i5-1240P- und dem i7-1260P-Modell. Wir empfehlen unabhängig von der CPU-Option mindestens 16 GB RAM auszuwählen, da sonst die Grafikleistung deutlich niedriger ausfällt.
Preis und Verfügbarkeit
Konfigurationen mit dem Core i7-1280P sind zwar noch nicht großflächig verfügbar, Modelle mit dem i7-1260P sind jedoch deutlich einfacher zu finden. Die größte Auswahl findet man direkt bei Dell, wo auch unser Testgerät mit dem Core i7-1280P und einem OLED-Panel für rund 2.400 Euro verfügbar ist.
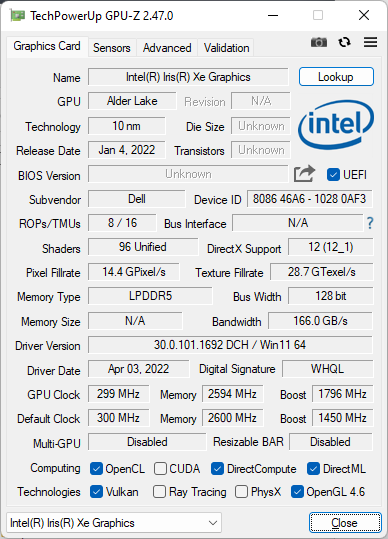
Dell XPS 13 Plus 9320 i7-1280P OLED
-
02.09.2022 v7
Allen Ngo
Weitere Artikel zur Serie
Dell XPS 13 Plus 9320 i7-1280P OLED (XPS 13 Serie)Verwandte Artikel


Preisvergleich

