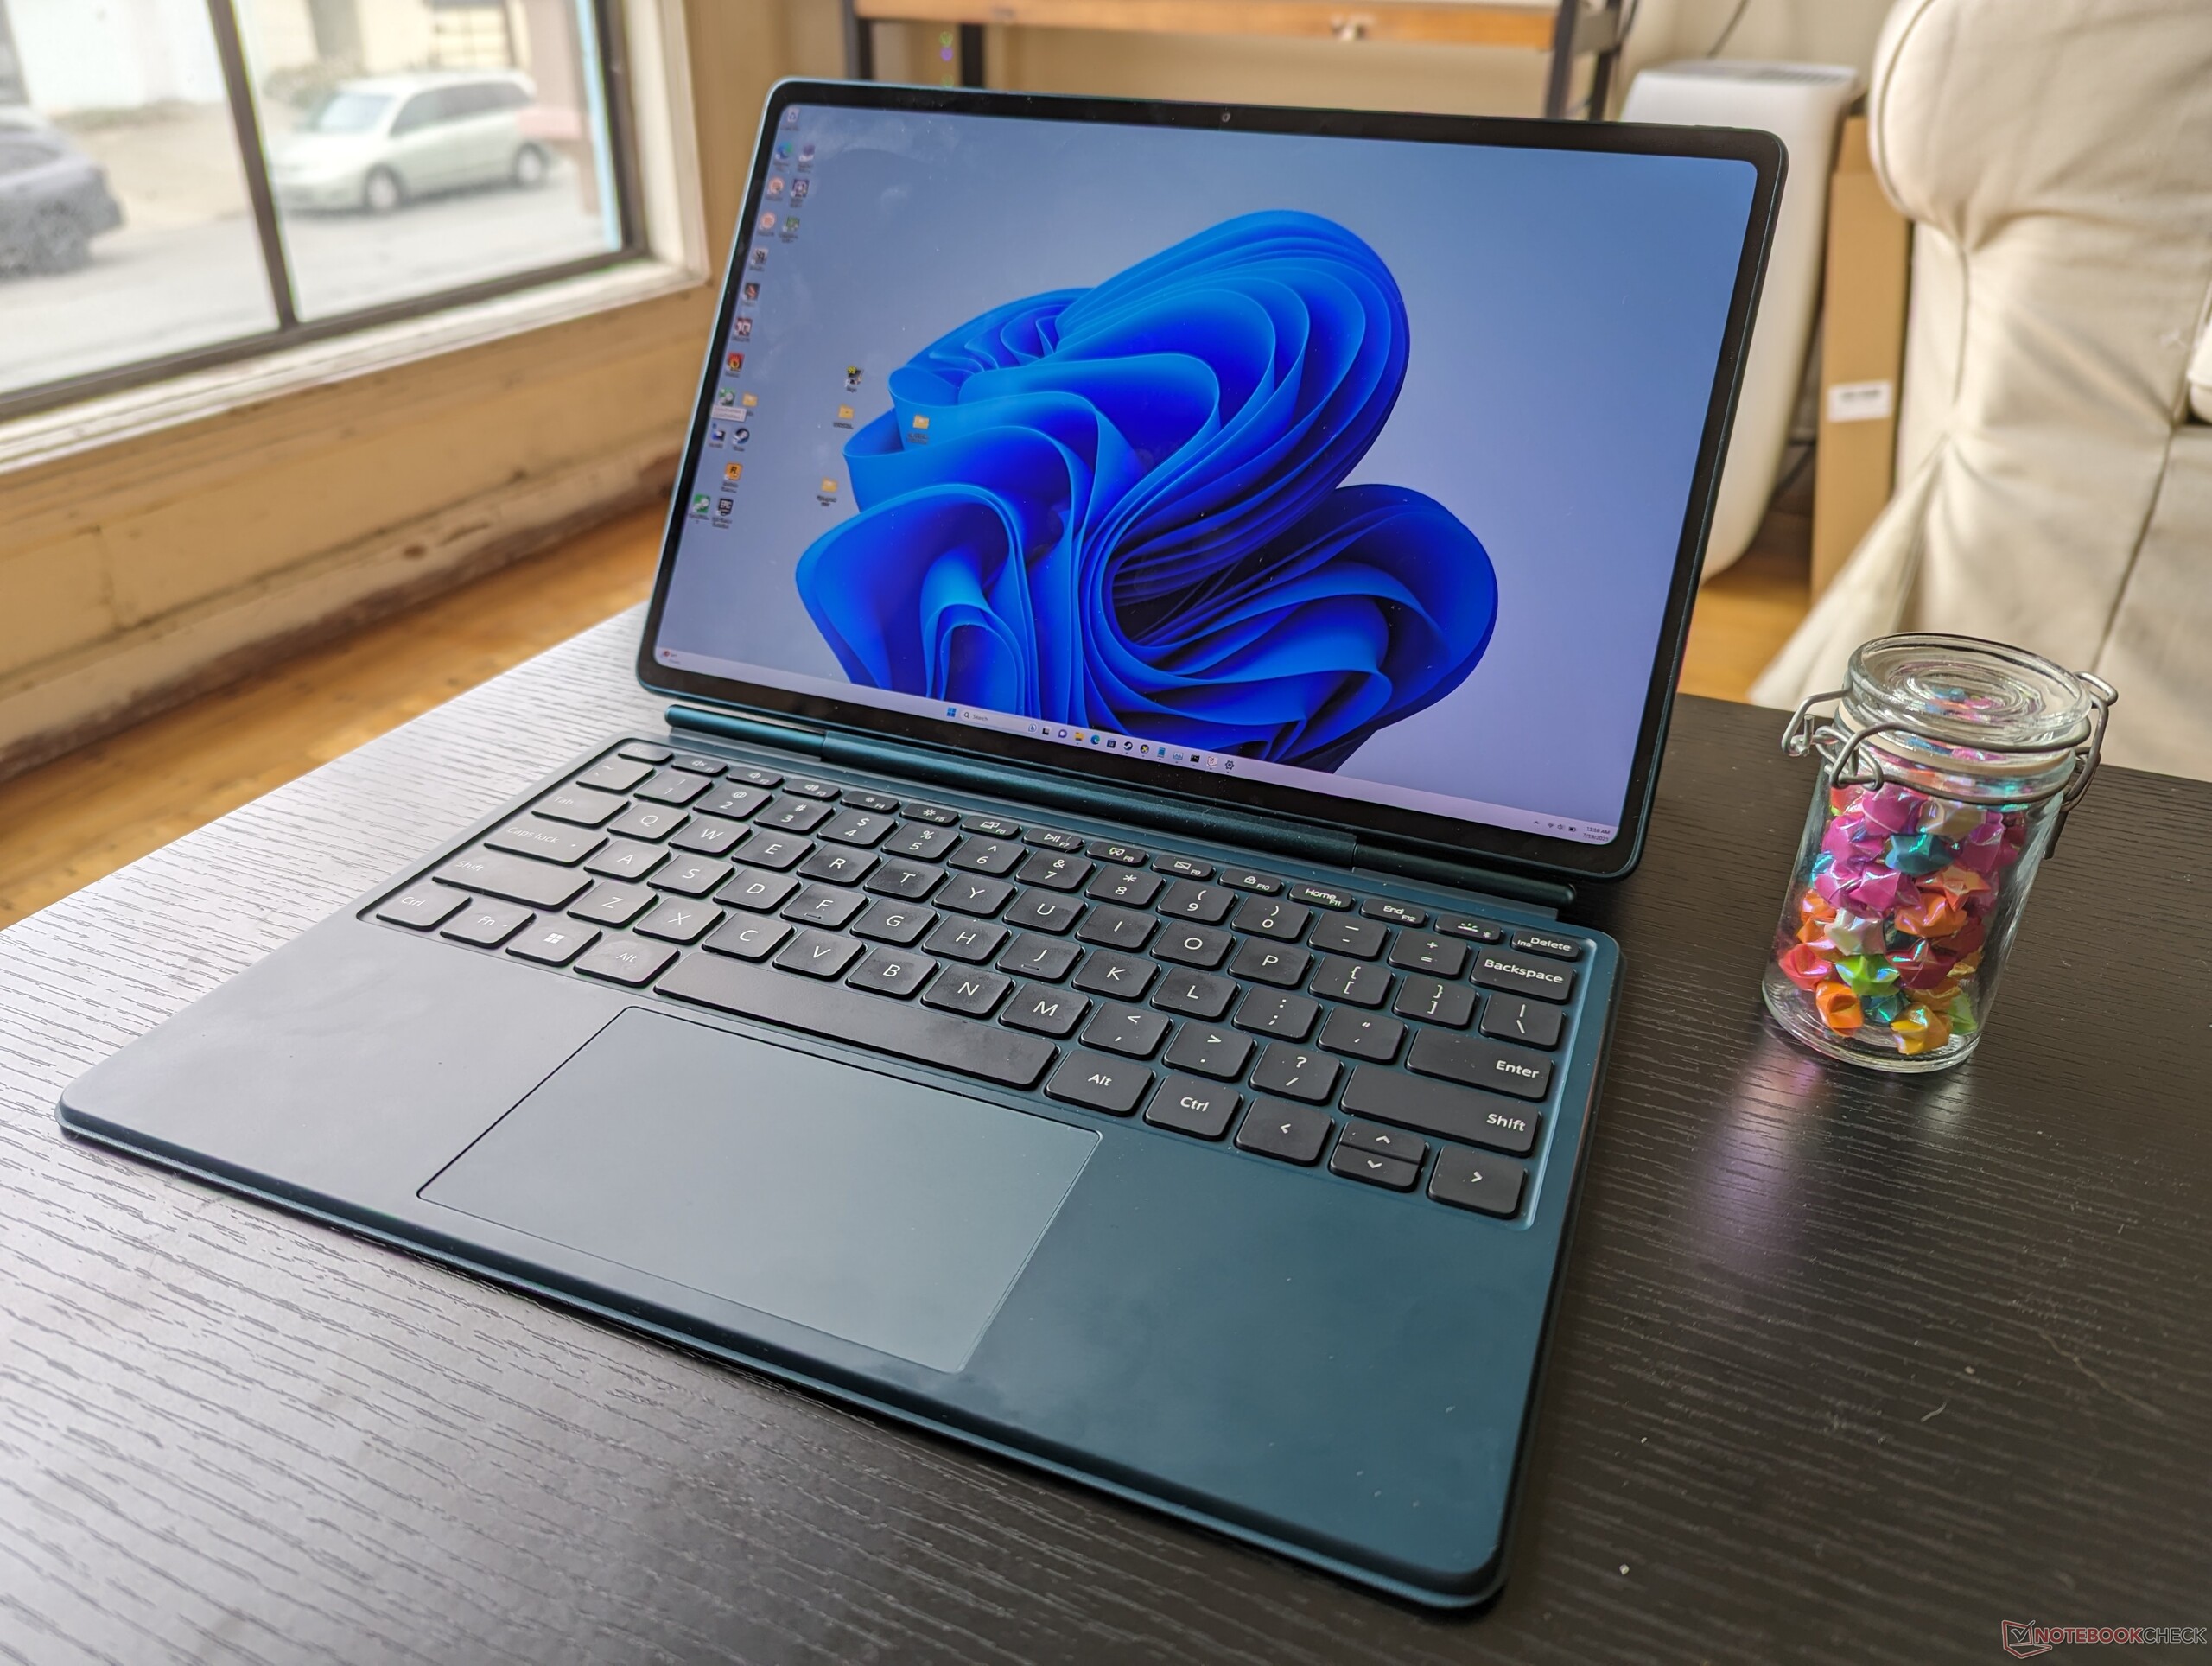
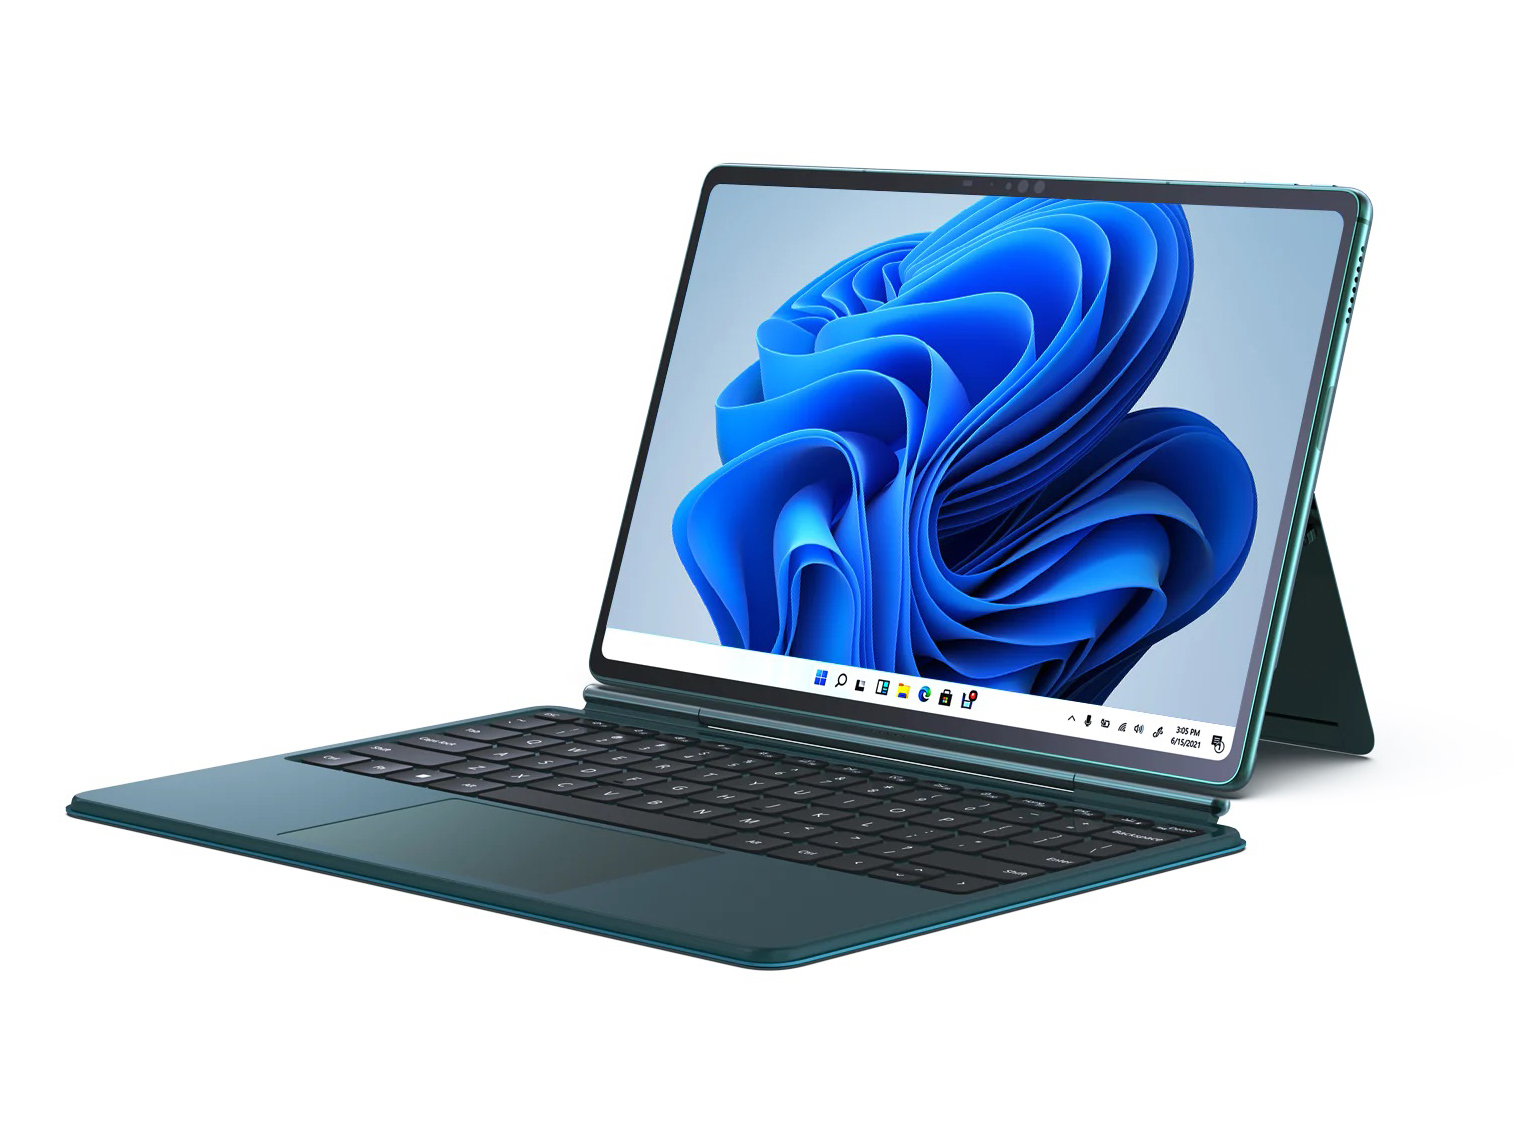
Robo & Kala TW220 2-in-1 OLED Tablet-Test: Besser als das Microsoft Surface Go 3

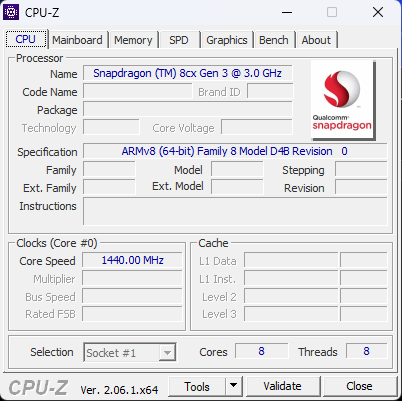
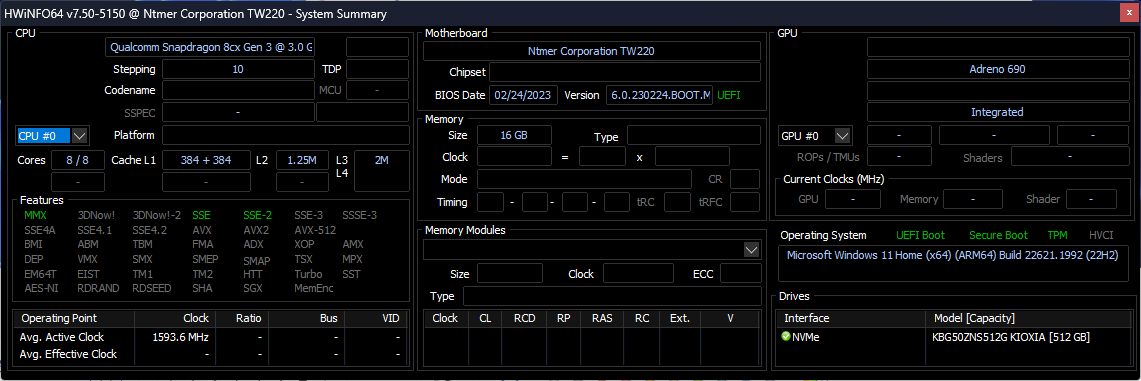
Das TW220 ist das neueste Windows-11-Flaggschiff der chinesisch-amerikanischen Firma Robo & Kala. Es ist eines der wenigen Windows Tablets, das mit einem ARM Sockel und dem Qualcomm Snapdragon 8cx Gen 3 inklusive Adreno-690-Grafik daherkommt. Das macht es zu einem direkten Konkurrenten zur Microsoft-Surface-Reihe, wie beispielsweise dem Surface Pro 9 ARM, welches ebenfalls einen Qualcomm Prozessor beherbergt.
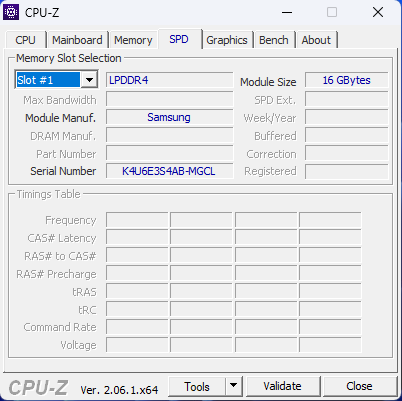
Abgesehen vom eher ungewöhnlichen Chipsatz liest sich das TW220 auf dem Papier wie ein High-End-Tablet: Man bekommt ein 16:10-2.560-x-1.600-OLED-Touchscreen mit P3-Farben, 16-GB-LPDDR4X-RAM, eine 512-GB-NVMe-SSD und ein abnehmbares Keyboard, und das alles für weitaus weniger als bei einem Surface Pro.
Potenzielle Mitstreiter im Vergleich
Bew. | Datum | Modell | Gewicht | Dicke | Größe | Auflösung | Preis ab |
|---|---|---|---|---|---|---|---|
| 82.1 % v7 (old) | 07 / 2023 | Robo and Kala TW220 2-in-1 SD 8cx Gen 3, Adreno 690 | 712 g | 7.3 mm | 12.60" | 2560x1600 | |
| 88.4 % v7 (old) | 01 / 2023 | Microsoft Surface Pro 9, i7-1255U i7-1255U, Iris Xe G7 96EUs | 877 g | 9.3 mm | 13.00" | 2880x1920 | |
| 86.9 % v7 (old) | 03 / 2023 | Microsoft Surface Pro 9, ARM SD 8cx Gen 3, Adreno 690 | 883 g | 9.3 mm | 13.00" | 2880x1920 | |
| 85.3 % v7 (old) | 10 / 2021 | Microsoft Surface Go 3 Core i3 i3-10100Y, UHD Graphics 615 | 783 g | 8.3 mm | 10.50" | 1920x1280 | |
| 88.6 % v7 (old) | 11 / 2022 | Apple iPad 10 A14, A14 Bionic GPU | 477 g | 7 mm | 10.90" | 2360x1640 | |
| 92.5 % v7 (old) | 11 / 2022 | Apple iPad Pro 11 2022 M2, M2 10-Core GPU | 466 g | 5.9 mm | 11.00" | 2388x1668 |
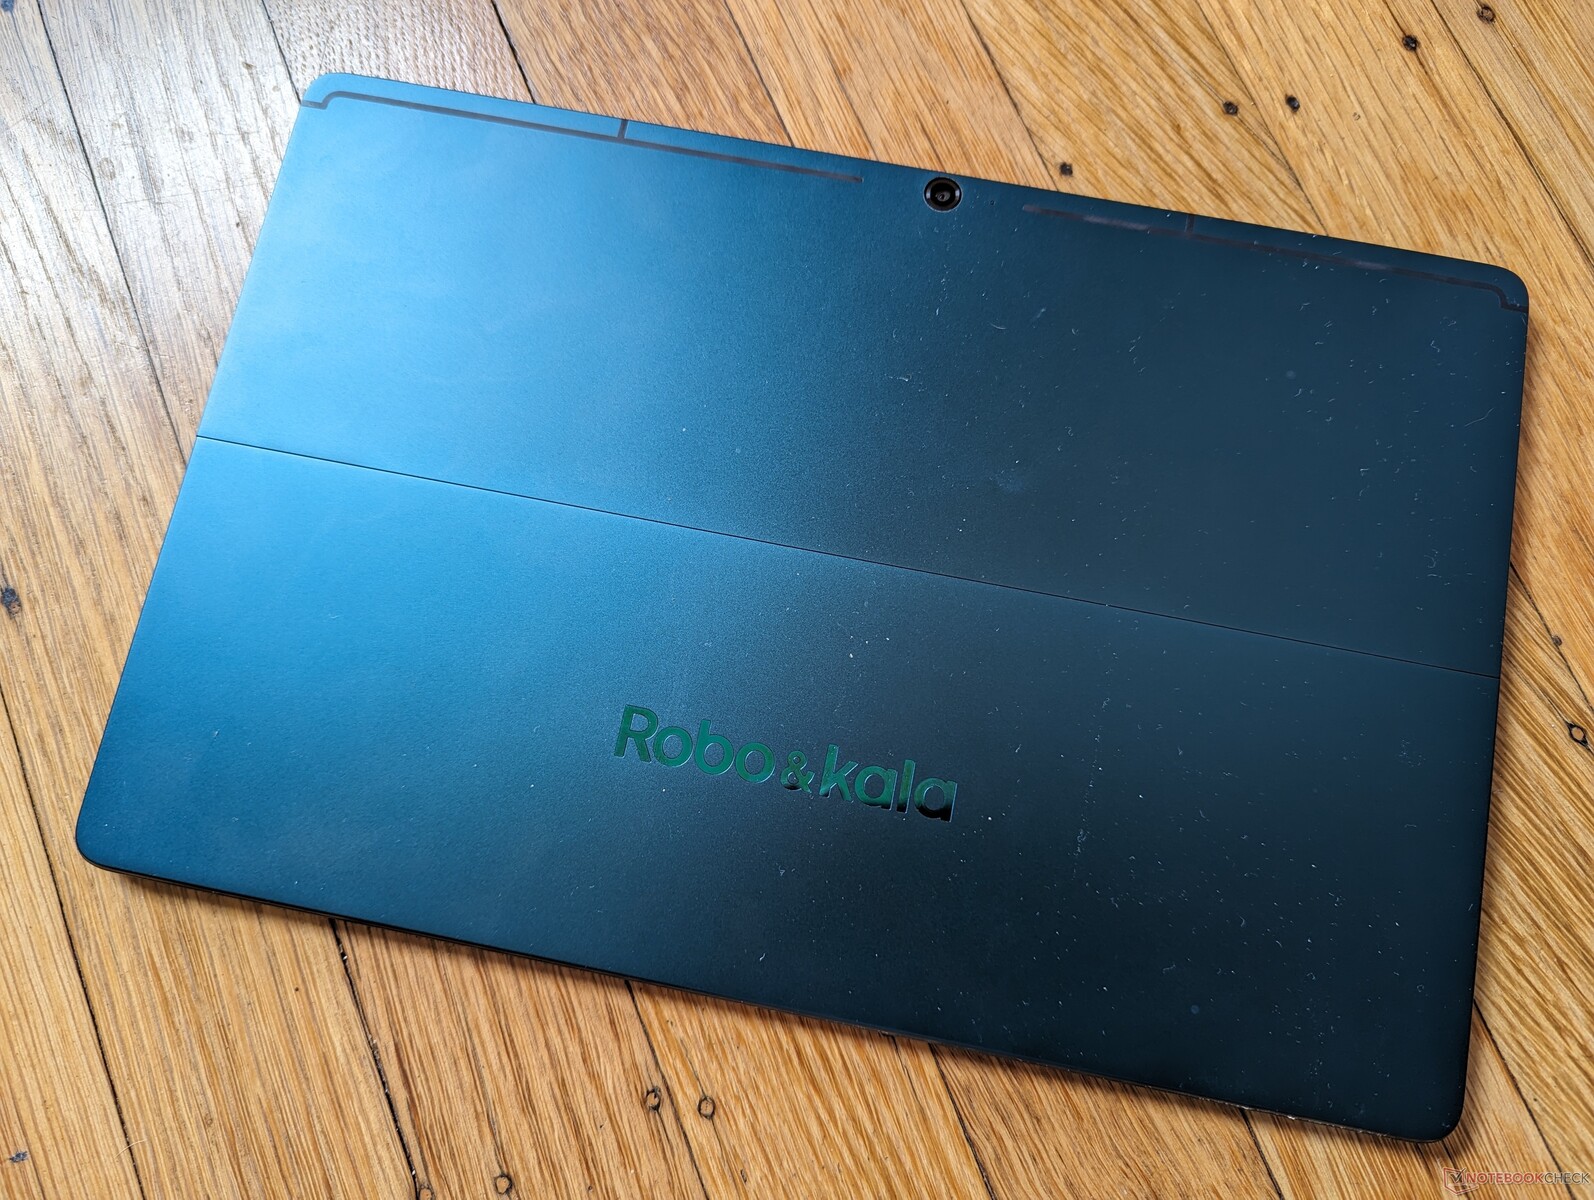
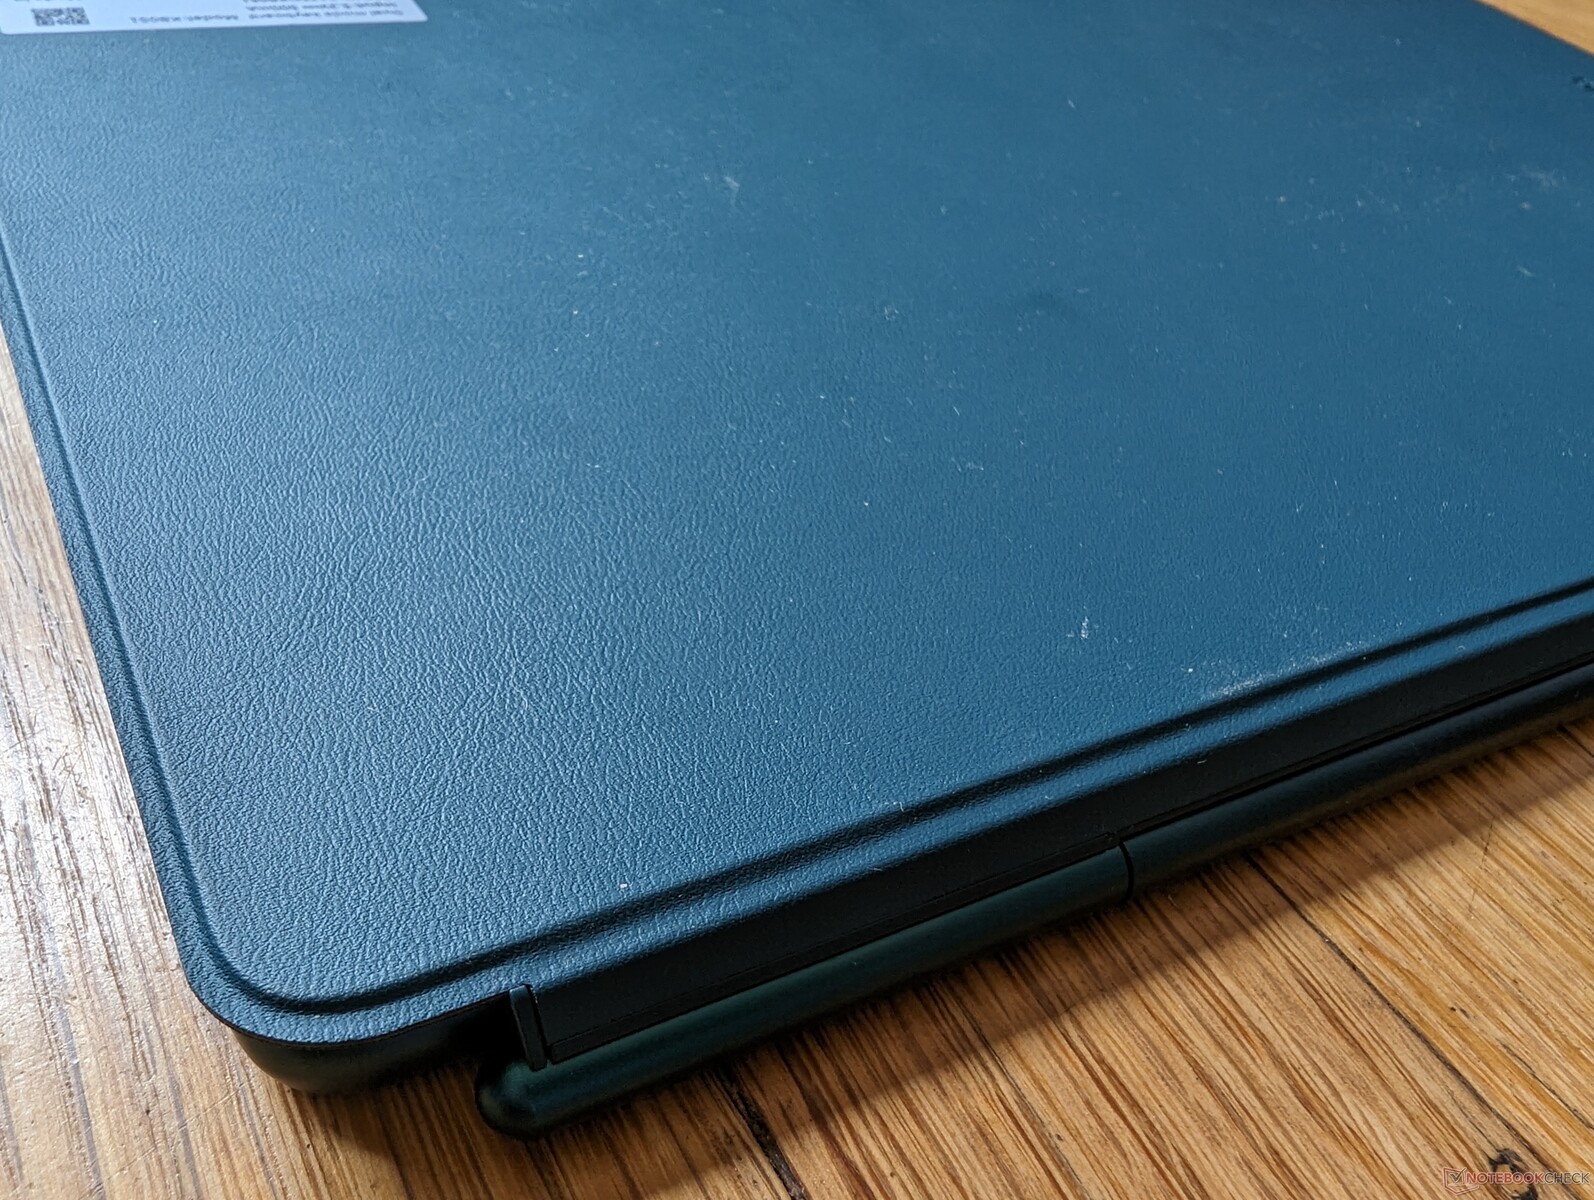
Gehäuse — Robuster erster Eindruck
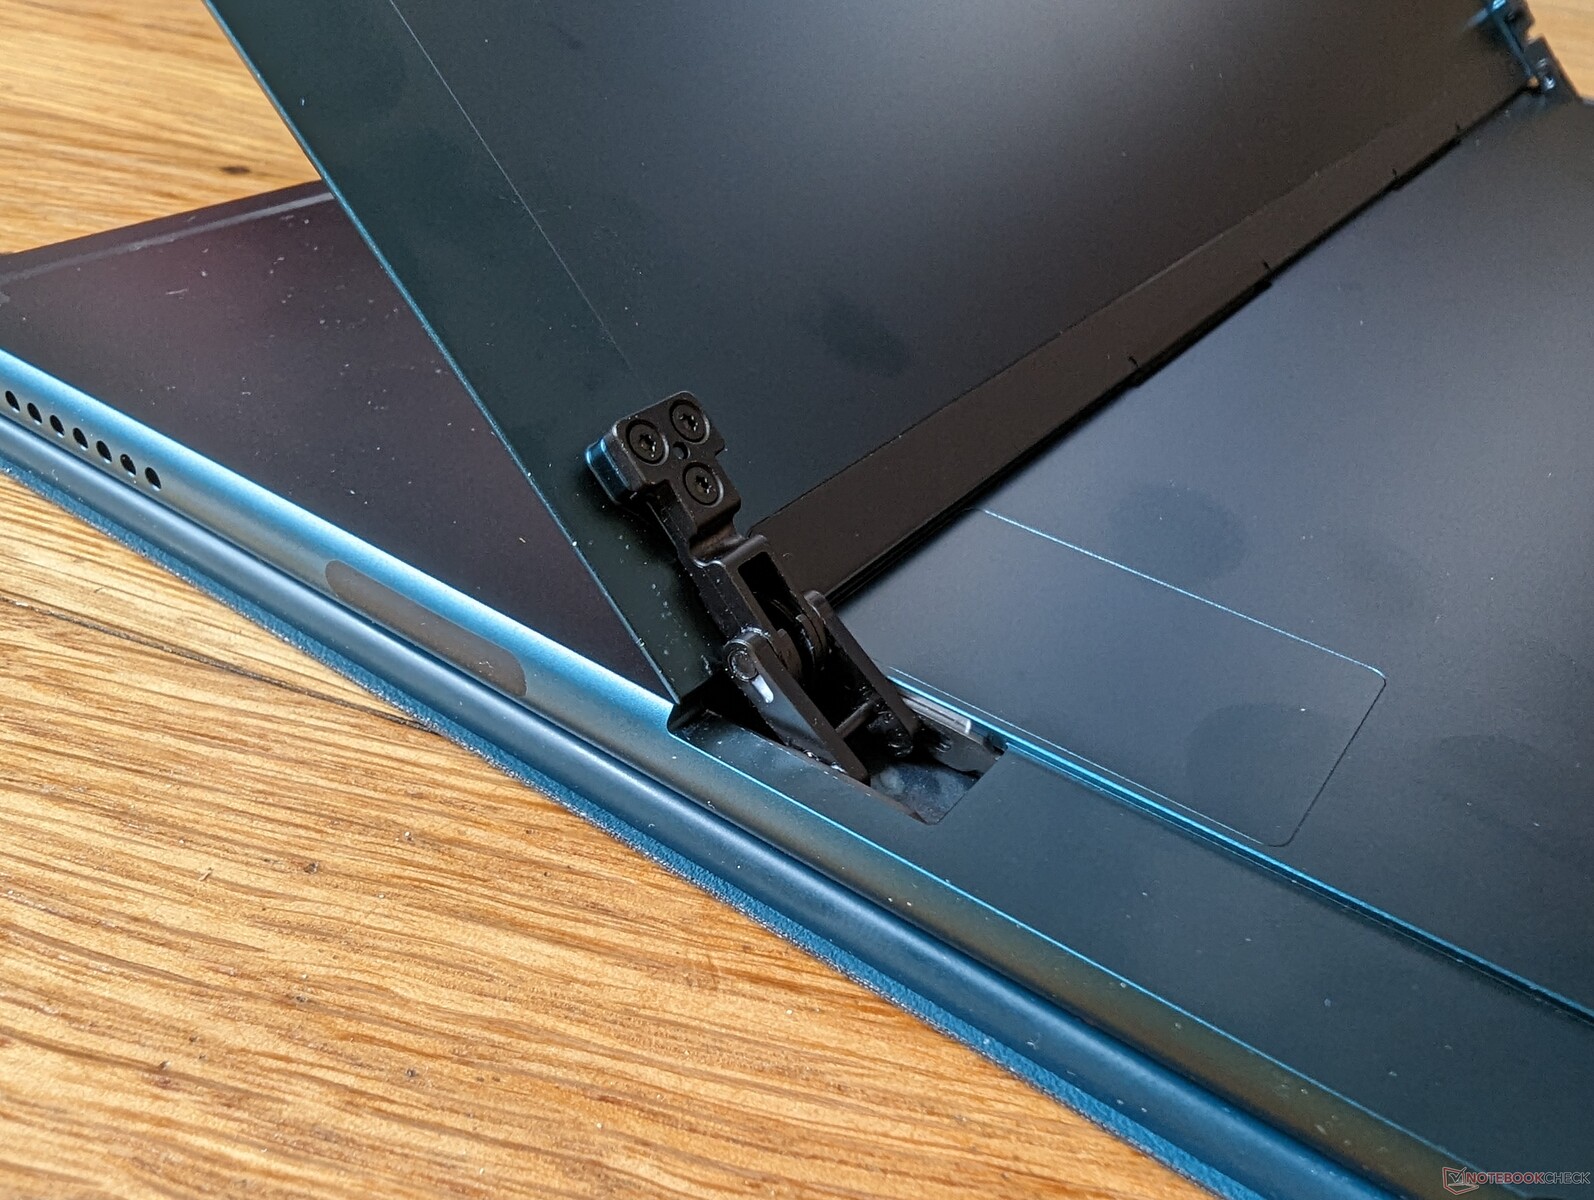
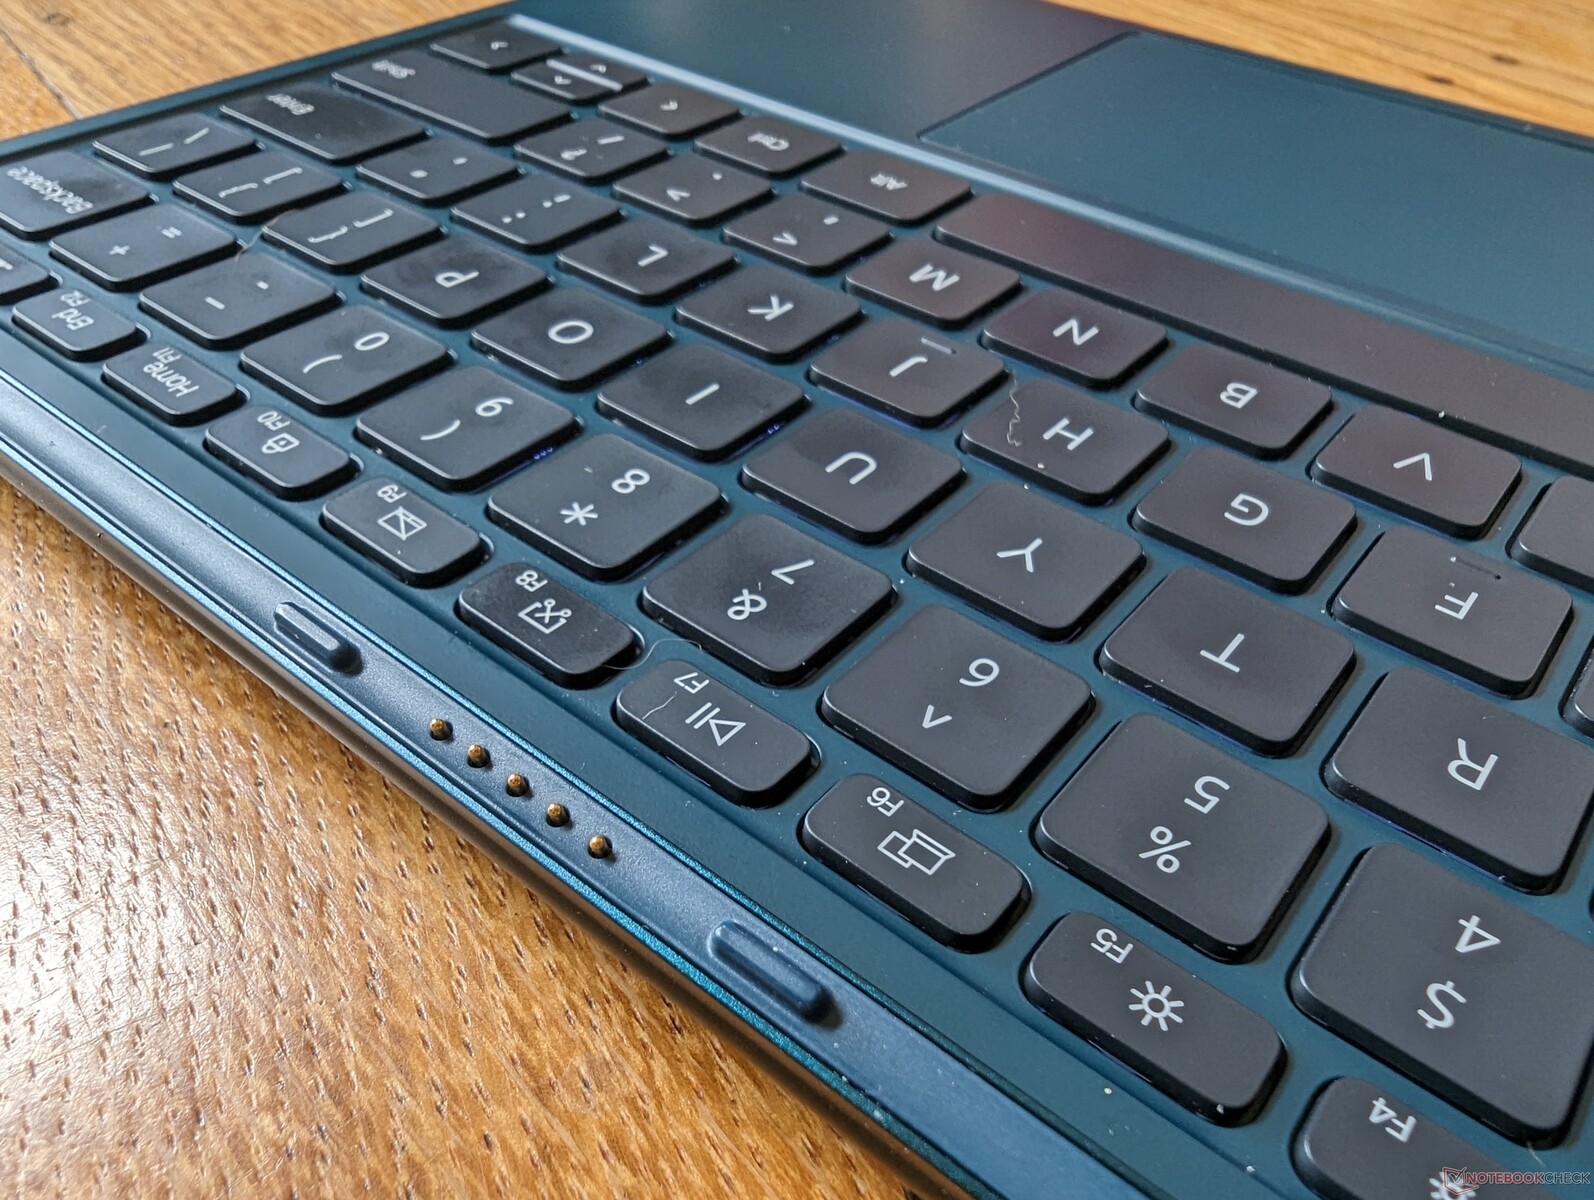
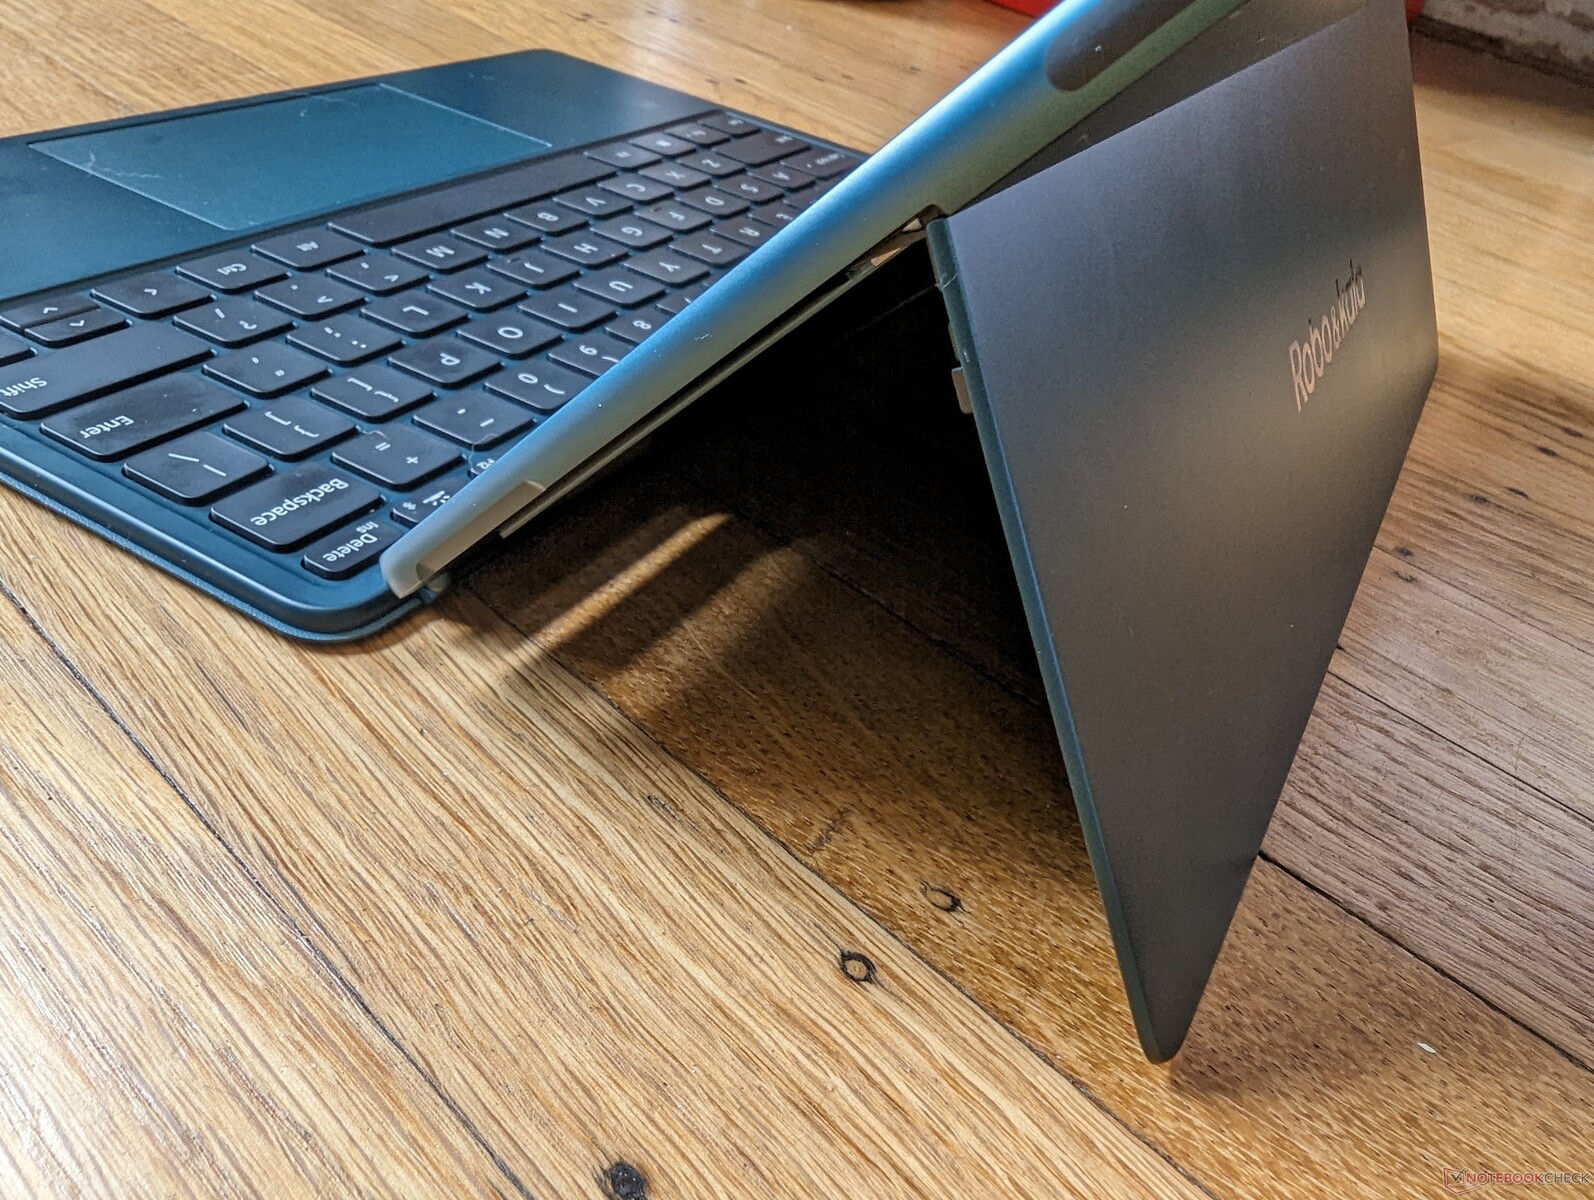
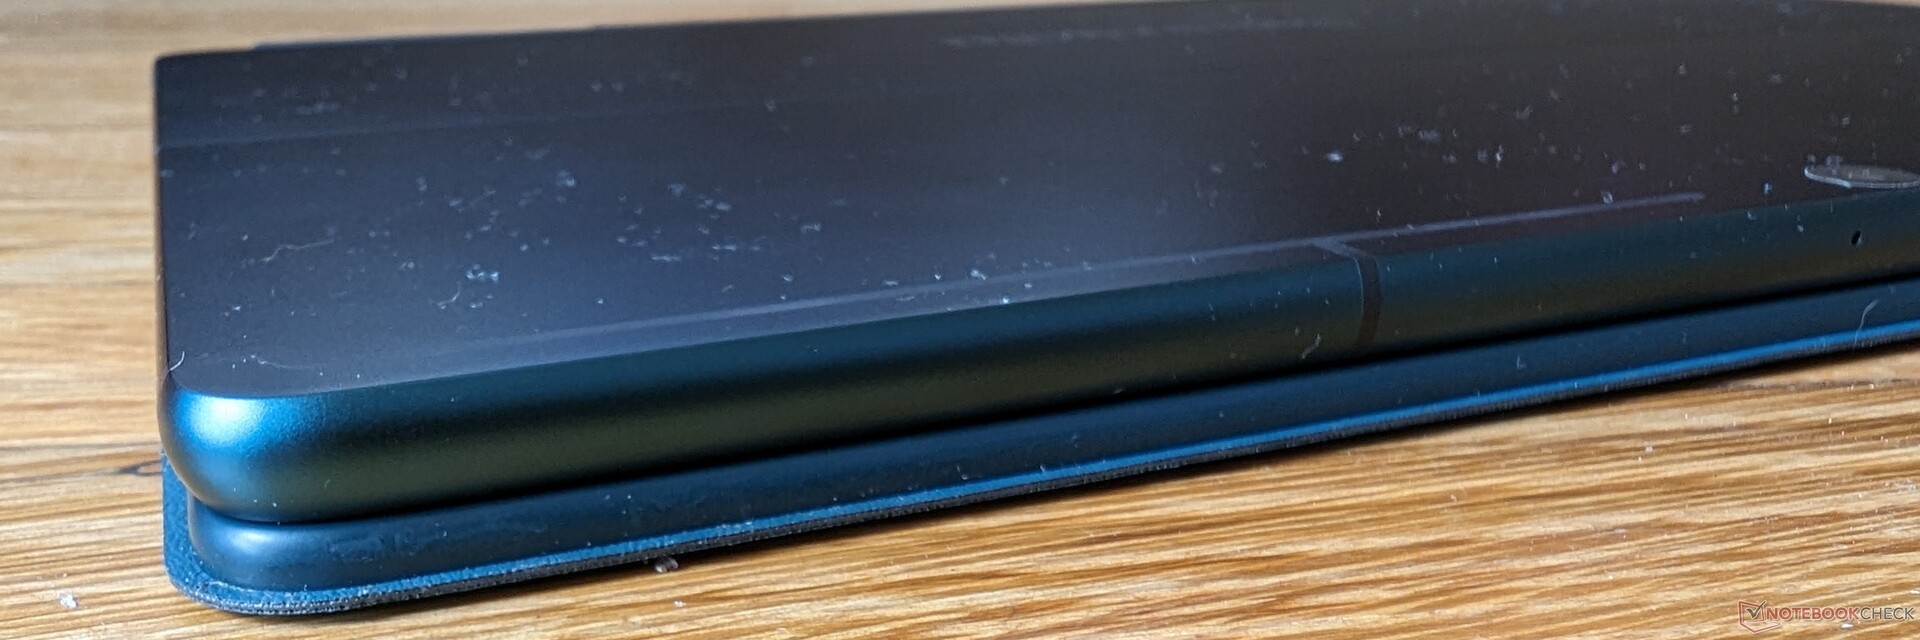
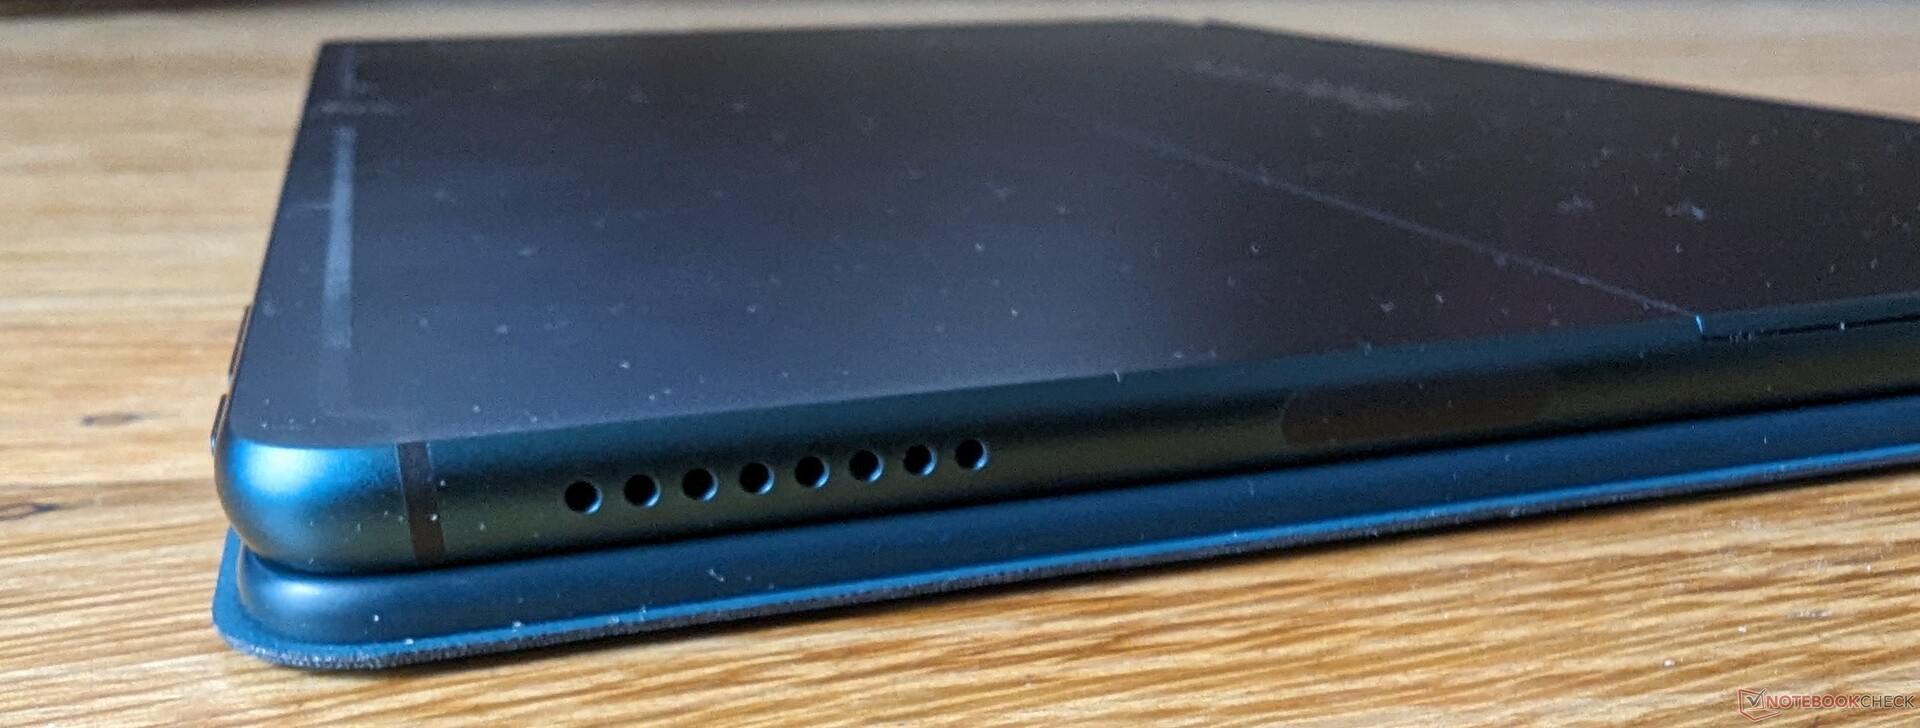
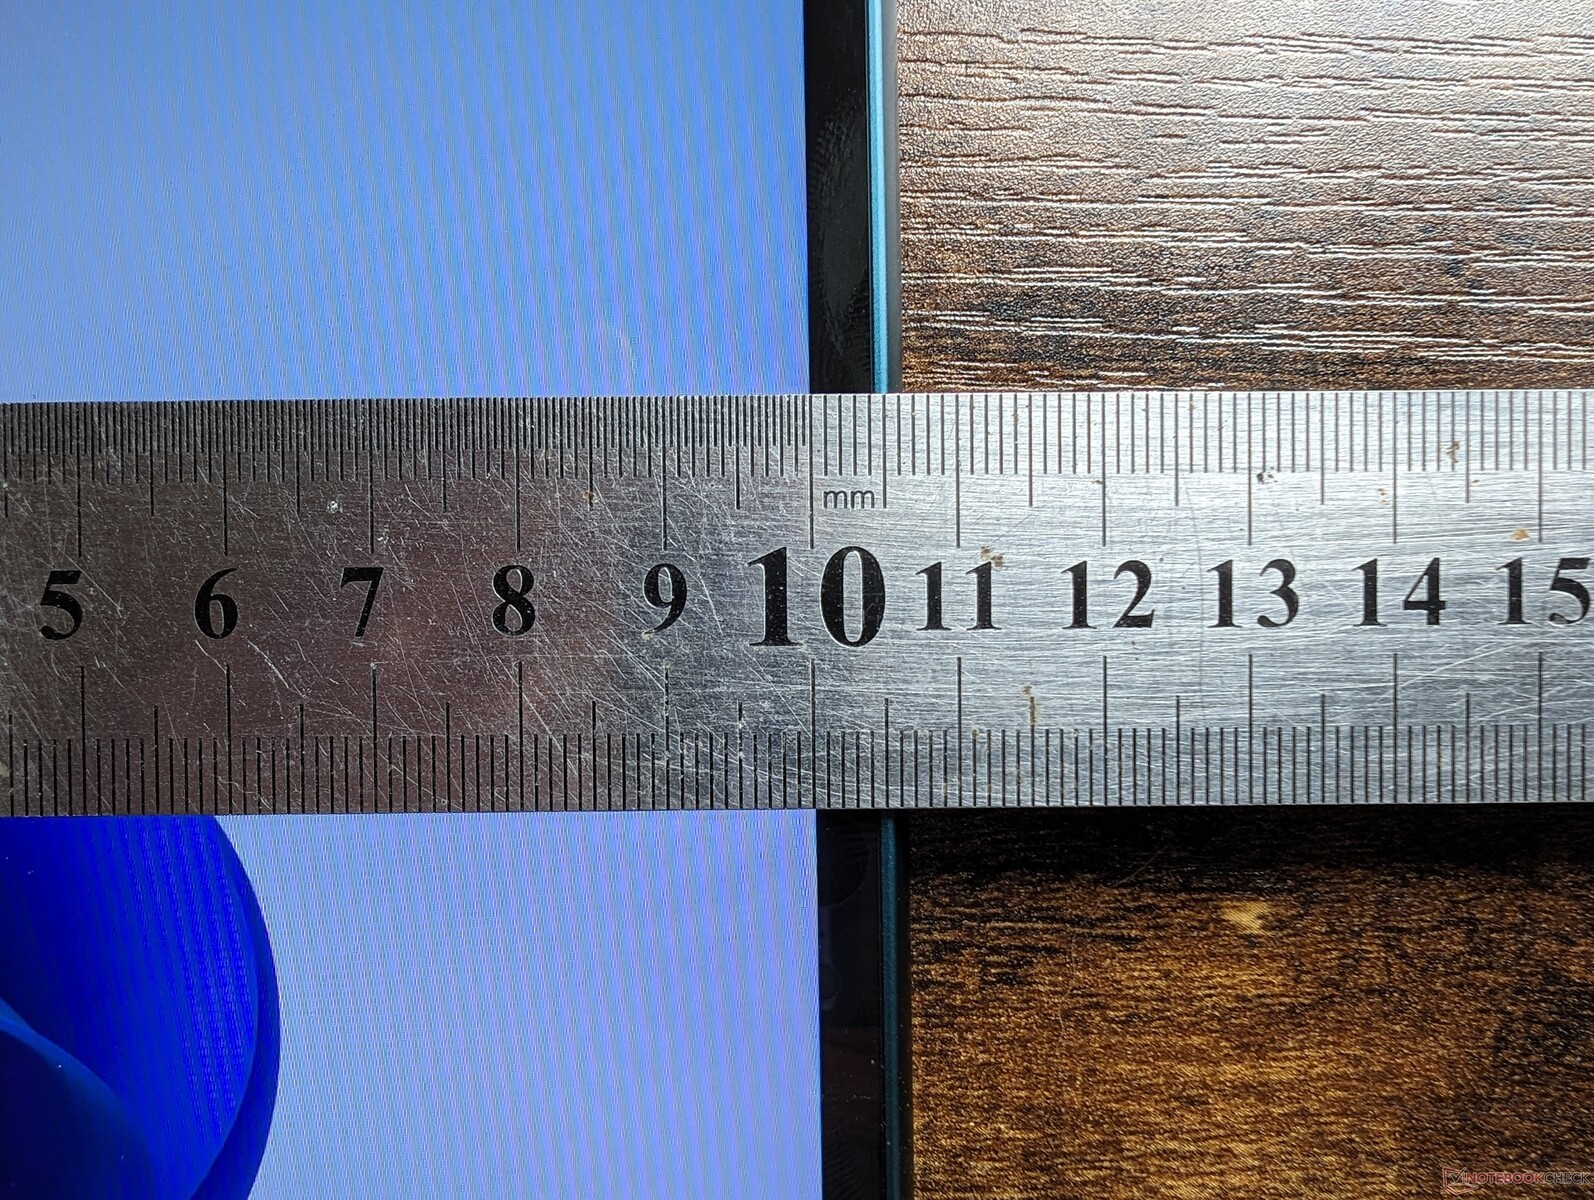
Das Aluminium-Gehäuse macht einen ziemlich stabilen und robusten ersten Eindruck, wenn man bedenkt, dass es sowohl dünner (und somit leichter) ist und auch dünnere Kanten besitzt. Die Tastatur ist grundsätzlich stabil gefertigt, jedoch lassen sich die Connection-Pins zu leicht vom Tablet lösen.
Das Tablet an sich wiegt 712 g, mit Tastatur zusammen sind es dann 1,06 kg. Somit ist es merkbar leichter als andere Surface Modelle wie das kleinere Surface Go 3.
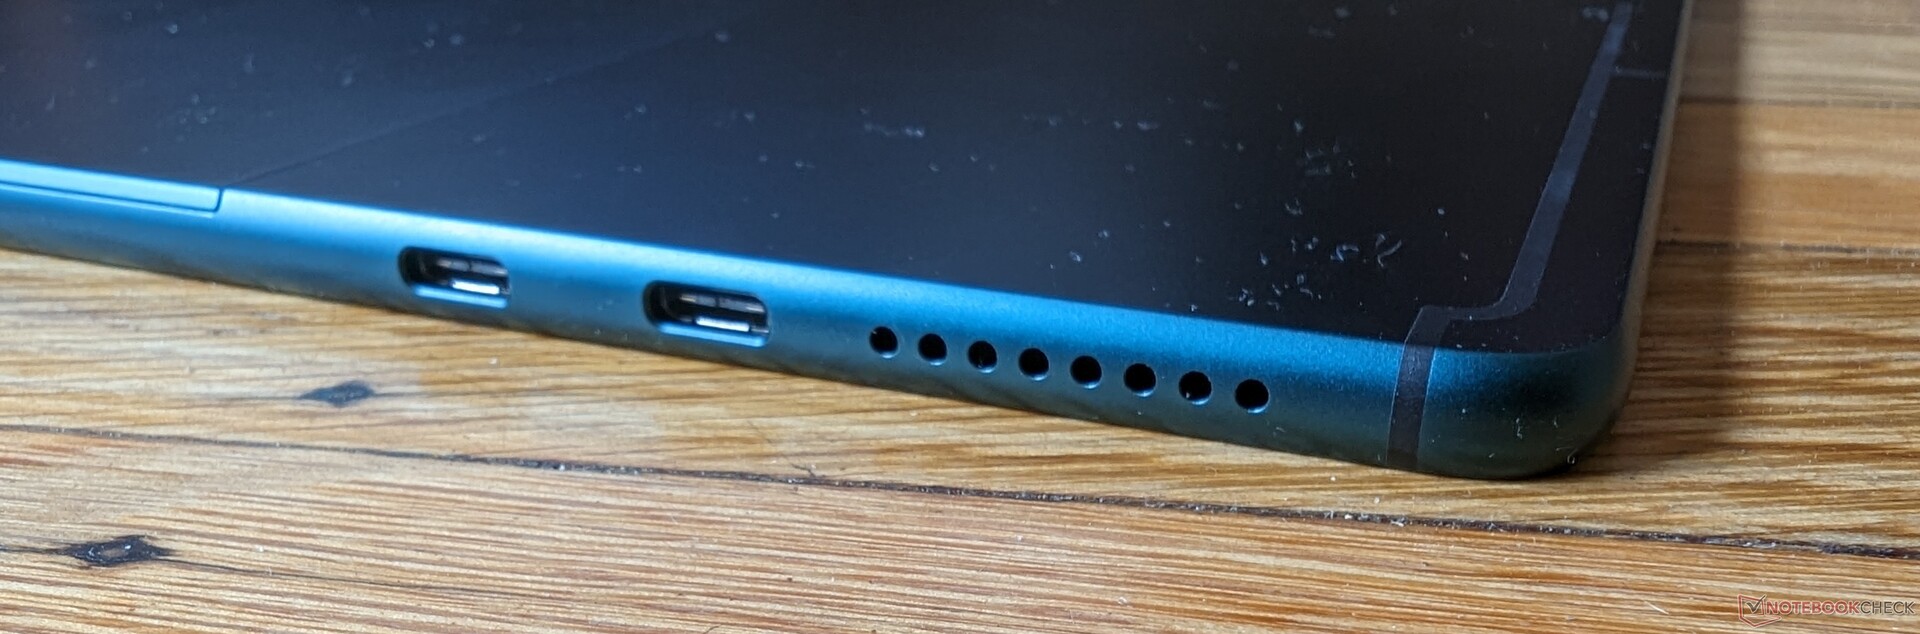
Anschlüsse
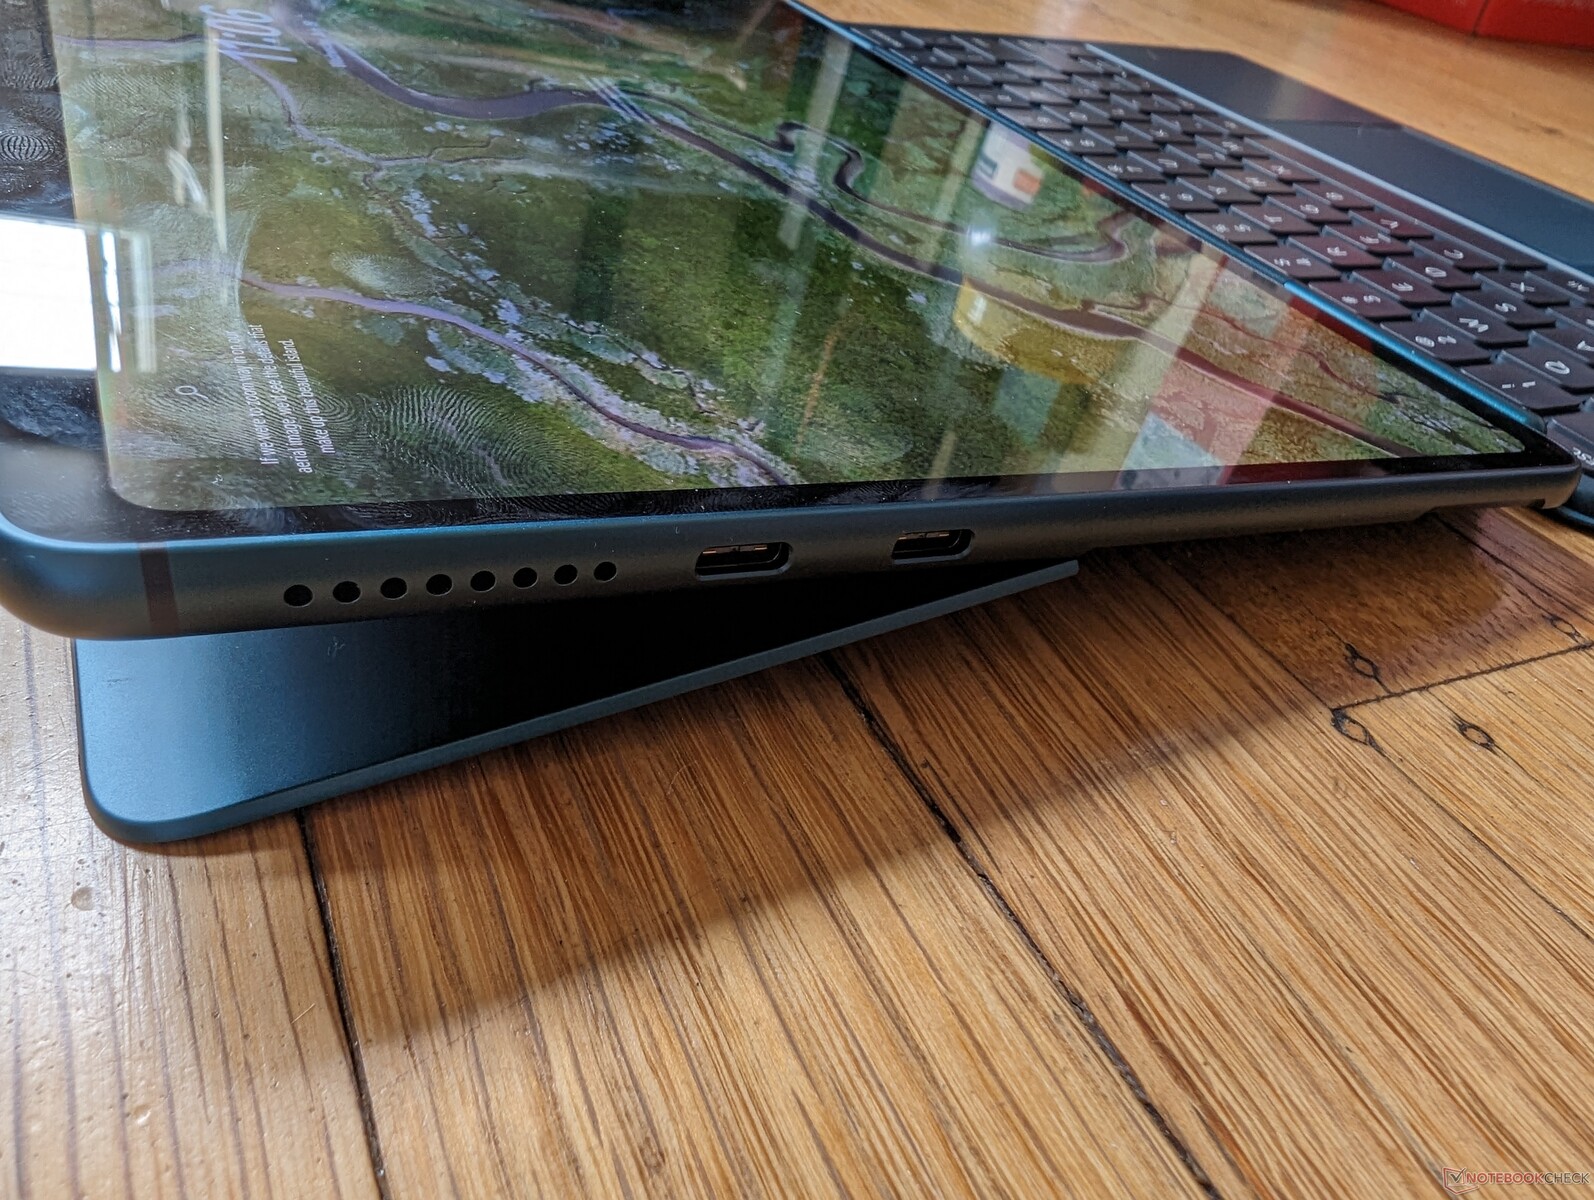
Die zwei USB-C-Ports unterstützen sowohl DisplayPort als auch das Laden des Geräts. Mit diesem konnten wir bis zu 4K bei 60 Hz und einer 8-Bit-Farbtiefe erzielen. Was man beim TW220 jedoch vergebens sucht, ist ein 3,5-mm-Klinkenanschluss.
Kommunikation
In den meisten Fällen wird für WiFi 6 und WiFi 6E ein Qualcomm-WCN685x-Chip verbaut, und so ist es auch hier der Fall. Bei unseren Tests konnten wir dabei keinerlei Performance-Probleme mit unserem Asus-AXE11000-6-GHz-Netzwerk feststellen.
Webcam
Mit seiner 13-MP-Webcam besitzt das Tablet auch eine merkbar bessere Kameraqualität als jene beim Surface Pro 9 (10 MP) oder beim Surface Go 3 (8 MP). Ebenfalls sorgt der Infrarot-Sensor für einen gut funktionierenden Windows-Hello-Support. Eine Kameraverdeckung gibt es aber nicht.


Zubehör und Garantie
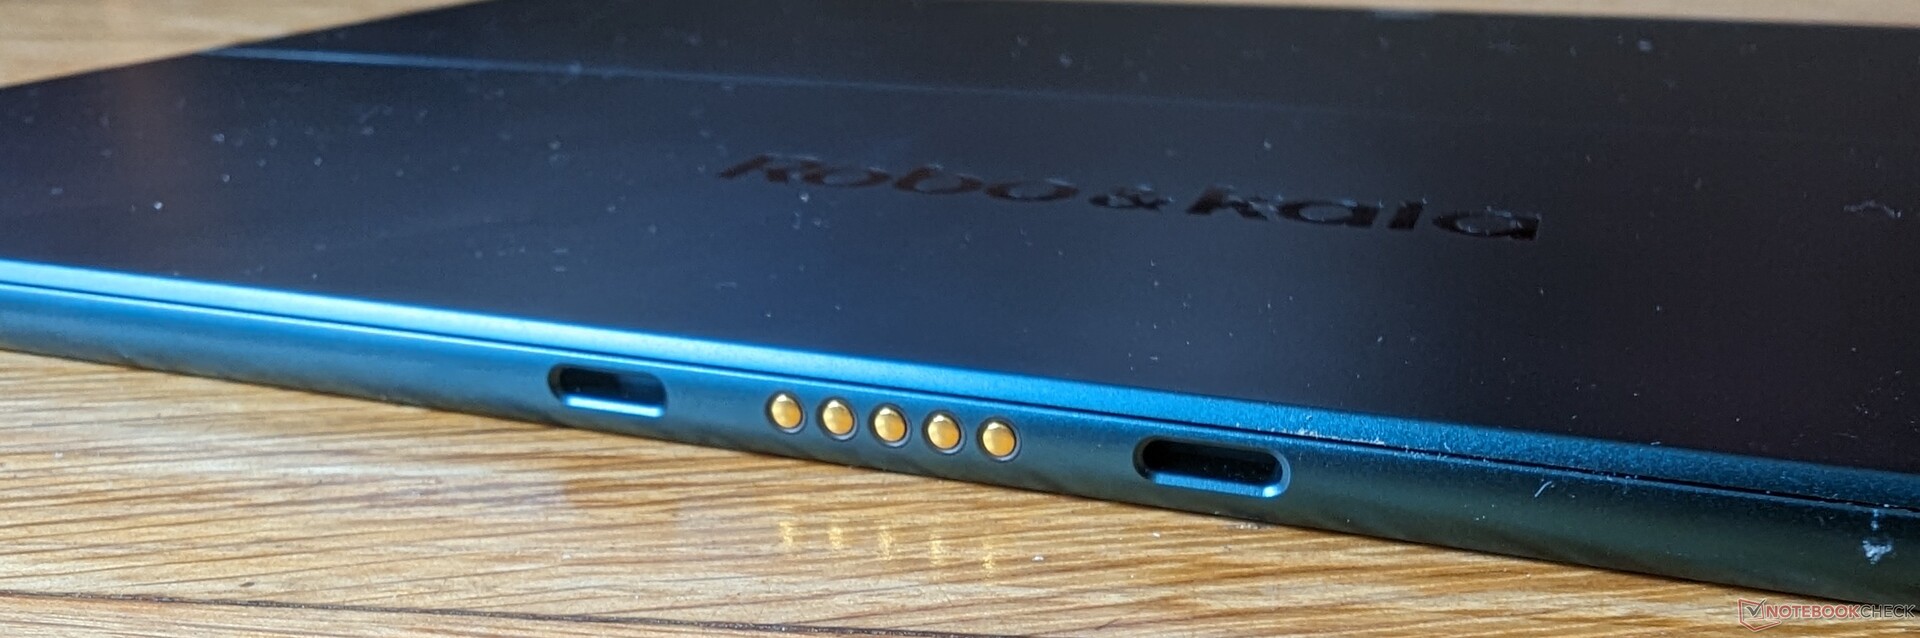
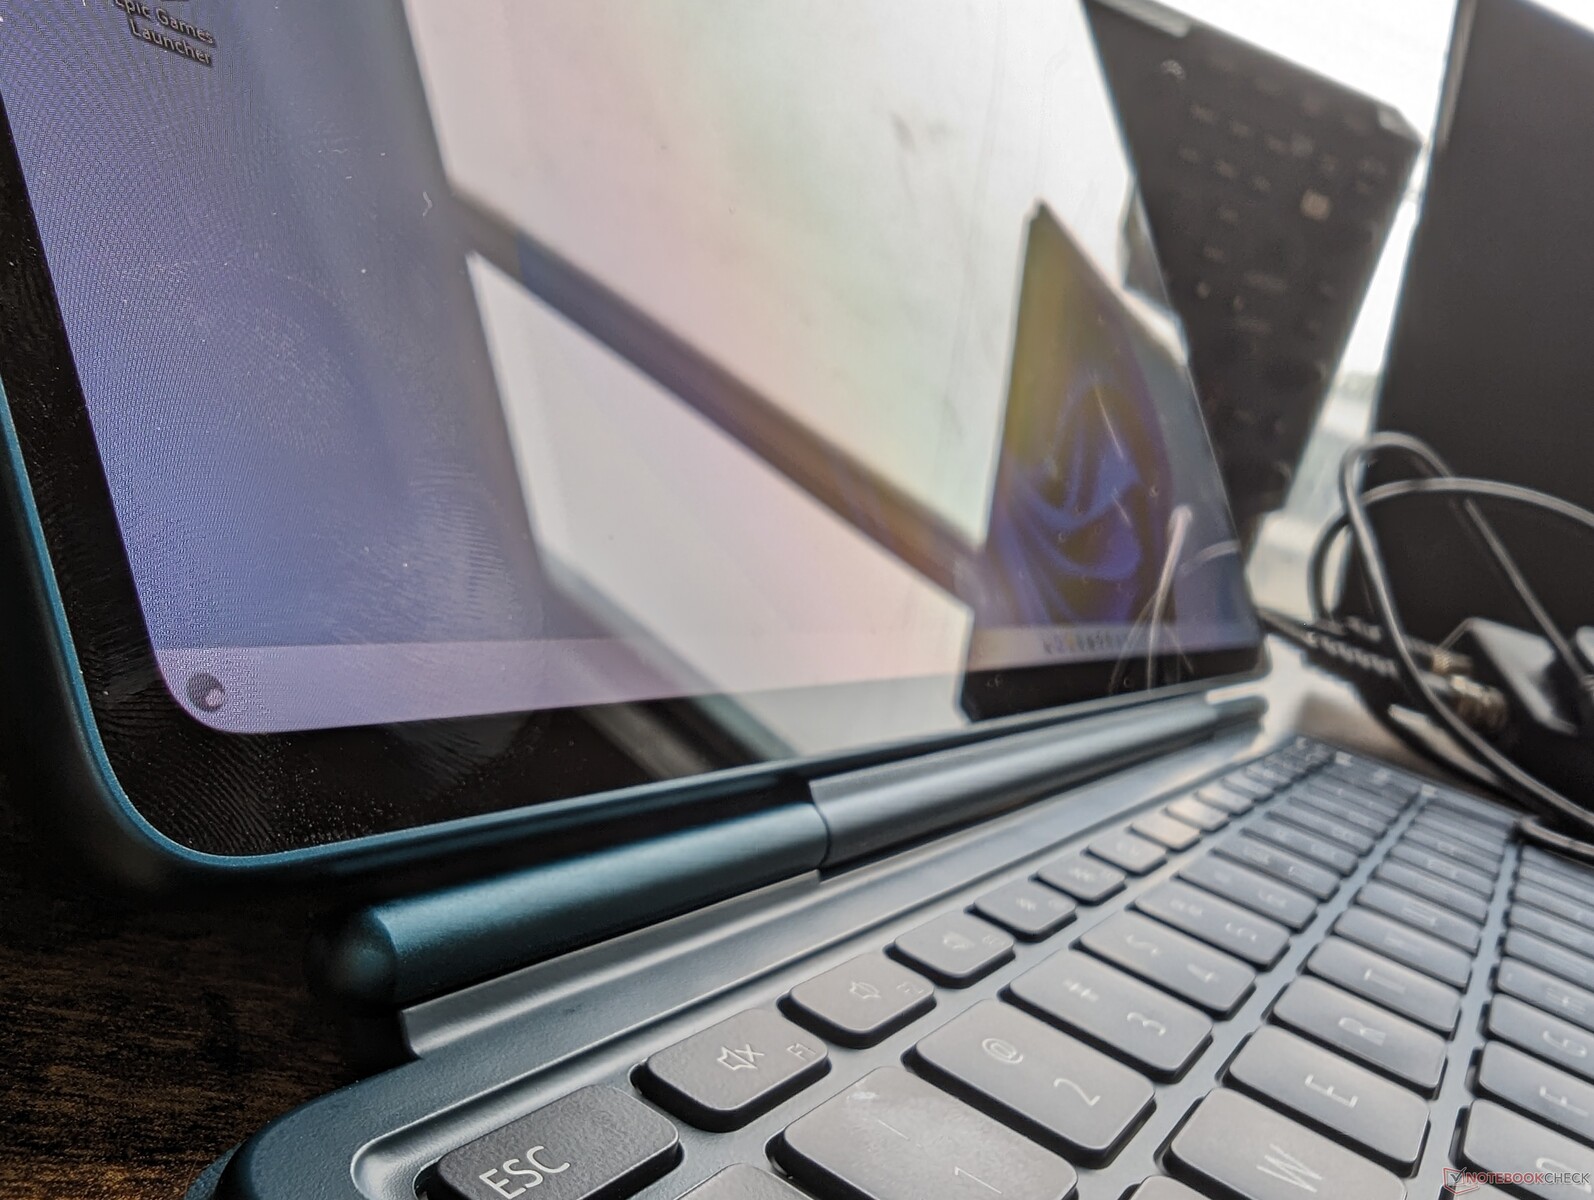
Ab Werk werden zwei Dinge mitgeliefert: die abnehmbare Tastatur und der 4096-Level-Pressure-Smart-Pen. Die Tastatur besitzt ihre eigene, interne Batterie und kann entweder physisch oder via Bluetooth mit dem Tablet verbunden werden. Geladen werden kann das Keyboard aber nur, wenn man es durch die Connection-Pins mit dem Tablet verbindet, da kein extra Lade-Anschluss verbaut wurde.
Außerdem bekommt man beim Kauf eine standardmäßige 1-Jahr-Garantie auf das Gerät.
Eingabegeräte
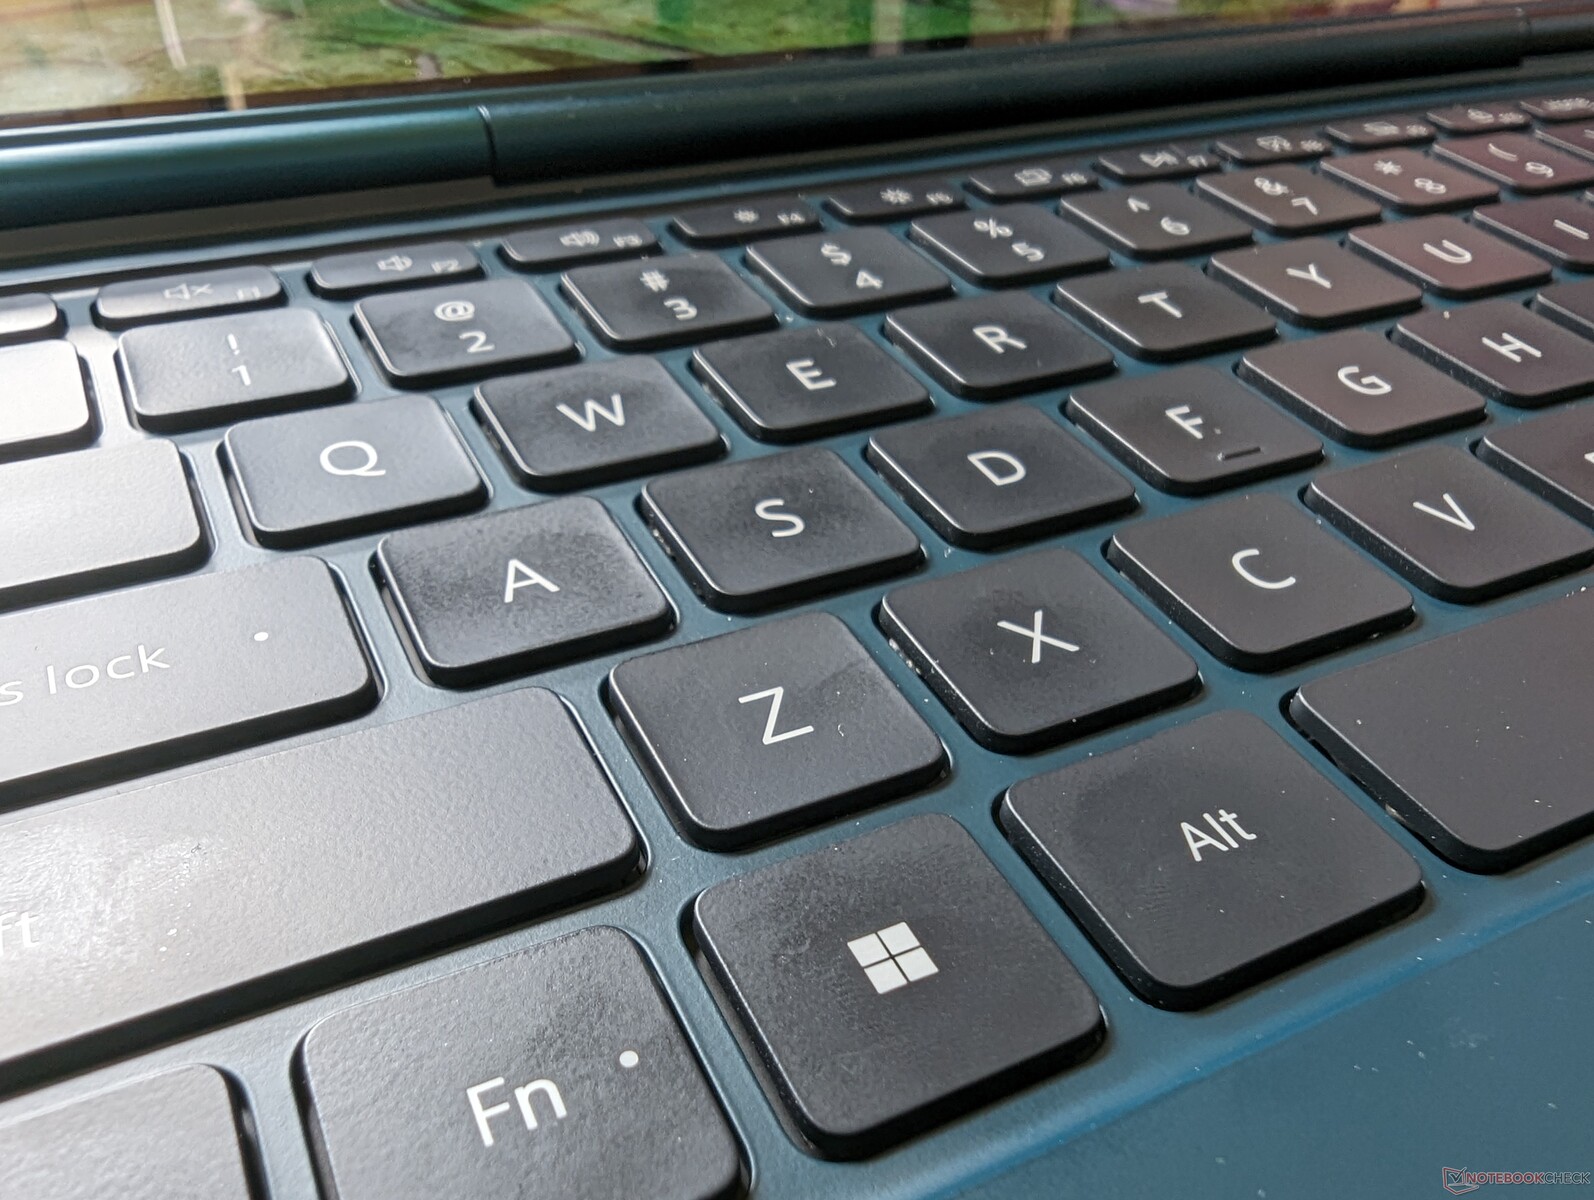
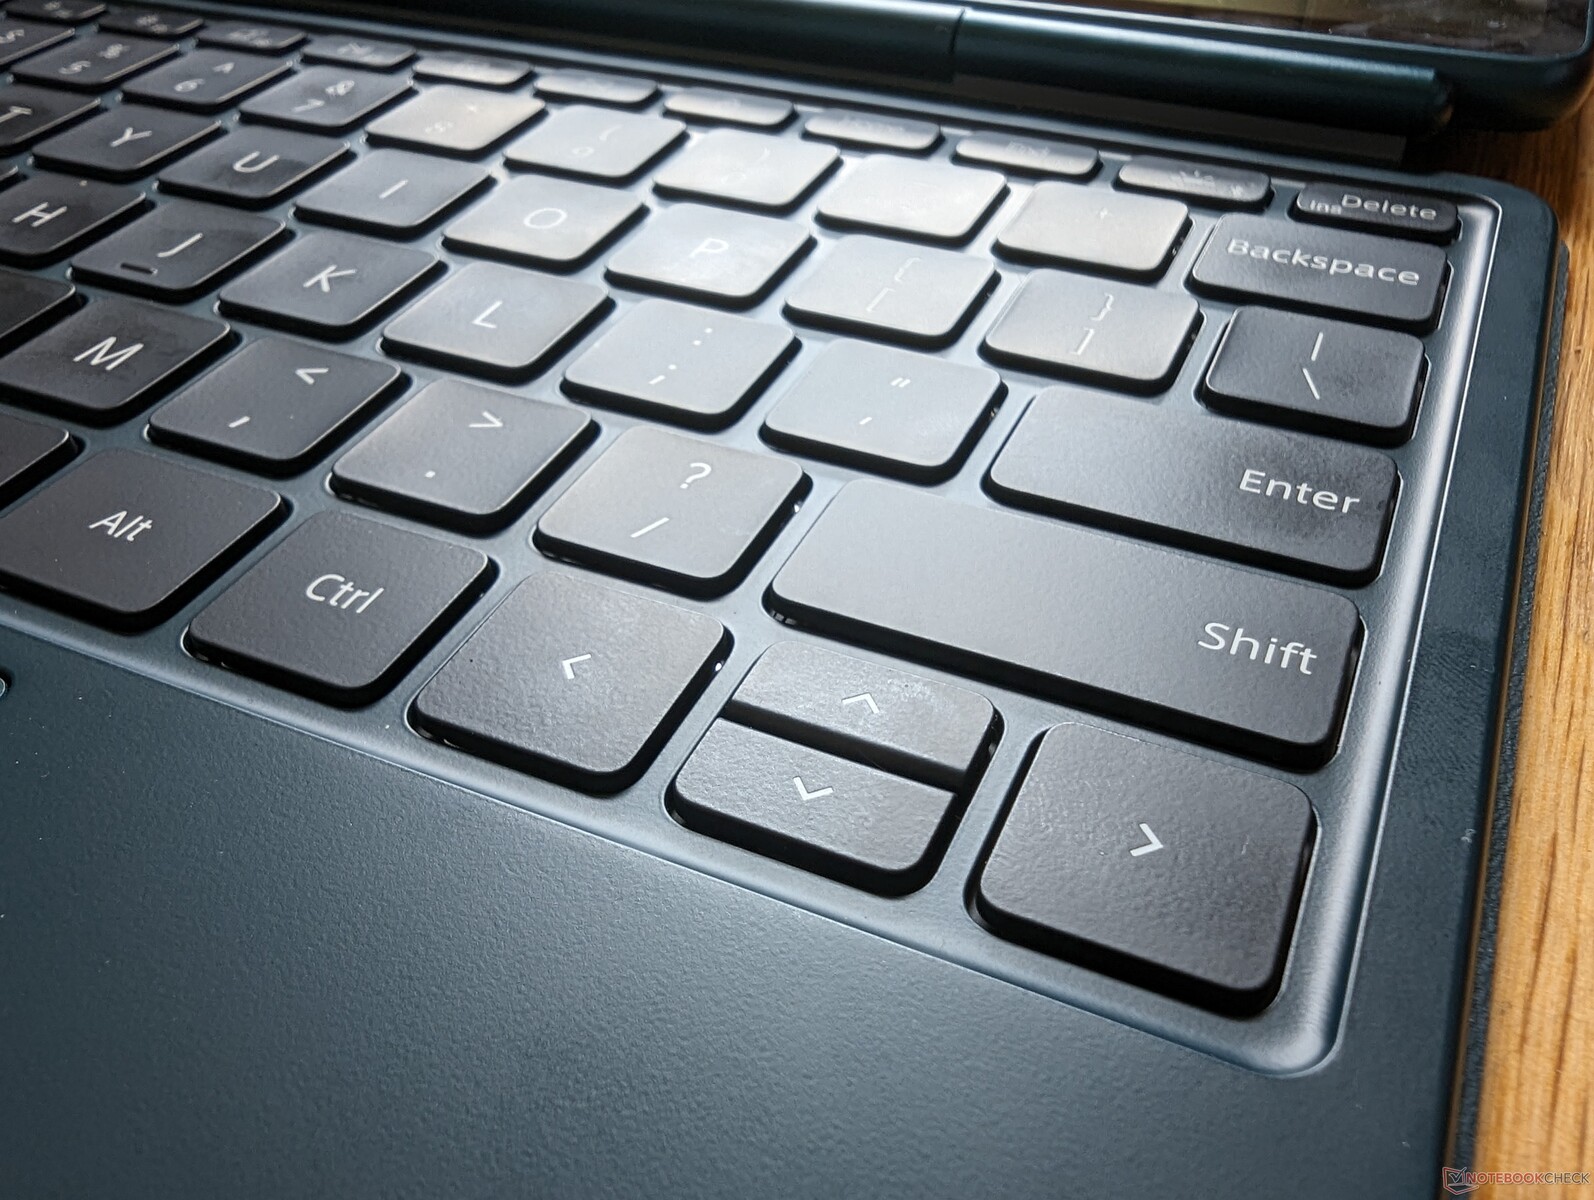
Tastatur
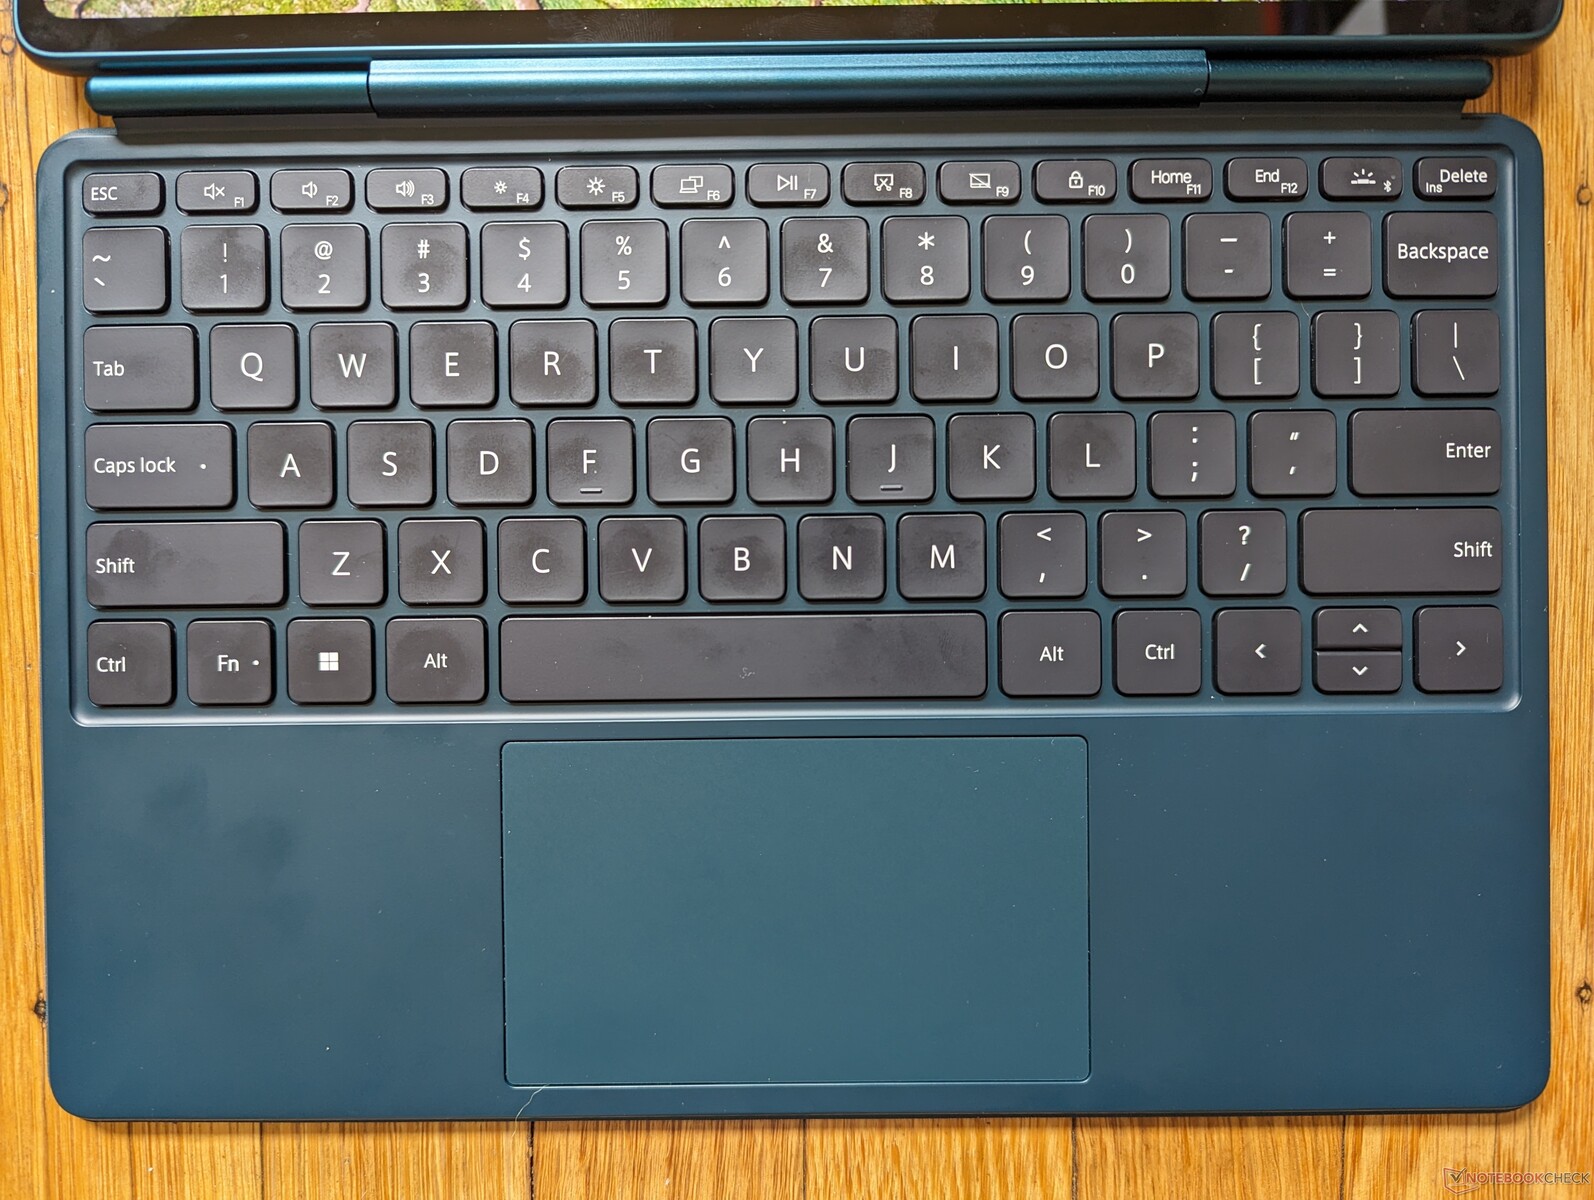
Abnehmbare Tastaturen bei Convertibles oder anderen Geräten sind meist dafür bekannt, eher schlecht als recht zu sein. Die Lösung beim TW220 ist dem Hersteller aber ziemlich gut gelungen. Das Tasten-Feedback fühlt sich gut an, und der Tastendruck ist mit 1,3 mm auch standardmäßig. Leider wirken die Tasten aber trotzdem ziemlich steif in der Benutzung, weshalb teilweise etwas mehr Druck notwendig ist.
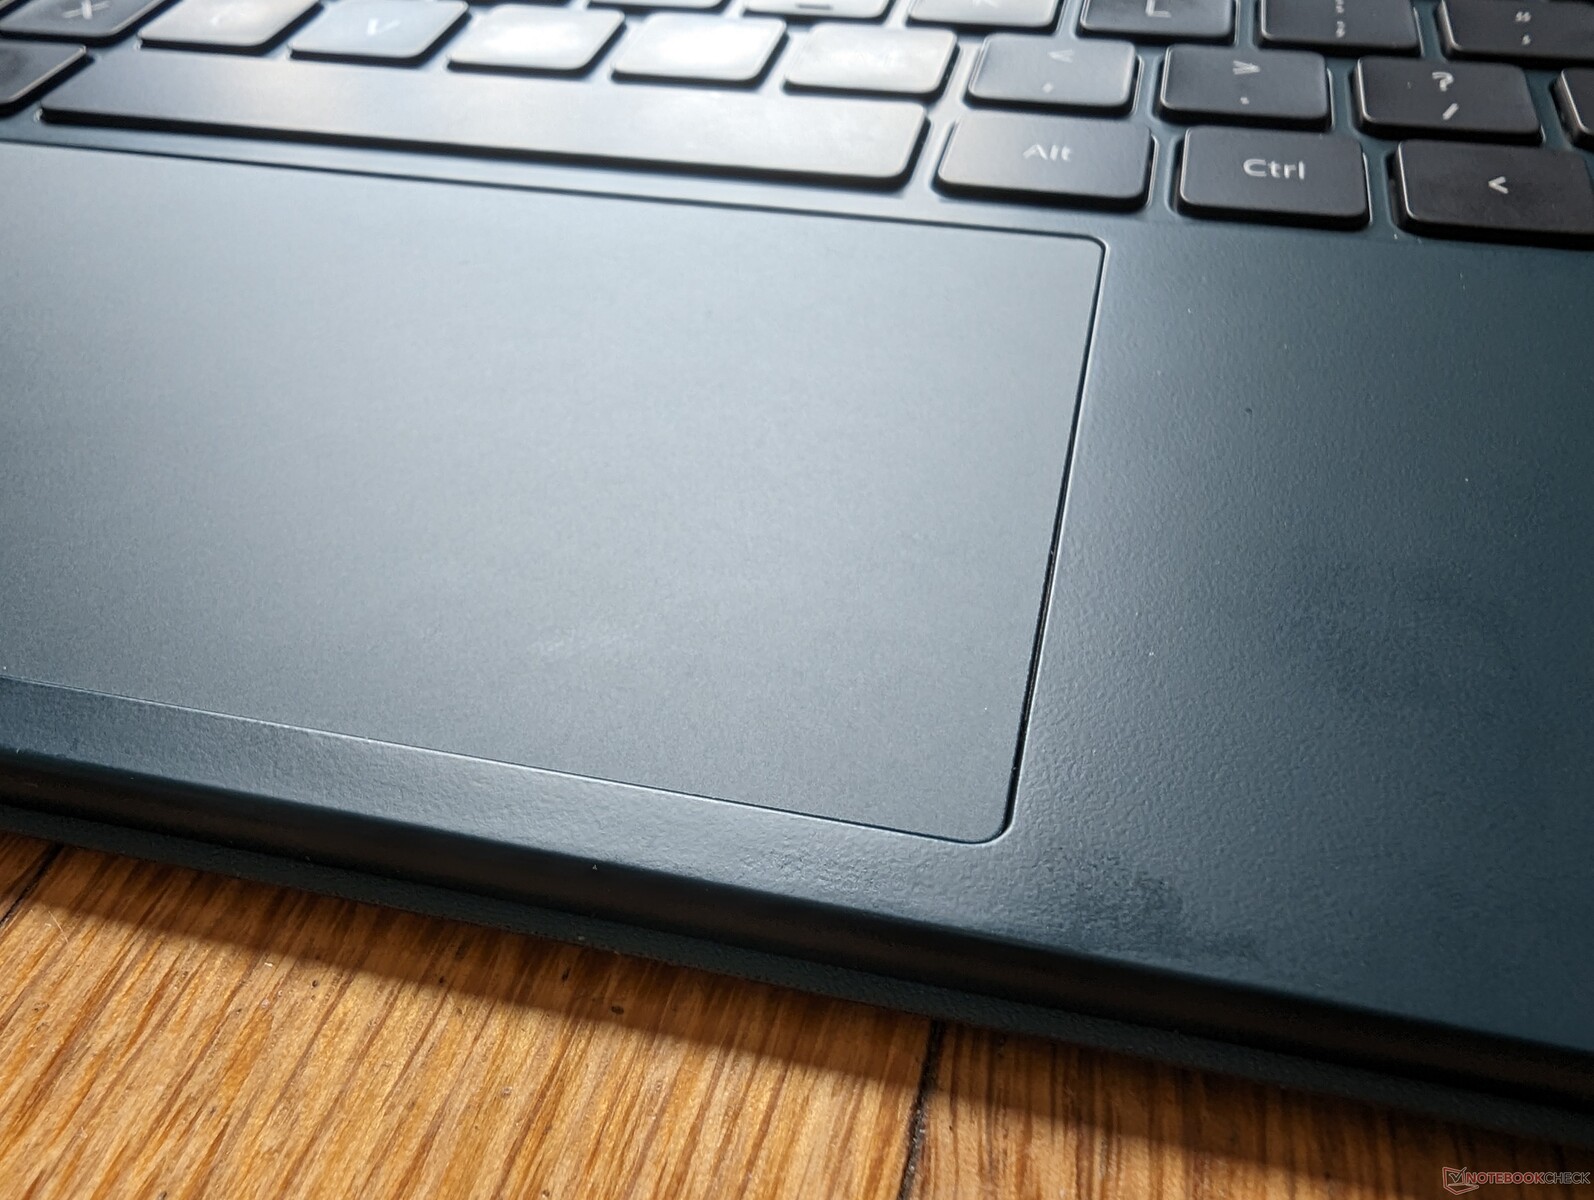
Touchpad
Das Clickpad ist mit seinen 11 x 6,5 cm größer geworden als jenes beim Surface Pro (10,2 x 5,8 cm). Es besitzt grundsätzlich einen ziemlich kurzen Druckpunkt, fühlt sich aber an jeder Stelle einheitlich an. Das Geräusch beim Drücken ist uns aber dann doch etwas zu laut.
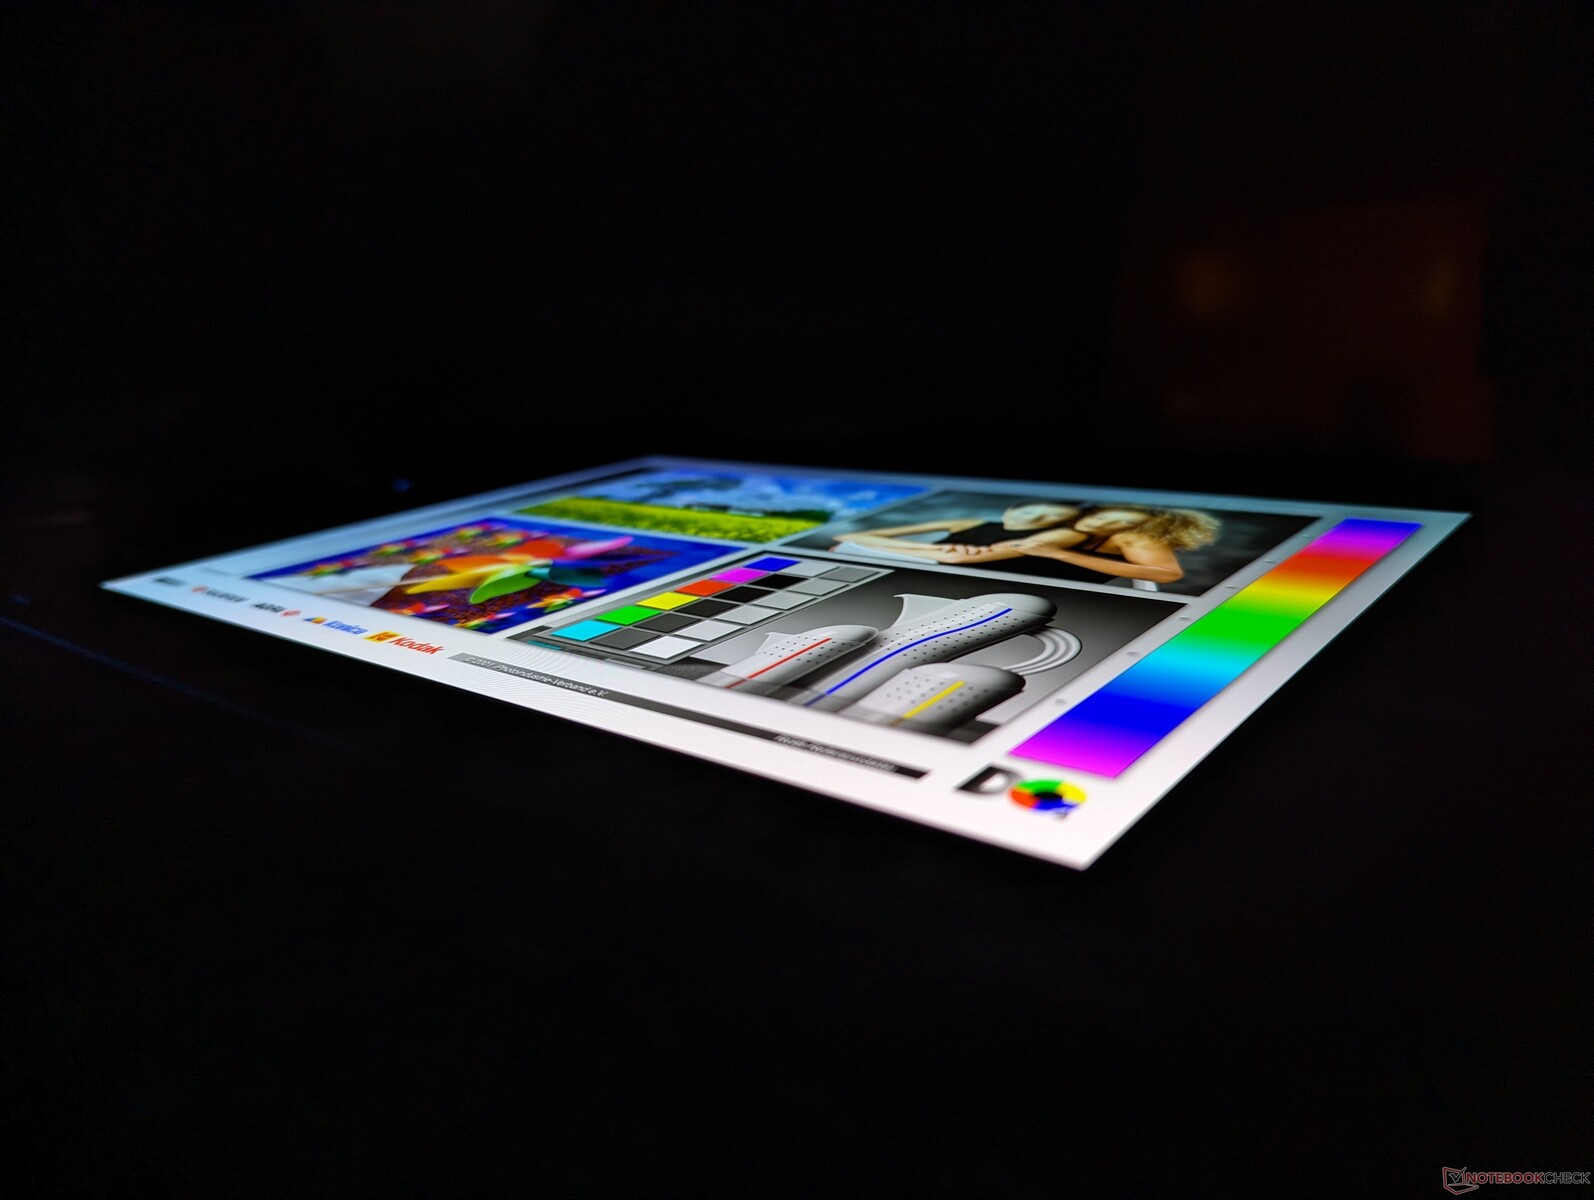
Display — OLED

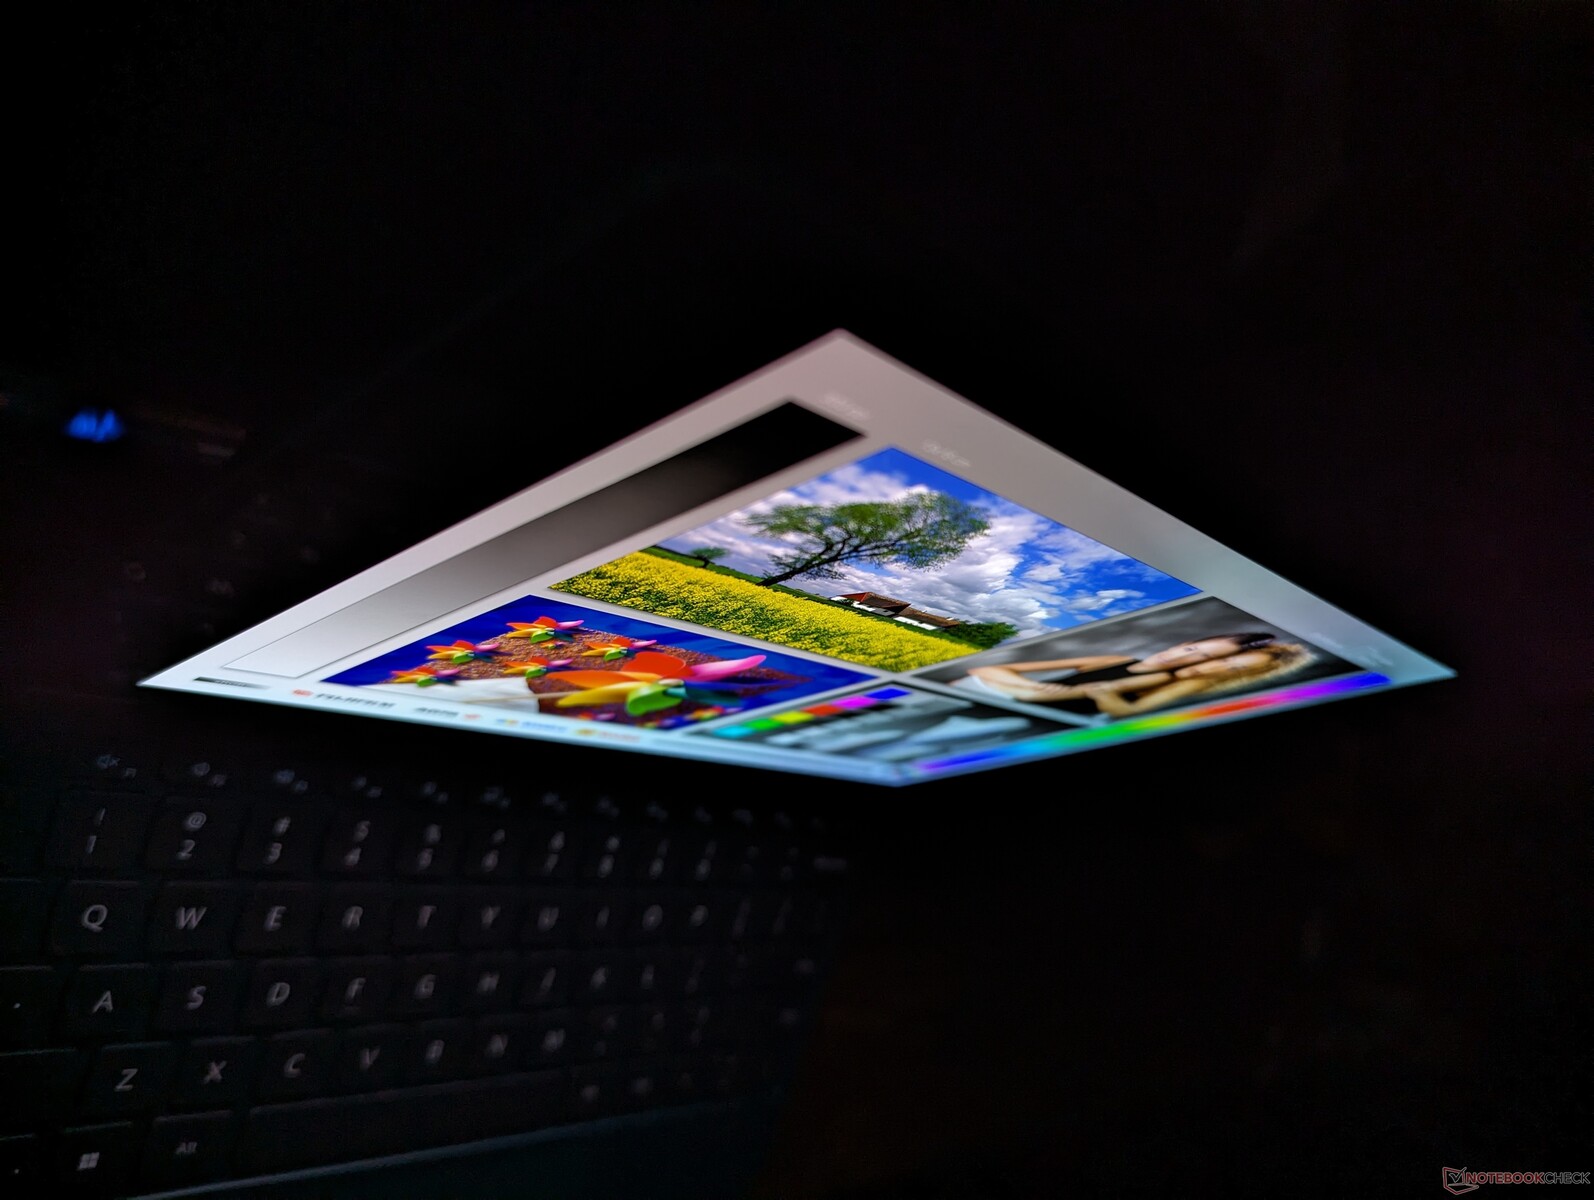
Das TW220 kann aufgrund seines Sharp-RM69380-OLED-Panels alle Inhalte klar und scharf darstellen und bietet auch diverse Vorteile gegenüber einem IPS-Panel, so wie man sie meist bei der Konkurrenz findet. So besitzen OLEDs deutlich schnellere Schwarz-Weiß-Reaktionszeiten, um ein Ghosting zu verhindern, tiefere Schwarzwerte, ein weiteres Farbspektrum und eine bessere Helligkeit.
| |||||||||||||||||||||||||
Ausleuchtung: 92 %
Helligkeit Akku: 568.7 cd/m²
Kontrast: ∞:1 (Schwarzwert: 0 cd/m²)
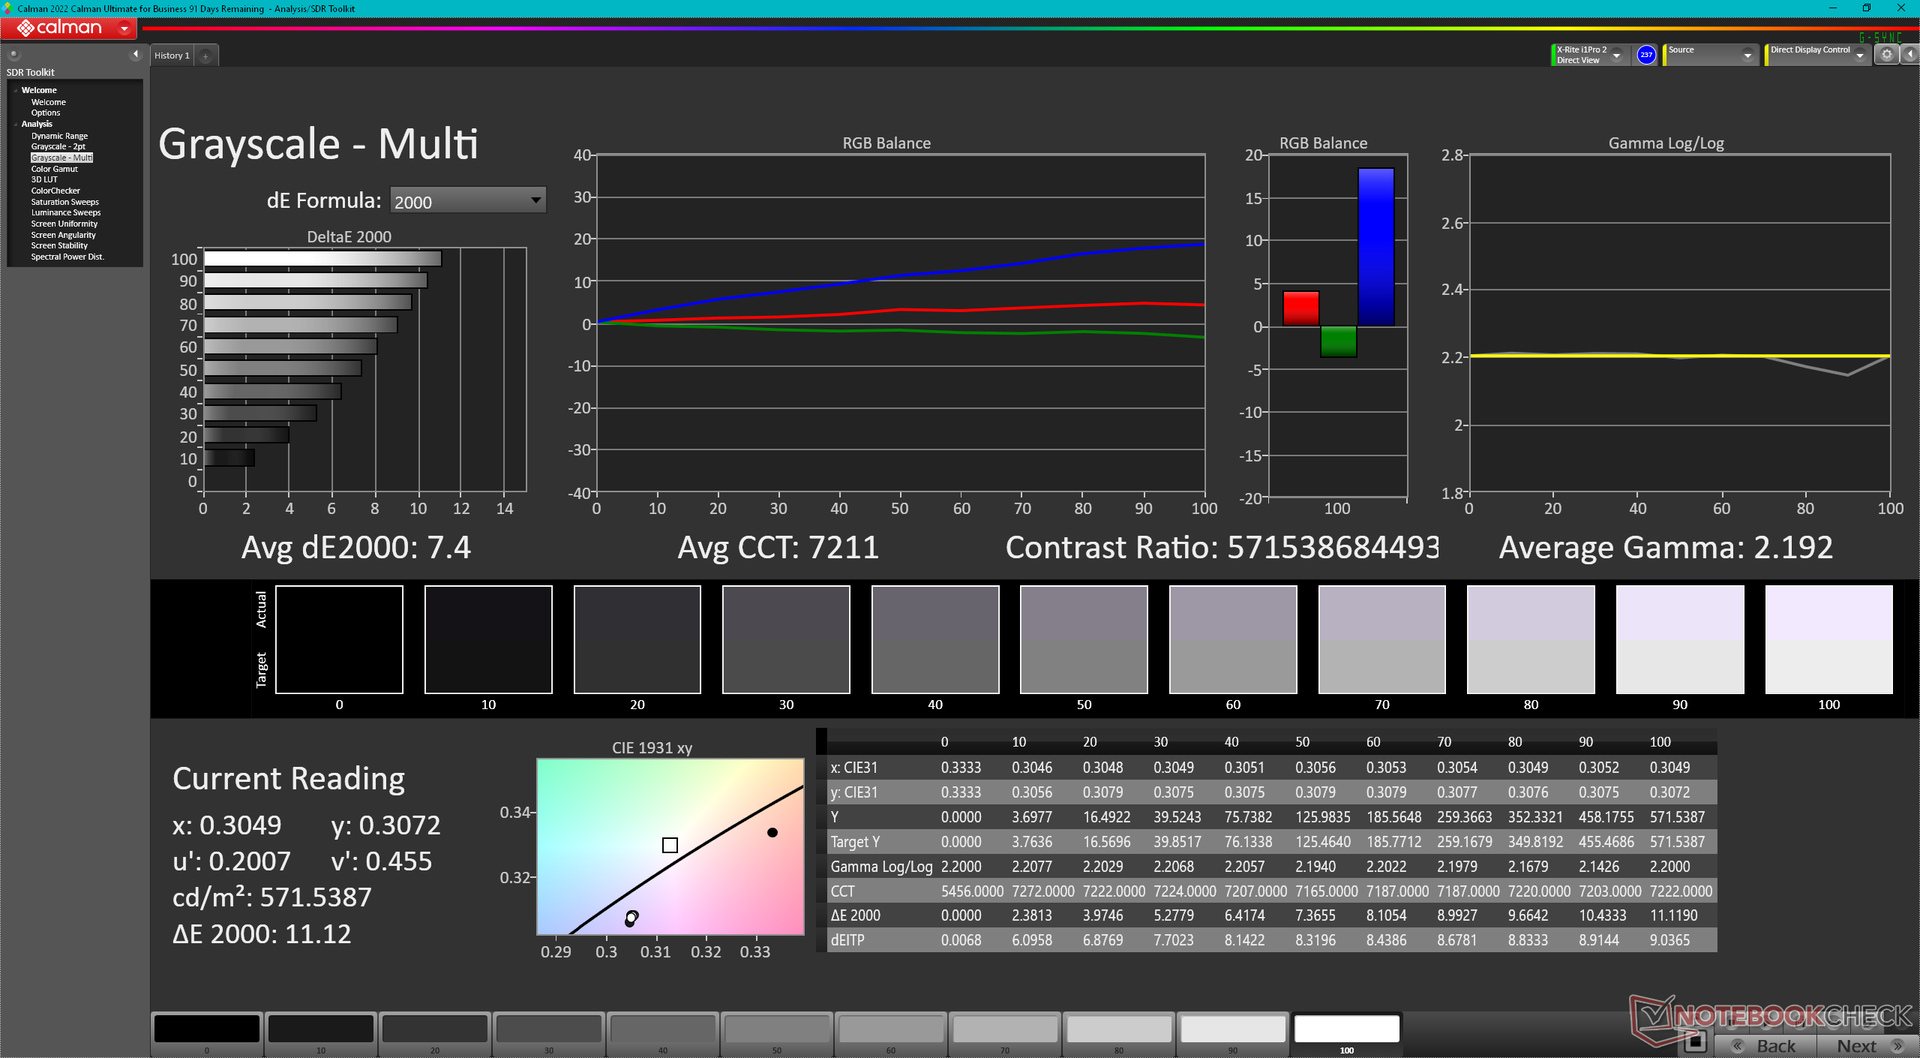
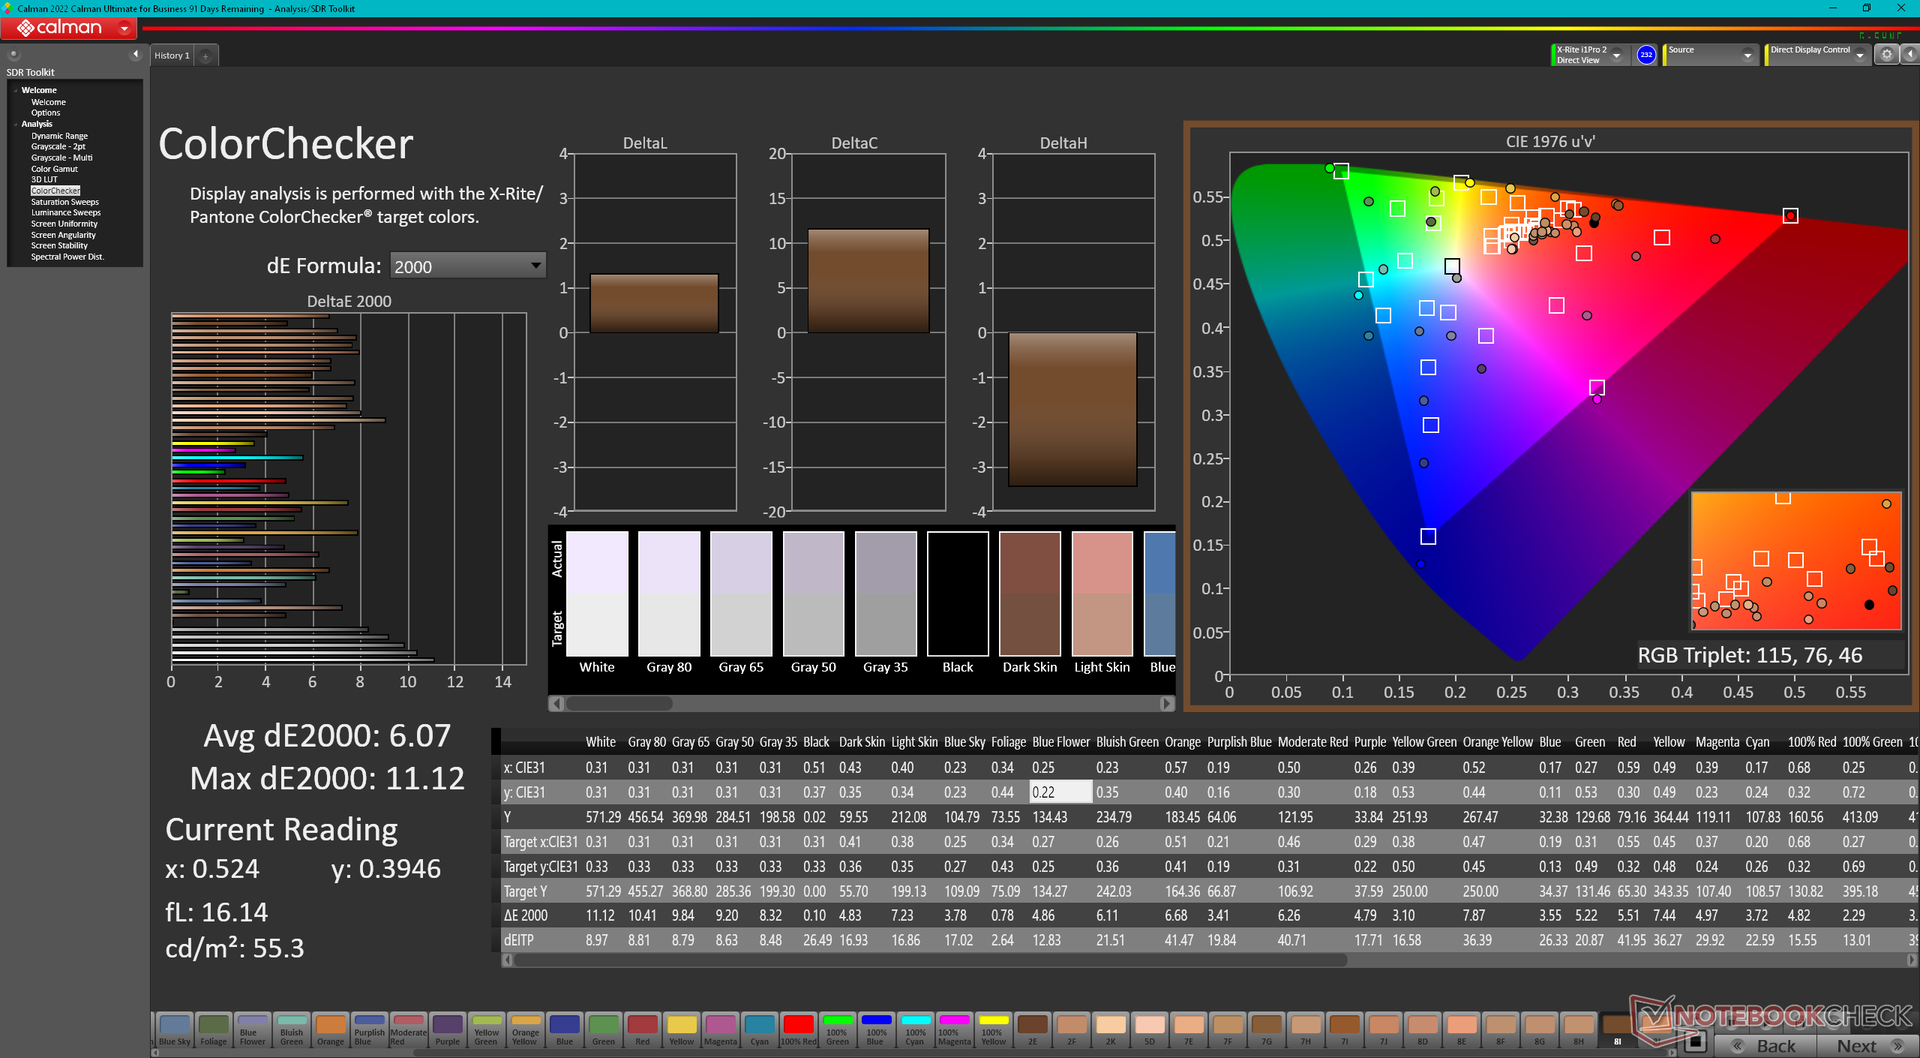
ΔE ColorChecker Calman: 6.07 | ∀{0.5-29.43 Ø4.73}
ΔE Greyscale Calman: 7.4 | ∀{0.09-98 Ø4.97}
Gamma: 2.19
CCT: 7211 K
| Robo and Kala TW220 2-in-1 Sharp RM69380, AMOLED, 2560x1600, 12.6" | Microsoft Surface Pro 9, i7-1255U LP129WT2-SPA6, IPS, 2880x1920, 13" | Microsoft Surface Go 3 Core i3 NV105WAM-N31, IPS , 1920x1280, 10.5" | Apple iPad 10 Liquid Retina, IPS, 2360x1640, 10.9" | Apple iPad Pro 11 2022 IPS, 2388x1668, 11" | |
|---|---|---|---|---|---|
| Display | |||||
| Display P3 Coverage (%) | 65.6 | 69 | |||
| sRGB Coverage (%) | 97.7 | 99.1 | |||
| AdobeRGB 1998 Coverage (%) | 67.7 | 69.8 | |||
| Response Times | -647% | -1234% | -1336% | -1360% | |
| Response Time Grey 50% / Grey 80% * (ms) | 2.4 ? | 13 ? -442% | 37.2 ? -1450% | 42.68 ? -1678% | 43 ? -1692% |
| Response Time Black / White * (ms) | 2.04 ? | 19.4 ? -851% | 22.8 ? -1018% | 22.31 ? -994% | 23 ? -1027% |
| PWM Frequency (Hz) | 60.6 ? | 29896 ? | 962 ? | ||
| Bildschirm | 30% | 30% | 30% | 38% | |
| Helligkeit Bildmitte (cd/m²) | 568.7 | 455 -20% | 418 -26% | 467 -18% | 620 9% |
| Brightness (cd/m²) | 573 | 453 -21% | 415 -28% | 468 -18% | 611 7% |
| Brightness Distribution (%) | 92 | 94 2% | 90 -2% | 92 0% | 93 1% |
| Schwarzwert * (cd/m²) | 0.38 | 0.28 | 0.49 | 0.37 | |
| Delta E Colorchecker * | 6.07 | 1.7 72% | 1.2 80% | 1.4 77% | 1.49 75% |
| Colorchecker dE 2000 max. * | 11.12 | 3.8 66% | 2.6 77% | 3.3 70% | 3.67 67% |
| Delta E Graustufen * | 7.4 | 1.5 80% | 1.8 76% | 2.3 69% | 2.3 69% |
| Gamma | 2.19 100% | 2.17 101% | 2.21 100% | 2.21 100% | 2.211 100% |
| CCT | 7211 90% | 6761 96% | 6225 104% | 6852 95% | 6849 95% |
| Kontrast (:1) | 1197 | 1493 | 953 | 1676 | |
| Colorchecker dE 2000 calibrated * | 1.5 | 1 | |||
| Durchschnitt gesamt (Programm / Settings) | -309% /
-139% | -602% /
-286% | -653% /
-312% | -661% /
-311% |
* ... kleinere Werte sind besser
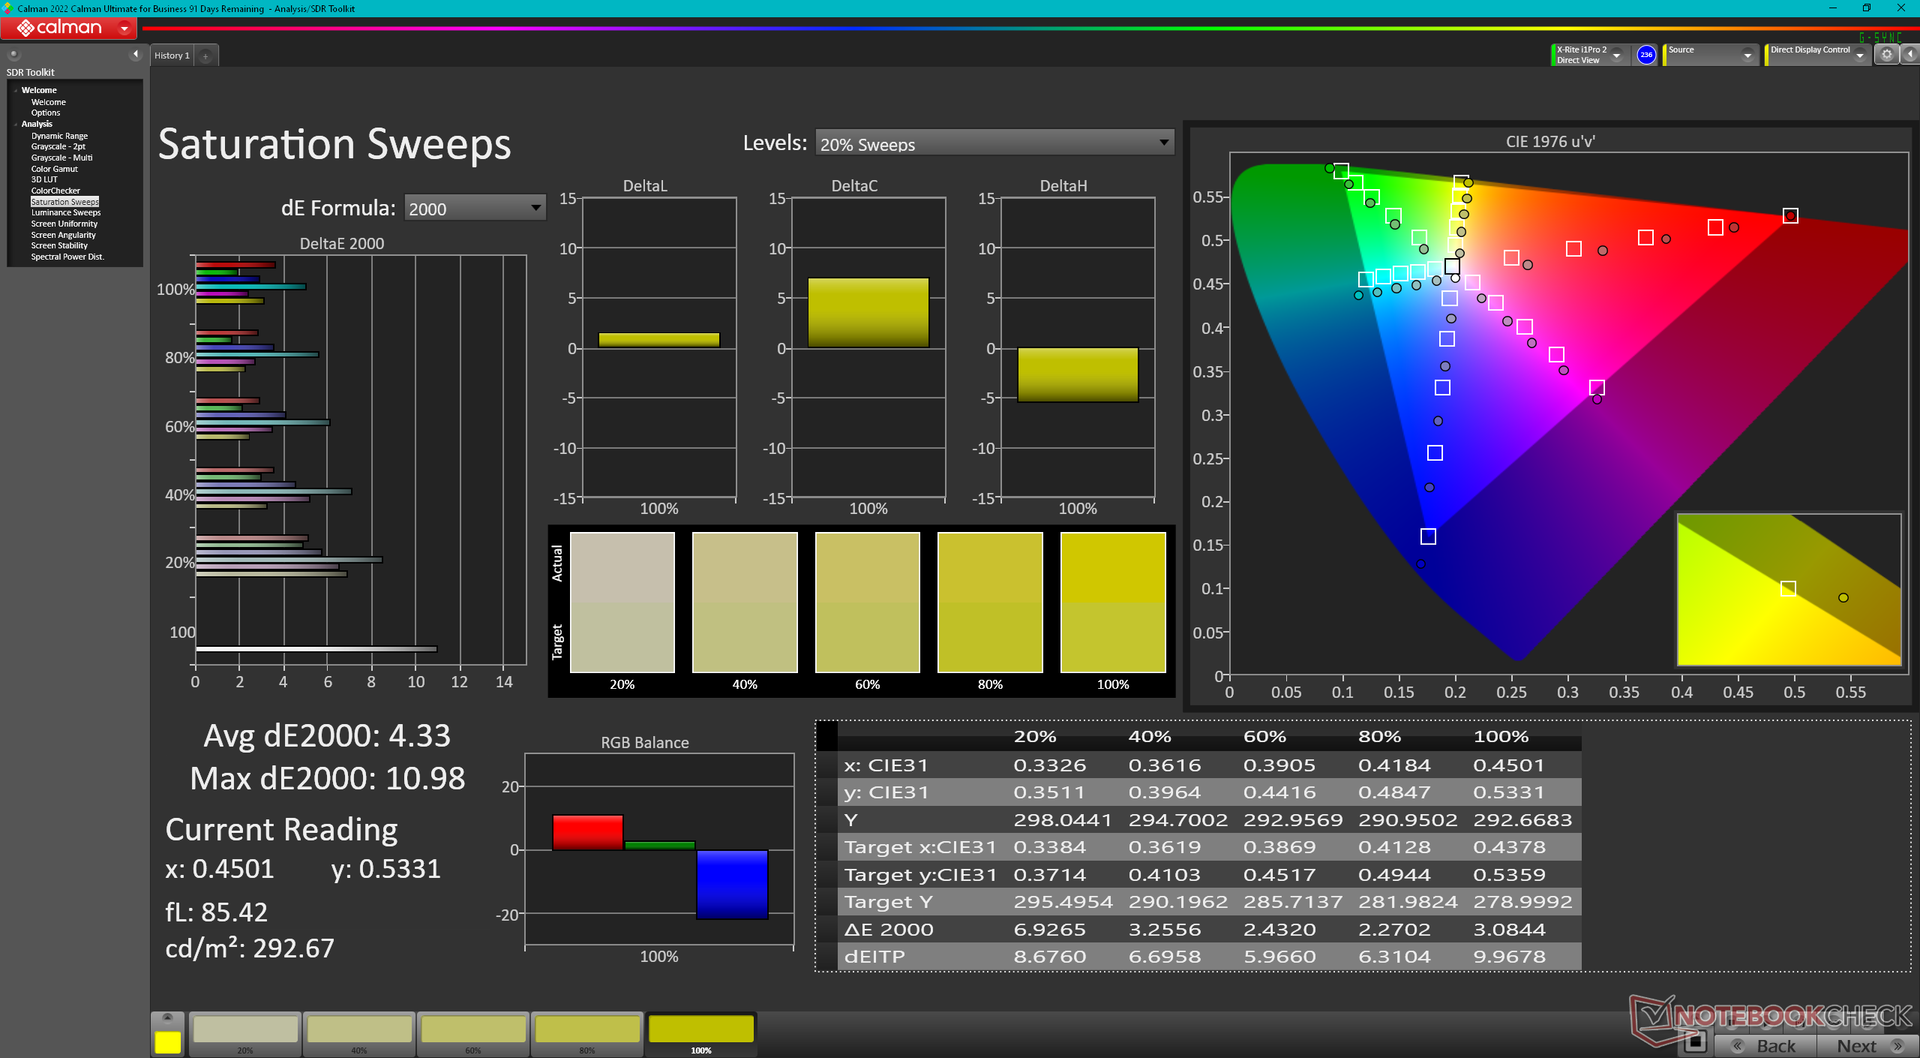
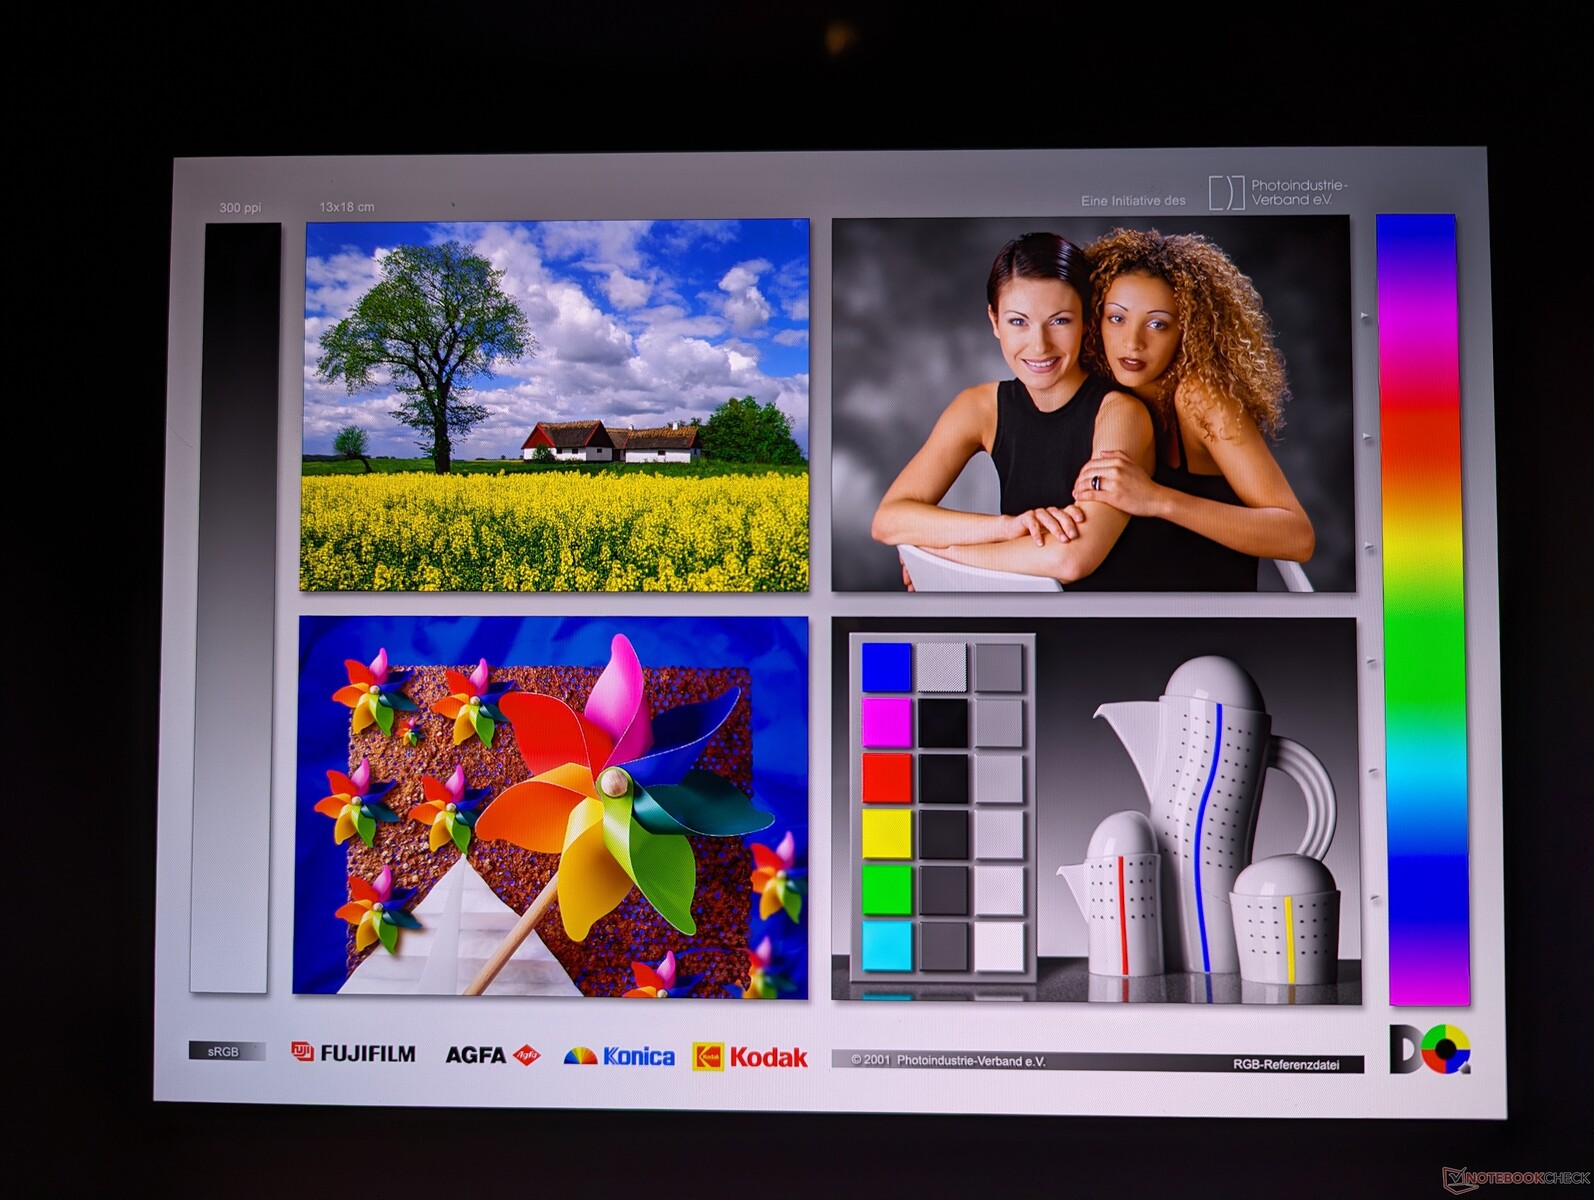
Obwohl das TW220 ein High-End-OLED-Display besitzt, ist es ab Werk nicht kalibriert. Grundsätzlich bietet es P3-Farben, diese sind aber recht kalt, weshalb die Farben bei niedrigerer Sättigung ziemlich stark verfälscht werden. Dies kann man auch unten in der Grafik erkennen.
Reaktionszeiten (Response Times) des Displays
| ↔ Reaktionszeiten Schwarz zu Weiß | ||
|---|---|---|
| 2.04 ms ... steigend ↗ und fallend ↘ kombiniert | ↗ 0.84 ms steigend | 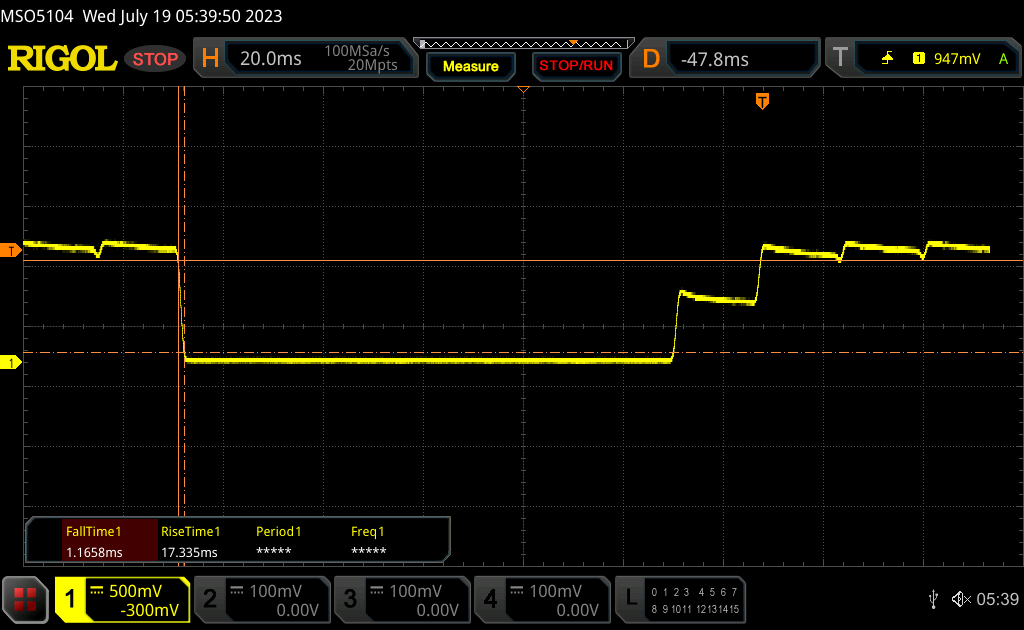 |
| ↘ 1.2 ms fallend | ||
| Die gemessenen Reaktionszeiten sind sehr kurz, wodurch sich der Bildschirm auch für schnelle 3D Spiele eignen sollte. Im Vergleich rangierten die bei uns getesteten Geräte von 0.1 (Minimum) zu 240 (Maximum) ms. » 12 % aller Screens waren schneller als der getestete. Daher sind die gemessenen Reaktionszeiten besser als der Durchschnitt aller vermessenen Geräte (19.9 ms). | ||
| ↔ Reaktionszeiten 50% Grau zu 80% Grau | ||
| 2.4 ms ... steigend ↗ und fallend ↘ kombiniert | ↗ 1.2 ms steigend | 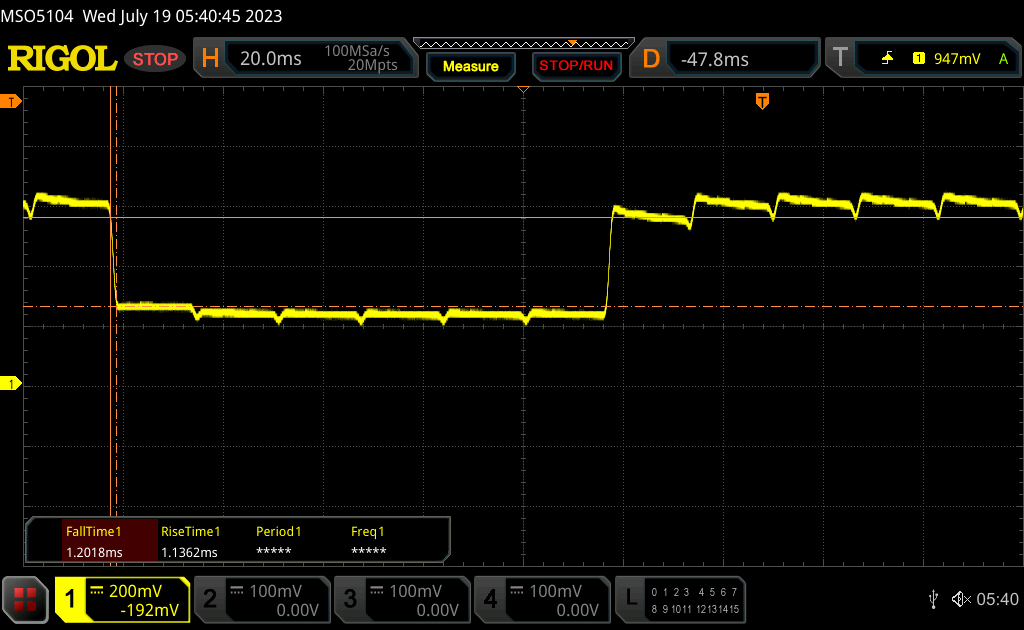 |
| ↘ 1.2 ms fallend | ||
| Die gemessenen Reaktionszeiten sind sehr kurz, wodurch sich der Bildschirm auch für schnelle 3D Spiele eignen sollte. Im Vergleich rangierten die bei uns getesteten Geräte von 0.165 (Minimum) zu 636 (Maximum) ms. » 11 % aller Screens waren schneller als der getestete. Daher sind die gemessenen Reaktionszeiten besser als der Durchschnitt aller vermessenen Geräte (31.1 ms). | ||
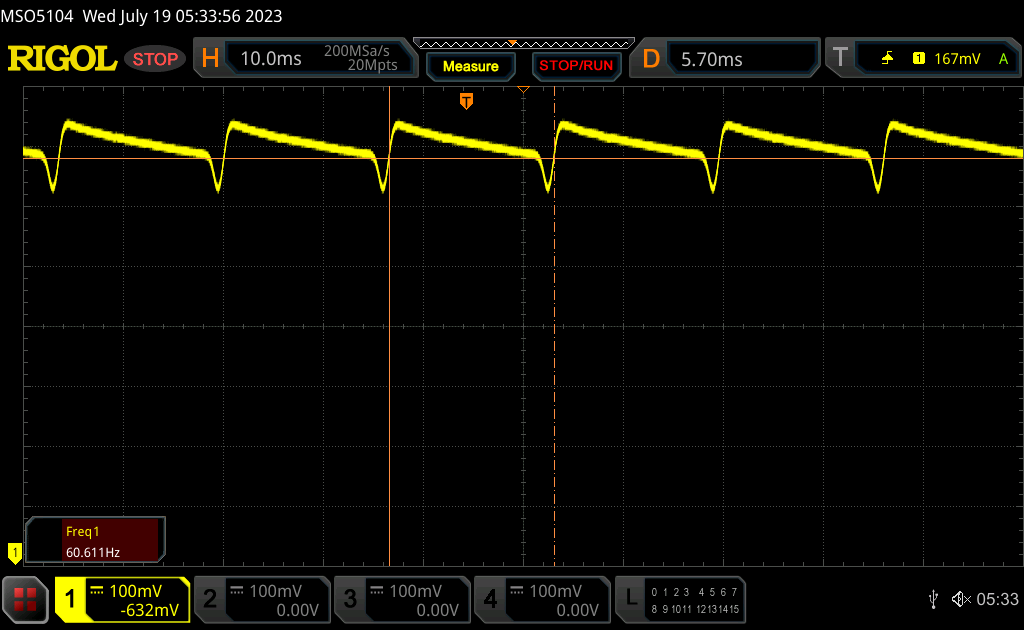
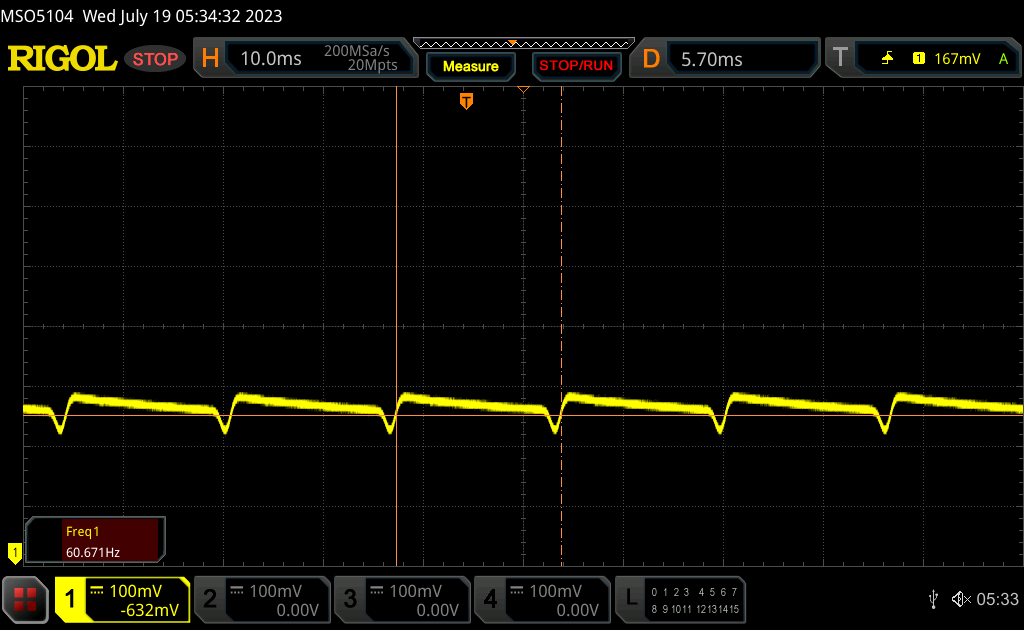
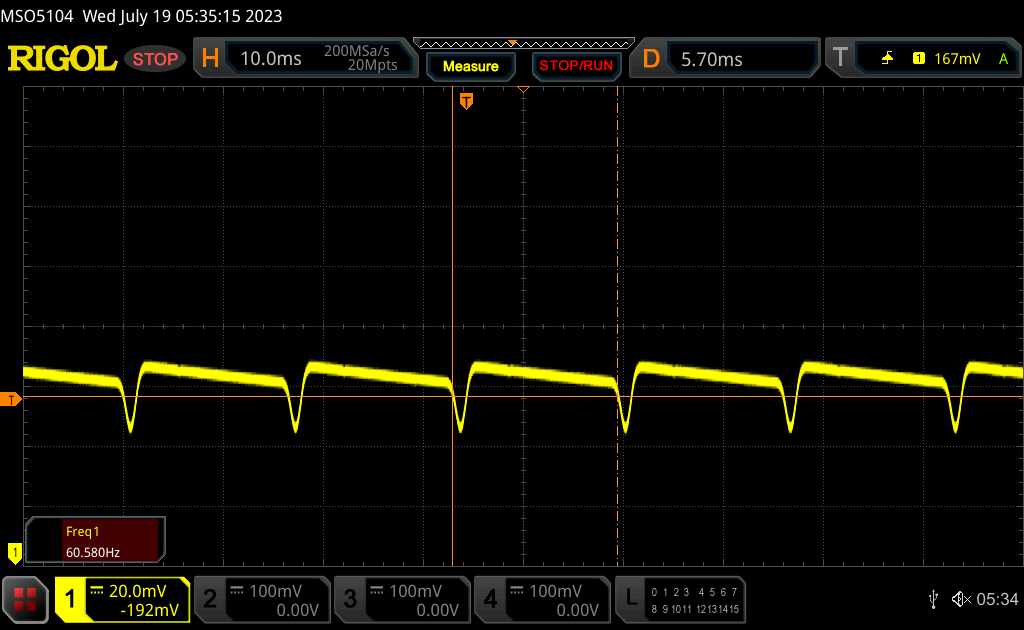
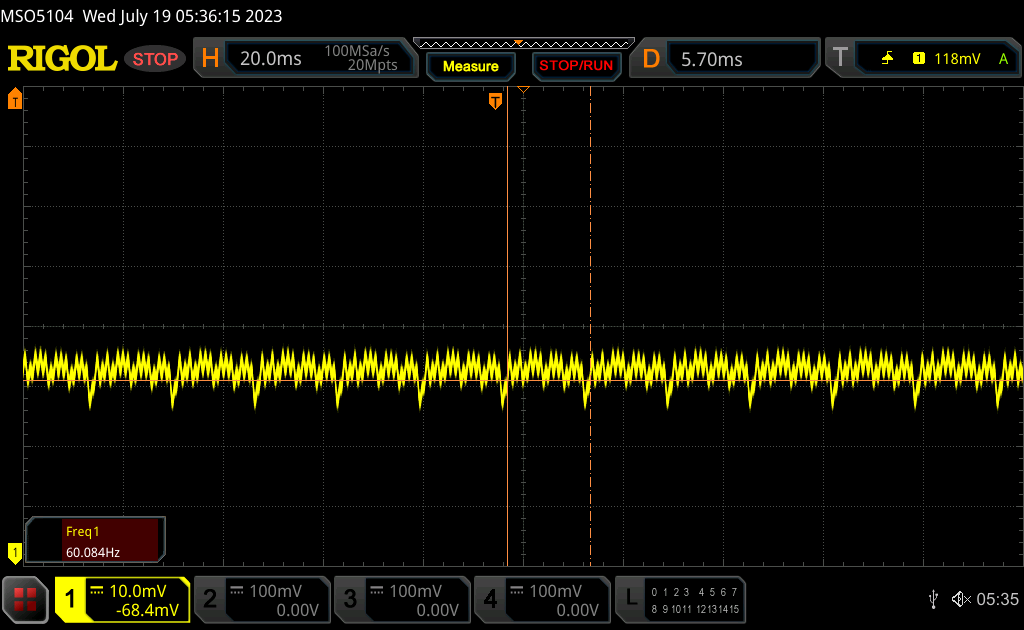
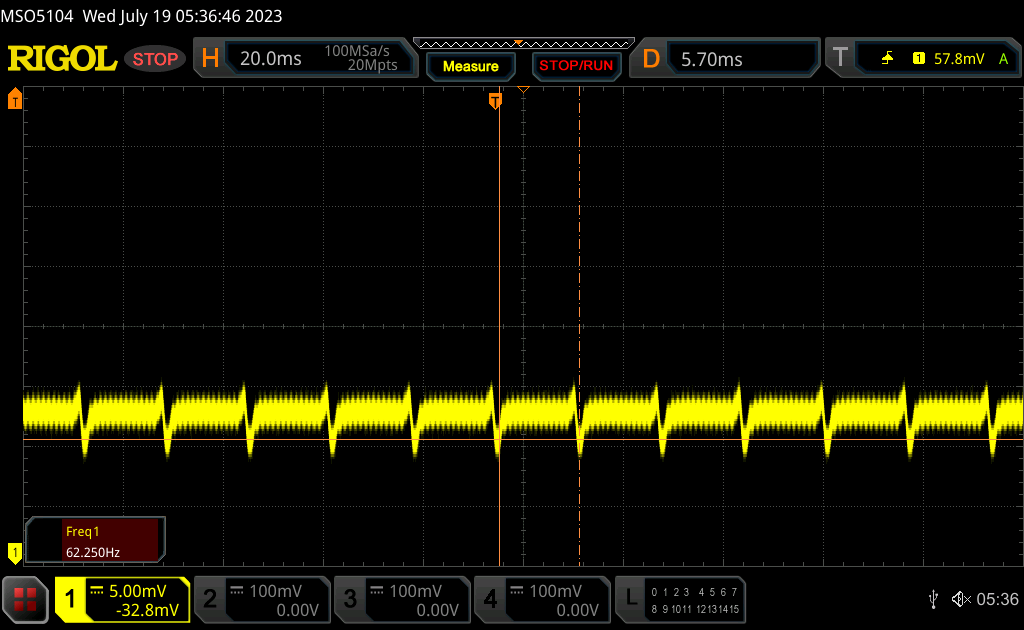
Bildschirm-Flackern / PWM (Pulse-Width Modulation)
| Flackern / PWM festgestellt | 60.6 Hz | ≤ 100 % Helligkeit |  |
Das Display flackert mit 60.6 Hz (im schlimmsten Fall, eventuell durch Pulsweitenmodulation PWM) bei einer eingestellten Helligkeit von 100 % und darunter. Darüber sollte es zu keinem Flackern kommen. Die Frequenz von 60.6 Hz ist sehr gering und daher kann es bei allen Usern zu sichtbaren Flackern, brennenden Augen oder Kopfweh kommen. Im Vergleich: 52 % aller getesteten Geräte nutzten kein PWM um die Helligkeit zu reduzieren. Wenn PWM eingesetzt wurde, dann bei einer Frequenz von durchschnittlich 7798 (Minimum 5, Maximum 343500) Hz. | |||
Leider konnten wir bei jeglichen Helligkeitsstufen ein Flackern feststellen, auch bei 100 Prozent. Dies passiert bei 60 Hz, wie es auch bei den meisten anderen Tablet, Laptops etc. mit OLED-Panels der Fall ist.
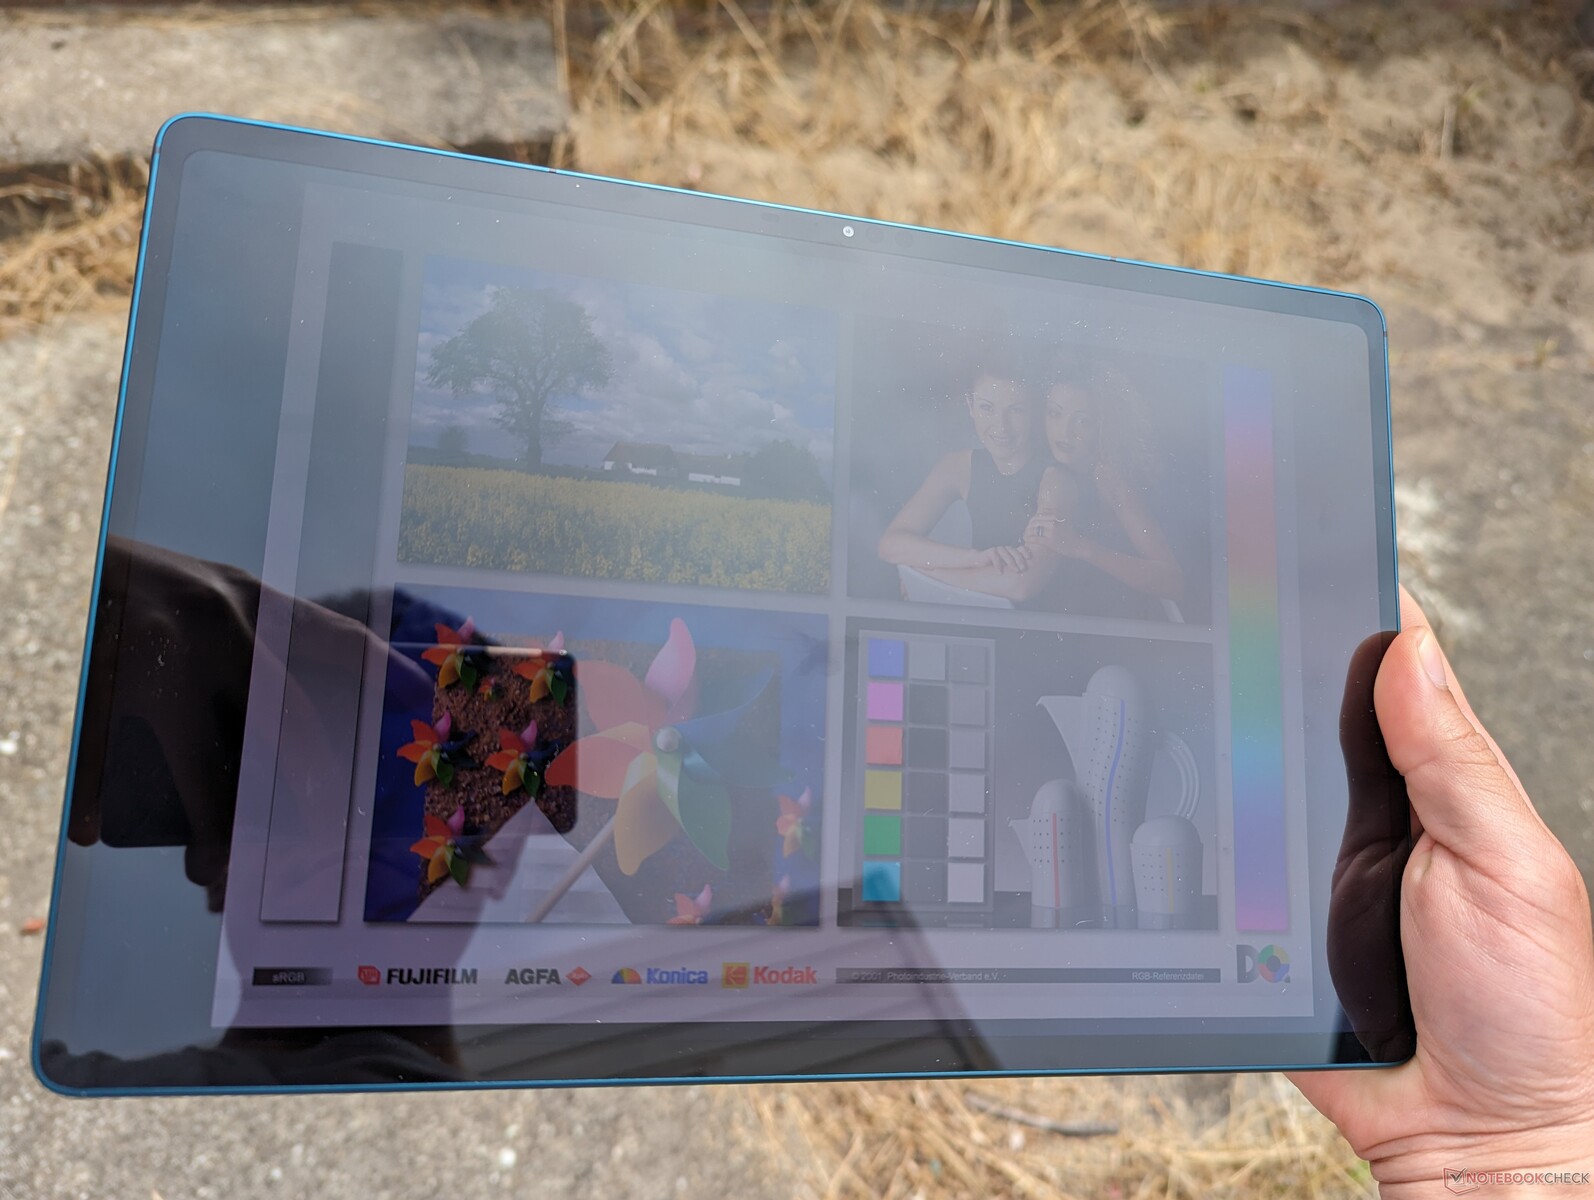
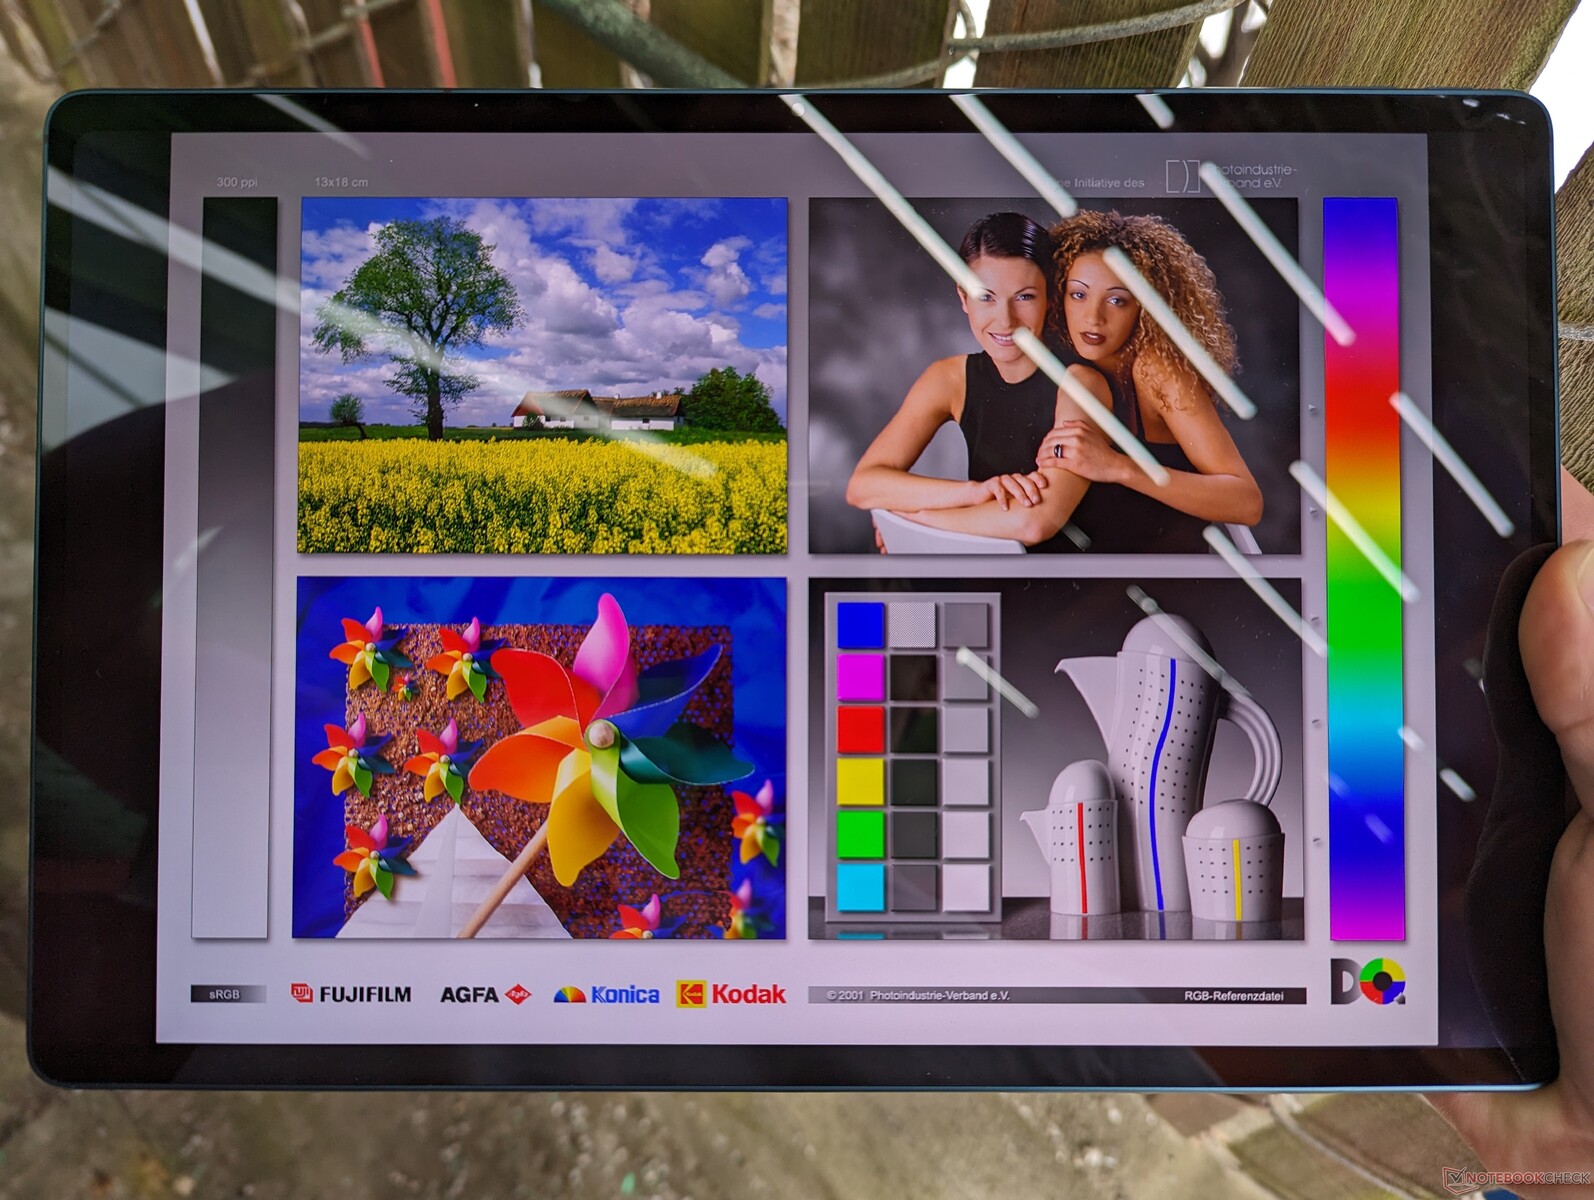
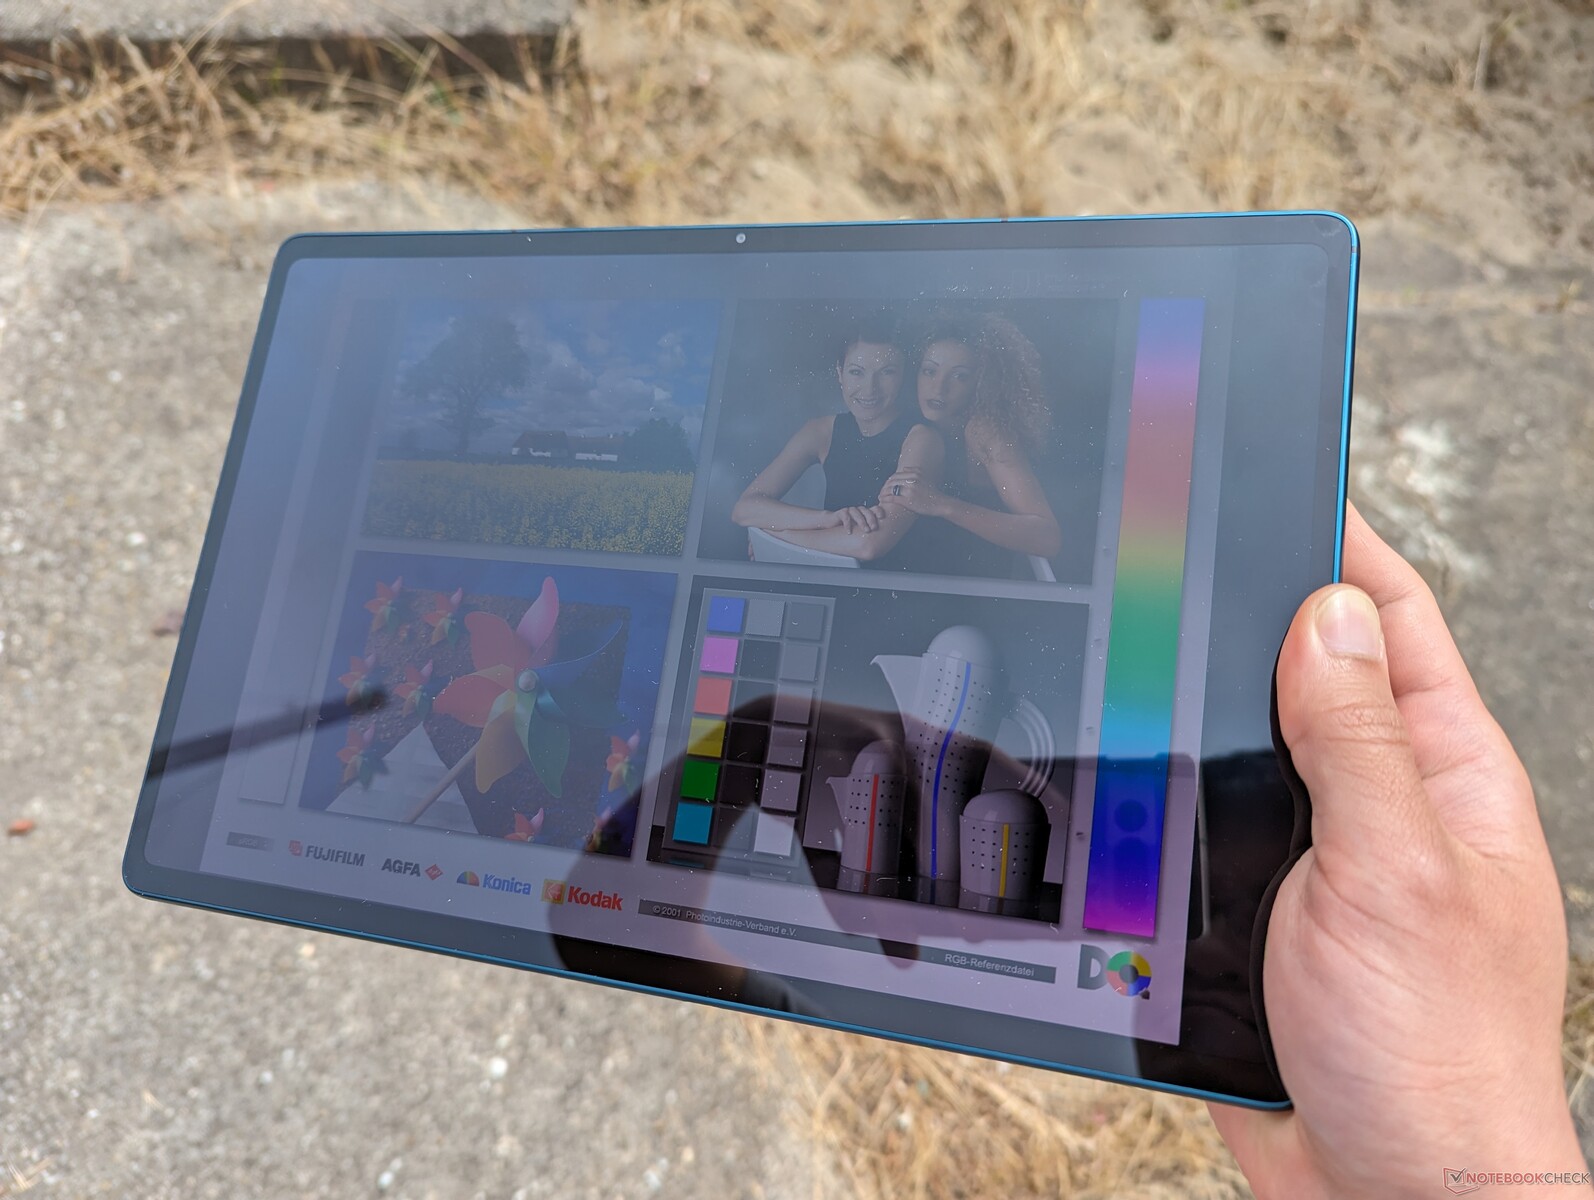
Das Display des Tablets wird im Verlgeich zum Surface Pro 9 oder zum Surface Go 3 um ca. 25 bis 35 Prozent heller. Nichtsdestotrotz ist es ratsam, das Gerät eher im Schatten zu nutzen, da man ansonsten mit ziemlich starken Spiegelungen und Farbverlust zu kämpfen hat.
Performance — Schneller als der i3 im Multi-Thread
Testszenario
Wir haben jegliche Benchmarks mit aktiviertem Performance-Modus durchgeführt. Hier ist aber hinzuzufügen, dass es deutliche Probleme mit Windows ARM und den Benchmark-Softwares gegeben hat. LatencyMon, PCMark 10, 3DMark, i1Profiler, BaseMark, Geekbench 5.4, GPUScore Sacred Path, 3DMark 06, HWiNFO und diverse Windows-Batch-Files sind nur einige Beispiele, was uns Probleme bereitet hat.
Prozessor
Die reine Multi-Thread-Performance ist im Vergleich zum mittlerweile drei Jahre alten i5-1035G1 merkbar besser, beim Single-Thread ist es aber genau anders herum. Stark fordernde Aufgaben wie 4K-Rendering beispielsweise sind hier langsamer, weshalb Nutzer mit solch hohen Ansprüchen eher zu einem Microsoft Surface Pro mit einem i7 greifen sollten. Trotzdem ist der Snapdragon 8cx Gen 3 leistungsfähiger als die ältere m3-Serie im Surface Go 2.
In unserem Prime95 Test konnten wir eine maximale Taktrate von 2,7 GHz messen, welche sich für ein paar Sekunden halten konnte. Anschließend pendelt sie sich bei 2,1 GHz ein.
Cinebench R15 Multi Loop
Cinebench R23: Multi Core | Single Core
Cinebench R20: CPU (Multi Core) | CPU (Single Core)
Cinebench R15: CPU Multi 64Bit | CPU Single 64Bit
Blender: v2.79 BMW27 CPU
7-Zip 18.03: 7z b 4 | 7z b 4 -mmt1
HWBOT x265 Benchmark v2.2: 4k Preset
LibreOffice : 20 Documents To PDF
R Benchmark 2.5: Overall mean
| CPU Performance Rating | |
| Microsoft Surface Pro 9, i7-1255U | |
| Microsoft Surface Laptop 4 13 Ryzen 5 | |
| Microsoft Surface Pro 7 Plus | |
| Microsoft Surface Laptop Go 2 Core i5 | |
| Microsoft Surface Pro 6, Core i5, 128 GB -6! | |
| Microsoft Surface Laptop Go Core i5 -2! | |
| Microsoft Surface Pro 9, ARM | |
| Robo and Kala TW220 2-in-1 | |
| Durchschnittliche Qualcomm Snapdragon 8cx Gen 3 | |
| Microsoft Surface Go 2, m3-8100Y -2! | |
| Microsoft Surface Go 3 Core i3 | |
| Microsoft Surface Go MHN-00003 -9! | |
| Cinebench R23 / Multi Core | |
| Microsoft Surface Pro 9, i7-1255U | |
| Microsoft Surface Laptop 4 13 Ryzen 5 | |
| Microsoft Surface Pro 7 Plus | |
| Microsoft Surface Laptop Go 2 Core i5 | |
| Robo and Kala TW220 2-in-1 | |
| Durchschnittliche Qualcomm Snapdragon 8cx Gen 3 (3534 - 3709, n=3) | |
| Microsoft Surface Pro 9, ARM | |
| Microsoft Surface Go 3 Core i3 | |
| Cinebench R23 / Single Core | |
| Microsoft Surface Pro 9, i7-1255U | |
| Microsoft Surface Laptop Go 2 Core i5 | |
| Microsoft Surface Pro 7 Plus | |
| Microsoft Surface Laptop 4 13 Ryzen 5 | |
| Microsoft Surface Go 3 Core i3 | |
| Microsoft Surface Pro 9, ARM | |
| Durchschnittliche Qualcomm Snapdragon 8cx Gen 3 (559 - 608, n=3) | |
| Robo and Kala TW220 2-in-1 | |
| Cinebench R20 / CPU (Multi Core) | |
| Microsoft Surface Pro 9, i7-1255U | |
| Microsoft Surface Laptop 4 13 Ryzen 5 | |
| Microsoft Surface Pro 7 Plus | |
| Microsoft Surface Laptop Go 2 Core i5 | |
| Robo and Kala TW220 2-in-1 | |
| Microsoft Surface Pro 9, ARM | |
| Microsoft Surface Laptop Go Core i5 | |
| Durchschnittliche Qualcomm Snapdragon 8cx Gen 3 (810 - 1258, n=3) | |
| Microsoft Surface Go 3 Core i3 | |
| Microsoft Surface Go 2, m3-8100Y | |
| Cinebench R20 / CPU (Single Core) | |
| Microsoft Surface Pro 9, i7-1255U | |
| Microsoft Surface Laptop Go 2 Core i5 | |
| Microsoft Surface Pro 7 Plus | |
| Microsoft Surface Laptop 4 13 Ryzen 5 | |
| Microsoft Surface Laptop Go Core i5 | |
| Microsoft Surface Go 3 Core i3 | |
| Microsoft Surface Go 2, m3-8100Y | |
| Durchschnittliche Qualcomm Snapdragon 8cx Gen 3 (199 - 222, n=3) | |
| Robo and Kala TW220 2-in-1 | |
| Microsoft Surface Pro 9, ARM | |
| LibreOffice / 20 Documents To PDF | |
| Microsoft Surface Pro 9, ARM | |
| Microsoft Surface Go 3 Core i3 | |
| Durchschnittliche Qualcomm Snapdragon 8cx Gen 3 (115.5 - 121.5, n=3) | |
| Robo and Kala TW220 2-in-1 | |
| Microsoft Surface Go 2, m3-8100Y | |
| Microsoft Surface Laptop 4 13 Ryzen 5 | |
| Microsoft Surface Laptop Go Core i5 | |
| Microsoft Surface Laptop Go 2 Core i5 | |
| Microsoft Surface Pro 7 Plus | |
| Microsoft Surface Pro 9, i7-1255U | |
| R Benchmark 2.5 / Overall mean | |
| Microsoft Surface Pro 9, ARM | |
| Robo and Kala TW220 2-in-1 | |
| Durchschnittliche Qualcomm Snapdragon 8cx Gen 3 (1.011 - 1.013, n=3) | |
| Microsoft Surface Go 3 Core i3 | |
| Microsoft Surface Go 2, m3-8100Y | |
| Microsoft Surface Laptop Go Core i5 | |
| Microsoft Surface Pro 7 Plus | |
| Microsoft Surface Laptop 4 13 Ryzen 5 | |
| Microsoft Surface Laptop Go 2 Core i5 | |
| Microsoft Surface Pro 9, i7-1255U | |
Cinebench R23: Multi Core | Single Core
Cinebench R20: CPU (Multi Core) | CPU (Single Core)
Cinebench R15: CPU Multi 64Bit | CPU Single 64Bit
Blender: v2.79 BMW27 CPU
7-Zip 18.03: 7z b 4 | 7z b 4 -mmt1
HWBOT x265 Benchmark v2.2: 4k Preset
LibreOffice : 20 Documents To PDF
R Benchmark 2.5: Overall mean
* ... kleinere Werte sind besser
AIDA64: FP32 Ray-Trace | FPU Julia | CPU SHA3 | CPU Queen | FPU SinJulia | FPU Mandel | CPU AES | CPU ZLib | FP64 Ray-Trace | CPU PhotoWorxx
| Performance Rating | |
| Microsoft Surface Laptop 4 13 Ryzen 5 | |
| Microsoft Surface Pro 9, i7-1255U | |
| Microsoft Surface Pro 7 Plus | |
| Microsoft Surface Laptop Go 2 Core i5 | |
| Microsoft Surface Pro 9, ARM | |
| Robo and Kala TW220 2-in-1 | |
| Durchschnittliche Qualcomm Snapdragon 8cx Gen 3 | |
| Microsoft Surface Go 2, m3-8100Y | |
| Microsoft Surface Go 3 Core i3 -9! | |
| AIDA64 / FP32 Ray-Trace | |
| Microsoft Surface Laptop 4 13 Ryzen 5 | |
| Microsoft Surface Pro 9, i7-1255U | |
| Microsoft Surface Pro 7 Plus | |
| Microsoft Surface Laptop Go 2 Core i5 | |
| Microsoft Surface Pro 9, ARM | |
| Robo and Kala TW220 2-in-1 | |
| Microsoft Surface Go 2, m3-8100Y | |
| Durchschnittliche Qualcomm Snapdragon 8cx Gen 3 (343 - 2627, n=3) | |
| AIDA64 / FPU Julia | |
| Microsoft Surface Laptop 4 13 Ryzen 5 | |
| Microsoft Surface Pro 9, i7-1255U | |
| Microsoft Surface Pro 7 Plus | |
| Microsoft Surface Laptop Go 2 Core i5 | |
| Durchschnittliche Qualcomm Snapdragon 8cx Gen 3 (13729 - 14650, n=3) | |
| Microsoft Surface Pro 9, ARM | |
| Robo and Kala TW220 2-in-1 | |
| Microsoft Surface Go 2, m3-8100Y | |
| AIDA64 / CPU SHA3 | |
| Microsoft Surface Pro 9, i7-1255U | |
| Microsoft Surface Pro 7 Plus | |
| Microsoft Surface Laptop 4 13 Ryzen 5 | |
| Microsoft Surface Laptop Go 2 Core i5 | |
| Microsoft Surface Pro 9, ARM | |
| Robo and Kala TW220 2-in-1 | |
| Durchschnittliche Qualcomm Snapdragon 8cx Gen 3 (453 - 1144, n=3) | |
| Microsoft Surface Go 2, m3-8100Y | |
| AIDA64 / CPU Queen | |
| Microsoft Surface Laptop 4 13 Ryzen 5 | |
| Microsoft Surface Pro 9, i7-1255U | |
| Microsoft Surface Pro 7 Plus | |
| Microsoft Surface Laptop Go 2 Core i5 | |
| Microsoft Surface Pro 9, ARM | |
| Robo and Kala TW220 2-in-1 | |
| Durchschnittliche Qualcomm Snapdragon 8cx Gen 3 (15447 - 27474, n=3) | |
| Microsoft Surface Go 2, m3-8100Y | |
| AIDA64 / FPU SinJulia | |
| Microsoft Surface Laptop 4 13 Ryzen 5 | |
| Microsoft Surface Pro 9, i7-1255U | |
| Microsoft Surface Pro 7 Plus | |
| Microsoft Surface Laptop Go 2 Core i5 | |
| Microsoft Surface Go 2, m3-8100Y | |
| Microsoft Surface Pro 9, ARM | |
| Durchschnittliche Qualcomm Snapdragon 8cx Gen 3 (1161 - 1257, n=3) | |
| Robo and Kala TW220 2-in-1 | |
| AIDA64 / FPU Mandel | |
| Microsoft Surface Laptop 4 13 Ryzen 5 | |
| Microsoft Surface Pro 9, i7-1255U | |
| Microsoft Surface Pro 7 Plus | |
| Microsoft Surface Laptop Go 2 Core i5 | |
| Durchschnittliche Qualcomm Snapdragon 8cx Gen 3 (7085 - 7704, n=3) | |
| Microsoft Surface Pro 9, ARM | |
| Robo and Kala TW220 2-in-1 | |
| Microsoft Surface Go 2, m3-8100Y | |
| AIDA64 / CPU AES | |
| Microsoft Surface Pro 9, i7-1255U | |
| Microsoft Surface Pro 7 Plus | |
| Microsoft Surface Laptop 4 13 Ryzen 5 | |
| Microsoft Surface Laptop Go 2 Core i5 | |
| Microsoft Surface Go 2, m3-8100Y | |
| Microsoft Surface Pro 9, ARM | |
| Robo and Kala TW220 2-in-1 | |
| Durchschnittliche Qualcomm Snapdragon 8cx Gen 3 (638 - 1279, n=3) | |
| AIDA64 / CPU ZLib | |
| Microsoft Surface Laptop 4 13 Ryzen 5 | |
| Microsoft Surface Pro 9, i7-1255U | |
| Robo and Kala TW220 2-in-1 | |
| Microsoft Surface Pro 9, ARM | |
| Durchschnittliche Qualcomm Snapdragon 8cx Gen 3 (398 - 412, n=3) | |
| Microsoft Surface Pro 7 Plus | |
| Microsoft Surface Laptop Go 2 Core i5 | |
| Microsoft Surface Go 2, m3-8100Y | |
| Microsoft Surface Go 3 Core i3 | |
| AIDA64 / FP64 Ray-Trace | |
| Microsoft Surface Laptop 4 13 Ryzen 5 | |
| Microsoft Surface Pro 9, i7-1255U | |
| Microsoft Surface Pro 7 Plus | |
| Microsoft Surface Laptop Go 2 Core i5 | |
| Microsoft Surface Pro 9, ARM | |
| Robo and Kala TW220 2-in-1 | |
| Microsoft Surface Go 2, m3-8100Y | |
| Durchschnittliche Qualcomm Snapdragon 8cx Gen 3 (204 - 1379, n=3) | |
| AIDA64 / CPU PhotoWorxx | |
| Microsoft Surface Pro 9, i7-1255U | |
| Microsoft Surface Pro 7 Plus | |
| Microsoft Surface Laptop Go 2 Core i5 | |
| Microsoft Surface Laptop 4 13 Ryzen 5 | |
| Robo and Kala TW220 2-in-1 | |
| Microsoft Surface Go 2, m3-8100Y | |
| Microsoft Surface Pro 9, ARM | |
| Durchschnittliche Qualcomm Snapdragon 8cx Gen 3 (7622 - 14660, n=3) | |
AIDA64: FP32 Ray-Trace | FPU Julia | CPU SHA3 | CPU Queen | FPU SinJulia | FPU Mandel | CPU AES | CPU ZLib | FP64 Ray-Trace | CPU PhotoWorxx
System-Performance
Grundsätzlich läuft Windows 11 ziemlich flüssig auf dem TW220, und wir bekamen auch mit dem Snapdragon Prozessor keinen einzigen Bluescreen oder Ähnliches. Trotzdem sollte beachtet werden, dass die meisten Applikationen nur emuliert werden, weshalb es vorkommen kann, dass gewisse Apps nicht unterstützt werden.
Das Nutzen des OS ist aber im Vergleich zu anderen Tablets nicht ganz so flüssig, was am 60-Hz-Display liegt. Die meisten anderen besitzen nämlich standardmäßig mittlerweile Panels mit 120 Hz oder noch mehr, wie zum Beispiel das Lenovo P11.
| CrossMark / Overall | |
| Microsoft Surface Pro 9, i7-1255U | |
| Microsoft Surface Laptop Go 2 Core i5 | |
| Microsoft Surface Duo 2 | |
| Durchschnittliche Qualcomm Snapdragon 8cx Gen 3, Qualcomm Adreno 690 (627 - 718, n=2) | |
| Robo and Kala TW220 2-in-1 | |
| CrossMark / Productivity | |
| Microsoft Surface Pro 9, i7-1255U | |
| Microsoft Surface Laptop Go 2 Core i5 | |
| Microsoft Surface Duo 2 | |
| Durchschnittliche Qualcomm Snapdragon 8cx Gen 3, Qualcomm Adreno 690 (586 - 685, n=2) | |
| Robo and Kala TW220 2-in-1 | |
| CrossMark / Creativity | |
| Microsoft Surface Pro 9, i7-1255U | |
| Microsoft Surface Laptop Go 2 Core i5 | |
| Microsoft Surface Duo 2 | |
| Durchschnittliche Qualcomm Snapdragon 8cx Gen 3, Qualcomm Adreno 690 (740 - 776, n=2) | |
| Robo and Kala TW220 2-in-1 | |
| CrossMark / Responsiveness | |
| Microsoft Surface Pro 9, i7-1255U | |
| Microsoft Surface Duo 2 | |
| Microsoft Surface Laptop Go 2 Core i5 | |
| Durchschnittliche Qualcomm Snapdragon 8cx Gen 3, Qualcomm Adreno 690 (468 - 652, n=2) | |
| Robo and Kala TW220 2-in-1 | |
| AIDA64 / Memory Copy | |
| Microsoft Surface Pro 9, i7-1255U | |
| Microsoft Surface Pro 7 Plus | |
| Microsoft Surface Laptop Go 2 Core i5 | |
| Robo and Kala TW220 2-in-1 | |
| Durchschnittliche Qualcomm Snapdragon 8cx Gen 3 (40599 - 42710, n=3) | |
| Microsoft Surface Pro 9, ARM | |
| Microsoft Surface Laptop 4 13 Ryzen 5 | |
| Microsoft Surface Go 2, m3-8100Y | |
| AIDA64 / Memory Read | |
| Microsoft Surface Pro 9, i7-1255U | |
| Microsoft Surface Pro 7 Plus | |
| Microsoft Surface Laptop Go 2 Core i5 | |
| Microsoft Surface Laptop 4 13 Ryzen 5 | |
| Robo and Kala TW220 2-in-1 | |
| Durchschnittliche Qualcomm Snapdragon 8cx Gen 3 (33013 - 33757, n=3) | |
| Microsoft Surface Pro 9, ARM | |
| Microsoft Surface Go 2, m3-8100Y | |
| AIDA64 / Memory Write | |
| Microsoft Surface Pro 7 Plus | |
| Microsoft Surface Pro 9, i7-1255U | |
| Microsoft Surface Laptop Go 2 Core i5 | |
| Microsoft Surface Pro 9, ARM | |
| Robo and Kala TW220 2-in-1 | |
| Durchschnittliche Qualcomm Snapdragon 8cx Gen 3 (49100 - 49815, n=3) | |
| Microsoft Surface Laptop 4 13 Ryzen 5 | |
| Microsoft Surface Go 2, m3-8100Y | |
| AIDA64 / Memory Latency | |
| Microsoft Surface Laptop 4 13 Ryzen 5 | |
| Microsoft Surface Pro 9, i7-1255U | |
| Microsoft Surface Laptop Go 2 Core i5 | |
| Microsoft Surface Pro 7 Plus | |
| Microsoft Surface Go 2, m3-8100Y | |
| Durchschnittliche Qualcomm Snapdragon 8cx Gen 3 (10.2 - 18.8, n=3) | |
| Robo and Kala TW220 2-in-1 | |
| Microsoft Surface Pro 9, ARM | |
| Microsoft Surface Go 3 Core i3 | |
* ... kleinere Werte sind besser
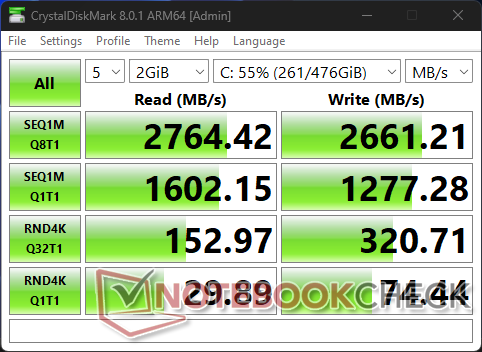
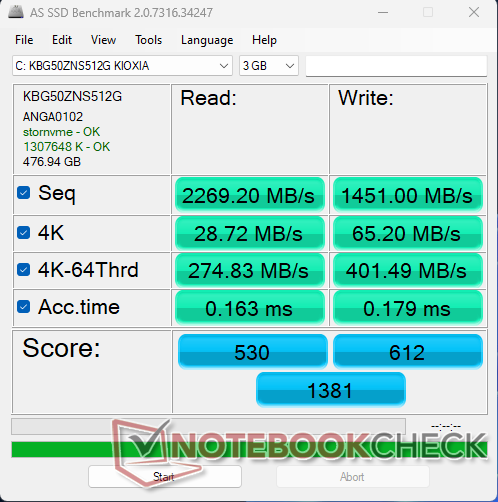
Speichergeräte
Das Tablet wird mit einer Toshiba Kioxia BG5 KBG50ZNS512G ausgeliefert, was eine ziemlich preiswerte PCIe4-x4-NVMe-SSD ist. Beim Lesen erreicht sie eine Geschwindigkeit von etwas mehr als 2.000 MB/s, welche auch nach längerer Zeit konstant bleibt.

* ... kleinere Werte sind besser
Disk-Throttling: DiskSpd Read Loop, 8 Runden
GPU-Performance
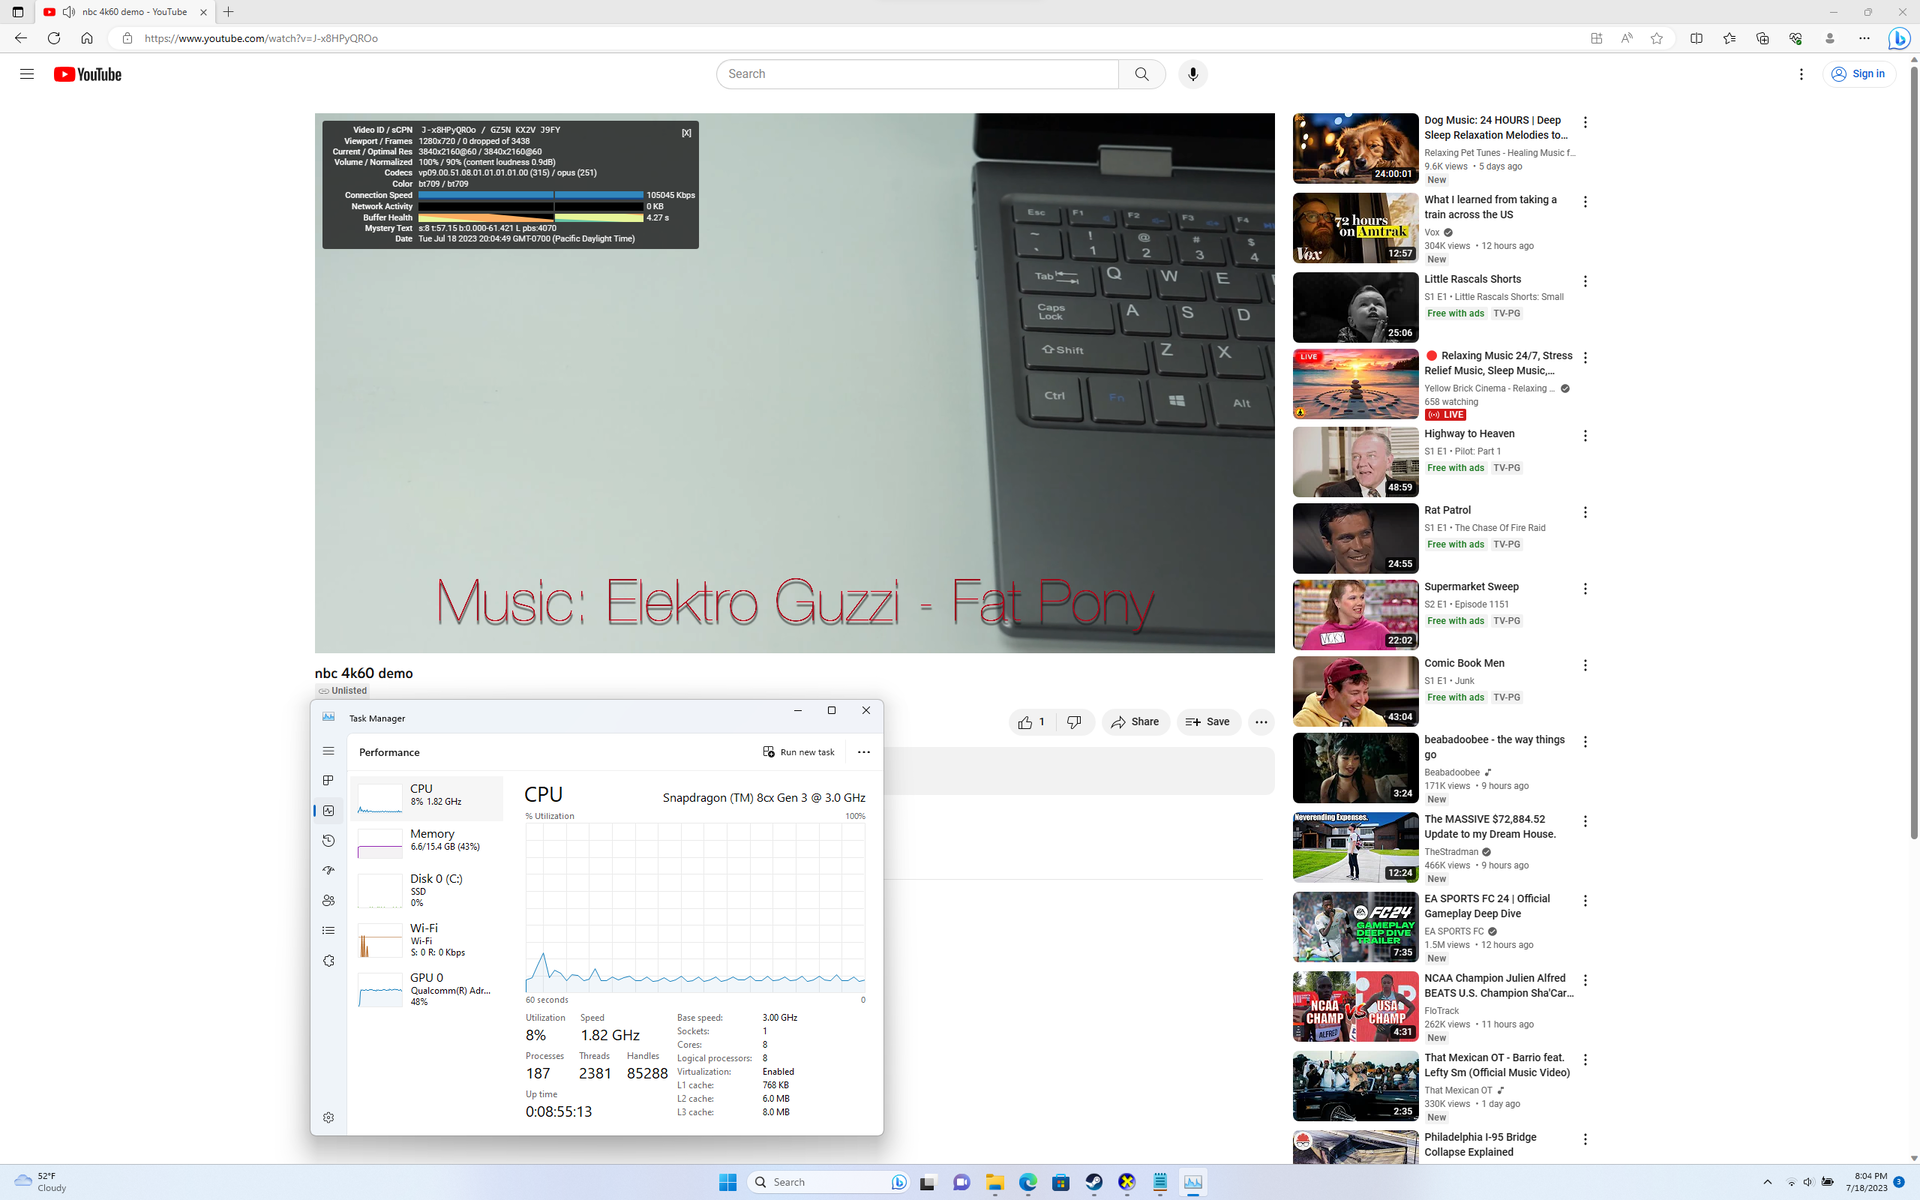
Nutzer des TW220 sollten sich nicht all zu viele Performance-Vorteile zu anderen Modellen von der integrierten Adreno-690-GPU erwarten. Dies liegt vor allem daran, dass sie relativ wenig Strom bekommt und nur passiv gekühlt wird. Der 3DMark-11-Benchmark hat gezeigt, dass sie aber zumindest schneller als die alte UHD-Graphics-Serie ist. Nichtsdestotrotz ist 4K-60-fps-Videostreaming ohne Qualitäts- oder Bildverlust möglich.
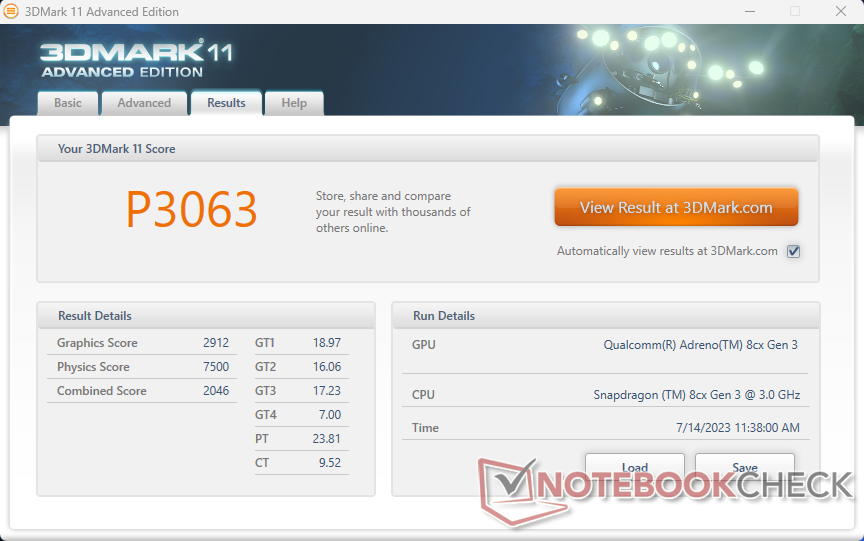
| 3DMark 11 Performance | 3063 Punkte | |
Hilfe | ||
| Blender - v3.3 Classroom CPU | |
| Robo and Kala TW220 2-in-1 | |
| Microsoft Surface Laptop Go 2 Core i5 | |
| Microsoft Surface Pro 9, i7-1255U | |
* ... kleinere Werte sind besser
Gaming Performance
Um es kurz und knapp zu beschreiben: Man sollte eher Gaming-Streams ansehen, anstatt selbst mit dem Tablet zu spielen. Die reine Performance liegt hier irgendwo zwischen der langsameren UHD-Grafik und der etwas schnelleren Iris-Xe-80-EU-GPU. Abgesehen davon crashen die meisten Games ohnehin bei bestimmten Einstellungen, was an den bereits genannten Gründen liegt.
| GTA V | |
| 1024x768 Lowest Settings possible | |
| Microsoft Surface Pro 9, i7-1255U | |
| Robo and Kala TW220 2-in-1 | |
| Durchschnittliche Qualcomm Adreno 690 (n=1) | |
| 1920x1080 Lowest Settings possible | |
| Robo and Kala TW220 2-in-1 | |
| Durchschnittliche Qualcomm Adreno 690 (n=1) | |
| F1 22 | |
| 1280x720 Ultra Low Preset AA:T AF:16x | |
| Robo and Kala TW220 2-in-1 | |
| Durchschnittliche Qualcomm Adreno 690 (n=1) | |
| 1920x1080 Low Preset AA:T AF:16x | |
| Microsoft Surface Pro 9, i7-1255U | |
| Robo and Kala TW220 2-in-1 | |
| Durchschnittliche Qualcomm Adreno 690 (n=1) | |
| 1920x1080 Medium Preset AA:T AF:16x | |
| Microsoft Surface Pro 9, i7-1255U | |
| Robo and Kala TW220 2-in-1 | |
| Durchschnittliche Qualcomm Adreno 690 (n=1) | |
| 1920x1080 High Preset AA:T AF:16x | |
| Microsoft Surface Pro 9, i7-1255U | |
| Robo and Kala TW220 2-in-1 | |
| Durchschnittliche Qualcomm Adreno 690 (n=1) | |
| 1920x1080 Ultra High Preset AA:T AF:16x | |
| Robo and Kala TW220 2-in-1 | |
| Durchschnittliche Qualcomm Adreno 690 (n=1) | |
Witcher 3 FPS Chart
| min. | mittel | hoch | max. | |
|---|---|---|---|---|
| GTA V (2015) | 29.9 | |||
| The Witcher 3 (2015) | 38.6 | 31.5 | 19.1 | 8.5 |
| Dota 2 Reborn (2015) | 58.7 | 55.2 | 45.9 | 40.2 |
| Final Fantasy XV Benchmark (2018) | 19 | 12.3 | 7.29 | |
| X-Plane 11.11 (2018) | 21.3 | 18.9 | 16.1 | |
| F1 22 (2022) | 26 | 22.5 | 17 | 12.6 |
Emissionen
Temperaturen
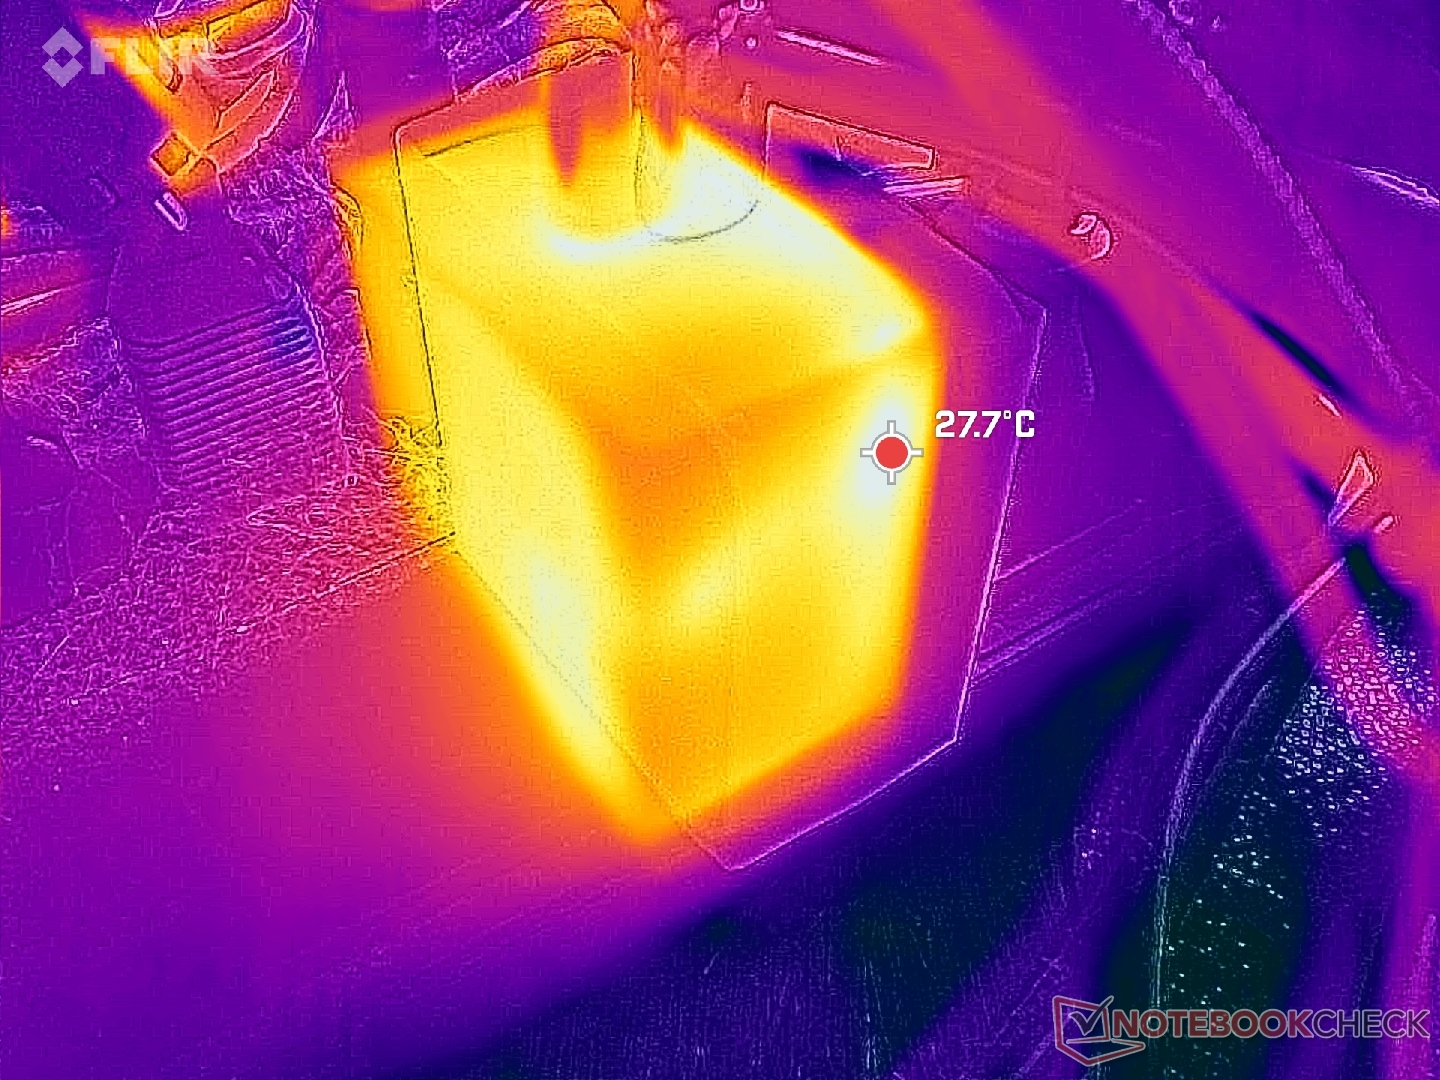
Die Oberfläche des TW220 kann merkbar warm werden, auch wenn nicht so warm wie beim Surface Pro 9. Die heißesten Stellen erreichen dabei zwischen 36 und 40 °C, im Vergleich zu den 45 °C beim Microsoft Tablet.
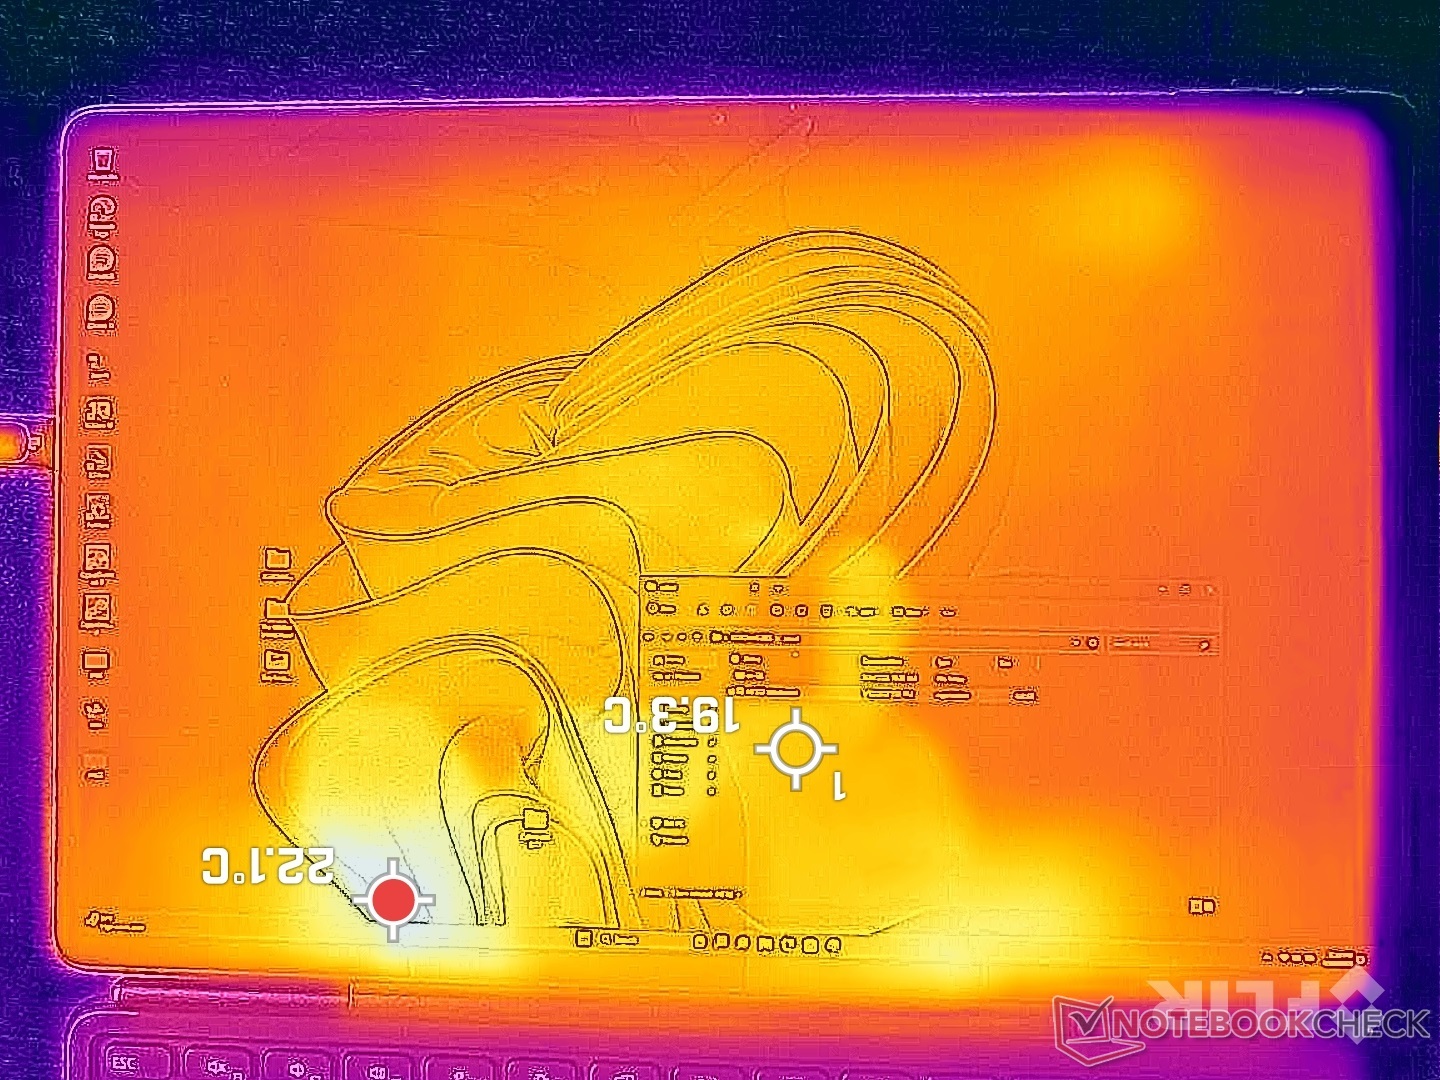
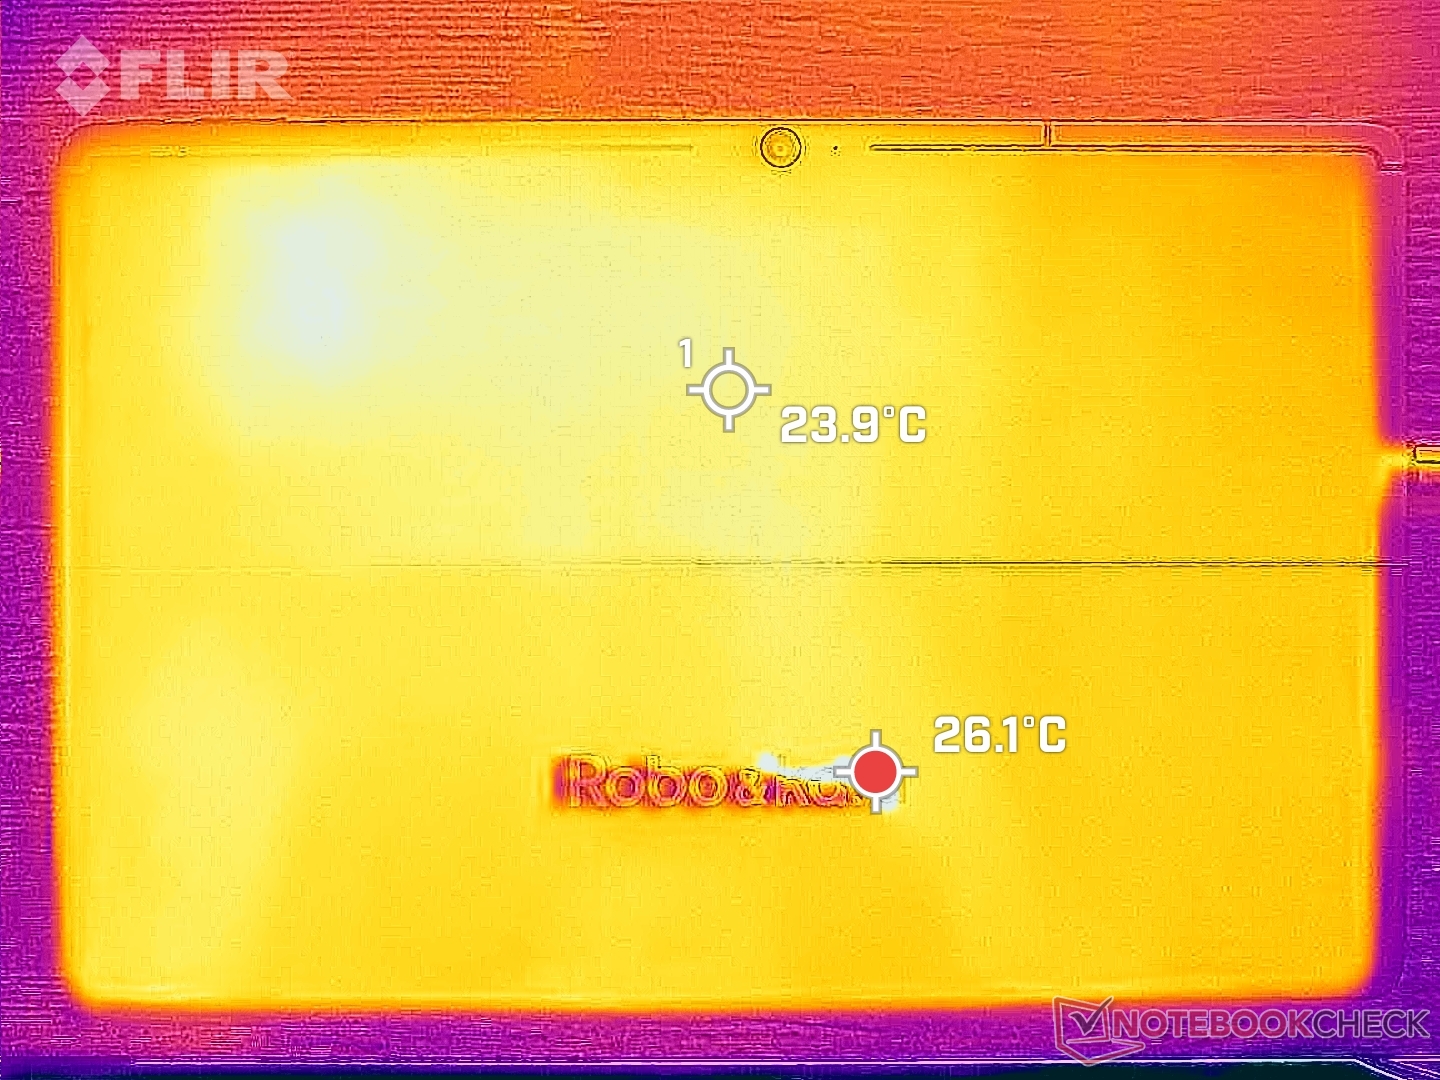
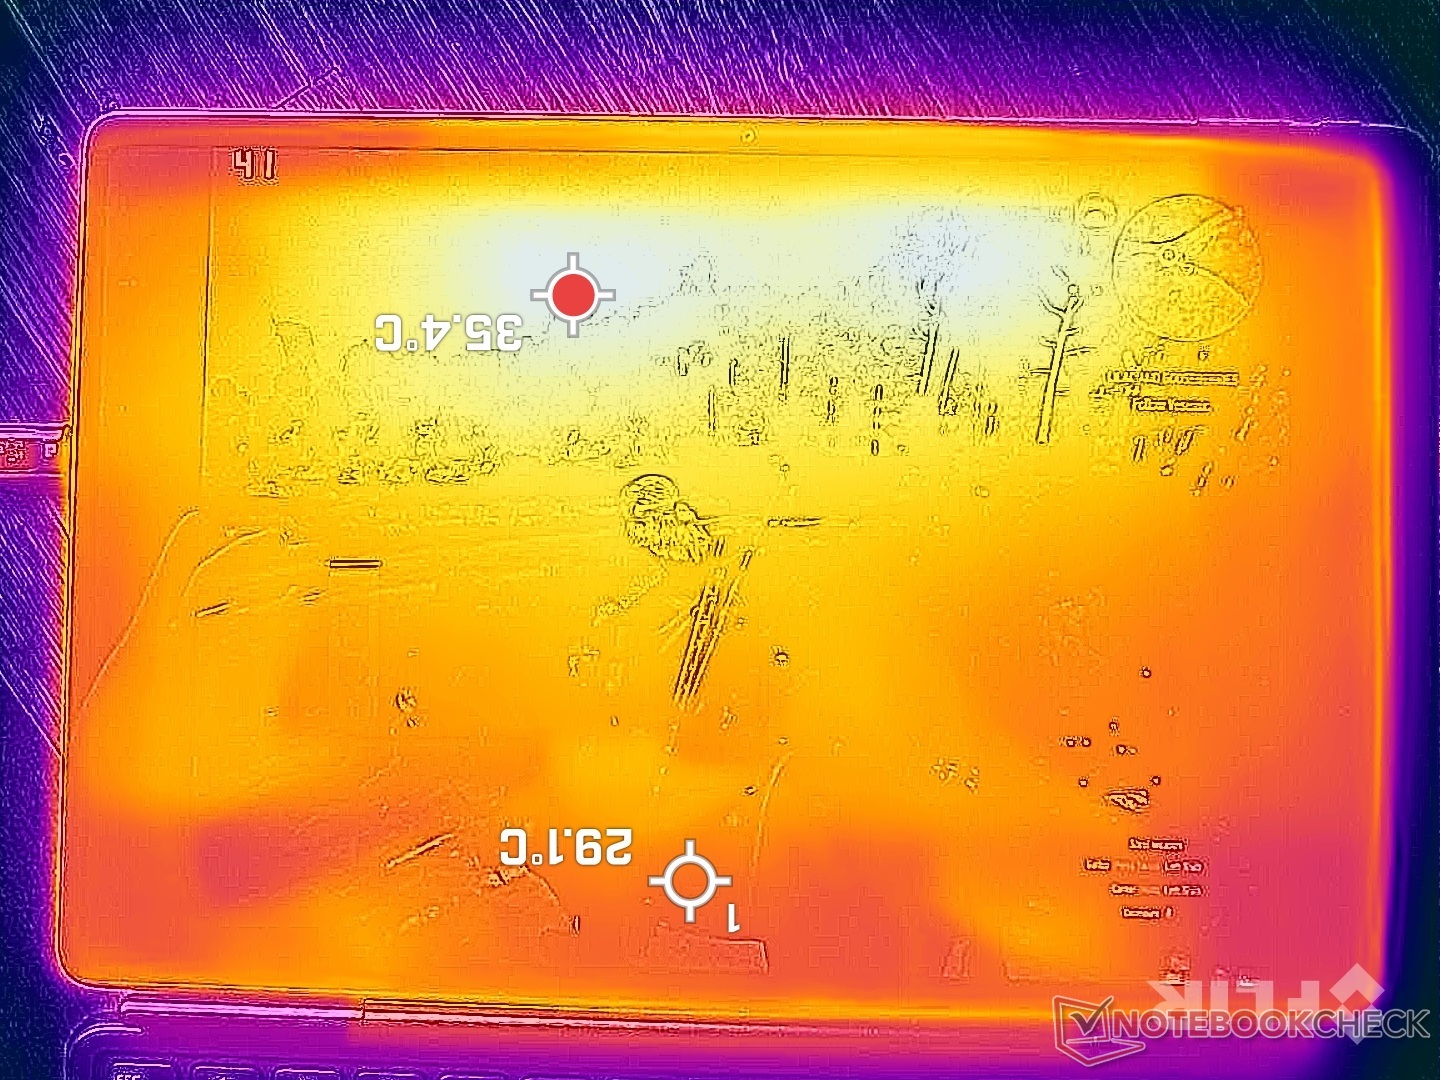
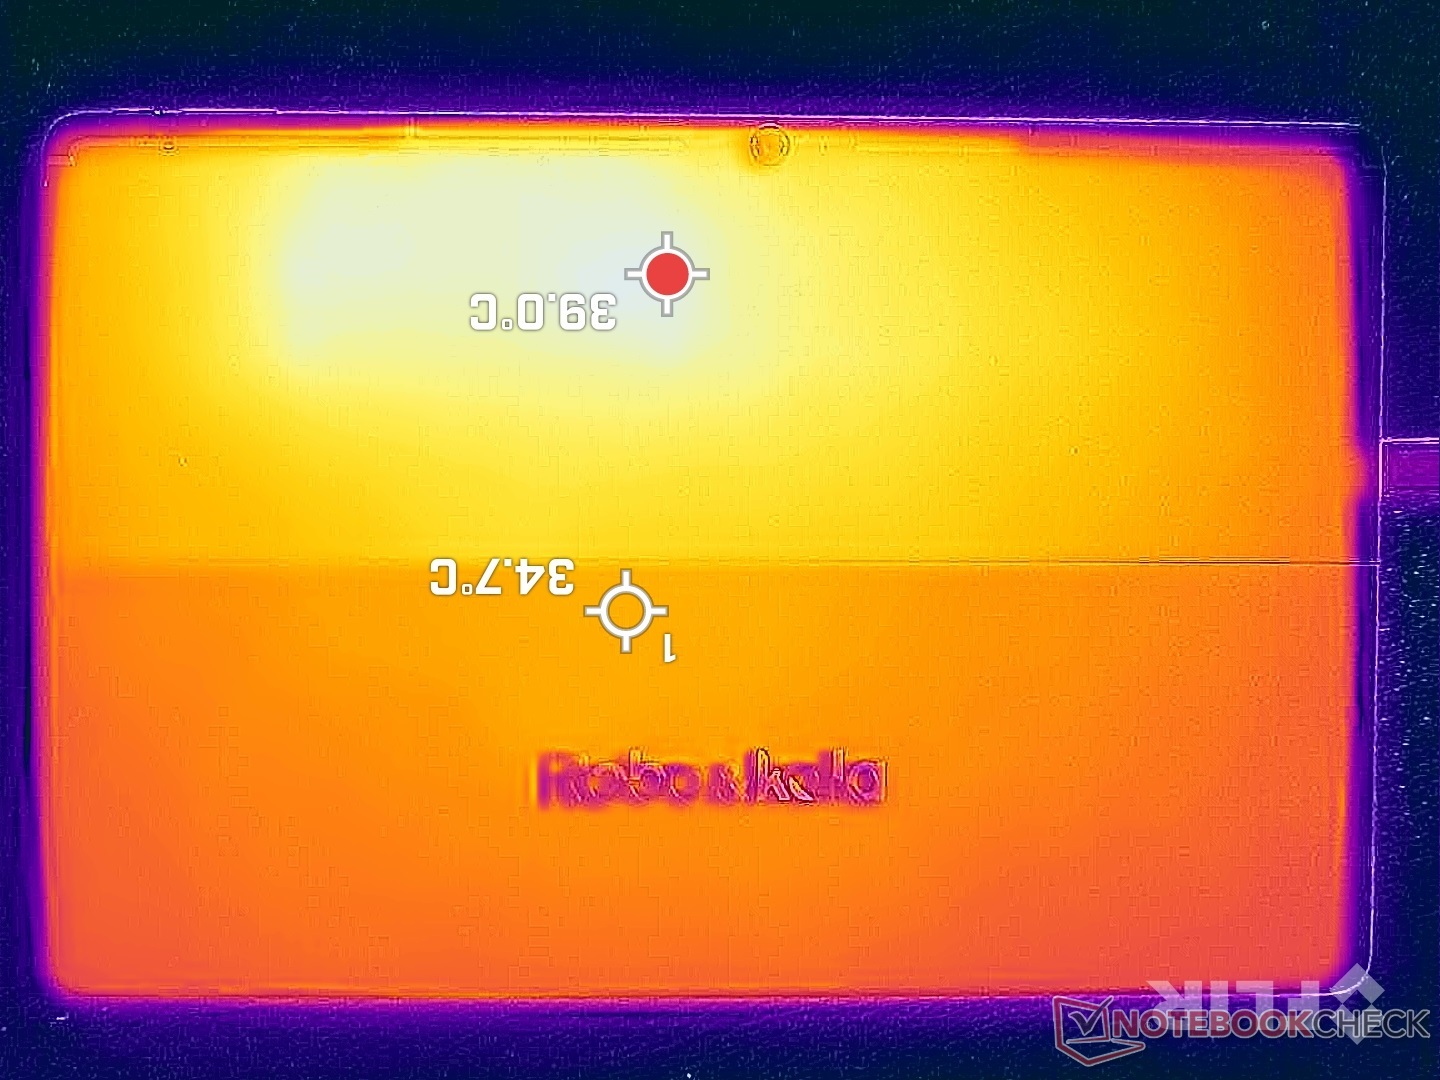
(+) Die maximale Temperatur auf der Oberseite ist 39.4 °C. Im Vergleich liegt der Klassendurchschnitt bei 33.6 °C (von 20.7 bis 53.2 °C für die Klasse Tablet).
(±) Auf der Unterseite messen wir eine maximalen Wert von 40.8 °C (im Vergleich zum Durchschnitt von 33.2 °C).
(+) Ohne Last messen wir eine durchschnittliche Temperatur von 26.2 °C auf der Oberseite. Der Klassendurchschnitt erreicht 30 °C.
| Robo and Kala TW220 2-in-1 Qualcomm Snapdragon 8cx Gen 3, Qualcomm Adreno 690 | Microsoft Surface Pro 9, i7-1255U Intel Core i7-1255U, Intel Iris Xe Graphics G7 96EUs | Microsoft Surface Pro 9, ARM Qualcomm Snapdragon 8cx Gen 3, Qualcomm Adreno 690 | Microsoft Surface Go 3 Core i3 Intel Core i3-10100Y, Intel UHD Graphics 615 | Apple iPad 10 Apple A14 Bionic, Apple A14 Bionic GPU | Apple iPad Pro 11 2022 Apple M2, Apple M2 10-Core GPU | |
|---|---|---|---|---|---|---|
| Hitze | -3% | 5% | -2% | -7% | 14% | |
| Last oben max * (°C) | 39.4 | 44.6 -13% | 40.8 -4% | 46.1 -17% | 35.1 11% | 34.3 13% |
| Last unten max * (°C) | 40.8 | 45.9 -13% | 43.4 -6% | 42.7 -5% | 36.9 10% | 34.5 15% |
| Idle oben max * (°C) | 26.8 | 24.8 7% | 23.2 13% | 25 7% | 33.4 -25% | 22.8 15% |
| Idle unten max * (°C) | 26.8 | 25.3 6% | 22.6 16% | 25 7% | 33.1 -24% | 23.1 14% |
* ... kleinere Werte sind besser
Lautsprecher
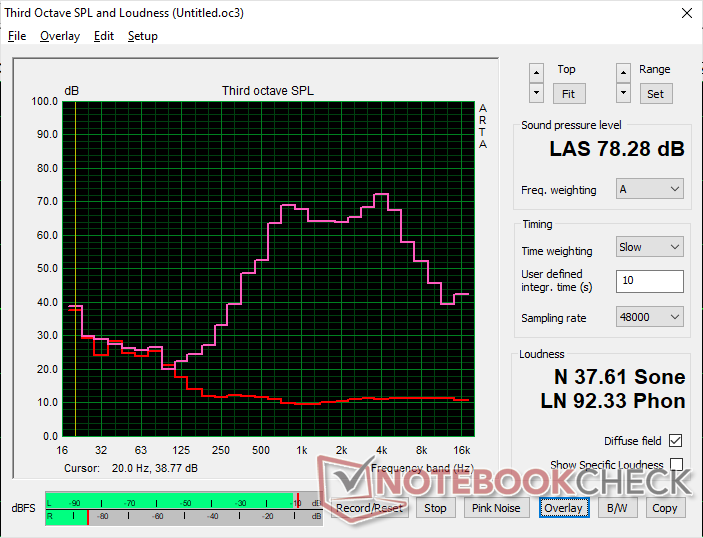
Robo and Kala TW220 2-in-1 Audio Analyse
(±) | Mittelmäßig laut spielende Lautsprecher (78.3 dB)
Bass 100 - 315 Hz
(-) | kaum Bass - 24.9% niedriger als der Median
(±) | durchschnittlich lineare Bass-Wiedergabe (10.5% Delta zum Vorgänger)
Mitteltöne 400 - 2000 Hz
(±) | zu hohe Mitten, vom Median 10.1% abweichend
(±) | Linearität der Mitten ist durchschnittlich (10.5% Delta zum Vorgänger)
Hochtöne 2 - 16 kHz
(±) | zu hohe Hochtöne, vom Median nur 10.7% abweichend
(±) | durchschnittlich lineare Hochtöne (12% Delta zum Vorgänger)
Gesamt im hörbaren Bereich 100 - 16.000 Hz
(-) | hörbarer Bereich ist nur wenig linear (35.9% Abstand zum Median)
Im Vergleich zu allen Geräten derselben Klasse
» 96% aller getesteten Geräte dieser Klasse waren besser, 2% vergleichbar, 3% schlechter
» Das beste Gerät hat einen Delta-Wert von 7%, durchschnittlich ist 20%, das schlechteste Gerät hat 129%
Im Vergleich zu allen Geräten im Test
» 94% aller getesteten Geräte waren besser, 1% vergleichbar, 5% schlechter
» Das beste Gerät hat einen Delta-Wert von 4%, durchschnittlich ist 24%, das schlechteste Gerät hat 134%
Apple MacBook Pro 16 2021 M1 Pro Audio Analyse
(+) | Die Lautsprecher können relativ laut spielen (84.7 dB)
Bass 100 - 315 Hz
(+) | guter Bass - nur 3.8% Abweichung vom Median
(+) | lineare Bass-Wiedergabe (5.2% Delta zum Vorgänger)
Mitteltöne 400 - 2000 Hz
(+) | ausgeglichene Mitten, vom Median nur 1.3% abweichend
(+) | lineare Mitten (2.1% Delta zum Vorgänger)
Hochtöne 2 - 16 kHz
(+) | ausgeglichene Hochtöne, vom Median nur 1.9% abweichend
(+) | sehr lineare Hochtöne (2.7% Delta zum Vorgänger)
Gesamt im hörbaren Bereich 100 - 16.000 Hz
(+) | hörbarer Bereich ist sehr linear (4.6% Abstand zum Median
Im Vergleich zu allen Geräten derselben Klasse
» 0% aller getesteten Geräte dieser Klasse waren besser, 0% vergleichbar, 100% schlechter
» Das beste Gerät hat einen Delta-Wert von 5%, durchschnittlich ist 17%, das schlechteste Gerät hat 45%
Im Vergleich zu allen Geräten im Test
» 0% aller getesteten Geräte waren besser, 0% vergleichbar, 100% schlechter
» Das beste Gerät hat einen Delta-Wert von 4%, durchschnittlich ist 24%, das schlechteste Gerät hat 134%
Energie-Management
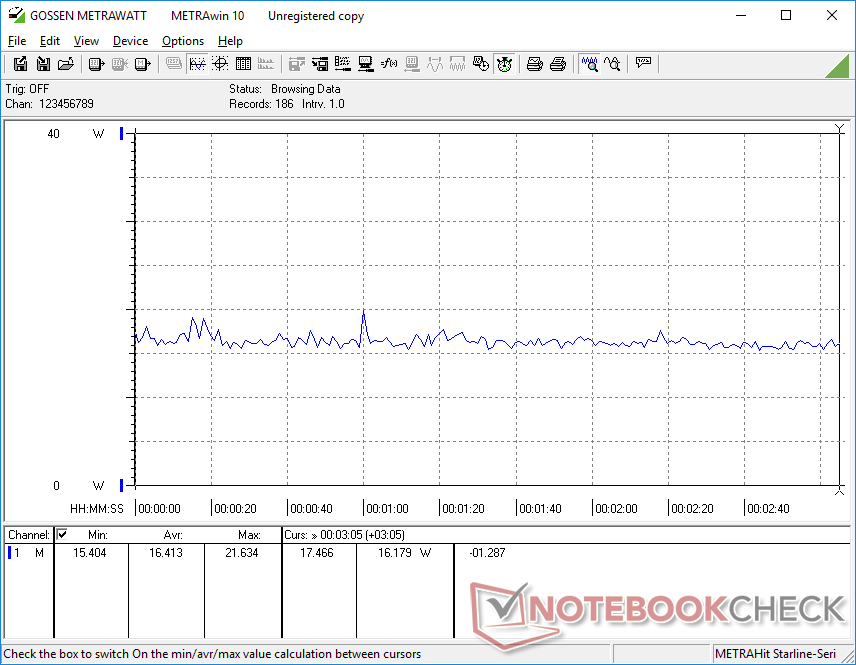
Stromverbrauch
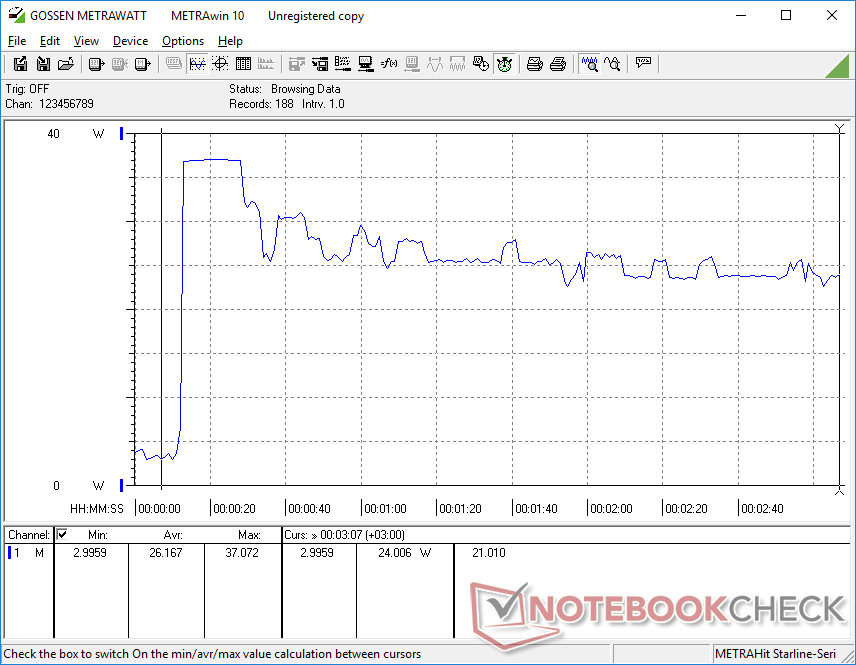
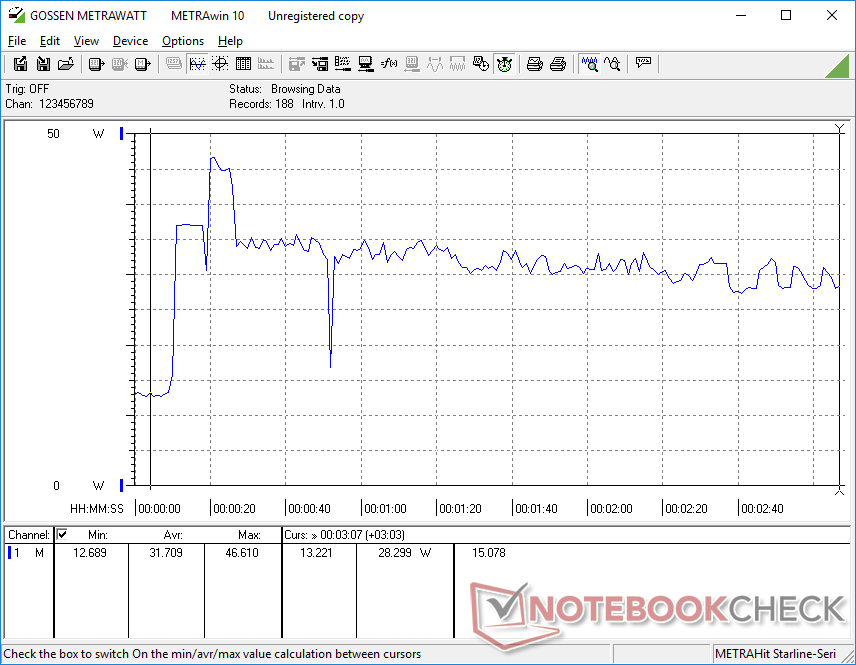
Der Stromverbrauch ist im Vergleich etwas höher als beim Surface Go 3, aber deutlich geringer als beim schnelleren Surface Pro 9. Der OLED-Touchscreen ist ein ziemlicher Stromfresser, was sich durch einen durchschnittlichen Verbrauch von 9 W bemerkbar macht. Hierzu sei gesagt: Es mag zwar tiefere Farben und eine höhere, maximale Helligkeit besitzen, aber die Nutzer müssen dafür einen höheren Stromverbrauch in Kauf nehmen.
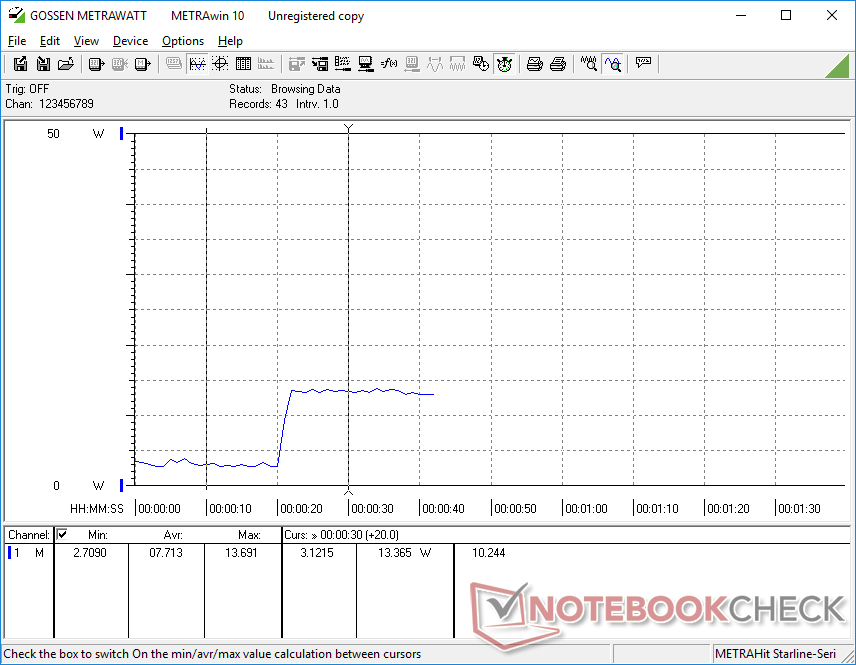
| Aus / Standby | |
| Idle | |
| Last |
|
Legende:
min: | |
| Robo and Kala TW220 2-in-1 SD 8cx Gen 3, Adreno 690, Kioxia BG5 KBG50ZNS512G, AMOLED, 2560x1600, 12.6" | Microsoft Surface Pro 9, i7-1255U i7-1255U, Iris Xe G7 96EUs, Samsung MZ9L4512HBLU-00BMV, IPS, 2880x1920, 13" | Microsoft Surface Pro 9, ARM SD 8cx Gen 3, Adreno 690, , IPS, 2880x1920, 13" | Microsoft Surface Go 3 Core i3 i3-10100Y, UHD Graphics 615, SK hynix HFB1M8MQ331C0MR, IPS , 1920x1280, 10.5" | Apple iPad 10 A14, A14 Bionic GPU, 64 GB SSD, IPS, 2360x1640, 10.9" | Apple iPad Pro 11 2022 M2, M2 10-Core GPU, 128 GB NVMe, IPS, 2388x1668, 11" | |
|---|---|---|---|---|---|---|
| Stromverbrauch | -59% | 14% | 30% | 46% | 55% | |
| Idle min * (Watt) | 3.2 | 5.1 -59% | 2.8 13% | 2.6 19% | 1.34 58% | 1.1 66% |
| Idle avg * (Watt) | 6.7 | 9.8 -46% | 6.8 -1% | 5.1 24% | 7.78 -16% | 6 10% |
| Idle max * (Watt) | 15.3 | 11.3 26% | 8.1 47% | 5.9 61% | 7.89 48% | 6.1 60% |
| Last avg * (Watt) | 22.7 | 47.5 -109% | 23.8 -5% | 22.9 -1% | 9.05 60% | 9.1 60% |
| Witcher 3 ultra * (Watt) | 16.4 | 36 -120% | ||||
| Last max * (Watt) | 46.7 | 68.5 -47% | 40.2 14% | 24.6 47% | 9.98 79% | 10.2 78% |
* ... kleinere Werte sind besser
Stromverbrauch Witcher 3 / Stresstest
Stromverbrauch externer Monitor
Akkulaufzeit
Der Akku ist mit 41 Wh etwas kleiner als bei der Surface-Pro-Serie, aber unter alltäglichen Bedingungen erreicht man eine durchschnittliche Akkulaufzeit von 8,5 Stunden beim Webbrowsing.
Um den komplett leeren Akku auf 100 Prozent zu laden, dauert es mit dem 65-W-Stromadapter ca. 70 Minuten.
| Robo and Kala TW220 2-in-1 SD 8cx Gen 3, Adreno 690, 41 Wh | Microsoft Surface Pro 9, i7-1255U i7-1255U, Iris Xe G7 96EUs, 47.7 Wh | Microsoft Surface Pro 9, ARM SD 8cx Gen 3, Adreno 690, 47.7 Wh | Microsoft Surface Go 3 Core i3 i3-10100Y, UHD Graphics 615, 28 Wh | Apple iPad 10 A14, A14 Bionic GPU, 28.93 Wh | Apple iPad Pro 11 2022 M2, M2 10-Core GPU, 28.65 Wh | |
|---|---|---|---|---|---|---|
| Akkulaufzeit | -23% | 17% | -19% | 34% | 75% | |
| Idle (h) | 23.4 | 28.8 23% | 36.6 56% | |||
| WLAN (h) | 8.6 | 7.5 -13% | 10.1 17% | 7 -19% | 10.8 26% | 14.1 64% |
| Last (h) | 2.1 | 1.4 -33% | 3.2 52% | 4.3 105% | ||
| H.264 (h) | 9.4 | 12.3 | 15.7 |
Pro
Contra
Fazit — Die goldene Mitte zwischen dem Surface Pro und dem Surface Go
Das Beste am Robo & Kala TW220 sind eindeutig der OLED-Screen, die ARM-Performance und der relativ geringe Preis für die gebotene Qualität. Das OLED-Display unterschiedet das TW220 auch vom Surface Pro und vom Surface Go, was sich in der Nutzung vor allem durch ein tieferes Schwarz und ein weites Farbspektrum bemerkbar macht.
Hat man mit den Limitierungen von Windows ARM keine Probleme, ist dieses Tablet definitiv eine Überlegung wert, insofern man nicht die Power eines Surface Pro 9 mit seinem i7 benötigt.
Nichtsdestotrotz würden wir uns wünschen, dass die Modelle in Zukunft bereits von Haus aus kalibriert werden, damit Nutzer das volle OLED-Erlebnis direkt von Anfang an genießen können. Außerdem könnten die Connection-Pins der Tastatur etwas stärker sein, und ein LTE/5G-Support wäre auch ein wünschenswertes Feature.
Diverse ARM Limitierungen lassen sich hier leider nicht vermeiden, weshalb andere Modelle mit Intel CPUs wahrscheinlich für viele Nutzer attraktiver sind. Für die meisten Basics, wie E-Mails-Lesen, im Internet surfen oder Streaming, ist das TW220 aber das erschwinglichste und user-freundlichste Windows-Tablet, wenn man es mit der kleineren Surface-Go-Serie vergleicht.
Preis und Verfügbarkeit
Momentan ist das Robo & Kala TW220 in Europa noch nicht erhältlich. Man kann es aber auf der offiziellen Website des Herstellers für umgerechnet ca. 537 Euro (599 USD) erwerben.
Robo and Kala TW220 2-in-1
- 20.07.2023 v7 (old)
Allen Ngo
Transparenz
Die Auswahl der zu testenden Geräte erfolgt innerhalb der Redaktion. Das vorliegende Testmuster wurde dem Autor vom Hersteller oder einem Shop zu Testzwecken leihweise zur Verfügung gestellt. Eine Einflussnahme des Leihstellers auf den Testbericht gab es nicht, der Hersteller erhielt keine Version des Reviews vor der Veröffentlichung. Es bestand keine Verpflichtung zur Publikation. Als eigenständiges, unabhängiges Unternehmen unterliegt Notebookcheck keiner Diktion von Herstellern, Shops und Verlagen.
So testet Notebookcheck
Pro Jahr werden von Notebookcheck hunderte Laptops und Smartphones unabhängig in von uns standardisierten technischen Verfahren getestet, um eine Vergleichbarkeit aller Testergebnisse zu gewährleisten. Seit rund 20 Jahren entwickeln wir diese Testmethoden kontinuierlich weiter und setzen damit Branchenstandards. In unseren Testlaboren kommt ausschließlich hochwertiges Messequipment in die Hände erfahrener Techniker und Redakteure. Die Tests unterliegen einer mehrstufigen Kontrolle. Unsere komplexe Gesamtbewertung basiert auf hunderten fundierten Messergebnissen und Benchmarks, womit Ihnen Objektivität garantiert ist. Weitere Informationen zu unseren Testmethoden gibt es hier.
Preisvergleich

