Notebookcheck Logo

Intel Core i3-1115G4 vs Intel Pentium Gold 4415U

Intel Core i3-1115G4

► remove from comparison Intel i3-1115G4

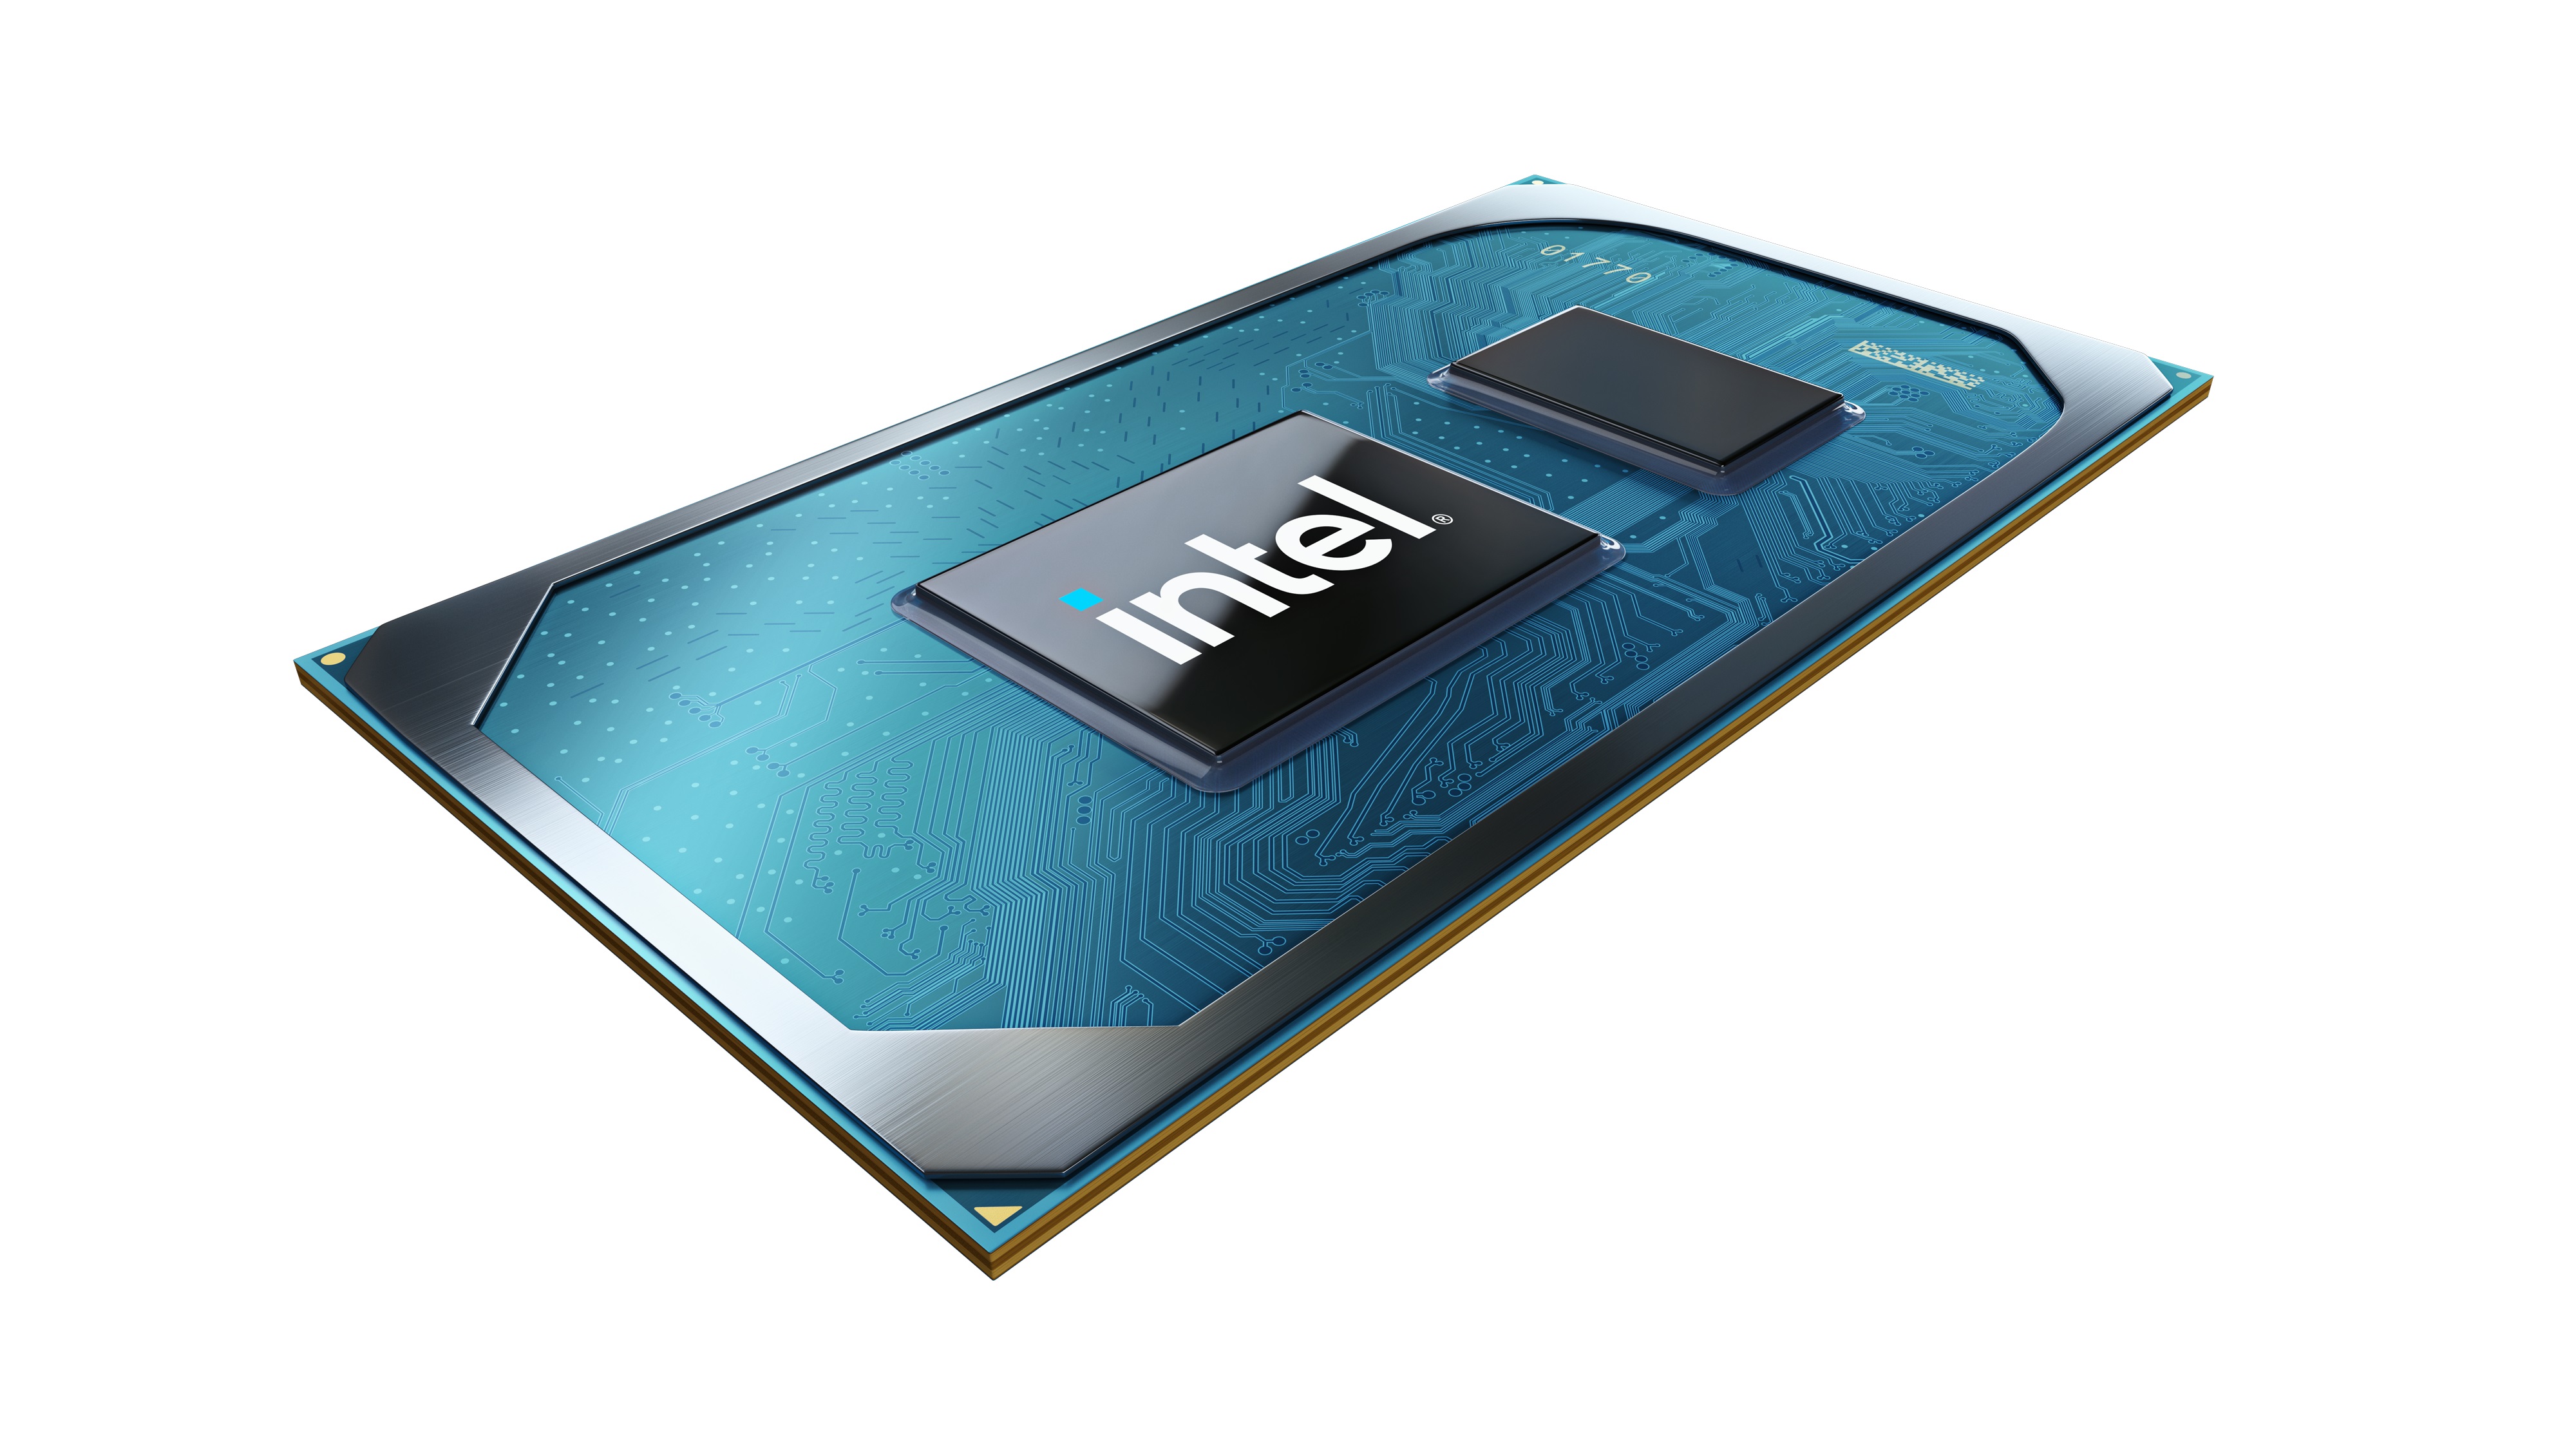
Der Intel Core i3-1115G4 ist ein sparsamer Dual-Core-SoC für Notebooks und Ultrabooks, der auf der Tiger-Lake-Architektur basiert und im September 2020 vorgestellt wurde. Tiger Lake wird im verbesserten 10nm+-Verfahren (SuperFin genannt) bei Intel gefertigt und nutzt die neuen Willow Cove CPU-Kerne mit einer neuen Mikroarchitektur. Der Intel Core i5-1115G4 bietet zwei Kerne mit Hyperthreading (4 Threads) und 3 GHz Basistakt bis 4,1 GHz Turbo-Takt (auch wenn beide Kerne genutzt werden). 

Eine weitere Neuerung ist die integrierte Intel UHD Graphics Xe G4 Grafikkarte (Gen 12) welche eine deutlich höhere Leistung wie die alte Iris Plus G7 in Ice Lake bieten soll. Im 1115G7 bietet die UHD Graphics jedoch nur 48 der 96 EUs bei einem Takt von 400 - 1250 MHz.

Wie bisher wird auch weiterhin WLAN (Wifi 6) und nun auch Thunderbolt 4 / USB 4 und 4 Lanes PCIe 4 im Chip (teil-)integriert für schnellere, günstige und platzsparende Implementierungen in Notebooks.

Der TDP kann bei den UP3 CPUs von 12 - 28 Watt gewählt werden und dadurch eignet sich die CPU auch für dünne und leichte Notebooks.

Intel Pentium Gold 4415U

► remove from comparison Intel Pentium 4415U

Der Intel Pentium Gold 4415U ist ein sparsamer Dual-Core-SoC auf Basis der Kaby-Lake-Architektur, der im 1. Quartal 2017 vorgestellt wurde. Die CPU wird hauptsächlich in Ultrabooks, aber auch gewöhnlichen Notebooks verbaut. Neben den zwei CPU-Kernen samt Hyper-Threading, die mit 2,3 GHz takten (kein Turbo Boost), integriert der Prozessor auch eine HD Graphics 610 Grafikeinheit sowie einen Dual-Channel-Speichercontroller (LPDDR3-1866/DDR4-2133/DDR3L-1600). Die Fertigung erfolgt in einem 14-Nanometer-Prozess mit FinFET-Transistoren.

Architektur

Im Vergleich mit Skylake hat Intel die zugrundeliegende Mikroarchitektur praktisch unverändert übernommen, sodass sich keine Unterschiede in der Pro-MHz-Leistung ergeben. Überarbeitet wurde lediglich die Speed-Shift-Technik zur schnelleren dynamischen Anpassung von Spannungen und Taktraten, zudem gestattet der gereifte 14-Nanometer-Prozess deutlich höhere Frequenzen und eine bessere Energieeffizienz als bislang.

Performance

Dank Hyper-Threading-Support rückt der Pentium 4415U nahe an die preislich höher positionierte Core-i3-Serie heran und erreicht in etwa die Leistung des alten Core i3-4000M (Haswell 2.4 GHz Dual-Core). Damit stehen für alltägliche Anwendungen, aber auch viele anspruchsvollere Programme ausreichende Reserven bereit.

Grafikeinheit

Die integrierte Grafikeinheit namens Intel HD Graphics 610 repräsentiert die kleinste, auch "GT1" genannte Ausbaustufe der Kaby-Lake-GPU (Intel Gen. 9).

Leistungsaufnahme

Dank "Configurable TDP" kann die CPU ausgehend von den standardmäßigen 15 Watt auch mit einer TDP von 10 Watt (cTDP Down) betrieben werden, wodurch sich jedoch die Performance reduziert. Je nach Einstellung ist der Chip für schlanke Note- und Ultrabooks ab etwa 11 Zoll Bilddiagonale geeignet.

ModelIntel Core i3-1115G4Intel Pentium Gold 4415U
SeriesIntel Tiger LakeIntel Kaby Lake
CodenameTiger Lake-UP3Kaby Lake
Serie: Kaby Lake Kaby Lake
Intel Core i7-1195G7 compare2.9 - 5 GHz4 / 8 cores12 MB L3
Intel Core i7-1185G7 compare3 - 4.8 GHz4 / 8 cores12 MB L3
Intel Core i7-1165G7 compare2.8 - 4.7 GHz4 / 8 cores12 MB L3
Intel Core i5-1155G7 compare2.5 - 4.5 GHz4 / 8 cores8 MB L3
Intel Core i5-1145G7 compare2.6 - 4.4 GHz4 / 8 cores8 MB L3
Intel Core i5-1135G7 compare2.4 - 4.2 GHz4 / 8 cores8 MB L3
Intel Core i3-1125G4 compare2 - 3.7 GHz4 / 8 cores8 MB L3
Intel Core i3-1115G4 « 3 - 4.1 GHz2 / 4 cores6 MB L3
Intel Core i7-7700K compare4.2 - 4.5 GHz4 / 8 cores8 MB L3
Intel Core i7-7700 compare3.6 - 4.2 GHz4 / 8 cores8 MB L3
Intel Xeon E3-1535M v6 compare3.1 - 4.2 GHz4 / 8 cores8 MB L3
Intel Core i7-7920HQ compare3.1 - 4.1 GHz4 / 8 cores8 MB L3
Intel Core i7-7700T compare2.9 - 3.8 GHz4 / 8 cores8 MB L3
Intel Core i5-7600K compare3.8 - 4.2 GHz4 / 4 cores8 MB L3
Intel Xeon E3-1505M v6 compare3 - 4 GHz4 / 8 cores8 MB L3
Intel Core i7-7820HQ compare2.9 - 3.9 GHz4 / 8 cores8 MB L3
Intel Core i7-7820HK compare2.9 - 3.9 GHz4 / 8 cores8 MB L3
Intel Core i7-7700HQ compare2.8 - 3.8 GHz4 / 8 cores6 MB L3
Intel Core i5-7500 compare3.4 - 3.8 GHz4 / 4 cores6 MB L3
Intel Core i5-7440HQ compare2.8 - 3.8 GHz4 / 4 cores6 MB L3
Intel Core i7-7567U compare3.5 - 4 GHz2 / 4 cores4 MB L3
Intel Core i7-7660U compare2.5 - 4 GHz2 / 4 cores4 MB L3
Intel Core i7-7600U compare2.8 - 3.9 GHz2 / 4 cores4 MB L3
Intel Core i5-7300HQ compare2.5 - 3.5 GHz4 / 4 cores6 MB L3
Intel Core i5-7500T compare2.7 - 3.3 GHz4 / 4 cores6 MB L3
Intel Core i5-7287U compare3.3 - 3.7 GHz2 / 4 cores4 MB L3
Intel Core i7-7560U compare2.4 - 3.8 GHz2 / 4 cores4 MB L3
Intel Core i5-7267U compare3.1 - 3.5 GHz2 / 4 cores4 MB L3
Intel Core i5-7360U compare2.3 - 3.6 GHz2 / 4 cores4 MB L3
Intel Core i7-7500U compare2.7 - 3.5 GHz2 / 4 cores4 MB L3
Intel Core i5-7300U compare2.6 - 3.5 GHz2 / 4 cores3 MB L3
Intel Core i5-7260U compare2.2 - 3.4 GHz2 / 4 cores4 MB L3
Intel Core i5-7200U compare2.5 - 3.1 GHz2 / 4 cores3 MB L3
Intel Core i3-7100H compare3 GHz2 / 4 cores3 MB L3
Intel Core i3-7167U compare2.8 GHz2 / 4 cores3 MB L3
Intel Core i7-7Y75 compare1.3 - 3.6 GHz2 / 4 cores4 MB L3
Intel Core i5-7Y57 compare1.2 - 3.3 GHz2 / 4 cores4 MB L3
Intel Core i5-7Y54 compare1.2 - 3.2 GHz2 / 4 cores4 MB L3
Intel Core i3-7100U compare2.4 GHz2 / 4 cores3 MB L3
Intel Core m3-7Y32 compare1 - 3 GHz2 / 4 cores4 MB L3
Intel Pentium Gold 4415U « 2.3 GHz2 / 4 cores2 MB L3
Intel Core m3-7Y30 compare1 - 2.6 GHz2 / 4 cores4 MB L3
Intel Celeron 3965U compare2.2 GHz2 / 2 cores2 MB L3
Intel Core i3-7020U compare2.3 GHz2 / 4 cores3 MB L3
Intel Celeron 3867U compare1.8 GHz2 / 2 cores2 MB L3
Intel Celeron 3865U compare1.8 GHz2 / 2 cores2 MB L3
Intel Pentium Gold 4425Y compare1.7 GHz2 / 4 cores2 MB L3
Intel Pentium Gold 4415Y compare1.6 GHz2 / 4 cores2 MB L3
Intel Pentium Gold 4410Y compare1.5 GHz2 / 4 cores2 MB L3
Intel Celeron 3965Y compare1.5 GHz2 / 2 cores2 MB L3
Clock3000 - 4100 MHz2300 MHz
L1 Cache160 KB128 KB
L2 Cache2.5 MB512 KB
L3 Cache6 MB2 MB
Cores / Threads2 / 42 / 4
TDP28 Watt15 Watt
Technology10 nm14 nm
max. Temp.100 °C100 °C
SocketBGA1449BGA
FeaturesDDR4-3200/LPDDR4x-3733 RAM, PCIe 4, 4 GT/s bus, DL Boost, GNA, MMX, SSE, SSE2, SSE3, SSSE3, SSE4.1, SSE4.2, AVX, AVX2, AVX-512, BMI2, ABM, FMA, ADX, VMX, SMEP, SMAP, EIST, TM1, TM2, HT, Turbo, SST, AES-NI, RDRAND, RDSEED, SHADual-Channel LPDDR3-1866/DDR4-2133 Memory Controller, HyperThreading, AVX, AVX2, Quick Sync, Virtualization, AES-NI
iGPUIntel UHD Graphics Xe G4 48EUs (400 - 1250 MHz)Intel HD Graphics 610 (300 - 950 MHz)
Architecturex86x86
Announced
Manufacturerark.intel.comark.intel.com
$161 U.S.

Benchmarks

Performance Rating - CB R15 + R20 + 7-Zip + X265 + Blender + 3DM11 CPU - i3-1115G4
30.5 pt (42%)
Performance Rating - CB R15 + R20 + 7-Zip + X265 + Blender + 3DM11 CPU - Pentium 4415U
18.9 pt (26%)
Cinebench R23 - Cinebench R23 Multi Core
min: 2725     avg: 3038     median: 3125 (3%)     max: 3244 Points
1366 Points (1%)
Cinebench R23 - Cinebench R23 Single Core
min: 1242     avg: 1299     median: 1312 (56%)     max: 1319 Points
529 Points (23%)
Cinebench R20 - Cinebench R20 CPU (Single Core)
min: 504     avg: 507     median: 504.5 (56%)     max: 515 Points
181.3 Points (20%)
Cinebench R20 - Cinebench R20 CPU (Multi Core)
min: 961     avg: 1120     median: 1114 (3%)     max: 1251 Points
356 Points (1%)
Cinebench R15 - Cinebench R15 CPU Multi 64 Bit
min: 384.7     avg: 461.6     median: 480.5 (3%)     max: 507 Points
min: 238     avg: 239.5     median: 239.5 (2%)     max: 241 Points
Cinebench R15 - Cinebench R15 CPU Single 64 Bit
min: 137     avg: 179.9     median: 190 (57%)     max: 197 Points
min: 93     avg: 94     median: 94 (28%)     max: 95 Points
Cinebench R11.5 - Cinebench R11.5 CPU Multi 64 Bit
2.7 Points (4%)
Cinebench R11.5 - Cinebench R11.5 CPU Single 64 Bit
1 Points (25%)
Cinebench R10 - Cinebench R10 Rend. Single (32bit)
8018 Points (48%)
3587 Points (22%)
Cinebench R10 - Cinebench R10 Rend. Multi (32bit)
16265 Points (12%)
8169 Points (6%)
wPrime 2.10 - wPrime 2.0 1024m *
412.8 s (5%)
wPrime 2.10 - wPrime 2.0 32m *
11.8 s (2%)
20.9 s (4%)
WinRAR - WinRAR 4.0
2003 Points (3%)
7-Zip 18.03 - 7-Zip 18.03 Multli Thread 4 runs
min: 11122     avg: 12669     median: 12919.5 (7%)     max: 13422 MIPS
6602 MIPS (4%)
7-Zip 18.03 - 7-Zip 18.03 Single Thread 4 runs
min: 4497     avg: 4586     median: 4599.5 (55%)     max: 4674 MIPS
2575 MIPS (31%)
X264 HD Benchmark 4.0 - x264 Pass 2
26.2 fps (9%)
X264 HD Benchmark 4.0 - x264 Pass 1
141.6 fps (33%)
85.7 fps (20%)
HWBOT x265 Benchmark v2.2 - HWBOT x265 4k Preset
min: 3.25     avg: 3.7     median: 3.7 (7%)     max: 4.1 fps
1.6 fps (3%)
TrueCrypt - TrueCrypt Serpent
0.2 GB/s (0%)
0.1 GB/s (0%)
TrueCrypt - TrueCrypt Twofish
0.4 GB/s (7%)
0.2 GB/s (4%)
TrueCrypt - TrueCrypt AES
2.8 GB/s (7%)
1.4 GB/s (4%)
Blender - Blender 3.3 Classroom CPU *
2408 Seconds (31%)
3786 Seconds (48%)
Blender - Blender 2.79 BMW27 CPU *
min: 940     avg: 1037     median: 1021.5 (7%)     max: 1188 Seconds
2188 Seconds (15%)
R Benchmark 2.5 - R Benchmark 2.5 *
min: 0.636     avg: 0.7     median: 0.7 (14%)     max: 0.671 sec
1.2 sec (26%)
3DMark 06 - CPU - 3DMark 06 - CPU
6331 Points (13%)
3249 Points (7%)
Super Pi mod 1.5 XS 1M - Super Pi mod 1.5 XS 1M *
8.2 s (2%)
16.7 s (4%)
Super Pi mod 1.5 XS 2M - Super Pi mod 1.5 XS 2M *
18.4 s (1%)
Super Pi Mod 1.5 XS 32M - Super Pi mod 1.5 XS 32M *
434.8 s (2%)
3DMark Vantage - 3DM Vant. Perf. CPU no Physx
16869 Points (15%)
9098 Points (8%)
3DMark 11 - 3DM11 Performance Physics
min: 5128     avg: 5771     median: 5579.5 (15%)     max: 6640 Points
min: 2788     avg: 3025     median: 3024.5 (8%)     max: 3261 Points
3DMark - 3DMark Ice Storm Physics
min: 57115     avg: 59888     median: 60028 (49%)     max: 62520 Points
31354 Points (25%)
3DMark - 3DMark Ice Storm Extreme Physics
min: 48647     avg: 55626     median: 56348 (46%)     max: 61883 Points
30220 Points (25%)
3DMark - 3DMark Ice Storm Unlimited Physics
min: 65022     avg: 65592     median: 65591.5 (55%)     max: 66161 Points
31593 Points (27%)
3DMark - 3DMark Cloud Gate Physics
min: 3986     avg: 4871     median: 5038 (13%)     max: 5250 Points
2628 Points (7%)
3DMark - 3DMark Fire Strike Standard Physics
min: 6125     avg: 7184     median: 7331.5 (13%)     max: 7786 Points
3755 Points (7%)
3DMark - 3DMark Time Spy CPU
min: 2227     avg: 2623     median: 2635 (11%)     max: 2937 Points
3DMark - 3DMark Sling Shot Extreme (ES 3.1) Unlimited Physics
5487 Points (21%)
Geekbench 5.5 - Geekbench 5.1 - 5.4 64 Bit Single-Core
min: 1190     avg: 1296     median: 1311.5 (55%)     max: 1352 Points
599 Points (25%)
Geekbench 5.5 - Geekbench 5.1 - 5.4 64 Bit Multi-Core
min: 2341     avg: 2628     median: 2605 (5%)     max: 2983 Points
1374 Points (2%)
Geekbench 5.0 - Geekbench 5.0 64 Bit Single-Core
1328 Points (6%)
Geekbench 5.0 - Geekbench 5.0 64 Bit Multi-Core
2399 Points (8%)
Geekbench 4.4 - Geekbench 4.1 - 4.4 64 Bit Single-Core
5601 Points (56%)
2943 Points (29%)
Geekbench 4.4 - Geekbench 4.1 - 4.4 64 Bit Multi-Core
9945 Points (11%)
5630 Points (6%)
Geekbench 4.0 - Geekbench 4.0 64 Bit Single-Core
2816 Points (38%)
Geekbench 4.0 - Geekbench 4.0 64 Bit Multi-Core
5455 Points (13%)
Geekbench 3 - Geekbench 3 32 Bit Multi-Core
5270 Points (9%)
Geekbench 3 - Geekbench 3 32 Bit Single-Core
2510 Points (49%)
Geekbench 3 - Geekbench 3 64 Bit Multi-Core
5481 Points (9%)
Geekbench 3 - Geekbench 3 64 Bit Single-Core
2625 Points (39%)
Geekbench 2 - 32 Bit - Geekbench Stream
7986 Points (64%)
Geekbench 2 - 32 Bit - Geekbench Memory
6662 Points (60%)
Geekbench 2 - 32 Bit - Geekbench Floating Point
5132 Points (10%)
Geekbench 2 - 32 Bit - Geekbench Integer
5122 Points (10%)
Geekbench 2 - 32 Bit - Geekbench Total Score
5719 Points (15%)
Mozilla Kraken 1.1 - Kraken 1.1 Total Score *
min: 657.9     avg: 749     median: 755 (1%)     max: 805 ms
min: 1652     avg: 1697     median: 1696.5 (2%)     max: 1741 ms
Sunspider - Sunspider 1.0 Total Score *
145.8 ms (2%)
119.1 ms (1%)
Octane V2 - Octane V2 Total Score
min: 49170     avg: 55606     median: 58151 (52%)     max: 59497 Points
21322 Points (19%)
WebXPRT 4 - WebXPRT 4 Score
152.3 Points (44%)
82.2 Points (24%)
WebXPRT 3 - WebXPRT 3 Score
min: 200     avg: 213.7     median: 204.5 (43%)     max: 257 Points
110.2 Points (23%)
PCMark for Android - PCM f. Android Storage 2.0 score
20509 Points (32%)
PCMark for Android - PCM f. Android Work Score 3.0
11801 Points (55%)
CrossMark - CrossMark Overall
min: 950     avg: 1029     median: 1033 (40%)     max: 1094 Points
CrXPRT 2 - CrXPRT2 Performance Score
147 Points (81%)
Power Consumption - Prime95 Power Consumption - external Monitor *
min: 24.7     avg: 36.1     median: 35.2 (6%)     max: 44.6 Watt
Power Consumption - Cinebench R15 Multi Power Consumption - external Monitor *
min: 25.6     avg: 36.3     median: 39.1 (7%)     max: 41.3 Watt
Power Consumption - Geekbench 5.5 Power Consumption 150cd *
22.5 Watt (10%)
Power Consumption - Idle Power Consumption - external Monitor *
3.7 Watt (2%)
Power Consumption - Idle Power Consumption 150cd 1min *
min: 5.66     avg: 6.2     median: 5.8 (6%)     max: 7.67 Watt
Power Consumption - Cinebench R15 Multi Power Efficiency - external Monitor
min: 12.1     avg: 13.5     median: 12.8 (10%)     max: 16.3 Points per Watt

Average Benchmarks Intel Core i3-1115G4 → 100% n=41

Average Benchmarks Intel Pentium Gold 4415U → 61% n=41

- Bereich der Benchmarkergebnisse für diese Grafikkarte
- Durchschnittliche Benchmarkergebnisse für diese Grafikkarte
* Smaller numbers mean a higher performance
1 This benchmark is not used for the average calculation

Add one or more devices and compare

In the following list you can select (and also search for) devices that should be added to the comparison. You can select more than one device.

restrict list:

show all (including archived), 2024, 2023
v1.26
log 19. 13:46:36

#0 checking url part for id 12242 +0s ... 0s

#1 checking url part for id 9292 +0s ... 0s

#2 not redirecting to Ajax server +0s ... 0s

#3 did not recreate cache, as it is less than 5 days old! Created at Sun, 19 May 2024 05:35:32 +0200 +0.001s ... 0.001s

#4 composed specs +0.027s ... 0.028s

#5 did output specs +0s ... 0.029s

#6 getting avg benchmarks for device 12242 +0.016s ... 0.044s

#7 got single benchmarks 12242 +0.068s ... 0.113s

#8 getting avg benchmarks for device 9292 +0.015s ... 0.128s

#9 got single benchmarks 9292 +0.018s ... 0.145s

#10 got avg benchmarks for devices +0s ... 0.145s

#11 min, max, avg, median took s +0.313s ... 0.459s

#12 return log +0.024s ... 0.482s

Teilen Sie diesen Artikel, um uns zu unterstützen. Jeder Link hilft!
> Notebook Test, Laptop Test und News > Benchmarks / Technik > Benchmarks / Technik > Prozessor Vergleich - Head 2 Head
Autor: Klaus Hinum,  8.09.2017 (Update:  1.07.2023)