 Deutsch
 English
 Español
 Français
 Italiano
 Nederlands
 Polski
 Português
 Русский
 Türkçe
 Svenska
 Chinese
 Magyar
2022 HP Envy 16 Laptop Test: Für Multimedia-User, Gamer, Kreative und alle dazwischen
Der letztjährige 15,6-Zoll-Envy-15 wird durch den Envy 16 ersetzt, mit Letzterem wagt sich HP mit Intel CPUs der 12. Generation sowie dedizierten GPUs von Nvidia und Intel in den 16-Zoll-Bereich. Im Vergleich zur günstigeren Pavilion Serie ist die Envy Serie dafür gemacht, mit weniger Plastik, generell besserer Performance und besserer Verarbeitung den High-End-Bedürfnissen zu entsprechen.
Unsere Konfiguration ist eine High-End-SKU mit einem Core i7-12700h, Geforce RTX 3060 und einem 2.400p-OLED-Touchscreen für ca. 1.750 Euro. Andere Konfigurationen sind u.a. mit einem langsameren Core i-12500H, einem schnelleren Core i9-12900H, Intel Arc A370M oder einem 1.600p-IPS-Display zwischen ca. 1.200 und 2.450 Euro erhältlich.
Alternativen zum Envy 16 sind andere High-End-Prosumer-Laptops wie die der Dell-XPS-15-Serie, wie das MacBook Pro 16, das Huawei MateBook 16s oder das LG Gram 16.
Mehr HP Tests:
Potenzielle Konkurrenten im Vergleich
Bew. | Datum | Modell | Gewicht | Dicke | Größe | Auflösung | Preis ab |
|---|---|---|---|---|---|---|---|
| 86.9 % | 10.2022 | HP Envy 16 h0112nr i7-12700H, GeForce RTX 3060 Laptop GPU | 2.3 kg | 19.8 mm | 16.00" | 3840x2400 | |
| 88.4 % | 09.2022 | Lenovo ThinkBook 16 G4+ IAP i7-12700H, GeForce RTX 2050 Mobile | 1.8 kg | 16.5 mm | 16.00" | 2560x1600 | |
| 83.7 % | 06.2022 | MSI Creator Z16P B12UHST i9-12900H, GeForce RTX 3080 Ti Laptop GPU | 2.4 kg | 20.4 mm | 16.00" | 2560x1600 | |
| 82.6 % | 11.2021 | Dell Inspiron 16 Plus 7610-MHJ8F i7-11800H, UHD Graphics Xe 32EUs (Tiger Lake-H) | 2 kg | 19 mm | 16.00" | 3072x1920 | |
| 93.2 % | 11.2021 | Apple MacBook Pro 16 2021 M1 Pro M1 Pro, M1 Pro 16-Core GPU | 2.2 kg | 16.8 mm | 16.20" | 3456x2234 | |
| 86.4 % | 07.2022 | Huawei MateBook 16s i7 i7-12700H, Iris Xe G7 96EUs | 2 kg | 17.8 mm | 16.00" | 2520x1680 |
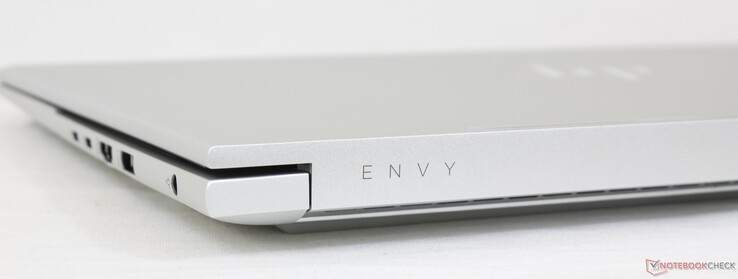
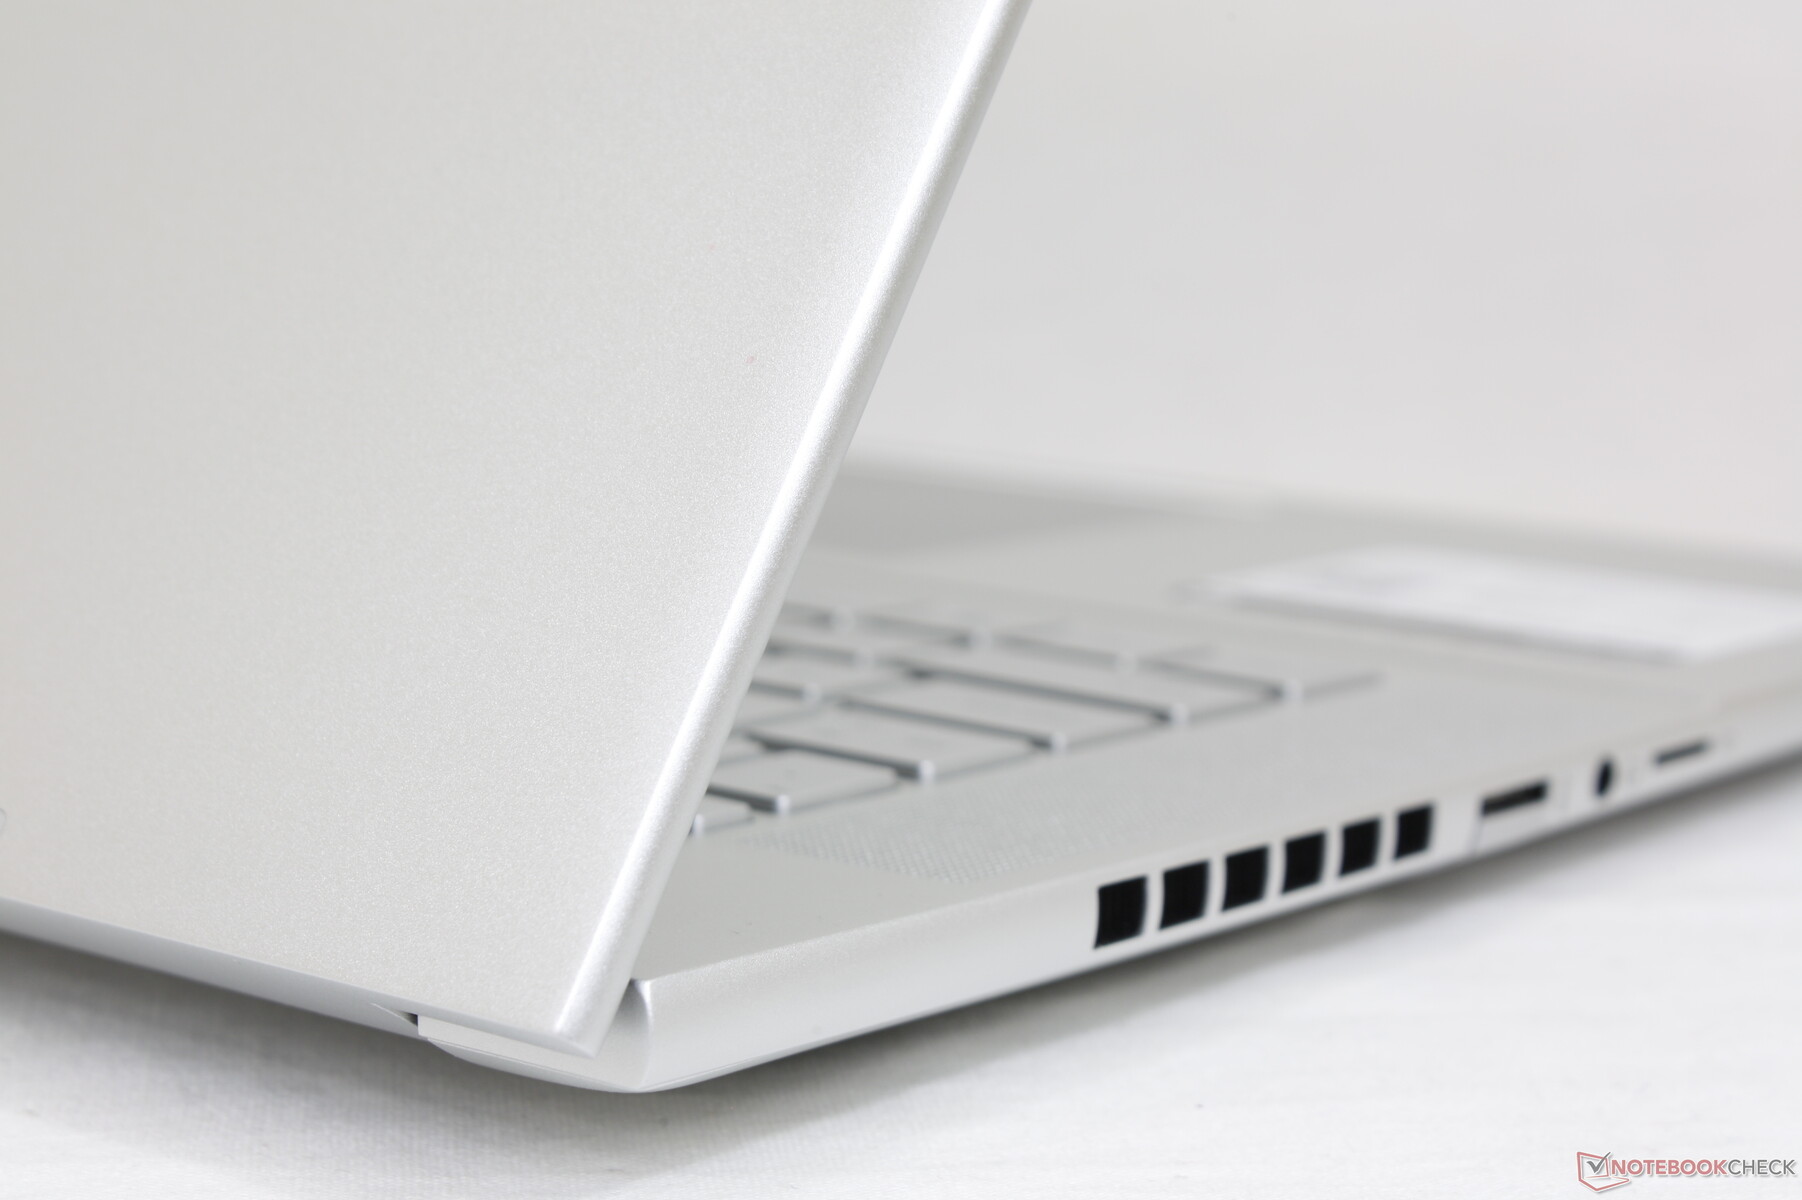
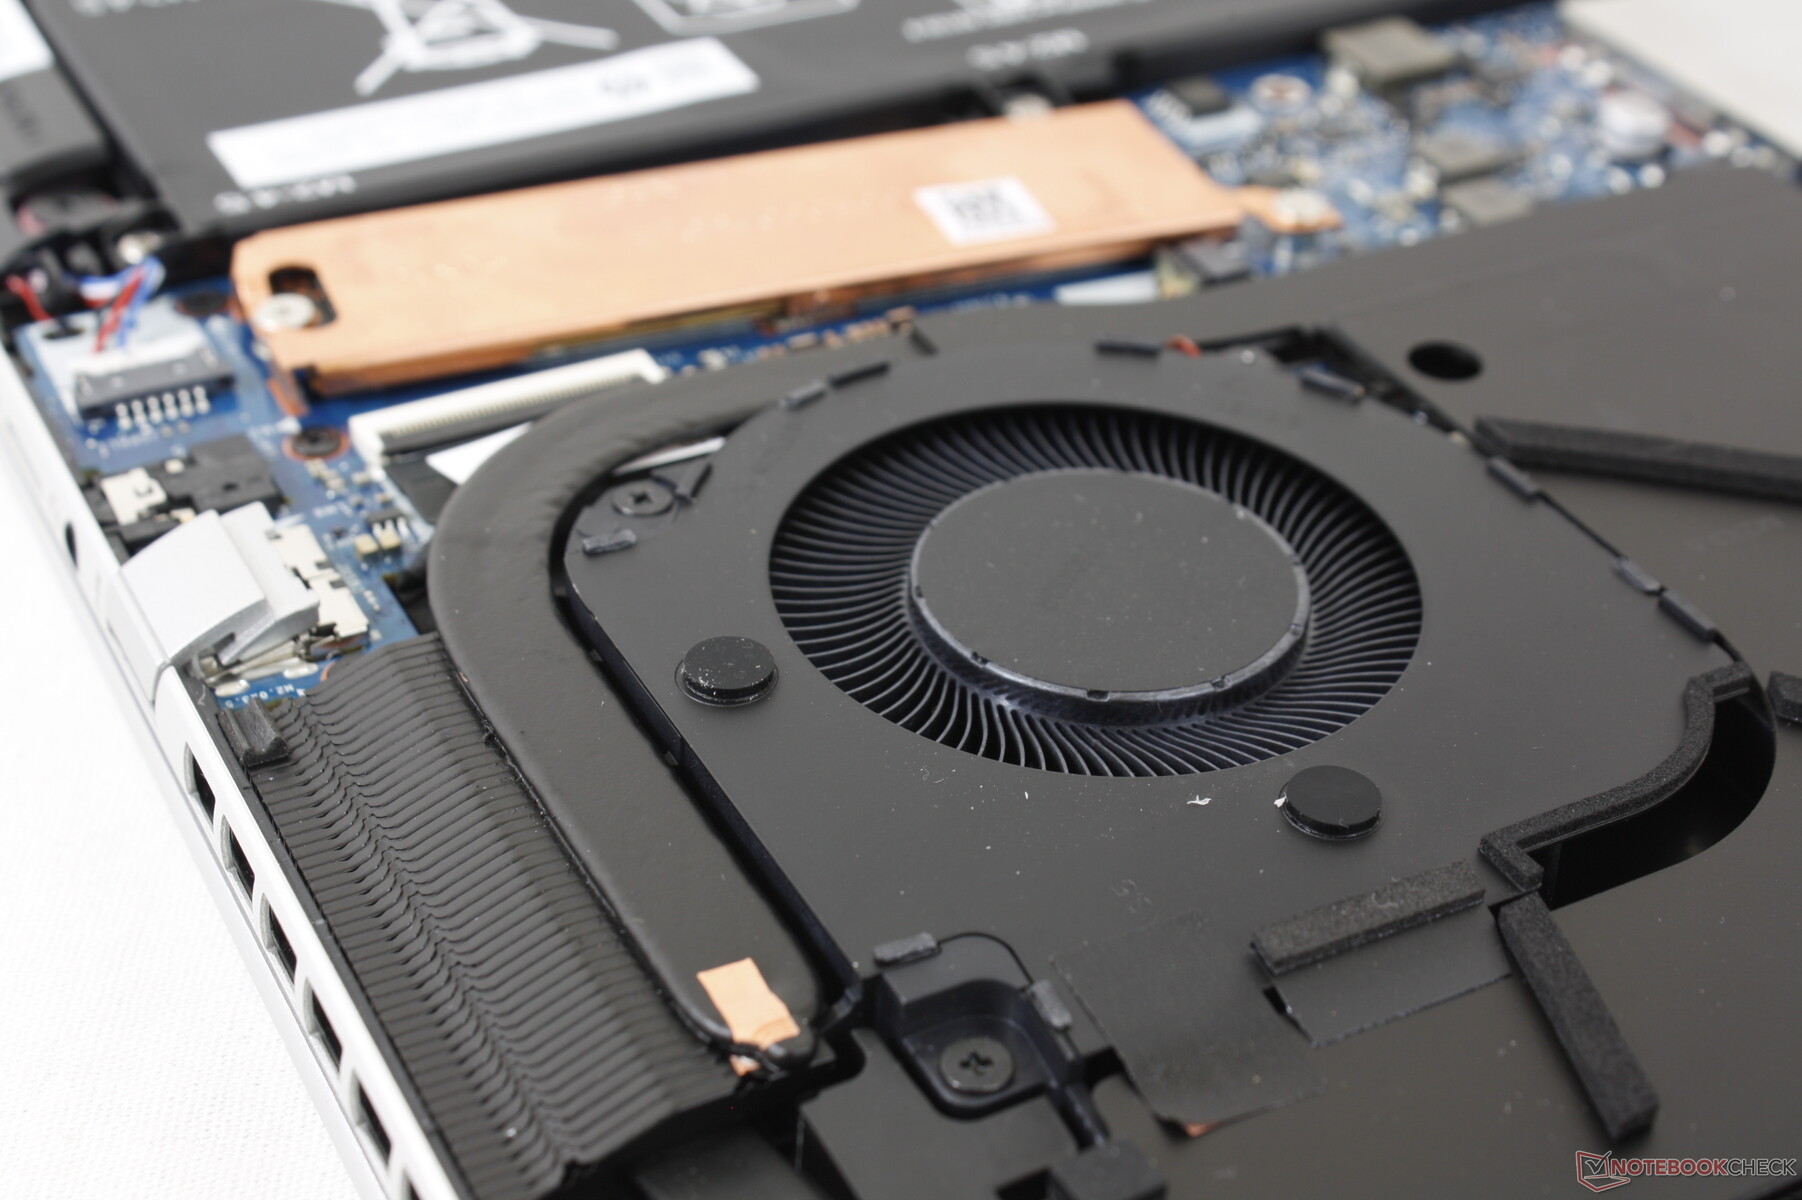
Gehäuse - Gleiche Farben mit vielen Verbesserungen
Der Envy 16 mag mit den gleichen Farbprofilen gleich wie der Envy 15 aussehen, allerdings gibt es viele Unterschiede - im Innen- als auch im Außenleben. Am markantesten stechen die runderen Ecken heraus, verglichen mit dem kantigeren, flacheren Envy-15-Design. Der Ventilationsteil auf der Unterseite ist jetzt angehoben anstatt flach, siehe Bilder unten. Die Handballenauflage und die Lautsprecher haben ebenfalls ein neues Design. Ein paar dieser Änderungen scheinen oberflächlich, andere Verbesserungen sollten allerdings die Belüftung des Gerätes fördern.
Die Qualität des Gehäuses verbleibt von gleicher Qualität wie beim 2020er Envy 15, trotz Vergrößerung. Es zeigen sich bei Verbiegungsversuchen nur kleine Rückstände. Ebenfalls ist der Deckel dank dem Randlos-Display und der Aluminiumverarbeitung recht stabil. Die zwei Scharniere schwanken ein wenig mehr als bei der ZenBook-Pro-Serie oder beim Razer Blade 15 und könnten stabiler sein.


Das 2022er-Modell ist dicker, schwerer und größer als das 2020er-Modell, sichtbar auf dem Vergleich unten. Unerwartet ist die Änderung in der Größe nicht, wenn man die Änderung von 15,6 auf 16 Zoll beachtet. Der HP Envy 16 ist schwerer und größer als konkurrierende Modelle wie das MacBook Pro 16, das Huawei MateBook 16s oder der Dell Inspiron 16 Plus 7610.

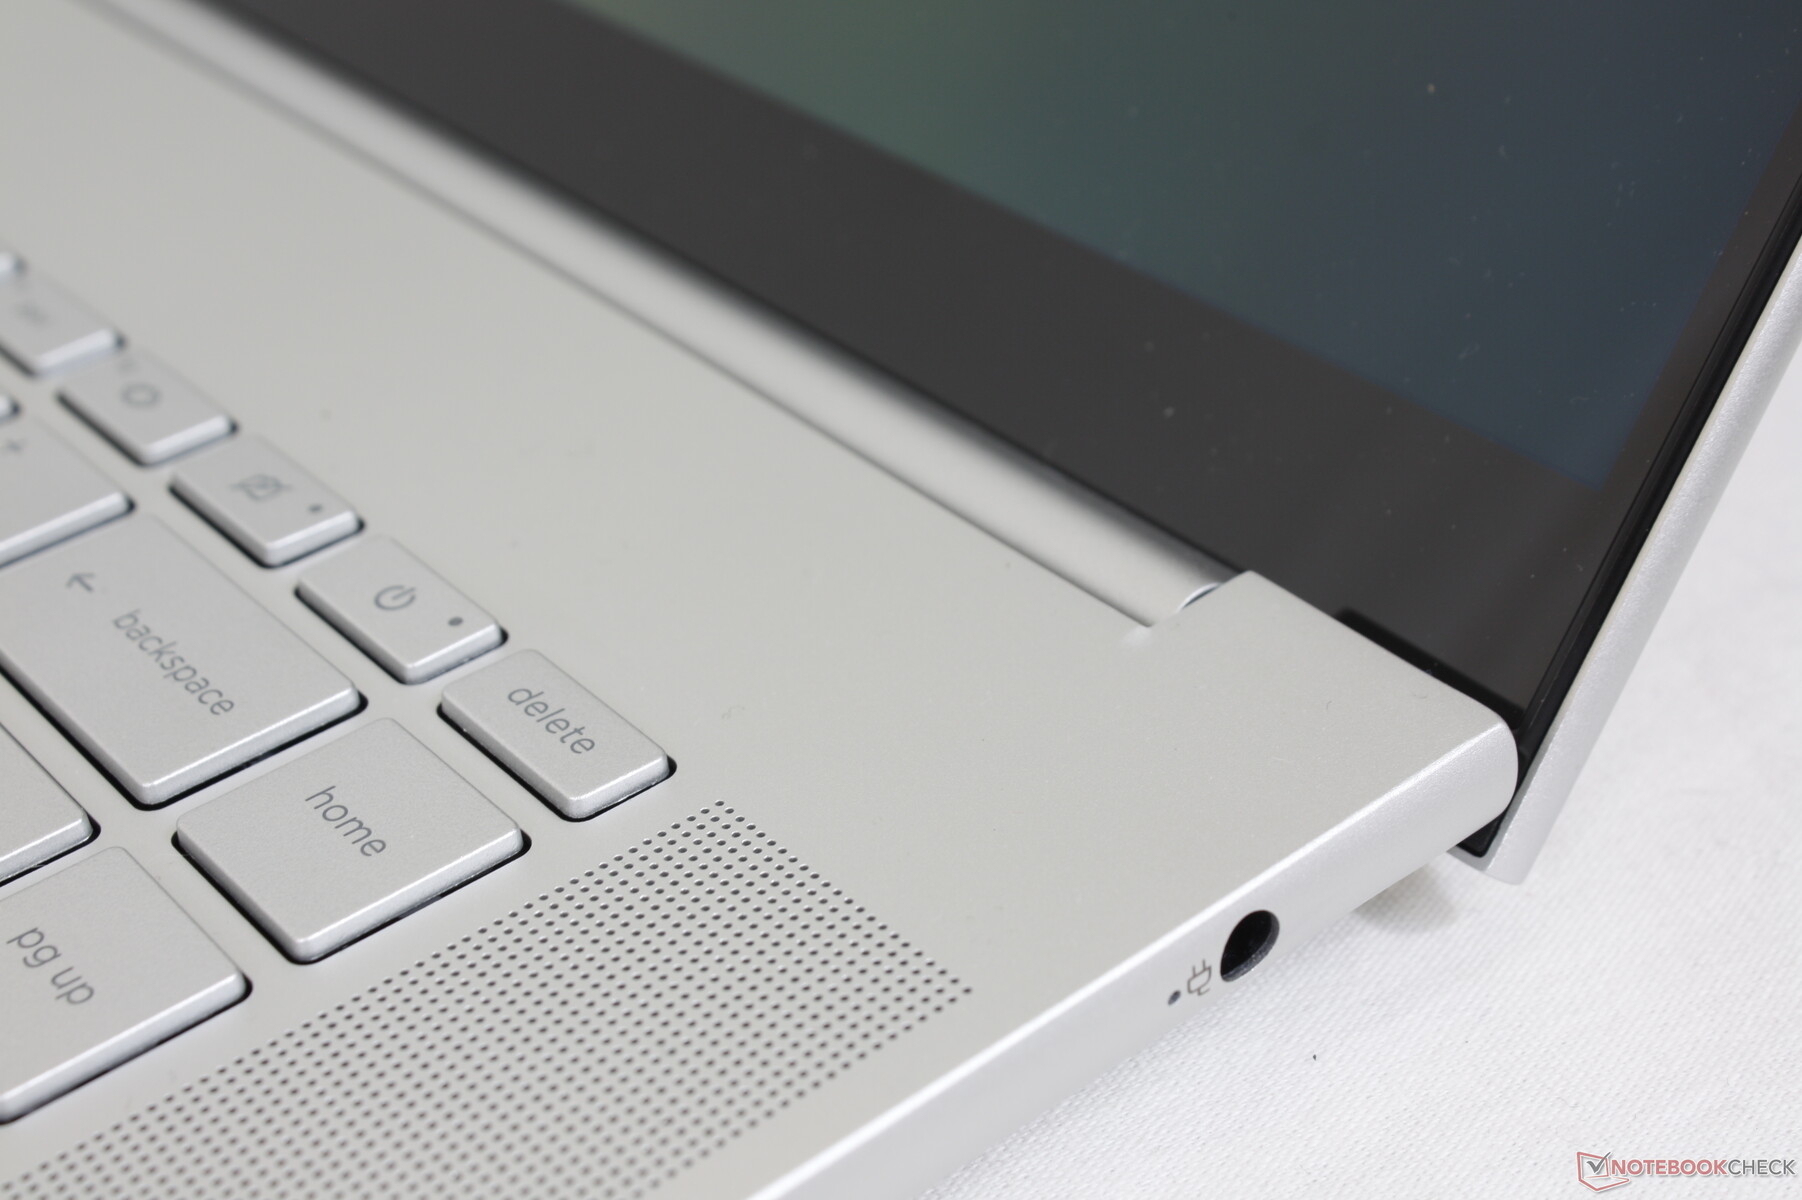


Konnektivität - Thunderbolt-4-Support
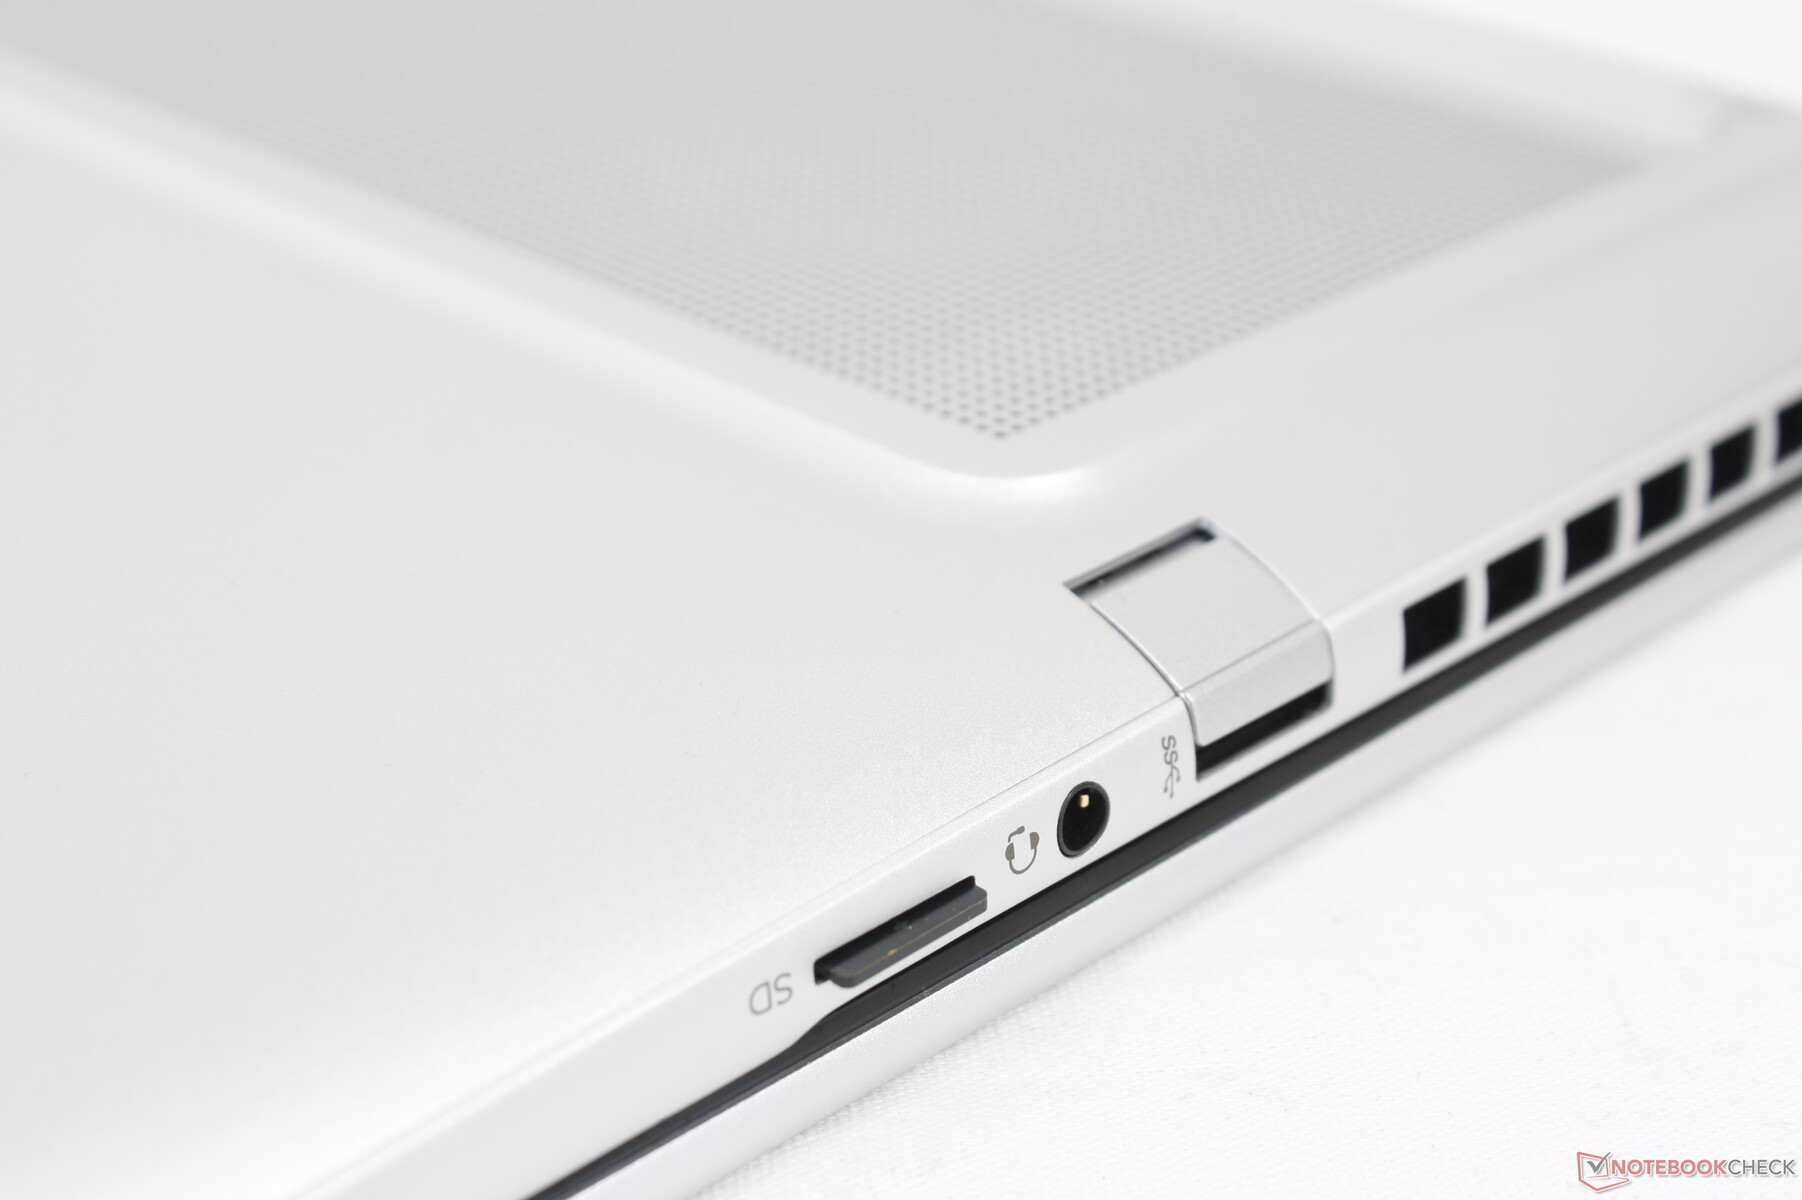
Man findet alle Anschlüsse des 2020er Envy auch beim 2022er-Modell, allerdings haben sich deren Positionen verändert. Der Großteil der Anschlüsse befindet sich nun auf der rechten Seite des Gehäuses anstatt auf der Linken. Nervig: Es gibt immer noch keinen Kensington-Lock-Slot.


SD-Kartenleser
Die Transfer-Geschwindigkeiten des integrierten microSD-Kartenlesers sind durchschnittlich. Der Transfer von 1 GB Bildern von unserer UHS-II-Karte zum Desktop dauerte 17 Sekunden.
| SD Card Reader | |
| average JPG Copy Test (av. of 3 runs) | |
| Apple MacBook Pro 16 2021 M1 Pro (Angelbird AV Pro V60) | |
| Lenovo ThinkBook 16 G4+ IAP (Angelbird AV Pro V60) | |
| MSI Creator Z16P B12UHST (AV PRO microSD 128 GB V60) | |
| HP Envy 16 h0112nr (AV Pro SD microSD 128 GB V60) | |
| Dell Inspiron 16 Plus 7610-MHJ8F (AV Pro SD microSD 128 GB V60) | |
| maximum AS SSD Seq Read Test (1GB) | |
| Lenovo ThinkBook 16 G4+ IAP (Angelbird AV Pro V60) | |
| HP Envy 16 h0112nr (AV Pro SD microSD 128 GB V60) | |
| Dell Inspiron 16 Plus 7610-MHJ8F (AV Pro SD microSD 128 GB V60) | |
Kommunikation
Ein Intel AX211 kommt standardmäßig mit Wi-Fi 6E und Bluetooth 5.2. In Verbindung mit unserem 6-GHz-Netzwerk gab es keine Probleme.

| Networking | |
| iperf3 transmit AX12 | |
| Dell Inspiron 16 Plus 7610-MHJ8F | |
| Apple MacBook Pro 16 2021 M1 Pro | |
| iperf3 receive AX12 | |
| Dell Inspiron 16 Plus 7610-MHJ8F | |
| Apple MacBook Pro 16 2021 M1 Pro | |
| iperf3 receive AXE11000 6GHz | |
| Huawei MateBook 16s i7 | |
| HP Envy 16 h0112nr | |
| iperf3 receive AXE11000 | |
| MSI Creator Z16P B12UHST | |
| Lenovo ThinkBook 16 G4+ IAP | |
| Apple MacBook Pro 16 2021 M1 Pro | |
| iperf3 transmit AXE11000 6GHz | |
| Huawei MateBook 16s i7 | |
| HP Envy 16 h0112nr | |
Webcam — 5 MP!
Ein Webcam-Shutter kommt als Standard inkl. Unterstützung für Windows Hello.


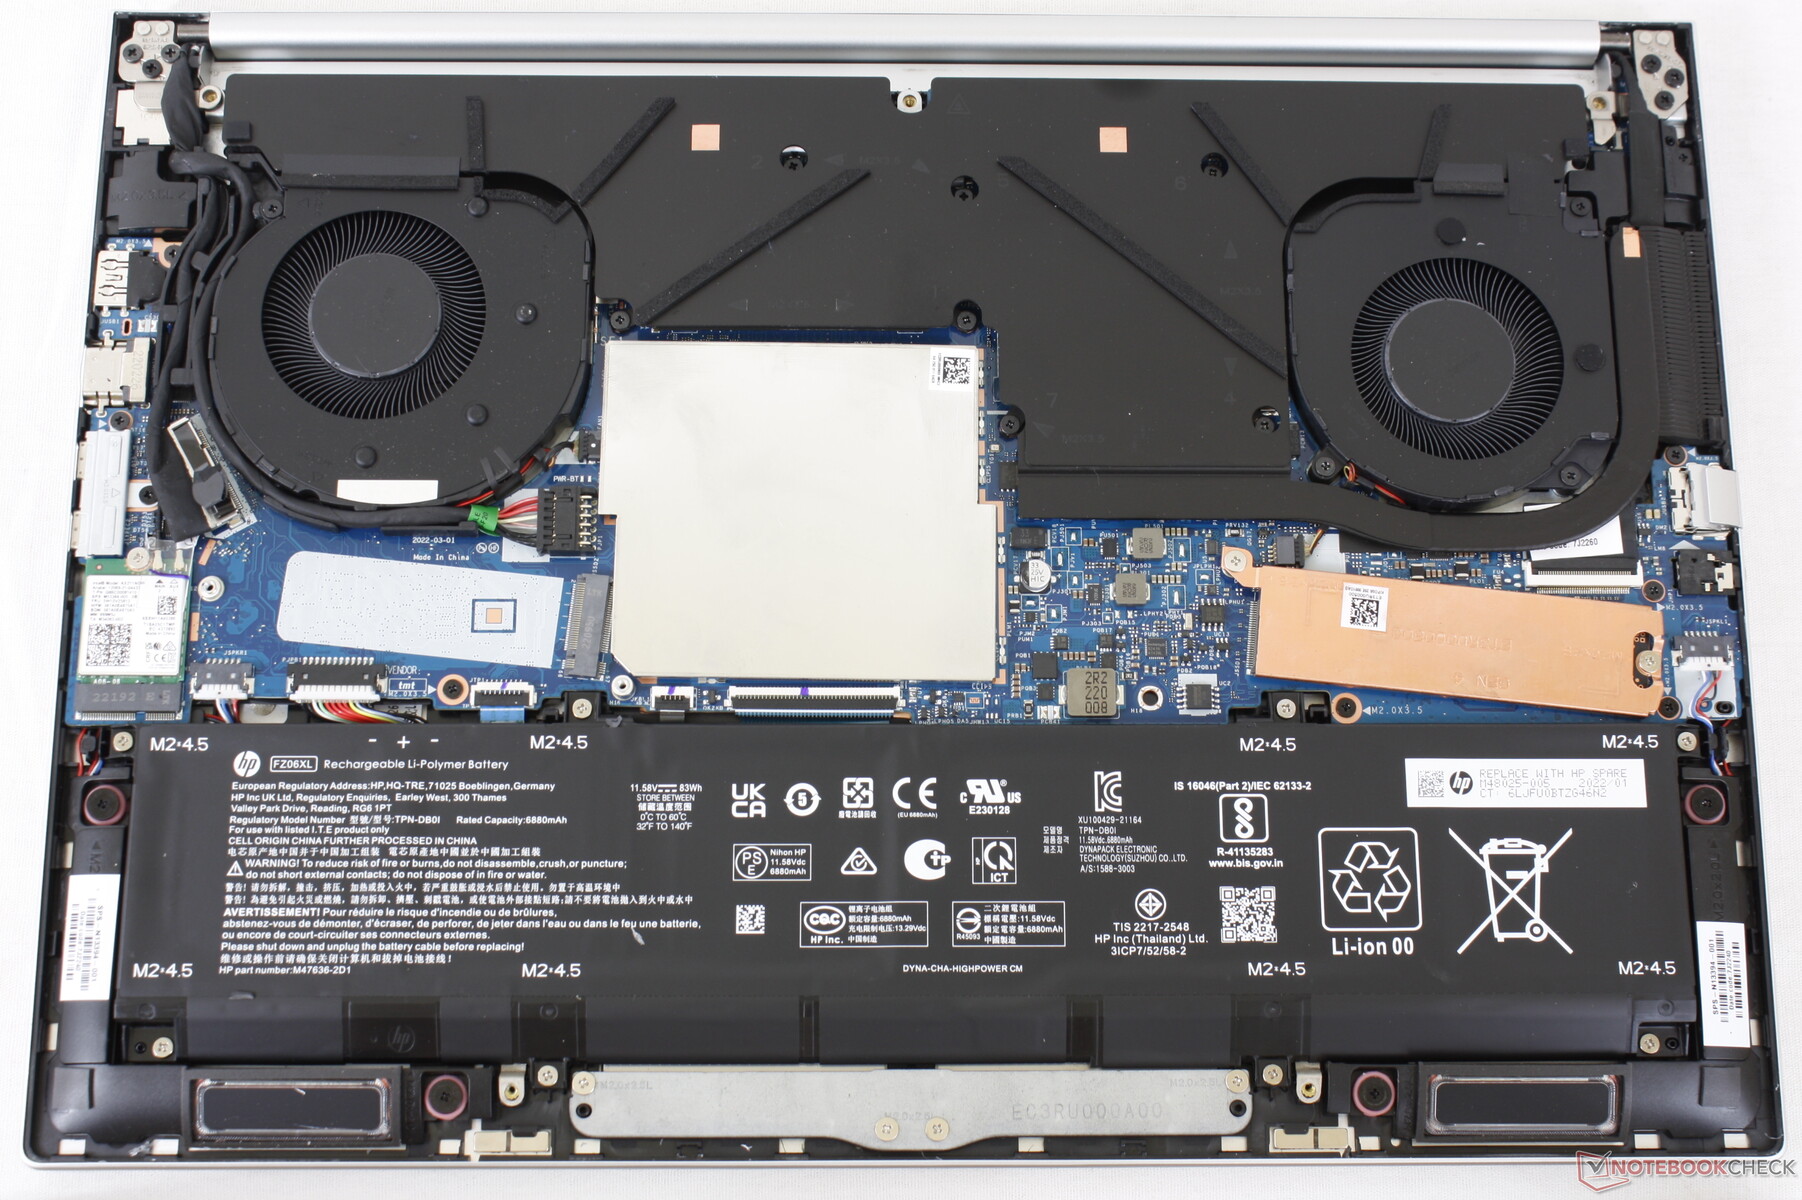
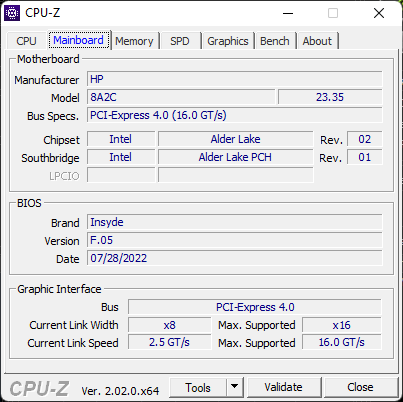
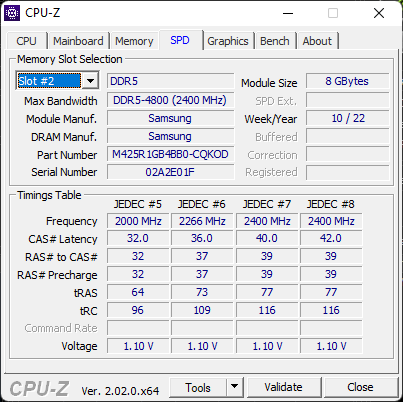
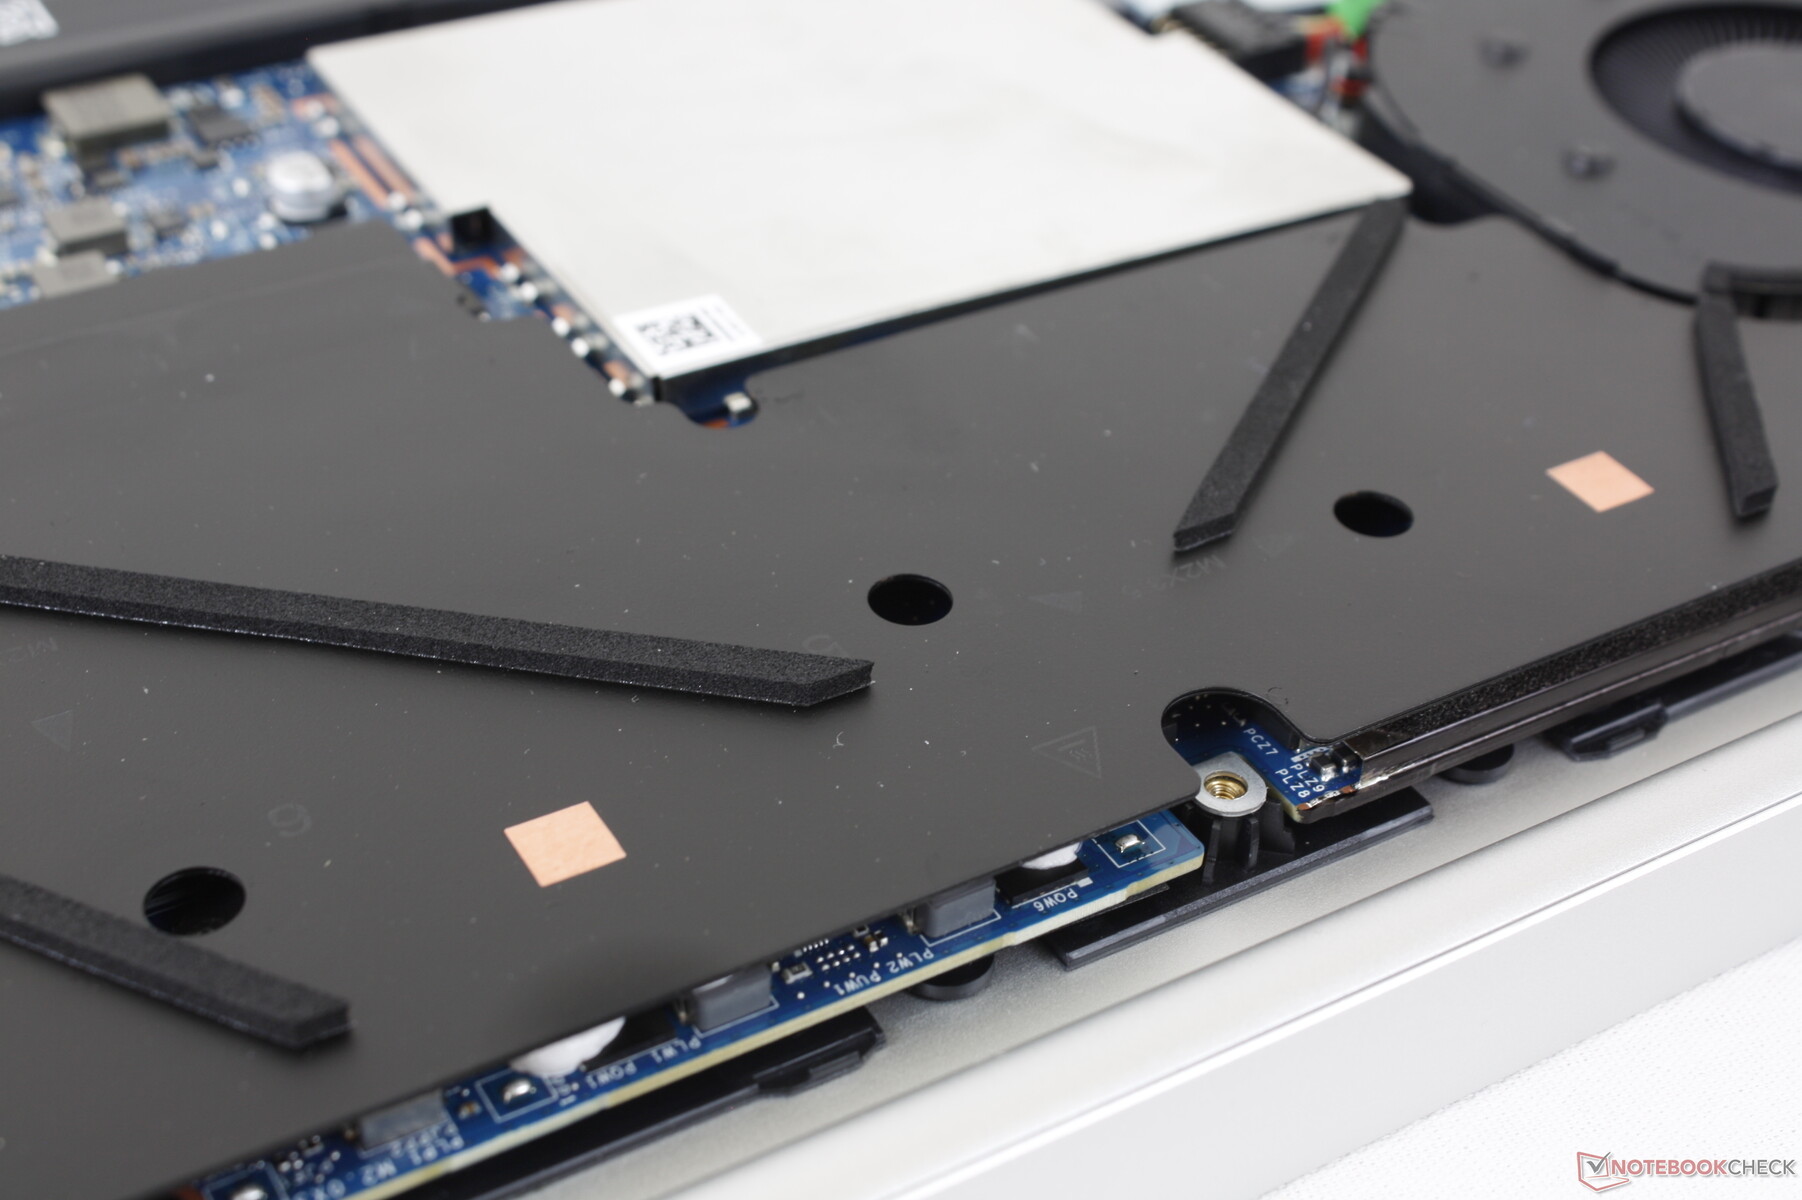
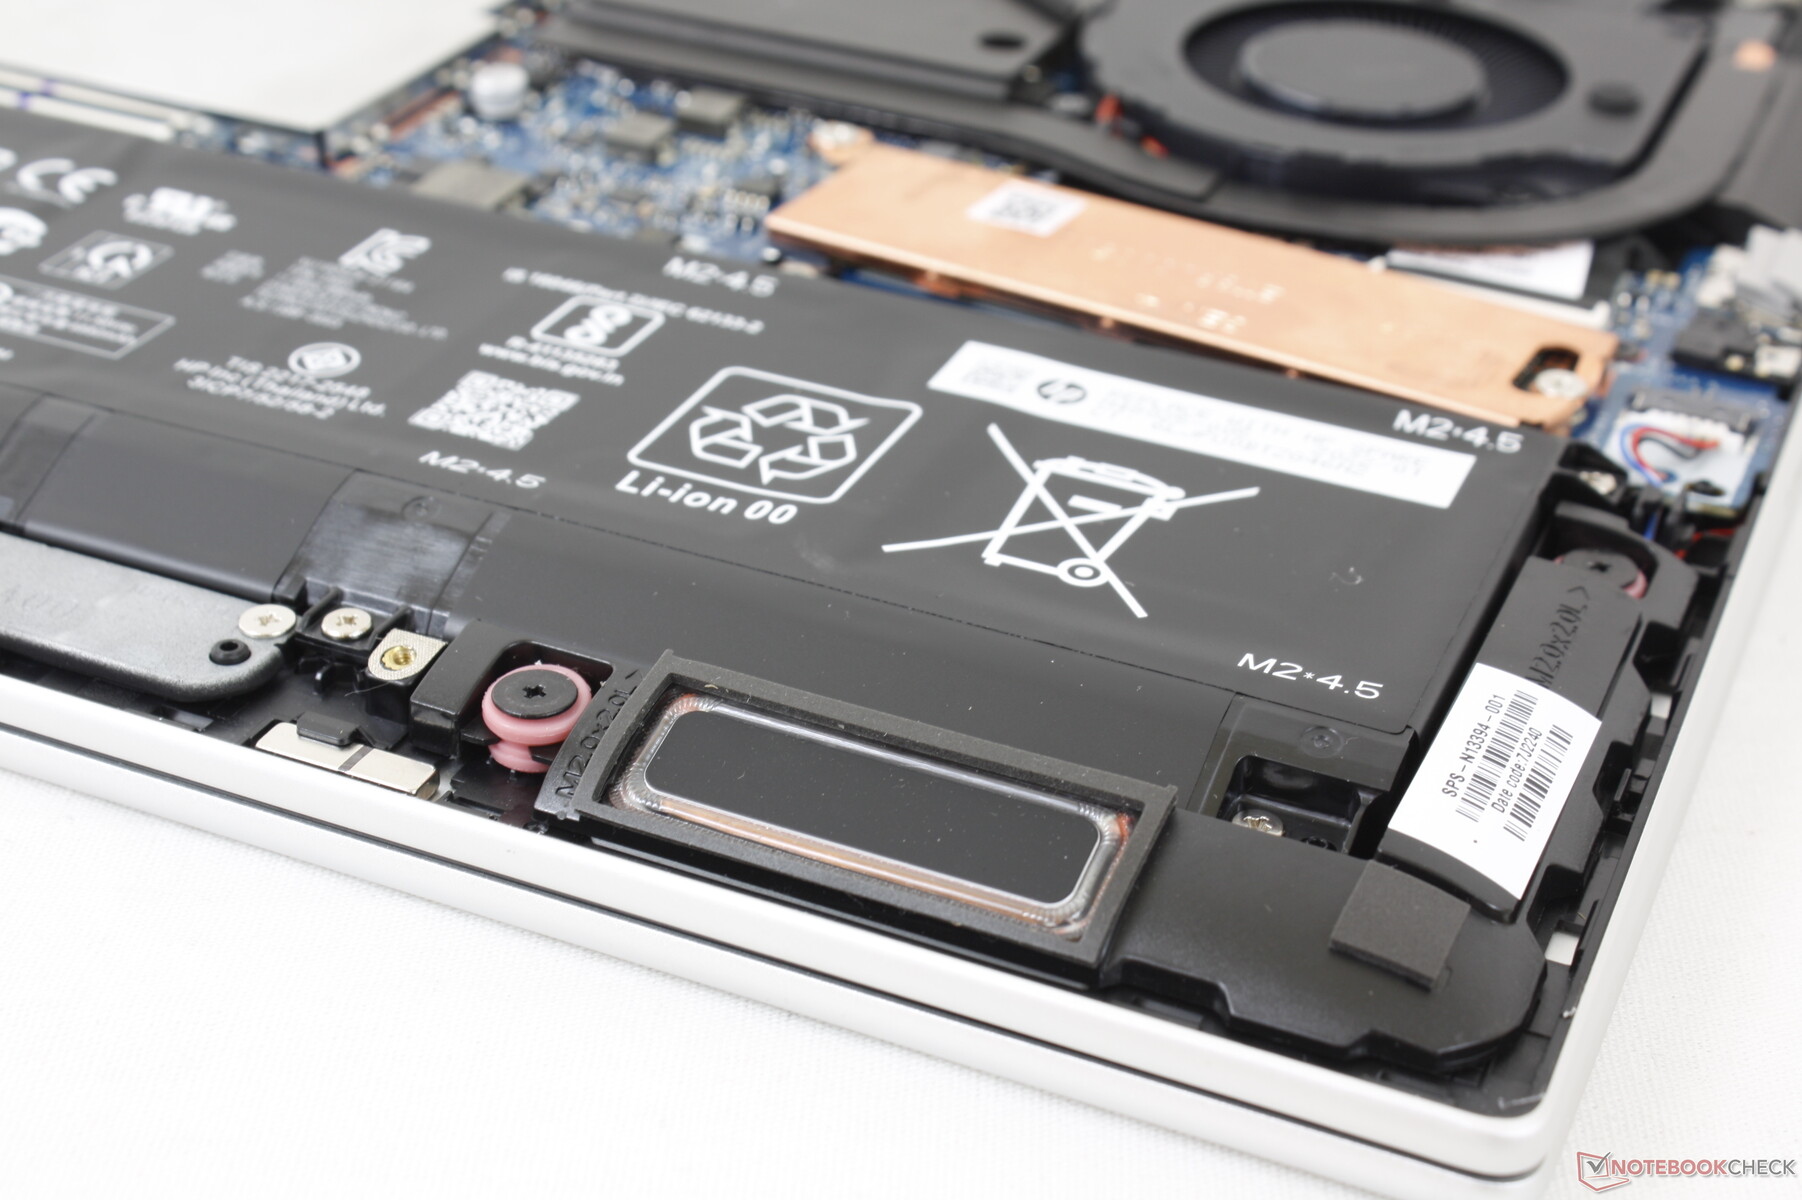
Wartung
Die Unterseite ist mit nur fünf Torx-Schrauben für einfache Wartung fixiert. HP bietet sogar YouTube Videos an, die Step by Step zeigen, wie man die Unterseite demontiert. Anwender können auf die zwei SODIMM-Slots, die zwei Massenspeicher-Slots und auf das WLAN-Modul zugreifen, sobald die Unterseite geöffnet wurde.
Zubehör und Garantie
Außer dem üblichen Papierkram und dem Netzteil findet man kein Zubehör. Abgesehen von der gesetzlichen Garantie bietet der Hersteller eine 1-Jahres-Garantie.
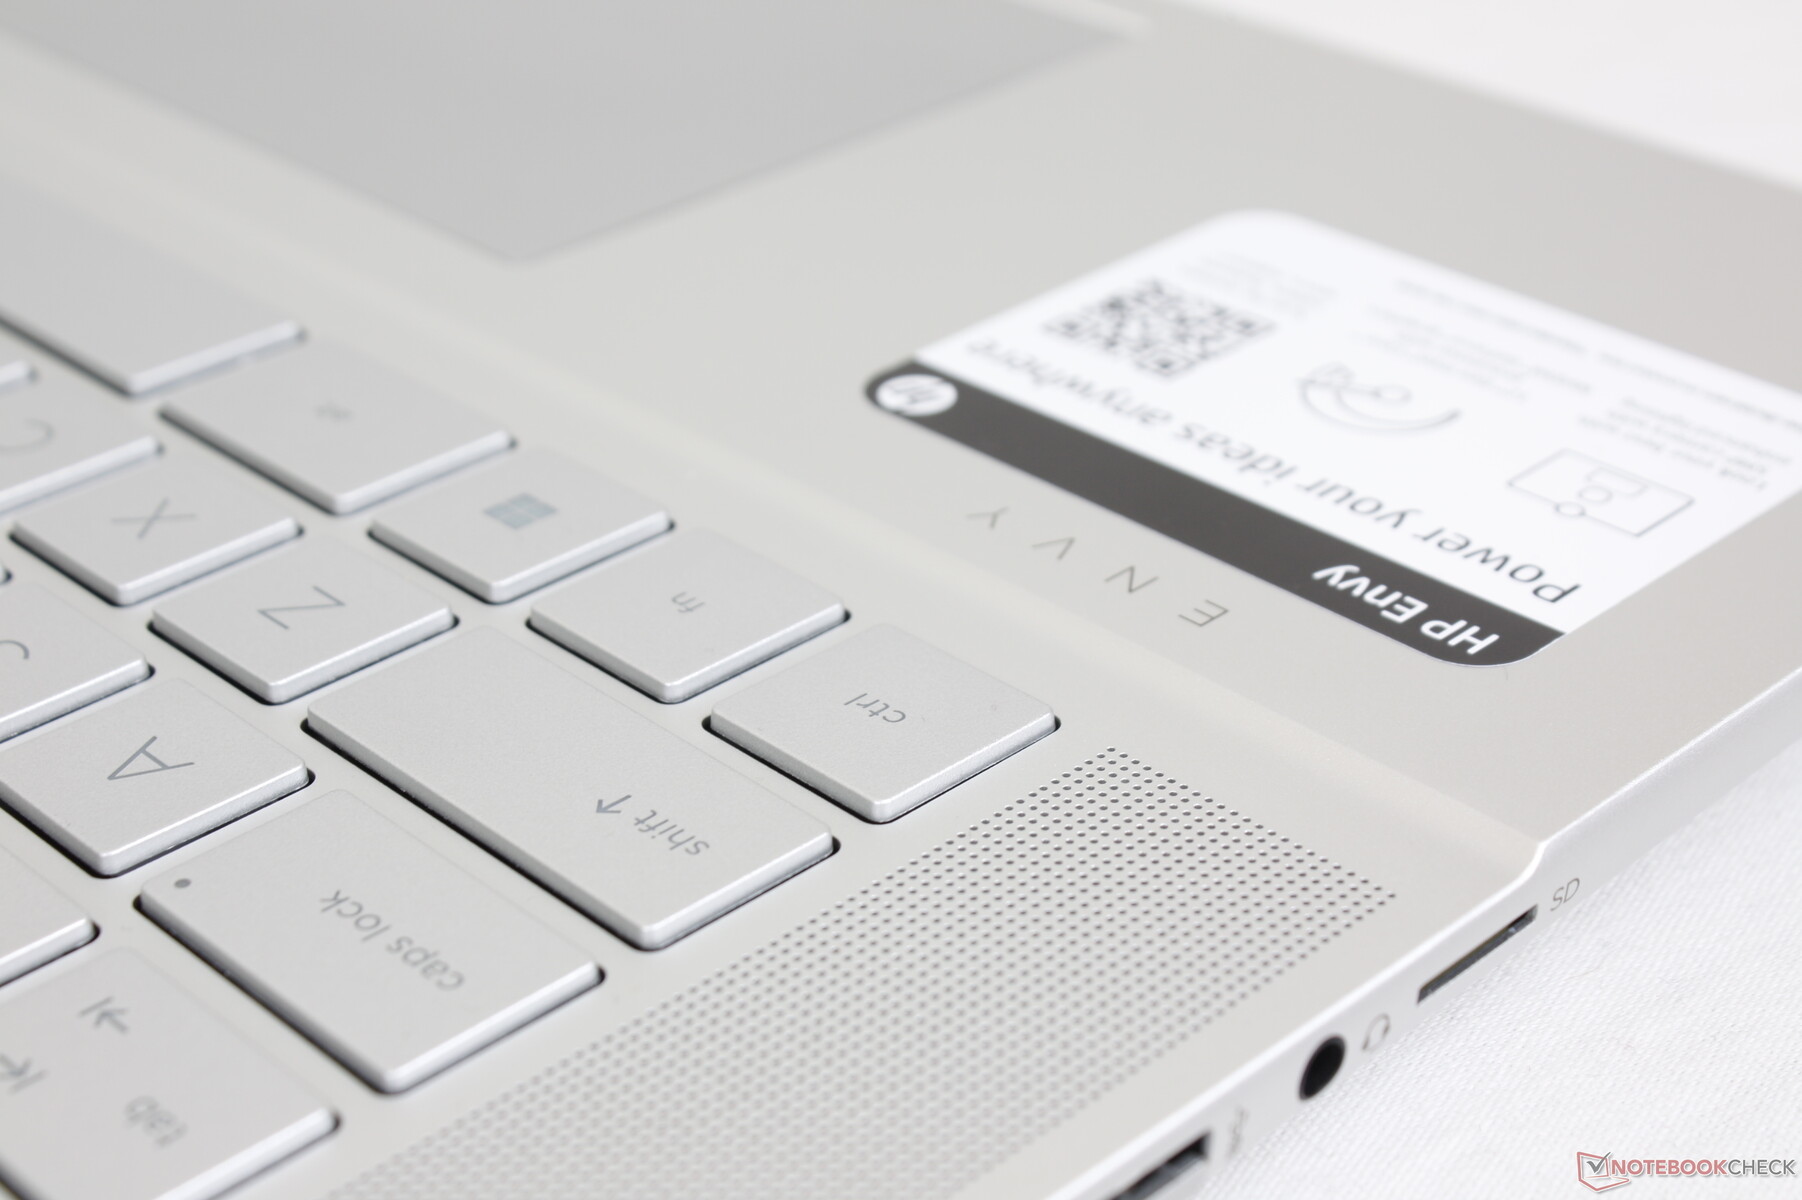
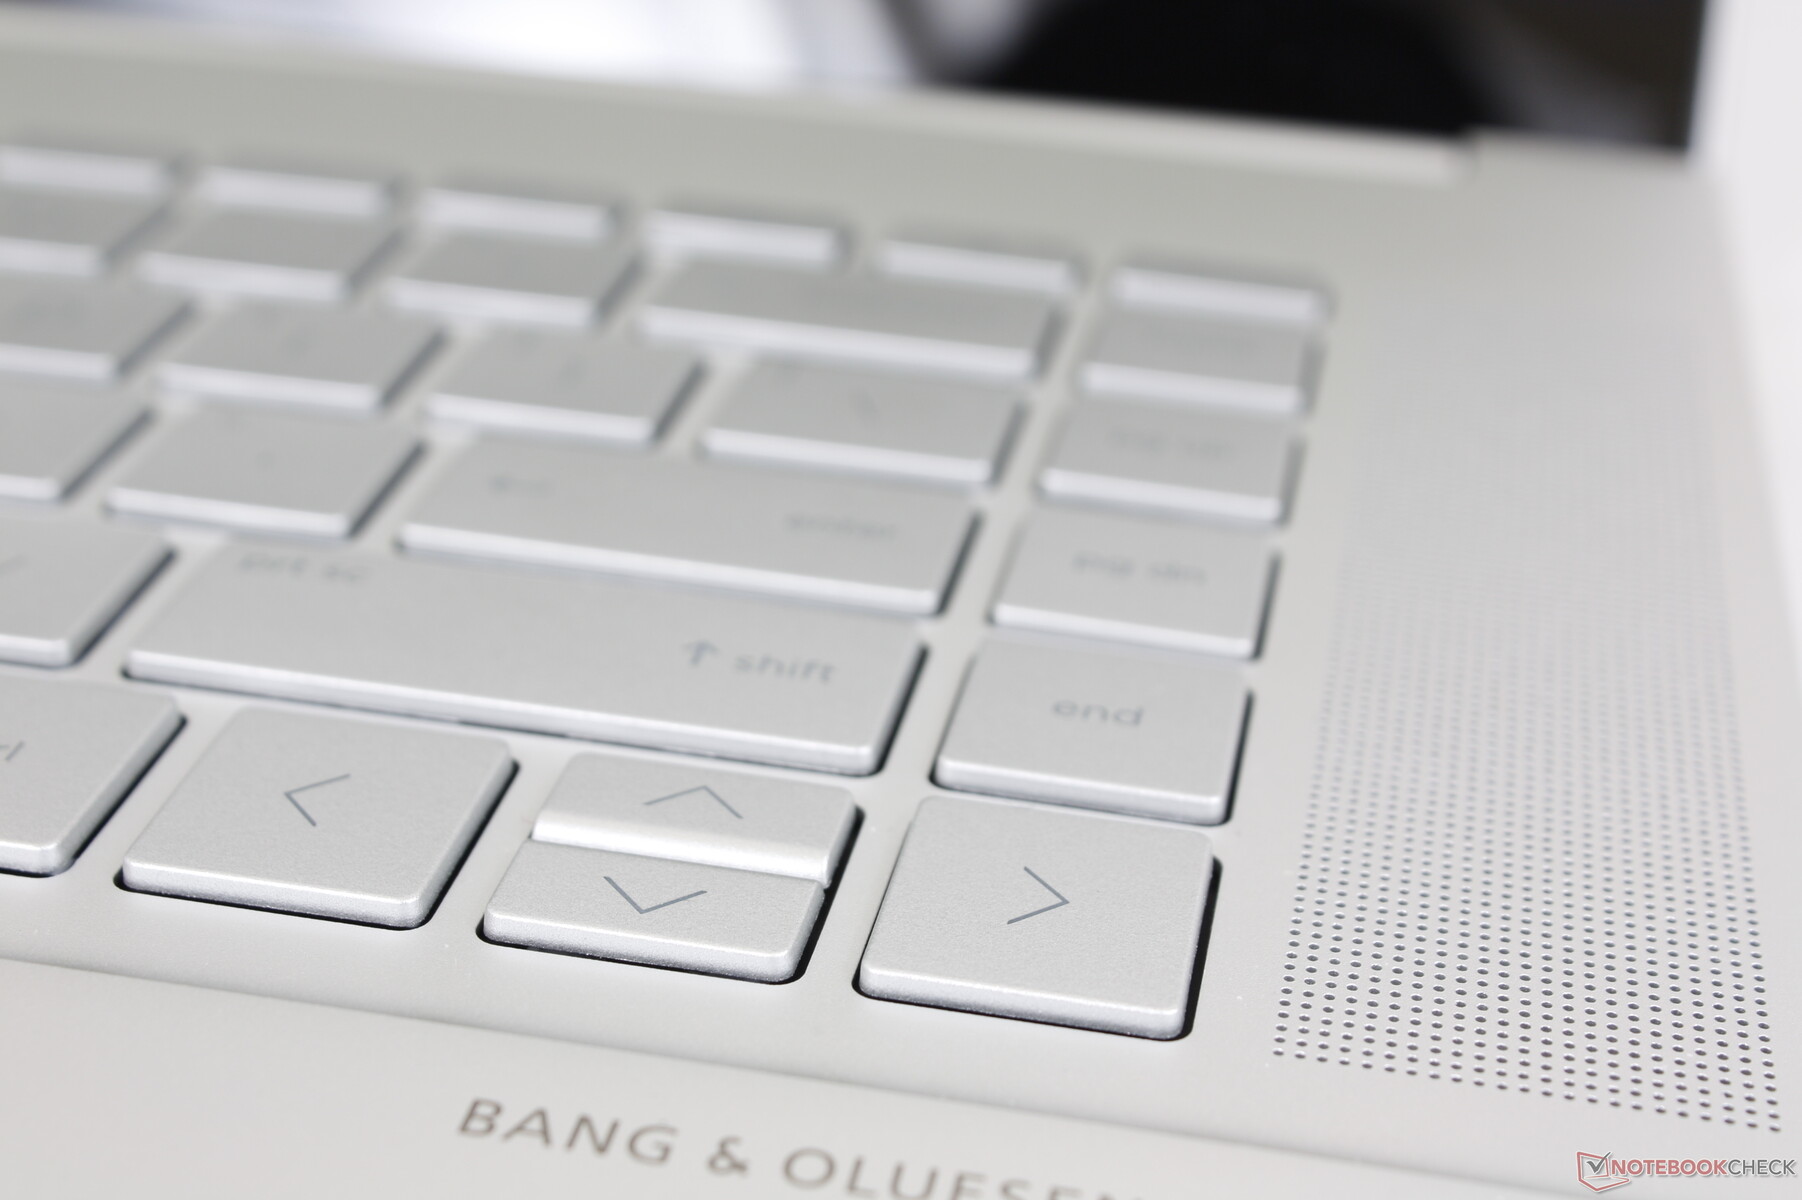
Eingabegeräte - Größeres Touchpad, vertraute Tastatur
Tastatur
Zwei kleine Änderungen sind hier zu erwähnen: Die Sekundärfunktion der F12-Taste startet jetzt die "System Event Utility"-Funktion, welche eigentlich nur eine Schnellfunktion für das HP Command Center, Omen Gaming Hub, myHP und HP Palette ist. Außerdem öffnet die Sekundär-Funktion der F1-Taste nun ein Pop-up, bei dem man Emojis und GIFs auswählen kann, ähnlich wie beim neuesten Pavilion.
Touchpad
Beim neuesten Modell wurde das Touchpad auf 12.5 x 8 cm vergrößert, verglichen mit 11.5 x 7.5 cm beim Envy 15. Die Oberfläche des Touchpads ist glatt und fast ohne Textur, bei dem man nur bei langsamen Bewegungen ein wenig Resistenz bemerkt, für genaueres klicken. Das Feedback beim klicken auf dem Touchpad ist relativ weich und ruhig für ein schwammiges Gefühl. Ein stärkerer Klick hätte das Clickpad angenehmer gemacht.


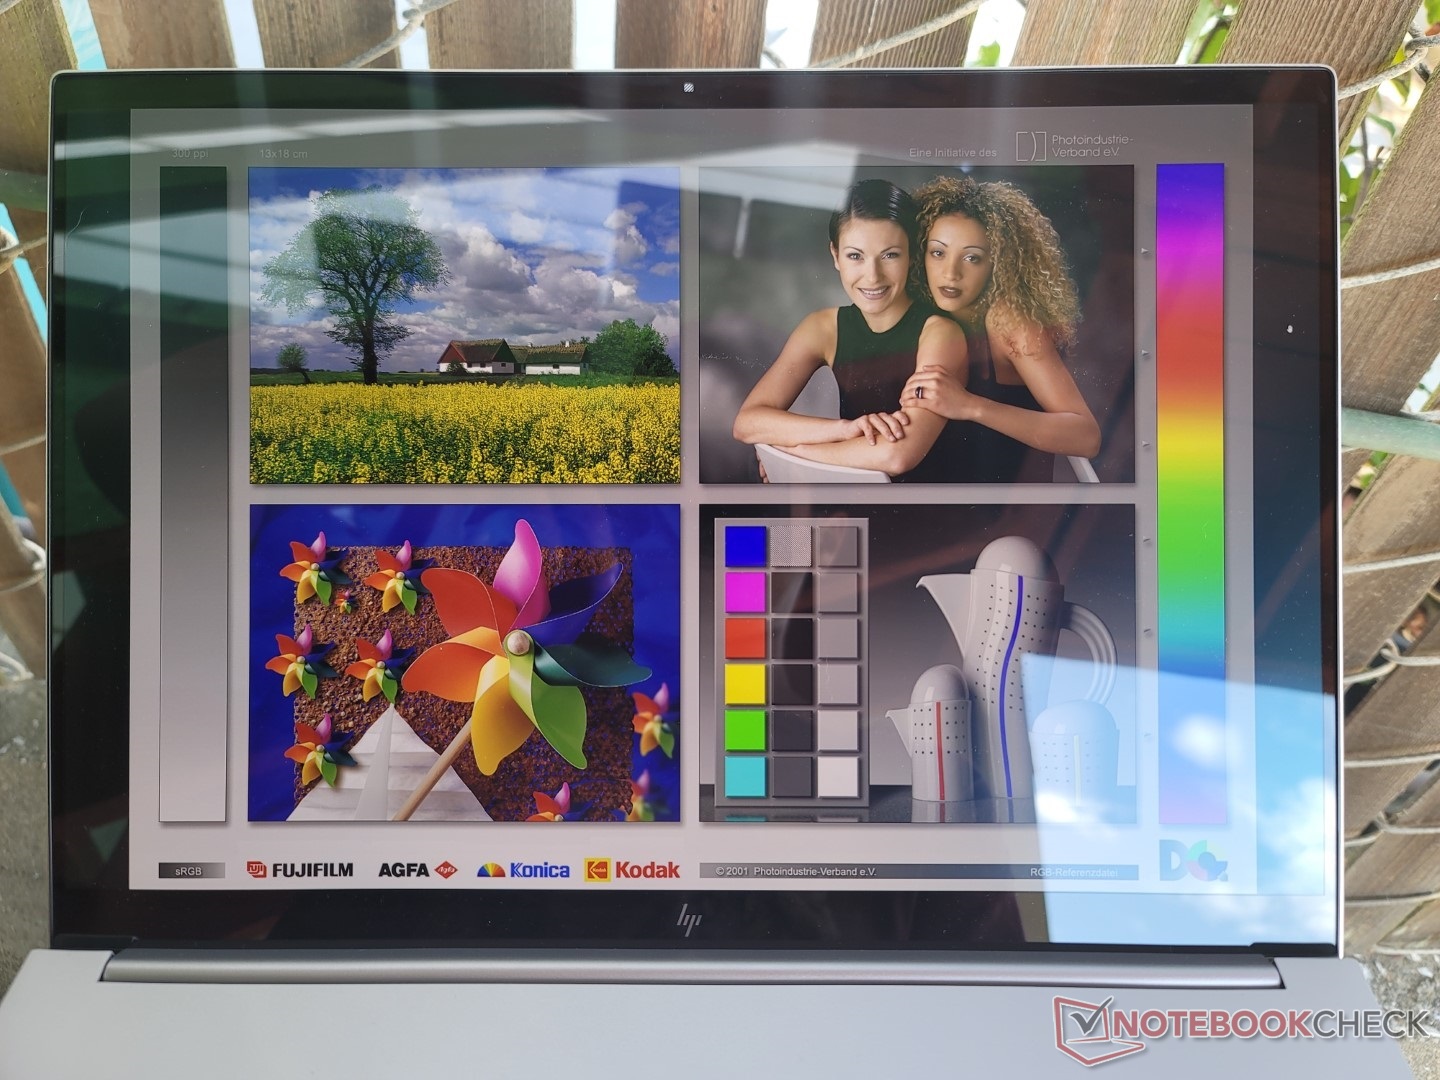
Display - IPS oder OLED?
Das Display ist in zwei Konfigurationen verfügbar:
- 2.560 x 1.600, 120 Hz, IPS, 100 % sRGB
- 3.840 x 2.400, 60 Hz, OLED, 100 % P3
Unsere folgenden Messungen beziehen sich nur auf die OLED-Option. Zu den Hauptvorteilen gehören die satteren Farben, das pechschwarze Kontrastverhältnis und die deutlich schnelleren Schwarz-Weiß- und Graustufen-Reaktionszeiten im Vergleich zu IPS, allerdings auf Kosten eines höheren Stromverbrauchs und eines Bildschirmflackerns, das eine kleine Gruppe von Nutzern betreffen kann.
Die Bildqualität ist scharf, aber mit spürbarer Farbkörnung, die bei der Anzeige von weißen Farben bei hohen Helligkeitseinstellungen deutlicher wird. Wer keine P3-Farben benötigt, sollte die IPS-Option bevorzugen, da die Bildwiederholrate von 120 Hz ein deutlich flüssigeres Erlebnis bietet.


| |||||||||||||||||||||||||
Ausleuchtung: 97 %
Helligkeit Akku: 328.8 cd/m²
Kontrast: ∞:1 (Schwarzwert: 0 cd/m²)
ΔE Color 1.53 | 0.5-29.43 Ø5
ΔE Greyscale 1.3 | 0.57-98 Ø5.3
88% AdobeRGB 1998 (Argyll 2.2.0 3D)
100% sRGB (Argyll 2.2.0 3D)
99.3% Display P3 (Argyll 2.2.0 3D)
Gamma: 2.18
| HP Envy 16 h0112nr Samsung SDC4174, OLED, 3840x2400, 16.00 | Lenovo ThinkBook 16 G4+ IAP LEN160WQXGA, IPS, 2560x1600, 16.00 | MSI Creator Z16P B12UHST AUOD298, IPS True Pixel (~100% DCI-P3), 2560x1600, 16.00 | Dell Inspiron 16 Plus 7610-MHJ8F AU Optronics B160QAN, AUO9F91, IPS, 3072x1920, 16.00 | Apple MacBook Pro 16 2021 M1 Pro Liquid Retina XDR, Mini-LED, 3456x2234, 16.20 | Huawei MateBook 16s i7 BOE XS TV160DKT-NH0, IPS, 2520x1680, 16.00 | |
|---|---|---|---|---|---|---|
| Display | -17% | -1% | -13% | 0% | -21% | |
| Display P3 Coverage | 99.3 | 69.6 -30% | 97.6 -2% | 75 -24% | 99.1 0% | 64.5 -35% |
| sRGB Coverage | 100 | 97.5 -2% | 99.9 0% | 100 0% | 100 0% | 96.7 -3% |
| AdobeRGB 1998 Coverage | 88 | 71.7 -19% | 86.8 -1% | 76 -14% | 88 0% | 66.6 -24% |
| Response Times | -1160% | -391% | -2092% | -224% | -1403% | |
| Response Time Grey 50% / Grey 80% * | 2 ? | 32.7 ? -1535% | 12.9 ? -545% | 54 ? -2600% | 42.8 ? -2040% | 35.7 ? -1685% |
| Response Time Black / White * | 1.9 ? | 16.8 ? -784% | 6.4 ? -237% | 32 ? -1584% | 91.6 ? -4721% | 23.2 ? -1121% |
| PWM Frequency | 240.4 ? | 14880 6090% | ||||
| Bildschirm | -36% | -17% | -37% | 15% | 13% | |
| Helligkeit Bildmitte | 328.8 | 371 13% | 428 30% | 290 -12% | 514 56% | 311 -5% |
| Brightness | 332 | 357 8% | 394 19% | 285 -14% | 497 50% | 319 -4% |
| Brightness Distribution | 97 | 91 -6% | 86 -11% | 88 -9% | 95 -2% | 91 -6% |
| Schwarzwert * | 0.23 | 0.42 | 0.21 | 0.02 | 0.17 | |
| Delta E Colorchecker * | 1.53 | 2.6 -70% | 1.67 -9% | 2.57 -68% | 1.4 8% | 1 35% |
| Colorchecker dE 2000 max. * | 6.04 | 4.4 27% | 5.71 5% | 4.78 21% | 2.8 54% | 1.7 72% |
| Delta E Graustufen * | 1.3 | 3.7 -185% | 3.1 -138% | 3.14 -142% | 2.3 -77% | 1.5 -15% |
| Gamma | 2.18 101% | 2.32 95% | 2.195 100% | 2.34 94% | 2.27 97% | 2.15 102% |
| CCT | 6362 102% | 7271 89% | 6498 100% | 6408 101% | 6792 96% | 6432 101% |
| Kontrast | 1613 | 1019 | 1381 | 25700 | 1829 | |
| Colorchecker dE 2000 calibrated * | 1.3 | 0.71 | 1.89 | 0.8 | ||
| Durchschnitt gesamt (Programm / Settings) | -404% /
-235% | -136% /
-81% | -714% /
-404% | -70% /
-49% | -470% /
-254% |
* ... kleinere Werte sind besser
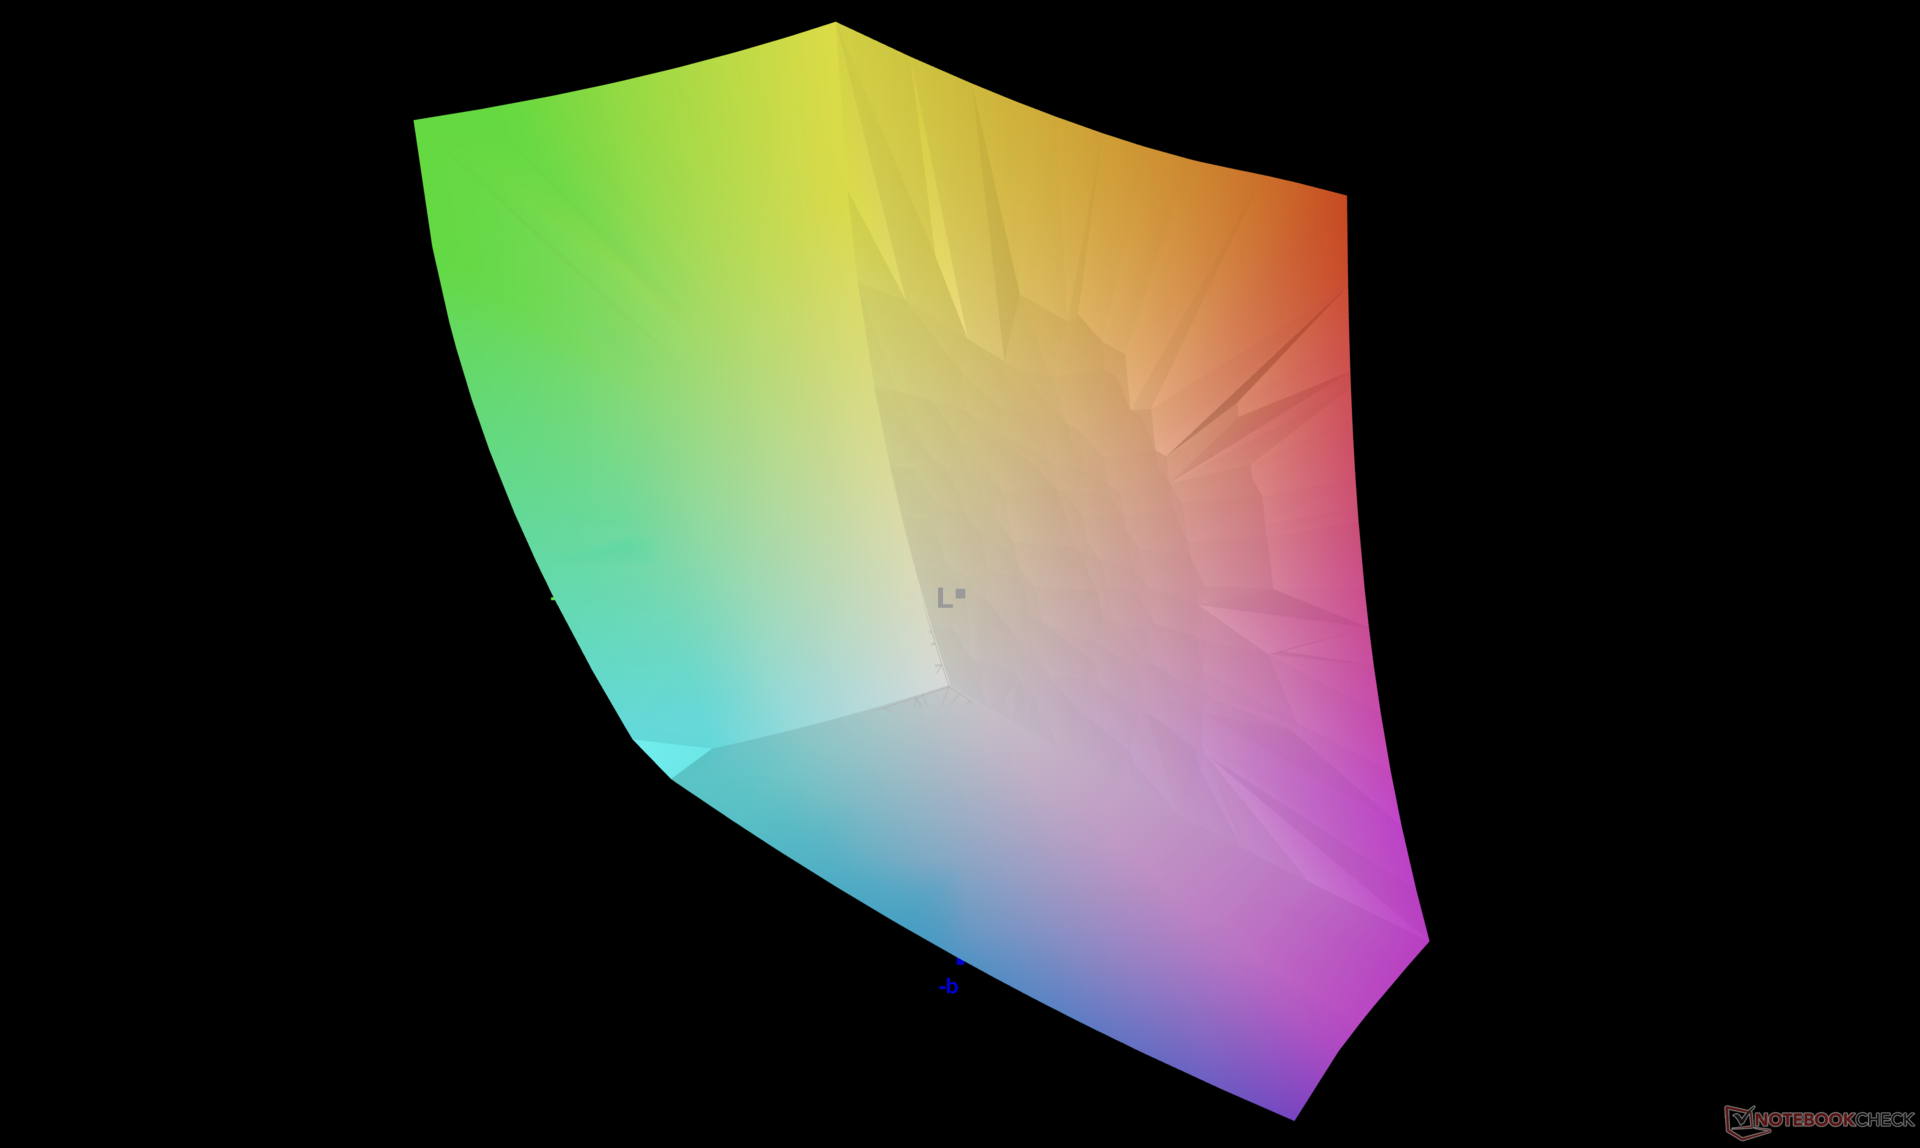

Das Panel ist standardmäßig gegen den P3-Standard kalibriert und weist durchschnittliche Graustufen- und Farb-DeltaE-Werte von nur 1,3 bzw. 1,53 auf. Die Farben scheinen bei höheren Sättigungswerten ungenauer zu sein als bei niedrigeren Sättigungswerten.


Reaktionszeiten (Response Times) des Displays
| ↔ Reaktionszeiten Schwarz zu Weiß | ||
|---|---|---|
| 1.9 ms ... steigend ↗ und fallend ↘ kombiniert | ↗ 0.8 ms steigend |  |
| ↘ 1.1 ms fallend | ||
| Die gemessenen Reaktionszeiten sind sehr kurz, wodurch sich der Bildschirm auch für schnelle 3D Spiele eignen sollte. Im Vergleich rangierten die bei uns getesteten Geräte von 0.1 (Minimum) zu 240 (Maximum) ms. » 6 % aller Screens waren schneller als der getestete. Daher sind die gemessenen Reaktionszeiten besser als der Durchschnitt aller vermessenen Geräte (21.4 ms). | ||
| ↔ Reaktionszeiten 50% Grau zu 80% Grau | ||
| 2 ms ... steigend ↗ und fallend ↘ kombiniert | ↗ 1 ms steigend | 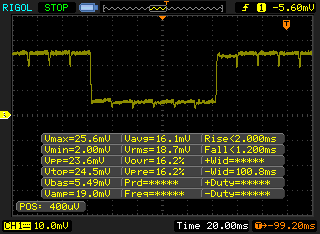 |
| ↘ 1 ms fallend | ||
| Die gemessenen Reaktionszeiten sind sehr kurz, wodurch sich der Bildschirm auch für schnelle 3D Spiele eignen sollte. Im Vergleich rangierten die bei uns getesteten Geräte von 0.2 (Minimum) zu 636 (Maximum) ms. » 5 % aller Screens waren schneller als der getestete. Daher sind die gemessenen Reaktionszeiten besser als der Durchschnitt aller vermessenen Geräte (33.7 ms). | ||
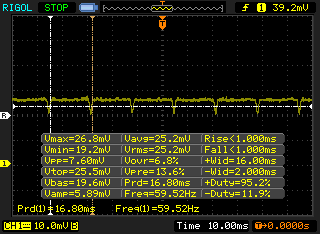
Bildschirm-Flackern / PWM (Pulse-Width Modulation)
| Flackern / PWM festgestellt | 240.4 Hz | ≤ 100 % Helligkeit | 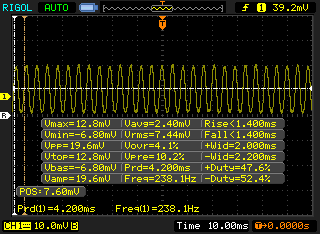 |
Das Display flackert mit 240.4 Hz (im schlimmsten Fall, eventuell durch Pulsweitenmodulation PWM) bei einer eingestellten Helligkeit von 100 % und darunter. Darüber sollte es zu keinem Flackern kommen. Die Frequenz von 240.4 Hz ist relativ gering und daher sollte es bei sensiblen Personen zu Problemen wie Flackern oder Augenbeschwerden führen. Im Vergleich: 53 % aller getesteten Geräte nutzten kein PWM um die Helligkeit zu reduzieren. Wenn PWM eingesetzt wurde, dann bei einer Frequenz von durchschnittlich 17844 (Minimum 5, Maximum 3846000) Hz. | |||
Das Flackern oder die Pulsweitenmodulation ist auf allen Helligkeitsstufen vorhanden, ähnlich wie bei den OLED-Panels der neuesten Asus-VivoBook- oder ZenBook Notebooks. Die Frequenz beträgt 240,4 Hz von 0 bis 40 Prozent Helligkeit und 60 Hz von 41 bis 100 Prozent Helligkeit.


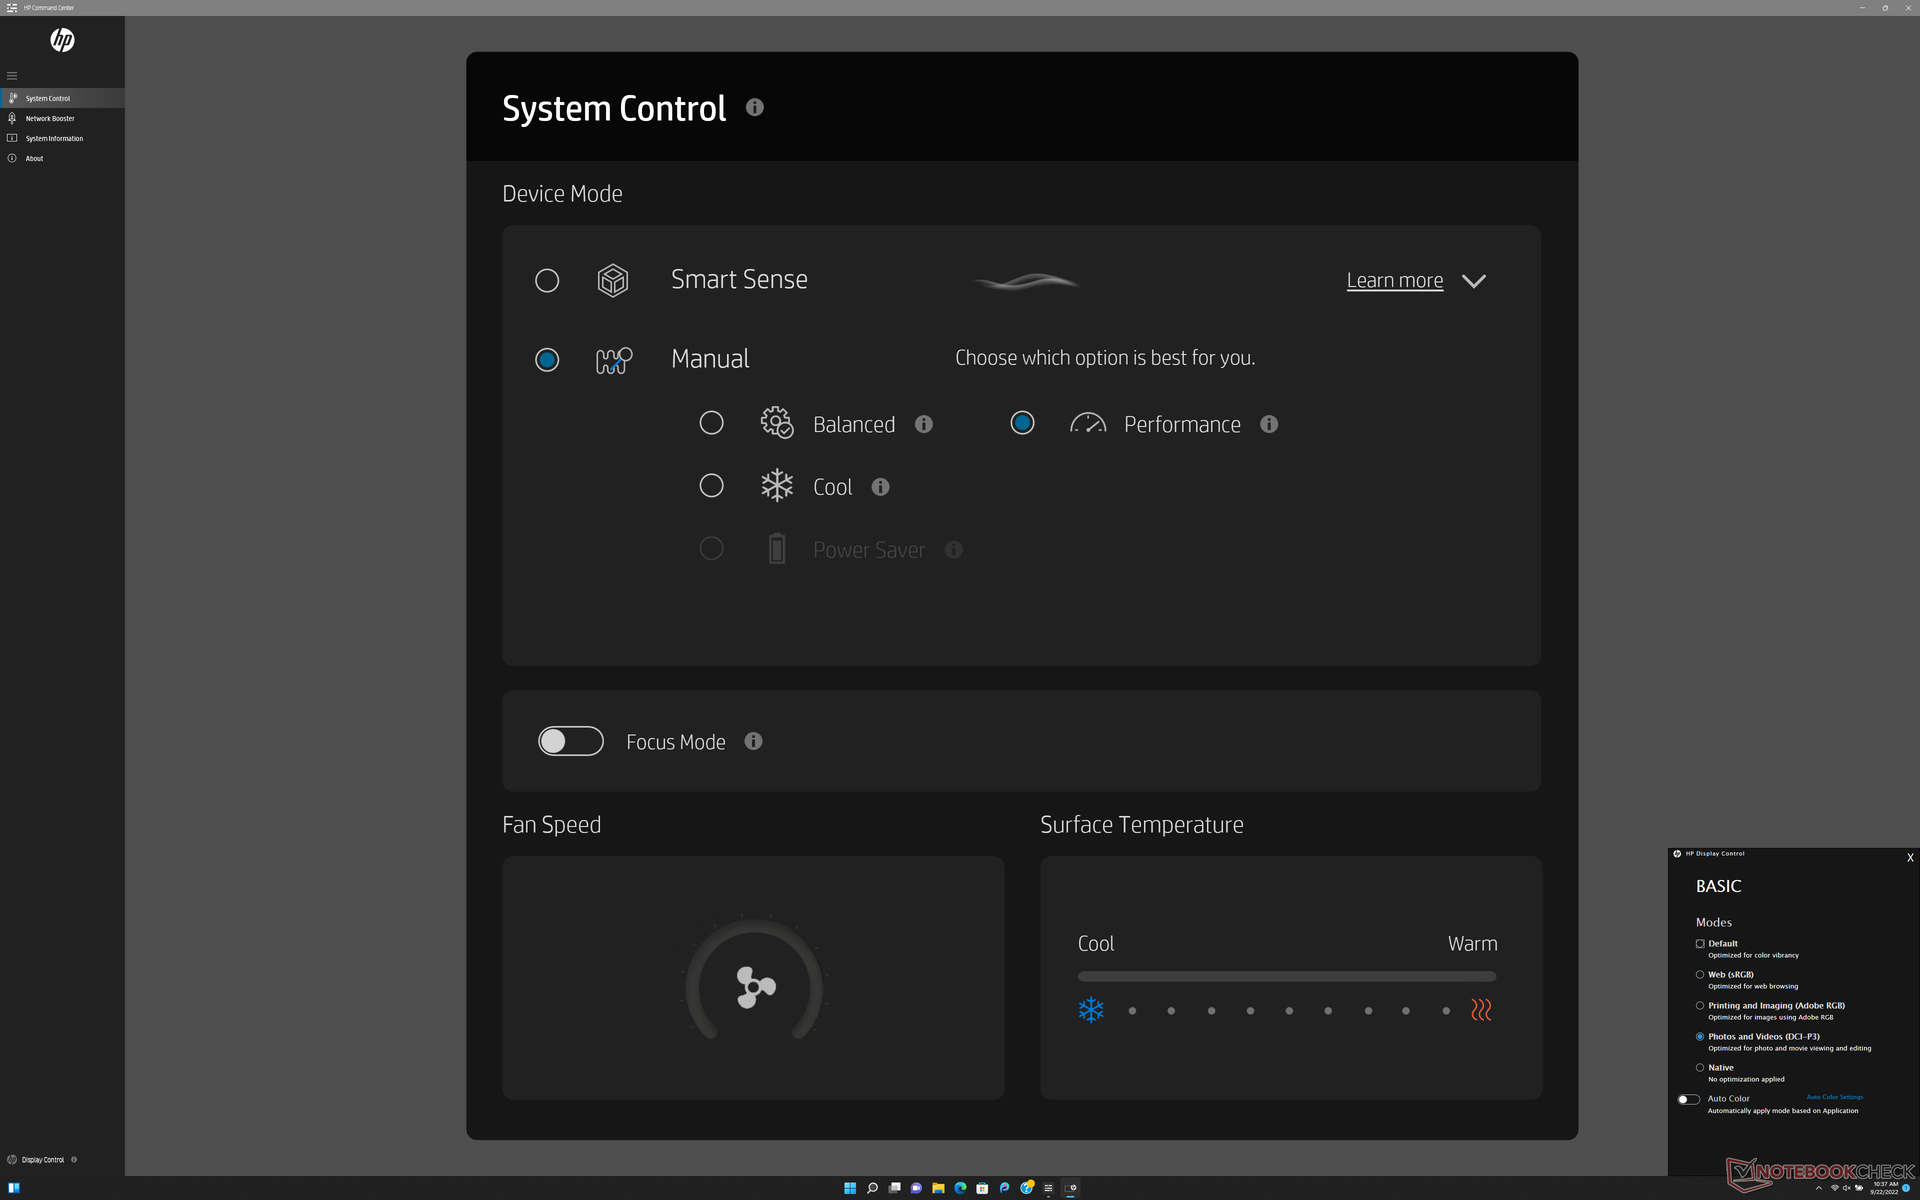
Leistung — Intel 12th Gen Core H


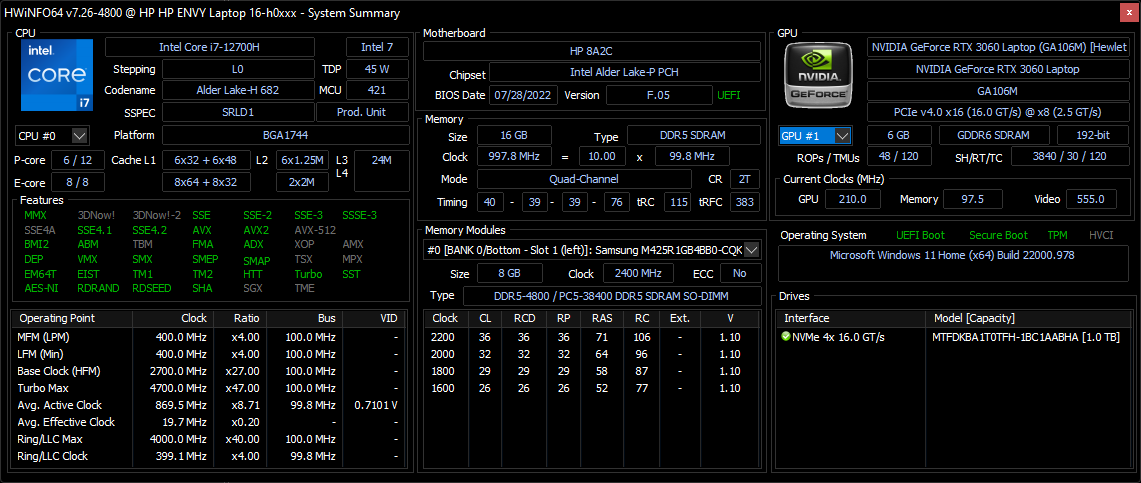
Testbedingungen
Wir haben unser Gerät sowohl über Windows als auch über die HP Command Center Software auf den Leistungsmodus eingestellt, bevor wir die folgenden Benchmarks durchgeführt haben. Das HP Command Center ist die Zentrale für die Steuerung von Energieprofilen und Displayfarben, wie der Screenshot unten zeigt.
Prozessor
Die Multi-Thread-Leistung ist etwa 15 % langsamer als die eines durchschnittlichen Notebooks in unserer Datenbank, das mit der gleichen Core i7-12700H CPU ausgestattet ist. Das Lenovo Legion Slim 7 16 beispielsweise ist in der Lage, den gleichen Prozessor schneller zu nutzen, selbst wenn man jegliche Drosselung berücksichtigt. Dennoch ist die Leistung immer noch deutlich besser als der Core i7-10750H der 10. Generation im 2020 Envy 15, nämlich um etwa 60 Prozent.
Ein Upgrade auf den Core i9-12900H SKU würde die Multi-Thread-Leistung im Vergleich mit unsererem Core i7-12700H SKU um bis zu 30 bis 40 Prozent steigern.
Cinebench R15 Multi Loop
Cinebench R23: Multi Core | Single Core
Cinebench R15: CPU Multi 64Bit | CPU Single 64Bit
Blender: v2.79 BMW27 CPU
7-Zip 18.03: 7z b 4 | 7z b 4 -mmt1
Geekbench 5.5: Multi-Core | Single-Core
HWBOT x265 Benchmark v2.2: 4k Preset
LibreOffice : 20 Documents To PDF
R Benchmark 2.5: Overall mean
Cinebench R23: Multi Core | Single Core
Cinebench R15: CPU Multi 64Bit | CPU Single 64Bit
Blender: v2.79 BMW27 CPU
7-Zip 18.03: 7z b 4 | 7z b 4 -mmt1
Geekbench 5.5: Multi-Core | Single-Core
HWBOT x265 Benchmark v2.2: 4k Preset
LibreOffice : 20 Documents To PDF
R Benchmark 2.5: Overall mean
* ... kleinere Werte sind besser
AIDA64: FP32 Ray-Trace | FPU Julia | CPU SHA3 | CPU Queen | FPU SinJulia | FPU Mandel | CPU AES | CPU ZLib | FP64 Ray-Trace | CPU PhotoWorxx
| Performance Rating | |
| Lenovo ThinkBook 16 G4+ IAP | |
| HP Envy 16 h0112nr | |
| MSI Creator Z16P B12UHST | |
| Durchschnittliche Intel Core i7-12700H | |
| Dell Inspiron 16 Plus 7610-MHJ8F | |
| Huawei MateBook 16s i7 | |
| AIDA64 / FP32 Ray-Trace | |
| Lenovo ThinkBook 16 G4+ IAP | |
| HP Envy 16 h0112nr | |
| Durchschnittliche Intel Core i7-12700H (2585 - 17957, n=62) | |
| Dell Inspiron 16 Plus 7610-MHJ8F | |
| MSI Creator Z16P B12UHST | |
| Huawei MateBook 16s i7 | |
| AIDA64 / FPU Julia | |
| Lenovo ThinkBook 16 G4+ IAP | |
| HP Envy 16 h0112nr | |
| Dell Inspiron 16 Plus 7610-MHJ8F | |
| Durchschnittliche Intel Core i7-12700H (12439 - 90760, n=62) | |
| MSI Creator Z16P B12UHST | |
| Huawei MateBook 16s i7 | |
| AIDA64 / CPU SHA3 | |
| Dell Inspiron 16 Plus 7610-MHJ8F | |
| Lenovo ThinkBook 16 G4+ IAP | |
| Durchschnittliche Intel Core i7-12700H (833 - 4242, n=62) | |
| MSI Creator Z16P B12UHST | |
| HP Envy 16 h0112nr | |
| Huawei MateBook 16s i7 | |
| AIDA64 / CPU Queen | |
| MSI Creator Z16P B12UHST | |
| Lenovo ThinkBook 16 G4+ IAP | |
| HP Envy 16 h0112nr | |
| Durchschnittliche Intel Core i7-12700H (57923 - 103202, n=62) | |
| Huawei MateBook 16s i7 | |
| Dell Inspiron 16 Plus 7610-MHJ8F | |
| AIDA64 / FPU SinJulia | |
| MSI Creator Z16P B12UHST | |
| Lenovo ThinkBook 16 G4+ IAP | |
| Durchschnittliche Intel Core i7-12700H (3249 - 9939, n=62) | |
| Dell Inspiron 16 Plus 7610-MHJ8F | |
| HP Envy 16 h0112nr | |
| Huawei MateBook 16s i7 | |
| AIDA64 / FPU Mandel | |
| Lenovo ThinkBook 16 G4+ IAP | |
| Dell Inspiron 16 Plus 7610-MHJ8F | |
| HP Envy 16 h0112nr | |
| Durchschnittliche Intel Core i7-12700H (7135 - 44760, n=62) | |
| MSI Creator Z16P B12UHST | |
| Huawei MateBook 16s i7 | |
| AIDA64 / CPU AES | |
| Dell Inspiron 16 Plus 7610-MHJ8F | |
| HP Envy 16 h0112nr | |
| MSI Creator Z16P B12UHST | |
| Durchschnittliche Intel Core i7-12700H (31839 - 144360, n=62) | |
| Lenovo ThinkBook 16 G4+ IAP | |
| Huawei MateBook 16s i7 | |
| AIDA64 / CPU ZLib | |
| MSI Creator Z16P B12UHST | |
| Lenovo ThinkBook 16 G4+ IAP | |
| Durchschnittliche Intel Core i7-12700H (305 - 1171, n=62) | |
| HP Envy 16 h0112nr | |
| Dell Inspiron 16 Plus 7610-MHJ8F | |
| Huawei MateBook 16s i7 | |
| AIDA64 / FP64 Ray-Trace | |
| Lenovo ThinkBook 16 G4+ IAP | |
| HP Envy 16 h0112nr | |
| Durchschnittliche Intel Core i7-12700H (1437 - 9692, n=62) | |
| Dell Inspiron 16 Plus 7610-MHJ8F | |
| MSI Creator Z16P B12UHST | |
| Huawei MateBook 16s i7 | |
| AIDA64 / CPU PhotoWorxx | |
| Huawei MateBook 16s i7 | |
| MSI Creator Z16P B12UHST | |
| Lenovo ThinkBook 16 G4+ IAP | |
| HP Envy 16 h0112nr | |
| Durchschnittliche Intel Core i7-12700H (12863 - 52207, n=62) | |
| Dell Inspiron 16 Plus 7610-MHJ8F | |
Systemleistung
Die PCMark Ergebnisse sind konstant bei Weitem besser als beim 2020er Envy 15. Wir vermuten, dass die Abkehr von Intel Optane einen großen Anteil an der Steigerung der Ergebnisse hat.

CrossMark: Overall | Productivity | Creativity | Responsiveness
| PCMark 10 / Score | |
| MSI Creator Z16P B12UHST | |
| HP Envy 16 h0112nr | |
| Durchschnittliche Intel Core i7-12700H, NVIDIA GeForce RTX 3060 Laptop GPU (5986 - 8156, n=12) | |
| Huawei MateBook 16s i7 | |
| HP Envy 15-ep0098nr | |
| Dell Inspiron 16 Plus 7610-MHJ8F | |
| PCMark 10 / Essentials | |
| HP Envy 16 h0112nr | |
| Huawei MateBook 16s i7 | |
| MSI Creator Z16P B12UHST | |
| Durchschnittliche Intel Core i7-12700H, NVIDIA GeForce RTX 3060 Laptop GPU (9289 - 12144, n=12) | |
| Dell Inspiron 16 Plus 7610-MHJ8F | |
| HP Envy 15-ep0098nr | |
| PCMark 10 / Productivity | |
| MSI Creator Z16P B12UHST | |
| HP Envy 16 h0112nr | |
| Durchschnittliche Intel Core i7-12700H, NVIDIA GeForce RTX 3060 Laptop GPU (6161 - 10362, n=12) | |
| Huawei MateBook 16s i7 | |
| HP Envy 15-ep0098nr | |
| Dell Inspiron 16 Plus 7610-MHJ8F | |
| PCMark 10 / Digital Content Creation | |
| MSI Creator Z16P B12UHST | |
| Durchschnittliche Intel Core i7-12700H, NVIDIA GeForce RTX 3060 Laptop GPU (8950 - 12554, n=12) | |
| HP Envy 16 h0112nr | |
| Huawei MateBook 16s i7 | |
| HP Envy 15-ep0098nr | |
| Dell Inspiron 16 Plus 7610-MHJ8F | |
| CrossMark / Overall | |
| Huawei MateBook 16s i7 | |
| HP Envy 16 h0112nr | |
| Durchschnittliche Intel Core i7-12700H, NVIDIA GeForce RTX 3060 Laptop GPU (1649 - 2017, n=11) | |
| Lenovo ThinkBook 16 G4+ IAP | |
| Apple MacBook Pro 16 2021 M1 Pro | |
| CrossMark / Productivity | |
| Huawei MateBook 16s i7 | |
| HP Envy 16 h0112nr | |
| Durchschnittliche Intel Core i7-12700H, NVIDIA GeForce RTX 3060 Laptop GPU (1536 - 1958, n=11) | |
| Lenovo ThinkBook 16 G4+ IAP | |
| Apple MacBook Pro 16 2021 M1 Pro | |
| CrossMark / Creativity | |
| Apple MacBook Pro 16 2021 M1 Pro | |
| HP Envy 16 h0112nr | |
| Huawei MateBook 16s i7 | |
| Lenovo ThinkBook 16 G4+ IAP | |
| Durchschnittliche Intel Core i7-12700H, NVIDIA GeForce RTX 3060 Laptop GPU (1816 - 2084, n=11) | |
| CrossMark / Responsiveness | |
| Huawei MateBook 16s i7 | |
| Durchschnittliche Intel Core i7-12700H, NVIDIA GeForce RTX 3060 Laptop GPU (1210 - 2207, n=11) | |
| HP Envy 16 h0112nr | |
| Lenovo ThinkBook 16 G4+ IAP | |
| Apple MacBook Pro 16 2021 M1 Pro | |
| PCMark 10 Score | 7595 Punkte | |
Hilfe | ||
| AIDA64 / Memory Copy | |
| Huawei MateBook 16s i7 | |
| Lenovo ThinkBook 16 G4+ IAP | |
| MSI Creator Z16P B12UHST | |
| HP Envy 16 h0112nr | |
| Durchschnittliche Intel Core i7-12700H (25615 - 80511, n=62) | |
| Dell Inspiron 16 Plus 7610-MHJ8F | |
| AIDA64 / Memory Read | |
| Lenovo ThinkBook 16 G4+ IAP | |
| Huawei MateBook 16s i7 | |
| MSI Creator Z16P B12UHST | |
| HP Envy 16 h0112nr | |
| Durchschnittliche Intel Core i7-12700H (25586 - 79442, n=62) | |
| Dell Inspiron 16 Plus 7610-MHJ8F | |
| AIDA64 / Memory Write | |
| MSI Creator Z16P B12UHST | |
| Huawei MateBook 16s i7 | |
| HP Envy 16 h0112nr | |
| Lenovo ThinkBook 16 G4+ IAP | |
| Durchschnittliche Intel Core i7-12700H (23679 - 88660, n=62) | |
| Dell Inspiron 16 Plus 7610-MHJ8F | |
| AIDA64 / Memory Latency | |
| Lenovo ThinkBook 16 G4+ IAP | |
| Huawei MateBook 16s i7 | |
| Dell Inspiron 16 Plus 7610-MHJ8F | |
| MSI Creator Z16P B12UHST | |
| HP Envy 16 h0112nr | |
| Durchschnittliche Intel Core i7-12700H (76.2 - 133.9, n=60) | |
* ... kleinere Werte sind besser
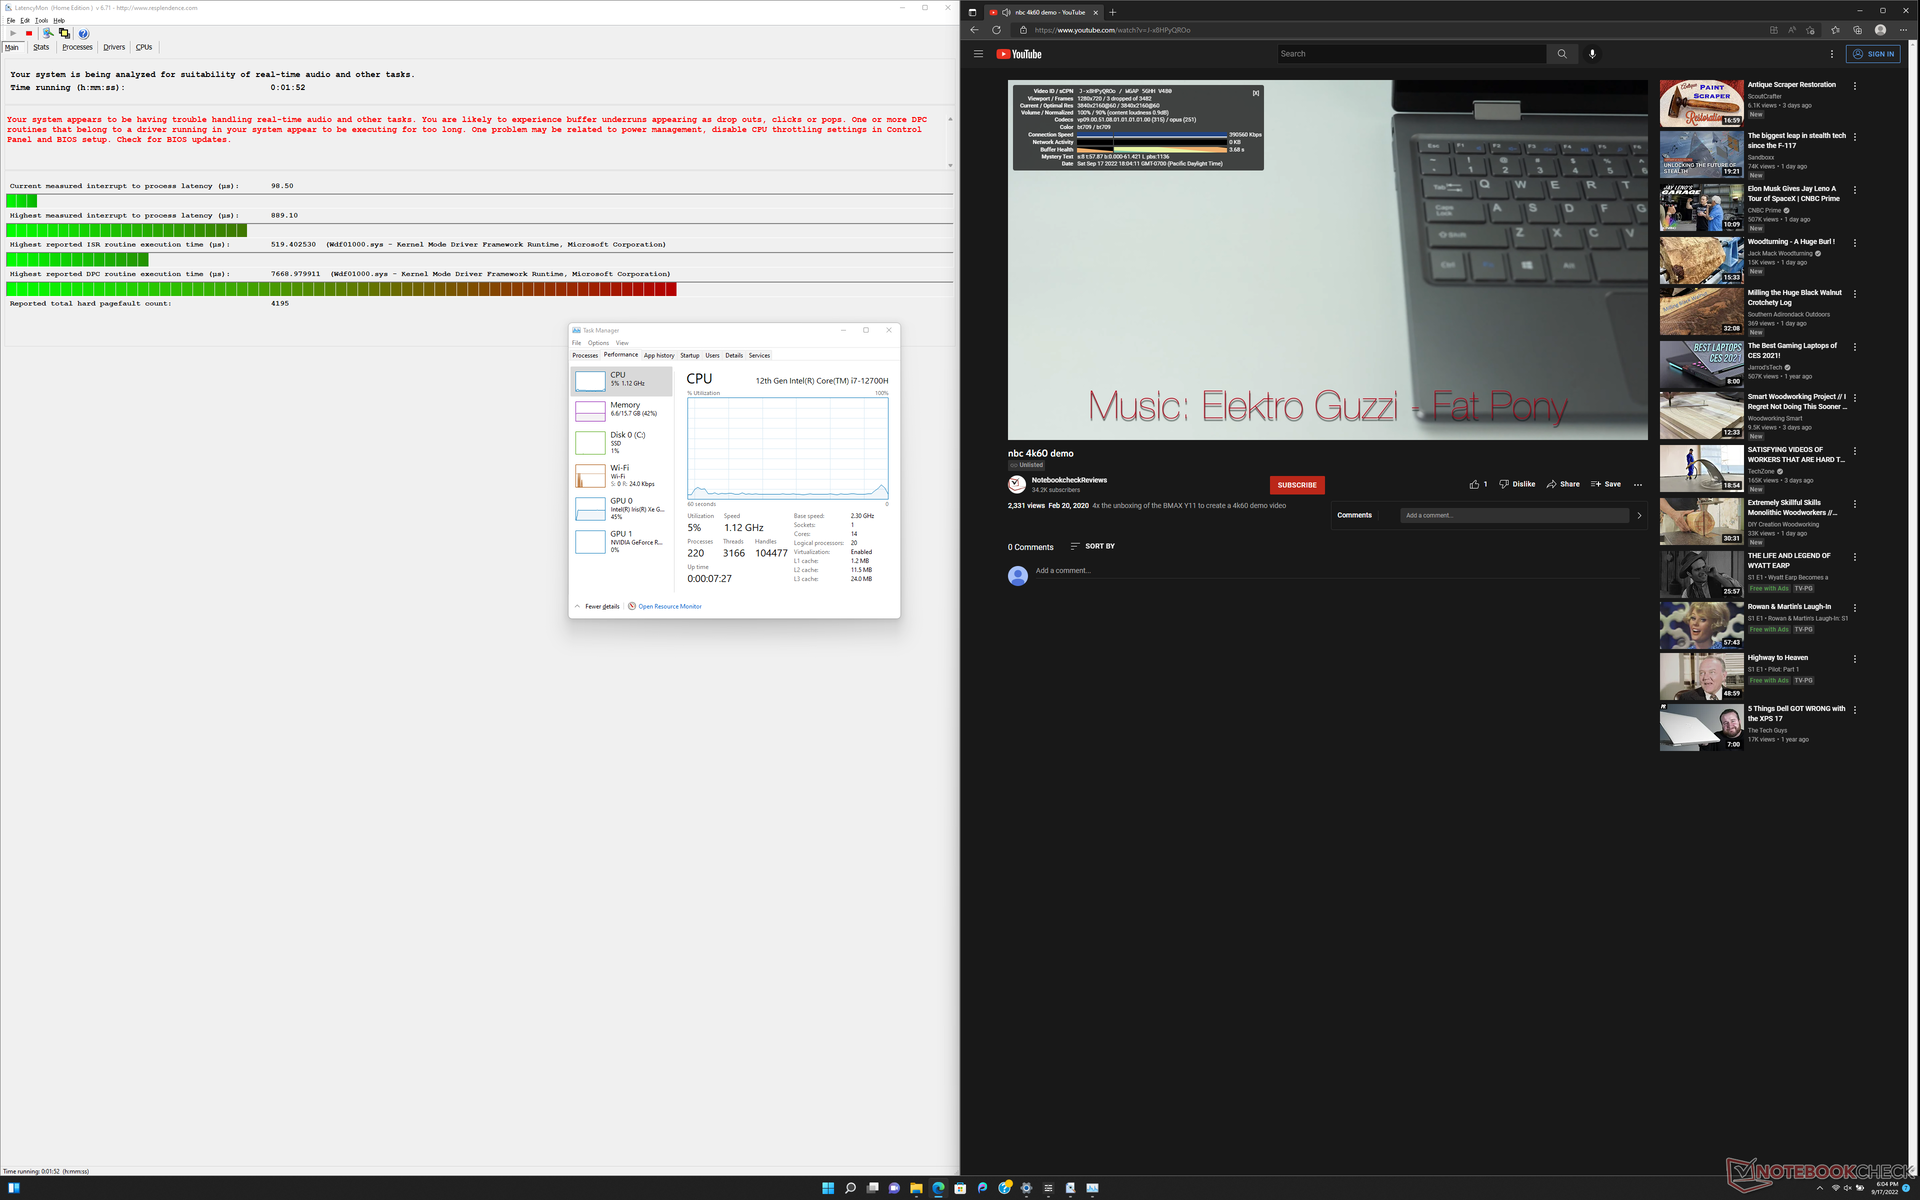
DPC Latency
LatencyMon zeigt DPC-Probleme beim Öffnen mehrerer Browser-Tabs unserer Homepage. Die 4K-Videowiedergabe bei 60 fps ist ebenfalls unvollkommen: Während unseres einminütigen Testvideos gab es drei FPS-Drops.

| DPC Latencies / LatencyMon - interrupt to process latency (max), Web, Youtube, Prime95 | |
| Lenovo ThinkBook 16 G4+ IAP | |
| HP Envy 16 h0112nr | |
| MSI Creator Z16P B12UHST | |
* ... kleinere Werte sind besser
Massenspeicher - RAID-0-Unterstützung

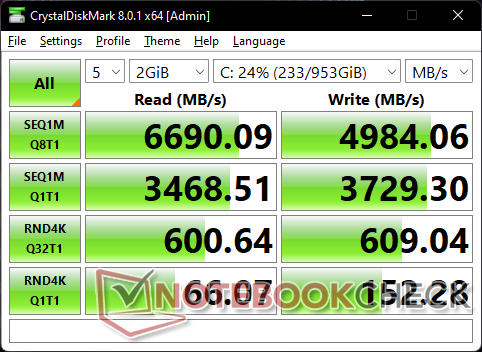


| Drive Performance Rating - Percent | |
| MSI Creator Z16P B12UHST | |
| HP Envy 16 h0112nr | |
| Huawei MateBook 16s i7 | |
| Lenovo ThinkBook 16 G4+ IAP | |
| Dell Inspiron 16 Plus 7610-MHJ8F -1! | |
* ... kleinere Werte sind besser
Disk Throttling: DiskSpd Read Loop, Queue Depth 8
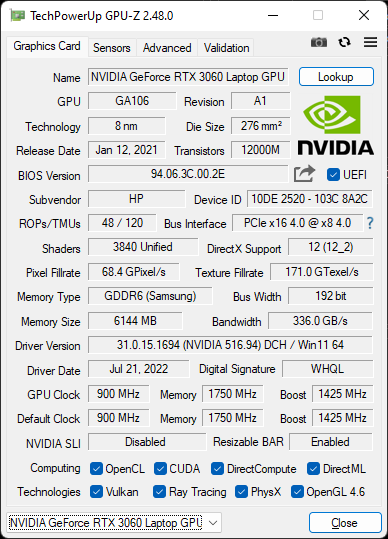
Grafikkarten Leistung - 95 W TGP GeForce RTX 3060
Die Grafikleistung ist etwa 5 % langsamer als die eines durchschnittlichen Notebooks in unserer Datenbank, das mit der gleichen GeForce RTX 3060 ausgestattet ist. Das Defizit ist so gering, dass es Anwendern wahrscheinlich nicht auffallen wird.
Ein Upgrade von der schwächeren Arc-A370M-Option auf die GeForce RTX 3060 bringt Nutzern mehr als das Doppelte der reinen Grafikleistung.
Die Verwendung des Modus "Ausbalanciert" anstelle des Modus "Leistung" reduziert die Grafikleistung um 6 Prozent und sorgt für deutlich leisere Lüfter, wie in unserem Abschnitt über Systemgeräusche beschrieben.
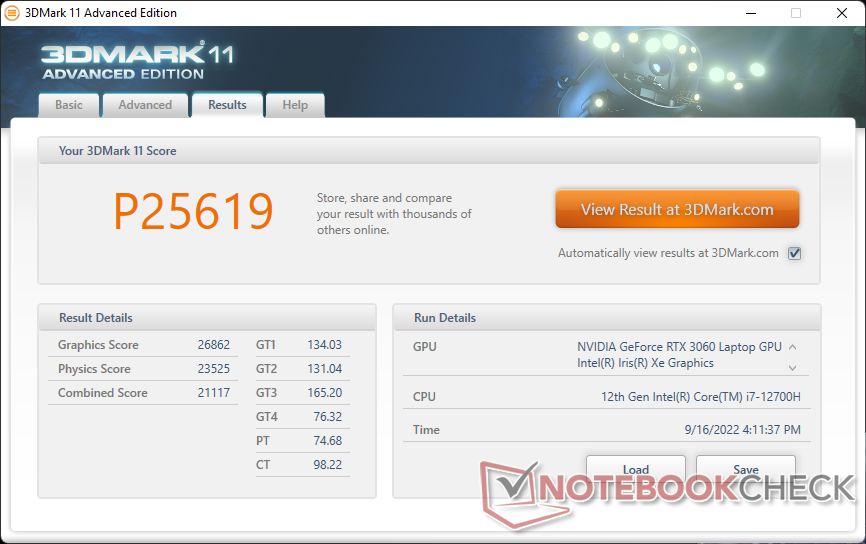
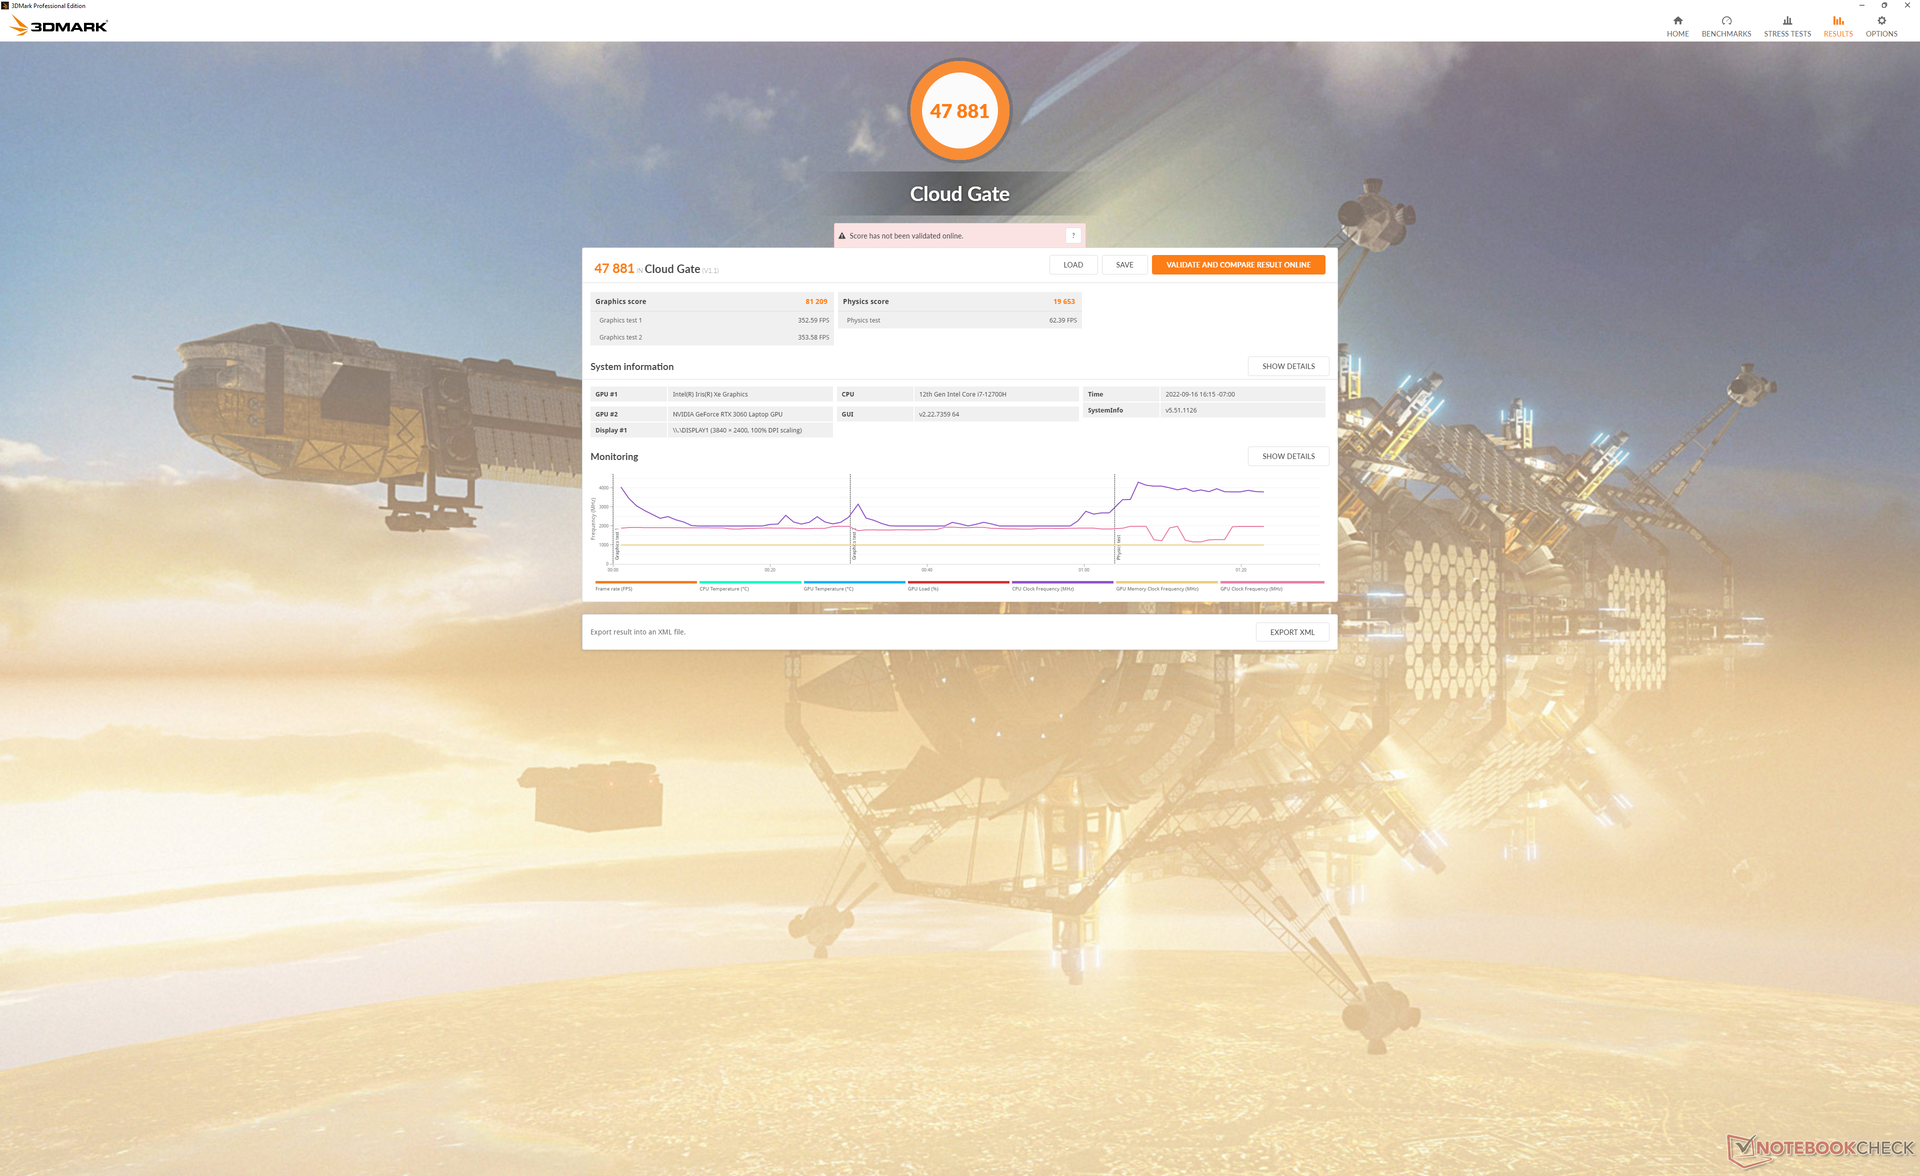


| 3DMark 11 Performance | 25619 Punkte | |
| 3DMark Cloud Gate Standard Score | 47881 Punkte | |
| 3DMark Fire Strike Score | 17118 Punkte | |
| 3DMark Time Spy Score | 8190 Punkte | |
Hilfe | ||
Witcher 3 FPS-Benchmark
| min. | mittel | hoch | max. | QHD | 4K | |
| GTA V (2015) | 185.6 | 181.2 | 174.1 | 103.3 | 76.7 | |
| The Witcher 3 (2015) | 402.3 | 264 | 161.2 | 82.8 | 55.1 | |
| Dota 2 Reborn (2015) | 180.6 | 164.8 | 149.1 | 139 | 46.9 | |
| Final Fantasy XV Benchmark (2018) | 177.2 | 111.7 | 83.9 | 62 | 34.6 | |
| X-Plane 11.11 (2018) | 140.3 | 127 | 103 | 60.5 | ||
| Strange Brigade (2018) | 418 | 202 | 162 | 140.4 | 103.5 | |
| Cyberpunk 2077 1.6 (2022) | 115.7 | 94.4 | 72.3 | 59.5 | 17.9 |
Emissionen
Systemlautstärke - so laut wie viele Gaming-Laptops
Das Lüftergeräusch neigt zum Pulsieren, wenn es auf das Leistungsprofil "Ausgeglichen" oder höher eingestellt ist. Zu erwarten ist, dass die Lüfter zwischen 30 und 34 dB(A) gegen einen leisen Hintergrund von 22,8 dB(A) schwanken, wenn man im Internet surft oder Videos abspielt. Andere 16-Zoll-Notebooks wie das Huawei MateBook 16s oder das MacBook Pro 16 sind alle in der Lage, länger leise zu bleiben als das Envy 16.
Die Lüfter können im 3DMark 06 bis zu 41 dB(A) laut sein, während es bei den genannten Apple- und Huawei Modellen nur 26 bzw. 34 dB(A) sind.
Noch lauter wird das Lüftergeräusch mit knapp über 51 dB(A), wenn Witcher 3 im Performance-Modus läuft. Die Lautstärke sinkt deutlich auf 41,6 dB(A), wenn stattdessen der Modus "Ausbalanciert" verwendet wird, aber die Grafikleistung ist dann, wie oben erwähnt, etwa 5 bis 10 Prozent langsamer. Insgesamt ist dies ein ziemlich lautes Notebook, wenn man dessen Leistung ausnutzen möchte.


Lautstärkediagramm
| Idle |
| 22.9 / 22.9 / 30.5 dB(A) |
| Last |
| 41.4 / 51.4 dB(A) |
 | ||
30 dB leise 40 dB(A) deutlich hörbar 50 dB(A) störend |
||
min: | ||
| HP Envy 16 h0112nr GeForce RTX 3060 Laptop GPU, i7-12700H, Micron 3400 1TB MTFDKBA1T0TFH | Lenovo ThinkBook 16 G4+ IAP GeForce RTX 2050 Mobile, i7-12700H, Micron 2450 1TB MTFDKCD1T0TFK | MSI Creator Z16P B12UHST GeForce RTX 3080 Ti Laptop GPU, i9-12900H, Samsung PM9A1 MZVL22T0HBLB | Dell Inspiron 16 Plus 7610-MHJ8F UHD Graphics Xe 32EUs (Tiger Lake-H), i7-11800H, OM3PDP3-AD NVMe KDI 512GB | Apple MacBook Pro 16 2021 M1 Pro M1 Pro 16-Core GPU, M1 Pro, Apple SSD AP1024R | Huawei MateBook 16s i7 Iris Xe G7 96EUs, i7-12700H, Silicon Motion PCIe-8 SSD | |
|---|---|---|---|---|---|---|
| Geräuschentwicklung | 1% | -5% | -1% | 10% | 9% | |
| aus / Umgebung * | 22.8 | 24.2 -6% | 26 -14% | 26.3 -15% | 24.7 -8% | 24 -5% |
| Idle min * | 22.9 | 24.2 -6% | 27 -18% | 26.3 -15% | 24.7 -8% | 24 -5% |
| Idle avg * | 22.9 | 24.2 -6% | 29 -27% | 26.3 -15% | 24.7 -8% | 25.2 -10% |
| Idle max * | 30.5 | 24.2 21% | 31 -2% | 24.7 19% | 27.2 11% | |
| Last avg * | 41.4 | 47 -14% | 43 -4% | 33 20% | 26.1 37% | 34.8 16% |
| Witcher 3 ultra * | 51.1 | 47 8% | 43 16% | 44 14% | 34.8 32% | |
| Last max * | 51.4 | 47 9% | 46 11% | 49.2 4% | 37.4 27% | 39 24% |
* ... kleinere Werte sind besser
Temperatur
Die Oberflächentemperaturen sind selbst im Leerlauf auf dem Desktop ohne laufende Anwendungen recht warm. Unter diesen Bedingungen können die heißen Stellen auf der Ober- und Unterseite 33 °C erreichen, während es beim ThinkBook 16 G4 nur 26 °C sind. Die Handballenablagen bleiben relativ kühl, aber die Unterseite kann sich auf der Haut unangenehm anfühlen.

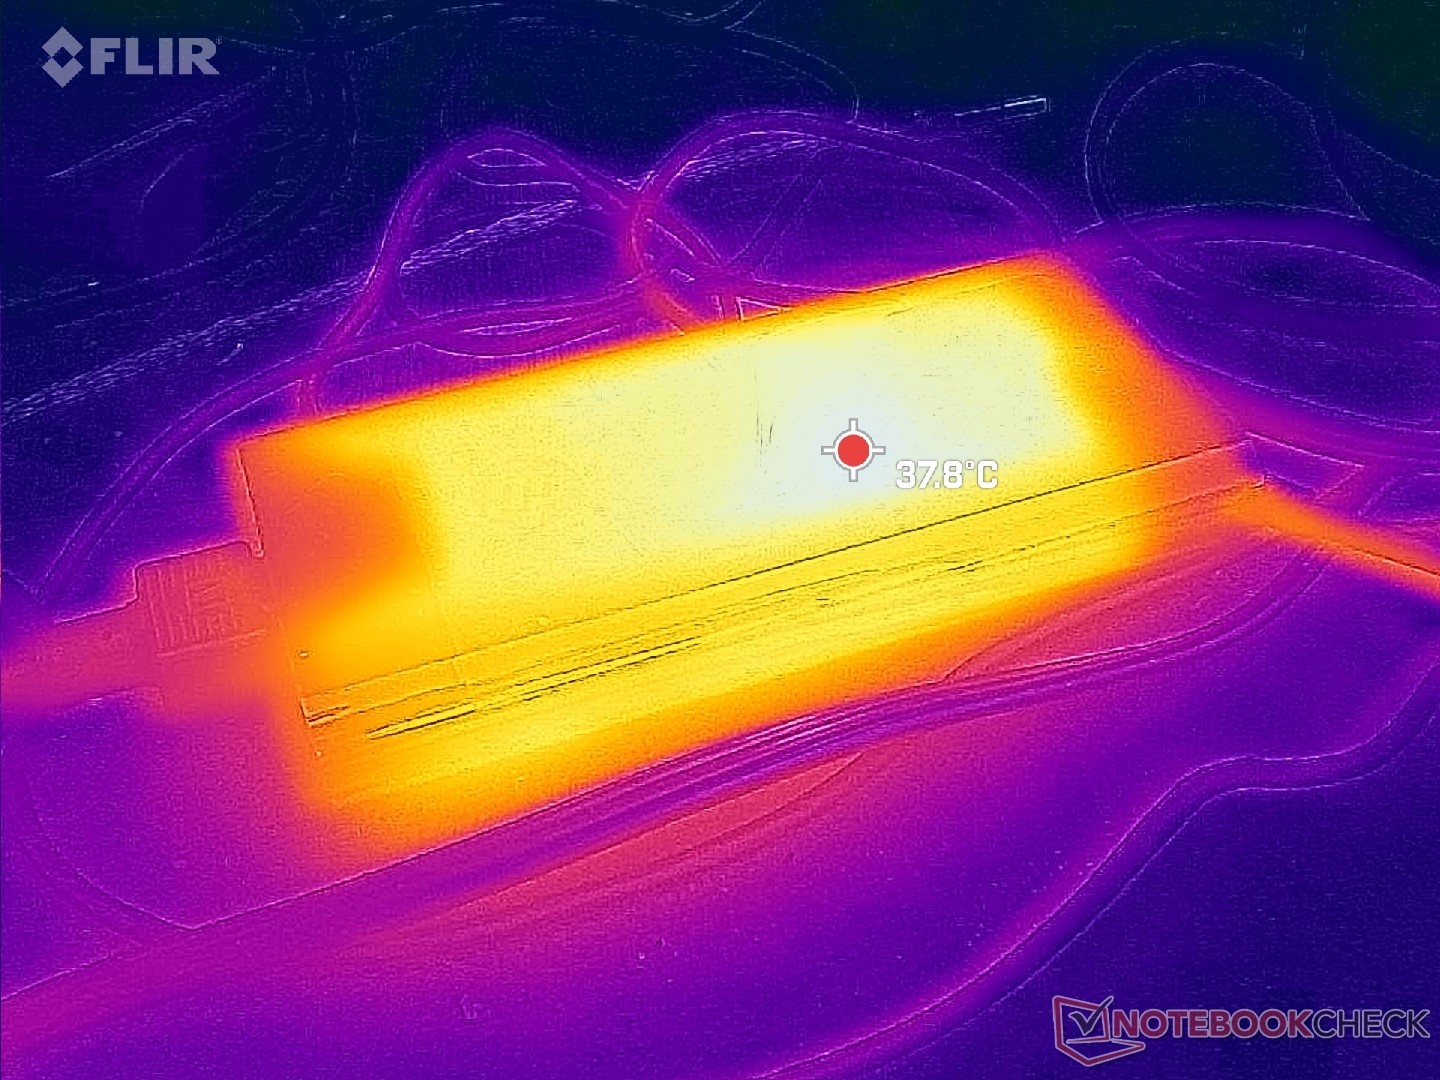
(-) Die maximale Temperatur auf der Oberseite ist 45.2 °C. Im Vergleich liegt der Klassendurchschnitt bei 36.9 °C (von 21.1 bis 71 °C für die Klasse Multimedia v7).
(±) Auf der Unterseite messen wir eine maximalen Wert von 44 °C (im Vergleich zum Durchschnitt von 39.1 °C).
(+) Ohne Last messen wir eine durchschnittliche Temperatur von 31 °C auf der Oberseite. Der Klassendurchschnitt erreicht 31.2 °C.
(±) Beim längeren Spielen von The Witcher 3 erhitzt sich das Gerät durchschnittlich auf 33.6 °C. Der Durchschnitt der Klasse ist derzeit 31.2 °C.
(+) Die Handballen und der Touchpad-Bereich sind mit gemessenen 29.8 °C kühler als die typische Hauttemperatur und fühlen sich dadurch kühl an.
(±) Die durchschnittliche Handballen-Temperatur anderer getesteter Geräte war 28.8 °C (-1 °C).


| HP Envy 16 h0112nr Intel Core i7-12700H, NVIDIA GeForce RTX 3060 Laptop GPU | Lenovo ThinkBook 16 G4+ IAP Intel Core i7-12700H, NVIDIA GeForce RTX 2050 Mobile | MSI Creator Z16P B12UHST Intel Core i9-12900H, NVIDIA GeForce RTX 3080 Ti Laptop GPU | Dell Inspiron 16 Plus 7610-MHJ8F Intel Core i7-11800H, Intel UHD Graphics Xe 32EUs (Tiger Lake-H) | Apple MacBook Pro 16 2021 M1 Pro Apple M1 Pro, Apple M1 Pro 16-Core GPU | Huawei MateBook 16s i7 Intel Core i7-12700H, Intel Iris Xe Graphics G7 96EUs | |
|---|---|---|---|---|---|---|
| Hitze | 8% | -20% | 4% | 19% | 5% | |
| Last oben max * | 45.2 | 42.9 5% | 67 -48% | 43.4 4% | 41 9% | 40.9 10% |
| Last unten max * | 44 | 50.6 -15% | 69 -57% | 45.1 -3% | 39 11% | 48.3 -10% |
| Idle oben max * | 33.6 | 26 23% | 29 14% | 30.6 9% | 24 29% | 29.2 13% |
| Idle unten max * | 32.6 | 26.5 19% | 29 11% | 31.1 5% | 24 26% | 30.4 7% |
* ... kleinere Werte sind besser
Stresstest - Begrenzter Turbo-Boost
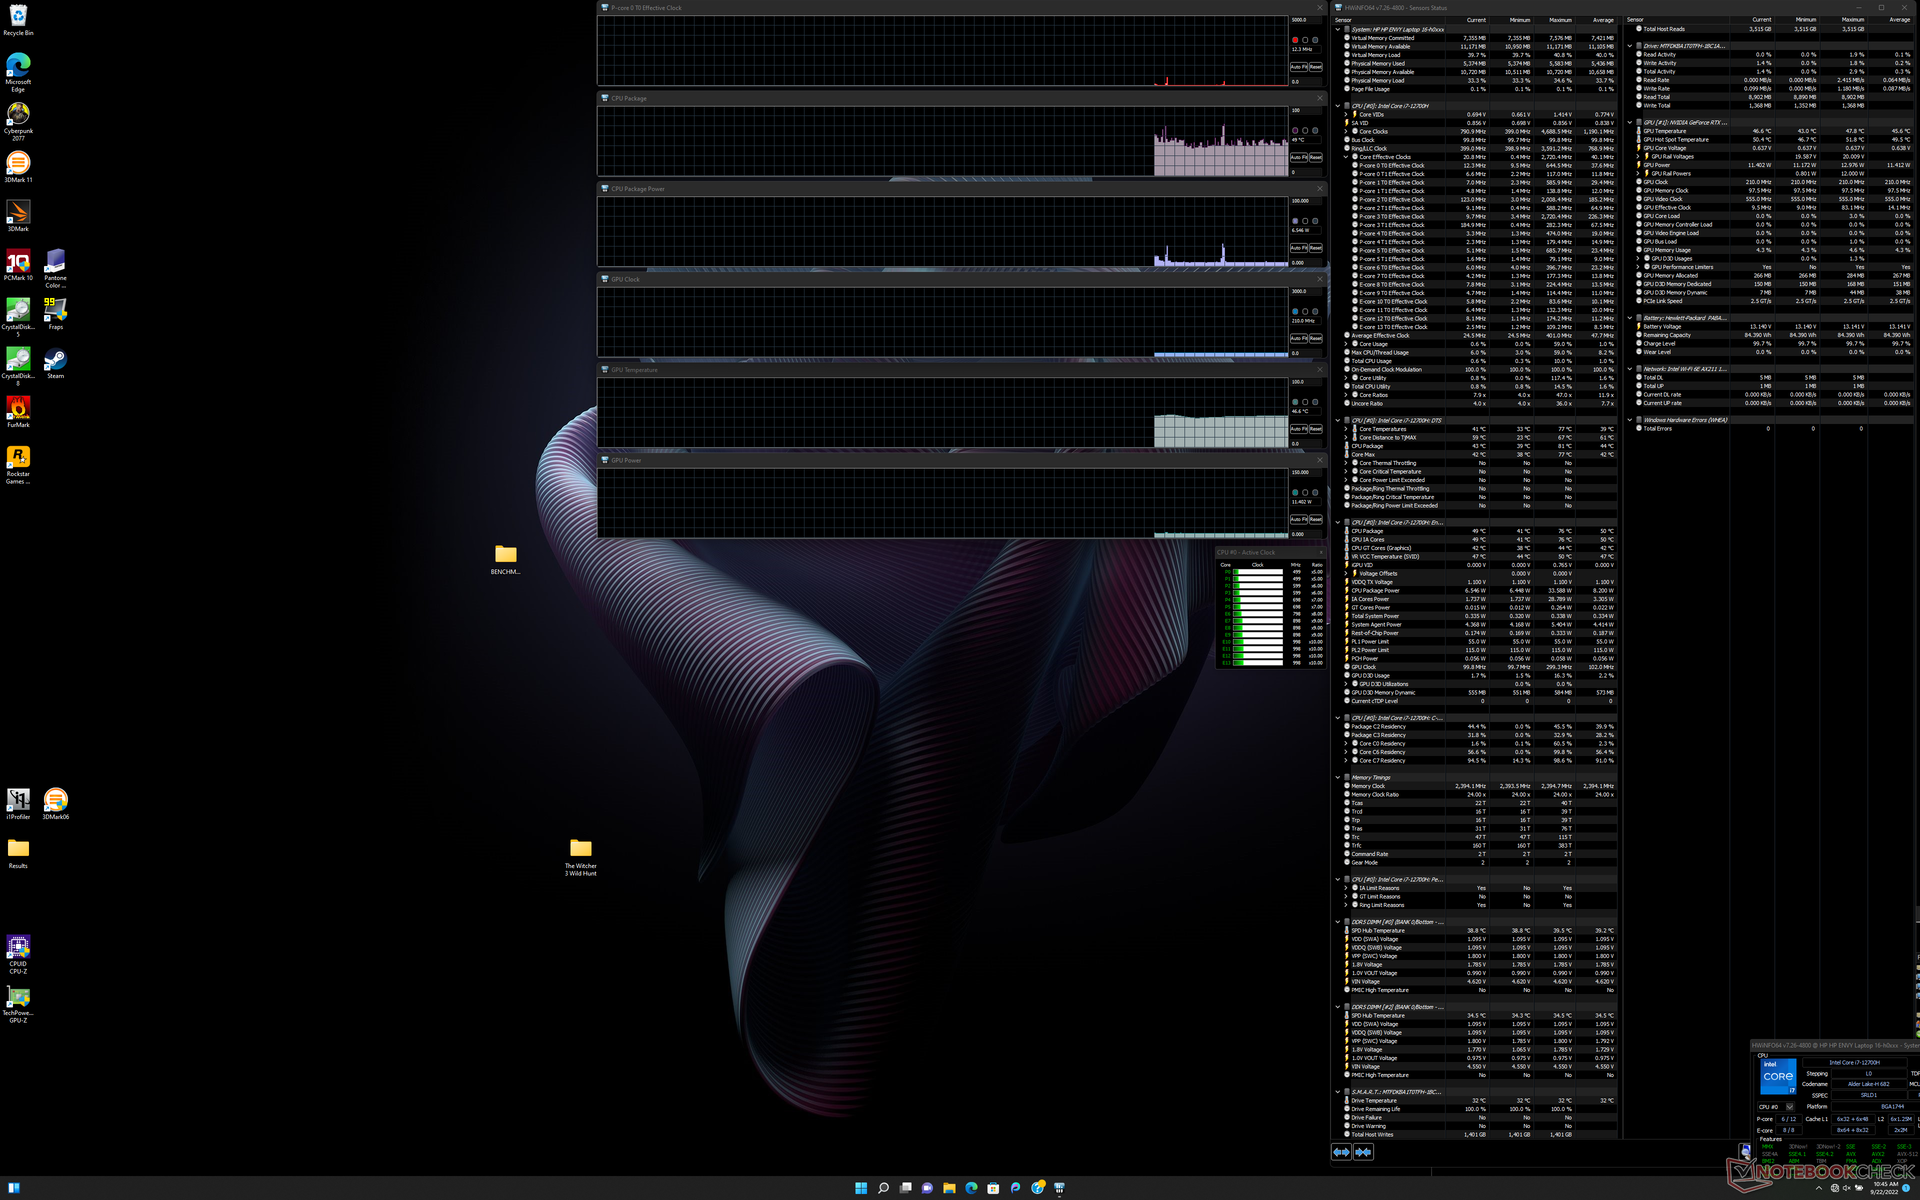
Bei der Ausführung von Prime95 stiegen die CPU-Taktraten, die Temperatur und die Leistungsaufnahme des Boards für etwa 15 Sekunden auf 3,7 GHz, 80 °C bzw. 115 W an. Danach sinkt die CPU und stabilisiert sich bei 2,1 bis 2,2 GHz, 66 °C und 55 W. Im Vergleich dazu würde die Durchführung desselben Tests auf dem MSI GS77 mit der gleichen Core i7-12700H-CPU sowohl zu höheren stabilen Taktraten als auch zu Kerntemperaturen von 2,7-3,0 GHz bzw. 96 °C führen. Möglicherweise geht HP beim Envy 16 den sichereren Weg, indem es mit tieferen Turbo-Boost-Taktraten arbeitet, um die Temperaturen niedrig zu halten.
Die GPU-Taktraten, die Temperatur und die Leistungsaufnahme der Karte stabilisieren sich bei 1.717 MHz, 74 °C bzw. 94 W, wenn Witcher 3 im Performance-Modus läuft. Diese Werte sinken auf 1.542 MHz, 72 °C und 80 W, wenn das Spiel stattdessen im Modus "Ausgewogen" ausgeführt wird. Wer die GPU voll ausnutzen will, muss die maximale Lüfterlautstärke des Systems ertragen.
Der Akkubetrieb schränkt die Leistung ein. Ein Fire-Strike-Test im Akkubetrieb liefert Physik- und Grafik-Scores von 17.295 bzw. 10.572 Punkten, verglichen mit 28.353 und 19.890 Punkten im Netzbetrieb.
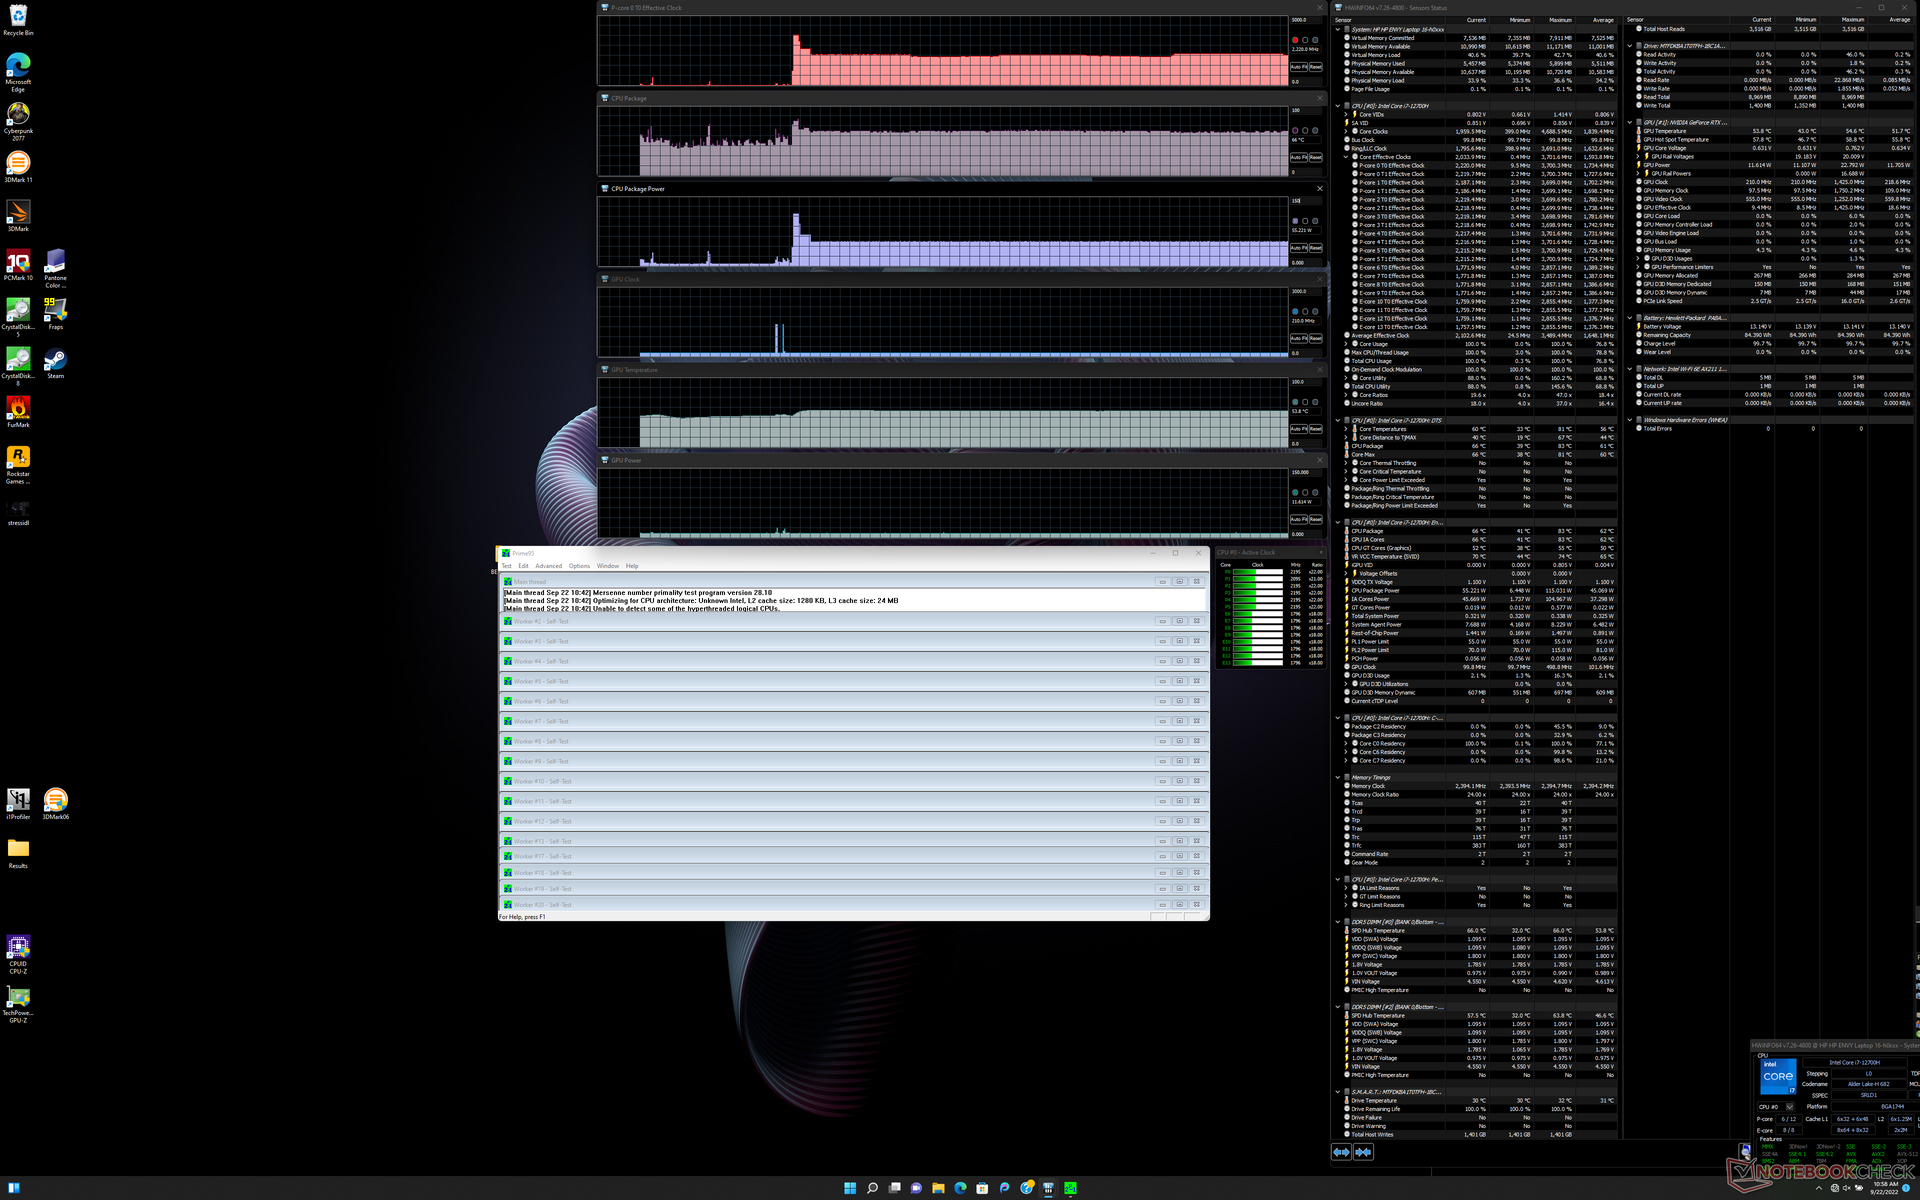


| CPU Clock (GHz) | GPU Clock (MHz) | Average CPU Temperature (°C) | Average GPU Temperature (°C) | |
| System Idle | -- | -- | 49 | 47 |
| Prime95 Stress | 2.1 - 2.2 | -- | 66 | 54 |
| Prime95 + FurMark Stress | 1.2 - 2.2 | ~1642 | 74 - 87 | 76 |
| Witcher 3 Stress (Balanced mode) | 0.67 | 1542 | 67 | 72 |
| Witcher 3 Stress (Performance mode) | 0.67 | 1717 | 69 | 74 |
Lautsprecher

HP Envy 16 h0112nr Audio Analyse
(+) | Die Lautsprecher können relativ laut spielen (84.4 dB)
Bass 100 - 315 Hz
(-) | kaum Bass - 15.9% niedriger als der Median
(±) | durchschnittlich lineare Bass-Wiedergabe (12.8% Delta zum Vorgänger)
Mitteltöne 400 - 2000 Hz
(+) | ausgeglichene Mitten, vom Median nur 3.1% abweichend
(+) | lineare Mitten (5.5% Delta zum Vorgänger)
Hochtöne 2 - 16 kHz
(+) | ausgeglichene Hochtöne, vom Median nur 3.4% abweichend
(+) | sehr lineare Hochtöne (6.3% Delta zum Vorgänger)
Gesamt im hörbaren Bereich 100 - 16.000 Hz
(+) | hörbarer Bereich ist sehr linear (12.1% Abstand zum Median
Im Vergleich zu allen Geräten derselben Klasse
» 15% aller getesteten Geräte dieser Klasse waren besser, 2% vergleichbar, 83% schlechter
» Das beste Gerät hat einen Delta-Wert von 5%, durchschnittlich ist 18%, das schlechteste Gerät hat 45%
Im Vergleich zu allen Geräten im Test
» 7% aller getesteten Geräte waren besser, 2% vergleichbar, 91% schlechter
» Das beste Gerät hat einen Delta-Wert von 4%, durchschnittlich ist 25%, das schlechteste Gerät hat 134%
Apple MacBook Pro 16 2021 M1 Pro Audio Analyse
(+) | Die Lautsprecher können relativ laut spielen (84.7 dB)
Bass 100 - 315 Hz
(+) | guter Bass - nur 3.8% Abweichung vom Median
(+) | lineare Bass-Wiedergabe (5.2% Delta zum Vorgänger)
Mitteltöne 400 - 2000 Hz
(+) | ausgeglichene Mitten, vom Median nur 1.3% abweichend
(+) | lineare Mitten (2.1% Delta zum Vorgänger)
Hochtöne 2 - 16 kHz
(+) | ausgeglichene Hochtöne, vom Median nur 1.9% abweichend
(+) | sehr lineare Hochtöne (2.7% Delta zum Vorgänger)
Gesamt im hörbaren Bereich 100 - 16.000 Hz
(+) | hörbarer Bereich ist sehr linear (4.6% Abstand zum Median
Im Vergleich zu allen Geräten derselben Klasse
» 0% aller getesteten Geräte dieser Klasse waren besser, 0% vergleichbar, 100% schlechter
» Das beste Gerät hat einen Delta-Wert von 5%, durchschnittlich ist 18%, das schlechteste Gerät hat 45%
Im Vergleich zu allen Geräten im Test
» 0% aller getesteten Geräte waren besser, 0% vergleichbar, 100% schlechter
» Das beste Gerät hat einen Delta-Wert von 4%, durchschnittlich ist 25%, das schlechteste Gerät hat 134%
Energiemanagement
Energieverbrauch


| Aus / Standby | |
| Idle | |
| Last |
|
Legende:
min: Derzeit nutzen wir das Metrahit Energy, ein professionelles TRMS Leistungs-Multimeter und PQ Analysator, für unsere Messungen. Mehr Details zu dem Messgerät finden Sie hier. Alle unsere Testmethoden beschreiben wir in diesem Artikel. | |
| HP Envy 16 h0112nr i7-12700H, GeForce RTX 3060 Laptop GPU, Micron 3400 1TB MTFDKBA1T0TFH, OLED, 3840x2400, 16.00 | Lenovo ThinkBook 16 G4+ IAP i7-12700H, GeForce RTX 2050 Mobile, Micron 2450 1TB MTFDKCD1T0TFK, IPS, 2560x1600, 16.00 | MSI Creator Z16P B12UHST i9-12900H, GeForce RTX 3080 Ti Laptop GPU, Samsung PM9A1 MZVL22T0HBLB, IPS True Pixel (~100% DCI-P3), 2560x1600, 16.00 | Dell Inspiron 16 Plus 7610-MHJ8F i7-11800H, UHD Graphics Xe 32EUs (Tiger Lake-H), OM3PDP3-AD NVMe KDI 512GB, IPS, 3072x1920, 16.00 | Apple MacBook Pro 16 2021 M1 Pro M1 Pro, M1 Pro 16-Core GPU, Apple SSD AP1024R, Mini-LED, 3456x2234, 16.20 | Huawei MateBook 16s i7 i7-12700H, Iris Xe G7 96EUs, Silicon Motion PCIe-8 SSD, IPS, 2520x1680, 16.00 | |
|---|---|---|---|---|---|---|
| Stromverbrauch | 36% | -11% | 50% | 33% | 35% | |
| Idle min * | 10 | 5 50% | 11 -10% | 5.4 46% | 5 50% | 6.8 32% |
| Idle avg * | 10.9 | 11.2 -3% | 17 -56% | 9.8 10% | 15.1 -39% | 13.2 -21% |
| Idle max * | 27.8 | 11.6 58% | 26 6% | 14 50% | 15.5 44% | 13.8 50% |
| Last avg * | 116.4 | 89.3 23% | 124 -7% | 44 62% | 54 54% | 75.2 35% |
| Witcher 3 ultra * | 133.7 | 83 38% | 133.5 -0% | 44 67% | 56.1 58% | |
| Last max * | 209.8 | 102 51% | 212 -1% | 76.8 63% | 90 57% | 90.6 57% |
* ... kleinere Werte sind besser
Power Consumption Witcher 3 / Stresstest
Stromverbrauch externer Monitor
Batterielaufzeit

(Update vom 27. September 2022: HP hat uns bestätigt, dass das Modell nur über USB-C aufgeladen werden kann, wenn das Gerät ausgeschaltet ist. Im Vergleich dazu können alle anderen von uns getesteten Laptops mit Unterstützung für PD-in aufgeladen werden, während das Gerät eingeschaltet ist. Unser Originaltext steht unten).
Die WLAN-Laufzeit ist mit etwa acht Stunden vergleichbar mit der des MateBook 16s i7 oder des ThinkBook 16 G4+ IAP. Die Akkukapazität ist trotz dem größeren Bildschirm identisch mit der des 2020er Envy 15.
Das Aufladen von leer auf voll mit dem mitgelieferten Adapter dauert etwa 1,5 Stunden. Das System kann nicht über USB-C aufgeladen werden, auch wenn dies in den offiziellen Spezifikationen behauptet wird. Wenn ein 100-W-USB-C-Ladegerät eingesteckt wird, gibt das System lediglich eine Aufforderung aus, stattdessen ein Ladegerät mit höherer Kapazität zu verwenden. Wir haben HP um Klärung gebeten und werden diesen Abschnitt entsprechend aktualisieren.
| HP Envy 16 h0112nr i7-12700H, GeForce RTX 3060 Laptop GPU, 83 Wh | Lenovo ThinkBook 16 G4+ IAP i7-12700H, GeForce RTX 2050 Mobile, 71 Wh | MSI Creator Z16P B12UHST i9-12900H, GeForce RTX 3080 Ti Laptop GPU, 90 Wh | Dell Inspiron 16 Plus 7610-MHJ8F i7-11800H, UHD Graphics Xe 32EUs (Tiger Lake-H), 86 Wh | Apple MacBook Pro 16 2021 M1 Pro M1 Pro, M1 Pro 16-Core GPU, 99.6 Wh | Huawei MateBook 16s i7 i7-12700H, Iris Xe G7 96EUs, 84 Wh | |
|---|---|---|---|---|---|---|
| Akkulaufzeit | 0% | -36% | 70% | 115% | 13% | |
| Idle | 1068 | 1350 26% | ||||
| WLAN | 472 | 489 4% | 310 -34% | 567 20% | 1016 115% | 483 2% |
| Last | 94 | 90 -4% | 58 -38% | 247 163% | 116 23% | |
| H.264 | 757 | 345 | 1048 | 555 | ||
| WLAN (alt) | 569 |
Pro
Contra
Fazit: Wie ein günstiges MacBook Pro 16

Das Envy 16 ist natürlich schneller als das ältere Envy 15, aber einige der Nachteile, die wir beim Envy 15 erwähnt haben, sind noch nicht behoben. Es gibt viele Verbesserungen, wie z. B. bei der Webcam, den Lautsprechern, den kabellosen Verbindungen, der Größe des Clickpads und der Akkulaufzeit, aber andere Dinge wie die lauten Lüfter, das fehlende Kensington Lock, das schwammige Clickpad und die relativ schwachen Scharniere sind dieses Jahr nicht besser. Eine Verbesserung dieser Schwachstellen hätte dem Envy 16 geholfen, sich gegen Konkurrenten wie das MacBook Pro 16 oder den Dell Inspiron 16 Plus durchzusetzen. Das System ist außerdem eines der größeren und schwereren 16-Zoll-Notebooks auf dem Markt, was Vielreisende und Studenten abschrecken könnte.
Das HP Envy 16 ist fast 1.000 Euro günstiger als das MacBook Pro 16 und bietet gleichzeitig konkurrenzfähige Leistungsmerkmale und Farben. Allerdings ist es ein ziemlich lautes und schweres Gerät.
Nutzer, die sich vom Gewicht nicht abschrecken lassen, werden im Envy 16 ein vielseitiges System finden, dessen Leistung, Bildschirmgröße und Farben für Gaming und Content-Creation geeignet ist. Wir schätzen besonders, wie einfach es ist, bei Bedarf mehr Speicher oder RAM hinzuzufügen. Wenn die Aufgaben jedoch nicht viel Leistung erfordern, dann sollten man viel leichtere 16-Zoll-Geräte wie das LG Gram 16 oder das Huawei MateBook 16s in Betracht ziehen.
Preis und Verfügbarkeit
Das Envy 16 ist in den USA in dieser Konfiguration für 1.700 US-Dollar erhältlich.
Hierzulande kann man andere Konfigurationen des Geräts (z. B. ohne OLED-Display) momentan via Geizhals.de erwerben.
HP Envy 16 h0112nr
-
24.09.2022 v7
Allen Ngo

Preisvergleich

