Samsung Galaxy Book3 Ultra 16 mit RTX 4070 im Notebook-Test: Viel Grafikleistung im Business-Look
Mit dem Galaxy Book3 Ultra wagt sich Samsung ins Segment der leistungsstarken Multimedia-Notebooks. Wahlweise mit einer Nvidia GeForce RTX 4050 oder RTX 4070 ausgestattet, stehen Video- und Bildbearbeitung auf hohem Niveau im Vordergrund. Gleichzeitig gibt sich der Laptop schlank, unauffällig und ist knapp 1 kg leichter als ein ähnlich ausgestattetes Gaming-Notebook.
Dank der starken Reduzierung der Leistungsaufnahme genügt eine kleine Kühlung, die zudem weniger Platz einnimmt. Im Test schauen wir uns an, wie stark sich die Grafikleistung reduziert, wenn das System statt 250 oder 300 Watt mit knapp 100 Watt auskommen muss. Zudem muss sich zeigen, wie gut Samsung bei dem geringen Platzangebot die Wärmeemissionen und die Lautstärke der Lüftung begrenzen konnte.
Das kleinere Samsung Galaxy Book3 Ultra mit RTX 4050 konnten wir bereits testen. Ein Konkurrent für vergleichbare Aufgaben und mit vergleichbarer Hardware ist zum Beispiel das Gigabyte AERO 16 OLED. Aber auch der Blick zum besser ausgestatteten und teureren MSI Stealth 17 Studio schadet sicher nicht. Und ein MacBook Pro mit M2-Chip dürfte bei Preis und Leistung ungefähr auf Augenhöhe sein, wobei der Vergleich zwischen Windows und Mac natürlich hinkt.
mögliche Konkurrenten im Vergleich
Bew. | Datum | Modell | Gewicht | Dicke | Größe | Auflösung | Preis ab |
|---|---|---|---|---|---|---|---|
| 88.8 % v7 (old) | 05 / 2023 | Samsung Galaxy Book3 Ultra 16, i9-13900H RTX 4070 i9-13900H, GeForce RTX 4070 Laptop GPU | 1.8 kg | 16.8 mm | 16.00" | 2880x1800 | |
| 90.3 % v7 (old) | 04 / 2023 | Dell XPS 15 9530 RTX 4070 i7-13700H, GeForce RTX 4070 Laptop GPU | 1.9 kg | 18 mm | 15.60" | 3456x2160 | |
| 89.2 % v7 (old) | 04 / 2023 | MSI Stealth 17 Studio A13VH-014 i9-13900H, GeForce RTX 4080 Laptop GPU | 3 kg | 21.3 mm | 17.30" | 3840x2160 | |
| 89 % v7 (old) | 02 / 2023 | Asus ProArt StudioBook 16 H7600ZW i9-12900H, GeForce RTX 3070 Ti Laptop GPU | 2.4 kg | 19.9 mm | 16.00" | 3840x2400 | |
| 86.2 % v7 (old) | 03 / 2023 | Gigabyte AERO 16 OLED BSF i9-13900H, GeForce RTX 4070 Laptop GPU | 2.1 kg | 18 mm | 16.00" | 3840x2400 | |
| 89.4 % v7 (old) | 04 / 2023 | Samsung Galaxy Book3 Ultra 16 i7-13700H, GeForce RTX 4050 Laptop GPU | 1.8 kg | 16.5 mm | 16.00" | 2880x1800 |
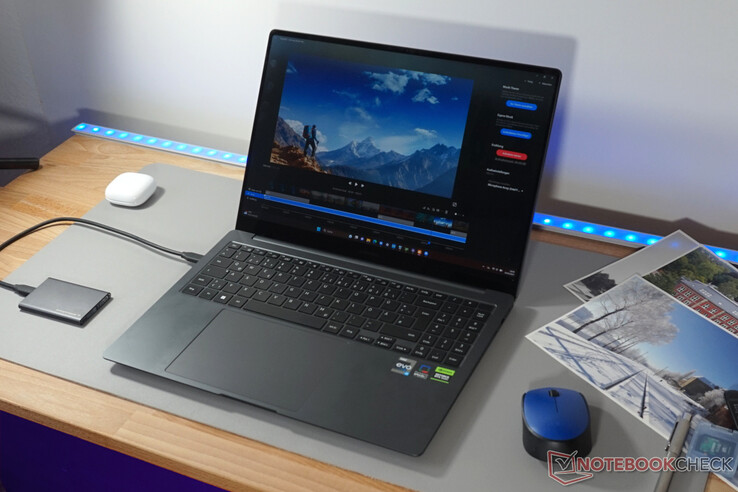
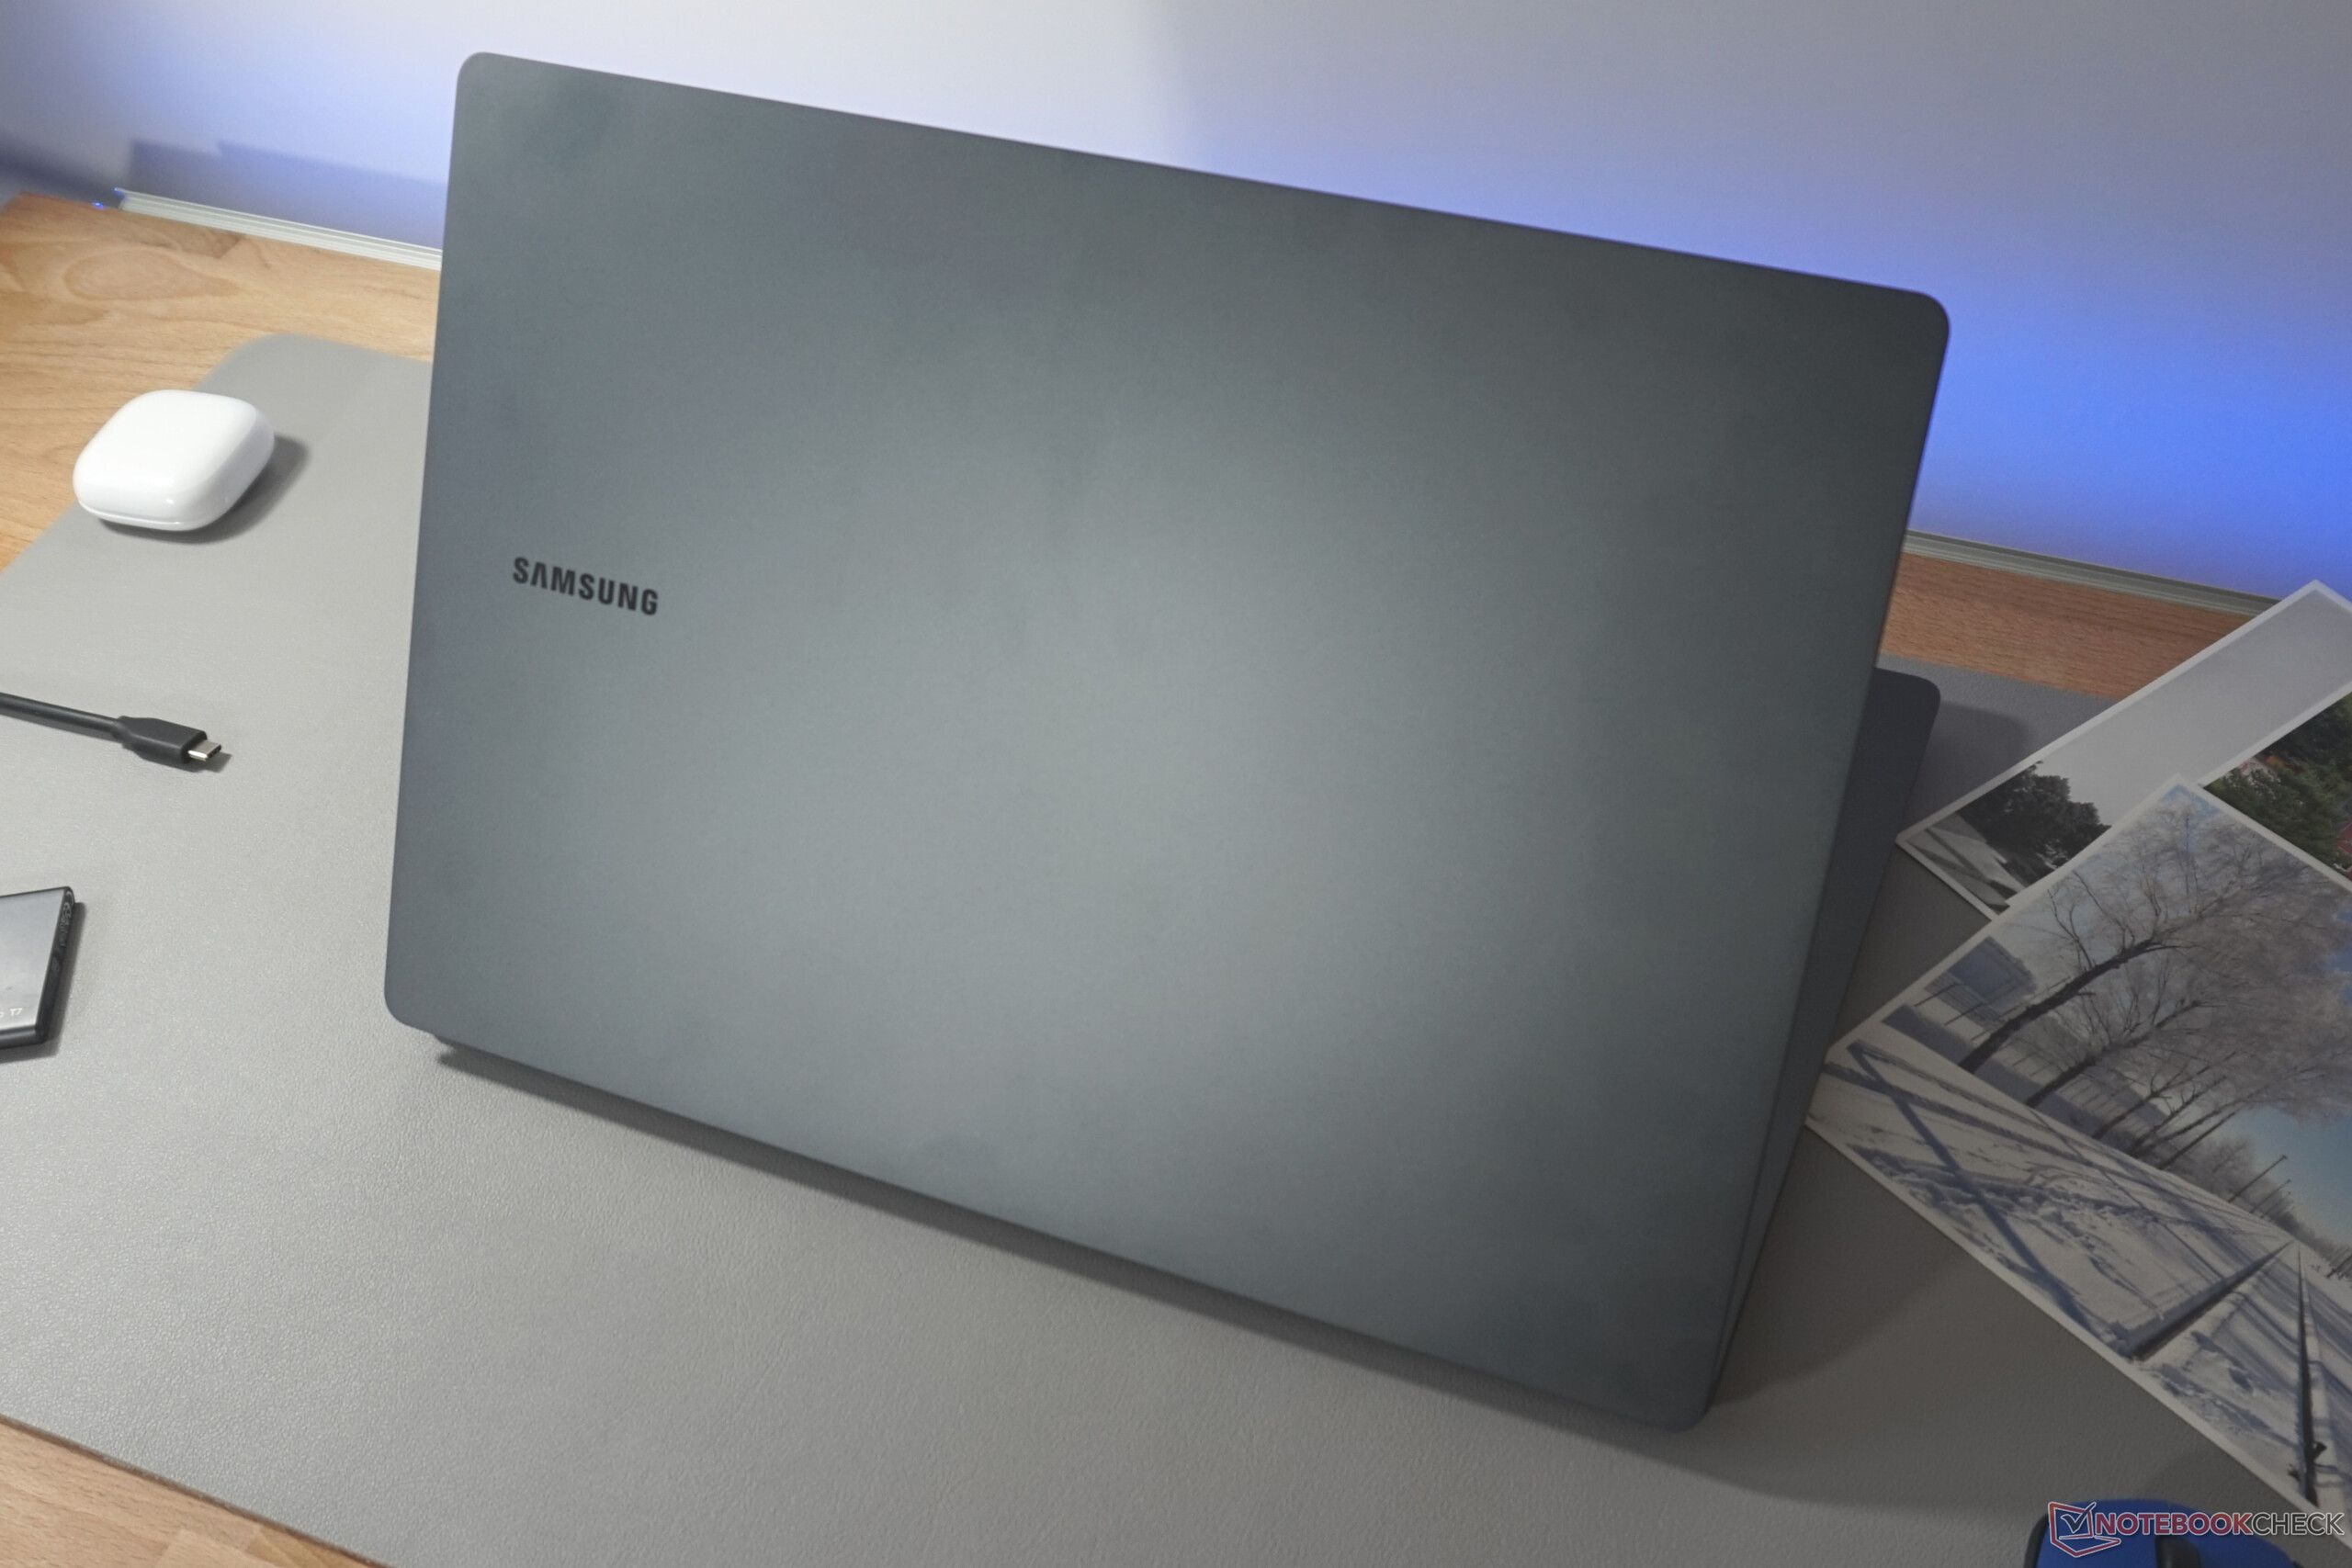
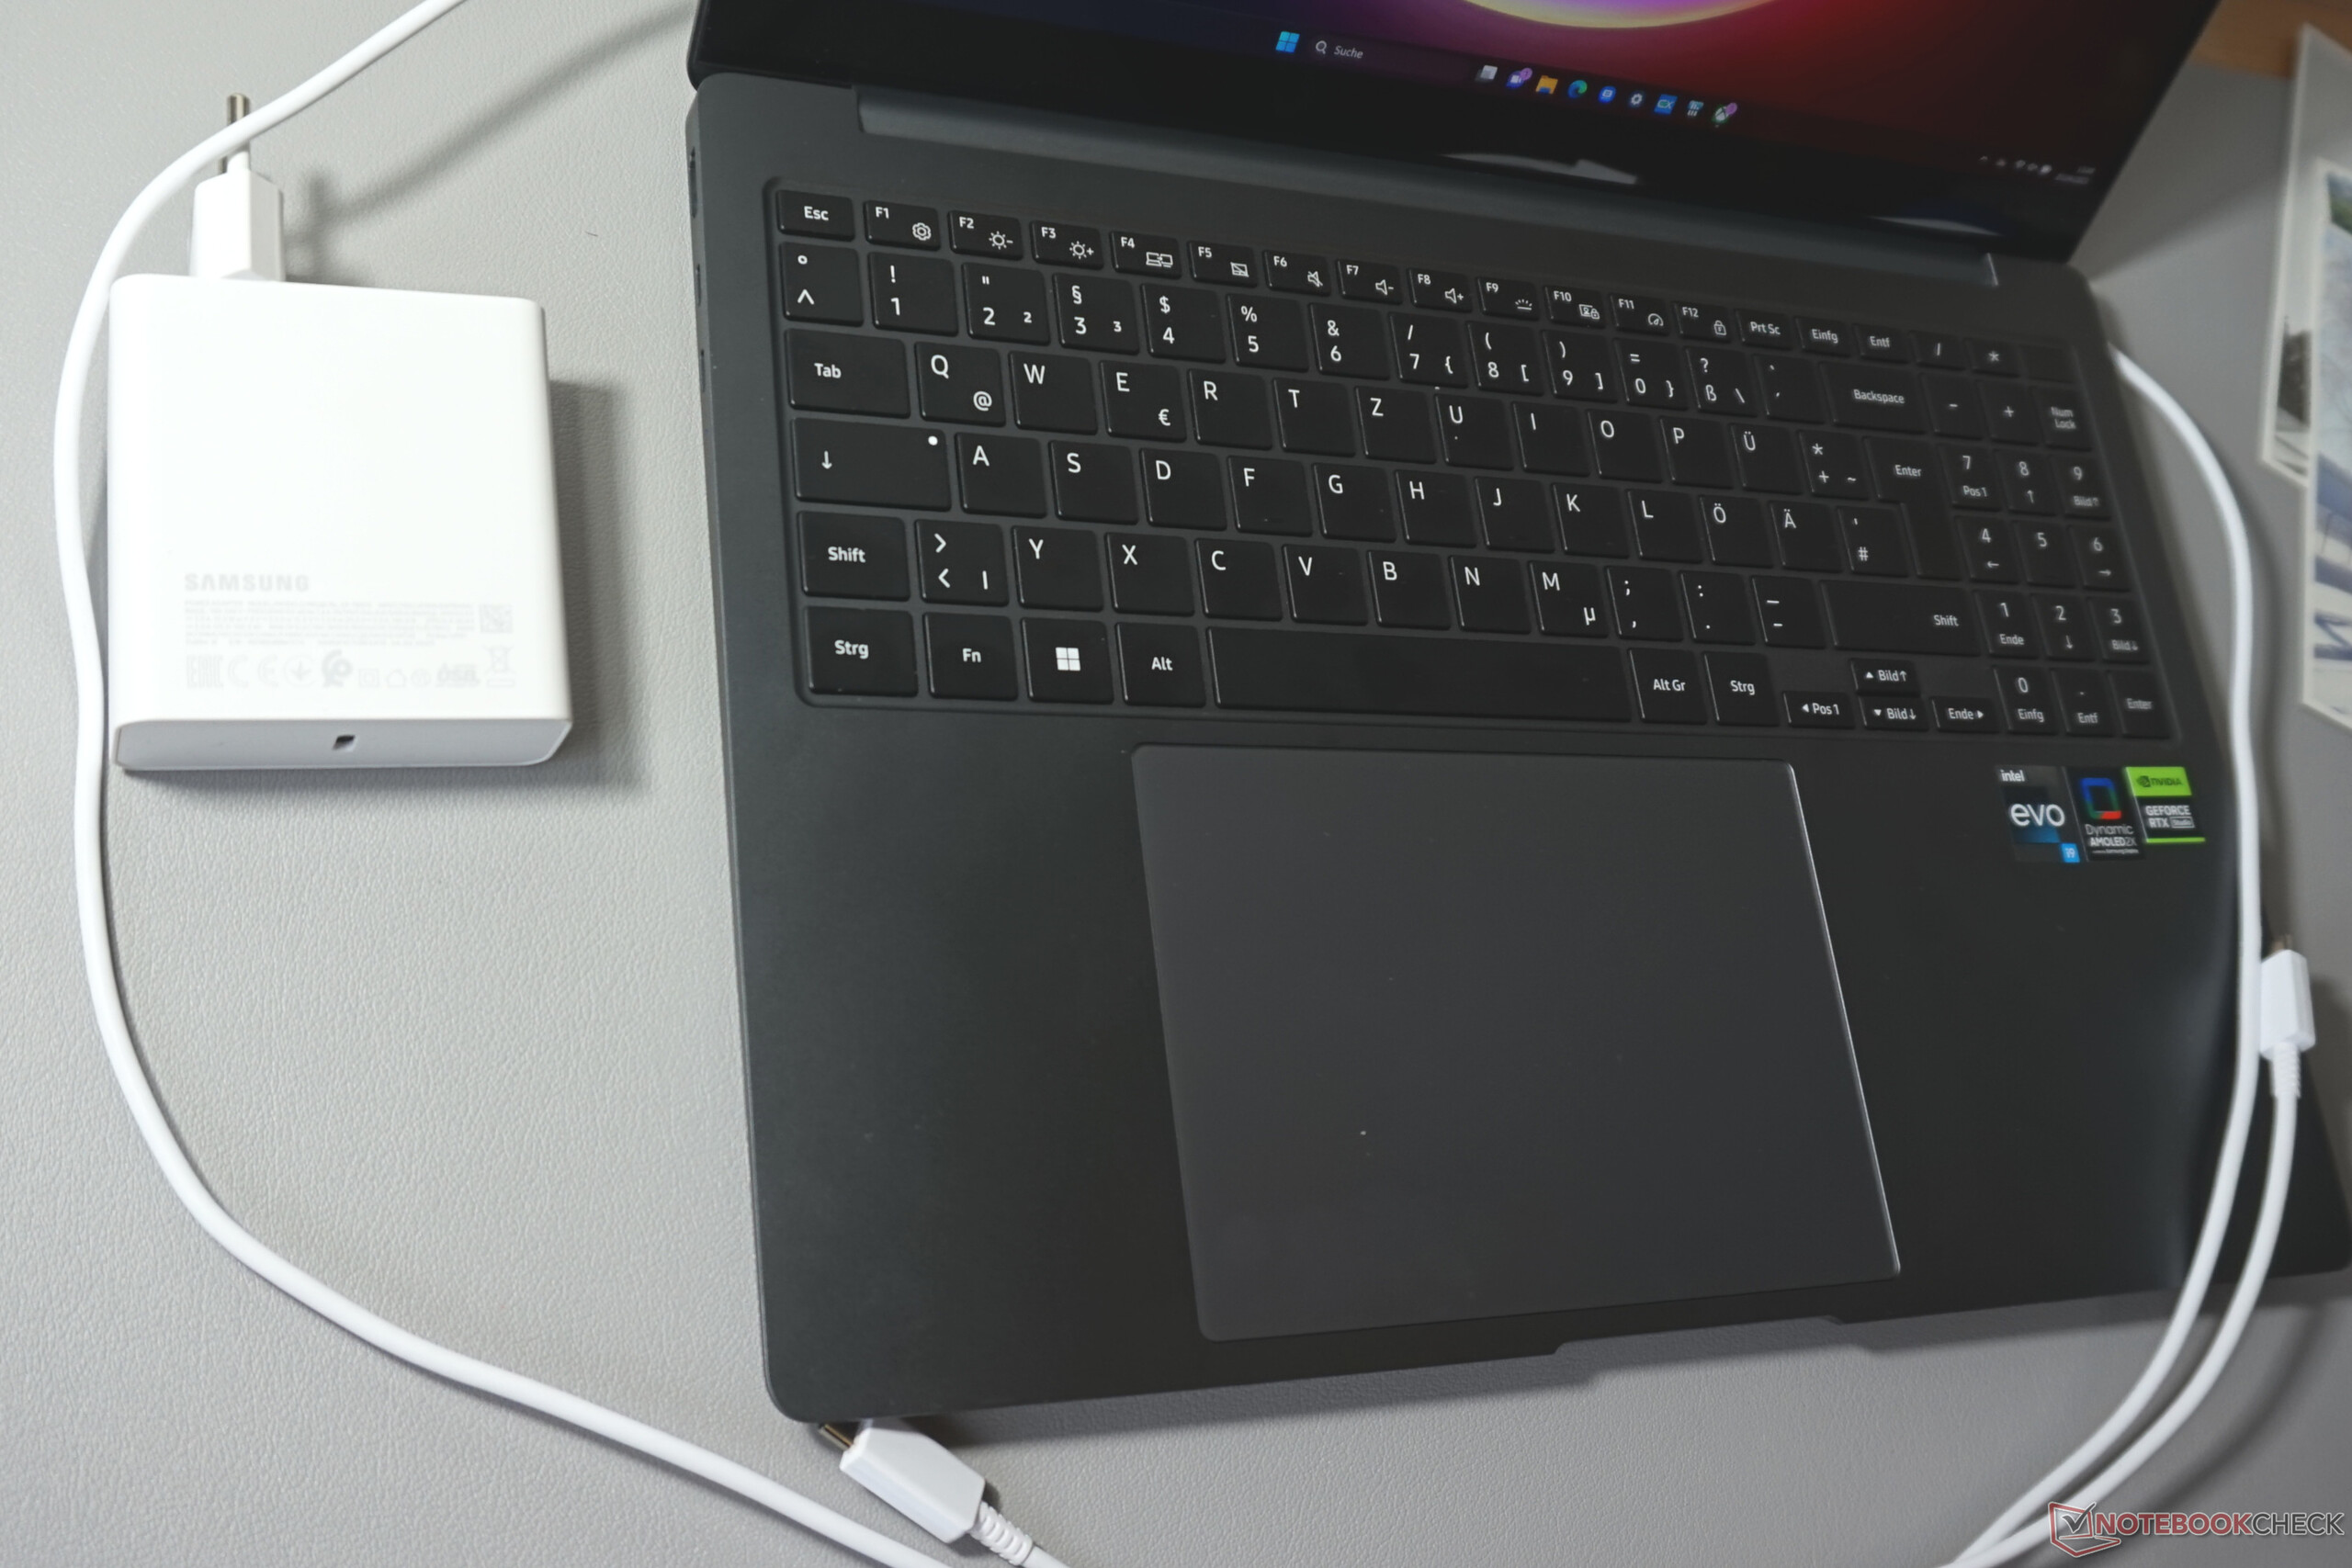
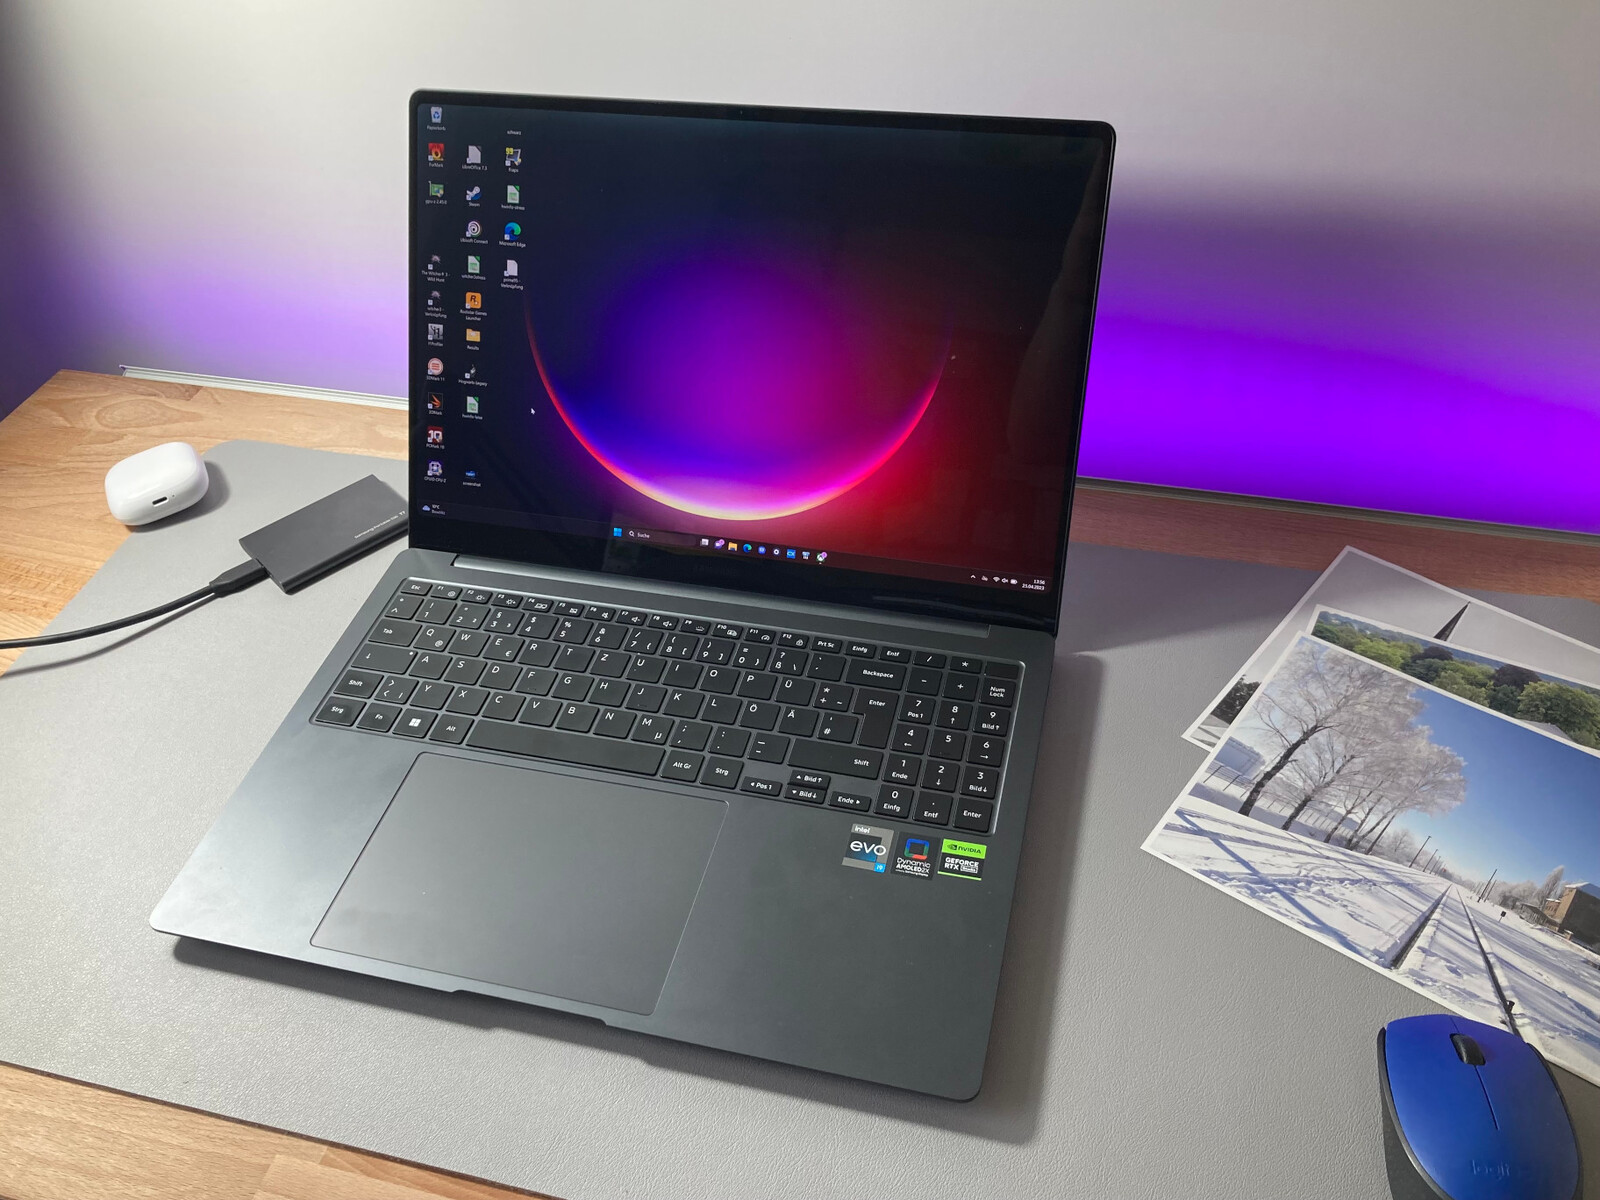
Gehäuse - Extrem dünnes Galaxy Book
Unscheinbar und nüchtern wirkt das dunkle Grau des Galaxy Book Ultra. Der Boden und der Tastaturrahmen aus Kunststoff lassen sich zumindest optisch kaum vom metallenen Displaydeckel unterscheiden. Alles wirkt präzise zusammengefügt, Spalten lassen sich keine entdecken.
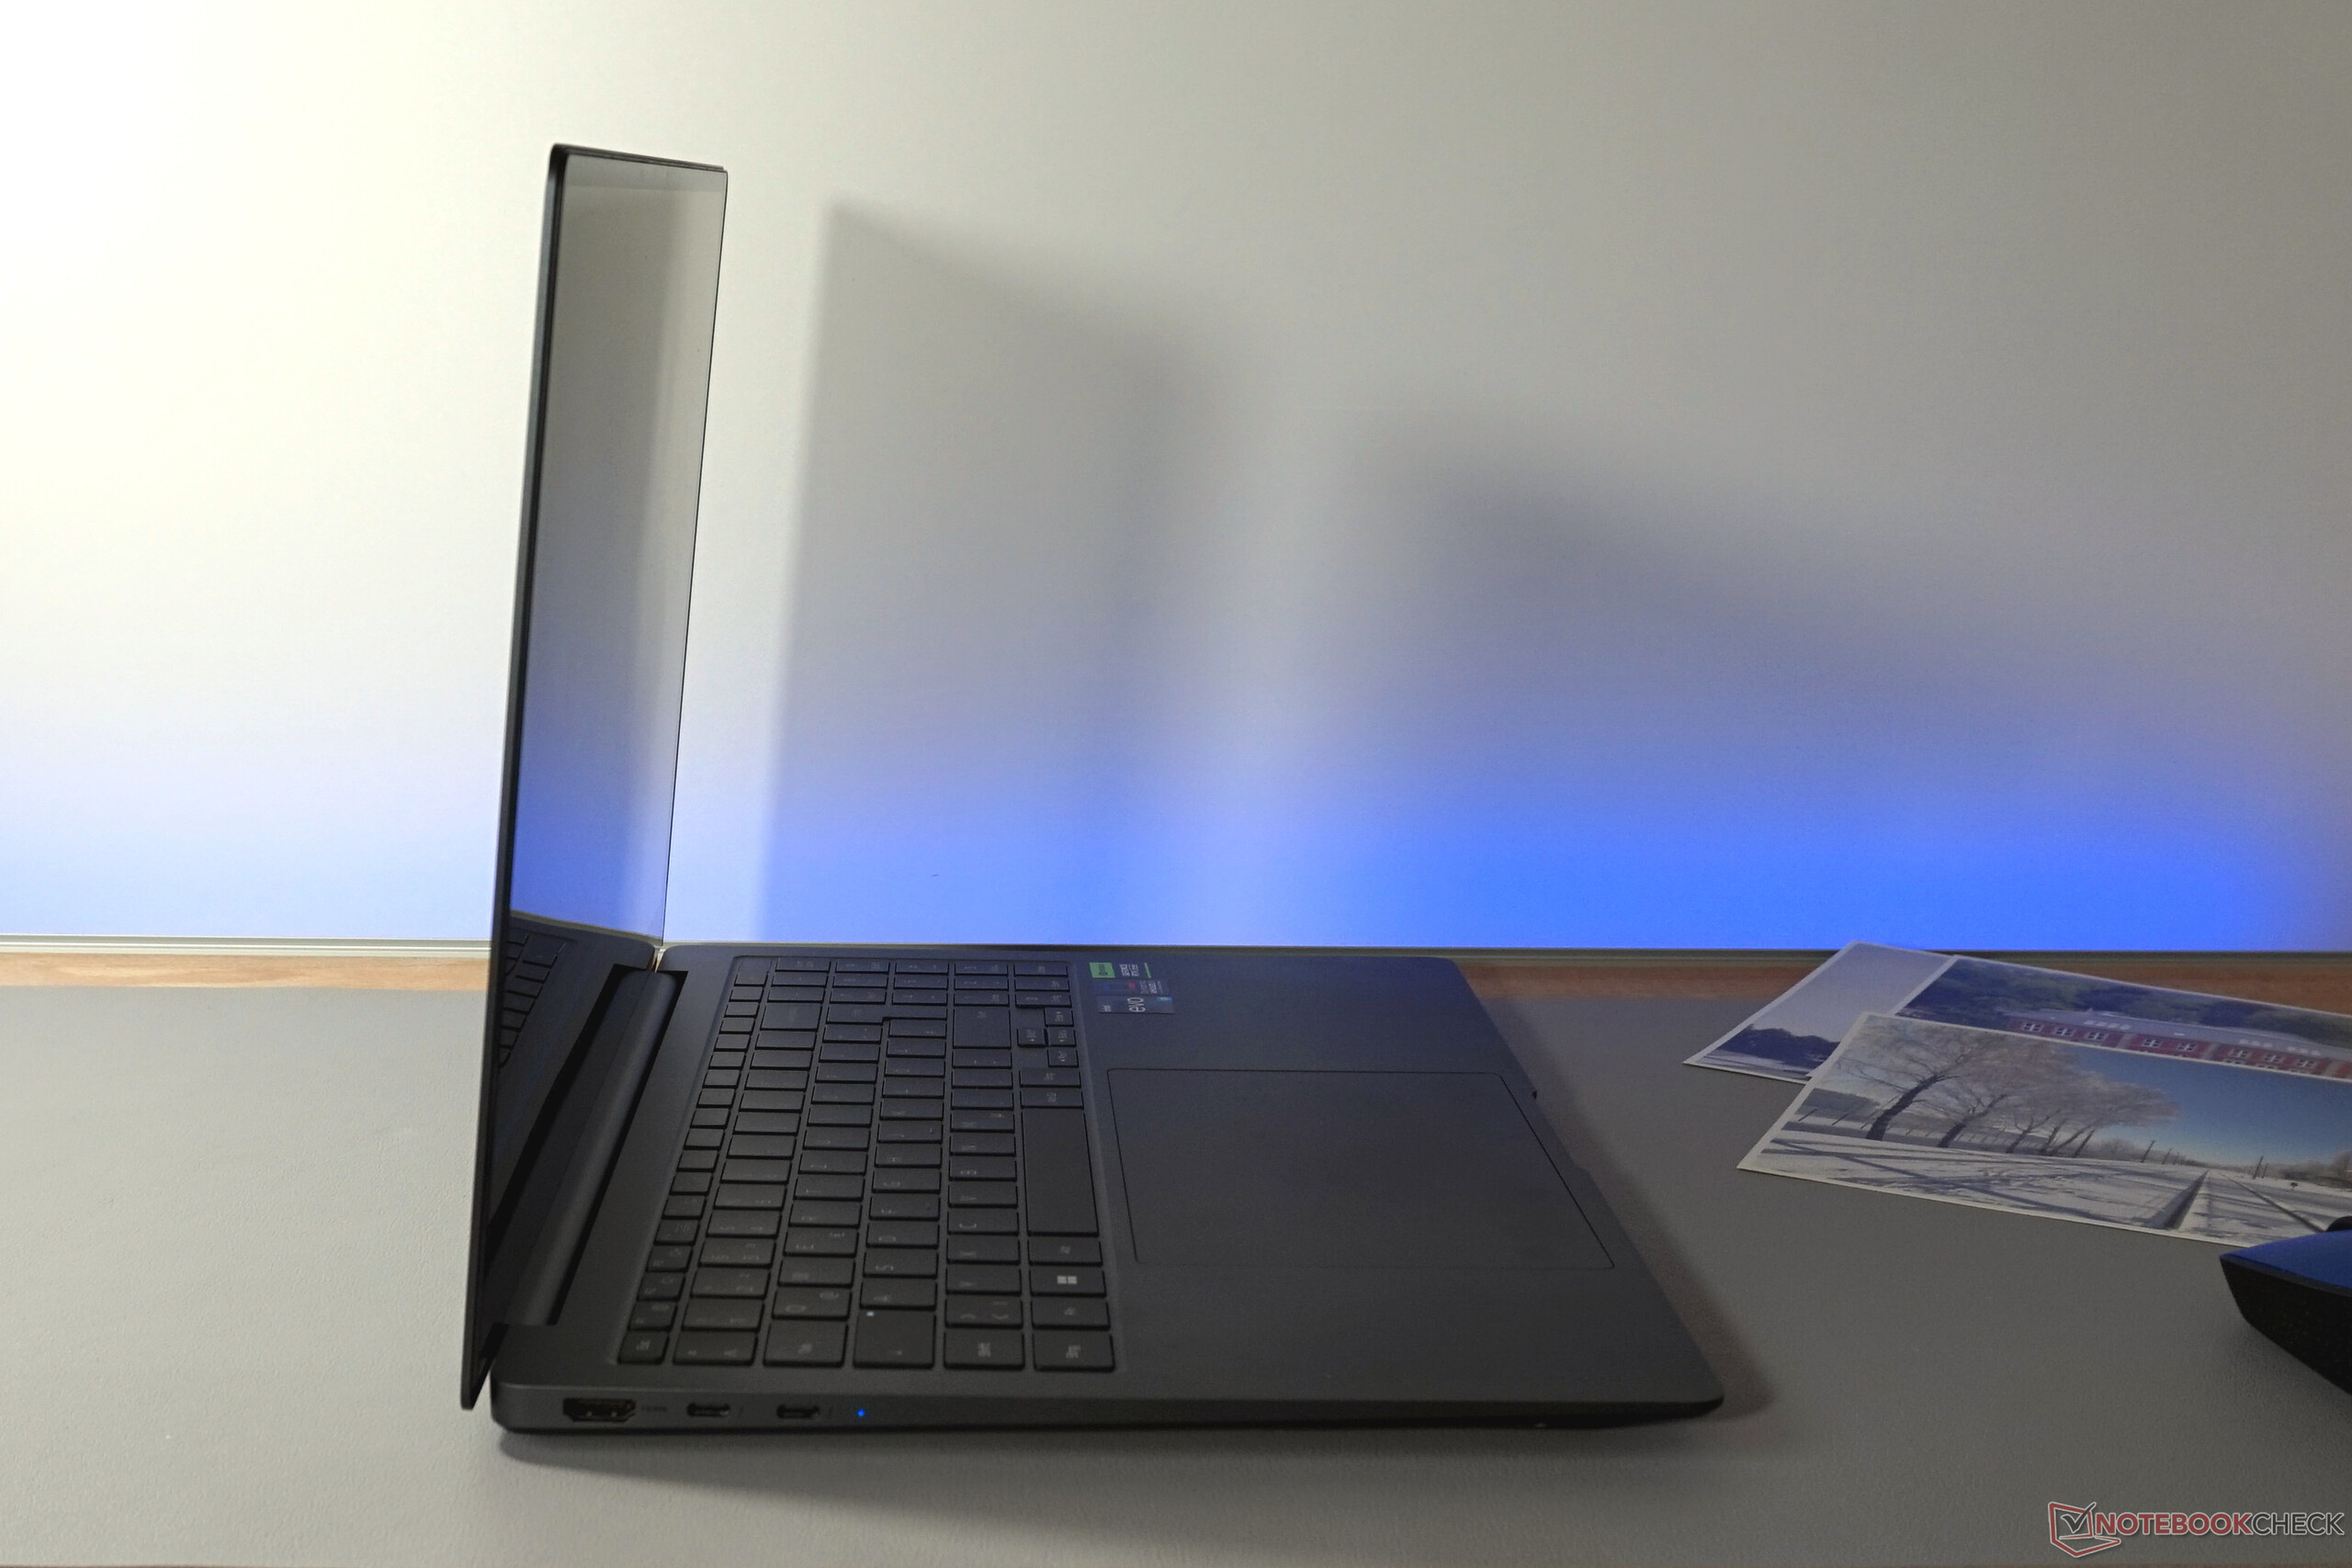
Hoch ist die Verwindungssteifigkeit. Nur ein minimales Verbiegen des sehr flachen Gehäuses lässt sich beobachten. Auch das Display, welches sich wegen des hohen Gewichts problemlos mit einer Hand öffnen lässt und bis 135° aufgeklappt werden kann, wirkt extrem fest. Nur die Scharniere wippen etwas zu viel nach.
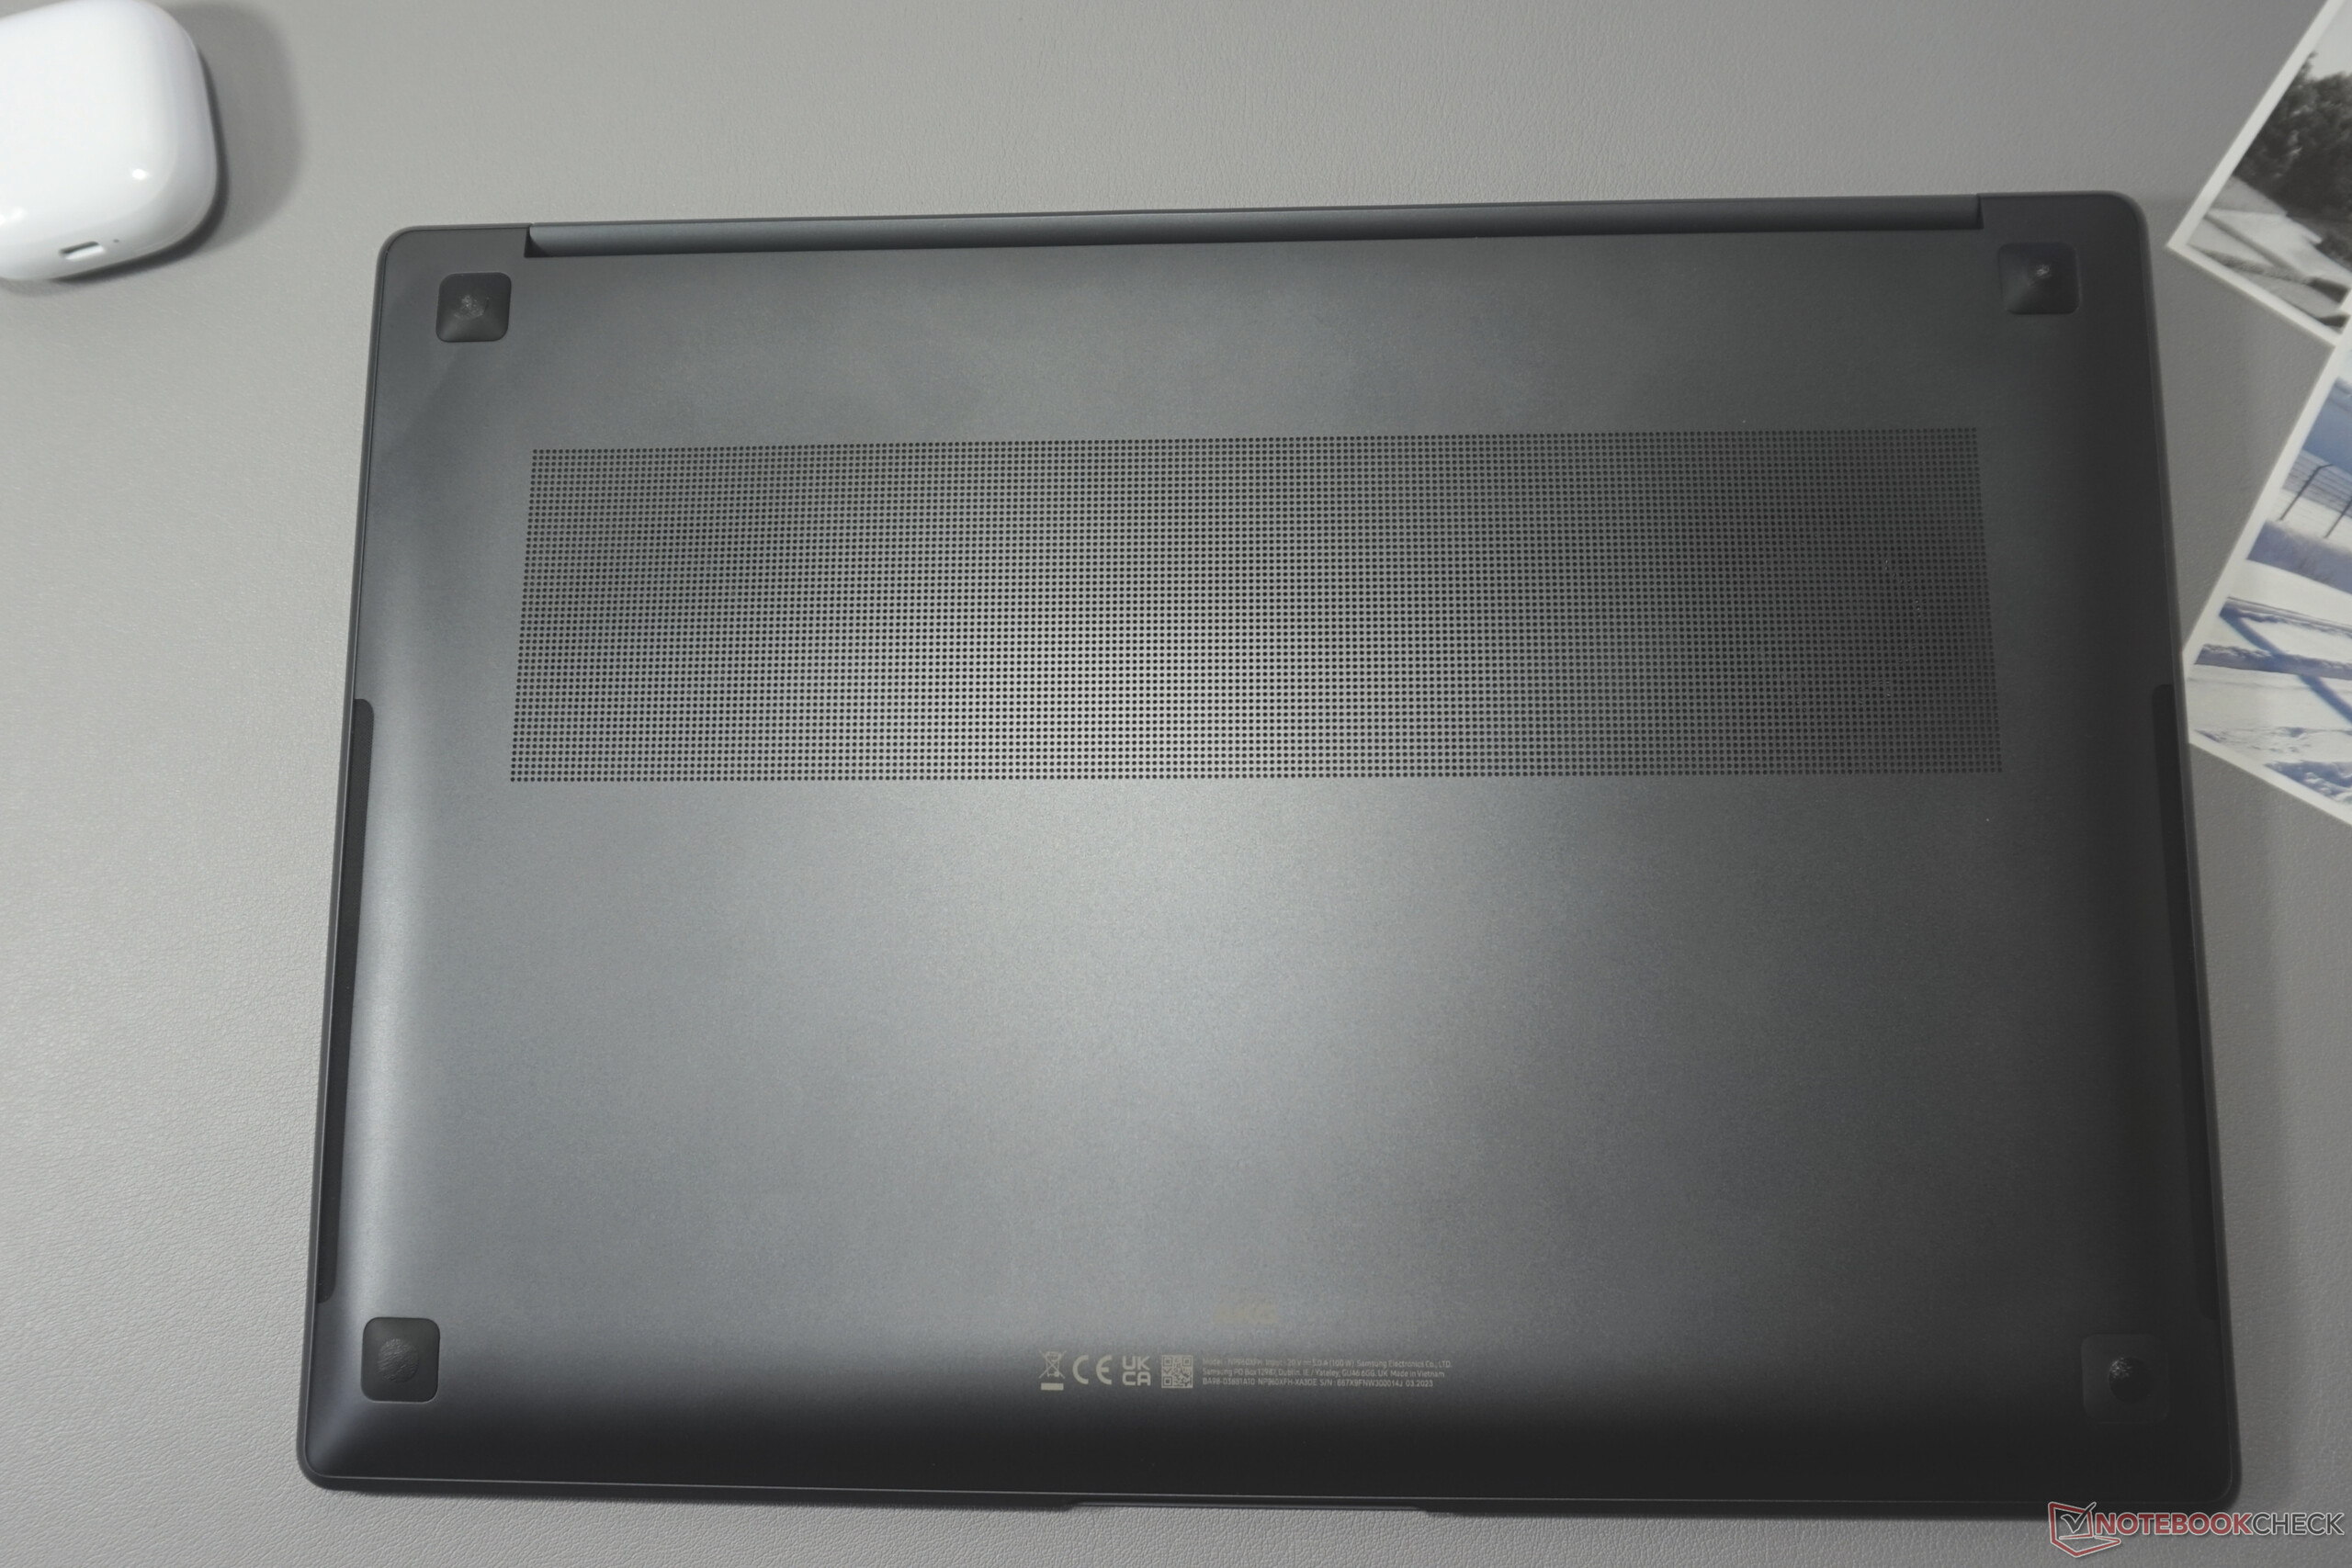
Wirklich auffällig ist das Fehlen größerer Lüftungsschlitze. Lediglich in der Bodenplatte und über sehr dezente Gitter an den Seiten wird Luftaustausch ermöglicht.
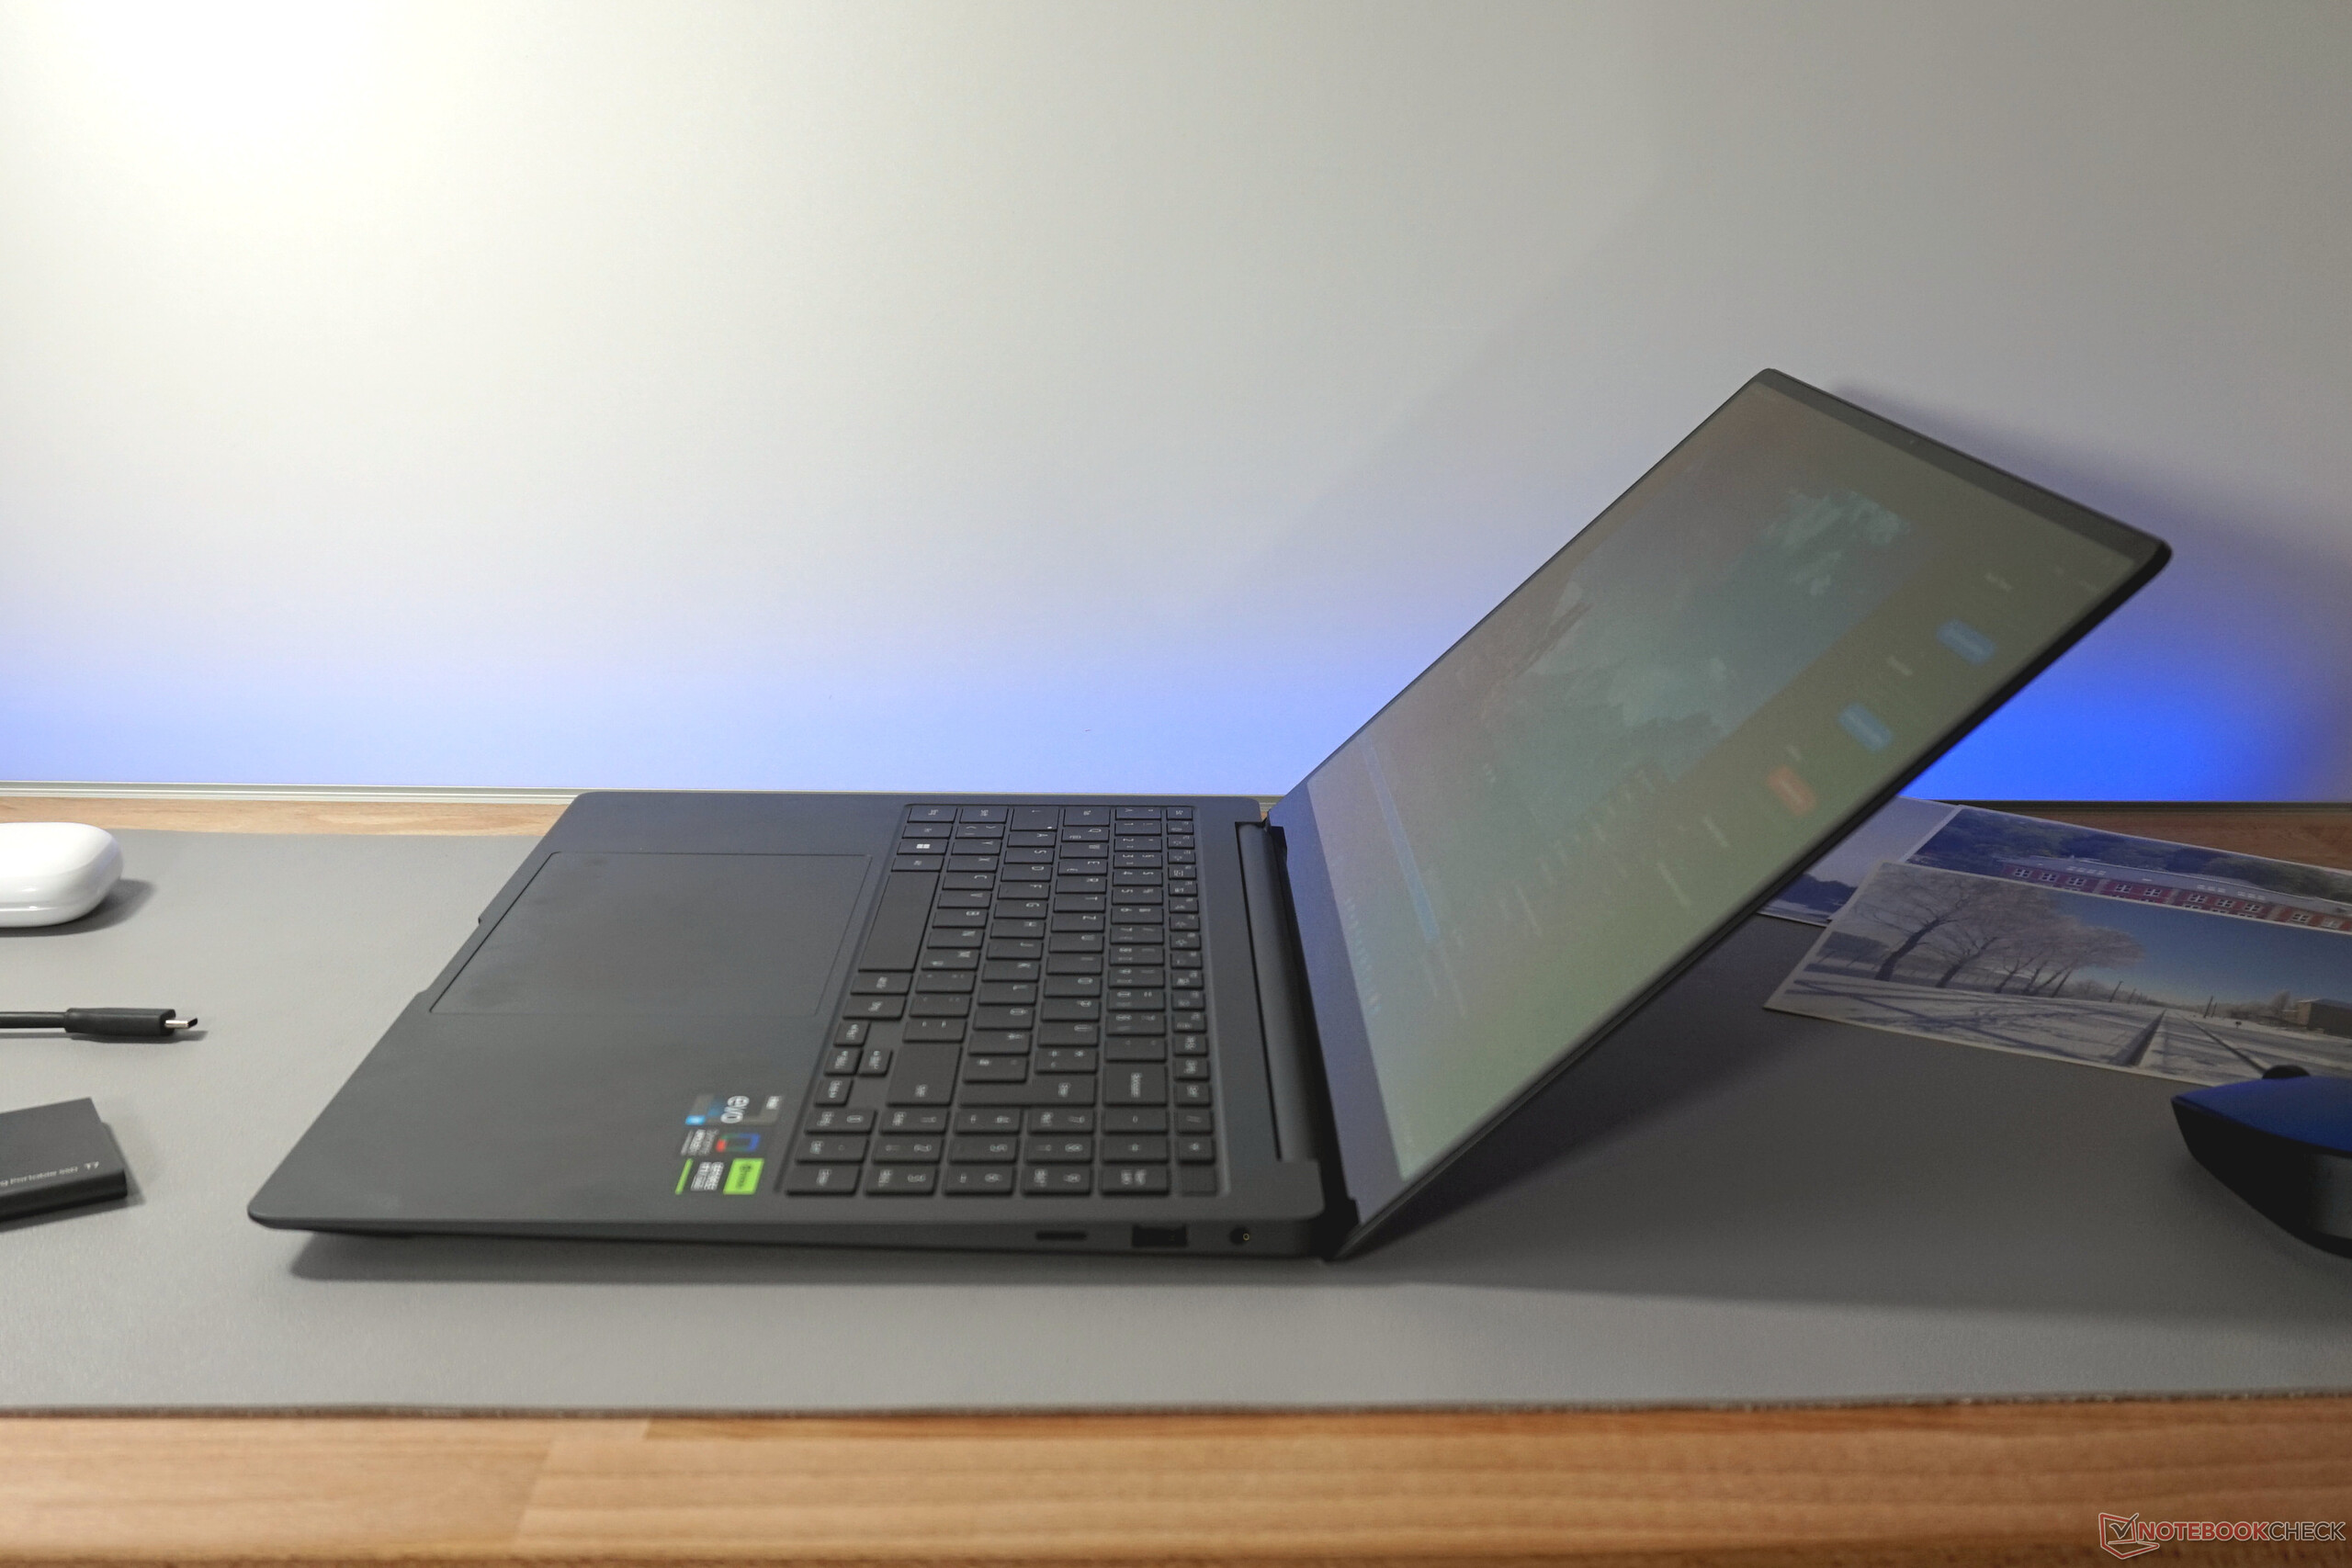
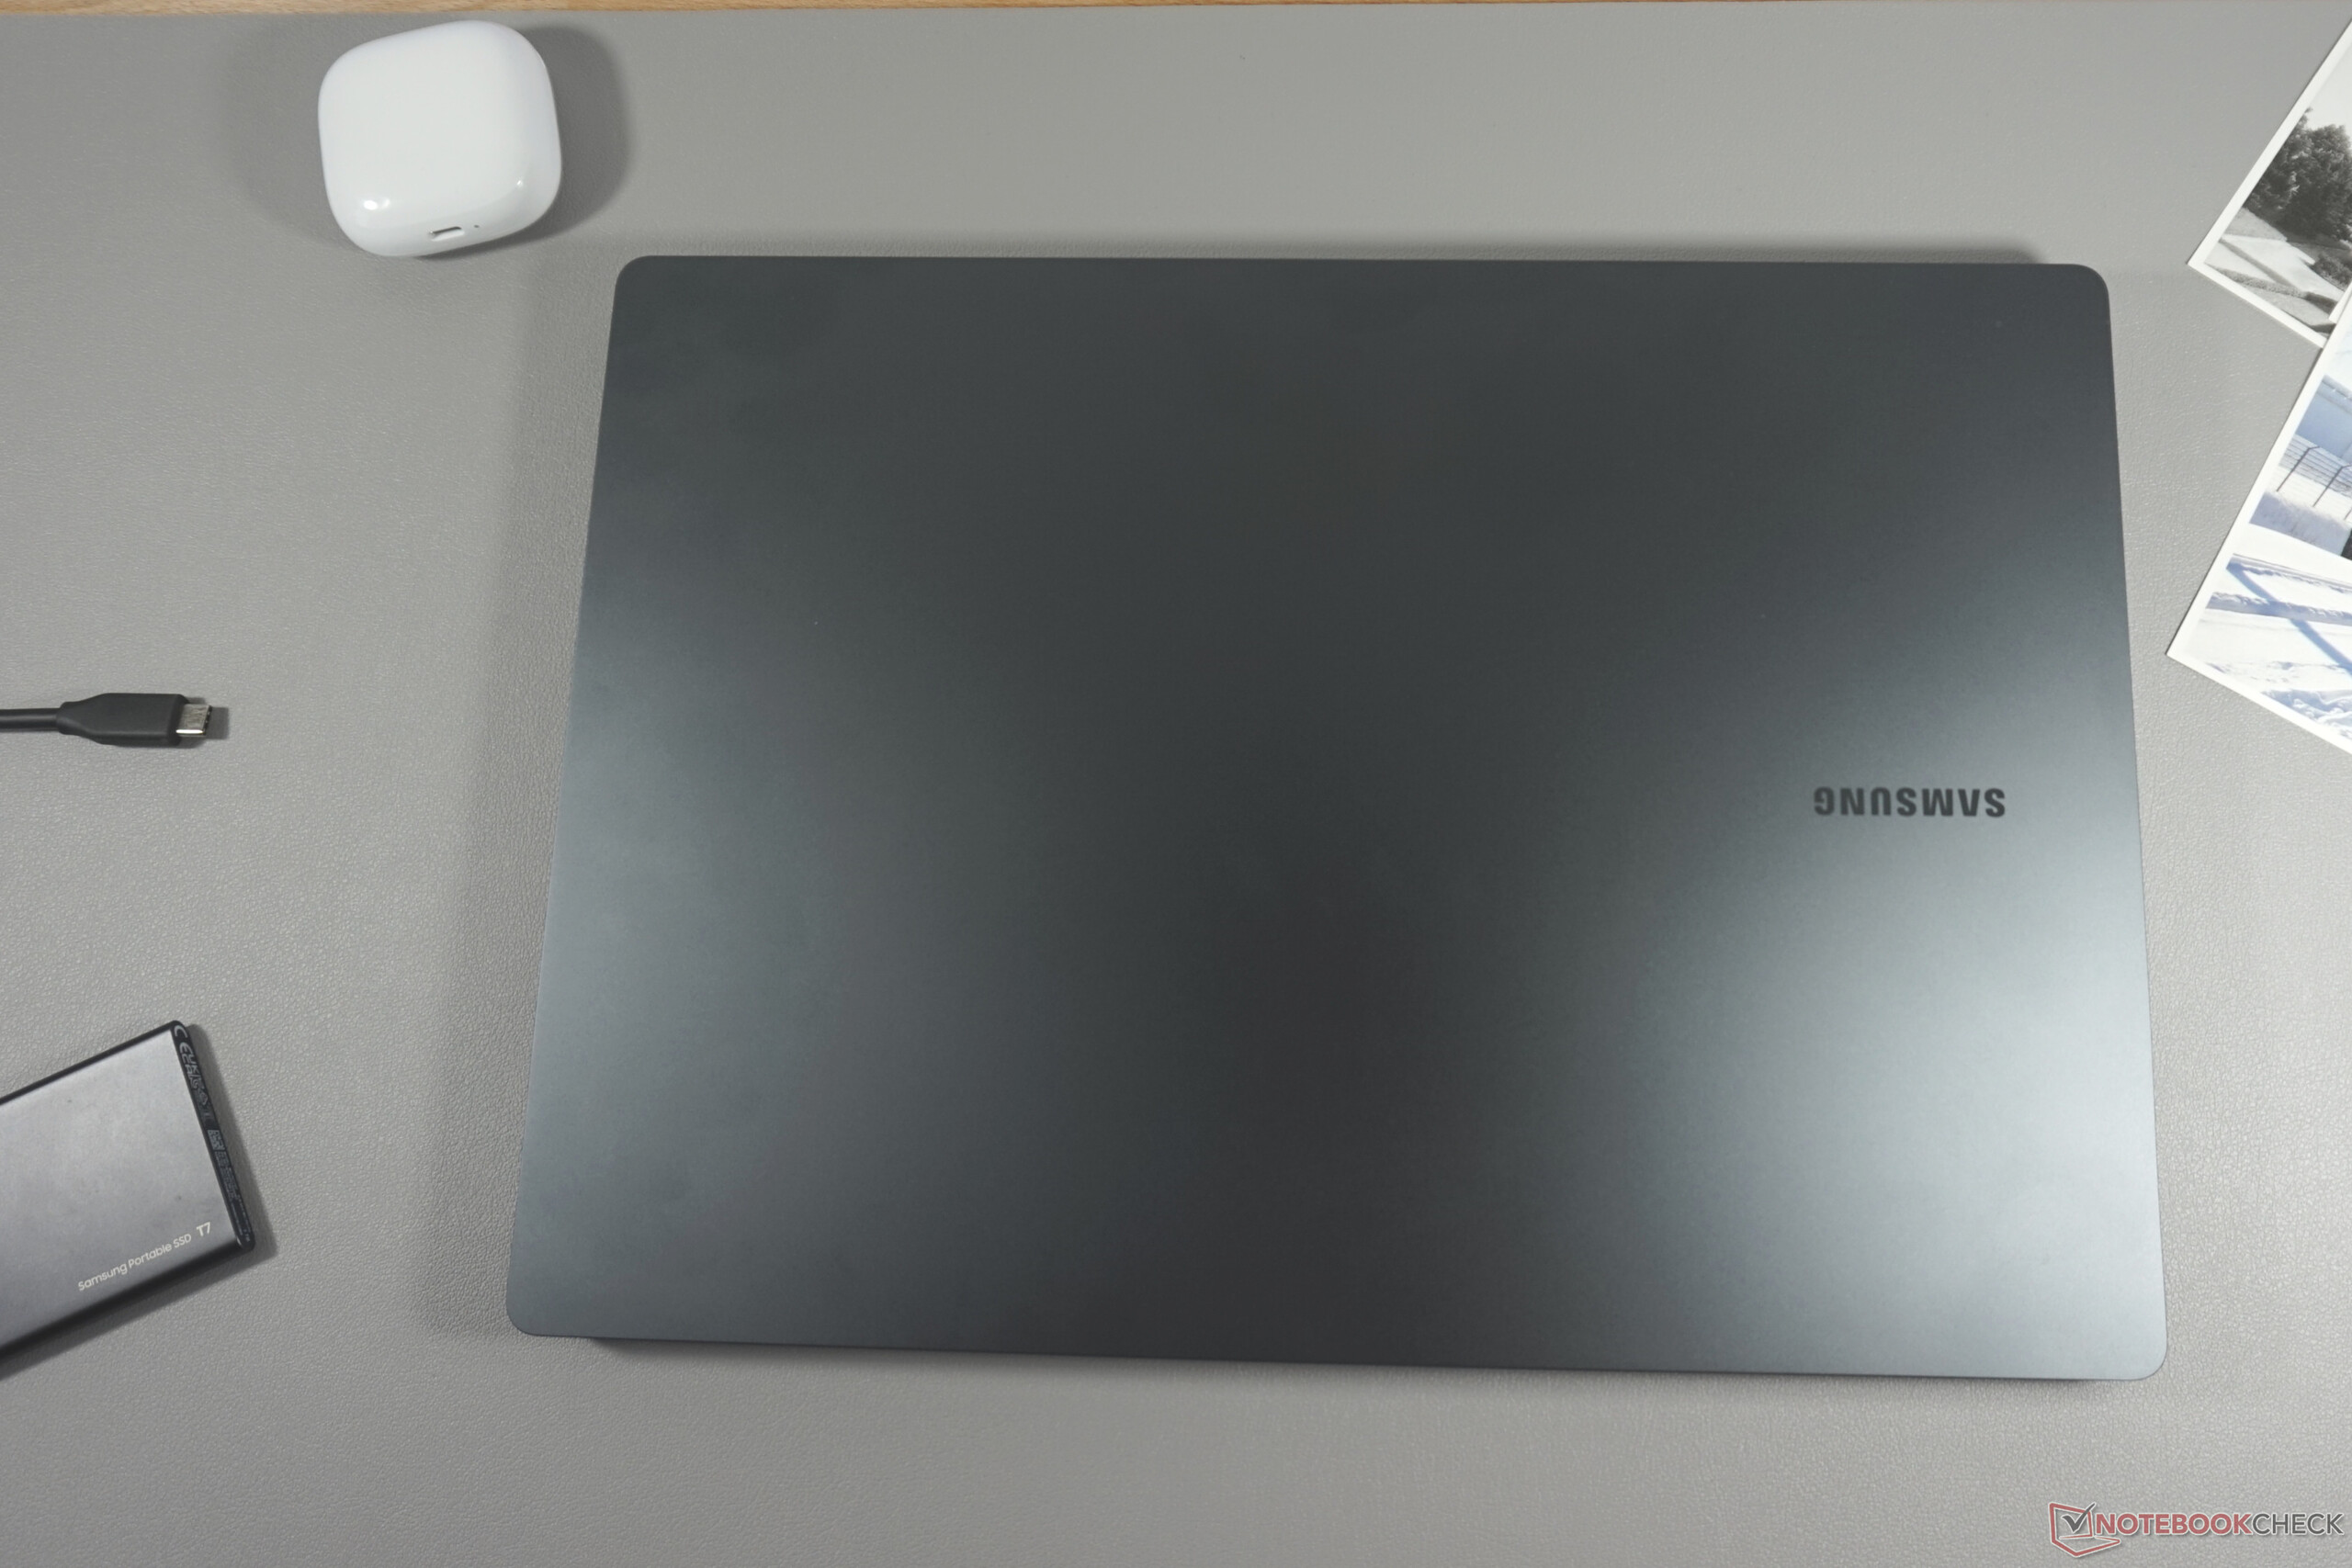
Die Dicke von 16,8 mm (unser Messwert) lässt sich so schnell nicht unterbieten. Umso bemerkenswerter ist diese Zahl in Anbetracht der starken Ausstattung. Auch beim Gewicht bleibt das Galaxy Book3 Ultra zurückhaltend für seine Hardware.
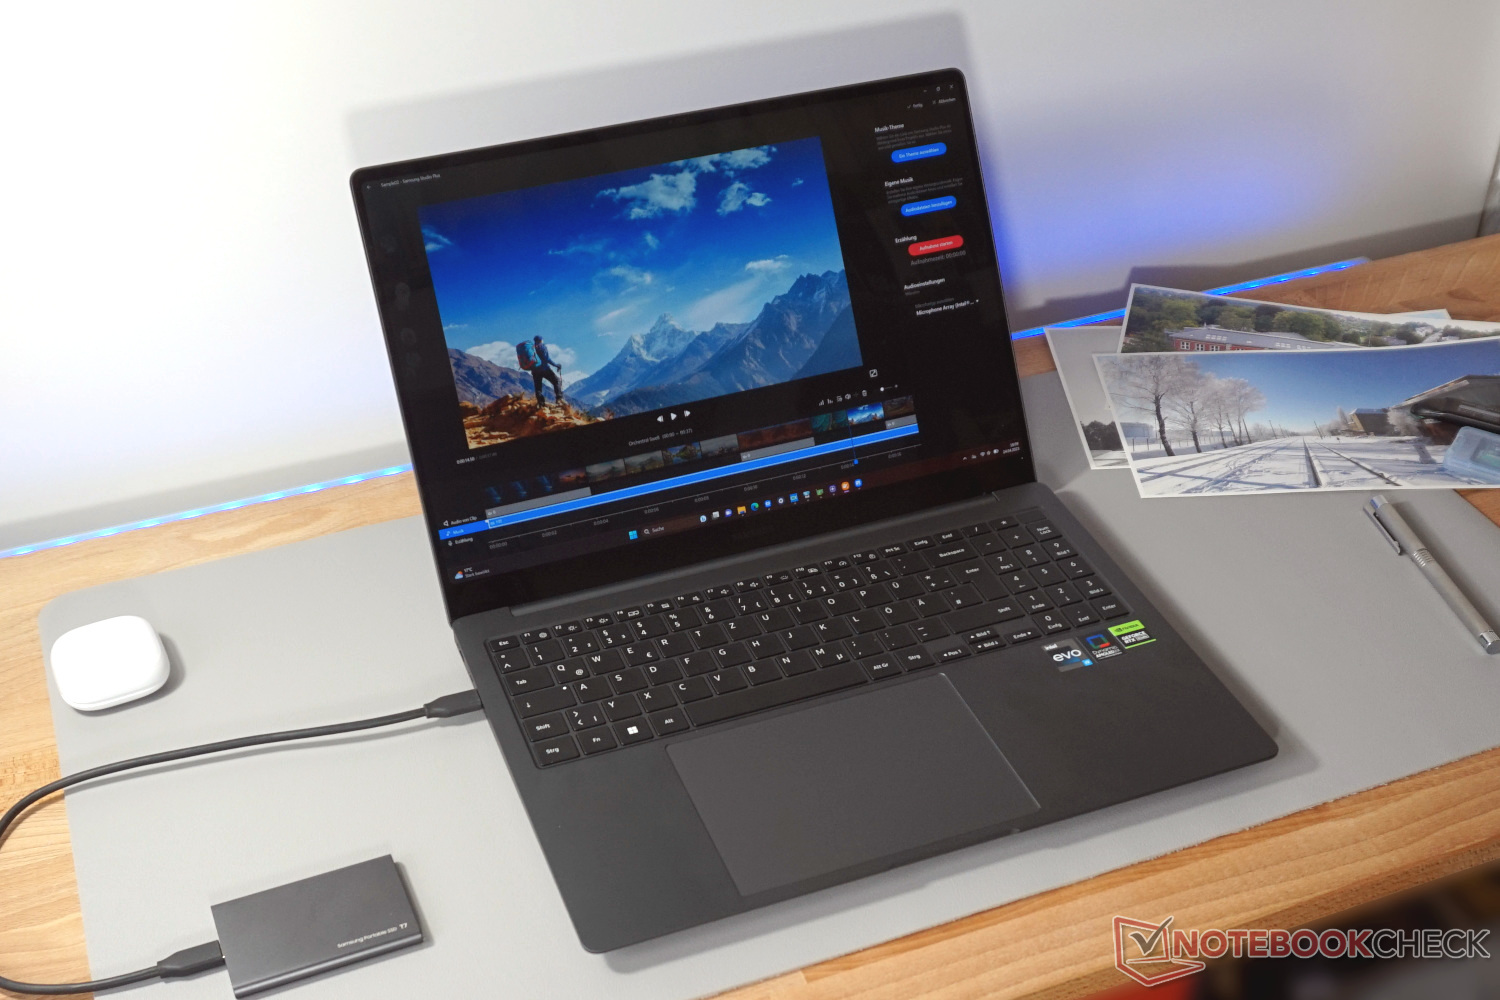
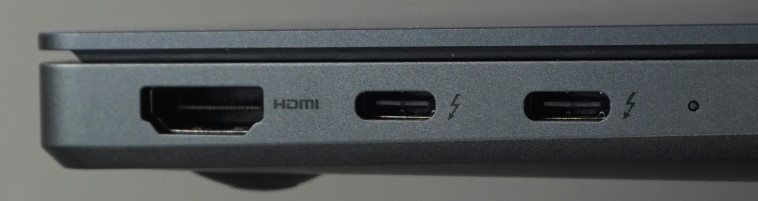
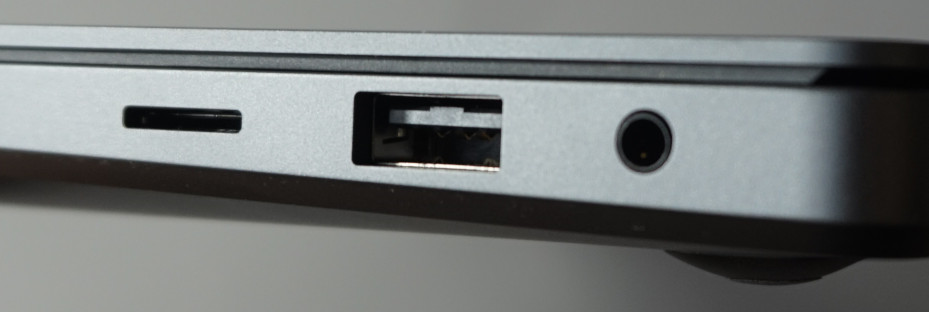
Ausstattung - Zweimal TB4, nicht viel mehr
Minimalistisch wirken Auswahl und Anzahl der Anschlüsse, die allerdings zum ebenfalls reduziert wirkenden Gehäuse passen. Zumindest das Allerwichtigste ist an Bord. Es gibt einen HDMI-Anschluss und daneben zweimal Thunderbolt 4, womit alle Video-Ausgänge direkt nebeneinander liegen. Hinzu kommen ein Kartenslot, einmal USB-A für Maus oder Drucker und der Headset-Anschluss.
Schön wäre natürlich gewesen, wenn man Thunderbolt auf links und rechts verteilt hätte. Auch für einen SD-Kartenleser in voller Größe hätte sich bestimmt Platz gefunden. Zudem war es unnötig, dem USB-A-Anschluss den betagten Standard USB 3.0 zu verpassen. Zumindest die doppelte Bandbreite hätte sich mühelos realisieren lassen.
SD Card Reader
Keine Überraschungen hält unsere Messung der Übertragungsgeschwindigkeit mit der Referenzkarte AV PRO microSD 128 GB V60 bereit. Etwa 80 MB/s erreichen auch die meisten Konkurrenten. Dass es deutlich besser geht, beweisen das Gigabyte AERO 16 und das Dell XPS 15 9530. Das spart ein paar Minuten beim Kopieren einer gefüllten Karte, mehr aber auch nicht.
| SD Card Reader | |
| average JPG Copy Test (av. of 3 runs) | |
| Gigabyte AERO 16 OLED BSF | |
| Dell XPS 15 9530 RTX 4070 (Toshiba Exceria Pro SDXC 64 GB UHS-II) | |
| Durchschnitt der Klasse Multimedia (21.1 - 531, n=46, der letzten 2 Jahre) | |
| Samsung Galaxy Book3 Ultra 16, i9-13900H RTX 4070 (AV Pro SD microSD 128 GB V60) | |
| Samsung Galaxy Book3 Ultra 16 (AV PRO microSD 128 GB V60) | |
| Asus ProArt StudioBook 16 H7600ZW (AV PRO microSD 128 GB V60) | |
| MSI Stealth 17 Studio A13VH-014 | |
| maximum AS SSD Seq Read Test (1GB) | |
| Gigabyte AERO 16 OLED BSF | |
| Dell XPS 15 9530 RTX 4070 (Toshiba Exceria Pro SDXC 64 GB UHS-II) | |
| Durchschnitt der Klasse Multimedia (27.4 - 1455, n=46, der letzten 2 Jahre) | |
| Samsung Galaxy Book3 Ultra 16, i9-13900H RTX 4070 (AV Pro SD microSD 128 GB V60) | |
| Samsung Galaxy Book3 Ultra 16 (AV PRO microSD 128 GB V60) | |
| Asus ProArt StudioBook 16 H7600ZW (AV PRO microSD 128 GB V60) | |
| MSI Stealth 17 Studio A13VH-014 | |
Kommunikation
Den fehlenden LAN-Port wird man nicht unbedingt vermissen. Zumindest in der Nähe des Routers überträgt das Samsung Galaxy Book3 auch ohne Kabel mehr als 1 Gbit/s. Unsere Messwerte liegen im Bereich des Durchschnitts für Multimedia-Notebooks und für das verwendete WLAN-Modul Intel AX211.
Nur beim Senden auf 6 GHz mittels Wi-Fi 6E verfehlt das Modul den erwarteten Wert trotz mehrerer Messreihen. Da dies beim Empfangen aber nicht der Fall war, können wir einen Hardwarefehler im Grunde ausschließen.
Webcam
Für die kompakten Abmessungen liefert die Full-HD-Webcam ganz ordentliche Resultate. Bei ausreichend Licht wirken die Bilder qualitativ hochwertig. Grobe Farbabweichungen oder Bildrauschen lassen sich nicht beobachten. Erst in einem Raum mit schwacher Beleuchtung oder im Dämmerlicht wird das Bildrauschen überdeutlich und auch die Bildrate scheint nachzulassen.
Das Dual-Array-Mikrofon kann überzeugen, was die Tauglichkeit für Videotelefonie betrifft. Es nimmt die Stimme aus verschiedenen Richtungen und Entfernungen sauber und ohne Lautstärkenveränderungen auf. Dabei wird die Stimme etwas verzerrt. Das lässt jedoch nur heraushören, wenn man explizit darauf achtet.


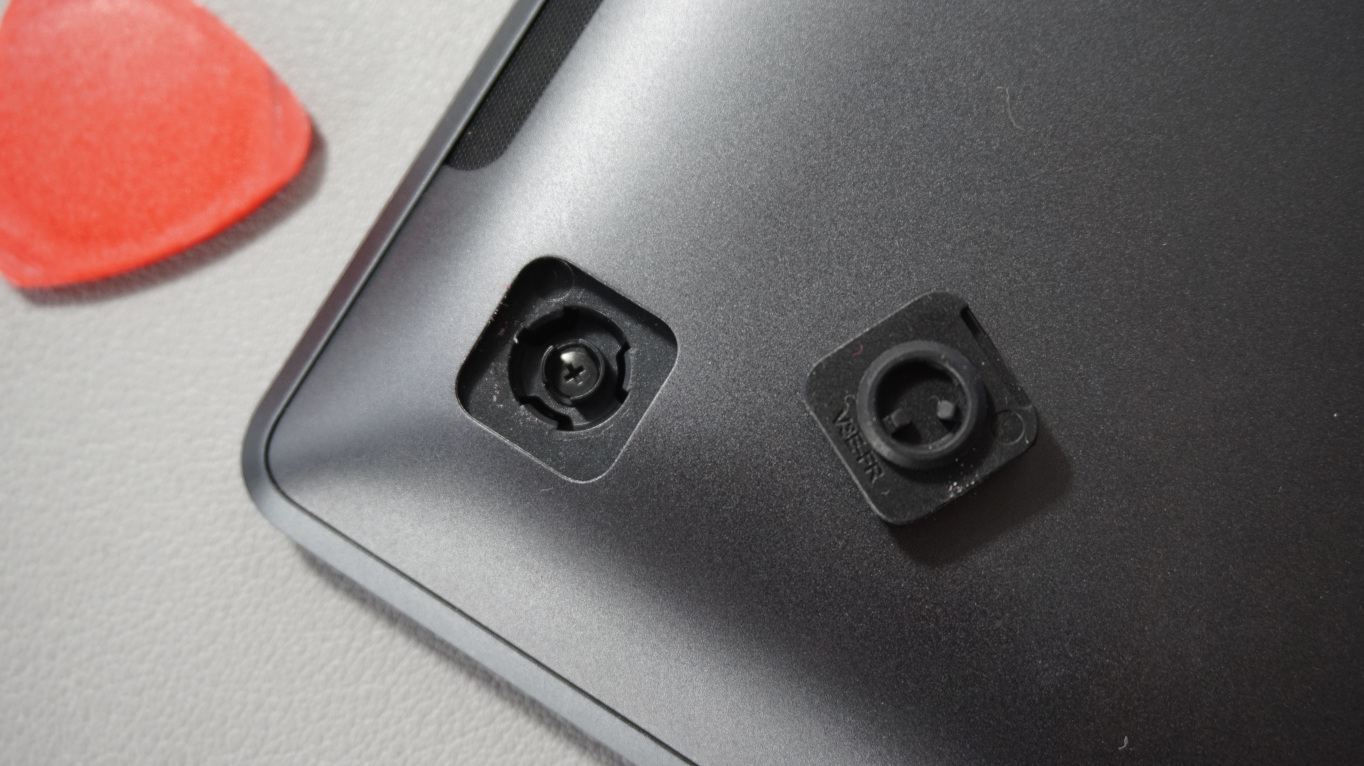
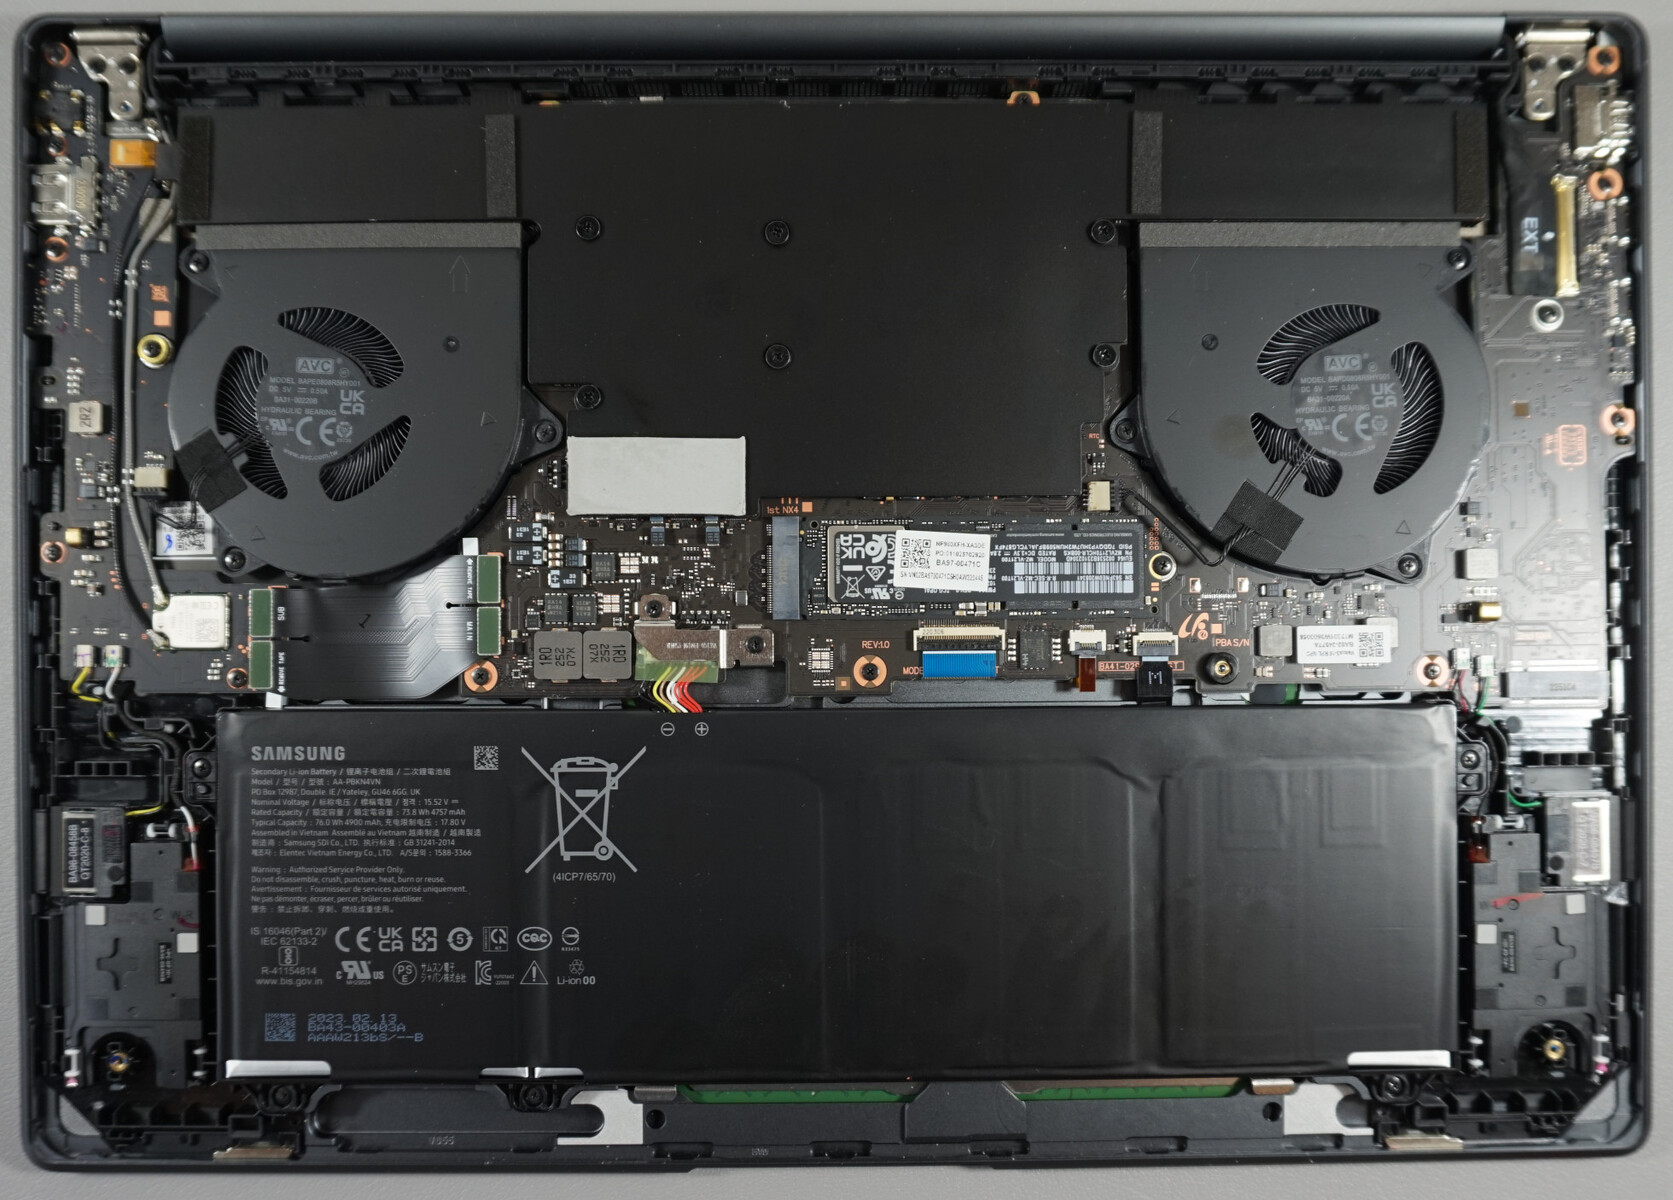
Wartung
Nur vier Kreuzschlitzschrauben müssen gelöst werden, um die Bodenplatte entfernen zu können. Sie befinden sich unter eingeklickten Gummifüßen, die sich mit ein wenig Feingefühl schadlos herausnehmen lassen.
Das klingt nach einem einfach zu öffnenden Notebook, ist es aber ganz und gar nicht. Unzählige Kunststoffverankerungen halten den Boden extrem fest. Hinzu kommt ein Mechanismus in der Mitte der Bodenplatte, die zudem mittels Wärmeleitpad mit der Kühlung verbunden ist. Der Mechanismus lässt sich erst nach dem kompletten Lösen und damit auch Biegen des Bodens öffnen und zeigt sich ähnlich kompliziert in der Handhabung, wenn der Laptop wieder zusammengefügt werden soll.
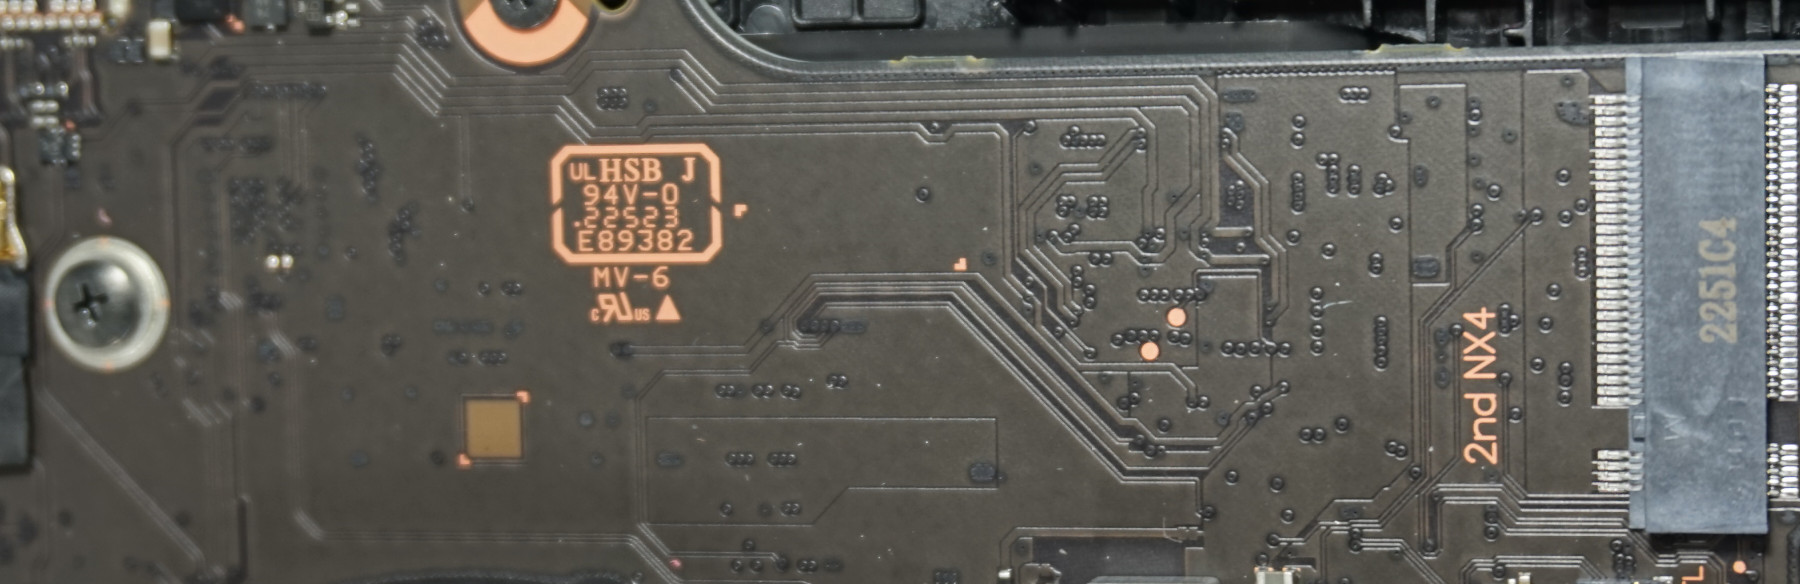
Wer dennoch nicht aufgibt und dabei vorsichtig genug ist, um nichts zu verbiegen oder zu brechen, findet zumindest einen freien M.2-Slot mit PCIe 4 für eine Speichererweiterung. Auch die primäre SSD und der Akku lassen sich tauschen. Die Lüfter können problemlos gereinigt werden.
Der RAM und das WLAN-Modul dagegen sind fest verlötet. Insgesamt spielt das kaum eine Rolle, da Samsung das Öffnen extrem umständlich gestaltet hat.
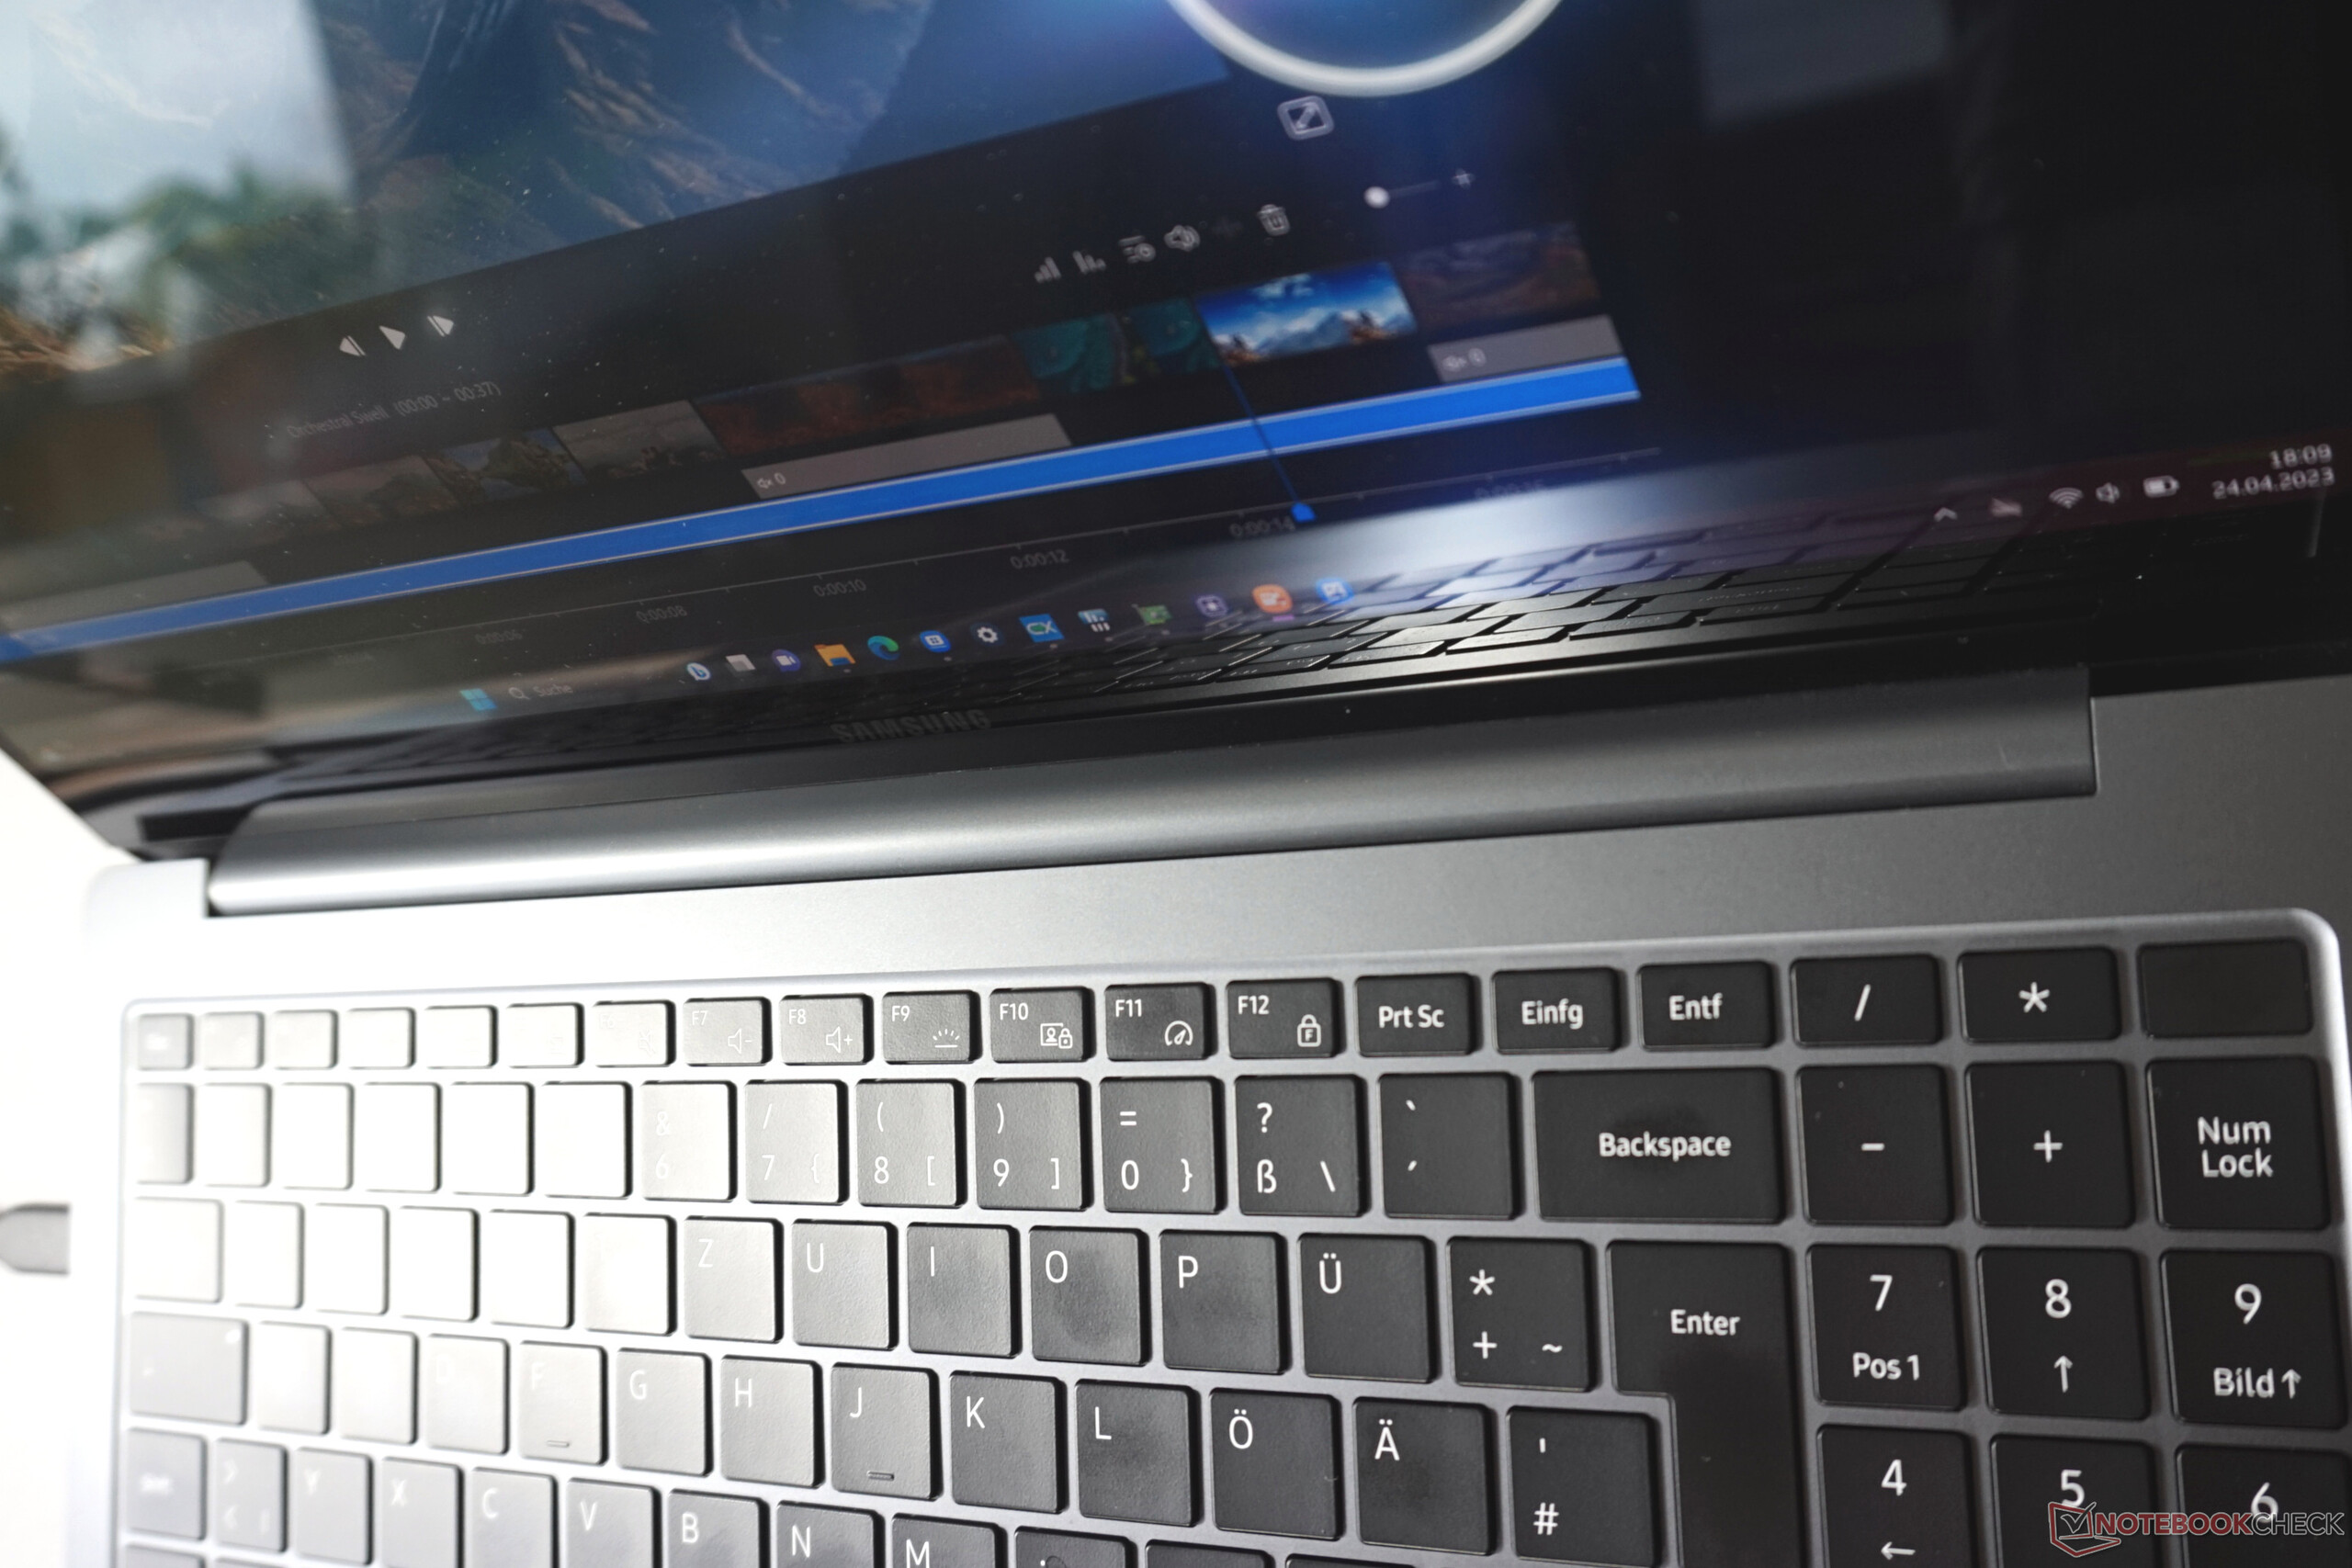
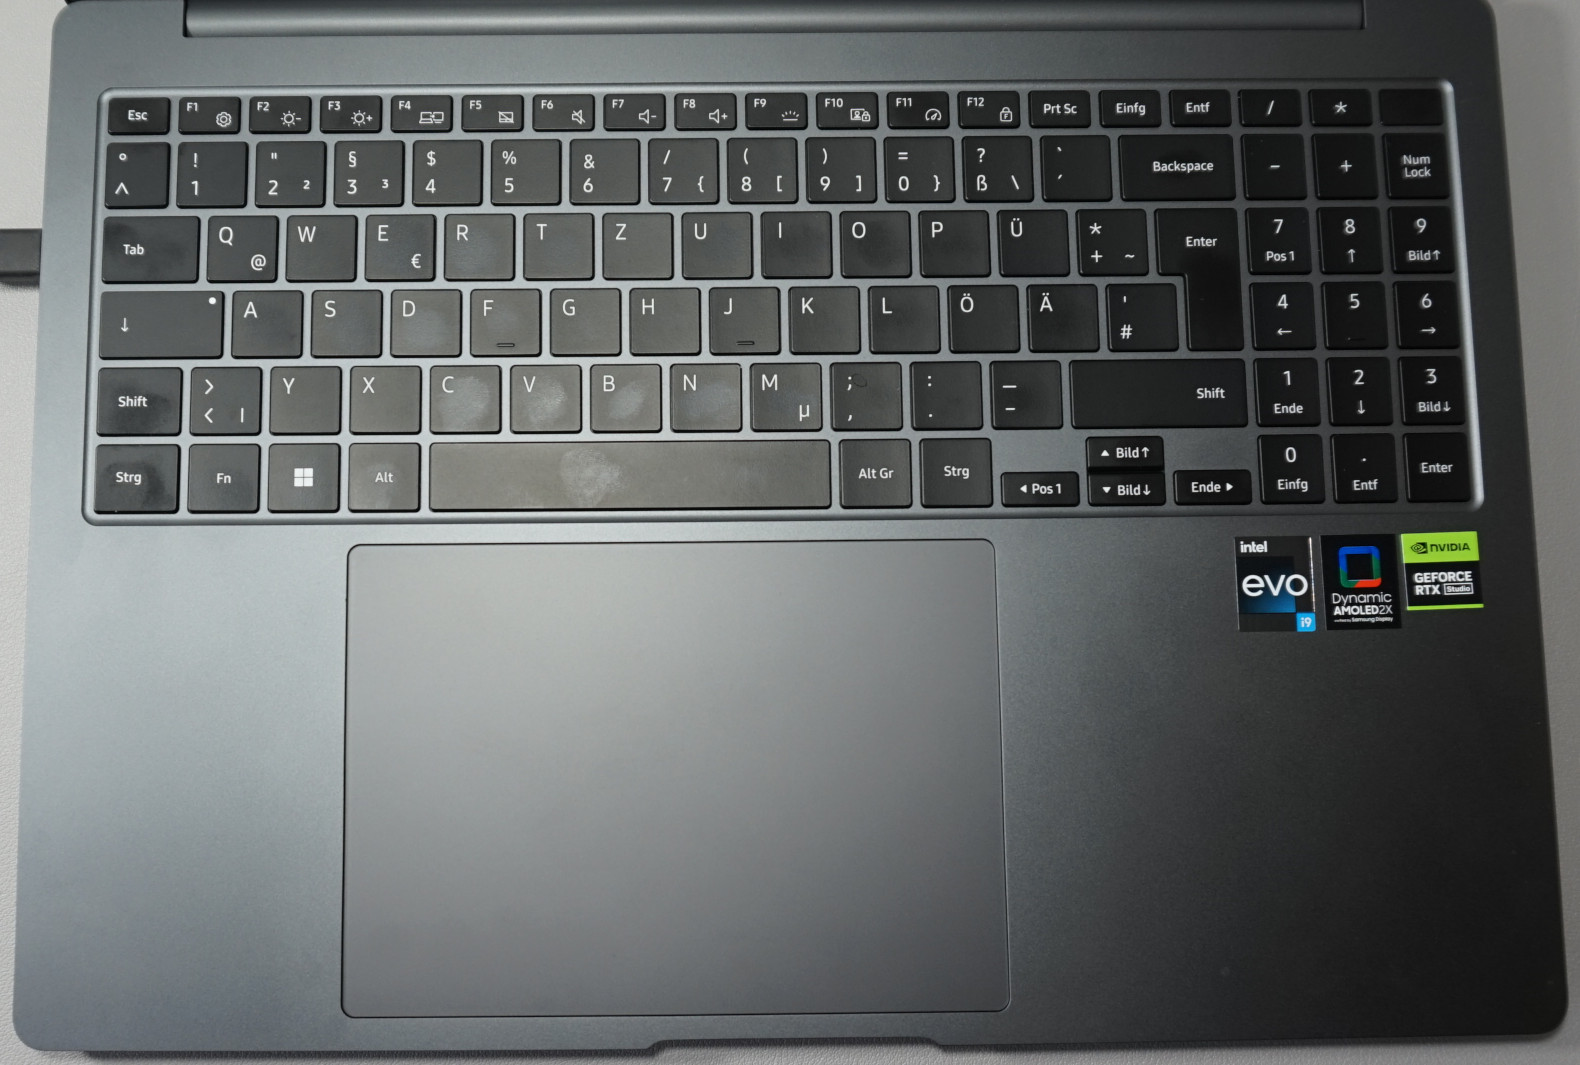
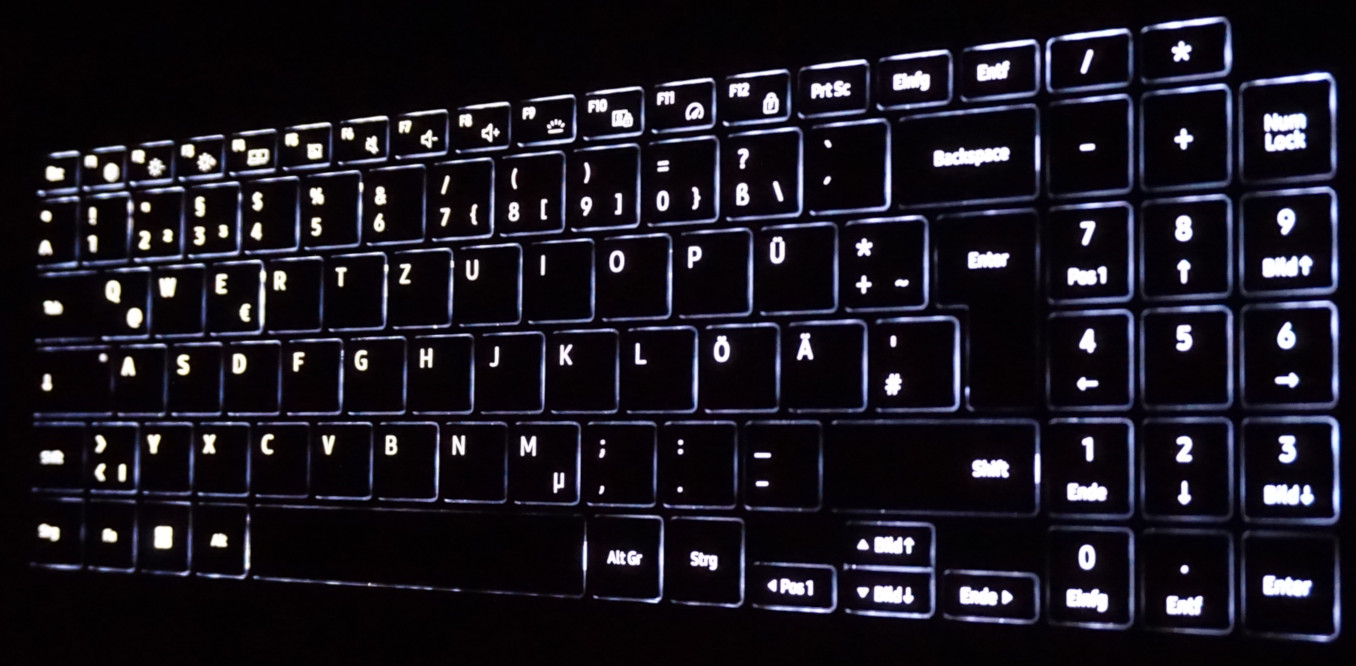
Eingabegeräte - Creator-Notebook mit großem Extra
Viel Platz nach oben ist nicht, sodass der Tastenhub mit 1 mm knapp ausfällt. Das trübt den guten Gesamteindruck der Tastatur aber nur minimal. Eine griffige Oberflächenstruktur und ein angenehm straffer Gegendruck sorgen für ein gutes Schreibgefühl. Außerdem hat Samsung den gebotenen Platz des 16-Zöllers hervorragend genutzt. Der Nummerblock hat Normalgröße und dank des kleinen Freiraums zu den Pfeiltasten sind diese ohne Blickkontakt erfühlbar. Unter anderem die Arbeit in Tabellen erleichtert sich dadurch merklich.
Highlight ist aber das übergroße Touchpad. Es misst 15 x 10 cm und ist damit wesentlich größer als bei einem typischen Business-Notebook. Die Steuerung ist präzise. Der Tastendruck fällt wohldosiert aus und die Bedienung mit mehreren Fingern gelingt ebenfalls problemlos. Es bedarf aber einer gewissen Gewöhnung, da wir beim Testen immer wieder die Hand beim Schreiben auf dem Touchpad abgelegt haben. Die Bedienung gelingt zwar weiterhin, teils aber ungenau oder als ungewollte Eingabe mit zwei Fingern.
Nichtsdestotrotz wirkt das Touchpad gelungen und dürfte nicht selten die zusätzliche Maus obsolet machen.
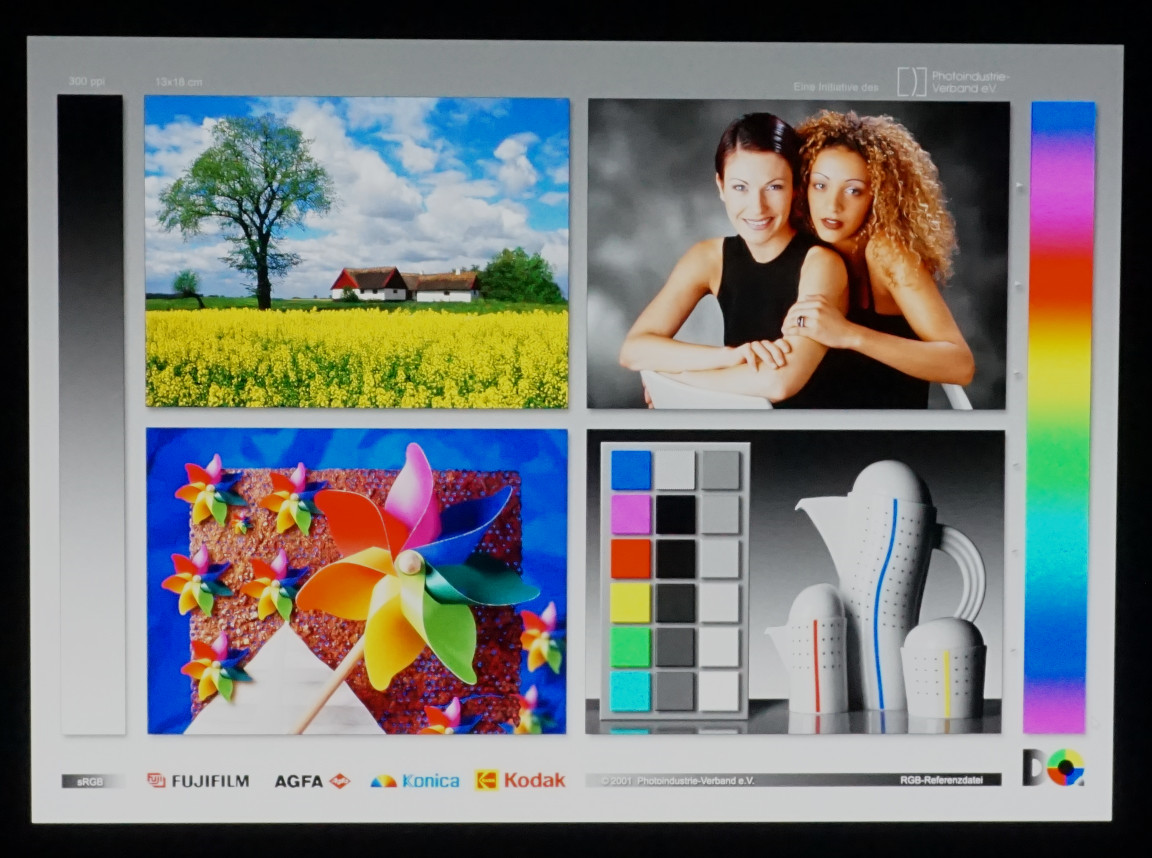
Display - OLED und 3K im Galaxy Book3 Ultra
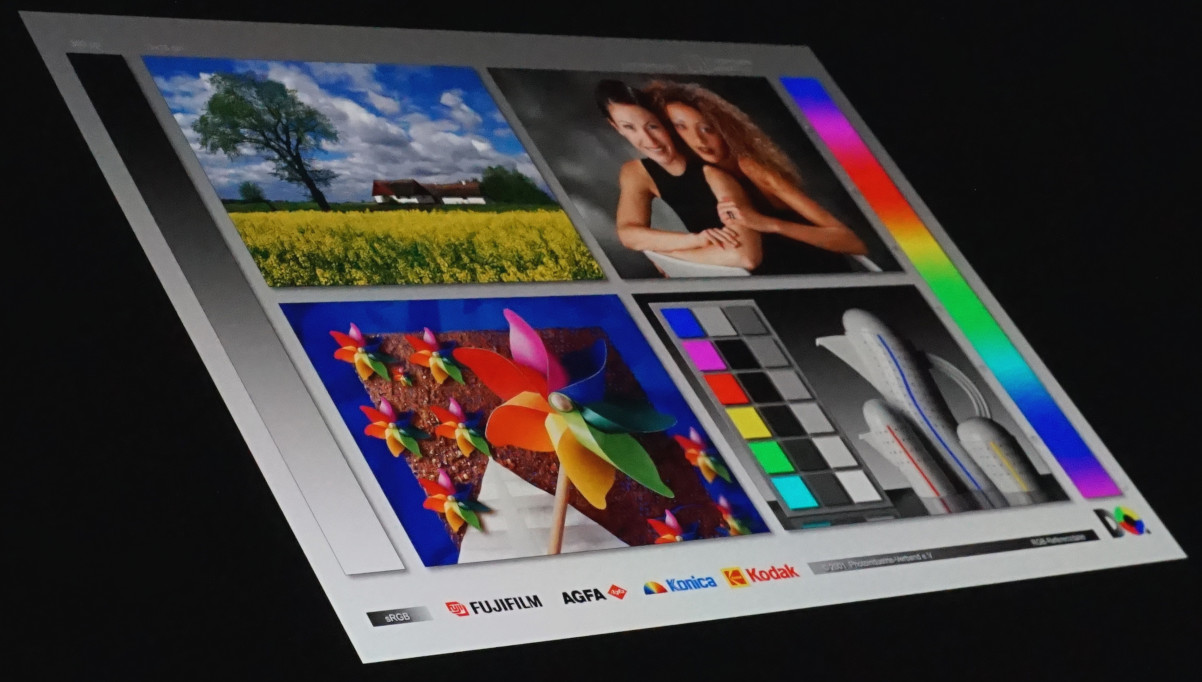
Eine 3K-Auflösung, die im konkreten Fall 2.880 x 1.800 Pixel bedeutet, ein OLED-Display, 120 Hertz und die HDR-Zertifizierung passen zum Aufgabengebiet. Dank der immerhin 5 Millionen Bildpunkte lassen sich hochauflösende Digitalfotos sehr gut darstellen. Die erhöhte Bildrate wird dagegen den Ansprüchen an eine optimale Videowiedergabe und -bearbeitung gerecht.
Ansonsten trägt das OLED-Display sein Übriges zu den starken Bildwerten bei. Das tiefe Schwarz sorgt für sehr gute Kontraste und lässt die Farben intensiver wirken. Hinzu kommt die Vesa-DisplayHDR-500-Zertifizierung, die die tatsächliche Wiedergabe von HDR-Inhalten bescheinigt. Ebenfalls zu einer sehr guten Darstellung der Inhalte trägt das spiegelnde Display bei. Ohne die Körnung der Oberfläche ergibt sich ein durchweg brillanter Eindruck bei Bildern, Videos und mehr. Dafür muss man starke Spiegelung durch helle Flächen im Hintergrund in Kauf nehmen.
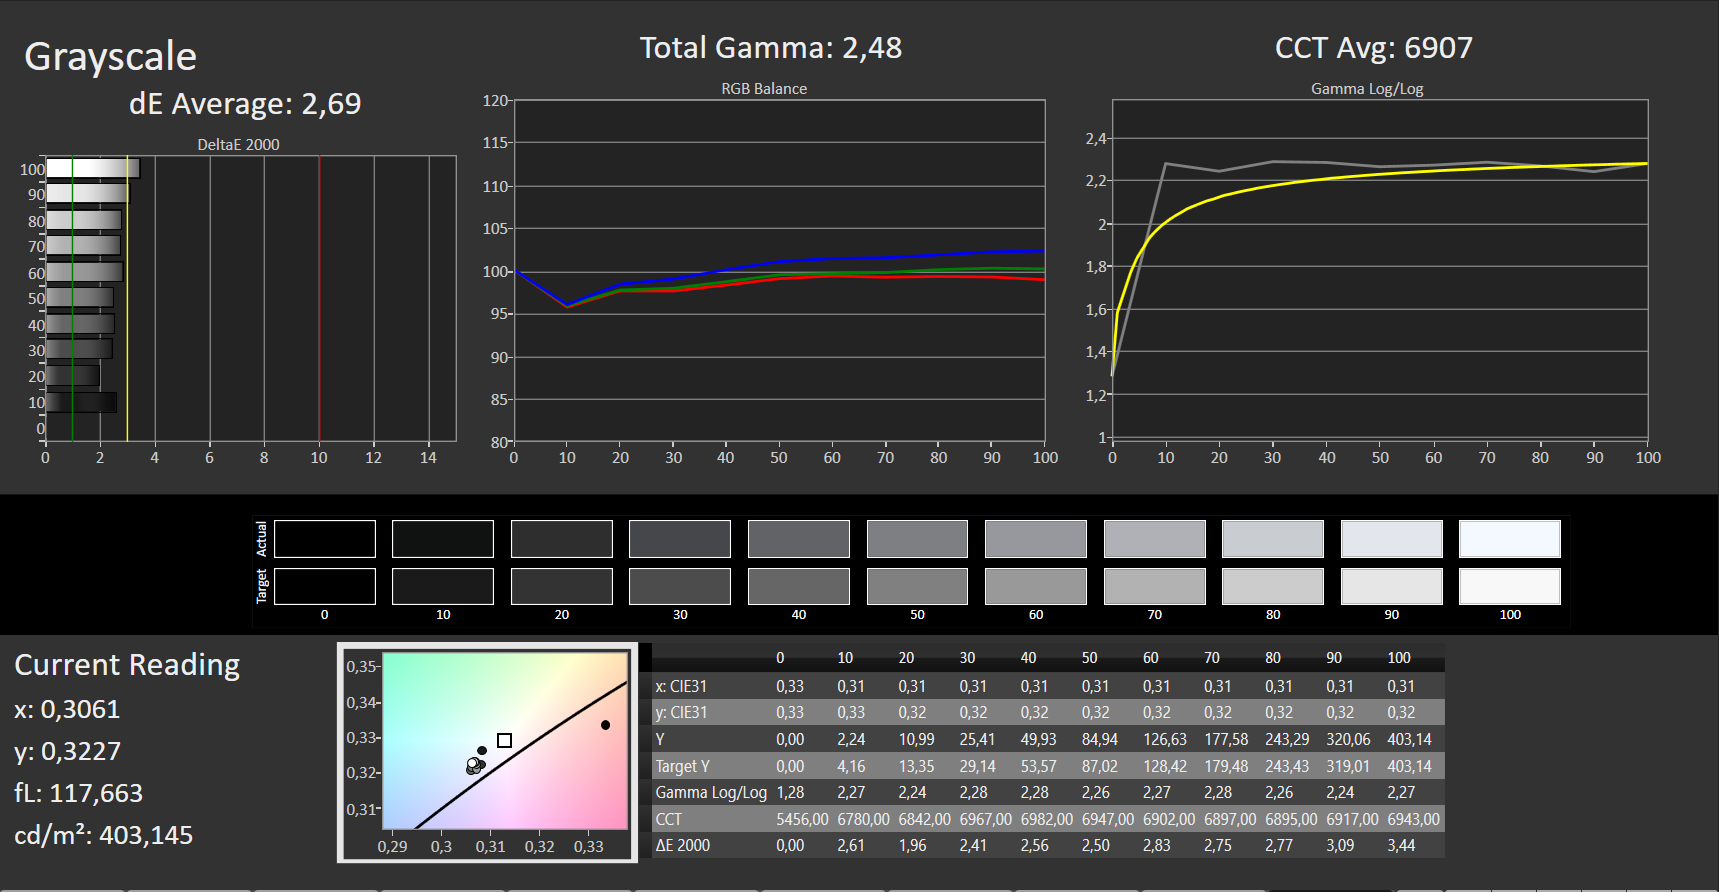
Bei der Helligkeit messen wir einen guten Wert von durchschnittlich 408 cd/m². Die Konkurrenz mit OLED-Displays erreicht diese Leuchtkraft nicht ganz. Wird das Netzteil abgezogen, lässt sich eine leichte Verdunklung beobachten. Mit weiterhin 340 cd/m² bleibt die Helligkeit dennoch akzeptabel.
Screenbleeding muss nicht befürchtet werden. Die selbstleuchtenden Pixel schalten bei der Darstellung von Schwarz ab, was in dem perfekten Schwarzwert des Panels resultiert.
| |||||||||||||||||||||||||
Ausleuchtung: 98 %
Helligkeit Akku: 343 cd/m²
Kontrast: ∞:1 (Schwarzwert: 0 cd/m²)
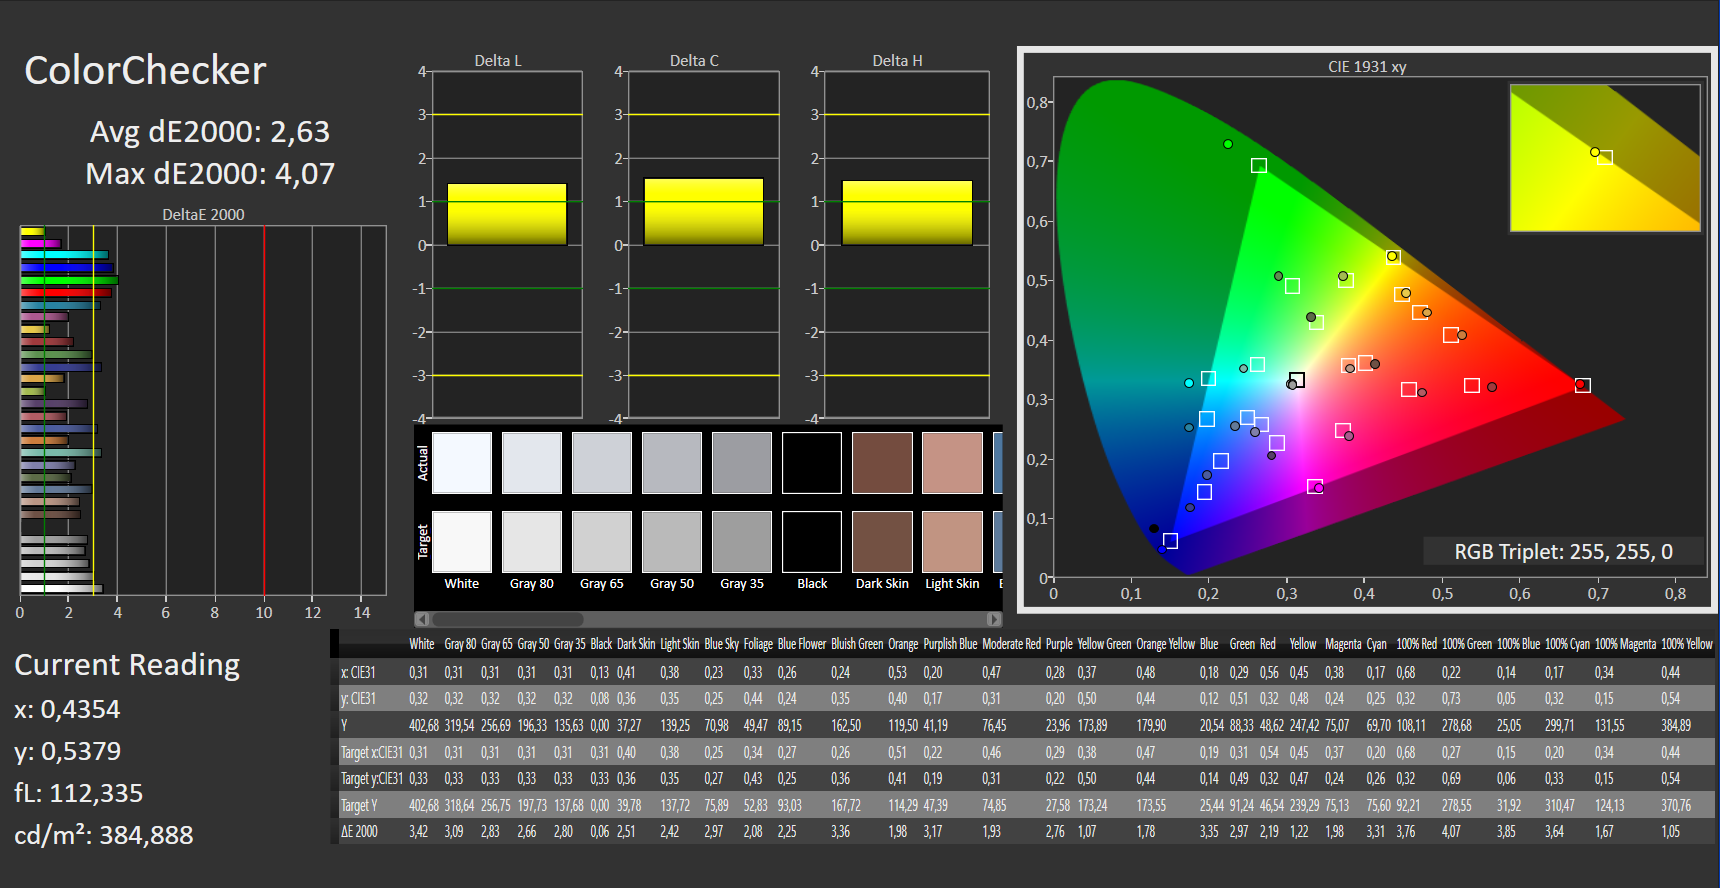
ΔE ColorChecker Calman: 2.63 | ∀{0.5-29.43 Ø4.76}
ΔE Greyscale Calman: 2.69 | ∀{0.09-98 Ø5}
97.4% AdobeRGB 1998 (Argyll 3D)
99.1% sRGB (Argyll 3D)
95.3% Display P3 (Argyll 3D)
Gamma: 2.48
CCT: 6907 K
| Samsung Galaxy Book3 Ultra 16, i9-13900H RTX 4070 Samsung SDC4185 ATNA60CL03-0, OLED / AMOLED, 2880x1800, 16" | Dell XPS 15 9530 RTX 4070 Samsung 156XG01, OLED, 3456x2160, 15.6" | MSI Stealth 17 Studio A13VH-014 AUO41A2 B173ZAN06.C, Mini LED, 3840x2160, 17.3" | Asus ProArt StudioBook 16 H7600ZW Samsung ATNA60YV02, OLED, 3840x2400, 16" | Gigabyte AERO 16 OLED BSF Samsung SDC4191 (ATNA60YV09-0, OLED, 3840x2400, 16" | Samsung Galaxy Book3 Ultra 16 Samsung ATNA60CL03-0, AMOLED, 2880x1800, 16" | |
|---|---|---|---|---|---|---|
| Display | 2% | -2% | 2% | 2% | 2% | |
| Display P3 Coverage (%) | 95.3 | 99.8 5% | 92 -3% | 99.6 5% | 99.9 5% | 99.9 5% |
| sRGB Coverage (%) | 99.1 | 100 1% | 99.1 0% | 100 1% | 100 1% | 100 1% |
| AdobeRGB 1998 Coverage (%) | 97.4 | 98.4 1% | 94.07 -3% | 96.5 -1% | 96.4 -1% | 96.3 -1% |
| Response Times | 10% | -1076% | -398% | 1% | 71% | |
| Response Time Grey 50% / Grey 80% * (ms) | 2 ? | 1.68 ? 16% | 46.4 ? -2220% | 1.6 ? 20% | 2 ? -0% | 0.49 ? 75% |
| Response Time Black / White * (ms) | 2 ? | 1.94 ? 3% | 0.62 ? 69% | 18.32 ? -816% | 1.98 ? 1% | 0.65 ? 67% |
| PWM Frequency (Hz) | 250 ? | 239 | 2400 | 60 ? | 60 | 240 ? |
| Bildschirm | -30% | -1% | -8% | 6% | 1% | |
| Helligkeit Bildmitte (cd/m²) | 403 | 389.5 -3% | 397.29 -1% | 370 -8% | 389.97 -3% | 400 -1% |
| Brightness (cd/m²) | 408 | 392 -4% | 392 -4% | 374 -8% | 395 -3% | 399 -2% |
| Brightness Distribution (%) | 98 | 98 0% | 93 -5% | 98 0% | 97 -1% | 93 -5% |
| Schwarzwert * (cd/m²) | 0.02 | 0.03 | 0.03 | |||
| Delta E Colorchecker * | 2.63 | 4.95 -88% | 2.52 4% | 2.97 -13% | 2 24% | 2.3 13% |
| Colorchecker dE 2000 max. * | 4.07 | 8.65 -113% | 3.91 4% | 4.38 -8% | 4.1 -1% | 4.15 -2% |
| Delta E Graustufen * | 2.69 | 2 26% | 2.78 -3% | 2.9 -8% | 2.23 17% | 2.7 -0% |
| Gamma | 2.48 89% | 2.27 97% | 2.63 84% | 2.13 103% | 2.41 91% | 2.266 97% |
| CCT | 6907 94% | 6265 104% | 6412 101% | 6636 98% | 6323 103% | 7047 92% |
| Colorchecker dE 2000 calibrated * | 1.53 | 2.52 | 2.15 | 1.68 | 1.66 | |
| Kontrast (:1) | 19865 | 12999 | 13333 | |||
| Durchschnitt gesamt (Programm / Settings) | -6% /
-14% | -360% /
-197% | -135% /
-76% | 3% /
4% | 25% /
14% |
* ... kleinere Werte sind besser
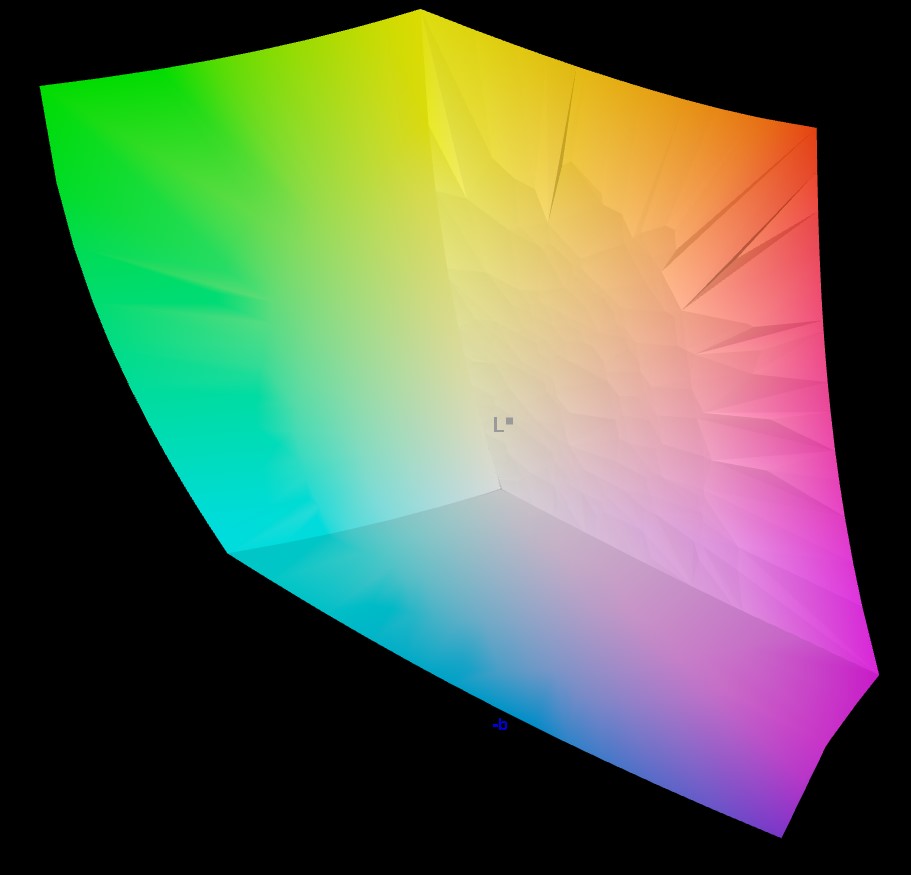
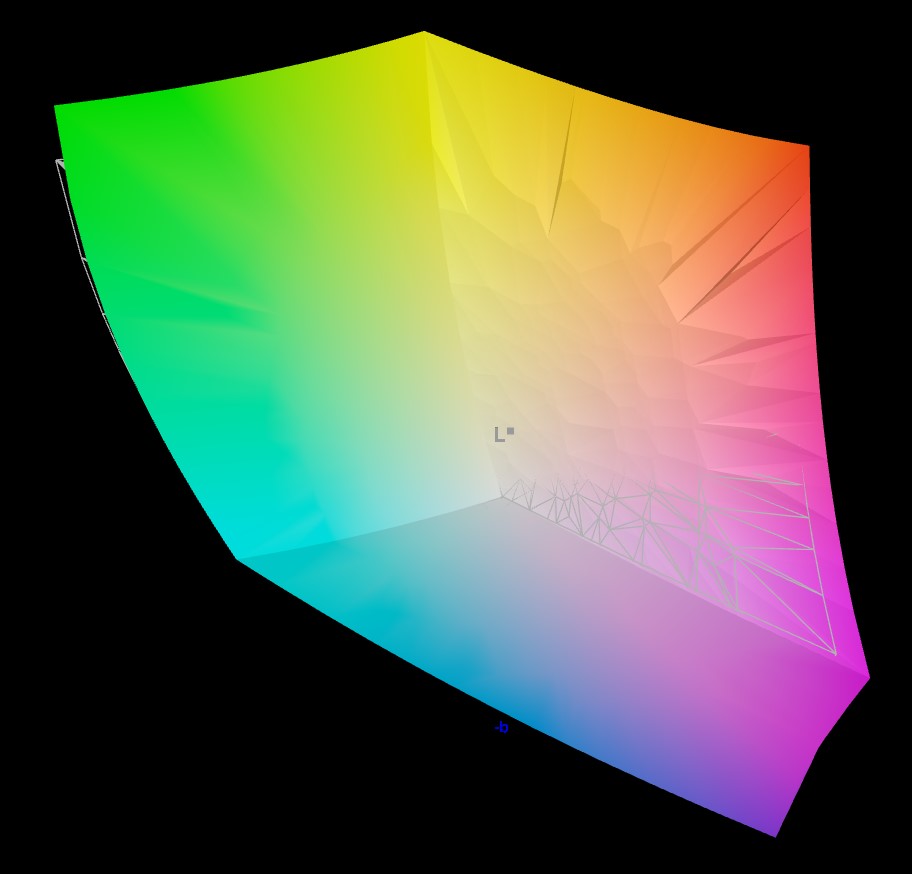
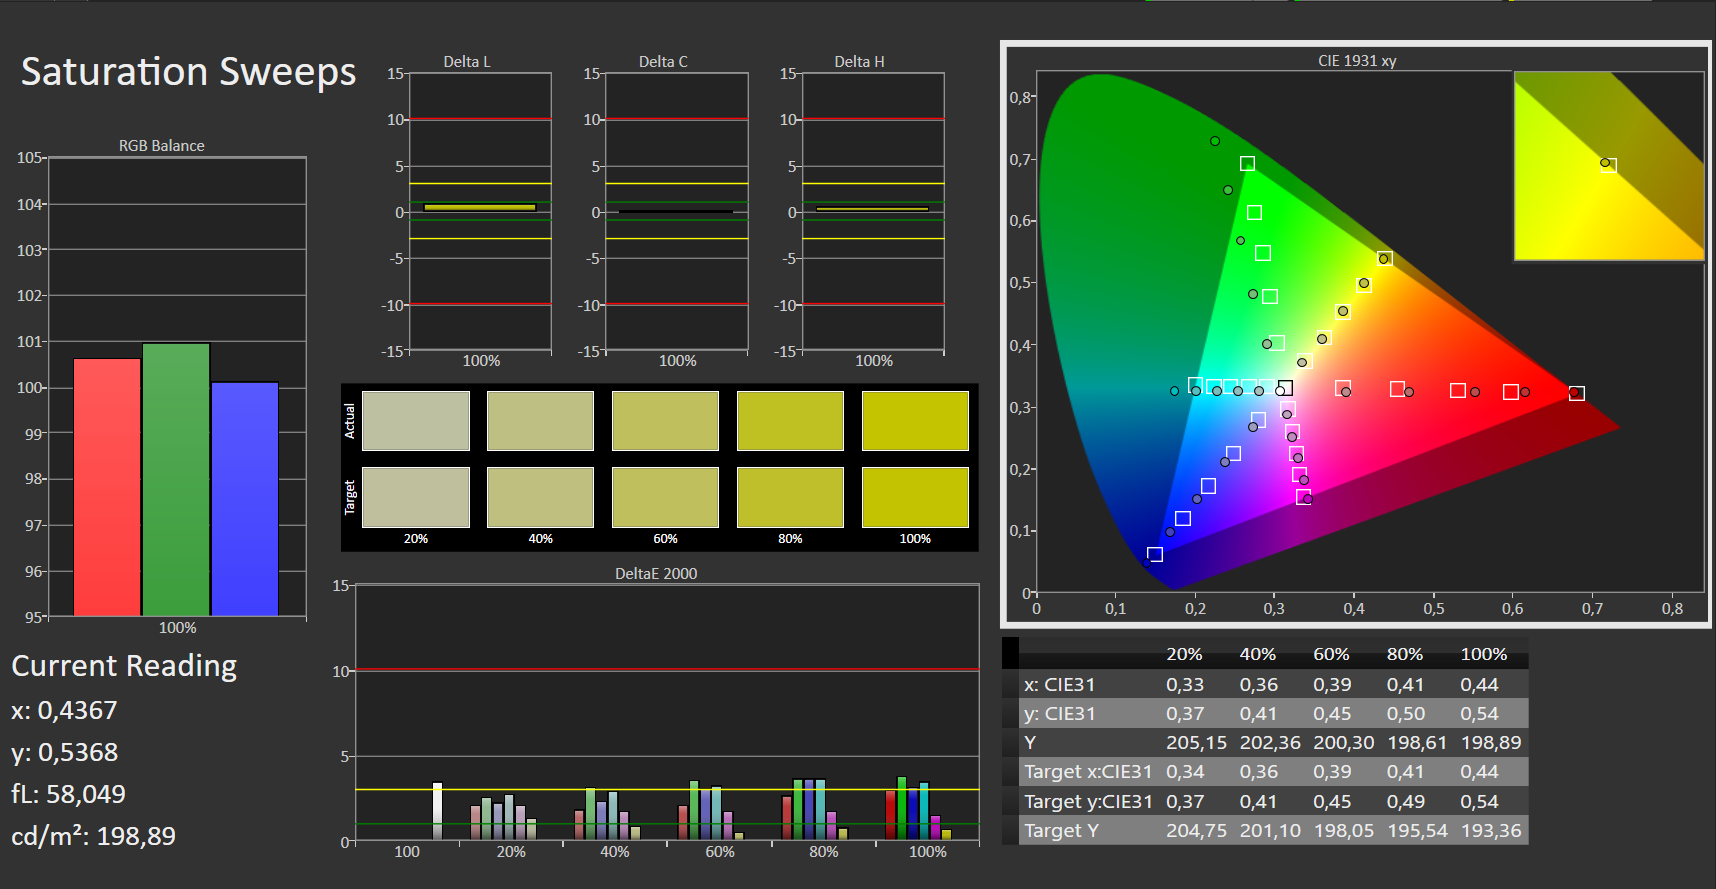
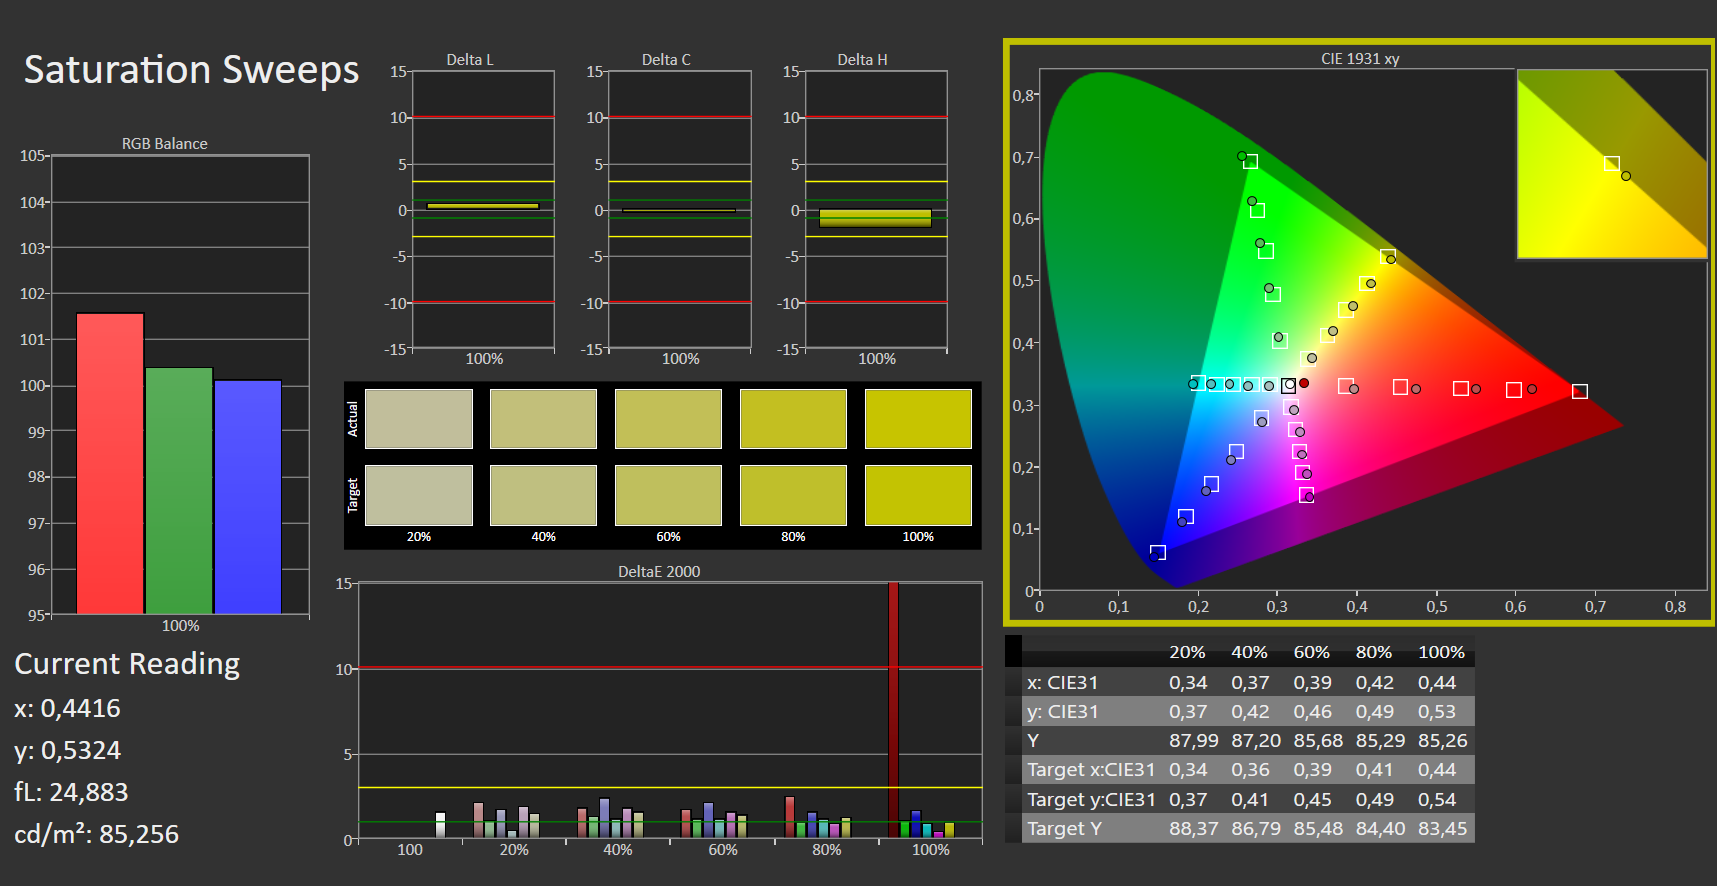
Der Display-P3-Farbraum, der üblicherweise bei professioneller Videobearbeitung zum Einsatz kommt, wird nicht ganz perfekt wiedergegeben. Die nötigen Gelb- und Orangetöne kann das OLED-Display nicht komplett anzeigen. Dass Samsung selbst eine 120-prozentige Abdeckung angibt, liegt daran, dass schlicht Farben dazugezählt werden, die in dem Farbraum gar nicht vorkommen.
Bei AdobeRGB, meist für professionelle Bildbearbeitung genutzt, messen wir dagegen eine der besten Abdeckungen unter den angeführten Konkurrenten. Lediglich das Dell XPS 9530, ebenfalls mit einem OLED-Display von Samsung ausgestattet, schneidet noch etwas besser ab.
Da jedoch fast immer im sRGB-Farbraum gearbeitet wird, eignet sich das Display ohne weitere Kalibrierung hervorragend für Medienerstellung und -bearbeitung.

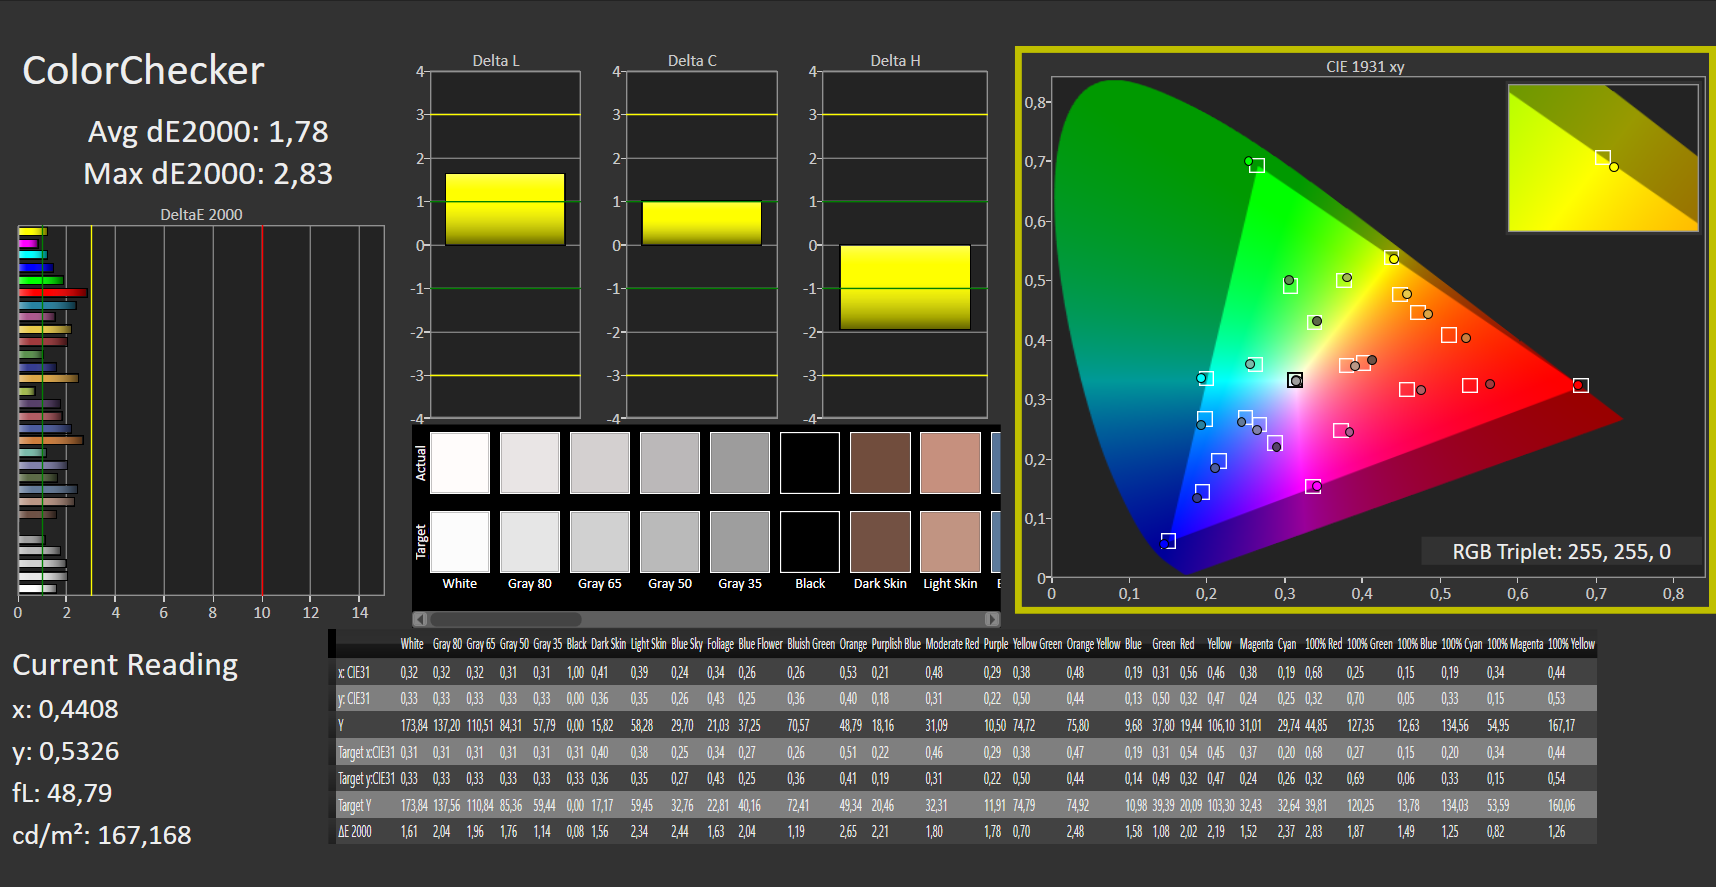
Die mitgelieferte Software von Samsung erlaubt eine direkte Anwahl unterschiedlicher Farbprofile. Bereits im nativen Modus des OLED-Displays liegt die von uns im Durchschnitt festgestellte Farbabweichung unterhalb der Wahrnehmung. Ein geübtes Auge könnte allerdings bei einigen Farbtönen noch Unstimmigkeiten feststellen.
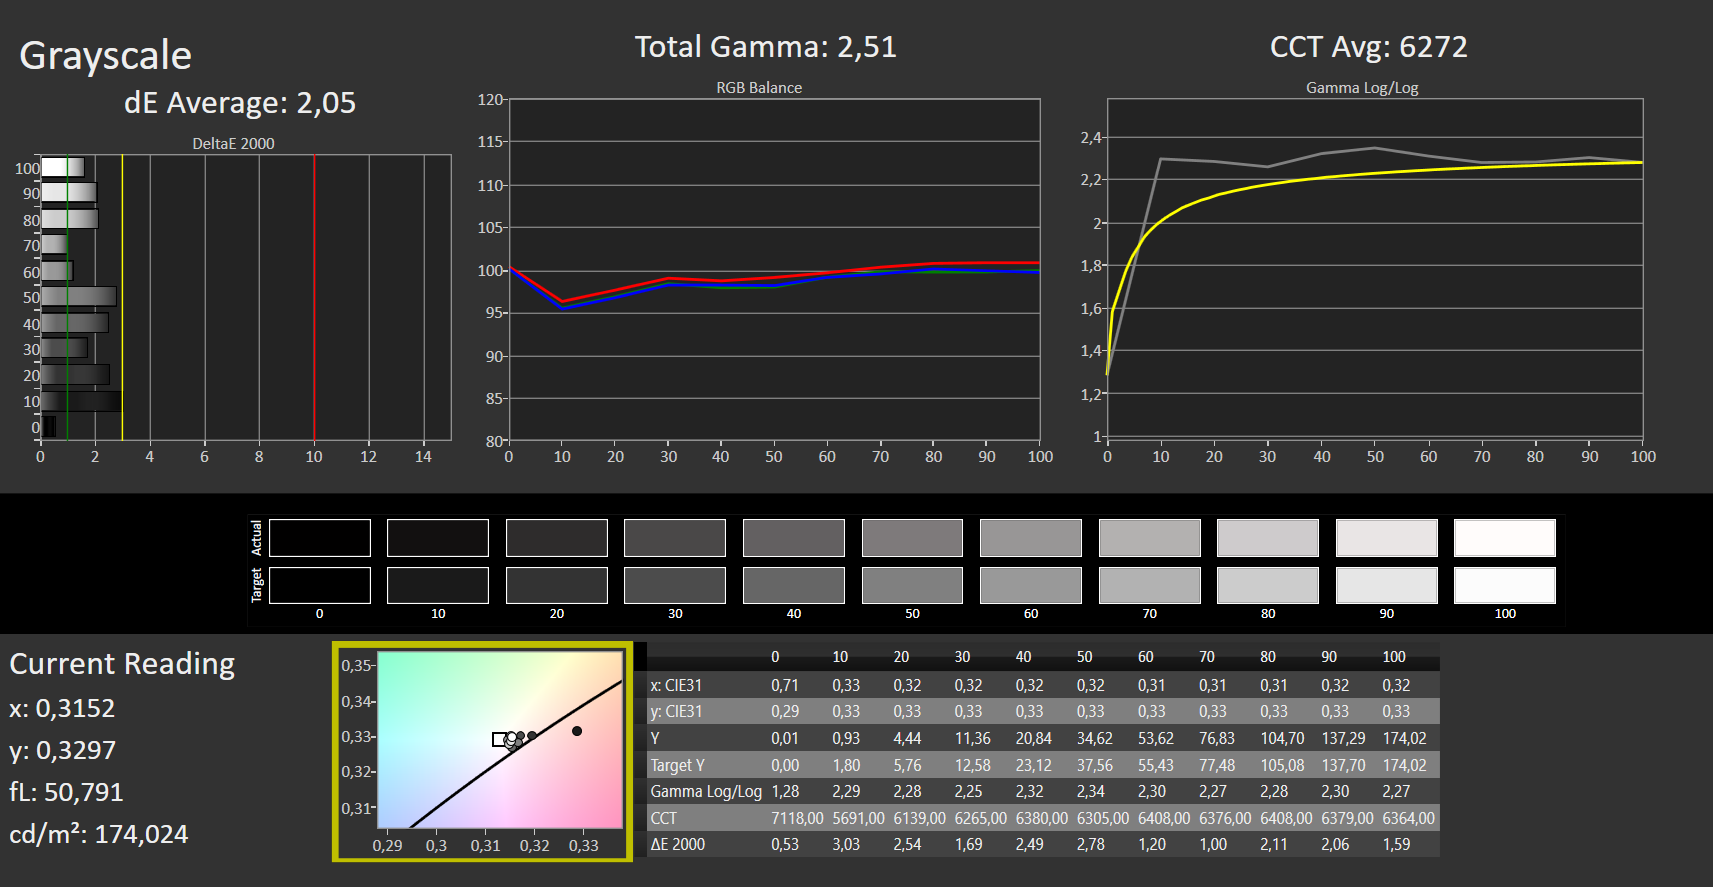
Wird dagegen das Profil Display-P3 ausgewählt, welches sichtbar die Darstellung auf dem Bildschirm verändert, liegen sämtliche Abweichung auf sehr niedrigem Niveau und sollten nicht mehr wahrnehmbar sein. Die Farbdarstellung fällt somit auch ohne Kalibrierung nahezu perfekt aus.
Reaktionszeiten (Response Times) des Displays
| ↔ Reaktionszeiten Schwarz zu Weiß | ||
|---|---|---|
| 2 ms ... steigend ↗ und fallend ↘ kombiniert | ↗ 1 ms steigend |  |
| ↘ 1 ms fallend | ||
| Die gemessenen Reaktionszeiten sind sehr kurz, wodurch sich der Bildschirm auch für schnelle 3D Spiele eignen sollte. Im Vergleich rangierten die bei uns getesteten Geräte von 0.1 (Minimum) zu 240 (Maximum) ms. » 10 % aller Screens waren schneller als der getestete. Daher sind die gemessenen Reaktionszeiten besser als der Durchschnitt aller vermessenen Geräte (20.1 ms). | ||
| ↔ Reaktionszeiten 50% Grau zu 80% Grau | ||
| 2 ms ... steigend ↗ und fallend ↘ kombiniert | ↗ 1 ms steigend |  |
| ↘ 1 ms fallend | ||
| Die gemessenen Reaktionszeiten sind sehr kurz, wodurch sich der Bildschirm auch für schnelle 3D Spiele eignen sollte. Im Vergleich rangierten die bei uns getesteten Geräte von 0.165 (Minimum) zu 636 (Maximum) ms. » 9 % aller Screens waren schneller als der getestete. Daher sind die gemessenen Reaktionszeiten besser als der Durchschnitt aller vermessenen Geräte (31.4 ms). | ||
Bildschirm-Flackern / PWM (Pulse-Width Modulation)
| Flackern / PWM festgestellt | 250 Hz | ≤ 70 % Helligkeit |    |
Das Display flackert mit 250 Hz (im schlimmsten Fall, eventuell durch Pulsweitenmodulation PWM) bei einer eingestellten Helligkeit von 70 % und darunter. Darüber sollte es zu keinem Flackern kommen. Die Frequenz von 250 Hz ist relativ gering und daher sollte es bei sensiblen Personen zu Problemen wie Flackern oder Augenbeschwerden führen. Im Vergleich: 53 % aller getesteten Geräte nutzten kein PWM um die Helligkeit zu reduzieren. Wenn PWM eingesetzt wurde, dann bei einer Frequenz von durchschnittlich 8013 (Minimum 5, Maximum 343500) Hz. | |||
Wie bei OLED-Panels üblich, messen wir ein Bildflackern, verursacht durch Pulsweitenmodulation. Die Frequenz von 240 Hz liegt in einem Bereich, den empfindliche Personen wahrnehmen könnten. Kamerasensoren haben ebenfalls kein Problem damit, das Verhalten zu zeigen.
Allerdings fällt der Effekt deutlich weniger dramatisch aus als bei einem klassischen Monitor mit LED-Hintergrundbeleuchtung. Bei einem solchen Panel werden größere Bereiche deaktiviert. Auf einem OLED-Display handelt es sich hingegen immer nur um einen sehr kleinen Bereich von Pixeln, die kurzfristig schwarz werden. Das dient unter anderem einer längeren Lebensdauer des Displays.
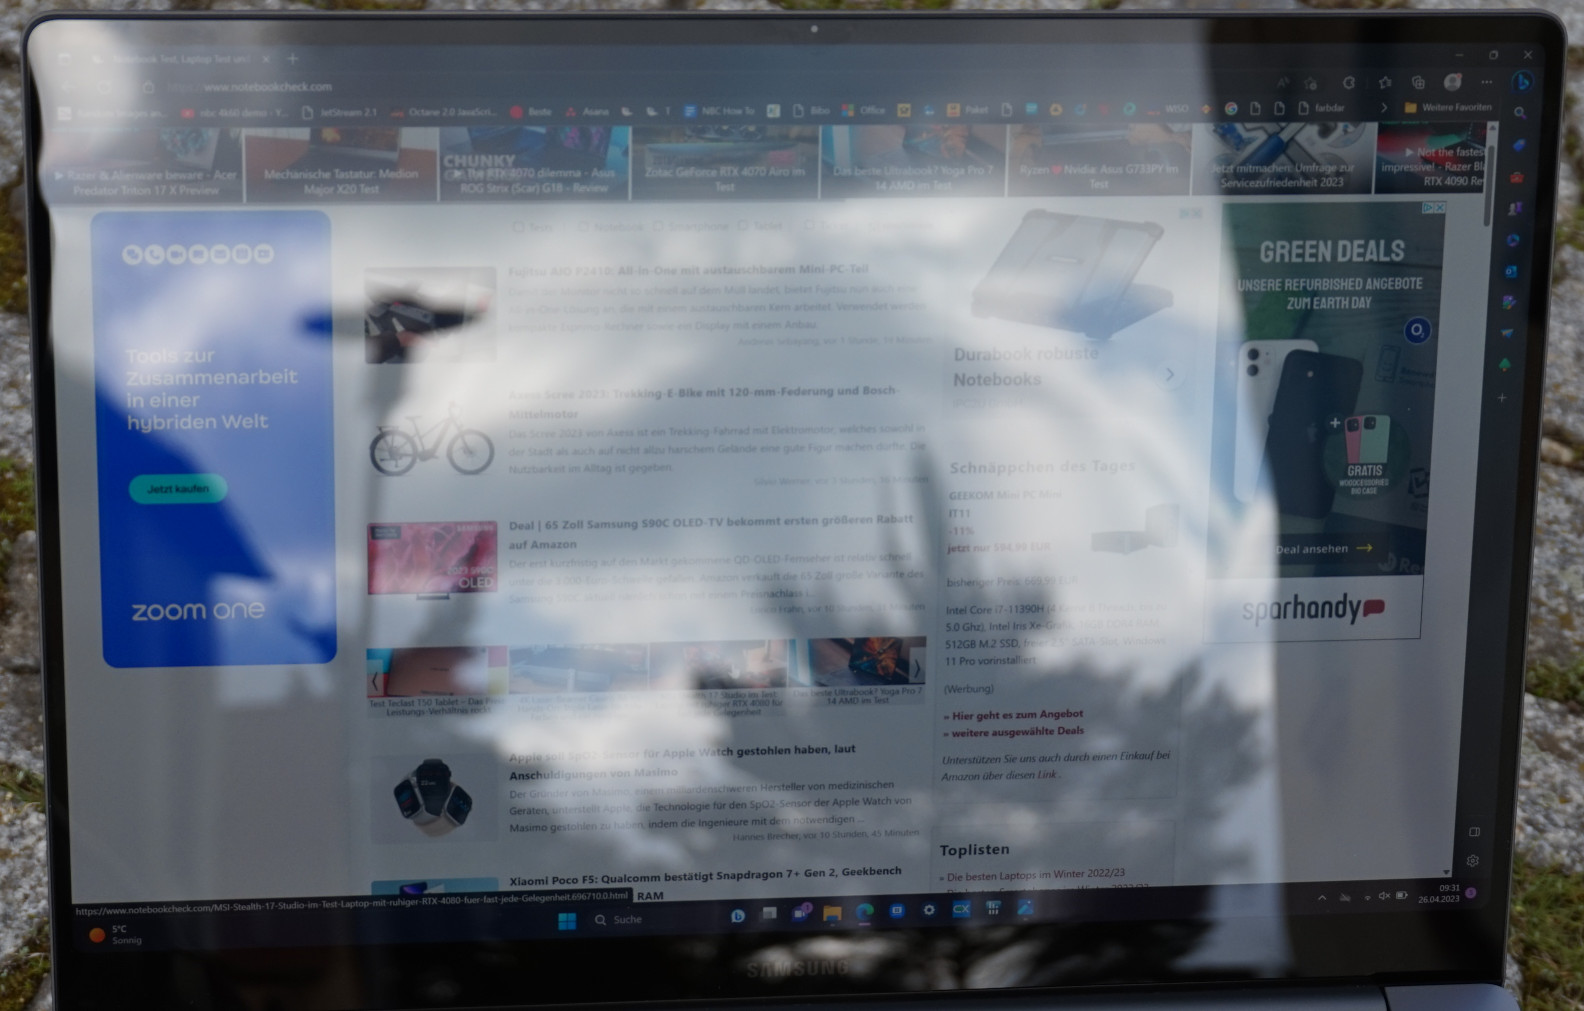
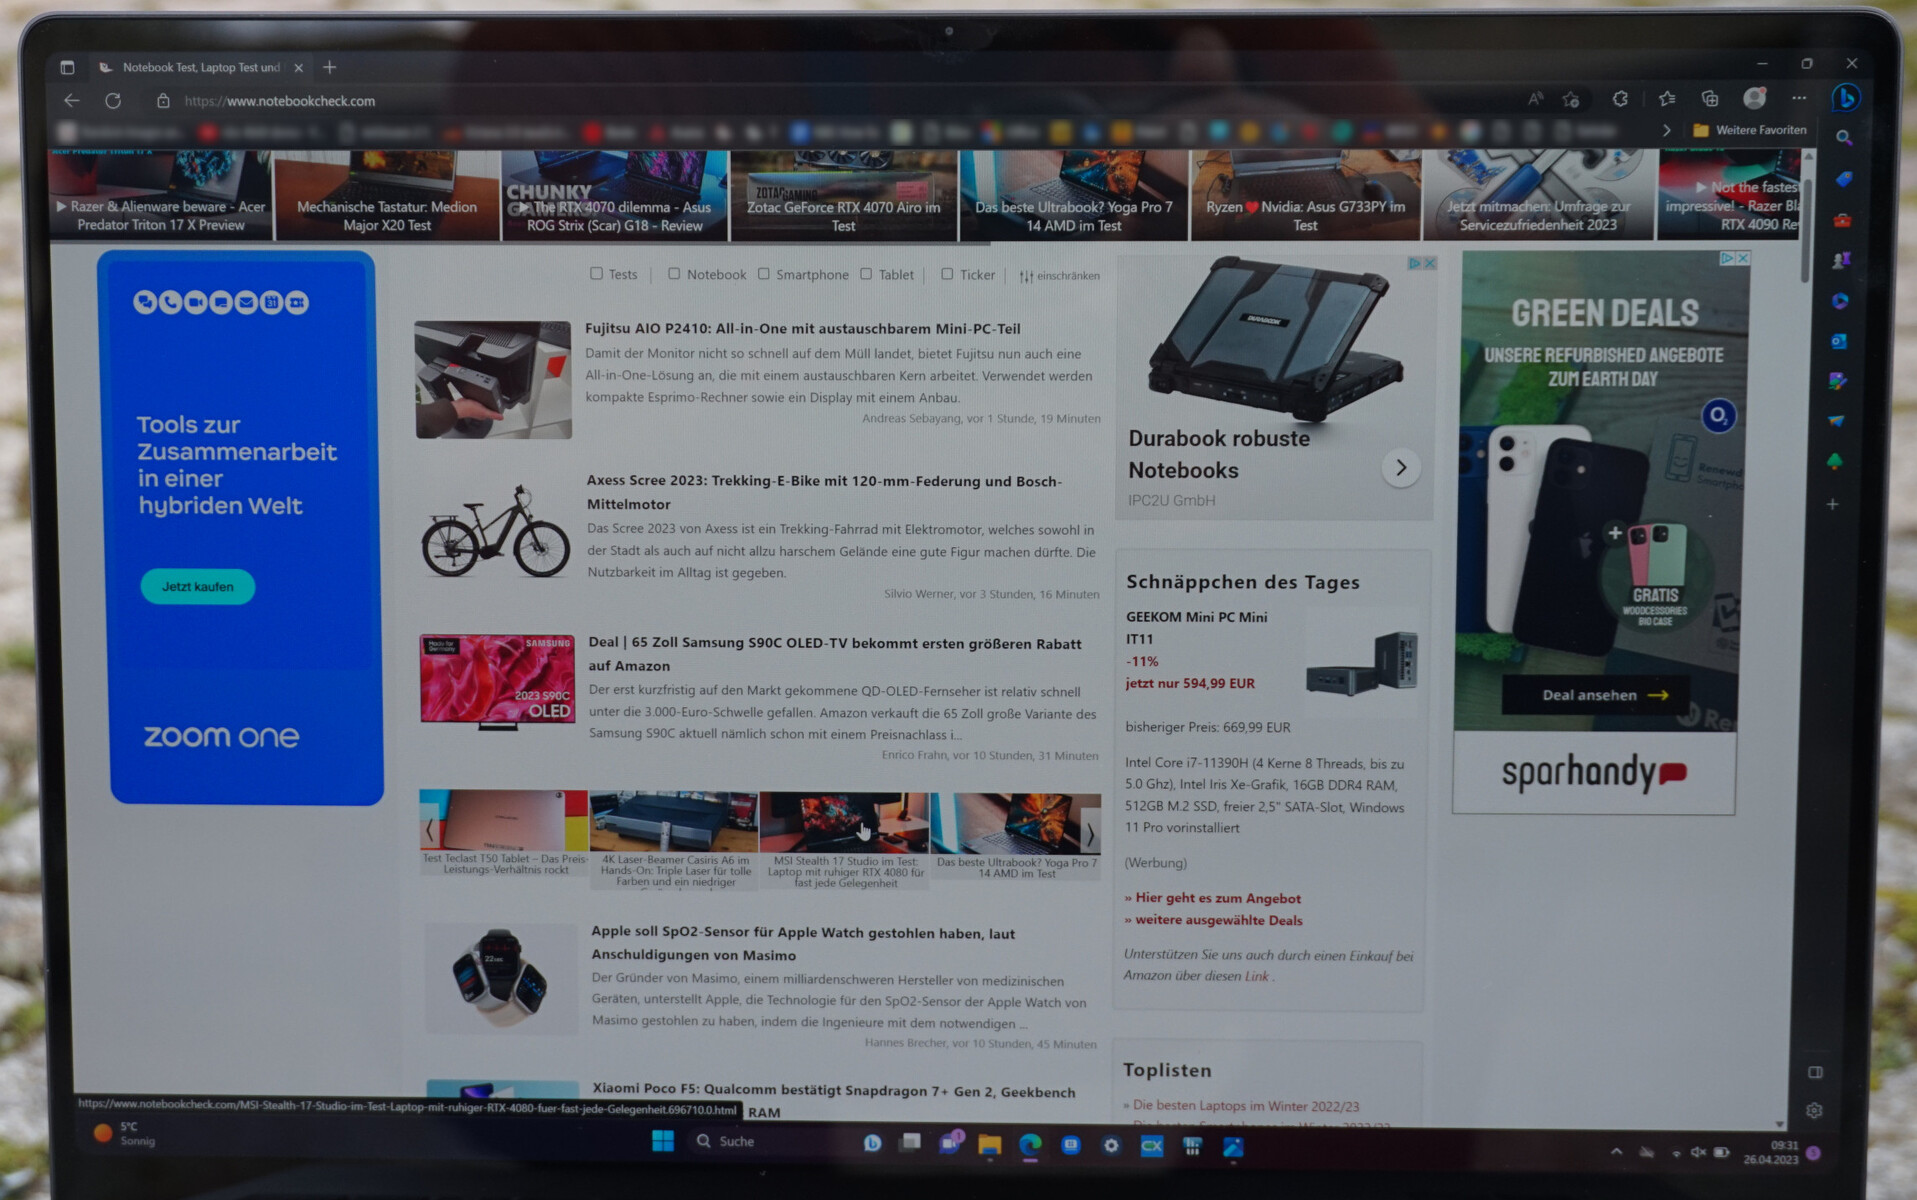
Trotz der ausreichenden Helligkeit verhindert das spiegelnde Display eine Nutzung im Freien. Selbst bei bewölktem Himmel kommt es zu starken Spiegelungen, die ein Erkennen des Bildschirmes deutlich erschweren.
Im Schatten und dann auch nur gegen das Licht sind Texte und Bilder gut erkennbar, da die Displayhelligkeit hoch genug ist.
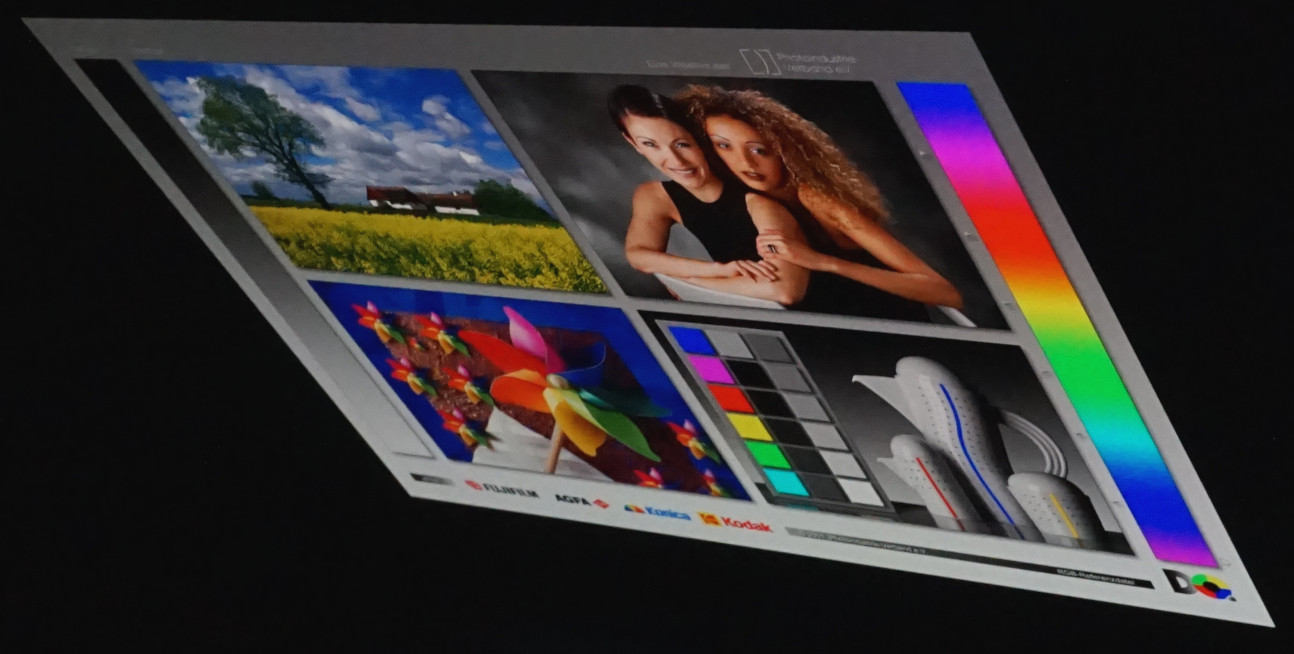
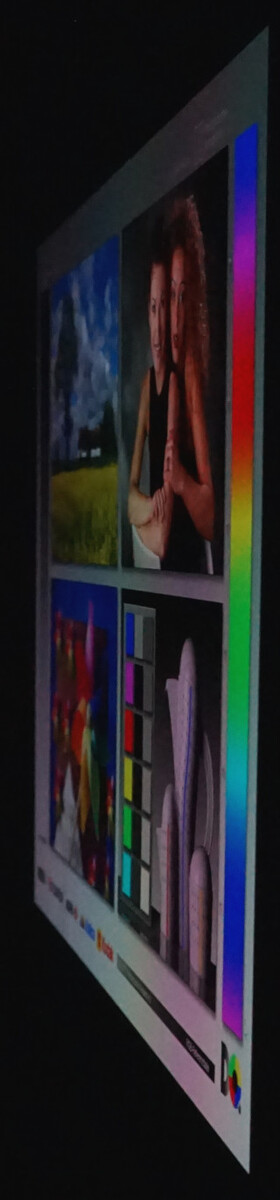
Eine Abweichung der Farbdarstellung lässt sich nur aus einem extrem steilen Blickwinkel beobachten. Innerhalb des üblichen Sichtfelds und auch jenseits von 45° bleiben Helligkeit und Farbwiedergabe tadellos.
Leistung - Effizienz steht bei Galaxy Book3 Ultra im Vordergrund
Die potente Hardware erlaubt schnelles Arbeiten selbst mit komplexen Anwendungen und intensivem Multitasking. Mit einfachen Aufgaben ist der Intel Core i9-13900H selten gänzlich gefordert. Ähnlich verhält es sich bei der RTX 4070. Erst in aktuellen Spielen stößt vor allem die Grafikkarte wegen der stark begrenzten Leistungsaufnahme an ihre Grenzen. Dennoch messen wir auch bei höchster Detailstufe fast durchweg spielbare Bildraten.
Prädestiniert ist das System allerdings für Bild- und Videobearbeitung. Auch 3D-Rendering bereitet ihm keine größeren Probleme. Dabei kann das Galaxy Book3 Ultra sehr leise betrieben werden, büßt dann aber noch einmal etwas Leistungsfähigkeit ein. Bemerkenswert ist zudem das Verhalten im Akkubetrieb: Die 3D-Leistung bleibt hoch. Videoschnitt unterwegs scheint somit realistisch.
Die kleinere Ausstattung mit dem Intel Core i7-13700H und der Nvidia GeForce RTX 4050 verlangt schon ein paar mehr Abstriche. Bei besonders komplexen Aufgaben dürfte ein deutlicher Geschwindigkeitsunterschied feststellbar sein. Soll tatsächlich zwischendurch ein Spiel laufen, wird die stärkere Variante ebenfalls im Vorteil sein.
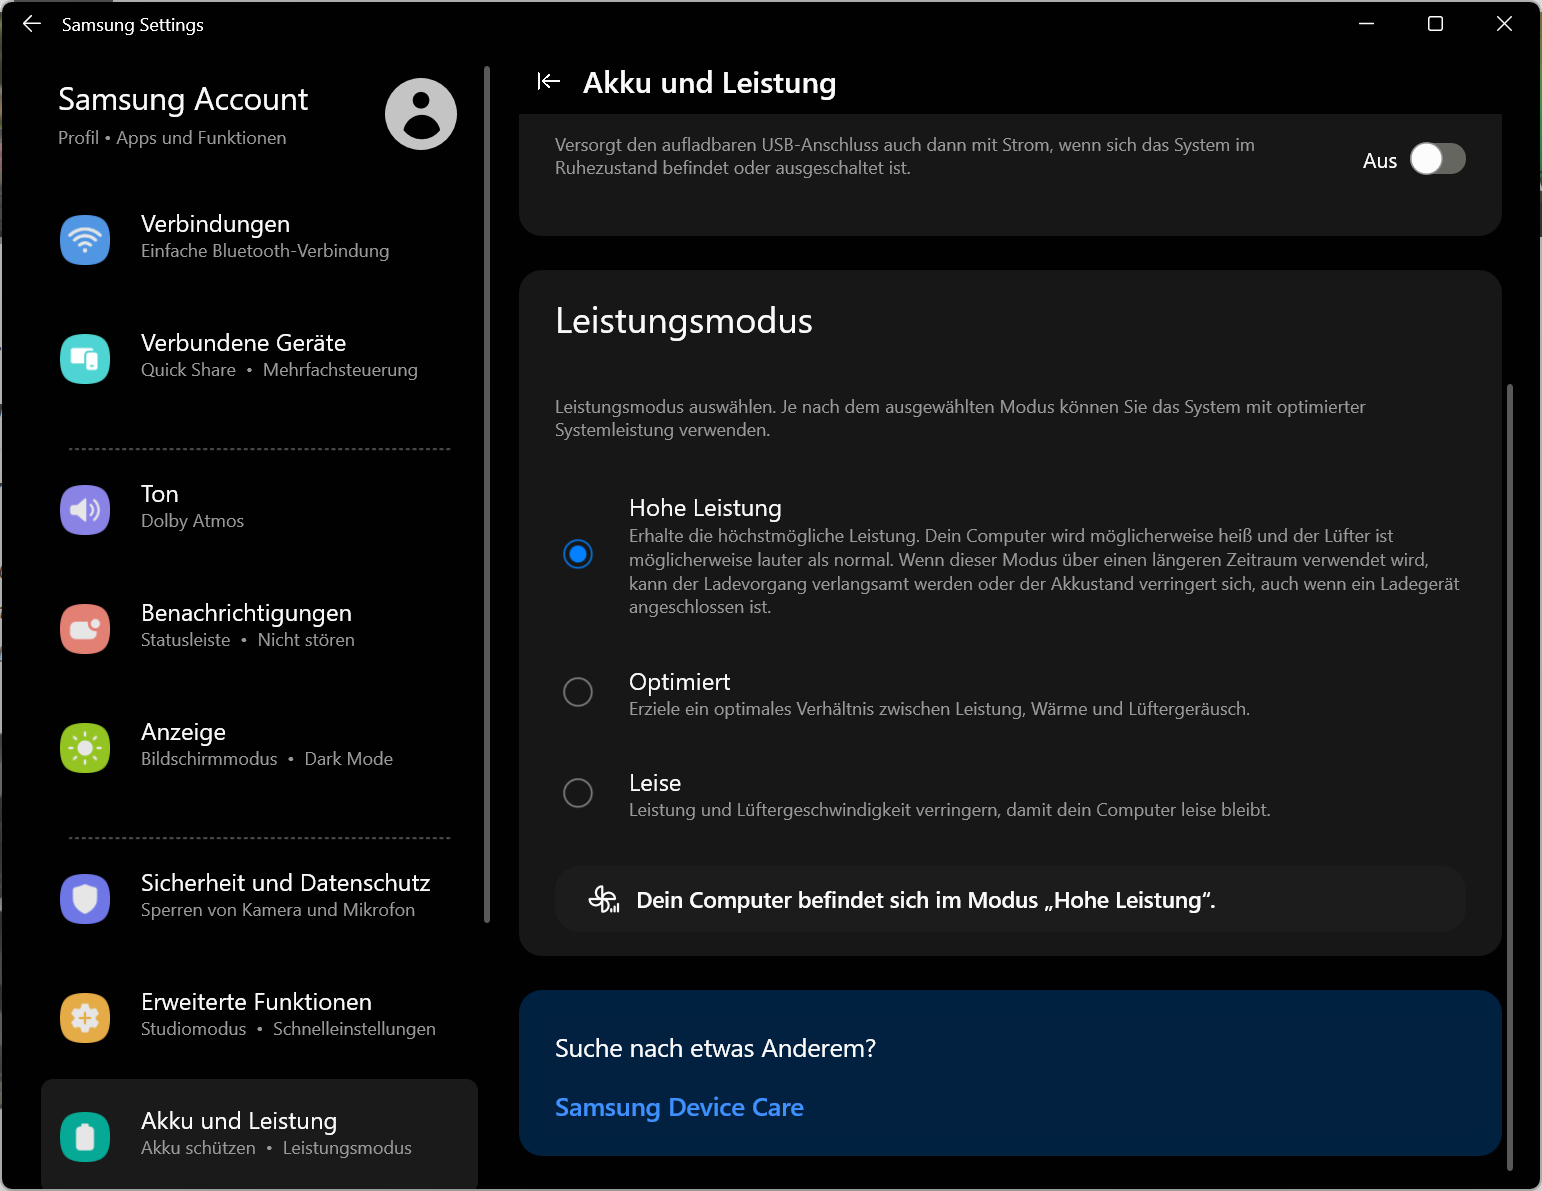
Testbedingungen
Das Samsung Galaxy Book3 nutzt die mitgelieferte Software "Samsung Settings", um einige grundlegende Einstellungen und Verhaltensweisen des Kreativ-Laptops vorzunehmen. Es stehen drei Leistungsprofile zur Auswahl, die sich auch per "Fn"+ "F11" festlegen lassen.
Für unsere Benchmarks haben wir den Modus "Hohe Leistung" gewählt. Hierbei wird wenig Rücksicht auf die Wärme- und Lärmentwicklung genommen. Zweitere liegt jedoch deutlich unterhalb des Niveaus, das Gaming-Notebooks regelmäßig an den Tag legen.
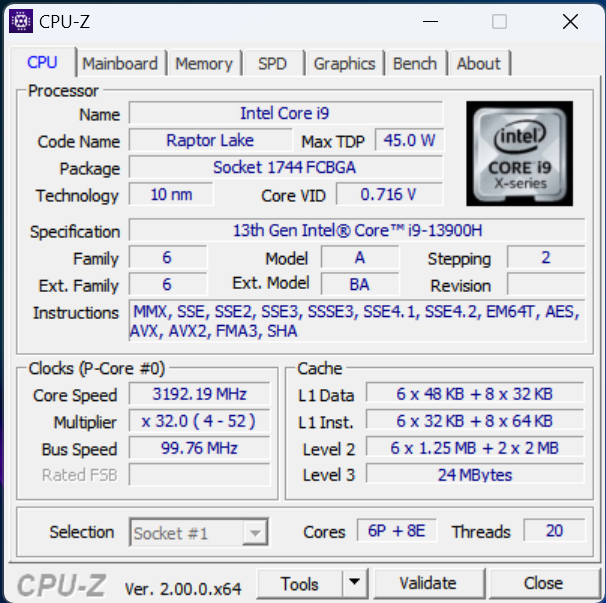
Prozessor
Die CPU Intel Core i9-13900H zählt zum High-End-Segment und wird nicht von vielen mobilen Prozessoren übertroffen. Mit 14 Kernen, 20 Threads, 24 MB L3-Cache und dem hohen Spitzentakt ist die Grundlage zur Abarbeitung komplexer Aufgaben gelegt. Im schlanken Galaxy Book muss die CPU jedoch mit einer verringerten Leistungsaufnahme von maximal 75 W auskommen. Dadurch bleibt sie zum Beispiel deutlich hinter einem Intel Core i9-12900H der Vorgängergeneration zurück, ist jedoch wesentlich sparsamer.
Dass es noch effizienter geht, zeigt der Apple M2 Pro 10-Core. Dieser benötigt für eine minimal schlechtere Wertung im Cinebench-R15-Dauertest lediglich 27 W. Dennoch liegt der i9 in Samsungs Creator-Notebook auf einem guten Niveau, wenn man bedenkt, wie limitiert Platz und Kühlungsmöglichkeiten sind.
Der Vergleich mit dem Galaxy Book3 Ultra mit Intel Core i7-13700H zeigt, dass die CPU bei kurzer Beanspruchung leistungsfähiger ist. Das "kleinere" Notebook von beiden schneidet in unserer CPU-Bewertung über verschiedene Messungen hinweg deutlich besser ab. Es scheint so, als ob der i7 mit der geringeren Leistungsaufnahme besser zurechtkommt als der i9. Die annähernd baugleichen CPUs unterscheiden sich vor allem bei der maximal erreichbaren Taktfrequenz. Dieser Vorteil lässt sich bei geringerer Stromzufuhr nicht mehr ausspielen. Wir messen zum Beispiel bei Cinebench R23 eine maximale Taktfrequenz von 3,7 GHz. Theoretisch erreichbar wären bis zu 5,4 GHz.
Wird die Rechenleistung über längere Zeit benötigt, kann sich der schnellere i9-Prozessor allerdings wieder behaupten im Cinebench-R15-Dauertest. Dann zeigen sich die Vorteile der stärkeren, aber auch lauteren Kühlung im Vergleich zur Variante mit i7.
Nicht ganz so extreme Bedingungen müssen im optimierten Modus ausgehalten werden. Für Sekundenbruchteile bleiben wie im leisen Modus und selbst im Akkubetrieb 75 W erlaubt. Die Stromaufnahme für längere Zeit ist hingegen auf 45 W begrenzt. Bei leisem Verhalten sinkt dieser Wert auf 30 W.
Die Leistungsmodi sind zudem im Akkubetrieb verfügbar. Das PL1, das die Leistungsaufnahme für bis zu 32 Sek. festlegt, ist dann um je 10 W abgesenkt. Im leisen Modus bleibt es dagegen bei 30 W, was eigentlich immer ausreicht, wie sich weiter unten noch zeigt.
Mehr Benchmarks und Vergleichswerte finden sich in unserer CPU-Benchmark-Liste.
Cinebench R15 Multi Dauertest
Cinebench R23: Multi Core | Single Core
Cinebench R20: CPU (Multi Core) | CPU (Single Core)
Cinebench R15: CPU Multi 64Bit | CPU Single 64Bit
Blender: v2.79 BMW27 CPU
7-Zip 18.03: 7z b 4 | 7z b 4 -mmt1
Geekbench 5.5: Multi-Core | Single-Core
HWBOT x265 Benchmark v2.2: 4k Preset
LibreOffice : 20 Documents To PDF
R Benchmark 2.5: Overall mean
| CPU Performance Rating | |
| Asus ProArt StudioBook 16 H7600ZW | |
| MSI Stealth 17 Studio A13VH-014 | |
| Gigabyte AERO 16 OLED BSF | |
| Durchschnittliche Intel Core i9-13900H | |
| Dell XPS 15 9530 RTX 4070 | |
| Durchschnitt der Klasse Multimedia | |
| Samsung Galaxy Book3 Ultra 16 | |
| Apple MacBook Pro 14 2023 M2 Pro Entry -5! | |
| Lenovo ThinkPad T14 G3-21AJS00400 | |
| Samsung Galaxy Book3 Ultra 16, i9-13900H RTX 4070 | |
| Samsung Galaxy Book Pro 15 NP950XDB-KC5US | |
| Cinebench R23 / Multi Core | |
| MSI Stealth 17 Studio A13VH-014 | |
| Gigabyte AERO 16 OLED BSF | |
| Asus ProArt StudioBook 16 H7600ZW | |
| Durchschnittliche Intel Core i9-13900H (11997 - 20385, n=28) | |
| Durchschnitt der Klasse Multimedia (4861 - 33362, n=80, der letzten 2 Jahre) | |
| Dell XPS 15 9530 RTX 4070 | |
| Samsung Galaxy Book3 Ultra 16 | |
| Samsung Galaxy Book3 Ultra 16, i9-13900H RTX 4070 | |
| Lenovo ThinkPad T14 G3-21AJS00400 | |
| Apple MacBook Pro 14 2023 M2 Pro Entry | |
| Samsung Galaxy Book Pro 15 NP950XDB-KC5US | |
| Cinebench R23 / Single Core | |
| Durchschnittliche Intel Core i9-13900H (1297 - 2054, n=26) | |
| Durchschnitt der Klasse Multimedia (1128 - 2459, n=72, der letzten 2 Jahre) | |
| Asus ProArt StudioBook 16 H7600ZW | |
| Dell XPS 15 9530 RTX 4070 | |
| Lenovo ThinkPad T14 G3-21AJS00400 | |
| Gigabyte AERO 16 OLED BSF | |
| MSI Stealth 17 Studio A13VH-014 | |
| Samsung Galaxy Book3 Ultra 16 | |
| Apple MacBook Pro 14 2023 M2 Pro Entry | |
| Samsung Galaxy Book Pro 15 NP950XDB-KC5US | |
| Samsung Galaxy Book3 Ultra 16, i9-13900H RTX 4070 | |
| Cinebench R20 / CPU (Multi Core) | |
| MSI Stealth 17 Studio A13VH-014 | |
| Asus ProArt StudioBook 16 H7600ZW | |
| Gigabyte AERO 16 OLED BSF | |
| Durchschnittliche Intel Core i9-13900H (4935 - 7716, n=25) | |
| Durchschnitt der Klasse Multimedia (1887 - 12912, n=63, der letzten 2 Jahre) | |
| Dell XPS 15 9530 RTX 4070 | |
| Samsung Galaxy Book3 Ultra 16 | |
| Samsung Galaxy Book3 Ultra 16, i9-13900H RTX 4070 | |
| Lenovo ThinkPad T14 G3-21AJS00400 | |
| Apple MacBook Pro 14 2023 M2 Pro Entry | |
| Samsung Galaxy Book Pro 15 NP950XDB-KC5US | |
| Cinebench R20 / CPU (Single Core) | |
| Asus ProArt StudioBook 16 H7600ZW | |
| Durchschnittliche Intel Core i9-13900H (428 - 792, n=25) | |
| Durchschnitt der Klasse Multimedia (420 - 853, n=63, der letzten 2 Jahre) | |
| Dell XPS 15 9530 RTX 4070 | |
| Lenovo ThinkPad T14 G3-21AJS00400 | |
| MSI Stealth 17 Studio A13VH-014 | |
| Samsung Galaxy Book3 Ultra 16 | |
| Gigabyte AERO 16 OLED BSF | |
| Samsung Galaxy Book Pro 15 NP950XDB-KC5US | |
| Apple MacBook Pro 14 2023 M2 Pro Entry | |
| Samsung Galaxy Book3 Ultra 16, i9-13900H RTX 4070 | |
| Cinebench R15 / CPU Multi 64Bit | |
| MSI Stealth 17 Studio A13VH-014 | |
| Gigabyte AERO 16 OLED BSF | |
| Asus ProArt StudioBook 16 H7600ZW | |
| Durchschnittliche Intel Core i9-13900H (2061 - 3100, n=26) | |
| Dell XPS 15 9530 RTX 4070 | |
| Durchschnitt der Klasse Multimedia (856 - 5224, n=68, der letzten 2 Jahre) | |
| Samsung Galaxy Book3 Ultra 16 | |
| Samsung Galaxy Book3 Ultra 16, i9-13900H RTX 4070 | |
| Lenovo ThinkPad T14 G3-21AJS00400 | |
| Apple MacBook Pro 14 2023 M2 Pro Entry | |
| Samsung Galaxy Book Pro 15 NP950XDB-KC5US | |
| Cinebench R15 / CPU Single 64Bit | |
| MSI Stealth 17 Studio A13VH-014 | |
| Asus ProArt StudioBook 16 H7600ZW | |
| Dell XPS 15 9530 RTX 4070 | |
| Durchschnittliche Intel Core i9-13900H (211 - 297, n=26) | |
| Durchschnitt der Klasse Multimedia (99.6 - 326, n=66, der letzten 2 Jahre) | |
| Samsung Galaxy Book3 Ultra 16 | |
| Lenovo ThinkPad T14 G3-21AJS00400 | |
| Gigabyte AERO 16 OLED BSF | |
| Apple MacBook Pro 14 2023 M2 Pro Entry | |
| Samsung Galaxy Book3 Ultra 16, i9-13900H RTX 4070 | |
| Samsung Galaxy Book Pro 15 NP950XDB-KC5US | |
| Blender / v2.79 BMW27 CPU | |
| Samsung Galaxy Book Pro 15 NP950XDB-KC5US | |
| Apple MacBook Pro 14 2023 M2 Pro Entry | |
| Lenovo ThinkPad T14 G3-21AJS00400 | |
| Durchschnitt der Klasse Multimedia (100 - 557, n=64, der letzten 2 Jahre) | |
| Samsung Galaxy Book3 Ultra 16, i9-13900H RTX 4070 | |
| Samsung Galaxy Book3 Ultra 16 | |
| Dell XPS 15 9530 RTX 4070 | |
| Durchschnittliche Intel Core i9-13900H (166 - 268, n=24) | |
| Gigabyte AERO 16 OLED BSF | |
| Asus ProArt StudioBook 16 H7600ZW | |
| MSI Stealth 17 Studio A13VH-014 | |
| 7-Zip 18.03 / 7z b 4 | |
| Asus ProArt StudioBook 16 H7600ZW | |
| MSI Stealth 17 Studio A13VH-014 | |
| Gigabyte AERO 16 OLED BSF | |
| Durchschnittliche Intel Core i9-13900H (45045 - 79032, n=25) | |
| Samsung Galaxy Book3 Ultra 16 | |
| Durchschnitt der Klasse Multimedia (29095 - 130368, n=62, der letzten 2 Jahre) | |
| Dell XPS 15 9530 RTX 4070 | |
| Samsung Galaxy Book3 Ultra 16, i9-13900H RTX 4070 | |
| Lenovo ThinkPad T14 G3-21AJS00400 | |
| Samsung Galaxy Book Pro 15 NP950XDB-KC5US | |
| 7-Zip 18.03 / 7z b 4 -mmt1 | |
| Asus ProArt StudioBook 16 H7600ZW | |
| MSI Stealth 17 Studio A13VH-014 | |
| Dell XPS 15 9530 RTX 4070 | |
| Durchschnittliche Intel Core i9-13900H (3665 - 6600, n=25) | |
| Durchschnitt der Klasse Multimedia (3666 - 7545, n=62, der letzten 2 Jahre) | |
| Lenovo ThinkPad T14 G3-21AJS00400 | |
| Gigabyte AERO 16 OLED BSF | |
| Samsung Galaxy Book3 Ultra 16 | |
| Samsung Galaxy Book Pro 15 NP950XDB-KC5US | |
| Samsung Galaxy Book3 Ultra 16, i9-13900H RTX 4070 | |
| Geekbench 5.5 / Multi-Core | |
| Asus ProArt StudioBook 16 H7600ZW | |
| Gigabyte AERO 16 OLED BSF | |
| MSI Stealth 17 Studio A13VH-014 | |
| Dell XPS 15 9530 RTX 4070 | |
| Durchschnittliche Intel Core i9-13900H (9094 - 15410, n=26) | |
| Durchschnitt der Klasse Multimedia (4652 - 20422, n=63, der letzten 2 Jahre) | |
| Apple MacBook Pro 14 2023 M2 Pro Entry | |
| Samsung Galaxy Book3 Ultra 16 | |
| Samsung Galaxy Book3 Ultra 16, i9-13900H RTX 4070 | |
| Lenovo ThinkPad T14 G3-21AJS00400 | |
| Samsung Galaxy Book Pro 15 NP950XDB-KC5US | |
| Geekbench 5.5 / Single-Core | |
| MSI Stealth 17 Studio A13VH-014 | |
| Apple MacBook Pro 14 2023 M2 Pro Entry | |
| Dell XPS 15 9530 RTX 4070 | |
| Durchschnittliche Intel Core i9-13900H (1140 - 2043, n=26) | |
| Durchschnitt der Klasse Multimedia (805 - 2974, n=63, der letzten 2 Jahre) | |
| Asus ProArt StudioBook 16 H7600ZW | |
| Gigabyte AERO 16 OLED BSF | |
| Samsung Galaxy Book3 Ultra 16 | |
| Lenovo ThinkPad T14 G3-21AJS00400 | |
| Samsung Galaxy Book Pro 15 NP950XDB-KC5US | |
| Samsung Galaxy Book3 Ultra 16, i9-13900H RTX 4070 | |
| HWBOT x265 Benchmark v2.2 / 4k Preset | |
| Asus ProArt StudioBook 16 H7600ZW | |
| MSI Stealth 17 Studio A13VH-014 | |
| Gigabyte AERO 16 OLED BSF | |
| Durchschnittliche Intel Core i9-13900H (14.1 - 22.3, n=25) | |
| Durchschnitt der Klasse Multimedia (5.26 - 36.1, n=62, der letzten 2 Jahre) | |
| Dell XPS 15 9530 RTX 4070 | |
| Samsung Galaxy Book3 Ultra 16 | |
| Samsung Galaxy Book3 Ultra 16, i9-13900H RTX 4070 | |
| Lenovo ThinkPad T14 G3-21AJS00400 | |
| Samsung Galaxy Book Pro 15 NP950XDB-KC5US | |
| LibreOffice / 20 Documents To PDF | |
| Samsung Galaxy Book3 Ultra 16, i9-13900H RTX 4070 | |
| Gigabyte AERO 16 OLED BSF | |
| Samsung Galaxy Book Pro 15 NP950XDB-KC5US | |
| MSI Stealth 17 Studio A13VH-014 | |
| Durchschnitt der Klasse Multimedia (23.9 - 146.7, n=63, der letzten 2 Jahre) | |
| Samsung Galaxy Book3 Ultra 16 | |
| Durchschnittliche Intel Core i9-13900H (34.4 - 82.8, n=25) | |
| Asus ProArt StudioBook 16 H7600ZW | |
| Dell XPS 15 9530 RTX 4070 | |
| Lenovo ThinkPad T14 G3-21AJS00400 | |
| R Benchmark 2.5 / Overall mean | |
| Samsung Galaxy Book3 Ultra 16, i9-13900H RTX 4070 | |
| Samsung Galaxy Book Pro 15 NP950XDB-KC5US | |
| Gigabyte AERO 16 OLED BSF | |
| Samsung Galaxy Book3 Ultra 16 | |
| Lenovo ThinkPad T14 G3-21AJS00400 | |
| Durchschnitt der Klasse Multimedia (0.3604 - 0.947, n=62, der letzten 2 Jahre) | |
| Durchschnittliche Intel Core i9-13900H (0.4052 - 0.723, n=25) | |
| Dell XPS 15 9530 RTX 4070 | |
| Asus ProArt StudioBook 16 H7600ZW | |
| MSI Stealth 17 Studio A13VH-014 | |
* ... kleinere Werte sind besser
AIDA64: FP32 Ray-Trace | FPU Julia | CPU SHA3 | CPU Queen | FPU SinJulia | FPU Mandel | CPU AES | CPU ZLib | FP64 Ray-Trace | CPU PhotoWorxx
| Performance Rating | |
| Asus ProArt StudioBook 16 H7600ZW | |
| Gigabyte AERO 16 OLED BSF | |
| MSI Stealth 17 Studio A13VH-014 | |
| Durchschnitt der Klasse Multimedia | |
| Durchschnittliche Intel Core i9-13900H | |
| Samsung Galaxy Book3 Ultra 16 | |
| Dell XPS 15 9530 RTX 4070 | |
| Samsung Galaxy Book3 Ultra 16, i9-13900H RTX 4070 | |
| AIDA64 / FP32 Ray-Trace | |
| MSI Stealth 17 Studio A13VH-014 | |
| Gigabyte AERO 16 OLED BSF | |
| Asus ProArt StudioBook 16 H7600ZW | |
| Durchschnitt der Klasse Multimedia (2214 - 50388, n=59, der letzten 2 Jahre) | |
| Durchschnittliche Intel Core i9-13900H (6788 - 19557, n=25) | |
| Samsung Galaxy Book3 Ultra 16, i9-13900H RTX 4070 | |
| Samsung Galaxy Book3 Ultra 16 | |
| Dell XPS 15 9530 RTX 4070 | |
| AIDA64 / FPU Julia | |
| MSI Stealth 17 Studio A13VH-014 | |
| Asus ProArt StudioBook 16 H7600ZW | |
| Gigabyte AERO 16 OLED BSF | |
| Durchschnitt der Klasse Multimedia (12867 - 201874, n=60, der letzten 2 Jahre) | |
| Durchschnittliche Intel Core i9-13900H (22551 - 95579, n=25) | |
| Samsung Galaxy Book3 Ultra 16 | |
| Dell XPS 15 9530 RTX 4070 | |
| Samsung Galaxy Book3 Ultra 16, i9-13900H RTX 4070 | |
| AIDA64 / CPU SHA3 | |
| MSI Stealth 17 Studio A13VH-014 | |
| Asus ProArt StudioBook 16 H7600ZW | |
| Gigabyte AERO 16 OLED BSF | |
| Durchschnitt der Klasse Multimedia (653 - 8623, n=60, der letzten 2 Jahre) | |
| Durchschnittliche Intel Core i9-13900H (2491 - 4270, n=25) | |
| Samsung Galaxy Book3 Ultra 16, i9-13900H RTX 4070 | |
| Samsung Galaxy Book3 Ultra 16 | |
| Dell XPS 15 9530 RTX 4070 | |
| AIDA64 / CPU Queen | |
| Asus ProArt StudioBook 16 H7600ZW | |
| Durchschnittliche Intel Core i9-13900H (65121 - 120936, n=25) | |
| Dell XPS 15 9530 RTX 4070 | |
| Samsung Galaxy Book3 Ultra 16 | |
| MSI Stealth 17 Studio A13VH-014 | |
| Gigabyte AERO 16 OLED BSF | |
| Samsung Galaxy Book3 Ultra 16, i9-13900H RTX 4070 | |
| Durchschnitt der Klasse Multimedia (13483 - 181505, n=60, der letzten 2 Jahre) | |
| AIDA64 / FPU SinJulia | |
| MSI Stealth 17 Studio A13VH-014 | |
| Gigabyte AERO 16 OLED BSF | |
| Asus ProArt StudioBook 16 H7600ZW | |
| Durchschnittliche Intel Core i9-13900H (6108 - 11631, n=25) | |
| Durchschnitt der Klasse Multimedia (1240 - 28794, n=60, der letzten 2 Jahre) | |
| Samsung Galaxy Book3 Ultra 16 | |
| Dell XPS 15 9530 RTX 4070 | |
| Samsung Galaxy Book3 Ultra 16, i9-13900H RTX 4070 | |
| AIDA64 / FPU Mandel | |
| MSI Stealth 17 Studio A13VH-014 | |
| Asus ProArt StudioBook 16 H7600ZW | |
| Gigabyte AERO 16 OLED BSF | |
| Durchschnitt der Klasse Multimedia (6395 - 105740, n=59, der letzten 2 Jahre) | |
| Durchschnittliche Intel Core i9-13900H (11283 - 48474, n=25) | |
| Samsung Galaxy Book3 Ultra 16, i9-13900H RTX 4070 | |
| Samsung Galaxy Book3 Ultra 16 | |
| Dell XPS 15 9530 RTX 4070 | |
| AIDA64 / CPU AES | |
| Asus ProArt StudioBook 16 H7600ZW | |
| Gigabyte AERO 16 OLED BSF | |
| Durchschnittliche Intel Core i9-13900H (3691 - 149377, n=25) | |
| MSI Stealth 17 Studio A13VH-014 | |
| Durchschnitt der Klasse Multimedia (13243 - 126790, n=60, der letzten 2 Jahre) | |
| Samsung Galaxy Book3 Ultra 16 | |
| Dell XPS 15 9530 RTX 4070 | |
| Samsung Galaxy Book3 Ultra 16, i9-13900H RTX 4070 | |
| AIDA64 / CPU ZLib | |
| MSI Stealth 17 Studio A13VH-014 | |
| Gigabyte AERO 16 OLED BSF | |
| Asus ProArt StudioBook 16 H7600ZW | |
| Durchschnittliche Intel Core i9-13900H (789 - 1254, n=25) | |
| Samsung Galaxy Book3 Ultra 16 | |
| Samsung Galaxy Book3 Ultra 16, i9-13900H RTX 4070 | |
| Durchschnitt der Klasse Multimedia (167.2 - 2022, n=60, der letzten 2 Jahre) | |
| Dell XPS 15 9530 RTX 4070 | |
| AIDA64 / FP64 Ray-Trace | |
| MSI Stealth 17 Studio A13VH-014 | |
| Asus ProArt StudioBook 16 H7600ZW | |
| Gigabyte AERO 16 OLED BSF | |
| Durchschnitt der Klasse Multimedia (1014 - 26875, n=60, der letzten 2 Jahre) | |
| Durchschnittliche Intel Core i9-13900H (3655 - 10716, n=25) | |
| Samsung Galaxy Book3 Ultra 16 | |
| Dell XPS 15 9530 RTX 4070 | |
| Samsung Galaxy Book3 Ultra 16, i9-13900H RTX 4070 | |
| AIDA64 / CPU PhotoWorxx | |
| MSI Stealth 17 Studio A13VH-014 | |
| Samsung Galaxy Book3 Ultra 16, i9-13900H RTX 4070 | |
| Samsung Galaxy Book3 Ultra 16 | |
| Durchschnitt der Klasse Multimedia (12860 - 88086, n=60, der letzten 2 Jahre) | |
| Gigabyte AERO 16 OLED BSF | |
| Dell XPS 15 9530 RTX 4070 | |
| Asus ProArt StudioBook 16 H7600ZW | |
| Durchschnittliche Intel Core i9-13900H (10871 - 50488, n=25) | |
System Performance
Die begrenzte Leistungsaufnahme ist beim normalen Umgang kaum zu spüren. Im Vergleich zu den leistungsstärkeren Modellen zeigen sich Programmstarts minimal verzögert. Im Vergleich zu einem schnellen Business-Notebook ist das Samsung Galaxy Book3 Ultra hingegen im Vorteil. Die vielen Kerne der CPU und die Unterstützung durch den dedizierten Grafikchip kommen voll zur Geltung.
Schnelles Arbeiten und Multitasking bereiten dem System keinerlei Probleme. Dazu darf der Blick auf die Effizienz nicht fehlen. Das sehr ähnlich ausgestattete Gigabyte AERO 16 OLED hat bei den meisten Benchmarks 40 bis 50 % Vorsprung. Es darf für diese Rechenleistung allerdings doppelt so viel Strom verbrauchen.
Was sich schon bei der CPU-Leistung angedeutet hat, setzt sich bei der Systemleistung fort: Auch hier kann das kleinere Samsung Galaxy Book3 Ultra bessere Werte vorweisen. Der Eindruck setzt sich fort, dass der i7-13700H mit der Begrenzung auf 75 W wesentlich besser umgehen kann als der i9-13900H.
CrossMark: Overall | Productivity | Creativity | Responsiveness
| PCMark 10 / Score | |
| Asus ProArt StudioBook 16 H7600ZW | |
| Gigabyte AERO 16 OLED BSF | |
| Durchschnittliche Intel Core i9-13900H, NVIDIA GeForce RTX 4070 Laptop GPU (5855 - 8538, n=8) | |
| MSI Stealth 17 Studio A13VH-014 | |
| Dell XPS 15 9530 RTX 4070 | |
| Durchschnitt der Klasse Multimedia (4325 - 10386, n=56, der letzten 2 Jahre) | |
| Samsung Galaxy Book3 Ultra 16 | |
| Lenovo ThinkPad T14 G3-21AJS00400 | |
| Samsung Galaxy Book3 Ultra 16, i9-13900H RTX 4070 | |
| Samsung Galaxy Book Pro 15 NP950XDB-KC5US | |
| PCMark 10 / Essentials | |
| Asus ProArt StudioBook 16 H7600ZW | |
| Dell XPS 15 9530 RTX 4070 | |
| Gigabyte AERO 16 OLED BSF | |
| Durchschnittliche Intel Core i9-13900H, NVIDIA GeForce RTX 4070 Laptop GPU (8835 - 11940, n=8) | |
| Samsung Galaxy Book3 Ultra 16 | |
| Durchschnitt der Klasse Multimedia (8025 - 11664, n=56, der letzten 2 Jahre) | |
| MSI Stealth 17 Studio A13VH-014 | |
| Samsung Galaxy Book Pro 15 NP950XDB-KC5US | |
| Lenovo ThinkPad T14 G3-21AJS00400 | |
| Samsung Galaxy Book3 Ultra 16, i9-13900H RTX 4070 | |
| PCMark 10 / Productivity | |
| Asus ProArt StudioBook 16 H7600ZW | |
| MSI Stealth 17 Studio A13VH-014 | |
| Durchschnitt der Klasse Multimedia (7323 - 18233, n=56, der letzten 2 Jahre) | |
| Durchschnittliche Intel Core i9-13900H, NVIDIA GeForce RTX 4070 Laptop GPU (7967 - 10991, n=8) | |
| Gigabyte AERO 16 OLED BSF | |
| Samsung Galaxy Book3 Ultra 16 | |
| Dell XPS 15 9530 RTX 4070 | |
| Lenovo ThinkPad T14 G3-21AJS00400 | |
| Samsung Galaxy Book3 Ultra 16, i9-13900H RTX 4070 | |
| Samsung Galaxy Book Pro 15 NP950XDB-KC5US | |
| PCMark 10 / Digital Content Creation | |
| Gigabyte AERO 16 OLED BSF | |
| Durchschnittliche Intel Core i9-13900H, NVIDIA GeForce RTX 4070 Laptop GPU (7738 - 13575, n=8) | |
| Asus ProArt StudioBook 16 H7600ZW | |
| MSI Stealth 17 Studio A13VH-014 | |
| Dell XPS 15 9530 RTX 4070 | |
| Durchschnitt der Klasse Multimedia (3651 - 16240, n=56, der letzten 2 Jahre) | |
| Samsung Galaxy Book3 Ultra 16 | |
| Samsung Galaxy Book3 Ultra 16, i9-13900H RTX 4070 | |
| Lenovo ThinkPad T14 G3-21AJS00400 | |
| Samsung Galaxy Book Pro 15 NP950XDB-KC5US | |
| CrossMark / Overall | |
| Asus ProArt StudioBook 16 H7600ZW | |
| Dell XPS 15 9530 RTX 4070 | |
| Gigabyte AERO 16 OLED BSF | |
| Durchschnittliche Intel Core i9-13900H, NVIDIA GeForce RTX 4070 Laptop GPU (1104 - 1974, n=7) | |
| Apple MacBook Pro 14 2023 M2 Pro Entry | |
| Durchschnitt der Klasse Multimedia (866 - 2426, n=64, der letzten 2 Jahre) | |
| MSI Stealth 17 Studio A13VH-014 | |
| Samsung Galaxy Book3 Ultra 16 | |
| Lenovo ThinkPad T14 G3-21AJS00400 | |
| Samsung Galaxy Book3 Ultra 16, i9-13900H RTX 4070 | |
| CrossMark / Productivity | |
| Asus ProArt StudioBook 16 H7600ZW | |
| Gigabyte AERO 16 OLED BSF | |
| Dell XPS 15 9530 RTX 4070 | |
| Durchschnittliche Intel Core i9-13900H, NVIDIA GeForce RTX 4070 Laptop GPU (1058 - 1914, n=7) | |
| Durchschnitt der Klasse Multimedia (913 - 2344, n=64, der letzten 2 Jahre) | |
| MSI Stealth 17 Studio A13VH-014 | |
| Apple MacBook Pro 14 2023 M2 Pro Entry | |
| Lenovo ThinkPad T14 G3-21AJS00400 | |
| Samsung Galaxy Book3 Ultra 16 | |
| Samsung Galaxy Book3 Ultra 16, i9-13900H RTX 4070 | |
| CrossMark / Creativity | |
| Apple MacBook Pro 14 2023 M2 Pro Entry | |
| Dell XPS 15 9530 RTX 4070 | |
| Asus ProArt StudioBook 16 H7600ZW | |
| Durchschnitt der Klasse Multimedia (907 - 2820, n=64, der letzten 2 Jahre) | |
| Durchschnittliche Intel Core i9-13900H, NVIDIA GeForce RTX 4070 Laptop GPU (1178 - 2254, n=7) | |
| Gigabyte AERO 16 OLED BSF | |
| MSI Stealth 17 Studio A13VH-014 | |
| Samsung Galaxy Book3 Ultra 16 | |
| Lenovo ThinkPad T14 G3-21AJS00400 | |
| Samsung Galaxy Book3 Ultra 16, i9-13900H RTX 4070 | |
| CrossMark / Responsiveness | |
| Gigabyte AERO 16 OLED BSF | |
| Asus ProArt StudioBook 16 H7600ZW | |
| Durchschnittliche Intel Core i9-13900H, NVIDIA GeForce RTX 4070 Laptop GPU (1037 - 1952, n=7) | |
| Dell XPS 15 9530 RTX 4070 | |
| MSI Stealth 17 Studio A13VH-014 | |
| Samsung Galaxy Book3 Ultra 16 | |
| Durchschnitt der Klasse Multimedia (605 - 2024, n=64, der letzten 2 Jahre) | |
| Apple MacBook Pro 14 2023 M2 Pro Entry | |
| Lenovo ThinkPad T14 G3-21AJS00400 | |
| Samsung Galaxy Book3 Ultra 16, i9-13900H RTX 4070 | |
| PCMark 10 Score | 5855 Punkte | |
Hilfe | ||
| AIDA64 / Memory Copy | |
| Durchschnitt der Klasse Multimedia (21158 - 131796, n=60, der letzten 2 Jahre) | |
| MSI Stealth 17 Studio A13VH-014 | |
| Samsung Galaxy Book3 Ultra 16 | |
| Samsung Galaxy Book3 Ultra 16, i9-13900H RTX 4070 | |
| Gigabyte AERO 16 OLED BSF | |
| Dell XPS 15 9530 RTX 4070 | |
| Asus ProArt StudioBook 16 H7600ZW | |
| Durchschnittliche Intel Core i9-13900H (37448 - 74486, n=25) | |
| AIDA64 / Memory Read | |
| Durchschnitt der Klasse Multimedia (19699 - 125604, n=60, der letzten 2 Jahre) | |
| MSI Stealth 17 Studio A13VH-014 | |
| Samsung Galaxy Book3 Ultra 16, i9-13900H RTX 4070 | |
| Dell XPS 15 9530 RTX 4070 | |
| Samsung Galaxy Book3 Ultra 16 | |
| Gigabyte AERO 16 OLED BSF | |
| Asus ProArt StudioBook 16 H7600ZW | |
| Durchschnittliche Intel Core i9-13900H (41599 - 75433, n=25) | |
| AIDA64 / Memory Write | |
| Samsung Galaxy Book3 Ultra 16 | |
| Samsung Galaxy Book3 Ultra 16, i9-13900H RTX 4070 | |
| Durchschnitt der Klasse Multimedia (17733 - 134916, n=60, der letzten 2 Jahre) | |
| MSI Stealth 17 Studio A13VH-014 | |
| Gigabyte AERO 16 OLED BSF | |
| Dell XPS 15 9530 RTX 4070 | |
| Durchschnittliche Intel Core i9-13900H (36152 - 88505, n=25) | |
| Asus ProArt StudioBook 16 H7600ZW | |
| AIDA64 / Memory Latency | |
| Durchschnitt der Klasse Multimedia (7 - 535, n=60, der letzten 2 Jahre) | |
| Samsung Galaxy Book3 Ultra 16, i9-13900H RTX 4070 | |
| Samsung Galaxy Book3 Ultra 16 | |
| Gigabyte AERO 16 OLED BSF | |
| MSI Stealth 17 Studio A13VH-014 | |
| Asus ProArt StudioBook 16 H7600ZW | |
| Durchschnittliche Intel Core i9-13900H (75.8 - 102.3, n=25) | |
| Dell XPS 15 9530 RTX 4070 | |
* ... kleinere Werte sind besser
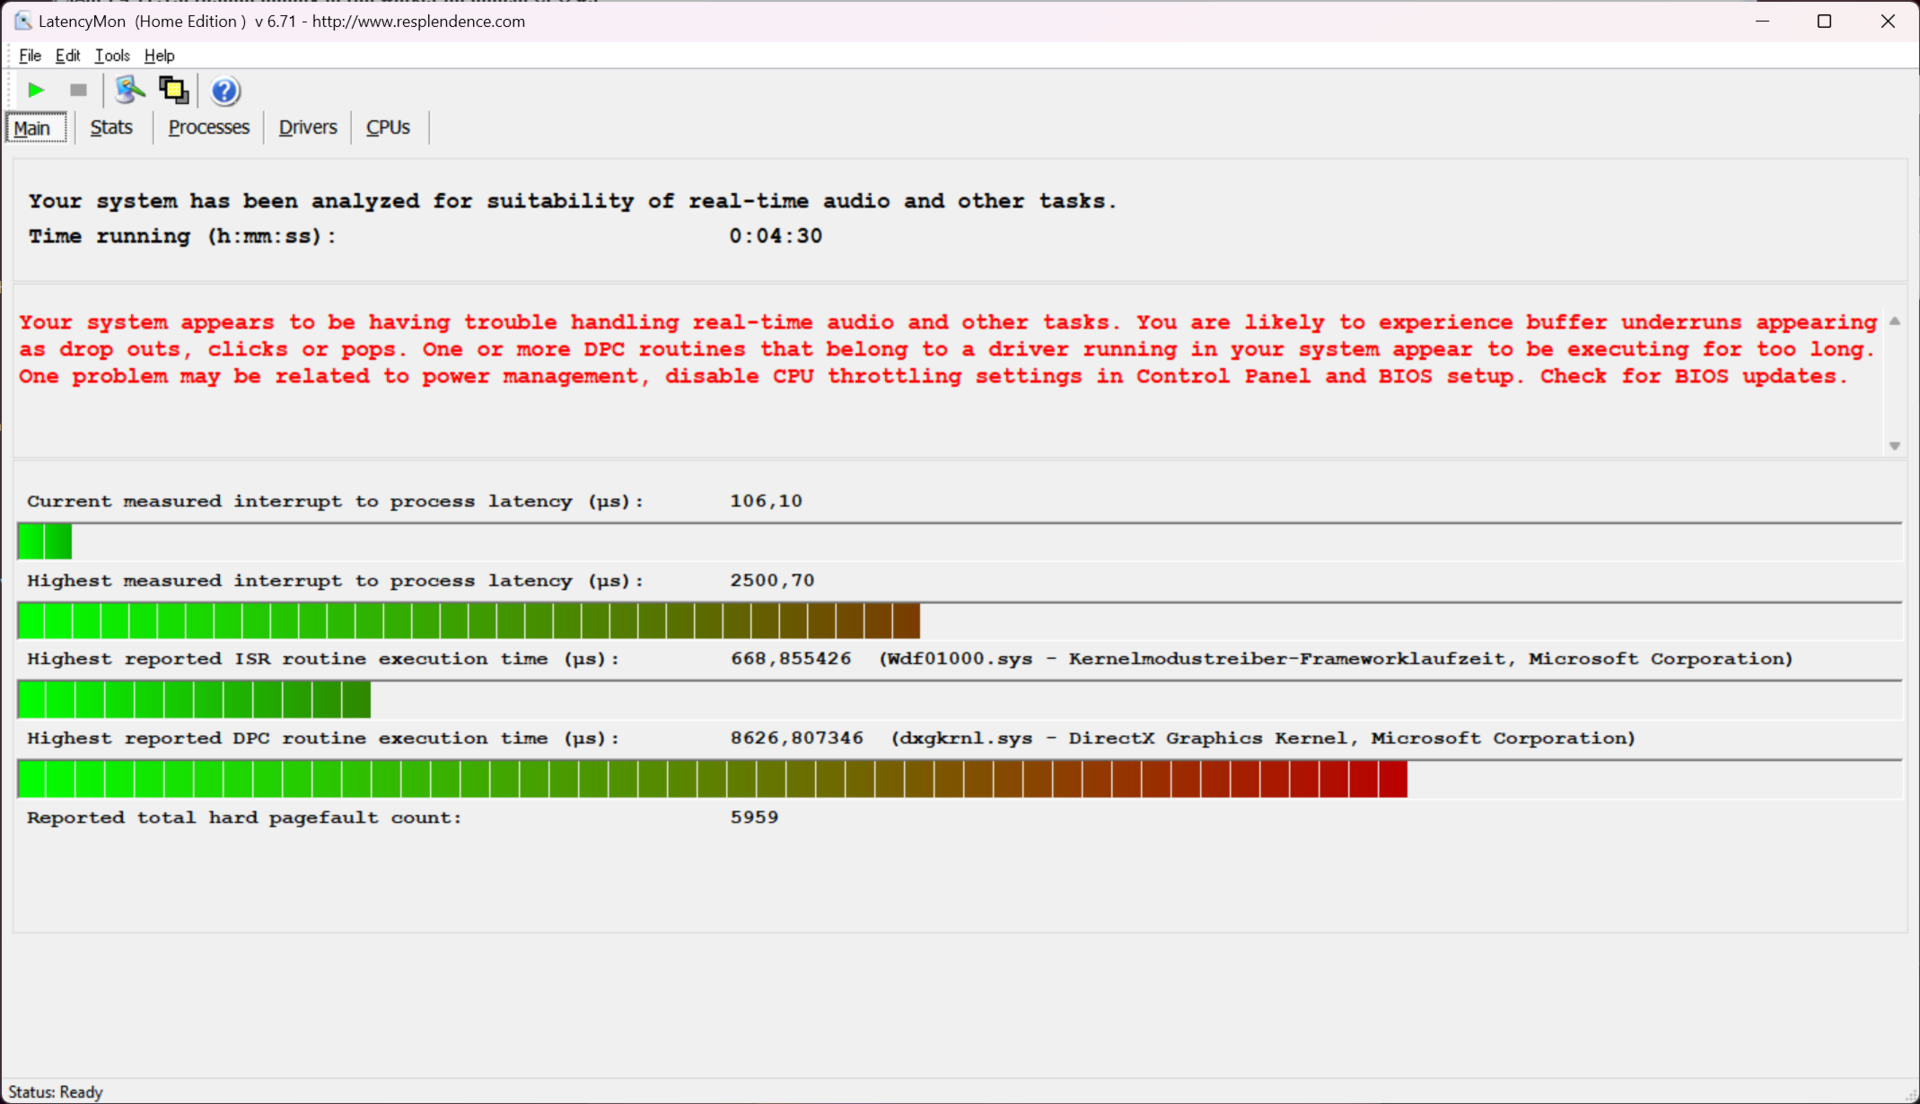
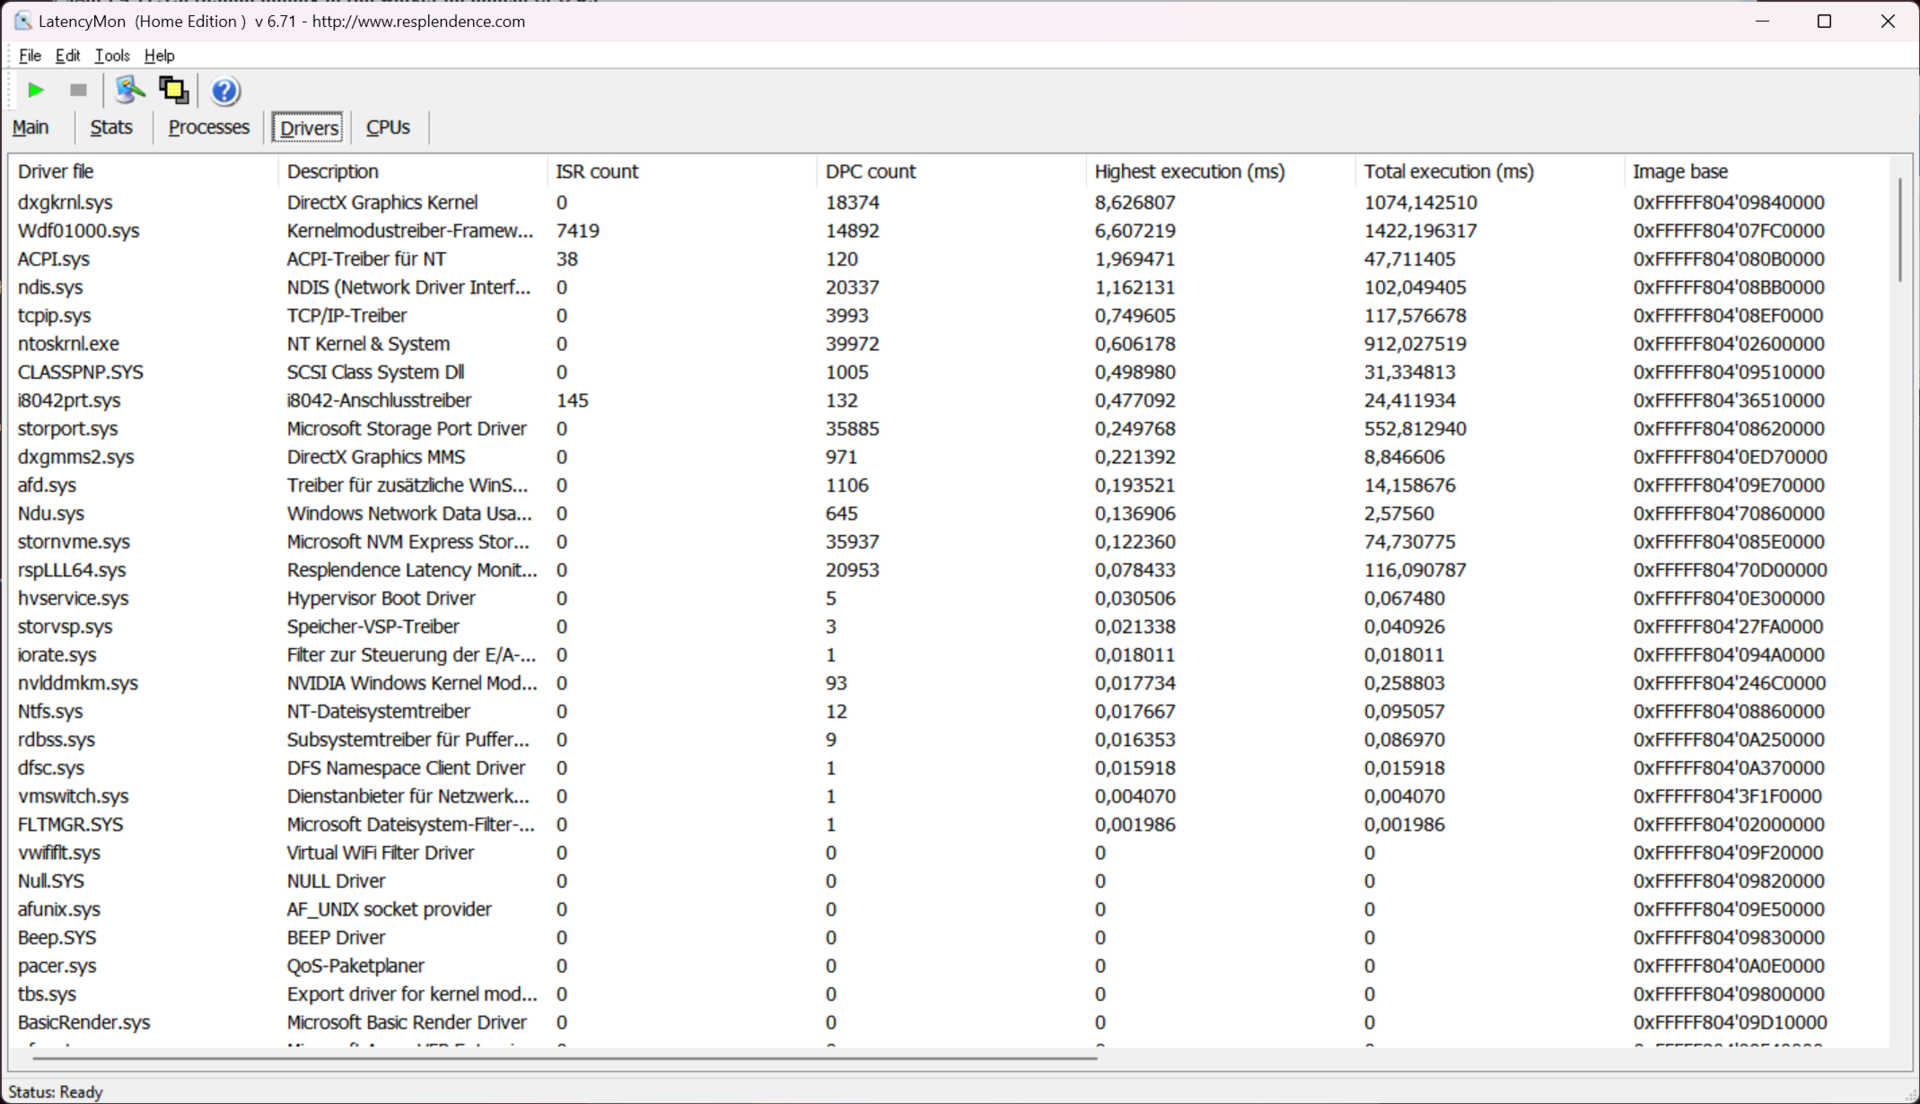
DPC-Latenzen
Die von uns mit LatencyMon gemessene Latenz deutet auf Treiberprobleme mit dem Nvidia-Studio-Grafiktreiber hin. Allerdings zeigt auch der Kernelmodustreiber-Framework messbare Verzögerungen. So ist das System für Echtzeit-Audiobearbeitung nicht geeignet. Die Anpassung der Software sowie zukünftige Aktualisierungen könnten das Verhalten stark verändern.
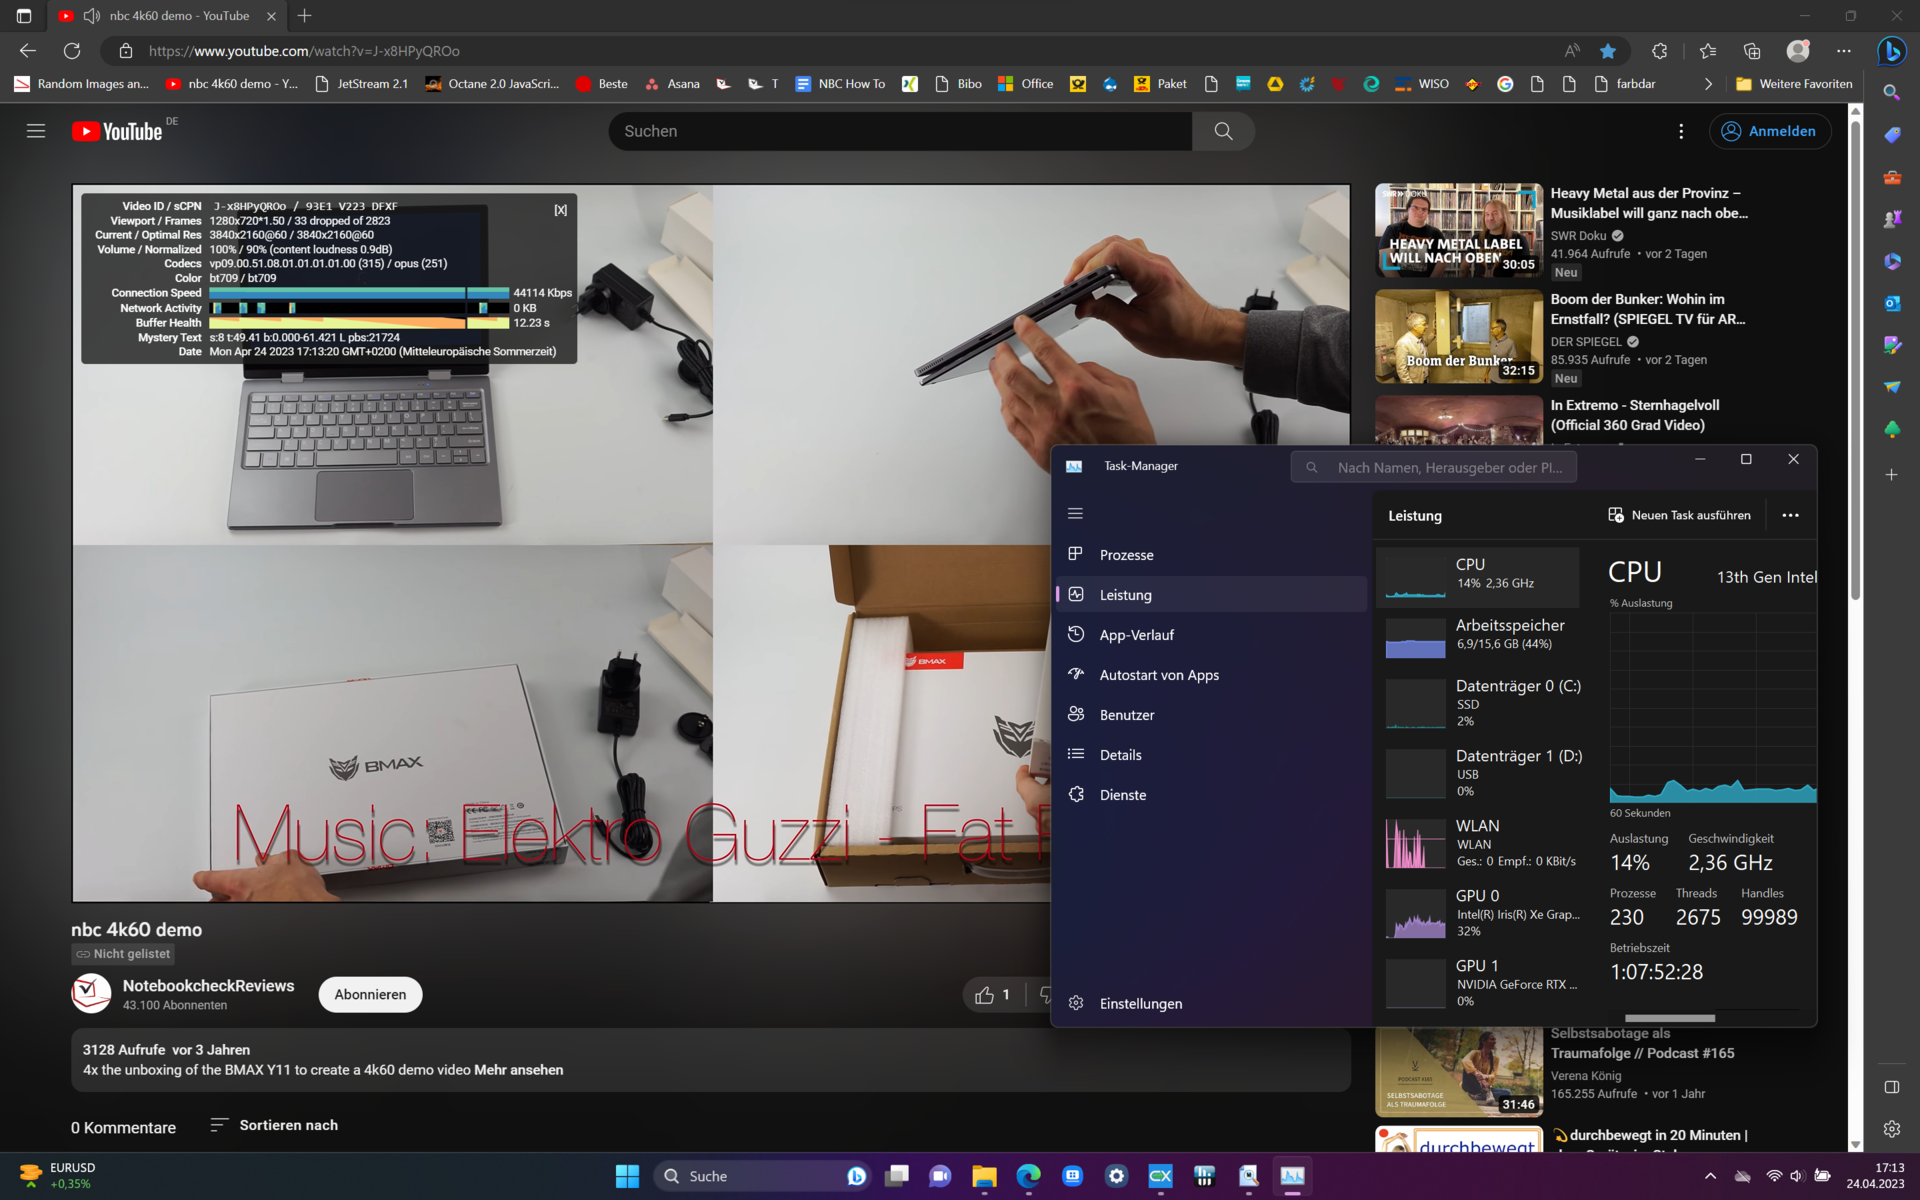
Auch bei der 4K-Videowiedergabe in Youtube sind 56 ausgelassene Zwischenbilder eher ein unterdurchschnittlicher Wert, zumal für ein Multimedia-Notebook mit dieser Ausstattung. Ein Treiberupdate dürfte in Zukunft helfen. Zum Zeitpunkt der Messung war der aktuelle Grafikkartentreiber Nvidia Studio 531.61 installiert.
| DPC Latencies / LatencyMon - interrupt to process latency (max), Web, Youtube, Prime95 | |
| Samsung Galaxy Book3 Ultra 16 | |
| MSI Stealth 17 Studio A13VH-014 | |
| Samsung Galaxy Book3 Ultra 16, i9-13900H RTX 4070 | |
| Asus ProArt StudioBook 16 H7600ZW | |
| Dell XPS 15 9530 RTX 4070 | |
| Gigabyte AERO 16 OLED BSF | |
* ... kleinere Werte sind besser
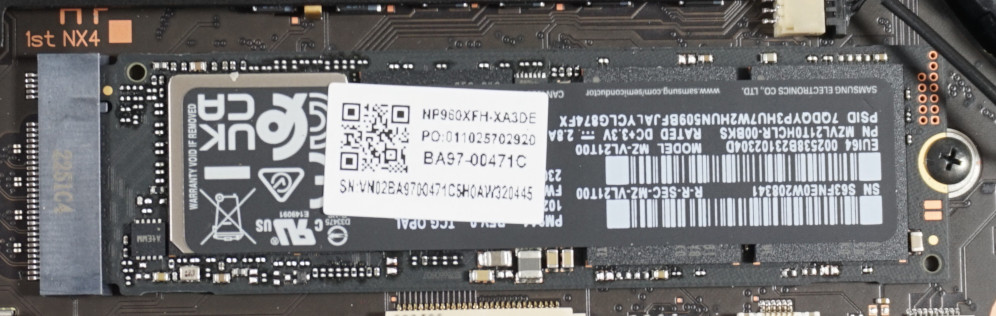
Massenspeicher
Keine Überraschungen hält die M.2-SSD bereit. Wenig überraschend handelt es sich um ein Modell von Samsung, das in unseren Messungen regelmäßig die hier festgestellten Werte erreicht. Die maximale Geschwindigkeit liegt oberhalb der Möglichkeiten von PCIe 3, aber kann mit den besten SSDs mit PCIe 4 nicht mithalten.
Für die Aufgaben, die das Galaxy Book3 Ultra zu bewältigen hat, sollte die SSD zu keiner Zeit ein bremsendes Element sein. Zudem verbleiben die Zugriffsgeschwindigkeit bei dauerhafter Belastung auf hohem Niveau - ganz im Gegenteil zum identischen Speicher im Asus ProArt StudioBook 16, das die Datenrate bei Erwärmung stark beschränken muss.
Allenfalls der Platz könnte bei Bearbeitung von viel Rohmaterial schnell knapp werden. Wäre die Bodenplatte nicht so schwer abzunehmen, ließe sich unkompliziert nachrüsten. Glücklicherweise können die beiden Thunderbolt-4-Anschlüsse für externe SSDs bestens genutzt werden.

* ... kleinere Werte sind besser
Dauerleistung Lesen: DiskSpd Read Loop, Queue Depth 8
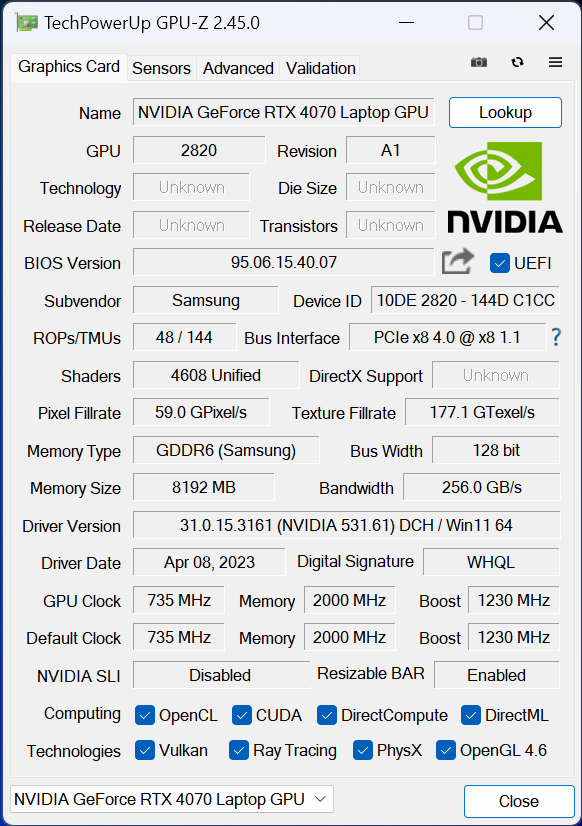
Grafikkarte
Die Nvidia GeForce RTX 4070 ist im Normalfall über jeden Zweifel erhaben. Sie bewältigt aktuelle Spiele auf höchster Detailstufe und jenseits von Full-HD. Dabei bleibt sie regelmäßig bei annähernd 100 Fps. In einem Medion Erazer Major X20 zum Beispiel darf sie für diese Leistungswerte 115 W verbrauchen, inklusive Boost sogar 140 W.
Im Creator-Laptop von Samsung hingegen sind es 35 W und mit Boost, der dann der CPU fehlt, 60 W. Wie die Messdaten aus Witcher 3 zeigen, werden diese 60 Watt bei hohen Anforderungen komplett ausgeschöpft, während die CPU mit weniger als 15 W Verbrauch fast schon unterbeschäftigt wirkt. Die Einstellungen der Grafikkarten sind nicht auf die dauerhaften Belastungen auf höchsten Niveau ausgelegt.
Dagegen liegen die Resultate des Galaxy Book Ultra bei Blender nicht weit weg vom Durchschnittswert der RTX 4070. Die eigentliche Hauptaufgabe, die Erstellung und Bearbeitung von grafischen Inhalten, erledigt das Notebook auf hohem Niveau.
Weitere Messwerte, Fps und Daten finden sich in unserer GPU-Benchmarkliste.
| 3DMark 11 Performance | 25500 Punkte | |
| 3DMark Cloud Gate Standard Score | 34191 Punkte | |
| 3DMark Fire Strike Score | 18076 Punkte | |
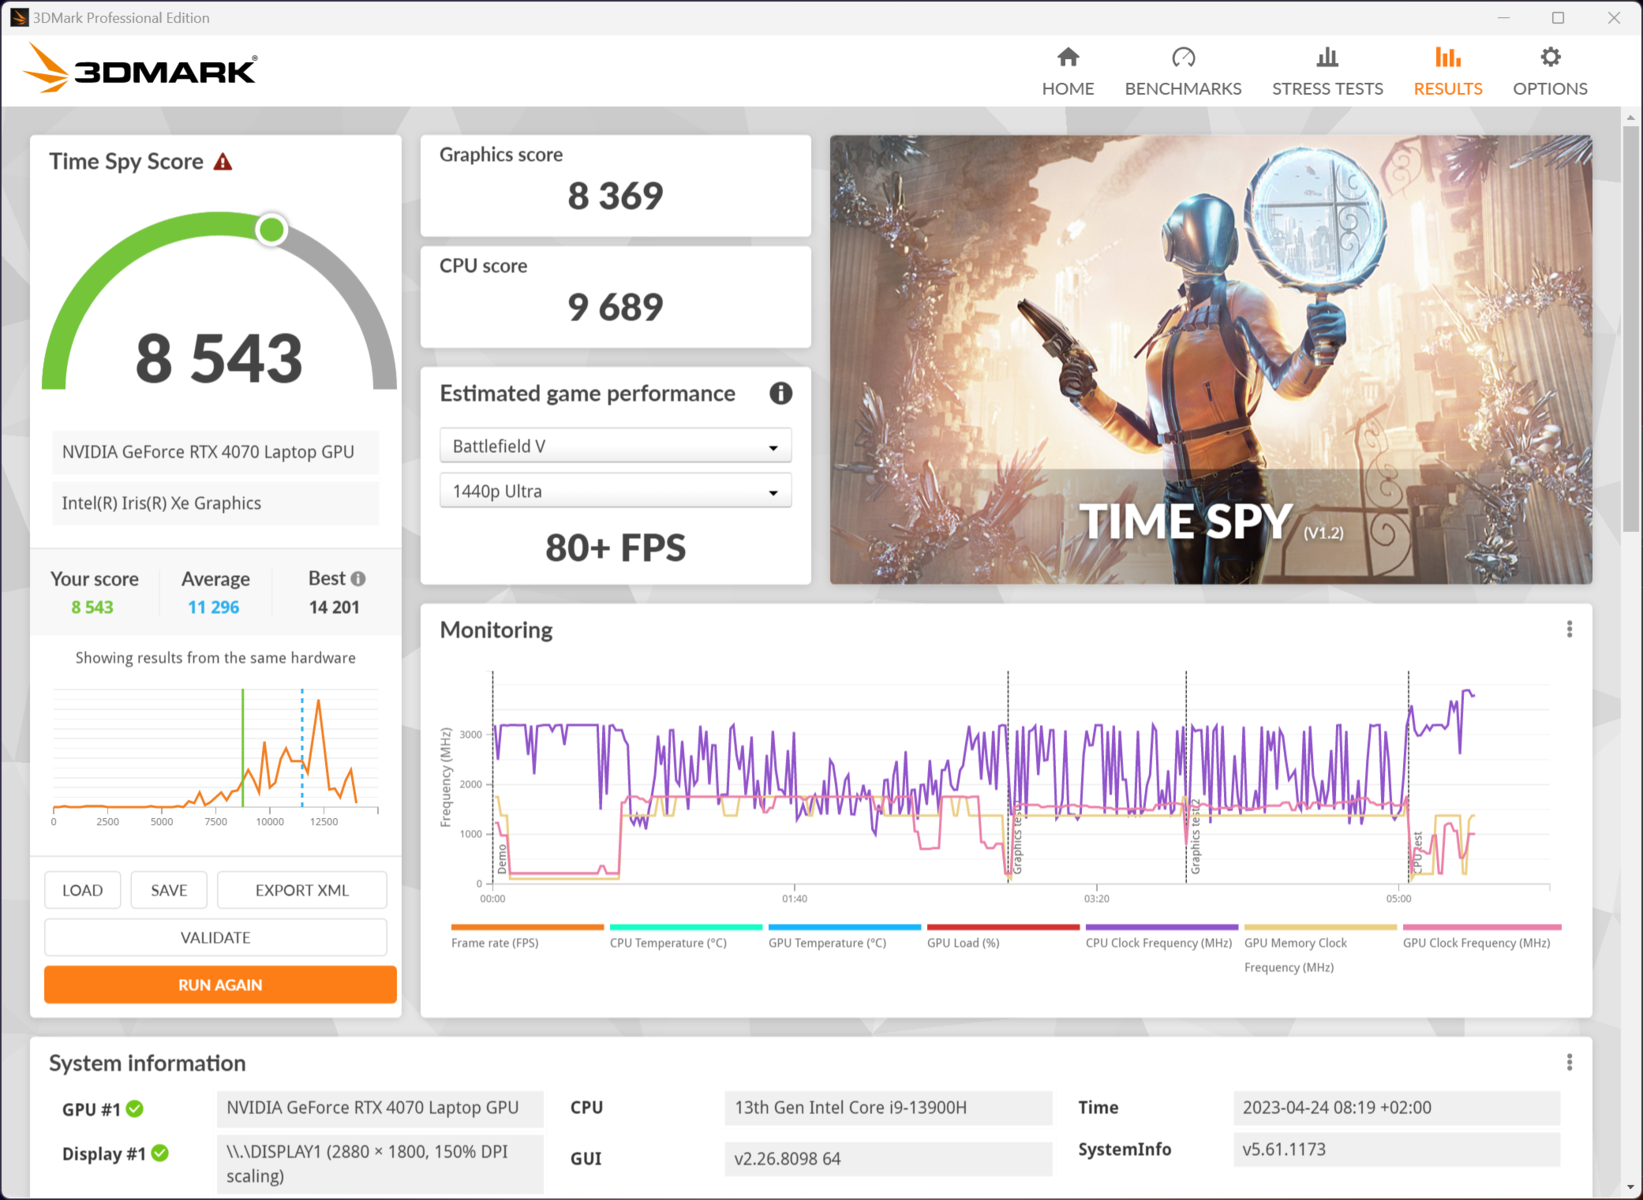
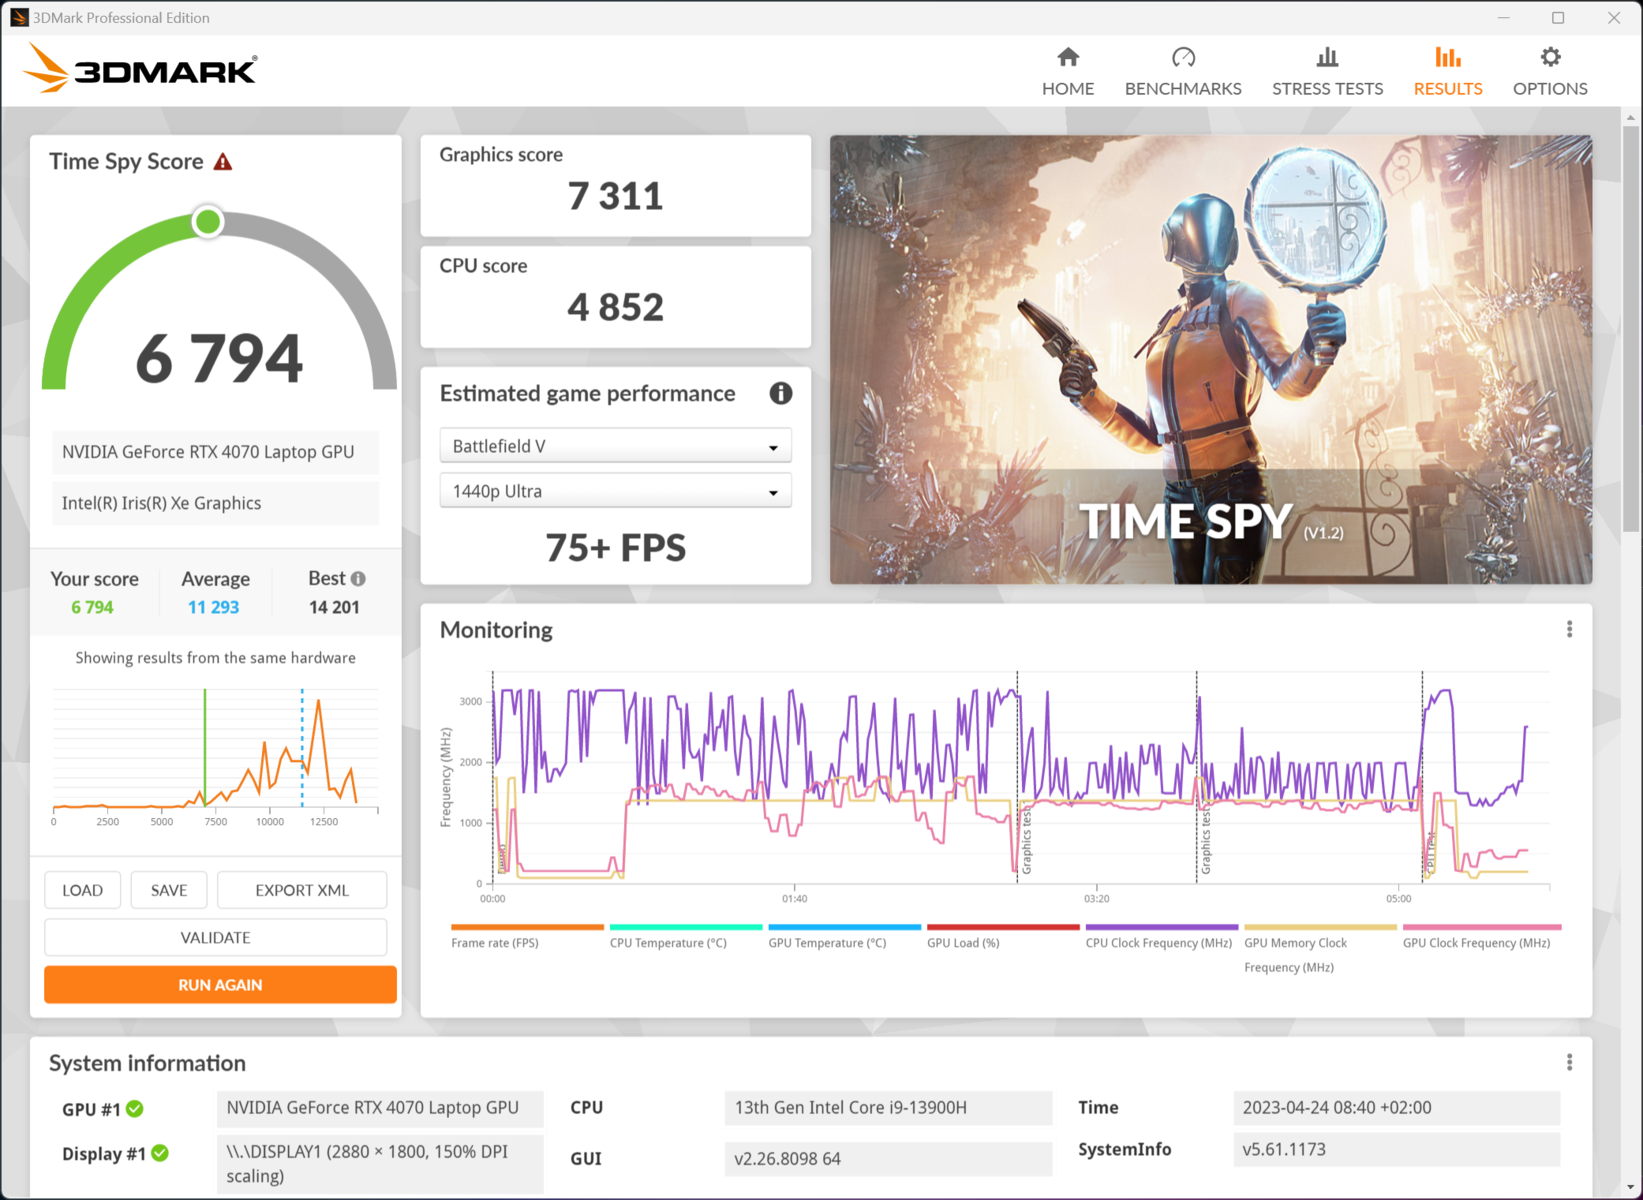
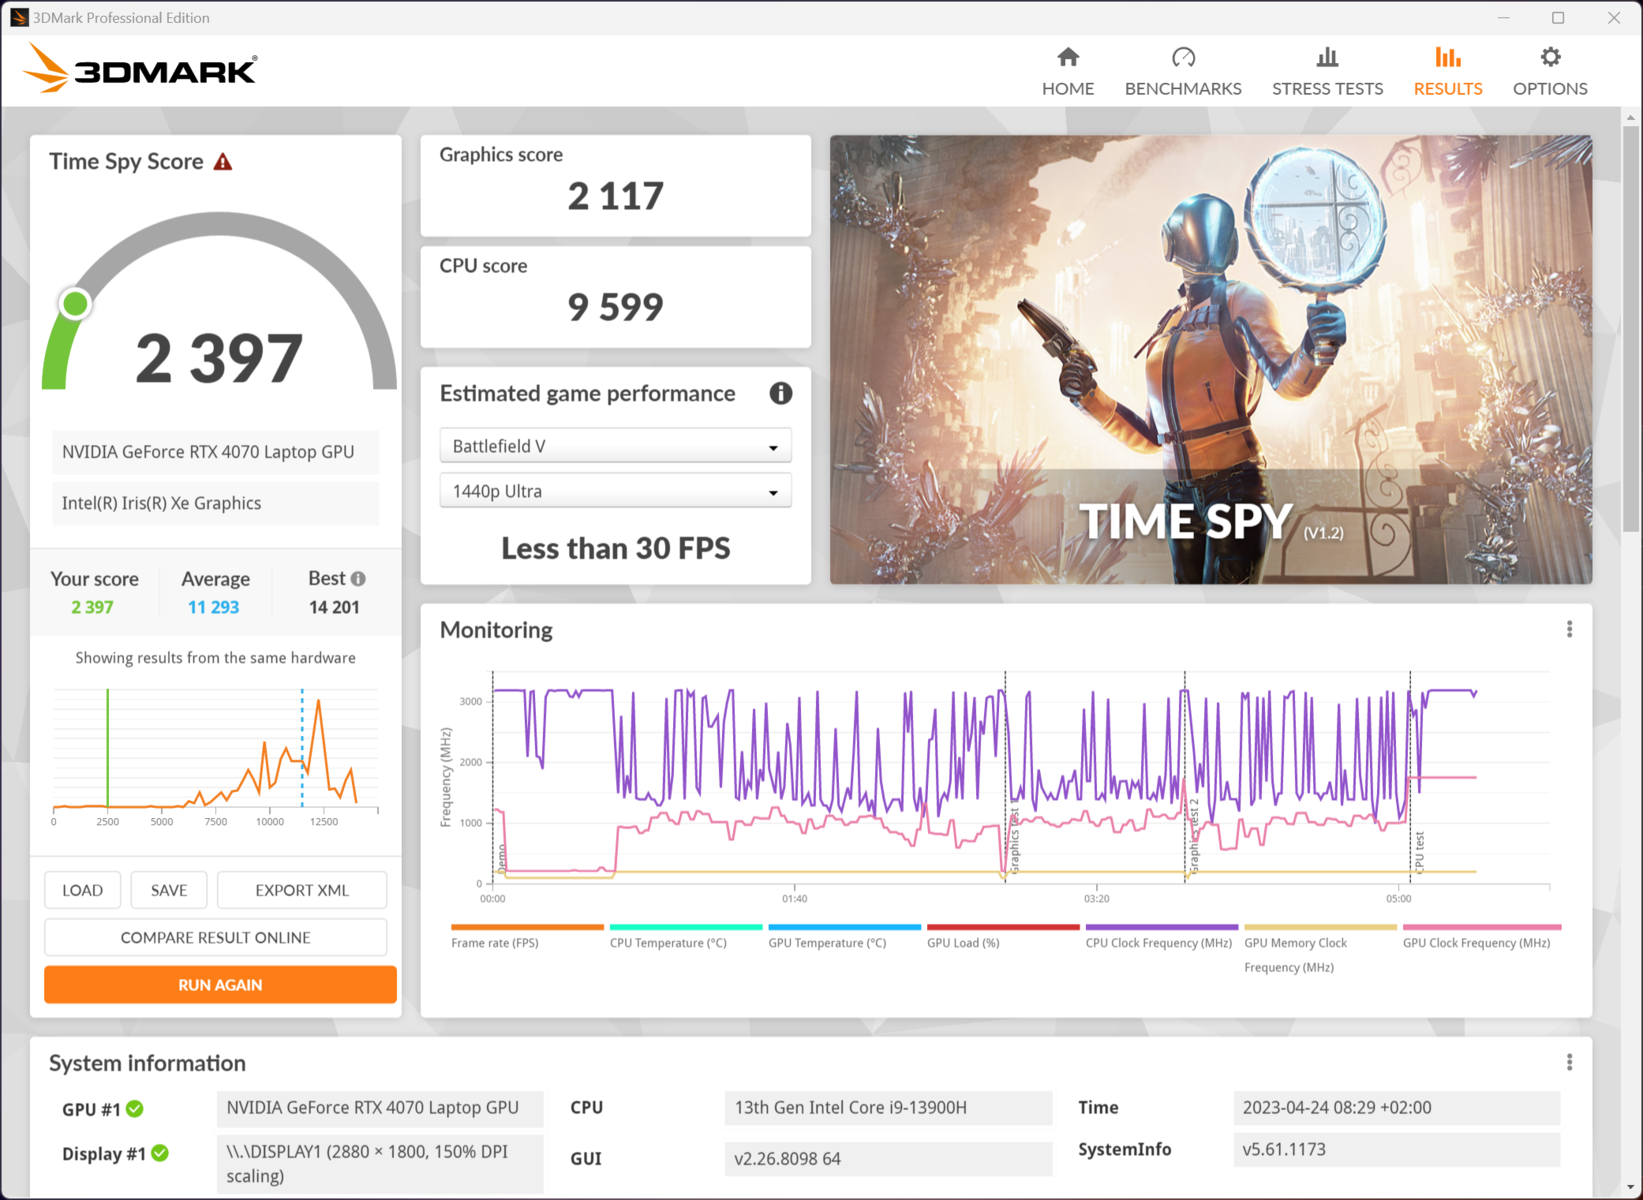
| 3DMark Time Spy Score | 8692 Punkte | |
Hilfe | ||
* ... kleinere Werte sind besser
Gaming Performance

Keineswegs die Kernkompetenz des Galaxy Book ist das Spielen. Regelmäßig stößt die RTX 4070 an ihre Grenzen, weil sie im dünnen Creator-Notebook nicht viel Wärme abgeben kann und zudem auf 60 W Stromaufnahme begrenzt ist. Mit anderen Laptops, die ähnlich ausgestattet sind, kann der Vergleich nicht gelingen. Dafür liegt allerdings auch der Stromverbrauch regelmäßig bei unter 100 W, selbst unter Last. In einem Gaming-Notebook wie dem Medion Erazer Major X20 sind es 200 bis 300 W.
Nicht viel weniger verbraucht bei maximaler Leistung ein HP Victus 16 mit einer Nvidia GeForce RTX 3060. Mit diesem liegt Samsungs Kreativ-Rechner beim Gaming ungefähr auf Augenhöhe. Erreicht werden die Werte jedoch in einem wesentlich dünneren Gehäuse mit der Hälfte der Strommenge. Das erlaubt mit einigen Abstrichen das Spielen aktueller Spiele, aber hierfür ist der Kreativ-Laptop aufgrund mangelnder Kühlung und begrenzter Stromaufnahme schlicht nicht ausgelegt.
Stabil zeigt sich die dauerhafte Protokollierung der Bildraten in Witcher 3. Immerhin 77 Bilder im Durchschnitt sind ein respektabler Wert. Viel wichtiger aber ist das gleichbleibende Niveau, welches für die ausreichende Kühlung der Komponenten spricht. Umfangreichere Rechenaufgaben kann das Notebook von Samsung auf stabilem Niveau abarbeiten.
Witcher 3 FPS-Diagramm
| min. | mittel | hoch | max. | QHD | |
|---|---|---|---|---|---|
| GTA V (2015) | 150.1 | 74.7 | 64.5 | ||
| The Witcher 3 (2015) | 161 | 71 | |||
| Dota 2 Reborn (2015) | 99.7 | 97.4 | |||
| Final Fantasy XV Benchmark (2018) | 82 | 60.2 | |||
| X-Plane 11.11 (2018) | 72.2 | ||||
| Far Cry 5 (2018) | 98 | 92 | 79 | ||
| Strange Brigade (2018) | 173.9 | 148.7 | 106.2 | ||
| Cyberpunk 2077 1.6 (2022) | 71 | 65 | 42 | ||
| F1 22 (2022) | 109 | 54 | 36 | ||
| Hogwarts Legacy (2023) | 57 | 41 | 35 |
Emissionen - Leises, heißes Creator-Notebook
Geräuschemissionen
Solang die Hardware nicht übermäßig gefordert wird, bleibt das Galaxy Book3 Ultra komplett stumm. Bei höherer Wärmeentwicklung setzt ein moderates Lüftergeräusch ein, das mit unter 40 dB in einem sehr erträglichen Bereich bleibt.
Nur bei maximaler Beanspruchung ist die Lüftung tatsächlich laut. Über 50 dB sind kein Wert, bei dem man noch voll konzentriert arbeiten möchte. Das lässt sich mit dem Modus "Leise" ändern. Zwar sinkt auch die Systemleistung spürbar, aber wir messen durchschnittlich 8 dB weniger, was annähernd der halben Lautstärke entspricht.
Größere Lüfter und eine etwas voluminösere Kühlung hätte die Ergebnisse wesentlich verbessern können, aber das Notebook natürlich insgesamt größer gemacht. Das MSI Stealth 17 Studio zum Beispiel mit deutlich höheren Leistungswerten zeigt das eindrucksvoll. Ist jedoch schwerer und deutlich dicker.
Lautstärkediagramm
| Idle |
| 25.2 / 25.2 / 31.3 dB(A) |
| Last |
| 38.8 / 51.2 dB(A) |
 | ||
30 dB leise 40 dB(A) deutlich hörbar 50 dB(A) störend |
||
min: | ||
| Samsung Galaxy Book3 Ultra 16, i9-13900H RTX 4070 GeForce RTX 4070 Laptop GPU, i9-13900H, Samsung PM9A1 MZVL21T0HCLR | Dell XPS 15 9530 RTX 4070 GeForce RTX 4070 Laptop GPU, i7-13700H, SK hynix PC801 HFS001TEJ9X101N | MSI Stealth 17 Studio A13VH-014 GeForce RTX 4080 Laptop GPU, i9-13900H, Samsung PM9A1 MZVL22T0HBLB | Asus ProArt StudioBook 16 H7600ZW GeForce RTX 3070 Ti Laptop GPU, i9-12900H, Samsung PM9A1 MZVL21T0HCLR | Gigabyte AERO 16 OLED BSF GeForce RTX 4070 Laptop GPU, i9-13900H, Gigabyte AG470S1TB-SI B10 | Samsung Galaxy Book3 Ultra 16 GeForce RTX 4050 Laptop GPU, i7-13700H, Samsung PM9A1 MZVL2512HCJQ | |
|---|---|---|---|---|---|---|
| Geräuschentwicklung | 15% | 9% | 19% | -4% | 3% | |
| aus / Umgebung * (dB) | 25.2 | 23.1 8% | 24 5% | 19.55 22% | 23 9% | 25 1% |
| Idle min * (dB) | 25.2 | 23.1 8% | 24 5% | 20.07 20% | 23 9% | 26 -3% |
| Idle avg * (dB) | 25.2 | 23.1 8% | 24 5% | 20.07 20% | 23 9% | 27 -7% |
| Idle max * (dB) | 31.3 | 24.2 23% | 24 23% | 20.07 36% | 33.64 -7% | 28 11% |
| Last avg * (dB) | 38.8 | 27.1 30% | 34.49 11% | 34.53 11% | 51.49 -33% | 40 -3% |
| Last max * (dB) | 51.2 | 44.6 13% | 49.66 3% | 49.21 4% | 55.24 -8% | 41 20% |
| Witcher 3 ultra * (dB) | 40.1 | 48.29 | 49.1 | 55.27 | 39 |
* ... kleinere Werte sind besser
Temperatur
Warm wird das Galaxy Book3 zu fast jeder Gelegenheit. Schon ein wenig surfen reicht aus, um zumindest die Unterseite so weit zu erwärmen, dass eine Lagerung auf den Beinen unangenehm wird.
Ist die gesamte Leistung gefragt, wird die Tastatur sehr warm. Am Boden messen wir noch höhere Temperaturen, sodass zum Beispiel ein Laptop-Ständer empfehlenswert erscheint, wenn größere Videodateien gerendert werden und das Notebook trotzdem noch bedienbar bleiben soll.
(-) Die maximale Temperatur auf der Oberseite ist 45.9 °C. Im Vergleich liegt der Klassendurchschnitt bei 36.9 °C (von 21.1 bis 71 °C für die Klasse Multimedia).
(-) Auf der Unterseite messen wir eine maximalen Wert von 50.9 °C (im Vergleich zum Durchschnitt von 39.1 °C).
(+) Ohne Last messen wir eine durchschnittliche Temperatur von 29.7 °C auf der Oberseite. Der Klassendurchschnitt erreicht 31.3 °C.
(-) Beim längeren Spielen von The Witcher 3 erhitzt sich das Gerät durchschnittlich auf 39.2 °C. Der Durchschnitt der Klasse ist derzeit 31.3 °C.
(±) Die Handballen und der Touchpad-Bereich können sehr heiß werden mit maximal 37.2 °C.
(-) Die durchschnittliche Handballen-Temperatur anderer getesteter Geräte war 28.7 °C (-8.5 °C).
| Samsung Galaxy Book3 Ultra 16, i9-13900H RTX 4070 Intel Core i9-13900H, NVIDIA GeForce RTX 4070 Laptop GPU | Dell XPS 15 9530 RTX 4070 Intel Core i7-13700H, NVIDIA GeForce RTX 4070 Laptop GPU | Gigabyte AERO 16 OLED BSF Intel Core i9-13900H, NVIDIA GeForce RTX 4070 Laptop GPU | MSI Stealth 17 Studio A13VH-014 Intel Core i9-13900H, NVIDIA GeForce RTX 4080 Laptop GPU | Samsung Galaxy Book3 Ultra 16 Intel Core i7-13700H, NVIDIA GeForce RTX 4050 Laptop GPU | Asus ProArt StudioBook 16 H7600ZW Intel Core i9-12900H, NVIDIA GeForce RTX 3070 Ti Laptop GPU | |
|---|---|---|---|---|---|---|
| Hitze | 3% | 20% | 1% | 19% | 11% | |
| Last oben max * (°C) | 45.9 | 45.6 1% | 41 11% | 47 -2% | 41 11% | 41.6 9% |
| Last unten max * (°C) | 50.9 | 42 17% | 47 8% | 54 -6% | 44 14% | 41.4 19% |
| Idle oben max * (°C) | 31.6 | 34.4 -9% | 23 27% | 30 5% | 23 27% | 31.8 -1% |
| Idle unten max * (°C) | 34.2 | 33.2 3% | 23 33% | 32 6% | 26 24% | 29.2 15% |
* ... kleinere Werte sind besser
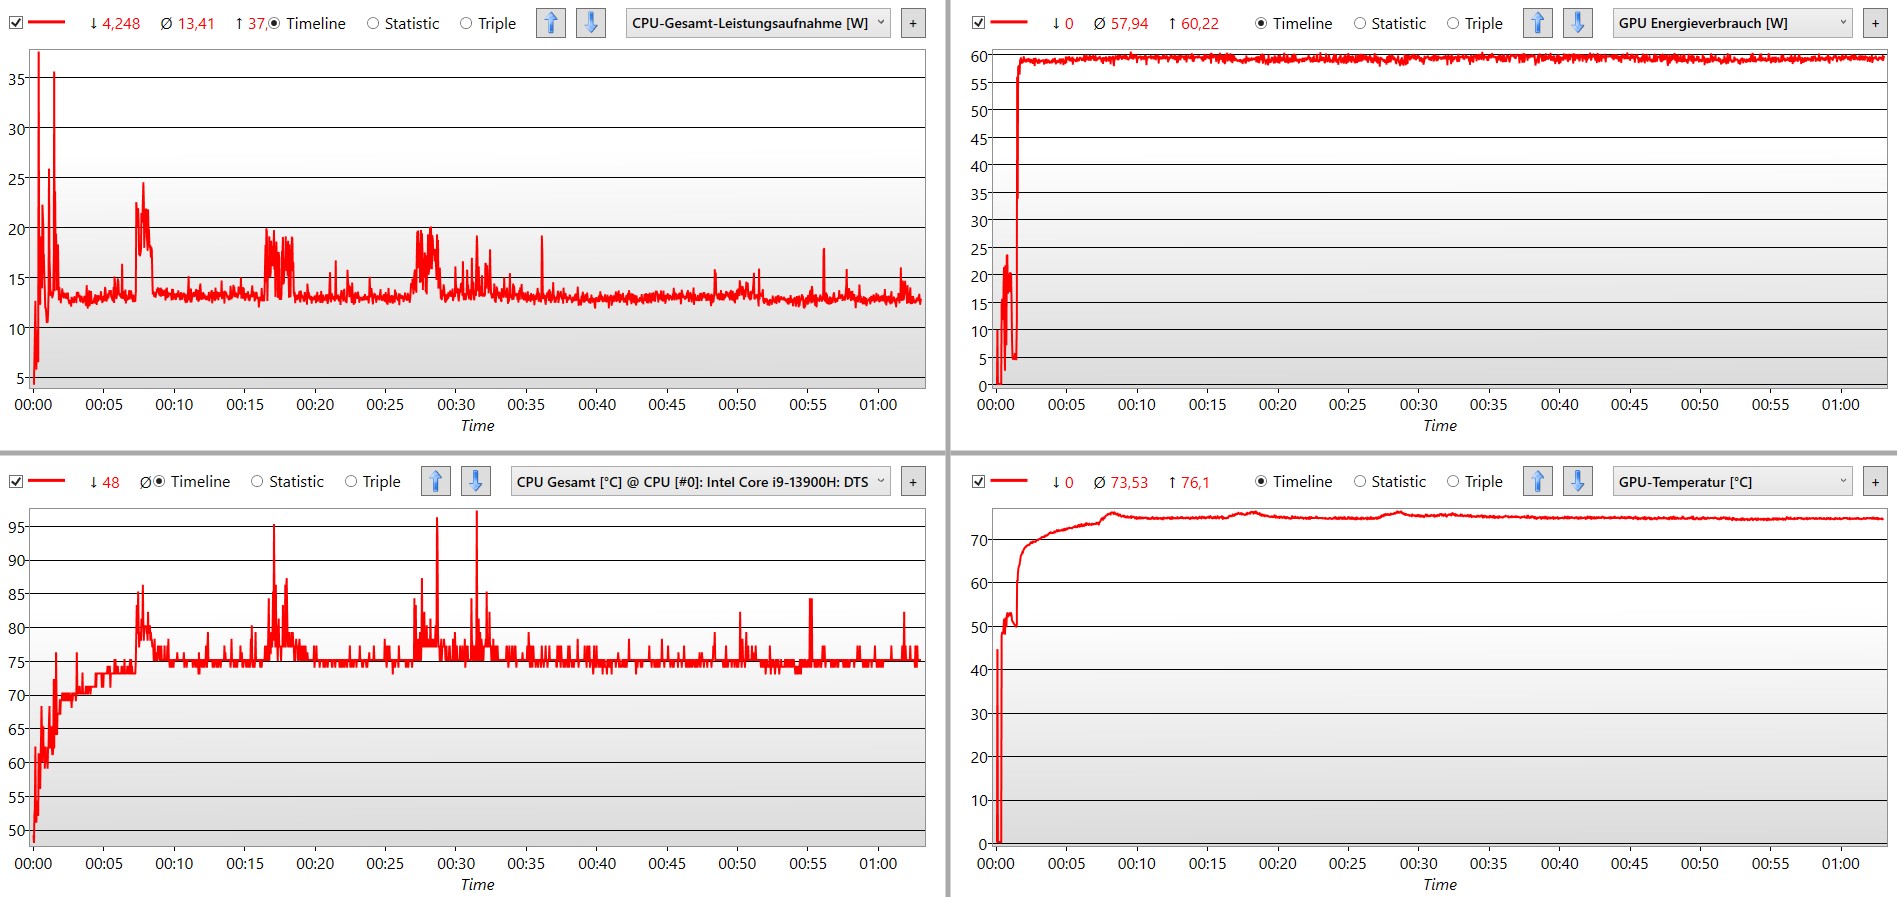
Stresstest
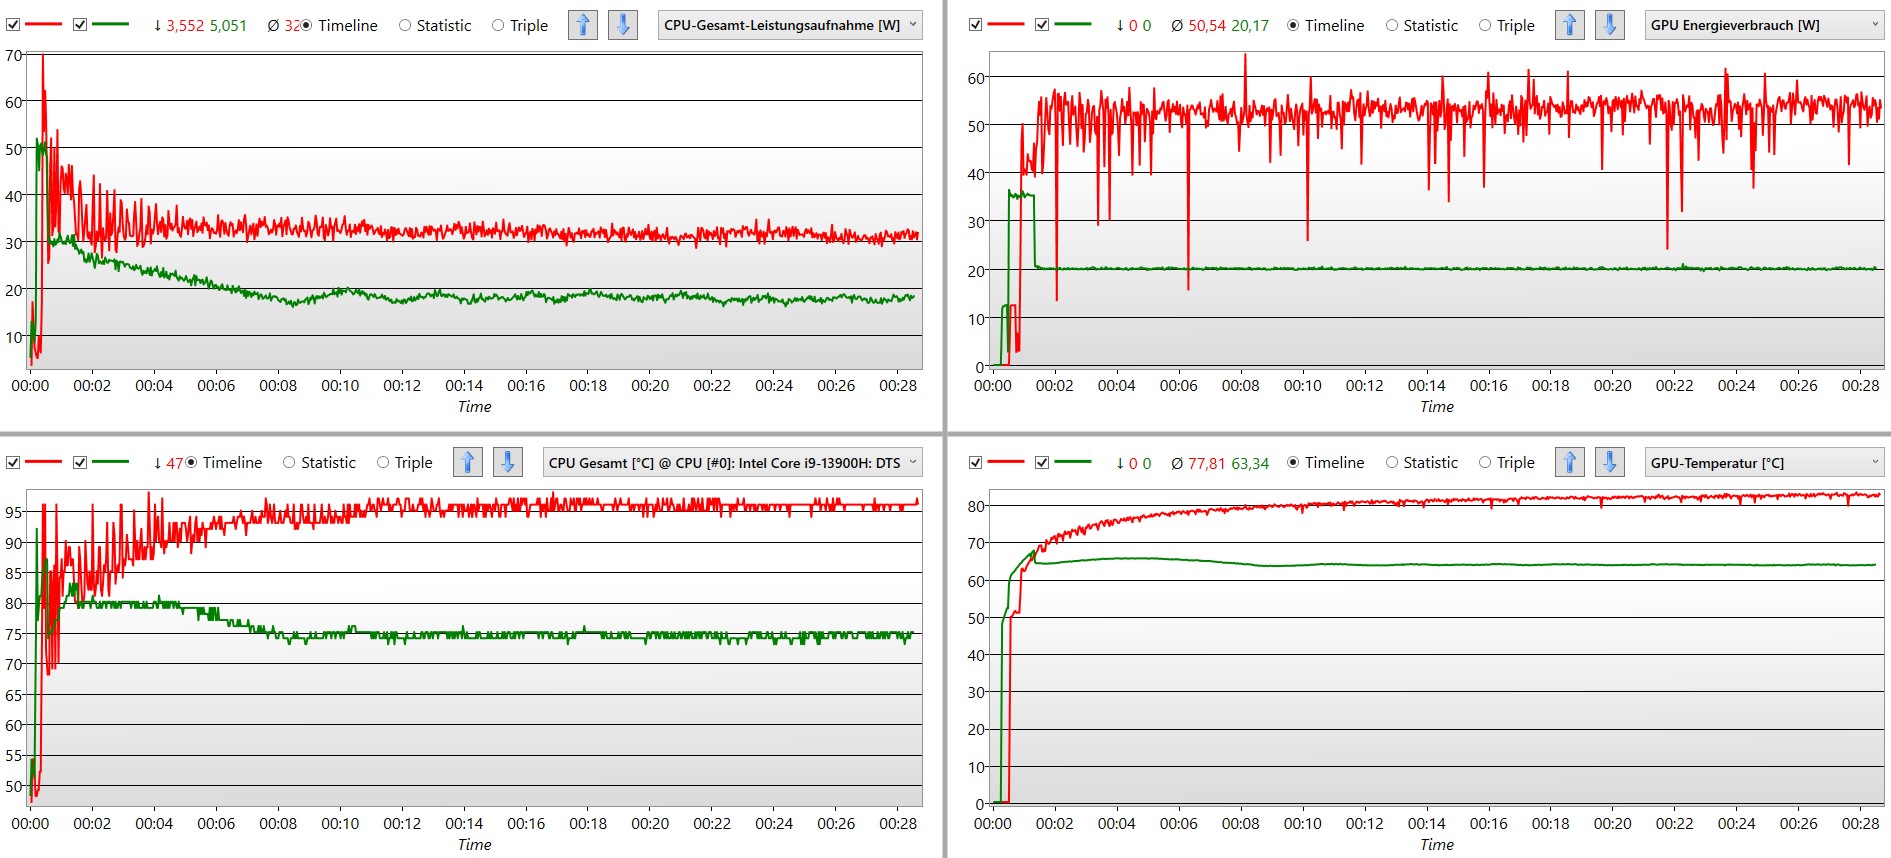
Bei höchster Beanspruchung werden dem Prozessor auf Dauer noch knapp 30 W zugestanden. Die Grafikkarte hingegen bleibt relativ stabil auf hohem Niveau bei knapp 50 W. Dass das Galaxy Book3 Ultra derart warm wird, zeigt sich gleichzeitig an den Temperaturkurven von CPU und GPU. Die bleiben zwar nach etwa 10 Min. fast gerade, liegen aber bei stolzen 95 beziehungsweise 80 °C. Zusammen mit der klein dimensionierten Kühlung ergibt sich daraus ein sehr warmes Gehäuse. Dennoch gelingt es dem Laptop, die vom Netzteil erlaubten 100 W auf Dauer zu nutzen.
Deutliche Änderungen lassen sich im Modus "Leise" beobachten. Nicht nur die Geräuschemissionen sinken dann stark. Die Stromaufnahme von CPU und GPU sinkt von 90 auf ungefähr 40 W. Auch die Temperaturen der Komponenten bleiben auf einem wesentlich erträglicheren Niveau. Zwar gibt es erhebliche Leistungseinbußen, vor allem bei der Grafikleistung, aber für dauerhaft ruhiges Arbeiten trotz erhöhtem Rechenbedarf scheint der Modus gut eingestellt zu sein.
Lautsprecher
Die Stereo-Lautsprecher von AKG können mit den Erwartungen, die die Marke zu Recht schürt, nur teilweise mithalten. Kernige Bässe und detaillierte Mitten mit hoher Klangqualität lassen Musik von Rock bis Elektro gut klingen. Die unteren Mitten könnten aber wie bei vielen Modellen etwas mehr Kraft vertragen. Insgesamt geht die Mischung vor allem für Videostreaming absolut in Ordnung.
Leider konnten wir ein starkes Übersteuern bei den Höhen feststellen, welches auch im Frequenzdiagramm deutlich zu sehen ist. Die "Königin der Nacht" will man auf dem Samsung Galaxy Book3 Ultra lieber nicht hören.
Samsung Galaxy Book3 Ultra 16, i9-13900H RTX 4070 Audio Analyse
(+) | Die Lautsprecher können relativ laut spielen (85.7 dB)
Bass 100 - 315 Hz
(-) | kaum Bass - 15.8% niedriger als der Median
(-) | keine lineare Bass-Wiedergabe (16.6% Delta zum Vorgänger)
Mitteltöne 400 - 2000 Hz
(+) | ausgeglichene Mitten, vom Median nur 2.9% abweichend
(+) | lineare Mitten (3.8% Delta zum Vorgänger)
Hochtöne 2 - 16 kHz
(+) | ausgeglichene Hochtöne, vom Median nur 4.7% abweichend
(±) | durchschnittlich lineare Hochtöne (9.5% Delta zum Vorgänger)
Gesamt im hörbaren Bereich 100 - 16.000 Hz
(+) | hörbarer Bereich ist sehr linear (13.8% Abstand zum Median
Im Vergleich zu allen Geräten derselben Klasse
» 29% aller getesteten Geräte dieser Klasse waren besser, 4% vergleichbar, 67% schlechter
» Das beste Gerät hat einen Delta-Wert von 5%, durchschnittlich ist 17%, das schlechteste Gerät hat 45%
Im Vergleich zu allen Geräten im Test
» 15% aller getesteten Geräte waren besser, 4% vergleichbar, 81% schlechter
» Das beste Gerät hat einen Delta-Wert von 4%, durchschnittlich ist 24%, das schlechteste Gerät hat 134%
Apple MacBook Pro 16 2021 M1 Pro Audio Analyse
(+) | Die Lautsprecher können relativ laut spielen (84.7 dB)
Bass 100 - 315 Hz
(+) | guter Bass - nur 3.8% Abweichung vom Median
(+) | lineare Bass-Wiedergabe (5.2% Delta zum Vorgänger)
Mitteltöne 400 - 2000 Hz
(+) | ausgeglichene Mitten, vom Median nur 1.3% abweichend
(+) | lineare Mitten (2.1% Delta zum Vorgänger)
Hochtöne 2 - 16 kHz
(+) | ausgeglichene Hochtöne, vom Median nur 1.9% abweichend
(+) | sehr lineare Hochtöne (2.7% Delta zum Vorgänger)
Gesamt im hörbaren Bereich 100 - 16.000 Hz
(+) | hörbarer Bereich ist sehr linear (4.6% Abstand zum Median
Im Vergleich zu allen Geräten derselben Klasse
» 0% aller getesteten Geräte dieser Klasse waren besser, 0% vergleichbar, 100% schlechter
» Das beste Gerät hat einen Delta-Wert von 5%, durchschnittlich ist 17%, das schlechteste Gerät hat 45%
Im Vergleich zu allen Geräten im Test
» 0% aller getesteten Geräte waren besser, 0% vergleichbar, 100% schlechter
» Das beste Gerät hat einen Delta-Wert von 4%, durchschnittlich ist 24%, das schlechteste Gerät hat 134%
Energieverwaltung - Creator-Notebook mit starker Ausdauer
Energieaufnahme
Extrem sparsam gibt sich das Galaxy Book bei geringer Beanspruchung. Trotz des großen und relativ hellen Displays bleibt der Stromverbrauch bei einfachen Aufgaben größtenteils unterhalb von 10 W. Viele Konkurrenten mit derart leistungsstarker Hardware kommen auf das Doppelte.
Unter Last wird die maximal mögliche Leistung des Netzteils, das via USB-C die erlaubten 100 W liefert, vollständig ausgenutzt. Wie unsere Messungen im Stresstest zeigen, kann der Laptop diesen Strom auf Dauer aufnehmen und umsetzen. So dürfte das Laden des Akkus bei derartigen Belastungen kaum realisierbar sein. Zumindest ein Entladen des Akkus konnten wir im Stresstest nicht feststellen.
| Aus / Standby | |
| Idle | |
| Last |
|
Legende:
min: | |
| Samsung Galaxy Book3 Ultra 16, i9-13900H RTX 4070 i9-13900H, GeForce RTX 4070 Laptop GPU, Samsung PM9A1 MZVL21T0HCLR, OLED / AMOLED, 2880x1800, 16" | Dell XPS 15 9530 RTX 4070 i7-13700H, GeForce RTX 4070 Laptop GPU, SK hynix PC801 HFS001TEJ9X101N, OLED, 3456x2160, 15.6" | MSI Stealth 17 Studio A13VH-014 i9-13900H, GeForce RTX 4080 Laptop GPU, Samsung PM9A1 MZVL22T0HBLB, Mini LED, 3840x2160, 17.3" | Asus ProArt StudioBook 16 H7600ZW i9-12900H, GeForce RTX 3070 Ti Laptop GPU, Samsung PM9A1 MZVL21T0HCLR, OLED, 3840x2400, 16" | Gigabyte AERO 16 OLED BSF i9-13900H, GeForce RTX 4070 Laptop GPU, Gigabyte AG470S1TB-SI B10, OLED, 3840x2400, 16" | Samsung Galaxy Book3 Ultra 16 i7-13700H, GeForce RTX 4050 Laptop GPU, Samsung PM9A1 MZVL2512HCJQ, AMOLED, 2880x1800, 16" | Durchschnittliche NVIDIA GeForce RTX 4070 Laptop GPU | Durchschnitt der Klasse Multimedia | |
|---|---|---|---|---|---|---|---|---|
| Stromverbrauch | -135% | -130% | -132% | -102% | 14% | -145% | -29% | |
| Idle min * (Watt) | 4.3 | 20 -365% | 13.9 -223% | 12.6 -193% | 11.8 -174% | 3 30% | 13.2 ? -207% | 5.96 ? -39% |
| Idle avg * (Watt) | 4.6 | 20.7 -350% | 20 -335% | 17.41 -278% | 16.1 -250% | 5 -9% | 18.2 ? -296% | 10.3 ? -124% |
| Idle max * (Watt) | 11.4 | 22.4 -96% | 20.6 -81% | 23.12 -103% | 17 -49% | 11 4% | 24.6 ? -116% | 12.3 ? -8% |
| Last avg * (Watt) | 97 | 77.1 21% | 77 21% | 117.5 -21% | 100.6 -4% | 72 26% | 97 ? -0% | 67.4 ? 31% |
| Witcher 3 ultra * (Watt) | 100.9 | 95.4 5% | 162 -61% | 172.6 -71% | 158 -57% | 69.7 31% | ||
| Last max * (Watt) | 107 | 133.4 -25% | 216 -102% | 241.36 -126% | 192 -79% | 108 -1% | 221 ? -107% | 113.2 ? -6% |
* ... kleinere Werte sind besser
Energieaufnahme Witcher 3 / Stresstest
Energieaufnahme mit externem Monitor
Akkulaufzeit
Was der geringe Stromverbrauch ohne Last schon vorwegnahm, zeigt sich überdeutlich in der Akkulaufzeit. Trotz des im Vergleich zur Konkurrenz eher kleinen 76-Wh-Akkus ergibt sich sowohl bei der Videowiedergabe in Full-HD als auch beim Surfen mit stetig wechselnden Websites eine hervorragende Ausdauer. Die schwächere Variante des Galaxy Book3 Ultra 16 kann sogar noch einige Stunden mehr bieten.
Dennoch sind 9 h beim Videotest und 8 h beim Websurfing mehr als beachtlich. Sehr großen Einfluss hat das OLED-Display auf die Dauer. Bei maximaler Helligkeit erreichten wir weniger als 6 h Laufzeit. Wird dagegen der Dark Mode im Webbrowser aktiviert beziehungsweise für alles Webseiten erzwungen, lässt sich das Notebook 2 h länger zum Surfen verwenden, also knapp über 10 h.
| Samsung Galaxy Book3 Ultra 16, i9-13900H RTX 4070 i9-13900H, GeForce RTX 4070 Laptop GPU, 76 Wh | Dell XPS 15 9530 RTX 4070 i7-13700H, GeForce RTX 4070 Laptop GPU, 86 Wh | MSI Stealth 17 Studio A13VH-014 i9-13900H, GeForce RTX 4080 Laptop GPU, 99 Wh | Asus ProArt StudioBook 16 H7600ZW i9-12900H, GeForce RTX 3070 Ti Laptop GPU, 90 Wh | Gigabyte AERO 16 OLED BSF i9-13900H, GeForce RTX 4070 Laptop GPU, 88 Wh | Samsung Galaxy Book3 Ultra 16 i7-13700H, GeForce RTX 4050 Laptop GPU, 76 Wh | Durchschnitt der Klasse Multimedia | |
|---|---|---|---|---|---|---|---|
| Akkulaufzeit | 34% | 3% | 1% | 36% | 56% | 70% | |
| H.264 (h) | 9 | 5.6 -38% | 9.7 8% | 7.4 -18% | 13.4 49% | 16.1 ? 79% | |
| WLAN (h) | 8 | 8 0% | 5.6 -30% | 7.5 -6% | 7.5 -6% | 9.6 20% | 11.4 ? 43% |
| Last (h) | 0.9 | 1.5 67% | 1.6 78% | 0.9 0% | 2.1 133% | 1.8 100% | 1.692 ? 88% |
| Witcher 3 ultra (h) | 2.6 | 1.3 |
Pro
Contra
Fazit - Galaxy Book Ultra auf content creation festgelegt
Samsung trifft mit dem Galaxy Book3 Ultra 16 ins Schwarze: Das Notebook bietet jede Menge Leistung und das perfekt passende Display für kreatives Schaffen. Mit dem schlanken und dezenten Gehäuse wirkt es rundum wie ein professionelles Arbeitsgerät. Genau diesen Eindruck bestätigen unsere Messungen und Benchmarks. Drei Video-Ausgänge, das gelungene Touchpad und der leise Betrieb unter Last fügen sich perfekt in das Gesamtbild ein.
Für kreative Aufgaben bietet das Galaxy Book3 Ultra alles. Bildschirm, Systemleistung und Aufbau harmonieren. Für das schlanke Gehäuse muss jedoch auf Spitzenleistung verzichtet werden.
Gleichzeitig sorgt die starke Reduzierung der Stromzufuhr bei CPU und GPU für eine starke Fokussierung rein auf Video- und Bildbearbeitung sowie Rendering. Mit Spielen kommt das Galaxy Book3 weniger gut zurecht, auch wenn wir aktuelle Games auf höchsten Einstellungen spielen konnten. Die RTX 4070 arbeitet jedoch eher auf dem Niveau einer RTX 3060, wenngleich sie dabei wesentlich sparsamer und ruhiger agiert.
Und es gibt ein paar Schönheitsfehler. Der Creator-Laptop wird heiß, wenn er über längere Zeit gefordert ist. Bei weniger anspruchsvollen Aufgaben werden die Unterseite sowie die Tastatur ebenfalls spürbar warm, etwas zu warm. Der microSD-Slot hätte gern ein vollwertiger Kartenleser sein dürfen. Dazu klingen die Lautsprecher hervorragend. Dass sie bei hohen Frequenzen übersteuern, darf auf diesem Niveau aber nicht passieren.
Mit dem Schwerpunkt Medienbearbeitung macht das Samsung-Notebook am ehesten einem MacBook Pro Konkurrenz, auch wenn sich Mac und Windows nur bedingt vergleichen lassen. Darf es dagegen mehr Grafikleistung sein, was vor allem das Gehäuse wachsen lässt und den Stromverbrauch erhöht, wären das ebenfalls leise MSI Stealth 17 Studio oder ein Gigabyte AERO 16 OLED gute Alternativen.
Preis und Verfügbarkeit
Die von uns getestete Konfiguration des Samsung Galaxy Book3 Ultra 16 mit i9-13900H und RTX 4070 kostet bei Cyberport aktuell 3.500 Euro. Die Version mit fest verlöteten 32 GB RAM gibt es für 100 Euro mehr - ein Aufpreis, der sich lohnen dürfte. Die kleine Version vom Galaxy Book3 Ultra 16 mit i7-13700H und RTX 4050 startet bei 2.800 Euro.
Samsung Galaxy Book3 Ultra 16, i9-13900H RTX 4070
- 27.04.2023 v7 (old)
Mario Petzold
